

Form 10-K Mistras Group, Inc. For: Dec 31
 Tweet
Tweet Share
ShareUNITED STATES SECURITIES AND EXCHANGE COMMISSION
Washington, D.C. 20549
Form 10-K
For the fiscal year ended December 31 , 2020
or
For the transition period from ___ to ___
Commission File Number 001-34481
(Exact name of registrant as specified in its charter)
(State or other jurisdiction of incorporation or organization) | (I.R.S. Employer Identification Number) | |||||||
(Address of principal executive offices) (Zip Code)
(609 ) 716-4000
(Registrant's telephone number, including area code)
Securities registered pursuant to Section 12(b) of the Act:
| Title of each class | Trading Symbol | Name of each exchange on which registered | ||||||||||||
Securities registered pursuant to Section 12(g) of the Act: None
Indicate by check mark if the registrant is a well-known seasoned issuer, as defined in Rule 405 of the Securities Act. Yes o No ý
Indicate by check mark if the registrant is not required to file reports pursuant to Section 13 or Section 15(d) of the Act. Yes o No ý
Indicate by check mark whether the registrant (1) has filed all reports required to be filed by Section 13 or 15(d) of the Securities Exchange Act of 1934 during the preceding 12 months (or for such shorter period that the registrant was required to file such reports), and (2) has been subject to such filing requirements for the past 90 days. Yes ý No o
Indicate by check mark whether the registrant has submitted electronically every Interactive Data File required to be submitted pursuant to Rule 405 of Regulation S-T (§ 232.405 of this chapter) during the preceding 12 months (or for such shorter period that the registrant was required to submit such files). Yes ý No o
Indicate by check mark whether the registrant is a large accelerated filer, an accelerated filer, a non-accelerated filer or a smaller reporting company or an emerging growth company. See the definitions of “large accelerated filer,” “accelerated filer”, “smaller reporting company” and “emerging growth company” in Rule 12b-2 of the Exchange Act.:
Large accelerated filer o | x | ||||||||||
Non-accelerated filer o | Smaller reporting company | ||||||||||
| Emerging growth company | |||||||||||
If an emerging growth company, indicate by check mark if the registrant has elected not to use the extended transition period for complying with any new or revised financial accounting standards provided pursuant to Section 13(a) of the Exchange Act. o
Indicate by check mark whether the registrant has filed a report on and attestation to its management’s assessment of the effectiveness of its internal control over financial reporting under Section 404(b) of the Sarbanes-Oxley Act (15 U.S.C. 7262(b)) by the registered public accounting firm that prepared or issued its audit report. ☒
Indicate by check mark whether the registrant is a shell company (as defined in Rule 12b-2 of the Act). Yes ☐ No ý
The aggregate market value of the voting and non-voting common stock held by non-affiliates of the registrant, based on the closing price of $3.95 on June 30, 2020, the last business day of the registrant's most recently completed second fiscal quarter, as reported on the New York Stock Exchange, was approximately $70.1 million.
As of March 11, 2021, the Registrant had 29,234,143 shares of common stock outstanding.
DOCUMENTS INCORPORATED BY REFERENCE
MISTRAS GROUP, INC.
ANNUAL REPORT ON FORM 10-K
TABLE OF CONTENTS
2
ITEM 1. BUSINESS
FORWARD-LOOKING STATEMENTS
This Annual Report on Form 10-K contains forward-looking statements regarding Mistras Group, Inc. ("Mistras," the Company," "us," "we" and similar expressions) and our business, financial condition, results of operations and prospects within the meaning of Section 27A of the Securities Act of 1933 (Securities Act), and Section 21E of the Securities Exchange Act of 1934 (Exchange Act). Such forward-looking statements include those that express plans, anticipation, intent, contingency, goals, targets or future development and/or otherwise are not statements of historical fact. These forward-looking statements are based on our current expectations and projections about future events and they are subject to risks and uncertainties known and unknown that could cause actual results and developments to differ materially from those expressed or implied in such statements.
In some cases, you can identify forward-looking statements by terminology, such as “goals,” “expects,” “anticipates,” “intends,” “plans,” “believes,” “seeks,” “estimates,” “may,” “could,” “should,” “would,” “predicts,” “appears,” “projects,” or the negative of such terms or other similar expressions. Factors that could cause or contribute to differences in results and outcomes from those in our forward-looking statements include, without limitation, those discussed elsewhere in this Report in Part I, Item 1A. “Risk Factors,” Part 2, Item 7, “Management’s Discussion and Analysis of Financial Condition and Results of Operations” and in this Item 1, as well as those discussed in our other Securities and Exchange Commission (SEC) filings. We undertake no obligation to (and expressly disclaim any obligation to) revise or update any forward-looking statements made herein whether as a result of new information, future events or otherwise. However, you should consult any further disclosures we may make on these or related topics in our reports on Form 8-K or Form 10-Q filed with the SEC.
The following discussions should be read in conjunction with the sections of this Report entitled “Management’s Discussion and Analysis of Financial Condition and Results of Operations” and “Risk Factors.”
OUR BUSINESS
Asset Protection Industry Overview
MISTRAS Group, Inc. is a leading "one source" multinational provider of integrated technology-enabled asset protection solutions, helping to maximize the safety and operational uptime for civilization’s most critical industrial and civil assets.
Backed by an innovative, data-driven asset protection portfolio, proprietary technologies, and a decades-long legacy of industry leadership, MISTRAS leads clients in the oil and gas, aerospace and defense, power generation, civil infrastructure, and manufacturing industries towards achieving and maintaining operational excellence. By supporting these organizations that help fuel our vehicles and power our society; inspecting components that are trusted for commercial, defense, and space craft; and building real-time monitoring equipment to enable safe travel across bridges, MISTRAS helps the world at large.
The company’s core capabilities also include non-destructive testing (“NDT”) field inspections enhanced by advanced robotics, laboratory quality control and assurance testing, sensing technologies and NDT equipment, asset and mechanical integrity engineering services, and light mechanical maintenance and access services. MISTRAS enhances value for its clients by integrating asset protection throughout supply chains and centralizing integrity data through a suite of Industrial IoT-connected digital software and monitoring solutions.
We offer our customers “OneSource™ for Asset Protection Solutions®” and are a leading global provider of technology-enabled asset protection solutions used to evaluate the safety, structural integrity and reliability of critical energy, industrial and public infrastructure.
Our asset protections are intended to help maximize safety and uptime of our customers' assets and facilities. These mission critical solutions enhance our customers’ ability to comply with governmental safety and environmental regulations, extend the useful life of their assets, increase productivity, minimize repair costs, manage risk and avoid catastrophic disasters.
We deliver value through a comprehensive “OneSource™” portfolio of customized solutions, utilizing a proven systematic method that creates a closed-loop lifecycle for addressing continuous asset protection and improvement.
3
Our specialized asset protection solutions include:
•Field Inspections
•Laboratory Quality Assurance/Control (QA/QC)
•Maintenance
•Engineering Consulting
•Access
•Data Management and Services
•Monitoring
•Equipment
Our OneSource™ model emphasizes the integration of these solutions and the asset integrity data associated with them to service our customers throughout their assets’ lifetimes. Under this business model, many customers outsource their inspection, integrity data management and other asset protection needs to us on a “run-and-maintain” basis to ensure the continued safety and structural and operational integrity of their assets.
We have established long-term relationships as a critical solutions provider to many of the leading companies with asset-intensive infrastructure in our target markets. These markets primarily consist of:
•Oil & Gas (Downstream, Midstream, Upstream and Petrochemical)
•Aerospace & Defense
•Industrial
•Power Generation and Transmission
•Public Infrastructure, Research and Engineering
•Process Industries
A majority of our revenues are generated by deploying technicians at our customers' locations. Most of our revenues from aerospace and defense as well as certain manufacturing customers are generated by performing inspections and testing at our various in-house laboratories.
We generated revenues of $592.6 million, $748.6 million and $742.4 million for the years ended December 31, 2020, 2019 and 2018, respectively. We generated a net loss of $(99.5) million, net income of $6.1 million and net income of $6.8 million for the years ended December 31, 2020, 2019, and 2018 respectively. For the years ended December 31, 2020, 2019 and 2018, we generated approximately 80%, 80% and 77%, respectively, of our revenues from our Services segment. Our revenues are diversified, with our top ten customers accounting for approximately 32%, 34% and 34% of our revenues during the years ended December 31, 2020, 2019 and 2018, respectively.
OUR SPECIALIZED SOLUTIONS
As a OneSource™ provider of asset protection solutions, MISTRAS combines our industry-leading services, products, data management solutions and technologies to provide a unique, custom-tailored solution for each customer’s individual asset protection needs, ranging from routine inspections to complex, plant-wide asset integrity management.
Field Inspections
Our field inspections portfolio includes traditional and advanced Non-Destructive Testing (NDT) techniques, along with predictive maintenance (PdM) assessments of fixed and rotating assets and inline inspection (ILI) for pipelines. We offer these solutions on an individual basis, or as parts of enterprise inspection and testing programs.
NDT is the examination of an asset without materially impacting its integrity. The ability to inspect infrastructure assets and not interfere with their operating performance makes NDT a highly-attractive alternative to many traditional techniques, which may require shutting down an asset or entire facility. Typical issues for which MISTRAS technicians inspect include corrosion, cracking, leaking, faults and flaws in piping, storage tanks, pressure vessels as well as a wide range of other industrial assets and public infrastructure.
Our automated data acquisition solutions utilize smart sensing and monitoring, robotic inspection systems, and digitized spot inspections to provide asset integrity data with greater insight into current and future asset conditions.
Field inspection services lend themselves to integration with our other offerings, and as such have often served as the initial entry point to more advanced customer engagements that require additional solutions. After an initial field inspection is performed, MISTRAS is able to provide multiple supplemental solutions that further serve to solidify our relationships with our customers and drive additional revenue.
4
Laboratory Quality Assurance/Control (QA/QC)
Our network of in-house laboratories located across North America and Europe offers quality assurance and quality control (QA/QC) solutions for new and existing metal and alloy components, materials, and composites.
Our in-house labs work with our customers throughout their components’ lifetimes, from preparation and production to post-processing and in-service component monitoring. MISTRAS’ laboratory QA/QC solutions help to meet customer needs throughout their manufacturing cycles, with a focus on optimizing production logistics. Our in-house lab solutions include:
•Non-destructive evaluation/inspection (NDE/NDI)
•Destructive testing (DT)
•Metallurgical testing
•Chemical analysis testing
•Mechanical services
•Pre-machining
•Finishing services
We often inspect and test components prior to assembly to screen for defects and discontinuities introduced in the manufacturing process. We also inspect existing components to ensure they remain fit-for-purpose.
Our labs hold a wide variety of certifications, such as: Nadcap (formerly NADCAP, the National Aerospace and Defense Contractors Accreditation Program), AS9100/ISO-9001, Federal Aviation Administration (FAA) Repair Station, and the International Traffic in Arms Regulations/Export Administration Regulations (ITAR/EAR) , that allow us to perform inspections to meet or exceed stringent regulatory and manufacturers' requirements. With these certifications comes a comprehensive range of approvals from prime contractors of major projects, militaries, and internationally-renowned original equipment manufacturers (OEMs) from many of our key markets, including the oil and gas, aerospace and defense, power generation, and industrial markets.
Maintenance
We perform maintenance and light mechanical services to prepare assets for inspection and to return them to working condition post inspection. These services include corrosion removal, mitigation and prevention; insulation installation and removal; electrical services; heat tracing, industrial cleaning; pipefitting; and welding. Our light mechanical services are often offered as complementary, value-added solutions to inspections, such as removing insulation in order to inspect piping, then re-installing insulation.
Our multi-disciplined technicians offer maintenance and light mechanical services in hard-to-access areas, in combination with rope access or diving strategies.
Mechanical services are still a small part of our business, and we carefully try to avoid providing any such services that conflict with our inspection services.
Engineering Consulting
We provide a broad range of engineering consulting services, primarily for process equipment, technologies and facilities. Our engineering consultations include plant operations and management support, turnaround/shutdown planning, profit improvement, facilities planning studies, engineering design, process safety reviews, energy optimization evaluations, benchmarking/key performance indicator (KPI) development and technical training.
Our Asset Integrity Management/Mechanical Integrity (AIMS/MI) services help improve asset reliability and regulatory compliance through a systematic, engineering-based approach to ensure the ongoing integrity and safety of equipment and industrial facilities. AIMS/MI services can include conducting an inventory of infrastructure assets; developing, implementing and training personnel in executing inspection and maintenance procedures; and managing MI programs. We help to identify gaps between existing and desired practices and establish quality assurance standards for fabrication, engineering and installation of infrastructure assets.
Access
Much of our work is conducted in hard-to-access locations, including those in at-height, subsea and confined locations. We utilize scaffolding and rope access to access at-height and confined assets; certified divers for subsea inspection and maintenance; and unmanned (drone) aerial, land-based and subsea systems to deliver a wide range of inspection applications, with an emphasis on minimizing at-height access and confined space entry (CSE).
5
Data Management and Services
The asset protection solutions that MISTRAS provides throughout our customers’ asset lifecycles generate asset integrity data that needs to be effectively archived, managed, and analyzed. MISTRAS provides value to our customers through our ability to integrate these functions to a single provider, as customers often struggle to unify data that was collected by various contractors in different locations at different times.
Plant Condition Management Software (PCMS®). Our world-class enterprise inspection database management software (IDMS) - Plant Condition Management Software (PCMS®) - was developed specifically for process industries and equipment, and enables the storage, organization and analysis of inspection data.
PCMS offers wide-ranging support for mechanical integrity programs, including:
•Comprehensive inspection tracking, scheduling and analysis
•Corrosion analysis & trending
•Integrated risk-based inspection (RBI) calculators
•Safety relief valve management
PCMS compares data to prior operations, similar assets, industrial standards and specific risk conditions, such as use with highly-flammable or corrosive materials. It also develops asset integrity management plans based on RBI calculations that specify an optimal schedule for the testing, maintenance and retirement of assets.
In many instances, customers of our field inspections and consulting services also have licensed PCMS for storage and analysis of collected inspection and MI data.
A common difficulty that MISTRAS’ customers face is the ability to easily access data from multiple data collection inputs and contractors. MISTRAS is actively advancing initiatives focused on creating digital pathways between multiple data applications, including PCMS, to provide streamlined access to asset integrity data and offer subject matter expert (SME) data analysis support.
We believe PCMS is one of the most widely used plant condition management software systems in North American refineries. We estimate it is currently used by approximately 50% of the U.S. refining capacity, as well as by leading midstream pipeline energy companies and major energy companies in Canada and Europe. This provides us with recurring maintenance and support fees and marketing opportunities for additional software and solutions.
Pipeline Data. Following our acquisitions of companies that support the midstream sector of the Oil & Gas industry, we believe MISTRAS provides among the most comprehensive, data-driven pipeline protection solution available to the industry. These proprietary pipeline data analysis solutions enable deep integration of inline inspection (ILI) big data with real-time risk analytics and business intelligence (BI) to provide capabilities for supporting pipeline integrity, which we believe provides us with an important competitive advantage.
MISTRAS Digital®. MISTRAS has also invested resources in digitalizing and optimizing the collection, transfer, and visibility of field inspection data. MISTRAS Digital® is an electronic platform that digitally delivers field inspection assignments and related data, captures inspection results, and delivers electronic reporting and productivity tracking via relevant KPIs to multiple members of a customer organization, including those not directly associated with the Inspection function. Customers have made clear that the timely and accurate delivery of field data to their inspection data management systems (IDMS) is an important feature for them. MISTRAS Digital® integrates with MISTRAS’ PCMS and other inspection data management systems to provide additional productivity improvements.
Monitoring
Online Monitoring. Our online condition-monitoring solutions provide real-time reports and analysis of infrastructure to alert facility personnel to damages before critical failures occur, while our flexible, Industrial Internet of Things (IIoT)-compatible, cloud-based online monitoring portal centralizes and analyzes all collected monitoring data. These monitoring solutions are often installed in hazardous or hard-to-reach locations, helping to enhance safety by reducing the need to send technicians into unsafe locations. We offer monitoring solutions for a wide range of assets and applications, including:
•Tube Leaking
•Power Transformer Health & Reliability
•Stator Vane Cracking
•Bridge Structural Health Monitoring (SHM)
•Wall Thickness Tracking
•High-Energy Piping (HEP) Integrity
•Fluid Corrosivity
6
•Through-Valve Leaking
With expertise in monitoring hardware and services, MISTRAS designs and installs monitoring systems, and provides commissioning, training, reporting, technical support, and annual maintenance services. We offer a variety of secure, web-based solutions that monitor structural integrity and analyze conditions against our library of historical inspection data, allowing users to stay aware of potential concerns and prioritize future inspections and maintenance. We also offer custom-developed software that integrates with sensing technologies, reporting platforms, and onsite IDMSs; stores and trends monitoring data; and provides immediate automated data analysis. Much of our monitoring is based on acoustical emissions technology.
Equipment
We design and manufacture portable, handheld, wireless and turnkey NDT equipment, along with corresponding data acquisition sensors and software, for spot inspections and long-term, unattended monitoring applications.
We sell these solutions as individual components, or as complete systems, which include a combination of sensors, amplifiers, signal processing electronics, knowledge-based software and decision and feedback electronics. We also sell integrated service-and-system technology packages, in which our field technicians utilize our proprietary and specialized testing procedures and hardware, advanced pattern recognition, neural network software and databases to compare test results against our prior testing data or industry standards.
We provide a range of acoustic emission (AE) products and are a leader in the design and manufacture of AE sensors, instruments and turnkey systems used for monitoring and testing materials, pressure components, processes, and structures. MISTRAS also designs and manufactures ultrasonic testing (UT) equipment.
Most of our hardware products are fabricated, assembled, and tested in our ISO-9001-certified facility in Princeton Junction, New Jersey. We also design and manufacture automated ultrasonic systems and scanners in France.
Centers of Excellence
Another differentiator in our business model is our Centers of Excellence (COEs), which offer support for asset, technology, or industry-specific solutions. Our subject matter experts engage in strategic sales opportunities to offer customers value-added solutions using advanced technologies and methods. The COEs help to standardize our approach to common problems in our key market segments. Our COEs include:
•Acoustic Emission
•Aerospace
•American Petroleum Institute (API) Turnarounds
•AIMS/MI/Engineering
•Automated Ultrasonics
•Fossil Power
•Guided Wave Ultrasonics
•Infrastructure
•PCMS Software & Services
•Mechanical Services
•Nuclear Power
•Offshore
•Phased Array
•Pipeline
•Power Generation
•Predictive Maintenance
•Refractory Inspection
•Rope Access/Wind
•Substation Reliability
•Tank Inspection
•Transportation
•Tube Inspection
•Unmanned Systems
ASSET PROTECTION INDUSTRY OVERVIEW
7
Asset protection plays a crucial role in assuring the integrity and reliability of critical infrastructure. As an asset protection solutions provider, MISTRAS seeks to maximize the uptime and safety of critical infrastructure, by helping customers to detect, locate, mitigate, and prevent damages such as corrosion, cracks, leaks, manufacturing flaws and other concerns to operating and structural integrity. In addition to these core utilities, the storage and analysis of collected inspection and mechanical integrity data is also a key aspect of asset protection.
NDT has historically been a prominent solution in the asset protection industry due to its capacity to detect defects without compromising the integrity of the tested materials or equipment. The supply of NDT inspection services has traditionally come from many small vendors, who provide services to a small geographic region. A trend has emerged, however, for customers to engage a select few vendors capable of providing a wider spectrum of asset protection solutions for global infrastructure, in addition to an increased demand for advanced non-destructive testing (ANDT) solutions and data acquisition software, both of which require a highly-trained workforce.
Due to these trends, those vendors offering integrated solutions, scalable operations, skilled personnel and a global footprint will have a distinct competitive advantage. Moreover, we believe that vendors that are able to effectively deliver both advanced solutions and data analytics, by virtue of their access to customers’ data, create a significant barrier to entry for competitors, leading to the opportunity to further create significant recurring revenues.
Key Dynamics of the Asset Protection Industry
We believe the following represent key dynamics of the asset protection industry, and that the market available to us will continue to grow as these macro-market trends continue to develop:
Extending the Useful Life of Aging Infrastructure While Increasing Utilization. Due to the prohibitive costs and challenges of building new infrastructure, many companies have chosen to extend the useful life of existing assets through enhancements, rather than replacing these assets. This has resulted in the significant aging and increased utilization of existing infrastructure in our target markets. Demand for refined petroleum products, combined with high plant-utilization rates, drives refineries to upgrade facilities to make them more efficient and expand capacities. Because aging infrastructure requires more frequent inspection and maintenance in comparison to new infrastructure, companies and public authorities continue to spend on asset protection to ensure their aging infrastructure assets continue to operate effectively.
Outsourcing of Non-Core Activities and Technical Resource Constraints. Due to the increasing sophistication and automation of NDT programs, a decreasing supply of skilled professionals and increasing governmental regulations, companies are increasingly outsourcing NDT to third-party providers with advanced solution portfolios, engineering expertise and trained workforces.
Digital Transformation of Asset Protection. Plants in the oil & gas and process industries are recognizing the need to evolve their traditional, paper-based mechanical integrity programs in favor of digitalized solutions. The rise of big data intelligence and the need to gain actionable insights from raw asset integrity data are growing trends that provide opportunities for contractors with a wide range of asset protection expertise and integrated data platforms to help customers maximize uptime while controlling costs.
Increasing Corrosion from Low-Quality Inputs. The increased availability and low cost of crude oil from areas such as shale plays and oil sands resources have led to the use of lower-grade raw materials and feedstock. This leads to higher rates of corrosion, especially in refining processes involving petroleum with higher sulfur content, which increases the need for asset protection solutions to detect and/or proactively prevent corrosion-related issues.
Increasing Use of Advanced Materials. Customers in various of our target markets - particularly aerospace and defense - are increasingly utilizing advanced materials, such as composites and other unique technologies in their assets. These materials often cannot be tested using traditional NDT techniques. We believe that demand for more advanced testing and assessment solutions will increase along with the increased utilization of these advanced materials during the design, manufacturing, operating and quality control phases.
Meeting Safety Regulations. Owners and operators of refineries, pipelines and petrochemical and chemical plants increasingly face strict government regulations and more stringent process safety enforcement standards. This includes the continued implementation of the Occupational Safety and Health Administration’s (OSHA) National Emphasis Program (NEP). Failure to meet these standards can result in significant financial liabilities, increased scrutiny by government and industry regulators, higher insurance premiums and tarnished corporate brand value. As a result, these owners and operators are seeking highly-reliable asset protection suppliers with a track record of assisting organizations in meeting increasingly stringent regulations. Our customers benefit from MISTRAS’ extensive engineering consulting base that supports them in devising mechanical integrity programs that both meet regulatory compliance standards and enable enhanced safety and uptime at the customer's facilities.
8
Expanding Addressable End-Markets. The continued emergence of and advances in asset protection technologies and software-based systems are increasing the demand for asset protection solutions in applications where existing techniques were previously ineffective.
Expanding Aerospace and Defense Industry. We believe that increased demand will continue to come over the next several years from the commercial industry due to the approximately decade-long backlog for next-generation commercial aircraft to be built, driving the need for advanced solutions that drive cost and quality efficiencies. Demand continues to be stable in the defense industry while demand in the outerspace industry is growing.
Crude Oil Prices. Volatility in the energy sector has been profound during the 2015-2020 five-year period. The collapse of world oil prices in 2015 and 2016 undermined industry expansion. While energy prices recovered in 2017 and 2018, they have once more declined, with the current year collapse, fueled by the coronavirus pandemic. With lower prices, we continue to see reductions in NDT and maintenance spending, although not to the extent as experienced in during 2015 and 2016, due in part to price stabilization.
Expanding Pipeline Integrity Regulations: The United States Pipeline & Hazardous Materials Safety Administration’s (PHMSA) “Mega Rule” adopted in October 2019, expands pipeline integrity regulations on more than 500,000 miles of pipelines that carry natural gas, oil and other hazardous materials throughout the U.S. Some of these requirements will take operators decades to fulfill. These regulations require inspection and integrity data records throughout a pipeline’s lifetime to be “reliable, traceable, verifiable, and complete,” increasing the demand for integrated inspection, engineering, monitoring, and data management and analysis solutions.
Consolidation of Refineries: Consolidation of refinery ownership will create both pressure on refinery service providers due to increased customer purchasing power and provide an opportunity to those same refinery service providers to become preferred providers to these larger customers.
Our Competitive Strengths
We believe the following competitive strengths contribute to our being a leading provider of asset protection solutions and will allow us to further capitalize on growth opportunities in our industry:
OneSource™ Provider for Asset Protection Solutions. We believe we have one of the most comprehensive portfolios of integrated asset protection solutions worldwide, which positions us to be a leading single-source provider for our customers’ asset protection requirements. This is particularly a competitive strength in regards to turnarounds and shutdowns - during which facilities temporarily cease portions of their operations in order to perform plant-wide inspections, maintenance and repairs - as the services being requested and performed during these work stoppages make up significant portions of refinery, process and power plant maintenance budgets. Demand for our solutions increases during these outages, as facilities seek third-party providers to perform a wide spectrum of asset protection operations while the plant is offline. In addition, as companies are increasingly outsourcing their NDT needs to third-party providers, we believe that the ability to offer a comprehensive package of solutions provides us with a competitive advantage.
Integrated Data Management: MISTRAS’ expertise and proprietary research and development in data solutions throughout the asset protection cycle provides a competitive advantage. With solutions for integrated data acquisition, storage, visualization and analytics, our integrated data management solutions are ahead of the industry’s trend towards centralizing asset protection to fewer, highly-skilled and multi-disciplined vendors. Many of our data solutions are platform-agnostic, allowing us to integrate into customer's existing operations, and thereby expanding the potential customer pool for our solutions. Our presence in our customers’ operations throughout their asset lifecycles also ideally positions us to be their primary vendor to centralize their asset integrity data collection, management, and analysis, creating opportunities to scale our relationships.
Long-Standing Trusted Provider to a Diversified and Growing Customer Base. We have become a trusted partner to a large and growing customer base across numerous global markets through our proven, decades-long track record of successful operations. Our customers include some of the largest and most well-recognized firms in the oil and gas, chemicals, power generation and aerospace and defense industries, as well as public authorities.
Repository of Customer-Specific Inspection Data. Through our world-class enterprise data management and analysis software, PCMS®, we have accumulated extensive, proprietary process data that allows us to provide our customers with value-added services, such as benchmarking, risk-based inspection (RBI) and reliability-centered maintenance (RCM).
Proprietary Products, Software and Technology Packages. Our deep knowledge base in asset protection services and equipment enables us to offer technology packages, in which our field technicians utilize our proprietary and specialized testing procedures and hardware, advanced pattern recognition, neural network software and databases to compare test results against our prior testing data or national and international structural integrity standards.
9
Deep Domain Knowledge and Extensive Industry Experience. We have extensive asset protection experience and data, dating back several decades of operations. We have gained this through our industry leadership in developing advanced asset protection solutions, including research and development of advanced NDT technologies and applications; process engineering technologies; online plant asset integrity management with sensor fusion; and enterprise software solutions for plant-wide and fleet-wide inspection data archiving and management.
Technological Research and Development. The NDT industry continues to move towards more advanced, automated solutions, requiring service providers to find safer and more cost-efficient inspection techniques. We believe that we remain ahead of the technological curve by backing our extensive industry expertise with the investment of resources in research and development (R&D). Some of the advanced inspection technologies developed by our internal R&D teams include an automated radiographic testing (aRT) crawler for corrosion under insulation (CUI) inspections in aboveground pipelines; our Large Structure Inspection (LSI) scanner; and our real-time radiography (RTR) crawler for 360° inspections of pipeline girth welds.
Collaborating with Our Customers. We have historically expanded our asset protection solution portfolio in response to our customers’ unique performance specifications. Our technology packages have often been developed in close cooperation and partnership with key customers and industry organizations.
Experienced Management Team. Our management team has a track record of asset protection organizational leadership. These individuals also have successfully driven operational growth organically and through acquisitions, which we believe is important to facilitate future growth in the asset protection industry.
Our Growth Strategy
Our growth strategy emphasizes the following key elements:
Continue to Digitalize Asset Protection Data and Processes. MISTRAS places a data-centric focus on asset protection, enabling our customers to ease some of their biggest areas of concern (particularly the timely and accurate transfer of asset integrity data from the field to their IDMS, as well as the data’s visibility and accessibility once uploaded). We expect that the demand for big data intelligence and remote data visibility will continue to grow, and are investing in data solutions that help our customers visualize and generate actionable insight from their asset integrity data, regardless of data input. We are also actively seeking to optimize our customers’ asset protection workflows and processes, by creating digital paths between data applications to increase data visibility and reduce manual data entry and human error.
Expand Our Focus in the Aerospace and Defense Industries. We believe that the introduction of next-generation airframes and aircraft engines has created an inherent demand for inspection, testing, machining and mechanical services required for the production of parts. The recent interest in the use of additive manufacturing techniques to create components also necessitates advanced inspection and testing solutions. The Company consummated two acquisitions of aerospace inspection companies in 2017. These recent actions are driven by our increased focus to provide solutions to our customers in the aerospace and defense industries throughout their manufacturing value chains in this growing area.
Expand Our Focus in the Pipeline Integrity Industry. MISTRAS intends to continue broadening our solutions for the pipeline market. Recent industry regulations significantly expanded pipeline integrity management regulations, requiring pipeline owner/operators to inspect, document, and assess the risk of operating conditions for existing lines. This provides MISTRAS with the opportunity to provide asset protection solutions for both the new construction and integrity phases. In 2019, we acquired a company that provides pipeline integrity management software and services to energy transportation companies. We acquired an inline inspection provider based in Canada in 2018 with operations in the U.S. and have implemented our PCMS software for several pipeline operators to support their integrity data management.
Expanding our Mechanical Services Portfolio. We believe that performing mechanical services to complement inspections, such as removing and reapplying insulation or preparing surfaces for coating or painting, is an important market differentiator for us. This is particularly true, for example, when considering the cost-efficiencies our customers realize when our rope access technicians perform these services at height without the use of scaffolding. Many of our customers already require these services, but utilize multiple vendors to do so, creating an opportunity for us to provide greater value to a customer base that increasingly requires enhanced speed and efficiency.
Continue to Develop Technology-Enabled & Digital Asset Protection Solutions. We intend to maintain and enhance our technological leadership by continuing to invest in developing new technology, applications and data services. We intend to continue deepening synergies between our solutions to provide our customers with uniquely-integrated offerings, which we believe makes us a more attractive vendor for customers seeking to centralize their asset protection. We also intend to continue to develop technologies that enhance the flow of data throughout multiple operational phases and facilities, through solutions such as MISTRAS Digital, our integrated pipeline integrity data portfolio, and our cloud-based monitoring data portal.
10
Expand our Solution Offerings to Existing Customers. We believe that branching into adjacent, complementary services, such as mechanical services, increases our value proposition and our ability to capture additional business. Many of our customers are multinational corporations with asset protection requirements at multiple locations. We believe that expanding our solution offerings and merging and visualizing data across facilities for enterprise data analysis, combined with the trend of customers outsourcing asset protection to service providers with integrated offerings, provides opportunities for significant additional recurring revenues.
Continue to Expand Our Customer Base into New End Markets. We believe we have significant opportunities to expand our customer base in relatively new end markets, including wind and other alternative energy, natural gas transportation industries pipeline integrity and additive manufacturing. The expansion of our addressable markets is being driven by the increased recognition and adoption of advanced asset protection technologies that are supplanting traditional methods.
Capitalize on Acquisitions. We have completed several acquisitions to supplement and enhance our solutions, add new customers, expand our sales channels and accelerate our expected growth. Due to our current debt levels and restrictions related to the debt covenants in our credit facility, we do not expect to make any acquisitions in 2021 other than small acquisitions with the banks’ approval. However, once we reduce our debt, we expect to make selective acquisitions beyond 2021.
Our Segments
The Company has three operating segments:
Services provides asset protection solutions predominantly in North America, with the largest concentration in the United States, followed by Canada, consisting primarily of NDT, inspection, mechanical and engineering services that are used to evaluate the structural integrity and reliability of critical energy, industrial and public infrastructure and commercial aerospace components. PCMS software and pipeline related software and data analysis solutions are included in this segment.
International offers services, products and systems similar to those of the other segments to select markets within Europe, the Middle East, Africa, Asia and South America, but not to customers in China and South Korea, which are served by the Products and Systems segment.
Products and Systems designs, manufactures, sells, installs and services the Company’s asset protection products and systems, including equipment and instrumentation, predominantly in the United States.
For a discussion of segment revenues, operating results and other financial information, including geographic areas in which we generated revenues, see “Management’s Discussion and Analysis of Financial Condition and Results of Operations” in Item 7, as well as Note 2-Revenue in the notes to consolidated financial statements in Item 8 of this Annual Report.
Our Target Markets
Overview
Mistras operates in a highly competitive, but fragmented market. Domestically, the market is serviced by several national competitors and many regional and/or local companies. Internationally, our primary competitors are divisions of large companies, with additional competition from small independent local companies which may be limited to a specific product, service or technology and focused on a niche market or geographic region. We focus our strategic sales, marketing and product development efforts on a range of infrastructure-intensive based industries and governmental authorities. We view energy-related infrastructure and commercial aerospace as the Company's largest market opportunities. We perform inspection and mechanical services for customers in both industries.
In the energy market, there are various economic indicators that drive our business, especially in the U.S. domestic markets. These factors are excerpted below from various Energy Information Administration (EIA) outlook reports:
The electricity generation mix is projected to continue to experience a rapid rate of change, with renewables the projected fastest-growing source of electricity generation through 2050 because of continuing declines in the capital costs for solar and wind that are supported by federal tax credits and higher state-level renewables targets. With slow load growth and increasing electricity production from renewables, U.S. coal-fired and nuclear electricity generation is projected to decline, with most of the decline occurring by the mid-2020s.
The EIA forecasts U.S. crude oil production will average 11.0 million barrels per day (bpd) in 2021, down 0.3 million bpd from 2020, and then rise to 11.5 million bpd in 2022.
11
There are a number of economic factors which drive the aerospace market, including:
•The multi-year backlog for next generation commercial aircraft to be built, including several large and mid-sized aircraft built by Boeing and Airbus, among other manufacturers; and
•The continuing regulatory scrutiny to ensure public safety serves to ensure the continued need for inspection and mechanical services to be performed.
Revenue by Target Market
The following chart represents the percentage of consolidated revenues we generated from our various markets for the year ended December 31, 2020:
Mistras Revenues by Target Market (Year ended December 31, 2020) | Oil & Gas Breakdown (Year ended December 31, 2020) | |||||||||||||
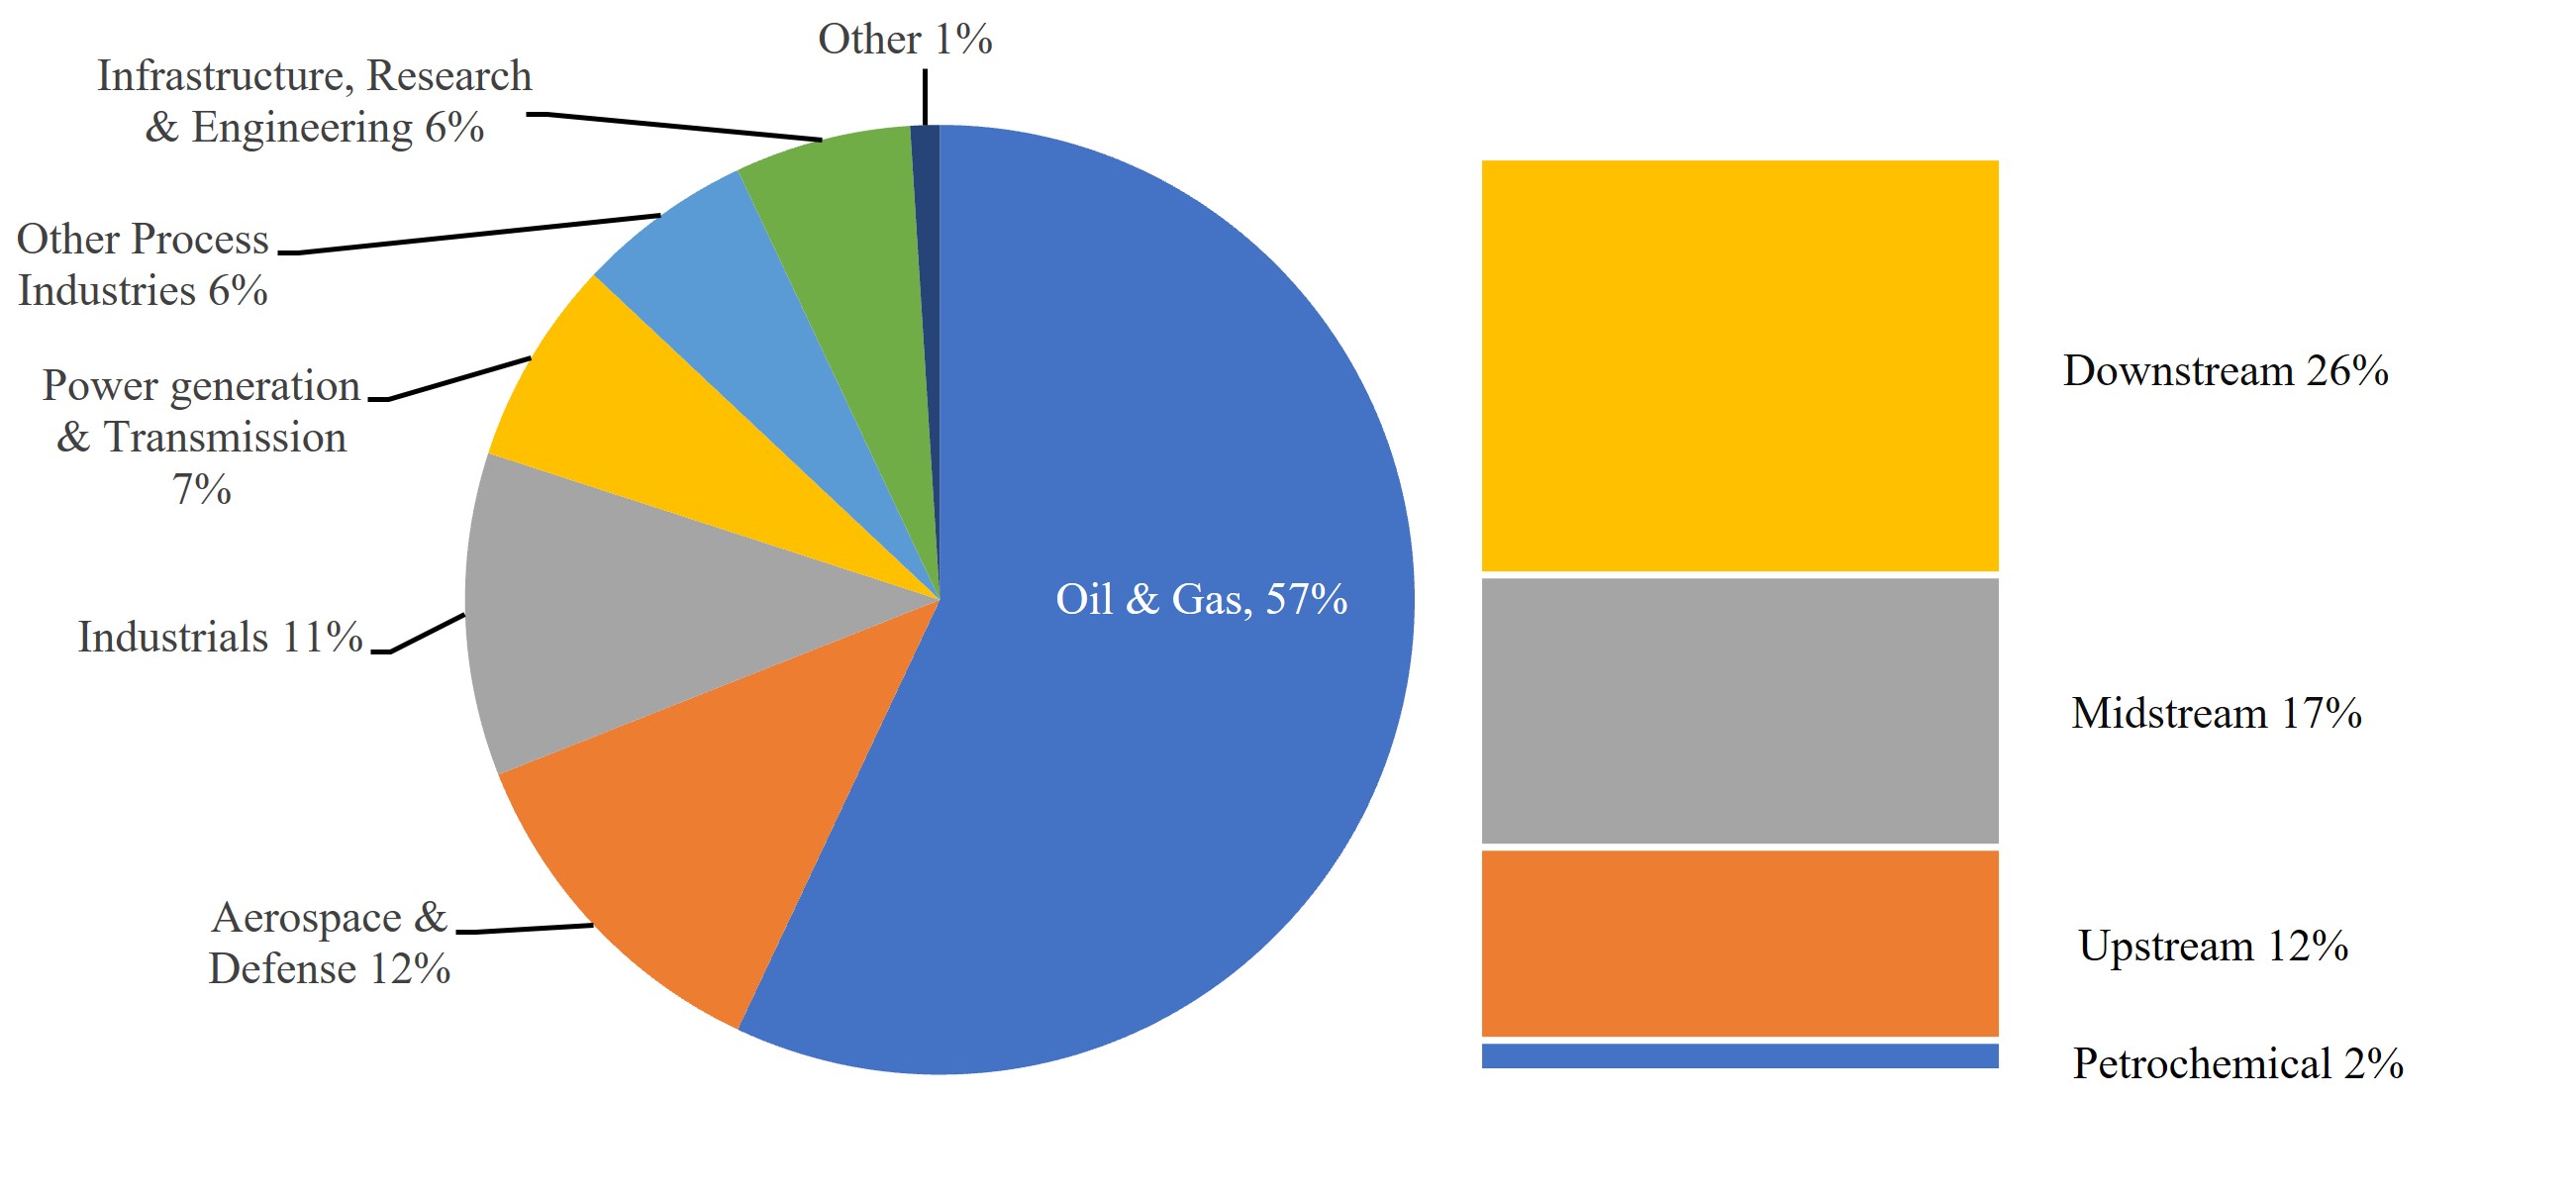
Oil and Gas
MISTRAS supplies oil and gas asset protection solutions to downstream (refining), midstream (transportation and storage), upstream (exploration and production) and petrochemical operations.
We use our vast solutions portfolio to help identify current and future asset performance, and actively prevent, mitigate or otherwise address potential issues, including corrosion, cracking, leaking and other damages that may lead to safety, productivity or environmental concerns. Our solutions help identify conditions that if not remedied, could lead to potential catastrophic failures in tanks, vessels, valves, buried and above ground pipelines, pumps, motors, compressors and other critical assets found throughout the oil & gas production and delivery supply chain.
We actively seek to evolve our solutions through technological enhancements and R&D to discover new applications. Online monitoring and permanently-mounted sensors, as well as the use of drones and other alternative delivery devices, are all being considered as oil and gas infrastructure owners look to “smart” technologies that reduce human intervention while delivering highly-accurate inspection & integrity data. We also have actively sought to further enhance our integrated approach to asset protection, through the development of our complementary mechanical service portfolio.
In general, the energy market is poised to leverage digital solutions to facilitate process improvements as well as increase plant reliability and improve process and personnel safety. This provides an opportunity for us to synergistically leverage our asset protection solutions into our new MISTRAS Digital platform. Digital transmission of data in various industry sectors, with built-in analytic functions, will allow our customers to better leverage inspection data that is being generated in the field.
12
While we expect off-stream inspection of critical assets to remain a routine practice, we anticipate an increase in the demand for non-invasive, or on-stream inspections. Non-invasive inspections enable companies to minimize the costs associated with shutting down equipment during testing, while enabling the economic and safety advantages of advanced planning and/or predictive maintenance.
Aerospace and Defense
The aerospace industry is undergoing unprecedented growth with many original equipment manufacturers (OEMs) reporting record-high backlogs of up to ten years. We serve this rapidly-growing target market by providing a full range of inspection, testing, machining, mechanical, finishing, additive manufacturing and equipment solutions, for which we are Nadcap certified. Our state-of-the-art in-house labs maintain numerous accreditations from industry organizations, including Nadcap and some of the largest manufacturers in the world, such as Boeing, Safran, Airbus, Bombardier and Embraer.
Advanced composite materials found in new classes of aircraft require advanced asset protection solutions, including x-ray of critical engine components, ultrasonic fatigue testing of complete aircraft structures and corrosion detection and other critical components. Many OEMs are shifting towards condition-based maintenance utilizing embedded monitoring sensors to track component structural and operational integrity over time as opposed to performing maintenance on time-based intervals. We expect demand for our solutions to increase with the adoption of these new-age materials and distributed online sensor networks. We also expect demand for asset protection solutions to increase with the continued adoption of additive manufacturing techniques.
Industrial
The quality control requirements driven by the need for zero-to-low-defect component tolerance within automated, robotic-intensive industries such as automotive, consumer electronics and medical industries serve as key drivers for increased demand in asset protection, particularly for in-house inspection and testing. We expect that increasingly stringent quality-control requirements and competitive forces will drive the demand for more-costly finishing and polishing which, in turn, creates opportunities for integrated partnerships between MISTRAS and our customers throughout the production lifecycle.
Power Generation and Transmission
MISTRAS provides asset protection solutions for customers in the combined cycle, fossil, nuclear, transmission & distribution and wind/alternative energy industries. We believe that in recent years, acceptance of asset protection solutions has grown in this industry due to the aging of critical power generation and transmission infrastructure.
The growing availability of cheap natural gas, along with environmental concerns with coal, has stimulated the construction of new natural gas-fired power plants across North America, creating opportunities for MISTRAS to provide specialized solutions in multiple phases. These include facility design consultations, NDT services during construction and plant operations and long-term condition monitoring. We anticipate sharp growth in these types of plants as natural gas pricing remains low, and the environmental impacts of coal remain unattractive to the public.
We also offer solutions for inspection, maintenance, monitoring, and data services for wind turbines and their components. These include NDT services — often performed through rope and/or drone access — to identify corrosion, cracking, and other defects that can affect the safety and operational effectiveness of wind turbines, along with remedial solutions to repair minor damages identified during inspections. MISTRAS views the wind/renewables market as a market with growth potential, and we are actively engaging in technology R&D to further support wind turbine owner/operators. We anticipate demand will continue to grow for wind/renewable energy solutions in the future.
Process Industries
Our asset protection solutions are crucial for process industries, or industries in which raw materials are treated or prepared in a series of stages, including chemicals, pharmaceuticals, food processing, pulp and paper and metals and mining. As the process facilities are increasingly facing aging infrastructure, high utilization, growing capacity constraints and increasing capital costs, we believe asset protection solutions will continue to grow in importance in maintenance planning, quality and cost control and prevention of catastrophic failure.
Public Infrastructure, Research and Engineering
We believe that high-profile infrastructure catastrophes have caused public authorities to more actively seek ways to prevent similar events from occurring. Public authorities tasked with new construction and maintenance of existing public infrastructure increasingly use asset protection solutions to inspect these assets, including the use of embedded sensors to enable online monitoring throughout the life of the asset.
13
We have provided testing and structural health monitoring (SHM) and data solutions on bridges and structures worldwide, including some of the largest and most well-known bridges in the United States and United Kingdom. Our sensors continuously monitor these assets, alerting owner/operators when defects are detected. Our monitoring teams also provide regular reports that include early warnings of suspect areas before an alarm is generated.
Customers
We provide our asset protection solutions to a global customer base of diverse companies primarily in our target markets. No customer represented 10% or more of our revenue in any of the years ended December 31, 2020, 2019 or 2018.
Geographic Areas
We have operations in 10 countries and occasionally conduct business in a few other countries. Most of our revenues are derived from our U.S., Canadian and European operations. See Note 2-Revenue and Note 19-Segment Disclosure to the consolidated financial statements in this Annual Report for further disclosure of our revenues, long-lived assets and other financial information regarding our international operations.
Sales and Marketing
We sell our asset protection solutions through our direct sales and marketing teams within all of our offices worldwide. In addition, our project and laboratory managers, as well as our management, are trained on our solutions and often are the source of sales leads and customer contacts. Our direct sales and marketing teams work closely with our customers’ research and design personnel, reliability engineers and facilities maintenance engineers to demonstrate the benefits and capabilities of our asset protection solutions, refine our asset protection solutions based on changing market and customer needs and identify potential sales opportunities. We divide our sales and marketing efforts into services sales, products and systems sales and marketing and utilize customer relationship management (CRM) systems to collect, manage and collaborate customer information with our teams globally. Our CRM's also provide critical data to provide accurate forecasting and reporting.
Manufacturing
Most of our hardware products are manufactured in our Princeton Junction, New Jersey facility. Our Princeton Junction facility includes the capabilities and personnel to fully produce all of our AE products and NDT Automation Ultrasonic equipment. We also design and manufacture automated ultrasonic systems and scanners in France.
Human Capital
As of December 31, 2020, we had 5,400 employees worldwide, of which 3,600 were located in the U.S., 600 in Canada and 1,200 in our other non-U.S. locations. As described below, we value our employees and have established various programs to promote the satisfaction, health and safety of our employees. Less than 0.5% of our employees in the United States are unionized.
Caring Connects
We consider the Company and its employees as a team connected by a common thread of caring – about one another, our customers, the environment, and the work we do. We see our responsibility as looking out for our employees and to encourage our employees to look out for one another, by fostering a culture of togetherness, safety, respect, and contribution which enables each individual member to feel that they are a part of something bigger. A community of caring professionals with a genuine passion for helping people and making a difference, together – that’s the heart of the program we call Caring Connects.
MISTRAS’ Safety-Conscious Culture
We consider safety as the backbone of our operations. Our asset protection solutions aim to ensure that industrial assets and facilities remain in safe, reliable working order, which in turn enhances safety for our clients, the public, and the environment. Our lab and field personnel are trained to operate according to strict safety and quality standards so that our processes and procedures in regard to hazardous materials, worker safety, and accident prevention are sound and effective. MISTRAS works to help ensure that our clients are in full compliance with all federal, state, and local regulations. Our practices, policies and procedures are designed to help ensure we perform our duties through the use of safe, industry-best practices, seeking to minimize risk wherever possible. We emphasize a “MISTRAS’ safety-conscious” culture with the intent that it becomes embedded in the day-to-day work of all our employees. We use various training tools and other practices to instill attitudes,
14
beliefs, perceptions, and values that all employees share in the mandate to create and maintain a safe work environment for all. We stay abreast of our safety performance through analysis of our company-wide safety statistics, which help us to determine behavioral trends while also instilling a culture of proactivity.
In 2020, our Board of Directors established the Social Responsibility, Environmental and Safety Committee, consisting of independent directors to help monitor and emphasize the importance of these core values at Mistras.
Seasonality
Our business is seasonal. This seasonality relates primarily to our oil and gas business, and to a lesser extent from the fossil and nuclear power industries. U.S. refineries’ non-peak periods are generally in the fall, when they are retooling to produce more heating oil for winter, and in the spring, when they are retooling to produce more gasoline for summer. The peak periods for these customers are the summer and winter months, when they run at peak capacity and are not retooling or performing turnarounds or shut downs. As a result, our revenues in the summer and winter months are typically lower than our revenues in the fall and spring, when demand for our asset protection solutions from the oil and gas as well as the fossil and nuclear power industries increases during their non-peak production periods. Because we are increasing our work in the fall and spring, our cash flows are lower in those quarters than in the summer and winter, as collections of receivables lag behind revenues. We expect that this seasonality will continue.
Competition
We operate in a highly competitive, but fragmented, market. Our primary competitors are divisions of large companies and various small companies which generally are limited to a specific product or technology and focused on a niche market or geographic region. We believe that few, if any, of our competitors currently provide the full range of asset protection and NDT products, enterprise software (PCMS) and the traditional and advanced services solutions that we offer. Our competition with respect to NDT services include Acuren, SGS Group, the Team Qualspec division of Team, Inc. and APPLUS RTD. Our competition with respect to our PCMS software includes UltraPIPE, Lloyd’s Register Capstone, Inc. and Meridium Systems. In the traditional NDT market, we believe the principal competitive factors include project management, availability of qualified personnel, execution, price, reputation and quality; whereas in the advanced NDT market, reputation, quality and size tend to be the most significant competitive factors. We believe that the NDT market has significant barriers to entry which would make it difficult for new competitors to enter the market. These barriers include: (1) having to acquire or develop advanced NDT services, products and systems technologies, which in our case occurred over many years of customer engagements and at significant internal research and development expense, (2) complex regulations and safety codes that require significant industry experience, (3) license requirements and evolved quality and safety programs, (4) costly and time-consuming certification processes, (5) capital requirements and (6) emphasis by large customers on size and critical mass, length of relationship and past service record.
Research and Development
Our research and development is principally conducted by engineers and scientists at our Princeton Junction, New Jersey headquarters, and supplemented by other employees in the United States and throughout the world, including France, Greece the United Kingdom, Brazil and the Netherlands. Our total professional staff includes employees who hold Ph.D.’s and engineers and employees who hold Level III certification, the highest level of certification from the American Society of Non-Destructive Testing (ASNT).
MISTRAS makes strategic R&D investments in technologies that support integration with our other solution offerings to enhance cost- and time-efficiencies, maximize uptime and safety and improve the flow of data from field technicians to inspection databases. We are investing resources in the development of MISTRAS Digital, an electronic platform that will digitally deliver field inspection assignments and related data, capture inspection results, and provide electronic reporting and productivity tracking. MISTRAS also invested significant R&D in pre-machining and advanced testing technologies in a purpose-built facility for an aerospace customer, with the goal of reducing the customer’s production cycle logistics and costs.
We also work with customers to develop new products or applications for our technology, including:
•Testing of new composites
•Detecting crack propagation
•Wireless and communications technologies
•Development of permanently embedded inspection systems to provide continuous, online, in-service monitoring of critical structural components
15
Research and development expenses are reflected on our consolidated statements of income as research and engineering expenses. Our company-sponsored research and engineering expenses were approximately $2.9 million, $3.0 million and $3.3 million for the years ended December 31, 2020, 2019 and 2018, respectively. While we have historically funded most of our research and development expenditures, from time to time we also receive customer-sponsored research and development funding. Most of the projects are in our target markets; however, a few of the projects could lead to other future market opportunities.
Intellectual Property
Our success depends, in part, on our ability to maintain and protect our proprietary technology and to conduct our business without infringing on the proprietary rights of others. We utilize a combination of intellectual property safeguards, including patents, copyrights, trademarks and trade secrets, as well as employee and third-party confidentiality agreements, to protect our intellectual property.
As of December 31, 2020, we held two U.S. patents (by direct ownership or exclusive licensing), which will expire in 2021 and 2026, respectively, and seven patents pending in the U.S. for applications filed in 2018, 2019 and 2020, and had licenses to certain other patents. However, we do not principally rely on these patents or licenses to provide most of our proprietary asset protection solutions. Our trademarks and service marks provide us and our solutions with a certain amount of brand recognition in our markets. We do not consider any single patent, trademark or service mark material to our financial condition or results of operations.
As of December 31, 2020, the primary trademarks and service marks that we held in the United States included MISTRAS® and our stylized globe design. Other key trademarks or service marks that we utilize in localized markets or product advertising include:
•Mistras Digital®
•OneSource™ for Asset Protection Solutions®
•OneSource™
•CALIPERAY™
•PCMS®
•Physical Acoustics and the PAC logo
•Streamview™
•Ropeworks®
•Sensor Highway™
•TankPAC®
•VPAC™
•Transformer Clinic™
•FieldCal
•UTwin
•AEwin
•Pocket AE
•Valve Squeak
•Pocket UT
Many elements of our asset protection solutions involve proprietary know-how, technology or data that are not covered by patents or patent applications because they are not patentable or would be difficult to enforce, including technical processes, equipment designs, algorithms and procedures. We believe that this proprietary know-how, technology and data is the most important component of our intellectual property used in our asset protection solutions and is a primary differentiator of our solutions from those of our competitors. We rely on various trade secret protection techniques and agreements with our customers, service providers and vendors to protect these assets. All of our employees are subject to confidentiality requirements through our employee handbook. In addition, many of our employees have entered into confidentiality and proprietary information agreements with us. Our employee handbook and these agreements require our employees not to use or disclose our confidential information and to assign to us all the inventions, designs and technologies they develop during the course of employment with us, as well as addressing other intellectual property protection issues. We also seek confidentiality agreements from our customers and business partners before we disclose any sensitive aspects of our technologies or business strategies. We are not currently involved in any material intellectual property claims.
16
Environmental Matters
We are subject to numerous environmental, legal and regulatory requirements related to our operations worldwide. In the United States, these laws and regulations include, among others: the Comprehensive Environmental Response, Compensation, and Liability Act, the Resources Conservation and Recovery Act, the Clean Air Act, the Federal Water Pollution Control Act, the Toxic Substances Control Act, the Atomic Energy Act, the Energy Reorganization Act of 1974, and applicable regulations. In addition to the federal laws and regulations, states and other countries where we do business often have numerous environmental, legal and regulatory requirements by which we must abide. We evaluate and address the environmental impact of our operations by assessing properties in order to avoid future liabilities and comply with environmental, legal and regulatory requirements.
Executive Officers
The following are our executive officers and other key employees as of December 31, 2020 and their background and experience:
| Name | Age | Position | ||||||||||||
| Sotirios J. Vahaviolos | 74 | Executive Chairman and Director | ||||||||||||
| Dennis Bertolotti | 61 | President, Chief Executive Officer and Director | ||||||||||||
| Edward J. Prajzner | 54 | Executive Vice President, Chief Financial Officer and Treasurer | ||||||||||||
| Michael C. Keefe | 64 | Executive Vice President, General Counsel and Secretary | ||||||||||||
| Michael J. Lange | 60 | Senior Group Executive Vice President | ||||||||||||
| Jonathan H. Wolk | 59 | Senior Executive Vice President and Chief Operating Officer | ||||||||||||
Sotirios J. Vahaviolos has been Executive Chairman since August 10, 2017. Prior to being named Executive Chairman, Dr. Vahaviolos had been our Chairman and Chief Executive Officer since he founded Mistras in 1978 under the name Physical Acoustics Corporation and was also our President until June 1, 2016. Prior to joining Mistras, Dr. Vahaviolos worked at AT&T Bell Laboratories. Dr. Vahaviolos received a B.S. in Electrical Engineering and graduated first in his engineering class from Fairleigh Dickinson University and received Masters Degrees in Electrical Engineering and Philosophy and a Ph.D. (EE) from the Columbia University School of Engineering. During Dr. Vahaviolos’ career in non-destructive testing, he has been elected Fellow of The Institute of Electrical and Electronics Engineers, a member of The American Society for Nondestructive Testing (ASNT) where he served as its President from 1992-1993 and its Chairman from 1993-1994, a member of Acoustic Emission Working Group (AEWG) and an honorary life member of the International Committee for Nondestructive Testing. Additionally, he was the recipient of ASNT’s Gold Medal in 2001 and AEWG’s Gold Medal in 2005. He was also one of the six founders of NDT Academia International in 2008 headquartered in Brescia, Italy.
Dennis Bertolotti joined Mistras when Conam Inspection Services was acquired in 2003, where Mr. Bertolotti was a Vice President at the time of the acquisition. Since then, Mr. Bertolotti has had increasing levels of responsibility with Mistras, and became our President and Chief Executive Officer and Director, effective August 10, 2017. From June 1, 2016 to August 9, 2017, Mr. Bertolotti was our President and Chief Operating Officer. Mr. Bertolotti has been in the NDT business for over 30 years, and previously held ASNT Level III certifications and various American Petroleum Institute, or API, certifications, and received his Associate of Science degree in NDT from Moraine Valley Community College in 1983. Mr. Bertolotti has also received a Bachelor of Science and MBA from Otterbein College.
Edward J. Prajzner joined Mistras in January 2018. Prior to joining Mistras, Mr. Prajzner worked at CECO Environmental Corp., a global service provider to environmental, energy and filtration industries, and served as Chief Financial Officer and Secretary from 2014 to 2017, Vice President of Finance and Chief Accounting Officer from 2013 until his appointment as CFO in 2014, and Corporate Controller and Chief Accounting Officer from 2012 to 2013. Mr. Prajzner also served in senior finance roles at CDI Corporation (now AE Industrial Partners), and American Infrastructure (now Allan Myers). Mr. Prajzner began his career in public accounting at Ernst & Young, received his B.S. in accountancy from Villanova University, his MBA in finance from Temple University and is a certified public accountant.
Michael C. Keefe joined Mistras in December 2009. Prior to joining Mistras, Mr. Keefe worked at International Fight League, a publicly-traded sports promotion company, from 2007 until 2009, in various executive positions. From 1990 until 2006, Mr. Keefe served in various legal roles with Lucent Technologies and AT&T, the last four years as Vice President, Corporate and Securities Law and Assistant Secretary. Mr. Keefe received a BS in Business Administration (Accounting) from Seton Hall University and a J.D. from Seton Hall University School of Law.
17
Michael J. Lange joined Mistras when we acquired Quality Services Laboratories in November 2000, and was elected a Director in 2003. Mr. Lange has held various executive level positions with Mistras, becoming Senior Executive Vice President, effective June 1, 2016. Mr. Lange is a well-recognized authority in Radiography and has held an ASNT Level III Certificate for almost 20 years. Mr. Lange received an Associate of Science degree in NDT from the Spartan School of Aeronautics.
Jonathan H. Wolk joined Mistras in November 2013 and served as Executive Vice President, Chief Financial Officer and Treasurer until August 10, 2017, when Mr. Wolk became Senior Executive Vice President and Chief Operating Officer. Mr. Wolk was also acting Chief Financial Officer from August 10, 2017 until the appointment of Mr. Prajzner on January 5, 2018. Prior to joining Mistras, Mr. Wolk served as Senior Vice President, Chief Financial Officer and Secretary of American Woodmark Corporation from 2004 until August 2013. Prior to American Woodmark, he served as the Chief Financial Officer and Treasurer of Tradecard, Inc., from 2000 to 2004, and was the global controller of GE Capital Real Estate from 1998 to 2000. Mr. Wolk started his career in public accounting at KPMG, received his B.S. in accounting from State University of New York-Albany and is a certified public accountant.
Our executive officers are elected by, and serve at the discretion of, our board of directors. There are no family relationships among any of our directors or executive officers.
Our Website and Available Information
Our website address is www.mistrasgroup.com. We file reports with the SEC, including Quarterly Reports on Form 10-Q, Annual Reports on Form 10-K, Current Reports on Form 8-K and Proxy Statements. All of the materials we file with or furnish to the SEC are available free of charge on our website at http://investors.mistrasgroup.com/sec.cfm, as soon as reasonably practicable after having been electronically submitted to the SEC. Information contained on or connected to our website is not incorporated by reference into this Annual Report on Form 10-K and should not be considered part of this report or any other filing with the SEC. All of our SEC filings are also available at the SEC’s website at www.sec.gov. In addition, materials we file with the SEC may be read and copied at the SEC’s Public Reference Room at 100 F Street, NE, Washington, DC 20549. The public may obtain information on the operation of the Public Reference Room by calling the SEC at 1-800-SEC-0330.
ITEM 1A. RISK FACTORS
This section describes the major risks to us, our business and our common stock. You should carefully read and consider the risks described below, together with the other information contained in this Annual Report, including our financial statements and the notes thereto and “Management’s Discussion and Analysis of Financial Condition and Results of Operations” (MD&A) before making an investment decision. The statements contained in this section constitute cautionary statements under the Private Securities Litigation Reform Act of 1995. If any of these risks occur, our business, financial condition, results of operations and future growth prospects may be adversely affected. As a result, the trading price of our common stock would likely decline, and you may lose all or part of your investment. You should understand that it is not possible to predict or identify all risk factors that could impact us. For example, the current pandemic created by the COVID-19 coronavirus is causing a dramatic negative impact on the health of citizens of many countries, which in turn has caused major disruptions in economies and markets around the world, including our key markets. Accordingly, you should not consider the following to be a complete discussion of all risks and uncertainties pertaining to us and our common stock.
Risks Related to Our Business
Due to our dependency on customers in the oil and gas industry, we are susceptible to prolonged negative trends relating to this industry that could adversely affect our operating results.
Our customers in the oil and gas industry (including the petrochemical market) have accounted for a substantial portion of our historical revenues. Specifically, they accounted for approximately 57%, 58%, and 56% of our revenues for the years ended December 31, 2020, 2019 and 2018, respectively. Although we have expanded our customer base into industries other than the oil and gas industry, we still receive a majority of our revenues from this industry. Our services are vital to the operators of plants and refineries and we have expanded our services offerings, such as expanding our mechanical services capabilities. However, economic slowdowns or low oil prices have, and could continue to, result in cutbacks in contracts for our services. In addition, low oil prices could depress the level of new exploration and construction, which would adversely affect our market opportunities. If the oil and gas industry were to continue to operate in a market with low oil prices, our revenues, profits and cash flows may be reduced. While we continue to expand our market presence in the aerospace, power generation and
18
transmission, and the chemical processing industries, among others, these markets are also cyclical in nature and as such, are subject to economic downturns.
We may be affected by climate change and market or regulatory responses to climate change
Climate change, including the impact of global warming, could have a material adverse effect on our results of operations, financial condition, and liquidity. Restrictions on emissions could affect our customers that (a) use commodities to produce energy, (b) use significant amounts of energy in producing or delivering commodities, or (c) manufacture or produce goods that consume significant amounts of energy or burn fossil fuels. Significant cost increases, government regulation, or changes of consumer preferences for goods or services relating to alternative sources of energy or emissions reductions could materially affect the markets we serve (including the oil and gas industry), which in turn could have a material adverse effect on our results of operations, financial condition, and liquidity. Government incentives encouraging the use of alternative sources of energy also could affect certain of our customers and the markets we serve in an unpredictable manner. Any of these factors, individually or in operation with one or more of the other factors, or other unforeseen impacts of climate change could have a material adverse effect on our results of operations, financial condition, and liquidity.
Our long-term growth strategy includes acquisitions. We may not be able to identify suitable acquisition candidates or integrate acquired businesses successfully, which may adversely impact our results. In addition, due to our current debt levels and the restrictions related to the covenants in our credit facility, we do not expect to complete any acquisitions in 2021 other than small acquisitions with the banks’ approval. Furthermore, acquisitions that we have completed or may complete in the future could expose us to a number of unanticipated operational and financial risks.
A significant factor in our growth has been and will continue to be based upon our ability to make acquisitions and successfully integrate these acquired businesses. We have used acquisitions both to expand into new markets and to enhance our position in existing markets. This strategy has provided us with many benefits and has helped fuel our growth, but also carries with it many risks. Some of the risks associated with our acquisition strategy include:
•whether we successfully identify suitable acquisition candidates, negotiate appropriate acquisition terms, and complete proposed acquisitions;
•whether we can successfully integrate acquired businesses into our current operations, including our accounting, internal control and information technology systems, marketing and other key infrastructure;
•whether we can adequately capture opportunities that an acquired business may offer, including the expansion into new markets in which we have little to no experience or presence;
•whether we value an acquired business properly when determining the purchase price and terms, and whether we are able to achieve the returns on the investment we expect;
•whether an acquired business can achieve levels of revenues, profitability, productivity or cost savings we expect;
•whether an acquired business is compatible with our culture and philosophy of doing business;
•the unexpected loss of key personnel and customers of an acquired business;
•the assumption of liabilities and risks (including environmental-related costs) of an acquired business, some of which may not be anticipated;
•the potential disruption of our ongoing business and distraction of management and other personnel of us and the acquired business resulting from the efforts to acquire, then integrate, an acquired business;
•the potential for greater exposure to risks associated with international operations; and
•the amount and cost of funding (including borrowings under our credit agreement) to acquire and integrate other businesses (some of which may require substantial funding) and the impact of the acquisition and borrowing on our continued compliance with covenants in our credit agreement.
Our ability to undertake acquisitions is limited by our financial resources, including available cash and borrowing capacity. Due to our current debt levels and restrictions related to the covenants in our credit facility, we do not expect to make any acquisitions in 2021 other than small acquisitions with the banks’ approval. Future acquisitions could result in potentially dilutive issuances of equity securities, the incurrence of substantial additional indebtedness and other expenses, any of which could adversely impact our financial condition and results of operations. Although management intends to: (i) evaluate the risks
19
inherent in any particular transaction, (ii) assume only risks management believes to be acceptable, and (iii) develop plans to mitigate such risks, there are no assurances that we will properly ascertain or accurately assess the extent of all such risks. Difficulties encountered with acquisitions may adversely impact our business, financial condition and results of operations.
In addition, we have a significant amount of goodwill and other intangible assets on our balance sheet from our acquisitions. This will increase as we complete more acquisitions. If our acquisitions do not perform as planned and we do not realize the benefits and profitability we expect, we could incur significant write-downs and impairment charges to our earnings due to the impairment of the goodwill and other intangible assets we have acquired or acquire in the future. We experienced such write-downs and impairment changes in the quarter ended March 31, 2020 (see notes 8 and 9 to the financial statements included in Item 8 of this report).
Our international operations are subject to risks relating to non-U.S. operations.
For the years ended December 31, 2020, 2019 and 2018, we generated approximately 31%, 34%, and 34% of our revenues outside the United States, respectively. In addition, our international operations as a percentage of our business may increase over time. Our primary operations outside the United States are in Canada, Germany, France, the United Kingdom and Brazil. We also have operations in the Netherlands, Belgium, Greece and India. There are numerous risks inherent in doing business in international markets, including:
•fluctuations in currency exchange rates and interest rates;
•varying regional and geopolitical business and economic conditions and demands;
•compliance with applicable foreign regulations and licensing requirements, and U.S. laws and regulation with respect to our business in other countries, including export controls and anti-bribery laws;
•the cost and uncertainty of obtaining data and creating solutions that are relevant to particular geographic markets;
•the need to provide sufficient levels of technical support in different locations;
•the complexity of maintaining effective policies and procedures in locations around the world;
•political instability and civil unrest;
•restrictions or limitations on outsourcing contracts or services abroad;
•the long-term impact of the United Kingdom exiting the European Union; the ultimate effects of Brexit on the Company are difficult to predict. On January 31, 2020, the U.K. exited from the EU (BREXIT). On December 24, 2020, the United Kingdom and European Union agreed on a new Trade and Cooperation Agreement and on December 31, 2020, the United Kingdom formally left the transition period. Although it is unknown what the terms of the U.K.’s future relationship with the EU will be, it is possible that there will be higher tariffs or greater restrictions on imports and exports between the U.K. and the EU and increased regulatory complexities. The Company currently has subsidiaries that operate in the United Kingdom and Europe and our UK subsidiary and other European subsidiaries from time to time share employees and equipment. Brexit may make this sharing of employees and equipment more time consuming and expensive, which could cause disruptions and adversely affect the Company’s financial condition, operating results and cash flows. Our UK subsidiary represents 1.6% of our consolidated revenue for the year ended December 31, 2020.
•restrictions or limitations on the repatriation of funds, or tax consequences on the non-repatriation of overseas operationally generated funds; and
•other potentially adverse tax consequences.
20
We expect to continue expanding and our success depends on how effectively we manage our growth.
We expect to continue experiencing growth in the number of employees and the scope of our operations over the long-term. To effectively manage our anticipated future growth, we must continue to implement and improve our managerial, operational, compliance, financial and reporting systems and capabilities, expand our facilities and continue to recruit and train additional qualified personnel. We expect that all these measures will require significant expenditures and will demand the attention of management. Failure to manage our growth effectively could lead us to over or under-invest in technology and operations, result in weaknesses in our infrastructure, systems, compliance programs or controls, and give rise to operational mistakes, the loss of business opportunities, the loss of employees and reduced productivity among remaining employees. Our expected growth could require significant capital expenditures and may divert financial resources from other projects, such as the development of new solutions. If our management is unable to effectively manage our expected growth, our expenses may increase more than expected, our profit margins may suffer, our revenues could decline or may grow more slowly than expected and we may be unable to implement our business strategy as anticipated.
Our operating results could be adversely affected by a reduction in business with our significant customers.
We derive a significant amount of revenues from a few customers. Taken as a group, our top ten customers were responsible for approximately 32%, 34%, and 34% of our revenues for the years ended December 31, 2020, 2019 and 2018, respectively. This concentration pertains almost exclusively to our Services segment, which accounted for more than 75% of our revenues for the years ended December 31, 2020, 2019 and 2018. These customers are primarily in the oil and gas sector. Generally, our customers do not have an obligation to make purchases from us and may stop ordering our products and services or may terminate existing orders or contracts at any time with little or no financial penalty. The loss of any of our significant customers, any substantial decline in sales to these customers or any significant change in the timing or volume of purchases by our customers could result in lower revenues and could harm our business, financial condition or results of operations.
An accident or incident involving our asset protection solutions could expose us to claims, harm our reputation and adversely affect our ability to compete for business and, as a result, harm our operating performance.
We could be exposed to liabilities arising out of the solutions we provide. For instance, we furnish the results of our testing and inspections for use by our customers in their assessment of their assets, facilities, plants and other structures. If such results were to be incorrect or incomplete, as a result of, for instance, poorly designed inspections, malfunctioning testing equipment or our employees’ failure to adequately test or properly record data, we could be subject to claims. Further, if an accident or incident involving a structure we tested occurs and causes personal injuries or property damage, such as the collapse of a bridge or an explosion in a facility, and particularly if these injuries or damages could have been prevented by our customers had we provided them with correct or complete results, we would likely face significant claims relating to personal injury, property damage or other losses. Even if our results are correct and complete, we may face claims for such injuries or damage simply because we tested the structure or facility in question. In addition, during the course of a single engagement, such as the inspection of a pipeline, we often perform tests on thousands of welds. Even if the accuracy of only a small number of these test results are questioned, a customer may attempt to refuse payment for the entire project. While we do have insurance, our insurance coverage does not cover non-payment by customers and may not be adequate to cover the damages from any such claims, forcing us to bear these uninsured damages directly, which could harm our operating results and may result in additional expenses and possible loss of revenues. An accident or incident for which we are found partially or fully responsible, even if fully insured, or even an incident at a customer or site for which we provide services although we were found not to be responsible, may also result in negative publicity, which would harm our reputation among our customers and the public, cause us to lose existing and future contracts or make it more difficult for us to compete effectively, thereby significantly harming our operating performance. In addition, the occurrence of an accident or incident might also make it more expensive or extremely difficult for us to insure against similar events in the future.
Many of the sites at which we work are inherently dangerous workplaces. If we fail to maintain a safe work environment, we may incur losses and lose business.
Many of our customers, particularly in the oil and gas and chemical industries, require their inspectors and other contractors working at their facilities to have good safety records because of the inherent danger at these sites. If our employees are injured at the work place, we could incur costs for the injuries and lost productivity. In addition, safety records are impacted by the number and amount of workplace incidents involving a contractor’s employees. If our safety record is not within the levels required by our customers, or compares unfavorably to our competitors, we could lose business, be prevented from working at certain facilities or suffer other adverse consequences, all of which could negatively impact our business, revenues, reputation and profitability.
21
If our software or system produces inaccurate information or are incompatible with the systems used by our customers and
make us unable to successfully provide our solutions, it could lead to a loss of revenues and customers.
Our software and systems are complex and, accordingly, may contain undetected errors or failures. Software or system defects or inaccurate data may cause incorrect recording, reporting or display of information related to our asset protection solutions. Any such failures, defects and inaccurate data may prevent us from successfully providing our asset protection solutions, which could result in lost revenues. Software or system defects or inaccurate data may lead to customer dissatisfaction and could cause our customers to seek to hold us liable for any damages incurred. As a result, we could lose customers, our reputation may be harmed and our financial condition and results of operations could be materially adversely affected.
We currently serve a commercial, industrial and governmental customer base that uses a wide variety of constantly changing hardware, software solutions and operating systems. Our asset protection solutions need to interface with these non-standard systems in order to gather and assess data. Our business depends on the following factors, among others:
•our ability to integrate our technology with new and existing hardware and software systems;
•our ability to anticipate and support new standards, especially internet-based standards; and
•our ability to integrate additional software modules under development with our existing technology and operational processes.
If we are unable to adequately address any of these factors, our results of operations and prospects for growth and profitability
would be adversely impacted.
If we are unable to attract and retain a sufficient number of trained certified technicians, engineers and scientists at competitive wages, our operational performance may be harmed and our costs may increase.
We believe that our success depends, in part, upon our ability to attract, develop and retain a sufficient number of trained certified technicians, engineers and scientists at competitive wages. The demand for such employees fluctuates as the demand for NDT and inspection services fluctuates. When the demand for qualified technicians increases, we will often experience increased labor costs, which we may not recover in the amounts we can charge our customers. The markets for our products and services require us to use personnel trained and certified in accordance with standards set by domestic or international standard-setting bodies, such as the American Society of Non-Destructive Testing or the American Petroleum Institute. Because of the limited supply of these certified technicians, we expend substantial resources maintaining in-house training and certification programs. If we fail to attract sufficient new personnel or fail to motivate and retain our current personnel, our ability to perform under existing contracts and orders or to pursue new business may be harmed, preventing us from growing our business or causing us to lose customers and revenues, and the costs of performing such contracts and orders may increase, which would likely reduce our margins.
We operate in competitive markets and if we are unable to compete successfully, we could lose market share and revenues and our margins could decline.
We face strong competition from NDT and a variety of niche asset protection providers, both larger and smaller than we are. Some of our competitors have greater financial resources than we do and could focus their substantial financial resources to develop a competing business model or develop products or services that are more attractive to potential customers than what we offer. Some of our competitors are business units of companies substantially larger than us and could attempt to combine asset protection solutions into an integrated offering to customers who already purchase other types of products or services from them. Our competitors may offer asset protection solutions at lower prices than ours in order to attempt to gain market share. Smaller niche competitors with small customer bases could be aggressive in their pricing in order to retain customers. These competitive factors could reduce our market share, revenues and profits.
The success of our businesses depends, in part, on our ability to develop new asset protection solutions, increase the functionality of our current offerings and meet the needs and demands of our customers.
The market for asset protection solutions is impacted by technological change, uncertain product lifecycles, shifts in customer demands and evolving industry standards and regulations. If management fails to execute effective business strategies, and to successfully develop and market new asset protection solutions that comply with present or emerging industry regulations and technology standards our competitive standing and results could suffer. Also, new regulations or technology standards could increase our cost of doing business.
22
From time to time, our customers have requested greater value and functionality in our solutions. As part of our strategy to enhance our asset protection solutions and grow our business, we continue to make investments in the research and development of new technologies, inspection tools and methodologies. We believe our future success will depend, in part, on our ability to continue to design new, competitive and broader asset protection solutions, enhance our current solutions and provide new, value-added services. Many traditional NDT and inspection services are subject to price competition by our customers. Accordingly, the need to demonstrate our value-added services is becoming more important. Developing new solutions will require continued investment, and we may experience unforeseen technological or operational challenges. In addition, our asset protection software is complex and can be expensive to develop, and new software and software enhancements can require long development and testing periods. If we are unable to develop new asset protection solutions or enhancements that meet market demands on a timely basis, including against possible alternative products developed and marketed by our competitors, we may experience a loss of customers or otherwise be likely to lose opportunities to earn revenues and to gain customers or access to markets, and our business and results of operations will be adversely affected.
Even if we develop new solutions, if our customers, or potential customers, do not see the value our solutions have over competing products and services, our operating results could be adversely impacted. In addition, because the asset protection solutions industry is rapidly evolving, we could lose insight into trends that may be emerging, which would further harm our competitive position by making it difficult to predict and respond to customer needs. If the market for our asset protection solutions does not continue to develop, our ability to grow our business would be limited and we might not be able to maintain profitability. If we cannot convince our customers of the advantages and value of our advanced NDT services, we could lose large contracts or suffer lower profit margin.
The seasonal nature of our business reduces our revenues and profitability in the winter and summer and related cash flows.
Our business is seasonal. The fall and spring revenues are typically higher than our revenues in the winter and summer because demand for our asset protection solutions from the oil and gas as well as the fossil and nuclear power industries increases during their non-peak production periods. For instance, U.S. refineries’ non-peak periods are generally in the fall, when they are retooling to produce more heating oil for winter, and in the spring, when they are retooling to produce more gasoline for summer. As a result of these trends, we generally have reduced cash flows in the fall and spring, as collections of receivables lag behind revenues, possibly requiring us to borrow under our credit agreement. In addition, most of our operating expenses, such as employee compensation and property rental expense, are relatively fixed over the short term. Moreover, our spending levels are based in part on our expectations regarding future revenues. As a result, if revenues for a particular quarter are below expectations, we may not be able to proportionately reduce operating expenses for that quarter. We expect that the impact of seasonality will continue.
Our business, and the industries we currently serve, are currently subject to governmental regulation, and may become subject to modified or new government regulation that may negatively impact our ability to market our asset protection solutions.
We incur substantial costs in complying with various government regulations and licensing requirements. For example, the transportation and overnight storage of radioactive materials used in providing certain of our asset protection solutions such as radiography are subject to regulation under federal and state laws and licensing requirements. Our Services segment is currently licensed to handle radioactive materials by the U.S. Nuclear Regulatory Commission (NRC), more than 20 state regulatory agencies and the Canadian Nuclear Safety Commission. If we allegedly fail to comply with these regulations, we may be investigated and incur significant legal expenses associated with such investigations, and if we are found to have violated these regulations, we may be fined or lose one or more of our licenses or permits, which would prevent or restrict our ability to provide radiography services. In addition, while we are investigated, we may be required to suspend work on the projects associated with our alleged noncompliance, resulting in loss of profits or customers, and damage to our reputation. Many of our customers have strict requirements concerning safety or loss time occurrences and if we are unable to meet these requirements it could result in lost revenues. In the future, governmental agencies may seek to change current regulations or impose additional regulations on our business. Any modified or new government regulation applicable to our current or future asset protection solutions may negatively impact the marketing and provision of those solutions and increase our costs of providing these solutions and have a corresponding adverse effect on our margins.
Additionally, greenhouse gases that result from human activities, including burning of fossil fuels, have been the focus of increased scientific and political scrutiny and are being subjected to various legal requirements. International agreements, national laws, state laws and various regulatory schemes limit or otherwise regulate emissions of greenhouse gases, and additional restrictions are under consideration by different governmental entities. We derive a significant amount of revenues and profits from such industries, including oil and gas, power generation and transmission, and chemicals processing. Such
23
regulations could negatively impact our customers, which could negatively impact the market for the services and products we provide. This could materially adversely affect our business, financial condition, results of operations and cash flows.
We rely on certification of our NDT solutions by industry standards-setting bodies. We and/or our subsidiaries currently have International Organization for Standardization (ISO) 9001:2008 certification, ISO 14001:2004 certification and OHSAS 18001:2007 certification. In addition, we currently have NADCAP (formerly National Aerospace and Defense Contractors Accreditation Program) and similar certifications for certain of our locations. We continually review our NDT solutions for compliance with the requirements of industry specification standards and the NADCAP special processes quality requirements. However, if we fail to maintain our ISO, Nadcap or other certifications, our business may be harmed because our customers generally require that we have these certifications before they purchase our NDT solutions.
Risks Related to Our Common Stock
A significant stockholder controls the direction of our business. The concentrated ownership of our common stock may prevent other stockholders from influencing significant corporate decisions.
Dr. Sotirios J. Vahaviolos, our founder and Executive Chairman, owns approximately 29% of our outstanding common stock. As a result, Dr. Vahaviolos has significant control over our Company and has the ability to exert substantial influence over all matters requiring approval by our shareholders, including the election and removal of directors, amendments to our certificate of incorporation, and any proposed merger, consolidation or sale of all or substantially all of our assets and other corporate transactions. This concentration of ownership could be disadvantageous to other shareholders with differing interests from Dr. Vahaviolos.
Our stock price could fluctuate for numerous reasons, including variations in our results.
Our quarterly operating results have fluctuated in the past and may do so in the future. Accordingly, we believe that period-to-period comparisons of our results of operations may be the best indicators of our business. You should not rely upon the results of one quarter as an indication of future performance. Our revenues and operating results may fall below the expectations of securities analysts or investors in any future period. Our failure to meet these expectations may cause the market price of our common stock to decline, perhaps substantially. Our quarterly revenues and operating results may vary depending on a number of factors, including those listed previously under “Risks Related to Our Business.” In addition, the price of our common stock is subject to general economic, market, industry, and competitive conditions, the risk factors discussed below and numerous other conditions outside of our control.
We currently have no plans to pay dividends on our common stock.
We have not declared or paid any cash dividends on our common stock to date, and we do not anticipate declaring or paying any dividends on our common stock in the foreseeable future. To the extent we do not pay dividends on our common stock, investors must look solely to stock appreciation for a return on their investment.
Shares eligible for future sale may cause the market price for our common stock to decline even if our business is doing well.
Future sales by us or by our existing shareholders of substantial amounts of our common stock in the public market, or the perception that these sales may occur, could cause the market price of our common stock to decline. This could also impair our ability to raise additional capital in the future through the sale of our equity securities. Under our certificate of incorporation, we are authorized to issue up to 200,000,000 shares of common stock, of which approximately 29,234,143 shares of common stock were outstanding as of March 11, 2021. In addition, we have approximately 1,414,000 shares of common stock reserved for issuance related to share-based equity awards that were outstanding as of March 11, 2021. We cannot predict the size of future issuances of our common stock or the effect, if any, that future sales and issuances of shares of our common stock, or the perception of such sales or issuances, would have on the market price of our common stock.
24
Provisions of our charter, bylaws and of Delaware law could discourage, delay or prevent a change of control of our company, which may adversely affect the market price of our common stock.
Certain provisions of our certificate of incorporation and bylaws could discourage, delay or prevent a merger, acquisition, or other change of control that stockholders may consider favorable, including transactions in which our stockholders might otherwise receive a premium for their shares. These provisions also could limit the price that investors might be willing to pay in the future for shares of our common stock, thereby depressing the market price of our common stock. Stockholders who wish to participate in these transactions may not have the opportunity to do so. Furthermore, these provisions could prevent or frustrate attempts by our stockholders to replace or remove our management. These provisions:
•allow the authorized number of directors to be changed only by resolution of our board of directors;
•require that vacancies on the board of directors, including newly created directorships, be filled only by a majority vote of directors then in office;
•authorize our board of directors to issue, without stockholder approval, preferred stock that, if issued, could operate as a “poison pill” to dilute the stock ownership of a potential hostile acquirer to prevent an acquisition that is not approved by our board of directors;
•require that stockholder actions must be effected at a duly called stockholder meeting by prohibiting stockholder action by written consent;
•prohibit cumulative voting in the election of directors, which may otherwise allow holders of less than a majority of stock to elect some directors; and
•establish advance notice requirements for stockholder nominations to our board of directors or for stockholder proposals that can be acted on at stockholder meetings and limit the right to call special meetings of stockholders to the Chairman of the Board, the Chief Executive Officer, the board of directors acting pursuant to a resolution adopted by a majority of directors or the Secretary upon the written request of stockholders entitled to cast not less than 35% of all the votes entitled to be cast at such meeting.
In addition, because we are incorporated in Delaware, we are governed by the provisions of Section 203 of the Delaware General Corporation Law, which may, unless certain criteria are met, prohibit large stockholders, in particular those owning 15% or more of our outstanding voting stock, from merging or combining with us for a prescribed period of time.
General Risk Factors
Our credit agreement contains financial and operating restrictions that may limit our access to credit. If we fail to comply with financial or other covenants in our credit agreement, we may be required to repay indebtedness to our existing lenders, which may harm our liquidity.
Our credit agreement contains financial covenants that require us to maintain compliance with specified financial ratios. If we fail to comply with these covenants, the lenders could prevent us from borrowing under our credit agreement, require us to pay all amounts outstanding, require that we cash collateralize letters of credit issued under the credit agreement and restrict us from making acquisitions. If the maturity of our indebtedness is accelerated, we then may not have sufficient funds available for repayment or the ability to borrow or obtain sufficient funds to replace the accelerated indebtedness on terms acceptable to us, or at all.
Our current credit agreement also imposes restrictions on our ability to engage in certain activities, such as creating liens, making certain investments, incurring more debt, disposing of certain property, paying dividends and making distributions and entering into a new line of business. While these restrictions have not impeded our business operations to date, if our plans change, these restrictions could be burdensome or require that we pay fees to have the restrictions waived. In addition, due to our current debt levels and financial ratios, we do not expect to make any acquisitions in 2021 due to restrictions related to the financial covenants in our credit agreement.
The COVID-19 pandemic has adversely affected and in future periods is expected to continue to adversely affect our business and operations.
The COVID-19 pandemic is adversely affecting, and is expected to continue to adversely affect, our business and operations and the business and operations of our customers. We have experienced, and expect to continue to experience, unpredictable
25
reductions in demand for our services and products. In response to the COVID-19 pandemic, companies within the oil and gas and aerospace industries (including our customers) have announced spending cuts and/or slowdowns (or temporary cessation) in production which, in turn, may result in decreases in awards of new contracts or adjustments, reductions, suspensions or cancellations of existing contracts. In addition, as a result of the COVID-19 pandemic, some of our customers have been and could continue to be negatively impacted as a result of disruption in demand, which has led to delays and could lead to defaults on collections of receivables from them. Such continued delays could negatively impact our business, results of operations and financial condition.
The continued spread of COVID-19 may result in a decrease in business and/or cause our customers to be unable to meet existing payment or other obligations to us, particularly in the event of a spread of COVID-19 in our market areas. The continued spread of COVID-19 could also negatively impact the availability of our key personnel necessary to conduct our business. In addition, any significant disruption of global financial markets, reducing our ability to access capital, could negatively affect our liquidity. Because the severity, magnitude and duration of the COVID-19 pandemic and its economic consequences are uncertain, rapidly changing and difficult to predict, the impact on our business, financial condition and results of operations remains uncertain and difficult to predict. While we expect the COVID-19 pandemic to have an adverse effect on our business, financial condition, liquidity, cash flow and results of operations, we are unable to predict the extent, nature or duration of these impacts at this time, although we expect such negative impacts for at least the next several quarters.
If the economic disruption caused by the COVID-19 pandemic increases in magnitude or continues longer than expected, we may have difficulty meeting the financial covenants in our credit agreement with our banks.
The Company expected that the economic disruption being caused by the COVID-19 pandemic was likely to cause our results in upcoming quarters to be less than what was required to meet the financial covenants in our then existing credit agreement with our banks. We obtained an amendment to our credit agreement which included, among other terms, modifications to the financial covenants in the credit agreement, and a reduction in our revolving line of credit from $300 million to $175 million. We believe it is probable that we will be able to meet the amended financial covenants and that sufficient credit remains available under the amended Credit Facility to meet our liquidity needs. However, due to the uncertainties and risks created by the COVID-19 pandemic, no assurance can be given that we will comply with these amended covenants, particularly if the pandemic increases in intensity or its duration is longer than expected. If we are not able to meet the financial covenants in our credit agreement in future quarters, and cannot obtain a waiver from our lenders or further amend the Credit Agreement, we will be in default, which would give the lenders the right to terminate the agreement, not allow us to borrow on our line of credit, call all of our loans to be due and payable, and exercise any other remedies available to the lenders. If we do default on our credit agreement and the lenders elect to not grant us a waiver or amendment and/or to commence exercising their remedies and we are unable to obtain other funding sources, our operations will be materially impacted and we may not be able to continue operating as a going concern. If we do obtain alternate funding sources, this alternate financing could be on substantially different and adverse terms than our existing credit agreement, materially impacting our operations and profitability, and otherwise could significantly dilute our existing shareholders and have other materially adverse effects on us and our shareholders. Likewise, any waiver and amendment to our existing credit facility could be on substantially different and adverse terms to those that currently exist, materially impacting our profitability and results of operations.
Deteriorations in economic conditions in certain markets or other factors may cause us to recognize additional impairment charges for our goodwill.
During the first quarter of 2020, the Company’s market capitalization declined significantly compared to the fourth quarter of 2019. Over the same period, the equity value of the Company’s peer group, and the overall U.S. stock market also declined significantly amid market volatility. In addition, oil prices had dropped significantly. These declines were driven in large part by the uncertainty surrounding the COVID-19 pandemic and other macroeconomic events such as the geopolitical tensions between OPEC and Russia. Based on these factors, the Company concluded that multiple triggering events occurred and, accordingly, an interim quantitative goodwill impairment test was performed for each reporting unit as of March 31, 2020.
Based upon the results of the interim quantitative goodwill impairment test during the first quarter of 2020, the Company recorded an aggregate impairment charge of $77.1 million, which included $57.2 million in the services reporting unit within the Services segment, and $19.3 million in the European reporting unit and $0.6 million in the Brazilian reporting unit, both within the International segment.
26
Significant continued deterioration in industry or economic conditions in which we operate, disruptions to our business, not effectively integrating acquired businesses, or other factors, may cause additional impairment charges to our goodwill in future periods.
We may face risks regarding our information technology and security.
Significant disruptions of our information technology systems or breaches of information security could adversely affect our business. We rely upon information technology systems to operate many parts of our business. We routinely collect, store and transmit large amounts of sensitive or confidential information, including data from the results of our testing and inspections. We deploy and operate various technical and procedural controls to maintain the confidentiality and integrity of such sensitive or confidential information. Furthermore, as we automate more of our inspection process and procedures, including through the use of Mistras Digital, we become more vulnerable to security breaches and other system disruptions. In addition, we rely on third parties for significant elements of our information technology infrastructure and, as a result, we are managing many independent vendor relationships with third parties who may or could have access to our confidential information. The size and complexity of our information technology and information security systems, and those of our third-party vendors with whom we contract (and the large amounts of confidential information that is present on them), make such systems potentially vulnerable to service interruptions or to security breaches from inadvertent or intentional actions by our employees or vendors, or from attacks by malicious third parties. Such attacks are of ever-increasing levels of sophistication and expertise, including organized criminal groups, “hacktivists,” and others. Due to the nature of some of these attacks, there is a risk that they may remain undetected for a period of time. While we have invested in the protection of data and information technology, there can be no assurance that our efforts will prevent service interruptions or security breaches. Any such interruption or breach of our systems could adversely affect our business operations and/or result in the loss of critical or sensitive confidential information, and could result in financial, legal, business and reputational harm to us. We maintain cyber liability insurance; however this insurance may not be sufficient to cover the financial, legal, business or reputational losses that may result from an interruption or breach of our systems. The occurrence or perception of security breaches in connection with our asset protection solutions or our customers’ concerns about internet security or the security of our solutions, whether warranted or not, would likely harm our reputation and business, inhibit market acceptance of our asset protection solutions and cause us to lose customers, any of which would harm our financial condition and results of operations.
In addition, much of our computer and communications hardware is located at a single facility. We have a back-up data-center and storage in a different geographic area. Should a natural disaster or some other event occur that damages our primary data center or significantly disrupts its operation, such as human error, fire, flood, power loss, telecommunications failure, break-ins, terrorist attacks, acts of war and similar events, we could suffer temporary interruption of key functions and capabilities before the back-up facility is fully operational.
We are subject to privacy and data security/protection laws in the jurisdictions in which we operate and may be exposed to substantial costs and liabilities associated with such laws and regulations.
The regulatory environment surrounding information security and privacy is increasingly demanding, with frequent imposition of new and changing requirements. The European Union's General Data Protection Regulation (“GDPR”), which became effective in May 2018, imposed significant new requirements on how companies process and transfer personal data, as well as significant fines for non-compliance. In addition to GDPR, many states in the U.S. have enacted, or are considering, data privacy requirements similar to GDPR, and thus we will need to ensure our procedures comply with these various state laws. Compliance with changes in privacy and information security laws and standards may result in significant expense due to increased investment in technology and the development of new operational processes, which could have a material adverse effect on our financial condition and results of operations. In addition, the payment of potentially significant fines or penalties in the event of a breach of the GDRP or other privacy and information security laws, as well as the negative publicity associated with such a breach, could damage the Company’s reputation and adversely impact product demand and customer relationships.
Events such as natural disasters, industrial accidents, epidemics, pandemics, war and acts of terrorism, and adverse weather conditions could disrupt our business or the business of our customers, which could significantly harm our operations, financial results and cash flow.
Our operations and those of our customers are susceptible to the occurrence of catastrophic events outside our control, which may include events like epidemics, pandemics and other health crises, severe weather conditions, industrial accidents, and acts of war and terrorism, to name a few. Any such events could cause a serious business disruption that reduces our customers’ need or interest in purchasing our asset protection solutions. In the past, such events have resulted in order cancellations and delays because customer equipment, facilities or operations have been damaged, or are not then operational or available. A large portion of our customer base has operations in the Gulf of Mexico, which is subject to hurricanes and tropical storms.
27
Hurricane-related disruptions to our customers’ operations have adversely affected our revenues in the past. Such events in the future may result in substantial delays in the provision of solutions to our customers and the loss of valuable equipment. In addition, our results can be adversely impacted by severe winter weather conditions, which can result in lost workdays and temporary closures of customer facilities or outdoor projects. While our business may not be directly impacted by the COVID-19 coronavirus like other industries such as travel and restaurants, the safety measures being taken in an attempt to slowdown the spread of COVID-19 has resulted in a slowdown of our business.
In addition, these events could disrupt commodity prices or financial markets or have other negative macroeconomic impacts, such as those being caused by COVID-19 coronavirus, which could harm our business.
If we lose key members of our senior management team upon whom we are dependent, we may be less effective in managing our operations and may have more difficulty achieving our strategic objectives.
Our future success depends to a considerable degree upon the availability, contributions, vision, skills, experience and effort of our senior management team. We have in place various compensation programs, such as an annual cash incentive program, equity incentive program and a severance policy, each designed to incentivize and retain our key senior managers. At this time, we do not have any reason to believe that we may lose the services of any of these key persons in the foreseeable future and we believe our compensation programs will help us retain these individuals. We believe we have sufficient depth in our executive management to continue our success if we were to lose the services of an executive. However, an unplanned loss or interruption of the service of numerous key members of our senior management team could harm our business, financial condition and results of operations and could significantly reduce our ability to manage our operations and implement our strategy.
Intellectual property may impact our business and results of operations.
Our ability to compete effectively depends in part upon the maintenance and protection of the intellectual property related to our asset protection solutions. Patent protection is unavailable for certain aspects of the technology and operational processes important to our business and any patent or patent applications, trademarks or copyrights held by us or to be issued to us, may not adequately protect us. Some of our trademarks that are not in use may become available to others. To date, we have relied principally on copyright, trademark and trade secrecy laws, as well as confidentiality agreements and licensing arrangements, to establish and protect our intellectual property. However, we have not obtained confidentiality agreements from all our customers and vendors. Although we obligate our employees to confidentiality, we cannot be certain that these obligations will be honored or enforceable.
We may require additional capital to support business growth, which might not be available.
We intend to continue making investments to support our business growth and may require additional funds to respond to business challenges or opportunities, including the need to develop new, or enhance our current, asset protection solutions, enhance our operating infrastructure or acquire businesses and technologies. Accordingly, we may need to engage in equity or debt financings to secure additional funds. If we raise additional funds through further issuances of equity or convertible debt securities, our current stockholders could suffer significant dilution, and any new equity securities we issue could have rights, preferences and privileges superior to those of holders of our common stock. Our current credit facility (as amended on May 15, 2020) meets our current needs, except that due to our current debt levels, the facility limits our ability to make acquisitions without the banks' approval until our debt ratio improves. If we were to secure other debt financing in the future, it could involve restrictive covenants relating to our capital-raising activities and other financial and operational matters, which may make it more difficult for us to obtain additional capital and to pursue business opportunities, including potential acquisitions. In addition, no assurance can be given that adequate or acceptable financing will be available to us, in which case we may not be able to grow our business, including through acquisitions, or respond to business challenges.
ITEM 1B. UNRESOLVED STAFF COMMENTS
None.
28
ITEM 2. PROPERTIES
As of December 31, 2020, we operated approximately 120 facilities in 10 countries, with our corporate headquarters located in Princeton Junction, New Jersey. Our headquarters in Princeton Junction is our primary location, where most of our manufacturing and research and development is conducted. While we lease most of our facilities, as of December 31, 2020, we owned properties located in Monroe, North Carolina; Trainer, Pennsylvania; LaPorte, Texas; Burlington, Washington; Evanston, Wyoming and Jonquiere, Quebec. Our Services segment utilizes approximately 80 facilities throughout North America (including Canada). Our Products and Systems segment’s primary location is in our Princeton Junction, NJ facility. Our International segment has approximately 40 facilities including locations in Belgium, Brazil, France, Germany, Greece, India, the Netherlands and the United Kingdom. We believe that all of our facilities are well maintained and are suitable and adequate for the foreseeable future.
ITEM 3. LEGAL PROCEEDINGS
We are subject to periodic legal proceedings, investigations and claims that arise in the ordinary course of business. See “Litigation” in Note 18-Commitments and Contingencies to the consolidated financial statements contained in Item 8 of this Annual Report for a description of legal proceedings involving us and our business, which is incorporated herein by reference.
ITEM 4. MINE SAFETY DISCLOSURES
None.
ITEM 5. MARKET FOR REGISTRANT’S COMMON EQUITY, RELATED STOCKHOLDER MATTERS AND ISSUER PURCHASE OF EQUITY SECURITIES
Market for Common Stock
Our common stock currently trades on the New York Stock Exchange (NYSE) under the ticker symbol “MG.”
Holders of Record
As of March 11, 2021, there were 11 holders of record of our Common Stock. The number of record holders was determined from the records of our transfer agent and does not include beneficial owners of common stock whose shares are held in the names of various security brokers, dealers, and registered clearing agencies. The transfer agent of our common stock is American Stock Transfer & Trust Company, 6201 15th Avenue, Brooklyn, New York 11219.
Dividends
No cash dividends have been paid on our Common Stock to date. We currently intend to retain our future earnings, if any, to finance the expansion of our business and do not expect to pay any cash dividends in the foreseeable future.
Purchases of Equity Securities
The following sets forth the shares of our common stock we acquired during the fourth quarter of 2020 pursuant to the surrender of shares by employees to satisfy minimum tax withholding obligations in connection with the vesting of restricted stock units.
| Month Ending | Total Number of Shares (or Units) Purchased | Average Price Paid per Share (or Unit) | Total Number of Shares Purchased as Part of Publicly Announced Plans or Programs | Approximate Dollar Value of Shares that May Yet Be Purchased Under the Plans or Programs | |||||||||||||||||||
| October 31, 2020 | 221 | $ | 4.06 | — | $ | — | |||||||||||||||||
| November 30, 2020 | 5,281 | $ | 4.39 | — | $ | — | |||||||||||||||||
| December 31, 2020 | 18,475 | $ | 7.76 | — | $ | — | |||||||||||||||||
29
`ITEM 6. SELECTED FINANCIAL DATA
The following table presents selected financial data for the years ended December 31, 2020, 2019, 2018, 2017, the transition period ended December 31, 2016 (see footnote 5 below) and the fiscal years ended May 31, 2016. This selected financial data should be read in conjunction with “Management’s Discussion and Analysis of Financial Condition and Results of Operations” in Item 7 and the audited consolidated financial statements and the notes thereto in Item 8 in this Annual Report.
| For the year ended December 31, | For the Transition period ended | For the fiscal year ended May 31, | |||||||||||||||||||||||||||||||||||||||
2020 (1) | 2019 (2) | 2018 (3) | 2017 (4) | December 31, 2016 (5) | 2016 (6) | ||||||||||||||||||||||||||||||||||||
| ($ in thousands, except per share data) | |||||||||||||||||||||||||||||||||||||||||
| Statement of Income Data: | |||||||||||||||||||||||||||||||||||||||||
| Revenues | $ | 592,571 | $ | 748,586 | $ | 742,354 | $ | 700,970 | $ | 404,161 | $ | 719,181 | |||||||||||||||||||||||||||||
| Gross profit | 178,531 | 217,297 | 207,874 | 187,712 | 117,004 | 203,008 | |||||||||||||||||||||||||||||||||||
| Income (loss) from operations | (101,217) | 24,137 | 22,221 | 4,160 | 17,533 | 43,177 | |||||||||||||||||||||||||||||||||||
| Net income (loss) attributable to Mistras Group, Inc. | $ | (99,461) | $ | 6,060 | $ | 6,836 | $ | (2,175) | $ | 9,568 | $ | 24,654 | |||||||||||||||||||||||||||||
| Per Share Information: | |||||||||||||||||||||||||||||||||||||||||
| Weighted average common shares outstanding: | |||||||||||||||||||||||||||||||||||||||||
| Basic | 29,147 | 28,740 | 28,406 | 28,422 | 28,989 | 28,856 | |||||||||||||||||||||||||||||||||||
| Diluted | 29,147 | 29,046 | 29,427 | 28,422 | 30,125 | 29,891 | |||||||||||||||||||||||||||||||||||
| Earnings (loss) per common share: | |||||||||||||||||||||||||||||||||||||||||
| Basic | $ | (3.41) | $ | 0.21 | $ | 0.24 | $ | (0.08) | $ | 0.33 | $ | 0.85 | |||||||||||||||||||||||||||||
| Diluted | $ | (3.41) | $ | 0.21 | $ | 0.23 | $ | (0.08) | $ | 0.32 | $ | 0.82 | |||||||||||||||||||||||||||||
| Balance Sheet Data: | |||||||||||||||||||||||||||||||||||||||||
| Cash and cash equivalents | $ | 25,760 | $ | 15,016 | $ | 25,544 | $ | 27,541 | $ | 19,154 | $ | 21,188 | |||||||||||||||||||||||||||||
| Total assets | 583,313 | 719,878 | 694,037 | 554,441 | 469,427 | 482,675 | |||||||||||||||||||||||||||||||||||
| Total long-term debt and obligations under finance leases, including current portion | 235,096 | 271,887 | 303,617 | 181,491 | 103,466 | 104,776 | |||||||||||||||||||||||||||||||||||
| Total Mistras Group, Inc. stockholders’ equity | $ | 197,021 | $ | 285,822 | $ | 270,897 | $ | 270,619 | $ | 270,582 | $ | 276,163 | |||||||||||||||||||||||||||||
| Cash Flow Data: | |||||||||||||||||||||||||||||||||||||||||
| Net cash provided by operating activities | $ | 67,802 | $ | 59,110 | $ | 41,664 | $ | 55,799 | $ | 30,259 | $ | 68,124 | |||||||||||||||||||||||||||||
| Net cash (used in) investing activities | (14,969) | (25,280) | (155,450) | (102,797) | (17,374) | (16,752) | |||||||||||||||||||||||||||||||||||
| Net cash (used in) provided by financing activities | $ | (44,169) | $ | (44,137) | $ | 113,969 | 53,045 | $ | (12,869) | $ | (40,378) | ||||||||||||||||||||||||||||||
1 - Includes pre-tax charges of $108.4 million relating to special items, including impairment charges of $106.1 million. See the Income from Operations table in Item 7 for a description of these items. The impact of these items, net of taxes, on net income and diluted earnings per share was $94.0 million and $3.22, respectively.
2 - Includes pre-tax charges of $5.7 million relating to special items. See the Income from Operations table in Item 7 for a description of these items. The impact of these items, net of taxes, on net income and diluted earnings per share was $4.4 million and $0.15, respectively. The Company modified the prior year tax effect on special items to be consistent with the current year methodology, which was to apply the current jurisdictional tax rate to each specific special item. The impact of this change on the year ended December 31, 2019 was a reduction of after-tax charges related to the special items of approximately $1.5 million and $0.05 per diluted share.
30
3 - Includes pre-tax charges of $9.4 million relating to special items. The impact of these items, net of taxes, on net income and diluted earnings per share was $9.3 million and $0.32, respectively, including a $1.7 million tax charge related to the Tax Act.
4 - Includes pre-tax charges of $21.0 million relating to special items. The impact of these items, net of taxes, on net income and diluted earnings per share was $14.9 million and $0.51, respectively, including a $2.0 million tax charge related to the Tax Act.
5 - On January 3, 2017, the Company's Board of Directors approved a change in the Company's fiscal year end from May 31 to December 31, effective December 31, 2016. In connection with this change, we previously filed a Transition Report on Form 10-K to report the results of the seven-month transition period from June 1, 2016 to December 31, 2016. The transition period ended December 31, 2016 is the seven-month period from June 1, 2016 to December 31, 2016. Includes pre-tax charges of $2.2 million relating to special items. The impact of these items, net of taxes, on net income and diluted earnings per share was $1.6 million and $0.05, respectively.
6 - Includes pre-tax charges (benefits) of $6.0 million in fiscal 2016 relating to special items. Net income decreased by these items, net of taxes, by $3.2 million in fiscal 2016. The decrease of these items on diluted earnings per share was ($0.11) in fiscal 2016.
31
ITEM 7. MANAGEMENT’S DISCUSSION AND ANALYSIS OF FINANCIAL CONDITION AND RESULTS OF OPERATION
The following Management’s Discussion and Analysis (“MD&A”) provides a discussion of our results of operations and financial position for the year ended December 31, 2020. A discussion of our results of operations and financial position for the year ended December 31, 2019 is included in Part II–Item 7, Management's Discussion and Analysis of Financial Condition and Results of Operations of our Annual Report on Form 10-K for the fiscal year ended December 31, 2019 filed with the SEC on March 27, 2020, which discussion is incorporated herein by reference. The MD&A should be read together with our consolidated financial statements and related notes included in Item 8 in this Annual Report on Form 10-K. Unless otherwise specified or the context otherwise requires, “Mistras,” “the Company,” “we,” “us” and “our” refer to Mistras Group, Inc. and its consolidated subsidiaries. The MD&A includes the following sections:
•Forward-Looking Statements
•Overview
•Note about Non-GAAP Measures
•Consolidated Results of Operations
•Liquidity and Capital Resources
•Critical Accounting Estimates
•Recent Accounting Pronouncements
Forward-Looking Statements
This Annual Report on Form 10-K contains forward-looking statements within the meaning of Section 27A of the Securities Act of 1933 (Securities Act), and Section 21E of the Securities Exchange Act of 1934 (Exchange Act). Such forward-looking statements include those that express plans, anticipation, intent, contingency, goals, targets or future development and/or otherwise are not statements of historical fact. These forward-looking statements are based on our current expectations and projections about future events and they are subject to risks and uncertainties known and unknown that could cause actual results and developments to differ materially from those expressed or implied in such statements. See “Forward-Looking Statements” at the beginning of Item 1 of this Annual Report.
At the time of this report, the COVID-19 pandemic is continuing to have a negative impact on us and our key markets and is causing significant economic disruption worldwide. Our discussion below is qualified by the unknown impact that the COVID-19 pandemic will continue to have on our business and the economy in general, including the duration of the health risk the COVID-19 pandemic will cause and the resulting economic disruption.
Overview
The Company is a leading "OneSource™" multinational provider of integrated technology-enabled asset protection solutions, helping to maximize the safety and operational uptime for civilization’s most critical industrial and civil assets.
Backed by an innovative, data-driven asset protection portfolio, proprietary technologies, and decades-long legacy of industry leadership, the Company leads clients in the oil and gas, aerospace and defense, power generation, infrastructure, and manufacturing industries towards achieving and maintaining operational excellence. By supporting these organizations that help fuel our vehicles and power our society; inspecting components that are trusted for commercial, defense, and space craft; and building real-time monitoring equipment to enable safe travel across bridges, the Company helps the world at large.
The company’s core capabilities also include non-destructive testing (“NDT”) field inspections enhanced by advanced robotics, laboratory quality control and assurance testing, sensing technologies and NDT equipment, asset and mechanical integrity engineering services, and light mechanical maintenance and access services. The Company enhances value for its clients by integrating asset protection throughout supply chains and centralizing integrity data through a suite of Industrial IoT-connected digital software and monitoring solutions.
32
Our operations consist of three reportable segments: Services, International, and Products and Systems.
•Services provides asset protection solutions predominantly in North America, with the largest concentration in the United States, followed by Canada, consisting primarily of NDT, inspection, mechanical and engineering services that are used to evaluate the structural integrity and reliability of critical energy, industrial and public infrastructure and commercial aerospace components. PCMS software and pipeline related software and data analysis solutions are included in this segment.
•International offers services, products and systems similar to those of the other segments to select markets within Europe, the Middle East, Africa, Asia and South America, but not to customers in China and South Korea, which are served by the Products and Systems segment.
•Products and Systems designs, manufactures, sells, installs and services the Company’s asset protection products and systems, including equipment and instrumentation, predominantly in the United States.
Given the role our solutions play in enhancing the safe and efficient operation of infrastructure, we have historically provided a
majority of our solutions to our customers on a regular, recurring basis. We perform these services largely at our customers’ facilities, while primarily servicing our aerospace customers at our network of state-of-the-art, in-house laboratories. These solutions typically include NDT and inspection services, and can also include a wide range of mechanical services, including heat tracing, pre-inspection insulation stripping, coating applications, re-insulation, engineering assessments and long-term condition-monitoring. Under this business model, many customers outsource their inspection to us on a “run and maintain” basis. We have established long-term relationships as a critical solutions provider to many of the leading companies with asset-intensive infrastructure in our target markets. These markets include oil and gas (downstream, midstream, upstream and petrochemical), commercial aerospace and defense, power generation (fossil, nuclear, alternative, renewable, and transmission and distribution), public infrastructure, chemicals, transportation, primary metals and metalworking and research and engineering institutions.
We have focused on providing our advanced asset protection solutions to our customers using proprietary, technology-enabled software and testing instruments, including those developed by our Products and Systems segment. We have made numerous acquisitions in an effort to grow our base of experienced, certified personnel, expand our service lines and technical capabilities, increase our geographical reach, complement our existing offerings, and leverage our fixed costs. We have increased our capabilities and the size of our customer base through the development of applied technologies and managed support services, organic growth and the integration of acquired companies. These acquisitions have provided us with additional service lines, technologies, resources and customers which we believe enhance our advantages over our competition.
We believe long-term growth can be realized in all of our target markets. Our level of business and financial results are impacted by world-wide macro- and micro-economic conditions generally, as well as those within our target markets. Among other things, we expect the timing of our oil and gas customers inspection spend to be impacted by oil price fluctuations.
2020 Developments
In March 2020, the World Health Organization declared the outbreak of the COVID-19 coronavirus (COVID-19) as a pandemic, which continues to infect the population throughout the United States and most other parts of the world. The COVID-19 pandemic has caused significant volatility in domestic and international markets. There is on-going uncertainty around the breadth and duration of business disruptions related to COVID-19, as well as its impact on the U.S. and international economies. In addition, oil prices have dropped significantly, and airline traffic has experienced a significant decline. In response to various factors surrounding the COVID-19 pandemic and, in the case of the oil and gas market, other macroeconomic events, companies within the oil and gas and aerospace industries (including our customers) have reduced
33
spending and/or slowed down (or temporarily ceased) production. This, in turn, resulted in decreases in awards of new contracts or adjustments, reductions, suspensions or cancellations of existing contracts.
The COVID-19 pandemic, significant volatility in oil prices and decreased traffic in the aerospace industry have adversely affected our workforce and operations, as well as the operations of our customers, suppliers and contractors. These negative factors have also resulted in significant volatility and uncertainty in the markets in which we operate. To successfully navigate through this unprecedented period, we continue to focus on the following key priorities:
•Ensuring the health and safety of our employees and those of our customers and suppliers;
•Maintaining business continuity and financial strength and stability; and
•Serving our customers as they provide essential products and services to the world.
While we cannot fully assess the impact that the COVID-19 pandemic or the significant volatility in oil prices will continue to have on our operations at this time, there are certain impacts that we have identified:
•The financial market volatility that resulted from COVID-19 and the drop in oil prices required that we reassess the goodwill we had recorded related to various prior acquisitions under the guidance of ASC 350 during the first quarter of 2020. We determined that the fair values of various reporting units were less than their carrying values (including goodwill). As a result, we recorded an impairment charge related to goodwill of approximately $77.1 million during the first quarter of 2020. See Note 8-Goodwill to the consolidated financial statements.
•These same events required that we reassess the tangible and intangible assets recorded under the guidance of ASC 360 during the first quarter of 2020. We determined that the fair values of certain asset groups were less than their carrying values (excluding goodwill). As a result, we recorded impairment charges related to intangible assets of approximately $28.8 million and a right-of-use asset of approximately $0.2 million during the first quarter of 2020. See Note 9-Intangible Assets and Note 17-Leases to the consolidated financial statements.
To respond to the economic downturn resulting from the factors discussed above, in March 2020 we initiated a cost reduction and efficiency program. As part of this program, our named executive officers took voluntarily temporary salary reductions ranging from 25% to 45% of their base salary. In addition, we instituted a reduction for certain other salaried employees, at lower percentages, and suspended our voluntary match under our sponsored savings plans for our U.S. and Canadian employees. These reductions became effective at the beginning of the second quarter of 2020 and, except for the salary reductions for certain lower salaried employees, continued through the end of the third quarter of 2020. In addition, our non-employee directors voluntarily agreed to a $3,750 reduction in their second and third quarter 2020 director's fee payments. Beginning in the fourth quarter of 2020, all salary and director fees reductions were removed and pay levels were returned to first quarter levels on a prospective basis, though certain other cost reduction measures have remained in place.
We are currently unable to predict with certainty the overall impact that the COVID-19 pandemic and volatility in oil prices may have on our business, results of operations, liquidity or in other ways which we cannot yet determine. We will continue to monitor market conditions and respond accordingly. Refer to Item 1A. Risk Factors in Part I of this 2020 Annual Report.
Note about Non-GAAP Measures
The Company prepares its consolidated financial statements in accordance with U.S. GAAP. In this MD&A under the heading "Income (loss) from Operations", the non-GAAP financial performance measure "Income (loss) before special items" is used for each of our three segments, the Corporate segment and the Total Company, with tables reconciling the measure to a financial measure under GAAP. This presentation excludes from "Income (loss) from Operations" (a) transaction expenses related to acquisitions, such as professional fees and due diligence costs, (b) the net changes in the fair value of acquisition-related contingent consideration liabilities, (c) impairment charges, (d) reorganization and other costs, which includes items such as severance, labor relations matters and asset and lease termination costs and (e) other special items. These adjustments
34
have been excluded from the GAAP measure because these expenses and credits are not related to our or any individual segment's core business operations. The acquisition related costs and special items can be a net expense or credit in any given period. Our management uses this non-GAAP measure as a measure of operating performance and liquidity to assist in comparing performance from period to period on a consistent basis, as a measure for planning and forecasting overall expectations and for evaluating actual results against such expectations. We believe investors and other users of our financial statements benefit from the presentation of this non-GAAP measure in evaluating our performance. Income (loss) before special items excludes the identified adjustments, which provides additional tools to compare our core business operating performance on a consistent basis and measure underlying trends and results in our business. Income (loss) before special items is not used to determine incentive compensation for executives or employees, nor is it a replacement for the reported GAAP financial performance and/or necessarily comparable to the non-GAAP financial measures of other companies.
Consolidated Results of Operations
Year ended December 31, 2020 vs. Year ended December 31, 2019
The following table summarizes our consolidated statements of operations for the years ended December 31, 2020 and 2019:
| For the year ended December 31, | |||||||||||
| 2020 | 2019 | ||||||||||
| ($ in thousands) | |||||||||||
| Revenues | $ | 592,571 | $ | 748,586 | |||||||
| Gross profit | 178,531 | 217,297 | |||||||||
| Gross profit as a % of Revenue | 30.1 | % | 29.0 | % | |||||||
| Income (loss) from operations | (101,217) | 24,137 | |||||||||
| Income (loss) from operations as a % of Revenue | (17.1) | % | 3.2 | % | |||||||
| Income (loss) before provision for income taxes | (114,172) | 10,439 | |||||||||
| Net income (loss) | (99,466) | 6,080 | |||||||||
| Net income (loss) attributable to Mistras Group, Inc. | $ | (99,461) | $ | 6,060 | |||||||
Revenues
Revenues by segment for the years ended December 31, 2020 and 2019 were as follows:
| For the year ended December 31, | |||||||||||
| 2020 | 2019 | ||||||||||
| ($ in thousands) | |||||||||||
| Revenues | |||||||||||
| Services | $ | 476,164 | $ | 595,130 | |||||||
| International | 107,556 | 144,271 | |||||||||
| Products and Systems | 16,449 | 18,583 | |||||||||
| Corporate and eliminations | (7,598) | (9,398) | |||||||||
| $ | 592,571 | $ | 748,586 | ||||||||
Revenue was $592.6 million for the year ended December 31, 2020, a decrease of $156.0 million, or 20.8%, compared with the year ended December 31, 2019. The decrease in revenue across all our segments was primarily the result of the impact of COVID-19, which disrupted the timing of projects or deferral of purchases for many of our customers. The decrease primarily was driven by the Services segment, which experienced a revenue decrease of $119.0 million, or 20.0%, driven by double-digit organic decline. The International segment revenues decreased 25.4% due predominantly to the double-digit organic decline. The Products and Systems segment decreased 11.5%, driven by lower sales volume.
Revenues from oil and gas customers comprised 57% and 58% of total revenue for the years ended December 31, 2020 and 2019, respectively. Revenues from aerospace and defense customers comprised 12% and 13% of total revenue for the years
35
ended December 31, 2020 and 2019, respectively. The Company's top ten customers comprised approximately 32% of total revenue for the year ended December 31, 2020, as compared to 34% for the year ended December 31, 2019, with no customer accounting for 10% or more of total revenue in either twelve month period.
Gross Profit
Gross profit by segment for the years ended December 31, 2020 and 2019 was as follows:
| For the year ended December 31, | |||||||||||
| 2020 | 2019 | ||||||||||
| ($ in thousands) | |||||||||||
| Gross profit | |||||||||||
| Services | $ | 141,084 | $ | 165,513 | |||||||
| % of segment revenue | 29.6 | % | 27.8 | % | |||||||
| International | 31,046 | 43,145 | |||||||||
| % of segment revenue | 28.9 | % | 29.9 | % | |||||||
| Products and Systems | 6,826 | 8,639 | |||||||||
| % of segment revenue | 41.5 | % | 46.5 | % | |||||||
| Corporate and eliminations | (425) | — | |||||||||
| $ | 178,531 | $ | 217,297 | ||||||||
| % of total revenue | 30.1 | % | 29.0 | % | |||||||
Gross profit decreased $38.8 million, or 17.8%, for the year ended December 31, 2020 compared to the year ended December 31, 2019, with a sales decrease of $156.0 million, or 20.8%. COVID-19, the significant drop in oil prices and a decrease in aerospace production have had a significant unfavorable impact on sales volume; however, gross profit margin improved due primarily to better employee utilization and, to a lesser extent, the favorable impact of mix of sales driven by the Services segment. Gross profit margin was 30.1% and 29.0% for the years ended December 31, 2020 and 2019, respectively. Services segment gross profit margins had a year-on-year increase of 180 basis points to 29.6% for the year ended December 31, 2020, due primarily to better employee utilization, favorable mix of sales on lower sales volume and Canadian wage subsidies. International segment gross margins had a year-on-year decrease of 100 basis points to 28.9% for the year ended December 31, 2020, due primarily to lower levels of employee utilization and sales mix. Products and Systems segment gross margins decreased by 500 basis points for the year ended December 31, 2020 to 41.5%, driven by unfavorable sales mix.
Operating Expenses
Operating expenses for the years ended December 31, 2020 and 2019 was as follows:
| For the year ended December 31, | |||||||||||
| 2020 | 2019 | ||||||||||
| ($ in thousands) | |||||||||||
| Operating Expenses | |||||||||||
| Selling, general and administrative expenses | $ | 157,157 | $ | 168,621 | |||||||
| Impairment charges | 106,062 | — | |||||||||
| Bad debt provision for troubled customers, net of recoveries | — | 3,038 | |||||||||
| Pension withdrawal expense | — | 848 | |||||||||
| Legal settlement and litigation charges, net | (220) | — | |||||||||
| Research and engineering | 2,892 | 3,045 | |||||||||
| Depreciation and amortization | 13,520 | 16,733 | |||||||||
| Acquisition-related expense, net | 337 | 875 | |||||||||
Operating expenses increased $86.6 million, or 44.8%, for the year ended December 31, 2020 compared to the year ended December 31, 2019 due predominantly to impairment charges of $106.1 million in 2020 as more fully described in Note 8-Goodwill, Note 9-Intangible Assets and Note 17-Leases to the consolidated financial statements. Amortization expense
36
decreased from prior year due to a lower net carrying amount of intangible assets as a result of the 2020 impairment charges. Selling, general and administrative expenses decreased $11.5 million, or 6.8% for the year ended December 31, 2020 compared to the year ended December 31, 2019 primarily due to the Company's cost reduction and efficiency program initiated during the first quarter of 2020 in response to COVID-19 as more fully described in 2020 Developments under the Overview of this section. Transactional foreign exchange expense, which is included within selling, general and administrative expenses, was approximately $3.6 million higher in 2020 as compared to 2019, due to volatility in certain foreign currencies.
37
Income (Loss) from Operations
The following table shows a reconciliation of segment income (loss) from operations to income (loss) before special items (unaudited) for the years ended December 31, 2020 and 2019:
| For the year ended December 31, | |||||||||||
| 2020 | 2019 | ||||||||||
| ($ in thousands) | |||||||||||
| Services: | |||||||||||
| Income (loss) from operations (GAAP) | $ | (44,222) | $ | 49,593 | |||||||
| Pension withdrawal expense | — | 848 | |||||||||
| Impairment charges | 86,200 | — | |||||||||
| Bad debt provision for troubled customers, net of recoveries | — | 3,018 | |||||||||
| Reorganization and other costs | 141 | 302 | |||||||||
| Legal settlement and litigation charges, net | 81 | — | |||||||||
| Acquisition-related expense (benefit), net | 337 | 541 | |||||||||
| Income before special items (unaudited, non-GAAP) | $ | 42,537 | $ | 54,302 | |||||||
| International: | |||||||||||
| Income (loss) from operations (GAAP) | $ | (21,855) | $ | 5,856 | |||||||
| Impairment charges | 19,862 | — | |||||||||
| Reorganization and other costs | 1,290 | 266 | |||||||||
| Bad debt provision for troubled customers, net of recoveries | — | 20 | |||||||||
| Income (loss) before special items (unaudited, non-GAAP) | $ | (703) | $ | 6,142 | |||||||
| Products and Systems: | |||||||||||
| Loss from operations (GAAP) | $ | (936) | $ | (529) | |||||||
| Reorganization and other costs | 5 | 218 | |||||||||
| Loss before special items (unaudited, non-GAAP) | $ | (931) | $ | (311) | |||||||
| Corporate and Eliminations: | |||||||||||
| Loss from operations (GAAP) | $ | (34,204) | $ | (30,783) | |||||||
| Legal settlement and litigation charges, net | (301) | — | |||||||||
| Loss on debt modification | 645 | — | |||||||||
| Reorganization and other costs | 177 | 104 | |||||||||
| Acquisition-related expense (benefit), net | — | 334 | |||||||||
| Loss before special items (unaudited, non-GAAP) | $ | (33,683) | $ | (30,345) | |||||||
| Total Company: | |||||||||||
| Income (loss) from operations (GAAP) | $ | (101,217) | $ | 24,137 | |||||||
| Pension withdrawal expense | — | 848 | |||||||||
| Impairment charges | 106,062 | — | |||||||||
| Bad debt provision for troubled customers, net of recoveries | — | 3,038 | |||||||||
| Legal settlement and litigation charges, net | (220) | — | |||||||||
| Loss on debt modification | 645 | — | |||||||||
| Reorganization and other costs | 1,613 | 890 | |||||||||
| Acquisition-related expense (benefit), net | 337 | 875 | |||||||||
| Income before special items (unaudited, non-GAAP) | $ | 7,220 | $ | 29,788 | |||||||
See section Note about Non-GAAP Measures in this report for an explanation of the use of non-GAAP measurements.
Total Company income from operations (GAAP) decreased by $125.4 million, or 519.3% compared to the year ended December 31, 2019. Total Company income (loss) before special items (non-GAAP) decreased by $22.6 million or 75.8%
38
compared with the year ended December 31, 2019. Operating expenses, excluding special items (non-GAAP), as a percentage of revenue, was 28.9% for the year ended December 31, 2020 compared to 25.0% for the year ended December 31, 2019. The COVID-19 outbreak and volatility in oil prices has adversely affected our workforce and operations, as well as the operations of our customers, suppliers and contractors and was the primary reason for the impairment charges. Income before special items as a percentage of revenue decreased by 280 basis points to 1.2% for the year ended December 31, 2020 from 4.0% for the year ended December 31, 2019. These negative factors have resulted in significant volatility and uncertainty in the markets in which we operate. We are currently unable to predict or determine the overall impact that the COVID-19 pandemic and change in oil prices may have on our business, results of operations, or liquidity. Refer to Item 1A. Risk Factors in Part I of this annual report for further discussion.
Interest Expense
Interest expense was $13.0 million and $13.7 million for the years ended December 31, 2020 and December 31, 2019, respectively. The decrease was due to lower average level of borrowings on our Credit Agreement attributable primarily to payments on borrowings for the acquisition completed during the fourth quarter of 2018, partially offset by an increase in the base borrowing rate effected during the second quarter as a result of the May 2020 amendment to our Credit Agreement.
Income Taxes
Our effective income tax rate was approximately 12.9% for the year ended December 31, 2020, compared to 41.8% for the year ended December 31, 2019. The decrease in effective tax rate was primarily driven by the impact of the non-deductible goodwill impairment partially offset by the benefit from the carryback of the current year domestic net operating loss, along with a decrease in the impact on our effective tax rate of nondeductible share based compensation, and foreign rate changes.
On March 27, 2020, the United States enacted the Coronavirus Aid, Relief, and Economic Security Act (CARES Act). The CARES Act is an approximately $2 trillion emergency economic stimulus package in response to the Coronavirus outbreak, which among other things contains numerous income tax provisions. Some of these tax provisions are effective retroactively for years ending before the date of enactment. The CARES Act provides a five-year carryback of net operating losses generated in years 2018 through 2020. As the statutory federal income tax rate applicable to certain years within the carryback period is 35%, carryback to those years of our estimated 2020 annual federal tax loss provides a tax benefit in excess of the current federal statutory rate of 21%, resulting in an increased income tax benefit of $1.9 million. We project that the income tax effects of the CARES Act will result in a cash refund of $4.8 million in 2021 of taxes paid in prior years.
On December 27, 2020, the United States enacted the Consolidated Appropriations Act, 2021, (the "Appropriations Act") an additional stimulus package providing financial relief for individuals and small business. The Appropriations Act contains a variety of tax provisions, including full expensing of business meals in 2021 and 2022, and expansion of the employee retention tax credit. We are currently evaluating the impact of this guidance on our consolidated financial position, results of operations, and cash flows, but does not expect it to have a material impact.
In response to the COVID-19 pandemic, the American Rescue Plan Act was signed into law on March 11, 2021. This act, among other things, provides economic relief provisions to individuals and funding to certain businesses and programs. We are currently evaluating the impact of this guidance on our consolidated financial position, results of operations, and cash flows, but does not expect it to have a material impact.
On June 28, 2019, the Canadian province of Alberta enacted the Job Creation Tax Cut which reduced the Alberta corporate income tax rate from 12% to 11% starting in 2019 with further annual reductions to 10% in 2020, 9% in 2021, and 8% in 2022. This rate reduction had a favorable impact of approximately $1.9 million on our net deferred tax liabilities in this jurisdiction in 2019. As part of Alberta’s Recovery plan associated with the COVID-19 pandemic, Alberta accelerated the decrease in income tax rates from 10% in 2020 to 8% effective July 1, 2020. The accelerated tax rate reduction did not have a material impact on our net deferred tax liabilities but did reduce current taxes.
Income tax expense varies as a function of pre-tax income and the level of non-deductible expenses, such as certain amounts of meals and entertainment expense, valuation allowances, and other permanent differences. It is also affected by discrete items that may occur in any given year but are not consistent from year to year. Our effective income tax rate may fluctuate over the next few years due to many variables including the amount and future geographic distribution of our pre-tax income, changes resulting from our acquisition strategy, and increases or decreases in our permanent differences.
39
Liquidity and Capital Resources
Overview
The Company has funded its operations from cash provided from operations, bank borrowings and lease financings. Management believes that the Company's existing cash and cash equivalents, anticipated cash flows from operating activities, and available borrowings under our credit agreement will be more than sufficient to meet anticipated cash needs over the next 12 months. The Company generated operating cash flow of $67.8 million and $59.1 million for the years ended December 31, 2020 and 2019, respectively. Capital expenditures for the purchase of property, plant and equipment and of intangible assets was $15.8 million and $22.9 million for the years ended December 31, 2020 and 2019, respectively.
Cash Flows Table
The following table summarizes our cash flows for the years ended December 31, 2020 and 2019:
| For the year ended December 31, | ||||||||||||||
| ($ in thousands) | 2020 | 2019 | ||||||||||||
| Net cash provided by (used in): | ||||||||||||||
| Operating activities | $ | 67,802 | $ | 59,110 | ||||||||||
| Investing activities | (14,969) | (25,280) | ||||||||||||
| Financing activities | (44,169) | (44,137) | ||||||||||||
| Effect of exchange rate changes on cash | 2,080 | (221) | ||||||||||||
| Net change in cash and cash equivalents | $ | 10,744 | $ | (10,528) | ||||||||||
Cash Flows from Operating Activities
Cash provided by operating activities for the year ended December 31, 2020 was $67.8 million, an increase of $8.7 million from the prior year. The increase was primarily attributable to movements in working capital driven by the increase in net accounts receivable collections of $19.0 million offset by less net income.
Cash Flows from Investing Activities
Net cash used in investing activities for the year ended December 31, 2020 was $15.0 million, a decrease of $10.3 million from the prior year as a response to the COVID-19 pandemic. In addition, the Company used $7.1 million less of cash for purchases of property, plant and equipment and intangible assets in 2020 compared to 2019. In 2019, the Company used $4.2 million for acquisitions, net of dispositions.
Cash Flows from Financing Activities
Net cash used by financing activities for the year ended December 31, 2020 was $44.2 million, compared to $44.1 million for the year ended December 31, 2019. During the year ended December 31, 2020, net repayment of debt was approximately $0.4 million higher compared to 2019. In addition, for the year ended December 31, 2020 we incurred $1.2 million and $1.5 million of additional acquisition-related contingent consideration and financing costs compared to 2019, respectively offset by $2.7 million less taxes paid related to net share settlement of share-based awards.
Cash Balance and Credit Facility Borrowings
The terms of our Credit Agreement as modified and described in Note 11-Long-Term Debt of the Notes to Consolidated Financial Statements in this Annual Report, under the heading "Senior Credit Facility", the provisions of which are incorporated herein.
As of December 31, 2020, we had cash and cash equivalents totaling $25.8 million and available borrowing capacity of up to $50.4 million under our existing Credit Agreement. Borrowings of $210.1 million and letters of credit of $4.3 million were outstanding under the Credit Agreement at December 31, 2020. We finance our operations primarily through our existing cash
40
balances, cash collected from operations, bank borrowings and lease financing. We believe these sources are sufficient to fund our operations for the foreseeable future. See 11-Long-Term Debt to the consolidated financial statements for additional information.
As of December 31, 2020, we were in compliance with the terms of the Credit Agreement and will continuously monitor our compliance with the covenants contained in the Credit Agreement.
Liquidity and Capital Resources Outlook
Future Sources of Cash
We expect our future sources of cash to include cash flow generated from our operating activities and borrowings under our Credit Agreement. Our revolving credit facility is available for cash advances required for working capital and for letters of credit to support our operations. Acquisitions, if any, are funded through available cash and borrowings under the Credit Agreement.
Future Uses of Cash
We expect our future uses of cash will primarily be for repayment of debt, international expansion, purchases or manufacture of field-testing equipment to support growth, additional investments in technology and software products and the replacement of existing assets and equipment used in our operations. We often make purchases to support new sources of revenues, particularly in our Services segment. In addition, we annually fund a certain amount of replacement equipment, including a portion of our fleet vehicles. We historically spend approximately 2% to 3% of our total revenues on capital expenditures, excluding acquisitions, and expect to fund these expenditures through a combination of cash and lease financing. Our cash capital expenditures, excluding acquisitions, for each of the years ended December 31, 2020 and 2019 were approximately 2.7% and 3.1% of revenues, respectively. However, the current COVID-19 coronavirus pandemic will negatively impact our cash flow and our uses of cash, particularly if we experience a material reduction in our revenues due to ongoing actions taken to combat the spread of the virus. We continue to take steps to reduce spending and preserve cash.
As a result of restrictions in our credit agreement, as amended, we do not expect to make any acquisitions in 2021 other than small acquisitions with the banks’ approval. We acquired one company during each of the years ended December 31, 2019 and 2018, for an aggregate cash outlay of $144.2 million. In some cases, additional equipment will be needed to upgrade the capabilities of these acquired companies. In addition, our future capital spending may increase as we pursue growth opportunities. Other investments in infrastructure, training and software may also be required to match our growth, but we plan to continue using a disciplined approach to building our business. In addition, we will use cash to fund our operating leases, finance leases, long-term debt repayments and various other obligations as they arise.
We also expect to use cash to support our working capital requirements for our operations, particularly in the event of further growth and due to the impacts of seasonality on our business. Our future working capital requirements will depend on many factors, including the rate of our revenue growth, our introduction of new solutions and enhancements to existing solutions and our expansion of sales and marketing and product development activities. To the extent that our cash and cash equivalents and future cash flows from operating activities are insufficient to fund our future activities, we may need to raise additional funds through bank credit arrangements, or public or private equity, or debt financings. We also may need to raise additional funds in the event we determine in the future to effect one or more acquisitions of businesses, technologies or products that will complement our existing operations. In the event additional funding is required, we may not be able to obtain bank credit arrangements or effect an equity or debt financing on acceptable terms.
Contractual Obligations
We generally do not enter into long-term minimum purchase commitments. Our principal commitments, in addition to those related to our long-term debt discussed below, consist of obligations under facility leases for office space and equipment leases and contingent consideration obligations in connection with our acquisitions.
The following table summarizes our outstanding contractual obligations as of December 31, 2020:
41
| ($ in thousands) | Total | 2021 | 2022 | 2023 | 2024 | 2025 | Thereafter | |||||||||||||||||||||||||||||||||||||
Long-term debt(1) | $ | 220,216 | $ | 10,678 | $ | 11,551 | $ | 194,191 | $ | 1,282 | $ | 799 | $ | 1,715 | ||||||||||||||||||||||||||||||
Finance lease obligations(2) | 16,337 | 5,353 | 4,087 | 3,194 | 2,261 | 688 | 754 | |||||||||||||||||||||||||||||||||||||
Right-of-use obligations(2) | 56,440 | 12,588 | 10,495 | 8,907 | 7,042 | 5,150 | 12,258 | |||||||||||||||||||||||||||||||||||||
Contingent consideration obligations(3) | 1,640 | 1,300 | 340 | — | — | — | — | |||||||||||||||||||||||||||||||||||||
Purchase commitments(4) | 1,250 | 1,250 | — | — | — | — | ||||||||||||||||||||||||||||||||||||||
| Total | $ | 295,883 | $ | 31,169 | $ | 26,473 | $ | 206,292 | $ | 10,585 | $ | 6,637 | $ | 14,727 | ||||||||||||||||||||||||||||||
________________________________
(1)Consists primarily of the principal portion of borrowings from our senior credit facility in connection with our acquisitions and includes the current portion outstanding.
(2)Includes minimum lease payments over the remaining terms of the leases.
(3)Fair value of payments deemed reasonably likely to occur in connection with our acquisitions.
(4)Consists of the remaining portion of a three-year cumulative agreement to purchase products from the buyer associated with the sale of a subsidiary.
Off-Balance Sheet Arrangements
During the years ended December 31, 2020 and 2019, we did not have any relationships with unconsolidated entities or financial partnerships, such as entities often referred to as structured finance or special purpose entities, which would have been established for the purpose of facilitating off-balance sheet arrangements or other contractually narrow or limited purposes.
Critical Accounting Policies and Estimates
The preparation of financial statements in accordance with generally accepted accounting principles requires that we make estimates and assumptions that affect the reported amounts of assets and liabilities and disclosure of contingent assets and liabilities at the date of financial statements and the reported amounts of revenues and expenses during the reporting period. The Company has established policies and control procedures intended to ensure that estimation methods, including any judgments made as part of such methods, are well-controlled, independently reviewed and applied consistently from period to period. The accounting policies that we believe require more significant estimates and assumptions include: revenue recognition, long-lived assets and goodwill. We base our estimates and assumptions on historical experience, known or expected trends and various other assumptions that we believe to be reasonable. As future events and their effects cannot be determined with precision, actual results could differ significantly from these estimates, which may cause our future results to be significantly affected.
We believe that the following critical accounting policies comprise the more significant estimates and assumptions used in the preparation of our consolidated financial statements.
Revenue Recognition
The majority of the Company's revenues are derived from providing services on a time and material basis and are short-term in nature. The Company accounts for revenue in accordance with ASC Topic 606, Revenue from Contracts with Customers.
Performance Obligations
A performance obligation is a promise in a contract to transfer a distinct good or service to the customer, and is the unit of account in ASC Topic 606. A contract’s transaction price is allocated to each distinct performance obligation and recognized as revenue when, or as, the performance obligation is satisfied. The majority of our contracts have a single performance obligation as the promise to transfer the individual goods or services is not separately identifiable from other promises in the contracts and is, therefore, not distinct. The Company provides highly integrated and bundled inspection services to its customers. Some of our contracts have multiple performance obligations, most commonly due to the contract providing both goods and services. For contracts with multiple performance obligations, the Company allocates the contract’s transaction price to each performance obligation using our best estimate of the standalone selling price of each distinct good or service in the contract. The primary method used to estimate standalone selling price is a relative selling price based on price lists.
42
Contract modifications are not routine in the performance of our contracts. Generally, when contracts are modified, the modification is to account for changes in scope to the goods and services that are provided. In most instances, contract modifications are for goods or services that are distinct, and, therefore, are accounted for as a separate contract.
Our performance obligations are satisfied over time as work progresses or at a point in time. The majority of our revenue recognized over time as work progresses is related to our service deliverables, which includes providing testing, inspection and mechanical services to our customers. Revenue is recognized over time based on time and material incurred to date which best portrays the transfer of control to the customer. The Company also utilizes an available practical expedient that provides for revenue to be recognized in an amount that corresponds directly with the value to the customer of the entity’s performance completed to date. Fixed fee arrangements are determined based on expected labor, material, and overhead to be consumed on fulfillment of such services. Revenue is recognized on a cost-to-cost method tracked on an input basis.
The majority of our revenue recognized at a point in time is related to product sales when the customer obtains control of the asset, which is generally upon shipment to the customer. Contract costs include labor, material and overhead.
The Company expects any significant remaining performance obligations to be satisfied within one year.
Contract Estimates
The majority of our revenues are short-term in nature. The Company has many Master Service Agreements (MSAs) that specify an overall framework and terms of contract when the Company and customers agree upon services or products to be provided. The actual contracting to provide services or furnish products are triggered by a work order, purchase order, or some similar document issued pursuant to a MSA which sets forth the scope of services and/or identifies the products to be provided. From time-to-time, the Company may enter into long-term contracts, which can range from several months to several years. Revenue on such long-term contracts is recognized as work is performed based on total costs incurred to date in relation to the total estimated costs for the performance of the contract at completion. This includes contract estimates of costs to be incurred for the performance of the contract. Cost estimation is based upon the professional knowledge and experience of our project managers, engineers and financial professionals. Factors that are considered in estimating the work to be completed include the availability of materials, the effect of any delays in our project performance and the recoverability of any claims. Whenever revisions of estimates, contract costs and/or contract values indicate that the contract costs will exceed estimated revenues, thus creating a loss, a provision for the total estimated loss is recorded in that period.
Long-Lived Assets
We perform a review of long-lived assets (or asset groups) for impairment when events or changes in circumstances indicate the carrying value of such assets may not be recoverable. If an indication of impairment is present, we compare the estimated undiscounted future cash flows to be generated by the asset (or asset group) to its carrying amount. If the undiscounted future cash flows are less than the carrying amount of the asset (or asset group), we record an impairment loss equal to the excess of the asset’s carrying amount over its fair value. We estimate fair value based on valuation techniques such as a discounted cash flow analysis or a comparison to fair values of similar assets. As of December 31, 2020 and December 31, 2019, we had $92.7 million and $98.6 million in net property, plant and equipment, respectively, and $68.6 million and $109.5 million in intangible assets, net, respectively. See Note 9-Intangible Assets to the consolidated financial statements for the 2020 impairment charge.
Goodwill
Goodwill represents the excess purchase price of acquired businesses over the fair values attributed to underlying net tangible assets and identifiable intangible assets. We test goodwill for impairment at a “reporting unit” level (which for the Company is represented by (i) our Services segment, (ii) our Products and Systems segment, and (iii) the European component of our International segment and (iv) the Brazilian component of our International segment). Our annual impairment test is conducted on the first day of our fourth quarter, which is October 1.
In testing for goodwill impairment, we have the option to first assess qualitative factors to determine whether the existence of events or circumstances lead to a determination that it is more likely than not that the fair value of a reporting unit is less than its carrying amount. If, after assessing the totality of events and circumstances, we conclude that it is not more likely than not that the fair value of a reporting unit is less than its carrying amount, then performing a quantitative impairment test is not necessary. If we conclude otherwise, we are required to perform a quantitative impairment test.
As a result of our adopting ASU 2017-04, impairment will be recorded in the amount that fair value is less than carrying value, as the ASU eliminated step two of the goodwill quantitative impairment process. We consider the income and market approaches to estimating the fair value of our reporting units, which requires significant judgment in evaluation of economic
43
and industry trends, estimated future cash flows, discount rates and other factors. Sustained declines in our stock price and related market capitalization could impact key assumptions in the overall estimated fair values of its reporting units and could result in non-cash impairment charges that could be material to our consolidated balance sheet or results of operations.
During the first quarter of 2020, our market capitalization declined significantly compared to the fourth quarter of 2019. Over the same period, the equity value of the Company’s peer group, and the overall U.S. stock market also declined significantly amid market volatility. In addition, oil prices had dropped significantly. These declines were driven in large part by the uncertainty surrounding the COVID-19 pandemic and other macroeconomic events such as the geopolitical tensions between OPEC and Russia. Based on these factors, we concluded that multiple triggering events occurred and, accordingly, an interim quantitative goodwill impairment test was performed for each reporting unit as of March 31, 2020.
Based upon the results of the interim quantitative goodwill impairment test during the first quarter of 2020, we recorded an aggregate impairment charge of $77.1 million, which included $57.2 million in the services reporting unit within the Services segment, and $19.3 million in the European reporting unit and $0.6 million in the Brazilian reporting unit, both within the International segment.
We elected to perform a qualitative assessment of goodwill on October 1, 2020. Our qualitative assessment considered relevant events and circumstances occurring since our interim quantitative goodwill impairment test performed as of March 31, 2020. Specifically, we considered changes in macroeconomic conditions, industry and market conditions, our internal forecasts of future revenue and expenses, our stock price, any significant events affecting the Company and actual changes in the carrying values of our net assets. After considering all positive and negative evidence for the assessment as of October 1, 2020, we concluded that it was not more likely than not that our carrying values exceeded fair values and as such, no additional impairment was indicated.
Additionally, as of December 31, 2020, there are no indicators of an impairment. See Note 8-Goodwill to the consolidated financial statements for additional information regarding the 2020 impairment charge.
Acquisitions
We allocate the purchase price of acquired businesses to their identifiable tangible assets and liabilities as well as identifiable intangible assets, such as customer relationships, technology, non-compete agreements and trade names. Allocations are based on estimated fair values of assets and liabilities, which reflects assumptions that would be made by typical market participants if they were to buy or sell each asset on an individual asset basis. Certain estimates and judgments are required in the application of the fair value techniques, including estimates of the respective acquisitions' future performance and related cash flows, selection of a discount rate and economic lives, and use of Level 3 measurements as defined in Accounting Standards Update ("ASC") 820 Fair Value Measurements and Disclosure. Deferred taxes are recorded for any differences between the assigned values and tax bases of assets and liabilities. We typically engage third-party valuation experts to assist in determining the fair values for both identifiable tangible and intangible assets. The judgments made in determining the estimated fair value assigned to each class of assets acquired and liabilities assumed, as well as asset lives, could materially impact our results of operations. See Note 7-Acquisitions and Disposition to the consolidated financial statements for additional information.
Recent Accounting Pronouncements
For information about recent accounting pronouncements, see Note 1-Summary of Significant Accounting Policies and Practices to the consolidated financial statements.
ITEM 7A. Quantitative and Qualitative Disclosures About Market Risk
Interest Rate Sensitivity
Our investment portfolio primarily includes cash equivalents for which the market values are not significantly affected by changes in interest rates. Our interest rate risk results primarily from our variable rate indebtedness under our credit facility, which is influenced by movements in short-term rates. Borrowings under our $175 million revolving credit facility as well as our $100.0 million senior secured term loan A facility are based on LIBOR, plus an additional margin based on our Funded Debt Leverage Ratio. Based on the amount of variable rate debt, $210.1 million at December 31, 2020, an increase in interest rates by one hundred basis points from our current rate would increase annual interest expense by approximately $2.1 million.
44
Foreign Currency Risk
We have foreign currency exposure related to our operations in foreign locations. This foreign currency exposure, particularly the Euro, British Pound Sterling, Brazilian Real, Canadian Dollar and the Indian Rupee, arises primarily from the translation of our foreign subsidiaries’ financial statements into U.S. Dollars. Gains and losses relating to nonfunctional currency transactions, are reported in the Consolidated statements of income. For example, a portion of our annual sales and operating costs are denominated in British Pound Sterling and we have exposure related to sales and operating costs increasing or decreasing based on changes in currency exchange rates. If the U.S. Dollar increases in value against these foreign currencies, the value in U.S. Dollars of the assets and liabilities originally recorded in these foreign currencies will decrease. Conversely, if the U.S. Dollar decreases in value against these foreign currencies, the value in U.S. Dollars of the assets and liabilities originally recorded in these foreign currencies will increase. Thus, increases and decreases in the value of the U.S. Dollar relative to these foreign currencies have a direct impact on the value in U.S. Dollars of our foreign currency denominated assets and liabilities, even if the value of these items has not changed in their original currency. Translation adjustments for these movements are recorded as a separate component of Accumulated Other Comprehensive Income in Stockholder Equity. An unfavorable 10% change (strengthening) in the average U.S. Dollar exchange rates for the year ended December 31, 2020 would cause a decrease to our operating loss of approximately $5.9 million. This was primarily driven by our operating losses impacted by impairment charges recorded on March 31, 2020 in certain of our international locations which is more fully described in note 8-Goodwill, 9-Intangible Assets and 17-Leases to the consolidated financial statements. Adjusted for the impairment charges, an unfavorable 10% change (strengthening) in the average U.S. Dollar exchange rates for the year ended December 31, 2020 would cause a decrease in adjusted operating income of approximately $0.3 million. We do not currently enter into forward exchange contracts to hedge exposures denominated in foreign currencies. We may consider entering into hedging or forward exchange contracts in the future, as sales in international currencies increase due to growth in our International segment.
Fair Value of Financial Instruments
We do not have material exposure to market risk with respect to investments, as our investments consist primarily of highly liquid investments purchased with a remaining maturity of three months or less. We do not use derivative financial instruments for speculative or trading purposes; however, this does not preclude our adoption of specific hedging strategies in the future.
Effects of Inflation and Changing Prices
Our results of operations and financial condition have not been significantly affected by inflation and changing prices.
45
ITEM 8. FINANCIAL STATEMENTS AND SUPPLEMENTARY DATA
Report of Independent Registered Public Accounting Firm
To the Stockholders and Board of Directors
Mistras Group, Inc.:
Opinions on the Consolidated Financial Statements and Internal Control Over Financial Reporting
We have audited the accompanying consolidated balance sheets of Mistras Group, Inc. and subsidiaries (the Company) as of December 31, 2020 and 2019, the related consolidated statements of income (loss), comprehensive income (loss), equity, and cash flows for each of the years in the three-year period ended December 31, 2020, and the related notes (collectively, the consolidated financial statements). We also have audited the Company’s internal control over financial reporting as of December 31, 2020, based on criteria established in Internal Control – Integrated Framework (2013) issued by the Committee of Sponsoring Organizations of the Treadway Commission.
In our opinion, the consolidated financial statements referred to above present fairly, in all material respects, the financial position of the Company as of December 31, 2020 and 2019, and the results of its operations and its cash flows for each of the years in the three-year period ended December 31, 2020, in conformity with U.S. generally accepted accounting principles. Also in our opinion, the Company maintained, in all material respects, effective internal control over financial reporting as of December 31, 2020 based on criteria established in Internal Control – Integrated Framework (2013) issued by the Committee of Sponsoring Organizations of the Treadway Commission.
Basis for Opinions
The Company’s management is responsible for these consolidated financial statements, for maintaining effective internal control over financial reporting, and for its assessment of the effectiveness of internal control over financial reporting, included in the accompanying Management’s Report on Internal Control Over Financial Reporting. Our responsibility is to express an opinion on the Company’s consolidated financial statements and an opinion on the Company’s internal control over financial reporting based on our audits. We are a public accounting firm registered with the Public Company Accounting Oversight Board (United States) (PCAOB) and are required to be independent with respect to the Company in accordance with the U.S. federal securities laws and the applicable rules and regulations of the Securities and Exchange Commission and the PCAOB.
We conducted our audits in accordance with the standards of the PCAOB. Those standards require that we plan and perform the audits to obtain reasonable assurance about whether the consolidated financial statements are free of material misstatement, whether due to error or fraud, and whether effective internal control over financial reporting was maintained in all material respects.
Our audits of the consolidated financial statements included performing procedures to assess the risks of material misstatement of the consolidated financial statements, whether due to error or fraud, and performing procedures that respond to those risks. Such procedures included examining, on a test basis, evidence regarding the amounts and disclosures in the consolidated financial statements. Our audits also included evaluating the accounting principles used and significant estimates made by management, as well as evaluating the overall presentation of the consolidated financial statements. Our audit of internal control over financial reporting included obtaining an understanding of internal control over financial reporting, assessing the risk that a material weakness exists, and testing and evaluating the design and operating effectiveness of internal control based on the assessed risk. Our audits also included performing such other procedures as we considered necessary in the circumstances. We believe that our audits provide a reasonable basis for our opinions.
Definition and Limitations of Internal Control Over Financial Reporting
A company’s internal control over financial reporting is a process designed to provide reasonable assurance regarding the reliability of financial reporting and the preparation of financial statements for external purposes in accordance with generally accepted accounting principles. A company’s internal control over financial reporting includes those policies and procedures that (1) pertain to the maintenance of records that, in reasonable detail, accurately and fairly reflect the transactions and dispositions of the assets of the company; (2) provide reasonable assurance that transactions are recorded as necessary to permit preparation of financial statements in accordance with generally accepted accounting principles, and that receipts and expenditures of the company are being made only in accordance with authorizations of management and directors of the company; and (3) provide reasonable assurance regarding prevention or timely detection of unauthorized acquisition, use, or disposition of the company’s assets that could have a material effect on the financial statements.
46
Because of its inherent limitations, internal control over financial reporting may not prevent or detect misstatements. Also, projections of any evaluation of effectiveness to future periods are subject to the risk that controls may become inadequate because of changes in conditions, or that the degree of compliance with the policies or procedures may deteriorate.
Critical Audit Matters
The critical audit matters communicated below are matters arising from the current period audit of the consolidated financial statements that were communicated or required to be communicated to the audit committee and that: (1) relate to accounts or disclosures that are material to the consolidated financial statements and (2) involved our especially challenging, subjective, or complex judgments. The communication of critical audit matters does not alter in any way our opinion on the consolidated financial statements, taken as a whole, and we are not, by communicating the critical audit matters below, providing separate opinions on the critical audit matters or on the accounts or disclosures to which they relate.
Valuation of goodwill for the services and European reporting units
As discussed in Note 1 to the consolidated financial statements, the company tests goodwill for impairment annually on October 1 or more frequently if an event occurs or circumstances change that would more likely than not reduce the fair value of a reporting unit below its carrying amount. The company considers the income and market approaches to estimate the fair value of its reporting units. As of December 31, 2020, the Company had goodwill of $206.0 million, of which a portion related to the services and European reporting units. During the year ended December 31, 2020, the Company recognized goodwill impairment charges of $77.1 million, of which $57.2 million pertained to the services reporting unit and $19.3 million pertained to the European reporting unit.
We identified the evaluation of goodwill impairment for the services and European reporting units as a critical audit matter. Auditor judgment was required to evaluate the selection of discount rates, revenue growth rates, gross margins, and selling, general, and administrative expense used in the income approach as they represented subjective determinations of future market or economic conditions. Additionally, the audit effort associated with the evaluation of goodwill for impairment for the services and European reporting units required specialized skills and knowledge.
The following are the primary procedures we performed to address this critical audit matter. We evaluated the design and tested the operating effectiveness of certain internal controls related to the Company’s goodwill impairment evaluation process, including controls related to management’s selection of discount rates, revenue growth rates, gross margins, and selling, general, and administrative expense. We evaluated the reasonableness of management’s forecasted revenue growth rates, gross margins, and selling, general, and administrative expense by comparing the forecasts to historical revenue growth rates, gross margins, and selling, general, and administrative expense and relevant industry reports. We evaluated the Company’s ability to accurately estimate future revenue growth rates, gross margins, and selling, general, and administrative expense by comparing the historical projected revenue growth rates, gross margins, and selling, general, and administrative expense to actual results for the same period. In addition, we involved valuation professionals with specialized skills and knowledge who assisted in:
•evaluating the Company’s methodology used to estimate the discount rates
•evaluating the Company’s discount rate by comparing it against a discount rate range that was independently developed using publicly available market data for comparable entities
•testing the estimate of fair value of the services and European reporting units by using the Company’s projected cash flows as well as our discount rate range and comparing the results to the Company’s fair values.
Assessment of impairment of a certain asset group within the services segment
As discussed in Note 1 to the consolidated financial statements, the company reviews the recoverability of its long-lived asset groups whenever events or changes in circumstances indicate that the carrying amount of the long-lived asset group might not be recoverable. The assessment for potential impairment is based on the Company’s ability to recover the carrying value of its long-lived assets from expected future undiscounted cash flows. If the total expected future undiscounted cash flows are less than the carrying amount of the assets, an impairment loss is recognized for the amount by which the carrying amount of the asset group exceeds its fair value. The company considers the income and market approaches to estimate the fair value of its asset groups. During the year ended December 31, 2020, the Company recognized long-lived asset impairment charges of $28.8 million of which $28.5 million related to a certain asset group within the services segment.
We identified the assessment of impairment of a certain asset group as a critical audit matter. Auditor judgment was required to evaluate the selection of the discount rate, revenue growth rates, gross margins, and selling, general, and administrative expense used in the income approach as they represented subjective determinations of future market or
47
economic conditions. Additionally, the audit effort associated with the evaluation of the asset group for impairment required specialized skills and knowledge.
The following are the primary procedures we performed to address this critical audit matter. We evaluated the design and tested the operating effectiveness of certain internal controls related to the Company’s long-lived asset impairment evaluation process, including controls related to management’s selection of the discount rate, revenue growth rates, gross margins, and selling, general, and administrative expense. We evaluated management’s forecasted revenue growth rates, gross margins, and selling, general, and administrative expense by comparing them to historical revenue growth rates, gross margins, and selling, general, and administrative expense and relevant industry reports. We evaluated the Company’s ability to accurately estimate future revenue growth rates, gross margins, and selling, general, and administrative expense by comparing the historical projected revenue growth rates, gross margins, and selling, general, and administrative expense to actual results for the same period. In addition, we involved valuation professionals with specialized skills and knowledge who assisted in:
•evaluating the Company’s methodology used to estimate the discount rate
•evaluating the Company’s discount rate by comparing it against a discount rate range that was independently developed using publicly available market data for comparable entities
•testing the estimate of fair value of the asset group by using the Company’s projected cash flows as well as our discount rate range and comparing the results to the Company’s fair value.
/s/ KPMG LLP
We have served as the Company’s auditor since 2013
Short Hills, New Jersey
March 16, 2021
48
Mistras Group, Inc. and Subsidiaries
Consolidated Balance Sheets
(in thousands, except share and per share data)
| December 31, | |||||||||||
| 2020 | 2019 | ||||||||||
| ASSETS | |||||||||||
| Current Assets | |||||||||||
| Cash and cash equivalents | $ | $ | |||||||||
| Accounts receivable, net | |||||||||||
| Inventories | |||||||||||
| Prepaid expenses and other current assets | |||||||||||
| Total current assets | |||||||||||
| Property, plant and equipment, net | |||||||||||
| Intangible assets, net | |||||||||||
| Goodwill | |||||||||||
| Deferred income taxes | |||||||||||
| Other assets | |||||||||||
| Total Assets | $ | $ | |||||||||
| LIABILITIES AND EQUITY | |||||||||||
| Current Liabilities | |||||||||||
| Accounts payable | $ | $ | |||||||||
| Accrued expenses and other current liabilities | |||||||||||
| Current portion of long-term debt | |||||||||||
| Current portion of finance lease obligations | |||||||||||
| Income taxes payable | |||||||||||
| Total current liabilities | |||||||||||
| Long-term debt, net of current portion | |||||||||||
| Obligations under finance leases, net of current portion | |||||||||||
| Deferred income taxes | |||||||||||
| Other long-term liabilities | |||||||||||
| Total Liabilities | $ | $ | |||||||||
| Commitments and contingencies | |||||||||||
| Equity | |||||||||||
Preferred stock, | |||||||||||
Common stock, $ | |||||||||||
| Additional paid-in capital | |||||||||||
| Retained earnings (deficit) | ( | ||||||||||
| Accumulated other comprehensive loss | ( | ( | |||||||||
| Total Mistras Group, Inc. stockholders’ equity | |||||||||||
| Non-controlling interests | |||||||||||
| Total Equity | |||||||||||
| Total Liabilities and Equity | $ | $ | |||||||||
The accompanying notes are an integral part of these consolidated financial statements.
49
Mistras Group, Inc. and Subsidiaries
Consolidated Statements of Income (Loss)
(in thousands, except per share data)
| For the year ended December 31, | |||||||||||||||||
| 2020 | 2019 | 2018 | |||||||||||||||
| Revenue | $ | $ | $ | ||||||||||||||
| Cost of revenue | |||||||||||||||||
| Depreciation | |||||||||||||||||
| Gross profit | |||||||||||||||||
| Selling, general and administrative expenses | |||||||||||||||||
| Bad debt provision for troubled customers, net of recoveries | |||||||||||||||||
| Impairment charges | |||||||||||||||||
| Pension withdrawal expense | |||||||||||||||||
| Gain on sale of subsidiary | ( | ||||||||||||||||
| Research and engineering | |||||||||||||||||
| Depreciation and amortization | |||||||||||||||||
| Acquisition-related expense, net | |||||||||||||||||
| Income (loss) from operations | ( | ||||||||||||||||
| Interest expense | |||||||||||||||||
| Income (loss) before provision for income taxes | ( | ||||||||||||||||
| Provision (benefit) for income taxes | ( | ||||||||||||||||
| Net income (loss) | ( | ||||||||||||||||
| Less: net income (loss) attributable to noncontrolling interests, net of taxes | ( | ||||||||||||||||
| Net income (loss) attributable to Mistras Group, Inc. | $ | ( | $ | $ | |||||||||||||
| Earnings (loss) per common share | |||||||||||||||||
| Basic | $ | ( | $ | $ | |||||||||||||
| Diluted | $ | ( | $ | $ | |||||||||||||
| Weighted average common shares outstanding: | |||||||||||||||||
| Basic | |||||||||||||||||
| Diluted | |||||||||||||||||
The accompanying notes are an integral part of these consolidated financial statements.
50
Mistras Group, Inc. and Subsidiaries
Consolidated Statements of Comprehensive Income (Loss)
(in thousands)
| For the year ended December 31, | |||||||||||||||||
| 2020 | 2019 | 2018 | |||||||||||||||
| Net income (loss) | $ | ( | $ | $ | |||||||||||||
| Other comprehensive income (loss): | |||||||||||||||||
| Foreign currency translation adjustments | ( | ||||||||||||||||
| Comprehensive income (loss) | ( | ( | |||||||||||||||
| Less: net income (loss) attributable to noncontrolling interests | ( | ||||||||||||||||
| Less: Foreign currency translation adjustments attributable to noncontrolling interests | ( | ||||||||||||||||
| Comprehensive income (loss) attributable to Mistras Group, Inc. | $ | ( | $ | $ | ( | ||||||||||||
The accompanying notes are an integral part of these consolidated financial statements.
51
Mistras Group, Inc. and Subsidiaries
Consolidated Statements of Equity
(in thousands)
| Common Stock | Additional paid-in capital | Retained earnings (deficit) | Accumulated other comprehensive income (loss) | Total Mistras Group, Inc. Stockholders’ Equity | Noncontrolling Interest | ||||||||||||||||||||||||||||||||||||||||||
| Shares | Amount | Total Equity | |||||||||||||||||||||||||||||||||||||||||||||
| Balance at December 31, 2017 | $ | $ | $ | $ | ( | $ | $ | $ | |||||||||||||||||||||||||||||||||||||||
| Net income | — | — | — | — | |||||||||||||||||||||||||||||||||||||||||||
| Other comprehensive loss, net of tax | — | — | — | — | ( | ( | ( | ( | |||||||||||||||||||||||||||||||||||||||
| Share-based payments | — | — | — | ||||||||||||||||||||||||||||||||||||||||||||
| Net settlement on vesting of restricted stock units | — | — | ( | — | — | ( | — | ( | |||||||||||||||||||||||||||||||||||||||
| Exercise of stock options | — | — | — | — | |||||||||||||||||||||||||||||||||||||||||||
| Balance at December 31, 2018 | $ | $ | $ | $ | ( | $ | $ | $ | |||||||||||||||||||||||||||||||||||||||
| Net income | — | — | — | — | |||||||||||||||||||||||||||||||||||||||||||
| Other comprehensive income, net of tax | — | — | — | — | |||||||||||||||||||||||||||||||||||||||||||
| Share-based payments | — | — | — | — | |||||||||||||||||||||||||||||||||||||||||||
| Net settlement on vesting of restricted stock units | ( | — | — | ( | — | ( | |||||||||||||||||||||||||||||||||||||||||
| Exercise of stock options | — | — | — | — | |||||||||||||||||||||||||||||||||||||||||||
| Balance at December 31, 2019 | $ | $ | $ | $ | ( | $ | $ | $ | |||||||||||||||||||||||||||||||||||||||
| Net loss | — | — | — | ( | — | ( | ( | ( | |||||||||||||||||||||||||||||||||||||||
| Other comprehensive income, net of tax | — | — | — | — | |||||||||||||||||||||||||||||||||||||||||||
| Share-based payments | — | — | — | — | — | ||||||||||||||||||||||||||||||||||||||||||
| Net settlement of restricted stock units | ( | — | — | ( | — | ( | |||||||||||||||||||||||||||||||||||||||||
| Balance at December 31, 2020 | $ | $ | $ | ( | $ | ( | $ | $ | $ | ||||||||||||||||||||||||||||||||||||||
The accompanying notes are an integral part of these consolidated financial statements.
52
Mistras Group, Inc. and Subsidiaries
Consolidated Statements of Cash Flows
(in thousands)
| For the year ended December 31, | |||||||||||||||||
| 2020 | 2019 | 2018 | |||||||||||||||
| Cash flows from operating activities | |||||||||||||||||
| Net income (loss) | $ | ( | $ | $ | |||||||||||||
| Adjustments to reconcile net income (loss) to net cash provided by operating activities | |||||||||||||||||
| Depreciation and amortization | |||||||||||||||||
| Deferred income taxes | ( | ( | |||||||||||||||
| Share-based compensation expense | |||||||||||||||||
| Impairment charges | |||||||||||||||||
| Bad debt provision for troubled customers, net of recoveries | |||||||||||||||||
| Foreign currency (gain) loss | ( | ||||||||||||||||
| Gain on sale of subsidiary | ( | ||||||||||||||||
| Fair value adjustments to contingent consideration | ( | ||||||||||||||||
| Other | |||||||||||||||||
| Changes in operating assets and liabilities, net of effect of acquisitions and dispositions | |||||||||||||||||
| Accounts receivable | ( | ||||||||||||||||
| Inventories | ( | ( | |||||||||||||||
| Prepaid expenses and other assets | ( | ||||||||||||||||
| Accounts payable | ( | ||||||||||||||||
| Accrued expenses and other liabilities | ( | ||||||||||||||||
| Income taxes payable | ( | ||||||||||||||||
| Net cash provided by operating activities | |||||||||||||||||
| Cash flows from investing activities | |||||||||||||||||
| Purchase of property, plant and equipment | ( | ( | ( | ||||||||||||||
| Purchase of intangible assets | ( | ( | ( | ||||||||||||||
| Disposition of business | |||||||||||||||||
| Acquisition of businesses, net of cash acquired | ( | ( | |||||||||||||||
| Proceeds from sale of equipment | |||||||||||||||||
| Net cash used in investing activities | ( | ( | ( | ||||||||||||||
| Cash flows from financing activities | |||||||||||||||||
| Repayment of finance lease obligations | ( | ( | ( | ||||||||||||||
| Proceeds from borrowings of long-term debt | |||||||||||||||||
| Repayment of long-term debt | ( | ( | ( | ||||||||||||||
| Proceeds from revolver | |||||||||||||||||
| Repayments of revolver | ( | ( | ( | ||||||||||||||
| Payments of debt issuance costs | ( | ( | |||||||||||||||
| Payment of contingent consideration for business acquisitions | ( | ( | ( | ||||||||||||||
| Taxes paid related to net share settlement of share-based awards | ( | ( | ( | ||||||||||||||
| Proceeds from the exercise of stock options | |||||||||||||||||
| Net cash provided by (used in) financing activities | ( | ( | |||||||||||||||
| Effect of exchange rate changes on cash and cash equivalents | ( | ( | |||||||||||||||
| Net change in cash and cash equivalents | ( | ( | |||||||||||||||
| Cash and cash equivalents: | |||||||||||||||||
| Beginning of period | |||||||||||||||||
| End of period | $ | $ | $ | ||||||||||||||
| Supplemental disclosure of cash paid | |||||||||||||||||
| Interest, net | $ | $ | $ | ||||||||||||||
| Income taxes, net | $ | ( | $ | $ | |||||||||||||
| Noncash investing and financing | |||||||||||||||||
| Equipment acquired through finance lease obligations | $ | $ | $ | ||||||||||||||
The accompanying notes are an integral part of these consolidated financial statements.
53
Mistras Group, Inc. and Subsidiaries
Notes to Consolidated Financial Statements
(tabular dollars in thousands, except per share data)
1. Summary of Significant Accounting Policies and Practices
Description of Business
Mistras Group, Inc. and subsidiaries (the Company) is a leading “OneSource™” multinational provider of integrated technology-enabled asset protection solutions helping to maximize the safety and operational uptime for civilization's most critical industrial and civil assets.
Backed by an innovative, data-driven asset protection portfolio, proprietary technologies, and decades-long legacy of industry leadership, the Company helps clients in the oil and gas, aerospace and defense, power generation, infrastructure, and manufacturing industries towards achieving and maintaining operational excellence. By supporting these organizations that help fuel our vehicles and power our society; inspecting components that are trusted for commercial, defense, and space craft; and building real-time monitoring equipment to enable safe travel across bridges, the Company helps the world at large.
The Company enhances value for its clients by integrating asset protection throughout supply chains and centralizing integrity data through a suite of Industrial IoT-connected digital software and monitoring solutions.
The company's core capabilities also include non-destructive testing (“NDT”) field inspections enhanced by advanced robotics, laboratory quality control and assurance testing, sensing technologies and NDT equipment, asset and mechanical integrity engineering services, and light mechanical maintenance and access services.
The Company serves a global customer base of companies with asset-intensive infrastructure, including companies in the oil and gas, commercial aerospace and defense, fossil and nuclear power, alternative and renewable energy, public infrastructure, chemicals, transportation, primary metals and metalworking, pharmaceutical/biotechnology and food processing industries, and research and engineering institutions.
Principles of Consolidation
The Company follows guidance on the consolidation of variable interest entities (VIEs) that requires companies to utilize a qualitative approach to determine whether it is the primary beneficiary of a VIE. The process for identifying the primary beneficiary of a VIE requires consideration of the factors that indicate a party has the power to direct the activities that most significantly impact the VIE’s economic performance, including powers granted to the VIE’s program manager, powers contained in the VIE governing board and, to a certain extent, a company’s economic interest in the VIE. The Company analyzes its joint ventures and classifies them as either:
•a VIE that must be consolidated because the Company is the primary beneficiary, or the joint venture is not a VIE and the Company holds the majority voting interest with no significant participative rights available to the other partners; or
•a VIE that does not require consolidation and is treated as an equity method investment because the Company is not the primary beneficiary or the joint venture is not a VIE and the Company does not hold the majority voting interest.
As part of the above analysis, if it is determined that the Company has the power to direct the activities that most significantly impact the joint venture’s economic performance, the Company considers whether or not it has the obligation to absorb losses or rights to receive benefits of the VIE that could potentially be significant to the VIE.
The Company became the primary beneficiary in July 2020 of a VIE in which the Company has a 49 % interest in a limited partnership, and a 49 % shareholder in the corporate general partner of the limited partnership. The Company consolidated the financial statements of the VIE with the financial statements of the Company. As of and the for the year ended December 31, 2020, the VIE had immaterial assets and had no revenue. The Company is the primary sub-contractor of the VIE.
The accompanying audited consolidated financial statements include the accounts of Mistras Group, Inc. as well as its wholly-owned subsidiaries, majority-owned subsidiaries and consolidated VIE. For subsidiaries in which the Company’s ownership interest is less than 100%, the non-controlling interests are reported in stockholders’ equity in the accompanying consolidated balance sheets. The non-controlling interests in net results, net of tax, is classified separately in the accompanying consolidated
54
Reclassifications
Certain amounts in prior periods have been reclassified to conform to the current year presentation. Such reclassifications did not have a material effect on the Company's financial condition or results of operations as previously reported.
Use of Estimates
The preparation of financial statements in accordance with U.S. generally accepted accounting principles (GAAP) requires that the Company make estimates and assumptions that affect the reported amounts of assets, liabilities, revenue and expenses and disclosure of contingent assets and liabilities at the date of financial statements. The Company bases its estimates and assumptions on historical experience, known or expected trends and various other assumptions that it believes to be reasonable. As future events and their effects cannot be determined with precision, actual results could differ significantly from these estimates, which may cause the Company’s future results to be significantly affected.
Cash and Cash Equivalents
The Company considers all highly liquid investments purchased with an original maturity of three months or less to be cash equivalents.
Accounts Receivable and Allowance for Credit Losses (formerly Allowance for Doubtful Accounts)
The Company maintains an allowance for credit losses on its accounts receivable balances, which represents its best estimate of current expected credit losses over the contractual life of the accounts receivable. Beginning January 1, 2020, when evaluating the adequacy of its allowance for credit losses each reporting period, the Company analyzes accounts receivable balances with similar risk characteristics on a collective basis, considering factors such as the aging of receivable balances, payment terms (primarily with 30 day terms), geographic location, historical loss experience, current information, and future expectations (generally considered one year which is consistent with expected collectability of the Company's trade receivables).
During the year ended December 31, 2020, the Company recorded a net provision for expected credit losses of $0.7 million.
Concentration of Credit Risk
For each of the years ended December 31, 2020 and 2019, no customer represented 10% or more of the Company's revenue.
Financial instruments that potentially subject the Company to concentrations of credit risk consist principally of cash and cash equivalents and accounts receivable. At times, cash deposits may exceed the limits insured by the Federal Deposit Insurance Corporation. The Company believes it is not exposed to any significant credit risk or risk of nonperformance of financial institutions.
Inventories
Inventories are stated at the lower of cost or net realizable value, as determined by using the first-in, first-out method, or market. Work in process and finished goods inventory include material, direct labor, variable costs and overhead.
Purchased and Internal-Use Software
The Company capitalizes certain costs that are incurred to purchase or to create and implement internal-use software, which includes software coding, installation and testing. Capitalized costs are amortized on a straight-line basis over three years , the estimated useful life of the software.
55
Property, Plant and Equipment
Property, plant and equipment are recorded at cost. Depreciation of property, plant and equipment is computed utilizing the straight-line method over the estimated useful lives of the assets. Amortization of leasehold improvements is computed utilizing the straight-line method over the shorter of the remaining lease term or estimated useful life. Repairs and maintenance costs are expensed as incurred.
Goodwill
Goodwill represents the excess purchase price of acquired businesses over the fair values attributed to underlying net tangible assets and identifiable intangible assets. The Company tests goodwill for impairment at a “reporting unit” level (which for the Company is represented by (i) our Services segment, (ii) our Products and Systems segment, and (iii) the European component of our International segment and (iv) the Brazilian component of our International segment). Our annual impairment test is conducted on the first day of our fourth quarter, which is October 1. Goodwill is also tested for impairment whenever an event occurs or circumstances change that would more likely than not reduce the fair value of a reporting unit below its carrying amount.
In testing for goodwill impairment, the Company has the option to first assess qualitative factors to determine whether the existence of events or circumstances lead to a determination that it is more likely than not that the fair value of a reporting unit is less than its carrying amount. If, after assessing the totality of events and circumstances, the Company concludes that it is not more likely than not that the fair value of a reporting unit is less than its carrying amount, then performing a quantitative impairment test is not necessary. If the Company concludes otherwise, the Company is required to perform a quantitative impairment test.
See Note 8-Goodwill for additional information related to the Company's goodwill impairment tests during 2020.
Impairment of Long-lived Assets
The Company reviews the recoverability of its long-lived assets (or asset groups) whenever events or changes in circumstances indicate that the carrying amount of the long-lived asset (group) might not be recoverable. The assessment for potential impairment is based primarily on the Company’s ability to recover the carrying value of its long-lived assets from expected future undiscounted cash flows. If the total expected future undiscounted cash flows are less than the carrying amount of the assets, a loss is recognized for the difference between fair value (computed based upon the expected future discounted cash flows) and the carrying value of the assets.
Research and Engineering
Research and product development costs are expensed as incurred.
Advertising, Promotions and Marketing
56
Fair Value of Financial Instruments
Foreign Currency Translation
The financial position and results of operations of the Company’s foreign subsidiaries are measured using their functional currencies, which are their local currencies. Assets and liabilities of foreign subsidiaries are translated into the U.S. Dollar at the exchange rates in effect at the balance sheet date. Income and expenses are translated at the average exchange rate during the period. Translation gains and losses are reported as a component of other comprehensive income (loss) for the period and included in accumulated other comprehensive income (loss) within stockholders’ equity.
Self-Insurance
The Company is self-insured for certain losses relating to workers’ compensation and health benefit claims. The Company maintains third-party excess insurance coverage for all workers' compensation and health benefit claims in excess of approximately $0.3 million per occurrence to reduce its exposure from such claims. Self-insured losses are accrued when it is probable that an uninsured claim has been incurred but not reported and the amount of the loss can be reasonably estimated at the balance sheet date.
Share-based Compensation
The value of services received from employees and directors in exchange for an award of an equity instrument is measured based on the grant-date fair value of the award. Such value is recognized as a non-cash expense on a straight-line basis over the minimum period the individual provides services, which is typically the vesting period of the award with the exception of awards with graded vesting that contain an internal performance measure where each tranche is recognized on a straight-line basis over its vesting period subject to the probability of meeting the performance requirements and adjusted for the number of shares expected to be earned. Awards to certain employees eligible for retirement prior to the award becoming fully vested are amortized to expense over the period through the date that the employee first becomes eligible to retire and is no longer required to provide service to earn the award. As share-based compensation expense is based on awards ultimately expected to vest, the amount of expense is reduced for estimated forfeitures. The cost of these awards is recorded in selling, general and administrative expense in the Company’s consolidated statements of income.
Income Taxes
Income taxes are accounted for under the asset and liability method. Deferred income tax assets and liabilities are recognized for the future tax consequences attributable to differences between the financial statement carrying amounts of existing assets and liabilities and their respective tax bases and tax credit carry-forwards. Deferred income tax assets and liabilities are measured using enacted tax rates expected to apply to taxable income in the years in which those temporary differences are expected to be recovered or settled. The effect on deferred income tax assets and liabilities of a change in tax rates is recognized in income in the period that includes the enactment date. A valuation allowance is provided if it is more likely than not that some or all of a deferred income tax asset will not be realized. A current tax liability or asset is recognized for the estimated taxes payable or refundable on tax returns for the current and prior years. US GAAP prescribes a minimum recognition threshold a tax position is required to meet before being recognized in the financial statements. US GAAP also provides guidance on de-recognition, measurement, and classification of amounts relating to uncertain tax positions, accounting for and disclosure of interest and penalties, accounting in interim periods and disclosures required. Interest and penalties related to unrecognized tax positions are recognized as incurred within “provision for income taxes” in the consolidated statements of income.
57
Recent Accounting Pronouncements
In December 2019, the FASB issued ASU No. 2019-12, Income Taxes (Topic 740): Simplifying the Accounting for Income Taxes (“ASU 2019-12”). ASU 2019-12 simplifies the accounting for income taxes by eliminating certain exceptions related to the approach for intraperiod tax allocation, the methodology for calculating income taxes in an interim period, and the recognition of deferred tax liabilities related to outside basis differences. The standard is effective for interim and annual periods beginning January 1, 2021, with certain amendments applied prospectively and others requiring retrospective application. Early adoption is permitted, with any adjustments reflected as of the beginning of the fiscal year of adoption. The Company did not elect early adoption and is currently evaluating the impact of this guidance on its consolidated financial position, results of operations, and cash flows.
In March 2020, the FASB issued ASU 2020-04, “Reference Rate Reform (Topic 848): Facilitation of the Effects of Reference Rate Reform on Financial Reporting.” The guidance provides optional expedients and exceptions for applying U.S. GAAP to contract modifications and hedging relationships, subject to meeting certain criteria, that reference LIBOR or another rate that is expected to be discontinued. The amendments in ASU 2020-04 are effective for all entities as of March 12, 2020 through December 31, 2022. The Company is currently evaluating the impact of this guidance on its consolidated financial position, results of operations, and cash flows.
2. Revenue
The Company derives the majority of its revenue by providing services on a time and material basis and are short-term in
nature. The Company accounts for revenue in accordance with ASC Topic 606, Revenue from Contracts with Customers.
Performance Obligations
A performance obligation is a promise in a contract to transfer a distinct good or service to the customer, and is the unit of account in ASC Topic 606. A contract’s transaction price is allocated to each distinct performance obligation and recognized as revenue when, or as, the performance obligation is satisfied. The majority of the Company's contracts have a single performance obligation as the promise to transfer the individual goods or services is not separately identifiable from other promises in the contracts and is, therefore, not distinct. The Company provides highly integrated and bundled inspection services to its customers. Some of our contracts have multiple performance obligations, most commonly due to the contract providing both goods and services. For contracts with multiple performance obligations, the Company allocates the contract’s transaction price to each performance obligation using the Company's best estimate of the standalone selling price of each distinct good or service in the contract. The primary method used to estimate standalone selling price is a relative selling price based on price lists.
Contract modifications are not routine in the performance of the Company's contracts. Generally, when contracts are modified, the modification is to account for changes in scope to the goods and services that are provided. In most instances, contract modifications are for goods or services that are distinct, and, therefore, are accounted for as a separate contract.
The Company's performance obligations are satisfied over time as work progresses or at a point in time. The majority of the Company's revenue recognized over time as work progresses is related to the Company's service deliverables, which includes providing testing, inspection and mechanical services to our customers. Revenue is recognized over time based on time and material incurred to date which best portrays the transfer of control to the customer. The Company also utilizes an available practical expedient that provides for revenue to be recognized in an amount that corresponds directly with the value to the customer of the entity’s performance completed to date. Fixed fee arrangements are determined based on expected labor, material, and overhead to be consumed on fulfillment of such services. Revenue is recognized on a cost-to-cost method tracked on an input basis.
58
The majority of our revenue recognized at a point in time is related to product sales when the customer obtains control of the asset, which is generally upon shipment to the customer. Contract costs include labor, material and overhead.
The Company expects any significant remaining performance obligations to be satisfied within one year .
Contract Estimates
The majority of the Company's revenues are short-term in nature. The Company has many master service agreements (MSAs) that specify an overall framework and contract terms when the Company and customers agree upon services or products to be provided. The actual contracting to provide services or furnish products are triggered by a work order, purchase order, or some similar document issued pursuant to a MSA which sets forth the scope of services and/or identifies the products to be provided. From time-to-time, the Company may enter into long-term contracts, which can range from several months to several years. Revenue on such long-term contracts is recognized as work is performed based on total costs incurred to date in relation to the total estimated costs for the performance of the contract at completion. This includes contract estimates of costs to be incurred for the performance of the contract. Cost estimation is based upon the professional knowledge and experience of the Company's project managers, engineers and financial professionals. Factors that are considered in estimating the work to be completed include the availability of materials, the effect of any delays in the Company's project performance and the recoverability of any claims. Whenever revisions of estimates, contract costs and/or contract values indicate that the contract costs will exceed estimated revenues, thus creating a loss, a provision for the total estimated loss is recorded in that period.
Revenue by category
The following series of tables present our disaggregated revenues by segment:
Revenue by industry was as follows:
| Year ended December 31, 2020 | Services | International | Products & Systems | Corp/Elim | Total | ||||||||||||||||||||||||
| Oil & Gas | $ | $ | $ | $ | $ | ||||||||||||||||||||||||
| Aerospace & Defense | $ | ||||||||||||||||||||||||||||
| Industrials | $ | ||||||||||||||||||||||||||||
| Power generation & Transmission | $ | ||||||||||||||||||||||||||||
| Other Process Industries | $ | ||||||||||||||||||||||||||||
| Infrastructure, Research & Engineering | $ | ||||||||||||||||||||||||||||
| Other | ( | $ | |||||||||||||||||||||||||||
| Total | $ | $ | $ | $ | ( | $ | |||||||||||||||||||||||
| Year ended December 31, 2019 | Services | International | Products & Systems | Corp/Elim | Total | ||||||||||||||||||||||||
| Oil & Gas | $ | $ | $ | $ | $ | ||||||||||||||||||||||||
| Aerospace & Defense | $ | ||||||||||||||||||||||||||||
| Industrials | $ | ||||||||||||||||||||||||||||
| Power generation & Transmission | $ | ||||||||||||||||||||||||||||
| Other Process Industries | $ | ||||||||||||||||||||||||||||
| Infrastructure, Research & Engineering | $ | ||||||||||||||||||||||||||||
| Other | ( | $ | |||||||||||||||||||||||||||
| Total | $ | $ | $ | $ | ( | $ | |||||||||||||||||||||||
59
| Year ended December 31, 2018 | Services | International | Products & Systems | Corp/Elim | Total | ||||||||||||||||||||||||
| Oil & Gas | $ | $ | $ | $ | $ | ||||||||||||||||||||||||
| Aerospace & Defense | |||||||||||||||||||||||||||||
| Industrials | |||||||||||||||||||||||||||||
| Power generation & Transmission | |||||||||||||||||||||||||||||
| Other Process Industries | |||||||||||||||||||||||||||||
| Infrastructure, Research & Engineering | |||||||||||||||||||||||||||||
| Other | ( | ||||||||||||||||||||||||||||
| Total | $ | $ | $ | $ | ( | $ | |||||||||||||||||||||||
Revenue per key geographic location was as follows:
| Year ended December 31, 2020 | Services | International | Products & Systems | Corp/Elim | Total | ||||||||||||||||||||||||
| United States | $ | $ | $ | $ | ( | $ | |||||||||||||||||||||||
| Other Americas | ( | ||||||||||||||||||||||||||||
| Europe | ( | ||||||||||||||||||||||||||||
| Asia-Pacific | ( | ||||||||||||||||||||||||||||
| Total | $ | $ | $ | $ | ( | $ | |||||||||||||||||||||||
| Year ended December 31, 2019 | Services | International | Products & Systems | Corp/Elim | Total | ||||||||||||||||||||||||
| United States | $ | $ | $ | $ | ( | $ | |||||||||||||||||||||||
| Other Americas | ( | ||||||||||||||||||||||||||||
| Europe | ( | ||||||||||||||||||||||||||||
| Asia-Pacific | ( | ||||||||||||||||||||||||||||
| Total | $ | $ | $ | $ | ( | $ | |||||||||||||||||||||||
| Year ended December 31, 2018 | Services | International | Products & Systems | Corp/Elim | Total | ||||||||||||||||||||||||
| United States | $ | $ | $ | $ | ( | $ | |||||||||||||||||||||||
| Other Americas | ( | ||||||||||||||||||||||||||||
| Europe | ( | ||||||||||||||||||||||||||||
| Asia-Pacific | ( | ||||||||||||||||||||||||||||
| Total | $ | $ | $ | $ | ( | $ | |||||||||||||||||||||||
Contract Balances
The timing of revenue recognition, billings and cash collections results in billed accounts receivable, unbilled receivables (contract assets), and customer advances and deposits (contract liabilities) on the consolidated balance sheet. Amounts are generally billed as work progresses in accordance with agreed-upon contractual terms, generally at periodic intervals (e.g., weekly, bi-weekly or monthly). Generally, billing occurs subsequent to revenue recognition, resulting in contract assets. However, the Company sometimes receives advances or deposits from its customers before revenue is recognized, resulting in contract liabilities. These assets and liabilities are aggregated on an individual contract basis and reported on the consolidated balance sheet at the end of each reporting period within accounts receivables or accrued expenses and other current liabilities.
Revenue recognized for 2020 and 2019, that was included in the contract liability balance at the beginning of the year was $4.6 million and $4.3 million, respectively. Changes in the contract asset and liability balances during the years ended December 31, 2020 and 2019, were not impacted by any other factors. The Company applies the practical expedient to expense incremental
60
3. Earnings per Share
Basic earnings (loss) per share is computed by dividing net income by the weighted average number of shares outstanding during the period. Diluted earnings per share is computed by dividing net by the sum of (1) the weighted average number of shares of common stock outstanding during the period, and (2) the dilutive effect of assumed conversion of equity awards using the treasury stock method. With respect to the number of weighted average shares outstanding (denominator), diluted shares reflect: (i) the exercise of options to acquire common stock to the extent that the options’ exercise prices are less than the average market price of common shares during the period and (ii) the pro forma vesting of restricted stock units.
The following table sets forth the computations of basic and diluted earnings per share:
| For the year ended December 31, | |||||||||||||||||
| 2020 | 2019 | 2018 | |||||||||||||||
| Basic earnings (loss) per share: | |||||||||||||||||
| Numerator: | |||||||||||||||||
| Net income (loss) attributable to Mistras Group, Inc. | $ | ( | $ | $ | |||||||||||||
| Denominator | |||||||||||||||||
| Weighted average common shares outstanding | |||||||||||||||||
| Basic earnings (loss) per share | $ | ( | $ | $ | |||||||||||||
| Diluted earnings (loss) per share: | |||||||||||||||||
| Numerator: | |||||||||||||||||
| Net income (loss) attributable to Mistras Group, Inc. | $ | ( | $ | $ | |||||||||||||
| Denominator | |||||||||||||||||
| Weighted average common shares outstanding | |||||||||||||||||
| Dilutive effect of stock options outstanding | |||||||||||||||||
| Dilutive effect of restricted stock units outstanding | |||||||||||||||||
| Diluted earnings (loss) per share | $ | ( | $ | $ | |||||||||||||
The following potential common shares were excluded from the computation of diluted earnings per share, as the effect would have been anti-dilutive:
| For the year ended December 31, | |||||||||||||||||
| 2020 | 2019 | 2018 | |||||||||||||||
Potential common stock attributable to restricted stock units (RSUs) and performance stock units (PSUs) outstanding (1) | |||||||||||||||||
| Potential common stock attributable to stock options outstanding | |||||||||||||||||
| Total | |||||||||||||||||
(1) For the twelve months ended December 31, 2020, 254 shares related to RSUs/PSUs, were excluded from the calculation of diluted EPS due to the net loss for the period.
61
4. Accounts Receivable
Accounts receivable consist of the following:
| December 31, | |||||||||||
| 2020 | 2019 | ||||||||||
| Trade accounts receivable | $ | $ | |||||||||
| Allowance for credit losses | ( | ( | |||||||||
| Accounts receivable, net | $ | $ | |||||||||
The Company had $11.9 million and $22.2 million of unbilled revenues accrued as of December 31, 2020 and December 31, 2019, respectively, which is included within the trade accounts receivable balance above. Unbilled revenue is generally billed in the subsequent quarter to their revenue recognition.
The Company was contracted to perform inspections of welds on various pipeline projects in Texas for a customer. As of December 31, 2019, approximately $1.4 million of past due receivables were outstanding from this customer. The Company received notice from the customer in December 2019, alleging that the work performed was not in compliance with the contract. The Company filed a lawsuit to recover the $1.4 million and other amounts due to the Company and the customer filed a counterclaim, alleging breach of contract and seeking its damages. Accordingly, the Company recorded a reserve of $1.4 million during the twelve months ended December 31, 2019 for these past due receivables. The status of this situation has not changed during 2020. See Note 18-Commitments and Contingencies for additional details.
In the fourth quarter of 2018, the Company recorded a reserve of $0.7 million for a renewable energy industry customer, based in part on the available information about the financial difficulties of the customer. During the first quarter of 2019, the Company recorded an additional charge of $5.7 million to fully reserve for the amount of the exposure related to this customer. This customer filed for a voluntary insolvency proceeding on April 9, 2019. During the second quarter of 2019, the Company reversed $1.0 million of this reserve based on additional information obtained during the quarter. The status of the dispute has not changed since the second quarter of 2019.
During 2019, the Company sold to an unaffiliated third party, without recourse, its remaining outstanding receivables owed from a customer which filed for bankruptcy, and for which the Company had initially recorded a charge during the second quarter of 2017. During the first quarter of 2019, the Company recorded a recovery of $0.2 million and during the second quarter of 2019, the Company recorded a recovery $1.7 million, related to a bad debt provision for the receivables due from this customer. This matter is considered fully resolved.
5. Inventories
Inventories consist of the following:
| December 31, | |||||||||||
| 2020 | 2019 | ||||||||||
| Raw materials | $ | $ | |||||||||
| Work in progress | |||||||||||
| Finished goods | |||||||||||
| Consumable supplies | |||||||||||
| Inventories | $ | $ | |||||||||
62
6. Property, Plant and Equipment
Property, plant and equipment consist of the following:
| December 31, | |||||||||||||||||
| Useful Life | 2020 | 2019 | |||||||||||||||
| (Years) | |||||||||||||||||
| Land | $ | $ | |||||||||||||||
| Building and improvements | |||||||||||||||||
| Office furniture and equipment | |||||||||||||||||
| Machinery and equipment | |||||||||||||||||
| Accumulated depreciation and amortization | ( | ( | |||||||||||||||
| Property, plant and equipment, net | $ | $ | |||||||||||||||
Depreciation expense was approximately $24.7 million, $24.2 million, and $24.2 million for the years ended December 31, 2020, 2019 and 2018, respectively.
7. Acquisitions and Disposition
Acquisitions
The Company did no t complete any acquisitions during the year ended December 31, 2020.
During September 2019, the Company completed one acquisition that provides pipeline integrity management software and services to energy transportation companies. The Company acquired all the equity interest of the acquiree in exchange for aggregate consideration of $4.4 million in cash, contingent consideration of up to $4.3 million to be earned based upon the acquired business achieving specific performance metrics over the initial three years of operations from the acquisition date and working capital adjustments. The goodwill recorded is primarily attributable to expected synergies and is generally deductible for tax purposes. The Company accounted for this transaction in accordance with the acquisition method of accounting for business combinations.
The following table summarizes the final fair value of the assets acquired and liabilities assumed and the Company's allocation of purchase price:
| 2019 | |||||
| Cash paid | $ | ||||
| Working capital adjustments | $ | ( | |||
| Fair value of contingent consideration | $ | ||||
| Total consideration | $ | ||||
| Current net assets | $ | ||||
| Other assets | $ | ||||
| Property, plant and equipment | $ | ||||
| Intangibles | $ | ||||
| Goodwill | $ | ||||
| Net assets acquired | $ | ||||
The Company accounted for the acquisition completed in 2019 in accordance with the acquisition method of accounting for business combinations. Assets and liabilities of the acquired businesses were included in the consolidated balance sheet based on their respective estimated fair value on the date of acquisition as determined in a purchase price allocation, using available information and making assumptions management believes are reasonable. The amortization periods for the intangible assets acquired range from one year to eighteen years .
63
Disposition
During the third quarter of 2018, substantially all of the assets and liabilities of a subsidiary in the Products and Systems segment were sold for approximately $4.3 million. For the year ended December 31, 2018, the Company recognized a gain of approximately $2.4 million related to the sale, which is reported as a gain on sale of subsidiary on the consolidated statements of income (loss). The sale also included a three-year agreement to purchase products from the buyer, with a cumulative commitment of $2.3 million (see Note 18-Commitments and Contingencies).
Acquisition-Related expense
In the course of its acquisition activities, the Company incurs costs in connection with due diligence, professional fees, and other expenses. Additionally, the Company adjusts the fair value of acquisition-related contingent consideration liabilities on a quarterly basis. These amounts are recorded as acquisition-related expense, net, on the consolidated statements of income and were as follows for the years ended December 31, 2020, 2019 and 2018:
| For the year ended December 31, | |||||||||||||||||
| 2020 | 2019 | 2018 | |||||||||||||||
| Due diligence, professional fees and other transaction costs | $ | $ | $ | ||||||||||||||
| Adjustments to fair value of contingent consideration liabilities | ( | ||||||||||||||||
| Acquisition-related expense, net | $ | $ | $ | ||||||||||||||
The Company’s contingent consideration liabilities are recorded on the consolidated balance sheets in accrued expenses and other current liabilities and Other long-term liabilities.
8. Goodwill
The changes in the carrying amount of goodwill by segment is shown below:
| Services | International | Products and Systems | Total | ||||||||||||||||||||
| Balance at December 31, 2018 | $ | $ | $ | $ | |||||||||||||||||||
| Goodwill acquired during the year | |||||||||||||||||||||||
| Adjustments to preliminary purchase price allocations | ( | ( | |||||||||||||||||||||
| Foreign currency translation | ( | ||||||||||||||||||||||
| Balance at December 31, 2019 | $ | $ | $ | $ | |||||||||||||||||||
| Impairment charges | ( | ( | ( | ||||||||||||||||||||
| Adjustments to preliminary purchase price allocations | |||||||||||||||||||||||
| Foreign currency translation | ( | ||||||||||||||||||||||
| Balance at December 31, 2020 | $ | $ | $ | $ | |||||||||||||||||||
The Company reviews goodwill for impairment on a reporting unit basis on October 1 of each year and whenever events or changes in circumstances indicate the carrying value of goodwill may not be recoverable.
During the first quarter of 2020, the Company’s market capitalization declined significantly compared to the fourth quarter of 2019. Over the same period, the equity value of the Company’s peer group, and the overall U.S. stock market also declined significantly amid market volatility. In addition, oil prices had dropped significantly. These declines were driven in large part by the uncertainty surrounding the COVID-19 pandemic and other macroeconomic events such as the geopolitical tensions between OPEC and Russia. Based on these factors, the Company concluded that multiple triggering events occurred and, accordingly, an interim quantitative goodwill impairment test was performed for each reporting unit as of March 31, 2020. During the first quarter of 2020, the Company also performed an analysis to determine any impairment of long-lived assets (see Note 9-Intangible Assets) based on the triggering events noted above.
In performing the interim quantitative goodwill impairment test and consistent with prior practice, the Company determined the fair value of each of the reporting units using a combination of the income approach and the market approach by assessing each
64
of these valuation methodologies based upon availability and relevance of comparable company data and determining the appropriate weighting.
Under the income approach, the fair value for each of the reporting units was determined based on the present value of estimated future cash flows, discounted at an appropriate risk-adjusted rate. The Company used internal forecasts, updated for recent events, to estimate future cash flows with cash flows beyond the specific operating plans estimated using a terminal value calculation, which incorporates historical and forecasted trends, including an estimate of long-term future growth rates, based on the Company’s most recent views of the long-term outlook for each reporting unit. The internal forecasts include assumptions about future market recovery, including the expected demand for the Company’s goods and services. Due to the inherent uncertainties involved in making estimates and assumptions, actual results may differ from those assumed in the forecasts. The Company derived the discount rates using a capital asset pricing model and analyzing published rates for industries relevant to the reporting units to estimate the cost of equity financing. The Company used discount rates that are commensurate with the risks and uncertainties inherent in the respective businesses and in the internally developed forecasts, updated for recent events.
The market approach valuations were derived from metrics of publicly traded companies or historically completed transactions of comparable businesses. The selection of comparable businesses was based on the markets in which the reporting units operate considering risk profiles, size, geography, and diversity of products and services.
Based upon the results of the interim quantitative goodwill impairment test during the first quarter of 2020, the Company recorded an aggregate impairment charge of $77.1 million, which included $57.2 million in the services reporting unit within the Services segment, and $19.3 million in the European reporting unit and $0.6 million in the Brazilian reporting unit, both within the International segment. The impairment was calculated based on the difference between the estimated fair value and the carrying value of the reporting units and are included in Impairment charges on the Consolidated Statements of Income (Loss) for the year ended December 31, 2020.
The Company's cumulative goodwill impairment as of December 31, 2020 was $100.2 million, of which $57.2 million related to the Services segment, $29.8 million related to the International segment and $13.2 million related to the Products and Systems segment. The Company's cumulative goodwill impairment as of December 31, 2019 was $23.1 million, of which $13.2 million related to the Products and Systems segment and $9.9 million related to the International segment.
The Company elected to perform a qualitative assessment of goodwill on October 1, 2020. The Company's qualitative assessment considered relevant events and circumstances occurring since the interim quantitative goodwill impairment test performed as of March 31, 2020 (see previous paragraphs). Specifically, the Company considered changes in macroeconomic conditions, industry and market conditions, internal forecasts of future revenue and expenses, the Company's stock price, any significant events affecting the Company and actual changes in the carrying values of its net assets. After considering all positive and negative evidence for the assessment as of October 1, 2020, the Company concluded that it was not more likely than not that the carrying values of each reporting unit exceeded their respective fair values and as such, no additional impairment was indicated. Subsequent to October 1, 2020 through December 31, 2020, the Company did not identify any changes in circumstances that would indicate the carrying value of goodwill may not be recoverable. Significant adverse changes in future periods could negatively affect the Company's key assumptions and may result in future goodwill impairment charges which could be material.
65
9. Intangible Assets
The gross carrying amount and accumulated amortization of intangible assets were as follows:
| December 31, | |||||||||||||||||||||||||||||||||||||||||||||||
| 2020 | 2019 | ||||||||||||||||||||||||||||||||||||||||||||||
Useful Life (Years) | Gross Amount | Accumulated Amortization | Impairment | Net Carrying Amount | Gross Amount | Accumulated Amortization | Net Carrying Amount | ||||||||||||||||||||||||||||||||||||||||
| Customer relationships | $ | $ | ( | $ | ( | $ | $ | $ | ( | $ | |||||||||||||||||||||||||||||||||||||
| Software/Technology | ( | ( | ( | ||||||||||||||||||||||||||||||||||||||||||||
| Covenants not to compete | ( | ( | ( | ||||||||||||||||||||||||||||||||||||||||||||
| Other | ( | ( | ( | ||||||||||||||||||||||||||||||||||||||||||||
| Total | $ | $ | ( | $ | ( | $ | $ | $ | ( | $ | |||||||||||||||||||||||||||||||||||||
As described in Note 8- Goodwill, during the first quarter of 2020, there were negative market indicators that were determined to be triggering events indicating a potential impairment of certain long-lived assets within asset groups in the Services, International, Products and Corporate segments. The asset groups are groupings of assets and liabilities determined at the lowest level for which identifiable cash flows are largely independent of the cash flows of other assets and liabilities. Recoverability testing indicated that certain intangible assets and right of use assets (See Note 17-Leases) were potentially impaired. For asset groups that required an impairment measurement, similar to the valuations performed to determine the goodwill impairment, the Company used income and market approaches to estimate the fair value of the long-lived assets, which requires significant judgment in evaluation of the useful lives of the assets, economic and industry trends, estimated future cash flows, discount rates, and other factors. The result of the analysis was an aggregate impairment charge of $28.8 million, which included $25.9 million to software/technology, $2.2 million to customer relationships, $0.5 million to other intangibles and $0.2 million to covenants not to compete, all of which are in the Services reporting unit within the Services segment and are included in Impairment charges on the consolidated statements of income (loss) for the year ended December 31, 2020.
Amortization expense for the years ended December 31, 2020, 2019 and 2018, was approximately $11.0 million, $14.3 million, and $10.2 million, respectively, including amortization of software/technology for these periods of $3.6 million, $5.6 million, and $1.4 million, respectively.
Amortization expense in each of the five years and thereafter subsequent to December 31, 2020 related to the Company’s intangible assets is expected to be as follows:
Expected Amortization Expense | |||||
| 2021 | $ | ||||
| 2022 | |||||
| 2023 | |||||
| 2024 | |||||
| 2025 | |||||
| Thereafter | |||||
| Total | $ | ||||
66
10. Accrued Expenses and Other Current Liabilities
Accrued expenses and other current liabilities consist of the following:
| December 31, | |||||||||||
| 2020 | 2019 | ||||||||||
| Accrued salaries, wages and related employee benefits | $ | $ | |||||||||
| Contingent consideration | |||||||||||
| Accrued workers' compensation and health benefits | |||||||||||
| Deferred revenues | |||||||||||
| Right-of-use liability - Operating | |||||||||||
| Pension accrual | |||||||||||
| Other accrued expenses | |||||||||||
| Total accrued expenses and other current liabilities | $ | $ | |||||||||
11. Long-Term Debt
Long-term debt consists of the following:
| December 31, | |||||||||||
| 2020 | 2019 | ||||||||||
| Senior credit facility | $ | $ | |||||||||
Senior secured term loan, net of unamortized debt issuance costs of $ | |||||||||||
| Other | |||||||||||
| Total debt | |||||||||||
| Less: Current portion | ( | ( | |||||||||
| Long-term debt, net of current portion | $ | $ | |||||||||
Senior Credit Facility
The Company has a credit agreement with its banking group (“Credit Agreement”) which provides the Company with a revolving line of credit and a $100 million senior secured term loan A facility. Pursuant to the Amendment described below, the revolving line of credit was reduced from $300 million to $175 million. Both the revolving line of credit and the term loan A facility under the Credit Agreement have a maturity date of December 12, 2023.
On May 15, 2020, the Company entered into the Third Amendment (the “Amendment”) to the Credit Agreement. The amendment was needed because the Company determined that as a result of the uncertain impact of the COVID-19 pandemic and the significant drop in oil prices, it would not meet the then existing financial covenants in the Credit Agreement for upcoming quarters. Accordingly, the Amendment modified the financial covenants to provide for: i) elimination of the Funded Debt Leverage Ratio (as defined in the Credit Agreement) for the quarters ended June 30 and September 30, 2020 and increased the Funded Debt Leverage ratio to no greater than 5.25 to 1 beginning for the quarter ending December 31, 2020 and decreasing each successive quarter to no greater than 3.50 to 1 for the quarter ended September 30, 2021, and all quarterly periods thereafter; ii) an elimination of the minimum Fixed Charge Coverage Ratio (as defined in the Credit Agreement for the quarters ended June 30, September 30 and December 31, 2020), a decrease to 1.0 to 1 for the quarter ending March 31, 2021 and returning to 1.25 to 1 for the quarter ending June 30, 2021 and thereafter; iii) the addition of a minimum EBITDA covenant requiring $3.44 million for the three months ending June 30, 2020, $24.25 million for the six months ending September 30, 2020, and $38.55 million for the nine months ending December 31, 2020, with no requirement thereafter; and iv) the addition of a minimum Liquidity (as defined in the Amendment) covenant of not less than $20.0 million at all times through September 30, 2020 and ceasing thereafter. In addition, the Amendment set a LIBOR floor of 1.0 % applicable to all LIBOR loans, and increased the LIBOR margin range to 1.50 % to 4.15 %, in addition to certain other modifications of the Credit Agreement. The Amendment also requires that the Company promptly prepay the outstanding amount under the revolving credit facility in an amount equal to the difference between (a) the aggregate sum of cash and cash equivalents of the Company and its subsidiaries held in the United States minus (b) $10.0 million if, for a period of two (2 ) consecutive business days, (i) the outstanding amount under the revolving credit facility exceeds $75.0 million and (ii) the sum of such cash and cash equivalents exceeds $10.0 million.
67
The Credit Agreement, as amended, provides that the Company may not make any acquisitions prior to June 30, 2021, and thereafter only if the Company's Funded Debt Leverage Ratio is less than 2.50 to 1, and after giving effect to such acquisition, its pro forma Funded Debt Leverage Ratio will not be greater than 3.25 to 1. The Credit Agreement also limits the Company’s ability to, among other things, create liens, make investments, incur more indebtedness, merge or consolidate, make dispositions of property, pay dividends and make distributions to stockholders or repurchase its stock, enter into a new line of business, enter into transactions with affiliates and enter into burdensome agreements.
The Company may borrow up to $100 million in non-U.S. Dollar currencies and use up to $20 million of the credit limit for the issuance of letters of credit.
As of December 31, 2020, the Company had borrowings of $210.1 million and a total of $4.3 million of letters of credit outstanding under the Credit Agreement. The Company has capitalized costs associated with debt modifications of $1.1 million as of December 31, 2020, which is included in Other Assets on the consolidated balance sheet. The Amendment reduced the Company's total available loan capacity, amongst other things, and as a result, the Company expensed approximately $0.6 million in capitalized debt issuance costs during the second quarter of 2020, which is included in Selling, general and administrative expenses on the consolidated statements of income (loss).
As of December 31, 2020, the Company was in compliance with the terms of the Credit Agreement, as amended, and will continuously monitor its compliance with the covenants contained in its Credit Agreement. The Company believes that it is probable, based on the amended covenants, that the Company will be able to comply with the financial covenants in the Credit Agreement as modified by the Amendment and that sufficient credit remains available under the Credit Agreement to meet the Company's liquidity needs. However, due to the uncertainties being caused by the COVID-19 pandemic, the significant volatility in oil prices, and volatility in the aerospace production, such matters cannot be predicted with certainty.
Other Debt
The Company's other debt includes local bank financing provided at the local subsidiary levels used to support working capital requirements and fund capital expenditures. At December 31, 2020, there was approximately $10.2 million outstanding, payable at various times through 2030. Monthly payments range from $1 thousand to $18 thousand. Interest rates range from 0.4 % to 3.5 %.
Scheduled principal payments due under all borrowing agreements in each of the five years and thereafter subsequent to December 31, 2020 are as follows:
| 2021 | $ | ||||
| 2022 | |||||
| 2023 | |||||
| 2024 | |||||
| 2025 | |||||
| Thereafter | |||||
| Total | $ | ||||
12. Fair Value Measurements
The Company performs fair value measurements in accordance with the guidance provided by ASC 820, Fair Value Measurements and Disclosures. ASC 820 defines fair value as the price that would be received to sell an asset or paid to transfer a liability in an orderly transaction between market participants at the measurement date. It also establishes a three level hierarchy that prioritizes the inputs used to measure fair value. The three levels of the hierarchy are defined as follows:
Level 1 — Inputs are unadjusted quoted prices in active markets for identical assets or liabilities that the Company has the ability to access at the measurement date.
Level 2 — Observable inputs other than quoted prices included in Level 1, including quoted prices for similar assets or liabilities in active markets, quoted prices for identical assets or liabilities in inactive markets, inputs other than quoted prices that are observable for the asset or liability and inputs derived principally from or corroborated by observable market data.
68
Level 3 — Unobservable inputs reflecting the Company’s own assumptions about inputs that market participants would use in pricing the asset or liability based on the best information available.
Financial instruments measured at fair value on a recurring basis
The fair value of contingent consideration liabilities was estimated using a discounted cash flow technique with significant inputs that are not observable in the market and thus represents a Level 3 fair value measurement as defined in ASC 820. The significant inputs in the Level 3 measurement not supported by market activity include the probability assessments of expected future cash flows related to the acquisitions, appropriately discounted considering the uncertainties associated with the obligation, and as calculated in accordance with the terms of the applicable acquisition agreements.
The following table represents the changes in the fair value of Level 3 contingent consideration:
| December 31, | ||||||||||||||
| 2020 | 2019 | |||||||||||||
| Balance at the beginning of the period: | $ | $ | ||||||||||||
| Acquisitions | ||||||||||||||
| Payments | ( | ( | ||||||||||||
| Accretion of liability | ||||||||||||||
| Revaluation | ||||||||||||||
| Foreign currency translation | ( | |||||||||||||
| Balance at the end of the period: | $ | $ | ||||||||||||
Financial instruments not measured at fair value on a recurring basis
The Company has evaluated current market conditions and borrower credit quality and has determined that the carrying value of its long-term debt approximates fair value. The fair value of the Company’s notes payable and finance and operating lease obligations approximates their carrying amounts based on anticipated interest rates which management believes would currently be available to the Company for similar issuances of debt.
13. Share-Based Compensation
The Company has share-based incentive awards outstanding to its eligible employees and directors under two employee stock ownership plans: (i) the 2009 Long-Term Incentive Plan (the "2009 Plan") and (ii) the 2016 Long-Term Incentive Plan (the "2016 Plan"). No further awards may be granted under the 2009 Plan, although awards granted under the 2009 Plan remain outstanding in accordance with their terms. Awards granted under the 2016 Plan may be in the form of stock options, restricted stock units and other forms of share-based incentives, including performance restricted stock units, stock appreciation rights and deferred stock rights. At the annual shareholders meeting on May 19, 2020, the Company’s shareholders approved an amendment to increase the total number of shares that may be issued under the 2016 Plan by 2,000,000 , for a total of 3,700,000 shares that may be issued under the 2016 Plan, of which 1,787,000 shares were available for future grants as of December 31, 2020. As of December 31, 2020, there was an aggregate of approximately 5,000 stock options outstanding under the 2009 Plan.
69
Stock Options
For the years ended December 31, 2020, 2019 and 2018, the Company did no No no unrecognized compensation costs remained related to stock option awards. Cash proceeds from, and the intrinsic value of, stock options exercised during the years ended December 31, 2020, 2019 and 2018 were as follows (in thousands):
| For the year ended December 31, | |||||||||||||||||
| 2020 | 2019 1 | 2018 | |||||||||||||||
| Cash proceeds from options exercised | $ | $ | $ | ||||||||||||||
| Aggregate intrinsic value of options exercised | $ | $ | $ | ||||||||||||||
____________________
A summary of the stock option activity, weighted average exercise prices, and options outstanding and exercisable as of December 31, 2020, 2019 and 2018 is as follows (in thousands, except per share amounts and years):
| For the years ended December 31, | |||||||||||||||||||||||||||||||||||
| 2020 | 2019 | 2018 | |||||||||||||||||||||||||||||||||
| Common Stock Options | Weighted Average Exercise Price | Common Stock Options | Weighted Average Exercise Price | Common Stock Options | Weighted Average Exercise Price | ||||||||||||||||||||||||||||||
| Outstanding at beginning of year: | $ | $ | $ | ||||||||||||||||||||||||||||||||
| Granted | $ | $ | $ | ||||||||||||||||||||||||||||||||
| Exercised | $ | ( | $ | ( | $ | ||||||||||||||||||||||||||||||
| Expired or forfeited | $ | ( | $ | $ | |||||||||||||||||||||||||||||||
| Outstanding at end of year: | $ | $ | $ | ||||||||||||||||||||||||||||||||
| December 31, 2020 | ||||||||||||||||||||||||||||||||
| Options Outstanding | Options Exercisable | |||||||||||||||||||||||||||||||
| Exercise Price | Total Options Outstanding | Weighted Average Remaining Life (Years) | Weighted Average Exercise Price | Number Exercisable | Weighted Average Exercise Price | |||||||||||||||||||||||||||
| $ | $ | |||||||||||||||||||||||||||||||
| Aggregate Intrinsic Value | $ | $ | ||||||||||||||||||||||||||||||
Restricted Stock Unit Awards
Restricted Stock Units generally vest ratably on each of the first four anniversary dates of issuance. The Company recognized approximately $4.4 million, $4.0 million and $4.2 million of share-based compensation for the years ended December 31, 2020, 2019 and 2018, respectively, related to restricted stock unit awards. As of December 31, 2020, there were approximately $4.9 million of unrecognized compensation costs, net of estimated forfeitures, related to restricted stock unit awards, which are expected to be recognized over a remaining weighted average period of 2.3 years. Upon vesting, restricted stock units are generally net share-settled to cover the required minimum withholding tax and the remaining amount is converted into an equivalent number of shares of common stock.
70
A summary of the vesting activity of restricted stock unit awards, with the respective fair value of the awards, is as follows: (in thousands):
| For the year ended December 31, | |||||||||||||||||
| 2020 | 2019 | 2018 | |||||||||||||||
| Restricted stock awards vested | |||||||||||||||||
| Fair value of awards vested | $ | $ | $ | ||||||||||||||
A summary of the fully-vested common stock the Company issued to its six non-employee directors, in connection with its non-employee director compensation plan, is as follows (in thousands):
| For the year ended December 31, | |||||||||||||||||
| 2020 | 2019 | 2018 | |||||||||||||||
| Awards issued | |||||||||||||||||
| Grant date fair value of awards issued | $ | $ | $ | ||||||||||||||
A summary of the Company's outstanding, non-vested restricted share units is presented below (in thousands, except per share amounts):
| For the year ended December 31, | |||||||||||||||||||||||||||||||||||
| 2020 | 2019 | 2018 | |||||||||||||||||||||||||||||||||
| Units | Weighted Average Grant-Date Fair Value | Units | Weighted Average Grant-Date Fair Value | Units | Weighted Average Grant-Date Fair Value | ||||||||||||||||||||||||||||||
| Outstanding at beginning of period: | $ | $ | $ | ||||||||||||||||||||||||||||||||
| Granted | $ | $ | $ | ||||||||||||||||||||||||||||||||
| Released | ( | $ | ( | $ | ( | $ | |||||||||||||||||||||||||||||
| Forfeited | ( | $ | ( | $ | ( | $ | |||||||||||||||||||||||||||||
| Outstanding at end of period: | $ | $ | $ | ||||||||||||||||||||||||||||||||
Performance Restricted Stock Units
The Company maintains Performance Restricted Stock Units (PRSUs) that have been granted to select executives and senior officers whose ultimate payout is based on the Company’s performance over a one-year period based on specific metrics approved by the Compensation Committee of the Board of Directors of the Company. The PRSU awards granted in 2019 included three performance metrics, as defined: (1) Operating Income, (2) Adjusted EBITDAS (defined as net income attributable to MISTRAS Group, Inc. plus: interest expense, provision for income taxes, depreciation and amortization, share-based compensation expense and certain acquisition related costs (including transaction due diligence costs and adjustments to the fair value of contingent consideration), foreign exchange (gain) loss and, if applicable, certain special items which are noted) and (3) Revenue. There also is a discretionary portion of the 2019 PRSUs based on individual performance, granted at the discretion of the Compensation Committee (Discretionary PRSUs). PRSUs and Discretionary PRSUs generally vest ratably on each of the first four anniversary dates upon completion of the performance period, for a total requisite service period of up to five years and have no dividend rights.
For 2020 awards, the Compensation Committee changed the criteria for the PRSUs to four metrics, with no discretionary portion. Revenue and Adjusted EBITDAS were retained, and two additional metrics, free cash flow as a percentage of revenue and return on average book equity, replaced Operating Income. These two newly-added metrics are relative metrics, the performance of which are based upon how the Company performs relative to a peer group.
PRSUs are equity-classified and compensation costs are initially measured using the fair value of the underlying stock at the date of grant, assuming that the target performance conditions will be achieved. Compensation costs related to the PRSUs are subsequently adjusted for changes in the expected outcomes of the performance conditions.
71
Discretionary PRSUs are liability-classified and adjusted to fair value (with a corresponding adjustment to compensation expense) based upon the targeted number of shares to be awarded and the fair value of the underlying stock each reporting period until approved by the Compensation Committee, at which point they are equity-classified.
A summary of the Company's PRSU activity is presented below (in thousands, except per share amounts):
| For the year ended December 31, | |||||||||||||||||||||||||||||||||||
| 2020 | 2019 | 2018 | |||||||||||||||||||||||||||||||||
| Units | Weighted Average Grant-Date Fair Value | Units | Weighted Average Grant-Date Fair Value | Units | Weighted Average Grant-Date Fair Value | ||||||||||||||||||||||||||||||
| Outstanding at beginning of period: | $ | $ | $ | ||||||||||||||||||||||||||||||||
| Granted | $ | $ | $ | ||||||||||||||||||||||||||||||||
| Performance condition adjustments, net | ( | $ | ( | $ | ( | $ | |||||||||||||||||||||||||||||
| Released | ( | $ | ( | $ | ( | $ | |||||||||||||||||||||||||||||
| Forfeited | $ | $ | ( | $ | |||||||||||||||||||||||||||||||
| Outstanding at end of period: | $ | $ | $ | ||||||||||||||||||||||||||||||||
For the year ended December 31, 2020, 292,000 PRSUs were granted. There was a 99,000 net unit reduction to these awards, which represents Company performance against target (including an increase of 1,000 units due to the Compensation Committee approving the final calculation of the award metrics for calendar year 2019), during the year ended December 31, 2020.
For the year ended December 31, 2019, 190,000 PRSUs were granted. There was a 103,000 unit reduction to these awards, which represents Company performance below target, during the year ended December 31, 2019. As of December 31, 2019, the aggregate liability related to 29,000 outstanding discretionary PRSUs was less than $0.1 million and is classified within Accrued expenses and other liabilities on the consolidated balance sheet.
For the year ended December 31, 2018, 129,000 PRSUs were granted. There was a 54,000 unit reduction to these awards, which represents Company performance below target, during the year ended December 31, 2018. As of December 31, 2018, the aggregate liability related to 22,000 outstanding discretionary PRSUs was less than $0.1 million and is classified within Accrued expenses and other liabilities on the consolidated balance sheet. The Compensation Committee approved these PRSUs during the first quarter of 2019, which further reduced these awards by 3,000 units. The discretionary portion of these awards were reclassified from a liability to equity on the consolidated balance sheet upon Compensation Committee approval.
Compensation expense related to all PRSUs described above was $1.2 million, $1.3 million, and $1.5 million for the years ended December 31, 2020, 2019 and 2018, respectively. At December 31, 2020, there was $1.1 million of total unrecognized compensation costs related to approximately 333,000 unvested performance restricted stock units. These costs are expected to be recognized over a weighted-average period of approximately 1.8 years.
14. Income Taxes
Income (loss) before provision for income taxes is as follows:
| For the year ended December 31, | |||||||||||||||||
| 2020 | 2019 | 2018 | |||||||||||||||
| Income (loss) before provision for income taxes from: | |||||||||||||||||
| U.S. operations | $ | ( | $ | $ | |||||||||||||
| Foreign operations | ( | ||||||||||||||||
| Income (loss) before income taxes | $ | ( | $ | $ | |||||||||||||
72
The provision for income taxes consists of the following:
| For the year ended December 31, | |||||||||||||||||
| 2020 | 2019 | 2018 | |||||||||||||||
| Current | |||||||||||||||||
| Federal | $ | ( | $ | $ | |||||||||||||
| States and local | |||||||||||||||||
| Foreign | |||||||||||||||||
| Reserve for uncertain tax positions | ( | ||||||||||||||||
| Total current provision (benefit) | ( | ||||||||||||||||
| Deferred | |||||||||||||||||
| Federal | ( | ||||||||||||||||
| States and local | ( | ( | |||||||||||||||
| Foreign | ( | ( | ( | ||||||||||||||
| Total deferred provision (benefit) | ( | ( | |||||||||||||||
| Net change in valuation allowance | |||||||||||||||||
| Net deferred provision (benefit) | ( | ( | |||||||||||||||
| Total provision (benefit) for income taxes | $ | ( | $ | $ | |||||||||||||
The provision (benefit) for income taxes differs from the amount computed by applying the statutory federal tax rate to income tax as follows:
| For the years ended December 31, | |||||||||||||||||||||||||||||||||||
| 2020 | 2019 | 2018 | |||||||||||||||||||||||||||||||||
| Federal tax at statutory rate | $ | ( | % | $ | % | $ | % | ||||||||||||||||||||||||||||
| State taxes, net of federal benefit | ( | % | % | % | |||||||||||||||||||||||||||||||
| Foreign tax | ( | % | % | % | |||||||||||||||||||||||||||||||
| Goodwill impairment | ( | % | % | % | |||||||||||||||||||||||||||||||
| Nondeductible compensation | ( | % | % | % | |||||||||||||||||||||||||||||||
| US taxation of foreign earnings | % | % | % | ||||||||||||||||||||||||||||||||
| Permanent differences | ( | % | % | % | |||||||||||||||||||||||||||||||
| Transition tax, net of foreign tax credits | % | % | % | ||||||||||||||||||||||||||||||||
| Federal loss carryback | ( | % | % | % | |||||||||||||||||||||||||||||||
| Change in valuation allowance | ( | % | % | % | |||||||||||||||||||||||||||||||
| Impact of foreign tax rate changes | ( | % | ( | ( | % | % | |||||||||||||||||||||||||||||
| Other | ( | % | % | % | |||||||||||||||||||||||||||||||
| Total provision (benefit) for income taxes | $ | ( | % | $ | % | $ | % | ||||||||||||||||||||||||||||
The permanent differences identified above include normal recurring differences, such as meals, entertainment and parking fringe benefits as well as a portion of the goodwill impairment charge.
On December 22, 2017, the United States enacted fundamental changes to the federal tax law following the passage of the Tax Cuts and Jobs Act (the "Tax Act").
The Tax Act is complex and significantly changes the U.S. corporate tax system by, among other things, (a) reducing the federal corporate tax rate from 35% to 21% for tax years beginning after December 31, 2017, (b) replacing the prior system of taxing corporations on foreign earnings of their foreign subsidiaries when the earnings are repatriated with a partial territorial tax system that provides a 100% dividends-received deduction (DRD) to domestic corporations for foreign-sourced dividends received from 10%-or-more owned foreign corporations, (c) subjecting certain unrepatriated foreign earnings to a mandatory
73
one-time transition tax on post-1986 earnings and profits ("the transition tax"), and (d) further limiting a public entity's ability to deduct compensation in excess of $1 million for covered employees.
During the year ended December 31, 2018, the Company completed its accounting for the effects of the Tax Act on the period ended December 31, 2017, which resulted in income tax expense of $1.7 million. This consisted primarily of $0.1 million of an increase in the Company's net deferred tax liabilities due to the reduction in the federal corporate rate from 35% to 21%, an increase of $1.3 million in tax expense attributable to the transition tax and a decrease in deferred tax assets of $0.4 million due to changes made to executive compensation.
On June 28, 2019, the Canadian province of Alberta enacted the Job Creation Tax Cut which reduced the Alberta corporate income tax rate from 12% to 11% starting in 2019 with further annual reductions to 10% in 2020, 9% in 2021, and 8% in 2022. This rate reduction had a favorable impact of approximately $1.9 million on the Company’s net deferred tax liabilities in this jurisdiction in 2019. As part of Alberta’s Recovery plan associated with the COVID-19 pandemic, Alberta accelerated the decrease in income tax rates from 10% in 2020 to 8% effective July 1, 2020. The accelerated tax rate reduction did not have a material impact on the Company’s net deferred tax liabilities but did reduce current taxes.
On March 27, 2020, the United States enacted the Coronavirus Aid, Relief, and Economic Security Act (CARES Act). The CARES Act is an approximately $2 trillion emergency economic stimulus package in response to the Coronavirus outbreak, which among other things contains numerous income tax provisions. Some of these tax provisions are effective retroactively for years ending before the date of enactment. The CARES Act provides a five-year carryback of net operating losses generated in years 2018 through 2020. As the statutory federal income tax rate applicable to certain years within the carryback period is 35%, carryback to those years of our estimated 2020 annual federal tax loss provides a tax benefit in excess of the current federal statutory rate of 21%, resulting in an increased income tax benefit of $1.9 million. The Company expects that the income tax effects of the CARES Act will result in a cash refund of approximately $4.8 million in 2021 of taxes paid in prior years.
On December 27, 2020, the United States enacted the Consolidated Appropriations Act, 2021, (the "Appropriations Act") an additional stimulus package providing financial relief for individuals and small business. The Appropriations Act contains a variety of tax provisions, including full expensing of business meals in 2021 and 2022, and expansion of the employee retention tax credit. The Company does not currently expect the Appropriations Act to have a material impact on our consolidated financial position, results of operations, and cash flows.
In response to the COVID-19 pandemic, the American Rescue Plan Act was signed into law on March 11, 2021. This act, among other things, provides economic relief provisions to individuals and funding to certain businesses and programs. The Company is currently evaluating the impact of this guidance on its consolidated financial position, results of operations, and cash flows, but does not expect it to have a material impact.
74
Deferred income tax attributes resulting from differences between financial accounting amounts and income tax basis of assets and liabilities are as follows:
| December 31, | |||||||||||
| 2020 | 2019 | ||||||||||
| Deferred income tax assets | |||||||||||
| Allowance for doubtful accounts | $ | $ | |||||||||
| Inventory | |||||||||||
| Intangible assets | |||||||||||
| Accrued expenses | |||||||||||
| Net operating loss carryforward | |||||||||||
| Finance lease obligations | |||||||||||
| Capital losses | |||||||||||
| Deferred stock based compensation | |||||||||||
| Interest carryforward | |||||||||||
| Right-of-use liability | |||||||||||
| Credits | |||||||||||
| Other | |||||||||||
| Deferred income tax assets | |||||||||||
| Valuation allowance | ( | ( | |||||||||
| Net deferred income tax assets | |||||||||||
| Deferred income tax liabilities | |||||||||||
| Property and equipment | ( | ( | |||||||||
| Goodwill | ( | ( | |||||||||
| Intangible assets | ( | ( | |||||||||
| Right-of-use asset | ( | ( | |||||||||
| Other | ( | ( | |||||||||
| Deferred income tax liabilities | ( | ( | |||||||||
| Net deferred income taxes | ( | ( | |||||||||
As of December 31, 2020, the Company had federal net operating loss carry forwards (NOLs) of approximately $0.1 million expiring in 2032 which may be used subject to limitation under Internal Revenue Code section 382. In addition, as of December 31, 2020, the Company had state and foreign NOLs of $14.8 million and $11.7 million, respectively. Approximately $8.9 million of the state NOLs expire at various times from 2031 to 2040, while the remainder of the Company's state NOLs do not expire. Approximately $0.1 million of the foreign NOLs expire at various times from 2023 to 2040, while the remainder of the Company's foreign NOLs do not expire.
In assessing the ability to realize deferred tax assets, management considers whether it is more likely than not that some portion or all of the deferred tax assets will be realized. Valuation allowances are provided when management believes the Company's deferred tax assets are not recoverable based on future reversals of existing taxable temporary differences, taxable income in prior carryback year(s) if carryback is permitted under the tax law, and an assessment of estimated future taxable income, exclusive of reversing temporary differences and carryforwards, that incorporates ongoing, prudent and feasible tax planning strategies. At December 31, 2020 and December 31, 2019, the Company has a valuation allowance of approximately $4.5 million and $4.1 million, respectively, primarily against certain state and foreign NOLs and other specific deferred tax assets. The valuation allowance as of December 31, 2019, also applied against capital losses generated by the disposals of certain foreign subsidiaries. These losses expired in 2020, so no valuation allowance remains as of December 31, 2020. The net increase in the valuation allowance of approximately $0.5 million is primarily attributable to state and foreign net operating losses and changes in foreign exchange rates, offset by a reduction of expiring losses. Except for those deferred tax assets subject to the valuation allowance, management believes that it will realize all deferred tax assets as a result of sufficient future taxable income in each tax jurisdiction in which the Company has deferred tax assets.
75
The following table summarizes the changes in the Company’s gross unrecognized tax benefits, excluding interest and penalties:
| For the year ended December 31, | |||||||||||
| 2020 | 2019 | ||||||||||
| Balance at beginning of period | $ | $ | |||||||||
| Additions for tax positions related to the current fiscal period | |||||||||||
| Additions for tax positions related to prior years | |||||||||||
| Decreases for tax positions related to prior years | |||||||||||
| Current year acquisitions | |||||||||||
| Impact of foreign exchange fluctuation | ( | ||||||||||
| Settlements | ( | ||||||||||
| Reductions related to the expiration of statutes of limitations | ( | ( | |||||||||
| Balance at end of period | $ | $ | |||||||||
The Company has recorded the unrecognized tax benefits in other long-term liabilities in the consolidated balance sheets. As of December 31, 2020 and December 31, 2019, there were approximately $0.3 million and $0.4 million of unrecognized tax benefits, respectively, including penalties and interest. If the Company recognized these unrecognized tax benefits, approximately $0.2 0.2 million excluding interest and penalties within the next 12 months.
The Company is subject to taxation in the United States and various states and foreign jurisdictions. The Company is no longer subject to U.S. federal income tax examinations for years ending before December 31, 2017 and generally is no longer subject to state, local or foreign income tax examinations by tax authorities for years ending before December 31, 2016.
Net income (loss) of foreign subsidiaries was $(55.7 ) million, $2.5 million, and $2.0 million for the years ended December 31, 2020, 2019 and 2018, respectively. Generally, it has been the Company's practice and intention to reinvest the earnings of its non-U.S. subsidiaries in those operations. As previously noted, the Tax Act made significant changes to the taxation of undistributed earnings, requiring that all previously untaxed earnings and profits of the Company's controlled foreign operations be subjected to the transition tax. Since these earnings have now been subjected to U.S. federal tax, they would only be potentially subject to limited other taxes, including foreign withholding and certain state taxes. As of December 31, 2020, the Company has no t recognized a deferred tax liability for foreign withholdings and state taxes on its undistributed international earnings or losses of its foreign subsidiaries since it intends to indefinitely reinvest the earnings outside the United States. The Company has estimated that the amount of the unrecorded deferred tax liability related to undistributed international earnings is approximately $1.8 million.
15. Employee Benefit Plans
The Company provides a 401(k) savings plan for eligible U.S. based employees. Employee contributions are discretionary up to the IRS limits each year and catch up contributions are allowed for employees 50 years of age or older. Under the 401(k) plan, employees become eligible to participate on the first day of the month after three months of continuous service. Under this plan, the Company matches 50 % of the employee’s contributions up to 6 % of the employee’s annual compensation, as defined by the plan. There is a five-year vesting schedule for the Company match.
To respond to the economic downturn resulting from the COVID-19 pandemic, significant volatility in oil prices and decreased traffic in the aerospace industry, the Company temporarily suspended its 401(k) match effective with the second quarter of 2020. The Company’s contribution to the plan was $1.1 million, $4.1 million, and $3.9 million for the years ended December 31, 2020, 2019 and 2018, respectively.
76
The Company's subsidiary participated with other employers in contributing to the Boilermaker-Blacksmith National Pension Trust (EIN 48-6168020) (“Boilermakers”) and Plumbers and Pipefitters National Pension Fund (EIN 52-6152779) (“Pipefitters”), multi-employer defined benefit pension plans, which covers certain U.S. based union employees. The plans provide multiple plan benefits with corresponding contribution rates that are collectively bargained between participating employers and their affiliated Boilermakers and Pipefitters local unions. Both the Boilermakers and Pipefitters plans are between 66 percent and 75 percent funded as of the latest Form 5500 filed. The Company did no 0.6 million for the year ended December 31, 2018. See Note 18-Commitments and Contingencies, Pension Related Contingencies, for additional detail.
The Company has other benefit plans covering certain employees throughout the Company. Amounts charged to expense under these plans were not significant in any year.
16. Related Party Transactions
The Company leases its headquarters under an operating lease from a shareholder and officer of the Company. On August 1, 2014, the Company extended its lease at its headquarters requiring monthly payments through October 2024. Total rent payments made during the year ended December 31, 2020 were approximately $0.7 million. See 17-Leases for further detail.
17. Leases
The Company leases certain office and operating facilities, machinery, equipment, and vehicles. Concurrent with the adoption of ASC 842, the Company recognized a right-of-use (ROU) asset and lease liability based on the present value of the future lease payments over the lease term for each lease agreement. The Company has elected not to recognize a ROU asset and lease liability for leases with terms of 12 months or less and will continue to recognize lease expense for these leases on a straight-line basis over the lease term. The Company has leases with both lease components and non-lease components, such as common area maintenance, utilities, or other repairs and maintenance. For all asset classes, the Company decided to utilize the practical expedient to include both fixed lease components and fixed non-lease components in calculating the ROU asset and lease liability. The Company identified variable lease payments, such as maintenance payments based on actual activities performed or costs incurred, at lease commencement by assessing the nature of the payment provisions, including whether the payments are subject to a minimum charge. Many of the Company's leases include one or more options to renew. When it is reasonably certain that the Company will exercise the option, the Company will include the impact of the option in the lease term for purposes of determining future lease payments. As the Company is unable to determine the discount rate implicit in its lease agreements, the Company uses its incremental borrowing rate on the commencement date to calculate the present value of future payments.
The Company’s Consolidated Balance Sheets include the following related to operating leases as of December 31, 2020 and 2019:
| Leases | Classification | 2020 | 2019 | |||||||||||||||||
| Assets: | ||||||||||||||||||||
| ROU assets | Other Assets | $ | $ | |||||||||||||||||
| Liabilities: | ||||||||||||||||||||
| ROU liability - current | Accrued and other current liabilities | $ | $ | |||||||||||||||||
| ROU liability - long-term | Other liabilities | |||||||||||||||||||
| Total ROU liabilities | $ | $ | ||||||||||||||||||
Included within the balance of operating leases is a lease for the Company’s headquarters which is with a related party. The ROU liability for this facility is approximately $3.8 million as of December 31, 2020 and $4.5 million as of December 31,
77
2019. Total rent payments for this facility were approximately $0.7 million and $1.0 million during the years ended December 31, 2020 and 2019. An agreement was reached with the related party to reduce rental payments by 20 % and defer payments for 90 days for the lease of the Company’s headquarters, starting in June 2020 through December 2020 as part of COVID-19 related lease concessions.
As of December 31, 2020 and 2019, the total ROU assets attributable to finance leases are approximately $15.8 million and $19.2 million, respectively, which is included in Property, plant, and equipment, net on the Consolidated Balance Sheets.
As described in Note 9-Intangible Assets, the Company performed an analysis to determine whether there was any impairment of long-lived assets, which included the ROU assets, within the Services, International, and Products and Systems operating segments as well as Corporate. The result of the analysis was a $0.2 million impairment of a ROU asset in an asset group within the Services segment which is included in Impairment charges on the consolidated statements of income (loss) for the year ended December 31, 2020.
The components of lease costs for the year ended December 31, 2020 and 2019 are as follows:
| Classification | 2020 | 2019 | ||||||||||||||||||
| Finance lease expense: | ||||||||||||||||||||
| Amortization of ROU assets | Depreciation and amortization | $ | $ | |||||||||||||||||
| Interest on lease liabilities | Interest expense | |||||||||||||||||||
| Operating lease expense | Cost of revenue; Selling, general & administrative expenses | |||||||||||||||||||
| Short-term lease expense | Cost of revenue; Selling, general & administrative expenses | |||||||||||||||||||
| Variable lease expense | Cost of revenue; Selling, general & administrative expenses | |||||||||||||||||||
| Total | $ | $ | ||||||||||||||||||
Additional information related to leases as of December 31, 2020 and 2019 is as follows:
| 2020 | 2019 | |||||||||||||
| Cash paid for amounts included in the measurement of lease liabilities for finance leases: | ||||||||||||||
| Finance - financing cash flows | $ | $ | ||||||||||||
| Finance - operating cash flows | ||||||||||||||
| Operating - operating cash flows | ||||||||||||||
| ROU assets obtained in the exchange for lease liabilities: | ||||||||||||||
| Finance leases | $ | |||||||||||||
| Operating leases | ||||||||||||||
| Weighted-average remaining lease term (in years): | ||||||||||||||
| Finance leases | ||||||||||||||
| Operating leases | ||||||||||||||
| Weighted-average discount rate: | ||||||||||||||
| Finance leases | % | % | ||||||||||||
| Operating leases | % | % | ||||||||||||
78
| Finance | Operating | ||||||||||
| 2021 | $ | $ | |||||||||
| 2022 | |||||||||||
| 2023 | |||||||||||
| 2024 | |||||||||||
| 2025 | |||||||||||
| Thereafter | |||||||||||
| Total | |||||||||||
| Less: Present value discount | |||||||||||
| Lease liability | $ | $ | |||||||||
18. Commitments and Contingencies
Legal Proceedings and Government Investigations
The Company is subject to periodic lawsuits, investigations and claims that arise in the ordinary course of business. The Company cannot predict with certainty the ultimate resolution of lawsuits, investigations and claims asserted against it. Except possibly for certain of the matters described below, the Company does not believe that any currently pending legal proceeding to which the Company is a party will have a material adverse effect on its business, results of operations, cash flows or financial condition. The costs of defense and amounts that may be recovered against the Company may be covered by insurance for certain matters.
Litigation and Commercial Claims
The Company was contracted to perform inspections of welds on various pipeline projects in Texas for a customer. As of December 31, 2020 approximately $1.4 million of past due receivables were outstanding from this customer. The customer provided the Company with notice in December 2019, alleging that the Company’s inspection of 66 welds (out of approximately 16,000 welds inspected) were not in compliance with the contract, claimed approximately $7.6 million in damages, and requested that the Company pay these damages and any other damages incurred. The Company has filed a lawsuit in the District Court of Bexar County, Texas, 37th Judicial District, in an action captioned Mistras Group, Inc. v. Epic Y-Grade Pipeline LP, to recover the $1.4 million and other amounts due to the Company. The customer filed a counterclaim, alleging breach of contract and seeking recovery of its alleged damages. The Company believes that any successful claim by the customer regarding the Company’s workmanship will be covered by insurance, subject to payment of a deductible. At this time, the Company is unable to determine whether it has any liability in connection with this matter and if so, the amount or range of any such liability, and accordingly, has no t established any accruals for this matter. Accordingly, the Company recorded a reserve of $1.4 million during the twelve months ended December 31, 2019 for these past due receivables. See 4-Accounts Receivable for additional details.
Pension Related Contingencies
The workforce of certain of the Company’s subsidiaries are unionized and the terms of employment for these workers are governed by collective bargaining agreements, or CBAs. Under these CBAs, the Company’s subsidiaries are required to contribute to the national pension funds for the unions representing these employees, which are multi-employer pension plans. The Company was notified that a significant project was awarded to another contractor in January 2018, and as a result, one of the Company’s subsidiaries experienced a significant reduction in the number of its employees covered by one of the CBAs.
79
Under certain circumstances, such a reduction in the number of employees participating in multi-employer pension plans pursuant to this CBA could result in a complete or partial withdrawal liability to these multi-employer pension plans under the Employee Retirement Income Security Act of 1974 ("ERISA"). Management explored options to retain a level of union work that would avoid withdrawal liability to the pension plans, but concluded during the third quarter of 2018 that the Company's subsidiaries probably would not obtain sufficient union work to avoid withdrawal liability. Therefore, the Company determined that it is probable that its subsidiary would incur a withdrawal liability related to these multi-employer pension plans. Accordingly, the Company recorded a charge of $5.9 million during 2018 and $0.8 million during 2019 for this potential withdrawal liability. The Company’s subsidiary reached an agreement with one of the pension funds in September 2019 and made a final payment of $0.9 million in complete satisfaction of the withdrawal liability of the subsidiary. Excluding the settlement payment, the Company made monthly payments totaling $3.3 million through the time of final settlement payment, for total payments of $4.2 million. The balance of the estimated total amount of this potential liability as of December 31, 2020 is approximately $2.5 million.
Severance and labor disputes
The Company’s German subsidiary provides employees to customers under temporary staff leasing arrangements. In April 2017, the German Labor Lease Act was passed in Germany limiting the duration of temporary workers to eighteen months , or longer as subsequently agreed with by a customer appropriate authority. Since the passing of the German Labor Lease Act, the Company explored selling its staff leasing services and concluded during the third quarter of 2018 that a sale would not be probable. As a result, the Company decided that it would not renew several of these leasing services contracts when they expired beginning in 2019. Due to the limit on the length of service allowed under the German Labor Lease Act, employees are being transitioned off the customer contracts. The German subsidiary has terminated, or will terminate, some these employees, creating a severance obligation to the terminated employees, and has transitioned, or will transition other employees to the Company's other customers. During December 2019, the Company executed an agreement to sell the rights of certain customer contracts for total consideration of approximately $0.1 million, effective January 1, 2020. No other assets or liabilities other than those employee benefits related to employees working on the customer contracts were included in the sale. As of December 31, 2020, the Company has approximately $0.2 million of accrued estimated severance payment obligations, which takes into account the Company's estimate with respect to the employees that have been or will be transitioned to the German subsidiaries' other customers. The $0.2 million of estimated obligations is net of $0.4 million in payments made and $1.0 million in reversals due to employees being transitioned to customer contracts.
During 2018, the Company recorded approximately $1.2 million in charges related to labor claims against its Brazilian subsidiary, which are included within selling, general and administrative expenses. These claims related to employees in a company acquired by the Brazilian subsidiary in a prior period. The Company is entitled to indemnification from the sellers of the acquired company for most of these charges and won an arbitration award against the seller in 2020. The Company and the seller subsequently entered into a settlement agreement for $1.0 million, which provides for payment in two installments, the first for approximately 31 % of the settlement and the second for the remaining 69 %. The first installment in the amount of $0.3 million was paid by the sellers in December 31, 2020 and recognized as a gain in selling, general and administrative expenses in the same period. The remaining payment is due in the first quarter of 2021, and the recovery resulting from this second payment will be recorded upon receipt.
Acquisition and disposition related contingencies
The Company is liable for contingent consideration in connection with one of its acquisitions. As of December 31, 2020, total potential acquisition-related contingent consideration ranged from zero to approximately $4.3 million and would be payable upon the achievement of specific performance metrics by certain of the acquired companies over the next 1.75 years.
With respect to the acquisition made in 2018, the Company filed a claim with the sellers and the Company's insurance carrier through which the Company has representations and warranty insurance. The Company received release of escrow funds from the Seller and is still pursuing its claim with the insurance carrier.
During 2018, the Company sold a subsidiary in the Products and Systems segment. As part of the sale, the Company entered into a three-year agreement to purchase products from the buyer, with a cumulative commitment of $2.3 million, of which $1.2 million is remaining as of December 31, 2020. The agreement is based on third party pricing and the Company's planned purchase requirements over the three-year purchase period to meet the minimum contractual purchases.
19. Segment Disclosure
The Company’s three operating segments are:
80
•Services. This segment provides asset protection solutions predominantly in North America, with the largest concentration in the United States, followed by Canada, consisting primarily of NDT, inspection, mechanical and engineering services that are used to evaluate the safety, structural integrity and reliability of critical energy, industrial and public infrastructure and commercial aerospace components. PCMS software and pipeline related software and data analysis solutions are included in this segment.
•International. This segment offers services, products and systems, similar to those of the other segments, to select markets within Europe, the Middle East, Africa, Asia and South America, but not to customers in China and South Korea, which are served by the Products and Systems segment.
•Products and Systems. This segment designs, manufactures, sells, installs and services the Company’s asset protection products and systems, including equipment and instrumentation, predominantly in the United States.
Costs incurred for general corporate services, including finance, legal, and certain other costs that are provided to the segments are reported within Corporate and eliminations. Sales to the International segment from the Products and Systems segment and subsequent sales by the International segment of the same items are recorded and reflected in the operating performance of both segments. Additionally, engineering charges and royalty fees charged to the Services and International segments by the Products and Systems segment are reflected in the operating performance of each segment.
The accounting policies of the reportable segments are the same as those described in Note 1-Summary of Significant Accounting Policies and Practices. Segment income from operations is one of the primary performance measures used by the chief operating decision maker, to assess the performance of each segment and make resource allocation decisions. Certain general and administrative costs such as human resources, information technology and training are allocated to the segments. Segment income from operations excludes interest and other financial charges and income taxes. Corporate and other assets are comprised principally of cash, deposits, property, plant and equipment, domestic deferred taxes, deferred charges and other assets. Corporate loss from operations consists of administrative charges related to corporate personnel and other charges that cannot be readily identified for allocation to a particular segment.
Selected financial information by segment for the periods shown was as follows (intercompany transactions are eliminated in Corporate and eliminations):
| For the year ended December 31, | |||||||||||||||||
| 2020 | 2019 | 2018 | |||||||||||||||
| Revenues | |||||||||||||||||
| Services | $ | $ | $ | ||||||||||||||
| International | |||||||||||||||||
| Products and Systems | |||||||||||||||||
| Corporate and eliminations | ( | ( | ( | ||||||||||||||
| $ | $ | $ | |||||||||||||||
| For the year ended December 31, | |||||||||||||||||
| 2020 | 2019 | 2018 | |||||||||||||||
| Gross profit | |||||||||||||||||
| Services | $ | $ | $ | ||||||||||||||
| International | |||||||||||||||||
| Products and Systems | |||||||||||||||||
| Corporate and eliminations | ( | ( | |||||||||||||||
| $ | $ | $ | |||||||||||||||
Income (loss) from operations by operating segment includes intercompany transactions, which are eliminated in Corporate and eliminations.
81
| For the year ended December 31, | |||||||||||||||||
| 2020 | 2019 | 2018 | |||||||||||||||
| Income (loss) from operations | |||||||||||||||||
| Services | $ | ( | $ | $ | |||||||||||||
| International | ( | ||||||||||||||||
| Products and Systems | ( | ( | |||||||||||||||
| Corporate and eliminations | ( | ( | ( | ||||||||||||||
| $ | ( | $ | $ | ||||||||||||||
| For the year ended December 31, | |||||||||||||||||
| 2020 | 2019 | 2018 | |||||||||||||||
| Depreciation and amortization | |||||||||||||||||
| Services | $ | $ | $ | ||||||||||||||
| International | |||||||||||||||||
| Products and Systems | |||||||||||||||||
| Corporate and eliminations | ( | ||||||||||||||||
| $ | $ | $ | |||||||||||||||
| December 31, | |||||||||||
| 2020 | 2019 | ||||||||||
| Intangible assets, net | |||||||||||
| Services | $ | $ | |||||||||
| International | |||||||||||
| Products and Systems | |||||||||||
| Corporate and eliminations | |||||||||||
| $ | $ | ||||||||||
| December 31, | |||||||||||
| 2020 | 2019 | ||||||||||
| Total assets | |||||||||||
| Services | $ | $ | |||||||||
| International | |||||||||||
| Products and Systems | |||||||||||
| Corporate and eliminations | |||||||||||
| $ | $ | ||||||||||
| December 31, | |||||||||||
| 2020 | 2019 | ||||||||||
| Long-lived assets | |||||||||||
| United States | $ | $ | |||||||||
| Other Americas | |||||||||||
| Europe | |||||||||||
| $ | $ | ||||||||||
Refer to Note 2-Revenue, for revenues by segment and by geographic area for the years ended December 31, 2020, 2019, and 2018.
20. Selected Quarterly Financial Information (unaudited)
82
| Quarter ended | December 31, 2020 | September 30, 2020 | June 30, 2020 | March 31, 2020 | ||||||||||||||||||||||
| Revenues | $ | $ | $ | $ | ||||||||||||||||||||||
| Gross Profit | ||||||||||||||||||||||||||
| Income (loss) from operations | ( | ( | ||||||||||||||||||||||||
| Net income (loss) attributable to Mistras Group, Inc. | $ | $ | $ | ( | $ | ( | ||||||||||||||||||||
| Earnings (loss) per common share: | ||||||||||||||||||||||||||
| Basic | $ | $ | $ | ( | $ | ( | ||||||||||||||||||||
| Diluted | $ | $ | $ | ( | $ | ( | ||||||||||||||||||||
| Quarter ended | December 31, 2019 | September 30, 2019 | June 30, 2019 | March 31, 2019 | ||||||||||||||||||||||
| Revenues | $ | $ | $ | $ | ||||||||||||||||||||||
| Gross Profit | ||||||||||||||||||||||||||
| Income from operations | ( | |||||||||||||||||||||||||
| Net income (loss) attributable to Mistras Group, Inc. | $ | $ | $ | $ | ( | |||||||||||||||||||||
| Earnings (loss) per common share: | ||||||||||||||||||||||||||
| Basic | $ | $ | $ | $ | ( | |||||||||||||||||||||
| Diluted | $ | $ | $ | $ | ( | |||||||||||||||||||||
| Quarter ended | December 31, 2018 | September 30, 2018 | June 30, 2018 | March 31, 2018 | ||||||||||||||||||||||
| Revenues | $ | $ | $ | $ | ||||||||||||||||||||||
| Gross Profit | ||||||||||||||||||||||||||
| Income (loss) from operations | ||||||||||||||||||||||||||
| Net income (loss) attributable to Mistras Group, Inc. | $ | ( | $ | ( | $ | $ | ||||||||||||||||||||
| Earnings (loss) per common share: | ||||||||||||||||||||||||||
| Basic | $ | ( | $ | ( | $ | $ | ||||||||||||||||||||
| Diluted | $ | ( | $ | ( | $ | $ | ||||||||||||||||||||
Item 9. Changes in and Disagreements with Accountants on Accounting and Financial Disclosure
None.
Item 9A. Controls and Procedures
Evaluation of Disclosure Controls and Procedures
Pursuant to Rule 13a-15(b) under the Exchange Act, our management carried out an evaluation, under the supervision and with the participation of our President and Chief Executive Officer and our Executive Vice President, Chief Financial Officer and Treasurer, of the effectiveness of the design and operation of our disclosure controls (as defined in Rule 13a-15(e) of the Exchange Act) and procedures. Based upon that evaluation, our President and Chief Executive Officer and our Executive Vice President, Chief Financial Officer and Treasurer concluded that, as of December 31, 2020, our disclosure controls and procedures were effective.
Management’s Report on Internal Control Over Financial Reporting
Our management is responsible for establishing and maintaining adequate internal control over financial reporting, as defined in Rules 13a-15(f) and 15d-15(f) under the Securities Exchange Act of 1934, as amended (the Exchange Act). Our internal control over financial reporting is a process designed by, or under the supervision of, our President and Chief Executive Officer and our
83
Executive Vice President, Chief Financial Officer and Treasurer, and effected by the Company’s board of directors, management and other personnel to provide reasonable assurance regarding the reliability of financial reporting and the preparation of financial statements for external purposes in accordance with generally accepted accounting principles.
Because of its inherent limitations, internal control over financial reporting may not prevent or detect misstatements. Also, projections of any evaluation of effectiveness to future periods are subject to the risk that controls may become inadequate because of changes in conditions, or that the degree of compliance with policies or procedures may deteriorate.
A material weakness is a deficiency, or a combination of deficiencies, in internal control over financial reporting, such that there is a reasonable possibility that a material misstatement of the Company’s annual or interim financial statements will not be prevented or detected on a timely basis.
Our management assessed the effectiveness of our internal control over financial reporting as of December 31, 2020. In making this assessment, management used the criteria set forth by the Committee of Sponsoring Organizations of the Treadway Commission (COSO) in the updated Internal Control — Integrated Framework issued in 2013. Based on that assessment, our management concluded that, as of December 31, 2020, our internal control over financial reporting was effective.
The effectiveness of the Company’s internal control over financial reporting as of December 31, 2020, has been audited by KPMG LLP, an independent registered public accounting firm, as stated in their report which appears herein.
Changes in Internal Control over Financial Reporting
During the quarter ended December 31, 2019, we identified material weaknesses with our internal controls related to the accounting and financial reporting for income taxes. As a consequence, process level controls over the completeness, existence, accuracy, valuation and presentation of the income tax provision, including deferred tax assets and liabilities and valuation allowance, were not effective. Based on the material weaknesses described above, management concluded that, as of December 31, 2019, our internal control over financial reporting were ineffective.
In connection with the preparation of the annual consolidated financial statements as of and for the year ended December 31, 2020, management designed and implemented effective internal controls surrounding the preparation of the income tax provision including engaging a third party accounting firm to assist with the documentation of these enhanced processes and controls including:
•Accelerate the risk assessment process related to changes in the business;
•Enhance the design of controls surrounding the preparation and review of the income tax provision, and enhance the automation of the income tax processes and controls to allow for a timelier completion and review of internal controls; and
•Accelerate all key activities within the income tax accounting and reporting process and controls by further increasing and expanding the capabilities of the income tax accounting resources in order to devote additional time and resources to the consolidated income tax accounting and reporting processes and controls.
We have determined that the actions taken to date have sufficiently improved the Company’s internal control over financial reporting such that as of December 31, 2020, there is not a reasonable possibility that a material misstatement of the Company’s annual or interim financial statements will not be prevented or detected on a timely basis. Based on the remediation of the material weaknesses identified, we concluded that our internal control over financial reporting was effective as of December 31, 2020.
Other than the changes noted above, there has been no change in our internal control over financial reporting during the quarter ended December 31, 2020, that has materially affected, or is reasonably likely to materially affect, our internal control over financial reporting.
Item 9B. Other Information
None.
PART III
ITEM 10. DIRECTORS, EXECUTIVE OFFICERS AND CORPORATE GOVERNANCE
84
Certain of the information concerning our executive officers required by this Item 10 is provided under the caption “Executive Officers of the Registrant” in Part I of this Annual Report. The remaining information required by Item 10 is incorporated herein by reference to the relevant information to be included in our definitive proxy statement related to the 2021 annual shareholders meeting.
ITEM 11. EXECUTIVE COMPENSATION
The information required by Item 11 is incorporated by reference to the relevant information to be included in our definitive proxy statement related to the 2021 annual shareholders meeting.
ITEM 12. SECURITY OWNERSHIP OF CERTAIN BENEFICIAL OWNERS AND MANAGEMENT AND RELATED STOCKHOLDER MATTERS
The information required by Item 12 regarding Security Ownership of Certain Beneficial Owners and Management and Related Stockholders is incorporated by reference to the relevant information to be included in our definitive proxy statement related to the 2021 annual shareholders meeting.
Equity Compensation Plan Information
The following table provides certain information as of December 31, 2020 concerning the shares of our common stock that may be issued under existing equity compensation plans.
| Plan Category | Number of Securities to be Issued Upon Exercise of Outstanding Options | Weighted Average Exercise Price of Outstanding Options | Number of Securities Remaining Available for Future Issuance Under Equity Compensation Plans | |||||||||||||||||
| (in thousands, except exercise price) | ||||||||||||||||||||
Equity Compensation Plans Approved by Security Holders (1) | 5 | $ | 22.35 | 1,787 | ||||||||||||||||
| Equity Compensation Plans Not Approved by Security Holders | — | — | — | |||||||||||||||||
| Total | 5 | $ | 22.35 | 1,787 | ||||||||||||||||
________________________________________
(1) Includes the Company’s 2009 Long-Term Incentive Plan and 2016 Long-Term Incentive Plan. There are no awards outstanding as of December 31, 2020 under the Company's 2007 Stock Option Plan.
ITEM 13. CERTAIN RELATIONSHIPS AND RELATED TRANSACTIONS, AND DIRECTOR INDEPENDENCE
The information required by Item 13 is incorporated by reference to the relevant information to be included in our definitive proxy statement related to the 2021 annual shareholders meeting.
ITEM 14. PRINCIPAL ACCOUNTANT FEES AND SERVICES
The information required by Item 14 is incorporated by reference to the information to be included in our definitive proxy statement related to the 2021 annual shareholders meeting.
PART IV
ITEM 15. EXHIBITS AND FINANCIAL STATEMENT SCHEDULES
(1) The following financial statements are filed herewith in Item 8 of Part II above:
85
| Page | |||||
(2) Financial Statement Schedules
All other schedules are omitted because of the absence of conditions under which they are required or because the required information is given in the financial statements or notes thereto.
(3) Exhibits
| Exhibit No. | Description | |||||||
| 2.1 | ||||||||
| 2.2 | ||||||||
| 2.3 | ||||||||
| 3.1 | ||||||||
| 3.2 | ||||||||
| 3.3 | ||||||||
| 4.1 | ||||||||
| 4.2 | ||||||||
| 10.1 | ||||||||
| 10.2 | ||||||||
86
| 10.3 | ||||||||
| 10.4 | ||||||||
| 10.5 | ||||||||
| 10.6 | ||||||||
| 10.7 | ||||||||
| 10.8 | ||||||||
| 10.9 | ||||||||
| 10.10* | ||||||||
| 10.11 | ||||||||
| 10.12 | ||||||||
| 10.13 | ||||||||
| 10.14 | ||||||||
| 10.15 | ||||||||
| 21.1* | ||||||||
| 23.1* | ||||||||
| 24.1* | ||||||||
| 31.1* | ||||||||
| 31.2* | ||||||||
| 32.1** | ||||||||
87
| 32.2** | ||||||||
| 101.INS | XBRL Instance Document | |||||||
| 101.SCH | XBRL Schema Document | |||||||
| 101.CAL | XBRL Calculation Linkbase Document | |||||||
| 101.LAB | XBRL Labels Linkbase Document | |||||||
| 101.PRE | XBRL Presentation Linkbase Document | |||||||
| 101.DEF | XBRL Definition Linkbase Document | |||||||
_______________________
Exhibits 10.5 to 10.15 are management contracts or compensatory plans, contracts, or arrangements.
* Filed herewith.
** Furnished herewith.
ITEM 16. FORM 10-K SUMMARY
None.
88
SIGNATURES
Pursuant to the requirements of Section 13 or 15(d) of the Securities Exchange Act of 1934, the registrant has duly caused this report to be signed on its behalf by the undersigned, thereunto duly authorized.
| MISTRAS GROUP, INC. | ||||||||
| By: | /s/ Dennis Bertolotti | |||||||
| Dennis Bertolotti | ||||||||
| President and Chief Executive Officer | ||||||||
Date: March 16, 2021
We, the undersigned directors and officers of Mistras Group, Inc., hereby severally constitute Dennis Bertolotti, Edward J. Prajzner and Michael C. Keefe, and each of them singly, as our true and lawful attorneys with full power to each of them to sign for us, in our names in the capacities indicated below, any and all amendments to this Annual Report on Form 10-K filed with the Securities and Exchange Commission.
This power of attorney may only be revoked by a written document executed by the undersigned that expressly revokes this power by referring to the date and subject hereof.
Pursuant to the requirements of the Securities Exchange Act of 1934, this report has been signed below by the following persons on behalf of the Registrant and in the capacities and on the dates indicated.
89
| Signature | Title | Date | ||||||||||||
| /s/ Dennis Bertolotti | President, Chief Executive Officer and Director (Principal Executive Officer) | March 16, 2021 | ||||||||||||
| Dennis Bertolotti | ||||||||||||||
| /s/ Edward J. Prajzner | Executive Vice President, Chief Financial Officer and Treasurer (Principal Financial and Accounting Officer) | March 16, 2021 | ||||||||||||
| Edward J. Prajzner | ||||||||||||||
| /s/ Dr. Sotirios J. Vahaviolos | Executive Chairman and Director | March 16, 2021 | ||||||||||||
| Dr. Sotirios J. Vahaviolos | ||||||||||||||
| /s/ Nicholas DeBenedictis | Director | March 16, 2021 | ||||||||||||
| Nicholas DeBenedictis | ||||||||||||||
| /s/ James J. Forese | Director | March 16, 2021 | ||||||||||||
| James J. Forese | ||||||||||||||
| /s/ Richard H. Glanton | Director | March 16, 2021 | ||||||||||||
| Richard H. Glanton | ||||||||||||||
| /s/ Michelle J. Lohmeier | Director | March 16, 2021 | ||||||||||||
| Michelle J. Lohmeier | ||||||||||||||
| /s/ Charles P. Pizzi | Director | March 16, 2021 | ||||||||||||
Charles P. Pizzi | ||||||||||||||
| /s/ Manuel N. Stamatakis | Director | March 16, 2021 | ||||||||||||
| Manuel N. Stamatakis | ||||||||||||||
90
Serious News for Serious Traders! Try StreetInsider.com Premium Free!
You May Also Be Interested In
- Serve Robotics Enters Production Agreement with Magna to Scale Robot Manufacturing
- Notice of AGM
- CTT Systems AB (publ.) - Interim Report First Quarter 2024
Create E-mail Alert Related Categories
SEC FilingsSign up for StreetInsider Free!
Receive full access to all new and archived articles, unlimited portfolio tracking, e-mail alerts, custom newswires and RSS feeds - and more!
