




CPKC reports strong Q2 results, poised for accelerated growth in second half of 2026

FREE Breaking News Alerts from StreetInsider.com!
StreetInsider.com Top Tickers, 10/22/2026
- Nasdaq leads Wall Street lower on AI spending jitters; oil prices rebound
- Meta’s new Class C stock to keep Zuckerberg in California, fund AI spending spree
- Brent hits five-month high on escalating Middle East conflict
- Meta beats Q3 estimates, approves new nonvoting share class as AI spending surges
- Tesla stock up as automotive gross margin improves, free cash flow turns positive
 Tweet
Tweet Share
Share E-mail
Get Alerts CP Hot Sheet
Overall Analyst Rating:
SELL (= Flat)
Dividend Yield: 1.2%
Revenue Growth %: +13.5%
Join SI Premium – FREE
"This unrivalled three-nation network and CPKC's exceptional team of railroaders delivered another quarter of strong revenue and earnings growth," said
Second-quarter 2026 results
- Revenues increased by 13 percent to
$4.2 billion from$3.7 billion in Q2 2025 - Reported operating ratio (OR) increased by 90 basis points to 64.6 percent from 63.7 percent in Q2 2025
- Core adjusted OR1 increased 90 basis points to 61.6 percent from 60.7 percent in Q2 2025
- Reported diluted EPS decreased 14 percent to
$1.15 from$1.33 in Q2 2025 - Core adjusted diluted EPS1 increased 13 percent to
$1.27 from$1.12 in Q2 2025 - Volumes, as measured in revenue ton-miles, increased 4 percent
"Successful implementation of our North American strategy and synergy realization, improving freight fundamentals, and disciplined cost control position CPKC to continue delivering differentiated earnings growth and value creation over the long term," Creel added. "We remain confident in our ability to continue creating unique long-term value for our customers, communities and shareholders, as we safely and efficiently serve the North American economy."
1 | These measures have no standardized meanings prescribed by accounting principles generally accepted in |
Conference Call Details
CPKC will discuss its results with the financial community in a conference call beginning at
Conference Call Access
International: 785-424-1789
*Conference ID: CPKCQ226
Callers should dial in 10 minutes prior to the call.
Webcast
We encourage you to access the webcast and presentation material in the Investors section of CPKC's website at investor.cpkcr.com.
A replay of the second-quarter conference call will be available through
Forward-looking information
This news release contains certain forward-looking information and forward-looking statements (collectively, "forward-looking statements") within the meaning of applicable securities laws in both the
The forward-looking statements contained in this news release are based on current expectations, estimates, projections and assumptions, having regard to CPKC's experience and its perception of historical trends, and include, but are not limited to, expectations, estimates, projections and assumptions relating to: changes in business strategies, North American and global economic growth and conditions; commodity demand growth; sustainable industrial and agricultural production; commodity prices and interest rates; foreign exchange rates; core adjusted effective tax rates; performance of our assets and equipment; sufficiency of our budgeted capital expenditures in carrying out our business plan; geopolitical conditions, applicable laws, regulations and government policies, including, without limitation, those relating to regulation of rates, tariffs, import/export, trade, taxes, wages, labour and immigration; the availability and cost of labour, services and infrastructure; labour disruptions; the satisfaction by third parties of their obligations to CPKC; and carbon markets, evolving sustainability strategies, and scientific or technological developments. Although CPKC believes the expectations, estimates, projections and assumptions reflected in the forward-looking statements presented herein are reasonable as of the date hereof, there can be no assurance that they will prove to be correct. Current conditions, economic and otherwise, render assumptions, although reasonable when made, subject to greater uncertainty.
Undue reliance should not be placed on forward-looking statements as actual results may differ materially from those expressed or implied by forward-looking statements. By their nature, forward-looking statements involve numerous inherent risks and uncertainties that could cause actual results to differ materially from the forward-looking statements, including, but not limited to, the following factors: changes in business strategies and strategic opportunities; general Canadian,
The forward-looking statements contained in this news release are made as of the date hereof. Except as required by law, CPKC undertakes no obligation to update publicly or otherwise revise any forward-looking statements, or the foregoing assumptions and risks affecting such forward-looking statements, whether as a result of new information, future events or otherwise.
About CPKC
With its global headquarters in
FINANCIAL STATEMENTS
INTERIM CONSOLIDATED STATEMENTS OF INCOME
(unaudited)
For the three months | For the six months ended | |||
(in millions of Canadian dollars, except share and per share data) | 2026 | 2025 | 2026 | 2025 |
Revenues (Note 3) | ||||
Freight | $ 4,088 | $ 3,629 | $ 7,716 | $ 7,356 |
Non-freight | 76 | 70 | 149 | 138 |
Total revenues | 4,164 | 3,699 | 7,865 | 7,494 |
Operating expenses | ||||
Compensation and benefits | 723 | 659 | 1,414 | 1,341 |
Fuel | 618 | 405 | 1,076 | 886 |
Materials | 130 | 124 | 257 | 248 |
Equipment rents | 97 | 103 | 192 | 202 |
Depreciation and amortization | 519 | 493 | 1,031 | 997 |
Purchased services and other | 605 | 572 | 1,165 | 1,160 |
Total operating expenses | 2,692 | 2,356 | 5,135 | 4,834 |
Operating income | 1,472 | 1,343 | 2,730 | 2,660 |
Other (income) expense | (14) | (16) | 6 | (9) |
Other components of net periodic benefit recovery (Note 12) | (110) | (107) | (220) | (214) |
Net interest expense | 237 | 208 | 465 | 424 |
Gain on sale of equity investment (Note 4) | — | (333) | — | (333) |
Income before income tax expense | 1,359 | 1,591 | 2,479 | 2,792 |
Current income tax expense | 281 | 348 | 541 | 614 |
Deferred income tax expense | 54 | 9 | 69 | 35 |
Income tax expense (Note 5) | 335 | 357 | 610 | 649 |
Net income | $ 1,024 | $ 1,234 | $ 1,869 | $ 2,143 |
Net loss attributable to non-controlling interest | — | — | (1) | (1) |
Net income attributable to controlling shareholders | $ 1,024 | $ 1,234 | $ 1,870 | $ 2,144 |
Earnings per share (Note 6) | ||||
Basic earnings per share | $ 1.16 | $ 1.34 | $ 2.10 | $ 2.31 |
Diluted earnings per share | $ 1.15 | $ 1.33 | $ 2.10 | $ 2.31 |
Weighted-average number of shares (millions) (Note 6) | ||||
Basic | 886.4 | 923.8 | 891.6 | 928.4 |
Diluted | 887.1 | 924.8 | 892.2 | 929.5 |
Dividends declared per share | $ 0.268 | $ 0.228 | $ 0.496 | $ 0.418 |
See Notes to Interim Consolidated Financial Statements. |
INTERIM CONSOLIDATED STATEMENTS OF COMPREHENSIVE INCOME
(unaudited)
For the three months | For the six months | |||
(in millions of Canadian dollars) | 2026 | 2025 | 2026 | 2025 |
Net income | $ 1,024 | $ 1,234 | $ 1,869 | $ 2,143 |
Net gain (loss) in foreign currency translation adjustments, net of | 652 | (1,729) | 1,190 | (1,758) |
Change in derivatives designated as cash flow hedges | (1) | — | (2) | 1 |
Change in pension and post-retirement defined benefit plans | — | 2 | 1 | 5 |
Other comprehensive income from equity investees | 1 | 3 | 2 | 3 |
Other comprehensive income (loss) before income taxes | 652 | (1,724) | 1,191 | (1,749) |
Income tax recovery (expense) | 15 | (32) | 29 | (35) |
Other comprehensive income (loss) | 667 | (1,756) | 1,220 | (1,784) |
Comprehensive income (loss) | $ 1,691 | $ (522) | $ 3,089 | $ 359 |
Comprehensive income (loss) attributable to non-controlling interest | 18 | (54) | 33 | (56) |
Comprehensive income (loss) attributable to controlling | $ 1,673 | $ (468) | $ 3,056 | $ 415 |
See Notes to Interim Consolidated Financial Statements. |
INTERIM CONSOLIDATED BALANCE SHEETS AS AT
(unaudited)
(in millions of Canadian dollars) | 2026 | 2025 |
Assets | ||
Current assets | ||
Cash and cash equivalents | $ 366 | $ 184 |
Accounts receivable, net (Note 8) | 2,253 | 2,029 |
Materials and supplies | 542 | 502 |
Other current assets | 292 | 224 |
3,453 | 2,939 | |
Investments | 522 | 473 |
Properties | 57,165 | 55,323 |
Goodwill | 19,111 | 18,436 |
Intangible assets | 2,974 | 2,911 |
Pension asset | 5,330 | 5,129 |
Other assets | 727 | 734 |
Total assets | $ 89,282 | $ 85,945 |
Liabilities and equity | ||
Current liabilities | ||
Accounts payable and accrued liabilities | $ 2,913 | $ 2,751 |
Long-term debt maturing within one year (Note 9, 10) | 2,899 | 3,240 |
5,812 | 5,991 | |
Pension and other benefit liabilities | 540 | 537 |
Other long-term liabilities | 910 | 815 |
Long-term debt (Note 9, 10) | 22,248 | 19,948 |
Deferred income taxes | 12,165 | 11,829 |
Total liabilities | 41,675 | 39,120 |
Shareholders' equity | ||
Share capital | 24,360 | 24,751 |
Additional paid-in capital | 115 | 105 |
Accumulated other comprehensive income (Note 7) | 2,424 | 1,238 |
Retained earnings | 19,727 | 19,783 |
46,626 | 45,877 | |
Non-controlling interest | 981 | 948 |
Total equity | 47,607 | 46,825 |
Total liabilities and equity | $ 89,282 | $ 85,945 |
See Contingencies (Note 14). |
See Notes to Interim Consolidated Financial Statements. |
INTERIM CONSOLIDATED STATEMENTS OF CASH FLOWS
(unaudited)
For the three months | For the six months | |||
(in millions of Canadian dollars) | 2026 | 2025 | 2026 | 2025 |
Operating activities | ||||
Net income | $ 1,024 | $ 1,234 | $ 1,869 | $ 2,143 |
Reconciliation of net income to net cash provided by operating activities: | ||||
Depreciation and amortization | 519 | 493 | 1,031 | 997 |
Deferred income tax expense | 54 | 9 | 69 | 35 |
Pension recovery and funding (Note 12) | (96) | (95) | (195) | (190) |
Gain on sale of equity investment (Note 4) | — | (333) | — | (333) |
Settlement of Mexican taxes | — | (1) | — | (12) |
Other operating activities, net | 105 | 39 | 93 | 28 |
Changes in non-cash working capital balances related to operations | 120 | 9 | (165) | (157) |
Net cash provided by operating activities | 1,726 | 1,355 | 2,702 | 2,511 |
Investing activities | ||||
Additions to properties | (758) | (743) | (1,422) | (1,454) |
Additions to Meridian Speedway properties | (8) | (12) | (13) | (24) |
Proceeds from sale of properties and other assets | 4 | 4 | 12 | 15 |
Proceeds from sale of equity investment (Note 4) | — | 493 | — | 493 |
Other investing activities, net | — | (48) | (11) | (51) |
Net cash used in investing activities | (762) | (306) | (1,434) | (1,021) |
Financing activities | ||||
Dividends paid | (204) | (210) | (408) | (387) |
Issuance of Common Shares | 30 | 30 | 55 | 38 |
Purchase of Common Shares (Note 11) | (1,283) | (1,393) | (1,963) | (1,740) |
Repayment of long-term debt, excluding commercial paper (Note 9) | (352) | (5) | (697) | (940) |
Issuance of long-term debt, excluding commercial paper (Note 9) | — | 1,392 | 1,621 | 3,102 |
Net issuance (repayment) of commercial paper (Note 9) | 778 | (722) | 284 | (1,175) |
Net issuance (repayment) of short-term borrowings (Note 9) | — | 8 | — | (277) |
Other financing activities, net | — | (1) | (4) | (6) |
Net cash used in financing activities | (1,031) | (901) | (1,112) | (1,385) |
Effect of foreign currency fluctuations on foreign-denominated | 24 | (44) | 26 | (45) |
Cash position | ||||
Net (decrease) increase in cash and cash equivalents | (43) | 104 | 182 | 60 |
Cash and cash equivalents at beginning of period | 409 | 695 | 184 | 739 |
Cash and cash equivalents at end of period | $ 366 | $ 799 | $ 366 | $ 799 |
Supplemental cash flow information | ||||
Income taxes paid | $ 286 | $ 409 | $ 577 | $ 646 |
Interest paid | $ 247 | $ 234 | $ 450 | $ 414 |
See Notes to Interim Consolidated Financial Statements. |
INTERIM CONSOLIDATED STATEMENTS OF CHANGES IN EQUITY
(unaudited)
For the three months ended | ||||||||||
(in millions of Canadian dollars | Common | Share capital | Additional paid-in capital | Accumulated other comprehensive income (loss) | Retained earnings | Total shareholders' equity | Non- | Total equity | ||
Balance as at | 892.6 | $ 24,623 | $ 118 | $ 1,775 | $ 19,937 | $ 46,453 | $ 963 | $ 47,416 | ||
Net income | — | — | — | — | 1,024 | 1,024 | — | 1,024 | ||
Other comprehensive income | — | — | — | 649 | — | 649 | 18 | 667 | ||
Dividends declared ( | — | — | — | — | (236) | (236) | — | (236) | ||
Effect of stock-based | — | — | 3 | — | — | 3 | — | 3 | ||
Common Shares repurchased | (11.0) | (300) | — | — | (998) | (1,298) | — | (1,298) | ||
Common Shares issued under | 0.4 | 37 | (6) | — | — | 31 | — | 31 | ||
Balance as at | 882.0 | $ 24,360 | $ 115 | $ 2,424 | $ 19,727 | $ 46,626 | $ 981 | $ 47,607 | ||
Balance as at | 930.4 | $ 25,603 | $ 107 | $ 2,653 | $ 19,883 | $ 48,246 | $ 997 | $ 49,243 | ||
Net income | — | — | — | — | 1,234 | 1,234 | — | 1,234 | ||
Other comprehensive loss (Note 7) | — | — | — | (1,702) | — | (1,702) | (54) | (1,756) | ||
Dividends declared ( | — | — | — | — | (210) | (210) | — | (210) | ||
Effect of stock-based | — | — | 4 | — | — | 4 | — | 4 | ||
Common Shares repurchased (Note 11) | (13.1) | (354) | — | — | (1,044) | (1,398) | — | (1,398) | ||
Common Shares issued under | 0.6 | 36 | (6) | — | — | 30 | — | 30 | ||
Balance as at | 917.9 | $ 25,285 | $ 105 | $ 951 | $ 19,863 | $ 46,204 | $ 943 | $ 47,147 | ||
For the six months ended | ||||||||||
(in millions of Canadian dollars | Common Shares | Share capital | Additional paid-in capital | Accumulated other comprehensive income (loss) | Retained earnings | Total shareholders' equity | Non- | Total equity | ||
Balance as at January 1, 2026 | 897.6 | $ 24,751 | $ 105 | $ 1,238 | $ 19,783 | $ 45,877 | $ 948 | $ 46,825 | ||
Net income (loss) | — | — | — | — | 1,870 | 1,870 | (1) | 1,869 | ||
Other comprehensive income (Note 7) | — | — | — | 1,186 | — | 1,186 | 34 | 1,220 | ||
Dividends declared ( | — | — | — | — | (440) | (440) | — | (440) | ||
Effect of stock-based | — | — | 22 | — | — | 22 | — | 22 | ||
Common Shares repurchased | (16.4) | (458) | — | — | (1,486) | (1,944) | — | (1,944) | ||
Common Shares issued under | 0.8 | 67 | (12) | — | — | 55 | — | 55 | ||
Balance as at | 882.0 | $ 24,360 | $ 115 | $ 2,424 | $ 19,727 | $ 46,626 | $ 981 | $ 47,607 | ||
Balance as at | 933.5 | $ 25,689 | $ 94 | $ 2,680 | $ 19,429 | $ 47,892 | $ 998 | $ 48,890 | ||
Net income (loss) | — | — | — | — | 2,144 | 2,144 | (1) | 2,143 | ||
Contribution from non-controlling interest | — | — | — | — | — | — | 1 | 1 | ||
Other comprehensive loss | — | — | — | (1,729) | — | (1,729) | (55) | (1,784) | ||
Dividends declared ( | — | — | — | — | (387) | (387) | — | (387) | ||
Effect of stock-based | — | — | 20 | — | — | 20 | — | 20 | ||
Common Shares repurchased | (16.4) | (450) | — | — | (1,323) | (1,773) | — | (1,773) | ||
Common Shares issued under | 0.8 | 46 | (9) | — | — | 37 | — | 37 | ||
Balance as at | 917.9 | $ 25,285 | $ 105 | $ 951 | $ 19,863 | $ 46,204 | $ 943 | $ 47,147 | ||
See Notes to Interim Consolidated Financial Statements. |
NOTES TO INTERIM CONSOLIDATED FINANCIAL STATEMENTS
(unaudited)
1 Description of business and basis of presentation
Canadian Pacific Kansas City Limited ("CPKC" or the "Company") owns and operates a transcontinental freight railway spanning
These unaudited interim consolidated financial statements ("Interim Consolidated Financial Statements") have been prepared in accordance with accounting principles generally accepted in the
The Company's operations and income for interim periods can be affected by seasonal fluctuations such as changes in customer demand and weather conditions, and may not be indicative of annual results.
Operating segment
The Company only has one operating segment: rail transportation. The Company's measure of segment profit is reported on the Interim Consolidated Statements of Income as "Net income attributable to controlling shareholders". CPKC's significant segment expenses are consistent with the expenses presented on the Interim Consolidated Statements of Income.
2 Accounting changes
Accounting Standards Update ("ASU") 2025-05 Financial Instruments - Credit Losses (Topic 326): Measurement of Credit Losses for Accounts Receivable and Contract Assets
On
Other accounting standards that became effective during the three and six months ended
3 Revenues
The following table presents disaggregated information about the Company's revenues from contracts with customers by major source:
For the three months | For the six months | |||
(in millions of Canadian dollars) | 2026 | 2025 | 2026 | 2025 |
Grain | $ 925 | $ 743 | $ 1,796 | $ 1,531 |
Coal | 209 | 256 | 435 | 513 |
Potash | 184 | 167 | 333 | 323 |
Fertilizers and sulphur | 110 | 98 | 222 | 212 |
Forest products | 198 | 195 | 379 | 412 |
Energy, chemicals and plastics | 777 | 712 | 1,477 | 1,470 |
Metals, minerals and consumer products | 524 | 444 | 962 | 892 |
Automotive | 403 | 330 | 699 | 645 |
Intermodal | 758 | 684 | 1,413 | 1,358 |
Total freight revenues | 4,088 | 3,629 | 7,716 | 7,356 |
Non-freight excluding leasing revenues | 49 | 44 | 94 | 85 |
Revenues from contracts with customers | 4,137 | 3,673 | 7,810 | 7,441 |
Leasing revenues | 27 | 26 | 55 | 53 |
Total revenues | $ 4,164 | $ 3,699 | $ 7,865 | $ 7,494 |
4 Gain on sale of equity investment
On
5 Income taxes
The effective income tax rate including discrete items for the three and six months ended
For the three months ended
For the three months ended
For the six months ended
For the six months ended
2014 Tax Assessment
Canadian Pacific Kansas City Mexico's ("CPKCM") 2014 Tax Assessment is currently in litigation (see Note 14).
6 Earnings per share
For the three months | For the six months | |||
(in millions, except per share data) | 2026 | 2025 | 2026 | 2025 |
Net income attributable to controlling shareholders | $ 1,024 | $ 1,234 | $ 1,870 | $ 2,144 |
Weighted-average basic shares outstanding | 886.4 | 923.8 | 891.6 | 928.4 |
Dilutive effect of stock options | 0.7 | 1.0 | 0.6 | 1.1 |
Weighted-average diluted shares outstanding | 887.1 | 924.8 | 892.2 | 929.5 |
Earnings per share - basic | $ 1.16 | $ 1.34 | $ 2.10 | $ 2.31 |
Earnings per share - diluted | $ 1.15 | $ 1.33 | $ 2.10 | $ 2.31 |
For the three and six months ended
7 Changes in Accumulated other comprehensive income ("AOCI") by component
Changes in AOCI attributable to controlling shareholders, net of tax, by component are as follows:
For the three months ended | |||||
(in millions of Canadian dollars) | Foreign currency | Derivatives | Pension and post- retirement defined benefit plans | Equity | Total |
Opening balance, | $ 2,365 | $ 8 | $ (601) | $ 3 | $ 1,775 |
Other comprehensive income before | 649 | — | — | 1 | 650 |
Amounts reclassified from AOCI | — | (1) | — | — | (1) |
Net other comprehensive income (loss) | 649 | (1) | — | 1 | 649 |
Balance as at | $ 3,014 | $ 7 | $ (601) | $ 4 | $ 2,424 |
Opening balance, | $ 3,385 | $ 10 | $ (737) | $ (5) | $ 2,653 |
Other comprehensive (loss) income | (1,707) | — | — | 3 | (1,704) |
Amounts reclassified from AOCI | — | 1 | 1 | — | 2 |
Net other comprehensive (loss) income | (1,707) | 1 | 1 | 3 | (1,702) |
Balance as at | $ 1,678 | $ 11 | $ (736) | $ (2) | $ 951 |
For the six months ended | |||||
Foreign currency | Derivatives | Pension and post- retirement defined | Equity accounted investments | Total | |
Opening balance, | $ 1,829 | $ 9 | $ (602) | $ 2 | $ 1,238 |
Other comprehensive income before | 1,185 | — | — | 2 | 1,187 |
Amounts reclassified from AOCI | — | (2) | 1 | — | (1) |
Net other comprehensive income (loss) | 1,185 | (2) | 1 | 2 | 1,186 |
Balance as at | $ 3,014 | $ 7 | $ (601) | $ 4 | $ 2,424 |
Opening balance, | $ 3,413 | $ 10 | $ (738) | $ (5) | $ 2,680 |
Other comprehensive (loss) income before reclassifications | (1,735) | — | — | 3 | (1,732) |
Amounts reclassified from AOCI | — | 1 | 2 | — | 3 |
Net other comprehensive (loss) income | (1,735) | 1 | 2 | 3 | (1,729) |
Balance as at | $ 1,678 | $ 11 | $ (736) | $ (2) | $ 951 |
8 Accounts receivable, net
(in millions of Canadian dollars) | As at | As at |
Total accounts receivable | $ 2,371 | $ 2,146 |
Allowance for credit losses | (118) | (117) |
Total accounts receivable, net | $ 2,253 | $ 2,029 |
9 Debt
During the six months ended
Issuance of long-term debt
During the six months ended
Credit facility
Effective
Commercial paper program
Effective
10 Financial instruments
A. Fair values of financial instruments
The Company categorizes its financial assets and liabilities measured at fair value into a three-level hierarchy that prioritizes those inputs to valuation techniques used to measure fair value based on the degree to which they are observable. The three levels of the fair value hierarchy are as follows: Level 1 inputs are quoted prices in active markets for identical assets and liabilities; Level 2 inputs, other than quoted prices included within Level 1, are observable for the asset or liability either directly or indirectly; and Level 3 inputs are not observable in the market.
The Company's short-term financial instruments include cash and cash equivalents, accounts receivable, accounts payable and accrued liabilities, and short-term borrowings, including commercial paper and term loans. The carrying value of short-term financial instruments approximate their fair value.
The carrying value of the Company's debt does not approximate its fair value. The estimated fair value has been determined based on market information, where available, or by discounting future payments of principal and interest at estimated interest rates expected to be available to the Company at the balance sheet date. All measurements are classified as Level 2. The Company's long-term debt, including current maturities, with a carrying value of
B. Financial risk management
Foreign exchange ("FX") management
Net investment hedge
The majority of the Company's
11 Share repurchases
On
On
All purchases were made in accordance with the respective NCIB at prevailing market prices plus brokerage fees, with consideration allocated to "Share capital" up to the average carrying amount of the Common Shares and any excess allocated to "Retained earnings".
In accordance with Canadian tax legislation, the Company has accrued for a 2% tax on the fair market value of Common Shares repurchased (net of qualifying issuances of equity) as a direct cost of Common Share repurchases recognized in Shareholders' equity. During the three and six months ended
The following table provides activities under the share repurchase program:
For the three months | For the six months | |||
2026 | 2025 | 2026 | 2025 | |
Number of Common Shares repurchased(1) | 10,855,699 | 12,882,454 | 16,591,606 | 16,363,112 |
Weighted-average price per share(2) | $ 119.60 | $ 108.52 | $ 117.18 | $ 108.34 |
Amount of repurchase (in millions of Canadian dollars)(1)(2) | $ 1,298 | $ 1,398 | $ 1,944 | $ 1,773 |
(1) | Includes shares repurchased but not yet cancelled at end of period. |
(2) | Includes brokerage fees and applicable tax on share repurchases. |
12 Pension and other benefits
During the three months ended
Net periodic benefit (recovery) cost for defined benefit pension plans and other benefits included the following components:
For the three months ended | ||||||
Pensions | Other benefits | Total | ||||
(in millions of Canadian dollars) | 2026 | 2025 | 2026 | 2025 | 2026 | 2025 |
Current service cost | $ 19 | $ 21 | $ 3 | $ 4 | $ 22 | $ 25 |
Other components of net periodic benefit | ||||||
Interest cost on benefit obligation | 118 | 116 | 6 | 6 | 124 | 122 |
Expected return on plan assets | (234) | (231) | — | — | (234) | (231) |
Recognized net actuarial (gain) loss | (1) | 2 | — | (1) | (1) | 1 |
Amortization of prior service costs | 1 | 1 | — | — | 1 | 1 |
Total other components of net periodic benefit (recovery) cost | (116) | (112) | 6 | 5 | (110) | (107) |
Net periodic benefit (recovery) cost | $ (97) | $ (91) | $ 9 | $ 9 | $ (88) | $ (82) |
For the six months ended | ||||||
Pensions | Other benefits | Total | ||||
(in millions of Canadian dollars) | 2026 | 2025 | 2026 | 2025 | 2026 | 2025 |
Current service cost | $ 38 | $ 42 | $ 6 | $ 7 | $ 44 | $ 49 |
Other components of net periodic benefit | ||||||
Interest cost on benefit obligation | 236 | 233 | 11 | 11 | 247 | 244 |
Expected return on plan assets | (468) | (463) | — | — | (468) | (463) |
Recognized net actuarial (gain) loss | (2) | 4 | — | (1) | (2) | 3 |
Amortization of prior service costs | 3 | 2 | — | — | 3 | 2 |
Total other components of net periodic benefit (recovery) cost | (231) | (224) | 11 | 10 | (220) | (214) |
Net periodic benefit (recovery) cost | $ (193) | $ (182) | $ 17 | $ 17 | $ (176) | $ (165) |
13 Stock-based compensation
As at
Stock options plan
In the six months ended
Under the fair value method, the fair value of the stock options at the grant date was approximately $30 million.
Performance share unit plans
During the six months ended
The performance period for all PSUs and all PDSUs granted in the six months ended
The performance period for the 544,175 PSUs and 26,333 PDSUs granted in 2023 was
14 Contingencies
Litigation
In the normal course of its operations, the Company becomes involved in various legal actions, including claims relating to injuries and damage to property. The Company maintains provisions it considers to be adequate for such actions. While the final outcome with respect to actions outstanding or pending as at
Legal proceedings related to Lac-Mégantic rail accident
On
Following the derailment, MMAC sought court protection in
A number of legal proceedings, set out below, were commenced in
(1)
(2) The AGQ sued the Company in the
(3) A class action in the
(4) Eight subrogated insurers sued the Company in the Québec Superior Court claiming approximately
On
(5) Forty-eight plaintiffs (all individual claims joined in one action) sued the Company, MMAC, and Harding in the
(6) The MMAR
(7) The class and mass tort action commenced against the Company in
(8) The trustee for the wrongful death trust commenced Carmack Amendment claims against the Company in North Dakota Federal Court, seeking to recover approximately
At this stage of the proceedings, any potential responsibility and the quantum of potential losses cannot be determined. Nevertheless, the Company denies liability and is vigorously defending these proceedings.
Court decision related to Remington Development Corporation legal claim
On
2014 tax assessment
On
On
On
On
On
On
Environmental liabilities
Environmental remediation accruals, recognized on an undiscounted basis unless a reliable, determinable estimate as to an amount and timing of costs can be established, cover site-specific remediation programs.
The accruals for environmental remediation represent the Company's best estimate of its probable future obligation and include both asserted and unasserted claims, without reduction for anticipated recoveries from third parties. Although the recognized accruals include the Company's best estimate of all probable costs, the Company's total environmental remediation costs cannot be predicted with certainty. Accruals for environmental remediation may change from time to time as new information about previously untested sites becomes known, and as environmental laws and regulations evolve and advances are made in environmental remediation technology. The accruals may also vary as the courts decide legal proceedings against outside parties responsible for contamination. These potential charges, which cannot be quantified at this time, may materially affect income in the particular period in which a charge is recognized. Costs related to existing, but as yet unknown, or future contamination will be accrued in the period in which they become probable and reasonably estimable.
Provisions for environmental remediation costs are recognized in the Company's Interim Consolidated Balance Sheets in "Other long-term liabilities", except for the current portion, which is recognized in "Accounts payable and accrued liabilities". The total amount provided as at
Summary of Rail Data
Second Quarter | Year-to-date | ||||||||
Financial (in millions, except per share data) | 2026 | 2025 | Total Change | % Change | 2026 | 2025 | Total Change | % Change | |
Revenues | |||||||||
Freight | $ 4,088 | $ 3,629 | $ 459 | 13 | $ 7,716 | $ 7,356 | $ 360 | 5 | |
Non-freight | 76 | 70 | 6 | 9 | 149 | 138 | 11 | 8 | |
Total revenues | 4,164 | 3,699 | 465 | 13 | 7,865 | 7,494 | 371 | 5 | |
Operating expenses | |||||||||
Compensation and benefits | 723 | 659 | 64 | 10 | 1,414 | 1,341 | 73 | 5 | |
Fuel | 618 | 405 | 213 | 53 | 1,076 | 886 | 190 | 21 | |
Materials | 130 | 124 | 6 | 5 | 257 | 248 | 9 | 4 | |
Equipment rents | 97 | 103 | (6) | (6) | 192 | 202 | (10) | (5) | |
Depreciation and amortization | 519 | 493 | 26 | 5 | 1,031 | 997 | 34 | 3 | |
Purchased services and other | 605 | 572 | 33 | 6 | 1,165 | 1,160 | 5 | — | |
Total operating expenses | 2,692 | 2,356 | 336 | 14 | 5,135 | 4,834 | 301 | 6 | |
Operating income | 1,472 | 1,343 | 129 | 10 | 2,730 | 2,660 | 70 | 3 | |
Other (income) expense | (14) | (16) | 2 | (13) | 6 | (9) | 15 | (167) | |
Other components of net periodic benefit recovery | (110) | (107) | (3) | 3 | (220) | (214) | (6) | 3 | |
Net interest expense | 237 | 208 | 29 | 14 | 465 | 424 | 41 | 10 | |
Gain on sale of equity investment | — | (333) | 333 | (100) | — | (333) | 333 | (100) | |
Income before income tax expense | 1,359 | 1,591 | (232) | (15) | 2,479 | 2,792 | (313) | (11) | |
Current income tax expense | 281 | 348 | (67) | (19) | 541 | 614 | (73) | (12) | |
Deferred income tax expense | 54 | 9 | 45 | 500 | 69 | 35 | 34 | 97 | |
Income tax expense | 335 | 357 | (22) | (6) | 610 | 649 | (39) | (6) | |
Net income | $ 1,024 | $ 1,234 | $ (210) | (17) | $ 1,869 | $ 2,143 | $ (274) | (13) | |
Net loss attributable to non-controlling interest | — | — | — | — | (1) | (1) | — | — | |
Net income attributable to controlling shareholders | $ 1,024 | $ 1,234 | $ (210) | (17) | $ 1,870 | $ 2,144 | $ (274) | (13) | |
Operating ratio (%) | 64.6 | 63.7 | 0.9 | 90 bps | 65.3 | 64.5 | 0.8 | 80 bps | |
Basic earnings per share | $ 1.16 | $ 1.34 | $ (0.18) | (13) | $ 2.10 | $ 2.31 | $ (0.21) | (9) | |
Diluted earnings per share | $ 1.15 | $ 1.33 | $ (0.18) | (14) | $ 2.10 | $ 2.31 | $ (0.21) | (9) | |
Shares Outstanding | |||||||||
Weighted average number of basic shares outstanding | 886.4 | 923.8 | (37.4) | (4) | 891.6 | 928.4 | (36.8) | (4) | |
Weighted average number of diluted shares outstanding (millions) | 887.1 | 924.8 | (37.7) | (4) | 892.2 | 929.5 | (37.3) | (4) | |
Foreign Exchange | |||||||||
Average foreign exchange rate (U.S.$/Canadian$) | 0.72 | 0.72 | — | — | 0.72 | 0.71 | 0.01 | 1 | |
Average foreign exchange rate (Canadian$/U.S.$) | 1.38 | 1.38 | — | — | 1.38 | 1.41 | (0.03) | (2) | |
Average foreign exchange rate (Mexican | 12.55 | 14.09 | (1.54) | (11) | 12.67 | 14.16 | (1.49) | (11) | |
Average foreign exchange rate (Canadian$/Mexican peso) | 0.0797 | 0.0710 | 0.0087 | 12 | 0.0789 | 0.0706 | 0.0083 | 12 | |
Summary of Rail Data (Continued)
Second Quarter | Year-to-date | ||||||||||
Commodity Data | 2026 | 2025 | Total Change | % Change | FX Adjusted % Change(1) | 2026 | 2025 | Total Change | % Change | FX Adjusted % Change(1) | |
Freight Revenues (millions) | |||||||||||
- Grain | $ 925 | $ 743 | $ 182 | 24 | 24 | $ 1,796 | $ 1,531 | $ 265 | 17 | 19 | |
- Coal | 209 | 256 | (47) | (18) | (18) | 435 | 513 | (78) | (15) | (15) | |
- Potash | 184 | 167 | 17 | 10 | 10 | 333 | 323 | 10 | 3 | 4 | |
- Fertilizers and sulphur | 110 | 98 | 12 | 12 | 12 | 222 | 212 | 10 | 5 | 7 | |
- Forest products | 198 | 195 | 3 | 2 | 2 | 379 | 412 | (33) | (8) | (6) | |
- Energy, chemicals and plastics | 777 | 712 | 65 | 9 | 8 | 1,477 | 1,470 | 7 | — | 2 | |
- Metals, minerals and consumer products | 524 | 444 | 80 | 18 | 16 | 962 | 892 | 70 | 8 | 8 | |
- Automotive | 403 | 330 | 73 | 22 | 19 | 699 | 645 | 54 | 8 | 7 | |
- Intermodal | 758 | 684 | 74 | 11 | 11 | 1,413 | 1,358 | 55 | 4 | 5 | |
Total Freight Revenues | $ 4,088 | $ 3,629 | $ 459 | 13 | 12 | $ 7,716 | $ 7,356 | $ 360 | 5 | 6 | |
Freight Revenue per Revenue Ton-Mile | |||||||||||
- Grain | 5.19 | 4.96 | 0.23 | 5 | 4 | 5.19 | 5.12 | 0.07 | 1 | 3 | |
- Coal | 4.82 | 4.22 | 0.60 | 14 | 14 | 4.57 | 4.33 | 0.24 | 6 | 6 | |
- Potash | 3.53 | 3.15 | 0.38 | 12 | 12 | 3.42 | 3.32 | 0.10 | 3 | 4 | |
- Fertilizers and sulphur | 8.96 | 8.03 | 0.93 | 12 | 12 | 8.49 | 8.01 | 0.48 | 6 | 8 | |
- Forest products | 9.02 | 8.72 | 0.30 | 3 | 3 | 8.81 | 9.00 | (0.19) | (2) | — | |
- Energy, chemicals and plastics | 8.00 | 7.78 | 0.22 | 3 | 2 | 7.82 | 7.80 | 0.02 | — | 2 | |
- Metals, minerals and consumer products | 9.98 | 9.05 | 0.93 | 10 | 9 | 9.57 | 9.31 | 0.26 | 3 | 3 | |
- Automotive | 26.43 | 23.31 | 3.12 | 13 | 11 | 25.09 | 24.35 | 0.74 | 3 | 2 | |
- Intermodal | 7.36 | 6.67 | 0.69 | 10 | 10 | 7.13 | 6.98 | 0.15 | 2 | 3 | |
Total Freight Revenue per RTM | 7.10 | 6.54 | 0.56 | 9 | 8 | 6.87 | 6.73 | 0.14 | 2 | 3 | |
Freight Revenue per Carload | |||||||||||
- Grain | $ 5,506 | $ 5,210 | $ 296 | 6 | 6 | $ 5,664 | $ 5,541 | $ 123 | 2 | 4 | |
- Coal | 2,214 | 2,159 | 55 | 3 | 3 | 2,133 | 2,165 | (32) | (1) | (1) | |
- Potash | 4,026 | 3,523 | 503 | 14 | 14 | 3,797 | 3,704 | 93 | 3 | 4 | |
- Fertilizers and sulphur | 6,832 | 6,282 | 550 | 9 | 9 | 6,568 | 6,347 | 221 | 3 | 5 | |
- Forest products | 6,367 | 5,945 | 422 | 7 | 7 | 6,153 | 6,095 | 58 | 1 | 3 | |
- Energy, chemicals and plastics | 5,534 | 4,989 | 545 | 11 | 10 | 5,363 | 5,154 | 209 | 4 | 5 | |
- Metals, minerals and consumer products | 3,908 | 3,541 | 367 | 10 | 9 | 3,833 | 3,571 | 262 | 7 | 7 | |
- Automotive | 6,238 | 5,288 | 950 | 18 | 15 | 6,010 | 5,366 | 644 | 12 | 11 | |
- Intermodal | 1,667 | 1,489 | 178 | 12 | 12 | 1,595 | 1,517 | 78 | 5 | 6 | |
Total Freight Revenue per Carload | $ 3,558 | $ 3,164 | $ 394 | 12 | 12 | $ 3,456 | $ 3,267 | $ 189 | 6 | 7 | |
(1) | This earnings measure has no standardized meaning prescribed by GAAP and, therefore, is unlikely to be comparable to similar measures presented by other companies. This measure is defined and reconciled in Non-GAAP Measures of this Earnings Release. |
Summary of Rail Data (Continued)
Second Quarter | Year-to-date | ||||||||
Commodity Data | 2026 | 2025 | Total | % | 2026 | 2025 | Total | % | |
Millions of RTM | |||||||||
- Grain | 17,814 | 14,970 | 2,844 | 19 | 34,599 | 29,912 | 4,687 | 16 | |
- Coal | 4,338 | 6,073 | (1,735) | (29) | 9,522 | 11,856 | (2,334) | (20) | |
- Potash | 5,217 | 5,304 | (87) | (2) | 9,728 | 9,723 | 5 | — | |
- Fertilizers and sulphur | 1,227 | 1,220 | 7 | 1 | 2,616 | 2,647 | (31) | (1) | |
- Forest products | 2,194 | 2,236 | (42) | (2) | 4,300 | 4,579 | (279) | (6) | |
- Energy, chemicals and plastics | 9,715 | 9,148 | 567 | 6 | 18,892 | 18,849 | 43 | — | |
- Metals, minerals and consumer products | 5,248 | 4,905 | 343 | 7 | 10,051 | 9,586 | 465 | 5 | |
- Automotive | 1,525 | 1,416 | 109 | 8 | 2,786 | 2,649 | 137 | 5 | |
- Intermodal | 10,299 | 10,257 | 42 | — | 19,808 | 19,452 | 356 | 2 | |
Total RTMs | 57,577 | 55,529 | 2,048 | 4 | 112,302 | 109,253 | 3,049 | 3 | |
Carloads (thousands) | |||||||||
- Grain | 168.0 | 142.6 | 25.4 | 18 | 317.1 | 276.3 | 40.8 | 15 | |
- Coal | 94.4 | 118.6 | (24.2) | (20) | 203.9 | 237.0 | (33.1) | (14) | |
- Potash | 45.7 | 47.4 | (1.7) | (4) | 87.7 | 87.2 | 0.5 | 1 | |
- Fertilizers and sulphur | 16.1 | 15.6 | 0.5 | 3 | 33.8 | 33.4 | 0.4 | 1 | |
- Forest products | 31.1 | 32.8 | (1.7) | (5) | 61.6 | 67.6 | (6.0) | (9) | |
- Energy, chemicals and plastics | 140.4 | 142.7 | (2.3) | (2) | 275.4 | 285.2 | (9.8) | (3) | |
- Metals, minerals and consumer products | 134.1 | 125.4 | 8.7 | 7 | 251.0 | 249.8 | 1.2 | — | |
- Automotive | 64.6 | 62.4 | 2.2 | 4 | 116.3 | 120.2 | (3.9) | (3) | |
- Intermodal | 454.7 | 459.5 | (4.8) | (1) | 885.8 | 894.9 | (9.1) | (1) | |
Total Carloads | 1,149.1 | 1,147.0 | 2.1 | — | 2,232.6 | 2,251.6 | (19.0) | (1) | |
Second Quarter | Year-to-date | ||||||||||
2026 | 2025 | Total | % Change | FX | 2026 | 2025 | Total | % | FX | ||
Operating Expenses (millions) | |||||||||||
Compensation and benefits | $ 723 | $ 659 | $ 64 | 10 | 8 | $ 1,414 | $ 1,341 | $ 73 | 5 | 5 | |
Fuel | 618 | 405 | 213 | 53 | 49 | 1,076 | 886 | 190 | 21 | 21 | |
Materials | 130 | 124 | 6 | 5 | 3 | 257 | 248 | 9 | 4 | 3 | |
Equipment rents | 97 | 103 | (6) | (6) | (6) | 192 | 202 | (10) | (5) | (3) | |
Depreciation and amortization | 519 | 493 | 26 | 5 | 5 | 1,031 | 997 | 34 | 3 | 5 | |
Purchased services and other | 605 | 572 | 33 | 6 | 5 | 1,165 | 1,160 | 5 | — | 1 | |
Total Operating Expenses | $ 2,692 | $ 2,356 | $ 336 | 14 | 13 | $ 5,135 | $ 4,834 | $ 301 | 6 | 6 | |
(1) | This earnings measure has no standardized meaning prescribed by GAAP and, therefore, is unlikely to be comparable to similar measures presented by other companies. This measure is defined and reconciled in Non-GAAP Measures of this Earnings Release. |
Summary of Rail Data (Continued)
Second Quarter | Year-to-date | ||||||||
2026 | 2025 | Total Change | % Change | 2026 | 2025 | Total Change | % Change | ||
Operations Performance | |||||||||
Gross ton-miles ("GTMs") (millions) | 107,585 | 101,973 | 5,612 | 6 | 208,210 | 200,385 | 7,825 | 4 | |
Train miles (thousands) | 12,389 | 11,960 | 429 | 4 | 23,912 | 23,764 | 148 | 1 | |
Average train weight - excluding local traffic (tons) | 9,294 | 9,187 | 107 | 1 | 9,334 | 9,111 | 223 | 2 | |
Average train length - excluding local traffic (feet) | 7,812 | 7,844 | (32) | — | 7,834 | 7,737 | 97 | 1 | |
Average terminal dwell (hours) | 8.6 | 10.2 | (1.6) | (16) | 9.0 | 10.2 | (1.2) | (12) | |
Average train speed (miles per hour, or "mph")(1) | 20.6 | 19.3 | 1.3 | 7 | 20.3 | 19.2 | 1.1 | 6 | |
Locomotive productivity (GTMs / operating | 177 | 169 | 8 | 5 | 174 | 166 | 8 | 5 | |
Fuel efficiency(3) | 0.992 | 1.034 | (0.042) | (4) | 1.017 | 1.049 | (0.032) | (3) | |
106.7 | 105.5 | 1.2 | 1 | 211.7 | 210.2 | 1.5 | 1 | ||
Average fuel price ( | 4.19 | 2.77 | 1.42 | 51 | 3.69 | 2.99 | 0.70 | 23 | |
Total Employees and Workforce | |||||||||
Total employees (average)(5) | 19,835 | 20,138 | (303) | (2) | 19,687 | 19,943 | (256) | (1) | |
Total employees (end of period)(5) | 19,704 | 20,107 | (403) | (2) | 19,704 | 20,107 | (403) | (2) | |
Workforce (end of period)(6) | 19,716 | 20,189 | (473) | (2) | 19,716 | 20,189 | (473) | (2) | |
Safety Indicators(7) | |||||||||
FRA personal injuries per 200,000 employee-hours | 0.96 | 0.73 | 0.23 | 32 | 0.94 | 0.85 | 0.09 | 11 | |
FRA train accidents per million train-miles | 1.00 | 0.97 | 0.03 | 3 | 0.93 | 0.68 | 0.25 | 37 | |
(1) | Average train speed is defined as a measure of the line-haul movement from origin to destination including terminal dwell hours. It is calculated by dividing the total train miles travelled by the total train hours operated. This calculation does not include delay time related to customers or foreign railroads and excludes the time and distance travelled by: i) trains used in or around CPKC's yards; ii) passenger trains; and iii) trains used for repairing track. An increase in average train speed indicates improved on-time performance resulting in improved asset utilization. |
(2) | Locomotive productivity is defined as the daily average GTMs divided by daily average operating horsepower. Operating horsepower excludes units offline, tied up or in storage, or in use on other railways, and includes foreign units. |
(3) | Fuel efficiency is defined as |
(4) | Fuel consumed includes gallons from freight, yard and commuter service but excludes fuel used in capital projects and other non-freight activities. |
(5) | An employee is defined as an individual currently engaged in full-time, part-time, or seasonal employment with CPKC. CPKC monitors employment levels in order to efficiently meet service and strategic requirements. The number of employees is a key driver to total compensation and benefits costs. |
(6) | Workforce is defined as employees plus contractors and consultants. |
(7) | Federal Railroad Administration ("FRA") personal injuries per 200,000 employee-hours for the three and six months ended |
Non-GAAP Measures
The Company presents Non-GAAP measures to provide a basis for evaluating underlying earnings and liquidity trends in the Company's current period's financial results that can be compared with the results of operations in prior periods. Management believes these Non-GAAP measures facilitate a multi-period assessment of long-term profitability.
These Non-GAAP measures have no standardized meanings and are not defined by accounting principles generally accepted in
Non-GAAP Performance and Liquidity Measures
The Company uses Core adjusted operating income, Core adjusted operating ratio, Core adjusted income, and Core adjusted diluted earnings per share ("EPS") to evaluate the Company's operating performance and for planning and forecasting future business operations and future profitability. In addition to the Non-GAAP performance measures noted above, other Non-GAAP liquidity measures include Adjusted free cash and Adjusted net debt to adjusted earnings before interest, taxes, depreciation, and amortization ("EBITDA") ratio.
Management believes these Non-GAAP measures provide meaningful supplemental information about our financial results and improved comparability to past performance because they exclude certain significant items that are not considered indicative of future or past financial trends either by nature or amount. As a result, these items are excluded for management's assessment of operational performance, allocation of resources, and preparation of annual budgets. These significant items may include, but are not limited to, restructuring and asset impairment charges, individually significant gains and losses from sales of assets or equity investments, acquisition-related costs, certain adjustments to provisions and settlements of Mexican taxes, advisory costs related to rail consolidation matters, discrete tax items, changes in income tax rates, changes to uncertain tax items, and certain items that are not typical of normal business activities or are outside the control of management. Acquisition-related costs include legal, consulting, integration costs including third-party services and system migration, restructuring and special termination benefit costs, employee retention, and synergy incentive costs. These items may not be non-recurring and may include items that are settled in cash. Specifically, due to the magnitude of the Kansas City Southern ("KCS") acquisition, its significant impact to the Company's business and complexity of integrating the acquired business and operations, the Company continues to expect to incur acquisition-related costs. Management believes excluding these significant items from GAAP results provides an additional viewpoint which may give users a consistent understanding of the Company's financial performance when performing a multi-period assessment including assessing the likelihood of future results. Accordingly, these Non-GAAP financial measures may provide additional insight to investors and other external users of the Company's financial information.
In addition, these Non-GAAP measures exclude KCS purchase accounting. KCS purchase accounting represents the amortization of basis differences being the incremental depreciation or amortization in relation to fair value adjustments to properties, intangible assets, and KCS's investments, the change in fair value of debt of KCS assumed on
Significant items recognized in "Net income attributable to controlling shareholders" as reported on a GAAP basis for the first six months of 2026, the year ended
2026:
- during the first six months, acquisition-related costs of
$36 million in connection with the KCS acquisition ($27 million after current income tax recovery of$9 million ) including$25 million recognized in "Compensation and benefits" primarily related to synergy related incentive compensation and restructuring costs, and$11 million recognized in "Purchased services and other" primarily related to system migration, legal fees, and other third party purchased services, that unfavourably impacted Diluted EPS by3 cents as follows:
- in the second quarter, acquisition-related costs of
$27 million ($20 million after current income tax recovery of$7 million ) including$21 million recognized in "Compensation and benefits", and$6 million recognized in "Purchased services and other", that unfavourably impacted Diluted EPS by3 cents ; - in the first quarter, acquisition-related costs of
$9 million ($7 million after current income tax recovery of$2 million ) including$4 million recognized in "Compensation and benefits", and$5 million recognized in "Purchased services and other", that unfavourably impacted Diluted EPS by1 cent ;
- in the second quarter, acquisition-related costs of
- during the first six months, advisory costs related to the analysis and advocacy in connection with the STB's review of the proposed merger between Union Pacific Corporation and Norfolk Southern Corporation of
$27 million ($21 million after current income tax recovery of$6 million ) recognized in "Purchased services and other", that unfavourably impacted Diluted EPS by2 cents as follows:
- in the second quarter, advisory costs of
$14 million ($11 million after current income tax recovery of$3 million ) recognized in "Purchased services and other", that unfavourably impacted Diluted EPS by1 cent ; and - in the first quarter, advisory costs of
$13 million ($10 million after current income tax recovery of$3 million ) recognized in "Purchased services and other", that unfavourably impacted Diluted EPS by1 cent .
- in the second quarter, advisory costs of
2025:
- during the course of the year, a gain on sale of an equity investment of
$333 million ($256 million after current income tax expense of$102 million net of deferred income tax recovery of$25 million ) recognized in "Gain on sale of equity investment", that favourably impacted Diluted EPS by27 cents as follows:
- in the fourth quarter, a current tax expense of
$26 million recognized in "Current income tax expense" due to the finalization of the related tax provision, that unfavourably impacted Diluted EPS by3 cents ; - in the second quarter, a gain on sale of an equity investment of
$333 million ($282 million after current income tax expense of$76 million net of deferred income tax recovery of$25 million ) recognized in "Gain on sale of equity investment", that favourably impacted Diluted EPS by30 cents ;
- in the fourth quarter, a current tax expense of
- during the course of the year, acquisition-related costs of $72 million in connection with the KCS acquisition ($56 million after current income tax recovery of
$16 million ), including $11 million recognized in "Compensation and benefits" primarily related to synergy related incentive compensation and restructuring costs, $1 million recognized in "Materials", $51 million recognized in "Purchased services and other" primarily related to system migration, legal fees, and other third party purchased services, and$9 million recognized in "Other components of net period benefit recovery" related to special termination benefit costs, that unfavourably impacted Diluted EPS by6 cents as follows:
- in the fourth quarter, acquisition-related costs of
$20 million ($17 million after current income tax recovery of$3 million ) including a recovery of$5 million recognized in "Compensation and benefits", an expense of$16 million recognized in "Purchased services and other", and an expense of$9 million recognized in "Other components of net period benefit recovery", that unfavourably impacted Diluted EPS by2 cents ; - in the third quarter, acquisition-related costs of
$13 million ($10 million after current income tax recovery of$3 million ) including$4 million recognized in "Compensation and benefits", and$9 million recognized in "Purchased services and other", that unfavourably impacted Diluted EPS by1 cent ; - in the second quarter, acquisition-related costs of
$19 million ($14 million after current income tax recovery of$5 million ) including$7 million recognized in "Compensation and benefits", and$12 million recognized in "Purchased services and other", that unfavourably impacted Diluted EPS by2 cents ; and - in the first quarter, acquisition-related costs of
$20 million ($15 million after current income tax recovery of$5 million ) including$5 million recognized in "Compensation and benefits",$1 million recognized in "Materials", and$14 million recognized in "Purchased services and other", that unfavourably impacted Diluted EPS by2 cents .
- in the fourth quarter, acquisition-related costs of
2024:
- in the fourth quarter, a deferred income tax recovery of
$78 million due to a decrease in theLouisiana state corporate income tax rate, that favourably impacted Diluted EPS by9 cents ;
- during the last six months, adjustments to provisions and settlements of Mexican taxes of
$14 million recovery ($12 million after deferred income tax expense of$2 million ) recognized in "Compensation and benefits", that favourably impacted Diluted EPS by1 cent as follows:
- in the fourth quarter, adjustments to provisions and settlements of Mexican taxes of
$7 million recovery ($6 million after deferred income tax expense of$1 million ) recognized in "Compensation and benefits", that had minimal impact on Diluted EPS; - in the third quarter, adjustments to provisions and settlements of Mexican taxes of
$7 million recovery ($6 million after deferred income tax expense of$1 million ) recognized in "Compensation and benefits", that favourably impacted Diluted EPS by1 cent ;
- in the fourth quarter, adjustments to provisions and settlements of Mexican taxes of
- during the last six months, acquisition-related costs of
$58 million in connection with the KCS acquisition ($43 million after current income tax recovery of$15 million ), including$12 million recognized in "Compensation and benefits" primarily related to retention and synergy related incentive compensation costs;$2 million recognized in "Materials"; and$44 million recognized in "Purchased services and other" primarily related to system migration, relocation expenses, legal and consulting fees, that unfavourably impacted Diluted EPS by5 cents as follows:
- in the fourth quarter, acquisition-related costs of
$22 million ($17 million after current income tax recovery of $5 million) including$1 million recognized in "Compensation and benefits",$1 million recognized in "Materials", and$20 million recognized in "Purchased services and other", that unfavourably impacted Diluted EPS by2 cents ; and - in the third quarter, acquisition-related costs of
$36 million ($26 million after current income tax recovery of$10 million ) including$11 million recognized in "Compensation and benefits",$1 million recognized in "Materials", and$24 million recognized in "Purchased services and other", that unfavourably impacted Diluted EPS by3 cents .
- in the fourth quarter, acquisition-related costs of
KCS purchase accounting recognized in "Net income attributable to controlling shareholders" as reported on a GAAP basis for the first six months of 2026, the year ended
2026:
- during the first six months, KCS purchase accounting of
$184 million ($134 million after deferred income tax recovery of$50 million ), including costs of$175 million recognized in "Depreciation and amortization",$1 million recognized in "Purchased services and other" related to the amortization of equity investments,$11 million recognized in "Net interest expense", and a recovery of$3 million recognized in "Net loss attributable to non-controlling interest", that unfavourably impacted Diluted EPS by15 cents as follows:
- in the second quarter, KCS purchase accounting of
$93 million ($68 million after deferred income tax recovery of$25 million ), including costs of$88 million recognized in "Depreciation and amortization",$6 million recognized in "Net interest expense", and a recovery of$1 million recognized in "Net loss attributable to non-controlling interest", that unfavourably impacted Diluted EPS by8 cents ; and - in the first quarter, KCS purchase accounting of
$91 million ($66 million after deferred income tax recovery of$25 million ), including costs of$87 million recognized in "Depreciation and amortization",$1 million recognized in "Purchased services and other",$5 million recognized in "Net interest expense", and a recovery of$2 million recognized in "Net loss attributable to non-controlling interest", that unfavourably impacted Diluted EPS by8 cents .
- in the second quarter, KCS purchase accounting of
2025:
- during the course of the year, KCS purchase accounting of
$391 million ($285 million after deferred income tax recovery of$106 million ), including costs of$373 million recognized in "Depreciation and amortization",$3 million recognized in "Purchased services and other" related to the amortization of equity investments,$21 million recognized in "Net interest expense",$1 million recognized in "Other (income) expense", and a recovery of$7 million recognized in "Net loss attributable to non-controlling interest", that unfavourably impacted Diluted EPS by31 cents as follows:
- in the fourth quarter, KCS purchase accounting of
$109 million ($79 million after deferred income tax recovery of$30 million ), including costs of$105 million recognized in "Depreciation and amortization",$1 million recognized in "Purchased services and other",$5 million recognized in "Net interest expense", and a recovery of$2 million recognized in "Net loss attributable to non-controlling interest", that unfavourably impacted Diluted EPS by8 cents ; - in the third quarter, KCS purchase accounting of
$95 million ($69 million after deferred income tax recovery of$26 million ), including costs of$90 million recognized in "Depreciation and amortization",$1 million recognized in "Purchased services and other",$6 million recognized in "Net interest expense", and a recovery of$2 million recognized in "Net loss attributable to non-controlling interest", that unfavourably impacted Diluted EPS by8 cents ; - in the second quarter, KCS purchase accounting of
$95 million ($70 million after deferred income tax recovery of$25 million ), including costs of$91 million recognized in "Depreciation and amortization",$5 million recognized in "Net interest expense", and a recovery of$1 million recognized in "Net loss attributable to non-controlling interest", that unfavourably impacted Diluted EPS by7 cents ; and - in the first quarter, KCS purchase accounting of
$92 million ($67 million after deferred income tax recovery of$25 million ), including costs of$87 million recognized in "Depreciation and amortization",$1 million recognized in "Purchased services and other",$5 million recognized in "Net interest expense",$1 million recognized in "Other (income) expense", and a recovery of$2 million recognized in "Net loss attributable to non-controlling interest", that unfavourably impacted Diluted EPS by7 cents .
- in the fourth quarter, KCS purchase accounting of
2024:
- during the last six months, KCS purchase accounting of
$182 million ($133 million after deferred income tax recovery of$49 million ), including$172 million recognized in "Depreciation and amortization",$1 million recognized in "Purchased services and other" related to the amortization of equity investments,$10 million recognized in "Net interest expense",$2 million recognized in "Other (income) expense", and a recovery of$3 million recognized in "Net loss attributable to non-controlling interest", that unfavourably impacted Diluted EPS by15 cents as follows:
- in the fourth quarter, KCS purchase accounting of
$93 million ($68 million after deferred income tax recovery of$25 million ), including costs of$87 million recognized in "Depreciation and amortization",$1 million recognized in "Purchased services and other",$6 million recognized in "Net interest expense",$1 million recognized in "Other (income) expense", and a recovery of$2 million recognized in "Net loss attributable to non-controlling interest", that unfavourably impacted Diluted EPS by8 cents ; and - in the third quarter, KCS purchase accounting of
$89 million ($65 million after deferred income tax recovery of$24 million ), including costs of$85 million recognized in "Depreciation and amortization",$4 million recognized in "Net interest expense",$1 million recognized in "Other (income) expense", and a recovery of$1 million recognized in "Net loss attributable to non-controlling interest", that unfavourably impacted Diluted EPS by7 cents .
- in the fourth quarter, KCS purchase accounting of
Reconciliation of GAAP Performance Measures to Non-GAAP Performance Measures
The following tables reconcile the most directly comparable measures presented in accordance with GAAP to the Non-GAAP measures:
Core Adjusted Income and Core Adjusted Diluted EPS
Core adjusted income is calculated as Net income attributable to controlling shareholders reported on a GAAP basis adjusted for significant items and KCS purchase accounting.
For the three months | For the six months | |||
(in millions of Canadian dollars) | 2026 | 2025 | 2026 | 2025 |
Net income attributable to controlling shareholders as reported | $ 1,024 | $ 1,234 | $ 1,870 | $ 2,144 |
Less: | ||||
Significant items (pre-tax): | ||||
Gain on sale of equity investment | — | 333 | — | 333 |
Acquisition-related costs | (27) | (19) | (36) | (39) |
Advisory costs related to rail consolidation matters | (14) | — | (27) | — |
KCS purchase accounting | (93) | (95) | (184) | (187) |
Add: | ||||
Tax effect of adjustments(1) | (35) | 21 | (65) | (9) |
Core adjusted income | $ 1,123 | $ 1,036 | $ 2,052 | $ 2,028 |
(1) | The tax effect of adjustments was calculated as the pre-tax effect of the significant items and KCS purchase accounting listed above multiplied by the applicable tax rate for the above items of 26.10% and 26.31% for the three and six months ended |
Core adjusted diluted EPS is calculated using Diluted EPS reported on a GAAP basis adjusted for significant items and KCS purchase accounting.
For the three months | For the six months | For the year ended December 31 | |||
2026 | 2025 | 2026 | 2025 | 2025 | |
Diluted EPS as reported | $ 1.15 | $ 1.33 | $ 2.10 | $ 2.31 | $ 4.51 |
Less: | |||||
Significant items (pre-tax): | |||||
Gain on sale of equity investment | — | 0.36 | — | 0.36 | 0.36 |
Acquisition-related costs | (0.03) | (0.02) | (0.04) | (0.04) | (0.08) |
Advisory costs related to rail consolidation | (0.01) | — | (0.03) | — | — |
KCS purchase accounting | (0.11) | (0.10) | (0.20) | (0.20) | (0.43) |
Add: | |||||
Tax effect of adjustments(1) | (0.03) | 0.03 | (0.07) | (0.01) | (0.05) |
Core adjusted diluted EPS | $ 1.27 | $ 1.12 | $ 2.30 | $ 2.18 | $ 4.61 |
(1) | The tax effect of adjustments was calculated as the pre-tax effect of the significant items and KCS purchase accounting listed above multiplied by the applicable tax rate for the above items of 26.10% and 26.31% for the three and six months ended |
Core Adjusted Operating Income and Core Adjusted Operating Ratio
Core adjusted operating income and Core adjusted operating ratio are calculated from reported GAAP revenue and operating expenses adjusted for, where applicable, (1) significant items (acquisition-related costs and advisory costs related to rail consolidation matters) that are reported within Operating income, and (2) KCS purchase accounting recognized in "Depreciation and amortization" and "Purchased services and other".
For the three months | For the six months | |||
(in millions of Canadian dollars) | 2026 | 2025 | 2026 | 2025 |
Operating income as reported | $ 1,472 | $ 1,343 | $ 2,730 | $ 2,660 |
Less: | ||||
Acquisition-related costs | (27) | (19) | (36) | (39) |
Advisory costs related to rail consolidation matters | (14) | — | (27) | — |
KCS purchase accounting in Operating expenses | (88) | (91) | (176) | (179) |
Core adjusted operating income | $ 1,601 | $ 1,453 | $ 2,969 | $ 2,878 |
For the three months | For the six months | |||
2026 | 2025 | 2026 | 2025 | |
Operating ratio as reported | 64.6 % | 63.7 % | 65.3 % | 64.5 % |
Less: | ||||
Acquisition-related costs | 0.6 % | 0.5 % | 0.5 % | 0.5 % |
Advisory costs related to rail consolidation matters | 0.3 % | — % | 0.3 % | — % |
KCS purchase accounting in Operating expenses | 2.1 % | 2.5 % | 2.2 % | 2.4 % |
Core adjusted operating ratio | 61.6 % | 60.7 % | 62.3 % | 61.6 % |
FX Adjusted % Change
FX adjusted % change allows certain financial results to be viewed without the impact of fluctuations in FX rates, thereby facilitating period-to-period comparisons in the analysis of trends in business performance. Financial result variances at constant currency are obtained by translating the comparable period of the prior year's results denominated in
FX adjusted % changes in revenues are also used in calculating FX adjusted % change in Freight revenue per carload and per RTM. FX adjusted % changes in revenues are as follows:
For the three months ended | |||||
(in millions of Canadian dollars) | Reported | Reported | Variance due to FX | FX Adjusted | FX Adjusted |
Freight revenues by line of business | |||||
Grain | $ 925 | $ 743 | $ 1 | $ 744 | 24 |
Coal | 209 | 256 | — | 256 | (18) |
Potash | 184 | 167 | — | 167 | 10 |
Fertilizers and sulphur | 110 | 98 | — | 98 | 12 |
Forest products | 198 | 195 | — | 195 | 2 |
Energy, chemicals and plastics | 777 | 712 | 6 | 718 | 8 |
Metals, minerals and consumer products | 524 | 444 | 6 | 450 | 16 |
Automotive | 403 | 330 | 8 | 338 | 19 |
Intermodal | 758 | 684 | — | 684 | 11 |
Freight revenues | 4,088 | 3,629 | 21 | 3,650 | 12 |
Non-freight revenues | 76 | 70 | — | 70 | 9 |
Total revenues | $ 4,164 | $ 3,699 | $ 21 | $ 3,720 | 12 |
For the six months ended | |||||
(in millions of Canadian dollars) | Reported | Reported | Variance due to FX | FX Adjusted | FX Adjusted |
Freight revenues by line of business | |||||
Grain | $ 1,796 | $ 1,531 | $ (21) | $ 1,510 | 19 |
Coal | 435 | 513 | (3) | 510 | (15) |
Potash | 333 | 323 | (4) | 319 | 4 |
Fertilizers and sulphur | 222 | 212 | (4) | 208 | 7 |
Forest products | 379 | 412 | (7) | 405 | (6) |
Energy, chemicals and plastics | 1,477 | 1,470 | (18) | 1,452 | 2 |
Metals, minerals and consumer products | 962 | 892 | — | 892 | 8 |
Automotive | 699 | 645 | 8 | 653 | 7 |
Intermodal | 1,413 | 1,358 | (11) | 1,347 | 5 |
Freight revenues | 7,716 | 7,356 | (60) | 7,296 | 6 |
Non-freight revenues | 149 | 138 | (1) | 137 | 9 |
Total revenues | $ 7,865 | $ 7,494 | $ (61) | $ 7,433 | 6 |
FX adjusted % changes in Operating expenses are as follows:
For the three months ended | |||||
(in millions of Canadian dollars) | Reported | Reported 2025 | Variance due to FX | FX Adjusted 2025 | FX Adjusted |
Compensation and benefits | $ 723 | $ 659 | $ 10 | $ 669 | 8 |
Fuel | 618 | 405 | 10 | 415 | 49 |
Materials | 130 | 124 | 2 | 126 | 3 |
Equipment rents | 97 | 103 | — | 103 | (6) |
Depreciation and amortization | 519 | 493 | — | 493 | 5 |
Purchased services and other | 605 | 572 | 6 | 578 | 5 |
Total operating expenses | $ 2,692 | $ 2,356 | $ 28 | $ 2,384 | 13 |
For the six months ended | |||||
(in millions of Canadian dollars) | Reported | Reported | Variance due to FX | FX Adjusted | FX Adjusted |
Compensation and benefits | $ 1,414 | $ 1,341 | $ 6 | $ 1,347 | 5 |
Fuel | 1,076 | 886 | 6 | 892 | 21 |
Materials | 257 | 248 | 1 | 249 | 3 |
Equipment rents | 192 | 202 | (4) | 198 | (3) |
Depreciation and amortization | 1,031 | 997 | (14) | 983 | 5 |
Purchased services and other | 1,165 | 1,160 | (2) | 1,158 | 1 |
Total operating expenses | $ 5,135 | $ 4,834 | $ (7) | $ 4,827 | 6 |
FX adjusted % change in Operating income is as follows:
For the three months ended | |||||
(in millions of Canadian dollars) | Reported | Reported 2025 | Variance due to FX | FX Adjusted 2025 | FX Adjusted |
Total revenues | $ 4,164 | $ 3,699 | $ 21 | $ 3,720 | 12 |
Total operating expenses | 2,692 | 2,356 | 28 | 2,384 | 13 |
Operating income | $ 1,472 | $ 1,343 | $ (7) | $ 1,336 | 10 |
For the six months ended | |||||
(in millions of Canadian dollars) | Reported | Reported 2025 | Variance due to FX | FX Adjusted 2025 | FX Adjusted % Change |
Total revenues | $ 7,865 | $ 7,494 | $ (61) | $ 7,433 | 6 |
Total operating expenses | 5,135 | 4,834 | (7) | 4,827 | 6 |
Operating income | $ 2,730 | $ 2,660 | $ (54) | $ 2,606 | 5 |
Reconciliation of GAAP Liquidity Measures to Non-GAAP Liquidity Measures
Adjusted Free Cash
Adjusted free cash is calculated as Net cash provided by operating activities, less Net cash used in investing activities, adjusted for changes in Cash and cash equivalents balances resulting from FX rate fluctuations, the cash flow impacts of acquisition-related costs associated with the KCS acquisition, certain settlements of Mexican taxes, advisory costs related to rail consolidation matters and net proceeds from the sale of an equity investment, net of tax which are not indicative of operating trends. Adjusted free cash is useful to investors and other external users of the Company's Interim Consolidated Financial Statements as it assists with the evaluation of the Company's ability to generate cash to satisfy debt obligations and other activities such as dividends, share repurchase programs, and other strategic opportunities, and is an important performance criterion in determining certain elements of the Company's long-term incentive plan. Adjusted free cash should be considered in addition to, rather than as a substitute for, Net cash provided by operating activities.
Reconciliation of Net Cash Provided by Operating Activities to Adjusted Free Cash
For the three months ended | For the six months ended | |||
(in millions of Canadian dollars) | 2026 | 2025 | 2026 | 2025 |
Net cash provided by operating activities as reported | $ 1,726 | $ 1,355 | $ 2,702 | $ 2,511 |
Net cash used in investing activities | (762) | (306) | (1,434) | (1,021) |
Effect of foreign currency fluctuations on foreign currency-denominated | 24 | (44) | 26 | (45) |
Less: | ||||
Settlements of Mexican taxes | — | (1) | — | (12) |
Acquisition-related costs | (6) | (8) | (27) | (23) |
Advisory costs related to rail consolidation matters | (9) | — | (20) | — |
Net proceeds from sale of equity investment, net of tax | — | 409 | — | 409 |
Adjusted free cash | $ 1,003 | $ 605 | $ 1,341 | $ 1,071 |
Adjusted Net Debt to Adjusted EBITDA Ratio
Adjusted net debt to adjusted EBITDA ratio is calculated as Adjusted net debt divided by Adjusted EBITDA. The Adjusted net debt to adjusted EBITDA ratio is a key credit measure used to assess the Company's financial capacity. The ratio provides information on the Company's ability to service its debt and other long-term obligations from operations, excluding significant items. The Adjusted net debt to adjusted EBITDA ratio which is reconciled below from the Long-term debt to Net income attributable to controlling shareholders ratio, the most comparable measure calculated in accordance with GAAP.
Calculation of Long-term Debt to Net Income Attributable to Controlling Shareholders Ratio
The Long-term debt to Net income attributable to controlling shareholders ratio is calculated as Long-term debt, including Long-term debt maturing within one year, divided by Net income attributable to controlling shareholders.
(in millions of Canadian dollars, except for ratios) | 2026 | 2025 |
Long-term debt including long-term debt maturing within one year as at | $ 25,147 | $ 22,269 |
Net income attributable to controlling shareholders for the twelve months ended | 3,867 | 4,182 |
Long-term debt to Net income attributable to controlling shareholders ratio | 6.5 | 5.3 |
Reconciliation of Long-term Debt to Adjusted Net Debt
Adjusted net debt is defined as Long-term debt and Long-term debt maturing within one year, as reported on the Company's Interim Consolidated Balance Sheets adjusted for pension plans' deficit, operating lease liabilities, Cash and cash equivalents, and the fair value adjustment to KCS debt on the Control Date which is recognized under Long-term debt on the Company's Interim Consolidated Balance Sheets. Adjusted net debt is used as a measure of debt and long-term obligations as part of the calculation of Adjusted net debt to Adjusted EBITDA.
(in millions of Canadian dollars) | 2026 | 2025 |
Long-term debt including long-term debt maturing within one year as at | $ 25,147 | $ 22,269 |
Add: | ||
Pension plans deficit(1) | 161 | 160 |
Operating lease liabilities | 377 | 390 |
Fair value adjustment to KCS debt upon Control(2) | 468 | 465 |
Less: | ||
Cash and cash equivalents | 366 | 799 |
Adjusted net debt | $ 25,787 | $ 22,485 |
(1) | Pension plans deficit is the total funded status of the Pension plans in deficit only. |
(2) | The fair value adjustment to KCS debt upon control represents the fair value adjustment based on the purchase price allocation at fair value, net of amortization of fair value adjustments from |
Reconciliation of Net Income Attributable to Controlling Shareholders to Adjusted EBITDA
Adjusted EBITDA is calculated as Net income attributable to controlling shareholders before Net interest expense, Income tax expense, Depreciation and amortization, and Operating lease expense recognized on the Company's Interim Consolidated Statement of Income, excluding significant items reported in "Net income", less "Other components of net periodic benefit recovery" recognized on the Company's Interim Consolidated Statement of Income. Adjusted EBITDA is used as a performance measure derived from operating results, excluding significant items, as part of the calculation of Adjusted net debt to adjusted EBITDA. Detailed quarterly information on significant items that occurred within the 12 months ended
For the twelve months ended | ||
(in millions of Canadian dollars) | 2026 | 2025 |
Net income attributable to controlling shareholders as reported | $ 3,867 | $ 4,182 |
Add: | ||
Net interest expense | 917 | 819 |
Income tax expense | 1,306 | 1,157 |
Depreciation and amortization | 2,053 | 1,957 |
Operating lease expense | 124 | 111 |
Less: | ||
Significant items (pre-tax): | ||
Certain adjustments to provisions and settlements of Mexican taxes | — | 14 |
Acquisition-related costs | (69) | (97) |
Advisory costs related to rail consolidation matters | (27) | — |
Gain on sale of equity investment | — | 333 |
Other components of net periodic benefit recovery | 421 | 390 |
Adjusted EBITDA | $ 7,942 | $ 7,586 |
Calculation of Adjusted Net Debt to Adjusted EBITDA Ratio
(in millions of Canadian dollars, except for ratios) | 2026 | 2025 |
Adjusted net debt as at | $ 25,787 | $ 22,485 |
Adjusted EBITDA for the twelve months ended | 7,942 | 7,586 |
Adjusted net debt to adjusted EBITDA ratio | 3.2 | 3.0 |
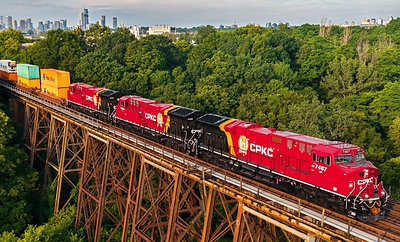

 View original content to download multimedia:https://www.prnewswire.com/news-releases/cpkc-reports-strong-q2-results-poised-for-accelerated-growth-in-second-half-of-2026-302838199.html
SOURCE CPKC
Serious News for Serious Traders! Try StreetInsider.com Premium Free!
You May Also Be Interested In
- TransAlta sells 49% Oklahoma wind stake for US$305M, buys Colorado gas assets
- INNIO receives 620 MW follow-on data center order, totaling 1.72 GW
- Scynexis completes Phase 1 IV study of antifungal SCY-247
Create E-mail Alert Related Categories
PRNewswire, Press ReleasesRelated Entities
Remington, Dividend, Crude Oil, Bankruptcy, Stock Buyback, Earnings, Definitive AgreementSign up for StreetInsider Free!
Receive full access to all new and archived articles, unlimited portfolio tracking, e-mail alerts, custom newswires and RSS feeds - and more!
