

Form N-CSRS VALUED ADVISERS TRUST For: Apr 30
 Tweet
Tweet Share
Shareunited
states
securities and exchange commission
washington, d.c. 20549
form n-csr
certified shareholder report of registered management
investment companies
Investment Company Act file number 811-22208
Valued Advisers Trust
(Exact name of registrant as specified in charter)
Ultimus Fund Solutions, LLC 225 Pictoria Drive, Suite 450 Cincinnati, OH 45246
(Address of principal executive offices) (Zip code)
Ultimus Fund Solutions, LLC
Attn: Zachary Richmond
225 Pictoria Drive, Suite 450
Cincinnati, OH 45246
(Name and address of agent for service)
Registrant's telephone number, including area code: 513-587-3400
Date of fiscal year end: 10/31
Date of reporting period: 4/30/2022
Item 1. Reports to Stockholders.
(a)

DANA
LARGE CAP EQUITY FUND
DANA EPIPHANY ESG SMALL CAP EQUITY FUND
DANA EPIPHANY ESG EQUITY FUND
Semi-Annual Report
April 30, 2022
Dana
Investment Advisors, Inc.
20700 Swenson Drive, Suite 400
Waukesha, WI 53186
(855) 280-9648
www.danafunds.com
| Investment Results (Unaudited) |
Average Annual Total Returns(a) as of April 30, 2022
| Since | |||||
| Inception | |||||
| Six Months | One Year | Five Year | Ten Year | (10/29/13) | |
| Dana Large Cap Equity Fund | |||||
| Institutional Class | (11.31)% | (4.00)% | 11.71% | N/A | 10.99% |
| Investor Class | (11.43)% | (4.25)% | 11.44% | 11.60% | N/A |
| S&P 500® Index(b) | (9.65)% | 0.21% | 13.66% | 13.67% | 12.62% |
| Expense Ratios(c) | |||||
| Institutional | Investor | ||||
| Class | Class | ||||
| Gross | 0.86% | 1.11% | |||
| With Applicable Waivers | 0.73% | 0.98% | |||
The performance quoted represents past performance, which does not guarantee future results. The investment return and principal value of an investment will fluctuate so that an investor’s shares, when redeemed, may be worth more or less than their original cost. The returns shown do not reflect deduction of taxes that a shareholder would pay on Dana Large Cap Equity Fund (the “Large Cap Fund”) distributions or the redemption of Large Cap Fund shares. Current performance of the Large Cap Fund may be lower or higher than the performance quoted. Performance data current to the most recent month end may be obtained by calling 1-855-280-9648.
(a) Average annual total returns reflect any change in price per share and assume the reinvestment of all distributions. The Large Cap Fund’s returns reflect any fee reductions during the applicable period. If such reductions had not occurred, the quoted performance would have been lower. Total returns for periods less than one year are not annualized.
(b) The S&P 500® Index (“S&P Index”) is a widely recognized unmanaged index of equity securities and is representative of a broader domestic equity market and range of securities than is found in the Large Cap Fund’s portfolio. Individuals cannot invest directly in the S&P Index; however, an individual can invest in exchange-traded funds (“ETFs”) or other investment vehicles that attempt to track the performance of a benchmark index.
(c) The expense ratios are from the Large Cap Fund’s prospectus dated February 28, 2022. Expense ratios with applicable waivers reflect that Dana Investment Advisors, Inc. (the “Adviser”) has contractually agreed to waive or limit its fees and to assume other expenses of the Large Cap Fund until February 28, 2023, so that total annual fund operating expenses do not exceed 0.73% of the Large Cap Fund’s average daily net assets. This operating expense limitation does not apply to brokerage fees and commissions, borrowing costs (such as interest and dividend expenses on securities sold short), taxes, extraordinary expenses, fees and expenses paid under a distribution plan adopted pursuant to Rule 12b-1, fees and expenses paid under a shareholder services plan, and indirect expenses (such as “Acquired Fund Fees and Expenses”). Each waiver or reimbursement of an expense by the Adviser is subject to repayment by the Large Cap Fund within three years following the date of such waiver or reimbursement, provided that the Large Cap Fund is able to make the repayment without exceeding the expense limitation in place at the time of the waiver or reimbursement and the expense limitation in place at the time of the repayment. This agreement may only be terminated by mutual consent of the Adviser and the Board of Trustees. Additional
1
| Investment Results (Unaudited) (continued) |
information pertaining to the Large Cap Fund’s expense ratios as of April 30, 2022 can be found in the financial highlights.
The Large Cap Fund’s investment objectives, strategies, risks, charges and expenses must be considered carefully before investing. The prospectus contains this and other important information about the Large Cap Fund and may be obtained by calling the same number as above. Please read it carefully before investing.
The Large Cap Fund is distributed by Ultimus Fund Distributors, LLC, Member FINRA/SIPC.
2
| Investment Results (Unaudited) (continued) |
Average Annual Total Returns(a) as of April 30, 2022
| Since | ||||
| Inception | ||||
| Six Months | One Year | Five Year | (11/3/15) | |
| Dana
Epiphany ESG Small Cap Equity Fund Institutional Class |
(17.25)% | (11.16)% | 6.25% | 5.81% |
| Morningstar US Small Core Index(b) | (10.17)% | (11.50)% | 6.57% | 8.19% |
| Expense Ratios(c) | ||||
| Institutional | ||||
| Class | ||||
| Gross | 2.05% | |||
| With Applicable Waivers | 0.95% | |||
The performance quoted represents past performance, which does not guarantee future results. The investment return and principal value of an investment will fluctuate so that an investor’s shares, when redeemed, may be worth more or less than their original cost. The returns shown do not reflect deduction of taxes that a shareholder would pay on Dana Epiphany ESG Small Cap Equity Fund (the “Small Cap Fund”) distributions or the redemption of Small Cap Fund shares. Current performance of the Small Cap Fund may be lower or higher than the performance quoted. Performance data current to the most recent month end may be obtained by calling 1-855-280-9648.
(a) Average annual total returns reflect any change in price per share and assume the reinvestment of all distributions. The Small Cap Fund’s returns reflect any fee reductions during the applicable period. If such reductions had not occurred, the quoted performance would have been lower. Total returns for periods less than one year are not annualized.
(b) The Morningstar US Small Core Index (“Morningstar Index”) provides a comprehensive depiction of the performance and fundamental characteristics of the Small Core segment of U.S. equity markets. The Morningstar Index does not incorporate Environmental, Social, Or Governance (ESG) criteria. Individuals can not invest directly in the Morningstar Index; however, an individual can invest in ETFs or other investment vehicles that attempt to track the performance of a benchmark index.
The Small Cap Fund is not sponsored, endorsed, sold or promoted by Morningstar, Inc. or any of its affiliates (all such entities, collectively, “Morningstar Entities”). The Morningstar Entities make no representation or warranty, express or implied, to individuals who invest in the Small Cap Fund or any member of the public regarding the advisability of investing in equity securities generally or in the Funds in particular or the ability of the Small Cap Fund to track the Morningstar Indices or general equity market performance. THE MORNINGSTAR ENTITIES DO NOT GUARANTEE THE ACCURACY AND/OR THE COMPLETENESS OF THE MORNINGSTAR US SMALL CORE INDEX OR ANY DATA INCLUDED THEREIN AND MORNINGSTAR ENTITIES SHALL HAVE NO LIABILITY FOR ANY ERRORS, OMISSIONS, OR INTERRUPTIONS THEREIN.
(c) The expense ratios are from the Small Cap Fund’s prospectus dated February 28, 2022. Expense ratios with applicable waivers reflect that the Adviser has contractually agreed to waive or limit its fees and to assume other expenses of the Small Cap Fund until February 28, 2023, so that total annual fund operating expenses do not exceed 0.95% of the Small Cap Fund’s average daily net assets. This
3
| Investment Results (Unaudited) (continued) |
operating expense limitation does not apply to brokerage fees and commissions, borrowing costs (such as interest and dividend expenses on securities sold short), taxes, extraordinary expenses, fees and expenses paid under a distribution plan adopted pursuant to Rule 12b-1, fees and expenses paid under a shareholder services plan, and indirect expenses (such as “Acquired Fund Fees and Expenses”). Each waiver or reimbursement of an expense by the Adviser is subject to repayment by the Small Cap Fund within three years following the date of such waiver or reimbursement, provided that the Small Cap Fund is able to make the repayment without exceeding the expense limitation in place at the time of the waiver or reimbursement and the expense limitation in place at the time of the repayment. This agreement may only be terminated by mutual consent of the Adviser and the Board of Trustees. Additional information pertaining to the Small Cap Fund’s expense ratios as of April 30, 2022 can be found in the financial highlights.
The Small Cap Fund’s investment objectives, strategies, risks, charges and expenses must be considered carefully before investing. The prospectus contains this and other important information about the Small Cap Fund and may be obtained by calling the same number as above. Please read it carefully before investing.
The Small Cap Fund is distributed by Ultimus Fund Distributors, LLC, Member FINRA/SIPC.
4
| Investment Results (Unaudited) (continued) |
Average Annual Total Returns(a) as of April 30, 2022
| Six Months | One Year | Five Year | Ten Year | |
| Dana
Epiphany ESG Equity Fund Institutional Class |
(9.79)% | (3.62)% | 11.71% | 10.46% |
| S&P 500® Index(b) | (9.65)% | 0.21% | 13.66% | 13.67% |
| Expense Ratios(c) | ||||
| Institutional | ||||
| Class | ||||
| Gross | 1.12% | |||
| With Applicable Waivers | 0.85% | |||
The performance quoted represents past performance, which does not guarantee future results. The investment return and principal value of an investment will fluctuate so that an investor’s shares, when redeemed, may be worth more or less than their original cost. The returns shown do not reflect deduction of taxes that a shareholder would pay on Dana Epiphany ESG Equity Fund (the “Epiphany ESG Fund”) distributions or the redemption of Epiphany ESG Fund shares. Current performance of the Epiphany ESG Fund may be lower or higher than the performance quoted. Performance data current to the most recent month end may be obtained by calling 1-855-280-9648.
(a) Average annual total returns reflect any change in price per share and assume the reinvestment of all distributions. The Epiphany ESG Fund’s returns reflect any fee reductions during the applicable period. If such reductions had not occurred, the quoted performance would have been lower. Total returns for periods less than one year are not annualized.
(b) The S&P 500® Index (“S&P Index”) is a widely recognized unmanaged index of equity securities and is representative of a broader domestic equity market and range of securities than is found in the Epiphany ESG Fund’s portfolio. Individuals cannot invest directly in the S&P Index; however, an individual can invest in ETFs or other investment vehicles that attempt to track the performance of a benchmark index.
(c) The expense ratios are from the Epiphany ESG Fund’s prospectus dated February 28, 2022. Expense ratios with applicable waivers reflect that the Adviser has contractually agreed to waive or limit its fees and to assume other expenses of the Epiphany ESG Fund until February 28, 2023, so that total annual fund operating expenses do not exceed 0.85% of the Epiphany ESG Fund’s average net assets. This operating expense limitation does not apply to brokerage fees and commissions, borrowing costs (such as interest and dividend expenses on securities sold short), taxes, extraordinary expenses, fees and expenses paid under a distribution plan adopted pursuant to Rule 12b-1, fees and expenses paid under a shareholder services plan, and indirect expenses (such as “Acquired Fund Fees and Expenses”). Each waiver or reimbursement of an expense by the Adviser is subject to repayment by the Epiphany ESG Fund within three years following the date of such waiver or reimbursement, provided that the Epiphany ESG Fund is able to make the repayment without exceeding the expense limitation in place at the time of the waiver or reimbursement and the expense limitation in place at the time of the repayment. This agreement may only be terminated by mutual consent of the Adviser and the Board of Trustees. Additional information pertaining to the Epiphany ESG Fund’s expense ratios as of April 30, 2022 can be found in the financial highlights.
5
| Investment Results (Unaudited) (continued) |
The Epiphany ESG Fund’s investment objectives, strategies, risks, charges and expenses must be considered carefully before investing. The prospectus contains this and other important information about the Epiphany ESG Fund and may be obtained by calling the same number as above. Please read it carefully before investing.
The Epiphany ESG Fund is distributed by Ultimus Fund Distributors, LLC, Member FINRA/SIPC.
6
| Fund Holdings (Unaudited) |
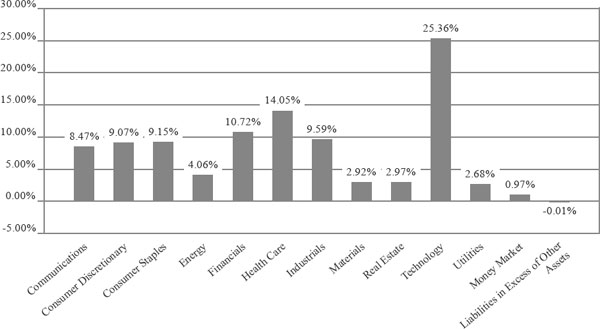
The following chart gives a visual breakdown of the Large Cap Fund by sector weighting as a percentage of net assets as of April 30, 2022.
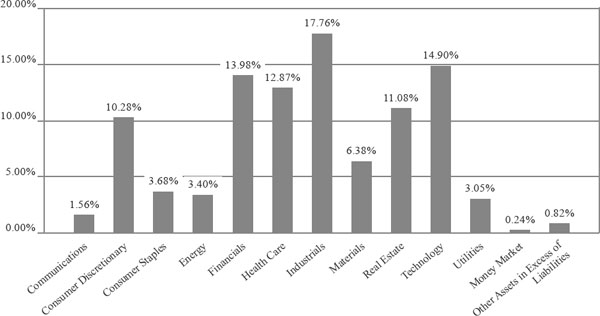
The following chart gives a visual breakdown of the Small Cap Fund by sector weighting as a percentage of net assets as of April 30, 2022.
7
| Fund Holdings (Unaudited) |
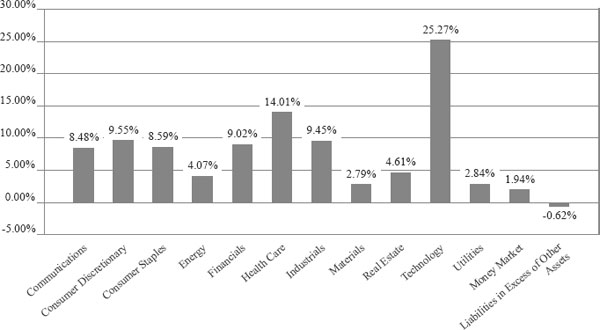
The following chart gives a visual breakdown of the Epiphany ESG Fund by sector weighting as a percentage of net assets as of April 30, 2022.
| Availability of Portfolio Schedules – (Unaudited) |
The Large Cap Fund, the Small Cap Fund and the Epiphany ESG Fund (each a “Fund” and collectively the “Funds”) file their complete schedules of portfolio holdings with the Securities and Exchange Commission (“SEC”) for the first and third quarters of each fiscal year as an exhibit to its reports on Form N-PORT. The Funds’ Form N-PORT reports are available on the SEC’s website at http://www.sec.gov and on the Funds’ website at http://www.danafunds.com.
8
| Dana Large Cap Equity Fund |
| Schedule of Investments |
| April 30, 2022 (Unaudited) |
| COMMON STOCKS — 99.04% | Shares | Fair Value | ||||||
| Communications — 8.47% | ||||||||
| Alphabet, Inc., Class A(a) | 1,660 | $ | 3,788,436 | |||||
| AT&T, Inc. | 1,000 | 18,860 | ||||||
| Comcast Corp., Class A | 51,600 | 2,051,616 | ||||||
| Interpublic Group of Cos., Inc. | 70,000 | 2,283,400 | ||||||
| Meta Platforms, Inc., Class A(a) | 2,000 | 400,940 | ||||||
| Verizon Communications, Inc. | 11,000 | 509,300 | ||||||
| Walt Disney Co. (The)(a) | 9,000 | 1,004,670 | ||||||
| Warner Bros. Discovery, Inc., Series A(a) | 241 | 4,374 | ||||||
| 10,061,596 | ||||||||
| Consumer Discretionary — 9.07% | ||||||||
| Amazon.com, Inc.(a) | 1,340 | 3,330,744 | ||||||
| Best Buy Co., Inc. | 9,000 | 809,370 | ||||||
| D.R. Horton, Inc. | 28,000 | 1,948,520 | ||||||
| General Motors Co.(a) | 37,000 | 1,402,670 | ||||||
| Home Depot, Inc. (The) | 6,900 | 2,072,760 | ||||||
| Tapestry, Inc. | 37,000 | 1,218,040 | ||||||
| 10,782,104 | ||||||||
| Consumer Staples — 9.15% | ||||||||
| Keurig Dr Pepper, Inc. | 12,000 | 448,800 | ||||||
| Kimberly-Clark Corp. | 11,000 | 1,527,130 | ||||||
| Mondelez International, Inc., Class A | 37,000 | 2,385,760 | ||||||
| PepsiCo, Inc. | 9,400 | 1,614,074 | ||||||
| Target Corp. | 11,400 | 2,606,610 | ||||||
| Walmart, Inc. | 15,000 | 2,294,850 | ||||||
| 10,877,224 | ||||||||
| Energy — 4.06% | ||||||||
| Chevron Corp. | 500 | 78,335 | ||||||
| ConocoPhillips | 16,000 | 1,528,320 | ||||||
| Exxon Mobil Corp. | 1,000 | 85,250 | ||||||
| Pioneer Natural Resources Co. | 11,400 | 2,650,158 | ||||||
| Williams Cos., Inc. (The) | 14,000 | 480,060 | ||||||
| 4,822,123 | ||||||||
| Financials — 10.72% | ||||||||
| Allstate Corp. (The) | 18,000 | 2,277,720 | ||||||
| American Express Co. | 12,800 | 2,236,288 | ||||||
| Bank of America Corp. | 60,000 | 2,140,800 | ||||||
| Bank of New York Mellon Corp. (The) | 46,000 | 1,934,760 | ||||||
| JPMorgan Chase & Co. | 16,500 | 1,969,440 | ||||||
| Morgan Stanley | 27,000 | 2,175,930 | ||||||
| 12,734,938 | ||||||||
| Health Care — 14.05% | ||||||||
| Abbott Laboratories | 18,600 | 2,111,100 | ||||||
| AbbVie, Inc. | 16,000 | 2,350,080 | ||||||
| Avantor, Inc.(a) | 63,000 | 2,008,440 | ||||||
| CVS Health Corp. | 27,000 | 2,595,510 | ||||||
| Horizon Therapeutics PLC(a) | 21,400 | 2,109,184 | ||||||
| Merck & Co., Inc. | 33,000 | 2,926,770 | ||||||
See accompanying notes which are an integral part of these financial statements.
9
| Dana Large Cap Equity Fund |
| Schedule of Investments (continued) |
| April 30, 2022 (Unaudited) |
| COMMON STOCKS — 99.04% - continued | Shares | Fair Value | ||||||
| Health Care — 14.05% - continued | ||||||||
| UnitedHealth Group, Inc. | 5,100 | $ | 2,593,605 | |||||
| 16,694,689 | ||||||||
| Industrials — 9.59% | ||||||||
| Boeing Co. (The)(a) | 200 | 29,768 | ||||||
| Deere & Co. | 5,000 | 1,887,750 | ||||||
| Dover Corp. | 12,000 | 1,599,600 | ||||||
| Norfolk Southern Corp. | 7,800 | 2,011,464 | ||||||
| Parker-Hannifin Corp. | 7,400 | 2,004,068 | ||||||
| Raytheon Technologies Corp. | 17,000 | 1,613,470 | ||||||
| TE Connectivity Ltd. | 18,000 | 2,246,040 | ||||||
| 11,392,160 | ||||||||
| Materials — 2.92% | ||||||||
| Avery Dennison Corp. | 8,400 | 1,517,040 | ||||||
| Nucor Corp. | 12,600 | 1,950,228 | ||||||
| 3,467,268 | ||||||||
| Real Estate — 2.97% | ||||||||
| American Tower Corp., Class A | 4,100 | 988,182 | ||||||
| Gaming and Leisure Properties, Inc. | 28,000 | 1,242,640 | ||||||
| Iron Mountain, Inc. | 24,000 | 1,289,520 | ||||||
| 3,520,342 | ||||||||
| Technology — 25.36% | ||||||||
| Adobe, Inc.(a) | 4,800 | 1,900,560 | ||||||
| Advanced Micro Devices, Inc.(a) | 8,400 | 718,368 | ||||||
| Analog Devices, Inc. | 16,000 | 2,470,080 | ||||||
| Apple, Inc. | 28,000 | 4,414,200 | ||||||
| CDW Corp. | 13,800 | 2,251,884 | ||||||
| Cisco Systems, Inc. | 45,000 | 2,204,100 | ||||||
| Cognizant Technology Solutions Corp., Class A | 30,400 | 2,459,360 | ||||||
| Fidelity National Information Services, Inc. | 23,000 | 2,280,450 | ||||||
| Lam Research Corp. | 4,500 | 2,095,920 | ||||||
| Microchip Technology, Inc. | 13,000 | 847,600 | ||||||
| Microsoft Corp. | 15,000 | 4,162,800 | ||||||
| Visa, Inc., Class A | 11,200 | 2,387,056 | ||||||
| Zebra Technologies Corp., Class A(a) | 5,300 | 1,959,198 | ||||||
| 30,151,576 | ||||||||
| Utilities — 2.68% | ||||||||
| Eversource Energy | 18,600 | 1,625,640 | ||||||
| NextEra Energy, Inc. | 22,000 | 1,562,440 | ||||||
| 3,188,080 | ||||||||
| Total Common Stocks (Cost $92,407,856) | 117,692,100 | |||||||
| MONEY MARKET FUNDS - 0.97% | ||||||||
| Fidelity Investments Money Market Government Portfolio, Institutional Class, 0.20%(b) | 1,158,041 | 1,158,041 | ||||||
| Total Money Market Funds (Cost $1,158,041) | 1,158,041 | |||||||
| Total Investments — 100.01% (Cost $93,565,897) | $ | 118,850,141 | ||||||
| Liabilities in Excess of Other Assets — (0.01)% | (13,200 | ) | ||||||
| NET ASSETS — 100.00% | $ | 118,836,941 | ||||||
| (a) | Non-income producing security. |
| (b) | Rate disclosed is the seven day effective yield as of April 30, 2022. |
See accompanying notes which are an integral part of these financial statements.
10
| Dana Epiphany ESG Small Cap Equity Fund |
| Schedule of Investments |
| April 30, 2022 (Unaudited) |
| COMMON STOCKS — 98.94% | Shares | Fair Value | ||||||
| Communications — 1.56% | ||||||||
| TechTarget, Inc.(a) | 3,169 | $ | 213,305 | |||||
| Consumer Discretionary — 10.28% | ||||||||
| Bloomin’ Brands, Inc. | 10,818 | 237,888 | ||||||
| Boot Barn Holdings, Inc.(a) | 2,785 | 250,816 | ||||||
| Deckers Outdoor Corp.(a) | 869 | 230,937 | ||||||
| Group 1 Automotive, Inc. | 1,334 | 232,303 | ||||||
| Malibu Boats, Inc., Class A(a) | 4,633 | 232,994 | ||||||
| Masonite International Corp.(a) | 2,857 | 221,475 | ||||||
| 1,406,413 | ||||||||
| Consumer Staples — 3.68% | ||||||||
| e.l.f. Beauty, Inc.(a) | 10,464 | 254,589 | ||||||
| Simply Good Foods Co. (The)(a) | 5,962 | 248,317 | ||||||
| 502,906 | ||||||||
| Energy — 3.40% | ||||||||
| Ovintiv, Inc. | 9,094 | 465,522 | ||||||
| Financials — 13.98% | ||||||||
| Evercore, Inc., Class A | 2,428 | 256,761 | ||||||
| Hanover Insurance Group, Inc. | 1,649 | 242,106 | ||||||
| Home BancShares, Inc. | 10,789 | 233,258 | ||||||
| Metropolitan Bank Holding Corp.(a) | 2,713 | 241,593 | ||||||
| Pinnacle Financial Partners, Inc. | 2,997 | 232,417 | ||||||
| Primerica, Inc. | 1,878 | 243,314 | ||||||
| United Community Banks, Inc. | 7,528 | 226,894 | ||||||
| Veritex Holdings, Inc. | 7,194 | 236,323 | ||||||
| 1,912,666 | ||||||||
| Health Care — 12.87% | ||||||||
| Aurinia Pharmaceuticals, Inc.(a) | 7,712 | 79,356 | ||||||
| Axsome Therapeutics, Inc.(a) | 1,934 | 61,405 | ||||||
| Blueprint Medicines Corp.(a) | 1,988 | 116,000 | ||||||
| CONMED Corp. | 1,980 | 263,261 | ||||||
| Cytokinetics, Inc.(a) | 2,136 | 85,162 | ||||||
| Denali Therapeutics, Inc.(a) | 2,901 | 69,044 | ||||||
| Ensign Group, Inc. (The) | 3,180 | 255,449 | ||||||
| Envista Holdings Corp.(a) | 6,074 | 240,652 | ||||||
| Global Blood Therapeutics, Inc.(a) | 1,783 | 54,738 | ||||||
| Horizon Therapeutics PLC(a) | 2,556 | 251,919 | ||||||
| Shockwave Medical, Inc.(a) | 1,368 | 206,746 | ||||||
| Travere Therapeutics, Inc.(a) | 3,077 | 77,325 | ||||||
| 1,761,057 | ||||||||
| Industrials — 17.76% | ||||||||
| Atkore, Inc.(a) | 2,709 | 260,335 | ||||||
| Cactus, Inc., Class A | 9,546 | 476,632 | ||||||
| Clean Harbors, Inc.(a) | 2,524 | 264,843 | ||||||
| Gates Industrial Corp. PLC(a) | 18,214 | 232,229 | ||||||
| Hub Group, Inc., Class A(a) | 3,426 | 230,090 | ||||||
| MasTec, Inc.(a) | 3,217 | 231,656 | ||||||
| Regal-Beloit Corp. | 1,850 | 235,394 | ||||||
See accompanying notes which are an integral part of these financial statements.
11
| Dana Epiphany ESG Small Cap Equity Fund |
| Schedule of Investments (continued) |
| April 30, 2022 (Unaudited) |
| COMMON STOCKS — 98.94% - continued | Shares | Fair Value | ||||||
| Industrials — 17.76% - continued | ||||||||
| TopBuild Corp.(a) | 1,401 | $ | 253,777 | |||||
| Zurn Water Solutions Corp. | 7,889 | 246,295 | ||||||
| 2,431,251 | ||||||||
| Materials — 6.38% | ||||||||
| Advanced Drainage Systems, Inc. | 2,186 | 223,977 | ||||||
| Avient Corp. | 4,031 | 198,486 | ||||||
| Codexis, Inc.(a) | 6,053 | 72,818 | ||||||
| Element Solutions, Inc. | 9,421 | 194,261 | ||||||
| Summit Materials, Inc., Class A(a) | 6,611 | 183,786 | ||||||
| 873,328 | ||||||||
| Real Estate — 11.08% | ||||||||
| Agree Realty Corp. | 4,492 | 305,097 | ||||||
| Global Medical REIT, Inc. | 16,816 | 248,204 | ||||||
| Hannon Armstrong Sustainable Infrastructure Capital, Inc. | 6,099 | 243,899 | ||||||
| Radius Global Infrastructure, Inc., Class A(a) | 15,970 | 198,347 | ||||||
| Spirit Realty Capital, Inc. | 5,781 | 251,184 | ||||||
| STAG Industrial, Inc. | 7,210 | 269,078 | ||||||
| 1,515,809 | ||||||||
| Technology — 14.90% | ||||||||
| Axcelis Technologies, Inc.(a) | 3,463 | 188,560 | ||||||
| Kulicke & Soffa Industries, Inc. | 4,663 | 216,410 | ||||||
| Omnicell, Inc.(a) | 2,215 | 241,812 | ||||||
| Perficient, Inc.(a) | 2,482 | 246,736 | ||||||
| Rapid7, Inc.(a) | 2,478 | 236,699 | ||||||
| Sailpoint Technologies Holdings, Inc.(a) | 4,933 | 314,872 | ||||||
| Semtech Corp.(a) | 3,852 | 229,579 | ||||||
| Ultra Clean Holdings, Inc.(a) | 6,229 | 194,158 | ||||||
| Veritone, Inc.(a) | 15,725 | 170,302 | ||||||
| 2,039,128 | ||||||||
| Utilities — 3.05% | ||||||||
| Chesapeake Utilities Corp. | 1,785 | 223,429 | ||||||
| Clearway Energy, Inc., Class C | 6,348 | 193,804 | ||||||
| 417,233 | ||||||||
| Total Common Stocks (Cost $13,395,219) | 13,538,618 | |||||||
| MONEY MARKET FUNDS - 0.24% | ||||||||
| Fidelity Investments Money Market Government Portfolio, Institutional Class, 0.20%(b) | 32,976 | 32,976 | ||||||
| Total Money Market Funds (Cost $32,976) | 32,976 | |||||||
| Total Investments — 99.18% (Cost $13,428,195) | 13,571,594 | |||||||
| Other Assets in Excess of Liabilities — 0.82% | 112,453 | |||||||
| NET ASSETS — 100.00% | $ | 13,684,047 | ||||||
| (a) | Non-income producing security. |
| (b) | Rate disclosed is the seven day effective yield as of April 30, 2022. |
See accompanying notes which are an integral part of these financial statements.
12
| Dana Epiphany ESG Equity Fund |
| Schedule of Investments |
| April 30, 2022 (Unaudited) |
| COMMON STOCKS — 98.68% | Shares | Fair Value | ||||||
| Communications — 8.48% | ||||||||
| Alphabet, Inc., Class A(a) | 870 | $ | 1,985,505 | |||||
| Alphabet, Inc., Class C(a) | 230 | 528,846 | ||||||
| Comcast Corp., Class A | 29,800 | 1,184,848 | ||||||
| Interpublic Group of Cos., Inc. | 42,600 | 1,389,612 | ||||||
| Verizon Communications, Inc. | 27,000 | 1,250,100 | ||||||
| 6,338,911 | ||||||||
| Consumer Discretionary — 9.55% | ||||||||
| Amazon.com, Inc.(a) | 400 | 994,252 | ||||||
| Best Buy Co., Inc. | 14,000 | 1,259,020 | ||||||
| D.R. Horton, Inc. | 17,800 | 1,238,702 | ||||||
| Home Depot, Inc. (The) | 2,900 | 871,160 | ||||||
| McDonald’s Corp. | 3,200 | 797,312 | ||||||
| Tapestry, Inc. | 39,000 | 1,283,880 | ||||||
| Tractor Supply Co. | 3,400 | 684,930 | ||||||
| 7,129,256 | ||||||||
| Consumer Staples — 8.59% | ||||||||
| Darling Ingredients, Inc.(a) | 21,000 | 1,541,190 | ||||||
| General Mills, Inc. | 22,400 | 1,584,352 | ||||||
| Kimberly-Clark Corp. | 4,600 | 638,618 | ||||||
| Mondelez International, Inc., Class A | 17,800 | 1,147,744 | ||||||
| Target Corp. | 6,600 | 1,509,090 | ||||||
| 6,420,994 | ||||||||
| Energy — 4.07% | ||||||||
| ConocoPhillips | 5,000 | 477,600 | ||||||
| Ovintiv, Inc. | 3,000 | 153,570 | ||||||
| Pioneer Natural Resources Co. | 5,800 | 1,348,326 | ||||||
| Williams Cos., Inc. (The) | 31,000 | 1,062,990 | ||||||
| 3,042,486 | ||||||||
| Financials — 9.02% | ||||||||
| Allstate Corp. (The) | 11,400 | 1,442,556 | ||||||
| American Express Co. | 8,000 | 1,397,680 | ||||||
| Bank of New York Mellon Corp. (The) | 31,000 | 1,303,860 | ||||||
| Morgan Stanley | 16,000 | 1,289,440 | ||||||
| Truist Financial Corp. | 27,000 | 1,305,450 | ||||||
| 6,738,986 | ||||||||
| Health Care — 14.01% | ||||||||
| Cigna Corp. | 6,500 | 1,604,070 | ||||||
| CVS Health Corp. | 16,200 | 1,557,306 | ||||||
| Envista Holdings Corp.(a) | 33,000 | 1,307,460 | ||||||
| Horizon Therapeutics PLC(a) | 16,000 | 1,576,960 | ||||||
| IQVIA Holdings, Inc.(a) | 7,200 | 1,569,528 | ||||||
| Syneos Health, Inc.(a) | 19,000 | 1,388,710 | ||||||
| Zoetis, Inc., Class A | 8,200 | 1,453,450 | ||||||
| 10,457,484 | ||||||||
| Industrials — 9.45% | ||||||||
| Deere & Co. | 3,700 | 1,396,935 | ||||||
| Norfolk Southern Corp. | 5,700 | 1,469,916 | ||||||
See accompanying notes which are an integral part of these financial statements.
13
| Dana Epiphany ESG Equity Fund |
| Schedule of Investments (continued) |
| April 30, 2022 (Unaudited) |
| COMMON STOCKS — 98.68% - continued | Shares | Fair Value | ||||||
| Industrials — 9.45% - continued | ||||||||
| Regal-Beloit Corp. | 10,800 | $ | 1,374,192 | |||||
| TE Connectivity Ltd. | 10,600 | 1,322,668 | ||||||
| W.W. Grainger, Inc. | 3,000 | 1,500,090 | ||||||
| 7,063,801 | ||||||||
| Materials — 2.79% | ||||||||
| Avery Dennison Corp. | 5,900 | 1,065,540 | ||||||
| Nucor Corp. | 6,600 | 1,021,548 | ||||||
| 2,087,088 | ||||||||
| Real Estate — 4.61% | ||||||||
| American Tower Corp., Class A | 2,100 | 506,142 | ||||||
| Hannon Armstrong Sustainable Infrastructure Capital, Inc. | 32,000 | 1,279,680 | ||||||
| Iron Mountain, Inc. | 22,400 | 1,203,552 | ||||||
| Spirit Realty Capital, Inc. | 10,600 | 460,570 | ||||||
| 3,449,944 | ||||||||
| Technology — 25.27% | ||||||||
| Accenture PLC, Class A | 4,400 | 1,321,584 | ||||||
| Advanced Micro Devices, Inc.(a) | 12,200 | 1,043,344 | ||||||
| Analog Devices, Inc. | 9,000 | 1,389,420 | ||||||
| Apple, Inc. | 16,400 | 2,585,460 | ||||||
| Cadence Design Systems, Inc.(a) | 8,400 | 1,267,140 | ||||||
| CDW Corp. | 8,400 | 1,370,712 | ||||||
| Cisco Systems, Inc. | 28,000 | 1,371,440 | ||||||
| Cognizant Technology Solutions Corp., Class A | 18,000 | 1,456,200 | ||||||
| Fidelity National Information Services, Inc. | 13,600 | 1,348,440 | ||||||
| Lam Research Corp. | 2,600 | 1,210,976 | ||||||
| Microchip Technology, Inc. | 8,000 | 521,600 | ||||||
| Microsoft Corp. | 9,000 | 2,497,680 | ||||||
| Visa, Inc., Class A | 7,000 | 1,491,910 | ||||||
| 18,875,906 | ||||||||
| Utilities — 2.84% | ||||||||
| Avangrid, Inc. | 7,400 | 328,190 | ||||||
| Eversource Energy | 10,000 | 874,000 | ||||||
| NextEra Energy, Inc. | 13,000 | 923,260 | ||||||
| 2,125,450 | ||||||||
| Total Common Stocks (Cost $71,070,193) | 73,730,306 | |||||||
| MONEY MARKET FUNDS - 1.94% | ||||||||
| Fidelity Investments Money Market Government Portfolio, Institutional Class, 0.20%(b) | 1,448,681 | 1,448,681 | ||||||
| Total Money Market Funds (Cost $1,448,681) | 1,448,681 | |||||||
| Total Investments — 100.62% (Cost $72,518,874) | 75,178,987 | |||||||
| Liabilities in Excess of Other Assets — (0.62)% | (463,431 | ) | ||||||
| NET ASSETS — 100.00% | $ | 74,715,556 | ||||||
| (a) | Non-income producing security. |
| (b) | Rate disclosed is the seven day effective yield as of April 30, 2022. |
See accompanying notes which are an integral part of these financial statements.
14
| Dana Funds |
| Statements of Assets and Liabilities |
| April 30, 2022 (Unaudited) |
| Dana | ||||||||||||
| Epiphany | ||||||||||||
| ESG | Dana | |||||||||||
| Dana Large | Small | Epiphany | ||||||||||
| Cap Equity | Cap Equity | ESG Equity | ||||||||||
| Fund | Fund | Fund | ||||||||||
| Assets | ||||||||||||
| Investments in securities at fair value (cost $93,565,897, $13,428,195 and $72,518,874) (Note 3) | $ | 118,850,141 | $ | 13,571,594 | $ | 75,178,987 | ||||||
| Cash | 16,500 | — | — | |||||||||
| Receivable for fund shares sold | 4,619 | 100 | 36,420 | |||||||||
| Receivable for investments sold | — | 188,506 | — | |||||||||
| Dividends receivable | 109,410 | 1,948 | 79,709 | |||||||||
| Receivable from Adviser (Note 4) | — | 2,803 | — | |||||||||
| Prepaid expenses | 28,639 | 11,523 | 20,499 | |||||||||
| Total Assets | 119,009,309 | 13,776,474 | 75,315,615 | |||||||||
| Liabilities | ||||||||||||
| Payable for fund shares redeemed | 83,216 | — | 181,779 | |||||||||
| Payable for investments purchased | — | 72,837 | 361,695 | |||||||||
| Payable to Adviser (Note 4) | 52,557 | — | 34,927 | |||||||||
| Accrued Distribution (12b-1) fees (Note 4) | 4,852 | — | — | |||||||||
| Payable to Administrator (Note 4) | 11,361 | 6,020 | 5,338 | |||||||||
| Payable to trustees (Note 4) | — | 902 | 7 | |||||||||
| Other accrued expenses | 20,382 | 12,668 | 16,313 | |||||||||
| Total Liabilities | 172,368 | 92,427 | 600,059 | |||||||||
| Net Assets | $ | 118,836,941 | $ | 13,684,047 | $ | 74,715,556 | ||||||
| Net Assets consist of: | ||||||||||||
| Paid-in capital | $ | 84,374,848 | $ | 12,093,072 | $ | 71,969,315 | ||||||
| Accumulated earnings | 34,462,093 | 1,590,975 | 2,746,241 | |||||||||
| Net Assets | $ | 118,836,941 | $ | 13,684,047 | $ | 74,715,556 | ||||||
| Institutional Class: | ||||||||||||
| Net Assets | $ | 96,578,270 | $ | 13,684,047 | $ | 74,715,556 | ||||||
| Shares outstanding (unlimited number of shares authorized, no par value) | 4,213,933 | 1,129,665 | 6,032,032 | |||||||||
| Net asset value, offering and redemption price per share (Note 2) | $ | 22.92 | $ | 12.11 | $ | 12.39 | ||||||
| Investor Class: | ||||||||||||
| Net Assets | $ | 22,258,671 | ||||||||||
| Shares outstanding (unlimited number of shares authorized, no par value) | 971,116 | |||||||||||
| Net asset value, offering and redemption price per share (Note 2) | $ | 22.92 | ||||||||||
See accompanying notes which are an integral part of these financial statements.
15
| Dana Funds |
| Statements of Operations |
| For the six months ended April 30, 2022 (Unaudited) |
| Dana Epiphany | Dana Epiphany | |||||||||||
| Dana Large Cap | ESG Small Cap | ESG Equity | ||||||||||
| Equity Fund | Equity Fund | Fund | ||||||||||
| Investment Income | ||||||||||||
| Dividend income | $ | 1,028,108 | $ | 81,217 | $ | 601,800 | ||||||
| Total investment income | 1,028,108 | 81,217 | 601,800 | |||||||||
| Expenses | ||||||||||||
| Investment Adviser fees (Note 4) | 434,896 | 63,684 | 242,501 | |||||||||
| Administration and compliance service fees (Note 4) | 38,170 | 16,364 | 22,458 | |||||||||
| Distribution (12b-1) fees, Investor Class (Note 4) | 31,441 | — | — | |||||||||
| Fund accounting fees (Note 4) | 22,452 | 12,397 | 13,965 | |||||||||
| Registration expenses | 19,979 | 10,959 | 18,924 | |||||||||
| Transfer agent fees (Note 4) | 11,405 | 8,927 | 8,927 | |||||||||
| Audit and tax preparation fees | 9,150 | 9,150 | 9,150 | |||||||||
| Custodian fees | 9,102 | 3,135 | 8,760 | |||||||||
| Legal fees | 8,999 | 8,866 | 8,613 | |||||||||
| Printing and postage expenses | 3,925 | 1,592 | 3,627 | |||||||||
| Trustee fees (Note 4) | 3,294 | 3,416 | 3,175 | |||||||||
| Insurance expenses | 1,973 | 1,216 | 1,435 | |||||||||
| Miscellaneous expenses | 12,788 | 10,854 | 12,998 | |||||||||
| Total expenses | 607,574 | 150,560 | 354,533 | |||||||||
| Fees contractually waived and expenses reimbursed by Adviser (Note 4) | (88,375 | ) | (70,011 | ) | (37,632 | ) | ||||||
| Net operating expenses | 519,199 | 80,549 | 316,901 | |||||||||
| Net investment income | 508,909 | 668 | 284,899 | |||||||||
| Net Realized and Change in Unrealized Gain (Loss) on Investments | ||||||||||||
| Net realized gain on investment securities transactions | 9,380,666 | 1,502,923 | 15,388 | |||||||||
| Net change in unrealized depreciation on investment securities | (24,998,114 | ) | (4,593,472 | ) | (8,273,469 | ) | ||||||
| Net realized and change in unrealized loss on investments | (15,617,448 | ) | (3,090,549 | ) | (8,258,081 | ) | ||||||
| Net decrease in net assets resulting from operations | $ | (15,108,539 | ) | $ | (3,089,881 | ) | $ | (7,973,182 | ) | |||
See accompanying notes which are an integral part of these financial statements.
16
| Dana Funds |
| Statements of Changes in Net Assets |
| Dana Large Cap Equity Fund | ||||||||
| For the Six | For the Year | |||||||
| Months Ended | Ended October | |||||||
| April 30, 2022 | 31, 2021 | |||||||
| (Unaudited) | ||||||||
| Increase (Decrease) in Net Assets due to: | ||||||||
| Operations | ||||||||
| Net investment income | $ | 508,909 | $ | 798,820 | ||||
| Net realized gain on investment securities transactions | 9,380,666 | 16,461,777 | ||||||
| Net change in unrealized appreciation (depreciation) of investment securities | (24,998,114 | ) | 26,848,239 | |||||
| Net increase (decrease) in net assets resulting from operations | (15,108,539 | ) | 44,108,836 | |||||
| Distributions to Shareholders from Earnings (Note 2) | ||||||||
| Institutional Class | (13,575,752 | ) | (2,521,779 | ) | ||||
| Investor Class | (3,102,171 | ) | (616,743 | ) | ||||
| Total distributions | (16,677,923 | ) | (3,138,522 | ) | ||||
| Capital Transactions – Institutional Class | ||||||||
| Proceeds from shares sold | 11,807,753 | 19,866,697 | ||||||
| Reinvestment of distributions | 7,577,444 | 1,261,457 | ||||||
| Amount paid for shares redeemed | (12,572,060 | ) | (29,994,338 | ) | ||||
| Total – Institutional Class | 6,813,137 | (8,866,184 | ) | |||||
| Capital Transactions – Investor Class | ||||||||
| Proceeds from shares sold | 161,533 | 955,765 | ||||||
| Reinvestment of distributions | 2,931,871 | 610,137 | ||||||
| Amount paid for shares redeemed | (1,364,353 | ) | (7,582,529 | ) | ||||
| Total – Investor Class | 1,729,051 | (6,016,627 | ) | |||||
| Net increase (decrease) in net assets resulting from capital transactions | 8,542,188 | (14,882,811 | ) | |||||
| Total Increase (Decrease) in Net Assets | (23,244,274 | ) | 26,087,503 | |||||
| Net Assets | ||||||||
| Beginning of period | 142,081,215 | 115,993,712 | ||||||
| End of period | $ | 118,836,941 | $ | 142,081,215 | ||||
| Share Transactions - Institutional Class | ||||||||
| Shares sold | 455,533 | 784,104 | ||||||
| Shares issued in reinvestment of distributions | 283,252 | 51,614 | ||||||
| Shares redeemed | (481,554 | ) | (1,178,281 | ) | ||||
| Total – Institutional Class | 257,231 | (342,563 | ) | |||||
| Share Transactions - Investor Class | ||||||||
| Shares sold | 6,388 | 36,024 | ||||||
| Shares issued in reinvestment of distributions | 109,490 | 25,319 | ||||||
| Shares redeemed | (53,492 | ) | (310,665 | ) | ||||
| Total – Investor Class | 62,386 | (249,322 | ) | |||||
See accompanying notes which are an integral part of these financial statements.
17
| Dana Funds |
| Statements of Changes in Net Assets (continued) |
| Dana Epiphany ESG Small Cap | ||||||||
| Equity Fund | ||||||||
| For the Six | For the Year | |||||||
| Months Ended | Ended October | |||||||
| April 30, 2022 | 31, 2021 | |||||||
| (Unaudited) | ||||||||
| Increase (Decrease) in Net Assets due to: | ||||||||
| Operations | ||||||||
| Net investment income (loss) | $ | 668 | $ | (35,266 | ) | |||
| Net realized gain on investment securities transactions | 1,502,923 | 2,817,117 | ||||||
| Net change in unrealized appreciation (depreciation) of investment securities | (4,593,472 | ) | 3,549,853 | |||||
| Net increase (decrease) in net assets resulting from operations | (3,089,881 | ) | 6,331,704 | |||||
| Distributions to Shareholders from Earnings (Note 2) | ||||||||
| Institutional Class | (1,429,190 | ) | — | |||||
| Total distributions | (1,429,190 | ) | — | |||||
| Capital Transactions – Institutional Class | ||||||||
| Proceeds from shares sold | 3,181,571 | 4,001,045 | ||||||
| Reinvestment of distributions | 1,400,259 | — | ||||||
| Amount paid for shares redeemed | (3,817,442 | ) | (2,755,405 | ) | ||||
| Total – Institutional Class | 764,388 | 1,245,640 | ||||||
| Net increase in net assets resulting from capital transactions | 764,388 | 1,245,640 | ||||||
| Total Increase (Decrease) in Net Assets | (3,754,683 | ) | 7,577,344 | |||||
| Net Assets | ||||||||
| Beginning of period | 17,438,730 | 9,861,386 | ||||||
| End of period | $ | 13,684,047 | $ | 17,438,730 | ||||
| Share Transactions - Institutional Class | ||||||||
| Shares sold | 219,656 | 285,750 | ||||||
| Shares issued in reinvestment of distributions | 95,256 | — | ||||||
| Shares redeemed | (281,615 | ) | (193,538 | ) | ||||
| Total – Institutional Class | 33,297 | 92,212 | ||||||
See accompanying notes which are an integral part of these financial statements.
18
| Dana Funds |
| Statements of Changes in Net Assets (continued) |
| Dana Epiphany ESG Equity Fund | ||||||||
| For the Six | For the Year | |||||||
| Months Ended | Ended October | |||||||
| April 30, 2022 | 31, 2021 | |||||||
| (Unaudited) | ||||||||
| Increase (Decrease) in Net Assets due to: | ||||||||
| Operations | ||||||||
| Net investment income | $ | 284,899 | $ | 234,908 | ||||
| Net realized gain on investment securities transactions | 15,388 | 1,024,321 | ||||||
| Net change in unrealized appreciation (depreciation) of investment securities | (8,273,469 | ) | 8,442,528 | |||||
| Net increase (decrease) in net assets resulting from operations | (7,973,182 | ) | 9,701,757 | |||||
| Distributions to Shareholders from Earnings (Note 2) | ||||||||
| Institutional Class | (1,310,252 | ) | (415,436 | ) | ||||
| Total distributions | (1,310,252 | ) | (415,436 | ) | ||||
| Capital Transactions – Institutional Class | ||||||||
| Proceeds from shares sold | 23,865,167 | 52,799,761 | ||||||
| Reinvestment of distributions | 1,272,146 | 412,645 | ||||||
| Amount paid for shares redeemed | (8,695,318 | ) | (8,003,838 | ) | ||||
| Total – Institutional Class | 16,441,995 | 45,208,568 | ||||||
| Net increase in net assets resulting from capital transactions | 16,441,995 | 45,208,568 | ||||||
| Total Increase in Net Assets | 7,158,561 | 54,494,889 | ||||||
| Net Assets | ||||||||
| Beginning of period | 67,556,995 | 13,062,106 | ||||||
| End of period | $ | 74,715,556 | $ | 67,556,995 | ||||
| Share Transactions - Institutional Class | ||||||||
| Shares sold | 1,746,752 | 4,143,277 | ||||||
| Shares issued in reinvestment of distributions | 89,671 | 34,346 | ||||||
| Shares redeemed | (640,395 | ) | (615,363 | ) | ||||
| Total – Institutional Class | 1,196,028 | 3,562,260 | ||||||
See accompanying notes which are an integral part of these financial statements.
19
| Dana Large Cap Equity Fund – Institutional Class |
| Financial Highlights |
| (For a share outstanding during each period) |
| For the Six | ||||||||||||||||||||||||
| Months | ||||||||||||||||||||||||
| Ended April | ||||||||||||||||||||||||
| 30, 2022 | For the Years Ended October 31, | |||||||||||||||||||||||
| (Unaudited) | 2021 | 2020 | 2019 | 2018 | 2017 | |||||||||||||||||||
| Selected Per Share Data | ||||||||||||||||||||||||
| Net asset value, beginning of period | $ | 29.20 | $ | 21.25 | $ | 22.69 | $ | 22.35 | $ | 22.64 | $ | 17.67 | ||||||||||||
| Investment operations: | ||||||||||||||||||||||||
| Net investment income | 0.10 | 0.17 | 0.23 | 0.38 | 0.32 | 0.32 | ||||||||||||||||||
| Net realized and unrealized gain (loss) on investments | (2.91 | ) | 8.39 | 0.86 | 2.46 | 0.45 | 4.96 | |||||||||||||||||
| Total from investment operations | (2.81 | ) | 8.56 | 1.09 | 2.84 | 0.77 | 5.28 | |||||||||||||||||
| Less distributions to shareholders from: | ||||||||||||||||||||||||
| Net investment income | (0.10 | ) | (0.17 | ) | (0.23 | ) | (0.36 | ) | (0.32 | ) | (0.31 | ) | ||||||||||||
| Net realized gains | (3.37 | ) | (0.44 | ) | (2.30 | ) | (2.14 | ) | (0.74 | ) | — | |||||||||||||
| Total distributions | (3.47 | ) | (0.61 | ) | (2.53 | ) | (2.50 | ) | (1.06 | ) | (0.31 | ) | ||||||||||||
| Redemption fees | — | — | — | — | — | — | (a) | |||||||||||||||||
| Net asset value, end of period | $ | 22.92 | $ | 29.20 | $ | 21.25 | $ | 22.69 | $ | 22.35 | $ | 22.64 | ||||||||||||
| Total Return(b) | (11.31 | )% (c) | 40.89 | % | 4.65 | % | 15.55 | % | 3.27 | % | 30.11 | % | ||||||||||||
| Ratios and Supplemental Data: | ||||||||||||||||||||||||
| Net assets, end of period (000 omitted) | $ | 96,578 | $ | 115,544 | $ | 91,379 | $ | 107,026 | $ | 176,954 | $ | 134,291 | ||||||||||||
| Before waiver | ||||||||||||||||||||||||
| Ratio of expenses to average net assets | 0.86 | % (d) | 0.86 | % | 0.91 | % | 0.85 | % | 0.86 | % | 0.92 | % | ||||||||||||
| After waiver | ||||||||||||||||||||||||
| Ratio of expenses to average net assets | 0.73 | % (d) | 0.73 | % | 0.73 | % | 0.73 | % | 0.73 | % | 0.74 | % (e) | ||||||||||||
| Ratio of net investment income to average net assets | 0.81 | % (d) | 0.65 | % | 1.10 | % | 1.68 | % | 1.41 | % | 1.48 | % | ||||||||||||
| Portfolio turnover rate(f) | 20 | % (c) | 30 | % | 57 | % | 50 | % | 58 | % | 50 | % | ||||||||||||
| (a) | Rounds to less than $0.005 per share. |
| (b) | Total return in the above table represents the rate that the investor would have earned or lost on an investment in the Fund, assuming reinvestment of distributions. |
| (c) | Not annualized. |
| (d) | Annualized. |
| (e) | This ratio includes the impact of overdraft fees. If this cost had been excluded, the ratio of expenses to average net assets would have been 0.73% for the fiscal year ended October 31, 2017. |
| (f) | Portfolio turnover is calculated on the basis of the Fund as a whole without distinguishing among the classes of shares. |
See accompanying notes which are an integral part of these financial statements.
20
| Dana Large Cap Equity Fund – Investor |
| Class Financial Highlights |
| (For a share outstanding during each period) |
| For the Six | ||||||||||||||||||||||||
| Months | ||||||||||||||||||||||||
| Ended April | ||||||||||||||||||||||||
| 30, 2022 | For the Years Ended October 31, | |||||||||||||||||||||||
| (Unaudited) | 2021 | 2020 | 2019 | 2018 | 2017 | |||||||||||||||||||
| Selected Per Share Data | ||||||||||||||||||||||||
| Net asset value, beginning of period | $ | 29.20 | $ | 21.26 | $ | 22.69 | $ | 22.35 | $ | 22.64 | $ | 17.68 | ||||||||||||
| Investment operations: | ||||||||||||||||||||||||
| Net investment income | 0.08 | 0.10 | 0.18 | 0.30 | 0.28 | 0.24 | ||||||||||||||||||
| Net realized and unrealized gain (loss) on investments | (2.92 | ) | 8.39 | 0.87 | 2.50 | 0.43 | 4.98 | |||||||||||||||||
| Total from investment operations | (2.84 | ) | 8.49 | 1.05 | 2.80 | 0.71 | 5.22 | |||||||||||||||||
| Less distributions to shareholders from: | ||||||||||||||||||||||||
| Net investment income | (0.07 | ) | (0.11 | ) | (0.18 | ) | (0.32 | ) | (0.26 | ) | (0.26 | ) | ||||||||||||
| Net realized gains | (3.37 | ) | (0.44 | ) | (2.30 | ) | (2.14 | ) | (0.74 | ) | — | |||||||||||||
| Total distributions | (3.44 | ) | (0.55 | ) | (2.48 | ) | (2.46 | ) | (1.00 | ) | (0.26 | ) | ||||||||||||
| Redemption fees | — | — | — | — | — | — | ||||||||||||||||||
| Net asset value, end of period | $ | 22.92 | $ | 29.20 | $ | 21.26 | $ | 22.69 | $ | 22.35 | $ | 22.64 | ||||||||||||
| Total Return(a) | (11.43 | )% (b) | 40.48 | % | 4.43 | % | 15.29 | % | 3.01 | % | 29.72 | % | ||||||||||||
| Ratios and Supplemental Data: | ||||||||||||||||||||||||
| Net assets, end of period (000 omitted) | $ | 22,259 | $ | 26,537 | $ | 24,615 | $ | 25,398 | $ | 28,870 | $ | 40,957 | ||||||||||||
| Before waiver | ||||||||||||||||||||||||
| Ratio of expenses to average net assets | 1.11 | % (c) | 1.11 | % | 1.16 | % | 1.10 | % | 1.11 | % | 1.17 | % | ||||||||||||
| After waiver | ||||||||||||||||||||||||
| Ratio of expenses to average net assets | 0.98 | % (c) | 0.98 | % | 0.98 | % | 0.98 | % | 0.98 | % | 0.99 | % (d) | ||||||||||||
| Ratio of net investment income to average net assets | 0.56 | % (c) | 0.40 | % | 0.85 | % | 1.40 | % | 1.17 | % | 1.20 | % | ||||||||||||
| Portfolio turnover rate(e) | 20 | % (b) | 30 | % | 57 | % | 50 | % | 58 | % | 50 | % | ||||||||||||
| (a) | Total return in the above table represents the rate that the investor would have earned or lost on an investment in the Fund, assuming reinvestment of distributions. |
| (b) | Not annualized. |
| (c) | Annualized. |
| (d) | This ratio includes the impact of overdraft fees. If this cost had been excluded, the ratio of expenses to average net assets would have been 0.98% for the fiscal year ended October 31, 2017. |
| (e) | Portfolio turnover is calculated on the basis of the Fund as a whole without distinguishing among the classes of shares. |
See accompanying notes which are an integral part of these financial statements.
21
| Dana Epiphany ESG Small Cap Equity Fund – Institutional Class |
| Financial Highlights |
| (For a share outstanding during each period) |
| For the Six | ||||||||||||||||||||||||
| Months | ||||||||||||||||||||||||
| Ended April | ||||||||||||||||||||||||
| 30, 2022 | For the Years Ended October 31, | |||||||||||||||||||||||
| (Unaudited) | 2021 | 2020 | 2019 | 2018 | 2017 | |||||||||||||||||||
| Selected Per Share Data | ||||||||||||||||||||||||
| Net asset value, beginning of period | $ | 15.91 | $ | 9.82 | $ | 10.24 | $ | 11.09 | $ | 11.43 | $ | 9.30 | ||||||||||||
| Investment operations: | ||||||||||||||||||||||||
| Net investment income (loss) | — | (a) | (0.03 | ) | 0.01 | 0.01 | (0.03 | ) | — | (a) | ||||||||||||||
| Net realized and unrealized gain (loss) on investments | (2.52 | ) | 6.12 | (0.42 | ) | (0.05 | ) | (0.31 | ) | 2.14 | ||||||||||||||
| Total from investment operations | (2.52 | ) | 6.09 | (0.41 | ) | (0.04 | ) | (0.34 | ) | 2.14 | ||||||||||||||
| Less distributions to shareholders from: | ||||||||||||||||||||||||
| Net investment income | — | — | (0.01 | ) | — | — | (a) | (0.01 | ) | |||||||||||||||
| Net realized gains | (1.28 | ) | — | — | (0.81 | ) | — | — | ||||||||||||||||
| Total distributions | (1.28 | ) | — | (0.01 | ) | (0.81 | ) | — | (a) | (0.01 | ) | |||||||||||||
| Redemption fees | — | — | — | — | — | — | ||||||||||||||||||
| Net asset value, end of period | $ | 12.11 | $ | 15.91 | $ | 9.82 | $ | 10.24 | $ | 11.09 | $ | 11.43 | ||||||||||||
| Total Return(b) | (17.25 | )% (c) | 62.02 | % | (4.04 | )% | 0.83 | % | (2.95 | )% | 23.08 | % | ||||||||||||
| Ratios and Supplemental Data: | ||||||||||||||||||||||||
| Net assets, end of period (000 omitted) | $ | 13,684 | $ | 17,439 | $ | 9,861 | $ | 12,421 | $ | 16,196 | $ | 14,011 | ||||||||||||
| Before waiver | ||||||||||||||||||||||||
| Ratio of expenses to average net assets | 1.78 | % (d) | 2.05 | % | 2.58 | % | 1.88 | % | 1.75 | % | 2.02 | % | ||||||||||||
| After waiver | ||||||||||||||||||||||||
| Ratio of expenses to average net assets | 0.95 | % (d) | 0.95 | % | 0.95 | % | 0.95 | % | 0.95 | % | 0.95 | % | ||||||||||||
| Ratio of net investment income (loss) to average net assets | 0.01 | % (d) | (0.24 | )% | 0.02 | % | 0.11 | % | (0.24 | )% | — | % | ||||||||||||
| Portfolio turnover rate | 43 | % (c) | 92 | % | 88 | % | 50 | % | 78 | % | 58 | % | ||||||||||||
| (a) | Rounds to less than $0.005 per share. |
| (b) | Total return in the above table represents the rate that the investor would have earned or lost on an investment in the Fund, assuming reinvestment of distributions. |
| (c) | Not annualized. |
| (d) | Annualized. |
See accompanying notes which are an integral part of these financial statements.
22
| Dana Epiphany ESG Equity Fund – Institutional Class |
| Financial Highlights |
| (For a share outstanding during each period) |
| For the Six | ||||||||||||||||||||||||
| Months | ||||||||||||||||||||||||
| Ended April | ||||||||||||||||||||||||
| 30, 2022 | For the Years Ended October 31, | |||||||||||||||||||||||
| (Unaudited) | 2021 | 2020 | 2019 | 2018 | 2017(a) | |||||||||||||||||||
| Selected Per Share Data | ||||||||||||||||||||||||
| Net asset value, beginning of period | $ | 13.97 | $ | 10.25 | $ | 11.58 | $ | 11.80 | $ | 13.09 | $ | 10.86 | ||||||||||||
| Investment operations: | ||||||||||||||||||||||||
| Net investment income | 0.05 | 0.06 | 0.09 | 0.14 | 0.08 | (b) | 0.04 | (b) | ||||||||||||||||
| Net realized and unrealized gain (loss) on investments | (1.39 | ) | 3.87 | 0.47 | 1.15 | 0.74 | 2.37 | |||||||||||||||||
| Total from investment operations | (1.34 | ) | 3.93 | 0.56 | 1.29 | 0.82 | 2.41 | |||||||||||||||||
| Less distributions to shareholders from: | ||||||||||||||||||||||||
| Net investment income | (0.05 | ) | (0.06 | ) | (0.10 | ) | (0.12 | ) | (0.08 | ) | (0.01 | ) | ||||||||||||
| Net realized gains | (0.19 | ) | (0.15 | ) | (1.79 | ) | (1.39 | ) | (2.03 | ) | (0.17 | ) | ||||||||||||
| Total distributions | (0.24 | ) | (0.21 | ) | (1.89 | ) | (1.51 | ) | (2.11 | ) | (0.18 | ) | ||||||||||||
| Redemption fees | — | — | — | — | — | — | (c) | |||||||||||||||||
| Net asset value, end of period | $ | 12.39 | $ | 13.97 | $ | 10.25 | $ | 11.58 | $ | 11.80 | $ | 13.09 | ||||||||||||
| Total Return(d) | (9.79 | )% (e) | 38.70 | % | 4.76 | % | 12.76 | % | 6.32 | % | 22.46 | % | ||||||||||||
| Ratios and Supplemental Data: | ||||||||||||||||||||||||
| Net assets, end of period (000 omitted) | $ | 74,716 | $ | 67,557 | $ | 13,062 | $ | 5,079 | $ | 6,485 | $ | 7,429 | ||||||||||||
| Before waiver | ||||||||||||||||||||||||
| Ratio of expenses to average net assets | 0.95 | % (f) | 1.12 | % | 2.00 | % | 2.13 | % | 1.63 | % | 2.15 | % | ||||||||||||
| After waiver | ||||||||||||||||||||||||
| Ratio of expenses to average net assets | 0.85 | % (f) | 0.85 | % | 0.85 | % | 0.90 | % | 1.25 | % | 1.82 | % | ||||||||||||
| Ratio of net investment income to average net assets | 0.76 | % (f) | 0.57 | % | 0.89 | % | 1.19 | % | 0.62 | % | 0.36 | % | ||||||||||||
| Portfolio turnover rate | 17 | % (e) | 18 | % | 67 | % | 60 | % | 23 | % | 97 | % | ||||||||||||
| (a) | Effective May 30, 2017, Class C shares were renamed Class I Shares. Effective December 19, 2018, Class I shares were renamed Institutional Class Shares. |
| (b) | Per share net investment income (loss) has been determined on the basis of average shares outstanding during the period. |
| (c) | Rounds to less than $0.005 per share. |
| (d) | Total return in the above table represents the rate that the investor would have earned or lost on an investment in the Fund, assuming reinvestment of distributions. |
| (e) | Not annualized. |
| (f) | Annualized. |
See accompanying notes which are an integral part of these financial statements.
23
| Dana Funds |
| Notes to the Financial Statements |
| April 30, 2022 (Unaudited) |
NOTE 1. ORGANIZATION
The Dana Large Cap Equity Fund (the “Large Cap Fund”), the Dana Epiphany ESG Small Cap Equity Fund (the “Small Cap Fund”), and the Dana Epiphany ESG Equity Fund (the “Epiphany ESG Fund”) (each a “Fund” and collectively, the “Funds”) are each registered under the Investment Company Act of 1940, as amended (“1940 Act”), as an open-end diversified series of Valued Advisers Trust (the “Trust”). The Trust is a management investment company established under the laws of Delaware by an Agreement and Declaration of Trust dated June 13, 2008 (the “Trust Agreement”). The Trust Agreement permits the Board of Trustees (“Board”) to issue an unlimited number of shares of beneficial interest of separate series without par value. Each Fund is one of a series of funds currently authorized by the Board. The investment adviser to the Funds is Dana Investment Advisors, Inc. (the “Adviser”). Each Fund seeks long-term growth of capital.
The Large Cap Fund currently offers Investor Class shares and Institutional Class shares. The Small Cap Fund and Epiphany ESG Fund currently offer Institutional Class shares. Effective on the close of business on October 13, 2017, Class A shares were consolidated into Class N shares of the Large Cap Fund which were subsequently re-designated Investor Class shares. Each share represents an equal proportionate interest in the assets and liabilities belonging to the Fund and is entitled to such dividends and distributions out of income belonging to the Fund as declared by the Board. Prior to February 28, 2017, all share classes of the Large Cap Fund and the Small Cap Fund imposed a 2.00% redemption fee on shares redeemed within 60 days of purchase.
NOTE 2. SIGNIFICANT ACCOUNTING POLICIES
The Funds are investment companies and follow accounting and reporting guidance under Financial Accounting Standards Board Accounting Standards Codification (“ASC”) Topic 946, “Financial Services-Investment Companies.” The following is a summary of significant accounting policies followed by the Funds in the preparation of their financial statements. These policies are in conformity with generally accepted accounting principles in the United States of America (“GAAP”).
Estimates – The preparation of financial statements in conformity with GAAP requires management to make estimates and assumptions that affect the reported amounts of assets and liabilities and disclosure of contingent assets and liabilities at the date of the financial statements and the reported amounts of increases and decreases in net assets from operations during the reporting period. Actual results could differ from those estimates.
Federal Income Taxes – The Funds make no provision for federal income or excise tax. Each Fund has qualified and intends to qualify each year as a regulated investment company (“RIC”) under subchapter M of the Internal Revenue Code of 1986, as amended,
24
| Dana Funds |
| Notes to the Financial Statements (continued) |
| April 30, 2022 (Unaudited) |
by complying with the requirements applicable to RICs and by distributing substantially all of its taxable income. Each Fund also intends to distribute sufficient net investment income and net capital gains, if any, so that it will not be subject to excise tax on undistributed income and gains. If the required amount of net investment income or gains is not distributed, the Funds could incur a tax expense.
As of and during the six months ended April 30, 2022, the Funds did not have any liabilities for any unrecognized tax benefits. The Funds recognize interest and penalties, if any, related to unrecognized tax benefits as income tax expense on the Statements of Operations when incurred. During the six months ended April 30, 2022, the Funds did not incur any interest or penalties. Management of the Funds has reviewed tax positions taken in tax years that remain subject to examination by all major tax jurisdictions, including federal (i.e., the last three tax year ends and the interim tax period since then, as applicable). Management believes that there is no tax liability resulting from unrecognized tax benefits related to uncertain tax positions taken.
Expenses – Expenses incurred by the Trust that do not relate to a specific fund of the Trust are allocated to the individual funds based on each fund’s relative net assets or another appropriate basis (as determined by the Board). Expenses specifically attributable to any class are borne by that class. Income, realized gains and losses, unrealized appreciation and depreciation, and fund-wide expenses not allocated to a particular class shall be allocated to each class based on the net assets of that class in relation to the net assets of the entire fund.
Security Transactions and Related Income – The Funds follow industry practice and record security transactions on the trade date for financial reporting purposes. The specific identification method is used for determining gains or losses for financial statement and income tax purposes. Dividend income is recorded on the ex-dividend date and interest income is recorded on an accrual basis. Withholding taxes on foreign dividends, if any, have been provided for in accordance with the Funds’ understanding of the applicable country’s tax rules and rates.
The Funds may hold Real Estate Investment Trusts (“REITs”) which pay dividends to their shareholders based upon available funds from operations. It is possible for these dividends to exceed the REIT’s underlying taxable earnings and profits resulting in the excess portion of such dividends being designated as a return of capital. Distributions received from REITs that represent a return of capital or capital gains are recorded as a reduction of the cost of the REITs or as a realized gain, respectively.
Dividends and Distributions – The Funds intend to distribute substantially all of their net investment income, if any, at least quarterly. The Funds intend to distribute their net realized long-term and short-term capital gains, if any, annually. Distributions to shareholders, which are determined in accordance with income tax regulations, are recorded on the
25
| Dana Funds |
| Notes to the Financial Statements (continued) |
| April 30, 2022 (Unaudited) |
ex-dividend date. The treatment for financial reporting purposes of distributions made to shareholders during the year from net investment income or net realized capital gains may differ from their ultimate treatment for federal income tax purposes. These differences are caused primarily by differences in the timing of the recognition of certain components of income, expense or realized capital gain for federal income tax purposes. Where such differences are permanent in nature, they are reclassified in the components of the net assets based on their ultimate characterization for federal income tax purposes. Any such reclassifications will have no effect on net assets, results of operations or net asset value (“NAV”) per share of the Funds.
Share Valuation – The NAV per share of each class of each Fund is calculated each day the New York Stock Exchange (“NYSE”) is open by dividing the total value of the assets attributable to that class, less liabilities attributable to that class, by the number of shares outstanding of that class.
NOTE 3. SECURITIES VALUATION AND FAIR VALUE MEASUREMENTS
Each Fund values its portfolio securities at fair value as of the close of regular trading on the NYSE (normally 4:00 p.m. Eastern time) on each business day the NYSE is open for business. Fair value is defined as the price that a Fund would receive upon selling an investment in a timely transaction to an independent buyer in the principal or most advantageous market of the investment. GAAP establishes a three-tier hierarchy to maximize the use of observable market data and minimize the use of unobservable inputs and to establish classification of fair value measurements for disclosure purposes.
Inputs refer broadly to the assumptions that market participants would use in pricing the asset or liability, including assumptions about risk (the risk inherent in a particular valuation technique used to measure fair value including a pricing model and/or the risk inherent in the inputs to the valuation technique). Inputs may be observable or unobservable. Observable inputs are inputs that reflect the assumptions market participants would use in pricing the asset or liability developed based on market data obtained and available from sources independent of the reporting entity. Unobservable inputs are inputs that reflect the reporting entity’s own assumptions about the assumptions market participants would use in pricing the asset or liability developed based on the best information available in the circumstances.
Various inputs are used in determining the value of each Fund’s investments. These inputs are summarized in the three broad levels listed below.
| ● | Level 1 – unadjusted quoted prices in active markets for identical investments and/or registered investment companies where the value per share is determined and published |
26
| Dana Funds |
| Notes to the Financial Statements (continued) |
| April 30, 2022 (Unaudited) |
and is the basis for current transactions for identical assets or liabilities at the valuation date
| ● | Level 2 – other significant observable inputs (including, but not limited to, quoted prices for an identical security in an inactive market, quoted prices for similar securities, interest rates, prepayment speeds, credit risk, etc.) |
| ● | Level 3 – significant unobservable inputs (including the Funds’ own assumptions in determining fair value of investments based on the best information available) |
The inputs used to measure fair value may fall into different levels of the fair value hierarchy. In such cases, for disclosure purposes, the level in the fair value hierarchy which is reported is determined based on the lowest level input that is significant to the fair value measurement in its entirety.
Equity securities that are traded on any stock exchange are generally valued at the last quoted sale price on the security’s primary exchange. Lacking a last sale price, an exchange-traded security is generally valued at its last bid price. Securities traded in the NASDAQ over-the-counter market are generally valued at the NASDAQ Official Closing Price. When using market quotations and when the market is considered active, the security is classified as a Level 1 security. In the event that market quotations are not readily available or are considered unreliable due to market or other events, a Fund values its securities and other assets at fair value in accordance with policies established by and under the general supervision of the Board. Under these policies, the securities will be classified as Level 2 or 3 within the fair value hierarchy, depending on the inputs used.
Investments in mutual funds, including money market mutual funds, are generally priced at the ending NAV. These securities are categorized as Level 1 securities.
In accordance with the Trust’s valuation policies, the Adviser is required to consider all appropriate factors relevant to the value of securities for which it has determined other pricing sources are not available or reliable as described above. No single method exists for determining fair value, because fair value depends upon the circumstances of each individual case. As a general principle, the current fair value of a security being valued by the Adviser would be the amount that the Funds might reasonably expect to receive upon the current sale. Methods that are in accordance with this principle may, for example, be based on (i) a multiple of earnings; (ii) a discount from market prices of a similar freely traded security (including a derivative security or a basket of securities traded on other markets, exchanges or among dealers); or (iii) yield to maturity with respect to debt issues, or a combination of these and other methods. Fair-value pricing is permitted if, in the Adviser’s opinion, the validity of market quotations appears to be questionable based on factors such as evidence of a thin market in the security based on a small number of
27
| Dana Funds |
| Notes to the Financial Statements (continued) |
| April 30, 2022 (Unaudited) |
quotations, a significant event occurs after the close of a market but before a Fund’s NAV calculation that may affect a security’s value, or the Adviser is aware of any other data that calls into question the reliability of market quotations.
The following is a summary of the inputs used to value the Funds’ investments as of April 30, 2022:
| Large Cap Fund | Valuation Inputs | |||||||||||||||
| Assets | Level 1 | Level 2 | Level 3 | Total | ||||||||||||
| Common Stocks(a) | $ | 117,692,100 | $ | — | $ | — | $ | 117,692,100 | ||||||||
| Money Market Funds | 1,158,041 | — | — | 1,158,041 | ||||||||||||
| Total | $ | 118,850,141 | $ | — | $ | — | $ | 118,850,141 | ||||||||
| Small Cap Fund | Valuation Inputs | |||||||||||||||
| Assets | Level 1 | Level 2 | Level 3 | Total | ||||||||||||
| Common Stocks(a) | $ | 13,538,618 | $ | — | $ | — | $ | 13,538,618 | ||||||||
| Money Market Funds | 32,976 | — | — | 32,976 | ||||||||||||
| Total | $ | 13,571,594 | $ | — | $ | — | $ | 13,571,594 | ||||||||
| Epiphany ESG Fund | Valuation Inputs | |||||||||||||||
| Assets | Level 1 | Level 2 | Level 3 | Total | ||||||||||||
| Common Stocks(a) | $ | 73,730,306 | $ | — | $ | — | $ | 73,730,306 | ||||||||
| Money Market Funds | 1,448,681 | — | — | 1,448,681 | ||||||||||||
| Total | $ | 75,178,987 | $ | — | $ | — | $ | 75,178,987 | ||||||||
| (a) | Refer to Schedule of Investments for sector classifications. |
The Funds did not hold any investments at the end of the reporting period for which significant unobservable inputs (Level 3) were used in determining fair value; therefore, no reconciliation of Level 3 securities is included for this reporting period.
NOTE 4. FEES AND OTHER TRANSACTIONS WITH AFFILIATES AND OTHER SERVICE PROVIDERS
The Adviser, under the terms of the management agreement for each Fund, manages the Funds’ investments subject to oversight of the Board. As compensation for its management services, the Funds are obligated to pay the Adviser a fee computed and accrued daily and paid monthly at an annual rate of 0.65%, 0.75% and 0.65% of the average daily net assets of the Large Cap Fund, the Small Cap Fund and the Epiphany ESG Fund, respectively. For the six months ended April 30, 2022, the Adviser earned fees of $434,896 from the Large Cap Fund, $63,684 from the Small Cap Fund and $242,501 from the Epiphany ESG Fund before the waivers described below. At April 30, 2022, the Large Cap Fund and Epiphany ESG Fund owed the Adviser $52,557 and $34,927, respectively and the Adviser owed the Small Cap Fund $2,803.
The Adviser has contractually agreed to waive its management fee and/or reimburse certain operating expenses through February 28, 2023, but only to the extent necessary
28
| Dana Funds |
| Notes to the Financial Statements (continued) |
| April 30, 2022 (Unaudited) |
so that the Funds’ net expenses, excluding brokerage fees and commissions, borrowing costs (such as interest and dividend expenses on securities sold short), taxes, extraordinary expenses, fees and expenses paid under a distribution plan adopted pursuant to Rule 12b-1, fees and expenses paid under a shareholder services plan, and indirect expenses (such as “acquired fund fees and expenses”) do not exceed 0.73% of the average daily net assets of the Institutional Class and the Investor Class for the Large Cap Fund, 0.95% of the average daily net assets of the Institutional Class for the Small Cap Fund, and 0.85% of the average daily net assets of the Institutional Class for the Epiphany ESG Fund.
Each fee waiver or expense reimbursement by the Adviser is subject to repayment by the applicable Fund within three years following the date in which the fee waiver or expense reimbursement occurred, provided that the Fund is able to make the repayment without exceeding the expense limitation that is in effect at the time of the waiver or expense reimbursement, and the expense limitation in effect at the time of the repayment. The expense limitation agreements may not be terminated except by mutual consent of the Adviser and the Board. For the six months ended April 30, 2022, the Adviser waived fees of $88,375 from the Large Cap Fund, $70,011 from the Small Cap Fund and $37,632 from the Epiphany ESG Fund.
The amounts subject to repayment by the Funds, pursuant to the aforementioned conditions are as follows:
| Large Cap | Small Cap | Epiphany | ||||||||||
| Recoverable Through | Fund | Fund | ESG Fund | |||||||||
| October 31, 2022 | $ | 95,237 | $ | 81,206 | $ | 81,601 | ||||||
| October 31, 2023 | 227,431 | 187,744 | 154,164 | |||||||||
| October 31, 2024 | 174,396 | 164,133 | 108,826 | |||||||||
| April 30, 2025 | 88,375 | 70,011 | 37,632 | |||||||||
The Trust retains Ultimus Fund Solutions, LLC (“Ultimus” or “Administrator”) to provide the Funds with administration and compliance (including a chief compliance officer), fund accounting and transfer agent services, including all regulatory reporting. For the six months ended April 30, 2022, fees for administration, compliance, fund accounting, and transfer agent services, and amounts due to the Administrator at April 30, 2022 were as follows:
| Epiphany ESG | ||||||||||||
| Large Cap Fund | Small Cap Fund | Fund | ||||||||||
| Administration and compliance | $ | 38,170 | $ | 16,364 | $ | 22,458 | ||||||
| Fund accounting | 22,452 | 12,397 | 13,965 | |||||||||
| Transfer agent | 11,405 | 8,927 | 8,927 | |||||||||
| Payable to Administrator | 11,361 | 6,020 | 5,338 | |||||||||
The officers and one trustee of the Trust are members of management and/or employees of the Administrator and are not paid by the Trust for services to the Funds. Ultimus Fund
29
| Dana Funds |
| Notes to the Financial Statements (continued) |
| April 30, 2022 (Unaudited) |
Distributors, LLC (the “Distributor”), a wholly-owned subsidiary of Ultimus, acts as the distributor of the Funds’ shares. There were no payments made to the Distributor by the Funds for the six months ended April 30, 2022.
The Trust, with respect to the Large Cap Fund, has adopted a Distribution Plan (the “Plan”) pursuant to Rule 12b-1 under the Investment Company Act of 1940, as amended (the “1940 Act”). The Plan provides that the Large Cap Fund will pay the Distributor and any registered securities dealer, financial institution or any other person (a “Recipient”) a shareholder servicing fee aggregating at a rate of 0.25% of the average daily net assets for the Investor Class shares in connection with the promotion and distribution of the Large Cap Fund’s shares or the provision of shareholder support services to shareholders, including, but not necessarily limited to, advertising, compensation to underwriters, dealers and selling personnel, the printing and mailing of prospectuses to other than current Investor Class shareholders, the printing and mailing of sales literature and servicing shareholder accounts (“12b-1 Expenses”). The Large Cap Fund or Distributor may pay all or a portion of these fees to any Recipient who renders assistance in distributing or promoting the sale of shares, or who provides certain shareholder services, pursuant to a written agreement. The Plan is a compensation plan, which means that compensation is paid regardless of 12b-1 Expenses actually incurred. It is anticipated that the Plan will benefit shareholders because an effective sales program typically is necessary in order for the Large Cap Fund to reach and maintain a sufficient size to achieve efficiently its investment objectives and to realize economies of scale. For the six months ended April 30, 2022, the Investor Class shares 12b-1 expense incurred by the Large Cap Fund was $31,441. As of April 30, 2022, the Large Cap Fund owed the Distributor $4,852.
NOTE 5. PURCHASES AND SALES OF SECURITIES
For the six months ended April 30, 2022, purchases and sales of investment securities, other than short-term investments were as follows:
| Purchases | Sales | |||||||
| Large Cap Fund | $ | 26,917,965 | $ | 34,436,238 | ||||
| Small Cap Fund | 7,114,037 | 7,824,100 | ||||||
| Epiphany ESG Fund | 27,705,169 | 12,200,251 | ||||||
There were no purchases or sales of long-term U.S. government obligations during the six months ended April 30, 2022.
30
| Dana Funds |
| Notes to the Financial Statements (continued) |
| April 30, 2022 (Unaudited) |
NOTE 6. FEDERAL TAX INFORMATION
At April 30, 2022, the net unrealized appreciation (depreciation) and tax cost of investments for tax purposes was as follows:
| Large Cap | Small Cap | Epiphany | ||||||||||
| Fund | Fund | ESG Fund | ||||||||||
| Gross unrealized appreciation | $ | 28,414,932 | $ | 1,503,968 | $ | 6,236,512 | ||||||
| Gross unrealized depreciation | (3,470,104 | ) | (1,408,649 | ) | (3,596,640 | ) | ||||||
| Net unrealized appreciation/(depreciation) on investments | 24,944,828 | 95,319 | 2,639,872 | |||||||||
| Tax cost of investments | 93,905,313 | 13,476,275 | 72,539,115 | |||||||||
At April 30, 2022, the difference between book basis and tax basis unrealized appreciation for the Large Cap Fund, Small Cap Fund and Epiphany ESG Fund was attributable primarily to the tax deferral of losses on wash sales.
The tax character of distributions paid for the fiscal year ended October 31, 2021, the Funds’ most recent fiscal year end, was as follows:
| Large Cap | Small Cap | Epiphany | ||||||||||
| Fund | Fund | ESG Fund | ||||||||||
| Distributions paid from: | ||||||||||||
| Ordinary income(a) | $ | 818,449 | $ | — | $ | 157,453 | ||||||
| Long-term capital gains | 2,320,073 | — | 257,983 | |||||||||
| Total distributions paid | $ | 3,138,522 | $ | — | $ | 415,436 | ||||||
| (a) | Short-term capital gain distributions are treated as ordinary income for tax purposes. |
At October 31, 2021, the components of accumulated earnings (deficit) on a tax basis were as follows:
| Large Cap | Small Cap | Epiphany | ||||||||||
| Fund | Fund | ESG Fund | ||||||||||
| Undistributed ordinary income | $ | 3,266,725 | $ | 112,914 | $ | 282,753 | ||||||
| Undistributed long-term capital gains | 13,038,888 | 1,308,341 | 833,581 | |||||||||
| Unrealized appreciation on investments | 49,942,942 | 4,688,791 | 10,913,341 | |||||||||
| Total accumulated earnings | $ | 66,248,555 | $ | 6,110,046 | $ | 12,029,675 | ||||||
Capital loss carryforwards are available to offset future realized capital gains and thereby reduce further taxable gain distributions. During the fiscal year ended October 31, 2021, the Small Cap Fund utilized $1,358,864 of its capital loss carryforwards.
31
| Dana Funds |
| Notes to the Financial Statements (continued) |
| April 30, 2022 (Unaudited) |
NOTE 7. SECTOR RISK
If a Fund has significant investments in the securities of issuers within a particular sector, any development affecting that sector will have a greater impact on the value of the net assets of the Fund than would be the case if the Fund did not have significant investments in that sector. In addition, this may increase the risk of loss in the Fund and increase the volatility of the Fund’s NAV per share. For instance, economic or market factors, regulatory changes or other developments may negatively impact all companies in a particular sector, and therefore the value of the Fund’s portfolio will be adversely affected. As of April 30, 2022, the Large Cap Fund and Epiphany ESG Fund had 25.36% and 25.27% of the value of their net assets invested in stocks within the Technology sector, respectively.
NOTE 8. COMMITMENTS AND CONTINGENCIES
The Trust indemnifies its officers and Trustees for certain liabilities that may arise from their performance of their duties to the Trust or the Funds. Additionally, in the normal course of business, the Trust enters into contracts that contain a variety of representations and warranties which provide general indemnifications. The Trust’s maximum exposure under these arrangements is unknown, as this would involve future claims that may be made against the Trust that have not yet occurred.
NOTE 9. SUBSEQUENT EVENTS
Management of the Funds has evaluated the need for disclosures and/or adjustments resulting from subsequent events through the date at which these financial statements were issued. Based upon this evaluation, management has determined there were no items requiring adjustment of the financial statements or additional disclosure.
32
| Summary of Fund Expenses (Unaudited) |
As a shareholder of a Fund, you incur two types of costs: (1) transaction costs and (2) ongoing costs, including management fees and other Fund expenses. These examples are intended to help you understand your ongoing costs (in dollars) of investing in each Fund and to compare these costs with the ongoing costs of investing in other mutual funds. Each Fund’s example is based on an investment of $1,000 invested at the beginning of the period and held for the entire period from November 1, 2021 through April 30, 2022.
Actual Expenses
The first line of the table for each class provides information about actual account values and actual expenses. You may use the information in these lines, together with the amount you invested, to estimate the expenses that you paid over the period. Simply divide your account value by $1,000 (for example, an $8,600 account value divided by $1,000 = 8.60), then multiply the result by the number in the first line under the heading “Expenses Paid During Period” to estimate the expenses you paid on your account during this period.
Hypothetical Example for Comparison Purposes
The second line of the table for each class provides information about hypothetical account values and hypothetical expenses based on each Fund’s actual expense ratios and an assumed rate of return of 5% per year before expenses, which is not the Fund’s actual return. The hypothetical account values and expenses may not be used to estimate the actual ending account balances or expenses you paid for the period. You may use this information to compare the ongoing costs of investing in the Funds and other funds. To do so, compare this 5% hypothetical example with the 5% hypothetical examples that appear in the shareholder reports of other funds.
Expenses shown in the table are meant to highlight your ongoing costs only and do not reflect any transactional costs. Therefore, the second line of the table for each class is useful in comparing ongoing costs only and will not help you determine the relative total costs of owning different funds. In addition, if transaction costs were included, your costs would have been higher.
33
| Summary of Fund Expenses (Unaudited) (continued) |
| Beginning | Ending | |||||||||
| Account | Account | Expenses | ||||||||
| Value | Value | Paid | Annualized | |||||||
| November | April 30, | During | Expense | |||||||
| 1, 2021 | 2022 | Period(a) | Ratio | |||||||
| Large Cap Fund | ||||||||||
| Institutional Class | Actual | $1,000.00 | $886.90 | $3.42 | 0.73% | |||||
| Hypothetical(b) | $1,000.00 | $1,021.17 | $3.66 | 0.73% | ||||||
| Investor Class | Actual | $1,000.00 | $885.70 | $4.58 | 0.98% | |||||
| Hypothetical(b) | $1,000.00 | $1,019.93 | $4.91 | 0.98% | ||||||
| Small Cap Fund | ||||||||||
| Institutional Class | Actual | $1,000.00 | $827.50 | $4.30 | 0.95% | |||||
| Hypothetical(b) | $1,000.00 | $1,020.08 | $4.76 | 0.95% | ||||||
| Epiphany ESG Fund | ||||||||||
| Institutional Class | Actual | $1,000.00 | $902.10 | $4.01 | 0.85% | |||||
| Hypothetical(b) | $1,000.00 | $1,020.58 | $4.26 | 0.85% | ||||||
| (a) | Expenses are equal to the Fund’s annualized expense ratios, multiplied by the average account value over the period, multiplied by 181/365 (to reflect the one-half year period). The annualized expense ratios reflect reimbursement of expenses by the Fund’s investment adviser for the period beginning November 1, 2021 to April 30, 2022. The “Financial Highlights” tables in the Fund’s financial statements, included in this report, also show the gross expense ratios, without such reimbursements. |
| (b) | Hypothetical assumes 5% annual return before expenses. |
34
| FACTS | WHAT DO THE DANA FUNDS (the “FUNDS”) DO WITH YOUR PERSONAL INFORMATION? | |
| Why? | Financial companies choose how they share your personal information. Federal law gives consumers the right to limit some but not all sharing. Federal law also requires us to tell you how we collect, share, and protect your personal information. Please read this notice carefully to understand what we do. | |
| What? | The types of personal information we collect and share depend on the product or service you have with us. This information can include:
■ Social Security number
■ account balances and account transactions
■ transaction or loss history and purchase history
■ checking account information and wire transfer instructions
When you are no longer our customer, we continue to share your information as described in this notice. | |
| How? | All financial companies need to share customers’ personal information to run their everyday business. In the section below, we list the reasons financial companies can share their customers’ personal information; the reasons Dana Funds choose to share; and whether you can limit this sharing. | |
| Reasons we can share your personal information | Do the Funds share? | |
For our everyday business purposes — such as to process your transactions, maintain your account(s), respond to court orders and legal investigations, or report to credit bureaus |
Yes | |
For our marketing purposes — to offer our products and services to you |
No | |
| For joint marketing with other financial companies | No | |
For our affiliates’ everyday business purposes – information about your transactions and experiences |
No | |
For our affiliates’ everyday business purposes – information about your creditworthiness |
No | |
| For nonaffiliates to market to you | No | |
| Questions? | Call (855) 280-9648 | |
35
| Who we are | |
| Who is providing this notice? | Dana Funds Ultimus Fund Distributors, LLC (Distributor) Ultimus Fund Solutions, LLC (Administrator) |
| What we do | |
| How
do the Funds protect my personal information? |
To protect your personal information from unauthorized access and use, we use security measures that comply with federal law. These measures include computer safeguards and secured files and buildings. Our service providers are held accountable for adhering to strict policies and procedures to prevent any misuse of your nonpublic personal information. |
| How
do the Funds collect my personal information? |
We collect your personal information, for example, when you
■ open an account or deposit money
■ buy securities from us or sell securities to us
■ make deposits or withdrawals from your account
■ give us your account information
■ make a wire transfer
■ tell us who receives the money
■ tell us where to send the money
■ show your government-issued ID
■ show your driver’s license |
| Why can’t I limit all sharing? | Federal law gives you the right to limit only
■ sharing for affiliates’ everyday business purposes— information about your creditworthiness
■ affiliates from using your information to market to you
■ sharing for nonaffiliates to market to you
State laws and individual companies may give you additional rights to limit sharing. |
| Definitions | |
| Affiliates | Companies related by common ownership or control. They can be financial and nonfinancial companies.
■ Dana Investment Advisors, Inc., the investment adviser to the Funds, could be deemed to be an affiliate. |
| Nonaffiliates | Companies not related by common ownership or control. They can be financial and nonfinancial companies.
■ The Dana Funds do not share your personal information with nonaffiliates so they can market to you. |
| Joint marketing | A formal agreement between nonaffiliated financial companies that together market financial products or services to you.
■ The Dana Funds do not jointly market. |
36
PROXY VOTING
A description of the policies and procedures that each Fund uses to determine how to vote proxies relating to portfolio securities and information regarding how each Fund voted those proxies during the most recent twelve month period ended June 30, are available (1) without charge upon request by calling the Funds at (855) 280-9648 and (2) in Fund documents filed with the Securities and Exchange Commission (“SEC”) on the SEC’s website at www.sec.gov.
TRUSTEES Andrea N. Mullins, Chairperson Ira P. Cohen Mark J. Seger
OFFICERS Matthew J. Miller, Principal Executive Officer and President Zachary P. Richmond, Principal Financial Officer and Treasurer N. Lynn Bowley, Chief Compliance Officer Carol J. Highsmith, Vice President and Secretary
INVESTMENT ADVISER Dana Investment Advisors, Inc. 20700 Swenson Drive, Suite 400 Waukesha, WI 53186
DISTRIBUTOR Ultimus Fund Distributors, LLC 225 Pictoria Drive, Suite 450 Cincinnati, OH 45246 |
INDEPENDENT REGISTERED PUBLIC ACCOUNTING FIRM Cohen & Company, Ltd. 1350 Euclid Avenue, Suite 800 Cleveland, OH 44115
LEGAL COUNSEL Troutman Pepper Hamilton Sanders LLP 3000 Two Logan Square 18th and Arch Streets Philadelphia, PA 19103
CUSTODIAN Huntington National Bank 41 South High Street Columbus, OH 43215
ADMINISTRATOR, TRANSFER AGENT AND FUND ACCOUNTANT Ultimus Fund Solutions, LLC 225 Pictoria Drive, Suite 450 Cincinnati, OH 45246 |
This report is intended only for the information of shareholders or those who have received the Funds’ prospectus which contains information about each Fund’s management fee and expenses. Please read the prospectus carefully before investing.
Distributed by Ultimus Fund Distributors, LLC, Member FINRA/SIPC
DANA-SAR-22
| Semi-Annual Report |
| April 30, 2022 |
| Foundry Partners Fundamental Small Cap Value Fund |
| Investor Class – DRSVX |
| Institutional Class – DRISX |
| Foundry Funds |
| c/o Ultimus Fund Solutions, LLC |
| 225 Pictoria Drive, Suite 450 |
| Cincinnati, Ohio 45246 |
| (800) 247-1014 |
| Market Overview and Fund Performance (Unaudited) |
Market Review
The past six months ended April 30, 2022 have been a wild ride. Declining GDP growth, rising inflation and the Ukraine war led investors to think about stock valuations and fundamentals. In addition, investors were looking at a new and uncertain future with regards to interest rates and liquidity. The Federal Reserve (“Fed”) intimated to several 50 bps rate hikes at future meetings. These factors led to a pull back in equities and small cap stocks as the Russell 2000® Value Index declined -9.50%.
On the economic front, Q4 2021 GDP growth topped 6.9% however, Q1 2022 GDP came in at a shocking -1.4% compared to estimates calling for 1.7%! Declines in fixed investment, defense spending and a record trade imbalance stymied growth. In addition, inflation estimates were lower than actual results. On a positive note, consumer spending remained robust growing 2.7%.
Despite the huge miss on GDP, the overall US economic data over the past two quarters was robust as retail sales, housing starts, and industrial production remain strong. Nonfarm have steadily improved and the unemployment rate remains near its lowest levels in history. Our thesis of a strong consumer remains another highlight as bank account cash balances remain elevated. The big issues are inflation running at a 40-year high and real GDP growth undergoing negative revisions. Consumer prices gained 1.2% m/m (8.6% y/y) in March following a 0.8% (7.9% y/y) gain in February. CPI less food and energy or core CPI gained 0.3% (6.4% y/y). Energy, 7.5% of CPI, jumped 18.0% (32.2% y/y) as the Ukraine war and Russian sanctions pushed commodity prices higher. Real GDP estimates continued to decline slightly for 2022 and 2023. Overall, we remain bullish on the economy as GDP growth is expected to remain above 2% through 2023. Corporate profits should remain robust as 2022 estimates call for another record year.
Portfolio Review
The Foundry Partners Fundamental Small Cap Value Fund (the “Fund”) (Institutional Class) outperformed the Fund’s benchmark, the Russell 2000® Value Index, by 478 basis points over the course of the last six months ending April 30, 2022. Detractors to performance were Consumer Staples, Consumer Discretionary and Utilities. Our contributors to performance included Health Care, Industrials, Information Technology, Communication Services, Financials, Materials, Energy and Real Estate.
Financials were a strong relative performer as our Insurance and Bank stocks outperformed. Several Banks saw a tailwind at the start of the year as the Fed intimated the need to raise rates which could lead to higher margins for the banks. Many of our banks outperformed. In Health Care stock selection and our underweight added to performance. As interest rates were set to rise investors fled the long duration negative earners that are common in the small cap health care space. The Biotech industry, which has numerous negative earners dropped -44.2% over the past six months.
Our Consumer Discretionary stocks underperformed for the period. Our homebuilders came under pressure as concerns over affordability due to rising rates, weighed on the stocks. Manufacturing shut downs in China and part shortages have plagued many industries.
Semi-Annual Report
1
| Market Overview and Fund Performance (Unaudited) (Continued) |
Below we highlight our thesis on both Energy and Gold.
Energy
A spike in energy prices played a large part of the inflation narrative over the last several quarters. The invasion of Ukraine amplified the underlying structural issues in the oil and natural gas markets that have been percolating under the surface for the past several years. From 2005 to 2014 the major exploration & production companies went on a spending binge incentivized by $80 to $100 oil prices. Total North American oil rig counts more than tripled to nearly 1,600 in 2014 and capex peaked that same year as illustrated in the charts below. This flurry of activity led to new oil finds while advancement in technology maximized well efficiencies. The combination of these two dynamics ultimately led to a tilt in the global supply of oil as the US more than doubled its daily production and drove oil prices to the mid-$30s in 2016. Natural gas was already in a decade long supply glut since it was a major byproduct of oil and due to vast amount of rich shale locations through the US and Canada.
In response to lower oil prices, the majors refocused their efforts on cash flow and right sizing over extended balance sheets. Simultaneously during this time two other narratives emerged which pressured the supply of oil even further: electrification of the auto industry and ESG investing. This shifted capital away from exploration and production activity as total rig counts and capex spending dropped to below inflation adjusted trend levels. The current heightened geopolitical risks have only magnified the supply/demand imbalance which will take several years to normalize.
Source: Baker Hughes
Semi-Annual Report
2
| Market Overview and Fund Performance (Unaudited) (Continued) |
Source: FactSet & U.S. Energy Information Administration
Natural gas has the potential to benefit the most amidst this backdrop given the following: 1) Europe’s reliance on Russia for the commodity (~40% of the European Union’s natural gas comes from Russia); 2) the rise in LNG export capacity in the US (see chart below); and 3) the rise in household formation since COVID combined with the shift to electrical vehicles (60% of natural gas in the US is used for electric power and residential consumption, see below). Natural gas prices averaged $3 from 2010 to 2020 but have nearly tripled in the past six months. While part of this move was due to the Russian invasion and seasonal trends, we believe that prices will average closer to $5 for the next decade. We have had a favorable tilt towards natural gas producers within our portfolio for nearly two years now as most of the names are trading at low single digit price to cash flow multiples given the forward curve on natural gas.
Gold
Throughout history and dawn of civilization gold has been prized for a facet of reasons. Initially gold was desired as a piece of jewelry given its luster. Eventually it became a de facto currency given its mutability, scarcity and non-corrosivity characteristics. And finally, as an asset to hedge against government largesse (inherently inflationary) and a safe haven during times of increased geopolitical tensions given its store of value qualities. While central banks across the globe own some amount of gold, it is no longer a currency as fiat money came in vogue in the post-World War II era driven by the mighty US dollar. Jewelry demand remains robust, but most of it is driven from China and India and fluctuates with the price of gold (people buy more when prices fall and
Semi-Annual Report
3
| Market Overview and Fund Performance (Unaudited) (Continued) |
refrain from buying when prices are high). The hedge against frivolous government spending and its role as a safe haven asset was always the swing factor. Over the past decade this narrative has gone to the wayside due to the rise in crypto currencies, disinflation following the 2008 credit crisis despite an increase in the monetary base, and the lack of major geopolitical events on a global basis.
Shifts in the geopolitical landscape tend to be the canary in the coal mine when it has come to major moves in the price of gold over the last 100 years (see below). In 1933 FDR passed several policies in response to the great depression that weakened the link of the US dollar to gold. The price of gold doubled in the subsequent year. Nixon went off the gold standard in 1971 as the rise in social spending domestically and deficit spending to fund a series of wars abroad created a balance of payments issue for the US. In addition, as Gold and oil decoupled, the new system was gold for dollars for oil or petro dollars. Over the next decade the price of gold went up more than tenfold. 2001 witnessed the third shift in gold prices as 9/11 sparked a decade of heightened geopolitical risks across the globe and the great recession reinforced the flight to safety trade. The price of gold went up five times in the ensuing decade.
We believe that we are on the verge of a shift in the narrative of gold and the role it will play due to the following: 1) inflation is persisting longer than people expected given rolling supply shocks; 2) the trend toward deglobalization marches on as governments implement nationalistic policies to appease rising tensions at home; 3) the lack of confidence in fiat currencies following the massive money printing effort that has taken place since 2008 as is evident by the rise of Bitcoin; and 4) Russian sanctions that have forced governments abroad to rethink the role of the petro dollar in the global markets. These dynamics should create a consistent period of higher gold prices despite a normalizing real rate environment.
Source: United States Geological Survey, FactSet
Semi-Annual Report
4
Market Overview and Fund Performance (Unaudited) (Continued) |
In our opinion, we are entering a new and exciting phase for the market where valuation and fundamentals matter. A market where companies ridden with debt and unable to make money will fall to the wayside as easy monetary policy will cease to provide liquidity for their survival. Simply put a market where the art of stock picking and understanding companies will matter - It should be a great time to be a value investor!
The Fund’s performance quoted is past performance and does not guarantee future results. The investment return and principal value of an investment in the Fund will fluctuate so that an investor’s shares, when redeemed, may be worth more or less than their original cost. Current performance of the Fund may be lower or higher than the performance quoted. Performance data current to the most recent month end may be obtained by calling 1-800-247-1014. Information provided with respect to the Fund’s Portfolio Holdings, Sector Weightings and Number of Holdings are as of April 30, 2022 and are subject to change at any time.
Value stocks may remain undervalued for extended periods of time and the market may not recognize the intrinsic value of these securities.
Micro cap and small cap investing involves greater risk not associated with investing in more established companies, such as greater price volatility, business risk, less liquidity and increased competitive threat.
The opinions expressed are those of the investment management team and are subject to change without notice, as are statements of financial market trends, which are based on current conditions. Under no circumstances does the information contained within represent a recommendation to buy, hold or sell any security and it should not be assumed that the companies discussed were, or will prove to be, profitable. Current and future holdings are subject to risk.
Semi-Annual Report
5
| Investment Results (Unaudited) |
| Average
Annual Total Returns(a) As of April 30, 2022 | ||||||
| Investor | Institutional | Russell 2000® | ||||
| Class | Class | Value Index(b) | ||||
| Six Months | (4.89)% | (4.72)% | (9.50)% | |||
| One Year | (4.34)% | (4.06)% | (6.59)% | |||
| Three Year | 7.38% | 7.66% | 8.38% | |||
| Five Year | 4.84% | 5.11% | 6.75% | |||
| Ten Year | 9.00% | 9.26% | 9.81% | |||
| Expense Ratios(c) | ||||||
| Investor | Institutional | |||||
| Class | Class | |||||
| 1.28% | 1.03% | |||||
The investment return and principal value of an investment will fluctuate so that an investor’s shares, when redeemed, may be worth more or less than their original cost. The returns shown do not reflect deduction of taxes that a shareholder would pay on Foundry Partners Fundamental Small Cap Value Fund (the “Fund”) distributions or the redemption of Fund shares. THE FUND’S RETURNS REPRESENT PAST PERFORMANCE AND DO NOT PREDICT FUTURE RESULTS. The returns shown are net of all recurring expenses. Current performance of the Fund may be lower or higher than the performance quoted. For more information on the Fund, and to obtain performance data current to the most recent month end, or to request a prospectus, please call 1-800-247-1014. You should carefully consider the investment objectives, potential risk, management fees, and charges and expenses of the Fund before investing. The Fund’s prospectus contains this and other information about the Fund and should be read carefully before investing.
| (a) | Average annual total returns reflect any change in price per share and assume the reinvestment of all distributions. The Fund’s returns reflect any fee reductions during the applicable periods. If such fee reductions had not occurred, the quoted performance would have been lower. Total returns for periods less than one year are not annualized. |
| (b) | The Russell 2000® Value Index (“Index”) is an unmanaged benchmark that assumes reinvestment of all distributions and excludes the effect of taxes and fees. The Index is a widely recognized unmanaged index of equity prices and is representative of a broader market and range of securities than are found in the Fund’s portfolio. Individuals cannot invest directly in the Index; however, an individual can invest in exchange-traded funds or other investment vehicles that attempt to track the performance of a benchmark index. |
| (c) | The expense ratios are from the Fund’s prospectus dated February 28, 2022. Foundry Partners, LLC (the “Adviser”) has contractually agreed to waive its management fee and/or reimburse certain Fund operating expenses, but only to the extent necessary so that the Fund’s net expenses, excluding brokerage fees and commissions, borrowing costs (such as interest and dividend expenses on securities sold short), taxes, distribution and service (12b-1) fees, extraordinary expenses and indirect expenses (such as fees and expenses of acquired funds), does not exceed 1.25% of the Fund’s average daily net assets. The contractual agreement is effective through February 28, 2023. This contractual arrangement may only be terminated by mutual consent of the Adviser and the Board of Trustees, and it will automatically terminate upon the termination of the investment advisory agreement between the Trust and the Adviser. Each waiver or reimbursement of an expense by the Adviser is subject to repayment by the Fund within the three years following the date of such waiver or reimbursement, provided that the Fund is able to make the repayment without exceeding the expense limitation in place at the time of the waiver or reimbursement, and the expense limitation in place at the time of the repayment. Information pertaining to the Fund’s expense ratios as of April 30, 2022 can be found in the financial highlights. |
The Fund is distributed by Ultimus Fund Distributors, LLC, member FINRA/SIPC.
Semi-Annual Report
6
| Fund Holdings (Unaudited) |
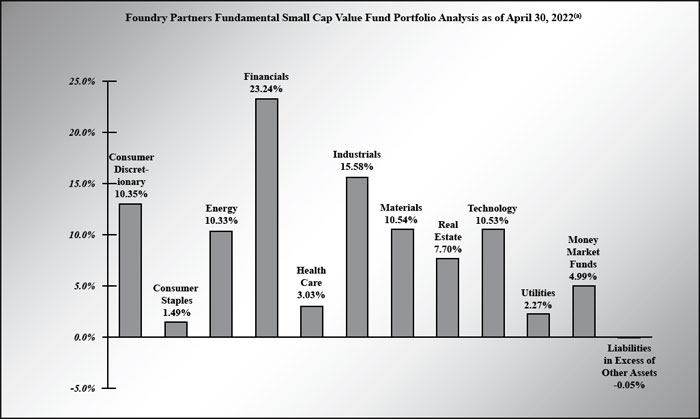
| (a) | As a percent of net assets. |
Availability of Portfolio Schedules (Unaudited)
The Fund files its complete schedule of portfolio holdings with the Securities and Exchange Commission (“SEC”) for the first and third quarters of each fiscal year as an exhibit to its reports on Form N-PORT. The Fund’s Form N-PORT reports are available on the SEC’s website at http://www.sec.gov and on the Fund’s website at www.foundrypartnersllc.com.
Semi-Annual Report
7
| Foundry Partners Fundamental Small Cap Value Fund |
| Schedule of Investments |
| April 30, 2022 (Unaudited) |
| Shares | Fair Value | |||||||
| COMMON STOCKS — 95.06% | ||||||||
| Consumer Discretionary — 10.35% | ||||||||
| Beacon Roofing Supply, Inc.(a) | 59,950 | $ | 3,574,819 | |||||
| Dana, Inc. | 299,089 | 4,429,508 | ||||||
| Group 1 Automotive, Inc. | 26,694 | 4,648,492 | ||||||
| Guess, Inc. | 59,056 | 1,326,988 | ||||||
| International Game Technology PLC | 146,047 | 3,188,206 | ||||||
| KB Home | 68,730 | 2,228,914 | ||||||
| Kontoor Brands, Inc. | 85,035 | 3,378,441 | ||||||
| Sally Beauty Holdings, Inc.(a) | 185,613 | 2,806,469 | ||||||
| 25,581,837 | ||||||||
| Consumer Staples — 1.49% | ||||||||
| United Natural Foods, Inc.(a) | 85,809 | 3,683,780 | ||||||
| Energy — 10.33% | ||||||||
| CNX Resources Corp.(a) | 187,014 | 3,843,138 | ||||||
| Comstock Resources,Inc.(a) | 226,603 | 3,859,049 | ||||||
| Enerplus Corp. | 300,374 | 3,676,578 | ||||||
| EnerSys | 28,557 | 1,869,341 | ||||||
| Murphy Oil Corp. | 102,487 | 3,902,705 | ||||||
| Oil States International,Inc.(a) | 407,772 | 2,756,539 | ||||||
| Whiting Petroleum Corp.(a) | 37,642 | 2,749,748 | ||||||
| World Fuel Services Corp. | 118,551 | 2,871,305 | ||||||
| 25,528,403 | ||||||||
| Financials — 23.24% | ||||||||
| Affiliated Managers | ||||||||
| Group, Inc. | 33,933 | 4,260,967 | ||||||
| Associated Banc-Corp. | 222,671 | 4,442,286 | ||||||
| Axos Financial, Inc.(a) | 71,590 | 2,711,829 | ||||||
| Bread Financial Holdings, Inc. | 64,365 | 3,527,202 | ||||||
| CNO Financial Group, Inc. | 175,181 | 4,228,869 | ||||||
| F.N.B. Corp. | 423,592 | 4,879,780 | ||||||
| Fulton Financial Corp. | 266,099 | 4,036,722 | ||||||
| Hancock Whitney Corp. | 110,142 | 5,151,342 | ||||||
| Lazard Ltd., Class A | 102,829 | 3,369,706 | ||||||
| MGIC Investment Corp. | 313,011 | 4,087,923 | ||||||
| Shares | Fair Value | |||||||
| COMMON STOCKS — (continued) | ||||||||
| Financials — (continued) | ||||||||
| New Residential Investment Corp. | 373,877 | $ | 3,888,321 | |||||
| Old National Bancorp | 194,404 | 2,947,165 | ||||||
| Prosperity Bancshares,Inc. | 35,351 | 2,311,248 | ||||||
| Umpqua Holdings Corp. | 207,963 | 3,439,708 | ||||||
| Unum Group | 136,056 | 4,152,429 | ||||||
| 57,435,497 | ||||||||
| Health Care — 3.03% | ||||||||
| Ironwood Pharmaceuticals,Inc., Class A(a) | 197,200 | 2,366,400 | ||||||
| MEDNAX, Inc.(a) | 109,688 | 2,031,421 | ||||||
| Select Medical Holdings Corp. | 89,828 | 2,031,011 | ||||||
| Varex Imaging Corp.(a) | 52,863 | 1,049,331 | ||||||
| 7,478,163 | ||||||||
| Industrials — 15.58% | ||||||||
| Advanced Energy Industries, Inc. | 34,226 | 2,618,974 | ||||||
| Allison Transmission Holdings, Inc. | 82,205 | 3,077,755 | ||||||
| AMN Healthcare Services, Inc.(a) | 28,329 | 2,769,160 | ||||||
| Crane Co. | 36,086 | 3,472,556 | ||||||
| Curtiss-Wright Corp. | 21,828 | 3,119,439 | ||||||
| DHT Holdings, Inc. | 504,230 | 2,833,773 | ||||||
| EMCOR Group, Inc. | 44,887 | 4,779,567 | ||||||
| GrafTech International Ltd. | 310,637 | 2,820,584 | ||||||
| Hillenbrand, Inc. | 62,730 | 2,560,639 | ||||||
| KBR, Inc. | 72,277 | 3,558,197 | ||||||
| Kennametal, Inc. | 65,758 | 1,691,953 | ||||||
| nVent Electric PLC | 75,934 | 2,565,051 | ||||||
| SMART Global Holdings, Inc.(a) | 116,674 | 2,643,832 | ||||||
| 38,511,480 | ||||||||
| Materials — 10.54% | ||||||||
| Alamos Gold, Inc., Class A | 586,551 | 4,551,636 | ||||||
| Cabot Corp. | 34,961 | 2,302,182 | ||||||
| Eagle Materials, Inc. | 30,790 | 3,797,023 | ||||||
See accompanying notes which are an integral part of these financial statements.
Semi-Annual Report
8
| Foundry Partners Fundamental Small Cap Value Fund |
| Schedule of Investments (Continued) |
| April 30, 2022 (Unaudited) |
| Shares | Fair Value | |||||||
| COMMON STOCKS — (continued) | ||||||||
| Materials — (continued) | ||||||||
| Minerals Technologies,Inc. | 37,058 | $ | 2,357,259 | |||||
| UFP Industries, Inc. | 48,095 | 3,721,110 | ||||||
| Univar Solutions, Inc.(a) | 122,319 | 3,561,929 | ||||||
| Warrior Met Coal, Inc. | 37,427 | 1,275,138 | ||||||
| Worthington Industries, Inc. | 47,952 | 2,281,077 | ||||||
| Yamana Gold, Inc. | 400,537 | 2,206,959 | ||||||
| 26,054,313 | ||||||||
| Real Estate — 7.70% | ||||||||
| Apple Hospitality REIT, Inc. | 171,219 | 3,028,864 | ||||||
| CareTrust REIT, Inc. | 125,398 | 2,032,702 | ||||||
| Industrial Logistics Properties Trust | 85,369 | 1,379,563 | ||||||
| Lexington Realty Trust | 146,568 | 1,839,428 | ||||||
| PotlatchDeltic Corp. | 83,152 | 4,605,790 | ||||||
| Retail Opportunity Investments Corp. | 145,295 | 2,706,846 | ||||||
| Uniti Group, Inc. | 278,188 | 3,446,749 | ||||||
| 19,039,942 | ||||||||
| Technology — 10.53% | ||||||||
| Cohu, Inc.(a) | 76,020 | 2,019,091 | ||||||
| Diodes, Inc.(a) | 46,971 | 3,430,292 | ||||||
| Progress Software Corp. | 86,174 | 4,134,629 | ||||||
| Sanmina Corp.(a) | 60,297 | 2,465,544 | ||||||
| Science Applications International Corp. | 45,348 | 3,774,314 | ||||||
| TTM Technologies, Inc.(a) | 300,656 | 4,194,152 | ||||||
| Ultra Clean Holdings,Inc.(a) | 80,796 | 2,518,411 | ||||||
| Vishay Intertechnology,Inc. | 186,853 | 3,481,071 | ||||||
| 26,017,504 | ||||||||
| Utilities — 2.27% | ||||||||
| National Fuel Gas Co. | 80,052 | 5,614,047 | ||||||
| Total Common Stocks (Cost $212,564,365) | 234,944,966 | |||||||
| Shares | Fair Value | |||||||
| MONEY MARKET FUNDS — 4.99% | ||||||||
| Federated Hermes Government Obligations Fund,Institutional Class, 0.21%(b) | 12,323,302 | $ | 12,323,302 | |||||
| Total Money Market Funds (Cost $12,323,302) | 12,323,302 | |||||||
| Total Investments — 100.05% (Cost $224,887,667) | 247,268,268 | |||||||
| Liabilities in Excess of Other Assets — (0.05)% | (131,021 | ) | ||||||
| NET ASSETS — 100.00% | $ | 247,137,247 | ||||||
| (a) | Non-income producing security. |
| (b) | Rate disclosed is the seven day effective yield as of April 30, 2022. |
REIT — Real Estate Investment Trust
See accompanying notes which are an integral part of these financial statements.
Semi-Annual Report
9
| Foundry Partners Fundamental Small Cap Value Fund |
| Statement of Assets and Liabilities |
| April 30, 2022 (Unaudited) |
| Assets | ||||
| Investments in securities at fair value (cost $224,887,667) (Note 3) | $ | 247,268,268 | ||
| Receivable for fund shares sold | 11,230 | |||
| Dividends receivable | 83,811 | |||
| Prepaid expenses | 39,957 | |||
| Total Assets | 247,403,266 | |||
| Liabilities | ||||
| Payable for fund shares redeemed | 43,049 | |||
| Payable to Adviser (Note 4) | 180,049 | |||
| Accrued distribution (12b-1) fees | 2,550 | |||
| Payable to Administrator (Note 4) | 21,456 | |||
| Payable to trustees | 997 | |||
| Other accrued expenses | 17,918 | |||
| Total Liabilities | 266,019 | |||
| Net Assets | $ | 247,137,247 | ||
| Net Assets consist of: | ||||
| Paid-in capital | 202,657,564 | |||
| Accumulated earnings | 44,479,683 | |||
| Net Assets | $ | 247,137,247 | ||
| Investor Class: | ||||
| Net Assets | $ | 11,907,151 | ||
| Shares outstanding | 550,956 | |||
| Net asset value, offering and redemption price per share (Note 2) | $ | 21.61 | ||
| Institutional Class: | ||||
| Net Assets | $ | 235,230,096 | ||
| Shares outstanding | 10,835,436 | |||
| Net asset value, offering and redemption price per share (Note 2) | $ | 21.71 |
See accompanying notes which are an integral part of these financial statements.
Semi-Annual Report
10
| Foundry Partners Fundamental Small Cap Value Fund |
| Statement of Operations |
| For the Six Months Ended April 30, 2022 (Unaudited) |
| Investment Income | ||||
| Dividend income (net of foreign taxes withheld of $8,977) | $ | 2,876,390 | ||
| Total investment income | 2,876,390 | |||
| Expenses | ||||
| Investment Adviser fees (Note 4) | 1,142,883 | |||
| Administration fees (Note 4) | 90,086 | |||
| Fund accounting fees (Note 4) | 31,315 | |||
| Registration expenses | 27,899 | |||
| Custodian fees | 18,009 | |||
| Distribution (12b-1), Investor Class | 16,414 | |||
| Legal fees | 12,483 | |||
| Transfer agent fees (Note 4) | 11,406 | |||
| Audit and tax preparation fees | 9,296 | |||
| Printing and postage expenses | 7,094 | |||
| Trustee fees | 4,425 | |||
| Insurance expenses | 2,273 | |||
| Interest expense | 1,238 | |||
| Miscellaneous expenses | 19,859 | |||
| Net operating expenses | 1,394,680 | |||
| Net investment income | 1,481,710 | |||
| Net Realized and Change in Unrealized Gain (Loss) on Investments | ||||
| Net realized gain on investment securities transactions | 21,705,393 | |||
| Net realized gain on foreign currency transactions | 2,057 | |||
| Net change in unrealized depreciation of investment securities and foreign currency translations | (34,933,309 | ) | ||
| Net realized and change in unrealized loss on investments | (13,225,859 | ) | ||
| Net decrease in net assets resulting from operations | $ | (11,744,149 | ) |
See accompanying notes which are an integral part of these financial statements.
Semi-Annual Report
11
| Foundry Partners Fundamental Small Cap Value Fund |
| Statements of Changes in Net Assets |
| For the | For the | |||||||
| Six Months Ended | Year Ended | |||||||
| April 30, 2022 | October 31, | |||||||
| (Unaudited) | 2021 | |||||||
| Increase (Decrease) in Net Assets due to: | ||||||||
| Operations | ||||||||
| Net investment income | $ | 1,481,710 | $ | 2,174,253 | ||||
| Net realized gain on investment securities transactions | 21,707,450 | 52,831,842 | ||||||
| Net change in unrealized appreciation (depreciation) of investment securities | (34,933,309 | ) | 59,314,433 | |||||
| Net increase (decrease) in net assets resulting from operations | (11,744,149 | ) | 114,320,528 | |||||
| Distributions to Shareholders From Earnings (Note 2) | ||||||||
| Investor Class | (1,829,560 | ) | (112,296 | ) | ||||
| Institutional Class | (35,166,584 | ) | (2,474,194 | ) | ||||
| Total Distributions | (36,996,144 | ) | (2,586,490 | ) | ||||
| Capital Transactions - Investor Class | ||||||||
| Proceeds from shares sold | 275,697 | 637,375 | ||||||
| Reinvestment of distributions | 1,803,645 | 111,081 | ||||||
| Amount paid for shares redeemed | (1,540,029 | ) | (5,758,180 | ) | ||||
| Total Capital Transactions - Investor Class | 539,313 | (5,009,724 | ) | |||||
| Capital Transactions - Institutional Class | ||||||||
| Proceeds from shares sold | 14,207,941 | 53,068,256 | ||||||
| Reinvestment of distributions | 34,018,201 | 2,388,010 | ||||||
| Amount paid for shares redeemed | (35,661,486 | ) | (74,192,808 | ) | ||||
| Total Capital Transactions - Institutional Class | 12,564,656 | (18,736,542 | ) | |||||
| Net increase (decrease) in net assets resulting from capital transactions | 13,103,969 | (23,746,266 | ) | |||||
| Total Increase (Decrease) in Net Assets | (35,636,324 | ) | 87,987,772 | |||||
| Net Assets | ||||||||
| Beginning of period | 282,773,571 | 194,785,799 | ||||||
| End of period | $ | 247,137,247 | $ | 282,773,571 | ||||
See accompanying notes which are an integral part of these financial statements.
Semi-Annual Report
12
| Foundry Partners Fundamental Small Cap Value Fund |
| Statements of Changes in Net Assets (Continued) |
| For the | For the | |||||||
| Six Months Ended | Year Ended | |||||||
| April 30, 2022 | October 31, | |||||||
| (Unaudited) | 2021 | |||||||
| Share Transactions - Investor Class | ||||||||
| Shares sold | 11,443 | 27,201 | ||||||
| Shares issued in reinvestment of distributions | 76,491 | 5,359 | ||||||
| Shares redeemed | (64,025 | ) | (243,745 | ) | ||||
| Total Share Transactions - Investor Class | 23,909 | (211,185 | ) | |||||
| Share Transactions - Institutional Class | ||||||||
| Shares sold | 585,233 | 2,405,396 | ||||||
| Shares issued in reinvestment of distributions | 1,437,187 | 114,864 | ||||||
| Shares redeemed | (1,416,684 | ) | (3,052,506 | ) | ||||
| Total Share Transactions - Institutional Class | 605,736 | (532,246 | ) | |||||
See accompanying notes which are an integral part of these financial statements.
Semi-Annual Report
13
| Foundry Partners Fundamental Small Cap Value Fund |
| Investor Class Financial Highlights |
| (For a share outstanding during each period) |
| For the | ||||||||||||||||||||||||
| Six Months | ||||||||||||||||||||||||
| Ended | For the | For the | For the | For the | For the | |||||||||||||||||||
| April 30, | Year Ended | Year Ended | Year Ended | Year Ended | Year Ended | |||||||||||||||||||
| 2022 | October 31, | October 31, | October 31, | October 31, | October 31, | |||||||||||||||||||
| (Unaudited) | 2021 | 2020 | 2019 | 2018 | 2017 | |||||||||||||||||||
| Selected Per Share Data | ||||||||||||||||||||||||
| Net asset value, beginning of period | $ | 26.16 | $ | 16.85 | $ | 20.55 | $ | 22.11 | $ | 24.32 | $ | 20.49 | ||||||||||||
| Investment operations: | ||||||||||||||||||||||||
| Net investment income | 0.11 | 0.17 | 0.18 | 0.25 | 0.12 | 0.05 | ||||||||||||||||||
| Net realized and unrealized gain (loss) on investments | (1.09 | ) | 9.30 | (3.15 | ) | (0.03 | ) | (1.52 | ) | 4.37 | ||||||||||||||
| Total from investment operations | (0.98 | ) | 9.47 | (2.97 | ) | 0.22 | (1.40 | ) | 4.42 | |||||||||||||||
| Less distributions to shareholders from: | ||||||||||||||||||||||||
| Net investment income | (0.13 | ) | (0.16 | ) | (0.26 | ) | (0.08 | ) | (0.08 | ) | (0.13 | ) | ||||||||||||
| Net realized gains | (3.44 | ) | — | (0.47 | ) | (1.70 | ) | (0.73 | ) | (0.46 | ) | |||||||||||||
| Total distributions | (3.57 | ) | (0.16 | ) | (0.73 | ) | (1.78 | ) | (0.81 | ) | (0.59 | ) | ||||||||||||
| Net asset value, end of period | $ | 21.61 | $ | 26.16 | $ | 16.85 | $ | 20.55 | $ | 22.11 | $ | 24.32 | ||||||||||||
| Total Return(a) | (4.89 | )%(b) | 56.45 | % | (15.17 | )% | 2.28 | % | (6.02 | )% | 21.68 | % | ||||||||||||
| Ratios and Supplemental Data: | ||||||||||||||||||||||||
| Net assets, end of period (000 omitted) | $ | 11,907 | $ | 13,785 | $ | 12,443 | $ | 21,048 | $ | 25,715 | $ | 41,786 | ||||||||||||
| Ratio of expenses to average net assets | 1.28 | %(c) | 1.28 | % | 1.32 | % | 1.32 | % | 1.31 | % | 1.36 | % | ||||||||||||
| Ratio of net investment income to average net assets | 0.87 | %(c) | 0.56 | % | 0.90 | % | 1.15 | % | 0.49 | % | 0.22 | % | ||||||||||||
| Portfolio turnover rate(d) | 31.36 | %(b) | 72.73 | % | 60.56 | % | 47.17 | % | 34.41 | % | 28.16 | % | ||||||||||||
| (a) | Total return represents the rate that the investor would have earned or lost on an investment in the Fund, assuming reinvestment of dividends. |
| (b) | Not annualized. |
| (c) | Annualized. |
| (d) | Portfolio turnover is calculated on the basis of the Fund as a whole without distinguishing among the classes of shares. |
See accompanying notes which are an integral part of these financial statements.
Semi-Annual Report
14
| Foundry Partners Fundamental Small Cap Value Fund |
| Institutional Class Financial Highlights |
| (For a share outstanding during each period) |
| For the | ||||||||||||||||||||||||
| Six Months | ||||||||||||||||||||||||
| Ended | For the | For the | For the | For the | For the | |||||||||||||||||||
| April 30, | Year Ended | Year Ended | Year Ended | Year Ended | Year Ended | |||||||||||||||||||
| 2022 | October 31, | October 31, | October 31, | October 31, | October 31, | |||||||||||||||||||
| (Unaudited) | 2021 | 2020 | 2019 | 2018 | 2017 | |||||||||||||||||||
| Selected Per Share Data | ||||||||||||||||||||||||
| Net asset value, beginning of period | $ | 26.29 | $ | 16.94 | $ | 20.66 | $ | 22.24 | $ | 24.46 | $ | 20.60 | ||||||||||||
| Investment operations: | ||||||||||||||||||||||||
| Net investment income | 0.15 | 0.18 | 0.21 | 0.27 | 0.18 | 0.11 | ||||||||||||||||||
| Net realized and unrealized gain (loss) on investments | (1.09 | ) | 9.38 | (3.14 | ) | — | (a) | (1.53 | ) | 4.39 | ||||||||||||||
| Total from investment operations | (0.94 | ) | 9.56 | (2.93 | ) | 0.27 | (1.35 | ) | 4.50 | |||||||||||||||
| Less distributions to shareholders from: | ||||||||||||||||||||||||
| Net investment income | (0.20 | ) | (0.21 | ) | (0.32 | ) | (0.15 | ) | (0.14 | ) | (0.18 | ) | ||||||||||||
| Net realized gains | (3.44 | ) | — | (0.47 | ) | (1.70 | ) | (0.73 | ) | (0.46 | ) | |||||||||||||
| Total distributions | (3.64 | ) | (0.21 | ) | (0.79 | ) | (1.85 | ) | (0.87 | ) | (0.64 | ) | ||||||||||||
| Net asset value, end of period | $ | 21.71 | $ | 26.29 | $ | 16.94 | $ | 20.66 | $ | 22.24 | $ | 24.46 | ||||||||||||
| Total Return(b) | (4.72 | )%(c) | 56.77 | % | (14.97 | )% | 2.55 | % | (5.78 | )% | 22.01 | % | ||||||||||||
| Ratios and Supplemental Data: | ||||||||||||||||||||||||
| Net assets, end of period (000 omitted) | $ | 235,230 | $ | 268,989 | $ | 182,343 | $ | 173,600 | $ | 157,758 | $ | 151,757 | ||||||||||||
| Ratio of expenses to average net assets | 1.03 | %(d) | 1.03 | % | 1.07 | % | 1.07 | % | 1.06 | % | 1.11 | % | ||||||||||||
| Ratio of net investment income to average net assets | 1.11 | %(d) | 0.80 | % | 1.16 | % | 1.34 | % | 0.76 | % | 0.45 | % | ||||||||||||
| Portfolio turnover rate(e) | 31.36 | %(c) | 72.73 | % | 60.56 | % | 47.17 | % | 34.41 | % | 28.16 | % | ||||||||||||
| (a) | Rounds to less than $0.005 per share. |
| (b) | Total return represents the rate that the investor would have earned or lost on an investment in the Fund, assuming reinvestment of dividends. |
| (c) | Not annualized. |
| (d) | Annualized. |
| (e) | Portfolio turnover is calculated on the basis of the Fund as a whole without distinguishing among the classes of shares. |
See accompanying notes which are an integral part of these financial statements.
Semi-Annual Report
15
| Foundry Partners Fundamental Small Cap Value Fund |
| Notes to the Financial Statements |
| April 30, 2022 (Unaudited) |
NOTE 1. ORGANIZATION
The Foundry Partners Fundamental Small Cap Value Fund (the “Fund”) is registered under the Investment Company Act of 1940, as amended (“1940 Act”), as an open-end diversified series of Valued Advisers Trust (the “Trust”). The Trust is a management investment company established under the laws of Delaware by an Agreement and Declaration of Trust dated June 13, 2008 (the “Trust Agreement”). The Trust Agreement permits the Board of Trustees (the “Board”) to issue an unlimited number of shares of beneficial interest of separate series without par value. The Fund is one of a series of funds authorized by the Board. The Fund’s investment adviser is Foundry Partners, LLC (the “Adviser”). The investment objective of the Fund is long-term capital appreciation.
The Fund currently offers Investor Class shares and Institutional Class shares. Each share represents an equal proportionate interest in the assets and liabilities belonging to the applicable class of the Fund and is entitled to such dividends and distributions out of income belonging to the applicable class of the Fund as are declared by the Board. On matters that affect the Fund as a whole, each class has the same voting and other rights and preferences as any other class. On matters that affect only one class, only shareholders of that class may vote. The Fund may offer additional classes of shares in the future.
NOTE 2. SIGNIFICANT ACCOUNTING POLICIES
The Fund is an investment company and follows accounting and reporting guidance under Financial Accounting Standards Board Accounting Standards Codification (“ASC”) Topic 946, “Financial Services-Investment Companies”, including Accounting Standards Update 2013-8. The following is a summary of significant accounting policies followed by the Fund in the preparation of its financial statements. These policies are in conformity with generally accepted accounting principles in the United States of America (“GAAP”).
Estimates – The preparation of financial statements in conformity with GAAP requires management to make estimates and assumptions that affect the reported amounts of assets and liabilities and disclosure of contingent assets and liabilities at the date of the financial statements and the reported amounts of increases and decreases in net assets from operations during the reporting period. Actual results could differ from those estimates.
Federal Income Taxes – The Fund makes no provision for federal income or excise tax. The Fund has qualified and intends to qualify each year as a regulated investment company (“RIC”) under subchapter M of the Internal Revenue Code of 1986, as amended, by complying with the requirements applicable to RICs and by distributing substantially all of its taxable income. The Fund also intends to distribute sufficient net investment income and net realized capital gains, if any, so that it will not be subject to excise tax on undistributed income and gains. If the required amount of net investment income or gains is not distributed, the Fund could incur a tax expense.
Semi-Annual Report
16
As of and during the six months ended April 30, 2022, the Fund did not have any liabilities for any unrecognized tax benefits. The Fund recognizes interest and penalties, if any, related to unrecognized tax benefits as income tax expense on the Statement of Operations when incurred. During the six months ended April 30, 2022, the Fund did not incur any interest or penalties. Management of the Fund has reviewed tax positions taken in tax years that remain subject to examination by all major tax jurisdictions, including federal (i.e., the last three tax year ends and the interim tax period since then, as applicable). Management believes that there is no tax liability resulting from unrecognized tax benefits related to uncertain tax positions taken.
Expenses – Expenses incurred by the Trust that do not relate to a specific fund of the Trust are allocated to the individual funds based on each fund’s relative net assets or another appropriate basis (as determined by the Board). Expenses specifically attributable to any class are borne by that class. Income, realized gains and losses, unrealized appreciation and depreciation, and fund-wide expenses not allocated to a particular class shall be allocated to each class based on the net assets of that class in relation to the net assets of the entire fund.
Security Transactions and Related Income – The Fund follows industry practice and records security transactions on the trade date for financial reporting purposes. The specific identification method is used for determining gains or losses for financial statement and income tax purposes. Dividend income is recorded on the ex-dividend date. Non-cash income, if any, is recorded at the fair market value of the securities received. Withholding taxes on foreign dividends, if any, have been provided for in accordance with the Fund’s understanding of the applicable country’s tax rules and rates.
The Fund holds Real Estate Investment Trusts (“REITs”) which pay dividends to their shareholders based upon available funds from operations. It is possible for these dividends to exceed the REIT’s underlying taxable earnings and profits resulting in the excess portion of such dividends being designated as a return of capital. Distributions received from REITs that represent a return of capital or capital gains are recorded as a reduction of the cost of the REITs or as a realized gain, respectively.
Dividends and Distributions – The Fund intends to distribute its net investment income and net realized long-term and short-term capital gains, if any, at least annually. Dividends and distributions to shareholders, which are determined in accordance with income tax regulations, are recorded on the ex-dividend date. The treatment for financial reporting purposes of distributions made to shareholders during the period from net investment income or net realized capital gains may differ from their ultimate treatment for federal income tax purposes. These differences are caused primarily by differences in the timing of the recognition of certain components of income, expense or realized capital gain for federal income tax purposes. Where such differences are permanent in nature, they are reclassified among the components of net assets based on their ultimate characterization for federal income tax purposes. Any such reclassifications will have no effect on net assets, results of operations or net asset value (“NAV”) per share of the Fund.
Semi-Annual Report
17
| Foundry Partners Fundamental Small Cap Value Fund |
| Notes to the Financial Statements |
| April 30, 2022 (Unaudited) (Continued) |
Share Valuation – The NAV is calculated each day the New York Stock Exchange (the “NYSE”) is open by dividing the total value of the Fund’s assets, less liabilities, by the number of shares outstanding for the Fund.
NOTE 3. SECURITIES VALUATION AND FAIR VALUE MEASUREMENTS
The Fund values its portfolio securities at fair value as of the close of regular trading on the NYSE (normally 4:00 p.m. Eastern time) on each business day the NYSE is open for business. Fair value is defined as the price that the Fund would receive upon selling an investment in a timely transaction to an independent buyer in the principal or most advantageous market of the investment. GAAP establishes a three-tier hierarchy to maximize the use of observable market data and minimize the use of unobservable inputs and to establish classification of fair value measurements for disclosure purposes.
Inputs refer broadly to the assumptions that market participants would use in pricing the asset or liability, including assumptions about risk (the risk inherent in a particular valuation technique used to measure fair value including a pricing model and/or the risk inherent in the inputs to the valuation technique). Inputs may be observable or unobservable. Observable inputs are inputs that reflect the assumptions market participants would use in pricing the asset or liability developed based on market data obtained and available from sources independent of the reporting entity. Unobservable inputs are inputs that reflect the reporting entity’s own assumptions about the assumptions market participants would use in pricing the asset or liability developed based on the best information available in the circumstances.
Various inputs are used in determining the value of the Fund’s investments. These inputs are summarized in the three broad levels listed below.
| ● | Level 1 – unadjusted quoted prices in active markets for identical investments and/or registered investment companies where the value per share is determined and published and is the basis for current transactions for identical assets or liabilities at the valuation date |
| ● | Level 2 – other significant observable inputs (including, but not limited to, quoted prices for an identical security in an inactive market, quoted prices for similar securities, interest rates, prepayment speeds, credit risk, etc.) |
| ● | Level 3 – significant unobservable inputs (including the Fund’s own assumptions in determining fair value of investments based on the best information available) |
The inputs used to measure fair value may fall into different levels of the fair value hierarchy. In such cases, for disclosure purposes, the level in the fair value hierarchy which is reported is determined based on the lowest level input that is significant to the fair value measurement in its entirety.
Semi-Annual Report
18
Equity securities that are traded on any stock exchange are generally valued at the last quoted sale price on the security’s primary exchange. Lacking a last sale price, an exchange-traded security is generally valued at its last bid price. Securities traded in the NASDAQ over-the-counter market are generally valued at the NASDAQ Official Closing Price. When using market quotations and when the market is considered active, the security is classified as a Level 1 security. In the event that market quotations are not readily available or are considered unreliable due to market or other events, the Fund values its securities and other assets at fair value in accordance with policies established by and under the general supervision of the Board. Under these policies, the securities will be classified as Level 2 or 3 within the fair value hierarchy, depending on the inputs used.
Investments in mutual funds, including money market mutual funds, are generally priced at the ending NAV. These securities are categorized as Level 1 securities.
In accordance with the Trust’s valuation policies, the Adviser is required to consider all appropriate factors relevant to the value of securities for which it has determined other pricing sources are not available or reliable as described above. No single method exists for determining fair value, because fair value depends upon the circumstances of each individual case. As a general principle, the current fair value of a security being valued by the Adviser would be the amount that the Fund might reasonably expect to receive upon the current sale. Methods that are in accordance with this principle may, for example, be based on (i) a multiple of earnings; (ii) a discount from market prices of a similar freely traded security (including a derivative security or a basket of securities traded on other markets, exchanges or among dealers); or (iii) yield to maturity with respect to debt issues, or a combination of these and other methods. Fair-value pricing is permitted if, in the Adviser’s opinion, the validity of market quotations appears to be questionable based on factors such as evidence of a thin market in the security based on a small number of quotations, a significant event occurs after the close of a market but before the Fund’s NAV calculation that may affect a security’s value, or the Adviser is aware of any other data that calls into question the reliability of market quotations.
The following is a summary of the inputs used to value the Fund’s investments as of April 30, 2022:
| Valuation Inputs | ||||||||||||||||
| Assets | Level 1 | Level 2 | Level 3 | Total | ||||||||||||
| Common Stocks (a) | $ | 234,944,966 | $ | — | $ | — | $ | 234,944,966 | ||||||||
| Money Market Funds | 12,323,302 | — | — | 12,323,302 | ||||||||||||
| Total | $ | 247,268,268 | $ | — | $ | — | $ | 247,268,268 | ||||||||
| (a) | Refer to Schedule of Investments for sector classifications. |
Semi-Annual Report
19
| Foundry Partners Fundamental Small Cap Value Fund |
| Notes to the Financial Statements |
| April 30, 2022 (Unaudited) (Continued) |
The Fund did not hold any investments at the end of the reporting period for which significant unobservable inputs (Level 3) were used in determining fair value; therefore, no reconciliation of Level 3 securities is included for this reporting period.
NOTE 4. FEES AND OTHER TRANSACTIONS WITH AFFILIATES
Under the terms of the management agreement between the Trust and the Adviser for the Fund, the Adviser manages the Fund’s investments subject to oversight of the Board. As compensation for its management services, the Fund is obligated to pay the Adviser a fee computed and accrued daily and paid monthly at an annual rate of 0.85% of the average daily net assets of the Fund. For the six months ended April 30, 2022, the Adviser earned a fee of $1,142,883 from the Fund. At April 30, 2022, the Fund owed the Adviser $180,049.
The Adviser has contractually agreed to waive its management fee and/or reimburse certain operating expenses, but only to the extent necessary so that the Fund’s net expenses, excluding brokerage fees and commissions, borrowing costs (such as interest expense and dividends on securities sold short), taxes, distribution and service (12b-1) fees, extraordinary expenses, and any indirect expenses (such as fees and expenses of acquired funds), do not exceed an annual rate of 1.25% of the average daily net assets of the Fund.
Each fee waiver or expense reimbursement by the Adviser is subject to repayment by the Fund within the three years following the date in which the fee waiver or expense reimbursement occurred, provided that the Fund is able to make the repayment without exceeding the expense limitation that is in effect at the time of the repayment, and the expense limitation that is in effect at the time of the fee waiver or expense reimbursement. As of April 30, 2022, the Adviser has made no previous waivers that may be recouped. The contractual agreement is in effect through February 28, 2023. The expense cap may not be terminated prior to this date except by mutual consent of the Adviser and the Board. For the six months ended April 30, 2022, the Adviser did not waive any fees from the Fund.
The Trust retains Ultimus Fund Solutions, LLC (“Ultimus” or the “Administrator”), to provide the Fund with administration and compliance, including a chief compliance officer, fund accounting and transfer agent services, including all regulatory reporting. For the six months ended April 30, 2022, the Administrator earned fees of $90,086 for administrative and compliance services, $31,315 for fund accounting services, and $11,406 for transfer agent services. At April 30, 2022, the Administrator was owed $21,456 for administrative services.
The officers and one trustee of the Trust are members of management and/or employees of the Administrator and are not paid by the Trust for services to the Fund. Ultimus Fund Distributors, LLC (the “Distributor”) acts as the distributor of the Fund’s shares. The Distributor is a wholly-owned subsidiary of Ultimus. There were no payments made to the Distributor by the Fund for the six months ended April 30, 2022.
Semi-Annual Report
20
The Fund has adopted a Distribution Plan (the “Plan”) pursuant to Rule 12b-1 under the 1940 Act. The Plan provides that the Fund will pay the Distributor or any registered securities dealer, financial institution or any other person (a “Recipient”) a fee aggregating at a rate of 0.25% of the average daily net assets of the Investor Class shares in connection with the promotion and distribution of the Fund’s shares or the provision of personal services to shareholders, including, but not necessarily limited to, advertising, compensation to underwriters, dealers and selling personnel; the printing and mailing of prospectuses to other than current Fund shareholders; the printing and mailing of sales literature; and servicing shareholder accounts. The Fund or the Adviser may pay all or a portion of these fees to any Recipient who renders assistance in distributing or promoting the sale of shares, or who provides certain shareholder services, pursuant to a written agreement. The Plan is a compensation plan, which means that compensation is paid regardless of 12b-1 expenses actually incurred. It is anticipated that the Plan will benefit shareholders because an effective sales program typically is necessary in order for the Fund to reach and maintain a sufficient size to achieve efficiently its investment objectives and to realize economies of scale. For the six months ended April 30, 2022, the Investor Class shares 12b-1 expense incurred by the Fund was $16,414. The Fund owed $2,550 for Investor Class shares 12b-1 fees as of April 30, 2022.
NOTE 5. PURCHASES AND SALES OF SECURITIES
For the six months ended April 30, 2022, purchases and sales of investment securities, other than short-term investments, were $82,154,798 and $109,531,285, respectively.
There were no purchases or sales of long-term U.S. government obligations during the six months ended April 30, 2022.
NOTE 6. FEDERAL TAX INFORMATION
At April 30, 2022, the net unrealized appreciation (depreciation) and tax cost of investments for tax purposes was as follows:
| Gross unrealized appreciation | $ | 36,030,217 | ||
| Gross unrealized depreciation | (13,822,617 | ) | ||
| Net unrealized appreciation on investments | $ | 22,207,600 | ||
| Tax cost of investments | $ | 225,060,668 |
At April 30, 2022, the difference between book basis and tax basis unrealized appreciation (depreciation) is attributable to the tax deferral of losses on wash sales and partnership basis adjustments.
Semi-Annual Report
21
| Foundry Partners Fundamental Small Cap Value Fund |
| Notes to the Financial Statements |
| April 30, 2022 (Unaudited) (Continued) |
At October 31, 2021, the Fund’s most recent fiscal year end, the components of accumulated earnings (deficit) on a tax basis were as follows:
| Undistributed ordinary income | $ | 29,856,092 | ||
| Undistributed long-term capital gains | 6,333,878 | |||
| Unrealized appreciation on investments | 57,030,006 | |||
| Total accumulated earnings | $ | 93,219,976 |
The tax character of distributions paid for the fiscal year ended October 31, 2021, was as follows:
| Distributions paid from: | ||||
| Ordinary income(a) | $ | 2,586,490 | ||
| Total taxable distributions | 2,586,490 | |||
| Total distributions paid | $ | 2,586,490 |
| (a) | Short-term capital gain distributions are treated as ordinary income for tax purposes. |
Capital loss carryforwards are available to offset future realized capital gains and thereby reduce further taxable gain distributions. During the fiscal year ended October 31, 2021, the Fund utilized $17,193,806 of their capital loss carryforwards.
NOTE 7. OTHER MATTERS
In April 2014, New York based fashion company The Jones Group went private through a leveraged buyout (the “LBO”). In connection with the LBO, Jones Group paid out roughly $1.2 billion to its shareholders to buy back its outstanding stock at $15 per share. Four years later, Nine West Holdings, the company that emerged from the LBO, filed for bankruptcy under Chapter 11. After Nine West’s Chapter 11 plan was confirmed, the Trustee of a Litigation Trust formed under the plan, together with the Indenture Trustee for certain notes issued by Jones Group/ Nine West, commenced a series of lawsuits against the former Jones Group shareholders who tendered their shares in the LBO, including the Fund. The plaintiffs in these suits seek to unwind the stock repurchase transactions that were part of the LBO on the grounds that they constitute fraudulent conveyances under the Bankruptcy Code and state law and to recover the amounts paid to the former Jones Group shareholders. Plaintiffs allege that the Fund received $1,209,420 for its shares in the LBO and seek to claw back those funds as part of the lawsuit.
On August 27, 2020, the Southern District of New York dismissed all fraudulent conveyance and unjust enrichment claims with respect to the payments made to stockholders in connection with the LBO, including the payments made to the Fund, on the basis that the transaction qualified for protection under the safe harbor provided for in Section 546(e) of the Bankruptcy Code. As part of
Semi-Annual Report
22
the ruling, all claims against the Fund were dismissed and judgment was entered in its favor. The Trustee has appealed the ruling, and the matter is now pending before the United States Court of Appeals for the Second Circuit.
NOTE 8. COMMITMENTS AND CONTINGENCIES
The Trust indemnifies its officers and Trustees for certain liabilities that may arise from their performance of their duties to the Trust or the Fund. Additionally, in the normal course of business, the Trust enters into contracts that contain a variety of representations and warranties which provide general indemnifications. The Trust’s maximum exposure under these arrangements is unknown, as this would involve future claims that may be made against the Trust that have not yet occurred.
NOTE 9. SUBSEQUENT EVENTS
Management of the Fund has evaluated the need for disclosures and/or adjustments resulting from subsequent events through the date at which these financial statements were issued. Based upon this evaluation, management has determined there were no items requiring adjustment of the financial statements or additional disclosure.
Semi-Annual Report
23
| Summary of Fund Expenses (Unaudited) |
As a shareholder of the Fund, you incur two types of costs: (1) transaction and (2) ongoing costs, including management fees and other Fund expenses. These examples are intended to help you understand your ongoing costs (in dollars) of investing in the Fund and to compare these costs with the ongoing costs of investing in other mutual funds. The example is based on an investment of $1,000 invested at the beginning of the period and held for the entire period from November 1, 2021 through April 30, 2022.
Actual Expenses
The first line of the table for each class provides information about actual account values and actual expenses. You may use the information in these lines, together with the amount you invested, to estimate the expenses that you paid over the period. Simply divide your account value by $1,000 (for example, an $8,600 account value divided by $1,000 = 8.60), then multiply the result by the number in the first line under the heading “Expenses Paid During Period” to estimate the expenses you paid on your account during this period.
Hypothetical Example for Comparison Purposes
The second line of the table for each class provides information about hypothetical account values and hypothetical expenses based on the Fund’s actual expense ratios and an assumed rate of return of 5% per year before expenses, which is not the Fund’s actual return. The hypothetical account values and expenses may not be used to estimate the actual ending account balances or expenses you paid for the period. You may use this information to compare the ongoing costs of investing in the Fund and other funds. To do so, compare this 5% hypothetical example with the 5% hypothetical examples that appear in the shareholder reports of other funds.
Expenses shown in the table are meant to highlight your ongoing costs only and do not reflect any transactional costs. Therefore, the second line of the table for each class is useful in comparing ongoing costs only and will not help you determine the relative total costs of owning different funds. In addition, if transaction costs were included, your costs would have been higher.
| Beginning | Ending | Expenses | ||||||||
| Account | Account | Paid | Annualized | |||||||
| Value | Value | During | Expense | |||||||
| November 1, 2021 | April 30, 2022 | Period(a) | Ratio | |||||||
| Foundry Partners Fundamental Small Cap Value Fund | ||||||||||
| Investor Class | Actual | $1,000.00 | $951.10 | $6.17 | 1.28% | |||||
| Hypothetical (b) | $1,000.00 | $1,018.47 | $6.39 | 1.28% | ||||||
| Institutional Class | Actual | $1,000.00 | $952.80 | $4.97 | 1.03% | |||||
| Hypothetical (b) | $1,000.00 | $1,019.71 | $5.14 | 1.03% | ||||||
| (a) | Expenses are equal to the Fund’s annualized expense ratios, multiplied by the average account value over the period, multiplied by 181/365 (to reflect the one-half year period). |
| (b) | Hypothetical assumes 5% annual return before expenses. |
Semi-Annual Report
24
| Valued Advisers Trust Privacy Policy |
| FACTS | WHAT DOES FOUNDRY PARTNERS FUNDAMENTAL SMALL CAP VALUE FUND (THE “FUND”) DO WITH YOUR PERSONAL INFORMATION? | |
| Why? | Financial companies choose how they share your personal information. Federal law gives consumers the right to limit some but not all sharing. Federal law also requires us to tell you how we collect, share, and protect your personal information. Please read this notice carefully to understand what we do. | |
| What? | The types of personal information we collect and share depend on the product or service you have with us. This information can include:
■ Social Security number
■ account balances and account transactions
■ transaction or loss history and purchase history
■ checking account information and wire transfer instructions
When you are no longer our customer, we continue to share your information as described in this notice. | |
| How? | All financial companies need to share customers’ personal information to run their everyday business. In the section below, we list the reasons financial companies can share their customers’ personal information; the reasons the Fund chooses to share; and whether you can limit this sharing. | |
| Reasons we can share your personal information | Does the Fund share? | |
For our everyday business purposes— such as to process your transactions, maintain your account(s), respond to court orders and legal investigations, or report to credit bureaus |
Yes | |
For our marketing purposes— to offer our products and services to you |
No | |
| For joint marketing with other financial companies | No | |
For our affiliates’ everyday business purposes— information about your transactions and experiences |
No | |
For our affiliates’ everyday business purposes— information about your creditworthiness |
No | |
| For nonaffiliates to market to you | No | |
| Questions? | Call (800) 247-1014 | |
| Who we are | |
| Who
is providing this notice? |
Foundry Partners Fundamental Small Cap Value Fund Ultimus Fund Distributors, LLC (Distributor) Ultimus Fund Solutions, LLC (Administrator) |
| What we do | |
| How
does the Fund protect my personal information? |
To protect your personal information from unauthorized access and use, we use security measures that comply with federal law. These measures include computer safeguards and secured files and buildings. Our service providers are held accountable for adhering to strict policies and procedures to prevent any misuse of your nonpublic personal information. |
| How
does the Fund collect my personal information? |
We collect your personal information, for example, when you
■ open an account or deposit money
■ buy securities from us or sell securities to us
■ make deposits or withdrawals from your account
■ give us your account information
■ make a wire transfer
■ tell us who receives the money
■ tell us where to send the money
■ show your government-issued ID
■ show your driver’s license |
| Why
can’t I limit all sharing? |
Federal law gives you the right to limit only
■ sharing for affiliates’ everyday business purposes— information about your creditworthiness
■ affiliates from using your information to market to you
■ sharing for nonaffiliates to market to you
State laws and individual companies may give you additional rights to limit sharing. |
| Definitions | |
| Affiliates | Companies related by common ownership or control. They can be financial and nonfinancial companies.
■ Foundry Partners, LLC, the investment adviser to the Fund, could be deemed to be an affiliate. |
| Nonaffiliates | Companies not related by common ownership or control. They can be financial and nonfinancial companies.
■ The Fund does not share your personal information with nonaffiliates so they can market to you. |
| Joint marketing | A formal agreement between nonaffiliated financial companies that together market financial products or services to you.
■ The Fund doesn’t jointly market. |
This page intentionally left blank.
This page intentionally left blank.
This page intentionally left blank.
PROXY VOTING
A description of the policies and procedures that the Fund uses to determine how to vote proxies relating to portfolio securities and information regarding how the Fund voted those proxies during the most recent twelve month period ended June 30, are available (1) without charge upon request by calling the Fund at (800) 247-1014 and (2) in Fund documents filed with the Securities and Exchange Commission (“SEC”) on the SEC’s website at www.sec.gov.
| TRUSTEES |
| Andrea N. Mullins, Chairperson |
| Ira P. Cohen |
| Mark J. Seger |
| OFFICERS |
| Matthew J. Miller, Principal Executive Officer and President |
| Zachary P. Richmond, Principal Financial Officer and Treasurer |
| N. Lynn Bowley, Chief Compliance Officer |
| Carol J. Highsmith, Vice President and Secretary |
| INVESTMENT ADVISER |
| Foundry Partners, LLC |
| 323 Washington Avenue North, Suite 360 |
| Minneapolis, MN 55401 |
| DISTRIBUTOR |
| Ultimus Fund Distributors, LLC |
| 225 Pictoria Drive, Suite 450 |
| Cincinnati, OH 45246 |
| INDEPENDENT REGISTERED PUBLIC ACCOUNTING FIRM |
| Cohen & Company, Ltd. |
| 1350 Euclid Avenue, Suite 800 |
| Cleveland, OH 44115 |
| LEGAL COUNSEL |
| Troutman Pepper Hamilton Sanders LLP |
| 3000 Two Logan Square |
| 18th and Arch Streets |
| Philadelphia, PA 19103 |
| CUSTODIAN |
| Huntington National Bank |
| 41 South High Street |
| Columbus, OH 43215 |
| ADMINISTRATOR, TRANSFER AGENT AND FUND ACCOUNTANT |
| Ultimus Fund Solutions, LLC |
| 225 Pictoria Drive, Suite 450 |
| Cincinnati, OH 45246 |
This report is intended only for the information of shareholders or those who have received the Fund’s prospectus which contains information about the Fund’s management fee and expenses. Please read the prospectus carefully before investing.
Distributed by Ultimus Fund Distributors, LLC
Member FINRA/SIPC
Foundry-SAR-22
 |
| Semi-Annual Report |
| April 30, 2022 |
| Fund Adviser: |
| Kovitz Investment Group Partners, LLC |
| 71 S. Wacker Drive, Suite 1860 |
| Chicago, IL 60606 |
| Toll Free (888) 695-3729 |
| Investment Results (Unaudited) |
| Average Annual Total Returns(a) | ||||||||
| as of April 30, 2022 | ||||||||
| Six Months | One Year | Five Year | Ten Year | |||||
| Green Owl Intrinsic Value Fund | (13.47)% | (6.42)% | 10.03% | 10.95% | ||||
| S&P 500® Index(b) | (9.65)% | 0.21% | 13.66% | 13.67% | ||||
Total annual operating expenses, as disclosed in the Green Owl Intrinsic Value Fund (the “Fund”) prospectus dated February 28, 2022, were 1.28% of average daily net assets (1.10% after fee waivers/ expense reimbursements by Kovitz Investment Group Partners, LLC (the “Adviser”)). The Adviser has agreed to waive its fees and/or reimburse other expenses of the Fund until February 28, 2023, so that Total Annual Fund Operating Expenses do not exceed 1.10%. This operating expense limitation does not apply to interest, taxes, brokerage commissions, other expenditures which are capitalized in accordance with generally accepted accounting principles, other extraordinary expenses not incurred in the ordinary course of the Fund’s business, dividend expense on short sales, expenses incurred under a Rule 12b-1 plan of distribution, “acquired fund fees and expenses,” and expenses that the Fund has incurred but did not actually pay because of an expense offset arrangement. Each waiver and/or reimbursement of an expense is subject to repayment by the Fund within the three years following the date the particular expense payment occurred, provided that the Fund is able to make the repayment without exceeding the expense limitation in place at the time of the waiver or reimbursement and the expense limitation in place at the time of the repayment. This agreement may only be terminated by mutual consent of the Adviser and the Board of Trustees. Additional information pertaining to the Fund’s expense ratios as of April 30, 2022 can be found in the financial highlights.
The performance quoted represents past performance, which does not guarantee future results. The investment return and principal value of an investment will fluctuate so that an investor’s shares, when redeemed, may be worth more or less than their original cost. The returns shown do not reflect deduction of taxes that a shareholder would pay on Fund distributions or the redemption of Fund shares. The Fund’s investment objectives, risks, charges and expenses must be considered carefully before investing. Current performance of the Fund may be lower or higher than the performance quoted. Performance data current to the most recent month end may be obtained by calling (888) 695-3729.
(a) Return figures reflect any change in price per share and assume the reinvestment of all distributions. The Fund’s returns reflect any fee reductions during the applicable periods. If such fee reductions had not occurred, the quoted performance would have been lower. Total returns for periods less than one year are not annualized.
(b) The S&P 500® Index (the “Index”) is an unmanaged index generally representing the performance of the broad domestic economy through changes in the aggregate market value of 500 stocks representing all major industries. Individuals cannot invest directly in the Index; however, an individual may invest in exchange-traded funds or other investment vehicles that attempt to track the performance of a benchmark index.
The Fund’s investment objectives, strategies, risks, charges and expenses must be considered carefully before investing. The prospectus contains this and other important information about the Fund and may be obtained by calling the same number as above. Please read it carefully before investing.
The Fund is distributed by Ultimus Fund Distributors, LLC, Member FINRA/SIPC.
1
| Fund Holdings (Unaudited) |
Green Owl Intrinsic Value Fund Holdings as of April 30, 2022*
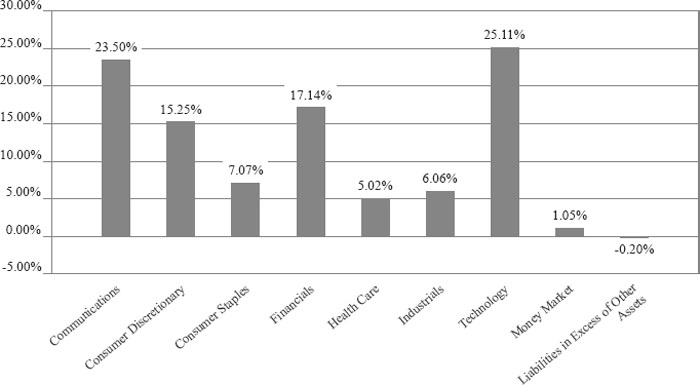
| * | As a percentage of net assets. |
The investment objective of the Green Owl Intrinsic Value Fund is long-term capital appreciation.
| Availability of Portfolio Schedule (Unaudited) |
The Fund files its complete schedule of portfolio holdings with the Securities and Exchange Commission (“SEC”) for the first and third quarters of each fiscal year as an exhibit to its reports on Form N-PORT. The Fund’s Form N-PORT reports are available on the SEC’s website at http://www. sec.gov and on the Fund’s website at http://greenowlfund.com.
2
| Green Owl Intrinsic Value Fund |
| Schedule of Investments |
| April 30, 2022 (Unaudited) |
| COMMON STOCKS — 99.15% | Shares | Fair Value | ||||||
| Communications — 23.50% | ||||||||
| Alphabet, Inc., Class A(a) | 373 | $ | 851,257 | |||||
| Alphabet, Inc., Class C(a) | 2,402 | 5,522,991 | ||||||
| Booking Holdings, Inc.(a) | 807 | 1,783,720 | ||||||
| Charter Communications, Inc., Class A(a) | 4,314 | 1,848,506 | ||||||
| Expedia Group, Inc.(a) | 7,000 | 1,223,250 | ||||||
| GoDaddy, Inc., Class A(a) | 26,010 | 2,101,868 | ||||||
| Meta Platforms, Inc., Class A(a) | 16,078 | 3,223,157 | ||||||
| Spotify Technology SA(a) | 8,682 | 882,525 | ||||||
| Walt Disney Co. (The)(a) | 22,580 | 2,520,605 | ||||||
| 19,957,879 | ||||||||
| Consumer Discretionary — 15.25% | ||||||||
| Amazon.com, Inc.(a) | 1,140 | 2,833,618 | ||||||
| CarMax, Inc.(a) | 16,768 | 1,438,359 | ||||||
| General Motors Co.(a) | 50,964 | 1,932,045 | ||||||
| Gildan Activewear, Inc. | 55,235 | 1,871,362 | ||||||
| Hasbro, Inc. | 24,005 | 2,113,880 | ||||||
| Las Vegas Sands Corp.(a) | 40,479 | 1,434,171 | ||||||
| Lowe’s Cos., Inc. | 6,730 | 1,330,723 | ||||||
| 12,954,158 | ||||||||
| Consumer Staples — 7.07% | ||||||||
| Dollar Tree, Inc.(a) | 14,748 | 2,395,813 | ||||||
| Philip Morris International, Inc. | 36,075 | 3,607,500 | ||||||
| 6,003,313 | ||||||||
| Financials — 17.14% | ||||||||
| American Express Co. | 9,841 | 1,719,321 | ||||||
| Aon PLC, Class A | 5,222 | 1,503,884 | ||||||
| Berkshire Hathaway, Inc., Class B(a) | 10,363 | 3,345,487 | ||||||
| Blackstone Group L.P. (The), Class A(b) | 17,189 | 1,745,887 | ||||||
| Charles Schwab Corp. (The) | 36,405 | 2,414,743 | ||||||
| Citigroup, Inc. | 17,105 | 824,632 | ||||||
| JPMorgan Chase & Co. | 12,745 | 1,521,243 | ||||||
| Northern Trust Corp. | 14,392 | 1,483,096 | ||||||
| 14,558,293 | ||||||||
| Health Care — 5.02% | ||||||||
| Becton, Dickinson and Co. | 15,284 | 3,778,052 | ||||||
| Covetrus, Inc.(a) | 28,735 | 396,543 | ||||||
| Embecta Corp.(a) | 3,056 | 92,994 | ||||||
| 4,267,589 | ||||||||
| Industrials — 6.06% | ||||||||
| Hayward Holdings, Inc.(a) | 27,633 | 439,365 | ||||||
| Jacobs Engineering Group, Inc. | 11,783 | 1,632,535 | ||||||
| Keysight Technologies, Inc.(a) | 7,050 | 988,903 | ||||||
| Quanta Services, Inc. | 17,961 | 2,083,117 | ||||||
| 5,143,920 | ||||||||
| Technology — 25.11% | ||||||||
| Analog Devices, Inc. | 11,411 | 1,761,630 | ||||||
| Apple, Inc. | 21,970 | 3,463,571 | ||||||
See accompanying notes which are an integral part of these financial statements.
3
| Green Owl Intrinsic Value Fund |
| Schedule of Investments (continued) |
| April 30, 2022 (Unaudited) |
| COMMON STOCKS — 99.15% - continued | Shares | Fair Value | ||||||
| Technology — 25.11% - continued | ||||||||
| Arista Networks, Inc.(a) | 13,920 | $ | 1,608,734 | |||||
| Autodesk, Inc.(a) | 11,516 | 2,179,748 | ||||||
| Motorola Solutions, Inc. | 16,023 | 3,423,955 | ||||||
| salesforce.com, Inc.(a) | 15,515 | 2,729,709 | ||||||
| Splunk, Inc.(a) | 11,867 | 1,448,011 | ||||||
| SS&C Technologies Holdings, Inc. | 26,775 | 1,731,272 | ||||||
| Visa, Inc., Class A | 14,013 | 2,986,591 | ||||||
| 21,333,221 | ||||||||
| Total Common Stocks (Cost $59,239,309) | 84,218,373 | |||||||
| MONEY MARKET FUNDS - 1.05% | ||||||||
| Federated Hermes Treasury Obligations Fund, Institutional Class, 0.01%(c) | 888,304 | 888,304 | ||||||
| Total Money Market Funds (Cost $888,304) | 888,304 | |||||||
| Total Investments — 100.20% (Cost $60,127,613) | 85,106,677 | |||||||
| Liabilities in Excess of Other Assets — (0.20)% | (170,426 | ) | ||||||
| NET ASSETS — 100.00% | $ | 84,936,251 | ||||||
| (a) | Non-income producing security. |
| (b) | Master Limited Partnership |
| (c) | Rate disclosed is the seven day effective yield as of April 30, 2022. |
See accompanying notes which are an integral part of these financial statements.
4
| Green Owl Intrinsic Value Fund |
| Statement of Assets and Liabilities |
| April 30, 2022 (Unaudited) |
| Assets | ||||
| Investments in securities at fair value (cost $60,127,613) (Note 3) | $ | 85,106,677 | ||
| Cash | 12,745 | |||
| Receivable for fund shares sold | 185,356 | |||
| Dividends receivable | 61,645 | |||
| Tax reclaims receivable | 9,995 | |||
| Prepaid expenses | 18,333 | |||
| Total Assets | 85,394,751 | |||
| Liabilities | ||||
| Payable for investments purchased | 370,735 | |||
| Payable to Adviser (Note 4) | 60,109 | |||
| Payable to Administrator (Note 4) | 10,913 | |||
| Payable to trustees | 80 | |||
| Other accrued expenses | 16,663 | |||
| Total Liabilities | 458,500 | |||
| Net Assets | $ | 84,936,251 | ||
| Net Assets consist of: | ||||
| Paid-in capital | $ | 54,757,803 | ||
| Accumulated earnings | 30,178,448 | |||
| Net Assets | $ | 84,936,251 | ||
| Shares outstanding (unlimited number of shares authorized, no par value) | 4,425,243 | |||
| Net asset value, offering and redemption price per share (Note 2) | $ | 19.19 | ||
See accompanying notes which are an integral part of these financial statements.
5
| Green Owl Intrinsic Value Fund |
| Statement of Operations |
| For the six months ended April 30, 2022 (Unaudited) |
| Investment Income | ||||
| Dividend income (net of foreign taxes withheld of $3,034) | $ | 429,126 | ||
| Total investment income | 429,126 | |||
| Expenses | ||||
| Investment Adviser fees (Note 4) | 474,490 | |||
| Administration fees (Note 4) | 38,558 | |||
| Fund accounting fees (Note 4) | 19,211 | |||
| Registration expenses | 12,120 | |||
| Transfer agent fees (Note 4) | 11,226 | |||
| Legal fees | 9,898 | |||
| Audit and tax preparation fees | 9,004 | |||
| Custodian fees | 7,426 | |||
| Printing and postage expenses | 4,628 | |||
| Trustee fees | 3,416 | |||
| Insurance expenses | 1,563 | |||
| Compliance service fees (Note 4) | 1,488 | |||
| Pricing | 393 | |||
| Interest expense | 72 | |||
| Miscellaneous expenses | 14,877 | |||
| Total expenses | 608,370 | |||
| Fees contractually waived by Adviser | (86,803 | ) | ||
| Net operating expenses | 521,567 | |||
| Net investment loss | (92,441 | ) | ||
| Net Realized and Change in Unrealized Gain (Loss) on Investments | ||||
| Net realized gain on: | ||||
| Investment securities | 5,234,478 | |||
| Net change in unrealized depreciation on: | ||||
| Investment securities transactions | (18,278,635 | ) | ||
| Foreign currency translations | (960 | ) | ||
| Net realized and change in unrealized loss on investments | (13,045,117 | ) | ||
| Net decrease in net assets resulting from operations | $ | (13,137,558 | ) | |
See accompanying notes which are an integral part of these financial statements.
6
| Green Owl Intrinsic Value Fund |
| Statements of Changes in Net Assets |
| For the Six | For the | |||||||
| Months | Year Ended | |||||||
| Ended | October 31, | |||||||
| April 30, 2022 | 2021 | |||||||
| (Unaudited) | ||||||||
| Increase (Decrease) in Net Assets due to: | ||||||||
| Operations | ||||||||
| Net investment loss | $ | (92,441 | ) | $ | (156,800 | ) | ||
| Net realized gain on investment securities transactions and foreign currency translations | 5,234,478 | 15,891,612 | ||||||
| Net change in unrealized appreciation (depreciation) of investment securities and foreign currency translations | (18,279,595 | ) | 21,150,339 | |||||
| Net increase (decrease) in net assets resulting from operations | (13,137,558 | ) | 36,885,151 | |||||
| Distributions to Shareholders from Earnings (Note 2) | (15,703,324 | ) | (2,423,786 | ) | ||||
| Capital Transactions | ||||||||
| Proceeds from shares sold | 4,969,833 | 8,289,840 | ||||||
| Reinvestment of distributions | 15,022,739 | 2,315,890 | ||||||
| Amount paid for shares redeemed | (5,582,410 | ) | (23,364,904 | ) | ||||
| Net increase (decrease) in net assets resulting from capital transactions | 14,410,162 | (12,759,174 | ) | |||||
| Total Increase (Decrease) in Net Assets | (14,430,720 | ) | 21,702,191 | |||||
| Net Assets | ||||||||
| Beginning of period | 99,366,971 | 77,664,780 | ||||||
| End of period | $ | 84,936,251 | $ | 99,366,971 | ||||
| Share Transactions | ||||||||
| Shares sold | 223,053 | 353,135 | ||||||
| Shares issued in reinvestment of distributions | 684,096 | 115,047 | ||||||
| Shares redeemed | (244,411 | ) | (1,034,060 | ) | ||||
| Net increase (decrease) in shares outstanding | 662,738 | (565,878 | ) | |||||
See accompanying notes which are an integral part of these financial statements.
7
| Green Owl Intrinsic Value Fund |
| Financial Highlights |
| (For a share outstanding during each period) |
| For the Six | ||||||||||||||||||||||||
| Months | ||||||||||||||||||||||||
| Ended | ||||||||||||||||||||||||
| April | ||||||||||||||||||||||||
| 30, 2022 | For the Years Ended October 31, | |||||||||||||||||||||||
| (Unaudited) | 2021 | 2020 | 2019 | 2018 | 2017 | |||||||||||||||||||
| Selected Per Share Data | ||||||||||||||||||||||||
| Net asset value, beginning of period | $ | 26.41 | $ | 17.94 | $ | 18.81 | $ | 18.99 | $ | 19.09 | $ | 15.08 | ||||||||||||
| Investment operations: | ||||||||||||||||||||||||
| Net investment income (loss) | (0.02 | ) | (0.04 | ) | 0.03 | 0.19 | 0.05 | 0.04 | ||||||||||||||||
| Net realized and unrealized gain (loss) on investments | (3.01 | ) | 9.10 | 0.05 | 1.47 | 0.24 | 4.03 | |||||||||||||||||
| Total from investment operations | (3.03 | ) | 9.06 | 0.08 | 1.66 | 0.29 | 4.07 | |||||||||||||||||
| Less distributions to shareholders from: | ||||||||||||||||||||||||
| Net investment income | — | — | (a) | (0.17 | ) | (0.05 | ) | (0.04 | ) | (0.06 | ) | |||||||||||||
| Net realized gains | (4.19 | ) | (0.59 | ) | (0.78 | ) | (1.79 | ) | (0.35 | ) | — | |||||||||||||
| Total distributions | (4.19 | ) | (0.59 | ) | (0.95 | ) | (1.84 | ) | (0.39 | ) | (0.06 | ) | ||||||||||||
| Net asset value, end of period | $ | 19.19 | $ | 26.41 | $ | 17.94 | $ | 18.81 | $ | 18.99 | $ | 19.09 | ||||||||||||
| Total Return(b) | (13.47 | )% (c) | 51.56 | % | 0.23 | % | 10.34 | % | 1.50 | % | 27.02 | % | ||||||||||||
| Ratios and Supplemental Data: | ||||||||||||||||||||||||
| Net assets, end of period (000 omitted) | $ | 84,936 | $ | 99,367 | $ | 77,665 | $ | 83,966 | $ | 78,417 | $ | 82,068 | ||||||||||||
| Ratio of expenses to average net assets after expense waiver | 1.10 | % (d) | 1.10 | % | 1.10 | % | 1.10 | % | 1.10 | % | 1.10 | % | ||||||||||||
| Ratio of expenses to average net assets before expense waiver | 1.28 | % (d) | 1.28 | % | 1.34 | % | 1.32 | % | 1.32 | % | 1.32 | % | ||||||||||||
| Ratio of net investment income (loss) to average net assets after expense waiver | (0.19 | )% (d) | (0.17 | )% | 0.15 | % | 1.04 | % | 0.26 | % | 0.22 | % | ||||||||||||
| Portfolio turnover rate | 13 | % (c) | 20 | % | 46 | % | 29 | % | 33 | % | 17 | % | ||||||||||||
| (a) | Rounds to less than $0.005 per share. |
| (b) | Total return represents the rate that the investor would have earned or lost on an investment in the Fund, assuming reinvestment of distributions. |
| (c) | Not annualized. |
| (d) | Annualized. |
See accompanying notes which are an integral part of these financial statements.
8
| Green Owl Intrinsic Value Fund |
| Notes to the Financial Statements |
| April 30, 2022 (Unaudited) |
NOTE 1. ORGANIZATION
The Green Owl Intrinsic Value Fund (the “Fund”) is registered under the Investment Company Act of 1940, as amended (“1940 Act”), as an open-end diversified series of Valued Advisers Trust (the “Trust”). The Trust is a management investment company established under the laws of Delaware by an Agreement and Declaration of Trust dated June 13, 2008 (the “Trust Agreement”). The Trust Agreement permits the Board of Trustees (the “Board”) to issue an unlimited number of shares of beneficial interest of separate series without par value. The Fund is one of a series of funds authorized by the Board. The Fund commenced operations on December 22, 2011. The Fund’s investment adviser is Kovitz Investment Group Partners, LLC (the “Adviser”). The investment objective of the Fund is to provide long-term capital appreciation.
NOTE 2. SIGNIFICANT ACCOUNTING POLICIES
The Fund is an investment company and follows accounting and reporting guidance under Financial Accounting Standards Board Accounting Standards Codification (“ASC”) Topic 946, “Financial Services-Investment Companies”, including Accounting Standards Update 2013-08. The following is a summary of significant accounting policies followed by the Fund in the preparation of its financial statements. These policies are in conformity with generally accepted accounting principles in the United States of America (“GAAP”).
Estimates – The preparation of financial statements in conformity with GAAP requires management to make estimates and assumptions that affect the reported amounts of assets and liabilities and disclosure of contingent assets and liabilities at the date of the financial statements and the reported amounts of increases and decreases in net assets from operations during the reporting period. Actual results could differ from those estimates.
Foreign Currency Translation – The accounting records of the Fund are maintained in U.S. dollars. Foreign currency amounts are translated into U.S. dollars at the current rate of exchange each business day to determine the value of investments, and other assets and liabilities. Purchases and sales of foreign securities, and income and expenses, are translated at the prevailing rate of exchange on the respective date of these transactions. The Fund does not isolate that portion of the results of operations resulting from changes in foreign exchange rates on investments from fluctuation arising from changes in market prices of securities held. These fluctuations are included with the unrealized gain or loss from investments. Reported net realized foreign exchange gains or losses arise from sales of foreign currencies, currency gains or losses realized between the trade and settlement dates on securities transactions, and the difference between the amounts of dividends, interest, and foreign withholding taxes recorded on the Fund’s books and the U.S. dollar equivalent of the amounts actually received or paid. Net unrealized foreign exchange
9
| Green Owl Intrinsic Value Fund |
| Notes to the Financial Statements (continued) |
| April 30, 2022 (Unaudited) |
gains and losses arise from changes in the fair values of assets and liabilities, other than investments in securities at period end, resulting from changes in exchange rates.
Federal Income Taxes – The Fund makes no provision for federal income or excise tax. The Fund has qualified and intends to qualify each year as a regulated investment company (“RIC”) under subchapter M of the Internal Revenue Code of 1986, as amended, by complying with the requirements applicable to RICs and by distributing substantially all of its taxable income. The Fund also intends to distribute sufficient net investment income and net realized capital gains, if any, so that it will not be subject to excise tax on undistributed income and gains. If the required amount of net investment income or gains is not distributed, the Fund could incur a tax expense.
As of and during the six months ended April 30, 2022, the Fund did not have any liabilities for any unrecognized tax benefits. The Fund recognizes interest and penalties, if any, related to unrecognized tax benefits as income tax expense on the Statement of Operations when incurred. During the six months ended April 30, 2022, the Fund did not incur any interest or penalties. Management of the Fund has reviewed tax positions taken in tax years that remain subject to examination by all major tax jurisdictions, including federal (i.e., the last three tax year ends and the interim tax period since then, as applicable). Management believes that there is no tax liability resulting from unrecognized tax benefits related to uncertain tax positions taken.
Expenses – Expenses incurred by the Trust that do not relate to a specific fund of the Trust are allocated to the individual funds based on each fund’s relative net assets or another appropriate basis (as determined by the Board).
Security Transactions and Related Income – The Fund follows industry practice and records security transactions on the trade date for financial reporting purposes. The specific identification method is used for determining gains or losses for financial statement and income tax purposes. Dividend income is recorded on the ex-dividend date and interest income is recorded on an accrual basis. Non-cash income, if any, is recorded at the fair market value of the securities received. Withholding taxes on foreign dividends, if any, have been provided for in accordance with the Fund’s understanding of the applicable country’s tax rules and rates.
Dividends and Distributions – The Fund intends to distribute its net investment income and net realized long-term and short-term capital gains, if any, at least annually. Dividends and distributions to shareholders, which are determined in accordance with income tax regulations, are recorded on the ex-dividend date. The treatment for financial reporting purposes of distributions made to shareholders during the period from net investment income or net realized capital gains may differ from their ultimate treatment for federal income tax purposes. These differences are caused primarily by differences in the timing
10
| Green Owl Intrinsic Value Fund |
| Notes to the Financial Statements (continued) |
| April 30, 2022 (Unaudited) |
of the recognition of certain components of income, expense or realized capital gain for federal income tax purposes. Where such differences are permanent in nature, they are reclassified among the components of net assets based on their ultimate characterization for federal income tax purposes. Any such reclassifications will have no effect on net assets, results of operations or net asset value (“NAV”) per share of the Fund.
Writing Options – The Fund may write covered call options on equity securities or futures contracts that the Fund is eligible to purchase to extend a holding period to obtain long-term capital gain treatment, to earn premium income, to assure a definite price for a security it has considered selling, or to close out options previously purchased. The Fund may write covered call options if, immediately thereafter, not more than 30% of its net assets would be committed to such transactions. A call option gives the holder (buyer) the right to purchase a security or futures contract at a specified price (the exercise price) at any time until a certain date (the expiration date). A call option is “covered” if the Fund owns the underlying security subject to the call option at all times during the option period. When the Fund writes a covered call option, it maintains a segregated account with its Custodian or as otherwise required by the rules of the exchange the underlying security, cash or liquid portfolio securities in an amount not less than the exercise price at all times while the option is outstanding.
The Fund may write put options on equity securities and futures contracts that the Fund is eligible to purchase to earn premium income or to assure a definite price for a security if it is considering acquiring the security at a lower price than the current market price or to close out options previously purchased. The Fund may not write a put option if, immediately thereafter, more than 25% of its net assets would be committed to such transactions. A put option gives the holder of the option the right to sell, and the writer has the obligation to buy, the underlying security at the exercise price at any time during the option period. The operation of put options in other respects is substantially identical to that of call options. When the Fund writes a put option, it maintains in a segregated account with its Custodian cash or liquid portfolio securities in an amount not less than the exercise price at all times while the put option is outstanding.
NOTE 3. SECURITIES VALUATION AND FAIR VALUE MEASUREMENTS
The Fund values its portfolio securities at fair value as of the close of regular trading on the New York Stock Exchange (“NYSE”) (normally 4:00 p.m. Eastern time) on each business day the NYSE is open for business. Fair value is defined as the price that the Fund would receive upon selling an investment in a timely transaction to an independent buyer in the principal or most advantageous market of the investment. GAAP establishes a three-tier hierarchy to maximize the use of observable market data and minimize the
11
| Green Owl Intrinsic Value Fund |
| Notes to the Financial Statements (continued) |
| April 30, 2022 (Unaudited) |
use of unobservable inputs and to establish classification of fair value measurements for disclosure purposes.
Inputs refer broadly to the assumptions that market participants would use in pricing the asset or liability, including assumptions about risk (the risk inherent in a particular valuation technique used to measure fair value including a pricing model and/or the risk inherent in the inputs to the valuation technique). Inputs may be observable or unobservable. Observable inputs are inputs that reflect the assumptions market participants would use in pricing the asset or liability developed based on market data obtained and available from sources independent of the reporting entity. Unobservable inputs are inputs that reflect the reporting entity’s own assumptions about the assumptions market participants would use in pricing the asset or liability developed based on the best information available in the circumstances.
Various inputs are used in determining the value of the Fund’s investments. These inputs are summarized in the three broad levels listed below.
| ● | Level 1 – unadjusted quoted prices in active markets for identical investments and/or registered investment companies where the value per share is determined and published and is the basis for current transactions for identical assets or liabilities at the valuation date |
| ● | Level 2 – other significant observable inputs (including, but not limited to, quoted prices for an identical security in an inactive market, quoted prices for similar securities, interest rates, prepayment speeds, credit risk, etc.) |
| ● | Level 3 – significant unobservable inputs (including the Fund’s own assumptions in determining fair value of investments based on the best information available) |
The inputs used to measure fair value may fall into different levels of the fair value hierarchy. In such cases, for disclosure purposes, the level in the fair value hierarchy which is reported is determined based on the lowest level input that is significant to the fair value measurement in its entirety.
Equity securities that are traded on any stock exchange are generally valued at the last quoted sale price on the security’s primary exchange. Lacking a last sale price, an exchange-traded security is generally valued at its last bid price. Securities traded in the NASDAQ over-the-counter market are generally valued at the NASDAQ Official Closing Price. When using the market quotations and when the market is considered active, the security is classified as a Level 1 security. In the event that market quotations are not readily available or are considered unreliable due to market or other events, the Fund values its securities and other assets at fair value in accordance with policies established
12
| Green Owl Intrinsic Value Fund |
| Notes to the Financial Statements (continued) |
| April 30, 2022 (Unaudited) |
by and under the general supervision of the Board. Under these policies, the securities will be classified as Level 2 or 3 within the fair value hierarchy, depending on the inputs used.
Investments in mutual funds, including money market mutual funds, are generally priced at the ending NAV. These securities are categorized as Level 1 securities.
Call and put options purchased or sold by the Fund are valued at the mean of the last bid and ask prices as provided by a pricing service. If there is no such reported ask price on the valuation date, options are valued at the most recent bid price. If there is no such reported bid price on the valuation date, options are valued at the most recent ask price. Options will generally be categorized as Level 2 securities.
In accordance with the Trust’s valuation policies, the Adviser is required to consider all appropriate factors relevant to the value of securities for which it has determined other pricing sources are not available or reliable as described above. No single method exists for determining fair value, because fair value depends upon the circumstances of each individual case. As a general principle, the current fair value of a security being valued by the Adviser would be the amount that the Fund might reasonably expect to receive upon the current sale. Methods that are in accordance with this principle may, for example, be based on (i) a multiple of earnings; (ii) a discount from market prices of a similar freely traded security (including a derivative security or a basket of securities traded on other markets, exchanges or among dealers); or (iii) yield to maturity with respect to debt issues, or a combination of these and other methods. Fair-value pricing is permitted if, in the Adviser’s opinion, the validity of market quotations appears to be questionable based on factors such as evidence of a thin market in the security based on a small number of quotations, a significant event occurs after the close of a market but before the Fund’s NAV calculation that may affect a security’s value, or the Adviser is aware of any other data that calls into question the reliability of market quotations.
The following is a summary of the inputs used to value the Fund’s investments as of April 30, 2022:
| Valuation Inputs | ||||||||||||||||
| Assets | Level 1 | Level 2 | Level 3 | Total | ||||||||||||
| Common Stocks (a) | $ | 84,218,373 | $ | — | $ | — | $ | 84,218,373 | ||||||||
| Money Market Funds | 888,304 | — | — | 888,304 | ||||||||||||
| Total | $ | 85,106,677 | $ | — | $ | — | $ | 85,106,677 | ||||||||
| (a) | Refer to Schedule of Investments for sector classifications. |
The Fund did not hold any investments at the end of the reporting period for which significant unobservable inputs (Level 3) were used in determining fair value; therefore, no reconciliation of Level 3 securities is included for this reporting period.
13
| Green Owl Intrinsic Value Fund |
| Notes to the Financial Statements (continued) |
| April 30, 2022 (Unaudited) |
NOTE 4. ADVISER FEES AND OTHER TRANSACTIONS
Under the terms of the management agreement, on behalf of the Fund, the Adviser manages the Fund’s investments subject to approval by the Board. As compensation for its management services, the Fund is obligated to pay the Adviser a fee computed and accrued daily and paid monthly at an annual rate of 1.00% of the average daily net assets of the Fund. For the six months ended April 30, 2022, the Adviser earned a fee of $474,490 from the Fund before the reimbursement described below. At April 30, 2022, the Fund owed the Adviser $60,109.
The Adviser has agreed to waive its fees and/or reimburse other expenses of the Fund until February 28, 2023, so that Total Annual Fund Operating Expenses do not exceed 1.10%. This operating expense limitation does not apply to interest, taxes, brokerage commissions, other expenditures which are capitalized in accordance with GAAP, other extraordinary expenses not incurred in the ordinary course of the Fund’s business, dividend expense on short sales, expenses incurred under a Rule 12b-1 plan of distribution, “acquired fund fees and expenses,” and expenses that the Fund has incurred but did not actually pay because of an expense offset arrangement.
Each waiver and/or reimbursement of an expense is subject to repayment by the Fund within the three years following the date the particular expense payment occurred, provided that the Fund is able to make the repayment without exceeding the expense limitation in place at the time of the waiver or reimbursement and the expense limitation in place at the time of the repayment. This agreement may only be terminated by mutual consent of the Adviser and the Board of Trustees. For the six months ended April 30, 2022, the Adviser waived fees and/or reimbursed expenses of $86,803.
The amounts subject to repayment by the Funds, pursuant to the aforementioned conditions are as follows:
| Recoverable Through | ||||
| October 31, 2022 | $ | 91,080 | ||
| October 31, 2023 | 184,529 | |||
| October 31, 2024 | 168,110 | |||
| April 30, 2025 | 86,803 | |||
The Trust retains Ultimus Fund Solutions, LLC (“the Administrator” or “Ultimus”) to provide the Fund with administration, compliance (including a chief compliance officer), fund accounting and transfer agent services, including all regulatory reporting. For the six months ended April 30, 2022, the Administrator earned fees of $38,558, $1,488, $19,211 and $11,226 for administrative, compliance, accounting and transfer agent services, respectively. At April 30, 2022, the Administrator was owed $10,913 from the Fund for these services.
14
| Green Owl Intrinsic Value Fund |
| Notes to the Financial Statements (continued) |
| April 30, 2022 (Unaudited) |
The officers and one trustee of the Trust are members of management and/or employees of the Administrator and are not paid by the Trust for services to the Fund. Ultimus Fund Distributors, LLC (the “Distributor”) acts as the distributor of the Fund’s shares. The Distributor is a wholly-owned subsidiary of Ultimus.
There were no payments made to the Distributor by the Fund for the six months ended April 30, 2022.
NOTE 5. PURCHASES AND SALES OF SECURITIES
For the six months ended April 30, 2022, purchases and sales of investment securities, other than short-term investments, were $12,055,792 and $13,899,423, respectively.
There were no purchases or sales of long-term U.S. government obligations during the six months ended April 30, 2022.
NOTE 6. FEDERAL TAX INFORMATION
At April 30, 2022, the net unrealized appreciation (depreciation) and tax cost of investments for tax purposes was as follows:
| Gross unrealized appreciation | $ | 26,703,202 | ||
| Gross unrealized depreciation | (1,664,560 | ) | ||
| Net unrealized appreciation on investments | $ | 25,038,642 | ||
| Tax cost of investments | $ | 60,068,035 |
At April 30, 2022, the difference between book basis and tax basis unrealized appreciation (depreciation) is attributable to the tax deferral of losses on organizational expense amortization and ROC basis adjustments.
The tax character of distributions paid for the fiscal year ended October 31, 2021, the Fund’s most recent fiscal year end, was as follows:
| Distributions paid from: | ||||
| Ordinary income(a) | $ | 14,233 | ||
| Long-term capital gains | 2,409,553 | |||
| Total distributions paid | $ | 2,423,786 |
| (a) | Short-term capital gain distributions are treated as ordinary income for tax purposes. |
15
| Green Owl Intrinsic Value Fund |
| Notes to the Financial Statements (continued) |
| April 30, 2022 (Unaudited) |
At October 31, 2021, the Fund’s most recent fiscal year end, the components of accumulated earnings (deficit) on a tax basis were as follows:
| Undistributed Ordinary Income | $ | 355,579 | ||
| Undistributed Long-Term Capital Gains | 15,347,555 | |||
| Accumulated Capital and Other Losses | (1,276 | ) | ||
| Unrealized Appreciation on Investments | 43,317,472 | |||
| Total Accumulated Earnings | $ | 59,019,330 |
NOTE 7. COMMITMENTS AND CONTINGENCIES
The Trust indemnifies its officers and Trustees for certain liabilities that may arise from their performance of their duties to the Trust or the Fund. Additionally, in the normal course of business, the Trust enters into contracts that contain a variety of representations and warranties which provide general indemnifications. The Trust’s maximum exposure under these arrangements is unknown, as this would involve future claims that may be made against the Trust that have not yet occurred.
NOTE 8. SUBSEQUENT EVENTS
Management of the Fund has evaluated the need for disclosures and/or adjustments resulting from subsequent events through the date at which these financial statements were issued. Based upon this evaluation, management has determined there were no items requiring adjustment of the financial statements or additional disclosure.
16
| Summary of Fund Expenses (Unaudited) |
As a shareholder of the Fund, you incur two types of costs: (1) transaction and (2) ongoing costs, including management fees and other Fund expenses. These examples are intended to help you understand your ongoing costs (in dollars) of investing in the Fund and to compare these costs with the ongoing costs of investing in other mutual funds. The example is based on an investment of $1,000 invested at the beginning of the period and held for the entire period from November 1, 2021 through April 30, 2022.
Actual Expenses
The first line of the table below provides information about actual account values and actual expenses. You may use the information in this line, together with the amount you invested, to estimate the expenses that you paid over the period. Simply divide your account value by $1,000 (for example, an $8,600 account value divided by $1,000 = 8.6), then multiply the result by the number in the first line under the heading “Expenses Paid During Period” to estimate the expenses you paid on your account during this period.
Hypothetical Example for Comparison Purposes
The second line of the table below provides information about hypothetical account values and hypothetical expenses based on the Fund’s actual expense ratio and an assumed rate of return of 5% per year before expenses, which is not the Fund’s actual return. The hypothetical account values and expenses may not be used to estimate the actual ending account balance or expenses you paid for the period. You may use this information to compare the ongoing costs of investing in the Fund and other funds. To do so, compare this 5% hypothetical example with the 5% hypothetical examples that appear in the shareholder reports of other funds.
Expenses shown in the table are meant to highlight your ongoing costs only and do not reflect any transactional costs. Therefore, the second line of the table below is useful in comparing ongoing costs only and will not help you determine the relative costs of owning different funds. In addition, if transaction costs were included, your costs would have been higher.
| Beginning | Ending | |||||||||
| Account | Account | Expenses | ||||||||
| Value | Value | Paid | Annualized | |||||||
| November 1, | April 30, | During | Expense | |||||||
| 2021 | 2022 | Period(a) | Ratio | |||||||
| Green Owl Intrinsic Value Fund | ||||||||||
| Actual | $1,000.00 | $865.30 | $5.09 | 1.10% | ||||||
| Hypothetical(b) | $1,000.00 | $1,019.34 | $5.51 | 1.10% | ||||||
| (a) | Expenses are equal to the Fund’s annualized expense ratios, multiplied by the average account value over the period, multiplied by 181/365 (to reflect the one-half year period). |
| (b) | Hypothetical assumes 5% annual return before expenses. |
17
| Investment Advisory Agreement Approval (Unaudited) |
At a meeting held on March 17, 2022, the Board of Trustees (the “Board”) considered the renewal of the Investment Advisory Agreement (the “Kovitz Agreement”) between Valued Advisers Trust (the “Trust”) and Kovitz Investment Group Partners, LLC (“Kovitz”) with respect to the Green Owl Intrinsic Value Fund (the “Green Owl Fund”). Kovitz provided written information to the Board to assist the Board in its considerations.
Counsel reminded the Trustees of their fiduciary duties and responsibilities, including the factors to be considered, and the application of those factors to Kovitz. In assessing the Factors and reaching its decision, the Board took into consideration information furnished by Kovitz and the Trust’s other service providers for the Board’s review and consideration throughout the year at regular Board meetings, as well as information specifically prepared or presented in connection with the annual renewal process, including information presented at this Meeting. The Board requested and was provided with, and reflected on, information and reports relevant to the annual renewal of the Kovitz Agreement, including: (i) reports regarding the services and support provided to the Green Owl Fund by Kovitz; (ii) quarterly assessments of the investment performance of the Green Owl Fund by personnel of Kovitz; (iii) commentary on the reasons for the performance; (iv) presentations by Kovitz addressing its investment philosophy, investment strategy, personnel, and operations; (v) compliance and audit reports concerning the Green Owl Fund and Kovitz; (vi) disclosure information contained in the Trust’s registration statement and the Form ADV of Kovitz; and (vii) a memorandum from counsel, that summarized the fiduciary duties and responsibilities of the Board in considering and approving the Kovitz Agreement. The Board also requested and received various informational materials including, without limitation: (a) documents containing information about Kovitz, including its financial information; a description of its personnel and the services it provides to the Green Owl Fund; information on Kovitz’s investment advice and performance; summaries of the Green Owl Fund’s expenses, compliance program, current legal matters, and other general information; (b) comparative expense and performance information for other mutual funds with strategies similar to the Green Owl Fund; and (c) the benefits to be realized by Kovitz from its relationship with the Green Owl Fund. The Board did not identify any particular information that was most relevant to its consideration of the Kovitz Agreement, and each Trustee may have afforded different weight to the various factors.
1. The nature, extent, and quality of the services to be provided by Kovitz. In this regard, the Board considered Kovitz’s responsibilities under the Kovitz Agreement. The Trustees considered the services being provided by Kovitz to the Green Owl Fund. The Trustees discussed, among other things: the quality of advisory services (including research and recommendations with respect to portfolio securities), the process for formulating investment recommendations and assuring compliance with the Green Owl Fund’s investment objectives and limitations, the coordination of services for the Green Owl Fund among the Green Owl Fund’s service providers, and efforts to promote the Green Owl Fund and grow its assets. The Trustees considered Kovitz’s continuity of, and commitment to retain, qualified personnel, and Kovitz’s commitment to maintain its resources and systems. The Trustees considered Kovitz’s personnel, including the education and experience of the personnel. After considering the foregoing information and further information in the meeting materials provided by Kovitz (including Kovitz’s Form ADV), the Board concluded that, in light of all the facts and circumstances, the nature, extent, and quality of the services provided by Kovitz were satisfactory and adequate for the Green Owl Fund.
2. Investment performance of the Green Owl Fund and Kovitz. In considering the investment performance of the Green Owl Fund and Kovitz, the Trustees compared the performance of the
18
| Investment Advisory Agreement Approval (Unaudited) (continued) |
Green Owl Fund with the performance of funds in a peer group with similar objectives managed by other investment advisers, as well as with aggregated Morningstar category data. The Trustees also considered the consistency of Kovitz’s management of the Green Owl Fund with its investment objective, strategies, and limitations. When comparing the performance of the Green Owl Fund to that of other funds in the peer group, the Trustees noted that the Green Owl Fund’s performance for the one-year period ended December 31, 2021 was above the median, and for the three-year, five-year and since inceptions periods, the Green Owl Fund’s performance was below the median. When considering the performance of the Green Owl Fund’s Morningstar category, the Trustees noted that the Green Owl Fund’s performance was above the average and median for the one-year period ended December 31, 2021, and below the average and median for the three-year, five-year, and since inceptions periods ended December 31, 2021. They also observed that the Green Owl Fund’s performance was above its benchmark index for the one-year period and below its benchmark index for all other periods considered. The Trustees also considered the performance of Kovitz’s separate accounts that were managed in a manner similar to that of the Green Owl Fund and they noted that the performance was very comparable and that any differences were reasonable in light of the circumstances. After reviewing and discussing the investment performance of the Green Owl Fund further, Kovitz’s experience managing the Green Owl Fund, the Green Owl Fund’s historical performance, and other relevant factors, the Board concluded, in light of all the facts and circumstances, that the investment performance of the Green Owl Fund and Kovitz was satisfactory.
3. The costs of the services to be provided and profits to be realized by Kovitz from the relationship with the Green Owl Fund. In considering the costs of services to be provided and the profits to be realized by Kovitz from the relationship with the Green Owl Fund, the Trustees considered: (1) Kovitz’s financial condition; (2) the asset levels of the Green Owl Fund; (3) the overall expenses of the Green Owl Fund; and (4) the nature and frequency of advisory fee payments. The Trustees reviewed information provided by Kovitz regarding its profits associated with managing the Green Owl Fund. The Trustees also considered potential benefits for Kovitz in managing the Green Owl Fund. The Trustees then compared the fees and expenses of the Green Owl Fund (including the management fee) to other comparable mutual funds. First, the Trustees compared the fees and expenses of the Green Owl Fund to those of other funds included in a custom peer group of funds with similar strategy and objective. The Trustees noted that the Green Owl Fund’s management fee was above the average and median for its peer group and the net expense ratio was also higher than the average and median. The Trustees then considered the fees and expenses of the Green Owl Fund as compared to other funds in its Morningstar category. They noted that the management fee was above the average and median of the category and the net expense ratio was also higher than the average and median. The Trustees acknowledged the commitment of Kovitz to continue to limit the expenses of the Green Owl Fund under the same terms going forward. The Trustees considered the services provided to the Green Owl Fund in light of the advisory fees and the peer group fee data and concluded that the fee was within an acceptable range. The Trustees noted that the management fee was less than what Kovitz charges to the majority of its separate account clients who have investment strategies and objectives similar to the Green Owl Fund. Based on the foregoing, the Board concluded that the fees to be paid to Kovitz by the Green Owl Fund and the profits to be realized by Kovitz, in light of all the facts and circumstances, were fair and reasonable in relation to the nature and quality of the services provided by Kovitz.
19
| Investment Advisory Agreement Approval (Unaudited) (continued) |
4. The extent to which economies of scale would be realized as the Green Owl Fund grows and whether advisory fee levels reflect these economies of scale for the benefit of the Green Owl Fund’s investors. In this regard, the Board considered that while the management fee remained the same at all asset levels, the Green Owl Fund’s shareholders experienced benefits from the Green Owl Fund’s expense limitation arrangement. The Trustees noted that once the Green Owl Fund’s expenses fell below the cap set by the arrangement, the Green Owl Fund’s shareholders would continue to benefit from the economies of scale under the Green Owl Fund’s agreements with service providers other than Kovitz. In light of its ongoing consideration of the Green Owl Fund’s asset levels, expectations for growth in the Green Owl Fund, and fee levels, the Board determined that the Green Owl Fund’s fee arrangements, in light of all the facts and circumstances, were fair and reasonable in relation to the nature and quality of the services provided by Kovitz.
5. Possible conflicts of interest and benefits to Kovitz. In considering Kovitz’s practices regarding conflicts of interest, the Trustees evaluated the potential for conflicts of interest and considered such matters as the experience and ability of the advisory personnel assigned to the Green Owl Fund; the basis of decisions to buy or sell securities for the Green Owl Fund and/or Kovitz’s other accounts; and the substance and administration of Kovitz’s code of ethics. The Trustees also considered disclosure in the registration statement of the Trust relating to potential conflicts of interest. The Trustees noted that Kovitz does not utilize soft dollars. The Trustees noted that Kovitz benefits from the Green Owl Fund in that it is able to utilize the Green Owl Fund as a vehicle into which to direct advisory clients with small account balances. The Trustees did not identify any other potential benefits (other than the management fee) that would inure to Kovitz. Based on the foregoing, the Board determined that the standards and practices of Kovitz relating to the identification and mitigation of potential conflicts of interest and the benefits that it derives from managing the Green Owl Fund are acceptable.
After additional consideration of the factors discussed by counsel and further discussion among the Board members, the Board determined to approve the continuation of the Kovitz Agreement.
20
| FACTS | WHAT DOES GREEN OWL INTRINSIC VALUE FUND (THE “FUND”) DO WITH YOUR PERSONAL INFORMATION? |
| Why? | Financial companies choose how they share your personal information. Federal law gives consumers the right to limit some but not all sharing. Federal law also requires us to tell you how we collect, share, and protect your personal information. Please read this notice carefully to understand what we do. |
| What? | The types of personal information we collect and share depend on the product or service you have with us. This information can include:
■ Social Security number
■ account balances and account transactions
■ transaction or loss history and purchase history
■ checking account information and wire transfer instructions
When you are no longer our customer, we continue to share your information as described in this notice. |
| How? | All financial companies need to share customers’ personal information to run their everyday business. In the section below, we list the reasons financial companies can share their customers’ personal information; the reasons the Funds choose to share; and whether you can limit this sharing. |
| Reasons we can share your personal information | Do the Funds share? |
| For
our everyday business purposes— such as to process your transactions, maintain your account(s), respond to court orders and legal investigations, or report to credit bureaus |
Yes |
| For
our marketing purposes— to offer our products and services to you |
No |
| For joint marketing with other financial companies | No |
| For
our affiliates’ everyday business purposes— information about your transactions and experiences |
No |
| For
our affiliates’ everyday business purposes— information about your creditworthiness |
No |
| For nonaffiliates to market to you | No |
| Questions? | Call (888) 695-3729 |
21
| Who we are | |
| Who is providing this notice? | Green
Owl Intrinsic Value Fund Ultimus Fund Distributors, LLC (Distributor) Ultimus Fund Solutions, LLC (Administrator) |
| What we do | |
| How does the Fund protect my personal information? | To protect your personal information from unauthorized access and use, we use security measures that comply with federal law. These measures include computer safeguards and secured files and buildings. Our service providers are held accountable for adhering to strict policies and procedures to prevent any misuse of your nonpublic personal information. |
| How does the Fund collect my personal information? | We collect your personal information, for example, when you
■ open an account or deposit money
■ buy securities from us or sell securities to us
■ make deposits or withdrawals from your account
■ give us your account information
■ make a wire transfer
■ tell us who receives the money
■ tell us where to send the money
■ show your government-issued ID
■ show your driver’s license |
| Why can’t I limit all sharing? | Federal law gives you the right to limit only
■ sharing for affiliates’ everyday business purposes—information about your creditworthiness
■ affiliates from using your information to market to you
■ sharing for nonaffiliates to market to you
State laws and individual companies may give you additional rights to limit sharing. |
| Definitions | |
| Affiliates | Companies related by common ownership or control. They can be financial and nonfinancial companies. |
| ■ Kovitz Investment Group Partners, LLC, the investment adviser to the Fund, could be deemed to be an affiliate. | |
| Nonaffiliates | Companies not related by common ownership or control. They can be financial and nonfinancial companies. |
| ■ The Fund does not share your personal information with nonaffiliates so they can market to you | |
| Joint marketing | A formal agreement between nonaffiliated financial companies that together market financial products or services to you. |
| ■ The Fund does not jointly market. | |
22
Proxy Voting
A description of the policies and procedures that the Fund uses to determine how to vote proxies relating to portfolio securities and information regarding how the Fund voted those proxies during the most recent twelve month period ended June 30, are available (1) without charge upon request by calling the Fund at (888) 695-3729 and (2) in Fund documents filed with the SEC on the SEC’s website at www.sec.gov.
TRUSTEES Andrea N. Mullins, Chairperson Ira P. Cohen Mark J. Seger
OFFICERS Matthew J. Miller, Principal Executive Officer and President Zachary P. Richmond, Principal Financial Officer and Treasurer N. Lynn Bowley, Chief Compliance Officer Carol J. Highsmith, Vice President and Secretary
INVESTMENT ADVISER Kovitz Investment Group Partners, LLC 71 S. Wacker Dr., Ste 1860 Chicago, IL 60606
DISTRIBUTOR Ultimus Fund Distributors, LLC 225 Pictoria Drive, Suite 450 Cincinnati, OH 45246 |
INDEPENDENT REGISTERED PUBLIC ACCOUNTING FIRM Cohen & Company, Ltd. 1350 Euclid Avenue, Suite 800 Cleveland, OH 44115
LEGAL COUNSEL Troutman Pepper Hamilton Sanders LLP 3000 Two Logan Square 18th and Arch Streets Philadelphia, PA 19103
CUSTODIAN Huntington National Bank 41 South High Street Columbus, OH 43215
ADMINISTRATOR, TRANSFER AGENT AND FUND ACCOUNTANT Ultimus Fund Solutions, LLC 225 Pictoria Drive, Suite 450 Cincinnati, OH 45246 |
This report is intended only for the information of shareholders or those who have received the Fund’s prospectus which contains information about the Fund’s management fee and expenses. Please read the prospectus carefully before investing.
Distributed by Ultimus Fund Distributors, LLC Member FINRA/SIPC
Green Owl-SAR-22

| SOUND MIND INVESTING FUND (SMIFX) |
| SMI DYNAMIC ALLOCATION FUND (SMIDX) |
| SMI
MULTI-STRATEGY FUND (SMILX) (Formerly SMI 50/40/10 Fund ) |
| SEMI-ANNUAL REPORT |
| April 30, 2022 |
Funds’ Adviser:
SMI Advisory Services, LLC
4400 Ray Boll Blvd.
Columbus, IN 47203
(877) 764-3863
(877)
SMI-FUND
www.smifund.com
Dear Fellow Shareholder,
The six months covered in this report (November 2021 - April 2022) witnessed multiple significant changes in market trends and conditions. All of the major U.S. stock market indexes peaked and started to decline during this period (the Russell 2000 and Nasdaq indexes peaked in November 2021, while the S&P 500 index peaked in January 2022). More time is needed to definitively say whether the bond market has broken its 40-year trend of declining interest rates, but it certainly appears so at this point. Not surprisingly, bonds have experienced their worst stretch of performance in many years (some have suggested this is the worst bond performance going all the way back to 1789, when it appeared the U.S. was on the verge of losing the Revolutionary War!).
Driving these rapidly changing trends in the stock and bond markets was the persistent rise in inflation and the dawning realization that it was becoming a significant problem. As the annual Consumer Price Index rate increased month by month (it would hit 8.5% in March), so too did the Federal Reserve’s jawboning regarding their intent to tighten financial conditions in response.
While the Fed wouldn’t actually take significant action to tighten conditions until their May meeting (at which they raised the Fed Funds rate 50 basis points and announced a time-table for the beginning of Quantitative Tightening), their forward guidance was clear enough that the bond market began pricing in significantly higher rates much earlier. The two-year Treasury bond, for example, which started November 2021 with a yield of 0.50%, saw that yield soar to 2.70% by the end of April 2022.
These rising interest rates and tightening financial conditions appear to have ended the bull market born 13 years earlier in 2009, at the end of the Global Financial Crisis. Much of the credit for this long bull market has been attributed to the near-zero interest rate policies of central banks around the world, along with their liquidity-enhancing Quantitative Easing policies. So it shouldn’t be a surprise that the reversal of these policies (to Quantitative Tightening and higher interest rates) would ultimately begin the process of unwinding the stock market’s historically elevated valuations.
Fortunately, the SMI Funds (the “Funds”) handled these market transitions deftly. The Funds’ emphasis on risk management served shareholders well over this six-month period and helped each fund outperform the major stock market indexes (S&P 500, Wilshire 5000) as well as their specific Morningstar category peer groups.
Performance Review
SMI’s Stock Upgrading strategy (the sole strategy used in SMIFX and 40% of SMILX) declined -6.96% between November 1, 2021 and April 30, 2022. That compared favorably to the S&P 500 index’s loss of -9.65% and the Wilshire 5000 index’s loss of -11.23%. SMIFX’s average peer lost -13.33% during this period. So while we never like losing money, it’s clear that Stock Upgrading successfully reduced losses
1
relative to both the stock market as a whole and other similarly focused equity funds. Somewhat incredibly, this stock oriented strategy also outperformed the Bloomberg U.S. Aggregate Bond index, which lost -9.47% over this six month period, nearly as much as the stock market.
Stock Upgrading is a trend-following strategy and this period marked a stark transition from the bullish trends that dominated the second-half of 2020 and most of 2021, to the bearish trends that have emerged in 2022. This was evident in the holdings of Stock Upgrading, which started the period heavily overweight growth funds. The portfolio had transitioned largely over to value funds by the end of January. The strategy also began incrementally reducing its stock exposure at that time and building its cash holdings.
From that point at the end of January through the end of April, Stock Upgrading’s risk management orientation made a significant difference to performance. SMIFX posted a +1.41% gain over the remaining three months of the period (February - April) while the broad stock market (S&P 500 index, -8.17%) and its category peer group (-8.83%) were suffering significant losses.
Stock Upgrading initiated a significant allocation to commodities at the beginning of 2021, a position that provided a substantial boost to its performance over the past six months. Upgrading’s commodities holding gained +28.95% during this period, in contrast to the market’s loss (S&P 500 index, -9.65%).
SMI’s Dynamic Asset Allocation (“DAA”) strategy (the sole strategy used in SMIDX and 50% of SMILX) ended the 6-month period with a loss of -7.85%. That was slightly more than Stock Upgrading’s loss, but still better than both the broad stock market as well as SMIDX’s Morningstar peer group, which lost -9.22%. As noted earlier, the Bloomberg U.S. Aggregate Bond index lost -9.47% during these six months, so DAA was able to outperform the typical bond investment as well. That’s particularly significant given that many SMI investors look to DAA as a defensive complement to their bond holdings.
Perhaps the biggest surprise is that DAA was able to perform well given that it maintained its maximum allocation of 33.3% to U.S. Stocks throughout the entire period. (DAA finally sold U.S. Stocks and moved that portion of the portfolio to cash at the end of April.)
Much like Stock Upgrading above, DAA’s performance improved over the latter half of the six-month period as the strategy made adjustments based on the new market trends. Normally during a period of significant stock market weakness, DAA would pivot part of the portfolio to bonds. But with bonds arguably leading the financial markets lower, there was no safety to be found there. Instead, DAA relied heavily on Real Estate and Gold during the period, both of which performed reasonably well.
SMI’s 50/40/10 portfolio (used in SMILX) consists of 50% DAA, 40% Stock Upgrading, and 10% in a strategy called Sector Rotation (“SR”). From November 1, 2021 through April 30, 2022, the SMI Multi-Strategy Fund lost -6.93%. Again, this compared favorably to the broad stock market (Wilshire 5000 index, -11.23%) as well as the Fund’s Morningstar peer group (-9.93%).
Having already covered Stock Upgrading and DAA, which make up 90% of the Fund’s weighting, the final component to discuss is the 10% Sector Rotation allocation. Sector Rotation is normally a bull market star, while being vulnerable to steeper losses than the other strategies during corrections and bear markets. In 2022, however, Sector Rotation flipped this script, generating a small gain of +1.64% during this period when most everything else was losing ground.
This performance was primarily attributable to SR’s pivot into energy funds at the end of January. Over the next three months, SR would go on to gain +16.81%. That exposure, along with the Commodities position within Stock Upgrading, provided valuable diversification among the few pockets of strength to be found anywhere as the 2022 bear market took hold.
2
Conclusion
Risk management is always underappreciated during long bull markets, like the one we experienced from 2009 through 2021. But its importance surges to the forefront during bear markets. The SMI Fund returns listed above are more than just a means of keeping score. For most people they represent the result of years of hard work, sacrifice, saving, and investment.
The cruel math of investment returns means that when a portfolio loses -21.1%, as the Nasdaq index did during the first four months of 2022, a gain of +26.7% is required to break even. Contrast that with the SMIFX portfolio, which lost just -5.7% and needed only a +6.0% rebound to recover. It’s an enormous difference.
That asymmetric math is why SMI Advisory has always focused so much on risk management. A “typical” bear market loss of -30% requires a +43% gain to erase, while the -50% bear markets investors experienced in 2000-2002 and 2007-2009 required massive gains of +100% to recover from. Limiting losses during bear markets sets SMI Fund investors up beautifully once the bear market ends and a new bull market begins.
Of course, no one knows for certain when a bear market has begun, or importantly, exactly when it will end. That’s why the strategies SMI Advisory has developed through years of analysis and practice adjust our risk exposure incrementally based on data the market provides. We had fresh evidence of this at the end of April, as the Funds moved meaningfully away from stocks and into cash just prior to the fresh wave of selling in early May.
All of SMI’s actively managed strategies contributed substantial value over the past six months. Their diversification and tactical decisions helped us lose much less than the broad market during this opening phase of the bear market. We believe that they have us positioned to weather whatever else this bear market has in store.
We appreciate the opportunity to serve you!
Blessings,

Mark
Biller
Senior Portfolio Manager
The Sound Mind Investing Funds
The SMI Fund lineup, shown below, now offers investors a way to mix and match professionally managed funds to custom tailor the risk level desired for their portfolio. If you’d like assistance customizing your portfolio in this manner, please call a Stewardship Advisor at (800) 796-4975.
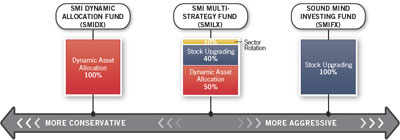
3
| PERFORMANCE RESULTS – (Unaudited) |
| Average Annual Total Returns(a) | |||||||||||
| (For the periods ended April 30, 2022) | |||||||||||
| Three | |||||||||||
| Months | Six Months | One Year | Five Year | Ten Year | |||||||
| Sound Mind Investing Fund | 1.41% | -6.96% | -2.76% | 9.18% | 9.26% | ||||||
| Wilshire 5000® Total Market Index(b) | -8.29% | -11.23% | -2.29% | 13.24% | 13.43% | ||||||
| S&P 500® Index(b) | -8.17% | -9.65% | 0.21% | 13.66% | 13.67% | ||||||
| SMI Custom Index(c) | -8.00% | -14.16% | -9.24% | 9.21% | 10.65% | ||||||
| Total annual operating expenses, as disclosed in the Sound Mind Investing Fund’s (“SMI Fund”) prospectus dated February 28, 2022, were 1.73% of average daily net assets, which includes acquired fund fees and expenses. All expenses are reflected in performance results. SMI Advisory Services, LLC (the “Adviser”) contractually has agreed to waive its fee and/or reimburse certain operating expenses, but only to the extent necessary so that total annual operating expenses (excluding interest, taxes, brokerage commissions, other expenses which are capitalized in accordance with generally accepted accounting principles, extraordinary expenses, dividend expense on short sales, 12b-1 fees, and acquired fund fees and expenses) do not exceed 1.50% of the SMI Fund’s average daily net assets through February 28, 2023. This expense cap may not be terminated prior to this date except by the Board of Trustees (the “Board”). Each waiver or reimbursement of an expense by the Adviser is subject to repayment by the SMI Fund within the three years following the date of such waiver or reimbursement, provided that the SMI Fund is able to make the repayment without exceeding the expense limitation in place at the time of the fee waiver or reimbursement and the expense limitation at the time of the repayment. | |||||||||||
| Average Annual Total Returns(a) | |||||||||||
| (For the periods ended April 30, 2022) | |||||||||||
| Three | Since Inception | ||||||||||
| Months | Six Months | One Year | Five Year | (February 28, 2013) | |||||||
| SMI Dynamic Allocation Fund | -2.61% | -7.85% | -2.03% | 4.65% | 4.44% | ||||||
| Wilshire 5000® Total Market Index(b) | -8.29% | -11.23% | -2.29% | 13.24% | 13.45% | ||||||
| Bloomberg U.S. Aggregate Bond Index(b) | -7.51% | -9.47% | -8.51% | 1.20% | 1.60% | ||||||
| Weighted Index(c) | -7.90% | -10.42% | -4.63% | 8.63% | 8.83% | ||||||
| Total annual operating expenses, as disclosed in the SMI Dynamic Allocation Fund’s prospectus dated February 28, 2022, were 1.41% of average daily net assets, which includes acquired fund fees and expenses. All expenses are reflected in performance results. The Adviser contractually has agreed to waive its fee and/or reimburse certain operating expenses, but only to the extent necessary so that total annual operating expenses (excluding interest, taxes, brokerage commissions, other expenses which are capitalized in accordance with generally accepted accounting principles, extraordinary expenses, dividend expense on short sales, 12b-1 fees, and acquired fund fees and expenses) do not exceed 1.45% of the SMI Dynamic Allocation Fund’s average daily net assets through February 28, 2023. This expense cap may not be terminated prior to this date except by the Board. Each waiver or reimbursement of an expense by the Adviser is subject to repayment by the SMI Dynamic Allocation Fund within the three years following the date of such waiver or reimbursement, provided that the SMI Dynamic Allocation Fund is able to make the repayment without exceeding the expense limitation in place at the time of the fee waiver or reimbursement and the expense limitation at the time of the repayment. | |||||||||||
4
| PERFORMANCE RESULTS – (Unaudited), (Continued) |
| Average Annual Total Returns(a) | |||||||||||
| (For the periods ended April 30, 2022) | |||||||||||
| Three | Since Inception | ||||||||||
| Months | Six Months | One Year | Five Year | (April 29, 2015) | |||||||
| SMI Multi-Strategy Fund | 0.42% | -6.93% | -3.66% | 6.97% | 4.95% | ||||||
| Wilshire 5000® Total Market Index(b) | -8.29% | -11.23% | -2.29% | 13.24% | 11.89% | ||||||
| Bloomberg U.S. Aggregate Bond Index(b) | -7.51% | -9.47% | -8.51% | 1.20% | 1.35% | ||||||
| Weighted Index(c) | -7.90% | -10.42% | -4.63% | 8.63% | 7.86% | ||||||
| Total annual operating expenses, as disclosed in the SMI Multi-Strategy Fund’s prospectus dated February 28, 2022 were 1.57% of average daily net assets (1.55% before fee waivers recouped by the Adviser), which includes acquired fund fees and expenses. All expenses are reflected in performance results. The Adviser contractually has agreed to waive its fee and/ or reimburse certain operating expenses, but only to the extent necessary so that total annual operating expenses (excluding interest, taxes, brokerage commissions, other expenses which are capitalized in accordance with generally accepted accounting principles, extraordinary expenses, dividend expense on short sales, 12b-1 fees, and acquired fund fees and expenses) do not exceed 1.15% of the SMI Multi-Strategy Fund’s average daily net assets through February 28, 2023. This expense cap may not be terminated prior to this date except by the Board. Each waiver or reimbursement of an expense by the Adviser is subject to repayment by the SMI Multi-Strategy Fund within the three years following the date of such waiver or reimbursement, provided that the SMI Multi-Strategy Fund is able to make the repayment without exceeding the expense limitation in place at the time of the fee waiver or reimbursement and the expense limitation at the time of the repayment. | |||||||||||
The performance quoted represents past performance, which does not guarantee future results. The investment return and principal value of an investment will fluctuate so that an investor’s shares, when redeemed, may be worth more or less than their original cost. The returns shown do not reflect deduction of taxes that a shareholder would pay on Fund distributions or the redemption of Fund shares. Current performance of the Sound Mind Investing Fund, SMI Dynamic Allocation Fund, and SMI Multi-Strategy Fund (each a “Fund” and collectively the “Funds”) may be lower or higher than the performance quoted. Performance data current to the most recent month end may be obtained by calling (877) 764-3863.
| (a) | Average annual total returns reflect any change in price per share and assume the reinvestment of all distributions. The Funds’ returns reflect any fee reductions during the applicable periods. If such fee reductions had not occurred, the quoted performance would have been lower. Total returns for periods less than one year are not annualized. |
| (b) | The Standard & Poor’s 500® Index (“S&P 500”), Wilshire 5000® Total Market Index (“Wilshire 5000”), Bloomberg U.S. Aggregate Bond Index, Russell 1000® Value Index, Russell 1000® Growth Index, Russell 2000® Value Index, Russell 2000® Growth Index and MSCI EAFE Index (collectively, the “Indices”) are unmanaged indices that assume reinvestment of all distributions and exclude the effect of taxes and fees. These Indices are widely recognized unmanaged indices and are representative of a broader market and range of securities than is found in each Fund’s portfolio. The returns of the Indices are not reduced by any fees or operating expenses. Individuals cannot invest directly in the Indices; however, an individual can invest in exchange-traded funds or other investment vehicles that attempt to track the performance of a benchmark index. |
| (c) | The SMI Custom Index for the Sound Mind Investing Fund is comprised of 20% Russell 1000® Value Index, 20% Russell 1000® Growth Index, 20% Russell 2000® Value Index, 20% Russell 2000® Growth Index and 20% MSCI EAFE Index and the Weighted Index for the SMI Dynamic Allocation Fund and the SMI Multi-Strategy Fund is comprised of 60% Wilshire 5000 and 40% Bloomberg U.S. Aggregate Bond Index. |
The Funds’ investment objectives, risks, charges and expenses must be considered carefully before investing. The prospectus contains this and other important information about the Funds and may be obtained by calling the same number as above. Please read it carefully before investing.
5
| FUND HOLDINGS – (Unaudited) |
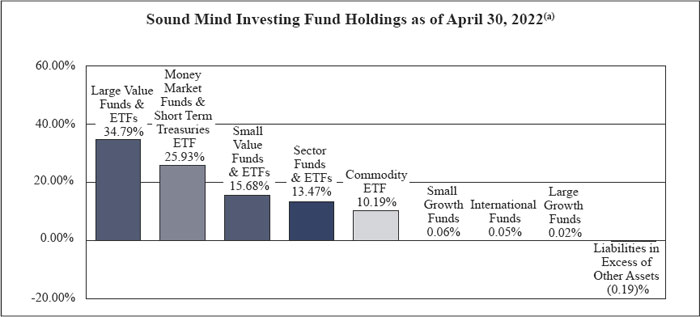
| (a) | As a percentage of net assets. |
Sound Mind Investing Fund seeks long-term capital appreciation. The Fund seeks to achieve its objective by investing in a diversified portfolio of other investment companies using a “Stock Upgrading” strategy. The Stock Upgrading investment strategy is a systematic investment approach that is based on the belief of the Adviser that superior returns can be obtained by constantly monitoring the performance of a wide universe of other investment companies and standing ready to move assets into the funds deemed by the Adviser to be most attractive at the time of analysis. This upgrading process strives to keep assets invested in funds that are demonstrating superior current performance relative to their peers as determined by a combination of size and investment style criteria.
6
| FUND HOLDINGS – (Unaudited), (Continued) |
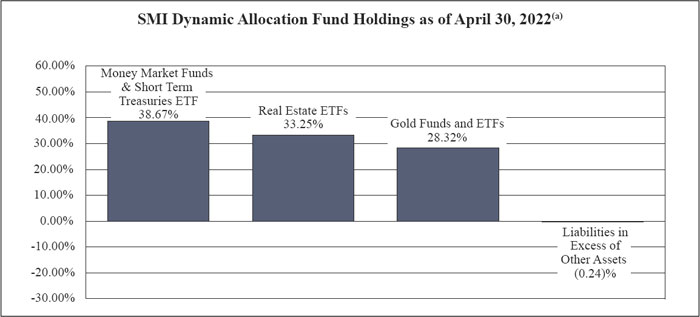
| (a) | As a percentage of net assets. |
SMI Dynamic Allocation Fund seeks total return. Total return is composed of both income and capital appreciation. The Fund uses a “Dynamic Asset Allocation” investment strategy to achieve its investment objective. This is done by investing in open-end mutual funds and exchange-traded funds (“ETFs”) that invest in securities from the following six asset classes – U.S. Equities, International Equities, Fixed Income Securities, Real Estate, Precious Metals, and Cash.
7
| FUND HOLDINGS – (Unaudited), (Continued) |
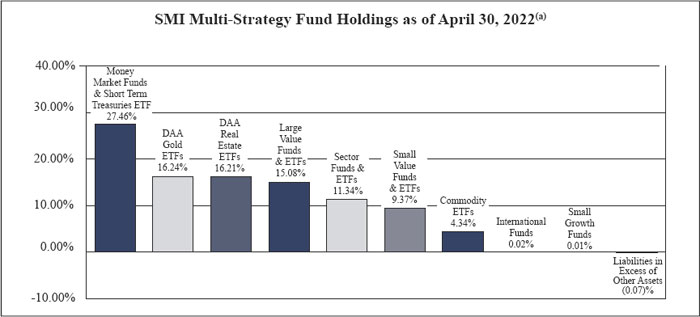
| (a) | As a percentage of net assets. |
SMI Multi-Strategy Fund seeks total return. Total return is composed of both income and capital appreciation. The Adviser typically allocates the Fund’s assets on a 50/40/10 basis among various investment strategies as follows:
| ● | 50% - Dynamic Asset Allocation Strategy (“DAA”) |
| ● | 40% - Stock Upgrading Strategy |
| ● | 10% - Sector Rotation Strategy |
The “Sector Rotation Strategy” involves the Adviser selecting from a universe of mutual funds and ETFs it has compiled using proprietary methods (“Underlying Funds”). This universe is specifically designed by the Adviser to balance exposure to a wide variety of market sectors and industries. This universe includes leveraged, non-leveraged and inverse Underlying Funds. The Adviser ranks these Underlying Funds based on their recent performance across multiple short-term performance periods, then uses an upgrading approach to invest in the top performing market sector or sectors. Once a particular sector or sectors is identified, the Adviser purchases one or more Underlying Funds to gain the desired exposure to that particular sector. This portion of the Fund may be concentrated, meaning that the Fund may be invested in as few as one or two sectors at a time and potentially as few as one Underlying Fund.
| Availability of Portfolio Schedules – (Unaudited) |
The Funds file their complete schedules of portfolio holdings with the Securities and Exchange Commission (“SEC”) for the first and third quarters of each fiscal year as an exhibit to its reports on Form N-PORT. The Funds’ Form N-PORT reports are available on the SEC’s website at http://www.sec.gov and on the Funds’ website at www.smifund.com.
8
| SOUND MIND INVESTING FUND |
| SCHEDULE OF INVESTMENTS |
| April 30, 2022 (Unaudited) |
| EXCHANGE-TRADED FUNDS – 57.87% | Shares | Fair Value | ||||||
| Energy Select Sector SPDR® Fund | 49,480 | $ | 3,718,422 | |||||
| First Trust Natural Gas ETF | 121,720 | 2,943,190 | ||||||
| Invesco DB Commodity Index Tracking Fund(a) | 471,430 | 12,978,468 | ||||||
| iShares S&P 500® Value ETF(b) | 218,850 | 32,385,422 | ||||||
| iShares S&P Small-Cap 600® Value ETF | 52,490 | 5,031,691 | ||||||
| SPDR® Bloomberg 1-3 Month T-Bill ETF | 85,430 | 7,810,011 | ||||||
| SPDR® S&P Metals & Mining ETF | 41,570 | 2,336,650 | ||||||
| SPDR® S&P Oil & Gas Exploration & Production ETF | 21,650 | 2,853,687 | ||||||
| WisdomTree U.S. High Dividend Fund | 43,030 | 3,679,926 | ||||||
| Total Exchange-Traded Funds (Cost $70,424,370) | 73,737,467 | |||||||
| MUTUAL FUNDS – 22.52% | ||||||||
| Aegis Value Fund, Inc., Institutional Class(a) | 134,333 | 4,557,925 | ||||||
| Akre Focus Fund, Institutional Class | 101 | 5,556 | ||||||
| AllianzGI Dividend Value Fund | 200 | 2,438 | ||||||
| AllianzGI NFJ Small-Cap Value Fund | 162 | 2,649 | ||||||
| American Century Equity Income Fund, Investor Class | 100 | 952 | ||||||
| American Century International Opportunities Fund, Institutional Class | 360 | 3,399 | ||||||
| AMG Yacktman Focused Fund, Institutional Class | 100 | 1,966 | ||||||
| AMG Yacktman Fund, Institutional Class | 100 | 2,293 | ||||||
| Artisan International Small Cap Fund, Investor Class | 100 | 1,641 | ||||||
| Artisan International Value Fund, Investor Class | 150 | 5,883 | ||||||
| Artisan Mid Cap Value Fund, Investor Class | 279 | 5,582 | ||||||
| Artisan Small Cap Fund, Investor Class | 125 | 3,656 | ||||||
| BlackRock International Opportunities Portfolio, Institutional Class | 100 | 3,208 | ||||||
| BNY Mellon Opportunistic Small Cap Fund, Investor Class | 100 | 3,045 | ||||||
| Bridgeway Small-Cap Value Fund, Class N | 137,312 | 4,952,843 | ||||||
| Bridgeway Ultra-Small Company Market Fund, Class N | 100 | 1,202 | ||||||
| Buffalo Small Cap Fund, Inc. | 150 | 2,106 | ||||||
| Centre American Select Equity Fund, Institutional Class | 452,457 | 6,958,784 | ||||||
| Champlain Small Company Fund, Institutional Class | 100 | 2,065 | ||||||
| Chartwell Small Cap Value Fund | 118 | 2,144 | ||||||
| Columbia Acorn Fund, Class Z | 137 | 1,378 | ||||||
| Columbia Acorn International, Class Z | 100 | 2,431 | ||||||
| Columbia Contrarian Core Fund, Class Z | 91 | 2,690 | ||||||
| Columbia Small Cap Growth Fund I, Class Z | 100 | 2,010 | ||||||
| Davis Opportunity Fund, Class Y | 100 | 3,849 | ||||||
| Delaware Select Growth Fund, Institutional Class | 100 | 2,753 | ||||||
| Delaware Small Cap Value Fund, Institutional Class | 100 | 7,334 | ||||||
See accompanying notes which are an integral part of these financial statements.
9
| SOUND MIND INVESTING FUND |
| SCHEDULE OF INVESTMENTS |
| April 30, 2022 (Unaudited) – (Continued) |
| MUTUAL FUNDS – 22.52% - continued | Shares | Fair Value | ||||||
| Delaware Value Fund, Institutional Class | 144 | $ | 2,892 | |||||
| Deutsche Small Cap Core Fund, Institutional Class | 52 | 2,243 | ||||||
| DFA International Small Cap Value Portfolio, Institutional Class | 100 | 1,979 | ||||||
| DFA International Small Company Portfolio, Institutional Class | 100 | 1,890 | ||||||
| DFA U.S. Small Cap Value Portfolio, Institutional Class | 100 | 4,088 | ||||||
| Fairholme Fund(a) | 39,842 | 1,281,317 | ||||||
| Fidelity Mid-Cap Stock Fund | 150 | 5,961 | ||||||
| Fidelity Select Energy Portfolio | 54,730 | 2,694,357 | ||||||
| Fidelity Select Natural Resources Portfolio | 72,022 | 2,623,024 | ||||||
| Fidelity Small Cap Discovery Fund | 100 | 2,693 | ||||||
| Fidelity Small Cap Stock Fund | 150 | 2,466 | ||||||
| Fidelity Small Cap Value Fund | 150 | 2,954 | ||||||
| Franklin Small Cap Value Fund, Advisor Class | 100 | 5,553 | ||||||
| Hartford International Opportunities Fund (The), Class Y | 248 | 4,252 | ||||||
| Heartland Value Fund | 100 | 4,187 | ||||||
| Hennessy Cornerstone Mid Cap 30 Fund, Institutional Class | 100 | 2,069 | ||||||
| Hennessy Focus Fund, Investor Class | 50 | 2,848 | ||||||
| Hotchkis and Wiley Mid-Cap Value Fund, Institutional Class | 119,066 | 5,359,137 | ||||||
| Invesco American Value Fund, Class Y | 141 | 5,198 | ||||||
| Invesco Oppenheimer International Small-Mid Company Fund, Class Y | 100 | 4,247 | ||||||
| Janus Henderson Contrarian Fund, Class T | 100 | 2,596 | ||||||
| Janus Henderson Mid Cap Value Fund, Class T | 200 | 3,144 | ||||||
| Janus Henderson Overseas Fund, Class T | 100 | 4,004 | ||||||
| Janus Henderson Venture Fund, Class T | 100 | 7,556 | ||||||
| JOHCM International Select Fund, Institutional Class | 100 | 2,324 | ||||||
| JPMorgan Mid Cap Value Fund, Institutional Class | 100 | 3,952 | ||||||
| JPMorgan Small Cap Equity Fund, Select Class | 100 | 5,759 | ||||||
| JPMorgan Small Cap Growth Fund, Class L | 100 | 1,902 | ||||||
| JPMorgan U.S. Research Enhanced Equity Fund, Institutional Class | 100 | 3,190 | ||||||
| Longleaf Partners Fund | 150 | 3,420 | ||||||
| Longleaf Partners International Fund | 150 | 2,132 | ||||||
| Longleaf Partners Small-Cap Fund | 100 | 2,404 | ||||||
| Lord Abbett Developing Growth Fund, Inc., Institutional Class | 100 | 2,435 | ||||||
| Miller Opportunity Trust, Institutional Class | 100 | 3,481 | ||||||
| Morgan Stanley Discovery Portfolio, Institutional Class | 100 | 1,560 | ||||||
| Morgan Stanley Growth Portfolio, Institutional Class | 100 | 4,237 | ||||||
| Neuberger Berman Genesis Fund, Institutional Class | 100 | 6,056 | ||||||
| Nicholas Fund, Inc. | 50 | 3,683 | ||||||
| Oakmark International Fund, Investor Class | 150 | 3,615 | ||||||
See accompanying notes which are an integral part of these financial statements.
10
| SOUND MIND INVESTING FUND |
| SCHEDULE OF INVESTMENTS |
| April 30, 2022 (Unaudited) – (Continued) |
| MUTUAL FUNDS – 22.52% - continued | Shares | Fair Value | ||||||
| Oakmark International Small Cap Fund, Institutional Class | 150 | $ | 2,453 | |||||
| Oakmark Select Fund, Institutional Class | 150 | 8,186 | ||||||
| PRIMECAP Odyssey Aggressive Growth Fund | 100 | 4,175 | ||||||
| Principal SmallCap Growth Fund I, Institutional Class | 200 | 2,612 | ||||||
| Prudential Jennison International Opportunities, Class Z | 185 | 4,815 | ||||||
| Royce Micro-Cap Fund, Investment Class | 106 | 1,113 | ||||||
| Royce Opportunity Fund, Investment Class | 318 | 4,624 | ||||||
| Royce Premier Fund, Investment Class | 300 | 3,372 | ||||||
| Royce Special Equity Fund, Institutional Class | 150 | 2,570 | ||||||
| T. Rowe Price International Discovery Fund, Investor Class | 75 | 4,750 | ||||||
| T. Rowe Price Mid-Cap Growth Fund, Investor Class | 50 | 4,747 | ||||||
| T. Rowe Price New Horizons Fund, Investor Class | 100 | 5,352 | ||||||
| T. Rowe Price Small-Cap Value Fund, Investor Class | 100 | 5,311 | ||||||
| Thornburg Value Fund, Institutional Class | 100 | 6,776 | ||||||
| TIAA-CREF International Equity Fund, Institutional Class | 100 | 1,181 | ||||||
| Touchstone Sands Capital Select Growth Fund, Class Y | 100 | 1,197 | ||||||
| Tweedy Browne International Value Fund | 150 | 4,104 | ||||||
| Vanguard Strategic Equity Fund, Investor Class | 100 | 3,487 | ||||||
| Victory RS Small Cap Growth Fund, Class Y | 100 | 5,600 | ||||||
| Wasatch International Growth Fund, Investor Class | 150 | 3,861 | ||||||
| Wasatch Micro Cap Fund, Investor Class | 100 | 664 | ||||||
| Total Mutual Funds (Cost $28,690,119) | 28,703,537 | |||||||
| MONEY MARKET FUNDS – 19.80% | ||||||||
| Fidelity Investments Money Market Government Portfolio, Institutional Class, 0.20%(c) | 25,231,054 | 25,231,054 | ||||||
| Total Money Market Funds (Cost $25,231,054) | 25,231,054 | |||||||
| Total Investments — 100.19% (Cost $124,345,543) | $ | 127,672,058 | ||||||
| Liabilities in Excess of Other Assets — (0.19)% | (240,167 | ) | ||||||
| NET ASSETS — 100.00% | $ | 127,431,891 | ||||||
| (a) | Non-income producing security. |
| (b) | Represents an investment greater than 25% of the Fund’s net assets. Performance of the Fund may be adversely impacted by concentrated investments in securities. The financial statements and portfolio holdings for these securities can be found at www.sec. gov. As of April 30, 2022, the percentage of net assets invested in iShares S&P 500® Value ETF was 25.41% of the Fund. |
| (c) | Rate disclosed is the seven day effective yield as of April 30, 2022. |
ETF - Exchange-Traded Fund
SPDR - Standard & Poor’s Depositary Receipt
See accompanying notes which are an integral part of these financial statements.
11
| SMI DYNAMIC ALLOCATION FUND |
| SCHEDULE OF INVESTMENTS |
| April 30, 2022 (Unaudited) |
| EXCHANGE-TRADED FUNDS – 74.86% | Shares | Fair Value | ||||||
| Gold Bullion Strategy Fund (The), Investor Class(a) | 183,604 | $ | 4,129,248 | |||||
| iShares 1-3 Year Treasury Bond ETF(b) | 478,350 | 39,655,216 | ||||||
| Real Estate Select Sector SPDR® Fund | 170,880 | 7,963,008 | ||||||
| Vanguard Real Estate ETF(b) | 260,010 | 27,025,439 | ||||||
| Total Exchange-Traded Funds (Cost $74,446,178) | 78,772,911 | |||||||
| CLOSED END FUNDS – 24.40% | ||||||||
| Sprott Physical Gold Trust(a) | 1,714,560 | 25,666,963 | ||||||
| Total Closed End Funds (Cost $25,614,651) | 25,666,963 | |||||||
| MONEY MARKET FUNDS – 0.98% | ||||||||
| Fidelity Investments Money Market Government Portfolio, Institutional Class, 0.20%(c) | 1,028,025 | 1,028,025 | ||||||
| Total Money Market Funds (Cost $1,028,025) | 1,028,025 | |||||||
| Total Investments — 100.24% (Cost $101,088,854) | $ | 105,467,899 | ||||||
| Liabilities in Excess of Other Assets — (0.24)% | (257,272 | ) | ||||||
| NET ASSETS — 100.00% | $ | 105,210,627 | ||||||
| (a) | Non-income producing security. |
| (b) | Represents an investment greater than 25% of the Fund’s net assets. Performance of the Fund may be adversely impacted by concentrated investments in securities. The financial statements and portfolio holdings for these securities can be found at www.sec. gov. As of April 30, 2022, the percentage of net assets invested in iShares 1-3 Year Treasury Bond ETF and Vanguard Real Estate ETF was 37.69% and 25.69% of the Fund, respectively. |
| (c) | Rate disclosed is the seven day effective yield as of April 30, 2022. |
ETF - Exchange-Traded Fund
See accompanying notes which are an integral part of these financial statements.
12
| SMI MULTI-STRATEGY FUND |
| SCHEDULE OF INVESTMENTS |
| April 30, 2022 (Unaudited) |
| EXCHANGE-TRADED FUNDS – 64.90% | Shares | Fair Value | ||||||
| Energy Select Sector SPDR® Fund | 40,960 | $ | 3,078,144 | |||||
| First Trust Natural Gas ETF | 35,180 | 850,652 | ||||||
| Invesco DB Commodity Index Tracking Fund(a) | 97,010 | 2,670,685 | ||||||
| iShares 1-3 Year Treasury Bond ETF | 123,860 | 10,267,994 | ||||||
| iShares S&P 500® Value ETF | 46,170 | 6,832,237 | ||||||
| iShares S&P Small-Cap 600® Value ETF | 23,160 | 2,220,118 | ||||||
| SPDR® Bloomberg 1-3 Month T-Bill ETF | 15,490 | 1,416,096 | ||||||
| SPDR® S&P Metals & Mining ETF | 11,270 | 633,487 | ||||||
| SPDR® S&P Oil & Gas Exploration & Production ETF | 6,410 | 844,902 | ||||||
| Vanguard Real Estate ETF | 95,900 | 9,967,846 | ||||||
| WisdomTree U.S. High Dividend Fund | 13,240 | 1,132,285 | ||||||
| Total Exchange-Traded Funds (Cost $37,603,493) | 39,914,446 | |||||||
| CLOSED END FUNDS – 16.25% | ||||||||
| Sprott Physical Gold Trust(a) | 667,452 | 9,991,757 | ||||||
| Total Closed End Funds (Cost $9,887,839) | 9,991,757 | |||||||
| MUTUAL FUNDS – 10.46% | ||||||||
| Aegis Value Fund, Inc., Institutional Class(a) | 36,401 | 1,235,093 | ||||||
| AMG Yacktman Focused Fund, Institutional Class | 100 | 1,966 | ||||||
| Bridgeway Small-Cap Value Fund, Class N | 52,901 | 1,908,150 | ||||||
| Centre American Select Equity Fund, Institutional Class | 85,058 | 1,308,192 | ||||||
| Fidelity Select Energy Portfolio | 16,163 | 795,727 | ||||||
| Fidelity Select Natural Resources Portfolio | 21,233 | 773,319 | ||||||
| Hotchkis and Wiley Mid-Cap Value Fund, Institutional Class | 8,781 | 395,224 | ||||||
| Invesco Oppenheimer International Small-Mid Company Fund, Class Y | 100 | 4,247 | ||||||
| Longleaf Partners International Fund | 150 | 2,132 | ||||||
| Lord Abbett Developing Growth Fund, Inc., Institutional Class | 100 | 2,435 | ||||||
| Miller Opportunity Trust, Institutional Class | 100 | 3,481 | ||||||
| Morgan Stanley Discovery Portfolio, Institutional Class | 100 | 1,560 | ||||||
| Oakmark International Fund, Investor Class | 50 | 1,205 | ||||||
| Wasatch International Growth Fund, Investor Class | 100 | 2,574 | ||||||
| Total Mutual Funds (Cost $6,310,608) | 6,435,305 | |||||||
See accompanying notes which are an integral part of these financial statements.
13
| SMI MULTI-STRATEGY FUND |
| SCHEDULE OF INVESTMENTS |
| April 30, 2022 (Unaudited) – (Continued) |
| MONEY MARKET FUNDS – 8.46% | Shares | Fair Value | ||||||
| Fidelity Investments Money Market Government Portfolio, Institutional Class, 0.20%(b) | 5,202,219 | $ | 5,202,219 | |||||
| Total Money Market Funds (Cost $5,202,219) | 5,202,219 | |||||||
| Total Investments — 100.07% (Cost $59,004,159) | $ | 61,543,727 | ||||||
| Liabilities in Excess of Other Assets — (0.07)% | (40,836 | ) | ||||||
| NET ASSETS — 100.00% | $ | 61,502,891 | ||||||
| (a) | Non-income producing security. |
| (b) | Rate disclosed is the seven day effective yield as of April 30, 2022. |
ETF - Exchange-Traded Fund
SPDR - Standard & Poor’s Depositary Receipt
See accompanying notes which are an integral part of these financial statements.
14
| SMI FUNDS |
| STATEMENTS OF ASSETS AND LIABILITIES |
| April 30, 2022 (Unaudited) |
| SMI | ||||||||||||
| Sound Mind | SMI Dynamic | Multi-Strategy | ||||||||||
| Investing Fund | Allocation Fund | Fund | ||||||||||
| Assets | ||||||||||||
| Investments in securities at fair value (cost $124,345,543, $101,088,854 and $59,004,159) (Note 3) | $ | 127,672,058 | $ | 105,467,899 | $ | 61,543,727 | ||||||
| Receivable for fund shares sold | 7,695 | 39,700 | 19,414 | |||||||||
| Receivable for investments sold | — | 34,097,182 | 9,692,615 | |||||||||
| Dividends receivable | 724 | 97 | 211 | |||||||||
| Prepaid expenses | 21,795 | 24,936 | 25,955 | |||||||||
| Total Assets | 127,702,272 | 139,629,814 | 71,281,922 | |||||||||
| Liabilities | ||||||||||||
| Payable for fund shares redeemed | 140,007 | 161,244 | 6,837 | |||||||||
| Payable for investments purchased | — | 34,153,694 | 9,711,275 | |||||||||
| Payable to Adviser (Note 4) | 109,284 | 89,658 | 45,216 | |||||||||
| Payable to Administrator (Note 4) | 7,485 | 5,433 | 3,735 | |||||||||
| Payable to trustees | 374 | 275 | 61 | |||||||||
| Other accrued expenses | 13,231 | 8,883 | 11,907 | |||||||||
| Total Liabilities | 270,381 | 34,419,187 | 9,779,031 | |||||||||
| Net Assets | $ | 127,431,891 | $ | 105,210,627 | $ | 61,502,891 | ||||||
| Net Assets consist of: | ||||||||||||
| Paid-in capital | 133,641,943 | 96,646,692 | 60,312,299 | |||||||||
| Accumulated earnings (deficit) | (6,210,052 | ) | 8,563,935 | 1,190,592 | ||||||||
| Net Assets | $ | 127,431,891 | $ | 105,210,627 | $ | 61,502,891 | ||||||
| Shares outstanding (unlimited number of shares authorized, no par value) | 14,708,427 | 8,817,404 | 6,367,932 | |||||||||
| Net asset value, offering and redemption price per share (Note 2) | $ | 8.66 | $ | 11.93 | $ | 9.66 | ||||||
See accompanying notes which are an integral part of these financial statements.
15
| SMI FUNDS |
| STATEMENTS OF OPERATIONS |
| For the six months ended April 30, 2022 (Unaudited) |
| SMI | ||||||||||||
| Sound Mind | SMI Dynamic | Multi-Strategy | ||||||||||
| Investing Fund | Allocation Fund | Fund | ||||||||||
| Investment Income | ||||||||||||
| Dividend income | $ | 6,714,394 | $ | 885,910 | $ | 1,672,476 | ||||||
| Total investment income | 6,714,394 | 885,910 | 1,672,476 | |||||||||
| Expenses | ||||||||||||
| Investment Adviser fees (Note 4) | 682,301 | 561,094 | 288,041 | |||||||||
| Administration fees (Note 4) | 19,827 | 16,240 | 9,249 | |||||||||
| Registration fees | 13,621 | 15,510 | 15,724 | |||||||||
| Transfer agent fees (Note 4) | 11,469 | 4,978 | 5,151 | |||||||||
| Legal fees | 11,271 | 10,895 | 10,061 | |||||||||
| Fund accounting fees (Note 4) | 10,419 | 8,533 | 4,860 | |||||||||
| Audit and tax preparation fees | 9,194 | 9,194 | 9,194 | |||||||||
| Printing and postage expenses | 6,345 | 4,439 | 3,344 | |||||||||
| Custodian fees | 5,992 | 3,135 | 3,660 | |||||||||
| Compliance service fees (Note 4) | 4,016 | 4,016 | 4,016 | |||||||||
| Trustee fees (Note 4) | 3,734 | 3,596 | 3,359 | |||||||||
| Line of credit | 3,198 | 2,655 | 1,497 | |||||||||
| Insurance expenses | 1,777 | 1,624 | 1,424 | |||||||||
| Interest expense | 251 | 298 | 42 | |||||||||
| Miscellaneous expenses | 24,155 | 16,822 | 17,961 | |||||||||
| Total expenses | 807,570 | 663,057 | 377,583 | |||||||||
| Fees contractually waived by Adviser | — | — | (8,189 | ) | ||||||||
| Net operating expenses | 807,570 | 663,057 | 369,394 | |||||||||
| Net investment income | 5,906,824 | 222,853 | 1,303,082 | |||||||||
| Net Realized and Change in Unrealized Gain (Loss) on Investments | ||||||||||||
| Long term capital gain dividends from investment companies | 821,943 | 76,168 | 182,572 | |||||||||
| Net realized gain (loss) on investment securities transactions | (11,119,650 | ) | 4,202,204 | (1,454,229 | ) | |||||||
| Net change in unrealized depreciation on investment securities | (5,593,033 | ) | (13,562,068 | ) | (4,645,822 | ) | ||||||
| Net realized and change in unrealized loss on investments | (15,890,740 | ) | (9,283,696 | ) | (5,917,479 | ) | ||||||
| Net decrease in net assets resulting from operations | $ | (9,983,916 | ) | $ | (9,060,843 | ) | $ | (4,614,397 | ) | |||
See accompanying notes which are an integral part of these financial statements.
16
| SOUND MIND INVESTING FUND |
| STATEMENTS OF CHANGES IN NET ASSETS |
| For the Six | ||||||||
| Months Ended | For the Year | |||||||
| April 30, 2022 | Ended | |||||||
| (Unaudited) | October 31, 2021 | |||||||
| Increase (Decrease) in Net Assets due to: | ||||||||
| Operations | ||||||||
| Net investment income (loss) | $ | 5,906,824 | $ | (134,517 | ) | |||
| Long term capital gain dividends from investment companies | 821,943 | 4,680,807 | ||||||
| Net realized gain (loss) on investment securities transactions | (11,119,650 | ) | 49,217,835 | |||||
| Net change in unrealized depreciation of investment securities | (5,593,033 | ) | (8,908,040 | ) | ||||
| Net increase (decrease) in net assets resulting from operations | (9,983,916 | ) | 44,856,085 | |||||
| Distributions to Shareholders from Earnings (Note 2) | (46,567,403 | ) | — | |||||
| Capital Transactions | ||||||||
| Proceeds from shares sold | 2,465,223 | 9,454,512 | ||||||
| Reinvestment of distributions | 45,907,374 | — | ||||||
| Amount paid for shares redeemed | (14,506,668 | ) | (28,968,665 | ) | ||||
| Net increase (decrease) in net assets resulting from capital transactions | 33,865,929 | (19,514,153 | ) | |||||
| Total Increase (Decrease) in Net Assets | (22,685,390 | ) | 25,341,932 | |||||
| Net Assets | ||||||||
| Beginning of period | 150,117,281 | 124,775,349 | ||||||
| End of period | $ | 127,431,891 | $ | 150,117,281 | ||||
| Share Transactions | ||||||||
| Shares sold | 248,274 | 746,447 | ||||||
| Shares issued in reinvestment of distributions | 4,989,932 | — | ||||||
| Shares redeemed | (1,518,529 | ) | (2,268,368 | ) | ||||
| Net increase (decrease) in shares outstanding | 3,719,677 | (1,521,921 | ) | |||||
See accompanying notes which are an integral part of these financial statements.
17
| SMI DYNAMIC ALLOCATION FUND |
| STATEMENTS OF CHANGES IN NET ASSETS |
| For the Six | ||||||||
| Months Ended | For the Year | |||||||
| April 30, 2022 | Ended | |||||||
| (Unaudited) | October 31, 2021 | |||||||
| Increase (Decrease) in Net Assets due to: | ||||||||
| Operations | ||||||||
| Net investment income | $ | 222,853 | $ | 928,910 | ||||
| Long term capital gain dividends from investment companies | 76,168 | 847,386 | ||||||
| Net realized gain on investment securities transactions | 4,202,204 | 7,158,116 | ||||||
| Net increase from payments by Adviser for investments losses | — | 225,012 | ||||||
| Net change in unrealized appreciation (depreciation) of investment securities | (13,562,068 | ) | 10,095,688 | |||||
| Net increase (decrease) in net assets resulting from operations | (9,060,843 | ) | 19,255,112 | |||||
| Distributions to Shareholders from Earnings (Note 2) | (8,760,391 | ) | (5,973,351 | ) | ||||
| Capital Transactions | ||||||||
| Proceeds from shares sold | 4,597,506 | 11,324,062 | ||||||
| Reinvestment of distributions | 8,579,627 | 5,901,945 | ||||||
| Amount paid for shares redeemed | (10,108,931 | ) | (23,738,841 | ) | ||||
| Net increase (decrease) in net assets resulting from capital transactions | 3,068,202 | (6,512,834 | ) | |||||
| Total Increase (Decrease) in Net Assets | (14,753,032 | ) | 6,768,927 | |||||
| Net Assets | ||||||||
| Beginning of period | 119,963,659 | 113,194,732 | ||||||
| End of period | $ | 105,210,627 | $ | 119,963,659 | ||||
| Share Transactions | ||||||||
| Shares sold | 363,638 | 871,261 | ||||||
| Shares issued in reinvestment of distributions | 653,437 | 474,433 | ||||||
| Shares redeemed | (789,825 | ) | (1,845,584 | ) | ||||
| Net increase (decrease) in shares outstanding | 227,250 | (499,890 | ) | |||||
See accompanying notes which are an integral part of these financial statements.
18
| SMI MULTI-STRATEGY FUND |
| STATEMENTS OF CHANGES IN NET ASSETS |
| For the Six | ||||||||
| Months Ended | For the Year | |||||||
| April 30, 2022 | Ended | |||||||
| (Unaudited) | October 31, 2021 | |||||||
| Increase (Decrease) in Net Assets due to: | ||||||||
| Operations | ||||||||
| Net investment income | $ | 1,303,082 | $ | 236,754 | ||||
| Long term capital gain dividends from investment companies | 182,572 | 786,807 | ||||||
| Net realized gain (loss) on investment securities transactions | (1,454,229 | ) | 11,770,129 | |||||
| Net change in unrealized appreciation (depreciation) of investment securities | (4,645,822 | ) | 1,694,676 | |||||
| Net increase (decrease) in net assets resulting from operations | (4,614,397 | ) | 14,488,366 | |||||
| Distributions to Shareholders from Earnings (Note 2) | (10,781,785 | ) | (210,442 | ) | ||||
| Capital Transactions | ||||||||
| Proceeds from shares sold | 3,538,609 | 12,438,096 | ||||||
| Reinvestment of distributions | 10,619,805 | 206,341 | ||||||
| Amount paid for shares redeemed | (6,143,891 | ) | (14,329,246 | ) | ||||
| Net increase (decrease) in net assets resulting from capital transactions | 8,014,523 | (1,684,809 | ) | |||||
| Total Increase (Decrease) in Net Assets | (7,381,659 | ) | 12,593,115 | |||||
| Net Assets | ||||||||
| Beginning of period | 68,884,550 | 56,291,435 | ||||||
| End of period | $ | 61,502,891 | $ | 68,884,550 | ||||
| Share Transactions | ||||||||
| Shares sold | 345,486 | 1,065,535 | ||||||
| Shares issued in reinvestment of distributions | 1,024,089 | 18,293 | ||||||
| Shares redeemed | (575,840 | ) | (1,208,402 | ) | ||||
| Net increase (decrease) in shares outstanding | 793,735 | (124,574 | ) | |||||
See accompanying notes which are an integral part of these financial statements.
19
| SOUND MIND INVESTING FUND |
| FINANCIAL HIGHLIGHTS |
| (For a share outstanding during each period) |
| For the Six | ||||
| Months Ended | ||||
| April 30, | ||||
| 2022 | ||||
| (Unaudited) | ||||
| Selected Per Share Data: | ||||
| Net asset value, beginning of period | $ | 13.66 | ||
| Income from investment operations: | ||||
| Net investment income (loss)(a) | 0.52 | |||
| Net realized and unrealized gain (loss) on investments | (1.21 | ) | ||
| Total from investment operations | (0.69 | ) | ||
| Less distributions to shareholders from: | ||||
| Net investment income | (0.42 | ) | ||
| Net realized gains | (3.89 | ) | ||
| Total distributions | (4.31 | ) | ||
| Paid in capital from redemption fees | — | |||
| Net asset value, end of period | $ | 8.66 | ||
| Total Return(c) | (6.96 | )% (d) | ||
| Ratios and Supplemental Data: | ||||
| Net assets, end of period (000 omitted) | $ | 127,432 | ||
| Ratio of expenses to average net assets(e) | 1.18 | % (f) | ||
| Ratio of expenses to average net assets excluding interest expenses(e) (g) | 1.18 | % (f) | ||
| Ratio of net investment income (loss) to average net assets(a) (e) | 8.67 | % (f) | ||
| Portfolio turnover rate | 164.42 | % (d) | ||
| (a) | Recognition of net investment income by the Fund is affected by the timing of the declaration of dividends by the underlying funds in which the Fund invests. |
| (b) | Rounds to less than $0.005 per share. |
| (c) | Total return in the above table represents the rate that the investor would have earned or lost on an investment in the Fund, assuming reinvestment of distributions. |
| (d) | Not annualized. |
| (e) | These ratios exclude the impact of expenses of the underlying funds in which the Fund invests as represented in the Schedule of Investments. |
| (f) | Annualized. |
| (g) | These ratios do not include the effects of line of credit interest expense and borrowing costs. |
See accompanying notes which are an integral part of these financial statements.
20
| SOUND MIND INVESTING FUND |
| FINANCIAL HIGHLIGHTS |
| (For a share outstanding during each period) – (Continued) |
| For the Year | For the Year | For the Year | For the Year | For the Year | ||||||||||||||
| Ended | Ended | Ended | Ended | Ended | ||||||||||||||
| October 31, | October 31, | October 31, | October 31, | October 31, | ||||||||||||||
| 2021 | 2020 | 2019 | 2018 | 2017 | ||||||||||||||
| $ | 9.97 | $ | 9.64 | $ | 11.65 | $ | 12.52 | $ | 10.30 | |||||||||
| (0.02 | ) | (0.04 | ) | 0.05 | 0.04 | (0.05 | ) | |||||||||||
| 3.71 | 0.42 | 0.14 | 0.26 | 2.27 | ||||||||||||||
| 3.69 | 0.38 | 0.19 | 0.30 | 2.22 | ||||||||||||||
| — | (0.05 | ) | (0.05 | ) | — | — | ||||||||||||
| — | — | (2.15 | ) | (1.17 | ) | — | ||||||||||||
| — | (0.05 | ) | (2.20 | ) | (1.17 | ) | — | |||||||||||
| — | — | — | — | — | (b) | |||||||||||||
| $ | 13.66 | $ | 9.97 | $ | 9.64 | $ | 11.65 | $ | 12.52 | |||||||||
| 37.01 | % | 3.92 | % | 4.28 | % | 2.36 | % | 21.55 | % | |||||||||
| $ | 150,117 | $ | 124,775 | $ | 147,650 | $ | 174,473 | $ | 196,564 | |||||||||
| 1.17 | % | 1.20 | % | 1.18 | % | 1.16 | % | 1.15 | % | |||||||||
| 1.16 | % | 1.20 | % | 1.17 | % | 1.16 | % | 1.15 | % | |||||||||
| (0.09 | )% | (0.38 | )% | 0.45 | % | 0.34 | % | (0.41 | )% | |||||||||
| 300.02 | % | 214.07 | % | 192.77 | % | 163.54 | % | 176.40 | % | |||||||||
See accompanying notes which are an integral part of these financial statements.
21
| SMI DYNAMIC ALLOCATION FUND |
| FINANCIAL HIGHLIGHTS |
| (For a share outstanding during each period) |
| For the Six | ||||
| Months Ended | ||||
| April 30, | ||||
| 2022 | ||||
| (Unaudited) | ||||
| Selected Per Share Data: | ||||
| Net asset value, beginning of period | $ | 13.97 | ||
| Income from investment operations: | ||||
| Net investment income(a) | 0.03 | |||
| Net realized and unrealized gain (loss) on investments | (1.03 | ) | ||
| Total from investment operations | (1.00 | ) | ||
| Less distributions to shareholders from: | ||||
| Net investment income | (0.06 | ) | ||
| Net realized gains | (0.98 | ) | ||
| Total distributions | (1.04 | ) | ||
| Paid in capital from redemption fees | — | |||
| Net asset value, end of period | $ | 11.93 | ||
| Total Return(c) | (7.85 | )% (d) | ||
| Ratios and Supplemental Data: | ||||
| Net assets, end of period (000 omitted) | $ | 105,211 | ||
| Ratio of expenses to average net assets(e) | 1.18 | % (f) | ||
| Ratio of expenses to average net assets excluding interest expenses(e) (g) | 1.18 | % (f) | ||
| Ratio of net investment income to average net assets(a) (e) | 0.40 | % (f) | ||
| Portfolio turnover rate | 196.39 | % (d) | ||
| (a) | Recognition of net investment income by the Fund is affected by the timing of the declaration of dividends by the underlying funds in which the Fund invests. |
| (b) | Rounds to less than $0.005 per share. |
| (c) | Total return in the above table represents the rate that the investor would have earned or lost on an investment in the Fund, assuming reinvestment of distributions. |
| (d) | Not annualized. |
| (e) | These ratios exclude the impact of expenses of the underlying funds in which the Fund invests as represented in the Schedule of Investments. |
| (f) | Annualized. |
| (g) | These ratios do not include the effects of line of credit interest expense and borrowing costs. |
See accompanying notes which are an integral part of these financial statements.
22
| SMI DYNAMIC ALLOCATION FUND |
| FINANCIAL HIGHLIGHTS |
| (For a share outstanding during each period) – (Continued) |
| For the Year | For the Year | For the Year | For the Year | For the Year | ||||||||||||||
| Ended | Ended | Ended | Ended | Ended | ||||||||||||||
| October 31, | October 31, | October 31, | October 31, | October 31, | ||||||||||||||
| 2021 | 2020 | 2019 | 2018 | 2017 | ||||||||||||||
| $ | 12.45 | $ | 12.17 | $ | 11.66 | $ | 11.75 | $ | 10.92 | |||||||||
| 0.10 | 0.06 | 0.12 | 0.18 | 0.07 | ||||||||||||||
| 2.08 | 0.37 | 0.56 | (0.16 | ) | 0.79 | |||||||||||||
| 2.18 | 0.43 | 0.68 | 0.02 | 0.86 | ||||||||||||||
| (0.09 | ) | (0.15 | ) | (0.17 | ) | (0.11 | ) | (0.03 | ) | |||||||||
| (0.57 | ) | — | — | — | — | |||||||||||||
| (0.66 | ) | (0.15 | ) | (0.17 | ) | (0.11 | ) | (0.03 | ) | |||||||||
| — | — | — | — | — | (b) | |||||||||||||
| $ | 13.97 | $ | 12.45 | $ | 12.17 | $ | 11.66 | $ | 11.75 | |||||||||
| 18.17 | % | 3.55 | % | 5.97 | % | 0.15 | % | 7.87 | % | |||||||||
| $ | 119,964 | $ | 113,195 | $ | 119,339 | $ | 132,999 | $ | 162,002 | |||||||||
| 1.17 | % | 1.19 | % | 1.18 | % | 1.16 | % | 1.16 | % | |||||||||
| 1.16 | % | 1.19 | % | 1.17 | % | 1.16 | % | 1.15 | % | |||||||||
| 0.80 | % | 0.44 | % | 1.02 | % | 1.45 | % | 0.57 | % | |||||||||
| 175.11 | % | 275.33 | % | 218.06 | % | 61.28 | % | 247.10 | % | |||||||||
See accompanying notes which are an integral part of these financial statements.
23
| SMI MULTI-STRATEGY FUND |
| FINANCIAL HIGHLIGHTS |
| (For a share outstanding during each period) |
| For the Six | ||||
| Months Ended | ||||
| April 30, | ||||
| 2022 | ||||
| (Unaudited) | ||||
| Selected Per Share Data: | ||||
| Net asset value, beginning of period | $ | 12.36 | ||
| Income from investment operations: | ||||
| Net investment income (loss)(b) | 0.24 | |||
| Net realized and unrealized gain (loss) on investments | (0.96 | ) | ||
| Total from investment operations | (0.72 | ) | ||
| Less distributions to shareholders from: | ||||
| Net investment income | (0.25 | ) | ||
| Net realized gains | (1.73 | ) | ||
| Total distributions | (1.98 | ) | ||
| Paid in capital from redemption fees | — | |||
| Net asset value, end of period | $ | 9.66 | ||
| Total Return(e) | (6.93 | )% (f) | ||
| Ratios and Supplemental Data: | ||||
| Net assets, end of period (000 omitted) | $ | 61,503 | ||
| Ratio of expenses to average net assets(g) | 1.15 | % (h) | ||
| Ratio of expenses to average net assets excluding interest expenses(g) (i) | 1.15 | % (h) | ||
| Ratio of expenses to average net assets before waiver and reimbursement(g) | 1.18 | % (h) | ||
| Ratio of net investment income (loss) to average net assets(b) (g) | 4.07 | % (h) | ||
| Portfolio turnover rate | 187.51 | % (f) | ||
| (a) | As described in Note 1 of the Notes to the Financial Statements, the Former 50/40/10 Fund was reorganized into the SMI Conservative Allocation Fund as of the close of business, April 27, 2018 and subsequently renamed. The Fund is the successor to the Former 50/40/10 Fund. The performance and financial information presented incorporates the operations of the Former 50/40/10 Fund, which, is a result of the reorganization, are the Fund’s operations. The per share amounts have been adjusted for a stock split that occurred on April 27, 2018. On February 28, 2022, the SMI 50/40/10 Fund was renamed SMI Multi-Strategy Fund. |
| (b) | Recognition of net investment income by the Fund is affected by the timing of the declaration of dividends by the underlying funds in which the Fund invests. |
| (c) | Per share net investment income has been determined on the basis of average shares outstanding during the year. |
| (d) | Rounds to less than $0.005 per share. |
| (e) | Total return in the above table represents the rate that the investor would have earned or lost on an investment in the Fund, assuming reinvestment of distributions. |
| (f) | Not annualized. |
| (g) | These ratios exclude the impact of expenses of the underlying funds in which the Fund invests as represented in the Schedule of Investments. |
| (h) | Annualized. |
| (i) | These ratios do not include the effects of line of credit interest expense and borrowing costs. |
See accompanying notes which are an integral part of these financial statements.
24
| SMI MULTI-STRATEGY FUND |
| FINANCIAL HIGHLIGHTS |
| (For a share outstanding during each period) – (Continued) |
| For the Year | For the Year | For the Year | For the Year | For the Year | ||||||||||||||
| Ended | Ended | Ended | Ended | Ended | ||||||||||||||
| October 31, | October 31, | October 31, | October 31, | October 31, | ||||||||||||||
| 2021 | 2020 | 2019 | 2018(a) | 2017(a) | ||||||||||||||
| $ | 9.88 | $ | 9.46 | $ | 9.46 | $ | 9.65 | $ | 8.20 | |||||||||
| 0.04 | 0.01 | 0.05 | 0.10 | (c) | (0.01 | ) | ||||||||||||
| 2.48 | 0.45 | 0.26 | (0.04 | ) | 1.49 | |||||||||||||
| 2.52 | 0.46 | 0.31 | 0.06 | 1.48 | ||||||||||||||
| (0.04 | ) | (0.04 | ) | (0.07 | ) | (0.11 | ) | (0.03 | ) | |||||||||
| — | — | (0.24 | ) | (0.14 | ) | — | ||||||||||||
| (0.04 | ) | (0.04 | ) | (0.31 | ) | (0.25 | ) | (0.03 | ) | |||||||||
| — | — | — | — | — | (d) | |||||||||||||
| $ | 12.36 | $ | 9.88 | $ | 9.46 | $ | 9.46 | $ | 9.65 | |||||||||
| 25.51 | % | 4.91 | % | 3.55 | % | 0.36 | % | 17.99 | % | |||||||||
| $ | 68,885 | $ | 56,291 | $ | 62,614 | $ | 66,305 | $ | 22,007 | |||||||||
| 1.16 | % | 1.16 | % | 1.15 | % | 1.24 | % | 1.46 | % | |||||||||
| 1.15 | % | 1.15 | % | 1.15 | % | 1.23 | % | 1.45 | % | |||||||||
| 1.14 | % | 1.19 | % | 1.21 | % | 1.39 | % | 1.56 | % | |||||||||
| 0.35 | % | 0.09 | % | 0.53 | % | 1.03 | % | (0.17 | )% | |||||||||
| 231.35 | % | 252.74 | % | 225.42 | % | 155.28 | % | 212.36 | % | |||||||||
See accompanying notes which are an integral part of these financial statements.
25
| SMI FUNDS |
| NOTES TO THE FINANCIAL STATEMENTS |
| April 30, 2022 (Unaudited) |
NOTE 1. ORGANIZATION
The Sound Mind Investing Fund (“SMI Fund”), SMI Dynamic Allocation Fund and SMI Multi-Strategy Fund (each a “Fund” and collectively, the “Funds”) are each registered under the Investment Company Act of 1940, as amended (“1940 Act”), as a diversified series of Valued Advisers Trust (the “Trust”). The Trust is a management investment company established under the laws of Delaware by an Agreement and Declaration of Trust dated June 13, 2008 (the “Trust Agreement”). The Trust Agreement permits the Board of Trustees (the “Board” or the “Trustees”) to issue an unlimited number of shares of beneficial interest of separate series without par value. Each Fund is one of a series of funds currently authorized by the Trustees. The investment adviser to the Funds is SMI Advisory Services, LLC (the “Adviser”). The SMI Fund seeks to provide long-term capital appreciation. The SMI Dynamic Allocation Fund and SMI Multi-Strategy Fund seek total return. Total return is composed of both income and capital appreciation.
Each of the Funds is a “fund-of-funds” in which each Fund may invest in other investment companies, including exchange-traded and closed-end funds. For a discussion on the strategies employed by each of the Funds, please refer to pages 6-8 of this report.
On February 28, 2022, the SMI 50/40/10 Fund was renamed the SMI Multi-Strategy Fund. At the close of business on April 27, 2018, the SMI Conservative Allocation Fund was renamed the SMI 50/40/10 Fund and acquired all of the assets and assumed all of the liabilities of the previous SMI 50/40/10 Fund (the “Former 50/40/10 Fund”), pursuant to an agreement and plan of reorganization approved by the Board on December 12, 2017. The reorganization qualified as a tax-free reorganization for federal income tax purposes with no gain or loss recognized to the Funds or their shareholders. The SMI 50/40/10 is considered the surviving entity for tax purposes.
Due to the reorganization on April 27, 2018, the number of outstanding shares of the Former 50/40/10 Fund increased by a factor of 1.132099; and since the Former 50/40/10 Fund’s total number of shares outstanding increased, the net asset value decreased. The reorganization did not affect the value of the Former 50/40/10 Fund’s net assets or each shareholder’s proportional ownership interest in those assets. The per share data presented in the Financial Highlights have been adjusted for periods prior to April 27, 2018 as a result.
NOTE 2. SIGNIFICANT ACCOUNTING POLICIES
The Funds are investment companies and follow accounting and reporting guidance under Financial Accounting Standards Board Accounting Standards Codification (“ASC”) Topic 946, “Financial Services-Investment Companies” including Accounting Standards Update 2013-08. The following is a summary of significant accounting policies followed by the Funds in the preparation of their financial statements. These policies are in conformity with generally accepted accounting principles in the United States of America (“GAAP”).
Estimates – The preparation of financial statements in conformity with GAAP requires management to make estimates and assumptions that affect the reported amounts of assets and liabilities and disclosure of contingent assets and liabilities at the date of the financial statements and the reported amounts of increases and decreases in net assets from operations during the reporting period. Actual results could differ from those estimates.
26
| SMI FUNDS |
| NOTES TO THE FINANCIAL STATEMENTS |
| April 30, 2022 (Unaudited) – (Continued) |
NOTE 2. SIGNIFICANT ACCOUNTING POLICIES – (Continued)
Federal Income Taxes – The Funds make no provision for federal income or excise tax. Each Fund has qualified and intends to qualify each year as a regulated investment company (“RIC”) under subchapter M of the Internal Revenue Code of 1986, as amended, by complying with the requirements applicable to RICs and by distributing substantially all of its taxable income. Each Fund also intends to distribute sufficient net investment income and net capital gains, if any, so that it will not be subject to excise tax on undistributed income and gains. If the required amount of net investment income or gains is not distributed, the Funds could incur a tax expense.
As of and during the six months ended April 30, 2022, the Funds did not have any liabilities for any unrecognized tax benefits. The Funds recognize interest and penalties, if any, related to unrecognized tax benefits as income tax expense on the Statements of Operations when incurred. During the six months ended April 30, 2022, the Funds did not incur any interest or penalties. Management of the Funds has reviewed tax positions taken in tax years that remain subject to examination by all major tax jurisdictions, including federal (i.e., the last three tax year ends and the interim tax period since then, as applicable). Management believes that there is no tax liability resulting from unrecognized tax benefits related to uncertain tax positions taken.
Expenses – Expenses incurred by the Trust that do not relate to a specific fund of the Trust are allocated to the individual funds based on each fund’s relative net assets or another appropriate basis (as determined by the Board).
Security Transactions and Related Income – The Funds follow industry practice and record security transactions on the trade date for financial reporting purposes. The specific identification method is used for determining gains or losses for financial statement and income tax purposes. Dividend income and long-term capital gains dividends from investment companies are recorded on the ex-dividend date and interest income is recorded on an accrual basis. Discounts and premiums on securities purchased are accreted or amortized using the effective interest method, if applicable. Withholding taxes on foreign dividends, if any, have been provided for in accordance with the Funds’ understanding of the applicable country’s tax rules and rates.
Dividends and Distributions – Each Fund intends to distribute its net investment income and net realized long-term and short-term capital gains, if any, at least annually. Dividends and distributions to shareholders, which are determined in accordance with income tax regulations, are recorded on the ex-dividend date. The treatment for financial reporting purposes of distributions made to shareholders during the period from net investment income or net realized capital gains may differ from their ultimate treatment for federal income tax purposes. These differences are caused primarily by differences in the timing of the recognition of certain components of income, expense or realized capital gain for federal income tax purposes. Where such differences are permanent in nature, they are reclassified among the components of the net assets based on their ultimate characterization for federal income tax purposes. Any such reclassifications will have no effect on net assets, results of operations or NAV per share of the Funds.
27
| SMI FUNDS |
| NOTES TO THE FINANCIAL STATEMENTS |
| April 30, 2022 (Unaudited) – (Continued) |
NOTE 2. SIGNIFICANT ACCOUNTING POLICIES – (Continued)
Share Valuation – The NAV of each Fund is calculated each day the New York Stock Exchange (the “NYSE”) is open by dividing the total value of each Fund’s assets, less liabilities, by the number of shares outstanding for each Fund.
NOTE 3. SECURITIES VALUATION AND FAIR VALUE MEASUREMENTS
Each Fund values its portfolio securities at fair value as of the close of regular trading on the NYSE (normally 4:00 p.m. Eastern time) on each business day the NYSE is open for business. Fair value is defined as the price that a Fund would receive upon selling an investment in a timely transaction to an independent buyer in the principal or most advantageous market of the investment. GAAP establishes a three-tier hierarchy to maximize the use of observable market data and minimize the use of unobservable inputs and to establish classification of fair value measurements for disclosure purposes.
Inputs refer broadly to the assumptions that market participants would use in pricing the asset or liability, including assumptions about risk (the risk inherent in a particular valuation technique used to measure fair value including a pricing model and/or the risk inherent in the inputs to the valuation technique). Inputs may be observable or unobservable. Observable inputs are inputs that reflect the assumptions market participants would use in pricing the asset or liability developed based on market data obtained and available from sources independent of the reporting entity. Unobservable inputs are inputs that reflect the reporting entity’s own assumptions about the assumptions market participants would use in pricing the asset or liability developed based on the best information available in the circumstances.
Various inputs are used in determining the value of each Fund’s investments. These inputs are summarized in the three broad levels listed below.
| ● | Level 1 – unadjusted quoted prices in active markets for identical investments and/or registered investment companies where the value per share is determined and published and is the basis for current transactions for identical assets or liabilities at the valuation date |
| ● | Level 2 – other significant observable inputs (including, but not limited to, quoted prices for an identical security in an inactive market, quoted prices for similar securities, interest rates, prepayment speeds, credit risk, etc.) |
| ● | Level 3 – significant unobservable inputs (including the Funds’ own assumptions in determining fair value of investments based on the best information available) |
The inputs used to measure fair value may fall into different levels of the fair value hierarchy. In such cases, for disclosure purposes, the level in the fair value hierarchy which is reported is determined based on the lowest level input that is significant to the fair value measurement in its entirety.
28
| SMI FUNDS |
| NOTES TO THE FINANCIAL STATEMENTS |
| April 30, 2022 (Unaudited) – (Continued) |
NOTE 3. SECURITIES VALUATION AND FAIR VALUE MEASUREMENTS – (Continued)
Equity securities, including ETFs and closed-end funds, that are traded on any stock exchange are generally valued at the last quoted sale price on the security’s primary exchange. Lacking a last sale price, an exchange-traded security is generally valued at its last bid price. Securities traded in the NASDAQ over-the-counter market are generally valued at the NASDAQ Official Closing Price. When using the market quotations and when the market is considered active, the security is classified as a Level 1 security. In the event that market quotations are not readily available or are considered unreliable due to market or other events, a Fund values its securities and other assets at fair value in accordance with policies established by and under the general supervision of the Board. Under these policies, the securities will be classified as Level 2 or 3 within the fair value hierarchy, depending on the inputs used.
Investments in mutual funds, including money market mutual funds, are generally priced at the ending NAV. These securities are categorized as Level 1 securities. In the event that the ending NAV for a mutual fund is unavailable at the end of day pricing time, the Adviser may, in accordance with the Trust’s valuation policies, consider all appropriate factors in determining the fair value of the mutual fund. In such cases the security will generally be categorized as a Level 2 security.
In accordance with the Trust’s valuation policies, the Adviser is required to consider all appropriate factors relevant to the value of securities for which it has determined other pricing sources are not available or reliable as described above. No single method exists for determining fair value, because fair value depends upon the circumstances of each individual case. As a general principle, the current fair value of a security being valued by the Adviser would be the amount that the Funds might reasonably expect to receive upon the current sale. Methods that are in accordance with this principle may, for example, be based on (i) a multiple of earnings; (ii) a discount from market prices of a similar freely traded security (including a derivative security or a basket of securities traded on other markets, exchanges or among dealers); or (iii) yield to maturity with respect to debt issues, or a combination of these and other methods. Fair-value pricing is permitted if, in the Adviser’s opinion, the validity of market quotations appears to be questionable based on factors such as evidence of a thin market in the security based on a small number of quotations, a significant event occurs after the close of a market but before a Fund’s NAV calculation that may affect a security’s value, or the Adviser is aware of any other data that calls into question the reliability of market quotations.
The following is a summary of the inputs used to value the Funds’ investments as of April 30, 2022:
| Valuation Inputs | ||||||||||||||||
| SMI Fund | Level 1 | Level 2 | Level 3 | Total | ||||||||||||
| Exchange-Traded Funds | $ | 73,737,467 | $ | — | $ | — | $ | 73,737,467 | ||||||||
| Mutual Funds | 28,703,537 | — | — | 28,703,537 | ||||||||||||
| Money Market Funds | 25,231,054 | — | — | 25,231,054 | ||||||||||||
| Total | $ | 127,672,058 | $ | — | $ | — | $ | 127,672,058 | ||||||||
29
| SMI FUNDS |
| NOTES TO THE FINANCIAL STATEMENTS |
| April 30, 2022 (Unaudited) – (Continued) |
NOTE 3. SECURITIES VALUATION AND FAIR VALUE MEASUREMENTS – (Continued)
| Valuation Inputs | ||||||||||||||||
| SMI Dynamic Allocation Fund | Level 1 | Level 2 | Level 3 | Total | ||||||||||||
| Exchange-Traded Funds | $ | 78,772,911 | $ | — | $ | — | $ | 78,772,911 | ||||||||
| Closed End Funds | 25,666,963 | — | — | 25,666,963 | ||||||||||||
| Money Market Funds | 1,028,025 | — | — | 1,028,025 | ||||||||||||
| Total | $ | 105,467,899 | $ | — | $ | — | $ | 105,467,899 | ||||||||
| Valuation Inputs | ||||||||||||||||
| SMI Multi-Strategy Fund | Level 1 | Level 2 | Level 3 | Total | ||||||||||||
| Exchange-Traded Funds | $ | 39,914,446 | — | — | $ | 39,914,446 | ||||||||||
| Closed End Funds | 9,991,757 | — | — | 9,991,757 | ||||||||||||
| Mutual Funds | 6,435,305 | — | — | 6,435,305 | ||||||||||||
| Money Market Funds | 5,202,219 | — | — | 5,202,219 | ||||||||||||
| Total | $ | 61,543,727 | $ | — | $ | — | $ | 61,543,727 | ||||||||
The Funds did not hold any investments at the end of the reporting period for which significant unobservable inputs (Level 3) were used in determining fair value; therefore, no reconciliation of Level 3 securities is included for this reporting period.
NOTE 4. FEES AND OTHER TRANSACTIONS WITH AFFILIATES
Under the terms of the investment advisory agreement with respect to each Fund (the “Advisory Agreements”), the Adviser is responsible for managing each Fund’s investments. As compensation for its management services, each Fund is obligated to pay the Adviser a fee based on the Fund’s average daily net assets as follows:
| SMI | ||||||
| SMI Dynamic | Multi-Strategy | |||||
| SMI Fund | Allocation Fund | Fund | ||||
| Fund Assets | Management Fee | Management Fee | Management Fee | |||
| $1 – $100 million | 1.00% | 1.00% | 0.90% | |||
| $100,000,001 – $250 million | 1.00% | 1.00% | 0.80% | |||
| $250,000,001 to $500 million | 0.90% | 0.90% | 0.70% | |||
| Over $500 million | 0.80% | 0.80% | 0.60% |
30
| SMI FUNDS |
| NOTES TO THE FINANCIAL STATEMENTS |
| April 30, 2022 (Unaudited) – (Continued) |
NOTE 4. FEES AND OTHER TRANSACTIONS WITH AFFILIATES – (Continued)
For the six months ended April 30, 2022, fees earned and waived by the Adviser and amounts due to the Adviser at April 30, 2022 were as follows:
| SMI | ||||||||||||
| SMI Dynamic | Multi-Strategy | |||||||||||
| SMI Fund | Allocation Fund | Fund | ||||||||||
| Management Fee | Management Fee | Management Fee | ||||||||||
| Management fees earned | $ | 682,301 | $ | 561,094 | $ | 288,041 | ||||||
| Fees waived by Adviser | — | — | (8,189 | ) | ||||||||
| Payable to Adviser | 109,284 | 89,658 | 45,216 | |||||||||
The Adviser contractually has agreed to waive its management fee and/or reimburse certain operating expenses, but only to the extent necessary so that each Fund’s total annual operating expenses (excluding interest, taxes, brokerage commissions, other expenses which are capitalized in accordance with GAAP, extraordinary expenses, dividend expense on short sales, 12b-1 fees, and acquired fund fees and expenses) do not exceed 1.50% of the Fund’s average daily net assets with respect to the SMI Fund, 1.45% with respect to the SMI Dynamic Allocation Fund, and 1.15% with respect to the SMI Multi-Strategy Fund. The contractual arrangement for each Fund is in place through February 28, 2023.
Each fee waiver or expense reimbursement by the Adviser is subject to repayment by the applicable Fund within the three years following the date in which the fee waiver or expense reimbursement occurred, provided that the Fund is able to make the repayment without exceeding the expense limitation in effect at the time of the fee waiver or expense reimbursement and the expense limitation at the time of the repayment.
As of April 30, 2022, the Adviser may seek repayment of investment advisory fee waivers and expense reimbursements from the SMI Multi-Strategy Fund as follows:
| Recoverable through | Amount | |||
| October 31, 2022 | $ | 16,878 | ||
| October 31, 2023 | 18,349 | |||
| April 30, 2025 | 8,189 | |||
On December 31, 2020, the Adviser purchased shares in the Invesco DB Gold Fund and the Sprott Physical Gold Trust (the “Securities”) for the SMI Dynamic Allocation Fund. Because the Fund’s positions in those Securities each represented more than 5% of Fund’s total assets, and together exceeded 25% of the Fund’s total assets, the Fund breached the SEC diversification limit set forth in Section 5(b)(1) of the 1940 Act. Consequently, the purchases of the Securities caused the Fund to become “non-diversified,” contrary to the representation in the Fund’s prospectus. In order to correct the compliance violation, the Fund sold sufficient Securities to bring the aggregate of issuers representing greater than 5% of the Fund’s total assets to below the
31
| SMI FUNDS |
| NOTES TO THE FINANCIAL STATEMENTS |
| April 30, 2022 (Unaudited) – (Continued) |
NOTE 4. FEES AND OTHER TRANSACTIONS WITH AFFILIATES – (Continued)
25% threshold. This caused a realized shareholder loss of $225,012, which was subsequently reimbursed to the Fund by the Adviser and reflected on the Statements of Operations. This impacted the Fund’s total return for the year by 0.22%.
The Trust retains Ultimus Fund Solutions, LLC (“Ultimus” or “Administrator”), to provide the Funds with administration, compliance (including a chief compliance officer), fund accounting, and transfer agent services, including all regulatory reporting. Expenses incurred by the Funds for these services are allocated to the individual Funds based on each Fund’s relative net assets.
The officers and one trustee of the Trust are members of management and/or employees of the Administrator and are not paid by the Trust for services to the Funds. Ultimus Fund Distributors, LLC (the “Distributor”), a wholly-owned subsidiary of Ultimus, acts as the distributor of the Funds’ shares. There were no payments made to the Distributor by the Funds for the six months ended April 30, 2022.
For the six months ended April 30, 2022, fees for administration, compliance, fund accounting, and transfer agent services, and amounts due to the Administrator at April 30, 2022 were as follows:
| SMI | ||||||||||||
| SMI Dynamic | Multi-Strategy | |||||||||||
| SMI Fund | Allocation Fund | Fund | ||||||||||
| Administration | $ | 19,827 | $ | 16,240 | $ | 9,249 | ||||||
| Compliance service | 4,016 | 4,016 | 4,016 | |||||||||
| Fund accounting | 10,419 | 8,533 | 4,860 | |||||||||
| Transfer agent | 11,469 | 4,978 | 5,151 | |||||||||
| Payable to Administrator | 7,485 | 5,433 | 3,735 | |||||||||
NOTE 5. PURCHASES AND SALES OF SECURITIES
For the six months ended April 30, 2022, purchases and sales of investment securities, other than short-term investments were as follows:
| SMI | ||||||||||||
| SMI Dynamic | Multi-Strategy | |||||||||||
| SMI Fund | Allocation Fund | Fund | ||||||||||
| Purchases | $ | 216,176,045 | $ | 216,129,183 | $ | 115,187,404 | ||||||
| Sales | $ | 245,834,394 | $ | 221,757,250 | $ | 121,157,326 | ||||||
There were no purchases or sales of long-term U.S. government obligations during the six months ended April 30, 2022.
32
| SMI FUNDS |
| NOTES TO THE FINANCIAL STATEMENTS |
| April 30, 2022 (Unaudited) – (Continued) |
NOTE 6. LINE OF CREDIT
During the six months ended April 30, 2022, the Trust, on behalf of the Funds, entered into in a short-term credit agreement (“Line of Credit”) with Huntington National Bank (“Huntington”), expiring on January 20, 2023. Under the terms of the agreement, each of the Funds may borrow up to the lesser of 10% of a Fund’s daily market value or $5 million at an interest rate equal to the Secured Overnight Financing Rate (“SOFR”) plus 161.50 basis points (if SOFR is less than 0.385%, such rate shall be deemed to be 0.385%), 2.00% as of April 30, 2022. The purpose of the agreement is to meet temporary or emergency cash needs, including redemption requests that might otherwise require the untimely disposition of securities. Huntington receives an annual facility fee of 0.125% on $5 million as well as an additional annual fee of 0.125% on any unused portion of the credit facility, invoiced quarterly, for providing the Line of Credit. The Funds will not borrow money, except (a) from a bank, provided that immediately after such borrowing there is an asset coverage of 300% for all borrowings of a Fund; or (b) from a bank or other persons for temporary purposes only, provided that such temporary borrowings are in an amount not exceeding 5% of a Fund’s total assets at the time when the borrowing is made. To the extent that the line of credit is utilized, it will be collateralized by securities in the Funds’ portfolios.
As of April 30, 2022, the Funds had no outstanding borrowings under this Line of Credit.
| Weighted | |||||||||||||||||||
| Average | Average | Interest | Maximum | ||||||||||||||||
| Daily Loan | Interest | Number of Days | Expense | Loan | |||||||||||||||
| Fund | Balance(a) | Rate(a) | Outstanding(b) | Accrued | Outstanding | ||||||||||||||
| SMI Fund | $ | 255,495 | 2.00% | 10 | $ | 142 | $ | 350,000 | |||||||||||
| SMI Dynamic Allocation Fund | 382,477 | 2.00% | 14 | 298 | 3,400,000 | ||||||||||||||
| SMI Multi-Strategy Fund | 132,000 | 2.00% | 5 | 37 | 310,000 | ||||||||||||||
| (a) | Averages based on the number of days outstanding. |
| (b) | Number of Days Outstanding represents the total days during the six months ended April 30, 2022, that a Fund utilized the Line of Credit. |
33
| SMI FUNDS |
| NOTES TO THE FINANCIAL STATEMENTS |
| April 30, 2022 (Unaudited) – (Continued) |
NOTE 7. FEDERAL TAX INFORMATION
At April 30, 2022, the net unrealized appreciation (depreciation) and tax cost of investments for tax purposes was as follows:
| SMI | ||||||||||||
| SMI Dynamic | Multi-Strategy | |||||||||||
| SMI Fund | Allocation Fund | Fund | ||||||||||
| Gross unrealized appreciation | $ | 5,545,939 | $ | 4,549,797 | $ | 2,951,148 | ||||||
| Gross unrealized depreciation | (2,220,952 | ) | (170,752 | ) | (439,892 | ) | ||||||
| Net unrealized appreciation/(depreciation) on investments | $ | 3,324,987 | $ | 4,379,045 | $ | 2,511,256 | ||||||
| Tax cost of investments | $ | 124,347,071 | $ | 101,088,854 | $ | 59,032,471 | ||||||
At April 30, 2022, the difference between book basis and tax basis unrealized appreciation (depreciation) is attributable to the tax deferral of losses on wash sales
The tax character of distributions for the fiscal year ended October 31, 2021, the Funds’ most recent fiscal year end, were as follows:
| SMI | ||||||||||||
| SMI Dynamic | Multi-Strategy | |||||||||||
| SMI Fund | Allocation Fund | Fund | ||||||||||
| Distributions paid from: | ||||||||||||
| Ordinary income(a) | $ | — | $ | 2,123,182 | $ | 210,442 | ||||||
| Long-term capital gains | — | 3,850,169 | — | |||||||||
| Total taxable distributions paid | $ | — | $ | 5,973,351 | $ | 210,442 | ||||||
| (a) | Short-term capital gain distributions are treated as ordinary income for tax purposes. |
At October 31, 2021, the components of distributable earnings (accumulated losses) on a tax basis was as follows:
| SMI | ||||||||||||
| SMI Dynamic | Multi-Strategy | |||||||||||
| SMI Fund | Allocation Fund | Fund | ||||||||||
| Undistributed ordinary income | $ | 22,006,997 | $ | 5,419,264 | $ | 5,525,306 | ||||||
| Undistributed long-term capital gains | 19,416,250 | 3,024,792 | 3,904,390 | |||||||||
| Unrealized appreciation on investments | 8,918,020 | 17,941,113 | 7,157,078 | |||||||||
| Total accumulated earnings | $ | 50,341,267 | $ | 26,385,169 | $ | 16,586,774 | ||||||
34
| SMI FUNDS |
| NOTES TO THE FINANCIAL STATEMENTS |
| April 30, 2022 (Unaudited) – (Continued) |
NOTE 7. FEDERAL TAX INFORMATION – (Continued)
Capital loss carryforwards are available to offset future realized capital gains and thereby reduce further taxable gain distributions. During the fiscal year ended October 31, 2021, the SMI Fund and SMI Multi-Strategy Fund utilized $11,557,011 and $2,939,547, respectively of their capital loss carryforwards.
NOTE 8. INVESTMENT IN OTHER INVESTMENT COMPANIES
Each Fund may invest a significant portion of its assets in shares of one or more investment companies, including ETFs, open-end and closed-end mutual funds and money market mutual funds. Each Fund will incur additional indirect expenses (acquired fund fees and expenses) to the extent it invests in shares of other investment companies. As of April 30, 2022, the SMI Fund had 57.87% and 22.52% of the value of its net assets invested in ETFs and open-end mutual funds, respectively. As of April 30, 2022, the SMI Dynamic Allocation Fund had 74.86% and 24.40% of the value of its net assets invested in ETFs and closed end funds, respectively. As of April 30, 2022, the SMI Multi-Strategy Fund had 64.90%, 16.25% and 10.46% of the value of its net assets invested in ETFs, closed end funds and open-end mutual funds, respectively. The financial statements of these ETFs and open-end and closed-end mutual funds can be found at www.sec.gov.
NOTE 9. COMMITMENTS AND CONTIGENCIES
The Trust indemnifies its officers and Trustees for certain liabilities that may arise from their performance of their duties to the Trust or the Funds. Additionally, in the normal course of business, the Trust enters into contracts that contain a variety of representations and warranties which provide general indemnifications. The Trust’s maximum exposure under these arrangements is unknown, as this would involve future claims that may be made against the Trust that have not yet occurred.
NOTE 10. SUBSEQUENT EVENTS
Management of the Funds has evaluated the need for disclosures and/or adjustments resulting from subsequent events through the date at which these financial statements were issued. Based upon this evaluation, management has determined there were no items requiring adjustment of the financial statements or additional disclosure.
35
| SUMMARY OF FUND EXPENSES – (Unaudited) |
As a shareholder of a Fund, you incur two types of costs: (1) transaction costs and (2) ongoing costs, including management fees and other Fund expenses. These examples are intended to help you understand your ongoing costs (in dollars) of investing in each Fund and to compare these costs with the ongoing costs of investing in other funds. You may pay brokerage commissions on purchases and sales of exchange-traded fund shares, which are not reflected in the example. Each Fund’s example is based on an investment of $1,000 invested at the beginning of the period and held for the entire period from November 1, 2021 through April 30, 2022.
Actual Expenses
The first line of the table below provides information about actual account values and actual expenses. You may use the information in this line, together with the amount you invested, to estimate the expenses that you paid over the period. Simply divide your account value by $1,000 (for example, an $8,600 account value divided by $1,000 = 8.6), then multiply the result by the number in the first line under the heading “Expenses Paid During Period” to estimate the expenses you paid on your account during this period.
Hypothetical Example for Comparison Purposes
The second line of the table below provides information about hypothetical account values and hypothetical expenses based on the Fund’s actual expense ratio and an assumed rate of return of 5% per year before expenses, which is not the Fund’s actual return. The hypothetical account values and expenses may not be used to estimate the actual ending account balance or expenses you paid for the period. You may use this information to compare the ongoing costs of investing in the Fund and other funds. To do so, compare this 5% hypothetical example with the 5% hypothetical examples that appear in the shareholder reports of other funds.
Expenses shown in the table are meant to highlight your ongoing costs only and do not reflect any transactional costs. Therefore, the second line of the table below is useful in comparing ongoing costs only and will not help you determine the relative costs of owning different funds. In addition, if transaction costs were included, your costs would have been higher.
36
| SUMMARY OF FUND EXPENSES – (Unaudited), (Continued) |
| Beginning | Ending | |||||||||
| Account Value | Account Value | Expenses Paid | Annualized | |||||||
| November 1, 2021 | April 30, 2022 | During Period(a) | Expense Ratio | |||||||
| SMI FUND | ||||||||||
| Actual | $1,000.00 | $ 930.40 | $5.65 | 1.18% | ||||||
| Hypothetical(b) | $1,000.00 | $1,018.94 | $5.91 | 1.18% | ||||||
| SMI DYNAMIC ALLOCATION FUND | ||||||||||
| Actual | $1,000.00 | $ 921.50 | $5.62 | 1.18% | ||||||
| Hypothetical(b) | $1,000.00 | $1,018.94 | $5.91 | 1.18% | ||||||
| SMI MULTI-STRATEGY FUND | ||||||||||
| Actual | $1,000.00 | $ 930.70 | $5.51 | 1.15% | ||||||
| Hypothetical(b) | $1,000.00 | $1,019.09 | $5.76 | 1.15% |
| (a) | Expenses are equal to the Fund’s annualized expense ratios, multiplied by the average account value over the period, multiplied by 184/365 (to reflect the one-half year period). |
| (b) | Hypothetical assumes 5% annual return before expenses. |
37
| INVESTMENT ADVISORY AGREEMENT APPROVAL |
| (Unaudited) |
At a meeting held on December 2-3, 2021, the Board of Trustees (the “Board”) considered the renewal of the Investment Advisory Agreements (the “SMI Agreements”) between Valued Advisers Trust (the “Trust”) and SMI Advisory Services, LLC (“SMI”) with respect to the Sound Mind Investing Fund, the SMI Dynamic Allocation Fund, and the SMI 50/40/10 Fund (the “SMI Funds”). SMI provided written information to the Board to assist the Board in its considerations.
Counsel reminded the Trustees of their fiduciary duties and responsibilities as summarized in a memorandum from his firm, including the factors to be considered, and the application of those factors to SMI and the SMI Agreements. In assessing the factors and reaching its decision, the Board took into consideration information furnished by SMI and the Trust’s other service providers for the Board’s review and consideration throughout the year, as well as information specifically prepared or presented in connection with the annual renewal process, including information presented at this Meeting: (i) reports regarding the services and support provided to the SMI Funds by SMI; (ii) quarterly assessments of the investment performance of the SMI Funds by personnel of SMI; (iii) commentary on the reasons for the SMI Funds’ performance; (iv) presentations by SMI addressing its investment philosophy, investment strategy, personnel, and operations; (v) compliance and audit reports concerning the SMI Funds and SMI; (vi) disclosure information contained in the Trust’s registration statement and SMI’s Form ADV; and (vii) a memorandum from counsel, that summarized the fiduciary duties and responsibilities of the Board in reviewing and approving the SMI Agreements. The Board also requested and received various informational materials including, without limitation: (a) documents containing information about SMI, including its financial information, a description of personnel and the services it provides to the SMI Funds; information on SMI’s investment advice and performance; summaries of the SMI Funds’ expenses, compliance program, current legal matters, and other general information; (b) comparative expense and performance information for other mutual funds with strategies similar to the SMI Funds; and (c) the benefits to be realized by SMI from its relationship with the SMI Funds. The Board did not identify any particular information that was most relevant to its consideration of the SMI Agreements and each Trustee may have afforded different weight to the various factors.
| 1. | The nature, extent, and quality of the services to be provided by SMI. In this regard, the Board considered SMI’s responsibilities under the SMI Agreements. The Trustees considered the services being provided by SMI to the SMI Funds, including, without limitation: the quality of its investment advisory services (including research and recommendations with respect to portfolio securities), its process for formulating investment recommendations and assuring compliance with the investment objectives and limitations, its coordination of services for the SMI Funds among the service providers to the SMI Funds and its efforts to promote the SMI Funds and grow their assets. The Trustees considered SMI’s continuity of, and commitment to retain, qualified personnel and SMI’s commitment to maintain and enhance its resources and systems. The Trustees considered SMI’s personnel, including the education and experience of SMI’s personnel. After considering the foregoing information and further information in the Meeting materials provided by SMI (including SMI’s Form ADV), the Board concluded that, in light of all the facts and circumstances, the nature, extent, and quality of the services provided by SMI were satisfactory and adequate for the SMI Funds. |
38
| INVESTMENT ADVISORY AGREEMENT APPROVAL |
| (Unaudited), (Continued) |
| 2. | Investment Performance of the SMI Funds and SMI. In considering the investment performance of the SMI Funds and SMI, the Trustees compared the performance of the SMI Funds with the performance of funds in the same Morningstar category, as well as with peer group data. They also compared the performance of the SMI Funds to the performance of composites of separately managed accounts (“SMAs”) utilizing the same strategies utilized by the SMI Funds. The Trustees also considered the consistency of SMI’s management of the SMI Funds with each of the SMI Fund’s investment objective, strategies, and limitations. The Trustees noted that the performance of each of the various SMA strategies varied as compared to the performance of the applicable SMI Fund(s) using those strategies. They considered the explanations provided by SMI regarding the reasons for differences in performance, and determined them to be reasonable. The Trustees noted and gave significant consideration to SMI’s view that the “upgrading” strategy utilized by the Sound Mind Investing Fund did not allow it to be appropriately compared to any particular peer category, although data for the Morningstar category was reviewed and considered. The Trustees observed that for the one year period ended September 30, 2021, the Sound Mind Investing Fund performed below its category average and median, performed above the median of its peer group, and underperformed compared to its benchmark. For the three year period, they noted that the Sound Mind Investing Fund performed below its category average and median, below its peer group median, and below its benchmark. The Trustees observed that for the five year period ended September 30, 2021 the Sound Mind Investing Fund performed below its category average and median, below its peer group median, and below its benchmark. For the period since inception, they noted that the Fund performed below its category median, above its peer group median, and below its benchmark. With respect to the SMI Dynamic Allocation Fund, the Trustees noted that the fund performed below the category average and median for the one year, three year, and five year periods ended September 30, 2021, and below the category median for the period since inception. They also noted that the SMI Dynamic Allocation Fund underperformed as compared to its peer group median for the one year period, three year, and five year periods. They also observed that the SMI Dynamic Allocation Fund underperformed as compared to its benchmark for all periods presented. The Trustees observed that the SMI 50/40/10 Fund performed below its category average and median for the one year, three year, and five year periods ended September 30, 2021. For the since inception period, the Trustees noted that the SMI 50/40/10 Fund performed below its category median. As compared to its peer group, the Trustees noted that the SMI 50/40/10 Fund outperformed the median for the one year period ended September 30, 2021, and underperformed for all other periods reported. They also observed that the SMI 50/40/10 Fund underperformed as compared to its benchmark for all periods reported. After reviewing and discussing the investment performance of the SMI Funds further, SMI’s experience managing the SMI Funds, and other relevant factors, the Board concluded, in light of all the facts and circumstances, that the investment performance of the SMI Funds was acceptable. |
| 3. | The costs of the services to be provided and profits to be realized by SMI from the relationship with the SMI Funds. In considering the costs of services to be provided and the profits to be realized by SMI from the relationship with the SMI Funds, the Trustees considered: (1) SMI’s financial condition; (2) the asset levels of the SMI Funds; (3) the overall expenses of the SMI Funds; and (4) the nature and frequency of advisory fee payments. The Trustees reviewed information provided by SMI regarding its profits associated with managing the SMI Funds. The Trustees also considered potential benefits for SMI in |
39
| INVESTMENT ADVISORY AGREEMENT APPROVAL |
| (Unaudited), (Continued) |
managing the SMI Funds. The Trustees then compared the fees and expenses of the SMI Funds (including the management fee) to other comparable mutual funds, including each of the SMI Fund’s Morningstar category averages, and each of the SMI Fund’s peer group averages. The Trustees noted that the Sound Mind Investing Fund’s management fee and net expense ratio were higher than the category average and median. They also noted that the management fee was equal to the medium of the Sound Mind Investment Fund’s peer group and its net expense ratio was below the average and the median of the peer group. With respect to the SMI Dynamic Allocation Fund, the Trustees observed that the management fee and net expense ratio were higher than the category average and median. They also noted that the SMI Dynamic Allocation Fund’s management fee was equal to the median of its peer group but higher than the average, while its net expense ratio was lower than the average and median of its peer group. With respect to the SMI 50/40/10 Fund, the Trustees noted that both the management fee and net expense ratio were higher than the category average and median. They noted that the management fee was equal to the peer group average, but lower than the peer group median. They also noted that the net expense ratio was lower than the peer group average and median. In light of the unique services rendered to the SMI Funds by SMI, the profits realized by SMI in managing the SMI Funds, and all other facts and circumstances they deemed relevant, the Trustees concluded that the management fees paid by the SMI Funds were fair and reasonable in relation to the nature and quality of the services provided by SMI.
| 4. | The extent to which economies of scale would be realized as the SMI Funds grow and whether advisory fee levels reflect these economies of scale for the benefit of the SMI Funds’ investors. In this regard, the Trustees considered the fee arrangements with SMI for the SMI Funds. The Trustees considered that the management fee for each of the SMI Funds has breakpoints that would allow shareholders to realize economies of scale as assets grow. The Trustees noted that none of the SMI Funds were currently at an asset level to take advantage of the breakpoints; however, the Board also noted the expense limitation arrangements in place with respect to each of the SMI Funds, and that each SMI Fund’s shareholders had experienced benefits from those arrangements. In light of its ongoing consideration of the asset levels of each of the SMI Funds, expectations for growth, and fee levels, the Board determined that the fee arrangements for each of the SMI Funds, in light of all the facts and circumstances, were fair and reasonable in relation to the nature and quality of the services provided by SMI. |
| 5. | Possible conflicts of interest and benefits to SMI. In considering SMI’s practices regarding conflicts of interest, the Trustees evaluated the potential for conflicts of interest and considered such matters as the experience and ability of the advisory personnel assigned to the SMI Funds; the basis of decisions to buy or sell securities for the SMI Funds; and the substance and administration of SMI’s code of ethics. The Trustees also considered disclosure in the registration statement of the Trust relating to SMI’s potential conflicts of interest. The Board noted that SMI has a separately managed account (“SMA”) product, and that if an SMI Fund is owned within an SMA, the SMA will not charge a management fee for those assets invested in an SMI Fund. The Board also noted that SMI does not engage in soft dollar arrangements and has not identified any indirect benefits from its relationship with the SMI Funds. Based on the foregoing, the Board determined that SMI’s standards and practices relating to the identification and mitigation of potential conflicts of interest were satisfactory. |
40
| INVESTMENT ADVISORY AGREEMENT APPROVAL |
| (Unaudited), (Continued) |
After additional consideration of the factors delineated in the memorandum provided by counsel and further discussion among the Board members, the Board determined to approve the continuation of the SMI Agreements between the Trust and SMI.
41
| FACTS | WHAT DO THE SMI FUNDS DO WITH YOUR PERSONAL INFORMATION? |
| Why? | Financial companies choose how they share your personal information. Federal law gives consumers the right to limit some but not all sharing. Federal law also requires us to tell you how we collect, share, and protect your personal information. Please read this notice carefully to understand what we do. |
| What? | The types of personal information we collect and share depend on the product or service you have with us. This information can include:
● Social Security number
● account balances and account transactions
● transaction or loss history and purchase history
● checking account information and wire transfer instructions |
| When you are no longer our customer, we continue to share your information as described in this notice. | |
| How? | All financial companies need to share customers’ personal information to run their everyday business. In the section below, we list the reasons financial companies can share their customers’ personal information; the reasons SMI Funds choose to share; and whether you can limit this sharing. |
| Reasons we can share your personal information | Do
SMI Funds share? |
For our everyday business purposes— such as to process your transactions, maintain your account(s), respond to court orders and legal investigations, or report to credit bureaus |
Yes |
For our marketing purposes— to offer our products and services to you |
No |
| For joint marketing with other financial companies | No |
For our affiliates’ everyday business purposes— information about your transactions and experiences |
No |
For our affiliates’ everyday business purposes— information about your creditworthiness |
No |
| For nonaffiliates to market to you | No |
| Questions? | Call (877) 764-3863 |
42
| Who we are | |
| Who is providing this notice? | SMI
Funds Ultimus Fund Distributors, LLC (Distributor) Ultimus Fund Solutions, LLC (Administrator) |
| What we do | |
| How do SMI Funds protect my personal information? | To protect your personal information from unauthorized access and use, we use security measures that comply with federal law. These measures include computer safeguards and secured files and buildings. Our service providers are held accountable for adhering to strict policies and procedures to prevent any misuse of your nonpublic personal information. |
| How do SMI Funds collect my personal information? | We collect your personal information, for example, when you
● open an account or deposit money
● buy securities from us or sell securities to us
● make deposits or withdrawals from your account or provide account information
● give us your account information
● make a wire transfer
● tell us who receives the money
● tell us where to send the money
● show your government-issued ID
● show your driver’s license |
| Why can’t I limit all sharing? | Federal law gives you the right to limit only
● sharing for affiliates’ everyday business purposes—information about your creditworthiness
● affiliates from using your information to market to you
● sharing for nonaffiliates to market to you
State laws and individual companies may give you additional rights to limit sharing. |
| Definitions | |
| Affiliates | Companies related by common ownership or control. They can be financial and nonfinancial companies.
● SMI Advisory Services, LLC, the investment adviser to the SMI Funds, could be deemed to be an affiliate. |
| Nonaffiliates | Companies not related by common ownership or control. They can be financial and nonfinancial companies.
● The SMI Funds do not share your personal information with nonaffiliates so they can market to you, |
| Joint marketing | A formal agreement between nonaffiliated financial companies that together market financial products or services to you.
● The SMI Funds do not jointly market. |
43
| PROXY VOTING |
A description of the policies and procedures that each Fund uses to determine how to vote proxies relating to portfolio securities and information regarding how each Fund voted those proxies during the most recent twelve month period ended June 30, are available (1) without charge upon request by calling the Funds at (877) 764-3863 and (2) in Fund documents filed with the Securities and Exchange Commission (“SEC”) on the SEC’s website at www.sec.gov.
| TRUSTEES |
| Andrea N. Mullins, Chairperson |
| Ira P. Cohen |
| Mark J. Seger |
| OFFICERS |
| Matthew J. Miller, Principal Executive Officer and President |
| Zachary P. Richmond, Principal Financial Officer and Treasurer |
| N. Lynn Bowley, Chief Compliance Officer |
| Carol J. Highsmith, Vice President and Secretary |
| INVESTMENT ADVISER |
| SMI Advisory Services, LLC |
| 4400 Ray Boll Blvd. |
| Columbus, IN 47203 |
| DISTRIBUTOR |
| Ultimus Fund Distributors, LLC |
| 225 Pictoria Drive, Suite 450 |
| Cincinnati, OH 45246 |
| INDEPENDENT REGISTERED PUBLIC ACCOUNTING FIRM |
| Cohen & Company, Ltd. |
| 1350 Euclid Avenue, Suite 800 |
| Cleveland, OH 44115 |
| LEGAL COUNSEL |
| Troutman Pepper Hamilton Sanders LLP |
| 3000 Two Logan Square |
| 18th and Arch Streets |
| Philadelphia, PA 19103 |
| CUSTODIAN |
| Huntington National Bank |
| 41 South High Street |
| Columbus, OH 43215 |
| ADMINISTRATOR, TRANSFER AGENT AND FUND ACCOUNTANT |
| Ultimus Fund Solutions, LLC |
| 225 Pictoria Drive, Suite 450 |
| Cincinnati, OH 45246 |
This report is intended only for the information of shareholders or those who have received the Funds’ prospectus which contains information about each Fund’s management fee and expenses. Please read the prospectus carefully before investing.
Distributed by Ultimus Fund Distributors LLC, Member FINRA/SIPC
44
THIS PAGE INTENTIONALLY LEFT BLANK
 | |
| SOUND MIND | |
| INVESTING FUND | |
| (SMIFX) | |
| SMI DYNAMIC | |
| ALLOCATION FUND | |
| (SMIDX) | |
| SMI MULTI-STRATEGY | |
| FUND | |
| (SMILX) | |
| SEMI-ANNUAL | |
| REPORT | |
| APRIL 30, 2022 | |
| Funds’ Adviser: | |
| SMI Advisory Services, LLC | |
| 4400 Ray Boll Blvd. | |
| Columbus, IN 47203 | |
| (877) 764-3863 | |
| (877) SMI-FUND | |
| www.smifund.com | |
| SMI-SAR-22 |
 |
| Genuine Investors ETF (GCIG) |
| NYSE Arca, Inc. |
| Semi-Annual Report |
| April 30, 2022 |
| Fund Adviser: |
| GCI Investors |
| 7880 San Felipe Street, Suite 240 |
| Houston, TX 77063 |
| 713-401-9048 |
Investment Results (Unaudited) |
Average Annual Total Return* as of April 30, 2022
| Since | ||
| Inception | ||
| 11/30/2021 | ||
| Genuine Investors ETF - NAV | (14.13)% | |
| Genuine Investors ETF - Market Price | (14.05)% | |
| S&P 500® Index(a) | (9.02)% |
Total annual operating expenses based on estimated amounts for the current fiscal year, as disclosed in the Genuine Investors ETF’s (the “Fund”) prospectus dated November 17, 2021, were 1.40% of average daily net assets (1.00% after fee waivers/expense reimbursements by GCI Investors (the “Adviser”)). The Adviser contractually has agreed to waive its management fee and/or reimburse expenses so that total annual Fund operating expenses do not exceed 1.00% through February 29, 2024. This operating expense limitation does not apply to: (i) interest, (ii) taxes, (iii) brokerage commissions, (iv) other expenditures which are capitalized in accordance with generally accepted accounting principles, (v) other extraordinary expenses not incurred in the ordinary course of the Fund’s business, (vi) dividend expense on short sales, (vii) expenses incurred under a plan of distribution under Rule 12b-1, and (viii) expenses that the Fund has incurred but did not actually pay because of an expense offset arrangement, if applicable, incurred by the Fund in any fiscal year. The operating expense limitation also excludes any “Acquired Fund Fees and Expenses,” which are the expenses indirectly incurred by the Fund as a result of investing in money market funds or other investment companies, including ETFs, that have their own expenses. This expense cap may only be terminated by mutual consent of the Adviser and the Board of Trustees. Each waiver/ expense reimbursement by the Adviser is subject to recoupment by the Adviser from the Fund in the three years following the date the particular waiver/expense reimbursement occurred, but only if such recoupment can be achieved without exceeding the annual expense limitation in effect at the time of the waiver/expense reimbursement and any expense limitation in effect at the time of the recoupment. Additional information pertaining to the Fund’s expense ratios as of April 30, 2022 can be found in the financial highlights.
The performance quoted represents past performance, which does not guarantee future results. The investment return and principal value of an investment will fluctuate so that an investor’s shares, when redeemed, may be worth more or less than their original cost. The returns shown do not reflect deduction of taxes that a shareholder would pay on Fund distributions or the redemption of Fund shares. Current performance of the Fund may be lower or higher than the performance quoted. The Fund’s investment objectives, risks, charges and expenses must be considered carefully before investing. Performance data current to the most recent month end may be obtained by calling (713) 401-9048. The Fund’s per share net asset value (“NAV”) is the value of one share of the Fund as calculated in accordance with the standard formula for valuing shares. The NAV return is based on the NAV of the Fund and the market return is based on the market price per share of the Fund. The price used to calculate market return (“Market Price”) is determined by using the midpoint between the highest bid and the lowest offer on the primary stock exchange on which the shares of the Fund are listed for trading, as of the time that the Fund’s NAV is calculated. Market Price and NAV returns assume that dividends and capital gain distributions have been reinvested in the Fund at Market Price and NAV, respectively. Since exchange-traded funds are bought and sold at prices set by the market, which can result in a premium or discount to NAV, the returns calculated using Market Price can differ from those calculated using NAV.
| * | Return figures reflect any change in price per share and assume the reinvestment of all distributions. The Fund’s returns reflect any fee reductions during the applicable periods. If such fee reductions had not occurred, the quoted performance would have been lower. Total returns for periods less than one year are not annualized. |
1
| Investment Results (Unaudited) (continued) |
(a) The S&P 500® Index is a widely recognized unmanaged index of equity prices and is representative of a broader market and range of securities than are found in the Fund’s portfolio. Index returns do not reflect the deduction of expenses, which have been deducted from the Fund’s returns. Index returns assume reinvestment of all distributions and do not reflect the deduction of taxes and fees. Individuals cannot invest directly in an index; however, an individual may invest in exchange-traded funds or other investment vehicles that attempt to track the performance of a benchmark index.
The Fund’s investment objectives, strategies, risks, charges and expenses must be considered carefully before investing. The prospectus contains this and other important information about the Fund and may be obtained by calling (713) 401-9048. Please read it carefully before investing.
The Fund is distributed by Northern Lights Distributors, LLC, Member FINRA/SIPC.
2
| Fund Holdings (Unaudited) |
Genuine Investor ETF Holdings as of April 30, 2022.*
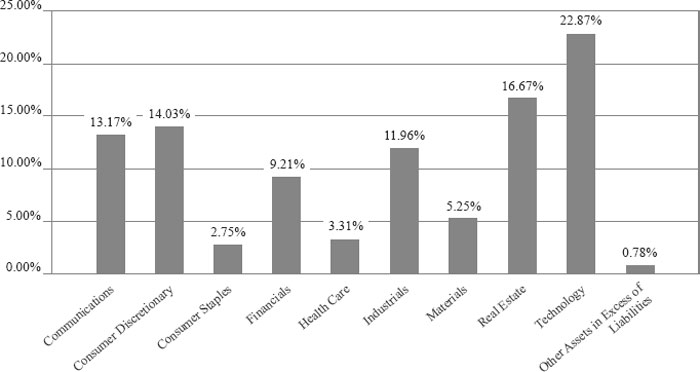
| * | As a percentage of net assets. |
The Genuine Investors ETF (the “Fund”) seeks to provide investors with attractive long-term risk-adjusted returns by investing in an equity portfolio of U.S. listed securities.
Availability of Portfolio Schedule (Unaudited)
The Fund files a complete schedule of portfolio holdings with the Securities and Exchange Commission (the “SEC”) for the first and third quarters of each fiscal year as an exhibit to its reports on Form N-PORT. The Fund’s Form N-PORT reports are available on the SEC’s website at http:// www.sec.gov or on the Fund’s website at https://genuineinvestorsetf.com.
3
| Genuine Investors ETF |
| Schedule of Investments |
| April 30, 2022 (Unaudited) |
| Common Stocks — 99.22% | Shares | Fair Value | ||||||
| Canada — 6.55% | ||||||||
| Industrials — 6.55% | ||||||||
| GFL Environmental, Inc. | 20,974 | $ | 631,947 | |||||
| Total Canada | 631,947 | |||||||
| United Kingdom — 2.75% | ||||||||
| Consumer Staples — 2.75% | ||||||||
| Ocado Group PLC - ADR(a) | 11,397 | 265,299 | ||||||
| Total United Kingdom | 265,299 | |||||||
| United States — 89.92% | ||||||||
| Communications — 13.17% | ||||||||
| Alphabet, Inc., Class A(a) | 191 | 435,898 | ||||||
| Booking Holdings, Inc.(a) | 205 | 453,114 | ||||||
| Meta Platforms, Inc., Class A(a) | 1,907 | 382,296 | ||||||
| 1,271,308 | ||||||||
| Consumer Discretionary — 14.03% | ||||||||
| Amazon.com, Inc.(a) | 212 | 526,954 | ||||||
| CarMax, Inc.(a) | 5,458 | 468,187 | ||||||
| Wyndham Hotels & Resorts, Inc. | 4,081 | 358,965 | ||||||
| 1,354,106 | ||||||||
| Financials — 9.21% | ||||||||
| Charles Schwab Corp. (The) | 5,537 | 367,269 | ||||||
| First American Financial Corp. | 8,951 | 521,933 | ||||||
| 889,202 | ||||||||
| Health Care — 3.31% | ||||||||
| Laboratory Corp. of America Holdings | 1,331 | 319,813 | ||||||
| Industrials — 5.41% | ||||||||
| United Parcel Service, Inc., Class B | 2,904 | 522,662 | ||||||
| Materials — 5.25% | ||||||||
| Air Products & Chemicals, Inc. | 2,167 | 507,230 | ||||||
| Real Estate — 16.67% | ||||||||
| American Tower Corp., A | 1,824 | 439,620 | ||||||
| Crown Castle International Corp. | 2,472 | 457,839 | ||||||
| Equinix, Inc. | 547 | 393,337 | ||||||
| Howard Hughes Corp. (The)(a) | 3,182 | 319,123 | ||||||
| 1,609,919 | ||||||||
| Technology — 22.87% | ||||||||
| Fidelity National Information Services, Inc. | 4,147 | 411,175 | ||||||
| MasterCard, Inc., Class A | 1,280 | 465,125 | ||||||
| Microsoft Corp. | 2,122 | 588,898 | ||||||
| S&P Global, Inc. | 1,113 | 419,045 | ||||||
See accompanying notes which are an integral part of these financial statements.
4
| Genuine Investors ETF |
| Schedule of Investments (continued) |
| April 30, 2022 (Unaudited) |
| Common Stocks — 99.22% (continued) | Shares | Fair Value | ||||||
| United States — 89.92% (continued) | ||||||||
| Technology — 22.87% (continued) | ||||||||
| Tyler Technologies, Inc.(a) | 820 | $ | 323,662 | |||||
| 2,207,905 | ||||||||
| 8,682,145 | ||||||||
| Total United States | ||||||||
| Total
Common Stocks/Investments — 99.22% (Cost $11,065,361) | ||||||||
| Other Assets in Excess of Liabilities — 0.78% | 9,579,391 | |||||||
| Net Assets — 100.00% | 75,550 | |||||||
| $ | 9,654,941 | |||||||
| (a) | Non-income producing security. |
ADR - American Depositary Receipt.
See accompanying notes which are an integral part of these financial statements.
5
| Genuine Investors ETF |
| Statement of Assets and Liabilities |
| April 30, 2022 (Unaudited) |
| Assets | ||||
| Investments in securities, at fair value (cost $11,065,361) (Note 3) | $ | 9,579,391 | ||
| Cash | 89,284 | |||
| Receivable for fund shares sold | 214,755 | |||
| Receivable from Adviser | 7,751 | |||
| Dividends receivable | 4,046 | |||
| Tax reclaims receivable | 35 | |||
| Prepaid expenses | 39 | |||
| Total Assets | 9,895,301 | |||
| Liabilities | ||||
| Payable for investments purchased | 207,756 | |||
| Payable to affiliates (Note 4) | 12,660 | |||
| Other accrued expenses | 19,944 | |||
| Total Liabilities | 240,360 | |||
| Net Assets | $ | 9,654,941 | ||
| Net Assets consist of: | ||||
| Paid-in capital | $ | 11,162,210 | ||
| Accumulated deficit | (1,507,269) | |||
| Net Assets | $ | 9,654,941 | ||
| Shares outstanding (unlimited number of shares authorized, no par value) | 450,000 | |||
| Net asset value per share | $ | 21.46 |
See accompanying notes which are an integral part of these financial statements.
6
| Genuine Investors ETF |
| Statement of Operations |
| For the period ended April 30, 2022(a) (Unaudited) |
| Investment Income | ||||
| Dividend income (net of foreign taxes withheld of $52) | $ | 32,333 | ||
| Total investment income | 32,333 | |||
| Expenses | ||||
| Administration (Note 4) | 24,627 | |||
| Adviser (Note 4) | 24,186 | |||
| Compliance services (Note 4) | 8,209 | |||
| Audit and tax | 8,059 | |||
| Legal | 7,387 | |||
| Transfer agent | 6,404 | |||
| Custodian | 4,844 | |||
| Report printing | 2,463 | |||
| Trustee | 2,260 | |||
| Pricing | 272 | |||
| Miscellaneous | 15,548 | |||
| Total expenses | 104,259 | |||
| Fees waived and expenses reimbursed by Adviser | (71,747 | ) | ||
| Net operating expenses | 32,512 | |||
| Net investment loss | (179 | ) | ||
| Net Realized and Change in Unrealized Gain (Loss) on Investments | ||||
| Net realized gain (loss) on: | ||||
| Investment securities transactions | (19,638 | ) | ||
| Change in unrealized depreciation on: | ||||
| Investment securities | (1,485,970 | ) | ||
| Net realized and change in unrealized gain (loss) on investment securities | (1,505,608 | ) | ||
| Net decrease in net assets resulting from operations | $ | (1,505,787 | ) |
| (a) | For the period November 30, 2021 (commencement of operations) to April 30, 2022. |
See accompanying notes which are an integral part of these financial statements.
7
| Genuine Investors ETF |
| Statement of Changes in Net Assets |
| For the Period | ||||
| Ended April 30, | ||||
| 2022(a) | ||||
| (Unaudited) | ||||
| Increase (Decrease) in Net Assets due to: | ||||
| Operations | ||||
| Net investment loss | $ | (179 | ) | |
| Net realized loss on investment securities | (19,638 | ) | ||
| Change in unrealized depreciation on investment securities | (1,485,970 | ) | ||
| Net decrease in net assets resulting from operations | (1,505,787 | ) | ||
| Distributions to Shareholders From: (Note 2) | ||||
| Earnings | (1,482 | ) | ||
| Total distributions | (1,482 | ) | ||
| Capital Transactions | ||||
| Proceeds from shares sold | 11,162,210 | |||
| Net increase in net assets resulting from capital transactions | 11,162,210 | |||
| Total Increase in Net Assets | 9,654,941 | |||
| Net Assets | ||||
| Beginning of period | $ | — | ||
| End of period | $ | 9,654,941 | ||
| Share Transactions | ||||
| Shares sold | 450,000 | |||
| Net increase in shares outstanding | 450,000 | |||
| (a) | For the period November 30, 2021 (commencement of operations) to April 30, 2022. |
See accompanying notes which are an integral part of these financial statements.
8
| Genuine Investors ETF |
| Financial Highlights |
| (For a share outstanding during the period) |
| For the | ||||
| Period | ||||
| Ended | ||||
| April 30, | ||||
| 2022(a) | ||||
| (Unaudited) | ||||
| Selected Per Share Data: | ||||
| Net asset value, beginning of period | $ | 25.00 | ||
| Investment operations: | ||||
| Net investment loss | — | (b) | ||
| Net realized and unrealized loss on investments | (3.53 | ) | ||
| Total from investment operations | (3.53 | ) | ||
| Less distributions to shareholders from: | ||||
| Net investment income | (0.01 | ) | ||
| Total distributions | (0.01 | ) | ||
| Net asset value, end of period | $ | 21.46 | ||
| Market price, end of period | $ | 21.48 | ||
| Total Return(c) | (14.13 | )%(d) | ||
| Ratios and Supplemental Data: | ||||
| Net assets, end of period (000 omitted) | $ | 9,655 | ||
| Ratio of net expenses to average net assets | 1.00 | %(e) | ||
| Ratio of expenses to average net assets before waiver and reimbursement | 3.21 | %(e) | ||
| Ratio of net investment loss to average net assets | (0.01 | )%(e) | ||
| Portfolio turnover rate(f) | 11 | %(d) | ||
| (a) | For the period November 30, 2021 (commencement of operations) to April 30, 2022. |
| (b) | Rounds to less than $0.005 per share. |
| (c) | Total return is calculated assuming a purchase of shares at net asset value on the first day and a sale at net asset value on the last day of the period. Distributions are assumed, for the purpose of this calculation, to be reinvested at the ex-dividend date net asset value per share on their respective payment dates. |
| (d) | Not annualized. |
| (e) | Annualized. |
| (f) | Portfolio turnover rate excludes securities received or delivered from in-kind processing of creations or redemptions. |
See accompanying notes which are an integral part of these financial statements.
9
| Genuine Investors ETF |
| Notes to the Financial Statements |
| April 30, 2022 (Unaudited) |
NOTE 1. ORGANIZATION
The Genuine Investors ETF (the “Fund”) is registered under the Investment Company Act of 1940, as amended (“1940 Act”), as an open-end non-diversified series of Valued Advisers Trust (the “Trust”), and commenced operations on November 30, 2021. The Trust is a management investment company established under the laws of Delaware by an Agreement and Declaration of Trust dated June 13, 2008 (the “Trust Agreement”). The Trust Agreement permits the Board of Trustees (the “Board” or “Trustees”) to issue an unlimited number of shares of beneficial interest of separate series without par value. The Fund is one of a series of funds authorized by the Board. The Fund’s investment adviser is Globescan Capital, Inc. dba GCI Investors (the “Adviser”). The Fund seeks to provide investors with attractive long-term risk-adjusted returns by investing in an equity portfolio of U.S. listed securities.
Non-Diversification Risk – The Fund is a non-diversified portfolio, which means that it has the ability to take larger positions in a smaller number of securities than a portfolio that is “diversified.” Non-diversification increases the risk that the value of the Fund could go down because of the poor performance of a single investment.
NOTE 2. SIGNIFICANT ACCOUNTING POLICIES
The Fund is an investment company and follows accounting and reporting guidance under Financial Accounting Standards Board Accounting Standards Codification (“ASC”) Topic 946, “Financial Services-Investment Companies”, including Accounting Standards Update 2013-08. The following is a summary of significant accounting policies followed by the Fund in the preparation of its financial statements. These policies are in conformity with generally accepted accounting principles in the United States of America (“GAAP”).
Estimates – The preparation of financial statements in conformity with GAAP requires management to make estimates and assumptions that affect the reported amounts of assets and liabilities and disclosure of contingent assets and liabilities at the date of the financial statements and the reported amounts of increases and decreases in net assets from operations during the reporting period. Actual results could differ from those estimates.
Foreign Currency Translation – The accounting records of the Fund are maintained in U.S. dollars. Foreign currency amounts are translated into U.S. dollars at the current rate of exchange each business day to determine the value of investments, and other assets and liabilities. Purchases and sales of foreign securities, and income and expenses, are translated at the prevailing rate of exchange on the respective date of these transactions. The Fund does not isolate that portion of the results of operations resulting from changes in foreign exchange rates on investments from fluctuation arising from changes in market prices of securities held. These fluctuations are included with the realized and unrealized
10
| Genuine Investors ETF |
| Notes to the Financial Statements (continued) |
| April 30, 2022 (Unaudited) |
gain or loss from investments. Net realized gain (loss) on foreign currency translations on the Statement of Operations represents currency gains (losses) realized between the trade and settlement dates on securities transactions, and the difference between the amount of investment income and foreign withholding taxes recorded on the Fund’s books and the U.S. dollar equivalent amounts actually received or paid. The change in unrealized currency gains (losses) on foreign currency translations for the period is reflected in the Statement of Operations.
Federal Income Taxes – The Fund makes no provision for federal income or excise tax. The Fund intends to qualify each year as a regulated investment company (“RIC”) under subchapter M of the Internal Revenue Code of 1986, as amended, by complying with the requirements applicable to RICs and by distributing substantially all of its taxable income. The Fund also intends to distribute sufficient net investment income and net realized capital gains, if any, so that it will not be subject to excise tax on undistributed income and gains. If the required amount of net investment income or gains is not distributed, the Fund could incur a tax expense.
As of and during the period ended April 30, 2022, the Fund did not have any liabilities for any unrecognized tax benefits. The Fund recognizes interest and penalties, if any, related to unrecognized tax benefits as income tax expense in the Statement of Operations when incurred. During the period, the Fund did not incur any interest or penalties. Management of the Fund has reviewed tax positions taken in tax years that remain subject to examination by all major tax jurisdictions, including federal (i.e., the interim tax period since inception, as applicable) and has concluded that no provision for unrecognized tax benefits or expenses is required in these financial statements and does not expect this to change over the next twelve months.
Expenses – Expenses incurred by the Trust that do not relate to a specific fund of the Trust are allocated to the individual funds based on each fund’s relative net assets or another appropriate basis (as determined by the Board).
Security Transactions and Related Income – The Fund follows industry practice and records security transactions on the trade date for financial reporting purposes. The specific identification method is used for determining gains or losses for financial statements and income tax purposes. Dividend income is recorded on the ex-dividend date and interest income is recorded on an accrual basis. Distributions received from investments in real estate investment trusts (“REITs”) that represent a return of capital or capital gain are recorded as a reduction of the cost of investment or as a realized gain, respectively. The calendar year-end amounts of ordinary income, capital gains, and return of capital included in distributions received from the Fund’s investments in REITs are reported to the Fund after the end of the calendar year; accordingly, the Fund estimates these amounts for
11
| Genuine Investors ETF |
| Notes to the Financial Statements (continued) |
| April 30, 2022 (Unaudited) |
accounting purposes until the characterization of REIT distributions is reported. Estimates are based on the most recent REIT distributions information available. Withholding taxes on foreign dividends and related reclaims have been provided for in accordance with the Fund’s understanding of the applicable country’s tax rules and rates.
Dividends and Distributions – The Fund intends to distribute its net investment income and net realized long-term and short-term capital gains, if any, at least annually. Dividends and distributions to shareholders, which are determined in accordance with income tax regulations, are recorded on the ex-dividend date. The treatment for financial reporting purposes of distributions made to shareholders during the period from net investment income or net realized capital gains may differ from their ultimate treatment for federal income tax purposes. These differences are caused primarily by differences in the timing of the recognition of certain components of income, expense or realized capital gain for federal income tax purposes. Where such differences are permanent in nature, they are reclassified among the components of net assets based on their ultimate characterization for federal income tax purposes. Any such reclassifications will have no effect on net assets, results of operations or NAV per share of the Fund.
NOTE 3. SECURITIES VALUATION AND FAIR VALUE MEASUREMENTS
The Fund values its portfolio securities at fair value as of the close of regular trading on the New York Stock Exchange (“NYSE”) (normally 4:00 p.m. Eastern time) on each business day the NYSE is open for business. Fair value is defined as the price that the Fund would receive upon selling an investment in a timely transaction to an independent buyer in the principal or most advantageous market of the investment. GAAP establishes a three-tier hierarchy to maximize the use of observable market data and minimize the use of unobservable inputs and to establish classification of fair value measurements for disclosure purposes.
Inputs refer broadly to the assumptions that market participants would use in pricing the asset or liability, including assumptions about risk (the risk inherent in a particular valuation technique used to measure fair value including a pricing model and/or the risk inherent in the inputs to the valuation technique). Inputs may be observable or unobservable. Observable inputs are inputs that reflect the assumptions market participants would use in pricing the asset or liability developed based on market data obtained and available from sources independent of the reporting entity. Unobservable inputs are inputs that reflect the reporting entity’s own assumptions about the assumptions market participants would use in pricing the asset or liability developed based on the best information available in the circumstances.
Various inputs are used in determining the value of the Fund’s investments. These inputs are summarized in the three broad levels listed below.
12
| Genuine Investors ETF |
| Notes to the Financial Statements (continued) |
| April 30, 2022 (Unaudited) |
| ● | Level 1 – unadjusted quoted prices in active markets for identical investments and/or registered investment companies where the value per share is determined and published and is the basis for current transactions for identical assets or liabilities at the valuation date |
| ● | Level 2 – other significant observable inputs (including, but not limited to, quoted prices for an identical security in an inactive market, quoted prices for similar securities, interest rates, prepayment speeds, credit risk, etc.) |
| ● | Level 3 – significant unobservable inputs (including the Fund’s own assumptions in determining fair value of investments based on the best information available) |
The inputs used to measure fair value may fall into different levels of the fair value hierarchy. In such cases, for disclosure purposes, the level in the fair value hierarchy which is reported is determined based on the lowest level input that is significant to the fair value measurement in its entirety.
Equity securities that are traded on any stock exchange are generally valued at the last quoted sale price on the security’s primary exchange. Lacking a last sale price, an exchange-traded security is generally valued at its last bid price. Securities traded in the NASDAQ over-the-counter market are generally valued at the NASDAQ Official Closing Price. When using the market quotations and when the market is considered active, the security is classified as a Level 1 security. In the event that market quotations are not readily available or are considered unreliable due to market or other events, the Fund values its securities and other assets at fair value in accordance with policies established by and under the general supervision of the Board. Under these policies, the securities will be classified as Level 2 or 3 within the fair value hierarchy, depending on the inputs used.
In accordance with the Trust’s valuation policies, the Adviser is required to consider all appropriate factors relevant to the value of securities for which it has determined other pricing sources are not available or reliable as described above. No single method exists for determining fair value, because fair value depends upon the circumstances of each individual case. As a general principle, the current fair value of a security being valued by the Adviser would be the amount that the Fund might reasonably expect to receive upon the current sale. Methods that are in accordance with this principle may, for example, be based on (i) a multiple of earnings; (ii) a discount from market prices of a similar freely traded security (including a derivative security or a basket of securities traded on other markets, exchanges or among dealers); or (iii) yield to maturity with respect to debt issues, or a combination of these and other methods. Fair-value pricing is permitted if, in the Adviser’s opinion, the validity of market quotations appears to be questionable based on factors such as evidence of a thin market in the security based on a small number of quotations, a significant event occurs after the close of a market but before the Fund’s NAV
13
| Genuine Investors ETF |
| Notes to the Financial Statements (continued) |
| April 30, 2022 (Unaudited) |
calculation that may affect a security’s value, or the Adviser is aware of any other data that calls into question the reliability of market quotations.
The following is a summary of the inputs used to value the Fund’s investments as of April 30, 2022:
| Valuation Inputs | ||||||||||||||||
| Assets | Level 1 | Level 2 | Level 3 | Total | ||||||||||||
| Common Stocks (a) | $ | 9,579,391 | $ | — | $ | — | $ | 9,579,391 | ||||||||
| Total | $ | 9,579,391 | $ | — | $ | — | $ | 9,579,391 | ||||||||
| (a) | Refer to Schedule of Investments for sector classifications. |
The Fund did not hold any investments at the end of the reporting period for which significant unobservable inputs (Level 3) were used in determining fair value; therefore, no reconciliation of Level 3 securities is included for this reporting period.
NOTE 4. FEES AND OTHER TRANSACTIONS WITH AFFILIATES AND OTHER SERVICE PROVIDERS
The Adviser, under the terms of the management agreement with the Trust with respect to the Fund (the “Agreement”), manages the Fund’s investments. As compensation for its management services, the Fund is obligated to pay the Adviser a fee computed and accrued daily and paid monthly at an annual rate of 0.75% of the Fund’s average daily net assets. For the six months ended April 30, 2022, before the waiver described below, the Adviser earned a fee of $24,186 from the Fund.
The Adviser has contractually agreed to waive its management fee and/or reimburse expenses so that total annual operating expenses (excluding interest, taxes, brokerage commissions, other expenditures which are capitalized in accordance with generally accepted accounting principles, other extraordinary expenses not incurred in the ordinary course of the Fund’s business, dividend expense on short sales,
expenses incurred under a plan of distribution under Rule 12b-1, and expenses that the Fund has incurred but did not actually pay because of an expense offset arrangement, if applicable, incurred by the Fund in any fiscal year. The operating expense limitation also excludes any “Acquired Fund Fees and Expenses,” which are the expenses indirectly incurred by the Fund as a result of investing in money market funds or other investment companies, including ETFs, that have their own expenses) do not exceed 1.00% of the Fund’s average daily net assets through February 29, 2024. For the six months ended April 30, 2022, the Adviser waived fees and reimbursed expenses of $71,747. At April 30, 2022, the Adviser owed the Fund $7,751.
14
| Genuine Investors ETF |
| Notes to the Financial Statements (continued) |
| April 30, 2022 (Unaudited) |
Each fee waiver/expense reimbursement by the Adviser is subject to recoupment by the Adviser from the Fund in the three years following the date in which that particular waiver/expense reimbursement occurred, but only if such recoupment can be achieved without exceeding the annual expense limitation in effect at the time of the waiver/expense reimbursement and any expense limitation in effect at the time of the recoupment. As of April 30, 2022 the Adviser may seek repayment of investment advisory fees waived and expense reimbursements pursuant to the aforementioned conditions, from the Fund no later than the dates stated below:
| Recoverable Through | ||||
| April 30, 2025 | $ | 71,747 | ||
Ultimus Fund Solutions, LLC (“Ultimus”) provides administration and fund accounting services to the Fund. The Fund pays Ultimus fees in accordance with the agreements for such services.
Northern Lights Compliance Services, LLC (“NLCS”), an affiliate of Ultimus, provides a Chief Compliance Officer to the Trust, as well as related compliance services, pursuant to a consulting agreement between NLCS and the Trust. Under the terms of such agreement, NLCS receives fees from the Fund, which are approved annually by the Board.
Under the terms of a Distribution Agreement with the Trust, Northern Lights Distributors, LLC (the “Distributor”) serves as principal underwriter to the Fund. The Distributor is an affiliate of Ultimus. The Distributor is compensated by the Adviser (not the Fund) for acting as principal underwriter.
The officers and one trustee of the Trust are members of management and/or employees of Ultimus or one of its affiliates and are not paid by the Trust for services to the Fund.
NOTE 5. INVESTMENT TRANSACTIONS
For the period ended April 30, 2022, purchases and sales of investment securities, other than short-term investments, were $1,173,990 and $968,342, respectively.
For the period ended April 30, 2022, purchases and sales for in-kind transactions were $10,879,569 and $0, respectively.
For the period ended April 30, 2022, the Fund had in-kind net realized gains of $0.
There were no purchases or sales of long-term U.S. government obligations during the period ended April 30, 2022.
15
| Genuine Investors ETF |
| Notes to the Financial Statements (continued) |
| April 30, 2022 (Unaudited) |
NOTE 6. CAPITAL SHARE TRANSACTIONS
Shares are not individually redeemable and may be redeemed by the Fund at NAV only in large blocks known as “Creation Units.” Only Authorized Participants or transactions done through an Authorized Participant are permitted to purchase or redeem Creation Units from the Fund. An Authorized Participant is either (i) a broker-dealer or other participant in the clearing process through the Continuous Net Settlement System of the National Securities Clearing Corporation or (ii) a Depository Trust Company participant and, in each case, must have executed a Participant Agreement with the Distributor. Such transactions are generally permitted on an in-kind basis, with a balancing cash component to equate the transaction to the NAV per share of the Fund on the transaction date. Cash may be substituted equivalent to the value of certain securities generally when they are not available in sufficient quantity for delivery, not eligible for trading by the Authorized Participant or as a result of other market circumstances. In addition, the Fund may impose transaction fees on purchases and redemptions of Fund shares to cover the custodial and other costs incurred by the Fund in effecting trades. A fixed fee payable to the Custodian may be imposed on each creation and redemption transaction regardless of the number of Creation Units involved in the transaction (“Fixed Fee”). Purchases and redemptions of Creation Units for cash or involving cash-in-lieu are required to pay an additional variable charge to compensate the Fund and its ongoing shareholders for brokerage and market impact expenses relating to Creation Unit transactions (“Variable Charge,” and together with the Fixed Fee, the “Transaction Fees”). Transactions in capital shares for the Fund are disclosed in the Statement of Changes in Net Assets. For the period ended April 30, 2022, the Fund received $2,800 and $0 in fixed fees and variable fees, respectively. The Transaction Fees for the Fund are listed in the table below:
| Fixed Fee | Variable Charge | |
| $200 | 2.00%* |
| * | The maximum Transaction Fee may be up to 2.00% of the amount invested. |
16
| Genuine Investors ETF |
| Notes to the Financial Statements (continued) |
| April 30, 2022 (Unaudited) |
NOTE 7. FEDERAL TAX INFORMATION
At April 30, 2022, the net unrealized appreciation (depreciation) and tax cost of investments for tax purposes was as follows:
| Gross unrealized appreciation | $ | 91,796 | ||
| Gross unrealized depreciation | (1,577,766 | ) | ||
| Net unrealized depreciation on investments | $ | (1,485,970 | ) | |
| Tax cost of investments | $ | 11,065,361 |
NOTE 8. COMMITMENTS AND CONTINGENCIES
The Trust indemnifies its officers and Trustees for certain liabilities that may arise from their performance of their duties to the Trust or the Fund. Additionally, in the normal course of business, the Trust enters into contracts that contain a variety of representations and warranties which provide general indemnifications. The Trust’s maximum exposure under these arrangements is unknown, as this would involve future claims that may be made against the Trust that have not yet occurred.
NOTE 9. SUBSEQUENT EVENTS
Management of the Fund has evaluated the need for disclosures and/or adjustments resulting from subsequent events through the date at which these financial statements were issued. Based upon this evaluation, management has determined there were no items requiring adjustment of the financial statements or additional disclosure.
17
| Summary of Fund Expenses (Unaudited) |
As a shareholder of the Fund, you incur two types of costs: (1) transaction and (2) ongoing costs, including management fees and other Fund expenses. These examples are intended to help you understand your ongoing costs (in dollars) of investing in the Fund and to compare these costs with the ongoing costs of investing in other funds. You may pay brokerage commissions on purchases and sales of exchange-traded fund shares, which are not reflected in the example. The example is based on an investment of $1,000 invested at the beginning of the period and held for the entire period from November 30, 2021 (commencement of operations) through April 30, 2022.
Actual Expenses
The first line of the table below provides information about actual account values and actual expenses. You may use the information in this line, together with the amount you invested, to estimate the expenses that you paid over the period. Simply divide your account value by $1,000 (for example, an $8,600 account value divided by $1,000 = 8.6), then multiply the result by the number in the first line under the heading “Expenses Paid During Period” to estimate the expenses you paid on your account during this period.
Hypothetical Example for Comparison Purposes
The second line of the table below provides information about hypothetical account values and hypothetical expenses based on the Fund’s actual expense ratio and an assumed rate of return of 5% per year before expenses, which is not the Fund’s actual return. The hypothetical account values and expenses may not be used to estimate the actual ending account balance or expenses you paid for the period. You may use this information to compare the ongoing costs of investing in the Fund and other funds. To do so, compare this 5% hypothetical example with the 5% hypothetical examples that appear in the shareholder reports of other funds.
Expenses shown in the table are meant to highlight your ongoing costs only and do not reflect any transactional costs. Therefore, the second line of the table below is useful in comparing ongoing costs only and will not help you determine the relative costs of owning different funds. In addition, if transaction costs were included, your costs would have been higher.
| Beginning | Ending | |||||||
| Account | Account | Expenses | ||||||
| Value | Value | Paid | Annualized | |||||
| November | April 30, | During | Expense | |||||
| 30, 2021 | 2022 | Period(a) | Ratio | |||||
| Actual | $1,000.00 | $858.70 | $3.84 | 1.00% | ||||
| Hypothetical(b) | $1,000.00 | $1,019.84 | $5.01 (c) | 1.00% |
| (a) | Expenses are equal to the Fund’s annualized expense ratios, multiplied by the average account value over the period, multiplied by 151/365 (to reflect the period November 30, 2021 (commencement of operations) through April 30, 2022). |
| (b) | Hypothetical assumes 5% annual return before expenses. |
| (c) | Expenses are equal to the Fund’s annualized expense ratios, multiplied by the average account value over the period, multiplied by 181/365 (to reflect the one-half year period). |
18
| Investment Advisory Agreement Approval (Unaudited) |
At a meeting held on September 1, 2021, the Board of Trustees (the “Board”) considered the approval of the Investment Advisory Agreement (the “GCI Agreement”) between Valued Advisers Trust (the “Trust”) and GCI Investors (“GCI”) with respect to the Genuine Investors ETF (the “GCI Fund”). GCI provided written information to the Board to assist the Board in its considerations.
The Board discussed the proposed contractual arrangements between GCI and the Trust with respect to the GCI Fund. Trust counsel reminded the Trustees of their fiduciary duties and responsibilities, including the factors to be considered, and the application of those factors to GCI. The Trustees considered the information provided for their review in advance of the meeting, which included, among other things, a letter from counsel to GCI, GCI’s response to that letter, financial information relating to GCI, and GCI’s Form ADV. The Board did not identify any particular information that was most relevant to its consideration to approve the GCI Agreement and each Trustee may have afforded different weight to the various factors.
1. The nature, extent, and quality of the services to be provided by GCI. In this regard, the Board considered responsibilities that GCI would have under the GCI Agreement. The Trustees considered the services proposed to be provided by GCI to the GCI Fund, including without limitation: GCI’s procedures for formulating investment recommendations and assuring compliance with the GCI Fund’s investment objectives and limitations; the efforts of GCI during the GCI Fund’s start-up phase, its anticipated coordination of services for the GCI Fund among the GCI Fund’s service providers, and its anticipated efforts to promote the GCI Fund and grow its assets. The Trustees considered GCI’s continuity of, and commitment to retain, qualified personnel and GCI’s commitment to maintain and enhance its resources and systems, and GCI’s cooperation with the Board and Counsel for the GCI Fund. The Trustees considered GCI’s personnel, including the education and experience of GCI’s personnel and GCI’s compliance program, policies and procedures. With regard to GCI’s compliance program, the Trustees reflected upon their discussion with the Trust’s CCO regarding needed enhancements and improvements, as well as GCI’s willingness to commit time and resources to implementing such recommendations. After considering the foregoing information and further information in the Meeting materials provided by GCI (including GCI’s Form ADV), the Board concluded that, in light of all the facts and circumstances, the nature, extent, and quality of the services proposed to be provided by GCI will be satisfactory and adequate for the GCI Fund.
2. Investment Performance of the GCI Fund and GCI. The Board noted that the GCI Fund had not commenced operations and thus did not have investment performance information to review. The Trustees reviewed information regarding the performance of GCI’s accounts with a strategy similar to the GCI Fund. The Board reflected upon their discussions with personnel of GCI, a review of such persons’ background and qualifications, and the anticipated implementation of the GCI Fund’s investment strategies. After reviewing the information provided, the Board concluded, in light of the foregoing factors, that the investment performance of GCI was satisfactory.
3. The costs of the services to be provided and profits to be realized by GCI from the relationship with the GCI Fund. In this regard, the Board considered: the financial condition of GCI and the level of commitment to the GCI Fund and GCI by the principals of GCI; the projected asset levels of the GCI Fund; GCI’s payment of startup costs for the GCI Fund; and the overall anticipated expenses of the GCI Fund, including the expected nature and frequency of advisory fee payments. The Board also considered potential benefits for GCI in managing the GCI Fund. The Board compared the expected fees and expenses of the GCI Fund (including the management fee)
19
| Investment Advisory Agreement Approval (Unaudited) (continued) |
to other funds included in its expected Morningstar category and its custom peer group. They noted that the GCI Fund’s proposed management fee was above the category average and median, and the expected net expense ratio was also above the category average and median. They also noted that the proposed management fee and expected net expense ratio were higher than the peer group average and median. Following this comparison and upon further consideration and discussion of the foregoing, the Board concluded that the fees to be paid to GCI by the GCI Fund were fair and reasonable in light of the services to be provided.
4. The extent to which economies of scale would be realized as the GCI Fund grows and whether advisory fee levels reflect these economies of scale for the benefit of the GCI Fund’s investors. In this regard, the Board considered the GCI Fund’s fee arrangements with GCI. The Board noted that the management fee would stay the same as asset levels increased, although it also noted that the shareholders of the GCI Fund would benefit from an Expense Limitation Agreement. The Board also noted that the GCI Fund would benefit from economies of scale under the Trust’s agreements with service providers other than GCI. Following further discussion of the GCI Fund’s projected asset levels, expectations for growth, and levels of fees, the Board determined that the GCI Fund’s fee arrangements with GCI were fair and reasonable in relation to the nature and quality of the services to be provided by GCI.
5. Possible conflicts of interest and benefits to GCI. In evaluating the possibility for conflicts of interest, the Board considered such matters as: the experience and ability of the advisory personnel assigned to the GCI Fund; the basis of decisions to buy or sell securities for the GCI Fund and/or GCI’s other accounts; the substance and administration of GCI’s code of ethics and other relevant policies described in GCI’s Form ADV. With respect to benefits to GCI (in addition to the fees under the GCI Agreement), the Board noted that GCI expects that its relationship with the GCI Fund will bring exposure to its strategy to a wider audience, which would be expected to increase GCI’s assets under management. Following further consideration and discussion, the Board determined that GCI’s standards and practices relating to the identification and mitigation of potential conflicts of interest were satisfactory and the anticipated benefits to be realized by GCI from managing the GCI Fund were acceptable.
After additional consideration of the relevant factors and further discussion among the Board members, the Board determined to approve the GCI Agreement.
20
Proxy Voting
A description of the policies and procedures that the Fund uses to determine how to vote proxies relating to portfolio securities and information regarding how the Fund voted those proxies during the most recent twelve month period ended June 30, are available (1) without charge upon request by calling the Fund at (713) 401-9048 and (2) in Fund documents filed with the SEC on the SEC’s website at www.sec.gov.
TRUSTEES Andrea N. Mullins, Chairperson Ira P. Cohen Mark J. Seger
OFFICERS Matthew J. Miller, Principal Executive Officer and President Zachary P. Richmond, Principal Financial Officer and Treasurer N. Lynn Bowley, Chief Compliance Officer Carol J. Highsmith, Vice President and Secretary
INVESTMENT ADVISER GCI Investors 7880 San Felipe Street, Suite 240 Houston, TX 77063
DISTRIBUTOR Northern Lights Distributors, LLC 17605 Wright Street Omaha, Nebraska 68130 |
INDEPENDENT REGISTERED PUBLIC ACCOUNTING FIRM Cohen & Company, Ltd. 1350 Euclid Avenue, Suite 800 Cleveland, OH 44115
LEGAL COUNSEL Troutman Pepper Hamilton Sanders LLP 3000 Two Logan Square 18th and Arch Streets Philadelphia, PA 19103
CUSTODIAN AND TRANSFER AGENT Brown Brothers Harriman & Co. 50 Post Office Square Boston, MA 02110
ADMINISTRATOR AND FUND ACCOUNTANT Ultimus Fund Solutions, LLC 225 Pictoria Drive, Suite 450 Cincinnati, OH 45246 |
This report is intended only for the information of shareholders or those who have received the Fund’s prospectus which contains information about the Fund’s management fee and expenses. Please read the prospectus carefully before investing.
Distributed by Northern Lights Distributors, LLC Member FINRA/SIPC
GENUINE-SAR-22
(b) Not applicable
Item 2. Code of Ethics. Not applicable – disclosed with annual report
Item 3. Audit Committee Financial Expert. Not applicable – disclosed with annual report
Item 4. Principal Accountant Fees and Services. Not applicable – disclosed with annual report
Item 5. Audit Committee of Listed Companies. Not applicable – applies to listed companies only
Item 6. Schedule of Investments. Schedules filed with Item 1.
Item 7. Disclosure of Proxy Voting Policies and Procedures for Closed-End Management Investment Companies. Not applicable – applies to closed-end funds only
Item 8. Portfolio Managers of Closed-End Investment Companies. Not applicable – applies to closed-end funds only
Item 9. Purchases of Equity Securities by Closed-End Management Investment Company and Affiliated Purchasers. Not applicable – applies to closed-end funds only
Item 10. Submission of Matters to a Vote of Security Holders.
The guidelines applicable to shareholders desiring to submit recommendations for nominees to the Registrant's board of trustees are contained in the statement of additional information of the Trust with respect to the Fund(s) for which this Form N-CSR is being filed.
Item 11. Controls and Procedures.
(a) Based on their evaluation of the registrant’s disclosure controls and procedures (as defined in Rule 30a-3(c) under the Investment Company Act of 1940, as amended (the “Act”)) as of a date within 90 days of the filing date of this report, the registrant’s principal executive officer and principal financial officer have concluded that such disclosure controls and procedures are reasonably designed and are operating effectively to ensure that material information relating to the registrant is made known to them by others within those entities, particularly during the period in which this report is being prepared, and that the information required in filings on Form N-CSR is recorded, processed, summarized, and reported on a timely basis.
(b) There were no changes in the registrant’s internal control over financial reporting (as defined in Rule 30a-3(d) under the Investment Company Act of 1940) that occurred during the period covered by this report that have materially affected, or are reasonably likely to materially affect, the registrant’s internal control over financial reporting.
Item 12. Disclosure of Securities Lending Activities for Closed-End Management Investment Companies. Not applicable – applies to closed-end funds only
Item 13. Exhibits.
(a) (1) Not applicable – disclosed with annual report
| (3) | Not Applicable |
| (b) | Certification pursuant to 18 U.S.C. Section 1350, as adopted pursuant to Section 906 of the Sarbanes-Oxley Act of 2002 is filed herewith. |
Pursuant to the requirements of the Securities Exchange Act of 1934 and the Investment Company Act of 1940, the registrant has duly caused this report to be signed on its behalf by the undersigned, thereunto duly authorized.
(Registrant) Valued Advisers Trust
By /s/ Matthew J. Miller
Matthew J. Miller, President and Principal Executive Officer
Date 7/6/2022
Pursuant to the requirements of the Securities Exchange Act of 1934 and the Investment Company Act of 1940, this report has been signed below by the following persons on behalf of the registrant and in the capacities and on the dates indicated.
By /s/ Matthew J. Miller
Matthew J. Miller, President and Principal Executive Officer
Date 7/6/2022
By /s/ Zachary P. Richmond
Zachary P. Richmond, Treasurer and Principal Financial Officer
Date 7/6/2022
Exhibit 99.CERT
SECTION 302 CERTIFICATIONS
CERTIFICATION OF PRESIDENT
CERTIFICATIONS
I, Matthew J. Miller, certify that:
1. I have reviewed this report on Form N-CSR of Valued Advisers Trust;
| 2. | Based on my knowledge, this report does not contain any untrue statement of a material fact or omit to state a material fact necessary to make the statements made, in light of the circumstances under which such statements were made, not misleading with respect to the period covered by this report; |
| 3. | Based on my knowledge, the financial statements, and other financial information included in this report, fairly present in all material respects the financial condition, results of operations, changes in net assets, and cash flows (if the financial statements are required to include a statement of cash flows) of the registrant as of, and for, the periods presented in this report; |
| 4. | The registrant's other certifying officer(s) and I are responsible for establishing and maintaining disclosure controls and procedures (as defined in Rule 30a-3(c) under the Investment Company Act of 1940) and internal control over financial reporting (as defined in Rule 30a-3(d) under the Investment Company Act of 1940) for the registrant and have: |
| a) | designed such disclosure controls and procedures, or caused such disclosure controls and procedures to be designed under our supervision, to ensure that material information relating to the registrant, including its consolidated subsidiaries, is made known to us by others within those entities, particularly during the period in which this report is being prepared; |
| b) | designed such internal control over financial reporting, or caused such internal control over financial reporting to be designed under our supervision, to provide reasonable assurance regarding the reliability of financial reporting and the preparation of financial statements for external purposes in accordance with generally accepted accounting principles; |
| c) | evaluated the effectiveness of the registrant's disclosure controls and procedures and presented in this report our conclusions about the effectiveness of the disclosure controls and procedures, as of a date within 90 days prior to the filing date of this report based on such evaluation; and |
| d) | Disclosed in this report any change in the registrant’s internal control over financial reporting that occurred during the period covered by this report that has materially affected, or is reasonably likely to materially affect, the registrant’s internal control over financial reporting; and |
| 5. | The registrant's other certifying officer(s) and I have disclosed to the registrant's auditors and the audit committee of the registrant's board of directors (or persons performing the equivalent functions): |
| a) | all significant deficiencies and material weaknesses in the design or operation of internal control over financial reporting which are reasonably likely to adversely affect the registrant's ability to record, process, summarize, and report financial information; and |
| b) | any fraud, whether or not material, that involves management or other employees who have a significant role in the registrant's internal control over financial reporting. |
| Date: 7/6/2022 | /s/ Matthew J. Miller | |
| Matthew J. Miller | ||
| President and Principal Executive Officer |
SECTION 302 CERTIFICATIONS
CERTIFICATION OF CHIEF FINANCIAL OFFICER
CERTIFICATIONS
I, Zachary P. Richmond, certify that:
1. I have reviewed this report on Form N-CSR of Valued Advisers Trust;
| 2. | Based on my knowledge, this report does not contain any untrue statement of a material fact or omit to state a material fact necessary to make the statements made, in light of the circumstances under which such statements were made, not misleading with respect to the period covered by this report; |
| 3. | Based on my knowledge, the financial statements, and other financial information included in this report, fairly present in all material respects the financial condition, results of operations, changes in net assets, and cash flows (if the financial statements are required to include a statement of cash flows) of the registrant as of, and for, the periods presented in this report; |
| 4. | The registrant's other certifying officer(s) and I are responsible for establishing and maintaining disclosure controls and procedures (as defined in Rule 30a-3(c) under the Investment Company Act of 1940) and internal control over financial reporting (as defined in Rule 30a-3(d) under the Investment Company Act of 1940) for the registrant and have: |
| a) | designed such disclosure controls and procedures, or caused such disclosure controls and procedures to be designed under our supervision, to ensure that material information relating to the registrant, including its consolidated subsidiaries, is made known to us by others within those entities, particularly during the period in which this report is being prepared; |
| b) | designed such internal control over financial reporting, or caused such internal control over financial reporting to be designed under our supervision, to provide reasonable assurance regarding the reliability of financial reporting and the preparation of financial statements for external purposes in accordance with generally accepted accounting principles; |
| c) | evaluated the effectiveness of the registrant's disclosure controls and procedures and presented in this report our conclusions about the effectiveness of the disclosure controls and procedures, as of a date within 90 days prior to the filing date of this report based on such evaluation; and |
| d) | Disclosed in this report any change in the registrant’s internal control over financial reporting that occurred during the period covered by this report that has materially affected, or is reasonably likely to materially affect, the registrant’s internal control over financial reporting; and |
| 5. | The registrant's other certifying officer(s) and I have disclosed to the registrant's auditors and the audit committee of the registrant's board of directors (or persons performing the equivalent functions): |
| a) | all significant deficiencies and material weaknesses in the design or operation of internal control over financial reporting which are reasonably likely to adversely affect the registrant's ability to record, process, summarize, and report financial information; and |
| b) | any fraud, whether or not material, that involves management or other employees who have a significant role in the registrant's internal control over financial reporting. |
| Date 7/6/2022 | /s/ Zachary P. Richmond | |
| Zachary P. Richmond | ||
| Treasurer and Principal Financial Officer |
EX-99.906CERT
certification of president and Treasurer pursuant to 18 U.S.C. section 1350, as adopted pursuant to section 906 of the sarbanes oxley act of 2002
Matthew J. Miller, President, and Zachary P. Richmond, Treasurer of Valued Advisers Trust (the “Registrant”), each certify to the best of his or her knowledge that:
| 1. | The Registrant’s periodic report on Form N-CSR for the period ended April 30, 2022 (the “Form N-CSR”) fully complies with the requirements of Sections 15(d) of the Securities Exchange Act of 1934, as amended; and |
| 2. | The information contained in the Form N-CSR fairly presents, in all material respects, the financial condition and results of operations of the Registrant. |
| President and Principal Executive Officer | Treasurer and Principal Financial Officer |
| Valued Advisers Trust | Valued Advisers Trust |
| /s/ Matthew J. Miller | /s/ Zachary P. Richmond |
| Matthew J. Miller | Zachary P. Richmond |
| Date: 7/6/2022 | Date: 7/6/2022 |
A signed original of this written statement required by Section 906 of the Sarbanes-Oxley Act of 2002 has been provided to Valued Advisers Trust and will be retained by Valued Advisers Trust and furnished to the Securities and Exchange Commission (the “Commission”) or its staff upon request.
This certification is being furnished to the Commission solely pursuant to 18 U.S.C. § 1350 and is not being filed as part of the Form N-CSR filed with the Commission.
Serious News for Serious Traders! Try StreetInsider.com Premium Free!
You May Also Be Interested In
- Form 8.5 (EPT/RI) - Pharos Energy Plc
- BC Token Hits Record $0.01561 as BC Engine Expands Utility Across BC.GAME
- Honeywell Technologies Completes Acquisition of Johnson Matthey’s Catalyst Technologies Business
Create E-mail Alert Related Categories
SEC FilingsSign up for StreetInsider Free!
Receive full access to all new and archived articles, unlimited portfolio tracking, e-mail alerts, custom newswires and RSS feeds - and more!