

Form N-CSRS SOURCE CAPITAL INC /DE/ For: Jun 30
 Tweet
Tweet Share
Share
UNITED STATES
SECURITIES AND EXCHANGE COMMISSION
Washington, D.C. 20549
FORM N-CSR
CERTIFIED SHAREHOLDER REPORT OF REGISTERED
MANAGEMENT INVESTMENT COMPANIES
|
Investment Company Act file number |
811-01731 | |||||||
|
| ||||||||
|
SOURCE CAPITAL, INC. | ||||||||
|
(Exact name of registrant as specified in charter) | ||||||||
|
| ||||||||
|
11601 WILSHIRE BLVD., STE. 1200 LOS ANGELES, CALIFORNIA |
|
90025 | ||||||
|
(Address of principal executive offices) |
|
(Zip code) | ||||||
|
|
|
| ||||||
|
(Name and address of agent for service) |
|
Copy to: | ||||||
|
|
|
| ||||||
|
J. RICHARD ATWOOD, PRESIDENT |
|
MARK D. PERLOW, ESQ. | ||||||
|
| ||||||||
|
Registrant’s telephone number, including area code: |
(310) 473-0225 |
| ||||||
|
| ||||||||
|
Date of fiscal year end: |
December 31 |
| ||||||
|
| ||||||||
|
Date of reporting period: |
June 30, 2018 |
| ||||||
Item 1: Report to Shareholders.

SOURCE CAPITAL, INC.
SEMIANNUAL REPORT
for the six months ended June 30, 2018
SOURCE CAPITAL, INC.
LETTER TO SHAREHOLDERS
DEAR SHAREHOLDERS:
Performance
During the second quarter of 2018, the net asset value per share return of Source Capital (or the "Fund") was 0.40%, and 0.23% on a market price basis (both percentages including the reinvestment of the distributions paid during the period). These changes compare with a 3.43% return for the S&P 500 Index, a -0.16% return for the Bloomberg Barclays U.S. Aggregate Bond Index and a 1.99% return for the 60/40 blended S&P 500/ Bloomberg Barclays U.S. Aggregate benchmark during the same period. For the calendar year to date period, the net asset value per share return of the Fund was -0.50%, and -1.29% on a market price basis (both percentages including the reinvestment of the distributions paid during the period). These changes compare with returns of 2.65%, -1.62% and 1.00% for the S&P 500 Index, the Bloomberg Barclays U.S. Aggregate Bond Index and the 60/40 blended S&P 500/ Bloomberg Barclays U.S. Aggregate benchmark during the same period, respectively.1
The Fund's top five winners and losers for the second quarter of 2018 are presented below. The winners contributed 1.47%, while the losers detracted -1.56%.2
| Winners |
Performance Contribution |
Losers |
Performance Contribution |
||||||||||||
|
|
0.36 |
% |
Arconic |
-0.70 |
% |
||||||||||
|
Microsoft |
0.30 |
% |
Mylan |
-0.28 |
% |
||||||||||
|
Alphabet |
0.30 |
% |
TE Connectivity |
-0.28 |
% |
||||||||||
|
Baidu |
0.27 |
% |
Bank of America |
-0.17 |
% |
||||||||||
|
Kinder Morgan |
0.24 |
% |
Oracle |
-0.13 |
% |
||||||||||
Equities
Growth continued to outperform value year-to-date, hurting the Fund's performance relative to the broader benchmarks. The Russell 1000 Growth Index returned 7.25%, while the Russell 1000 Value Index declined -1.69% in the first half of the year.
One needn't look much further than the investments that had the greatest impact on the Fund's Q2 performance to drive this point home. The top four contributors are considered "growth" companies. The holdings that hurt Q2's performance largely fall in the "value" category.
For equities, our strategy is largely to purchase equity in undervalued businesses. If we have correctly assessed the opportunity, we believe our investments can deliver a better than market rate of return by virtue of a discounted valuation. The market will define some of these investments as value and others as growth.
Buying growing businesses with an adequate margin of safety is just as much a value investment as buying, say, a financial firm at a discount to tangible book value or a holding company at a discount to readily ascertainable net asset value. We've held all three types of investments in our portfolio over the past decade.
When analyzing businesses, we focus on the key performance indicators that we believe matter. Sometimes financial statements tell the story, and in those cases, investments typically appear "cheap" based on reported financial results. In other situations, information not in the financial statements might be most relevant, for instance, data like a company's position on the cost curve, its subscribers/user base, its total addressable market, its customer acquisition cost, the lifetime value of a customer, or real asset marked-to-market. In these situations, our holding might appear "expensive" based on reported financial results, but not when one looks at these other factors. Our value approach is the same no matter what the ultimate driver of intrinsic value.
We suspect that balance sheet sources of value will prove a less fertile source of opportunities than in the past, given evolutionary changes in the economy and business models over the past thirty years. In the past few years, the team has spent much time building a base of knowledge in businesses that are capital light, demonstrate outstanding economics and are likely to offer substantial organic growth over the next decade. Some of these companies are too hard for us to underwrite and others trade at values that seem devoid of a margin of safety, but others, like Facebook, Expedia, JD.com and Baidu, have made it into our portfolio.
1 Comparison to the S&P 500 Index and the Bloomberg Barclays U.S. Aggregate Index is for illustrative purposes only. The Fund does not include outperformance of any index or benchmark in its investment objectives.
2 Reflects the top contributors and top detractors to the Fund's performance based on contribution to return for the quarter. Contribution is presented gross of investment management fees, transactions costs and Fund operating expenses, which if included, would reduce the returns presented.
1
SOURCE CAPITAL, INC.
Admittedly, no bright line divides growth and value. Lacking a more robust methodology, index funds place some companies into both buckets. A company with a low price-to-earnings ratio but a high price-to-book may find some portion of its market capitalization allocated to a value index and the remainder in a growth index.
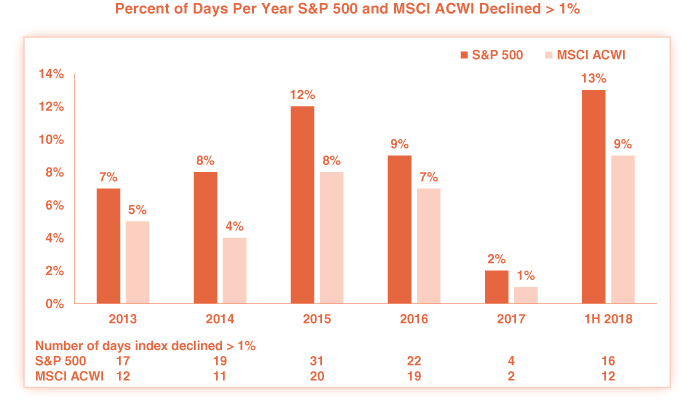
With active and passive funds building ever larger exposure to growth stocks, the lack of oxygen left in the room for value stocks has triggered some wilting in price. That, along with somewhat higher volatility, has allowed us to initiate new positions.
Last year the U.S. market posted the lowest volatility on record, but 2018 has seen bigger ups and downs.3 The S&P 500 has already declined more than 1% on four times as many trading days in 2018 than in all of last year; the MSCI ACWI, six times as many.
Source: Bloomberg
3 The VIX Index
2
SOURCE CAPITAL, INC.
When investors become fearful, we like to take advantage of indiscriminate selling. In the first half of the year, that allowed us to establish ten new long positions and exit five. This is more portfolio movement than we've had in years.
Fixed Income
At mid-year, the investment community appears to be comfortable with a gradual increase in the Fed Funds rate. The Federal Reserve began tightening monetary policy via increases in the Fed Funds rate in December 2015. The next increase occurred at the end of 2016, followed by three increases in 2017 and a market expectation of three or four increases this year. The chart below compares the yield curves as of December 15, 2015 (green line) and June 30, 2018 (blue line).

Source: Bloomberg.
The chart shows that increasing rates on the short end of the curve have been accompanied by less significant increases in other parts of the curve, causing the yield curve to flatten significantly over the past two-and-a-half years.
One immediate impact of the Fed's tightening path is that it has introduced more yield into bond markets, particularly in the one- to five-year portion of the yield curve. As we have stated before, as long as rates are sufficient to compensate us for taking on duration risk, we are willing to do so.
Open Market Repurchases
We started the quarter with the market discount to net asset value of 10.16% and ended the quarter with the discount at 10.35%. We repurchased 3,128 shares in the second quarter of 2018 at an average discount of 10.54%. While the number of shares repurchased was modest, it was accretive to shareholders by adding $0.002 per share to the Fund's NAV.
As a reminder, Source Capital is authorized to make open-market repurchases of its common stock of up to 10% of the Fund's outstanding shares at such times as its shares trade at a greater than 10% discount to the Fund's net asset value, when in FPA's judgment such repurchases would benefit shareholders, subject to various factors, including the limitations imposed by the federal securities laws governing the repurchase of an issuer's stock by the issuer and the managers' ability to raise cash to repurchase shares in a tax-efficient manner. There is no assurance that Source Capital will purchase shares at any specific discount levels or in any specific amounts.
Respectfully submitted,
Source Capital Portfolio Management Team
July 2018
3
SOURCE CAPITAL, INC.
Important Disclosures
On December 1, 2015, a new portfolio management team assumed management of the Fund and the Fund transitioned to a balanced strategy. Performance prior to December 1, 2015 reflects the performance of the prior portfolio manager and investment strategy and is not indicative of performance for any subsequent periods.
Performance data quoted represents past performance, which is no guarantee of future results. Current performance may vary from the performance quoted. The Fund is managed according to its investment strategy which may differ significantly in terms of security holdings, industry weightings, and asset allocation from those of the benchmark(s). Overall Fund performance, characteristics and volatility may differ from the benchmark(s) shown.
The views expressed herein and any forward-looking statements are as of the date of this publication and are those of the portfolio management team. Future events or results may vary significantly from those expressed and are subject to change at any time in response to changing circumstances and industry developments. This information and data has been prepared from sources believed reliable, but the accuracy and completeness of the information cannot be guaranteed and is not a complete summary or statement of all available data.
Portfolio composition will change due to ongoing management of the Fund. References to individual securities are for informational purposes only and should not be construed as recommendations by the Fund or the portfolio managers. It should not be assumed that future investments will be profitable or will equal the performance of the security examples discussed. Please visit our website, www.sourcecapitalinc.com, for a complete list of portfolio holdings.
Investing in closed-end funds involves risk, including loss of principal. Closed-end fund shares may frequently trade at a discount or premium to their net asset value. In addition, there is no guarantee the Fund's investment objectives will be achieved. You should consider the Fund's investment objectives, risks, and charges and expenses carefully before you invest.
Stock markets are volatile and can decline significantly in response to adverse issuer, political, regulatory, market, or economic developments. It is important to remember that there are risks inherent in any investment and there is no assurance that any investment or asset class will provide positive performance over time.
Non-U.S. investing presents additional risks, such as the potential for adverse political, currency, economic, social or regulatory developments in a country, including lack of liquidity, excessive taxation, and differing legal and accounting standards. Non-U.S. securities, including American Depository Receipts (ADRs) and other depository receipts, are also subject to interest rate and currency exchange rate risks.
The return of principal in a fund that invests in fixed income securities is not guaranteed. The Fund's investments in fixed income securities have the same issuer, interest rate, inflation and credit risks that are associated with underlying bonds owned by the Fund. Lower rated bonds, convertible securities and other types of debt obligations involve greater risks than higher rated bonds.
When interest rates go up, the value of fixed income securities, such as bonds, typically go down and investors may lose principal value. Credit risk is the risk of loss of principle due to the issuer's failure to repay a loan. Generally, the lower the quality rating of a security, the greater the risk that the issuer will fail to pay interest fully and return principal in a timely manner. If an issuer defaults, the security may lose some or all its value.
Mortgage securities and collateralized mortgage obligations (CMOs) are subject to prepayment risk and the risk of default on the underlying mortgages or other assets; such derivatives may increase volatility. Convertible securities are generally not investment grade and are subject to greater credit risk than higher-rated investments. High yield securities can be volatile and subject to much higher instances of default. The Fund may experience increased costs, losses and delays in liquidating underlying securities should the seller of a repurchase agreement declare bankruptcy or default.
Value style investing presents the risk that the holdings or securities may never reach their full market value because the market fails to recognize what the portfolio management team considers the true business value or because the portfolio management team has misjudged those values. In addition, value style investing may fall out of favor and underperform growth or other styles of investing during given periods.
Index Definitions
S&P 500 Index includes a representative sample of 500 leading companies in leading industries of the U.S. economy. The index focuses on the large-cap segment of the market, with over 80% coverage of U.S. equities, but is also considered a proxy for the total market.
The Barclays U.S. Aggregate Bond Index provides a measure of the performance of the U.S. investment grade bonds market, which includes investment grade U.S. Government bonds, investment grade corporate bonds, mortgage pass-through securities and asset-backed securities that are publicly offered for sale in the United States. The securities in the Index must have at least 1-year remaining in maturity. In addition, the securities must be denominated in U.S. dollars and must be fixed rate, nonconvertible, and taxable.
4
SOURCE CAPITAL, INC.
60% S&P 500/40% Barclays Aggregate Index is a hypothetical combination of unmanaged indices comprised of 60% S&P 500 Index and 40% Barclays U.S. Aggregate Bond Index, representing the Fund's neutral mix of 60% stocks and 40% bonds.
Indices are unmanaged, do not reflect any commissions or fees which would be incurred by an investor purchasing the underlying securities. Investors cannot invest directly in an index.
You can obtain additional information by visiting the website at www.fpa.com, by email at [email protected], toll free by calling 1-800-279-1241 (option 1), or by contacting the Fund in writing.
The discussion of Fund investments represents the views of the Fund's managers at the time of this report and are subject to change without notice. References to individual securities are for informational purposes only and should not be construed as recommendations to purchase or sell individual securities. While the Fund's managers believe that the Fund's holdings are value stocks, there can be no assurance that others will consider them as such. Further, investing in value stocks presents the risk that value stocks may fall out of favor with investors and underperform growth stocks during given periods.
The Russell 2500 Index is an unmanaged index comprised of the 2,500 smallest companies in the Russell 3000 Index. The Russell 3000 Index measures the performance of the 3,000 largest U.S. companies based on total market capitalization. The S&P 500 Index is an index of 500 companies with large market capitalization.
FORWARD LOOKING STATEMENT DISCLOSURE
As managers, one of our responsibilities is to communicate with shareholders in an open and direct manner. Insofar as some of our opinions and comments in our letters to shareholders are based on our current expectations, they are considered "forward-looking statements," which may or may not be accurate over the long term. While we believe we have a reasonable basis for our comments and have confidence in our opinions, actual results may differ materially from those we anticipate. You can identify forward-looking statements by words such as "believe," "expect," "may," "anticipate," and other similar expressions when discussing prospects for particular portfolio holdings and/or the markets, generally. We cannot, however, assure future results and disclaim any obligation to update or alter any forward-looking statements, whether as a result of new information, future events, or otherwise. Further, information provided in this report should not be construed as a recommendation to purchase or sell any particular security.
5
SOURCE CAPITAL, INC.
PORTFOLIO SUMMARY
June 30, 2018
(Unaudited)
|
Common Stocks |
64.3 |
% |
|||||||||
|
Internet Media |
8.5 |
% |
|||||||||
|
Infrastructure Software |
6.5 |
% |
|||||||||
|
Diversified Banks |
5.5 |
% |
|||||||||
|
Aircraft & Parts |
5.4 |
% |
|||||||||
|
P&C Insurance |
3.7 |
% |
|||||||||
|
Semiconductor Devices |
3.6 |
% |
|||||||||
|
Cable & Satellite |
3.6 |
% |
|||||||||
|
Insurance Brokers |
3.1 |
% |
|||||||||
|
Consumer Finance |
2.7 |
% |
|||||||||
|
Electrical Components |
2.5 |
% |
|||||||||
|
Investment Companies |
2.1 |
% |
|||||||||
|
Internet Based Services |
2.0 |
% |
|||||||||
|
Generic Pharma |
1.9 |
% |
|||||||||
|
Cement & Aggregates |
1.9 |
% |
|||||||||
|
Advertising & Marketing |
1.8 |
% |
|||||||||
|
Banks |
1.6 |
% |
|||||||||
|
Midstream-Oil & Gas |
1.5 |
% |
|||||||||
|
Life Science Equipment |
1.4 |
% |
|||||||||
|
Packaged Food |
1.2 |
% |
|||||||||
|
Communications Equipment |
1.2 |
% |
|||||||||
|
Household Products |
0.7 |
% |
|||||||||
|
Integrated Oils |
0.6 |
% |
|||||||||
|
Food & Drug Stores |
0.5 |
% |
|||||||||
|
E-Commerce Discretionary |
0.4 |
% |
|||||||||
|
Base Metals |
0.4 |
% |
|||||||||
|
Bonds & Debentures |
33.7 |
% |
|||||||||
|
Asset-Backed Securities |
18.9 |
% |
|||||||||
|
Residential Mortgage-Backed Securities |
6.4 |
% |
|||||||||
|
Commercial Mortgage-Backed Securities |
3.7 |
% |
|||||||||
|
U.S. Treasuries |
2.6 |
% |
|||||||||
|
Corporate Bank Debt |
1.1 |
% |
|||||||||
|
Corporate Bonds & Notes |
1.0 |
% |
|||||||||
|
Short-term Investments |
2.7 |
% |
|||||||||
|
Other Assets And Liabilities, Net |
(0.7 |
)% |
|||||||||
|
Net Assets |
100.0 |
% |
|||||||||
6
SOURCE CAPITAL, INC.
PORTFOLIO OF INVESTMENTS
June 30, 2018
(Unaudited)
|
COMMON STOCKS |
Shares |
Fair Value |
|||||||||
|
INTERNET MEDIA — 8.5% |
|||||||||||
|
Alphabet, Inc. (Class A)(a) |
6,539 |
$ |
7,383,773 |
||||||||
|
Alphabet, Inc. (Class C)(a) |
6,581 |
7,342,093 |
|||||||||
|
Baidu, Inc. (ADR) (China)(a) |
42,839 |
10,409,877 |
|||||||||
|
Facebook, Inc. (Class A)(a) |
38,190 |
7,421,081 |
|||||||||
|
$ |
32,556,824 |
||||||||||
|
INFRASTRUCTURE SOFTWARE — 6.5% |
|||||||||||
|
Microsoft Corporation |
91,997 |
$ |
9,071,824 |
||||||||
|
Oracle Corporation |
357,877 |
15,768,061 |
|||||||||
|
$ |
24,839,885 |
||||||||||
|
DIVERSIFIED BANKS — 5.5% |
|||||||||||
|
Bank of America Corporation |
406,117 |
$ |
11,448,438 |
||||||||
|
Citigroup, Inc. |
142,450 |
9,532,754 |
|||||||||
|
$ |
20,981,192 |
||||||||||
|
AIRCRAFT & PARTS — 5.4% |
|||||||||||
|
Arconic, Inc. |
533,257 |
$ |
9,070,702 |
||||||||
|
United Technologies Corporation |
92,528 |
11,568,776 |
|||||||||
|
$ |
20,639,478 |
||||||||||
|
P&C INSURANCE — 3.7% |
|||||||||||
|
American International Group, Inc. |
264,180 |
$ |
14,006,824 |
||||||||
|
SEMICONDUCTOR DEVICES — 3.6% |
|||||||||||
|
Analog Devices, Inc. |
92,880 |
$ |
8,909,049 |
||||||||
|
Broadcom, Inc. |
20,126 |
4,883,373 |
|||||||||
|
$ |
13,792,422 |
||||||||||
|
CABLE & SATELLITE — 3.6% |
|||||||||||
|
Charter Communications, Inc. (Class A)(a) |
21,472 |
$ |
6,295,805 |
||||||||
|
Comcast Corp. (Class A) |
221,715 |
7,274,469 |
|||||||||
|
$ |
13,570,274 |
||||||||||
|
INSURANCE BROKERS — 3.1% |
|||||||||||
|
Aon plc (Britain) |
86,962 |
$ |
11,928,578 |
||||||||
|
CONSUMER FINANCE — 2.7% |
|||||||||||
|
Ally Financial, Inc. |
224,180 |
$ |
5,889,209 |
||||||||
|
American Express Co. |
46,310 |
4,538,380 |
|||||||||
|
$ |
10,427,589 |
||||||||||
|
ELECTRICAL COMPONENTS — 2.5% |
|||||||||||
|
TE Connectivity, Ltd. (Switzerland) |
106,190 |
$ |
9,563,472 |
||||||||
|
INVESTMENT COMPANIES — 2.1% |
|||||||||||
|
Groupe Bruxelles Lambert SA (Belgium) |
77,290 |
$ |
8,152,217 |
||||||||
|
INTERNET BASED SERVICES — 2.0% |
|||||||||||
|
Expedia, Inc. |
62,170 |
$ |
7,472,212 |
||||||||
|
GENERIC PHARMA — 1.9% |
|||||||||||
|
Mylan NV(a) |
201,310 |
$ |
7,275,343 |
||||||||
|
CEMENT & AGGREGATES — 1.9% |
|||||||||||
|
HeidelbergCement AG (Germany) |
25,802 |
$ |
2,171,884 |
||||||||
|
LafargeHolcim Ltd. (Switzerland) |
103,294 |
5,046,313 |
|||||||||
|
$ |
7,218,197 |
||||||||||
7
SOURCE CAPITAL, INC.
PORTFOLIO OF INVESTMENTS (Continued)
June 30, 2018
(Unaudited)
| COMMON STOCKS (Continued) |
Shares or Principal Amount |
Fair Value |
|||||||||
|
ADVERTISING & MARKETING — 1.8% |
|||||||||||
|
WPP plc (Britain) |
436,170 |
$ |
6,867,332 |
||||||||
|
BANKS — 1.6% |
|||||||||||
|
Wells Fargo & Co. |
107,980 |
$ |
5,986,411 |
||||||||
|
MIDSTREAM-OIL & GAS — 1.5% |
|||||||||||
|
Kinder Morgan, Inc. |
315,100 |
$ |
5,567,817 |
||||||||
|
LIFE SCIENCE EQUIPMENT — 1.4% |
|||||||||||
|
Thermo Fisher Scientific, Inc. |
26,680 |
$ |
5,526,495 |
||||||||
|
PACKAGED FOOD — 1.2% |
|||||||||||
|
Mondelez International, Inc. (Class A) |
116,310 |
$ |
4,768,710 |
||||||||
|
COMMUNICATIONS EQUIPMENT — 1.2% |
|||||||||||
|
Cisco Systems, Inc. |
106,511 |
$ |
4,583,168 |
||||||||
|
HOUSEHOLD PRODUCTS — 0.7% |
|||||||||||
|
Unilever NV (CVA) (Britain) |
47,620 |
$ |
2,657,354 |
||||||||
|
INTEGRATED OILS — 0.6% |
|||||||||||
|
Lukoil PJSC (ADR) (Russia) |
33,940 |
$ |
2,320,817 |
||||||||
|
FOOD & DRUG STORES — 0.5% |
|||||||||||
|
Jardine Strategic Holdings, Ltd. (Hong Kong) |
56,030 |
$ |
2,043,974 |
||||||||
|
E-COMMERCE DISCRETIONARY — 0.4% |
|||||||||||
|
JD.com, Inc. (ADR) (China)(a) |
36,465 |
$ |
1,420,312 |
||||||||
|
BASE METALS — 0.4% |
|||||||||||
|
Alcoa Corporation(a) |
24,800 |
$ |
1,162,624 |
||||||||
|
MMC Norilsk Nickel PJSC (ADR) (Russia) |
11,860 |
212,887 |
|||||||||
|
$ |
1,375,511 |
||||||||||
| TOTAL COMMON STOCKS — 64.3% (Cost $207,318,569) |
$ |
245,542,408 |
|||||||||
|
BONDS & DEBENTURES |
|||||||||||
|
COMMERCIAL MORTGAGE-BACKED SECURITIES — 3.7% |
|||||||||||
|
AGENCY — 0.0% |
|||||||||||
|
Government National Mortgage Association 2011-49 A — 2.45% 7/16/2038 |
$ |
41,961 |
$ |
41,877 |
|||||||
|
AGENCY STRIPPED — 2.2% |
|||||||||||
|
Government National Mortgage Association 2014-171 IO — 0.675% 11/16/2055(b) |
$ |
15,645,109 |
$ |
586,082 |
|||||||
|
Government National Mortgage Association 2012-58 IO — 0.714% 2/16/2053(b) |
12,026,754 |
392,079 |
|||||||||
|
Government National Mortgage Association 2015-86 IO — 0.772% 5/16/2052(b) |
2,957,531 |
156,853 |
|||||||||
|
Government National Mortgage Association 2012-79 IO — 0.772% 3/16/2053(b) |
7,480,100 |
281,751 |
|||||||||
|
Government National Mortgage Association 2013-63 IO — 0.79% 9/16/2051(b) |
17,533,301 |
897,526 |
|||||||||
|
Government National Mortgage Association 2013-74 IO — 0.795% 12/16/2053(b) |
18,883,769 |
891,206 |
|||||||||
|
Government National Mortgage Association 2014-153 IO — 0.796% 4/16/2056(b) |
11,842,812 |
639,025 |
|||||||||
|
Government National Mortgage Association 2012-109 IO — 0.802% 10/16/2053(b) |
12,919,770 |
437,527 |
|||||||||
|
Government National Mortgage Association 2012-114 IO — 0.803% 1/16/2053(b) |
16,351,676 |
820,228 |
|||||||||
|
Government National Mortgage Association 2013-146 IO — 0.815% 11/16/2048(b) |
16,474,681 |
624,844 |
|||||||||
|
Government National Mortgage Association 2015-19 IO — 0.843% 1/16/2057(b) |
7,579,380 |
431,431 |
|||||||||
|
Government National Mortgage Association 2014-187 IO — 0.896% 5/16/2056(b) |
7,453,215 |
431,710 |
|||||||||
|
Government National Mortgage Association 2015-114 IO — 0.941% 3/15/2057(b) |
2,113,804 |
125,668 |
|||||||||
|
Government National Mortgage Association 2015-108 IO — 0.95% 10/16/2056(b) |
8,568,783 |
519,430 |
|||||||||
8
SOURCE CAPITAL, INC.
PORTFOLIO OF INVESTMENTS (Continued)
June 30, 2018
(Unaudited)
| BONDS & DEBENTURES (Continued) |
Amount |
Principal Fair Value |
|||||||||
|
Government National Mortgage Association 2016-65 IO — 1.006% 1/16/2058(b) |
$ |
6,353,818 |
$ |
482,592 |
|||||||
|
Government National Mortgage Association 2016-106 IO — 1.032% 9/16/2058(b) |
6,417,176 |
505,012 |
|||||||||
|
Government National Mortgage Association 2016-125 IO — 1.062% 12/16/2057(b) |
3,717,698 |
293,947 |
|||||||||
|
$ |
8,516,911 |
||||||||||
|
NON-AGENCY — 1.5% |
|||||||||||
|
Aventura Mall Trust M 2013-AVM A — 3.867% 12/5/2032(b)(c) |
$ |
970,000 |
$ |
986,902 |
|||||||
|
Bear Stearns Commercial Mortgage Securities Trust 2005-PWR7 B — 5.214% 2/11/2041(b) |
129,224 |
129,609 |
|||||||||
|
Citigroup Commercial Mortgage Trust 2006-C4 B — 6.395% 3/15/2049(b) |
3,415 |
3,428 |
|||||||||
|
COMM Mortgage Trust 2014-FL5 B, 1M LIBOR + 2.150% — 3.183% 10/15/2031(b)(c) |
339,000 |
338,647 |
|||||||||
|
COMM Mortgage Trust 2014-FL5 C, 1M LIBOR + 2.150% — 3.183% 10/15/2031(b)(c) |
226,000 |
224,308 |
|||||||||
|
Credit Suisse Commercial Mortgage Trust Series 2016-MFF E, 1M LIBOR + 6.000% — 8.073% 11/15/2033(b)(c) |
878,000 |
887,253 |
|||||||||
|
DBUBS Mortgage Trust 2011-LC2A A4 — 4.537% 7/10/2044(c) |
1,082,918 |
1,117,309 |
|||||||||
|
JP Morgan Chase Commercial Mortgage Securities Trust 2010-C1 A3 — 5.058% 6/15/2043(c) |
191,000 |
197,186 |
|||||||||
|
Latitude Management Real Estate Capita 2016-CRE2 A, 1M LIBOR + 1.700% — 3.784% 11/24/2031(b)(c) |
444,000 |
448,535 |
|||||||||
|
Madison Avenue Trust M 2013-650M A — 3.843% 10/12/2032(c) |
277,000 |
280,428 |
|||||||||
|
Rialto Real Estate Fund LP 2015-LT7 B — 5.071% 12/25/2032(c) |
70,023 |
70,023 |
|||||||||
|
Wells Fargo Commercial Mortgage Trust 2015-C26 A2 — 2.663% 2/15/2048 |
198,000 |
197,151 |
|||||||||
|
WFRBS Commercial Mortgage Trust 2013-UBS1 A3 — 3.591% 3/15/2046 |
737,000 |
745,054 |
|||||||||
|
$ |
5,625,833 |
||||||||||
| TOTAL COMMERICAL MORTGAGE-BACKED SECURITIES (Cost $14,512,313) |
$ |
14,184,621 |
|||||||||
|
RESIDENTIAL MORTGAGE-BACKED SECURITIES — 6.4% |
|||||||||||
|
AGENCY COLLATERALIZED MORTGAGE OBLIGATION — 2.0% |
|||||||||||
|
Federal Home Loan Mortgage Corporation 4302 AE — 2.00% 11/15/2029 |
$ |
437,980 |
$ |
430,254 |
|||||||
|
Federal Home Loan Mortgage Corporation 4664 TA — 3.00% 9/15/2037 |
176,591 |
176,380 |
|||||||||
|
Federal Home Loan Mortgage Corporation 4504 DN — 3.00% 10/15/2040 |
359,080 |
358,075 |
|||||||||
|
Federal Home Loan Mortgage Corporation 3862 MB — 3.50% 5/15/2026 |
455,000 |
461,786 |
|||||||||
|
Federal National Mortgage Association 2012-117 DA — 1.50% 12/25/2039 |
170,919 |
162,890 |
|||||||||
|
Federal National Mortgage Association 2014-89 LB — 2.00% 6/25/2042 |
125,379 |
122,390 |
|||||||||
|
Federal National Mortgage Association 2017-30 G — 3.00% 7/25/2040 |
271,903 |
269,063 |
|||||||||
|
Federal National Mortgage Association 2013-93 PJ — 3.00% 7/25/2042 |
54,538 |
54,290 |
|||||||||
|
Federal National Mortgage Association 2017-16 JA — 3.00% 2/25/2043 |
789,804 |
784,058 |
|||||||||
|
Federal National Mortgage Association 2018-16 HA — 3.00% 7/25/2043 |
626,287 |
622,948 |
|||||||||
|
Federal National Mortgage Association 2016-104 QA — 3.00% 11/25/2043 |
1,200,805 |
1,190,198 |
|||||||||
|
Federal National Mortgage Association 2014-4 KA — 3.00% 1/25/2044 |
86,797 |
85,239 |
|||||||||
|
Federal National Mortgage Association 2011-98 VE — 3.50% 6/25/2026 |
329,000 |
330,958 |
|||||||||
|
Federal National Mortgage Association 2011-80 KB — 3.50% 8/25/2026 |
327,000 |
331,782 |
|||||||||
|
Federal National Mortgage Association 2017-45 KD — 3.50% 2/25/2044 |
554,014 |
556,486 |
|||||||||
|
Federal National Mortgage Association 2017-52 KC — 3.50% 4/25/2044 |
551,317 |
553,766 |
|||||||||
|
Federal National Mortgage Association 2017-59 DC — 3.50% 5/25/2044 |
771,957 |
775,399 |
|||||||||
|
Federal National Mortgage Association 2003-78 B — 5.00% 8/25/2023 |
218,868 |
228,544 |
|||||||||
|
$ |
7,494,506 |
||||||||||
|
AGENCY POOL FIXED RATE — 1.9% |
|||||||||||
|
Federal Home Loan Mortgage Corporation J16678 — 3.00% 9/1/2026 |
$ |
143,596 |
$ |
143,798 |
|||||||
|
Federal Home Loan Mortgage Corporation G16406 — 3.00% 1/1/2028 |
592,696 |
592,972 |
|||||||||
|
Federal Home Loan Mortgage Corporation G16473 — 3.50% 1/1/2028 |
960,997 |
975,212 |
|||||||||
|
Federal Home Loan Mortgage Corporation G13122 — 5.00% 4/1/2023 |
196,636 |
203,696 |
|||||||||
|
Federal Home Loan Mortgage Corporation G15744 — 5.00% 6/1/2026 |
193,845 |
199,226 |
|||||||||
|
Federal Home Loan Mortgage Corporation G13145 — 5.50% 4/1/2023 |
403,375 |
418,833 |
|||||||||
|
Federal National Mortgage Association MA1212 — 2.50% 10/1/2022 |
331,222 |
328,851 |
|||||||||
9
SOURCE CAPITAL, INC.
PORTFOLIO OF INVESTMENTS (Continued)
June 30, 2018
(Unaudited)
| BONDS & DEBENTURES (Continued) |
Amount |
Principal Fair Value |
|||||||||
|
Federal National Mortgage Association AR6882 — 2.50% 2/1/2028 |
$ |
102,924 |
$ |
101,231 |
|||||||
|
Federal National Mortgage Association AJ6973 — 3.00% 11/1/2026 |
46,973 |
47,081 |
|||||||||
|
Federal National Mortgage Association AJ9387 — 3.00% 12/1/2026 |
23,641 |
23,696 |
|||||||||
|
Federal National Mortgage Association AU3826 — 3.00% 12/1/2026 |
704,285 |
704,582 |
|||||||||
|
Federal National Mortgage Association AL1345 — 3.00% 2/1/2027 |
43,476 |
43,576 |
|||||||||
|
Federal National Mortgage Association AB4673 — 3.00% 3/1/2027 |
47,835 |
47,945 |
|||||||||
|
Federal National Mortgage Association AK9467 — 3.00% 3/1/2027 |
50,547 |
50,664 |
|||||||||
|
Federal National Mortgage Association AL4693 — 3.00% 8/1/2028 |
42,086 |
42,183 |
|||||||||
|
Federal National Mortgage Association AB2446 — 3.50% 3/1/2026 |
276,566 |
280,981 |
|||||||||
|
Federal National Mortgage Association MA3075 — 3.50% 7/1/2027 |
871,344 |
884,709 |
|||||||||
|
Federal National Mortgage Association MA3132 — 3.50% 9/1/2027 |
195,101 |
198,216 |
|||||||||
|
Federal National Mortgage Association MA3251 — 3.50% 1/1/2028 |
230,895 |
234,581 |
|||||||||
|
Federal National Mortgage Association CA1631 — 3.50% 10/1/2028 |
221,579 |
225,116 |
|||||||||
|
Federal National Mortgage Association BM1231 — 3.50% 11/1/2031 |
474,089 |
481,658 |
|||||||||
|
Federal National Mortgage Association 889109 — 5.00% 1/1/2023 |
141,075 |
145,289 |
|||||||||
|
Federal National Mortgage Association AE0286 — 5.00% 4/1/2025 |
220,327 |
228,438 |
|||||||||
|
Federal National Mortgage Association AL7725 — 5.00% 9/1/2025 |
376,555 |
388,201 |
|||||||||
|
Federal National Mortgage Association 256717 — 5.50% 5/1/2022 |
118,988 |
122,986 |
|||||||||
|
$ |
7,113,721 |
||||||||||
|
NON-AGENCY COLLATERALIZED MORTGAGE OBLIGATION — 2.5% |
|||||||||||
|
CIM Trust 2017-7 A, VRN — 3.00% 4/25/2057(b)(c) |
$ |
827,036 |
$ |
811,610 |
|||||||
|
CIM Trust 2018-R3 A1, VRN — 5.00% 12/25/2057(b)(c) |
1,222,664 |
1,262,897 |
|||||||||
|
Citigroup Mortgage Loan Trust, Inc. 2014-A A — 4.00% 1/25/2035(b)(c) |
242,119 |
245,434 |
|||||||||
|
Finance of America Structured Securities Trust 2017-HB1 M1 — 2.84% 11/25/2027(b)(c)(d) |
379,000 |
375,642 |
|||||||||
|
Mill City Mortgage Loan Trust 2018-2 A1, VRN — 3.50% 5/25/2058(b)(c)(d) |
1,162,000 |
1,157,085 |
|||||||||
|
Nationstar HECM Loan Trust 2017-2A M1 — 2.815% 9/25/2027(b)(c) |
316,000 |
312,346 |
|||||||||
|
Nomura Resecuritization Trust 2016-1R 3A1 — 5.00% 9/28/2036(b)(c) |
131,768 |
133,809 |
|||||||||
|
Towd Point Mortgage Trust 2016-3 A1 — 2.25% 4/25/2056(b)(c) |
488,024 |
477,037 |
|||||||||
|
Towd Point Mortgage Trust 2015-5 A1B, VRN — 2.75% 5/25/2055(b)(c) |
207,267 |
204,383 |
|||||||||
|
Towd Point Mortgage Trust 2015-1 AES — 3.00% 10/25/2053(b)(c) |
362,785 |
360,050 |
|||||||||
|
Towd Point Mortgage Trust 2015-3 A1B, VRN — 3.00% 3/25/2054(b)(c) |
347,184 |
344,595 |
|||||||||
|
Towd Point Mortgage Trust 2018-1 A1, VRN — 3.00% 1/25/2058(b)(c) |
891,252 |
877,558 |
|||||||||
|
Towd Point Mortgage Trust 2018-2 A1, VRN — 3.25% 3/25/2058(b)(c) |
1,226,901 |
1,223,586 |
|||||||||
|
Towd Point Mortgage Trust 2015-2 2A1 — 3.75% 11/25/2057(b)(c) |
964,399 |
968,145 |
|||||||||
|
Towd Point Mortgage Trust 2015-4 A1 — 3.50% 4/25/2055(b)(c) |
756,580 |
756,641 |
|||||||||
|
VOLT XL LLC 2015-NP14 A1 — 4.375% 11/27/2045(c)(e) |
224,211 |
224,399 |
|||||||||
|
$ |
9,735,217 |
||||||||||
| TOTAL RESIDENTIAL MORTGAGE-BACKED SECURITIES (Cost $24,620,030) |
$ |
24,343,444 |
|||||||||
|
ASSET-BACKED SECURITIES — 18.9% |
|||||||||||
|
AUTO — 5.7% |
|||||||||||
|
Ally Auto Receivables Trust 2017-1 B — 2.35% 3/15/2022 |
$ |
101,000 |
$ |
99,029 |
|||||||
|
Ally Auto Receivables Trust 2017-1 C — 2.48% 5/16/2022 |
191,000 |
187,705 |
|||||||||
|
American Credit Acceptance Receivables Trust 2017-4 B — 2.61% 5/10/2021(c) |
216,000 |
215,131 |
|||||||||
|
AmeriCredit Automobile Receivables Trust 2017-4 A3 — 2.04% 7/18/2022 |
402,000 |
396,044 |
|||||||||
|
AmeriCredit Automobile Receivables Trust 2017-1 C — 2.71% 8/18/2022 |
203,000 |
200,459 |
|||||||||
|
BMW Vehicle Lease Trust 2017-1 A4 — 2.18% 6/22/2020 |
501,000 |
497,180 |
|||||||||
|
BMW Vehicle Lease Trust 2017-2 A4 — 2.19% 3/22/2021 |
247,000 |
243,731 |
|||||||||
|
Capital Auto Receivables Asset Trust 2016-1 B — 2.67% 12/21/2020 |
114,000 |
113,744 |
|||||||||
|
CarMax Auto Owner Trust 2017-4 A3 — 2.11% 10/17/2022 |
225,000 |
221,621 |
|||||||||
|
CarMax Auto Owner Trust 2018-1 A3 — 2.48% 11/15/2022 |
474,000 |
469,684 |
|||||||||
|
CarMax Auto Owner Trust 2018-2 A3 — 2.98% 1/17/2023 |
536,000 |
535,705 |
|||||||||
|
Credit Acceptance Auto Loan Trust 2017-2A A — 2.55% 2/17/2026(c) |
1,351,000 |
1,336,278 |
|||||||||
10
SOURCE CAPITAL, INC.
PORTFOLIO OF INVESTMENTS (Continued)
June 30, 2018
(Unaudited)
| BONDS & DEBENTURES (Continued) |
Amount |
Principal Fair Value |
|||||||||
|
Credit Acceptance Auto Loan Trust 2017-3A A — 2.65% 6/15/2026(c) |
$ |
445,000 |
$ |
439,877 |
|||||||
|
Credit Acceptance Auto Loan Trust 2016-3A B — 2.94% 10/15/2024(c) |
548,000 |
541,017 |
|||||||||
|
Credit Acceptance Auto Loan Trust 2016-2A B — 3.18% 5/15/2024(c) |
601,000 |
598,899 |
|||||||||
|
Credit Acceptance Auto Loan Trust 2017-3A B — 3.21% 8/17/2026(c) |
941,000 |
926,540 |
|||||||||
|
DT Auto Owner Trust 2017-4A B — 2.44% 1/15/2021(c) |
274,000 |
272,473 |
|||||||||
|
DT Auto Owner Trust 2017-1A C — 2.70% 11/15/2022(c) |
503,000 |
500,404 |
|||||||||
|
DT Auto Owner Trust 2017-4A C — 2.86% 7/17/2023(c) |
236,000 |
234,607 |
|||||||||
|
Exeter Automobile Receivables Trust 2018-1A B — 2.75% 4/15/2022(c) |
275,000 |
272,571 |
|||||||||
|
Exeter Automobile Receivables Trust 2017-1A B — 3.00% 12/15/2021(c) |
237,000 |
236,860 |
|||||||||
|
First Investors Auto Owner Trust 2017-1A B — 2.67% 4/17/2023(c) |
115,000 |
113,823 |
|||||||||
|
First Investors Auto Owner Trust 2017-1A C — 2.95% 4/17/2023(c) |
219,000 |
214,873 |
|||||||||
|
GM Financial Automobile Leasing Trust 2016-3 C — 2.38% 5/20/2020 |
208,000 |
206,779 |
|||||||||
|
GM Financial Automobile Leasing Trust 2017-2 B — 2.43% 6/21/2021 |
597,000 |
590,375 |
|||||||||
|
GM Financial Automobile Leasing Trust 2017-1 B — 2.48% 8/20/2020 |
1,320,000 |
1,308,745 |
|||||||||
|
GM Financial Automobile Leasing Trust 2018-1 A4 — 2.68% 12/20/2021 |
385,000 |
381,880 |
|||||||||
|
GM Financial Automobile Leasing Trust 2017-1 C — 2.74% 8/20/2020 |
597,000 |
591,984 |
|||||||||
|
GM Financial Automobile Leasing Trust 2017-2 C — 2.84% 6/21/2021 |
100,000 |
99,108 |
|||||||||
|
Honda Auto Receivables Owner Trust 2018-1I A4 — 2.78% 5/15/2024 |
918,000 |
912,801 |
|||||||||
|
Hyundai Auto Lease Securitization Trust 2017-C A4 — 2.21% 9/15/2021(c) |
265,000 |
261,589 |
|||||||||
|
Hyundai Auto Lease Securitization Trust 2018-A A4 — 2.89% 3/15/2022(c) |
576,000 |
573,670 |
|||||||||
|
Hyundai Auto Receivables Trust 2018-A A4 — 2.94% 6/17/2024 |
656,000 |
654,022 |
|||||||||
|
Mercedes-Benz Auto Lease Trust 2018-A A4 — 2.51% 10/16/2023 |
158,000 |
156,473 |
|||||||||
|
Nissan Auto Lease Trust 2017-B A4 — 2.17% 12/15/2021 |
292,000 |
288,463 |
|||||||||
|
Nissan Auto Lease Trust 2017-A A3 — 1.91% 4/15/2020 |
567,000 |
562,301 |
|||||||||
|
Nissan Auto Receivables Owner Trust 2018-A A3 — 2.65% 5/16/2022 |
662,000 |
658,585 |
|||||||||
|
Prestige Auto Receivables Trust 2016-2A B — 2.19% 11/15/2022(c) |
673,000 |
667,751 |
|||||||||
|
Prestige Auto Receivables Trust 2017-1A B — 2.39% 5/16/2022(c) |
319,000 |
314,910 |
|||||||||
|
Prestige Auto Receivables Trust 2017-1A C — 2.81% 1/17/2023(c) |
787,000 |
772,484 |
|||||||||
|
Prestige Auto Receivables Trust 2016-2A C — 2.88% 11/15/2022(c) |
327,000 |
323,061 |
|||||||||
|
Santander Drive Auto Receivables Trust 2017-3 B — 2.19% 3/15/2022 |
797,000 |
788,497 |
|||||||||
|
Santander Drive Auto Receivables Trust 2017-1 C — 2.58% 5/16/2022 |
209,000 |
207,525 |
|||||||||
|
Santander Drive Auto Receivables Trust 2018-1 B — 2.63% 7/15/2022 |
463,000 |
459,595 |
|||||||||
|
Santander Drive Auto Receivables Trust 2016-2 C — 2.66% 11/15/2021 |
131,000 |
130,482 |
|||||||||
|
Santander Drive Auto Receivables Trust 2017-2 C — 2.79% 8/15/2022 |
327,000 |
325,395 |
|||||||||
|
Westlake Automobile Receivables Trust 2017-1A C — 2.70% 10/17/2022(c) |
411,000 |
409,325 |
|||||||||
|
Westlake Automobile Receivables Trust 2018-1A C — 2.92% 5/15/2023(c) |
310,000 |
307,337 |
|||||||||
|
World Omni Auto Receivables Trust 2018-A A3 — 2.50% 4/17/2023 |
773,000 |
764,583 |
|||||||||
|
World Omni Automobile Lease Securitization Trust 2017-A A4 — 2.32% 8/15/2022 |
149,000 |
147,707 |
|||||||||
|
World Omni Automobile Lease Securitization Trust 2017-A B — 2.48% 8/15/2022 |
276,000 |
273,328 |
|||||||||
|
$ |
22,007,010 |
||||||||||
|
COLLATERALIZED LOAN OBLIGATION — 4.8% |
|||||||||||
|
Adams Mill CLO Ltd. 2014-1A B2R — 3.35% 7/15/2026(c) |
$ |
250,000 |
$ |
247,669 |
|||||||
|
B&M CLO Ltd. 2014-1A A2R, FRN — 3.948% 4/16/2026(b)(c) |
287,000 |
287,183 |
|||||||||
|
Black Diamond CLO Ltd. 2014-1A A1R, 3M USD LIBOR + 1.150% — 3.503% 10/17/2026(b)(c) |
893,000 |
892,242 |
|||||||||
|
BlueMountain CLO Ltd. 2013-4A — 3.36% 4/15/2025(c) |
250,000 |
250,045 |
|||||||||
|
Cerberus Loan Funding XVIII LP 2017-1A A, 3M USD LIBOR + 1.750% — 4.098% 4/15/2027(b)(c) |
1,138,000 |
1,138,124 |
|||||||||
|
Cerberus Loan Funding XXI LP 2017-4A A, FRN — 3.798% 10/15/2027(b)(c) |
857,000 |
857,081 |
|||||||||
|
Elm Trust 2016-1A A2 — 4.163% 6/20/2025(c) |
356,000 |
355,012 |
|||||||||
|
Flagship VII Ltd. 2013-7A A2R — 2.70% 1/20/2026(c) |
407,064 |
403,617 |
|||||||||
|
Fortress Credit Opportunities IX CLO Ltd. 2017-9A A1T, FRN — 3.893% 11/15/2029(b)(c) |
613,000 |
614,178 |
|||||||||
|
Fortress Credit Opportunities IX CLO Ltd. 2017-9A E, FRN — 9.593% 11/15/2029(b)(c) |
328,000 |
320,317 |
|||||||||
|
Fortress Credit Opportunities VII CLO Ltd. 2016-7I E, 3M USD LIBOR + 7.490% — 9.831% 12/15/2028(b) |
561,000 |
562,220 |
|||||||||
11
SOURCE CAPITAL, INC.
PORTFOLIO OF INVESTMENTS (Continued)
June 30, 2018
(Unaudited)
| BONDS & DEBENTURES (Continued) |
Amount |
Principal Fair Value |
|||||||||
|
Halcyon Loan Advisors Funding 2015-3A A1R, 3M USD LIBOR + 0.90% — 3.255% 10/18/2027(b)(c) |
$ |
1,089,000 |
$ |
1,088,689 |
|||||||
|
Halcyon Loan Advisors Funding 2015-1A AR, FRN — 3.279% 4/20/2027(b)(c) |
1,304,000 |
1,304,007 |
|||||||||
|
Halcyon Loan Advisors Funding 2014-3A AR, 3M USD LIBOR + 1.100% — 3.462% 10/22/2025(b)(c) |
491,000 |
491,061 |
|||||||||
|
Ivy Hill Middle Market Credit Fund VII Ltd. — 1.00% 7/18/2030(d) |
604,000 |
604,000 |
|||||||||
|
Ivy Hill Middle Market Credit Fund VII Ltd. 7A AR, FRN — 3.889% 10/20/2029(b)(c) |
250,000 |
250,162 |
|||||||||
|
Jamestown CLO III Ltd. 2013-3A A1BR — 2.753% 1/15/2026(c) |
276,940 |
276,898 |
|||||||||
|
NewMark Capital Funding CLO, Ltd. 2014-2A AFR — 3.077% 6/30/2026(c) |
250,000 |
249,924 |
|||||||||
|
NewMark Capital Funding CLO, Ltd. 2014-2A BFR — 3.669% 6/30/2026(c) |
278,000 |
277,824 |
|||||||||
|
Oaktree CLO Ltd. 2014-2A A1BR — 2.953% 10/20/2026(c) |
293,000 |
292,969 |
|||||||||
|
Ocean Trails CLO V 2014-5A C2R — 4.70% 10/13/2026(c) |
186,000 |
185,868 |
|||||||||
|
Peaks CLO 1, Ltd. 2014-1A A, 3M USD LIBOR + 1.750% — 4.098% 6/15/2026(b)(c) |
839,000 |
839,106 |
|||||||||
|
Peaks CLO 1, Ltd. 2014-1A C, 3M USD LIBOR + 3.500% — 5.848% 6/15/2026(b)(c) |
344,000 |
344,177 |
|||||||||
|
Saranac CLO III Ltd. 2014-3A ALR, FRN — 3.432% 6/22/2030(b)(c)(d) |
632,000 |
631,210 |
|||||||||
|
Senior Credit Fund SPV LLC 2016-1A — 3.033% 12/19/2025(d) |
925,000 |
925,000 |
|||||||||
|
Silvermore CLO Ltd. 2014-1A A1R, 3M USD LIBOR + 1.170% — 3.513% 5/15/2026(b)(c) |
664,000 |
664,151 |
|||||||||
|
Symphony CLO XII Ltd. 2013-12A B2R — 3.389% 10/15/2025(c) |
427,000 |
426,983 |
|||||||||
|
Telos CLO 2013-3A AR, 3M USD LIBOR + 1.300% — 3.653% 7/17/2026(b)(c) |
461,000 |
464,079 |
|||||||||
|
Telos CLO 2013-3A BR, 3M USD LIBOR + 2.000% — 4.353% 7/17/2026(b)(c) |
550,000 |
550,072 |
|||||||||
|
Telos CLO Ltd. 2014-5A A1R, FRN — 3.303% 4/17/2028(b)(c) |
828,000 |
827,020 |
|||||||||
|
Wellfleet CLO Ltd. 2016-1A AR, FRN — 3.269% 4/20/2028(b)(c) |
629,000 |
624,028 |
|||||||||
|
West CLO Ltd. 2014-2A A1BR — 2.724% 1/16/2027(c) |
233,000 |
230,364 |
|||||||||
|
West CLO Ltd. 2013-1A A1BR — 2.745% 11/7/2025(c) |
362,264 |
360,747 |
|||||||||
|
West CLO Ltd. 2013-1A A2BR — 3.393% 11/7/2025(c) |
250,000 |
249,872 |
|||||||||
|
Zais CLO 2 Ltd. 2014-2A A1BR — 2.92% 7/25/2026(c) |
250,000 |
249,956 |
|||||||||
|
$ |
18,335,856 |
||||||||||
|
CREDIT CARD — 1.1% |
|||||||||||
|
American Express Credit Account Master Trust 2017-6 B — 2.20% 5/15/2023 |
$ |
1,002,000 |
$ |
984,786 |
|||||||
|
Capital One Multi-Asset Execution Trust 2016-A6 A6 — 1.82% 9/15/2022 |
1,051,000 |
1,036,943 |
|||||||||
|
Capital One Multi-Asset Execution Trust 2017-A1 A1 — 2.00% 1/17/2023 |
1,321,000 |
1,301,342 |
|||||||||
|
Golden Credit Card Trust 2018-1A A — 2.62% 1/15/2023(c) |
798,000 |
789,603 |
|||||||||
|
Synchrony Credit Card Master Note Trust 2016-3 B — 1.91% 9/15/2022 |
104,000 |
102,725 |
|||||||||
|
$ |
4,215,399 |
||||||||||
|
EQUIPMENT — 4.3% |
|||||||||||
|
ARI Fleet Lease Trust 2018-A A3 — 2.84% 10/15/2026(c) |
$ |
340,000 |
$ |
337,271 |
|||||||
|
Ascentium Equipment Receivables Trust 2017-2A A3 — 2.31% 12/10/2021(c) |
288,000 |
282,928 |
|||||||||
|
Avis Budget Rental Car Funding AESOP LLC 2014-2A A — 2.50% 2/20/2021(c) |
172,000 |
170,518 |
|||||||||
|
Avis Budget Rental Car Funding AESOP LLC 2015-1A A — 2.50% 7/20/2021(c) |
1,282,000 |
1,264,155 |
|||||||||
|
Avis Budget Rental Car Funding AESOP LLC 2015-2A A — 2.63% 12/20/2021(c) |
616,000 |
608,741 |
|||||||||
|
CCG Receivables Trust 2018-1 A2 — 2.50% 6/16/2025(c) |
363,000 |
361,156 |
|||||||||
|
Chesapeake Funding II LLC 2016-1A A1 — 2.11% 3/15/2028(c) |
586,332 |
583,957 |
|||||||||
|
Chesapeake Funding II LLC 2017-4A A1 — 2.12% 11/15/2029(c) |
724,000 |
714,452 |
|||||||||
|
Coinstar Funding LLC Series 2017-1A A2 — 5.216% 4/25/2047(c) |
225,720 |
228,248 |
|||||||||
|
Dell Equipment Finance Trust 2017-2 A3 — 2.19% 10/24/2022(c) |
179,000 |
177,001 |
|||||||||
|
Enterprise Fleet Financing LLC 2017-3 A2 — 2.13% 5/22/2023(c) |
455,000 |
450,567 |
|||||||||
|
Enterprise Fleet Financing LLC 2017-1 A3 — 2.60% 7/20/2022(c) |
275,000 |
272,844 |
|||||||||
|
GreatAmerica Leasing Receivables Funding LLC Series 2017-1 A4 — 2.36% 1/20/2023(c) |
177,000 |
174,501 |
|||||||||
|
GreatAmerica Leasing Receivables Funding LLC Series 2018-1 A4 — 2.83% 6/17/2024(c) |
210,000 |
207,749 |
|||||||||
|
GreatAmerica Leasing Receivables Funding LLC Series 2017-1 C — 2.89% 1/22/2024(c) |
250,000 |
246,840 |
|||||||||
|
Hertz Fleet Lease Funding LP 2017-1 A2 — 2.13% 4/10/2031(c) |
523,581 |
519,312 |
|||||||||
|
Hertz Fleet Lease Funding LP 2018-1 A2 — 3.23% 5/10/2032(c) |
409,000 |
409,379 |
|||||||||
|
John Deere Owner Trust 2018 2018-A A4 — 2.91% 1/15/2025 |
598,000 |
595,041 |
|||||||||
|
Kubota Credit Owner Trust 2018-1A A3 — 3.10% 8/15/2022(c) |
1,009,000 |
1,008,744 |
|||||||||
12
SOURCE CAPITAL, INC.
PORTFOLIO OF INVESTMENTS (Continued)
June 30, 2018
(Unaudited)
| BONDS & DEBENTURES (Continued) |
Amount |
Principal Fair Value |
|||||||||
|
MMAF Equipment Finance LLC 2017-B A3 — 2.21% 10/17/2022(c) |
$ |
499,000 |
$ |
489,151 |
|||||||
|
NextGear Floorplan Master Owner Trust 2017-1A A2 — 2.54% 4/18/2022(c) |
620,000 |
612,456 |
|||||||||
|
NextGear Floorplan Master Owner Trust 2017-2A B — 3.02% 10/17/2022(c) |
498,000 |
492,727 |
|||||||||
|
NextGear Floorplan Master Owner Trust 2018-1A A2 — 3.22% 2/15/2023(c) |
300,000 |
298,896 |
|||||||||
|
Prop Series 2017-1A — 5.30% 3/15/2042(d) |
951,325 |
941,660 |
|||||||||
|
Verizon Owner Trust 2016-2A A — 1.68% 5/20/2021(c) |
240,000 |
237,533 |
|||||||||
|
Verizon Owner Trust 2017-2A A — 1.92% 12/20/2021(c) |
707,000 |
697,190 |
|||||||||
|
Verizon Owner Trust 2017-1A A — 2.06% 9/20/2021(c) |
269,000 |
265,938 |
|||||||||
|
Verizon Owner Trust 2017-3A A1A — 2.06% 4/20/2022(c) |
311,000 |
305,729 |
|||||||||
|
Verizon Owner Trust 2016-2A B — 2.15% 5/20/2021(c) |
269,000 |
264,008 |
|||||||||
|
Verizon Owner Trust 2017-2A B — 2.22% 12/20/2021(c) |
645,000 |
632,230 |
|||||||||
|
Verizon Owner Trust 2017-1A B — 2.45% 9/20/2021(c) |
918,000 |
903,798 |
|||||||||
|
Verizon Owner Trust 2018-1A B — 3.05% 9/20/2022(c) |
491,000 |
488,852 |
|||||||||
|
Volvo Financial Equipment LLC Series 2017-1A A4 — 2.21% 11/15/2021(c) |
159,000 |
156,417 |
|||||||||
|
Volvo Financial Equipment LLC Series 2018-1A A3 — 2.54% 2/15/2022(c) |
987,000 |
978,776 |
|||||||||
|
$ |
16,378,765 |
||||||||||
|
OTHER — 3.9% |
|||||||||||
|
Conn Funding II LP 2017-B B — 4.52% 11/15/2020(c) |
$ |
200,000 |
$ |
201,500 |
|||||||
|
New Residential Advance Receivables Trust 2015-ON1 2016-T4 AT4 — 3.107% 12/15/2050(c) |
1,345,000 |
1,343,704 |
|||||||||
|
New Residential Advance Receivables Trust Advance Receivables Backed Notes 2016-T2 AT2 — 2.575% 10/15/2049(c) |
1,362,000 |
1,349,303 |
|||||||||
|
New Residential Advance Receivables Trust Advance Receivables Backed Notes 2017-T1 AT1 — 3.214% 2/15/2051(c) |
1,262,000 |
1,252,884 |
|||||||||
|
New Residential Mortgage LLC 2018-FNT1 A — 3.61% 5/25/2023(c)(d) |
804,333 |
804,333 |
|||||||||
|
NRZ Excess Spread-Collateralized Notes Series 2018-PLS1 A — 3.193% 1/25/2023(c)(d) |
400,121 |
396,495 |
|||||||||
|
NRZ Excess Spread-Collateralized Notes Series 2018-PLS2 A — 3.265% 2/25/2023(c)(d) |
447,580 |
443,646 |
|||||||||
|
Panhandle-Plains Student Finance Corporation 2001-1 A2 — 3.53% 12/1/2031(d) |
600,000 |
596,250 |
|||||||||
|
PFS Financing Corp. 2017-D A — 2.40% 10/17/2022(c) |
430,000 |
422,296 |
|||||||||
|
PFS Financing Corp. 2017-D B — 2.74% 10/17/2022(c) |
202,000 |
198,470 |
|||||||||
|
PFS Financing Corp. 2018-B A — 2.89% 2/15/2023(c) |
1,085,000 |
1,076,113 |
|||||||||
|
PFS Financing Corp. 2018-B B — 3.08% 2/15/2023(c) |
191,000 |
189,068 |
|||||||||
|
PFS Financing Corp. 2018-D A — 3.19% 4/17/2023(c) |
846,000 |
844,182 |
|||||||||
|
PFS Financing Corp. 2018-D B — 3.45% 4/17/2023(c) |
421,000 |
418,865 |
|||||||||
|
PFS Financing Corporation 2016-BA A — 1.87% 10/15/2021(c) |
320,000 |
315,420 |
|||||||||
|
PFS Financing Corporation 2017-BA A2 — 2.22% 7/15/2022(c) |
588,000 |
576,039 |
|||||||||
|
PFS Financing Corporation 2017-BA B — 2.57% 7/15/2022(c) |
195,000 |
191,574 |
|||||||||
|
Unison Ground Lease Funding LLC 2013-1 B — 5.78% 3/15/2043(c)(d) |
349,000 |
346,427 |
|||||||||
|
WCP ISSUER LLC 2013-1 B — 6.657% 8/15/2043(c)(d) |
409,000 |
423,266 |
|||||||||
|
$ |
11,389,834 |
||||||||||
| TOTAL ASSET-BACKED SECURITIES (Cost $72,731,785) |
$ |
72,326,864 |
|||||||||
|
CORPORATE BONDS & NOTES — 1.0% |
|||||||||||
|
COMMUNICATIONS — 0.2% |
|||||||||||
|
Cisco Systems, Inc. — 2.45% 6/15/2020 |
$ |
669,000 |
$ |
665,026 |
|||||||
|
CONSUMER, CYCLICAL — 0.0% |
|||||||||||
|
Continental Airlines 2000-1 Class B Pass Through Trust — 8.388% 5/1/2022 |
$ |
753 |
$ |
823 |
|||||||
|
Northwest Airlines 1999-2 Class C Pass Through Trust — 8.304% 9/1/2010(d) |
284,512 |
50,501 |
|||||||||
|
$ |
51,324 |
||||||||||
|
CONSUMER, NON-CYCLICAL — 0.2% |
|||||||||||
|
StoneMor Partners LP / Cornerstone Family Services of West Virginia Subsidiary — 7.875% 6/1/2021 |
$ |
540,000 |
$ |
535,275 |
|||||||
13
SOURCE CAPITAL, INC.
PORTFOLIO OF INVESTMENTS (Continued)
June 30, 2018
(Unaudited)
| BONDS & DEBENTURES (Continued) |
Amount |
Principal Fair Value |
|||||||||
|
ENERGY — 0.3% |
|||||||||||
|
PHI, Inc. — 5.25% 3/15/2019 |
$ |
1,135,000 |
$ |
1,109,462 |
|||||||
|
FINANCIAL — 0.1% |
|||||||||||
|
Berkshire Hathaway Finance Corporation, 3M USD LIBOR + 0.260% — 2.603% 8/15/2019(b) |
$ |
336,000 |
$ |
337,277 |
|||||||
|
N671US Trust — 7.50% 9/15/2020(c)(d) |
132,500 |
132,832 |
|||||||||
|
$ |
470,109 |
||||||||||
|
INDUSTRIAL — 0.0% |
|||||||||||
|
Air 2 US — 10.127% 10/1/2020(c)(d) |
$ |
426,921 |
$ |
81,115 |
|||||||
|
TECHNOLOGY — 0.2% |
|||||||||||
|
Apple, Inc. — 1.90% 2/7/2020 |
$ |
750,000 |
$ |
740,263 |
|||||||
|
Oracle Corporation — 3.875% 7/15/2020 |
21,000 |
21,400 |
|||||||||
|
$ |
761,663 |
||||||||||
| TOTAL CORPORATE BONDS & NOTES (Cost $3,831,427) |
$ |
3,673,974 |
|||||||||
|
CORPORATE BANK DEBT — 1.1% |
|||||||||||
|
ABG Intermediate Holdings 2 LLC, 3M USD LIBOR + 7.750% — 9.844% 9/29/2025(f) |
$ |
277,323 |
$ |
277,151 |
|||||||
|
ABG Intermediate Holdings 2 LLC 2L DDTL — 3.875% 9/29/2025(d)(f)(g) |
16,000 |
(10 |
) |
||||||||
|
Accruent 1L DDTL — 0.750% 12/14/2019(d)(f)(g) |
53,246 |
(259 |
) |
||||||||
|
ACCTL2, 3M USD LIBOR + 4.750% — 7.110% 7/28/2023(d)(f) |
617,545 |
614,543 |
|||||||||
|
JC Penney Corporation, Inc., 1M USD LIBOR + 4.250% — 6.569% 6/23/2023(f) |
538,955 |
512,007 |
|||||||||
|
Logix Holding Co. LLC TL 1L, 1 M USD LIBOR + 5.750% — 7.841% 7/17/2024(f) |
297,005 |
298,490 |
|||||||||
|
MB2LTL, 1M USD LIBOR + 9.250% — 11.750% 11/30/2023(d)(f) |
184,000 |
181,470 |
|||||||||
|
OTGDDTL — 1.000% 8/23/2021(d)(f)(g) |
19,917 |
572 |
|||||||||
|
OTGTL, 3M USD LIBOR + 9.000% — 11.290% 8/26/2021(d)(f) |
657,083 |
662,799 |
|||||||||
|
SDTL, 1M USD LIBOR + 6.000% — 8.094% 11/22/2021(d)(f) |
348,847 |
348,411 |
|||||||||
|
Sears Roebuck Acceptance Corp. TL, 3M USD LIBOR + 4.500% — 6.501% 1/29/2019(f) |
71,675 |
71,407 |
|||||||||
|
Xplornet Communication, Inc. TL-B 1L, 3M USD LIBOR + 4.000% — 6.334% 9/9/2021(f) |
562,103 |
564,582 |
|||||||||
|
ZW1L, 3M USD LIBOR +5.000% — 7.340% 11/16/2022(d)(f) |
363,292 |
364,200 |
|||||||||
|
ZW2L, 3M USD LIBOR +9.000% — 11.331% 11/16/2023(d)(f) |
130,000 |
129,838 |
|||||||||
| TOTAL CORPORATE BANK DEBT (Cost $4,000,113) |
$ |
4,025,201 |
|||||||||
|
U.S. TREASURIES — 2.6% |
|||||||||||
|
U.S. Treasury Bills — 1.643% 7/5/2018 |
$ |
2,091,000 |
$ |
2,090,705 |
|||||||
|
U.S. Treasury Notes — 0.75% 7/31/2018 |
1,386,000 |
1,384,646 |
|||||||||
|
U.S. Treasury Notes — 1.875% 1/31/2022 |
2,247,000 |
2,185,438 |
|||||||||
|
U.S. Treasury Notes — 2.00% 11/15/2021 |
2,231,000 |
2,183,445 |
|||||||||
|
U.S. Treasury Notes — 2.00% 2/15/2022 |
2,238,000 |
2,185,525 |
|||||||||
| TOTAL U.S. TREASURIES (Cost $9,996,953) |
$ |
10,029,759 |
|||||||||
| TOTAL BONDS & DEBENTURES — 33.7% (Cost $129,692,621) |
$ |
128,583,863 |
|||||||||
| TOTAL INVESTMENT SECURITIES — 98.0% (Cost $337,011,190) |
$ |
374,126,271 |
|||||||||
14
SOURCE CAPITAL, INC.
PORTFOLIO OF INVESTMENTS (Continued)
June 30, 2018
(Unaudited)
| SHORT-TERM INVESTMENTS |
Amount |
Principal Fair Value |
|||||||||
|
State Street Bank Repurchase Agreement — 0.35% 7/2/2018 (Dated 06/29/2018, repurchase price of $10,499,306, collateralized by $10,440,000 principal amount U.S. Treasury Notes — 0.125% 2024, fair value $10,709,697) |
$ |
10,499,000 |
$ |
10,499,000 |
|||||||
| TOTAL SHORT-TERM INVESTMENTS — 2.7% (Cost $10,499,000) |
$ |
10,499,000 |
|||||||||
| TOTAL INVESTMENTS — 100.7% (Cost $347,510,190) |
$ |
384,625,271 |
|||||||||
|
Other Assets and Liabilities, net — (0.7)% |
(2,810,336 |
) |
|||||||||
|
NET ASSETS — 100.0% |
$ |
381,814,935 |
|||||||||
(a) Non-income producing security.
(b) Variable/Floating Rate Security — The rate shown is based on the latest available information as of June 30, 2018. For Senior Loan Notes, the rate shown may represent a weighted average interest rate. Certain variable rate securities are not based on a published rate and spread but are determined by the issuer or agent and are based on current market conditions. These securities do not indicate a reference rate and spread in their description.
(c) Security exempt from registration under Rule 144A of the Securities Act of 1933. These securities may be resold in transactions exempt from registration, typically only to qualified institutional buyers. Unless otherwise indicated, these securities are not considered to be illiquid.
(d) Investments categorized as a significant unobservable input (Level 3) (See Note 6 of the Notes to Financial Statements).
(e) Step Coupon — Coupon rate increases in increments to maturity. Rate disclosed is as of June 30, 2018.
(f) Restricted securities. These restricted securities constituted 1.05% of total net assets at June 30, 2018, most of which are considered liquid by the Adviser. These securities are not registered and may not be sold to the public. There are legal and/or contractual restrictions on resale. The Fund does not have the right to demand that such securities be registered. The values of these securities are determined by valuations provided by pricing services, brokers, dealers, market makers, or in good faith under policies adopted by authority of the Fund's Board of Directors.
(g) These securities have been valued in good faith under policies adopted by authority of the Board of Director in accordance with the Fund's fair value procedures. These securities constituted 0.00% of total net assets at June 30, 2018.
See notes to financial statements.
15
SOURCE CAPITAL, INC.
PORTFOLIO OF INVESTMENTS —
RESTRICTED SECURITIES
June 30, 2018
(Unaudited)
|
Issuer |
Acquisition Date(s) |
Cost |
Fair Value |
Fair Value as a % of Net Assets |
|||||||||||||||
|
ABG Intermediate Holdings 2 LLC, 3M USD LIBOR + 7.750% — 9.844% 9/29/2025 |
09/26/2017 |
$ |
276,373 |
$ |
277,151 |
0.07 |
% |
||||||||||||
|
ABG Intermediate Holdings 2 LLC 2L DDTL — 3.875% 9/29/2025 |
04/11/2018, 6/21/2018, 6/25/2018 |
— |
(10 |
) |
0.00 |
% |
|||||||||||||
|
Accruent 1L DDTL — 0.750% 12/14/2019 |
06/14/2018 |
— |
(259 |
) |
0.00 |
% |
|||||||||||||
|
ACCTL2, 3M USD LIBOR + 4.750% — 7.110% 7/28/2023 |
09/19/2016, 12/30/2016 |
612,887 |
614,543 |
0.16 |
% |
||||||||||||||
|
JC Penney Corporation, Inc., 1M USD LIBOR + 4.250% — 6.569% 6/23/2023 |
10/4/2017, 10/5/2017, 10/6/2017, 10/11/2017, 02/07/2018 |
522,044 |
512,007 |
0.13 |
% |
||||||||||||||
|
Logix Holding Co. LLC TL 1L, 1 M USD LIBOR + 5.750% — 7.841% 7/17/2024 |
08/11/2017 |
294,237 |
298,490 |
0.08 |
% |
||||||||||||||
|
MB2LTL, 1M USD LIBOR + 9.250% — 11.750% 11/30/2023 |
12/02/2016, 01/31/2017 |
181,701 |
181,470 |
0.05 |
% |
||||||||||||||
|
OTGDDTL — 1.000% 8/23/2021 |
08/26/2016, 01/26/2018 |
— |
572 |
0.00 |
% |
||||||||||||||
|
OTGTL, 3M USD LIBOR + 9.000% — 11.290% 8/26/2021 |
08/26/2016, 02/28/2017, 05/26/2017, 06/14/2017, 08/26/2017, 08/30/2017, 11/30/2017, 01/26/2018, |
648,490 |
662,799 |
0.17 |
% |
||||||||||||||
|
SDTL, 1M USD LIBOR + 6.000% — 8.094% 11/22/2021 |
12/22/2016 |
343,775 |
348,411 |
0.09 |
% |
||||||||||||||
|
Sears Roebuck Acceptance Corp. TL, 3M USD LIBOR + 4.500% — 6.501% 1/29/2019 |
08/01/2017, 08/03/2017, 08/10/2017, 09/11/2017, 09/12/2017, 09/13/2017, 09/25/2017, 10/05/2017 |
71,675 |
71,407 |
0.02 |
% |
||||||||||||||
|
Xplornet Communication, Inc. TL-B 1L, 3M USD LIBOR + 4.500% — 6.334% 9/9/2021 09/08/2016, 09/20/2016, 10/7/2016, 10/14/2016 |
05/22/2017, 10/18/2017 |
560,027 |
564,582 |
0.15 |
% |
||||||||||||||
|
ZW1L, 3M USD LIBOR + 5.000% — 7.340% 11/16/2022 |
11/17/2016 |
360,515 |
364,200 |
0.10 |
% |
||||||||||||||
|
ZW2L, 3M USD LIBOR + 9.000% — 11.331% 11/16/2023 |
11/17/2016 |
128,389 |
129,838 |
0.03 |
% |
||||||||||||||
|
TOTAL RESTRICTED SECURITIES |
$ |
4,000,113 |
$ |
4,025,201 |
1.05 |
% |
|||||||||||||
See notes to financial statements.
16
SOURCE CAPITAL, INC.
STATEMENT OF ASSETS AND LIABILITIES
June 30, 2018
(Unaudited)
|
ASSETS |
|||||||
|
Investment securities — at fair value (identified cost $337,011,190) |
$ |
374,126,271 |
|||||
|
Short-term investments — at amortized cost (maturities 60 days or less) |
10,499,000 |
||||||
|
Cash |
418 |
||||||
|
Receivable for: |
|||||||
|
Dividends and interest |
896,836 |
||||||
|
Investment securities sold |
186,996 |
||||||
|
Unrealized gain on foreign currency contracts |
8,182 |
||||||
|
Prepaid expenses and other assets |
3,083 |
||||||
|
Total assets |
385,720,786 |
||||||
|
LIABILITIES |
|||||||
|
Payable for: |
|||||||
|
Investment securities purchased |
3,534,306 |
||||||
|
Advisory fees |
220,847 |
||||||
|
Accrued expenses and other liabilities |
150,698 |
||||||
|
Total liabilities |
3,905,851 |
||||||
|
NET ASSETS |
$ |
381,814,935 |
|||||
|
SUMMARY OF SHAREHOLDERS' EQUITY |
|||||||
|
Capital Stock — par value $1 per share; authorized 12,000,000 shares; outstanding 8,610,801 shares |
$ |
8,610,801 |
|||||
|
Additional Paid-in Capital |
319,632,132 |
||||||
|
Undistributed net realized gain |
18,376,558 |
||||||
|
Accumulated net investment loss |
(1,912,410 |
) |
|||||
|
Unrealized appreciation of investments |
37,107,854 |
||||||
|
NET ASSETS |
$ |
381,814,935 |
|||||
|
NET ASSET VALUE |
|||||||
|
Common Stock net asset value per share |
$ |
44.34 |
|||||
|
Common Stock market price per share |
$ |
39.75 |
|||||
See notes to financial statements.
17
SOURCE CAPITAL, INC.
STATEMENT OF OPERATIONS
For the six months ended June 30, 2018
(Unaudited)
|
INVESTMENT INCOME |
|||||||
|
Dividends (net of foreign taxes withheld of $47,620) |
$ |
2,138,908 |
|||||
|
Interest |
2,039,630 |
||||||
|
Total investment income |
4,178,538 |
||||||
|
EXPENSES |
|||||||
|
Advisory fees |
1,343,283 |
||||||
|
Audit and tax services fees |
84,275 |
||||||
|
Director fees and expenses |
80,789 |
||||||
|
Reports to shareholders |
76,094 |
||||||
|
Transfer agent fees and expenses |
58,191 |
||||||
|
Legal fees |
56,113 |
||||||
|
Custodian fees |
37,831 |
||||||
|
Filing fees |
12,397 |
||||||
|
Administrative services fees |
9,895 |
||||||
|
Professional fees |
8,931 |
||||||
|
Other |
16,285 |
||||||
|
Total expenses |
1,784,084 |
||||||
|
Net expenses |
1,784,084 |
||||||
|
Net investment income |
2,394,454 |
||||||
|
NET REALIZED AND UNREALIZED GAIN (LOSS) |
|||||||
|
Net realized gain (loss) on: |
|||||||
|
Investments |
14,460,641 |
||||||
|
Investments in foreign currency transactions |
(5,427 |
) |
|||||
|
Net change in unrealized appreciation (depreciation) of: |
|||||||
|
Investments |
(18,717,596 |
) |
|||||
|
Investments in forward foreign currency contracts |
8,182 |
||||||
|
Translation of foreign currency denominated amounts |
(14,784 |
) |
|||||
|
Net realized and unrealized loss |
(4,268,984 |
) |
|||||
|
NET DECREASE IN NET ASSETS RESULTING FROM OPERATIONS |
$ |
(1,874,530 |
) |
||||
See notes to financial statements.
18
SOURCE CAPITAL, INC.
STATEMENTS OF CHANGES IN NET ASSETS
|
Six months ended June 30, 2018 (Unaudited) |
Year ended December 31, 2017 |
||||||||||
|
INCREASE (DECREASE) IN NET ASSETS |
|||||||||||
|
Operations: |
|||||||||||
|
Net investment income |
$ |
2,394,454 |
$ |
4,347,897 |
|||||||
|
Net realized gain |
14,455,214 |
7,693,772 |
|||||||||
|
Net change in unrealized appreciation (depreciation) |
(18,724,198 |
) |
36,669,628 |
||||||||
|
Net increase (decrease) in net assets resulting from operations |
(1,874,530 |
) |
48,711,297 |
||||||||
|
Distributions to shareholders from: |
|||||||||||
|
Net investment income |
(4,306,864 |
) |
(6,091,999 |
) |
|||||||
|
Net realized capital gains |
— |
(8,824,641 |
) |
||||||||
|
Total distributions |
(4,306,864 |
) |
(14,916,640 |
) |
|||||||
|
Capital Stock transactions: |
|||||||||||
|
Cost of Capital Stock repurchased |
(268,110 |
) |
(861,448 |
) |
|||||||
|
Net decrease from Capital Stock transactions |
(268,110 |
) |
(861,448 |
) |
|||||||
|
Total change in net assets |
(6,449,504 |
) |
32,933,209 |
||||||||
|
NET ASSETS |
|||||||||||
|
Beginning of period |
388,264,439 |
355,331,230 |
|||||||||
|
End of period |
$ |
381,814,935 |
$ |
388,264,439 |
|||||||
|
CHANGE IN CAPITAL STOCK OUTSTANDING |
|||||||||||
|
Shares of Capital Stock repurchased |
(6,563 |
) |
(23,027 |
) |
|||||||
|
Change in Capital Stock outstanding |
(6,563 |
) |
(23,027 |
) |
|||||||
See notes to financial statements.
19
SOURCE CAPITAL, INC.
FINANCIAL HIGHLIGHTS
Selected data for each share of capital stock outstanding throughout each period
|
Six months ended June 30, 2018 |
Year ended December 31, |
||||||||||||||||||||||||||
|
(unaudited) |
2017 |
2016 |
2015 |
2014 |
2013 |
||||||||||||||||||||||
|
Per share operating performance: |
|||||||||||||||||||||||||||
|
Net asset value at beginning of period |
$ |
45.06 |
$ |
41.12 |
$ |
73.07 |
$ |
80.44 |
$ |
73.94 |
$ |
59.06 |
|||||||||||||||
|
Income from investment operations: |
|||||||||||||||||||||||||||
|
Net investment income(1) |
$ |
0.28 |
$ |
0.50 |
$ |
0.40 |
$ |
0.02 |
$ |
0.14 |
$ |
0.14 |
|||||||||||||||
|
Net realized and unrealized gain (loss) on investment securities |
(0.50 |
) |
5.17 |
2.82 |
(3.39 |
) |
10.56 |
17.74 |
|||||||||||||||||||
|
Total from investment operations |
$ |
(0.22 |
) |
$ |
5.67 |
$ |
3.22 |
$ |
(3.37 |
) |
$ |
10.70 |
$ |
17.88 |
|||||||||||||
|
Distributions to Common shareholders: |
|||||||||||||||||||||||||||
|
Dividends from net investment income |
$ |
(0.50 |
) |
$ |
(0.71 |
) |
$ |
(1.58 |
) |
$ |
(0.04 |
) |
$ |
(0.18 |
) |
$ |
(0.22 |
) |
|||||||||
|
Distributions from net realized capital gains |
— |
(1.02 |
) |
(33.65 |
) |
(3.96 |
) |
(4.02 |
) |
(2.78 |
) |
||||||||||||||||
|
Total distributions |
$ |
(0.50 |
) |
$ |
(1.73 |
) |
$ |
(35.23 |
) |
$ |
(4.00 |
) |
$ |
(4.20 |
) |
$ |
(3.00 |
) |
|||||||||
|
Capital stock repurchased |
— |
* |
— |
* |
$ |
0.01 |
— |
— |
— |
||||||||||||||||||
|
Capital contributions(4) |
— |
— |
$ |
0.05 |
— |
— |
— |
||||||||||||||||||||
|
Net asset value at end of period |
$ |
44.34 |
$ |
45.06 |
$ |
41.12 |
$ |
73.07 |
$ |
80.44 |
$ |
73.94 |
|||||||||||||||
|
Per share market value at end of period |
$ |
39.75 |
$ |
40.76 |
$ |
35.95 |
$ |
66.26 |
$ |
72.13 |
$ |
67.10 |
|||||||||||||||
|
Total investment return(2) |
(1.29 |
)% |
18.42 |
% |
8.13 |
% |
(2.76 |
)% |
14.20 |
% |
34.80 |
% |
|||||||||||||||
|
Net asset value total return(3) |
(0.50 |
)% |
14.01 |
% |
9.05 |
% |
(4.38 |
)% |
14.90 |
% |
30.90 |
% |
|||||||||||||||
|
Ratios/supplemental data: |
|||||||||||||||||||||||||||
|
Net assets, end of period (in $000's) |
$ |
381,815 |
$ |
388,264 |
$ |
355,331 |
$ |
632,454 |
$ |
696,239 |
$ |
639,974 |
|||||||||||||||
|
Ratios based on average net assets applicable to common stock: |
|||||||||||||||||||||||||||
|
Expenses |
0.92 |
%† |
0.94 |
% |
0.91 |
% |
0.85 |
% |
0.80 |
% |
0.84 |
% |
|||||||||||||||
|
Net investment income |
1.24 |
%† |
1.16 |
% |
0.87 |
% |
0.03 |
% |
0.19 |
% |
0.18 |
% |
|||||||||||||||
|
Portfolio turnover rate |
62 |
%† |
30 |
% |
35 |
% |
39 |
% |
6 |
% |
9 |
% |
|||||||||||||||
(1) Per share amount is based on average shares outstanding.
(2) Based on market value per share, adjusted for reinvestment of distributions.
(3) Based on net asset value per share, adjusted for reinvestment of distributions.
(4) In 2016, 0.13% of the Fund's net asset value total return was the result of the Adviser's reimbursement of trade errors.
* Rounds to less than $0.01 per share.
† Annualized.
See notes to financial statements.
20
SOURCE CAPITAL, INC.
NOTES TO FINANCIAL STATEMENTS
(Unaudited)
NOTE 1—Significant Accounting Policies
Source Capital, Inc. (the "Fund"), is registered under the Investment Company Act of 1940 as a diversified, closed-end management investment company. The investment objective of the Fund is to seek maximum total return for Common shareholders from both capital appreciation and investment income to the extent consistent with protection of invested capital. The Fund qualifies as an investment company pursuant to Financial Accounting Standard Board (FASB) Accounting Standards Codification (ASC) No. 946, Financial Services—Investment Companies. The significant accounting policies followed by the Fund in the preparation of its financial statements include the following:
A. Security Valuation
The Fund's investments are reported at fair value as defined by accounting principles generally accepted in the United States of America, ("U.S. GAAP"). The Fund generally determines its net asset value as of approximately 4:00 p.m. New York time each day the New York Stock Exchange is open. Further discussion of valuation methods, inputs and classifications can be found under Disclosure of Fair Value Measurements.
B. Use of Estimates
The preparation of the financial statements in accordance with U.S. GAAP requires management to make estimates and assumptions that affect the amounts reported. Actual results could differ from those estimates.
C. Securities Transactions and Related Investment Income
Securities transactions are accounted for on the date the securities are purchased or sold. Dividend income and distributions to shareholders are recorded on the ex-dividend date. Interest income and expenses are recorded on an accrual basis. The books and records of the Fund are maintained in U.S. dollars as follows: (1) the foreign currency market value of investment securities, and other assets and liabilities stated in foreign currencies, are translated using the daily spot rate; and (2) purchases, sales, income and expenses are translated at the rate of exchange prevailing on the respective dates of such transactions. The resultant exchange gains and losses are included in net realized or net unrealized gain (loss) in the statement of operations. Distributions payable on the Common Stock are recorded on the ex-dividend date.
NOTE 2—Risk Considerations
Investing in the Fund may involve certain risks including, but not limited to, those described below.
Market Risk: Because the values of the Fund's investments will fluctuate with market conditions, so will the value of your investment in the Fund. You could lose money on your investment in the Fund or the Fund could underperform other investments.
Common Stocks and Other Securities (Long): The prices of common stocks and other securities held by the Fund may decline in response to certain events taking place around the world, including; those directly involving companies whose securities are owned by the Fund; conditions affecting the general economy; overall market changes; local, regional or global political, social or economic instability; and currency, interest rate and commodity price fluctuations. In addition, the emphasis on a value-oriented investment approach by the Fund's investment adviser, First Pacific Advisors, LLC ("Adviser"), generally results in the Fund's portfolio being invested primarily in medium or smaller sized companies. Smaller companies may be subject to a greater degree of change in earnings and business prospects than larger, more established companies, and smaller companies are often more reliant on key products or personnel than larger companies. Also, securities of smaller companies are traded in lower volumes than those issued by larger companies and may be more volatile than those of larger companies. The Fund's foreign investments are subject to additional risks such as, foreign markets could go down or prices of the Fund's foreign investments could go down because of unfavorable changes in foreign currency exchange rates, foreign government actions, social, economic or political instability or other factors that can adversely affect investments in foreign countries. These factors can also make foreign securities less liquid, more volatile and harder to value than U.S. securities. In light of these characteristics of smaller companies and their securities, the Fund may be subjected to greater risk than that assumed when investing in the equity securities of larger companies
Interest Rate and Credit Risk: The values of, and the income generated by, most debt securities held by the Fund may be affected by changing interest rates and by changes in the effective maturities and credit rating of these securities. For example, the value of debt securities in the Fund's portfolio generally will decline when interest rates rise and increase when interest rates fall. In addition, falling interest rates may cause an issuer to redeem, call or refinance a security before its stated maturity, which may result in the Fund having to reinvest the proceeds in lower yielding securities. Debt securities are subject to credit risk, meaning that the issuer of the debt security may default or fail to make timely payments of principal or interest. The values of any of the Fund's investments may also decline in response to events affecting the issuer or its credit rating. The lower rated debt securities in which the Fund may invest are considered speculative and are generally subject to greater volatility and risk of loss than investment grade securities, particularly in deteriorating economic conditions.
21
SOURCE CAPITAL, INC.
NOTES TO FINANCIAL STATEMENTS (Continued)
(Unaudited)
Repurchase Agreements: Repurchase agreements permit the Fund to maintain liquidity and earn income over periods of time as short as overnight. Repurchase agreements held by the Fund are fully collateralized by U.S. Government securities, or securities issued by U.S. Government agencies, or securities that are within the three highest credit categories assigned by established rating agencies (Aaa, Aa, or A by Moody's or AAA, AA or A by Standard & Poor's) or, if not rated by Moody's or Standard & Poor's, are of equivalent investment quality as determined by the Adviser. Such collateral is in the possession of the Fund's custodian. The collateral is evaluated daily to ensure its market value equals or exceeds the current market value of the repurchase agreements including accrued interest. In the event of default on the obligation to repurchase, the Fund has the right to liquidate the collateral and apply the proceeds in satisfaction of the obligation.
The Fund may enter into repurchase agreements, under the terms of a Master Repurchase Agreement ("MRA"). The MRA permits the Fund, under certain circumstances including an event of default (such as bankruptcy or insolvency), to offset payables and/or receivables under the MRA with collateral held and/or posted to the counterparty and create one single net payment due to or from the Fund. However, bankruptcy or insolvency laws of a particular jurisdiction may impose restrictions on or prohibitions against such a right of offset in the event of a MRA counterparty's bankruptcy or insolvency. Pursuant to the terms of the MRA, the Fund receives securities as collateral with a market value in excess of the repurchase price to be received by the Fund upon the maturity of the repurchase transaction. Upon a bankruptcy or insolvency of the MRA counterparty, the Fund recognizes a liability with respect to such excess collateral to reflect the Fund's obligation under bankruptcy law to return the excess to the counterparty. Repurchase agreements outstanding at the end of the period are listed in the Fund's Portfolio of Investments.
NOTE 3—Capital Stock
The Fund did not issue any shares of Common Stock under its Dividend Reinvestment Plan for shareholders during the period ended June 30, 2018. During the year ended period ended June 30, 2018, the Fund repurchased 6,563 of its outstanding shares at a weighted-average discount of 10.75% from net asset value per share. These repurchases were made pursuant to the stock repurchase program approved annually by the Fund's Board of Directors. Under the program, the Fund is authorized to make open-market repurchases of its common stock of up to 10% of the Fund's outstanding shares. The Fund expects to repurchase its common stock when the discount to NAV of the trading price of its common stock on the NYSE is greater than 10%, subject to various factors, including the ability of the Fund to raise cash to repurchase shares in a tax-efficient manner.
NOTE 4—Advisory Fees and Other Affiliated Transactions
Pursuant to an investment advisory agreement (the "Agreement"), the Fund pays the Adviser, monthly investment advisory fees calculated at an annual rate of 0.725% for the first $100 million of total net assets, 0.700% for the next $100 million of total net assets, and 0.675% for any total net assets in excess of $200 million. The Agreement obligates the Adviser to reduce its fee to the extent necessary to reimburse the Fund for any annual expenses (exclusive of interest, taxes, the cost of brokerage and research services, legal expenses related to portfolio securities, and extraordinary expenses such as litigation) in excess of 11/2% of the first $30 million and 1% of the remaining average net assets of the Fund for the year.
For the period ended June 30, 2018, the Fund paid aggregate fees and expenses of $80,789 to all Directors who are not affiliated persons of the Adviser.
NOTE 5—Federal Income Tax
No provision for federal income tax is required because the Fund has elected to be taxed as a "regulated investment company" under the Internal Revenue Code (the "Code") and intends to maintain this qualification and to distribute each year to its shareholders, in accordance with the minimum distribution requirements of the Code, its taxable net investment income and taxable net realized gains on investments.
Cost of purchases of investment securities (excluding short-term investments) aggregated $121,095,690 for the period ended June 30, 2018. The proceeds and cost of securities sold resulting in net realized gains of $14,460,641 aggregated $113,954,280 and $99,493,639, respectively, for the period ended June 30, 2018. Realized gains or losses are based on the specific identification method.
The cost of investment securities held at June 30, 2018, was $337,011,190 for federal income tax purposes. Gross unrealized appreciation and depreciation for all investments (excluding short-term investments) at June 30, 2018, for federal income tax purposes was $44,674,171 and $7,558,821, respectively resulting in net unrealized appreciation of $37,115,350. As of and during the period ended June 30, 2018, the Fund did not have any liability for unrecognized tax benefits. The Fund recognizes interest and penalties, if any, related to unrecognized tax benefits as income tax expense in the Statement of Operations. During the year, the Fund did not incur any interest or penalties. The Fund is not subject to examination by U.S. federal tax authorities for years ended on or before December 31, 2014 or by state tax authorities for years ended on or before December 31, 2013.
NOTE 6—Disclosure of Fair Value Measurements
The Fund uses the following methods and inputs to establish the fair value of its assets and liabilities. Use of particular methods and inputs may vary over time based on availability and relevance as market and economic conditions evolve.
22
SOURCE CAPITAL, INC.
NOTES TO FINANCIAL STATEMENTS (Continued)
(Unaudited)
Equity securities are generally valued each day at the official closing price of, or the last reported sale price on, the exchange or market on which such securities principally are traded, as of the close of business on that day. If there have been no sales that day, equity securities are generally valued at the last available bid price. Securities that are unlisted and fixed-income and convertible securities listed on a national securities exchange for which the over-the-counter ("OTC") market more accurately reflects the securities' value in the judgment of the Fund's officers, are valued at the most recent bid price. However, most fixed income securities are generally valued at prices obtained from pricing vendors and brokers. Vendors value such securities based on one or more of the following inputs: transactions, bids, offers quotations from dealers and trading systems, spreads and other relationships observed in the markets among comparable securities, benchmarks, underlying equity of the issuer, and proprietary pricing models such as cash flows, financial or collateral performance and other reference data (includes prepayments, defaults, collateral, credit enhancements, and interest rate volatility). Short-term corporate notes with maturities of 60 days or less at the time of purchase are valued at amortized cost
Securities for which representative market quotations are not readily available or are considered unreliable by the Adviser are valued as determined in good faith under procedures adopted by the authority of the Fund's Board of Directors. Various inputs may be reviewed in order to make a good faith determination of a security's value. These inputs include, but are not limited to, the type and cost of the security; contractual or legal restrictions on resale of the security; relevant financial or business developments of the issuer; actively traded similar or related securities; conversion or exchange rights on the security; related corporate actions; significant events occurring after the close of trading in the security; and changes in overall market conditions. Fair valuations and valuations of investments that are not actively trading involve judgment and may differ materially from valuations of investments that would have been used had greater market activity occurred.
The Fund classifies its assets based on three valuation methodologies. Level 1 values are based on quoted market prices in active markets for identical assets. Level 2 values are based on significant observable market inputs, such as quoted prices for similar assets and quoted prices in inactive markets or other market observable inputs as noted above including spreads, cash flows, financial performance, prepayments, defaults, collateral, credit enhancements, and interest rate volatility. Level 3 values are based on significant unobservable inputs that reflect the Fund's determination of assumptions that market participants might reasonably use in valuing the assets. The valuation levels are not necessarily an indication of the risk associated with investing in those securities. The following table presents the valuation levels of the Fund's investments as of June 30, 2018:
|
Investments |
Level 1 |
Level 2 |
Level 3 |
Total |
|||||||||||||||
|
Common Stocks |
|||||||||||||||||||
|
Internet Media |
$ |
32,556,824 |
$ |
— |
$ |
— |
$ |
32,556,824 |
|||||||||||
|
Infrastructure Software |
24,839,885 |
— |
— |
24,839,885 |
|||||||||||||||
|
Diversified Banks |
20,981,192 |
— |
— |
20,981,192 |
|||||||||||||||
|
Aircraft & Parts |
20,639,478 |
— |
— |
20,639,478 |
|||||||||||||||
|
P&C Insurance |
14,006,824 |
— |
— |
14,006,824 |
|||||||||||||||
|
Semiconductor Devices |
13,792,422 |
— |
— |
13,792,422 |
|||||||||||||||
|
Cable & Satellite |
13,570,274 |
— |
— |
13,570,274 |
|||||||||||||||
|
Insurance Brokers |
11,928,578 |
— |
— |
11,928,578 |
|||||||||||||||
|
Consumer Finance |
10,427,589 |
— |
— |
10,427,589 |
|||||||||||||||
|
Electrical Components |
9,563,472 |
— |
— |
9,563,472 |
|||||||||||||||
|
Investment Companies |
8,152,217 |
— |
— |
8,152,217 |
|||||||||||||||
|
Internet Based Services |
7,472,212 |
— |
— |
7,472,212 |
|||||||||||||||
|
Generic Pharma |
7,275,343 |
— |
— |
7,275,343 |
|||||||||||||||
|
Cement & Aggregates |
7,218,197 |
— |
— |
7,218,197 |
|||||||||||||||
|
Advertising & Marketing |
6,867,332 |
— |
— |
6,867,332 |
|||||||||||||||
|
Banks |
5,986,411 |
— |
— |
5,986,411 |
|||||||||||||||
|
Midstream—Oil & Gas |
5,567,817 |
— |
— |
5,567,817 |
|||||||||||||||
|
Life Science Equipment |
5,526,495 |
— |
— |
5,526,495 |
|||||||||||||||
|
Packaged Food |
4,768,710 |
— |
— |
4,768,710 |
|||||||||||||||
|
Communications Equipment |
4,583,168 |
— |
— |
4,583,168 |
|||||||||||||||
|
Household Products |
2,657,354 |
— |
— |
2,657,354 |
|||||||||||||||
|
Integrated Oils |
2,320,817 |
— |
— |
2,320,817 |
|||||||||||||||
|
Food & Drug Stores |
2,043,974 |
— |
— |
2,043,974 |
|||||||||||||||
|
E-Commerce Discretionary |
1,420,312 |
— |
— |
1,420,312 |
|||||||||||||||
|
Base Metals |
1,375,511 |
— |
— |
1,375,511 |
|||||||||||||||
|
Commercial Mortgage-Backed Securities |
|||||||||||||||||||
|
Agency |
— |
41,877 |
— |
41,877 |
|||||||||||||||
|
Agency Stripped |
— |
8,516,911 |
— |
8,516,911 |
|||||||||||||||
|
Non-Agency |
— |
5,625,833 |
— |
5,625,833 |
|||||||||||||||
23
SOURCE CAPITAL, INC.
NOTES TO FINANCIAL STATEMENTS (Continued)
(Unaudited)
|
Investments |
Level 1 |
Level 2 |
Level 3 |
Total |
|||||||||||||||
|
Residential Mortgage-Backed Securities |
|||||||||||||||||||
|
Agency Collateralized Mortgage Obligation |
$ |
— |
$ |
7,494,506 |
$ |
— |
$ |
7,494,506 |
|||||||||||
|
Agency Pool Fixed Rate |
— |
7,113,721 |
— |
7,113,721 |
|||||||||||||||
|
Non-Agency Collateralized Mortgage Obligation |
— |
8,202,490 |
375,642 |
8,578,132 |
|||||||||||||||
|
Asset-Backed Securities |
|||||||||||||||||||
|
Auto |
— |
22,007,010 |
— |
22,007,010 |
|||||||||||||||
|
Collateralized Loan Obligation |
— |
15,264,434 |
1,529,000 |
16,793,434 |
|||||||||||||||
|
Credit Card |
— |
4,215,399 |
— |
4,215,399 |
|||||||||||||||
|
Equipment |
— |
14,428,361 |
941,660 |
15,370,021 |
|||||||||||||||
|
Other |
— |
10,299,373 |
4,798,712 |
15,098,085 |
|||||||||||||||
|
Corporate Bonds & Notes |
— |
3,409,526 |
264,448 |
3,673,974 |
|||||||||||||||
|
Corporate Bank Debt |
— |
1,723,637 |
2,301,564 |
4,025,201 |
|||||||||||||||
|
U.S. Treasuries |
— |
10,029,759 |
— |
10,029,759 |
|||||||||||||||
|
Short-Term Investment |
— |
10,499,000 |
— |
10,499,000 |
|||||||||||||||
|
$ |
245,542,408 |
$ |
128,871,837 |
$ |
10,211,026 |
$ |
384,625,271 |
||||||||||||
The following table summarizes the Fund's Level 3 investment securities and related transactions during the period ended June 30, 2018:
|
Investments |
Beginning Value at December 31, 2017 |
Net Realized and Unrealized Gains (Losses)* |
Purchases |
(Sales) |
Gross Transfers In (Out) |
Ending Value at June 30, 2018 |
Net Change in Unrealized Appreciation (Depreciation) related to Investments held at June 30, 2018 |
||||||||||||||||||||||||
|
Commercial Mortgage-Backed Securities Non-Agency |
$ |
464,468 |
$ |
(2,578 |
) |
— |
$ |
(461,890 |
) |
— |
— |
— |
|||||||||||||||||||
|
Residential Mortgage-Backed Securities Non-Agency Collateralized Mortgage Obligation |
834,410 |
(3,655 |
) |
— |
(455,113 |
) |
— |
$ |
375,642 |
$ |
(2,678 |
) |
|||||||||||||||||||
|
Asset-Backed Securities Collateralized Loan Obligations |
1,159,665 |
(4,301 |
) |
$ |
604,000 |
— |
$ |
(230,364 |
) |
1,529,000 |
(1,781 |
) |
|||||||||||||||||||
|
Asset-Backed Securities Equipment |
1,012,436 |
(21,571 |
) |
— |
(49,205 |
) |
— |
941,660 |
(21,606 |
) |
|||||||||||||||||||||
|
Asset-Backed Securities Other |
3,961,842 |
(6,829 |
) |
3,572,253 |
(131,966 |
) |
(2,596,588 |
) |
4,798,712 |
(9,297 |
) |
||||||||||||||||||||
|
Corporate Bonds & Notes |
290,257 |
(45,283 |
) |
92,368 |
(72,894 |
) |
— |
264,448 |
(59,863 |
) |
|||||||||||||||||||||
|
Corporate Bank Debt |
2,856,931 |
7,657 |
806,788 |
(1,369,812 |
) |
— |
2,301,564 |
4,300 |
|||||||||||||||||||||||
|
$ |
10,580,009 |
$ |
(76,560 |
) |
$ |
5,075,409 |
$ |
(2,540,880 |
) |
$ |
(2,826,952 |
) |
$ |
10,211,026 |
$ |
(90,925 |
) |
||||||||||||||
* Net realized and unrealized gains (losses) are included in the related amounts in the statement of operations.
Level 3 Valuation Process: Investments classified within Level 3 of the fair value hierarchy are valued by the Adviser in good faith under procedures adopted by authority of the Fund's Board of Directors. The Adviser employs various methods to determine fair valuations including regular review of key inputs and assumptions, and review of related market activity, if any. However, there are generally no observable trade activities in these securities. The Adviser reports to the Board of Directors at their regularly scheduled
24
SOURCE CAPITAL, INC.
NOTES TO FINANCIAL STATEMENTS (Continued)
(Unaudited)
quarterly meetings, or more often if warranted. The report includes a summary of the results of the process, the key inputs and assumptions noted, and any changes to the inputs and assumptions used. When appropriate, the Adviser will recommend changes to the procedures and process employed. The value determined for an investment using the fair value procedures may differ significantly from the value realized upon the sale of such investment. Transfers of investments between different levels of the fair value hierarchy are recorded at market value as of the end of the reporting period. There were no transfers between Level 1 and 2.
There were transfers of $2,826,952 out of Level 3 into Level 2 during the period ended June 30, 2018. Transfers out were due to change from single broker quoted to vendor priced.
The following table summarizes the quantitative inputs and assumptions used for items categorized as items categorized as Level 3 of the fair value hierarchy as of June 30, 2018:
| Financial Assets |
Fair Value at June 30, 2018 |
Valuation Technique(s) |
Unobservable Inputs |
Price/Range |
|||||||||||||||
|
Residential Mortgage-Backed Securities - Non-Agency CMO |
$ |
375,642 |
Third-Party Broker Quote(a) |
Quotes/Prices |
$ |
99.11 |
|||||||||||||
|
Asset-Backed Securities - Collateralized Loan Obligation |
$ |
1,529,000 |
Third-Party Broker Quote(a) |
Quotes/Prices |
$ |
100.00 |
|||||||||||||
|
Asset-Backed Securities - Equipment |
$ |
941,660 |
Third-Party Broker Quote(a) |
Quotes/Prices |
$ |
98.98 |
|||||||||||||
|
Asset-Backed Securities - Other |
$ |
4,798,712 |
Third-Party Broker Quote(a) |
Quotes/Prices |
$ |
99.09-$103.49 |
|||||||||||||
|
Corporate Bonds and Notes - Consumer, Cyclical |
$ |
50,501 |
Third-Party Broker Quote(a) |
Quotes/Prices |
$ |
17.75 |
|||||||||||||
|
Corporate Bonds and Notes - Financial |
$ |
132,832 |
Third-Party Broker Quote(a) |
Quotes/Prices |
$ |
100.25 |
|||||||||||||
|
Corporate Bonds and Notes - Industrial |
$ |
81,115 |
Third-Party Broker Quote(a) |
Quotes/Prices |
$ |
19.00 |
|||||||||||||
|
Corporate Bank Debt |
$ |
303 |
Pricing Model(b) |
Reference prices |
$ |
(0.49 |
)-$2.87 |
||||||||||||
|
$ |
2,301,261 |
Pricing Vendor |
Prices |
$ |
98.63-$100.87 |
||||||||||||||
(a) The Third-Party Broker Quote technique involves obtaining an independent third-party broker quote for the security.
(b) The Pricing Model technique for Level 3 securities involves calculating the difference between the fair value of the funded portion of the securitiy and the price at which the Fund is committed to fund the unfunded committment.
NOTE 7—Collateral Requirements
FASB Accounting Standards Update No. 2011-11, Disclosures about Offsetting Assets and Liabilities, requires disclosures to make financial statements that are prepared under U.S. GAAP more comparable to those prepared under International Financial Reporting Standards. Under this guidance the Fund discloses both gross and net information about instruments and transactions eligible for offset such as instruments and transactions subject to an agreement similar to a master netting arrangement. In addition, the Fund discloses collateral received and posted in connection with master netting agreements or similar arrangements.
The following table presents the Fund's repurchase agreements by counterparty net of amounts available for offset under an ISDA Master agreement or similar agreements and net of the related collateral received or pledged by the Fund as of June 30, 2018, are as follows:
|
Counterparty |
Gross Assets (Liabilities) in the Statement of Assets and Liabilities |
Collateral Received (Pledged) |
Assets (Liabilities) Available for Offset |
Net Amount of Assets (Liabilities)* |
|||||||||||||||
|
State Street Bank and Trust Company: Repurchase Agreement |
$ |
10,499,000 |
$ |
10,499,000 |
** |
— |
— |
||||||||||||
* Represents the net amount receivable from the counterparty in the event of default.
** Collateral with a value of $10,709,697 has been received in connection with a master repurchase agreement. Excess of collateral received from the individual master repurchase agreement is not shown for financial reporting purposes.
25
SOURCE CAPITAL, INC.
RESULTS OF ANNUAL MEETING
Results of the Annual Meeting of Shareholders:
The Annual Meeting of Shareholders was held on May 14, 2018 in Los Angeles, California. The voting result for the proposal considered at the Annual Meeting of Shareholders is as follows:
Election of Directors. The shareholders of the Fund elected J. Richard Atwood, Sandra Brown, Mark L. Lipson, Alfred E. Osborne, Jr., A. Robert Pisano, Patrick B. Purcell and Allan M. Rudnick to serve on the Board of Directors.
|
Total Shares Voted For: |
Total Shares Withheld: |
||||||||||
| J. Richard Atwood |
6,391,759 |
429,147 |
|||||||||
| Sandra Brown |
6,396,187 |
429,147 |
|||||||||
| Mark L. Lipson |
6,394,438 |
429,147 |
|||||||||
| Alfred E. Osborne, Jr. |
6,388,650 |
429,147 |
|||||||||
| A. Robert Pisano |
6,366,730 |
429,147 |
|||||||||
| Patrick B. Purcell |
6,418,885 |
429,147 |
|||||||||
| Allan M. Rudnick |
6,416,496 |
429,147 |
|||||||||
26
SOURCE CAPITAL, INC.
DIRECTOR AND OFFICER INFORMATION
(Unaudited)
|
Name, Address(1) and Year of Birth |
Position(s) with Fund Years Served |
Principal Occupation(s) During the past 5 years |
Portfolios in Fund Complex Overseen |
Other Directorships |
|||||||||||||||
|
Independent Directors |
|||||||||||||||||||
|
Allan M. Rudnick - 1940† |
Director and Chairman* Years Served: 6 |
Private Investor. Formerly Co-Founder, Chief Executive Officer, Chairman and Chief Investment Officer of Kayne Anderson Rudnick Investment Management from 1989 to 2007. |
7 |
||||||||||||||||
|
Sandra Brown - 1955† |
Trustee* Years Served: 1 |
Consultant. Formerly CEO and President of Transamerica Financial Advisers, Inc., 1999 to 2009; President, Transamerica Securities Sales Corp. 1998 to 2009; VP, Bank of America Mutual Fund Administration 1990 to 1998. |
7 |
||||||||||||||||
|
Mark L. Lipson - 1949† |
Director* Years Served: 2 |
Consultant. ML2Advisors, LLC. Former Managing Director, Bessemer Trust (2007-2014) and US Trust (2003-2006); Founder, Chairman and CEO of the Northstar Mutual Funds (1993-2001). |
7 |
||||||||||||||||
|
Alfred E. Osborne, Jr. - 1944† |
Director* Years Served: 4 |
Interim Dean, Professor and Faculty Director, Price Center for Entrepreneurship and Innovation of the John E. Anderson School of Management at UCLA. |
7 |
Wedbush, Inc., Nuverra Environmental Solutions, Inc., and Kaiser Aluminum, Inc. |
|||||||||||||||
|
A. Robert Pisano - 1943† |
Director* Years Served: 5 |
Consultant. Formerly President and Chief Operating Officer of the Motion Picture Association of America, Inc. from 2005 to 2011. |
7 |
Entertainment Partners, and Resources Global Professionals |
|||||||||||||||
|
Patrick B. Purcell - 1943† |
Director* Years Served: 8 |
Retired. Formerly Executive Vice President, Chief Financial and Administrative Officer of Paramount Pictures from 1983 to 1998. |
7 |
||||||||||||||||
|
Interested Director(2) |
|||||||||||||||||||
|
J. Richard Atwood - 1960 |
Director* and President Years Served: 21 |
Managing Partner of the Adviser. |
7 |
||||||||||||||||
|
Officers |
|||||||||||||||||||
|
Steven Romick - 1963 |
Vice President & Portfolio Manager Years Served: 2 |
Managing Partner of the Adviser |
2 |
||||||||||||||||
|
Mark Landecker - 1975 |
Vice President & Portfolio Manager Years Served: 2 |
Partner of the Adviser (since 2013). Formerly Managing Director (2013) and Senior Vice President (2009 to 2012) of the Adviser. |
|||||||||||||||||
|
Brian Selmo - 1977 |
Vice President & Portfolio Manager Years Served: 2 |
Partner of the Adviser (since 2013). Formerly Managing Director (2013) and Vice President (2008 to 2012) of the Adviser. |
|||||||||||||||||
|
Thomas H. Atteberry - 1955 |
Vice President & Portfolio Manager Years Served: 2 |
Partner of the Adviser |
|||||||||||||||||
|
Abhijeet Patwardhan - 1979 |
Portfolio Manager Years Served: 2 |
Managing Director (since 2015) and a Director of Research (since 2015) of the Adviser. Formerly Senior Vice President (2014 to 2015) and Vice President (2010 to 2013) of the Adviser. |
|||||||||||||||||
|
David C. Lebisky - 1972 |
Chief Compliance Officer Years Served: 1 |
President of Lebisky Compliance Consulting LLC (since October 2015). Consultant, Duff & Phelps Compliance Consulting (since 2016). Senior Consultant, Freeh Group International Solutions, LLC (a global risk management firm) (since 2015). Formerly, Director of Regulatory Administration, Scotia Institutional Investments US, LP (2010 to 2014). |
|||||||||||||||||
|
E. Lake Setzler - 1967 |
Treasurer Years Served: 12 |
Senior Vice President and Controller of the Adviser. |
|||||||||||||||||
|
Francine S. Hayes - 1967 |
Secretary Years Served: 3 |
Vice President and Senior Counsel of State Street Bank and Trust Company |
|||||||||||||||||
(1) The address for each Director and each Officer (except Ms. Hayes) is 11601 Wilshire Boulevard, Suite 1200, Los Angeles, California 90025. Ms. Hayes' address is State Street Bank and Trust Company, One Lincoln Street, Boston, Massachusetts 02111.
(2) "Interested person" within the meaning of the 1940 Act by virtue of his affiliation with the Fund's Adviser.
* Directors serve until their resignation, removal or retirement.
† Independent Director and Audit Committee member
27
SOURCE CAPITAL, INC.
DIRECTOR AND OFFICER INFORMATION (Continued)
(Unaudited)
Ms. Brown and Messrs. Lipson, Osborne, Pisano, Purcell and Rudnick serve as members of the audit committee of certain investment companies managed by First Pacific Advisors, LLC ("FPA"), the Fund's investment adviser. The Fund's Board of Directors has considered the matter of their simultaneous service and determined that serving simultaneously as a member of these audit committees does not impair their ability to serve as a member of the Audit Committee of the Fund.
The Fund's schedule of portfolio holdings, filed the first and third quarter on Form N-Q with the SEC, is available on the SEC's website at www.sec.gov. Form N-Q is available at the SEC's Public Reference Room in Washington, D.C., and information on the operations of the Public Reference Room may be obtained by calling 1-202-551-8090. To obtain information on Form N-Q from the Fund, shareholders can call 1-800-982-4372.
The Fund's complete proxy voting record for the 12 months ended June 30, 2018, is available without charge, upon request, by calling 1-800-982-4372 and on the SEC's website at www.sec.gov.
The Fund's Audit Committee Charter is available on its website, www.fpa.com, and is available without charge, upon request, by calling 1-800-982-4372. The Fund's Annual CEO Certification as required by the NYSE's Corporate Governance listing standards for the fiscal year ended December 31, 2017, was submitted to the NYSE on May 18, 2018. The Fund's Chief Executive Officer and Chief Financial Officer Certifications pursuant to Section 302 of the Sarbanes-Oxley Act of 2002 were filed with the Fund's Form N-CSR and are available on the Securities and Exchange Commission's Web site at http://www.sec.gov.
Additional information about the Fund is available online at www.fpa.com. This information includes, among other things, holdings, top sectors and performance, and is updated on or about the 15th business day after the end of each quarter.
28
SOURCE CAPITAL, INC.
(Unaudited)
INVESTMENT ADVISER
First Pacific Advisors, LLC
11601 Wilshire Blvd., Suite 1200
Los Angeles, California 90025
(800) 982-4372 or (310) 473-0225
CUSTODIAN AND ADMINISTRATOR
State Street Bank and Trust Company
One Lincoln Street
Boston, Massachusetts 02111
LEGAL COUNSEL
Dechert LLP
One Bush Street, Suite 1600
San Francisco, California 94104
TRANSFER AND SHAREHOLDER SERVICE AGENT AND REGISTRAR
American Stock Transfer &
Trust Company, LLC
6201 15th Avenue
Brooklyn, New York 11219
(800) 279-1241 or (718) 921-8124
www.amstock.com
INDEPENDENT REGISTERED PUBLIC ACCOUNTING FIRM
Ernst & Young LLP
725 South Figueroa Street,
Los Angeles, California 90017
STOCK EXCHANGE LISTING
New York Stock Exchange: SOR
SUMMARY OF DIVIDEND REINVESTMENT PLAN
Holders of record (other than brokers or nominees of banks and other financial institutions) of Common Stock are eligible to participate in the Dividend Reinvestment Plan ("Plan"), pursuant to which distributions to shareholders are paid in or reinvested in shares of Common Stock of the Fund ("Dividend Shares"). American Stock Transfer & Trust Company, LLC, acts as the "Agent" for Plan participants. All correspondence with the Agent should be sent to: American Stock Transfer & Trust Company, LLC, Attn: Shareholder Relations Department, 6201 15th Avenue, Brooklyn, New York, 11219.
A shareholder may join the Plan by signing and returning an authorization form that may be obtained from the Agent. A shareholder may elect to withdraw from the Plan at any time by written notice to the Agent and thereby elect to receive cash in lieu of Dividend Shares. There is no penalty for withdrawal from the Plan, and shareholders who have previously withdrawn from the Plan may rejoin at any time. The Fund reserves the right to amend or terminate the Plan.
Purchases of the Fund's shares are made by the Agent, on behalf of the participants in the Plan, promptly after receipt of funds, and in no event later than 30 days from such receipt except when restricted under applicable federal securities laws. The Agent purchases outstanding shares in the market when the price plus estimated commissions of the Fund's Common Stock on the NYSE is lower than the Fund's most recently calculated net asset value per share. To the extent that outstanding shares are not available at a cost of less than per share net asset value, the Agent, on behalf of the participants in the Plan, accepts payment of the dividend, or the remaining portion thereof, in authorized but unissued shares of Common Stock of the Fund on the payment date. Such shares are issued at a per share price equal to the higher of (1) the net asset value per share on the payment date, or (2) 95% of the closing market price per share on the payment date. There are no brokerage charges with respect to shares issued
directly by the Fund to satisfy the dividend reinvestment requirements. However, each participant pays a pro rata share of brokerage commissions incurred with respect to the Agent's open market purchases of shares. In each case, the cost per share of shares purchased for each shareholder's account is the average cost, including brokerage commissions, of any shares purchased in the open market plus the cost of any shares issued by the Fund.
For Federal income tax purposes, shareholders who reinvest distributions are treated as receiving distributions in an amount equal to the fair market value, determined as of the payment date, of the shares received if the shares are purchased from the Fund. Such value may exceed the amount of the cash distribution that would have been paid. If outstanding shares are purchased in the open market, the taxable distribution equals the cash distribution that would have been paid. In either event, the cost basis in the shares received equals the amount recognized as a taxable distribution.
In the case of foreign participants whose dividends are subject to United States income tax withholding and in the case of any participants subject to 31% federal backup withholding, the Agent will reinvest dividends after deduction of the amount required to be withheld.
All record holders of Common Stock are also offered the opportunity, on a voluntary basis, to send in cash payments of not less than $100 each up to a total of $7,500 per month to purchase additional shares of the Common Stock of the Fund through participation in the Cash Investment Plan ("Cash Plan"). Under the Cash Plan, shares are purchased in the market and no shares are issued by the Fund. A brochure describing the terms and conditions of the Cash Plan, including fees and expenses, is available from the Agent.
29
SOURCE CAPITAL, INC.
11601 Wilshire Boulevard, Suite 1200
Los Angeles, California 90025
Item 2. Code of Ethics.
Not applicable to this semi-annual report.
Item 3. Audit Committee Financial Expert.
Not applicable to this semi-annual report.
Item 4. Principal Accountant Fees and Services.
Not applicable to this semi-annual report.
Item 5. Audit Committee of Listed Registrants.
Not applicable to this semi-annual report.
Item 6. Investments.
(a) Schedule of Investments is included as a part of the report to shareholders filed under Item 1 of this Form N-CSR.
(b) Not applicable.
Item 7. Disclosure of Proxy Voting Policies and Procedures for Closed-End Management Investment Companies.
Not applicable to this semi-annual report.
Item 8. Portfolio Managers of Closed-End Management Investment Companies.
(a)(1) Not required for this filing.
(a)(2) Not required for this filing.
(a)(3) Not required for this filing.
(a)(4) Not required for this filing.
(b) There have been no changes to any of the registrant’s portfolio managers since last reported in the registrant’s Annual Report dated December 31, 2017 and as filed in Form N-CSR on March 5, 2018 SEC Accession No. 0001104659-18-014911.
Item 9. Purchases of Equity Securities by Closed-End Management Investment Company and Affiliated Purchasers.
The registrant’s Board of Directors renewed the stock repurchase program at a Meeting of the Board of Directors on November 13, 2017 to repurchase up to 10% of the registrant’s outstanding common stock through December 31, 2018. During the period ended June 30, 2018, the registrant repurchased 6,563 shares of common stock as further detailed below.
|
Period |
|
Total Number of |
|
Average Price |
|
Total Number of |
|
Maximum |
| |
|
1/1/18 – 1/31/18 |
|
603 |
|
$ |
42.1908 |
|
603 |
|
861,133 |
|
|
2/1/18 – 2/28/18 |
|
2,232 |
|
$ |
41.8419 |
|
2,232 |
|
858,901 |
|
|
3/1/18 – 3/31/18 |
|
600 |
|
$ |
39.6717 |
|
600 |
|
858,301 |
|
|
4/1/18 – 4/30/18 |
|
1,004 |
|
$ |
39.6597 |
|
1,004 |
|
857,297 |
|
|
5/1/18 – 5/31/18 |
|
0 |
|
0 |
|
0 |
|
857,297 |
| |
|
6/1/18 – 6/30/18 |
|
2,124 |
|
$ |
40.2041 |
|
2,124 |
|
855,173 |
|
Item 10. Submission of Matters to a Vote of Security Holders.
There have been no material changes to the procedures by which the shareholders may recommend nominees to the registrant’s board of directors.
Item 11. Controls and Procedures.
(a) The principal executive officer and principal financial officer of the registrant have concluded that the registrant’s disclosure controls and procedures (as defined in Rule 30a-3(c) under the Investment Company Act of 1940) are effective based on their evaluation of the disclosure controls and procedures as of a date within 90 days of the filing date of this report.
(b) There have been no significant changes in the registrant’s internal controls over financial reporting (as defined in Rule 30a-3(d) under the Investment Company Act of 1940) that occurred during the registrant’s second fiscal quarter of the period covered by this report that have materially affected, or is reasonably likely to materially affect, the registrant’s internal controls over financial reporting.
Item 12. Disclosure of Securities Lending Activities for Closed-End Management Investment Companies
Not applicable to this semi-annual report.
Item 13. Exhibits.
(a)(1) Not applicable.
(a)(2) The certifications required by Rule 30a-2(a) under the Investment Company Act of 1940 are attached hereto.
(a)(3) Not applicable.
(a)(4) The information required regarding the change in the independent public accountant is attached hereto.
(b) The certifications required by Rule 30a-2(b) under the Investment Company Act of 1940 and Section 906 of the Sarbanes-Oxley Act of 2002 are attached hereto.
SIGNATURES
Pursuant to the requirements of the Securities Exchange Act of 1934 and the Investment Company Act of 1940, the registrant has duly caused this report to be signed on its behalf by the undersigned, thereunto duly authorized.
|
SOURCE CAPITAL, INC. |
| |
|
|
| |
|
|
| |
|
By: |
/s/ J. Richard Atwood |
|
|
|
J. Richard Atwood |
|
|
|
President (principal executive officer) |
|
|
|
|
|
|
Date: |
September 6, 2018 |
|
Pursuant to the requirements of the Securities Exchange Act of 1934 and the Investment Company Act of 1940, this report has been signed below by the following persons on behalf of the registrant and in the capacities and on the dates indicated.
|
By: |
/s/ J. Richard Atwood |
|
|
|
J. Richard Atwood |
|
|
|
President (principal executive officer) |
|
|
|
|
|
|
Date: |
September 6, 2018 |
|
|
|
|
|
|
|
|
|
|
By: |
/s/ E. Lake Setzler III |
|
|
|
E. Lake Setzler III |
|
|
|
Treasurer (principal financial officer) |
|
|
|
|
|
|
Date: |
September 6, 2018 |
|
On February 12, 2018, the Board of Trustees of Source Capital, Inc. (the “Board”) dismissed Deloitte & Touche LLP (“Deloitte”) as the independent registered public accounting firm for Source Capital, Inc. (the “Fund”).
Deloitte’s reports on the Fund’s financial statements for the fiscal years ended December 31, 2016 and December 31, 2017 contained no adverse opinion or disclaimer of opinion nor were they qualified or modified as to uncertainty, audit scope, or accounting principles. During the Fund’s fiscal years ended December 31, 2016, December 31, 2017 and through February 12, 2018, (i) there were no disagreements with Deloitte on any matter of accounting principles or practices, financial statement disclosure, or audit scope or procedure, which disagreements, if not resolved to the satisfaction of Deloitte, would have caused them to make reference to the subject matter of the disagreements in connection with their reports on the Fund’s financial statements for such years, and (ii) there were no reportable events of the kind described in Item 304(a)(1)(v) of Regulation S-K.
The Board has requested that Deloitte furnish it with a letter addressed to the SEC stating whether or not it agrees with the above statements. A copy of such letter, dated September 6, 2018, is filed as an exhibit to this N-CSR.
The Board has selected Ernst & Young LLP (“EY”) to serve as the Fund’s independent registered public accounting firm for the fiscal year ending December 31, 2018. The decision to select EY was recommended by the Board’s Audit Committee and was approved by the Board. During the Fund’s fiscal years ended December 31, 2016, December 31, 2017 and through February 12, 2018, the Fund has not consulted with EY regarding either the (i) application of accounting principles to a specified transaction, either completed or proposed; or the type of audit opinion that might be rendered on the financial statements, and neither a written report was provided nor oral advice was provided that EY concluded was an important factor considered by the Fund in reaching a decision as to the accounting, auditing, or financial reporting issue; or (ii) any matter that was either the subject of a disagreement, as that term is defined in S-K 304(a)(1)(iv) and the related instructions to S-K 304, or a reportable event, as that term is defined in S-K 304(a)(1)(v).
|
|
Deloitte & Touche LLP |
|
|
555 West 5th Street |
|
|
Suite 2700 |
|
|
Los Angeles, CA 90013-1010 |
|
|
USA |
|
|
|
|
|
Tel: +1 213 688 0800 |
|
|
Fax: +1 213 688 0100 |
|
|
www.deloitte.com |

September 6, 2018
Securities and Exchange Commission
100 F Street, N.E.
Washington, D.C. 20549-7561
Dear Sirs/Madams:
We have read the exhibit to item 304(a)(3) on Form N-CSR dated September 6, 2018, and have the following comments:
1. We agree with the statements made in the first, second and third paragraphs.
2. We have no basis on which to agree or disagree with the statements made in the fourth paragraph.
|
Yours Truly, |
|
|
|
|
|
/s/ Deloitte & Touche LLP |
|
I, J. Richard Atwood, President of Source Capital, Inc., certify that:
1. I have reviewed this report on Form N-CSR of Source Capital, Inc.;
2. Based on my knowledge, this report does not contain any untrue statement of a material fact or omit to state a material fact necessary to make the statements made, in light of the circumstances under which such statements were made, not misleading with respect to the period covered by this report;
3. Based on my knowledge, the financial statements, and other financial information included in this report, fairly present in all material respects the financial condition, results of operations, changes in net assets, and cash flows (if the financial statements are required to include a statement of cash flows) of the registrant as of, and for, the periods presented in this report;
4. The registrant’s other certifying officer and I are responsible for establishing and maintaining disclosure controls and procedures (as defined in Rule 30a-3(c) under the Investment Company Act of 1940) and internal control over financial reporting (as defined in Rule 30a-3(d) under the Investment Company Act of 1940) for the registrant and have:
(a) Designed such disclosure controls and procedures, or caused such disclosure controls and procedures to be designed under our supervision, to ensure that material information relating to the registrant, including its consolidated subsidiaries, is made known to us by others within those entities, particularly during the period in which this report is being prepared;
(b) Designed such internal control over financial reporting, or caused such internal control over financial reporting to be designed under our supervision, to provide reasonable assurance regarding the reliability of financial reporting and the preparation of financial statements for external purposes in accordance with generally accepted accounting principles;
(c) Evaluated the effectiveness of the registrant’s disclosure controls and procedures and presented in this report our conclusions about the effectiveness of the disclosure controls and procedures, as of a date within 90 days prior to the filing date of this report based on such evaluation; and
(d) Disclosed in this report any change in the registrant’s internal control over financial reporting that occurred during the second fiscal quarter of the period covered by this report that has materially affected, or is reasonably likely to materially affect, the registrant’s internal control over financial reporting; and
5. The registrant’s other certifying officer and I have disclosed to the registrant’s auditors and the audit committee of the registrant’s board of directors (or persons performing the equivalent functions):
(a) All significant deficiencies and material weaknesses in the design or operation of internal control over financial reporting which are reasonably likely to adversely
affect the registrant’s ability to record, process, summarize, and report financial information; and
(b) Any fraud, whether or not material, that involves management or other employees who have a significant role in the registrant’s internal control over financial reporting.
|
Date: |
September 6, 2018 |
|
|
|
|
|
|
|
|
|
|
By: |
/s/ J. Richard Atwood |
|
|
|
J. Richard Atwood |
|
|
|
President (principal executive officer) |
|
I, E. Lake Setzler III, Treasurer of Source Capital, Inc., certify that:
1. I have reviewed this report on Form N-CSR of Source Capital, Inc.;
2. Based on my knowledge, this report does not contain any untrue statement of a material fact or omit to state a material fact necessary to make the statements made, in light of the circumstances under which such statements were made, not misleading with respect to the period covered by this report;
3. Based on my knowledge, the financial statements, and other financial information included in this report, fairly present in all material respects the financial condition, results of operations, changes in net assets, and cash flows (if the financial statements are required to include a statement of cash flows) of the registrant as of, and for, the periods presented in this report;
4. The registrant’s other certifying officer and I are responsible for establishing and maintaining disclosure controls and procedures (as defined in Rule 30a-3(c) under the Investment Company Act of 1940) and internal control over financial reporting (as defined in Rule 30a-3(d) under the Investment Company Act of 1940) for the registrant and have:
(a) Designed such disclosure controls and procedures, or caused such disclosure controls and procedures to be designed under our supervision, to ensure that material information relating to the registrant, including its consolidated subsidiaries, is made known to us by others within those entities, particularly during the period in which this report is being prepared;
(b) Designed such internal control over financial reporting, or caused such internal control over financial reporting to be designed under our supervision, to provide reasonable assurance regarding the reliability of financial reporting and the preparation of financial statements for external purposes in accordance with generally accepted accounting principles;
(c) Evaluated the effectiveness of the registrant’s disclosure controls and procedures and presented in this report our conclusions about the effectiveness of the disclosure controls and procedures, as of a date within 90 days prior to the filing date of this report based on such evaluation; and
(d) Disclosed in this report any change in the registrant’s internal control over financial reporting that occurred during the second fiscal quarter of the period covered by this report that has materially affected, or is reasonably likely to materially affect, the registrant’s internal control over financial reporting; and
5. The registrant’s other certifying officer and I have disclosed to the registrant’s auditors and the audit committee of the registrant’s board of directors (or persons performing the equivalent functions):
(a) All significant deficiencies and material weaknesses in the design or operation of internal control over financial reporting which are reasonably likely to adversely affect the registrant’s ability to record, process, summarize, and report financial information; and
(b) Any fraud, whether or not material, that involves management or other employees who have a significant role in the registrant’s internal control over financial reporting.
|
Date: |
September 6, 2018 |
|
|
|
|
|
|
|
|
|
|
By: |
/s/ E. Lake Setzler III |
|
|
|
E. Lake Setzler III |
|
|
|
Treasurer (principal financial officer) |
|
Pursuant to Section 906 of the Sarbanes-Oxley Act of 2002 (subsections (a) and (b) of section 1350, chapter 63 of title 18, United States Code) I, J. Richard Atwood, President of Source Capital, Inc. (the “Fund”), does hereby certify, to my knowledge, that:
1. The Form N-CSR of the Fund for the period ended June 30, 2018 (the “Report”) fully complies with the requirements of Section 13(a) or 15(d) of the Securities Exchange Act of 1934; and
2. The information contained in the Report fairly presents, in all material respects, the financial condition and results of operations of the Fund.
|
By: |
/s/ J. Richard Atwood |
|
|
|
J. Richard Atwood |
|
|
|
President (principal executive officer) |
|
|
|
|
|
|
|
|
|
|
Date: |
September 6, 2018 |
|
Pursuant to Section 906 of the Sarbanes-Oxley Act of 2002 (subsections (a) and (b) of section 1350, chapter 63 of title 18, United States Code) I, E. Lake Setzler III, Treasurer of Source Capital, Inc. (the “Fund”), does hereby certify, to my knowledge, that:
1. The Form N-CSR of the Fund for the period ended June 30, 2018 (the “Report”) fully complies with the requirements of Section 13(a) or 15(d) of the Securities Exchange Act of 1934; and
2. The information contained in the Report fairly presents, in all material respects, the financial condition and results of operations of the Fund.
|
By: |
/s/ E. Lake Setzler III |
|
|
|
E. Lake Setzler III |
|
|
|
Treasurer (principal financial officer) |
|
|
|
|
|
|
|
|
|
|
Date: |
September 6, 2018 |
|
This certification is being furnished to the Securities and Exchange Commission pursuant to Rule 30a-2(b) under the Investment Company Act of 1940, as amended, and 18 U.S.C. Section 1350 and is not being filed as part of the Report with the Securities and Exchange Commission. A signed original of this written statement required by Section 906 has been provided by the Fund and will be retained by the Fund and furnished to the Securities and Exchange Commission or its staff upon request.
Serious News for Serious Traders! Try StreetInsider.com Premium Free!
You May Also Be Interested In
- RROCKET Burns 50% of Its Supply to Fuel Growth and Investor Confidence
- Novo Nordisk A/S – Total number of voting rights and share capital in Novo Nordisk A/S as of 26 April 2024
- BitFuFu Files 2023 Annual Report on Form 20-F
Create E-mail Alert Related Categories
SEC FilingsSign up for StreetInsider Free!
Receive full access to all new and archived articles, unlimited portfolio tracking, e-mail alerts, custom newswires and RSS feeds - and more!
