

Form N-CSRS Northern Lights Fund For: Oct 31
 Tweet
Tweet Share
Shareunited
states
securities and exchange commission
washington, d.c. 20549
form n-csr
certified shareholder report of registered management
investment companies
Investment Company Act file number 811-21720
Northern Lights Fund Trust
(Exact name of registrant as specified in charter)
225 Pictoria Drive, Suite 450, Cincinnati, Ohio 45246
(Address of principal executive offices) (Zip code)
The Corporation Trust Company
1209 Orange Street, Wilmington, DE 19801
(Name and address of agent for service)
Registrant's telephone number, including area code: 631-470-2600
Date of fiscal year end: 4/30
Date of reporting period: 10/31/20
Item 1. Reports to Stockholders.
 | |
| Semi-Annual Report | |
| October 31, 2020 | |
| CMG MAULDIN CORE FUND | |
| CLASS A SHARES – GEFAX | CLASS I SHARES – GEFIX |
| CMG TACTICAL BOND FUND | |
| CLASS A SHARES – CHYAX | CLASS I SHARES - CHYOX |
| CMG TACTICAL ALL ASSET STRATEGY FUND | |
| CLASS A SHARES – CMGQX | CLASS I SHARES - CMGHX |
| 1-866-CMG-9456 | |
| www.cmgmutualfunds.com | |
| This report and the financial statements contained herein are submitted for the general information of shareholders and are not authorized for distribution to prospective investors unless preceded or accompanied by an effective prospectus. Nothing herein contained is to be considered an offer of sale or solicitation of an offer to buy shares of CMG Funds. Such offering is made only by prospectus, which includes details as to offering price and other material information. | |
| Distributed
by Northern Lights Distributors, LLC Member FINRA | |
Beginning on January 1, 2021, as permitted by regulations adopted by the Securities and Exchange Commission, paper copies of the Funds’ shareholder reports like this one will no longer be sent by mail, unless you specifically request paper copies of the reports. Instead, the reports will be made available on the Funds’ website www.cmgmutualfunds.com, and you will be notified by mail each time a report is posted and provided with a website link to access the report.
If you already elected to receive shareholder reports electronically, you will not be affected by this change and you need not take any action. You may elect to receive shareholder reports and other communications from the Funds electronically or to continue receiving paper copies of shareholder reports, which are available free of charge, by contacting your financial intermediary (such as a broker-dealer or bank) or, if you are a direct investor, by following the instructions included with paper Fund documents that have been mailed to you.
Dear Shareholder,
The purpose of this letter is to review performance, provide a comparison of performance vs. appropriate benchmarks, and discuss our outlook for the CMG Mauldin Core Fund, the CMG Tactical All Asset Strategy Fund and the CMG Tactical Bond Fund.
CMG Mauldin Core Fund
The Fund returned +3.41% (Class A Shares) and +3.48% (Class I Shares) over the past six months (May 1, 2020 through October 31, 2020), net of fees. The Morningstar Tactical Allocation Category, the Fund’s peer group, returned +7.61% over the past six months (May 1, 2020 through October 31, 2020). The benchmark for the Fund, the Morningstar Moderate Target Risk Index, returned +8.81% over the past six months (May 1, 2020 through October 31, 2020).
The Fund began the second quarter of 2020 in a conservative risk position after reducing risk in February ahead of the sharp market decline in March. The market crash in response to the coronavirus pandemic dramatically reversed technical and fundamental market indicators that were, just a couple months earlier, signaling a bullish year for equities.
The Fund was positioned as follows at the beginning of May: 27.44% equities, 65.47% fixed income, 6.78% commodities and 0.31% cash. Equity positions were allocated as follows: 73.40% U.S. equities, 19.85% international developed and 6.75% emerging market equities. Fixed income holdings were still predominately in ultrashort bonds (80.44% of the portfolio’s fixed income allocation) with long and intermediate government bonds accounting for the next two largest allocations at 11.36% and 8.20%, respectively.
After the crash in March, equity markets rebounded sharply in April, setting off a rally that continued through the second and into the third quarter. Unprecedented support by the Federal Reserve and a historic amount of fiscal stimulus put a floor under equity markets while at the same time driving bond yields lower. The Fund added risk exposure slowly in April and May while also taking more credit and duration risk in the portfolio’s fixed income holdings. The Fund reduced domestic equity positions in favor of holdings in German equities while also adding modestly to a diversified emerging markets position. The Fund’s fixed income positions held steady through April, favoring ultrashort duration, intermediate and long government bonds over riskier credits. In May, ultrashort bonds were reduced in favor of long government bonds and a small allocation to corporate bonds. The Fund further added risk to its fixed income positions, again reducing ultrashort duration positions in favor of corporate, high yield, emerging market and world bonds. The Fund also increased its allocation to long government bonds. The Fund also increased and diversified its equity positions in May and June. By the end of the quarter, the Fund had doubled its equity exposure (from previous quarter-end). Domestic equity positions, primarily in large caps, still accounted for the overwhelming majority of equity exposure but by June, the portfolio held some small cap and emerging market exposure.
The Fund began the third quarter in a moderate risk position and remained similarly positioned throughout the quarter. Equity markets continued to recover and trend higher while bond markets remained strong, backed by
1
the strong tailwind of accommodative Fed policy. The Fund’s equity allocation reached the highest level since February. Although the portfolio embraced more risk, fixed income holdings outweighed equities and bonds remained attractive from a risk-reward standpoint, especially against a backdrop of ultra-accommodative central bank policy. The asset class mix of the portfolio remained consistent throughout the quarter, but the underlying mix of equity and fixed income funds adapted to a change in investor preferences over the past several months. Specifically, domestic equities were reduced from 86% in June to 68% in September, reflecting the relative slowdown of the U.S. recovery as compared to Asia and Europe. The U.S. has had one of the least effective health policy responses to the pandemic and, although the Fed and fiscal stimulus helped stave off a greater decline in GDP earlier in the year, the economy looked to be running on fumes. In this context, Asia and Europe looked comparatively better. The Fund’s equity holdings reflected this change in sentiment and, while international developed positions remained roughly 8% (of equity exposure) throughout the quarter, emerging market exposure increased significantly to 23% of the Fund’s total equity exposure by the end of the third quarter, the highest level since January 2019.
The mix of fixed income positions in the portfolio also reflected an increased risk appetite, especially early in the quarter. Ultrashort bond holding reached a peak of 80% of the Fund’s fixed income holdings in March and April but bottomed out during July and August at around 30% before rising back to 56% in reaction to the market decline in September. Nonetheless, the reduction in short duration bond positions reflects the market appetite for increased risk with the reallocation out of short duration bonds going to high yield bonds in July and August.
After dropping slightly in the second quarter, commodity exposure increased in the third quarter. The Fund’s commodity exposure has been almost exclusively in gold over the past six months ended October 31, 2020 holding between 4-8% in gold related funds. Gold, continues to perform well as investors seek portfolio diversification to offset potential tail risks like currency devaluations. Specifically, the U.S. dollar, which historically has been inversely correlated to the price of gold, will likely continue to be under pressure during the economic recovery.
As the budget deficit has exploded, the Fed’s printing press has many investors, domestic and foreign, concerned and seeking exposure to gold. We believe that gold can and will continue to play a meaningful role in the portfolio as a number of macroeconomic factors (including massive monetary and fiscal stimulus, pressure on currencies and global trade and low bond yields) support further price appreciation. The Fund also added exposure to a basket of commodities, particularly energy. Oil prices remain range bound but well off the lows from the year and could be further helped by dollar weakness.
At end of October, the Fund remained in a moderate risk position and was allocated as follows: 47.16% equities, 46.36% fixed income, 5.02% commodities, and 1.47% cash. Equity positions were allocated as follows: 68.20% U.S. equities, 13.17% international developed, and 18.62% emerging market equities. Fixed income holdings were still predominately in ultrashort bonds (61.79% of the portfolio’s fixed income allocation) with long government bonds and corporate bonds accounting for the next two largest allocations at 26.06% and 6.47%, respectively.
CMG Tactical All Asset Strategy Fund
The Fund returned +2.93% (Class A Shares) and +2.93% (Class I Shares) over the past six months (May 1, 2020 through October 31, 2020), net of fees. The Morningstar Multialternative Category, the Fund’s peer group,
2
returned +3.20% over the past six months (May 1, 2020 through October 31, 2020). The benchmark for the Fund, the Morningstar Moderate Target Risk TR Index, returned +8.81% over the past six months (May 1, 2020 through October 31, 2020).
The Fund began the second quarter of 2020 in an extremely conservative risk position with zero exposure to equities. During the market crash in the first quarter, the Fund moved entirely to fixed income and gold. As equity markets responded to fiscal and monetary stimulus, the Fund slowly added risk exposure over the quarter. In April, the Fund was primarily allocated to ultrashort duration bonds, long government bonds and gold. In May, the portfolio increased risk, rotating out of ultrashort duration bonds and into investment grade corporate bonds, mortgage backed securities and equities, specifically, healthcare and large caps. The Fund continued to add risk to the portfolio in June, further adding equity exposure. The portfolio held positions in technology and large caps. The fixed income allocations also reflected an increased appetite for risk, adding exposure to convertible bonds and longer duration government bonds at the expense of a reduction in ultrashort bonds. The Fund’s holdings in technology funds and its position in gold were strong contributors to positive performance, particularly at the end of the quarter and into July.
The Fund began the third quarter conservatively positioned but quickly added equity risk in early July. The portfolio shifted out of short and intermediate government bonds, reallocating in favor of technology and gold miner positions. As equity markets trended higher in July and August, the Fund was able to capture upside due to increased equity exposure. The Fund has held gold-related positions for much of the year and in August increased that exposure in two ways: increasing exposure in gold to 20% of the portfolio while also adding a position in gold miners. Fixed income exposure, early in the quarter also signaled an increased appetite for risk as holdings in government bonds were moved to corporate bonds. In September, the Fund was positioned in technology, transportation, consumer discretionary, and emerging markets equities, reflecting the increased risk appetite of the overall market entering the month. Bond exposure was diversified across international developed and emerging bonds and long government bonds and helped offset declines in the equity portion of the portfolio. The Fund continued to overweight equity exposure in October, holding a diversified mix of utilities, technology and emerging market positions. Fixed income holdings were allocated across convertible, international and emerging market bond funds. Gold, despite strong performance throughout the year, was a drag on performance as prices pulled back from multi-year highs after reaching $2,000/ounce. However, equity markets peaked and then drew down in September as negotiations over fiscal stimulus stalled. Although the Fund trended down with the market due to its increased equity exposure in September, most of those positions rebounded nicely in October and have continued to perform well through November.
CMG Tactical Bond Fund
The Fund returned -1.28% (Class A Shares) over the past six months (May 1, 2020 through October 31, 2020) and -0.82% (Class I Shares) over the past six months (May 1, 2020 through October 31, 2020), net of fees. The Morningstar Nontraditional Bond Category, the Fund’s peer group, returned +6.00% over the past six months (May 1, 2020 through October 31, 2020). The benchmark for the Fund, the Bloomberg Barclays U.S. Corporate High Yield Bond Index, returned +10.83% over the past six months (May 1, 2020 through October 31, 2020).
3
The Fund began the second quarter of 2020 in a defensive position after a difficult first quarter for high yield bonds. The Fund moved back into high yield bonds in June and remained invested for the balance of the quarter. The Fed relieved pressure on corporate debt markets, announcing a range of liquidity programs at the end of the first quarter. In some cases, the Fed was buying ETFs, including high yield bond ETFs seeking to provide liquidity and avoid the large dislocations that occurred during the worst moments of panic selling in March. For example, the iShares iBoxx Investment Grade Corporate Bond ETF traded at a 5% discount to NAV, the widest spread since 2008. Investors who were selling into that market were receiving 5% less than the actual value of the underlying bonds due to a liquidity mismatch (the ETF trades while the underlying bonds do not). The Fed stepped in to prevent contagion to credit markets. If investment grade bonds could trade that wide, the risk to lesser credits like high yield bonds was dangerously severe. The resulting impact has been a rally in high yield bonds, back to spreads that mask the underlying economic risk to the bond issuers. Much of that rally occurred in just a few trading days after the Fed announced its interventions. While this strategy can pay off in the short term, the Fed risks attempting to prop up the entire credit market if an economic recovery does not pick up steam. High yield bonds’ prices reflect this rose colored view as spreads have come back down to levels more indicative of a stable economic expansion.
The Fund began the third quarter invested in high yield bonds. July was a particularly strong month for high yields and the strategy was able to capture significant upside, posting its strongest monthly return for the year. The high yield rally stalled out in August, barely posting a positive return. After a strong second quarter across most asset classes a pullback was expected, especially heading into what is historically the most difficult period for markets. In September, high yield bonds declined modestly dragged down along with equity markets fretting about additional economic stimulus. As a result, the Fund moved out of high yields and into a defensive position in early September. High yields rebounded late in the month and, by early October, the Fund was again invested in high yield bonds.
Since high yield spreads spiked to 1,100 bps in March, the second widest spread in history, spread levels have continued to tighten, coming back to levels we’ve seen over the past couple of years. At 500-600 bps over Treasuries, high yield bonds continue to lure investors seeking additional yield from their fixed income portfolios. This appetite for yield, combined with a Fed bond buying backstop, will likely limit short-term drawdowns in the near future as investors are keen to “buy the dips.” However, there are some interesting cross-currents in the market with respect to issuance and default rates.
In September, annual issuance in the primary high yield bond market reached a new annual record. Issuance reached $339 billion, surpassing the previous annual record set in 2012. A larger part of new issuance this year has been for refinancing purposes, as companies are preparing for the worst by getting ahead of upcoming maturities and moving their debt further out in time. While many companies are refinancing, on the other end of the high yield spectrum we’re starting to see an uptick in defaults. Historically, default cycles typically peak about a year after a big blow out in spreads like we had in March. Default rates in March were just under 5% but in August the rate hit 8.7%. History would suggest that we are still several months away from a peak in defaults. The divergence within the high yield market is indicative of the larger economy: some sectors, such as technology, are thriving while others, such as service and hospitality or energy, are barely hanging on. For those barely hanging on, two factors will play an additional role that is likely to drive the default rate higher: a second wave of COVID-19 and a lack of or undersized stimulus. Just when high yields claw their way back to break even, it appears that there are more storm clouds on the horizon.
4
Market Outlook
Bar Rescue and Restaurant Impossible
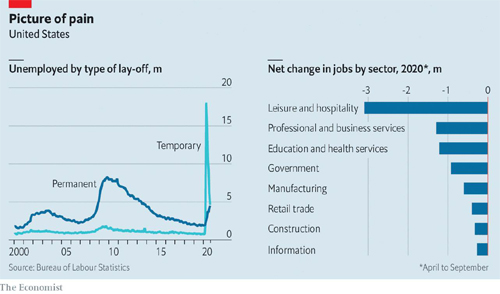
Jon Taffer knows about bars. He’s been in the bar, restaurant, and club business since the early 70’s and Taffer is also credited for creating the NFL’s Sunday Ticket, a pay programming package that has helped bars attract patrons and boost revenues. Taffer is most famous for his television show “Bar Rescue,” which much like restaurant-themed shows from Chef Robert Irvine (“Restaurant Impossible”) and Chef Gordon Ramsey (“Kitchen Nightmares”), tells the story of a turnaround in a failing business. Given the state of the restaurant and hospitality business during the pandemic, I imagine that Mr. Taffer is receiving more than his normal volume of requests for help. On the show, Taffer brings his strong personality, tough love based on a reality-based view of the world and industry best practices to struggling business owners. His recent observations on the bar and restaurant sector are troubling: the economics of running a bar or restaurant can’t work at the reduced capacity levels caused by the pandemic and many owners are better off temporarily closing down than bleeding money. Furthermore, he doesn’t believe that the situation is going to change barring a vaccine. In his estimation, a solid 30% of people will not go out until there is certainty, which means a widely distributed vaccine. At 70% capacity, the economics simply don’t work for most bar and restaurant owners.
While the retail sector suffered during the early months of the pandemic in the spring, companies with strong e-commerce strategies have managed to adapt. For bars and restaurants, the closest equivalent is takeout and, while takeout business is helping some businesses to survive, many are just barely hanging on. Moreover, as we head into the fall and winter, businesses that were able to use outdoor seating will no longer have that option available. Additional stimulus is needed across most of the economy to buy more time for additional therapeutics and, ultimately, a vaccine, but for bars, restaurants, and the leisure and hospitality businesses, it cannot come soon enough. The chart below shows how the sector has been disproportionately impacted by the pandemic, easily outpacing the rest of the economy in job losses. Those lay-offs have been temporary in most cases but, as the pandemic grinds on and positive cases increase, many of those lay-offs will become permanent. In the past several weeks alone, airlines have announced another 30,000 job cuts, Disney is planning 28,000 lay-offs and movie theaters, led by Regal Cinemas, which announced it plans to close most of its largest theaters, are fighting an existential crisis as they seek to adapt to a new world.
5
Macroeconomic Tasseomancy
While stocks continue to hover around their highs of the year, the disconnect between Wall Street and Main Street has widened. Equity markets have been buoyed by aggressive Fed policy and low interest rates and, although accommodative policy combined with the CARES Act earlier this year helped Main Street, the disconnect in economic fundamentals raises questions about the sustainability of the market rally that started in April. The first quarter was likely the trough for most economies including the U.S. market but the recovery, much like after the financial crisis a decade ago, is stalling out. There is reason for optimism that the worst is possibly behind us but, without better policies to contain the pandemic and more economic stimulus, the recovery will be longer and more difficult. A quick look at the some of the most recent vital signs for the economy should sound alarm bells for investors and begs the question: are Wall Street and the stock market correctly predicting a rebound or do the fundamentals on Main Street signal a more difficult period ahead? Let’s read some of the tea leaves.
| ● | The IMF forecasts that, by the end of 2020, global output will be 8% lower than it would have been without the pandemic, reflecting the difference in a forecast of +3% growth vs. a -5% decline. To put this in perspective, the global economy declined by -0.1% during the financial crisis in 2009. |
| ● | The World Bank forecasts that 89 million people will be pushed into extreme poverty, a rise of 15%. |
| ● | The second quarter saw the lowest level of workforce participation amongst Americans aged 25-54 in 50 years. One-sixth of young people worldwide lost their jobs. |
| ● | Mortgage delinquencies reached a 21-year high in July as the 120-day delinquency rate hit 1.4%. The 90-day delinquency rate hit 4.1%, up from 1.3% for the same period last year and highest level since 2014. All 50 states saw an uptick. |
6
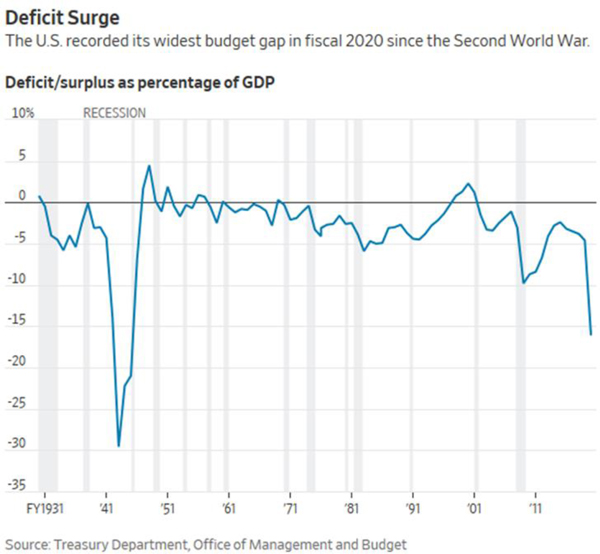
| ● | The U.S. budget deficit hit a record $3.1 trillion in September, representing 16.1% of economic output, the largest percentage since 1945. Federal debt represented 102% of GDP, a level not seen for over 70 years. Although the Fed’s aggressive policies have kept interest rates down, sustaining this level of spending and accommodation will put pressure on the dollar down the road. |
| ● | The personal savings rate hit 33% in early 2020, illustrating American’s uncertainty about the near future. Many recipients of stimulus checks have been able to get through the spring and summer but are concerned about the next several quarters. Mortgage forbearance and moratoriums on evictions could also be a factor here as unemployed Americans are saving money and/or using it to live day-to-day but may ultimately have to be use those funds to catch up on payments. Conversely, if the pandemic slows or a vaccine is available, there is a lot of dry powder available, in savings and investment accounts, that could push consumer spending and equity markets higher. |
7
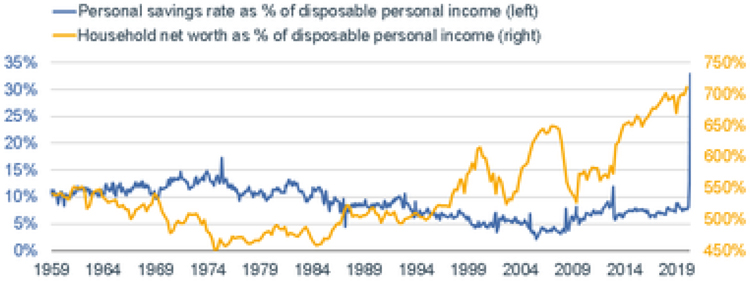
| * | Source: Charles Schwab, Bloomberg, BEA, Federal Reserve. Personal savings rate as of 4/30/20. Household net worth as of 12/31/2019. |
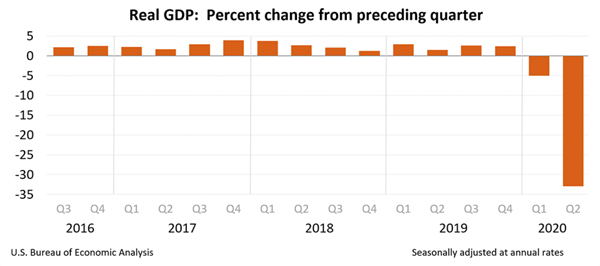
| ● | U.S. GDP declined at an annual rate of 31.4% in the second quarter 2020. The U.S. economy has never shrunk by more than 10% on an annualized basis in any quarter since World War II (when the government started keeping track). The third quarter is expected to expand by approximately 25%. Consumer spending and business investment contracted by over 30% in the spring, both record declines. While the economy is showing signs of recovery, it is likely to be slower than expected as the second and third waves of the pandemic emerge in Europe and the U.S. (see more below). |
Reopening Catch-22
Reopening has created optimism about the economic recovery but, as of the time of this writing, as the school year has started and we head into the fall, cases are rising across Europe and the U.S., forcing governments to lockdown again. After managing the spread of the virus relatively well after the initial outbreak, Europe is facing
8
a quickly rising second wave and, with the exception of Germany, most European countries are imposing wide-ranging lockdowns again. The outbreak in Europe was a harbinger for the U.S. in the spring and the current outbreak looks like an omen again. The U.S. is facing a third wave of rising infections with just a handful of states showing declining cases. The daily number of cases is breaking daily highs from earlier in the year. While lockdowns were effective at slowing the spread of the virus earlier in the year, a second wave of lockdowns without a comprehensive strategy for testing and tracing outbreaks seems absurd. Unfortunately, on both sides of the Atlantic, governments have fallen woefully short. The result is that the economic recovery is undercut by the inadequacy of each government’s response. The situation looks even more troubling when compared to Asia where aggressive testing and tracing policies have kept daily cases low.
Each subsequent wave and missed opportunity to take the necessary steps to control outbreaks is straining the mental health of citizens across the globe. In our view it makes absolutely no sense to buy more time by stimulating the economy and locking down areas if there is no strategy for how that extra time will be used to make our policies more effective. Hoping the virus will go away or a vaccine will be available and distributed soon is not a strategy and will lead to further economic pain and a likely market pullback, or something worse. The good news is that we know more about the virus and how to treat it than six months ago and despite the rising number of positive cases, we are likely to see fewer deaths.
Resilient Portfolios for Uncertain Times
For investors trying to make heads or tails of the market, we believe it’s important to fall back on two principles: diversification and patience. Investors with long horizons should try to avoid chasing a market due to a fear of missing out where a handful of stocks (i.e., FAANG stocks) are creating the impression of a raging bull market. Assessing the market based on an equal-weighted index tells a dramatically different story as most investors are not invested in just five stocks. Having a plan and being patient enough to stick to it should help most investors avoid emotional whiplash and withstand the volatility of markets driven by irrational positive (i.e., good clinical trial or stimulus is coming) and negative (i.e., side effects of a bad clinical trial and no stimulus is coming) sentiments. To facilitate that patience, we believe that investors should remain well diversified across stocks, bonds, and commodities, especially gold. Furthermore, investor portfolios should blend active with passive strategies seeking to facilitate automatic de-risking of portfolios during sell-offs. By reducing overall portfolio volatility, investors are more likely to manage emotions and stay on plan. We think an open mind and a well-diversified portfolio is more important than ever as we expect the next several quarters to be extremely challenging.
Kindest regards,
PJ Grzywacz
President
November 30, 2020
8181-NLD-12/3/2020
9
Additional Index Disclosure: The Bloomberg Barclays U.S. Corporate High Yield Bond Index: The Bloomberg Barclays U.S. Corporate High Yield Bond Index is an unmanaged index that covers the universe of fixed-rate, noninvestment grade debt. The Morningstar Moderate Target Risk Index: The Moderate Target Risk Index is a rules-based index based on a well-established asset allocation methodology from Ibbotson Associates, a Morningstar company. The index seeks to provide both capital appreciation and income. This index tends to hold larger positions in stocks than conservative-allocation portfolios. The index typically has 50-70% of assets in equities. The index is rebalanced annually. The Morningstar Multialternative Category: The Multialternative Category contains funds that offer investors exposure to several different alternative investment tactics. Funds in this category have a majority of their assets exposed to alternative strategies. An investor’s exposure to different tactics may change slightly over time in response to market movements. Funds in this category include both funds with static allocations to alternative strategies and funds tactically allocating among alternative strategies and asset classes. The gross short exposure is greater than 20%. The Morningstar Nontraditional Bond Category: The Nontraditional Bond Category contains funds that pursue strategies divergent in one or more ways from conventional practice in the broader bond-fund universe. Many funds in this group describe themselves as “absolute return” portfolios, which seek to avoid losses and produce returns uncorrelated with the overall bond market; they employ a variety of methods to achieve those aims. Another large subset are self-described “unconstrained” portfolios that have more flexibility to invest tactically across a wide swath of individual sectors, including high-yield and foreign debt, and typically with very large allocations. Funds in the latter group typically have broad freedom to manage interest-rate sensitivity, but attempt to tactically manage those exposures in order to minimize volatility. The category is also home to a subset of portfolios that attempt to minimize volatility by maintaining short or ultra-short duration portfolios, but explicitly court significant credit and foreign bond market risk in order to generate high returns. Funds within this category often will use credit default swaps and other fixed income derivatives to a significant level within their portfolios. The Morningstar Tactical Allocation Category: The Tactical Allocation Category contains funds that seek to provide capital appreciation and income by actively shifting allocations across investments. These funds have material shifts across equity regions, and bond sectors on a frequent basis. To qualify for the tactical allocation category, a fund must have minimum exposures of 10% in bonds and 20% in equity. Next, a fund must historically demonstrate material shifts in sector or regional allocations either through a gradual shift over three years or through a series of material shifts on a quarterly basis. Within a three year period, typically the average quarterly changes between equity regions and bond sectors exceeds 15% or the difference between the maximum and minimum exposure to a single equity region or bond sector exceeds 50%.
10
| CMG Mauldin Core Fund |
| PORTFOLIO REVIEW (Unaudited) |
| October 31, 2020 |
| Annualized Total Returns as of October 31, 2020 | ||||||||
| Annualized Since | ||||||||
| CMG Mauldin Core Fund: | Six Months | One Year | Five Year | Inception * | ||||
| Class A | ||||||||
| Without sales charge | 3.41% | (0.86)% | 1.00% | 2.11% | ||||
| With sales charge | (2.50)% | (6.55)% | (0.19)% | 1.30% | ||||
| Class I | 3.48% | (0.62)% | 1.22% | 2.34% | ||||
| MSCI AC World Index Gross | 13.88% | 5.42% | 8.70% | 7.85% | ||||
| Morningstar Moderate Target Risk TR Index | 8.81% | 4.52% | 6.95% | 6.08% | ||||
| * | Class A and Class I shares commenced operations on May 15, 2013. |
The MSCI All Country World Index is a free float-adjusted market capitalization weighted equity index designed to measure the performance of equities in developed and emerging markets. Investors cannot invest directly in an index or benchmark.
The Morningstar Moderate Target Risk Index is a rules-based index based on a well-established asset allocation from Ibbotson Associates, a Morningstar company. The index seeks to provide both capital appreciation and income. This index tends to hold larger positions in stocks than conservative-allocation portfolios. The index typically has 50-70% of assets in equities. The index is rebalanced annually.
Past performance is not predictive of future results. The investment return and principal value of an investment will fluctuate. An investor’s shares, when redeemed, may be worth more or less than the original cost. Total return is calculated assuming reinvestment of all dividends and distributions, if any. Class A shares are subject to a sales charge of 5.75% imposed on purchases. The Fund’s total annual operating expenses, including underlying funds, are 1.89% for Class A and 1.65% for Class I per the Fund’s prospectus dated August 28, 2020. The performance data does not reflect the deduction of taxes that a shareholder would have to pay on Fund distributions, if any, or the redemption of the Fund shares. For performance information current to the most recent month-end, please call 1-866-CMG-9456.
| Portfolio Composition as of October 31, 2020 (Unaudited) | ||||
| Percent of | ||||
| Net Assets | ||||
| Exchange Traded Funds: | 100.0 | % | ||
| Equity Funds | 47.9 | % | ||
| Debt Funds | 47.0 | % | ||
| Commodity Fund | 5.1 | % | ||
| Short-Term Investments | 1.5 | % | ||
| Liabilities In Excess of Other Assets | (1.5 | )% | ||
| Total | 100.0 | % | ||
Please refer to the Portfolio of Investments in this semi-annual report for a detailed listing of the Fund’s holdings.
11
| CMG Tactical Bond Fund |
| PORTFOLIO REVIEW (Unaudited) |
| October 31, 2020 |
| Annualized Total Returns as of October 31, 2020 | ||||||||
| Annualized Since | ||||||||
| CMG Tactical Bond Fund: | Six Months | One Year | Five Year | Inception * | ||||
| Class A | ||||||||
| Without sales charge | (1.28)% | (0.91)% | 1.77% | 0.94% | ||||
| With sales charge | (6.97)% | (6.60)% | 0.58% | (0.16)% | ||||
| Class I | (0.82)% | (0.29)% | 2.24% | 1.61% | ||||
| Bloomberg Barclays US Corporate High Yield Index | 10.83% | 3.49% | 6.32% | 4.90% | ||||
| * | Class I shares commenced operations on October 6, 2014. Class A shares commenced operations on May 29, 2015. Barclays U.S. Corporate High Yield Index since inception performance is as of October 6, 2014. |
The Barclays U.S. Corporate High Yield Index is a market value-weighted index which covers the U.S. non-investment grade fixed-rate debt market. Investors cannot invest directly in an index or benchmark.
Past performance is not predictive of future results. The investment return and principal value of an investment will fluctuate. An investor’s shares, when redeemed, may be worth more or less than the original cost. Total return is calculated assuming reinvestment of all dividends and distributions, if any. Class A shares are subject to a sales charge of 5.75% imposed on purchases. The Fund’s total annual operating expenses, including underlying funds, are 2.13% for Class A and 1.72% for Class I per the Fund’s prospectus dated August 28, 2020. The performance data does not reflect the deduction of taxes that a shareholder would have to pay on Fund distributions, if any, or the redemption of the Fund shares. For performance information current to the most recent month-end, please call 1-866-CMG-9456.
| Portfolio Composition as of October 31, 2020 (Unaudited) | ||||
| Percent of | ||||
| Net Assets | ||||
| Exchange Traded Funds: | 95.0 | % | ||
| Short-Term Investments | 23.7 | % | ||
| Liabilities In Excess of Other Assets | (18.7 | )% | ||
| Total | 100.0 | % | ||
Please refer to the Portfolio of Investments in this semi-annual report for a detailed listing of the Fund’s holdings.
12
| CMG Tactical All Asset Strategy Fund |
| PORTFOLIO REVIEW (Unaudited) |
| October 31, 2020 |
| Annualized Total Returns as of October 31, 2020 | ||||||||
| Annualized Since | ||||||||
| CMG Tactical All Asset Strategy Fund: | Six Months | One Year | Three Year | Inception * | ||||
| Class A | ||||||||
| Without sales charge | 2.93% | (5.19)% | (2.56)% | (0.14)% | ||||
| With sales charge | (2.97)% | (10.64)% | (4.46)% | (1.44)% | ||||
| Class I | 2.93% | (4.94)% | (2.29)% | 0.11% | ||||
| Morningstar Moderate Target Risk TR Index | 8.81% | 4.52% | 5.46% | 7.37% | ||||
| * | Class A and Class I shares commenced operations on May 2, 2016. |
The Morningstar Moderate Target Risk Index is a rules-based index based on a well-established asset allocation methodology from Ibbotson Associates, a Morningstar company. The index seeks to provide both capital appreciation and income. This index tends to hold larger positions in stocks than conservative-allocation portfolios. The index typically has 50-70% of assets in equities. The index is rebalanced annually. Investors cannot invest directly in an index or benchmark.
Past performance is not predictive of future results. The investment return and principal value of an investment will fluctuate. An investor’s shares, when redeemed, may be worth more or less than the original cost. Total return is calculated assuming reinvestment of all dividends and distributions, if any. Total returns would have been lower had the adviser not waived its fees and reimbursed a portion of the Fund’s expenses. Class A shares are subject to a sales charge of 5.75% imposed on purchases. The Fund’s total annual operating expenses, including underlying funds, are 1.55% for Class A and 1.41% for Class I per the Fund’s prospectus dated August 28, 2020. The performance data does not reflect the deduction of taxes that a shareholder would have to pay on Fund distributions, if any, or the redemption of the Fund shares. For performance information current to the most recent month-end, please call 1-866-CMG-9456.
| Portfolio Composition as of October 31, 2020 (Unaudited) | ||||
| Percent of | ||||
| Net Assets | ||||
| Exchange Traded Funds: | 103.9 | % | ||
| Commodity Fund | 11.7 | % | ||
| Equity Funds | 60.7 | % | ||
| Debt Funds | 31.5 | % | ||
| Assets In Excess of Other Liabilities | (3.9 | )% | ||
| Total | 100.0 | % | ||
Please refer to the Portfolio of Investments in this semi-annual report for a detailed listing of the Fund’s holdings.
13
| CMG Mauldin Core Fund |
| PORTFOLIO OF INVESTMENTS (Unaudited) |
| October 31, 2020 |
| Shares | Security | Fair Value | ||||||
| EXCHANGE-TRADED FUNDS - 100.0% | ||||||||
| COMMODITY FUND - 5.1% | ||||||||
| 137,386 | SPDR Gold MiniShares Trust ETF * | $ | 2,570,492 | |||||
| TOTAL COMMODITY FUNDS (Cost - $2,129,687) | ||||||||
| DEBT FUNDS - 47.0% | ||||||||
| 75,335 | Invesco Treasury Collateral ETF | 7,964,416 | ||||||
| 4,691 | iShares 20+ Year Treasury Bond ETF | 739,161 | ||||||
| 10,735 | iShares 7-10 Year Treasury Bond ETF | 1,288,844 | ||||||
| 11,478 | iShares iBoxx $ Investment Grade Corporate Bond ETF | 1,534,953 | ||||||
| 5,255 | iShares JP Morgan USD Emerging Markets Bond ETF | 578,155 | ||||||
| 132,735 | Janus Henderson Short Duration Income ETF | 6,692,499 | ||||||
| 92,053 | SPDR Portfolio Long Term Treasury ETF | 4,154,353 | ||||||
| 6,637 | Vanguard Total International Bond ETF | 387,202 | ||||||
| 7,956 | Xtrackers USD High Yield Corporate Bond ETF | 382,604 | ||||||
| TOTAL DEBT FUNDS (Cost - $23,959,853) | 23,722,187 | |||||||
| EQUITY FUNDS - 47.9% | ||||||||
| 33,478 | Invesco S&P 500 Low Volatility ETF | 1,741,860 | ||||||
| 40,357 | Invesco S&P 500 Quality ETF | 1,497,648 | ||||||
| 84,042 | iShares Core MSCI Emerging Markets ETF | 4,493,726 | ||||||
| 54,587 | iShares MSCI Japan ETF | 3,179,147 | ||||||
| 8,364 | iShares MSCI USA Momentum Factor ETF | 1,181,248 | ||||||
| 36,645 | Schwab U.S. Large-Cap Value ETF | 1,872,926 | ||||||
| 15,894 | Schwab U.S. Small-Cap ETF | 1,109,719 | ||||||
| 52,925 | Vanguard Utilities ETF | 7,166,574 | ||||||
| 65,707 | Xtrackers S&P 500 ESG ETF | 1,888,406 | ||||||
| TOTAL EQUITY FUNDS (Cost - $23,373,444) | 24,131,254 | |||||||
| TOTAL EXCHANGE-TRADED FUNDS (Cost - $49,462,984) | 50,423,933 | |||||||
| SHORT-TERM INVESTMENT - 1.5% | ||||||||
| MONEY MARKET FUND - 1.5% | ||||||||
| 749,379 | Federated Institutional Prime Obligations Fund, Institutional Shares, 0.10% ^ | 749,754 | ||||||
| TOTAL SHORT-TERM INVESTMENT (Cost - $749,754) | ||||||||
| TOTAL INVESTMENTS - 101.5% (Cost - $50,212,738) | $ | 51,173,687 | ||||||
| LIABILITIES IN EXCESS OF OTHER ASSETS - (1.5)% | (745,665 | ) | ||||||
| NET ASSETS - 100.0% | $ | 50,428,022 | ||||||
ETF - Exchange-Traded Fund
| * | Non-income producing security. |
| ^ | Floating rate, rate shown represents the rate at October 31, 2020. |
The accompanying notes are an integral part of these financial statements.
14
| CMG Tactical Bond Fund |
| PORTFOLIO OF INVESTMENTS (Unaudited) |
| October 31, 2020 |
| Shares | Security | Fair Value | ||||||
| EXCHANGE-TRADED FUNDS - 95.0% | ||||||||
| DEBT FUNDS - 95.0% | ||||||||
| 151,343 | Invesco Treasury Collateral ETF | $ | 15,999,982 | |||||
| 317,208 | Janus Henderson Short Duration Income ETF | 15,993,627 | ||||||
| TOTAL EXCHANGE-TRADED FUNDS (Cost - $32,008,537) | 31,993,609 | |||||||
| SHORT-TERM INVESTMENT - 23.7% | ||||||||
| MONEY MARKET FUND - 23.7% | ||||||||
| 7,991,565 | Federated Institutional Prime Obligations Fund, Institutional Shares, 0.10% ^ | 7,995,561 | ||||||
| TOTAL SHORT-TERM INVESTMENT (Cost - $7,995,561) | ||||||||
| TOTAL INVESTMENTS - 118.7% (Cost - $40,004,098) | $ | 39,989,170 | ||||||
| LIABILITIES IN EXCESS OF OTHER ASSETS - (18.7)% | (6,305,535 | ) | ||||||
| NET ASSETS - 100.0% | $ | 33,683,635 | ||||||
ETF - Exchange-Traded Fund
| ^ | Floating rate, rate shown represents the rate at October 31, 2020. |
The accompanying notes are an integral part of these financial statements.
15
| CMG Tactical All Asset Strategy Fund |
| PORTFOLIO OF INVESTMENTS (Unaudited) |
| October 31, 2020 |
| Shares | Security | Fair Value | ||||||
| EXCHANGE-TRADED FUNDS - 103.9% | ||||||||
| COMMODITY FUND - 11.7% | ||||||||
| 41,287 | SPDR Gold MiniShares Trust ETF * | $ | 772,480 | |||||
| TOTAL COMMODITY FUND (Cost - $850,698) | ||||||||
| DEBT FUNDS - 31.5% | ||||||||
| 11,143 | SPDR Bloomberg Barclays Convertible Securities ETF | 767,864 | ||||||
| 7,437 | Vanguard Emerging Markets Government Bond ETF | 582,317 | ||||||
| 12,698 | Vanguard Total International Bond ETF | 740,801 | ||||||
| TOTAL DEBT FUNDS (Cost - $2,119,727) | 2,090,982 | |||||||
| EQUITY FUNDS - 60.7% | ||||||||
| 2,748 | Invesco QQQ Trust Series 1 | 740,257 | ||||||
| 29,000 | iShares Latin America 40 ETF | 610,450 | ||||||
| 12,704 | iShares MSCI Emerging Markets ETF | 567,996 | ||||||
| 2,074 | SPDR S&P 500 ETF Trust | 677,244 | ||||||
| 11,735 | Utilities Select Sector SPDR Fund | 732,029 | ||||||
| 5,137 | Vanguard Utilities ETF | 695,601 | ||||||
| TOTAL EQUITY FUNDS (Cost - $3,948,625) | 4,023,577 | |||||||
| TOTAL EXCHANGE-TRADED FUNDS (Cost - $6,919,050) | 6,887,039 | |||||||
| TOTAL INVESTMENTS - 103.9% (Cost - $6,919,050) | $ | 6,887,039 | ||||||
| LIABILITIES IN EXCESS OF OTHER ASSETS - (3.9)% | (259,315 | ) | ||||||
| NET ASSETS - 100.0% | $ | 6,627,724 | ||||||
ETF - Exchange-Traded Fund
| * | Non-income producing security. |
The accompanying notes are an integral part of these financial statements.
16
| CMG Funds |
| STATEMENTS OF ASSETS AND LIABILITIES (Unaudited) |
| October 31, 2020 |
| CMG Tactical All | ||||||||||||
| CMG Mauldin | CMG Tactical | Asset Strategy | ||||||||||
| Core Fund | Bond Fund | Fund | ||||||||||
| Assets: | ||||||||||||
| Investments at Value (identified cost $50,212,738, $40,004,098, and $6,919,050, respectively) | $ | 51,173,687 | $ | 39,989,170 | $ | 6,887,039 | ||||||
| Receivable for Securities Sold | 6,607,576 | 25,696,528 | — | |||||||||
| Dividends and Interest Receivable | 15,944 | 24,560 | 12 | |||||||||
| Receivable for Fund Shares Sold | 7,650 | 34,639 | 93 | |||||||||
| Prepaid Expenses | 8,029 | 7,604 | 15,757 | |||||||||
| Total Assets | 57,812,886 | 65,752,501 | 6,902,901 | |||||||||
| Liabilities: | ||||||||||||
| Payable for Securities Purchased | 7,276,016 | 32,008,537 | — | |||||||||
| Payable for Fund Shares Redeemed | 26,651 | 9,500 | 278 | |||||||||
| Due to Custodian | — | — | 260,824 | |||||||||
| Accrued Advisory Fees | 49,076 | 28,461 | 4,558 | |||||||||
| Accrued Distribution Fees | 535 | 737 | 20 | |||||||||
| Payable to Related Parties | 29,451 | 18,488 | 6,236 | |||||||||
| Accrued Expenses and Other Liabilities | 3,135 | 3,143 | 3,261 | |||||||||
| Total Liabilities | 7,384,864 | 32,068,866 | 275,177 | |||||||||
| NET ASSETS | $ | 50,428,022 | $ | 33,683,635 | $ | 6,627,724 | ||||||
| Composition of Net Assets: | ||||||||||||
| Paid-in-Capital | $ | 48,494,885 | $ | 36,158,874 | $ | 8,069,041 | ||||||
| Accumulated Earnings (Losses) | 1,933,137 | (2,475,239 | ) | (1,441,317 | ) | |||||||
| Net Assets | $ | 50,428,022 | $ | 33,683,635 | $ | 6,627,724 | ||||||
| Net Asset Value, Offering and Redemption Price Per Share | ||||||||||||
| Class A Shares: | ||||||||||||
| Net Assets | $ | 2,452,267 | $ | 2,115,176 | $ | 92,176 | ||||||
| Shares of beneficial interest outstanding (unlimited shares of no par beneficial interest authorized) | 224,409 | 222,802 | 9,714 | |||||||||
| Net Asset Value (Net Assets ÷ Shares Outstanding) and Redemption Price Per Share | $ | 10.93 | $ | 9.49 | $ | 9.49 | ||||||
| Maximum Offering Price Per Share (Maximum sales charge of 5.75%) | 11.60 | 10.07 | 10.07 | |||||||||
| Class I Shares: | ||||||||||||
| Net Assets | $ | 47,975,755 | $ | 31,568,459 | $ | 6,535,548 | ||||||
| Shares of beneficial interest outstanding (unlimited shares of no par beneficial interest authorized) | 4,367,545 | 3,338,772 | 690,189 | |||||||||
| Net Asset Value (Net Assets ÷ Shares Outstanding), Offering and Redemption Price Per Share | $ | 10.98 | $ | 9.46 | $ | 9.47 | ||||||
The accompanying notes are an integral part of these financial statements.
17
| CMG Funds |
| STATEMENTS OF OPERATIONS (Unaudited) |
| For the Six Months Ended October 31, 2020 |
| CMG Tactical All | ||||||||||||
| CMG Mauldin | CMG Tactical Bond | Asset Strategy | ||||||||||
| Core Fund | Fund | Fund | ||||||||||
| Investment Income: | ||||||||||||
| Dividend Income | $ | 408,090 | $ | 393,168 | $ | 50,129 | ||||||
| Interest Income | 670 | 3,367 | 432 | |||||||||
| Total Investment Income | 408,760 | 396,535 | 50,561 | |||||||||
| Expenses: | ||||||||||||
| Investment Advisory Fees | 296,380 | 174,862 | 27,697 | |||||||||
| Administration Fees | 155,272 | 91,000 | 23,480 | |||||||||
| Distribution Fees- Class A | 3,265 | 4,067 | 131 | |||||||||
| Third Party Administrative Servicing Fees | 6,280 | 1,184 | 3,200 | |||||||||
| Total Expenses | 461,197 | 271,113 | 54,508 | |||||||||
| Net Investment Income (Loss) | (52,437 | ) | 125,422 | (3,947 | ) | |||||||
| Net Realized and Unrealized Gain (Loss) on Investments: | ||||||||||||
| Net Realized Gain (Loss) From: | ||||||||||||
| Investments | 1,626,460 | (502,767 | ) | 391,819 | ||||||||
| Net Change in Unrealized Appreciation (Depreciation) on: | ||||||||||||
| Investments | 407,666 | (42,113 | ) | (143,473 | ) | |||||||
| Foreign Currency Translations | 876 | — | — | |||||||||
| Net Realized and Unrealized Gain (Loss) on Investments | 2,035,002 | (544,880 | ) | 248,346 | ||||||||
| Net Increase (Decrease) in Net Assets Resulting From Operations | $ | 1,982,565 | $ | (419,458 | ) | $ | 244,399 | |||||
The accompanying notes are an integral part of these financial statements.
18
| CMG Funds |
| STATEMENTS OF CHANGES IN NET ASSETS |
| CMG Mauldin Core Fund | CMG Tactical Bond Fund | |||||||||||||||
| For the Six Months | For the Year | For the Six Months | For the Year | |||||||||||||
| Ended | Ended | Ended | Ended | |||||||||||||
| October 31, 2020 | April 30, 2020 | October 31, 2020 | April 30, 2020 | |||||||||||||
| (Unaudited) | (Unaudited) | |||||||||||||||
| Operations: | ||||||||||||||||
| Net Investment Income (Loss) | $ | (52,437 | ) | $ | 429,511 | $ | 125,422 | $ | 885,721 | |||||||
| Net Realized Gain (Loss) on Investments | 1,626,460 | (247,047 | ) | (502,767 | ) | 975,485 | ||||||||||
| Net Change in Unrealized Appreciation (Depreciation) on Investments | 408,542 | (1,240,108 | ) | (42,113 | ) | (1,602,813 | ) | |||||||||
| Net Increase (Decrease) in Net Assets Resulting From Operations | 1,982,565 | (1,057,644 | ) | (419,458 | ) | 258,393 | ||||||||||
| Distributions to Shareholders from: | ||||||||||||||||
| Total Distributions Paid | ||||||||||||||||
| Class A | — | (42,157 | ) | (1,966 | ) | (13,309 | ) | |||||||||
| Class I | — | (993,184 | ) | (139,718 | ) | (891,631 | ) | |||||||||
| Total Distributions to Shareholders | — | (1,035,341 | ) | (141,684 | ) | (904,940 | ) | |||||||||
| Beneficial Interest Transactions: | ||||||||||||||||
| Class A Shares: | ||||||||||||||||
| Proceeds from Shares Issued | 247,794 | 528,298 | 1,540,653 | 1,668,569 | ||||||||||||
| Distributions Reinvested | — | 40,660 | 85 | 5,755 | ||||||||||||
| Cost of Shares Redeemed | (444,112 | ) | (2,528,315 | ) | (1,401,748 | ) | (208,759 | ) | ||||||||
| Total Class A Transactions | (196,318 | ) | (1,959,357 | ) | 138,990 | 1,465,565 | ||||||||||
| Class I Shares: | ||||||||||||||||
| Proceeds from Shares Issued | 4,741,393 | 14,267,697 | 5,845,128 | 12,864,349 | ||||||||||||
| Distributions Reinvested | — | 903,700 | 139,449 | 872,280 | ||||||||||||
| Cost of Shares Redeemed | (14,049,051 | ) | (23,322,923 | ) | (9,520,755 | ) | (14,398,268 | ) | ||||||||
| Total Class I Transactions | (9,307,658 | ) | (8,151,526 | ) | (3,536,178 | ) | (661,639 | ) | ||||||||
| Net Increase (Decrease) in Net Assets Resulting from Beneficial Interest Transactions | (9,503,976 | ) | (10,110,883 | ) | (3,397,188 | ) | 803,926 | |||||||||
| Increase (Decrease) in Net Assets | (7,521,411 | ) | (12,203,868 | ) | (3,958,330 | ) | 157,379 | |||||||||
| Net Assets: | ||||||||||||||||
| Beginning of Period | 57,949,433 | 70,153,301 | 37,641,965 | 37,484,586 | ||||||||||||
| End of Period | $ | 50,428,022 | $ | 57,949,433 | $ | 33,683,635 | $ | 37,641,965 | ||||||||
| Share Activity: | ||||||||||||||||
| Class A Shares: | ||||||||||||||||
| Shares Issued | 23,001 | 48,659 | 160,732 | 41,998 | ||||||||||||
| Shares Reinvested | — | 3,630 | 9 | 588 | ||||||||||||
| Shares Redeemed | (40,628 | ) | (230,048 | ) | (145,545 | ) | (45,912 | ) | ||||||||
| Net increase (decrease) in shares of beneficial interest outstanding | (17,627 | ) | (177,759 | ) | 15,196 | (3,326 | ) | |||||||||
| Class I Shares: | ||||||||||||||||
| Shares Issued | 438,467 | 1,293,578 | 612,478 | 4,404,352 | ||||||||||||
| Shares Reinvested | — | 80,472 | 14,492 | 60,422 | ||||||||||||
| Shares Redeemed | (1,288,547 | ) | (2,127,913 | ) | (1,000,333 | ) | (1,984,200 | ) | ||||||||
| Net increase (decrease) in shares of beneficial interest outstanding | (850,080 | ) | (753,863 | ) | (373,363 | ) | 2,480,574 | |||||||||
The accompanying notes are an integral part of these financial statements.
19
| CMG Funds |
| STATEMENTS OF CHANGES IN NET ASSETS (Continued) |
| CMG Tactical All Asset Strategy Fund | ||||||||
| For the Six Months | For the Year | |||||||
| Ended | Ended | |||||||
| October 31, 2020 | April 30, 2020 | |||||||
| (Unaudited) | ||||||||
| Operations: | ||||||||
| Net Investment Income (Loss) | $ | (3,947 | ) | $ | 285,062 | |||
| Net Realized Gain (Loss) on Investments | 391,819 | (1,062,032 | ) | |||||
| Net Change in Unrealized Appreciation (Depreciation) on Investments | (143,473 | ) | 49,487 | |||||
| Net Increase (Decrease) in Net Assets Resulting From Operations | 244,399 | (727,483 | ) | |||||
| Distributions to Shareholders from: | ||||||||
| Total Distributions Paid | ||||||||
| Class I | — | (246,298 | ) | |||||
| Total Distributions to Shareholders | — | (246,298 | ) | |||||
| Beneficial Interest Transactions: | ||||||||
| Class A Shares: | ||||||||
| Proceeds from Shares Issued | 13 | 100,424 | ||||||
| Cost of Shares Redeemed | (100,846 | ) | (2,885,400 | ) | ||||
| Total Class A Transactions | (100,833 | ) | (2,784,976 | ) | ||||
| Class I Shares: | ||||||||
| Proceeds from Shares Issued | 647,179 | 11,449,324 | ||||||
| Distributions Reinvested | — | 245,370 | ||||||
| Cost of Shares Redeemed | (1,317,702 | ) | (33,775,701 | ) | ||||
| Total Class I Transactions | (670,523 | ) | (22,081,007 | ) | ||||
| Net Decrease in Net Assets Resulting from Beneficial Interest Transactions | (771,356 | ) | (24,865,983 | ) | ||||
| Decrease in Net Assets | (526,957 | ) | (25,839,764 | ) | ||||
| Net Assets: | ||||||||
| Beginning of Period | 7,154,681 | 32,994,445 | ||||||
| End of Period | $ | 6,627,724 | $ | 7,154,681 | ||||
| Share Activity: | ||||||||
| Class A Shares: | ||||||||
| Shares Issued | 2 | 10,936 | ||||||
| Shares Redeemed | (10,902 | ) | (291,659 | ) | ||||
| Net decrease in shares of beneficial interest outstanding | (10,900 | ) | (280,723 | ) | ||||
| Class I Shares: | ||||||||
| Shares Issued | 68,524 | 1,121,582 | ||||||
| Shares Reinvested | — | 24,488 | ||||||
| Shares Redeemed | (135,737 | ) | (3,352,989 | ) | ||||
| Net decrease in shares of beneficial interest outstanding | (67,213 | ) | (2,206,919 | ) | ||||
The accompanying notes are an integral part of these financial statements.
20
| CMG Funds |
| FINANCIAL HIGHLIGHTS |
The table below sets forth financial data for one share of beneficial interest outstanding throughout each year/period presented.
| CMG Mauldin Core Fund | ||||||||||||||||||||||||
| Class A | ||||||||||||||||||||||||
| Six Months | Year | Year | Year | Year | Year | |||||||||||||||||||
| Ended | Ended | Ended | Ended | Ended | Ended | |||||||||||||||||||
| October 31, 2020 | April 30, 2019 | April 30, 2019 | April 30, 2018 | April 30, 2017 | April 30, 2016 | |||||||||||||||||||
| (Unaudited) | ||||||||||||||||||||||||
| Net Asset Value, Beginning of Period | $ | 10.57 | $ | 10.92 | $ | 10.79 | $ | 10.40 | $ | 10.23 | $ | 11.00 | ||||||||||||
| Increase (Decrease) From Operations: | ||||||||||||||||||||||||
| Net investment income (loss) (a) | (0.02 | ) | 0.05 | 0.05 | 0.08 | (0.13 | ) | (0.16 | ) | |||||||||||||||
| Net gain (loss) from investments (both realized and unrealized) | 0.38 | (0.25 | ) | 0.12 | 0.45 | 0.38 | (0.56 | ) | ||||||||||||||||
| Total from operations | 0.36 | (0.20 | ) | 0.17 | 0.53 | 0.25 | (0.72 | ) | ||||||||||||||||
| Distributions to shareholders from: | ||||||||||||||||||||||||
| Net investment income | — | (0.14 | ) | — | (0.00 | ) (g) | — | (0.05 | ) | |||||||||||||||
| Net realized gains | — | (0.01 | ) | (0.04 | ) | (0.14 | ) | (0.08 | ) | — | ||||||||||||||
| Total distributions | — | (0.15 | ) | (0.04 | ) | (0.14 | ) | (0.08 | ) | (0.05 | ) | |||||||||||||
| Net Asset Value, End of Period | $ | 10.93 | $ | 10.57 | $ | 10.92 | $ | 10.79 | $ | 10.40 | $ | 10.23 | ||||||||||||
| Total Return (b) | 3.41 | % (f) | (1.93 | )% | 1.60 | % | 5.06 | % | 2.50 | % | (6.57 | )% | ||||||||||||
| Ratios/Supplemental Data | ||||||||||||||||||||||||
| Net assets, end of period (in 000’s) | $ | 2,452 | $ | 2,559 | $ | 4,586 | $ | 4,649 | $ | 3,049 | $ | 3,757 | ||||||||||||
| Ratio of expenses to average net assets (c) | 1.87 | % (e) | 1.75 | % | 1.66 | % | 1.52 | % | 3.40 | % | 2.95 | % | ||||||||||||
| Ratio of net investment income (loss) to average net assets (c)(d) | (0.44 | )% (e) | 0.49 | % | 0.48 | % | 0.76 | % | (1.26 | )% | (1.44 | )% | ||||||||||||
| Portfolio turnover rate | 232 | % (f) | 278 | % | 324 | % | 220 | % | 248 | % | 20 | % | ||||||||||||
| (a) | Per share amounts are calculated using the average shares method, which appropriately presents the per share data for the period. |
| (b) | Total returns are historical in nature and assume changes in share price, reinvestment of dividends and capital gains distributions, if any, and excludes sales charges. Had the adviser not waived a portion of the Fund’s expenses, total returns would have been lower. |
| (c) | Does not include the expenses of the underlying investment companies in which the Fund invests. |
| (d) | Recognition of net investment income (loss) by the Fund is affected by the timing and declaration of dividends by the underlying investment companies in which the Fund invests. |
| (e) | Annualized. |
| (f) | Not annualized. |
| (g) | Amount is less than $0.005 per share. |
The accompanying notes are an integral part of these financial statements.
21
| CMG Funds |
| FINANCIAL HIGHLIGHTS |
The table below sets forth financial data for one share of beneficial interest outstanding throughout each year/period presented.
| CMG Mauldin Core Fund | ||||||||||||||||||||||||
| Class I | ||||||||||||||||||||||||
| Six Months | Year | Year | Year | Year | Year | |||||||||||||||||||
| Ended | Ended | Ended | Ended | Ended | Ended | |||||||||||||||||||
| October 31, 2020 | April 30, 2020 | April 30, 2019 | April 30, 2018 | April 30, 2017 | April 30, 2016 | |||||||||||||||||||
| (Unaudited) | ||||||||||||||||||||||||
| Net Asset Value, Beginning of Period | $ | 10.62 | $ | 10.98 | $ | 10.82 | $ | 10.46 | $ | 10.26 | $ | 11.04 | ||||||||||||
| Increase (Decrease) From Operations: | ||||||||||||||||||||||||
| Net investment income (loss) (a) | (0.01 | ) | 0.08 | 0.08 | 0.04 | (0.08 | ) | (0.13 | ) | |||||||||||||||
| Net gain (loss) from investments (both realized and unrealized) | 0.37 | (0.25 | ) | 0.13 | 0.50 | 0.36 | (0.58 | ) | ||||||||||||||||
| Total from operations | 0.36 | (0.17 | ) | 0.21 | 0.54 | 0.28 | (0.71 | ) | ||||||||||||||||
| Distributions to shareholders from: | ||||||||||||||||||||||||
| Net investment income | — | (0.18 | ) | (0.01 | ) | (0.04 | ) | — | (0.07 | ) | ||||||||||||||
| Net realized gains | — | (0.01 | ) | (0.04 | ) | (0.14 | ) | (0.08 | ) | — | ||||||||||||||
| Total distributions | — | (0.19 | ) | (0.05 | ) | (0.18 | ) | (0.08 | ) | (0.07 | ) | |||||||||||||
| Net Asset Value, End of Period | $ | 10.98 | $ | 10.62 | $ | 10.98 | $ | 10.82 | $ | 10.46 | $ | 10.26 | ||||||||||||
| Total Return (b) | 3.48 | % (f) | (1.69 | )% | 1.93 | % | 5.13 | % | 2.78 | % | (6.43 | )% | ||||||||||||
| Ratios/Supplemental Data | ||||||||||||||||||||||||
| Net assets, end of period (in 000’s) | $ | 47,976 | $ | 55,390 | $ | 65,567 | $ | 68,814 | $ | 7,669 | $ | 4,776 | ||||||||||||
| Ratio of expenses to average net assets (c) | 1.62 | % (e) | 1.51 | % | 1.41 | % | 1.33 | % | 2.98 | % | 2.70 | % | ||||||||||||
| Ratio of net investment income (loss) to average net assets (c)(d) | (0.17 | )% (e) | 0.69 | % | 0.73 | % | 0.37 | % | (0.81 | )% | (1.18 | )% | ||||||||||||
| Portfolio turnover rate | 232 | % (f) | 278 | % | 324 | % | 220 | % | 248 | % | 20 | % | ||||||||||||
| (a) | Per share amounts are calculated using the average shares method, which appropriately presents the per share data for the period. |
| (b) | Total returns are historical in nature and assume changes in share price, reinvestment of dividends and capital gains distributions, if any, and excludes sales charges. Had the adviser not waived a portion of the Fund’s expenses, total returns would have been lower. |
| (c) | Does not include the expenses of the underlying investment companies in which the Fund invests. |
| (d) | Recognition of net investment income (loss) by the Fund is affected by the timing and declaration of dividends by the underlying investment companies in which the Fund invests. |
| (e) | Annualized. |
| (f) | Not annualized. |
| (g) | The realized and unrealized gain or loss from securities and futures does not accord with the amounts reported on the Statement of Operations due to timing of subscriptions and/or redemptions of Fund |
The accompanying notes are an integral part of these financial statements.
22
| CMG Funds |
| FINANCIAL HIGHLIGHTS |
The table below sets forth financial data for one share of beneficial interest outstanding throughout each year/period presented.
| CMG Tactical Bond Fund | ||||||||||||||||||||||||
| Class A | ||||||||||||||||||||||||
| Six Months | Year | Year | Year | Year | Period | |||||||||||||||||||
| Ended | Ended | Ended | Ended | Ended | Ended | |||||||||||||||||||
| October 31, 2020 | April 30, 2020 | April 30, 2019 | April 30, 2018 | April 30, 2017 | April 30, 2016 * | |||||||||||||||||||
| (Unaudited) | ||||||||||||||||||||||||
| Net Asset Value, Beginning of Period | $ | 9.63 | $ | 9.82 | $ | 9.42 | $ | 9.75 | $ | 9.60 | $ | 9.96 | ||||||||||||
| Increase (Decrease) From Operations: | ||||||||||||||||||||||||
| Net investment income (a) | 0.01 | 0.16 | 0.22 | 0.18 | 0.23 | 0.12 | ||||||||||||||||||
| Net gain (loss) from investments (both realized and unrealized) | (0.14 | ) | (0.13 | ) | 0.37 | (0.33 | ) | 0.12 | (0.33 | ) | ||||||||||||||
| Total from operations | (0.13 | ) | 0.03 | 0.59 | (0.15 | ) | 0.35 | (0.21 | ) | |||||||||||||||
| Distributions to shareholders from: | ||||||||||||||||||||||||
| Net investment income | (0.01 | ) | (0.22 | ) | (0.19 | ) | (0.18 | ) | (0.20 | ) | (0.11 | ) | ||||||||||||
| Return of Capital | — | — | — | — | — | (0.04 | ) | |||||||||||||||||
| Total distributions | (0.01 | ) | (0.22 | ) | (0.19 | ) | (0.18 | ) | (0.20 | ) | (0.15 | ) | ||||||||||||
| Net Asset Value, End of Period | $ | 9.49 | $ | 9.63 | $ | 9.82 | $ | 9.42 | $ | 9.75 | $ | 9.60 | ||||||||||||
| Total Return (b) | (1.28 | )% (f) | 0.27 | % | 6.31 | % | (1.57 | )% | 3.73 | % (f) | (2.07 | )% (f) | ||||||||||||
| Ratios/Supplemental Data | ||||||||||||||||||||||||
| Net assets, end of period (in 000’s) | $ | 2,115 | $ | 1,999 | $ | 548 | $ | 557 | $ | 1,042 | $ | 305 | ||||||||||||
| Ratio of expenses to average net assets (c) | 1.85 | % (e) | 1.79 | % | 1.74 | % | 1.78 | % | 1.82 | % | 1.76 | % (e) | ||||||||||||
| Ratio of net investment income (loss) to average net assets (c)(d) | 0.28 | % (e) | 1.69 | % | 2.26 | % | 1.91 | % | 2.38 | % | 1.41 | % (e) | ||||||||||||
| Portfolio turnover rate | 599 | % (f) | 959 | % | 433 | % | 886 | % | 12.68 | 1,413 | % (f) | |||||||||||||
| (a) | Per share amounts are calculated using the average shares method, which appropriately presents the per share data for the period. |
| (b) | Total returns are historical in nature and assume changes in share price, reinvestment of dividends and capital gains distributions, if any, and excludes sales charges. Had the adviser not waived a portion of the Fund’s expenses, total returns would have been lower. |
| (c) | Does not include the expenses of the underlying investment companies in which the Fund invests. |
| (d) | Recognition of net investment income (loss) by the Fund is affected by the timing and declaration of dividends by the underlying investment companies in which the Fund invests. |
| (e) | Annualized. |
| (f) | Not annualized. |
The accompanying notes are an integral part of these financial statements.
23
| CMG Funds |
| FINANCIAL HIGHLIGHTS |
The table below sets forth financial data for one share of beneficial interest outstanding throughout each year/period presented.
| CMG Tactical Bond Fund | ||||||||||||||||||||||||
| Class I | ||||||||||||||||||||||||
| Six Months | Year | Year | Year | Year | Year | |||||||||||||||||||
| Ended | Ended | Ended | Ended | Ended | Ended | |||||||||||||||||||
| October 31, 2020 | April 30, 2020 | April 30, 2019 | April 30, 2018 | April 30, 2017 | April 30, 2016 | |||||||||||||||||||
| (Unaudited) | ||||||||||||||||||||||||
| Net Asset Value, Beginning of Period | $ | 9.60 | $ | 9.78 | $ | 9.42 | $ | 9.75 | $ | 9.62 | $ | 9.97 | ||||||||||||
| Increase (Decrease) From Operations: | ||||||||||||||||||||||||
| Net investment income (a) | 0.03 | 0.24 | 0.27 | 0.22 | 0.25 | 0.17 | ||||||||||||||||||
| Net gain (loss) from investments (both realized and unrealized) | (0.13 | ) | (0.17 | ) | 0.35 | (0.33 | ) | 0.14 | (0.32 | ) | ||||||||||||||
| Total from operations | (0.10 | ) | 0.07 | 0.62 | (0.11 | ) | 0.39 | (0.15 | ) | |||||||||||||||
| Distributions to shareholders from: | ||||||||||||||||||||||||
| Net investment income | (0.04 | ) | (0.25 | ) | (0.26 | ) | (0.22 | ) | (0.26 | ) | (0.16 | ) | ||||||||||||
| Return of Capital | — | — | — | — | — | (0.04 | ) | |||||||||||||||||
| Total distributions | (0.04 | ) | (0.25 | ) | (0.26 | ) | (0.22 | ) | (0.26 | ) | (0.20 | ) | ||||||||||||
| Net Asset Value, End of Period | $ | 9.46 | $ | 9.60 | $ | 9.78 | $ | 9.42 | $ | 9.75 | $ | 9.62 | ||||||||||||
| Total Return (b) | (0.82 | )% (f) | 0.73 | % | 6.68 | % | (1.18 | )% | 4.13 | % | (1.44 | )% | ||||||||||||
| Ratios/Supplemental Data | ||||||||||||||||||||||||
| Net assets, end of period (in 000’s) | $ | 31,568 | $ | 35,643 | $ | 36,937 | $ | 12,197 | $ | 18,120 | $ | 33,290 | ||||||||||||
| Ratio of expenses to average net assets (c) | 1.45 | % (e) | 1.38 | % | 1.32 | % | 1.35 | % | 1.47 | % | 1.36 | % | ||||||||||||
| Ratio of net investment income (loss) to average net assets (c)(d) | 0.71 | % (e) | 2.51 | % | 2.87 | % | 2.25 | % | 2.61 | % | 1.81 | % | ||||||||||||
| Portfolio turnover rate | 599 | % (f) | 959 | % | 433 | % | 886 | % | 1,268 | % | 1,413 | % | ||||||||||||
| (a) | Per share amounts are calculated using the average shares method, which appropriately presents the per share data for the period. |
| (b) | Total returns are historical in nature and assume changes in share price, reinvestment of dividends and capital gains distributions, if any, and excludes sales charges. Had the adviser not waived a portion of the Fund’s expenses, total returns would have been lower. |
| (c) | Does not include the expenses of the underlying investment companies in which the Fund invests. |
| (d) | Recognition of net investment income (loss) by the Fund is affected by the timing and declaration of dividends by the underlying investment companies in which the Fund invests. |
| (e) | Annualized. |
| (f) | Not annualized. |
The accompanying notes are an integral part of these financial statements.
24
| CMG Funds |
| FINANCIAL HIGHLIGHTS |
The table below sets forth financial data for one share of beneficial interest outstanding throughout each year/period presented.
| CMG Tactical All Asset Strategy Fund | ||||||||||||||||||||
| Class A | ||||||||||||||||||||
| Six Months | Year | Year | Year | Period | ||||||||||||||||
| Ended | Ended | Ended | Ended | Ended | ||||||||||||||||
| October 31, 2020 | April 30, 2020 | April 30, 2019 | April 30, 2018 | April 30, 2017 * | ||||||||||||||||
| (Unaudited) | ||||||||||||||||||||
| Net Asset Value, Beginning of Period | $ | 9.22 | $ | 10.06 | $ | 10.19 | $ | 10.32 | $ | 10.00 | ||||||||||
| Increase (Decrease) From Operations: | ||||||||||||||||||||
| Net investment income (loss) (a) | (0.02 | ) | 0.12 | 0.07 | 0.02 | 0.03 | ||||||||||||||
| Net gain (loss) from investments (both realized and unrealized) | 0.29 | (0.96 | ) | (0.20 | ) | 0.26 | 0.37 | |||||||||||||
| Total from operations | 0.27 | (0.84 | ) | (0.13 | ) | 0.28 | 0.40 | |||||||||||||
| Distributions to shareholders from: | ||||||||||||||||||||
| Net investment income | — | — | — | (0.06 | ) | (0.03 | ) | |||||||||||||
| Net realized gains | — | — | — | (0.35 | ) | (0.05 | ) | |||||||||||||
| Total distributions | — | — | — | (0.41 | ) | (0.08 | ) | |||||||||||||
| Net Asset Value, End of Period | $ | 9.49 | $ | 9.22 | $ | 10.06 | $ | 10.19 | $ | 10.32 | ||||||||||
| Total Return (b) | 2.93 | % (f) | (8.35 | )% | (1.28 | )% | 2.61 | % | 4.00 | % (f) | ||||||||||
| Ratios/Supplemental Data | ||||||||||||||||||||
| Net assets, end of period (in 000’s) | $ | 92 | $ | 190 | $ | 3,033 | $ | 18,338 | $ | 38,741 | ||||||||||
| Ratio of expenses to average net assets (c) | 1.72 | % (e) | 1.39 | % | 1.43 | % | 1.30 | % | 1.53 | % (e) | ||||||||||
| Ratio of net investment income (loss) to average net assets (c)(d) | (0.38 | )% (e) | 1.25 | % | 0.72 | % | 0.22 | % | 0.32 | % (e) | ||||||||||
| Portfolio turnover rate | 362 | % (f) | 563 | % | 400 | % | 627 | % | 451 | % (f) | ||||||||||
| * | Commencement of Operations on May 2, 2016. |
| (a) | Per share amounts are calculated using the average shares method, which appropriately presents the per share data for the period. |
| (b) | Total returns are historical in nature and assume changes in share price, reinvestment of dividends and capital gains distributions, if any, and excludes sales charges. Had the adviser not waived a portion of the Fund’s expenses, total returns would have been lower. |
| (c) | Does not include the expenses of the underlying investment companies in which the Fund invests. |
| (d) | Recognition of net investment income (loss) by the Fund is affected by the timing and declaration of dividends by the underlying investment companies in which the Fund invests. |
| (e) | Annualized. |
| (f) | Not annualized. |
The accompanying notes are an integral part of these financial statements.
25
| CMG Funds |
| FINANCIAL HIGHLIGHTS |
The table below sets forth financial data for one share of beneficial interest outstanding throughout each year/period presented.
| CMG Tactical All Asset Strategy Fund | ||||||||||||||||||||
| Class I | ||||||||||||||||||||
| Six Months | Year | Year | Period | Period | ||||||||||||||||
| Ended | Ended | Ended | Ended | Ended | ||||||||||||||||
| October 31, 2020 | April 30, 2020 | April 30, 2019 | April 30, 2018 | April 30, 2017 * | ||||||||||||||||
| (Unaudited) | ||||||||||||||||||||
| Net Asset Value, Beginning of Period | $ | 9.20 | $ | 10.11 | $ | 10.20 | $ | 10.34 | $ | 10.00 | ||||||||||
| Increase (Decrease) From Operations: | ||||||||||||||||||||
| Net investment income (a) | — | 0.12 | 0.10 | 0.04 | 0.06 | |||||||||||||||
| Net gain (loss) from investments (both realized and unrealized) | 0.27 | (0.92 | ) | (0.19 | ) | 0.25 | 0.37 | |||||||||||||
| Total from operations | 0.27 | (0.80 | ) | (0.09 | ) | 0.29 | 0.43 | |||||||||||||
| Distributions to shareholders from: | ||||||||||||||||||||
| Net investment income | — | (0.11 | ) | — | (0.08 | ) | (0.04 | ) | ||||||||||||
| Net realized gains | — | — | — | (0.35 | ) | (0.05 | ) | |||||||||||||
| Total distributions | — | (0.11 | ) | — | (0.43 | ) | (0.09 | ) | ||||||||||||
| Net Asset Value, End of Period | $ | 9.47 | $ | 9.20 | $ | 10.11 | $ | 10.20 | $ | 10.34 | ||||||||||
| Total Return (b) | 2.93 | % (f) | (8.02 | )% | (0.88 | )% | 2.68 | % | 4.29 | % (f) | ||||||||||
| Ratios/Supplemental Data | ||||||||||||||||||||
| Net assets, end of period (in 000’s) | $ | 6,536 | $ | 6,965 | $ | 29,962 | $ | 13,354 | $ | 5,956 | ||||||||||
| Ratio of expenses to average net assets (c) | 1.47 | % (e) | 1.25 | % | 1.06 | % | 1.21 | % | 1.28 | % (e) | ||||||||||
| Ratio of net investment income (loss) to average net assets (c)(d) | (0.10 | )% (e) | 1.25 | % | 1.04 | % | 0.34 | % | 0.58 | % (e) | ||||||||||
| Portfolio turnover rate | 362 | % (f) | 563 | % | 400 | % | 627 | % | 451 | % (f) | ||||||||||
| * | Commencement of Operations on May 2, 2016. |
| (a) | Per share amounts are calculated using the average shares method, which appropriately presents the per share data for the period. |
| (b) | Total returns are historical in nature and assume changes in share price, reinvestment of dividends and capital gains distributions, if any, and excludes sales charges. Had the adviser not waived a portion of the Fund’s expenses, total returns would have been lower. |
| (c) | Does not include the expenses of the underlying investment companies in which the Fund invests. |
| (d) | Recognition of net investment income (loss) by the Fund is affected by the timing and declaration of dividends by the underlying investment companies in which the Fund invests. |
| (e) | Annualized. |
| (f) | Not annualized. |
The accompanying notes are an integral part of these financial statements.
26
| CMG Funds |
| NOTES TO FINANCIAL STATEMENTS (Unaudited) |
| October 31, 2020 |
| 1. | ORGANIZATION |
CMG Mauldin Core Fund (the “Mauldin Fund”), CMG Tactical Bond Fund, (the “Bond Fund”) and CMG Tactical All Asset Strategy Fund (“Tactical Fund”) (each a “Fund”, collectively, the “Funds”) are each a diversified series of shares of beneficial interest of the Northern Lights Fund Trust (the “Trust”), a Delaware statutory trust organized on January 19, 2005. The Trust is registered under the Investment Company Act of 1940, as amended (the “1940 Act”), as an open-end management investment company.
The Funds currently offer Class A shares and Class I shares. Class I shares are offered at net asset value. Class A shares for all Funds are offered at net asset value plus a maximum sales charge of 5.75%. Each class represents an interest in the same assets of the Funds and classes are identical except for their sales charge structures and ongoing service and distribution charges. All classes of shares have equal voting privileges except that each class has exclusive voting rights with respect to the respective class’ service and/or distribution plans. Each Fund’s income, expenses (other than class specific distribution fees) and realized and unrealized gains and losses are allocated proportionately each day based upon the relative net assets of each class. The Mauldin Fund seeks capital appreciation as its investment objective. Class A and Class I of the Mauldin Fund commenced operations on May 15, 2013. The Bond Fund seeks to generate total returns over a complete market cycle through capital appreciation and income. Class I of the Bond Fund commenced operations on October 6, 2014. Class A of the Bond Fund commenced operations on May 29, 2015. The Tactical Fund’s investment objective is to generate capital appreciation. Class A and Class I of the Tactical Fund commenced operations on May 2, 2016.
| 2. | SUMMARY OF SIGNIFICANT ACCOUNTING POLICIES |
The following is a summary of significant accounting policies followed by the Funds in preparation of their financial statements. These policies are in conformity with accounting principles generally accepted in the United States of America (“GAAP”). The preparation of financial statements requires management to make estimates and assumptions that affect the reported amounts of assets and liabilities and disclosure of contingent assets and liabilities at the date of the financial statements and the reported amounts of income and expenses for the period. Actual results could differ from those estimates. Each Fund is an investment company and accordingly follows the investment company accounting and reporting guidance of the Financial Accounting Standards Board (“FASB”) Accounting Standards Codification Topic 946 “Financial Services – Investment Companies” including FASB Accounting Standards Update (“ASU”) 2013-08.
Security Valuation – Securities listed on an exchange are valued at the last reported sale price at the close of the regular trading session of the primary exchange on the business day the value is being determined, or in the case of securities listed on NASDAQ at the NASDAQ Official Closing Price (“NOCP”). In the absence of a sale, such securities shall be valued at the mean between the current bid and ask prices on the primary exchange on the day of valuation. Investments valued in currencies other than the U.S. dollar are converted to U.S. dollars using exchange rates obtained from pricing services. Futures and future options are valued at the final settled price or, in the absence of a settled price, at the last sale price on the day of valuation. Exchange traded options, futures and options on futures are valued at the final settle price or, in the absence of a settle price, at the last sale price on the day of valuation. The independent pricing service does not distinguish between smaller-sized bond positions known as “odd lots” and larger institutional-sized bond positions known as “round lots”. The Funds may fair value a particular bond if the adviser does not believe that the round lot value provided by the independent pricing service reflects fair value of the Fund’s holding. Short-term debt obligations having 60 days or less remaining until maturity, at time of purchase, may be valued at amortized cost.
Valuation of Fund of Funds – The Funds may invest in portfolios of open-end or closed-end investment companies (the “underlying funds”). Underlying open-end investment companies are valued at their respective net asset values as reported by such investment companies. The underlying funds value securities in their portfolios for which market quotations are readily available at their market values (generally the last reported sale price) and all other securities and assets at their fair value by the methods established by the Boards of the underlying funds. The shares of many closed-end investment companies, after their initial public offering, frequently trade at a price per share, which is different than the net asset value per share. The difference represents a market premium or market discount of such shares. There can be no assurances
27
| CMG Funds |
| NOTES TO FINANCIAL STATEMENTS (Unaudited) (Continued) |
| October 31, 2020 |
that the market discount or market premium on shares of any closed-end investment company purchased by the Funds will not change.
Exchange Traded Funds – The Funds may invest in exchange traded funds (“ETFs”). ETFs are a type of fund bought and sold on a securities exchange. An ETF trades like common stock and represents a fixed portfolio of securities. The risks of owning an ETF generally reflect the risks of owning the underlying securities they are designed to track, although the lack of liquidity on an ETF could result in it being more volatile. Additionally, ETFs have fees and expenses that reduce their value.
ETF, Mutual Fund and Exchange Traded Note (“ETN”) Risk – ETFs, mutual funds and ETNs are subject to investment advisory fees or management fees and other expenses, which are indirectly paid by each Fund. Each are subject to specific risks, depending on investment strategy. Also, each may be subject to leverage risk, which may magnify losses. ETNs are also subject to default risks.
A Fund may hold securities, such as private investments, interests in commodity pools, other non-traded securities or temporarily illiquid securities, for which market quotations are not readily available or are determined to be unreliable. These securities will be valued using the “fair value” procedures approved by the Trust’s Board of Trustees (the “Board”). The Board has delegated execution of these procedures to a fair value committee composed of one or more representatives from each of the (i) Trust, (ii) administrator, and (iii) adviser. The committee may also enlist third party consultants such as a valuation specialist at a public accounting firm, valuation consultant or financial officer of a security issuer on an as-needed basis to assist in determining a security-specific fair value. The Board has also engaged a third party valuation firm to attend valuation meetings held by the Trust, review minutes of such meetings, and report to the Board on a quarterly basis. The Board reviews and ratifies the execution of this process and the resultant fair value prices at least quarterly to assure the process produces reliable results.
Fair Valuation Process – As noted above, the fair value committee is composed of one or more representatives from each of the (i) Trust, (ii) administrator, and (iii) adviser. The applicable investments are valued collectively via inputs from the fair value team. For example, fair value determinations are required for the following securities: (i) securities for which market quotations are insufficient or not readily available on a particular business day (including securities for which there is a short and temporary lapse in the provision of a price by the regular pricing source); (ii) securities for which, in the judgment of the adviser, the prices or values available do not represent the fair value of the instrument. Factors which may cause the adviser to make such a judgment include, but are not limited to, the following: only a bid price or an ask price is available; the spread between bid and ask prices is substantial; the frequency of sales; the thinness of the market; the size of reported trades; and actions of the securities markets, such as the suspension or limitation of trading; (iii) securities determined to be illiquid; (iv) securities with respect to which an event that will affect the value thereof has occurred since the closing prices were established on the principal exchange on which they are traded, but prior to a Fund’s calculation of its net asset value. Specifically, interests in commodity pools or managed futures pools are valued on a daily basis by reference to the closing market prices of each futures contract or other asset held by a pool, as adjusted for pool expenses. Restricted or illiquid securities, such as private investments or non-traded securities are valued via inputs from the adviser based upon the current bid for the security from two or more independent dealers or other parties reasonably familiar with the facts and circumstances of the security (who should take into consideration all relevant factors as may be appropriate under the circumstances). If the adviser is unable to obtain a current bid from such independent dealers or other independent parties, the fair value committee shall determine the fair value of such security using the following factors: (i) the type of security; (ii) the cost at date of purchase; (iii) the size and nature of the Fund’s holdings; (iv) the discount from market value of unrestricted securities of the same class at the time of purchase and subsequent thereto; (v) information as to any transactions or offers with respect to the security; (vi) the nature and duration of restrictions on disposition of the security and the existence of any registration rights; (vii) how the yield of the security compares to similar securities of companies of similar or equal creditworthiness; (viii) the level of recent trades of similar or comparable securities; (ix) the liquidity characteristics of the security; (x) current market conditions; and (xi) the market value of any securities into which the security is convertible or exchangeable.
28
| CMG Funds |
| NOTES TO FINANCIAL STATEMENTS (Unaudited) (Continued) |
| October 31, 2020 |
Each Fund utilizes various methods to measure the fair value of most of its investments on a recurring basis. GAAP establishes a hierarchy that prioritizes inputs to valuation methods. The three levels of input are:
Level 1 – Unadjusted quoted prices in active markets for identical assets and liabilities that the Funds have the ability to access.
Level 2 – Observable inputs other than quoted prices included in Level 1 for the asset or liability, either directly or indirectly. These inputs may include quoted prices for the identical instrument in an inactive market, prices for similar instruments, interest rates, prepayment speeds, credit risk, yield curves, default rates and similar data.
Level 3 – Unobservable inputs for the asset or liability, to the extent relevant observable inputs are not available, representing the Funds’ own assumptions about the assumptions a market participant would use in valuing the asset or liability, and would be based on the best information available.
The availability of observable inputs can vary from security to security and is affected by a wide variety of factors, including, for example, the type of security, whether the security is new and not yet established in the marketplace, the liquidity of markets, and other characteristics particular to the security. To the extent that valuation is based on models or inputs that are less observable or unobservable in the market, the determination of fair value requires more judgment. Accordingly, the degree of judgment exercised in determining fair value is greatest for instruments categorized in Level 3.
The inputs used to measure fair value may fall into different levels of the fair value hierarchy. In such cases, for disclosure purposes, the level in the fair value hierarchy within which the fair value measurement falls in its entirety, is determined based on the lowest level input that is significant to the fair value measurement in its entirety.
The inputs or methodology used for valuing securities are not necessarily an indication of the risk associated with investing in those securities. The following tables summarize the inputs used as of October 31, 2020 for the Funds’ assets and liabilities measured at fair value:
| Mauldin Fund: | Level 1 | Level 2 | Level 3 | Total | ||||||||||||
| Assets* | ||||||||||||||||
| Exchange-Traded Funds | $ | 50,423,933 | $ | — | $ | — | $ | 50,423,933 | ||||||||
| Short-Term Investments | 749,754 | — | — | 749,754 | ||||||||||||
| Total Assets | $ | 51,173,687 | $ | — | $ | — | $ | 51,173,687 | ||||||||
| Bond Fund: | Level 1 | Level 2 | Level 3 | Total | ||||||||||||
| Assets* | ||||||||||||||||
| Exchange-Traded Funds | $ | 31,993,609 | $ | — | $ | — | $ | 31,993,609 | ||||||||
| Short-Term Investments | 7,995,561 | — | — | 7,995,561 | ||||||||||||
| Total Assets | $ | 39,989,170 | $ | — | $ | — | $ | 39,989,170 | ||||||||
| Tactical Fund: | Level 1 | Level 2 | Level 3 | Total | ||||||||||||
| Assets* | ||||||||||||||||
| Exchange-Traded Funds | $ | 6,887,039 | $ | — | $ | — | $ | 6,887,039 | ||||||||
| Total Assets | $ | 6,887,039 | $ | — | $ | — | $ | 6,887,039 | ||||||||
| * | Refer to the Portfolios of Investments for industry classifications. |
The Funds did not hold Level 3 securities during the period.
Security Transactions and Investment Income – Investment security transactions are accounted for on a trade date basis. Cost is determined and gains and losses are based upon the specific identification method for both financial statement and Federal income tax purposes. Dividend income is recorded on the ex-dividend date and interest income is recorded on an
29
| CMG Funds |
| NOTES TO FINANCIAL STATEMENTS (Unaudited) (Continued) |
| October 31, 2020 |
accrual basis. Purchase discounts and premiums on securities are accreted and amortized over the life of the respective securities.
Foreign Currency Translations – All assets and liabilities denominated in foreign currencies are translated into U.S. dollars based on the rate of exchange of such currencies against U.S. dollars on the date of valuation. Purchases and sales of securities and income and expenses are translated at the rate of exchange quoted on the respective date that such transactions are recorded. The Funds do not isolate the portion of the results of operations resulting from changes in foreign exchange rates on investments from the fluctuations arising from changes in market prices of securities held.
Expenses – Expenses of the Trust that are directly identifiable to a specific fund are charged to that fund. Expenses, which are not readily identifiable to a specific fund, are allocated in such a manner as deemed equitable, taking into consideration the nature and type of expense and the relative sizes of the funds in the Trust.
Federal Income Taxes – The Funds intend to continue to comply with the requirements of Subchapter M of the Internal Revenue Code applicable to regulated investment companies and will distribute all of their taxable income, if any, to shareholders. Accordingly, no provision for federal income taxes is required in the financial statements.
The Funds recognize the tax benefits of uncertain tax positions only when the position is “more likely than not” to be sustained assuming examination by tax authorities. Management has analyzed the Funds’ tax positions and has concluded that no liability for unrecognized tax benefits should be recorded related to uncertain tax positions taken on returns filed for open tax years ended April 30, 2018 to April 30, 2020, or expected to be taken in the Funds’ April 30, 2021 year-end tax returns. The Funds identify their major tax jurisdictions as U.S. federal, Ohio and foreign jurisdictions where the Funds make significant investments. The Funds are not aware of any tax positions for which it is reasonably possible that the total amounts of unrecognized tax benefits will change materially in the next twelve months.
Distributions to Shareholders – Distributions from investment income and net realized capital gains, if any, are declared and paid at least annually and are recorded on the ex-dividend date. The character of income and gains to be distributed is determined in accordance with income tax regulations, which may differ from GAAP. These “book/tax” differences are considered either temporary (e.g., deferred losses, mark-to-market on open Section 1256 contracts) or permanent in nature. To the extent these differences are permanent in nature, such amounts are reclassified within the composition of net assets based on their federal tax-basis treatment; temporary differences do not require reclassification. These reclassifications have no effect on net assets, results from operations or net asset value per share of the Funds.
Indemnification – The Trust indemnifies its officers and trustees for certain liabilities that may arise from the performance of their duties to the Trust. Additionally, in the normal course of business, the Funds enter into contracts that contain a variety of representations and warranties and which provide general indemnities. The Funds’ maximum exposure under these arrangements is unknown, as this would involve future claims that may be made against the Funds that have not yet occurred. However, based on experience, the risk of loss due to these warranties and indemnities appears to be remote.
| 3. | INVESTMENT ADVISORY AGREEMENT AND TRANSACTIONS WITH RELATED PARTIES |
Advisory Fees – Pursuant to an investment advisory agreement between the adviser and the Trust, with respect to the Funds (the “Advisory Agreement”), investment advisory services are provided to the Funds by CMG Capital Management Group, Inc. (the “Adviser”). Under the terms of the Advisory Agreement, the Adviser receives monthly fees calculated at an annual rate of 1.05%, 0.95% and 0.75% of the average daily net assets of the Mauldin Fund, Bond Fund and Tactical Fund, respectively. For the six months ended October 31, 2020, the Adviser earned advisory fees of $296,380 for the Mauldin Fund, $174,862 for the Bond Fund and $27,697 for the Tactical Fund.
Distributor – The distributor of the Funds is Northern Lights Distributors, LLC ( the “Distributor”). The Trust has adopted, on behalf of the Funds, the Trust’s Master Distribution and Shareholder Servicing Plan (the “Plan”), as amended, pursuant to Rule 12b-1 under the 1940 Act, to pay for certain distribution activities and shareholder services. Under the Plan, the
30
| CMG Funds |
| NOTES TO FINANCIAL STATEMENTS (Unaudited) (Continued) |
| October 31, 2020 |
Mauldin Fund may pay up to 0.25% for Class A shares, the Bond Fund may pay up to 0.40% for Class A shares, and the Tactical Fund may pay up to 0.25% for Class A shares per year of its average daily net assets for such distribution and shareholder service activities. During the six months ended October 31, 2020, $3,265, $4,067 and $131 were accrued under the Plan for the Mauldin Fund, Bond Fund and Tactical Fund, respectively. As of October 31, 2020, the Board has not implemented the Plan with respect to the Class I shares of the Funds and no distribution fees have been accrued against the net assets of that class for the six months ended October 31, 2020.
The Distributor acts as the Funds’ principal underwriter in a continuous public offering of the Funds’ shares. For the six months ended October 31, 2020, the Distributor received underwriter commissions of $3,466 for sales of the Mauldin Fund Class A shares, of which $502 was retained by the principal underwriter or other affiliated broker-dealers, respectively.
In addition, certain affiliates of the Distributor provide services to the Funds as follows:
Gemini Fund Services, LLC (“GFS”) – GFS, an affiliate of the Distributor, provides administration, fund accounting, and transfer agent services to the Trust. Pursuant to an administrative servicing agreement with GFS, each Fund pays GFS customary fees based on aggregate net assets of the Funds as described in the servicing agreement for providing administration, fund accounting, and transfer agency services to the Funds. In accordance with this agreement, GFS pays for all other operating expenses for the Funds, including but not limited to legal fees, audit fees, compliance services and custody fees. As of October 31, 2020, the amounts owed to GFS were $29,451, $18,488 and $6,236 for the Mauldin Fund, Bond Fund and Tactical Fund, respectively. Certain officers of the Trust are also officers of GFS, and are not paid any fees directly by the Funds for serving in such capacities. For the six months ended October 31, 2020, the Trustees received fees in the amount of $8,860 on behalf of the Mauldin Fund and $7,088 each from the Bond Fund and the Tactical Fund.
Northern Lights Compliance Services, LLC (“NLCS”) – NLCS, an affiliate of GFS and the Distributor, provides a Chief Compliance Officer to the Trust, as well as related compliance services, pursuant to a consulting agreement between NLCS and the Trust. Under the terms of such agreement, NLCS receives customary fees from the Funds.
Blu Giant, LLC (“Blu Giant”) – Blu Giant, an affiliate of GFS and the Distributor, provides EDGAR conversion and filing services as well as print management services for the Funds on an ad-hoc basis. For the provision of these services, Blu Giant receives customary fees from the Funds.
| 4. | INVESTMENT TRANSACTIONS |
The cost of purchases and proceeds from the sale of securities, other than short-term investments and U.S. Government securities, for the six months ended October 31, 2020 amounted to $128,115,498 and $137,536,701, respectively, for the Mauldin Fund, $204,707,502 and $206,835,028, respectively, for the Bond Fund, and $25,442,234 and $25,859,377, respectively, for the Tactical Fund.
31
| CMG Funds |
| NOTES TO FINANCIAL STATEMENTS (Unaudited) (Continued) |
| October 31, 2020 |
| 5. | DISTRIBUTIONS TO SHAREHOLDERS AND TAX COMPONENTS OF CAPITAL |
The Statement of Assets and Liabilities represents cost for financial reporting purposes. Aggregate cost for federal tax purposes is $50,367,968, $40,004,098 and $6,921,477 for the Mauldin Fund, Bond Fund and the Tactical Fund, respectively, and differs from market value by net unrealized appreciation (depreciation) consisted of:
| Mauldin Fund | ||||
| Gross unrealized appreciation: | $ | 1,569,649 | ||
| Gross unrealized depreciation: | (763,930 | ) | ||
| Net unrealized appreciation: | $ | 805,719 | ||
| Bond Fund | ||||
| Gross unrealized appreciation: | $ | — | ||
| Gross unrealized depreciation: | (14,928 | ) | ||
| Net unrealized depreciation: | $ | (14,928 | ) | |
| Tactical Fund | ||||
| Gross unrealized appreciation: | $ | 131,503 | ||
| Gross unrealized depreciation: | (165,951 | ) | ||
| Net unrealized depreciation: | $ | (34,438 | ) |
The tax character of distributions paid during the years ended April 30, 2020 and April 30, 2019 was as follows:
| For the year ended April 30, 2020: | ||||||||||||||||
| Ordinary | Long-Term | Return of | ||||||||||||||
| Income | Capital Gains | Capital | Total | |||||||||||||
| CMG Mauldin Core Fund | $ | 1,005,250 | $ | 30,091 | $ | — | $ | 1,035,341 | ||||||||
| CMG Tactical Bond Fund | 902,998 | — | 1,942 | 904,940 | ||||||||||||
| CMG Tactical All Asset Strategy Fund | 246,298 | — | — | 246,298 | ||||||||||||
| For the year ended April 30, 2019: | ||||||||||||||||
| Ordinary | Long-Term | Return of | ||||||||||||||
| Income | Capital Gains | Capital | Total | |||||||||||||
| CMG Mauldin Core Fund | $ | 340,205 | $ | 2,777 | $ | — | $ | 342,982 | ||||||||
| CMG Tactical Bond Fund | 618,362 | — | — | 618,362 | ||||||||||||
| CMG Tactical All Asset Strategy Fund | — | — | — | — | ||||||||||||
32
| CMG Funds |
| NOTES TO FINANCIAL STATEMENTS (Unaudited) (Continued) |
| October 31, 2020 |
As of April 30, 2020, the components of accumulated earnings/ (losses) on a tax basis were as follows:
| Undistributed | Undistributed | Post October | Capital Loss | Unrealized | ||||||||||||||||||||
| Ordinary | Long-Term | Loss and Late | Carry | Appreciation/ | Total Accumulated | |||||||||||||||||||
| Income | Capital Gains | Year Loss | Forwards | (Depreciation) | Earnings/(Deficits) | |||||||||||||||||||
| CMG Mauldin Core Fund | $ | 9,691 | $ | 27,424 | $ | (483,081 | ) | $ | — | $ | 396,538 | $ | (49,428 | ) | ||||||||||
| CMG Tactical Bond Fund | — | — | (450,025 | ) | (1,493,199 | ) | 27,185 | (1,916,039 | ) | |||||||||||||||
| CMG Tactical All Asset Strategy Fund | 37,750 | — | (510,294 | ) | (1,322,207 | ) | 109,035 | (1,685,716 | ) | |||||||||||||||
The difference between book basis and tax basis undistributed net investment income and unrealized appreciation from investments is primarily attributable to the tax deferral of losses on wash sales and tax adjustments for grantor trusts.
The unrealized appreciation in the table above table includes unrealized foreign currency gains of $1,515 for CMG Mauldin Core Fund.
Late year losses incurred after December 31 within the fiscal year are deemed to arise on the first business day of the following fiscal year for tax purposes. The Fund incurred and elected to defer such late year losses as follows:
| Late Year Losses | ||||
| CMG Mauldin Core Fund | $ | 94,909 | ||
Capital losses incurred after October 31 within the fiscal year are deemed to arise on the first business day of the following fiscal year for tax purposes. The Fund incurred and elected to defer such capital losses as follows:
| Post October Losses | ||||
| CMG Mauldin Solutions Core Fund | $ | 388,172 | ||
| CMG Tactical Bond Fund | 450,025 | |||
| CMG Tactical All Asset Strategy Fund | 510,294 | |||
At April 30, 2020, the Funds had capital loss carry forwards for federal income tax purposes available to offset future capital gains and capital loss carryforwards utilized as follows:
| Non-Expiring | ||||||||||||||||
| Short-Term | Long-Term | Total | CLCF Utilized | |||||||||||||
| CMG Mauldin Core Fund | $ | — | $ | — | $ | — | 103,471 | $ | ||||||||
| CMG Tactical Bond Fund | 1,493,199 | — | 1,493,199 | 1,425,510 | ||||||||||||
| CMG Tactical All Asset Strategy Fund | 1,321,196 | 1,011 | 1,322,207 | — | ||||||||||||
Permanent book and tax differences, primarily attributable to the tax reclassification of Fund distributions resulted in reclassifications for the Funds for the year ended April 30, 2020 as follows:
| Accumulated | ||||||||
| Paid In Capital | Earnings (Losses) | |||||||
| CMG Mauldin Core Fund | $ | — | $ | — | ||||
| CMG Tactical Bond Fund | — | — | ||||||
| CMG Tactical All Asset Strategy Fund | — | — | ||||||
33
| CMG Funds |
| NOTES TO FINANCIAL STATEMENTS (Unaudited) (Continued) |
| October 31, 2020 |
| 6. | BENEFICIAL OWNERSHIP |
The beneficial ownership, either directly or indirectly, of more than 25% of the voting securities of a fund creates a presumption of control of a fund, under Section 2(a)(9) of the 1940 Act. As of October 31, 2020, TD Ameritrade held 41.35% of the Mauldin Fund, , E*TRADE Savings Bank held 89.41% of the Bond Fund, and Charles Schwab & Co. held 71.67% of the voting securities of the Tactical Fund.
| 7. | UNDERLYING INVESTMENT IN OTHER INVESTMENT COMPANIES |
The Bond Fund currently invests a portion of its assets in Invesco Treasury Collateral ETF (“Invesco”) and Janus Henderson Short Duration Income ETF (“Janus Henderson”). The Bond Fund may sell investments in Invesco and Janus Henderson at any time if the Adviser determines that it is in the best interest of the Bond Fund and its shareholders to do so. The performance of the Bond Fund will be directly affected by the performance of Invesco and Janus Henderson. The financial statements of Invesco and Janus Henderson, including the portfolio of investments, can be found at the SEC website www.sec.gov and should be read in conjunction with the Bond Fund’s financial statements. As of October 31 ,2020, the percentage of the Bond Fund’s net assets invested in Invesco was 47.5% and Janus Henderson was 47.5%.
| 8. | SUBSEQUENT EVENTS |
Subsequent events after the date of the Statements of Assets and Liabilities have been evaluated through the date the financial statements were issued. Management has determined that no events or transactions occurred requiring adjustment or disclosure in the financial statements.
34
| CMG Funds |
| SUPPLEMENTAL INFORMATION (Unaudited) |
| October 31, 2020 |
LIQUIDITY RISK MANAGEMENT PROGRAM
The Funds have adopted and implemented a written liquidity risk management program as required by Rule 22e-4 (the “Liquidity Rule”) under the Investment Company Act. The program is reasonably designed to assess and manage the Funds’ liquidity risk, taking into consideration, among other factors, the Funds’ investment strategies and the liquidity of its portfolio investments during normal and reasonably foreseeable stressed conditions; its short and long-term cash flow projections; and its cash holdings and access to other funding sources.
During the six months ended October 31, 2020, the Board and the Trust’s Liquidity Risk Management Program Committee (the “Committee”) reviewed the Funds’ investments and they determined that the Funds held adequate levels of cash and highly liquid investments to meet shareholder redemption activities in accordance with applicable requirements. Accordingly, the Board and Committee concluded that (i) the Funds’ liquidity risk management program is reasonably designed to prevent violations of the Liquidity Rule and (ii) the Funds’ liquidity risk management program has been effectively implemented.
35
| CMG Funds |
| EXPENSE EXAMPLES (Unaudited) |
| October 31, 2020 |
As a shareholder of the Funds, you incur two types of costs: (1) transaction costs, including sales charges (loads) on purchases and (2) ongoing costs, including management fees, distribution and/or service (12b-1) fees and other Fund expenses. This example is intended to help you understand your ongoing costs (in dollars) of investing in the Funds and to compare these costs with the ongoing costs of investing in other mutual funds.
The example is based on an investment of $1,000 invested at the beginning of the period and held for the entire period from May 1, 2020 through October 31, 2020.
Actual Expenses
The “Actual” columns in the table below provide information about actual account values and actual expenses. You may use the information below, together with the amount you invested, to estimate the expenses that you paid over the period. Simply divide your account value by $1,000 (for example, an $8,600 account value divided by $1,000 = 8.6), then multiply the result by the number in the table under the heading entitled “Expenses Paid During Period” to estimate the expenses you paid on your account during this period.
Hypothetical Example for Comparison Purposes
The “Hypothetical” columns in the table below provide information about hypothetical account values and hypothetical expenses based on each Fund’s actual expense ratio and an assumed rate of return of 5% per year before expenses, which is not the Fund’s actual return. The hypothetical account values and expenses may not be used to estimate the actual ending account balances or expenses you paid for the period. You may use this information to compare this 5% hypothetical example with the 5% hypothetical examples that appear in the shareholder reports of other funds.
Please note that the expenses shown in the table are meant to highlight your ongoing costs only and do not reflect any transactional costs such as front-end or contingent deferred sales charges (loads). Therefore, the table is useful in comparing ongoing costs only, and will not help you determine the relative total costs of owning different funds. In addition, if these transactional costs were included, your costs would have been higher.
| Hypothetical | ||||||||||||
| ’ | Actual | (5% return before expenses) | ||||||||||
| Fund’s | Beginning | Ending | ||||||||||
| Annualized | Account | Account | Expenses | Ending | Expenses | |||||||
| Expense | Value | Value | Paid During | Account Value | Paid During | |||||||
| Class A | Ratio | 5/1/20 | 10/31/20 | Period * | 10/31/20 | Period * | ||||||
| Mauldin Fund | 1.87% | $1,000.00 | $1,034.10 | $9.61 | $1,015.76 | $9.52 | ||||||
| Bond Fund | 1.85% | $1,000.00 | $987.20 | $9.28 | $1,015.87 | $9.41 | ||||||
| All Asset Fund | 1.72% | $1,000.00 | $1,029.30 | $8.76 | $1,016.53 | $8.74 | ||||||
| Class I | ||||||||||||
| Mauldin Fund | 1.62% | $1,000.00 | $1,034.80 | $8.32 | $1,017.02 | $8.25 | ||||||
| Bond Fund | 1.45% | $1,000.00 | $991.80 | $7.29 | $1,017.89 | $7.38 | ||||||
| All Asset Fund | 1.47% | $1,000.00 | $1,029.30 | $7.49 | $1,017.82 | $7.45 | ||||||
| * | Expenses are equal to the average account value over the period, multiplied by the Funds’ annualized expense ratio, multiplied by the number of days in the six-month period ended October 31, 2020 (184) divided by the number of days in the fiscal year (365). |
36
CMG Capital Management Group, Inc. Adviser to CMG Mauldin Core Fund (“CMG Mauldin”), CMG Tactical All Asset Strategy Fund “(CMG All Asset”) & CMG Tactical Bond Fund (“CMG Bond”) *
In connection with the regular meeting held on September 23-25, 2020 of the Board of Trustees (the “Trustees” or the “Board”) of the Northern Lights Fund Trust (the “Trust”), including a majority of the Trustees who are not “interested persons,” as that term is defined in the Investment Company Act of 1940, as amended, discussed the renewal of an investment advisory agreement (the “Advisory Agreement”) between CMG Capital Management Group, Inc. (“CMG Capital”) and the Trust, with respect to the CMG Mauldin, CMG All Asset, and CMG Bond (each a “Fund”, collectively the “Funds”). In considering the renewal of the Advisory Agreement, the Board received materials specifically relating to the Advisory Agreement.
The Trustees were assisted by independent legal counsel throughout the Advisory Agreement review process. The Trustees relied upon the advice of independent legal counsel and their own business judgment in determining the material factors to be considered in evaluating the Advisory Agreement and the weight to be given to each such factor. The conclusions reached by the Trustees were based on a comprehensive evaluation of all of the information provided and were not the result of any one factor. Moreover, each Trustee may have afforded different weight to the various factors in reaching his conclusions with respect to the Advisory Agreement.
Nature, Extent and Quality of Services. The Trustees noted that CMG Capital was founded in 1992 and directly managed approximately $210 million in assets and provided consulting services on an additional $31 million in assets. They further noted that the adviser provided strategies in equity, fixed income, balanced and customized portfolios for a large range of client types through multiple investment vehicles. The Trustees reviewed the background information of the key investment professionals servicing the Funds and expressed their satisfaction with the team’s diverse financial industry experience and veteran investment team. The Trustees reviewed the adviser’s investment process for each Fund, noting that CMG Mauldin selected tactical research providers after conducting an analysis and due diligence of the adviser’s strategy, examining asset classes, sectors and investment style. The Trustees reviewed the adviser’s investment strategy for CMG Bond, commenting that it focused on investing in high yield bond markets using a proprietary quantitative model that analyzes price, volume, yield spreads, and default rates. They acknowledged that the CMG All Asset’s investment strategy differed from both CMG Bond and CMG Mauldin because it selected ETFs based on price data using relative strength and momentum indicators. The Trustees observed that the adviser approached each Fund’s unique set of risks with mitigation processes that focus on the effects of tactical trading, use of dynamic asset allocation, hedging techniques and the ability to take defensive positions and perform deep analysis of risk characteristics of investment products. The Trustees acknowledged that the adviser monitored compliance with each Fund’s investment limitations by pre-screening trades against a checklist to determine the trade’s impact on portfolio compliance and performed post-trade reviews to ensure each Fund is investing consistent with its prospectus. The Trustees reviewed the adviser’s broker-dealer selection approach noting it took into consideration various qualitative service factors relevant to providing best execution. The Trustees considered the adviser’s reported litigation (but above, it sounded like there were no on-going litigations, please confirm and revise as necessary) and regulatory matters, The Trustees observed that the adviser had been working remotely and
37
operating effectively during the COVID-19 pandemic. The Trustees further noted that the adviser continued to invest in research and dedicates sufficient resources to support the Fund.
Performance.
CMG Mauldin. The Trustees noted that the Fund received a three-star Morningstar rating and seeks capital appreciation. They further noted that the Fund’s investment strategy changed in 2018 and that the adviser believed that the Fund’s one-year and three-year performance statistics were more relevant to the Trustees’ evaluation than five-year and since inception periods. The Trustees acknowledged that the Fund underperformed the Fund’s peer group median and Morningstar median over the one-year and three-year periods. They further noted that the Fund had top quartile standard deviation over the one-year and three-year periods, and that the standard deviation was an indication that the Fund’s strategy was working well. The Trustees concurred with the adviser’s assertion that the Fund appeared to be better suited as an allocation fund that provided capital appreciation with a lower standard deviation and that they would continue to monitor performance. The Trustees concluded that the adviser had been consistent in implementing the Fund’s strategy since its inception and should be given the opportunity to continue to seek positive performance.
CMG All Asset. The Trustees observed that the Fund received a two-star Morningstar rating and the Fund’s assets decreased by $24 million for the period ended June 30, 2020. The Trusted noted that the Fund underperformed its benchmark, peer group median, and Morningstar category median for the one-year, three-year, and since inception periods. They further noted that the adviser recognized that Fund’s underperformance and had implemented changes to the adviser’s algorithms and investment models. They considered the Fund’s risks metrics, commenting that the Fund’s Standard Deviation ranked in the 2nd quartile for the one-year, three-year, and since inception periods. The Trustees acknowledged the Fund’s underperformance but agreed that the adviser should be given the opportunity to improve the Fund’s performance.
CMG Bond. The Trustees observed that the Fund incepted in 2014 and was a two-star Morningstar fund. They acknowledged that the Fund’s assets decreased by approximately $2 million for the fiscal year ended June 30, 2020. The Trustees considered the Fund’s performance, noting that it outperformed the Fund’s peer group median over the one-year, three-year, five-year and since inception periods, while underperforming its benchmark and Morningstar category median. The Trustees considered the Fund’s standard deviation, noting that it ranked in the 1st quartile for the all periods and demonstrated that the adviser was committed to maintaining low volatility. The Trustees concluded that the adviser had improved the Fund’s performance, with a continued focus on low volatility, and should be given the opportunity to continue to seek positive performance and risk protection for shareholders.
Fees and Expenses.
CMG Mauldin. The Trustees considered the Fund’s fees and expenses, noting that the Fund’s advisory fee of 1.05% was higher than the peer group average and median and Morningstar category average and median. The Trustees further noted that the advisory fee was within the range of both the peer group and Morningstar category. They compared the Fund’s advisory fee to the advisory fee charged by the adviser for managing the same strategy in a separately managed account, acknowledging that the Fund’s advisory fee was lower. They reviewed the Fund’s net
38
expense ratio, acknowledging that it was higher than the Morningstar category median and peer group median. They further discussed that the Fund’s net expense ratio of 1.41% was higher than its Morningstar category median and its peer group median. Based on the Fund’s specific strategy and other factors, the Trustees concluded that the advisory fee was not unreasonable.
CMG All Asset. The Trustees reviewed the Fund’s fees and expenses, commenting that the Fund’s advisory fee of 0.75% and net expense ratio of 1.06% were lower than the peer group average and median and Morningstar category average and median. They further noted that the Fund’s advisory fee was lower than the fee charged by the adviser for managing the same strategy in a separately managed account. The Trustees concluded that the advisory fee was not unreasonable.
CMG Bond. The Trustees noted that the Fund’s advisory fee of 0.95% was lower than its peer group median and average, but higher than both the Morningstar category median and average. They further noted that the Fund’s net expense ratio of 1.32% was lower than the peer group median and peer group average but higher than the Morningstar category median and average. After discussion, the Trustees concluded that the advisory fee charged by the adviser was not unreasonable.
Profitability. The Trustees considered the profits and losses that were realized by the adviser in connection with the advisory services rendered to each Fund. The Trustees noted that the adviser reported no realized profits with respect to CMG Bond and CMG Mauldin and a modest profit in connection with CMG All Asset. They acknowledged that the amount earned by the adviser in connection with its relationship to the Funds could decrease due to the recent decrease in assets in each of the Funds. The Trustees also considered the benefits of soft dollar usage by the adviser. The Trustees concluded the adviser’s profits were not excessive.
Economies of Scale. The Trustees considered whether economies of scale had been realized in connection with the adviser’s advisory services provided to each Fund. They reviewed the adviser’s assertion that the adviser would begin to benefit from economies of scale once each Fund’s assets exceed $250 million. They noted that based on each Fund’s current asset size, the absence of breakpoints was acceptable at this time and they agreed to continue to monitor each Fund’s asset levels and revisit the matter if one or more of the Funds saw significant growth.
Conclusion. Having requested and received such information from the adviser as the Trustees believed to be reasonably necessary to evaluate the terms of the advisory agreement, and as assisted by the advice of counsel, the Trustees concluded that the fee structure was not unreasonable and that renewal of the advisory agreement with CMG Capital was in the best interests of the Funds and their respective shareholders.
| * | Due to the timing of the contract renewal schedule, these deliberations may or may not relate to the current performance results of the Funds. |
39
PRIVACY NOTICE
Northern Lights Fund Trust
Rev. February 2014
| FACTS | WHAT DOES NORTHERN LIGHTS FUND TRUST DO WITH YOUR PERSONAL INFORMATION? |
| Why? | Financial companies choose how they share your personal information. Federal law gives consumers the right to limit some, but not all sharing. Federal law also requires us to tell you how we collect, share, and protect your personal information. Please read this notice carefully to understand what we do. |
| What? | The types of personal information we collect and share depends on the product or service that you have with us. This information can include:
● Social Security number and wire transfer instructions
● account transactions and transaction history
● investment experience and purchase history
When you are no longer our customer, we continue to share your information as described in this notice. |
| How? | All financial companies need to share customers’ personal information to run their everyday business. In the section below, we list the reasons financial companies can share their customers’ personal information; the reasons Northern Lights Fund Trust chooses to share; and whether you can limit this sharing. |
| Reasons
we can share your personal information: |
Does
Northern Lights Fund Trust share information? |
Can you limit this sharing? |
| For our everyday business purposes - such as to process your transactions, maintain your account(s), respond to court orders and legal investigations, or report to credit bureaus. | YES | NO |
| For our marketing purposes - to offer our products and services to you. | NO | We don’t share |
| For joint marketing with other financial companies. | NO | We don’t share |
| For our affiliates’ everyday business purposes - information about your transactions and records. | NO | We don’t share |
| For our affiliates’ everyday business purposes - information about your credit worthiness. | NO | We don’t share |
| For nonaffiliates to market to you | NO | We don’t share |
| QUESTIONS? | Call 1-402-493-4603 |
40
PRIVACY NOTICE
Northern Lights Fund Trust
| Page 2 |
| What we do: | |
How does Northern Lights Fund Trust protect my personal information? |
To protect your personal information from unauthorized access and use, we use security measures that comply with federal law. These measures include computer safeguards and secured files and buildings.
Our service providers are held accountable for adhering to strict policies and procedures to prevent any misuse of your nonpublic personal information. |
How does Northern Lights Fund Trust collect my personal information? |
We collect your personal information, for example, when you ● open an account or deposit money
● direct us to buy securities or direct us to sell your securities
● seek advice about your investments
We also collect your personal information from others, such as credit bureaus, affiliates, or other companies. |
Why can’t I limit all sharing? |
Federal law gives you the right to limit only: ● sharing for affiliates’ everyday business purposes – information about your creditworthiness.
● affiliates from using your information to market to you.
● sharing for nonaffiliates to market to you.
State laws and individual companies may give you additional rights to limit sharing. |
| Definitions | |
| Affiliates | Companies related by common ownership or control. They can be financial and nonfinancial companies.
● Northern Lights Fund Trust does not share with its affiliates. |
| Nonaffiliates | Companies not related by common ownership or control. They can be financial and nonfinancial companies.
● Northern Lights Fund Trust does not share with nonaffiliates so they can market to you. |
| Joint marketing | A formal agreement between nonaffiliated financial companies that together market financial products or services to you.
● Northern Lights Fund Trust doesn’t jointly market. |
41
CMG FUNDS
| Adviser | CMG
Capital Management Group, Inc. 1000 Continental Drive, Suite 570 King of Prussia, PA19406 |
| Sub-Adviser
CMG Mauldin Core Fund |
Mauldin
Solutions, LLC 2900 McKinnon # 1708 Dallas, TX 75201 |
| Administrator | Gemini
Fund Services, LLC 4221 North 203rd Street, Suite 100 Elkhorn, NE 68022 |
How to Obtain Proxy Voting Information
Information regarding how the Funds voted proxies relating to portfolio securities for the most recent 12 month period ended June 30th as well as a description of the policies and procedures that the Funds used to determine how to vote proxies is available without charge, upon request, by calling 1-866-CMG-9456 or by referring to the Securities and Exchange Commission’s (“SEC”) website at http://www.sec.gov.
How to Obtain 1st and 3rd Fiscal Quarter Portfolio Holdings
The Funds file a complete schedule of portfolio holdings with the SEC for the first and third quarters of each fiscal year as an exhibit to its reports on Form N-PORT, within sixty days after the end of the period. Form N-PORT is available on the SEC’s website at http://www.sec.gov. The information on Form N-PORT is available without charge, upon request, by calling 1-866-CMG-9456.
| CMG Funds |
| 225 Pictoria Drive ● Suite 450 ● Cincinnati, OH 45246 |
| 1-866-CMG-9456 |
Item 2. Code of Ethics. Not applicable.
Item 3. Audit Committee Financial Expert. Not applicable.
Item 4. Principal Accountant Fees and Services. Not applicable.
Item 5. Audit Committee of Listed Companies. Not applicable to open-end investment companies.
Item 6. Schedule of Investments. Schedule of investments in securities of unaffiliated issuers is included under Item 1.
Item 7. Disclosure of Proxy Voting Policies and Procedures for Closed-End Management Investment Companies. Not applicable to open-end investment companies.
Item 8. Portfolio Managers of Closed-End Management Investment Companies. Not applicable to open-end investment companies.
Item 9. Purchases of Equity Securities by Closed-End Management Investment Companies and Affiliated Purchasers. Not applicable to open-end investment companies.
Item 10. Submission of Matters to a Vote of Security Holders. None
Item 11. Controls and Procedures.
(a) Based on an evaluation of the Registrant’s disclosure controls and procedures as of a date within 90 days of filing date of this Form N-CSR, the principal executive officer and principal financial officer of the Registrant have concluded that the disclosure controls and procedures of the Registrant are reasonably designed to ensure that the information required in filings on Form N-CSR is recorded, processed, summarized, and reported by the filing date, including that information required to be disclosed is accumulated and communicated to the Registrant’s management, including the Registrant’s principal executive officer and principal financial officer, as appropriate to allow timely decisions regarding required disclosure.
(b) There were no significant changes in the Registrant’s internal control over financial reporting that occurred during the Registrant’s last fiscal half-year that have materially affected, or are reasonably likely to materially affect, the Registrant’s internal control over financial reporting.
Item 12. Disclosure of Securities Lending Activities for Closed-End Management Investment Companies.
Not applicable Fund is an open-end management investment company
Item 13. Exhibits.
(a)(1) Not applicable.
(a)(3) Not applicable for open-end investment companies.
SIGNATURES
Pursuant to the requirements of the Securities Exchange Act of 1934 and the Investment Company Act of 1940, the registrant has duly caused this report to be signed on its behalf by the undersigned, thereunto duly authorized.
(Registrant) Northern Lights Fund Trust
By (Signature and Title)
/s/ Kevin E. Wolf
Kevin E. Wolf, Principal Executive Officer/President
Date 1/8/21
Pursuant to the requirements of the Securities Exchange Act of 1934 and the Investment Company Act of 1940, this report has been signed below by the following persons on behalf of the registrant and in the capacities and on the dates indicated.
By (Signature and Title)
/s/ Kevin E. Wolf
Kevin E. Wolf, Principal Executive Officer/President
Date 1/8/21
By (Signature and Title)
/s/ Jim Colantino
Jim Colantino, Principal Financial Officer/Treasurer
Date 1/8/21
CERTIFICATIONS
I, Kevin E. Wolf, certify that:
1. I have reviewed this report on Form N-CSR of the CMG Funds (series of Northern Lights Fund Trust);
2. Based on my knowledge, this report does not contain any untrue statement of a material fact or omit to state a material fact necessary to make the statements made, in light of the circumstances under which such statements were made, not misleading with respect to the period covered by this report;
3. Based on my knowledge, the financial statements, and other financial information included in this report, fairly present in all material respects the financial condition, results of operations, changes in net assets, and cash flows (if the financial statements are required to include a statement of cash flows) of the registrant as of, and for, the periods presented in this report;
4. The registrant's other certifying officer(s) and I are responsible for establishing and maintaining disclosure controls and procedures (as defined in Rule 30a-3(c) under the Investment Company Act of 1940) and internal control over financial reporting (as defined in Rule 30a-3(d) under the Investment Company Act of 1940) for the registrant and have:
a) designed such disclosure controls and procedures, or caused such disclosure controls and procedures to be designed under our supervision, to ensure that material information relating to the registrant, including its consolidated subsidiaries, is made known to us by others within those entities, particularly during the period in which this report is being prepared;
b) designed such internal control over financial reporting, or caused such internal control over financial reporting to be designed under our supervision, to provide reasonable assurance regarding the reliability of financial reporting and the preparation of financial statements for external purposes in accordance with generally accepted accounting principles;
c) evaluated the effectiveness of the registrant's disclosure controls and procedures and presented in this report our conclusions about the effectiveness of the disclosure controls and procedures, as of a date within 90 days prior to the filing date of this report based on such evaluation; and
d) disclosed in this report any change in the registrant’s internal control over financial reporting that occurred during the second fiscal quarter of the period covered by this report that has materially affected, or is reasonably likely to materially affect, the registrant’s internal control over financial reporting; and
5. The registrant's other certifying officer(s) and I have disclosed to the registrant's auditors and the audit committee of the registrant's board of directors (or persons performing the equivalent functions):
a) all significant deficiencies and material weaknesses in the design or operation of internal control over financial reporting which are reasonably likely to adversely affect the registrant's ability to record, process, summarize, and report financial information; and
b) any fraud, whether or not material, that involves management or other employees who have a significant role in the registrant's internal control over financial reporting.
Date: 1/8/21 /s/ Kevin E. Wolf
Kevin E. Wolf
Principal Executive Officer/President
I, Jim Colantino, certify that:
1. I have reviewed this report on Form N-CSR of the CMG Funds (series of Northern Lights Fund Trust);
2. Based on my knowledge, this report does not contain any untrue statement of a material fact or omit to state a material fact necessary to make the statements made, in light of the circumstances under which such statements were made, not misleading with respect to the period covered by this report;
3. Based on my knowledge, the financial statements, and other financial information included in this report, fairly present in all material respects the financial condition, results of operations, changes in net assets, and cash flows (if the financial statements are required to include a statement of cash flows) of the registrant as of, and for, the periods presented in this report;
4. The registrant's other certifying officer(s) and I are responsible for establishing and maintaining disclosure controls and procedures (as defined in Rule 30a-3(c) under the Investment Company Act of 1940) and internal control over financial reporting (as defined in Rule 30a-3(d) under the Investment Company Act of 1940) for the registrant and have:
a) designed such disclosure controls and procedures, or caused such disclosure controls and procedures to be designed under our supervision, to ensure that material information relating to the registrant, including its consolidated subsidiaries, is made known to us by others within those entities, particularly during the period in which this report is being prepared;
b) designed such internal control over financial reporting, or caused such internal control over financial reporting to be designed under our supervision, to provide reasonable assurance regarding the reliability of financial reporting and the preparation of financial statements for external purposes in accordance with generally accepted accounting principles;
c) evaluated the effectiveness of the registrant's disclosure controls and procedures and presented in this report our conclusions about the effectiveness of the disclosure controls and procedures, as of a date within 90 days prior to the filing date of this report based on such evaluation; and
d) disclosed in this report any change in the registrant’s internal control over financial reporting that occurred during the second fiscal quarter of the period covered by this report that has materially affected, or is reasonably likely to materially affect, the registrant’s internal control over financial reporting; and
5. The registrant's other certifying officer(s) and I have disclosed to the registrant's auditors and the audit committee of the registrant's board of directors (or persons performing the equivalent functions):
a) all significant deficiencies and material weaknesses in the design or operation of internal control over financial reporting which are reasonably likely to adversely affect the registrant's ability to record, process, summarize, and report financial information; and
b) any fraud, whether or not material, that involves management or other employees who have a significant role in the registrant's internal control over financial reporting.
Date: 1/8/21 /s/ Jim Colantino
Jim Colantino
Principal Financial
Officer/Treasurer
certification
Kevin E. Wolf, Principal Executive Officer/President, and Jim Colantino, Principal Financial Officer/Treasurer of Northern Lights Fund Trust (the “Registrant”), each certify to the best of his knowledge that:
1. The Registrant’s periodic report on Form N-CSR for the period ended October 31, 2020 (the “Form N-CSR”) fully complies with the requirements of Sections 15(d) of the Securities Exchange Act of 1934, as amended; and
2. The information contained in the Form N-CSR fairly presents, in all material respects, the financial condition and results of operations of the Registrant.
| Principal Executive Officer/President | Principal Financial Officer/Treasurer | |
| Northern Lights Fund Trust | Northern Lights Fund Trust | |
| /s/ Kevin E. Wolf | /s/ Jim Colantino | |
| Kevin E. Wolf | Jim Colantino | |
| Date: 1/8/21 | Date: 1/8/21 |
A signed original of this written statement required by Section 906 of the Sarbanes-Oxley Act of 2002 has been provided to Northern Lights Funds Trust and will be retained by Northern Lights Fund Trust and furnished to the Securities and Exchange Commission (the “Commission”) or its staff upon request.
This certification is being furnished to the Commission solely pursuant to 18 U.S.C. § 1350 and is not being filed as part of the Form N-CSR filed with the Commission.
Serious News for Serious Traders! Try StreetInsider.com Premium Free!
You May Also Be Interested In
- Company announcement no 9/2024 Annual account 2023
- Dimensional Fund Advisors Ltd. : Form 8.3 - BARRATT DEVELOPMENTS PLC - Ordinary Shares
- PMD Device Solutions Publishes 2023 Annual Report
Create E-mail Alert Related Categories
SEC FilingsSign up for StreetInsider Free!
Receive full access to all new and archived articles, unlimited portfolio tracking, e-mail alerts, custom newswires and RSS feeds - and more!
