

Form N-CSRS NORTHERN LIGHTS FUND For: Jun 30
 Tweet
Tweet Share
Shareunited
states
securities and exchange commission
washington, d.c. 20549
form n-csr
certified shareholder report of registered management
investment companies
Investment Company Act file number 811-22549
Northern Lights Fund Trust II
(Exact name of registrant as specified in charter)
225 Pictoria Drive, Suite 450, Cincinnati, Ohio 45246
(Address of principal executive offices) (Zip code)
Kevin Wolf, Gemini Fund Services, LLC
4221 North 203rd Street, Suite 100, Elkhorn, NE 68022
(Name and address of agent for service)
Registrant's telephone number, including area code: 631-470-2600
Date of fiscal year end: 12/31
Date of reporting period: 06/30/21
Item 1. Reports to Stockholders.
 |
| Acclivity Mid Cap Multi-Style Fund |
| Acclivity Small Cap Value Fund |
| Semi-Annual Report |
| June 30, 2021 |
| www.acclivityfunds.com |
| 1 (855) 873-3837 |
| Distributed by Northern Lights Distributors, LLC |
| Member FINRA |
US Market Review (unaudited)
A Brief Recap
In the first half of this year ending with June 30th, 2021, the U.S. equity market, represented by the S&P 500 Total Return Index, advanced 15.25% as the vaccine rollout continues. We believe the economic activity will continue to improve throughout the year if the following assumptions are satisfied: 1) Current increase in inflation is transitory, 2) Interest rates will increase, 3) A portion of President Biden’s fiscal plan will pass into law, 4) A stable and healthy geography political environment. But this future is not guaranteed. We remain cautious and observe any potential market changes. Across different market capitalization segments, the U.S. large-cap, represented by the Russell 1000 Total Return Index, went up 14.95%. The U.S. mid-cap, represented by the Russell Mid Cap Total Return Index, finished 16.25% higher. And the U.S. small-cap, represented by the Russell 2000 Total Return Index, outperformed the large peers by 2.58%. Among all the Global Industry Clasification Standards sectors, Energy and Financial securities outperformed most while Utility and Consumer Staples securities lagged behind most. Value securities outperformed growth securities across different market capitalization segments measured by Russell indices in the first half of 2021.
Acclivity Mid Cap Multi-Style Fund
Within the Mid Caps for this period, the Russell Mid Cap Total Return Index went up 16.25%, and the Russell Mid Cap Value Total Return Index advanced 19.45%. Acclivity Mid Cap Multi-Style Fund Class I Shares (“AXMIX”) were up 16.30%. Exhibit 1 compares the first two-quarters performance of AXMIX and its benchmark Russell Mid Cap Total Return index.
Exhibit 1. Performance of AXMIX v.s. Russell Mid Cap as of June 30th, 2021
| 2021 Performance | Q1 | Q2 | YTD |
| AXMIX | 11.50% | 4.31% | 16.30% |
| Russell Mid Cap | 8.14% | 7.50% | 16.25% |
To decompose fund performance, the overweight in financial securities has made up most of the positive sector allocation. The underweight in real estate and energy securities dragged the performance. Meanwhile, the security selections in the industrials sector outperformed the most, and the security selections in the real estate and healthcare sectors struggled. Exhibit 2 compares the characteristics of AXMIX against the benchmark.
1
Exhibit 2. Characteristics of AXMIX v.s. Russell Mid Cap Index as of June 30th, 2021.
| Fund/Index | Price-to-Book | Price-to-Earnings | EBITDA/Total Market Value |
Market Capitalization ($B) |
| AXMIX | 2.76 | 20.63 | 1.68% | 13.04 |
| Russell
Mid Cap Index |
3.68 | 24.19 | 0.94% | 23.31 |
Exhibit 2 shows that our Fund emphasizes stocks with smaller market capitalization, lower relative prices, and higher profitability than the benchmark. Exhibit 3 shows the investment style between the Fund and benchmark.
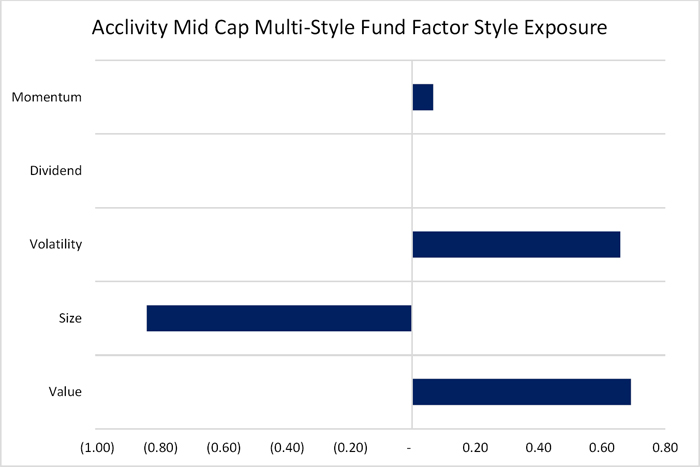
Exhibit 3. Investment style of AXMIX v.s. Russell Mid Cap Index using daily data between January 1st, 2021, and June 30th, 2021.
2
Acclivity Small Cap Value Fund
Within small cap stocks for this period, the Russell 2000 Value Total Return Index surged 26.69%, while the Russell 2000 Growth Total Return Index advanced 8.98%. Acclivity Small Cap Value Fund Class I Shares (“AXVIX”) were up 31.24%. Exhibit 4 compares the first two-quarters performance of AXVIX and its benchmark Russell 2000 Value index.
Exhibit 4. Performance of AXVIX v.s. Russell 2000 Value as of June 30th, 2021
| 2021 Performance | Q1 | Q2 | YTD |
| AXVIX | 24.78% | 5.17% | 31.23% |
| Russell 2000 Value | 21.17% | 4.56% | 26.69% |
To decompose fund performance, the overweight in consumer discretionary securities and the underweight of utility securities have made up most of the positive sector allocation. The overweight in information technology and financial securities dragged the performance. Meanwhile, the security selections in the financial sector outperformed the most, and the security selections in the communication services sector struggled. Exhibit 5 compares the characteristics of AXVIX against the benchmark.
Exhibit 5. Characteristics of AXVIX v.s. Russell 2000 Value Index as of June 30th, 2021.
| Fund/Index | Price-to-Book | Price-to-Earnings | EBITDA/Total Market Value |
Market Capitalization ($B) |
| AXVIX | 1.39 | 11.97 | 6.74% | 3.49 |
| Russell
2000 Value Index |
1.57 | 14.44 | 3.96% | 3.08 |
Exhibit 5 shows that our Fund emphasizes stocks with lower relative prices and higher profitability than the benchmark. Exhibit 6 shows the investment style between the Fund and benchmark.
3
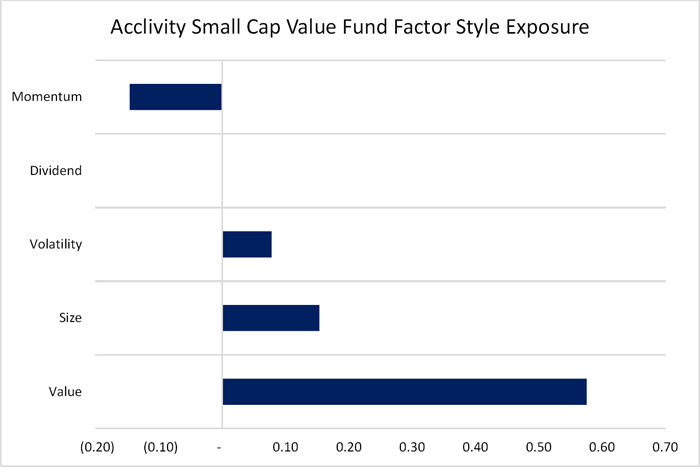
Exhibit 6. Investment style of AXVIX v.s. Russell 2000 Value Index using daily data between January 1st, 2021, and June 30th, 2021.
Our research team pursues an active research agenda in which we are looking for better ways to systematically define and measure factors. And as always, we are focused on delivering long-term results that our clients expect from Innealta Capital.
Disclosures and Important Information
Russell 1000 Index is a stock market index that tracks the highest-ranking 1,000 stocks in the Russell 3000 Index.
Russell 2000 Index is a small-cap stock market index of the bottom 2,000 stocks in the Russell 3000 Index.
Russell 2000 Value Index measures the performance of Russell 2000 companies with lower price-to-book ratios and lower forecasted growth values.
Russell 2000 Growth Index measures the performance of Russell 2000 companies with higher price-to-book ratios and higher forecasted growth values.
4
Russell Mid Cap Index is a stock market index that tracks the 800 smallest companies in the Russell 1000 Index, which represents approximately 25% of the total market capitalization of the Russell 1000 Index.
Russell Mid Cap Value Index measures the performance of Russell mid cap companies with lower price-to-book ratios and lower forecasted growth values.
Russell Mid Cap Growth Index measures the performance of Russell mid cap companies with higher price-to-book ratios and higher forecasted growth values.
Total return indexes reinvest dividends.
Frank Russell Company is the source and owner of the trademarks, service marks, and copyrights related to the Russell Indexes. Indices do not reflect any fees, expenses, or sales charges and are not available for direct investment.
Price-to-book ratio is calculated using Index Methodology. Price-to-earnings ratio is calculated using Weighted Harmonic Average. EBITDA/Total Market Value is a proxy for current cash flow to total market value, commonly known in factor investing as “profitability”.
Momentum refers to the Bloomberg US Pure Momentum Portfolio, which represents the return of Momentum factor defined by Bloomberg PORT. It separates stocks based on their 1-year price performance.
Dividend refers to the Bloomberg US Pure Dividend Yield Portfolio, which represents the return of Dividend Yield factor defined by Bloomberg PORT. It is a distinct dimension of value.
Volatility refers to the Bloomberg US Pure Volatility Portfolio, which represents the return of Volatility factor defined by Bloomberg PORT. It differentiates more volatile stocks and less volatile ones.
Size refers to the Bloomberg US Pure Size Portfolio, which represents the return of Size factor defined by Bloomberg PORT. It is a metric distinguishing between large and small stocks.
Value refers to the Bloomberg US Pure Value Portfolio, which represents the return of Value factor defined by Bloomberg PORT. It aims to differentiate “rish” & “cheap” stocks.
Investments cannot be made in an index. Unmanaged index returns do not reflect any fees, expenses, or sales charges. Past performance is no guarantee of future results.
824-INN-08/02/2021
9140-NLD-7/30/2021
5
| ACCLIVITY MID CAP MULTI-STYLE FUND |
| PORTFOLIO REVIEW (Unaudited) |
| June 30, 2021 |
The Fund’s performance figures* for the periods ended June 30, 2021, compared to its benchmark:
| Since Inception | |||
| Six Months | One Year | (12/31/19) | |
| Acclivity Mid Cap Multi-Style Fund - Class I | 16.30% | 51.95% | 18.15% |
| Acclivity Mid Cap Multi-Style Fund - Class N | 16.30% | 51.95% | 18.15% |
| Russell Mid-Cap Total Return Index** | 16.25% | 49.80% | 22.85% |
| S&P 500 Total Return Index*** | 15.25% | 40.79% | 23.05% |
| * | The performance data quoted here represents past performance. The performance comparison includes reinvestment of all dividends and capital gain distributions, if any. Current performance may be lower or higher than the performance data quoted above. Past performance is no guarantee of future results. The investment return and principal value of an investment will fluctuate so that investor’s shares, when redeemed, may be worth more or less than their original cost. The returns shown do not reflect the deduction of taxes that a shareholder would pay on Fund distributions or on the redemption of Fund shares. The Fund’s total annual operating expenses are 97.50% for Class I shares and 97.75% for Class N shares per the May 1, 2021, prospectus. After fee waivers, the Fund’s total annual operating expenses are 0.49% for Class I shares and 0.74% for Class N shares. For performance information current to the most recent month-end, please call toll-free 1-855-873-3837 (1-855-USE-ETFS). |
| ** | The Russell Mid-Cap Total Return Index measures the performance of the smallest 800 companies in the Russell 1000 index. Investors cannot invest directly in an index. |
| *** | The S&P 500 Total Return Index is a widely accepted, unmanaged index of U.S. stock market performance which does not take into account charges, fees and other expenses. Investors cannot invest directly in an index. |
| Holdings By Asset Class as of June 30, 2021 | % of Net Assets | |||
| Insurance | 8.7 | % | ||
| Money Market Fund | 6.5 | % | ||
| Retail - Discretionary | 5.5 | % | ||
| Banking | 5.2 | % | ||
| Software | 4.0 | % | ||
| Semiconductors | 3.6 | % | ||
| Health Care Facilities & Services | 3.5 | % | ||
| Chemicals | 3.2 | % | ||
| Machinery | 3.2 | % | ||
| Other | 61.0 | % | ||
| Liabilities in Excess of Other Assets | (4.4 | )% | ||
| 100.0 | % | |||
Please refer to the Schedule of Investments in this semi-annual report for a detailed analysis of the Fund’s holdings.
6
| ACCLIVITY SMALL CAP VALUE FUND |
| PORTFOLIO REVIEW (Unaudited) |
| June 30, 2021 |
The Fund’s performance figures* for the periods ended June 30, 2021, compared to its benchmark:
| Since Inception | |||
| Six Months | One Year | (12/31/18) | |
| Acclivity Small Cap Value Fund - Class I | 31.23% | 82.33% | 22.84% |
| Acclivity Small Cap Value Fund - Class N | 31.04% | 81.97% | 22.69% |
| Russell 2000® Value Total Return Index** | 26.69% | 73.28% | 21.40% |
| S&P 500 Total Return Index*** | 15.25% | 40.79% | 26.39% |
| * | The performance data quoted here represents past performance. The performance comparison includes reinvestment of all dividends and capital gain distributions, if any. Current performance may be lower or higher than the performance data quoted above. Past performance is no guarantee of future results. The investment return and principal value of an investment will fluctuate so that investor’s shares, when redeemed, may be worth more or less than their original cost. The returns shown do not reflect the deduction of taxes that a shareholder would pay on Fund distributions or on the redemption of Fund shares. The Fund’s total annual operating expenses are 5.63% for Class I shares and 5.88% for Class N shares per the May 1, 2021 prospectus. After fee waivers, the Fund’s total annual operating expenses are 0.54% for Class I shares and 0.79% for Class N shares. For performance information current to the most recent month-end, please call toll-free 1-855-873-3837 (1-855-USE-ETFS). |
| ** | The Russell 2000® Value Total Return Index measures the performance of the largest 2,000 U.S. companies determined by total market capitalization. Investors cannot invest directly in an index. |
| *** | The S&P 500 Total Return Index is a widely accepted, unmanaged index of U.S. stock market performance which does not take into account charges, fees and other expenses. Investors cannot invest directly in an index. |
| Holdings By Asset Class as of June 30, 2021 | % of Net Assets | |||
| Banking | 21.8 | % | ||
| Retail - Discretionary | 7.6 | % | ||
| Technology Hardware | 5.9 | % | ||
| Oil & Gas Producers | 5.3 | % | ||
| Specialty Finance | 5.2 | % | ||
| Insurance | 4.8 | % | ||
| Chemicals | 2.8 | % | ||
| Money Market Fund | 2.7 | % | ||
| Machinery | 2.4 | % | ||
| Other | 43.2 | % | ||
| Liabilities in Excess of Other Assets | (1.7 | )% | ||
| 100.0 | % | |||
Please refer to the Schedule of Investments in this semi-annual report for a detailed analysis of the Fund’s holdings.
7
| ACCLIVITY MID CAP MULTI-STYLE FUND |
| SCHEDULE OF INVESTMENTS |
| June 30, 2021 (Unaudited) |
| Shares | Value | |||||||
| COMMON STOCKS — 97.5% | ||||||||
| ADVERTISING & MARKETING - 1.6% | ||||||||
| 39 | Interpublic Group of Companies, Inc. (The) | $ | 1,267 | |||||
| 10 | Omnicom Group, Inc. | 800 | ||||||
| 30 | Trade Desk, Inc. (The), Class A(a) | 2,321 | ||||||
| 4,388 | ||||||||
| AEROSPACE & DEFENSE - 1.7% | ||||||||
| 36 | Howmet Aerospace, Inc.(a) | 1,241 | ||||||
| 5 | Huntington Ingalls Industries, Inc. | 1,054 | ||||||
| 2 | Teledyne Technologies, Inc.(a) | 838 | ||||||
| 15 | Textron, Inc. | 1,031 | ||||||
| 4 | Woodward, Inc. | 491 | ||||||
| 4,655 | ||||||||
| APPAREL & TEXTILE PRODUCTS - 1.6% | ||||||||
| 4 | Crocs, Inc.(a) | 466 | ||||||
| 1 | Deckers Outdoor Corporation(a) | 384 | ||||||
| 27 | Hanesbrands, Inc. | 504 | ||||||
| 6 | PVH Corporation(a) | 646 | ||||||
| 6 | Ralph Lauren Corporation | 707 | ||||||
| 10 | Skechers USA, Inc., Class A(a) | 498 | ||||||
| 28 | Tapestry, Inc.(a) | 1,217 | ||||||
| 4,422 | ||||||||
| ASSET MANAGEMENT - 2.8% | ||||||||
| 20 | Apollo Global Management, Inc. | 1,244 | ||||||
| 42 | Carlyle Group, Inc. (The) | 1,952 | ||||||
| 40 | Franklin Resources, Inc. | 1,280 | ||||||
| 7 | LPL Financial Holdings, Inc. | 945 | ||||||
| 13 | Raymond James Financial, Inc. | 1,689 | ||||||
| 11 | Stifel Financial Corporation | 713 | ||||||
| 7,823 | ||||||||
| AUTOMOTIVE - 1.5% | ||||||||
| 9 | Autoliv, Inc. | 880 | ||||||
| 22 | BorgWarner, Inc. | 1,068 | ||||||
| 18 | Gentex Corporation | 596 | ||||||
| 16 | Harley-Davidson, Inc. | 733 | ||||||
See accompanying notes to financial statements.
8
| ACCLIVITY MID CAP MULTI-STYLE FUND |
| SCHEDULE OF INVESTMENTS (Continued) |
| June 30, 2021 (Unaudited) |
| Shares | Value | |||||||
| COMMON STOCKS — 97.5% (Continued) | ||||||||
| AUTOMOTIVE - 1.5% (Continued) | ||||||||
| 5 | Lear Corporation | $ | 876 | |||||
| 4,153 | ||||||||
| BANKING - 5.2% | ||||||||
| 1 | CIT Group, Inc. | 52 | ||||||
| 24 | Citizens Financial Group, Inc. | 1,101 | ||||||
| 14 | Comerica, Inc. | 999 | ||||||
| 6 | Cullen/Frost Bankers, Inc. | 672 | ||||||
| 11 | East West Bancorp, Inc. | 789 | ||||||
| 139 | Huntington Bancshares, Inc. | 1,983 | ||||||
| 59 | KeyCorp | 1,218 | ||||||
| 7 | M&T Bank Corporation | 1,017 | ||||||
| 36 | People’s United Financial, Inc. | 617 | ||||||
| 7 | Pinnacle Financial Partners, Inc. | 618 | ||||||
| 8 | Prosperity Bancshares, Inc. | 574 | ||||||
| 57 | Regions Financial Corporation | 1,150 | ||||||
| 3 | SVB Financial Group(a) | 1,669 | ||||||
| 12 | Synovus Financial Corporation | 527 | ||||||
| 8 | Western Alliance Bancorp | 743 | ||||||
| 16 | Zions Bancorp NA | 846 | ||||||
| 14,575 | ||||||||
| BEVERAGES - 0.6% | ||||||||
| 1 | Boston Beer Company, Inc. (The), Class A(a) | 1,021 | ||||||
| 14 | Molson Coors Beverage Company, Class B(a) | 751 | ||||||
| 1,772 | ||||||||
| BIOTECH & PHARMA - 2.6% | ||||||||
| 7 | ACADIA Pharmaceuticals, Inc.(a) | 171 | ||||||
| 3 | Acceleron Pharma, Inc.(a) | 376 | ||||||
| 2 | Amicus Therapeutics, Inc.(a) | 19 | ||||||
| 4 | BioMarin Pharmaceutical, Inc.(a) | 334 | ||||||
| 4 | Blueprint Medicines Corporation(a) | 352 | ||||||
| 11 | Denali Therapeutics, Inc.(a) | 863 | ||||||
| 4 | Emergent BioSolutions, Inc.(a) | 252 | ||||||
| 29 | Exelixis, Inc.(a) | 528 | ||||||
| 11 | Halozyme Therapeutics, Inc.(a) | 500 | ||||||
See accompanying notes to financial statements.
9
| ACCLIVITY MID CAP MULTI-STYLE FUND |
| SCHEDULE OF INVESTMENTS (Continued) |
| June 30, 2021 (Unaudited) |
| Shares | Value | |||||||
| COMMON STOCKS — 97.5% (Continued) | ||||||||
| BIOTECH & PHARMA - 2.6% (Continued) | ||||||||
| 8 | Ionis Pharmaceuticals, Inc.(a) | $ | 319 | |||||
| 1 | Iovance Biotherapeutics, Inc.(a) | 26 | ||||||
| 2 | Mirati Therapeutics, Inc.(a) | 323 | ||||||
| 7 | Neurocrine Biosciences, Inc.(a) | 681 | ||||||
| 4 | Novavax, Inc., Class A(a) | 849 | ||||||
| 5 | Sarepta Therapeutics, Inc.(a) | 389 | ||||||
| 2 | TG Therapeutics, Inc.(a) | 78 | ||||||
| 3 | Ultragenyx Pharmaceutical, Inc.(a) | 286 | ||||||
| 5 | United Therapeutics Corporation(a) | 897 | ||||||
| 7,243 | ||||||||
| CHEMICALS - 3.2% | ||||||||
| 2 | Albemarle Corporation | 337 | ||||||
| 5 | Ashland Global Holdings, Inc. | 438 | ||||||
| 4 | Avery Dennison Corporation | 841 | ||||||
| 4 | Celanese Corporation | 606 | ||||||
| 12 | CF Industries Holdings, Inc. | 618 | ||||||
| 9 | Eastman Chemical Company | 1,051 | ||||||
| 11 | FMC Corporation | 1,190 | ||||||
| 18 | Huntsman Corporation | 477 | ||||||
| 5 | International Flavors & Fragrances, Inc. | 747 | ||||||
| 30 | Mosaic Company (The) | 957 | ||||||
| 15 | Olin Corporation | 694 | ||||||
| 12 | RPM International, Inc. | 1,064 | ||||||
| 1 | W R Grace & Company | 69 | ||||||
| 9,089 | ||||||||
| COMMERCIAL SUPPORT SERVICES - 1.0% | ||||||||
| 13 | Aramark | 484 | ||||||
| 5 | ManpowerGroup, Inc. | 595 | ||||||
| 17 | R1 RCM, Inc.(a) | 378 | ||||||
| 7 | Robert Half International, Inc. | 623 | ||||||
| 6 | Stericycle, Inc.(a) | 429 | ||||||
| 9 | Terminix Global Holdings, Inc.(a) | 429 | ||||||
| 2,938 | ||||||||
See accompanying notes to financial statements.
10
| ACCLIVITY MID CAP MULTI-STYLE FUND |
| SCHEDULE OF INVESTMENTS (Continued) |
| June 30, 2021 (Unaudited) |
| Shares | Value | |||||||
| COMMON STOCKS — 97.5% (Continued) | ||||||||
| CONSTRUCTION MATERIALS - 1.6% | ||||||||
| 6 | Advanced Drainage Systems, Inc. | $ | 700 | |||||
| 5 | Carlisle Companies, Inc. | 957 | ||||||
| 4 | Martin Marietta Materials, Inc. | 1,407 | ||||||
| 17 | MDU Resources Group, Inc. | 533 | ||||||
| 8 | Owens Corning | 783 | ||||||
| 4,380 | ||||||||
| CONSUMER SERVICES - 0.6% | ||||||||
| 1 | Bright Horizons Family Solutions, Inc.(a) | 147 | ||||||
| 7 | Chegg, Inc.(a) | 582 | ||||||
| 18 | Service Corp International | 964 | ||||||
| 1,693 | ||||||||
| CONTAINERS & PACKAGING - 1.8% | ||||||||
| 4 | AptarGroup, Inc. | 563 | ||||||
| 12 | Crown Holdings, Inc. | 1,227 | ||||||
| 1 | Graphic Packaging Holding Company | 18 | ||||||
| 7 | Packaging Corp of America | 948 | ||||||
| 13 | Sealed Air Corporation | 770 | ||||||
| 8 | Sonoco Products Company | 535 | ||||||
| 21 | Westrock Company | 1,118 | ||||||
| 5,179 | ||||||||
| DIVERSIFIED INDUSTRIALS - 0.2% | ||||||||
| 6 | ITT, Inc. | 549 | ||||||
| E-COMMERCE DISCRETIONARY - 0.3% | ||||||||
| 3 | Etsy, Inc.(a) | 617 | ||||||
| 2 | Stitch Fix, Inc., Class A(a) | 121 | ||||||
| 738 | ||||||||
| ELECTRIC UTILITIES - 2.6% | ||||||||
| 16 | Alliant Energy Corporation | 892 | ||||||
| 28 | Evergy, Inc. | 1,692 | ||||||
| 1 | Hawaiian Electric Industries, Inc. | 42 | ||||||
| 2 | IDACORP, Inc. | 195 | ||||||
| 4 | NextEra Energy Partners, L.P. | 305 | ||||||
| 25 | NRG Energy, Inc. | 1,008 | ||||||
See accompanying notes to financial statements.
11
| ACCLIVITY MID CAP MULTI-STYLE FUND |
| SCHEDULE OF INVESTMENTS (Continued) |
| June 30, 2021 (Unaudited) |
| Shares | Value | |||||||
| COMMON STOCKS — 97.5% (Continued) | ||||||||
| ELECTRIC UTILITIES - 2.6% (Continued) | ||||||||
| 25 | OGE Energy Corporation | $ | 841 | |||||
| 17 | Pinnacle West Capital Corporation | 1,394 | ||||||
| 1 | Portland General Electric Company | 46 | ||||||
| 43 | Vistra Corporation | 798 | ||||||
| 7,213 | ||||||||
| ELECTRICAL EQUIPMENT - 1.9% | ||||||||
| 11 | A O Smith Corporation | 793 | ||||||
| 2 | Acuity Brands, Inc. | 374 | ||||||
| 6 | BWX Technologies, Inc. | 349 | ||||||
| 6 | Cognex Corporation | 504 | ||||||
| 3 | Generac Holdings, Inc.(a) | 1,245 | ||||||
| 1 | Hubbell, Inc. | 187 | ||||||
| 1 | Lennox International, Inc. | 351 | ||||||
| 2 | Littelfuse, Inc. | 509 | ||||||
| 7 | National Instruments Corporation | 296 | ||||||
| 8 | Trimble, Inc.(a) | 655 | ||||||
| 5,263 | ||||||||
| ENGINEERING & CONSTRUCTION - 1.8% | ||||||||
| 9 | AECOM(a) | 570 | ||||||
| 4 | EMCOR Group, Inc. | 493 | ||||||
| 7 | Jacobs Engineering Group, Inc. | 934 | ||||||
| 8 | MasTec, Inc.(a) | 849 | ||||||
| 13 | Quanta Services, Inc. | 1,177 | ||||||
| 4 | Tetra Tech, Inc. | 488 | ||||||
| 17 | WillScot Mobile Mini Holdings Corporation(a) | 474 | ||||||
| 4,985 | ||||||||
| ENTERTAINMENT CONTENT - 0.3% | ||||||||
| 68 | Zynga, Inc., Class A(a) | 723 | ||||||
| FOOD - 1.9% | ||||||||
| 28 | Campbell Soup Company | 1,277 | ||||||
| 1 | Darling Ingredients, Inc.(a) | 67 | ||||||
| 6 | Ingredion, Inc. | 543 | ||||||
| 12 | J M Smucker Company (The) | 1,555 | ||||||
See accompanying notes to financial statements.
12
| ACCLIVITY MID CAP MULTI-STYLE FUND |
| SCHEDULE OF INVESTMENTS (Continued) |
| June 30, 2021 (Unaudited) |
| Shares | Value | |||||||
| COMMON STOCKS — 97.5% (Continued) | ||||||||
| FOOD - 1.9% (Continued) | ||||||||
| 12 | Lamb Weston Holdings, Inc. | $ | 968 | |||||
| 2 | Lancaster Colony Corporation | 387 | ||||||
| 5 | Post Holdings, Inc.(a) | 542 | ||||||
| 5,339 | ||||||||
| FORESTRY, PAPER & WOOD PRODUCTS - 0.5% | ||||||||
| 12 | Louisiana-Pacific Corporation | 724 | ||||||
| 7 | Trex Company, Inc.(a) | 715 | ||||||
| 1,439 | ||||||||
| GAS & WATER UTILITIES - 1.7% | ||||||||
| 15 | Atmos Energy Corporation | 1,442 | ||||||
| 18 | Essential Utilities, Inc. | 822 | ||||||
| 49 | NiSource, Inc. | 1,200 | ||||||
| 31 | UGI Corporation | 1,436 | ||||||
| 4,900 | ||||||||
| HEALTH CARE FACILITIES & SERVICES - 3.5% | ||||||||
| 2 | Amedisys, Inc.(a) | 490 | ||||||
| 16 | Cardinal Health, Inc. | 913 | ||||||
| 1 | Charles River Laboratories International, Inc.(a) | 370 | ||||||
| 1 | Chemed Corporation | 475 | ||||||
| 11 | DaVita, Inc.(a) | 1,325 | ||||||
| 5 | Encompass Health Corporation | 390 | ||||||
| 5 | HealthEquity, Inc.(a) | 402 | ||||||
| 13 | Henry Schein, Inc.(a) | 965 | ||||||
| 12 | Invitae Corporation(a) | 405 | ||||||
| 2 | LHC Group, Inc.(a) | 401 | ||||||
| 3 | Molina Healthcare, Inc.(a) | 759 | ||||||
| 2 | NeoGenomics, Inc.(a) | 90 | ||||||
| 2 | PRA Health Sciences, Inc.(a) | 330 | ||||||
| 5 | Syneos Health, Inc.(a) | 448 | ||||||
| 1 | Teladoc Health, Inc.(a) | 166 | ||||||
| 12 | Universal Health Services, Inc., Class B | 1,757 | ||||||
| 9,686 | ||||||||
| HOME & OFFICE PRODUCTS - 1.7% | ||||||||
| 13 | Leggett & Platt, Inc. | 673 | ||||||
See accompanying notes to financial statements.
13
| ACCLIVITY MID CAP MULTI-STYLE FUND |
| SCHEDULE OF INVESTMENTS (Continued) |
| June 30, 2021 (Unaudited) |
| Shares | Value | |||||||
| COMMON STOCKS — 97.5% (Continued) | ||||||||
| HOME & OFFICE PRODUCTS - 1.7% (Continued) | ||||||||
| 25 | Newell Brands, Inc. | $ | 687 | |||||
| 5 | Scotts Miracle-Gro Company (The) | 960 | ||||||
| 17 | Tempur Sealy International, Inc. | 666 | ||||||
| 8 | Whirlpool Corporation | 1,744 | ||||||
| 4,730 | ||||||||
| HOME CONSTRUCTION - 1.9% | ||||||||
| 10 | Fortune Brands Home & Security, Inc. | 996 | ||||||
| 20 | Masco Corporation | 1,178 | ||||||
| 5 | Mohawk Industries, Inc.(a) | 961 | ||||||
| 26 | PulteGroup, Inc. | 1,419 | ||||||
| 13 | Toll Brothers, Inc. | 752 | ||||||
| 5,306 | ||||||||
| INDUSTRIAL INTERMEDIATE PRODUCTS - 0.2% | ||||||||
| 6 | Timken Company (The) | 484 | ||||||
| INDUSTRIAL SUPPORT SERVICES - 1.3% | ||||||||
| 2 | AMERCO | 1,179 | ||||||
| 3 | SiteOne Landscape Supply, Inc.(a) | 508 | ||||||
| 4 | United Rentals, Inc.(a) | 1,276 | ||||||
| 2 | Watsco, Inc. | 573 | ||||||
| 3,536 | ||||||||
| INSTITUTIONAL FINANCIAL SERVICES - 0.6% | ||||||||
| 28 | Jefferies Financial Group, Inc. | 957 | ||||||
| 12 | SEI Investments Company | 744 | ||||||
| 1,701 | ||||||||
| INSURANCE - 8.7% | ||||||||
| 2 | Alleghany Corporation(a) | 1,334 | ||||||
| 11 | American Financial Group, Inc. | 1,372 | ||||||
| 9 | Assurant, Inc. | 1,406 | ||||||
| 16 | Cincinnati Financial Corporation | 1,866 | ||||||
| 14 | Globe Life, Inc. | 1,334 | ||||||
| 33 | Hartford Financial Services Group, Inc. (The) | 2,045 | ||||||
| 9 | Kemper Corporation | 665 | ||||||
| 26 | Lincoln National Corporation | 1,634 | ||||||
See accompanying notes to financial statements.
14
| ACCLIVITY MID CAP MULTI-STYLE FUND |
| SCHEDULE OF INVESTMENTS (Continued) |
| June 30, 2021 (Unaudited) |
| Shares | Value | |||||||
| COMMON STOCKS — 97.5% (Continued) | ||||||||
| INSURANCE - 8.7% (Continued) | ||||||||
| 29 | Loews Corporation | $ | 1,585 | |||||
| 2 | Markel Corporation(a) | 2,373 | ||||||
| 52 | Old Republic International Corporation | 1,295 | ||||||
| 5 | Primerica, Inc. | 766 | ||||||
| 19 | Principal Financial Group, Inc. | 1,201 | ||||||
| 1 | Radian Group, Inc. | 22 | ||||||
| 12 | Reinsurance Group of America, Inc. | 1,368 | ||||||
| 31 | Unum Group | 880 | ||||||
| 20 | Voya Financial, Inc. | 1,230 | ||||||
| 26 | W R Berkley Corporation | 1,935 | ||||||
| 24,311 | ||||||||
| INTERNET MEDIA & SERVICES - 1.5% | ||||||||
| 16 | Expedia Group, Inc.(a) | 2,619 | ||||||
| 16 | GoDaddy, Inc., Class A(a) | 1,391 | ||||||
| 13 | Just Eat Takeaway.com N.V. - ADR(a) | 238 | ||||||
| 1 | TripAdvisor, Inc.(a) | 40 | ||||||
| 4,288 | ||||||||
| LEISURE FACILITIES & SERVICES - 1.6% | ||||||||
| 9 | Boyd Gaming Corporation(a) | 553 | ||||||
| 4 | Choice Hotels International, Inc. | 475 | ||||||
| 2 | Churchill Downs, Inc. | 397 | ||||||
| 6 | Darden Restaurants, Inc. | 876 | ||||||
| 10 | Penn National Gaming, Inc.(a) | 765 | ||||||
| 5 | Texas Roadhouse, Inc. | 481 | ||||||
| 3 | Vail Resorts, Inc.(a) | 950 | ||||||
| 4,497 | ||||||||
| LEISURE PRODUCTS - 1.6% | ||||||||
| 8 | Brunswick Corporation | 797 | ||||||
| 3 | Fox Factory Holding Corporation(a) | 467 | ||||||
| 15 | Hasbro, Inc. | 1,418 | ||||||
| 31 | Mattel, Inc.(a) | 623 | ||||||
| 6 | Polaris, Inc. | 822 | ||||||
| 4 | Thor Industries, Inc. | 452 | ||||||
| 4,579 | ||||||||
See accompanying notes to financial statements.
15
| ACCLIVITY MID CAP MULTI-STYLE FUND |
| SCHEDULE OF INVESTMENTS (Continued) |
| June 30, 2021 (Unaudited) |
| Shares | Value | |||||||
| COMMON STOCKS — 97.5% (Continued) | ||||||||
| MACHINERY - 3.2% | ||||||||
| 7 | AGCO Corporation | $ | 913 | |||||
| 4 | Crane Company | 369 | ||||||
| 1 | Curtiss-Wright Corporation | 119 | ||||||
| 9 | Donaldson Company, Inc. | 572 | ||||||
| 9 | Flowserve Corporation | 363 | ||||||
| 8 | Graco, Inc. | 606 | ||||||
| 3 | IDEX Corporation | 660 | ||||||
| 4 | Lincoln Electric Holdings, Inc. | 527 | ||||||
| 4 | Middleby Corporation (The)(a) | 693 | ||||||
| 3 | MSA Safety, Inc. | 497 | ||||||
| 4 | Nordson Corporation | 878 | ||||||
| 4 | Oshkosh Corporation | 498 | ||||||
| 6 | Snap-on, Inc. | 1,340 | ||||||
| 8 | Toro Company (The) | 879 | ||||||
| 8,914 | ||||||||
| MEDICAL EQUIPMENT & DEVICES - 2.7% | ||||||||
| 1 | ABIOMED, Inc.(a) | 312 | ||||||
| 2 | Bio-Techne Corporation | 901 | ||||||
| 3 | Bruker Corporation | 228 | ||||||
| 15 | DENTSPLY SIRONA, Inc. | 949 | ||||||
| 7 | Globus Medical, Inc., Class A(a) | 543 | ||||||
| 2 | Haemonetics Corporation(a) | 133 | ||||||
| 5 | Hill-Rom Holdings, Inc. | 568 | ||||||
| 3 | Insulet Corporation(a) | 824 | ||||||
| 5 | Integra LifeSciences Holdings Corporation(a) | 341 | ||||||
| 1 | iRhythm Technologies, Inc.(a) | 66 | ||||||
| 2 | Masimo Corporation(a) | 485 | ||||||
| 1 | Nevro Corporation(a) | 166 | ||||||
| 1 | Penumbra, Inc.(a) | 274 | ||||||
| 3 | PerkinElmer, Inc. | 463 | ||||||
| 3 | Quidel Corporation(a) | 384 | ||||||
| 3 | Repligen Corporation(a) | 599 | ||||||
| 2 | STAAR Surgical Company(a) | 305 | ||||||
| 7,541 | ||||||||
See accompanying notes to financial statements.
16
| ACCLIVITY MID CAP MULTI-STYLE FUND |
| SCHEDULE OF INVESTMENTS (Continued) |
| June 30, 2021 (Unaudited) |
| Shares | Value | |||||||
| COMMON STOCKS — 97.5% (Continued) | ||||||||
| METALS & MINING - 0.7% | ||||||||
| 22 | Alcoa Corporation(a) | $ | 810 | |||||
| 25 | Cleveland-Cliffs, Inc.(a) | 539 | ||||||
| 5 | Royal Gold, Inc. | 571 | ||||||
| 1,920 | ||||||||
| OIL & GAS PRODUCERS - 1.9% | ||||||||
| 35 | Cabot Oil & Gas Corporation | 611 | ||||||
| 11 | Cimarex Energy Company | 797 | ||||||
| 16 | ConocoPhillips | 974 | ||||||
| 11 | Diamondback Energy, Inc. | 1,033 | ||||||
| 5 | HollyFrontier Corporation | 165 | ||||||
| 62 | Marathon Oil Corporation | 844 | ||||||
| 18 | Targa Resources Corporation | 800 | ||||||
| 5,224 | ||||||||
| OIL & GAS SERVICES & EQUIPMENT - 0.5% | ||||||||
| 44 | Halliburton Company | 1,017 | ||||||
| 27 | NOV, Inc.(a) | 414 | ||||||
| 1,431 | ||||||||
| PUBLISHING & BROADCASTING - 1.1% | ||||||||
| 17 | Liberty Media Corp-Liberty Formula One - Series C(a) | 819 | ||||||
| 18 | Liberty Media Corp-Liberty SiriusXM, Class C(a) | 835 | ||||||
| 9 | New York Times Company (The), Class A | 392 | ||||||
| 41 | News Corporation, Class A | 1,057 | ||||||
| 3,103 | ||||||||
| REAL ESTATE SERVICES - 0.5% | ||||||||
| 6 | Jones Lang LaSalle, Inc.(a) | 1,173 | ||||||
| 4 | Redfin Corporation(a) | 253 | ||||||
| 1,426 | ||||||||
| REIT - 0.6% | ||||||||
| 1 | Texas Pacific Land Corporation | 1,600 | ||||||
| RENEWABLE ENERGY - 0.8% | ||||||||
| 5 | Enphase Energy, Inc.(a) | 918 | ||||||
| 7 | First Solar, Inc.(a) | 633 | ||||||
See accompanying notes to financial statements.
17
| ACCLIVITY MID CAP MULTI-STYLE FUND |
| SCHEDULE OF INVESTMENTS (Continued) |
| June 30, 2021 (Unaudited) |
| Shares | Value | |||||||
| COMMON STOCKS — 97.5% (Continued) | ||||||||
| RENEWABLE ENERGY - 0.8% (Continued) | ||||||||
| 2 | SolarEdge Technologies, Inc.(a) | $ | 553 | |||||
| 2,104 | ||||||||
| RETAIL - CONSUMER STAPLES - 0.6% | ||||||||
| 3 | Casey’s General Stores, Inc. | 584 | ||||||
| 4 | Five Below, Inc.(a) | 773 | ||||||
| 5 | Ollie’s Bargain Outlet Holdings, Inc.(a) | 421 | ||||||
| 1,778 | ||||||||
| RETAIL - DISCRETIONARY - 5.5% | ||||||||
| 6 | Advance Auto Parts, Inc. | 1,231 | ||||||
| 9 | AutoNation, Inc.(a) | 853 | ||||||
| 17 | Builders FirstSource, Inc.(a) | 725 | ||||||
| 3 | Burlington Stores, Inc.(a) | 966 | ||||||
| 12 | Dick’s Sporting Goods, Inc. | 1,202 | ||||||
| 8 | Floor & Decor Holdings, Inc., Class A(a) | 846 | ||||||
| 11 | Foot Locker, Inc. | 678 | ||||||
| 44 | Gap, Inc. (The) | 1,481 | ||||||
| 7 | Genuine Parts Company | 885 | ||||||
| 18 | Kohl’s Corporation | 992 | ||||||
| 3 | Lithia Motors, Inc., Class A | 1,031 | ||||||
| 3 | Nordstrom, Inc.(a) | 110 | ||||||
| 2 | RH(a) | 1,358 | ||||||
| 6 | Tractor Supply Company | 1,116 | ||||||
| 2 | Ulta Beauty, Inc.(a) | 691 | ||||||
| 7 | Williams-Sonoma, Inc. | 1,118 | ||||||
| 15,283 | ||||||||
| SEMICONDUCTORS - 3.6% | ||||||||
| 4 | Brooks Automation, Inc. | 381 | ||||||
| 1 | Cirrus Logic, Inc.(a) | 85 | ||||||
| 5 | Cree, Inc.(a) | 490 | ||||||
| 9 | Entegris, Inc. | 1,107 | ||||||
| 9 | II-VI, Inc.(a) | 653 | ||||||
| 3 | IPG Photonics Corporation(a) | 632 | ||||||
| 9 | Lattice Semiconductor Corporation(a) | 506 | ||||||
| 9 | Marvell Technology, Inc. | 525 | ||||||
See accompanying notes to financial statements.
18
| ACCLIVITY MID CAP MULTI-STYLE FUND |
| SCHEDULE OF INVESTMENTS (Continued) |
| June 30, 2021 (Unaudited) |
| Shares | Value | |||||||
| COMMON STOCKS — 97.5% (Continued) | ||||||||
| SEMICONDUCTORS - 3.6% (Continued) | ||||||||
| 4 | MKS Instruments, Inc. | $ | 712 | |||||
| 1 | Monolithic Power Systems, Inc. | 373 | ||||||
| 24 | ON Semiconductor Corporation(a) | 919 | ||||||
| 6 | Qorvo, Inc.(a) | 1,174 | ||||||
| 3 | Silicon Laboratories, Inc.(a) | 460 | ||||||
| 11 | Teradyne, Inc. | 1,473 | ||||||
| 3 | Universal Display Corporation | 667 | ||||||
| 10,157 | ||||||||
| SOFTWARE - 4.0% | ||||||||
| 1 | ACI Worldwide, Inc.(a) | 37 | ||||||
| 1 | Alteryx, Inc., Class A(a) | 86 | ||||||
| 6 | Aspen Technology, Inc.(a) | 825 | ||||||
| 11 | Black Knight, Inc.(a) | 858 | ||||||
| 4 | Cloudera, Inc.(a) | 63 | ||||||
| 4 | Concentrix Corporation(a) | 643 | ||||||
| 7 | Digital Turbine, Inc.(a) | 532 | ||||||
| 3 | Five9, Inc.(a) | 550 | ||||||
| 4 | Guidewire Software, Inc.(a) | 451 | ||||||
| 3 | J2 Global, Inc.(a) | 413 | ||||||
| 6 | Manhattan Associates, Inc.(a) | 869 | ||||||
| 1 | MicroStrategy, Inc., Class A(a) | 665 | ||||||
| 8 | NortonLifeLock, Inc. | 218 | ||||||
| 19 | Nuance Communications, Inc.(a) | 1,034 | ||||||
| 2 | Omnicell, Inc.(a) | 303 | ||||||
| 3 | Paylocity Holding Corporation(a) | 572 | ||||||
| 5 | Pegasystems, Inc. | 696 | ||||||
| 4 | Proofpoint, Inc.(a) | 695 | ||||||
| 3 | PTC, Inc.(a) | 424 | ||||||
| 4 | Varonis Systems, Inc.(a) | 231 | ||||||
| 5 | Workiva, Inc.(a) | 557 | ||||||
| 4 | Zendesk, Inc.(a) | 577 | ||||||
| 11,299 | ||||||||
| SPECIALTY FINANCE - 2.7% | ||||||||
| 47 | Fidelity National Financial, Inc. | 2,043 | ||||||
See accompanying notes to financial statements.
19
| ACCLIVITY MID CAP MULTI-STYLE FUND |
| SCHEDULE OF INVESTMENTS (Continued) |
| June 30, 2021 (Unaudited) |
| Shares | Value | |||||||
| COMMON STOCKS — 97.5% (Continued) | ||||||||
| SPECIALTY FINANCE - 2.7% (Continued) | ||||||||
| 22 | First American Financial Corporation | $ | 1,372 | |||||
| 3 | MGIC Investment Corporation | 41 | ||||||
| 40 | SLM Corporation | 837 | ||||||
| 69 | Synchrony Financial | 3,348 | ||||||
| 7,641 | ||||||||
| STEEL - 0.5% | ||||||||
| 4 | Reliance Steel & Aluminum Company | 604 | ||||||
| 14 | Steel Dynamics, Inc. | 834 | ||||||
| 1,438 | ||||||||
| TECHNOLOGY HARDWARE - 3.0% | ||||||||
| 8 | Arrow Electronics, Inc.(a) | 911 | ||||||
| 15 | Ciena Corporation(a) | 853 | ||||||
| 9 | Dolby Laboratories, Inc., Class A | 885 | ||||||
| 4 | F5 Networks, Inc.(a) | 747 | ||||||
| 13 | Jabil, Inc. | 755 | ||||||
| 41 | Juniper Networks, Inc. | 1,121 | ||||||
| 7 | Lumentum Holdings, Inc.(a) | 574 | ||||||
| 8 | NetApp, Inc. | 655 | ||||||
| 8 | Pure Storage, Inc., Class A(a) | 156 | ||||||
| 1 | SYNNEX Corporation | 122 | ||||||
| 1 | ViaSat, Inc.(a) | 50 | ||||||
| 21 | Western Digital Corporation(a) | 1,495 | ||||||
| 7 | Xerox Holdings Corporation | 164 | ||||||
| 8,488 | ||||||||
| TECHNOLOGY SERVICES - 2.3% | ||||||||
| 5 | Booz Allen Hamilton Holding Corporation | 426 | ||||||
| 18 | DXC Technology Company(a) | 701 | ||||||
| 2 | Euronet Worldwide, Inc.(a) | 271 | ||||||
| 3 | FactSet Research Systems, Inc. | 1,007 | ||||||
| 5 | Gartner, Inc.(a) | 1,211 | ||||||
| 4 | Jack Henry & Associates, Inc. | 654 | ||||||
| 6 | Leidos Holdings, Inc. | 606 | ||||||
| 1 | LiveRamp Holdings, Inc.(a) | 47 | ||||||
| 5 | MAXIMUS, Inc. | 440 | ||||||
See accompanying notes to financial statements.
20
| ACCLIVITY MID CAP MULTI-STYLE FUND |
| SCHEDULE OF INVESTMENTS (Continued) |
| June 30, 2021 (Unaudited) |
| Shares | Value | |||||||
| COMMON STOCKS — 97.5% (Continued) | ||||||||
| TECHNOLOGY SERVICES - 2.3% (Continued) | ||||||||
| 30 | Western Union Company (The) | $ | 689 | |||||
| 2 | WEX, Inc.(a) | 388 | ||||||
| 6,440 | ||||||||
| TELECOMMUNICATIONS - 0.1% | ||||||||
| 8 | Iridium Communications, Inc.(a) | 320 | ||||||
| TRANSPORTATION & LOGISTICS - 1.8% | ||||||||
| 8 | Alaska Air Group, Inc.(a) | 482 | ||||||
| 12 | CH Robinson Worldwide, Inc. | 1,124 | ||||||
| 3 | JB Hunt Transport Services, Inc. | 489 | ||||||
| 11 | JetBlue Airways Corporation(a) | 185 | ||||||
| 17 | Knight-Swift Transportation Holdings, Inc. | 773 | ||||||
| 3 | Landstar System, Inc. | 474 | ||||||
| 2 | Saia, Inc.(a) | 419 | ||||||
| 7 | XPO Logistics, Inc.(a) | 979 | ||||||
| 4,925 | ||||||||
| TRANSPORTATION EQUIPMENT - 0.5% | ||||||||
| 1 | Allison Transmission Holdings, Inc. | 40 | ||||||
| 15 | Westinghouse Air Brake Technologies Corporation | 1,234 | ||||||
| 1,274 | ||||||||
| WHOLESALE - CONSUMER STAPLES - 0.4% | ||||||||
| 15 | Performance Food Group Company(a) | 727 | ||||||
| 13 | US Foods Holding Corporation(a) | 499 | ||||||
| 1,226 | ||||||||
| WHOLESALE - DISCRETIONARY - 0.9% | ||||||||
| 25 | LKQ Corporation(a) | 1,230 | ||||||
| 3 | Pool Corporation | 1,376 | ||||||
| 2,606 | ||||||||
| TOTAL COMMON STOCKS (Cost $215,942) | 272,715 | |||||||
See accompanying notes to financial statements.
21
| ACCLIVITY MID CAP MULTI-STYLE FUND |
| SCHEDULE OF INVESTMENTS (Continued) |
| June 30, 2021 (Unaudited) |
| Shares | Value | |||||||
| PARTNERSHIP SHARES — 0.4% | ||||||||
| OIL & GAS PRODUCERS - 0.4% | ||||||||
| 25 | Magellan Midstream Partners, L.P. | $ | 1,223 | |||||
| TOTAL PARTNERSHIP SHARES (Cost $1,115) | 1,223 | |||||||
| MONEY MARKET FUNDS - 6.5% | ||||||||
| 18,306 | BlackRock Liquidity Funds T-Fund, Institutional Class, 0.01%(b) | 18,306 | ||||||
| TOTAL MONEY MARKET FUNDS (Cost $18,306) | 18,306 | |||||||
| TOTAL INVESTMENTS - 104.4% (Cost $235,363) | $ | 292,244 | ||||||
| LIABILITIES IN EXCESS OF OTHER ASSETS - (4.4)% | (12,399 | ) | ||||||
| NET ASSETS - 100.0% | $ | 279,845 | ||||||
ADR - American Depositary Receipt.
| (a) | Non-income producing security. |
| (b) | Rate disclosed is the seven day effective yield as of June 30, 2021. |
See accompanying notes to financial statements.
22
| ACCLIVITY SMALL CAP VALUE FUND |
| SCHEDULE OF INVESTMENTS |
| June 30, 2021 (Unaudited) |
| Shares | Value | |||||||
| COMMON STOCKS — 97.8% | ||||||||
| AEROSPACE & DEFENSE - 0.7% | ||||||||
| 205 | AAR Corporation(a) | $ | 7,944 | |||||
| 103 | Barnes Group, Inc. | 5,279 | ||||||
| 35 | Ducommun, Inc.(a) | 1,909 | ||||||
| 68 | Mercury Systems, Inc.(a) | 4,507 | ||||||
| 105 | Moog, Inc., Class A | 8,826 | ||||||
| 21 | National Presto Industries, Inc. | 2,135 | ||||||
| 71 | SIFCO Industries, Inc.(a) | 715 | ||||||
| 31,315 | ||||||||
| APPAREL & TEXTILE PRODUCTS - 0.6% | ||||||||
| 61 | Culp, Inc. | 994 | ||||||
| 124 | Fossil Group, Inc.(a) | 1,771 | ||||||
| 171 | Movado Group, Inc. | 5,381 | ||||||
| 110 | PVH Corporation(a) | 11,835 | ||||||
| 76 | Rocky Brands, Inc. | 4,226 | ||||||
| 149 | Tandy Leather Factory, Inc.(a) | 745 | ||||||
| 19 | Unifi, Inc.(a) | 463 | ||||||
| 22 | Weyco Group, Inc. | 492 | ||||||
| 25,907 | ||||||||
| ASSET MANAGEMENT - 0.6% | ||||||||
| 25 | Associated Capital Group, Inc., Class A | 972 | ||||||
| 330 | Boston Private Financial Holdings, Inc. | 4,867 | ||||||
| 151 | Community Bankers Trust Corporation | 1,712 | ||||||
| 138 | Entasis Therapeutics Holdings, Inc.(a) | 368 | ||||||
| 14 | First Western Financial, Inc.(a) | 362 | ||||||
| 62 | Hennessy Advisors, Inc. | 578 | ||||||
| 159 | ODP Corporation (The)(a) | 7,634 | ||||||
| 184 | Oppenheimer Holdings, Inc., Class A | 9,355 | ||||||
| 25,848 | ||||||||
| AUTOMOTIVE - 1.8% | ||||||||
| 411 | American Axle & Manufacturing Holdings, Inc.(a) | 4,254 | ||||||
| 665 | China Automotive Systems, Inc.(a) | 3,278 | ||||||
| 72 | Cooper-Standard Holdings, Inc.(a) | 2,088 | ||||||
| 578 | Dana, Inc. | 13,733 | ||||||
| 1,348 | Goodyear Tire & Rubber Company (The)(a) | 23,118 | ||||||
See accompanying notes to financial statements.
23
| ACCLIVITY SMALL CAP VALUE FUND |
| SCHEDULE OF INVESTMENTS (Continued) |
| June 30, 2021 (Unaudited) |
| Shares | Value | |||||||
| COMMON STOCKS — 97.8% (Continued) | ||||||||
| AUTOMOTIVE - 1.8% (Continued) | ||||||||
| 458 | Harley-Davidson, Inc. | $ | 20,986 | |||||
| 87 | Methode Electronics, Inc. | 4,281 | ||||||
| 34 | Miller Industries, Inc. | 1,341 | ||||||
| 339 | Modine Manufacturing Company(a) | 5,624 | ||||||
| 148 | Motorcar Parts of America, Inc.(a) | 3,321 | ||||||
| 85 | Unique Fabricating, Inc.(a) | 315 | ||||||
| 82,339 | ||||||||
| BANKING - 21.8% | ||||||||
| 80 | 1st Constitution Bancorp | 1,655 | ||||||
| 40 | ACNB Corporation | 1,116 | ||||||
| 67 | American National Bankshares, Inc. | 2,083 | ||||||
| 82 | American River Bankshares | 1,484 | ||||||
| 48 | Ames National Corporation | 1,176 | ||||||
| 478 | Associated Banc-Corporation | 9,789 | ||||||
| 311 | Atlantic Union Bankshares Corporation | 11,264 | ||||||
| 186 | Banc of California, Inc. | 3,262 | ||||||
| 263 | BancorpSouth Bank | 7,451 | ||||||
| 154 | Bank of Commerce Holdings | 2,313 | ||||||
| 12 | Bank of Princeton (The) | 344 | ||||||
| 61 | Bank OZK | 2,572 | ||||||
| 81 | BankFinancial Corporation | 927 | ||||||
| 219 | BankUnited, Inc. | 9,349 | ||||||
| 123 | Banner Corporation | 6,668 | ||||||
| 75 | Bar Harbor Bankshares | 2,146 | ||||||
| 81 | BayCom Corporation(a) | 1,454 | ||||||
| 182 | BCB Bancorp, Inc. | 2,448 | ||||||
| 272 | Berkshire Hills Bancorp, Inc. | 7,456 | ||||||
| 339 | BOK Financial Corporation | 29,357 | ||||||
| 242 | Brookline Bancorp, Inc. | 3,618 | ||||||
| 87 | Bryn Mawr Bank Corporation | 3,671 | ||||||
| 305 | Byline Bancorp, Inc. | 6,902 | ||||||
| 904 | Cadence BanCorporation | 18,876 | ||||||
| 88 | Camden National Corporation | 4,203 | ||||||
| 111 | Capstar Financial Holdings, Inc. | 2,275 | ||||||
See accompanying notes to financial statements.
24
| ACCLIVITY SMALL CAP VALUE FUND |
| SCHEDULE OF INVESTMENTS (Continued) |
| June 30, 2021 (Unaudited) |
| Shares | Value | |||||||
| COMMON STOCKS — 97.8% (Continued) | ||||||||
| BANKING - 21.8% (Continued) | ||||||||
| 49 | CB Financial Services, Inc. | $ | 1,085 | |||||
| 52 | CBM Bancorp, Inc. | 782 | ||||||
| 147 | Central Pacific Financial Corporation | 3,831 | ||||||
| 88 | Central Valley Community Bancorp | 1,773 | ||||||
| 44 | ChoiceOne Financial Services, Inc. | 1,066 | ||||||
| 664 | CIT Group, Inc. | 34,256 | ||||||
| 81 | Citizens & Northern Corporation | 1,984 | ||||||
| 117 | Citizens Community Bancorp, Inc. | 1,601 | ||||||
| 134 | Civista Bancshares, Inc. | 2,961 | ||||||
| 108 | CNB Financial Corp | 2,465 | ||||||
| 38 | Codorus Valley Bancorp, Inc. | 762 | ||||||
| 96 | Colony Bankcorp, Inc. | 1,715 | ||||||
| 28 | Community Financial Corporation (The) | 966 | ||||||
| 84 | Community Trust Bancorp, Inc. | 3,392 | ||||||
| 216 | ConnectOne Bancorp, Inc. | 5,653 | ||||||
| 56 | County Bancorp, Inc. | 1,902 | ||||||
| 310 | Customers Bancorp, Inc.(a) | 12,087 | ||||||
| 195 | Dime Community Bancshares, Inc. | 6,556 | ||||||
| 138 | Eagle Bancorp, Inc. | 7,739 | ||||||
| 103 | Enterprise Financial Services Corporation | 4,778 | ||||||
| 118 | Equity Bancshares, Inc., Class A(a) | 3,598 | ||||||
| 84 | ESSA Bancorp, Inc. | 1,377 | ||||||
| 53 | Farmers & Merchants Bancorp, Inc. | 1,156 | ||||||
| 180 | Financial Institutions, Inc. | 5,400 | ||||||
| 277 | First Bancorp | 11,332 | ||||||
| 99 | First Bancshares, Inc. (The) | 3,706 | ||||||
| 198 | First Bank | 2,681 | ||||||
| 211 | First Busey Corporation | 5,203 | ||||||
| 93 | First Business Financial Services, Inc. | 2,518 | ||||||
| 248 | First Commonwealth Financial Corporation | 3,489 | ||||||
| 91 | First Community Bankshares, Inc. | 2,716 | ||||||
| 432 | First Financial Bancorp | 10,208 | ||||||
| 81 | First Financial Corporation | 3,306 | ||||||
| 99 | First Financial Northwest, Inc. | 1,500 | ||||||
See accompanying notes to financial statements.
25
| ACCLIVITY SMALL CAP VALUE FUND |
| SCHEDULE OF INVESTMENTS (Continued) |
| June 30, 2021 (Unaudited) |
| Shares | Value | |||||||
| COMMON STOCKS — 97.8% (Continued) | ||||||||
| BANKING - 21.8% (Continued) | ||||||||
| 50 | First Guaranty Bancshares, Inc. | $ | 974 | |||||
| 234 | First Hawaiian, Inc. | 6,632 | ||||||
| 2,026 | First Horizon Corporation | 35,009 | ||||||
| 68 | First Internet Bancorp | 2,107 | ||||||
| 85 | First Mid Bancshares, Inc. | 3,443 | ||||||
| 590 | First Midwest Bancorp, Inc. | 11,700 | ||||||
| 90 | First Northwest Bancorp | 1,579 | ||||||
| 124 | First of Long Island Corporation (The) | 2,633 | ||||||
| 431 | Flagstar Bancorp, Inc. | 18,218 | ||||||
| 218 | Flushing Financial Corporation | 4,672 | ||||||
| 1,261 | FNB Corporation | 15,548 | ||||||
| 30 | FS Bancorp, Inc. | 2,138 | ||||||
| 894 | Fulton Financial Corporation | 14,107 | ||||||
| 188 | Great Western Bancorp, Inc. | 6,165 | ||||||
| 428 | Hancock Whitney Corporation | 19,020 | ||||||
| 259 | Hanmi Financial Corporation | 4,937 | ||||||
| 243 | HarborOne Bancorp, Inc. | 3,485 | ||||||
| 218 | Heartland Financial USA, Inc. | 10,244 | ||||||
| 296 | Heritage Commerce Corporation | 3,294 | ||||||
| 141 | Heritage Financial Corporation | 3,528 | ||||||
| 393 | Hilltop Holdings, Inc. | 14,305 | ||||||
| 57 | Home Bancorp, Inc. | 2,172 | ||||||
| 13 | HomeStreet, Inc. | 530 | ||||||
| 102 | HomeTrust Bancshares, Inc. | 2,846 | ||||||
| 522 | Hope Bancorp, Inc. | 7,402 | ||||||
| 174 | Horizon Bancorp, Inc. | 3,033 | ||||||
| 109 | Howard Bancorp, Inc.(a) | 1,758 | ||||||
| 1,591 | Huntington Bancshares, Inc. | 22,704 | ||||||
| 79 | Investar Holding Corporation | 1,808 | ||||||
| 678 | Investors Bancorp, Inc. | 9,668 | ||||||
| 375 | Kearny Financial Corporation | 4,481 | ||||||
| 266 | Lakeland Bancorp, Inc. | 4,650 | ||||||
| 115 | LCNB Corporation | 1,883 | ||||||
| 55 | Mackinac Financial Corporation | 1,087 | ||||||
See accompanying notes to financial statements.
26
| ACCLIVITY SMALL CAP VALUE FUND |
| SCHEDULE OF INVESTMENTS (Continued) |
| June 30, 2021 (Unaudited) |
| Shares | Value | |||||||
| COMMON STOCKS — 97.8% (Continued) | ||||||||
| BANKING - 21.8% (Continued) | ||||||||
| 56 | MainStreet Bancshares, Inc.(a) | $ | 1,264 | |||||
| 85 | Mercantile Bank Corporation | 2,567 | ||||||
| 164 | Meridian Bancorp, Inc. | 3,355 | ||||||
| 38 | Middlefield Banc Corporation | 897 | ||||||
| 209 | Midland States Bancorp, Inc. | 5,490 | ||||||
| 102 | MidWestOne Financial Group, Inc. | 2,935 | ||||||
| 1,461 | New York Community Bancorp, Inc. | 16,100 | ||||||
| 218 | Northfield Bancorp, Inc. | 3,575 | ||||||
| 80 | Northrim BanCorp, Inc. | 3,420 | ||||||
| 529 | Northwest Bancshares, Inc. | 7,216 | ||||||
| 279 | OceanFirst Financial Corporation | 5,814 | ||||||
| 7 | Ohio Valley Banc Corporation | 171 | ||||||
| 399 | Old National Bancorp | 7,026 | ||||||
| 10 | Old Point Financial Corporation | 243 | ||||||
| 227 | Old Second Bancorp, Inc. | 2,815 | ||||||
| 163 | OP Bancorp | 1,640 | ||||||
| 133 | Orrstown Financial Services, Inc. | 3,068 | ||||||
| 686 | PacWest Bancorp | 28,236 | ||||||
| 62 | Parke Bancorp, Inc. | 1,213 | ||||||
| 21 | Pathfinder Bancorp, Inc. | 332 | ||||||
| 28 | PCB Bancorp | 451 | ||||||
| 132 | Peapack-Gladstone Financial Corporation | 4,101 | ||||||
| 45 | Penns Woods Bancorp, Inc. | 1,072 | ||||||
| 107 | Peoples Bancorp, Inc. | 3,169 | ||||||
| 245 | Pinnacle Financial Partners, Inc. | 21,631 | ||||||
| 87 | Premier Financial Bancorp, Inc. | 1,466 | ||||||
| 249 | Premier Financial Corporation | 7,074 | ||||||
| 161 | Primis Financial Corporation | 2,457 | ||||||
| 50 | Provident Financial Holdings, Inc. | 863 | ||||||
| 369 | Provident Financial Services, Inc. | 8,446 | ||||||
| 113 | QCR Holdings, Inc. | 5,434 | ||||||
| 117 | RBB Bancorp | 2,834 | ||||||
| 198 | Renasant Corporation | 7,920 | ||||||
| 99 | Republic Bancorp, Inc., Class A | 4,567 | ||||||
See accompanying notes to financial statements.
27
| ACCLIVITY SMALL CAP VALUE FUND |
| SCHEDULE OF INVESTMENTS (Continued) |
| June 30, 2021 (Unaudited) |
| Shares | Value | |||||||
| COMMON STOCKS — 97.8% (Continued) | ||||||||
| BANKING - 21.8% (Continued) | ||||||||
| 190 | Riverview Bancorp, Inc. | $ | 1,347 | |||||
| 137 | Riverview Financial Corporation | 1,566 | ||||||
| 171 | S&T Bancorp, Inc. | 5,352 | ||||||
| 12 | SB Financial Group, Inc. | 222 | ||||||
| 112 | Select Bancorp, Inc.(a) | 1,805 | ||||||
| 112 | Sierra Bancorp | 2,850 | ||||||
| 306 | Simmons First National Corporation, Class A | 8,978 | ||||||
| 120 | SmartFinancial, Inc. | 2,881 | ||||||
| 18 | South State Corporation | 1,472 | ||||||
| 901 | Sterling Bancorp | 22,336 | ||||||
| 1,302 | Synovus Financial Corporation | 57,132 | ||||||
| 52 | Territorial Bancorp, Inc. | 1,350 | ||||||
| 313 | Towne Bank | 9,521 | ||||||
| 86 | TrustCo Bank Corp | 2,957 | ||||||
| 222 | Trustmark Corporation | 6,838 | ||||||
| 836 | Umpqua Holdings Corporation | 15,424 | ||||||
| 53 | United Bancshares, Inc. | 1,909 | ||||||
| 430 | United Bankshares, Inc. | 15,695 | ||||||
| 117 | United Security Bancshares | 956 | ||||||
| 171 | Univest Financial Corporation | 4,509 | ||||||
| 1,504 | Valley National Bancorp | 20,199 | ||||||
| 177 | Veritex Holdings, Inc. | 6,268 | ||||||
| 232 | Washington Federal, Inc. | 7,373 | ||||||
| 773 | Webster Financial Corporation | 41,232 | ||||||
| 328 | WesBanco, Inc. | 11,687 | ||||||
| 208 | Western New England Bancorp, Inc. | 1,695 | ||||||
| 198 | Wintrust Financial Corporation | 14,975 | ||||||
| 984,554 | ||||||||
| BEVERAGES - 0.0% (b) | ||||||||
| 51 | Coffee Holding Company, Inc.(a) | 274 | ||||||
| BIOTECH & PHARMA - 1.2% | ||||||||
| 617 | Amneal Pharmaceuticals, Inc.(a) | 3,159 | ||||||
| 170 | Amphastar Pharmaceuticals, Inc.(a) | 3,427 | ||||||
See accompanying notes to financial statements.
28
| ACCLIVITY SMALL CAP VALUE FUND |
| SCHEDULE OF INVESTMENTS (Continued) |
| June 30, 2021 (Unaudited) |
| Shares | Value | |||||||
| COMMON STOCKS — 97.8% (Continued) | ||||||||
| BIOTECH & PHARMA - 1.2% (Continued) | ||||||||
| 21 | ANI Pharmaceuticals, Inc.(a) | $ | 736 | |||||
| 151 | Coherus Biosciences, Inc.(a) | 2,088 | ||||||
| 67 | Collegium Pharmaceutical, Inc.(a) | 1,584 | ||||||
| 96 | Cumberland Pharmaceuticals, Inc.(a) | 273 | ||||||
| 41 | Eagle Pharmaceuticals, Inc.(a) | 1,755 | ||||||
| 123 | Emergent BioSolutions, Inc.(a) | 7,748 | ||||||
| 42 | Enanta Pharmaceuticals, Inc.(a) | 1,848 | ||||||
| 64 | G1 Therapeutics, Inc.(a) | 1,404 | ||||||
| 267 | Innoviva, Inc.(a) | 3,580 | ||||||
| 9 | Lannett Company, Inc.(a) | 42 | ||||||
| 17 | MacroGenics, Inc.(a) | 457 | ||||||
| 2 | Minerva Neurosciences, Inc.(a) | 5 | ||||||
| 180 | Prestige Consumer Healthcare, Inc.(a) | 9,378 | ||||||
| 376 | Sangamo Therapeutics, Inc.(a) | 4,501 | ||||||
| 25 | Travere Therapeutics, Inc.(a) | 365 | ||||||
| 59 | United Therapeutics Corporation(a) | 10,585 | ||||||
| 467 | Verastem, Inc.(a) | 1,901 | ||||||
| 54,836 | ||||||||
| CHEMICALS - 2.8% | ||||||||
| 188 | AdvanSix, Inc.(a) | 5,614 | ||||||
| 806 | AgroFresh Solutions, Inc.(a) | 1,677 | ||||||
| 103 | American Vanguard Corporation | 1,804 | ||||||
| 112 | Ashland Global Holdings, Inc. | 9,800 | ||||||
| 653 | Element Solutions, Inc. | 15,267 | ||||||
| 68 | Hawkins, Inc. | 2,227 | ||||||
| 56 | Haynes International, Inc. | 1,981 | ||||||
| 159 | HB Fuller Company | 10,114 | ||||||
| 700 | Huntsman Corporation | 18,564 | ||||||
| 76 | Intrepid Potash, Inc.(a) | 2,421 | ||||||
| 125 | Koppers Holdings, Inc.(a) | 4,044 | ||||||
| 180 | Kraton Corporation(a) | 5,812 | ||||||
| 46 | Materion Corporation | 3,466 | ||||||
| 103 | Minerals Technologies, Inc. | 8,103 | ||||||
| 28 | Oil-Dri Corp of America | 957 | ||||||
See accompanying notes to financial statements.
29
| ACCLIVITY SMALL CAP VALUE FUND |
| SCHEDULE OF INVESTMENTS (Continued) |
| June 30, 2021 (Unaudited) |
| Shares | Value | |||||||
| COMMON STOCKS — 97.8% (Continued) | ||||||||
| CHEMICALS - 2.8% (Continued) | ||||||||
| 331 | PQ Group Holdings, Inc. | $ | 5,084 | |||||
| 809 | Rayonier Advanced Materials, Inc.(a) | 5,412 | ||||||
| 33 | Rogers Corporation(a) | 6,626 | ||||||
| 139 | Trecora Resources(a) | 1,157 | ||||||
| 530 | Univar Solutions, Inc.(a) | 12,921 | ||||||
| 161 | Valhi, Inc. | 3,917 | ||||||
| 126,968 | ||||||||
| COMMERCIAL SUPPORT SERVICES - 2.1% | ||||||||
| 17 | ABM Industries, Inc. | 754 | ||||||
| 135 | AMN Healthcare Services, Inc.(a) | 13,092 | ||||||
| 495 | ARC Document Solutions, Inc. | 1,064 | ||||||
| 52 | BGSF, Inc. | 642 | ||||||
| 28 | BrightView Holdings, Inc.(a) | 451 | ||||||
| 187 | CBIZ, Inc.(a) | 6,128 | ||||||
| 134 | Cross Country Healthcare, Inc.(a) | 2,212 | ||||||
| 137 | Deluxe Corporation | 6,544 | ||||||
| 2 | Emerald Holding, Inc.(a) | 11 | ||||||
| 84 | Ennis, Inc. | 1,808 | ||||||
| 90 | GP Strategies Corporation(a) | 1,415 | ||||||
| 77 | Heidrick & Struggles International, Inc. | 3,430 | ||||||
| 51 | Huron Consulting Group, Inc.(a) | 2,507 | ||||||
| 179 | Kelly Services, Inc., Class A(a) | 4,291 | ||||||
| 194 | Korn Ferry | 14,075 | ||||||
| 131 | ManpowerGroup, Inc. | 15,577 | ||||||
| 110 | Quest Resource Holding Corporation(a) | 699 | ||||||
| 100 | Resources Connection, Inc. | 1,436 | ||||||
| 146 | Schnitzer Steel Industries, Inc., Class A | 7,161 | ||||||
| 70 | TrueBlue, Inc.(a) | 1,968 | ||||||
| 33 | UniFirst Corporation | 7,743 | ||||||
| 36 | Vectrus, Inc.(a) | 1,713 | ||||||
| 94,721 | ||||||||
| CONSTRUCTION MATERIALS - 0.7% | ||||||||
| 199 | Apogee Enterprises, Inc. | 8,105 | ||||||
| 475 | Summit Materials, Inc., Class A(a) | 16,554 | ||||||
See accompanying notes to financial statements.
30
| ACCLIVITY SMALL CAP VALUE FUND |
| SCHEDULE OF INVESTMENTS (Continued) |
| June 30, 2021 (Unaudited) |
| Shares | Value | |||||||
| COMMON STOCKS — 97.8% (Continued) | ||||||||
| CONSTRUCTION MATERIALS - 0.7% (Continued) | ||||||||
| 66 | US Concrete, Inc.(a) | $ | 4,871 | |||||
| 29,530 | ||||||||
| CONSUMER SERVICES - 0.8% | ||||||||
| 134 | Adtalem Global Education, Inc.(a) | 4,776 | ||||||
| 43 | American Public Education, Inc.(a) | 1,219 | ||||||
| 12 | Graham Holdings Company, Class B | 7,607 | ||||||
| 94 | Grand Canyon Education, Inc.(a) | 8,457 | ||||||
| 131 | Matthews International Corporation, Class A | 4,711 | ||||||
| 382 | Perdoceo Education Corporation(a) | 4,687 | ||||||
| 158 | Stride, Inc.(a) | 5,076 | ||||||
| 36,533 | ||||||||
| CONTAINERS & PACKAGING - 0.1% | ||||||||
| 93 | TriMas Corporation(a) | 2,821 | ||||||
| E-COMMERCE DISCRETIONARY - 0.1% | ||||||||
| 137 | Lands’ End, Inc.(a) | 5,624 | ||||||
| ELECTRICAL EQUIPMENT - 1.0% | ||||||||
| 275 | API Group Corporation(a) | 5,745 | ||||||
| 43 | Argan, Inc. | 2,055 | ||||||
| 99 | Bel Fuse, Inc., Class B | 1,426 | ||||||
| 157 | Belden, Inc. | 7,939 | ||||||
| 69 | Itron, Inc.(a) | 6,899 | ||||||
| 228 | Kimball Electronics, Inc.(a) | 4,957 | ||||||
| 243 | LSI Industries, Inc. | 1,946 | ||||||
| 257 | National Instruments Corporation | 10,866 | ||||||
| 35 | Powell Industries, Inc. | 1,083 | ||||||
| 48 | Preformed Line Products Company | 3,562 | ||||||
| 38 | RF Industries Ltd.(a) | 283 | ||||||
| 46,761 | ||||||||
| ENGINEERING & CONSTRUCTION - 2.3% | ||||||||
| 106 | Dycom Industries, Inc.(a) | 7,900 | ||||||
| 137 | EMCOR Group, Inc. | 16,877 | ||||||
| 371 | Fluor Corporation(a) | 6,567 | ||||||
See accompanying notes to financial statements.
31
| ACCLIVITY SMALL CAP VALUE FUND |
| SCHEDULE OF INVESTMENTS (Continued) |
| June 30, 2021 (Unaudited) |
| Shares | Value | |||||||
| COMMON STOCKS — 97.8% (Continued) | ||||||||
| ENGINEERING & CONSTRUCTION - 2.3% (Continued) | ||||||||
| 168 | Granite Construction, Inc. | $ | 6,977 | |||||
| 206 | KBR, Inc. | 7,859 | ||||||
| 70 | Limbach Holdings, Inc.(a) | 648 | ||||||
| 183 | MasTec, Inc.(a) | 19,416 | ||||||
| 192 | Mistras Group, Inc.(a) | 1,887 | ||||||
| 160 | MYR Group, Inc.(a) | 14,547 | ||||||
| 230 | Orion Group Holdings, Inc.(a) | 1,322 | ||||||
| 255 | Primoris Services Corporation | 7,505 | ||||||
| 248 | Sterling Construction Company, Inc.(a) | 5,984 | ||||||
| 290 | Tutor Perini Corporation(a) | 4,017 | ||||||
| 15 | VSE Corporation | 743 | ||||||
| 102,249 | ||||||||
| ENTERTAINMENT CONTENT - 0.3% | ||||||||
| 204 | AMC Networks, Inc., Class A(a) | 13,627 | ||||||
| FOOD - 1.3% | ||||||||
| 75 | Alico, Inc. | 2,670 | ||||||
| 101 | B&G Foods, Inc. | 3,313 | ||||||
| 171 | Hain Celestial Group, Inc. (The)(a) | 6,861 | ||||||
| 399 | Hostess Brands, Inc.(a) | 6,460 | ||||||
| 81 | Landec Corporation(a) | 911 | ||||||
| 37 | Natural Health Trends Corporation | 259 | ||||||
| 111 | Nature’s Sunshine Products, Inc. | 1,928 | ||||||
| 380 | S&W Seed Company(a) | 1,383 | ||||||
| 24 | Sanderson Farms, Inc. | 4,511 | ||||||
| 2 | Seaboard Corporation | 7,737 | ||||||
| 77 | Seneca Foods Corporation, Class A(a) | 3,933 | ||||||
| 195 | Simply Good Foods Company (The)(a) | 7,119 | ||||||
| 139 | Tootsie Roll Industries, Inc. | 4,714 | ||||||
| 135 | TreeHouse Foods, Inc.(a) | 6,010 | ||||||
| 57,809 | ||||||||
| FORESTRY, PAPER & WOOD PRODUCTS - 1.1% | ||||||||
| 125 | Boise Cascade Company | 7,294 | ||||||
| 270 | Domtar Corporation(a) | 14,839 | ||||||
See accompanying notes to financial statements.
32
| ACCLIVITY SMALL CAP VALUE FUND |
| SCHEDULE OF INVESTMENTS (Continued) |
| June 30, 2021 (Unaudited) |
| Shares | Value | |||||||
| COMMON STOCKS — 97.8% (Continued) | ||||||||
| FORESTRY, PAPER & WOOD PRODUCTS - 1.1% (Continued) | ||||||||
| 33 | Glatfelter Corporation | $ | 461 | |||||
| 226 | Mercer International, Inc. | 2,881 | ||||||
| 59 | Neenah, Inc. | 2,960 | ||||||
| 1,018 | Resolute Forest Products, Inc. | 12,420 | ||||||
| 115 | Schweitzer-Mauduit International, Inc. | 4,644 | ||||||
| 138 | Verso Corporation, Class A | 2,442 | ||||||
| 47,941 | ||||||||
| HEALTH CARE FACILITIES & SERVICES - 1.3% | ||||||||
| 133 | MEDNAX, Inc.(a) | 4,010 | ||||||
| 40 | National HealthCare Corporation | 2,796 | ||||||
| 1,235 | OPKO Health, Inc.(a) | 5,002 | ||||||
| 330 | Owens & Minor, Inc. | 13,969 | ||||||
| 451 | Patterson Companies, Inc. | 13,706 | ||||||
| 133 | Premier, Inc., Class A | 4,627 | ||||||
| 12 | Psychemedics Corporation(a) | 83 | ||||||
| 334 | Select Medical Holdings Corporation | 14,115 | ||||||
| 58,308 | ||||||||
| HOME & OFFICE PRODUCTS - 0.7% | ||||||||
| 723 | ACCO Brands Corporation | 6,239 | ||||||
| 90 | Hooker Furniture Corporation | 3,118 | ||||||
| 40 | iRobot Corporation(a) | 3,736 | ||||||
| 4 | Kewaunee Scientific Corporation(a) | 57 | ||||||
| 158 | Kimball International, Inc., Class B | 2,078 | ||||||
| 364 | Knoll, Inc. | 9,460 | ||||||
| 518 | Steelcase, Inc., Class A | 7,827 | ||||||
| 100 | Virco Mfg. Corporation(a) | 341 | ||||||
| 32,856 | ||||||||
| HOME CONSTRUCTION - 2.2% | ||||||||
| 41 | American Woodmark Corporation(a) | 3,349 | ||||||
| 225 | Beazer Homes USA, Inc.(a) | 4,340 | ||||||
| 200 | Century Communities, Inc. | 13,308 | ||||||
| 116 | Dixie Group, Inc. (The)(a) | 340 | ||||||
| 67 | Forestar Group, Inc.(a) | 1,401 | ||||||
| 173 | Green Brick Partners, Inc.(a) | 3,934 | ||||||
See accompanying notes to financial statements.
33
| ACCLIVITY SMALL CAP VALUE FUND |
| SCHEDULE OF INVESTMENTS (Continued) |
| June 30, 2021 (Unaudited) |
| Shares | Value | |||||||
| COMMON STOCKS — 97.8% (Continued) | ||||||||
| HOME CONSTRUCTION - 2.2% (Continued) | ||||||||
| 135 | Griffon Corporation | $ | 3,460 | |||||
| 195 | Interface, Inc. | 2,983 | ||||||
| 90 | KB Home | 3,665 | ||||||
| 69 | LGI Homes, Inc.(a) | 11,174 | ||||||
| 200 | M/I Homes, Inc.(a) | 11,734 | ||||||
| 84 | MDC Holdings, Inc. | 4,250 | ||||||
| 84 | Meritage Homes Corporation(a) | 7,903 | ||||||
| 85 | Patrick Industries, Inc. | 6,205 | ||||||
| 359 | Taylor Morrison Home Corporation(a) | 9,485 | ||||||
| 142 | Toll Brothers, Inc. | 8,209 | ||||||
| 183 | Tri Pointe Homes, Inc.(a) | 3,922 | ||||||
| 99,662 | ||||||||
| HOUSEHOLD PRODUCTS - 0.8% | ||||||||
| 182 | Central Garden & Pet Company, Class A(a) | 8,791 | ||||||
| 63 | Clearwater Paper Corporation(a) | 1,825 | ||||||
| 195 | Crown Crafts, Inc. | 1,476 | ||||||
| 93 | Edgewell Personal Care Company | 4,083 | ||||||
| 160 | Nu Skin Enterprises, Inc., Class A | 9,064 | ||||||
| 138 | Quanex Building Products Corporation | 3,428 | ||||||
| 85 | Spectrum Brands Holdings, Inc. | 7,228 | ||||||
| 35,895 | ||||||||
| INDUSTRIAL INTERMEDIATE PRODUCTS - 1.1% | ||||||||
| 124 | Ampco-Pittsburgh Corporation(a) | 753 | ||||||
| 106 | AZZ, Inc. | 5,489 | ||||||
| 63 | Core Molding Technologies, Inc.(a) | 972 | ||||||
| 26 | Eastern Company (The) | 788 | ||||||
| 44 | EnPro Industries, Inc. | 4,275 | ||||||
| 74 | L B Foster Company, Class A(a) | 1,379 | ||||||
| 122 | Park-Ohio Holdings Corporation | 3,921 | ||||||
| 39 | Strattec Security Corporation(a) | 1,734 | ||||||
| 322 | Timken Company (The) | 25,950 | ||||||
| 165 | Tredegar Corporation | 2,272 | ||||||
| 47,533 | ||||||||
See accompanying notes to financial statements.
34
| ACCLIVITY SMALL CAP VALUE FUND |
| SCHEDULE OF INVESTMENTS (Continued) |
| June 30, 2021 (Unaudited) |
| Shares | Value | |||||||
| COMMON STOCKS — 97.8% (Continued) | ||||||||
| INDUSTRIAL SUPPORT SERVICES - 0.9% | ||||||||
| 151 | CAI International, Inc. | $ | 8,456 | |||||
| 95 | DXP Enterprises, Inc.(a) | 3,163 | ||||||
| 130 | Herc Holdings, Inc.(a) | 14,569 | ||||||
| 158 | Titan Machinery, Inc.(a) | 4,889 | ||||||
| 73 | WESCO International, Inc.(a) | 7,506 | ||||||
| 38,583 | ||||||||
| INSTITUTIONAL FINANCIAL SERVICES - 1.3% | ||||||||
| 322 | Cowen, Inc., Class A | 13,218 | ||||||
| 1,363 | Jefferies Financial Group, Inc. | 46,615 | ||||||
| 59,833 | ||||||||
| INSURANCE - 4.8% | ||||||||
| 187 | Ambac Financial Group, Inc.(a) | 2,928 | ||||||
| 244 | American Equity Investment Life Holding Company | 7,886 | ||||||
| 223 | American National Group, Inc. | 33,127 | ||||||
| 513 | Brighthouse Financial, Inc.(a) | 23,362 | ||||||
| 292 | Citizens, Inc.(a) | 1,545 | ||||||
| 1,054 | CNO Financial Group, Inc. | 24,895 | ||||||
| 206 | Employers Holdings, Inc. | 8,817 | ||||||
| 59 | FedNat Holding Company | 245 | ||||||
| 599 | Genworth Financial, Inc., Class A(a) | 2,336 | ||||||
| 238 | Hallmark Financial Services, Inc.(a) | 1,059 | ||||||
| 379 | Heritage Insurance Holdings, Inc. | 3,252 | ||||||
| 195 | Horace Mann Educators Corporation | 7,297 | ||||||
| 22 | National Western Life Group, Inc., Class A | 4,937 | ||||||
| 620 | ProAssurance Corporation | 14,105 | ||||||
| 980 | Radian Group, Inc. | 21,805 | ||||||
| 257 | Security National Financial Corporation, Class A(a) | 2,249 | ||||||
| 506 | State Auto Financial Corporation | 8,663 | ||||||
| 337 | Tiptree, Inc. | 3,134 | ||||||
| 61 | Unico American Corporation(a) | 284 | ||||||
| 150 | United Fire Group, Inc. | 4,159 | ||||||
| 506 | United Insurance Holdings Corporation | 2,884 | ||||||
| 1,307 | Unum Group | 37,119 | ||||||
| 216,088 | ||||||||
See accompanying notes to financial statements.
35
| ACCLIVITY SMALL CAP VALUE FUND |
| SCHEDULE OF INVESTMENTS (Continued) |
| June 30, 2021 (Unaudited) |
| Shares | Value | |||||||
| COMMON STOCKS — 97.8% (Continued) | ||||||||
| INTERNET MEDIA & SERVICES - 0.4% | ||||||||
| 292 | Cars.com, Inc.(a) | $ | 4,184 | |||||
| 467 | DHI Group, Inc.(a) | 1,579 | ||||||
| 336 | TrueCar, Inc.(a) | 1,898 | ||||||
| 212 | Yelp, Inc.(a) | 8,472 | ||||||
| 16,133 | ||||||||
| LEISURE FACILITIES & SERVICES - 1.2% | ||||||||
| 10 | Ark Restaurants Corporation(a) | 198 | ||||||
| 37 | Biglari Holdings, Inc.(a) | 5,900 | ||||||
| 306 | Carrols Restaurant Group, Inc.(a) | 1,839 | ||||||
| 141 | Century Casinos, Inc.(a) | 1,894 | ||||||
| 124 | Chuy’s Holdings, Inc.(a) | 4,620 | ||||||
| 220 | Del Taco Restaurants, Inc. | 2,202 | ||||||
| 513 | Dover Motorsports, Inc. | 1,154 | ||||||
| 441 | El Pollo Loco Holdings, Inc.(a) | 8,066 | ||||||
| 172 | Fiesta Restaurant Group, Inc.(a) | 2,310 | ||||||
| 108 | Full House Resorts, Inc.(a) | 1,074 | ||||||
| 34 | Golden Entertainment, Inc.(a) | 1,523 | ||||||
| 104 | Good Times Restaurants, Inc.(a) | 425 | ||||||
| 108 | J Alexander’s Holdings, Inc.(a) | 1,257 | ||||||
| 331 | Marcus Corporation (The)(a) | 7,021 | ||||||
| 16 | Potbelly Corporation(a) | 126 | ||||||
| 104 | RCI Hospitality Holdings, Inc. | 6,885 | ||||||
| 266 | Red Robin Gourmet Burgers, Inc.(a) | 8,807 | ||||||
| 55,301 | ||||||||
| LEISURE PRODUCTS - 0.7% | ||||||||
| 43 | American Outdoor Brands, Inc.(a) | 1,511 | ||||||
| 118 | Escalade, Inc. | 2,708 | ||||||
| 30 | Smith & Wesson Brands, Inc. | 1,041 | ||||||
| 46 | Thor Industries, Inc. | 5,198 | ||||||
| 257 | Vista Outdoor, Inc.(a) | 11,894 | ||||||
| 128 | Winnebago Industries, Inc. | 8,699 | ||||||
| 31,051 | ||||||||
| MACHINERY - 2.4% | ||||||||
| 201 | AGCO Corporation | 26,207 | ||||||
See accompanying notes to financial statements.
36
| ACCLIVITY SMALL CAP VALUE FUND |
| SCHEDULE OF INVESTMENTS (Continued) |
| June 30, 2021 (Unaudited) |
| Shares | Value | |||||||
| COMMON STOCKS — 97.8% (Continued) | ||||||||
| MACHINERY - 2.4% (Continued) | ||||||||
| 111 | Altra Industrial Motion Corporation | $ | 7,217 | |||||
| 67 | Astec Industries, Inc. | 4,217 | ||||||
| 258 | CECO Environmental Corporation(a) | 1,847 | ||||||
| 174 | Colfax Corporation(a) | 7,971 | ||||||
| 72 | Columbus McKinnon Corporation | 3,473 | ||||||
| 42 | ESCO Technologies, Inc. | 3,940 | ||||||
| 38 | Gencor Industries, Inc.(a) | 462 | ||||||
| 314 | Hillenbrand, Inc. | 13,841 | ||||||
| 46 | Hurco Companies, Inc. | 1,610 | ||||||
| 36 | Hyster-Yale Materials Handling, Inc., Class A | 2,627 | ||||||
| 85 | Intevac, Inc.(a) | 573 | ||||||
| 111 | Kennametal, Inc. | 3,987 | ||||||
| 93 | LS Starrett Company (The), Class A(a) | 869 | ||||||
| 234 | Manitowoc Company, Inc. (The)(a) | 5,733 | ||||||
| 879 | NN, Inc.(a) | 6,461 | ||||||
| 67 | Regal Beloit Corporation | 8,945 | ||||||
| 68 | SPX FLOW, Inc. | 4,436 | ||||||
| 119 | Terex Corporation | 5,667 | ||||||
| 110,083 | ||||||||
| MEDICAL EQUIPMENT & DEVICES - 1.0% | ||||||||
| 720 | Accuray, Inc.(a) | 3,254 | ||||||
| 155 | AngioDynamics, Inc.(a) | 4,205 | ||||||
| 76 | Avanos Medical, Inc.(a) | 2,764 | ||||||
| 14 | CryoLife, Inc.(a) | 398 | ||||||
| 36 | FONAR Corporation(a) | 637 | ||||||
| 157 | Harvard Bioscience, Inc.(a) | 1,308 | ||||||
| 27 | ICU Medical, Inc.(a) | 5,557 | ||||||
| 56 | Integer Holdings Corporation(a) | 5,275 | ||||||
| 11 | Luminex Corporation | 405 | ||||||
| 101 | Merit Medical Systems, Inc.(a) | 6,531 | ||||||
| 127 | Natus Medical, Inc.(a) | 3,299 | ||||||
| 107 | NuVasive, Inc.(a) | 7,252 | ||||||
| 148 | OraSure Technologies, Inc.(a) | 1,501 | ||||||
| 9 | Utah Medical Products, Inc. | 765 | ||||||
See accompanying notes to financial statements.
37
| ACCLIVITY SMALL CAP VALUE FUND |
| SCHEDULE OF INVESTMENTS (Continued) |
| June 30, 2021 (Unaudited) |
| Shares | Value | |||||||
| COMMON STOCKS — 97.8% (Continued) | ||||||||
| MEDICAL EQUIPMENT & DEVICES - 1.0% (Continued) | ||||||||
| 128 | Varex Imaging Corporation(a) | $ | 3,433 | |||||
| 46,584 | ||||||||
| METALS & MINING – 0.9% | ||||||||
| 301 | Alcoa Corporation(a) | 11,089 | ||||||
| 401 | CONSOL Energy, Inc.(a) | 7,406 | ||||||
| 110 | Encore Wire Corporation | 8,337 | ||||||
| 1,046 | Hecla Mining Company | 7,782 | ||||||
| 848 | SunCoke Energy, Inc. | 6,055 | ||||||
| 143 | Warrior Met Coal, Inc. | 2,460 | ||||||
| 43,129 | ||||||||
| OIL & GAS PRODUCERS - 4.7% | ||||||||
| 1,449 | Antero Resources Corporation(a) | 21,779 | ||||||
| 106 | Bonanza Creek Energy, Inc. | 4,989 | ||||||
| 1,717 | Centennial Resource Development, Inc., Class A(a) | 11,641 | ||||||
| 785 | CNX Resources Corporation(a) | 10,723 | ||||||
| 1,263 | Comstock Resources, Inc.(a) | 8,424 | ||||||
| 815 | Earthstone Energy, Inc., Class A(a) | 9,022 | ||||||
| 1,284 | EQT Corporation(a) | 28,582 | ||||||
| 361 | Equitrans Midstream Corporation | 3,072 | ||||||
| 865 | HollyFrontier Corporation | 28,459 | ||||||
| 120 | Matador Resources Company | 4,321 | ||||||
| 783 | Murphy Oil Corporation | 18,228 | ||||||
| 262 | PBF Energy, Inc., Class A(a) | 4,009 | ||||||
| 278 | PDC Energy, Inc. | 12,730 | ||||||
| 227 | Penn Virginia Corporation(a) | 5,360 | ||||||
| 1 | Plains GP Holdings, L.P., Class A | 12 | ||||||
| 157 | SilverBow Resources, Inc.(a) | 3,646 | ||||||
| 4,666 | Southwestern Energy Company(a) | 26,456 | ||||||
| 180 | TravelCenters of America, Inc.(a) | 5,263 | ||||||
| 173 | World Fuel Services Corporation | 5,489 | ||||||
| 212,205 | ||||||||
| OIL & GAS SERVICES & EQUIPMENT - 0.5% | ||||||||
| 267 | Dawson Geophysical Company(a) | 697 | ||||||
| 82 | Dril-Quip, Inc.(a) | 2,774 | ||||||
See accompanying notes to financial statements.
38
| ACCLIVITY SMALL CAP VALUE FUND |
| SCHEDULE OF INVESTMENTS (Continued) |
| June 30, 2021 (Unaudited) |
| Shares | Value | |||||||
| COMMON STOCKS — 97.8% (Continued) | ||||||||
| OIL & GAS SERVICES & EQUIPMENT - 0.5% (Continued) | ||||||||
| 96 | Geospace Technologies Corporation(a) | $ | 777 | |||||
| 215 | Helmerich & Payne, Inc. | 7,015 | ||||||
| 23 | Matrix Service Company(a) | 241 | ||||||
| 192 | MRC Global, Inc.(a) | 1,805 | ||||||
| 175 | Natural Gas Services Group, Inc.(a) | 1,799 | ||||||
| 306 | Smart Sand, Inc.(a) | 1,019 | ||||||
| 113 | Thermon Group Holdings, Inc.(a) | 1,926 | ||||||
| 396 | US Silica Holdings, Inc.(a) | 4,578 | ||||||
| 22,631 | ||||||||
| PUBLISHING & BROADCASTING - 1.8% | ||||||||
| 199 | Beasley Broadcast Group, Inc., Class A(a) | 575 | ||||||
| 38 | Cumulus Media, Inc., Class A(a) | 557 | ||||||
| 130 | Emmis Communications Corporation(a) | 357 | ||||||
| 15 | Entercom Communications Corporation.(a) | 65 | ||||||
| 584 | Entravision Communications Corporation, Class A | 3,901 | ||||||
| 542 | EW Scripps Company (The), Class A | 11,051 | ||||||
| 1,212 | Gannett Company, Inc.(a) | 6,654 | ||||||
| 392 | Gray Television, Inc. | 9,173 | ||||||
| 139 | Hemisphere Media Group, Inc.(a) | 1,640 | ||||||
| 22 | Houghton Mifflin Harcourt Company(a) | 243 | ||||||
| 151 | John Wiley & Sons, Inc., Class A | 9,087 | ||||||
| 195 | Meredith Corporation(a) | 8,471 | ||||||
| 70 | Saga Communications, Inc., Class A | 1,516 | ||||||
| 212 | Scholastic Corporation | 8,033 | ||||||
| 794 | TEGNA, Inc. | 14,895 | ||||||
| 445 | Townsquare Media, Inc., Class A(a) | 5,674 | ||||||
| 260 | Urban One, Inc.(a) | 1,305 | ||||||
| 83,197 | ||||||||
| REAL ESTATE OWNERS & DEVELOPERS - 0.0% (b) | ||||||||
| 24 | FRP Holdings, Inc.(a) | 1,336 | ||||||
| 14 | Stratus Properties, Inc.(a) | 346 | ||||||
| 1,682 | ||||||||
| REAL ESTATE SERVICES - 0.5% | ||||||||
| 25 | RE/MAX Holdings, Inc., Class A | 833 | ||||||
See accompanying notes to financial statements.
39
| ACCLIVITY SMALL CAP VALUE FUND |
| SCHEDULE OF INVESTMENTS (Continued) |
| June 30, 2021 (Unaudited) |
| Shares | Value | |||||||
| COMMON STOCKS — 97.8% (Continued) | ||||||||
| REAL ESTATE SERVICES - 0.5% (Continued) | ||||||||
| 1,219 | Realogy Holdings Corporation(a) | $ | 22,210 | |||||
| 23,043 | ||||||||
| RENEWABLE ENERGY - 0.8% | ||||||||
| 94 | EnerSys | 9,187 | ||||||
| 44 | FutureFuel Corporation | 422 | ||||||
| 141 | Green Plains, Inc.(a) | 4,740 | ||||||
| 314 | Renewable Energy Group, Inc.(a) | 19,575 | ||||||
| 117 | Ultralife Corporation(a) | 981 | ||||||
| 34,905 | ||||||||
| RETAIL - CONSUMER STAPLES - 0.7% | ||||||||
| 221 | Big Lots, Inc. | 14,588 | ||||||
| 135 | Ingles Markets, Inc., Class A | 7,866 | ||||||
| 132 | Rite Aid Corporation(a) | 2,152 | ||||||
| 93 | SpartanNash Company | 1,796 | ||||||
| 60 | Village Super Market, Inc., Class A | 1,410 | ||||||
| 39 | Weis Markets, Inc. | 2,015 | ||||||
| 29,827 | ||||||||
| RETAIL - DISCRETIONARY - 7.6% | ||||||||
| 12 | Aaron’s Company, Inc. (The) | 384 | ||||||
| 312 | Abercrombie & Fitch Company, Class A(a) | 14,486 | ||||||
| 3 | American Eagle Outfitters, Inc. | 113 | ||||||
| 20 | America’s Car-Mart, Inc.(a) | 2,834 | ||||||
| 55 | AutoNation, Inc.(a) | 5,215 | ||||||
| 502 | Barnes & Noble Education, Inc.(a) | 3,619 | ||||||
| 81 | Bassett Furniture Industries, Inc. | 1,972 | ||||||
| 135 | Beacon Roofing Supply, Inc.(a) | 7,189 | ||||||
| 213 | Bed Bath & Beyond, Inc.(a) | 7,091 | ||||||
| 199 | Big 5 Sporting Goods Corporation | 5,110 | ||||||
| 124 | Caleres, Inc. | 3,384 | ||||||
| 88 | Children’s Place, Inc. (The)(a) | 8,189 | ||||||
| 260 | Conn’s, Inc.(a) | 6,630 | ||||||
| 312 | Container Store Group, Inc. (The)(a) | 4,069 | ||||||
| 20 | Designer Brands, Inc., Class A(a) | 331 | ||||||
| 386 | Dick’s Sporting Goods, Inc. | 38,673 | ||||||
See accompanying notes to financial statements.
40
| ACCLIVITY SMALL CAP VALUE FUND |
| SCHEDULE OF INVESTMENTS (Continued) |
| June 30, 2021 (Unaudited) |
| Shares | Value | |||||||
| COMMON STOCKS — 97.8% (Continued) | ||||||||
| RETAIL - DISCRETIONARY - 7.6% (Continued) | ||||||||
| 120 | Dillard’s, Inc., Class A | $ | 21,706 | |||||
| 187 | Ethan Allen Interiors, Inc. | 5,161 | ||||||
| 335 | Foot Locker, Inc. | 20,646 | ||||||
| 138 | Genesco, Inc.(a) | 8,788 | ||||||
| 162 | GMS, Inc.(a) | 7,799 | ||||||
| 94 | Group 1 Automotive, Inc. | 14,517 | ||||||
| 137 | Guess?, Inc. | 3,617 | ||||||
| 103 | Haverty Furniture Companies, Inc. | 4,404 | ||||||
| 19 | Hertz Global Holdings, Inc.(a) | 166 | ||||||
| 89 | Hibbett, Inc.(a) | 7,977 | ||||||
| 750 | Kohl’s Corporation | 41,333 | ||||||
| 159 | La-Z-Boy, Inc. | 5,889 | ||||||
| 122 | MarineMax, Inc.(a) | 5,946 | ||||||
| 149 | Penske Automotive Group, Inc. | 11,248 | ||||||
| 2,853 | Qurate Retail, Inc. - Series A | 37,346 | ||||||
| 133 | Rush Enterprises, Inc., Class A | 5,751 | ||||||
| 60 | Shoe Carnival, Inc. | 4,295 | ||||||
| 147 | Sonic Automotive, Inc., Class A | 6,577 | ||||||
| 197 | Tilly’s, Inc., Class A | 3,148 | ||||||
| 188 | Urban Outfitters, Inc.(a) | 7,749 | ||||||
| 265 | Vera Bradley, Inc.(a) | 3,283 | ||||||
| 158 | Zumiez, Inc.(a) | 7,740 | ||||||
| 344,375 | ||||||||
| SEMICONDUCTORS - 2.1% | ||||||||
| 371 | Amkor Technology, Inc. | 8,782 | ||||||
| 127 | Amtech Systems, Inc.(a) | 1,224 | ||||||
| 94 | AXT, Inc.(a) | 1,032 | ||||||
| 97 | Cirrus Logic, Inc.(a) | 8,257 | ||||||
| 155 | Cohu, Inc.(a) | 5,702 | ||||||
| 105 | CTS Corporation | 3,902 | ||||||
| 16 | Data I/O Corporation(a) | 109 | ||||||
| 123 | Diodes, Inc.(a) | 9,812 | ||||||
| 104 | DSP Group, Inc.(a) | 1,539 | ||||||
| 57 | GSI Technology, Inc.(a) | 320 | ||||||
See accompanying notes to financial statements.
41
| ACCLIVITY SMALL CAP VALUE FUND |
| SCHEDULE OF INVESTMENTS (Continued) |
| June 30, 2021 (Unaudited) |
| Shares | Value | |||||||
| COMMON STOCKS — 97.8% (Continued) | ||||||||
| SEMICONDUCTORS - 2.1% (Continued) | ||||||||
| 247 | Kulicke & Soffa Industries, Inc. | $ | 15,116 | |||||
| 126 | NeoPhotonics Corporation(a) | 1,287 | ||||||
| 110 | Onto Innovation, Inc.(a) | 8,034 | ||||||
| 229 | Photronics, Inc.(a) | 3,025 | ||||||
| 234 | Rambus, Inc.(a) | 5,548 | ||||||
| 94 | Richardson Electronics Ltd. | 781 | ||||||
| 183 | Ultra Clean Holdings, Inc.(a) | 9,831 | ||||||
| 132 | Veeco Instruments, Inc.(a) | 3,173 | ||||||
| 412 | Vishay Intertechnology, Inc. | 9,291 | ||||||
| 96,765 | ||||||||
| SOFTWARE - 2.0% | ||||||||
| 354 | Allscripts Healthcare Solutions, Inc.(a) | 6,553 | ||||||
| 60 | Avaya Holdings Corporation(a) | 1,614 | ||||||
| 30 | BM Technologies, Inc.(a) | 373 | ||||||
| 100 | Bottomline Technologies DE, Inc.(a) | 3,708 | ||||||
| 205 | ChannelAdvisor Corporation(a) | 5,025 | ||||||
| 350 | Cloudera, Inc.(a) | 5,551 | ||||||
| 47 | Cognyte Software Ltd.(a) | 1,151 | ||||||
| 110 | Computer Programs and Systems, Inc. | 3,655 | ||||||
| 273 | Donnelley Financial Solutions, Inc.(a) | 9,009 | ||||||
| 168 | Ebix, Inc. | 5,695 | ||||||
| 136 | J2 Global, Inc.(a) | 18,707 | ||||||
| 204 | NextGen Healthcare, Inc.(a) | 3,384 | ||||||
| 1 | SeaChange International, Inc.(a) | 1 | ||||||
| 288 | Support.com, Inc.(a) | 1,112 | ||||||
| 116 | Synchronoss Technologies, Inc.(a) | 416 | ||||||
| 108 | Verint Systems, Inc.(a) | 4,868 | ||||||
| 771 | Xperi Holding Corporation | 17,147 | ||||||
| 261 | Zovio, Inc.(a) | 676 | ||||||
| 88,645 | ||||||||
| SPECIALTY FINANCE - 4.9% | ||||||||
| 511 | Air Lease Corporation | 21,329 | ||||||
| 178 | Alliance Data Systems Corporation | 18,546 | ||||||
| 15 | Consumer Portfolio Services, Inc.(a) | 67 | ||||||
See accompanying notes to financial statements.
42
| ACCLIVITY SMALL CAP VALUE FUND |
| SCHEDULE OF INVESTMENTS (Continued) |
| June 30, 2021 (Unaudited) |
| Shares | Value | |||||||
| COMMON STOCKS — 97.8% (Continued) | ||||||||
| SPECIALTY FINANCE - 4.9% (Continued) | ||||||||
| 567 | Elevate Credit, Inc.(a) | $ | 2,024 | |||||
| 214 | Encore Capital Group, Inc.(a) | 10,141 | ||||||
| 222 | Enova International, Inc.(a) | 7,595 | ||||||
| 754 | EZCORP, Inc., Class A(a) | 4,547 | ||||||
| 110 | GATX Corporation | 9,732 | ||||||
| 4 | Investors Title Company | 699 | ||||||
| 94 | Marlin Business Services Corporation | 2,139 | ||||||
| 2,428 | MGIC Investment Corporation | 33,021 | ||||||
| 475 | Mr Cooper Group, Inc.(a) | 15,703 | ||||||
| 957 | Navient Corporation | 18,499 | ||||||
| 109 | Nelnet, Inc., Class A | 8,200 | ||||||
| 57 | Nicholas Financial, Inc.(a) | 640 | ||||||
| 1,081 | OneMain Holdings, Inc. | 64,763 | ||||||
| 2 | PROG Holdings, Inc. | 96 | ||||||
| 35 | Regional Management Corporation | 1,629 | ||||||
| 49 | Willis Lease Finance Corporation(a) | 2,100 | ||||||
| 221,470 | ||||||||
| STEEL - 1.3% | ||||||||
| 34 | Carpenter Technology Corporation | 1,367 | ||||||
| 692 | Commercial Metals Company | 21,258 | ||||||
| 86 | Friedman Industries, Inc. | 1,152 | ||||||
| 46 | Northwest Pipe Company(a) | 1,300 | ||||||
| 258 | Olympic Steel, Inc. | 7,583 | ||||||
| 922 | United States Steel Corporation | 22,128 | ||||||
| 72 | Worthington Industries, Inc. | 4,405 | ||||||
| 59,193 | ||||||||
| TECHNOLOGY HARDWARE - 5.9% | ||||||||
| 140 | ADTRAN, Inc. | 2,891 | ||||||
| 6 | Applied Optoelectronics, Inc.(a) | 51 | ||||||
| 2 | AstroNova, Inc.(a) | 28 | ||||||
| 164 | Aviat Networks, Inc.(a) | 5,374 | ||||||
| 257 | Avnet, Inc. | 10,300 | ||||||
| 144 | Aware, Inc.(a) | 534 | ||||||
| 123 | Benchmark Electronics, Inc. | 3,501 | ||||||
See accompanying notes to financial statements.
43
| ACCLIVITY SMALL CAP VALUE FUND |
| SCHEDULE OF INVESTMENTS (Continued) |
| June 30, 2021 (Unaudited) |
| Shares | Value | |||||||
| COMMON STOCKS — 97.8% (Continued) | ||||||||
| TECHNOLOGY HARDWARE - 5.9% (Continued) | ||||||||
| 940 | CommScope Holding Company, Inc.(a) | $ | 20,031 | |||||
| 196 | Communications Systems, Inc. | 1,407 | ||||||
| 179 | Comtech Telecommunications Corporation | 4,325 | ||||||
| 646 | Daktronics, Inc.(a) | 4,257 | ||||||
| 299 | EMCORE Corporation(a) | 2,757 | ||||||
| 422 | Harmonic, Inc.(a) | 3,595 | ||||||
| 104 | InterDigital, Inc. | 7,595 | ||||||
| 492 | Jabil, Inc. | 28,595 | ||||||
| 64 | Key Tronic Corporation(a) | 417 | ||||||
| 270 | Knowles Corporation(a) | 5,330 | ||||||
| 265 | Maxar Technologies, Inc. | 10,579 | ||||||
| 677 | NCR Corporation(a) | 30,878 | ||||||
| 180 | NETGEAR, Inc.(a) | 6,898 | ||||||
| 337 | NetScout Systems, Inc.(a) | 9,618 | ||||||
| 63 | PCTEL, Inc. | 413 | ||||||
| 477 | Pitney Bowes, Inc. | 4,183 | ||||||
| 68 | Plexus Corporation(a) | 6,216 | ||||||
| 1,120 | Ribbon Communications, Inc.(a) | 8,523 | ||||||
| 186 | Sanmina Corporation(a) | 7,247 | ||||||
| 215 | Super Micro Computer, Inc.(a) | 7,564 | ||||||
| 347 | SYNNEX Corporation | 42,251 | ||||||
| 389 | TTM Technologies, Inc.(a) | 5,563 | ||||||
| 122 | ViaSat, Inc.(a) | 6,080 | ||||||
| 45 | Vishay Precision Group, Inc.(a) | 1,532 | ||||||
| 825 | Xerox Holdings Corporation | 19,379 | ||||||
| 267,912 | ||||||||
| TECHNOLOGY SERVICES - 1.5% | ||||||||
| 1,478 | Conduent, Inc.(a) | 11,085 | ||||||
| 105 | CSG Systems International, Inc. | 4,954 | ||||||
| 793 | DXC Technology Company(a) | 30,879 | ||||||
| 45 | ICF International, Inc. | 3,954 | ||||||
| 58 | Insight Enterprises, Inc.(a) | 5,801 | ||||||
| 54 | ManTech International Corporation, Class A | 4,673 | ||||||
| 108 | NetSol Technologies, Inc.(a) | 509 | ||||||
See accompanying notes to financial statements.
44
| ACCLIVITY SMALL CAP VALUE FUND |
| SCHEDULE OF INVESTMENTS (Continued) |
| June 30, 2021 (Unaudited) |
| Shares | Value | |||||||
| COMMON STOCKS — 97.8% (Continued) | ||||||||
| TECHNOLOGY SERVICES - 1.5% (Continued) | ||||||||
| 112 | RCM Technologies, Inc.(a) | $ | 461 | |||||
| 92 | StarTek, Inc.(a) | 656 | ||||||
| 132 | Sykes Enterprises, Inc.(a) | 7,088 | ||||||
| 70,060 | ||||||||
| TELECOMMUNICATIONS - 0.9% | ||||||||
| 332 | Alaska Communications Systems Group, Inc.(a) | 1,105 | ||||||
| 40 | ATN International, Inc. | 1,820 | ||||||
| 325 | Consolidated Communications Holdings, Inc.(a) | 2,857 | ||||||
| 466 | EchoStar Corporation, Class A(a) | 11,319 | ||||||
| 81 | KVH Industries, Inc.(a) | 996 | ||||||
| 563 | ORBCOMM, Inc.(a) | 6,328 | ||||||
| 109 | Spok Holdings, Inc. | 1,049 | ||||||
| 748 | Telephone and Data Systems, Inc. | 16,950 | ||||||
| 42,424 | ||||||||
| TOBACCO & CANNABIS - 0.1% | ||||||||
| 104 | Universal Corporation | 5,925 | ||||||
| TRANSPORTATION & LOGISTICS - 1.8% | ||||||||
| 144 | Alaska Air Group, Inc.(a) | 8,685 | ||||||
| 23 | ArcBest Corporation | 1,338 | ||||||
| 153 | Atlas Air Worldwide Holdings, Inc.(a) | 10,421 | ||||||
| 56 | Covenant Logistics Group, Inc., Class A(a) | 1,158 | ||||||
| 76 | Echo Global Logistics, Inc.(a) | 2,336 | ||||||
| 152 | Hawaiian Holdings, Inc.(a) | 3,704 | ||||||
| 24 | Hub Group, Inc., Class A(a) | 1,584 | ||||||
| 116 | Kirby Corporation(a) | 7,034 | ||||||
| 1 | Macquarie Infrastructure Corporation | 38 | ||||||
| 178 | Marten Transport Ltd. | 2,935 | ||||||
| 772 | Overseas Shipholding Group, Inc., Class A(a) | 1,613 | ||||||
| 29 | Patriot Transportation Holding, Inc. | 327 | ||||||
| 222 | Radiant Logistics, Inc.(a) | 1,538 | ||||||
| 229 | Ryder System, Inc. | 17,022 | ||||||
| 80 | Schneider National, Inc., Class B | 1,742 | ||||||
| 338 | SkyWest, Inc.(a) | 14,558 | ||||||
See accompanying notes to financial statements.
45
| ACCLIVITY SMALL CAP VALUE FUND |
| SCHEDULE OF INVESTMENTS (Continued) |
| June 30, 2021 (Unaudited) |
| Shares | Value | |||||||
| COMMON STOCKS — 97.8% (Continued) | ||||||||
| TRANSPORTATION & LOGISTICS - 1.8% (Continued) | ||||||||
| 126 | Werner Enterprises, Inc. | $ | 5,610 | |||||
| 81,643 | ||||||||
| TRANSPORTATION EQUIPMENT - 0.3% | ||||||||
| 63 | Greenbrier Companies, Inc. (The) | 2,745 | ||||||
| 181 | REV Group, Inc. | 2,840 | ||||||
| 195 | Trinity Industries, Inc. | 5,244 | ||||||
| 117 | Wabash National Corporation | 1,872 | ||||||
| 12,701 | ||||||||
| WHOLESALE - CONSUMER STAPLES - 0.6% | ||||||||
| 198 | Andersons, Inc. (The) | 6,045 | ||||||
| 86 | Core-Mark Holding Company, Inc. | 3,871 | ||||||
| 520 | United Natural Foods, Inc.(a) | 19,229 | ||||||
| 29,145 | ||||||||
| WHOLESALE - DISCRETIONARY - 0.8% | ||||||||
| 13 | Acme United Corporation | 579 | ||||||
| 15 | Educational Development Corporation | 187 | ||||||
| 39 | ePlus, Inc.(a) | 3,381 | ||||||
| 211 | G-III Apparel Group Ltd.(a) | 6,933 | ||||||
| 422 | KAR Auction Services, Inc.(a) | 7,406 | ||||||
| 106 | PC Connection, Inc. | 4,905 | ||||||
| 232 | ScanSource, Inc.(a) | 6,526 | ||||||
| 101 | Veritiv Corporation(a) | 6,203 | ||||||
| 7 | Wayside Technology Group, Inc. | 175 | ||||||
| 443 | ZAGG CVR(a) | — | ||||||
| 36,295 | ||||||||
| TOTAL COMMON STOCKS (Cost $3,069,635) | 4,424,739 | |||||||
| PARTNERSHIP SHARES — 1.1% | ||||||||
| METALS & MINING - 0.3% | ||||||||
| 1,852 | Alliance Resource Partners, L.P. | 13,353 | ||||||
See accompanying notes to financial statements.
46
| ACCLIVITY SMALL CAP VALUE FUND |
| SCHEDULE OF INVESTMENTS (Continued) |
| June 30, 2021 (Unaudited) |
| Shares | Value | |||||||
| PARTNERSHIP SHARES — 1.1% (Continued) | ||||||||
| OIL & GAS PRODUCERS - 0.6% | ||||||||
| 1 | NGL Energy Partners, L.P. | $ | 2 | |||||
| 552 | NuStar Energy, L.P. | 9,964 | ||||||
| 1,426 | Plains All American Pipeline, L.P. | 16,199 | ||||||
| 26,165 | ||||||||
| REIT - 0.0% (b) | ||||||||
| 100 | Landmark Infrastructure Partners, L.P. | 1,275 | ||||||
| SPECIALTY FINANCE - 0.2% | ||||||||
| 224 | America First Multifamily Investors, L.P. | 1,510 | ||||||
| 182 | Fortress Transportation and Infrastructure | 6,106 | ||||||
| 7,616 | ||||||||
| TOTAL PARTNERSHIP SHARES (Cost $34,256) | 48,409 | |||||||
| REIT — 0.1% | ||||||||
| MORTGAGE FINANCE - 0.1% | ||||||||
| 305 | Ellington Financial, Inc. | 5,841 | ||||||
| TOTAL REIT (Cost $4,700) | 5,841 | |||||||
| MONEY MARKET FUNDS - 2.7% | ||||||||
| 123,952 | BlackRock Liquidity Funds T-Fund, Institutional Class, 0.01%(c) | 123,952 | ||||||
| TOTAL MONEY MARKET FUNDS (Cost $123,952) | 123,952 | |||||||
| TOTAL INVESTMENTS - 101.7% (Cost $3,232,543) | $ | 4,602,941 | ||||||
| LIABILITIES IN EXCESS OF OTHER ASSETS - (1.7)% | (78,073 | ) | ||||||
| NET ASSETS - 100.0% | $ | 4,524,868 | ||||||
| (a) | Non-income producing security. |
| (b) | Percentage rounds to less than 0.1%. |
| (c) | Rate disclosed is the seven day effective yield as of June 30, 2021 |
See accompanying notes to financial statements.
47
| Acclivity Funds |
| STATEMENTS OF ASSETS AND LIABILITIES (Unaudited) |
| June 30, 2021 |
| Acclivity Mid Cap | Acclivity Small Cap | |||||||
| Multi-Style Fund | Value Fund | |||||||
| ASSETS | ||||||||
| Investment securities: | ||||||||
| At cost | $ | 235,363 | $ | 3,232,543 | ||||
| At value | $ | 292,244 | $ | 4,602,941 | ||||
| Receivable for investments sold | 4,638 | 24,246 | ||||||
| Dividends and interest receivable | 206 | 4,212 | ||||||
| Receivable due from Advisor | 16,802 | 18,512 | ||||||
| Prepaid expenses and other assets | 2,970 | 1,685 | ||||||
| TOTAL ASSETS | 316,860 | 4,651,596 | ||||||
| LIABILITIES | ||||||||
| Payable for investments purchased | 4,607 | 89,286 | ||||||
| Audit fees payable | 18,339 | 14,426 | ||||||
| Distribution (12b-1) fees payable | — | 10 | ||||||
| Payable to related parties | 12,825 | 19,721 | ||||||
| Accrued expenses and other liabilities | 1,244 | 3,285 | ||||||
| TOTAL LIABILITIES | 37,015 | 126,728 | ||||||
| NET ASSETS | $ | 279,845 | $ | 4,524,868 | ||||
| Net Assets Consist Of: | ||||||||
| Paid in capital | $ | 230,020 | $ | 3,271,611 | ||||
| Accumulated earnings | 49,825 | 1,253,257 | ||||||
| NET ASSETS | $ | 279,845 | $ | 4,524,868 | ||||
| Net Asset Value Per Share: | ||||||||
| Class I Shares: | ||||||||
| Net Assets | $ | 279,832 | $ | 4,524,851 | ||||
| Shares of beneficial interest outstanding ($0 par value, unlimited shares authorized) | 21,796 | 278,273 | ||||||
| Net asset value (Net Assets ÷ Shares Outstanding), offering price and redemption price per share | $ | 12.84 | $ | 16.26 | ||||
| Class N Shares: | ||||||||
| Net Assets | $ | 13 | $ | 17 | ||||
| Shares of beneficial interest outstanding ($0 par value, unlimited shares authorized) | 1 | 1 | ||||||
| Net asset value (Net Assets ÷ Shares Outstanding), offering price and redemption price per share | $ | 12.84 | (a) | $ | 16.21 | (a) | ||
| (a) | Net asset value may not recalculate due to the rounding of net assets. |
See accompanying notes to financial statements.
48
| Acclivity Funds | |||||
| STATEMENTS OF OPERATIONS (Unaudited) | |||||
| For the Six Months Ended June 30, 2021 | |||||
| Acclivity Mid Cap | Acclivity Small Cap | |||||||
| Multi-Style Fund | Value Fund | |||||||
| INVESTMENT INCOME | ||||||||
| Dividends (Foreign Taxes Withheld - $0 and $154, respectively) | $ | 1,756 | $ | 37,211 | ||||
| Interest | 1 | 4 | ||||||
| TOTAL INVESTMENT INCOME | 1,757 | 37,215 | ||||||
| EXPENSES | ||||||||
| Investment advisory fees | 433 | 7,813 | ||||||
| Distribution (12b-1) fees: | ||||||||
| Class N | — | 49 | ||||||
| Transfer agent fees | 12,628 | 12,197 | ||||||
| Trustees’ fees | 12,188 | 15,811 | ||||||
| Legal fees | 13,288 | 10,218 | ||||||
| Administration fees | 7,734 | 14,755 | ||||||
| Audit fees | 6,139 | 3,720 | ||||||
| Compliance officer fees | 1,373 | 1,665 | ||||||
| Registration fees | — | 3,320 | ||||||
| Custody fees | 1,967 | 263 | ||||||
| Shareholder reporting expense | 417 | 662 | ||||||
| Fund accounting fees | 83 | 694 | ||||||
| Third party administrative servicing fees | 4 | 608 | ||||||
| Insurance expense | — | 83 | ||||||
| Other expenses | 894 | 1,418 | ||||||
| TOTAL EXPENSES | 57,148 | 73,276 | ||||||
| Less: Fees waived/reimbursed by the Adviser | (56,603 | ) | (63,589 | ) | ||||
| NET EXPENSES | 545 | 9,687 | ||||||
| NET INVESTMENT INCOME | 1,212 | 27,528 | ||||||
| REALIZED AND UNREALIZED GAIN ON INVESTMENTS | ||||||||
| Net realized gain from investments | 5,714 | 217,696 | ||||||
| Net change in unrealized appreciation on investments | 26,106 | 724,536 | ||||||
| NET REALIZED AND UNREALIZED GAIN ON INVESTMENTS | 31,820 | 942,232 | ||||||
| NET INCREASE IN NET ASSETS RESULTING FROM OPERATIONS | $ | 33,032 | $ | 969,760 | ||||
See accompanying notes to financial statements.
49
| Acclivity Mid Cap Multi-Style Fund |
| STATEMENTS OF CHANGES IN NET ASSETS |
| For the Six Months Ended | For the Period* Ended | |||||||
| June 30, 2021 | December 31, | |||||||
| (Unaudited) | 2020 | |||||||
| FROM OPERATIONS | ||||||||
| Net investment income | $ | 1,212 | $ | 1,187 | ||||
| Net realized gain/(loss) from investments | 5,714 | (15,169 | ) | |||||
| Net change in unrealized appreciation of investments | 26,106 | 30,775 | ||||||
| Net increase in net assets resulting from operations | 33,032 | 16,793 | ||||||
| FROM SHARES OF BENEFICIAL INTEREST | ||||||||
| Proceeds from shares sold | ||||||||
| Class I | 105,000 | 125,010 | ||||||
| Class N | — | 10 | ||||||
| Net increase in net assets from shares of beneficial interest | 105,000 | 125,020 | ||||||
| TOTAL INCREASE IN NET ASSETS | 138,032 | 141,813 | ||||||
| NET ASSETS | ||||||||
| Beginning of Period | 141,813 | — | ||||||
| End of Period | $ | 279,845 | $ | 141,813 | ||||
| SHARE ACTIVITY - CLASS I | ||||||||
| Shares sold | 8,954 | 12,842 | ||||||
| Net increase in shares of beneficial interest outstanding | 8,954 | 12,842 | ||||||
| SHARE ACTIVITY - CLASS N | ||||||||
| Shares sold | — | 1 | ||||||
| Net increase in shares of beneficial interest outstanding | — | 1 | ||||||
| * | The inception date of the Acclivity Mid Cap Multi-Style Fund was December 31, 2019 and the Fund commenced operations on January 2, 2020. |
See accompanying notes to financial statements.
50
| Acclivity Small Cap Value Fund |
| STATEMENTS OF CHANGES IN NET ASSETS |
| For the Six Months Ended | For the Year Ended | |||||||
| June 30, 2021 | December 31, | |||||||
| (Unaudited) | 2020 | |||||||
| FROM OPERATIONS | ||||||||
| Net investment income | $ | 27,528 | $ | 48,969 | ||||
| Net realized gain/(loss) from security investments | 217,696 | (410,033 | ) | |||||
| Distributions of realized gains from underlying investment companies | — | 7 | ||||||
| Net change in unrealized appreciation of investments | 724,536 | 551,561 | ||||||
| Net increase in net assets resulting from operations | 969,760 | 190,504 | ||||||
| DISTRIBUTIONS TO SHAREHOLDERS | ||||||||
| Total Distributions Paid | ||||||||
| Class I | — | (55,855 | ) | |||||
| Class N | — | (0 | ) ^ | |||||
| — | (55,855 | ) | ||||||
| FROM SHARES OF BENEFICIAL INTEREST | ||||||||
| Proceeds from shares sold | ||||||||
| Class I | 1,101,302 | 435,810 | ||||||
| Class N | 62,212 | 20,000 | ||||||
| Net asset value of shares issued in reinvestment of distributions | ||||||||
| Class I | — | 55,182 | ||||||
| Class N ^ | — | 0 | ||||||
| Payments for shares redeemed | ||||||||
| Class I | (363,029 | ) | (624,862 | ) | ||||
| Class N | (80,633 | ) | (12,494 | ) | ||||
| Net increase/(decrease) in net assets from shares of beneficial interest | 719,852 | (126,364 | ) | |||||
| TOTAL INCREASE IN NET ASSETS | 1,689,612 | 8,285 | ||||||
| NET ASSETS | ||||||||
| Beginning of Period | 2,835,256 | 2,826,971 | ||||||
| End of Period | $ | 4,524,868 | $ | 2,835,256 | ||||
| SHARE ACTIVITY - CLASS I | ||||||||
| Shares sold | 73,701 | 46,406 | ||||||
| Shares reinvested | — | 4,509 | ||||||
| Shares redeemed | (23,465 | ) | (63,350 | ) | ||||
| Net increase/(decrease) in shares of beneficial interest outstanding | 50,236 | (12,435 | ) | |||||
| SHARE ACTIVITY - CLASS N | ||||||||
| Shares sold | 4,059 | 1,888 | ||||||
| Shares reinvested | — | 0 | # | |||||
| Shares redeemed | (4,885 | ) | (1,062 | ) | ||||
| Net increase in shares of beneficial interest outstanding | (826 | ) | 826 | |||||
| ^ | Amount represents less than $0.50. |
| # | Amount represents less than 0.50 shares. |
See accompanying notes to financial statements.
51
| Acclivity Mid Cap Multi-Style Fund |
| FINANCIAL HIGHLIGHTS |
| Per Share Data and Ratios for a Share of Beneficial Interest Outstanding Throughout each Period |
| Class I | ||||||||
| Six Months Ended | Period* Ended | |||||||
| June 30, 2021 | December 31, | |||||||
| (Unaudited) | 2020 | |||||||
| Net asset value, beginning of period | $ | 11.04 | $ | 10.00 | ||||
| Activity from investment operations: | ||||||||
| Net investment income (1) | 0.06 | 0.10 | ||||||
| Net realized and unrealized gain on investments | 1.74 | 0.94 | ||||||
| Total from investment operations | 1.80 | 1.04 | ||||||
| Net asset value, end of period | $ | 12.84 | $ | 11.04 | ||||
| Total return (2)(3) | 16.30 | % | 10.40 | % | ||||
| Net assets, at end of period (000s) | $ | 280 | $ | 142 | ||||
| Ratio of gross expenses to average net assets (4)(5)(6) | 46.10 | % | 97.49 | % | ||||
| Ratio of net expenses to average net assets (5)(6) | 0.44 | % | 0.47 | % | ||||
| Ratio of net investment income to average net assets (5)(6) | 0.98 | % | 1.07 | % | ||||
| Portfolio turnover rate (3) | 14 | % | 47 | % | ||||
| * | The inception date of the Acclivity Mid Cap Multi-Style Fund was December 31, 2019 and the Fund commenced operations on January 2, 2020. |
| (1) | Per share amounts calculated using the average shares method, which more appropriately presents the per share data for the period. |
| (2) | Had the Adviser not waived a portion of the Fund’s expenses, total returns would have been lower. |
| (3) | Not annualized. |
| (4) | Represents the ratio of expenses to average net assets absent fee waivers and/or expense reimbursements by the Adviser. |
| (5) | Does not include the expenses of other investment companies in which the Fund invests. |
| (6) | Annualized for periods less than one full year. |
See accompanying notes to financial statements.
52
| Acclivity Mid Cap Multi-Style Fund |
| FINANCIAL HIGHLIGHTS |
| Per Share Data and Ratios for a Share of Beneficial Interest Outstanding Throughout each Period |
| Class N | ||||||||
| Six Months Ended | Period* Ended | |||||||
| June 30, 2021 | December 31, | |||||||
| (Unaudited) | 2020 | |||||||
| Net asset value, beginning of period | $ | 11.04 | $ | 10.00 | ||||
| Activity from investment operations: | ||||||||
| Net investment income (1) | 0.06 | 0.10 | ||||||
| Net realized and unrealized gain on investments | 1.74 | 0.94 | ||||||
| Total from investment operations | 1.80 | 1.04 | ||||||
| Net asset value, end of period | $ | 12.84 | $ | 11.04 | ||||
| Total return (2)(3) | 16.30 | % | 10.40 | % | ||||
| Net assets, at end of period (4) | $ | 13 | $ | 11 | ||||
| Ratio of gross expenses to average net assets (5)(6)(7) | 46.35 | % | 97.74 | % | ||||
| Ratio of net expenses to average net assets (6)(7) | 0.69 | % | 0.72 | % | ||||
| Ratio of net investment income to average net assets (6)(7) | 0.73 | % | 0.82 | % | ||||
| Portfolio turnover rate (3) | 14 | % | 47 | % | ||||
| * | The inception date of the Acclivity Mid Cap Multi-Style Fund was December 31, 2019 and the Fund commenced operations on January 2, 2020. |
| (1) | Per share amounts calculated using the average shares method, which more appropriately presents the per share data for the period. |
| (2) | Had the Adviser not waived a portion of the Fund’s expenses, total returns would have been lower. |
| (3) | Not annualized. |
| (4) | Represents actual net assets. |
| (5) | Represents the ratio of expenses to average net assets absent fee waivers and/or expense reimbursements by the Adviser. |
| (6) | Does not include the expenses of other investment companies in which the Fund invests. |
| (7) | Annualized for periods less than one full year. |
See accompanying notes to financial statements.
53
| Acclivity Small Cap Value Fund |
| FINANCIAL HIGHLIGHTS |
| Per Share Data and Ratios for a Share of Beneficial Interest Outstanding Throughout Each Period |
| Class I | ||||||||||||
| Six Months Ended | Year Ended | Period* Ended | ||||||||||
| June 30, 2021 | December 31, | December 31, | ||||||||||
| (Unaudited) | 2020 | 2019 | ||||||||||
| Net asset value, beginning of period | $ | 12.39 | $ | 11.76 | $ | 10.00 | ||||||
| Activity from investment operations: | ||||||||||||
| Net investment income (1) | 0.10 | 0.21 | 0.15 | |||||||||
| Net realized and unrealized gain on investments | 3.77 | 0.67 | 1.69 | |||||||||
| Total from investment operations | 3.87 | 0.88 | 1.84 | |||||||||
| Less distributions from: | ||||||||||||
| Net investment income | — | (0.01 | ) | (0.08 | ) | |||||||
| Net realized gains | — | (0.24 | ) | — | ||||||||
| Total distributions | — | (0.25 | ) | (0.08 | ) | |||||||
| Net asset value, end of period | $ | 16.26 | $ | 12.39 | $ | 11.76 | ||||||
| Total return (2) | 31.23 | % (6) | 7.51 | % | 18.44 | % (6) | ||||||
| Net assets, at end of period (000s) | $ | 4,525 | $ | 2,825 | $ | 2,827 | ||||||
| Ratio of gross expenses to average net assets (3)(4) | 3.65 | % (5) | 5.62 | % | 14.59 | % (5) | ||||||
| Ratio of net expenses to average net assets (4) | 0.48 | % (5) | 0.54 | % | 0.67 | % (5) | ||||||
| Ratio of net investment income to average net assets (4) | 1.37 | % (5) | 2.12 | % | 1.34 | % (5) | ||||||
| Portfolio turnover rate | 21 | % (6) | 65 | % | 166 | % (6) | ||||||
| * | The inception date of the Acclivity Small Cap Value Fund was December 31, 2018 and the Fund commenced operations on January 2, 2019. |
| (1) | Per share amounts calculated using the average shares method, which more appropriately presents the per share data for the period. |
| (2) | Had the Adviser not waived a portion of the Fund’s expenses, total returns would have been lower. |
| (3) | Represents the ratio of expenses to average net assets absent fee waivers and/or expense reimbursements by the Adviser. |
| (4) | Does not include the expenses of other investment companies in which the Fund invests. |
| (5) | Annualized for periods less than one full year. |
| (6) | Not annualized. |
See accompanying notes to financial statements.
54
| Acclivity Small Cap Value Fund |
| FINANCIAL HIGHLIGHTS |
| Per Share Data and Ratios for a Share of Beneficial Interest Outstanding Throughout Each Period |
| Class N | ||||||||||||
| Six Months Ended | Year Ended | Period* Ended | ||||||||||
| June 30, 2021 | December 31, | December 31, | ||||||||||
| (Unaudited) | 2020 | 2019 | ||||||||||
| Net asset value, beginning of period | $ | 12.37 | $ | 11.75 | $ | 10.00 | ||||||
| Activity from investment operations: | ||||||||||||
| Net investment income (1) | 0.08 | 0.26 | 0.16 | |||||||||
| Net realized and unrealized gain on investments | 3.76 | 0.61 | 1.67 | |||||||||
| Total from investment operations | 3.84 | 0.87 | 1.83 | |||||||||
| Less distributions from: | ||||||||||||
| Net investment income | — | (0.01 | ) | (0.08 | ) | |||||||
| Net realized gains | — | (0.24 | ) | — | ||||||||
| Total distributions | — | (0.25 | ) | (0.08 | ) | |||||||
| Net asset value, end of period | $ | 16.21 | $ | 12.37 | $ | 11.75 | ||||||
| Total return (2) | 31.04 | % (6) | 7.43 | % | 18.34 | % (6) | ||||||
| Net assets, at end of period (000s) | $ | 17 | (7) | $ | 10 | $ | 12 | (7) | ||||
| Ratio of gross expenses to average net assets (3)(4) | 3.91 | % (5) | 5.87 | % | 81.62 | % (5) | ||||||
| Ratio of net expenses to average net assets (4) | 0.73 | % (5) | 0.79 | % | 0.92 | % (5) | ||||||
| Ratio of net investment income to average net assets (4) | 1.02 | % (5) | 1.87 | % | 1.44 | % (5) | ||||||
| Portfolio turnover rate | 21 | % (6) | 65 | % | 166 | % (6) | ||||||
| * | The inception date of the Acclivity Small Cap Value Fund was December 31, 2018 and the Fund commenced operations on January 2, 2019. |
| (1) | Per share amounts calculated using the average shares method, which more appropriately presents the per share data for the period. |
| (2) | Had the Adviser not waived a portion of the Fund’s expenses, total returns would have been lower. |
| (3) | Represents the ratio of expenses to average net assets absent fee waivers and/or expense reimbursements by the Adviser. |
| (4) | Does not include the expenses of other investment companies in which the Fund invests. |
| (5) | Annualized for periods less than one full year. |
| (6) | Not annualized. |
| (7) | Represents actual net assets. |
See accompanying notes to financial statements.
55
| Acclivity Funds |
| NOTES TO FINANCIAL STATEMENTS (Unaudited) |
| June 30, 2021 |
| 1. | ORGANIZATION |
The Acclivity Mid Cap Multi-Style Fund (the “Mid Cap Fund”) and Acclivity Small Cap Value Fund (the “Small Cap Fund”) (each a “Fund,” collectively the “Funds”) are each a diversified series of shares of beneficial interest of Northern Lights Fund Trust II (the “Trust”), a statutory trust organized under the laws of the State of Delaware on August 26, 2010, and are registered under the Investment Company Act of 1940, as amended (the “1940 Act”), as open-end management investment companies. The inception date of the Mid Cap Fund was December 31, 2019 and the Mid Cap Fund commenced operations on January 2, 2020. The inception date of the Small Cap Fund was December 31, 2018 and the Small Cap Fund commenced operations on January 2, 2019. The Funds seek long term capital appreciation.
The Funds currently offer Class I shares and Class N shares. Class I and Class N shares are offered at net asset value without an initial sales charge. Class N shares are subject to a 0.25% Rule 12b-1 distribution and shareholder servicing fee. Each class represents an interest in the same assets of a Fund and classes are identical except for differences in ongoing service and distribution charges. All classes of shares have equal voting privileges except that each class has exclusive voting rights with respect to its shareholder service and/or distribution plans.
| 2. | SIGNIFICANT ACCOUNTING POLICIES |
The following is a summary of significant accounting policies followed by the Funds in preparation of their financial statements. The policies are in conformity with accounting principles generally accepted in the United States of America (“GAAP”). The preparation of financial statements requires management to make estimates and assumptions that affect the reported amounts of assets and liabilities and disclosure of contingent assets and liabilities at the date of the financial statements and the reported amounts of income and expenses for the period. Actual results could differ from those estimates. The Funds are each an investment company and accordingly follow the investment company accounting and reporting guidance of the Financial Accounting Standards Board (“FASB”) Accounting Standard Codification Topic 946 “Financial Services – Investment Companies”.
Security Valuation – Securities listed on an exchange are valued at the last reported sale price at the close of the regular trading session of the primary exchange on the business day the value is being determined, or in the case of securities listed on NASDAQ at the NASDAQ Official Closing Price (“NOCP”). In the absence of a sale, such securities shall be valued at the mean between the current bid and ask prices on the day of valuation. Investments valued in currencies other than the U.S. dollar are converted to U.S. dollars using exchange rates obtained from pricing services. Short- term debt obligations having 60 days or less remaining until maturity, at time of purchase, may be valued at amortized cost.
The Funds may hold securities, such as private investments, interests in commodity pools, other non-traded securities or temporarily illiquid securities, for which market quotations are not readily available or are determined to be unreliable. These securities will be valued using the “fair value” procedures approved by the Trust’s Board of Trustees (the “Board”) . The Board has delegated execution of these procedures to a fair value committee composed of one or more representatives from each of the (i)
56
| Acclivity Funds |
| NOTES TO FINANCIAL STATEMENTS (Unaudited)(Continued) |
| June 30, 2021 |
Trust, (ii) administrator, and (iii) Adviser. The committee may also enlist third party consultants such as a valuation specialist at a public accounting firm, valuation consultant or financial officer of a security issuer on an as-needed basis to assist in determining a security -specific fair value. The Board has also engaged a third party valuation firm to attend meetings held by the Trust, review minutes of such meetings and report to the Board on a quarterly basis. The Board reviews and ratifies the execution of this process and the resultant fair value prices at least quarterly to assure the process produces reliable results.
Fair Valuation Process – As noted above, this fair value committee is composed of one or more representatives from each of the (i) Trust, (ii) administrator, and (iii) adviser. The applicable investments are valued collectively via inputs from each of these groups. For example, fair value determinations are required for the following securities: (i) securities for which market quotations are insufficient or not readily available on a particular business day (including securities for which there is a short and temporary lapse in the provision of a price by the regular pricing source), (ii) securities for which, in the judgment of the adviser, the prices or values available do not represent the fair value of the instrument. Factors which may cause the adviser to make such a judgment include, but are not limited to, the following: only a bid price or an asked price is available; the spread between bid and asked prices is substantial; the frequency of sales; the thinness of the market; the size of reported trades; and actions of the securities markets, such as the suspension or limitation of trading; (iii) securities determined to be illiquid; (iv) securities with respect to which an event that will affect the value thereof has occurred (a “significant event”) since the closing prices were established on the principal exchange on which they are traded, but prior to a Fund’s calculation of its net asset values. Specifically, interests in commodity pools or managed futures pools are valued on a daily basis by reference to the closing market prices of each futures contract or other asset held by a pool, as adjusted for pool expenses. Restricted or illiquid securities, such as private investments or non-traded securities are valued via inputs from the adviser based upon the current bid for the security from two or more independent dealers or other parties reasonably familiar with the facts and circumstances of the security (who should take into consideration all relevant factors as may be appropriate under the circumstances). If the adviser is unable to obtain a current bid from such independent dealers or other independent parties, the fair value committee shall determine the fair value of such security using the following factors: (i) the type of security; (ii) the cost at date of purchase; (iii) the size and nature of the Fund’s holdings; (iv) the discount from market value of unrestricted securities of the same class at the time of purchase and subsequent thereto; (v) information as to any transactions or offers with respect to the security; (vi) the nature and duration of restrictions on disposition of the security and the existence of any registration rights; (vii) how the yield of the security compares to similar securities of companies of similar or equal creditworthiness; (viii) the level of recent trades of similar or comparable securities; (ix) the liquidity characteristics of the security; (x) current market conditions; and (xi) the market value of any securities into which the security is convertible or exchangeable.
Each Fund utilizes various methods to measure fair value of all of its investments on a recurring basis. GAAP establishes the hierarchy that prioritizes inputs to valuation methods. The three levels of input are:
Level 1 – Unadjusted quoted prices in active markets for identical assets and liabilities that each Fund has the ability to access.
57
| Acclivity Funds |
| NOTES TO FINANCIAL STATEMENTS (Unaudited)(Continued) |
| June 30, 2021 |
Level 2 – Observable inputs other than quoted prices included in Level 1 that are observable for the asset or liability, either directly or indirectly. These inputs may include quoted prices for the identical instrument in an inactive market, prices for similar instruments, interest rates, prepayment speeds, credit risk, yield curves, default rates and similar data.
Level 3 – Unobservable inputs for the asset or liability, to the extent relevant observable inputs are not available, representing a Fund’s own assumptions about the assumptions a market participant would use in valuing the asset or liability, and would be based on the best information available.
The availability of observable inputs can vary from security to security and is affected by a wide variety of factors, including, for example, the type of security, whether the security is new and not yet established in the marketplace, the liquidity of markets, and other characteristics particular to the security. To the extent that valuation is based on models or inputs that are less observable or unobservable in the market, the determination of fair value requires more judgment. Accordingly, the degree of judgment exercised in determining fair value is greatest for instruments categorized in Level 3.
The inputs used to measure fair value may fall into different levels of the fair value hierarchy. In such cases, for disclosure purposes, the level in the fair value hierarchy within which the fair value measurement falls in its entirety, is determined based on the lowest level input that is significant to the fair value measurement in its entirety.
The inputs or methodology used for valuing securities are not necessarily an indication of the risk associated with investing in those securities. The following tables summarize the inputs used as of June 30, 2021 for each Fund’s assets measured at fair value:
| Acclivity Mid Cap Multi-Style Fund | ||||||||||||||||
| Assets * | Level 1 | Level 2 | Level 3 | Total | ||||||||||||
| Common Stocks | $ | 272,715 | $ | — | $ | — | $ | 272,715 | ||||||||
| Partnership Shares | 1,223 | — | — | 1,223 | ||||||||||||
| Money Market Fund | 18,306 | — | — | 18,306 | ||||||||||||
| Total | $ | 292,244 | $ | — | $ | — | $ | 292,244 | ||||||||
| Acclivity Small Cap Value Fund | ||||||||||||||||
| Assets * | Level 1 | Level 2 | Level 3 | Total | ||||||||||||
| Common Stocks | $ | 4,424,739 | $ | — | $ | — | $ | 4,424,739 | ||||||||
| Partnership Shares | 48,409 | — | — | 48,409 | ||||||||||||
| REIT | 5,841 | — | — | 5,841 | ||||||||||||
| Money Market Fund | 123,952 | — | — | 123,952 | ||||||||||||
| Total | $ | 4,602,941 | $ | — | $ | — | $ | 4,602,941 | ||||||||
The Funds did not hold any Level 3 securities during the period.
| * | See each Fund’s Schedule of Investments for classification. |
58
| Acclivity Funds |
| NOTES TO FINANCIAL STATEMENTS (Unaudited)(Continued) |
| June 30, 2021 |
Security Transactions and Related Income – Security transactions are accounted for on trade date. Interest income is recognized on an accrual basis. Discounts are accreted and premiums are amortized on securities purchased over the lives of the respective securities. Dividend income is recorded on the ex-dividend date. Realized gains or losses from sales of securities are determined by comparing the identified cost of the security lot sold with the net sales proceeds. Each Fund’s income, expenses (other than class specific distribution fees) and realized and unrealized gains and losses are allocated proportionately each day based upon the relative net assets of each class.
Dividends and Distributions to Shareholders – Dividends from net investment income, if any, are declared and paid annually. Distributable net realized capital gains, if any, are declared and distributed annually in December. Dividends from net investment income and distributions from net realized gains are determined in accordance with federal income tax regulations, which may differ from GAAP. These “book/tax” differences are considered either temporary (i.e., deferred losses) or permanent in nature. To the extent these differences are permanent in nature, such amounts are reclassified within the composition of net assets based on their Federal tax-basis treatment; temporary differences do not require reclassification. Dividends and distributions to shareholders are recorded on ex-dividend date.
Federal Income Taxes – Each Fund intends to continue to comply with the requirements of the Internal Revenue Code applicable to regulated investment companies and to distribute all of their taxable income to their shareholders. Therefore, no provision for federal income tax is required. The Funds recognize the tax benefits of uncertain tax positions only where the position is “more likely than not” to be sustained assuming examination by tax authorities. Management has analyzed each Fund’s tax positions and has concluded that no liability for unrecognized tax benefits should be recorded related to uncertain tax positions taken on returns filed for the Small Cap Fund’s December 31, 2019 year-end or the Small Cap Fund’s and Mid Cap Fund’s December 31, 2020 year end, or expected to be taken in the Funds’ December 31, 2021 tax returns. Each Fund has identified its major tax jurisdictions as U.S. Federal, Ohio, and foreign jurisdictions where the Funds make significant investments. The Funds are not aware of any tax positions for which it is reasonably possible that the total amounts of unrecognized tax benefits will change materially in the next twelve months.
Expenses – Expenses of the Trust that are directly identifiable to a specific fund are charged to that fund. Expenses, which are not readily identifiable to a specific fund, are allocated in such a manner as deemed equitable, taking into consideration the nature and type of expense and the relative sizes of the funds in the Trust.
Indemnification – The Trust indemnifies its officers and Trustees for certain liabilities that may arise from the performance of their duties to the Trust. Additionally, in the normal course of business, the Funds enter into contracts that contain a variety of representations and warranties and which provide general indemnities. Each Fund’s maximum exposure under these arrangements is unknown, as this would involve future claims that may be made against a Fund that have not yet occurred. However, based on experience, the Funds expect the risk of loss due to these warranties and indemnities to be remote.
59
| Acclivity Funds |
| NOTES TO FINANCIAL STATEMENTS (Unaudited)(Continued) |
| June 30, 2021 |
| 3. | INVESTMENT TRANSACTIONS |
For the six months ended June 30, 2021, cost of purchases and proceeds from sales of portfolio securities, other than short-term investments, amounted to:
| Purchases | Sales | |||||||
| Mid Cap | $ | 139,003 | $ | 33,188 | ||||
| Small Cap | 1,528,364 | 823,852 | ||||||
| 4. | INVESTMENT ADVISORY AGREEMENT AND TRANSACTIONS WITH RELATED PARTIES |
Innealta Capital, LLC (the “Adviser”) serves as investment adviser to the Funds. Pursuant to an Advisory Agreement with the Funds, the Adviser, under the oversight of the Board, directs the daily operations of the Funds and supervises the performance of administrative and professional services provided by others. Effective May 1, 2020, the Funds pay the Adviser a management fee at an annual rate of 0.35% and 0.39% of the Mid Cap Fund’s and Small Cap Fund’s average daily net assets, respectively. Prior to May 1, 2020, as compensation for its services and the related expenses borne by the Adviser, the Funds paid the Adviser a management fee, computed and accrued daily and paid monthly, at an annual rate of 0.45% and 0.55% of the Mid Cap Fund’s and Small Cap Fund’s average daily net assets, respectively. For the six months ended June 30, 2021, the Adviser earned $433 and $7,813 from the Mid Cap Fund and Small Cap Fund, respectively.
Effective May 1, 2020, pursuant to a written contract (the “Waiver Agreement”), the Adviser has agreed, at least until April 30, 2022, to waive a portion of its advisory fee and has agreed to reimburse each Fund for other expenses to the extent necessary so that the total expenses incurred by each Fund (excluding any front-end or contingent deferred sales loads, brokerage fees and commissions, acquired fund fees and expenses, borrowing costs (such as interest and dividend expense on securities sold short), taxes and extraordinary expenses such as litigation) do not exceed 0.44% and 0.69% for Class I and Class N shares of the Mid Cap Fund, respectively, and 0.48% and 0.73% for Class I and Class N shares of the Small Cap Fund, respectively. Prior to May 1, 2020, the Advisor agreed to waive/reimburse expenses to the extent necessary that the total expenses did not exceed 0.55% and 0.80% for Class I and Class N shares of the Mid Cap Fund, respectively, and 0.67% and 0.92% for Class I and Class N shares of the Small Cap Fund, respectively.
If the Adviser waives any fee or reimburses any expenses pursuant to the Waiver Agreement for a Fund, and a Fund’s operating expenses are subsequently lower than its respective expense limitation, the Adviser shall be entitled to reimbursement by a Fund provided that such reimbursement does not cause a Fund’s operating expenses to exceed its expense limitation. If a Fund’s operating expenses subsequently exceed its expense limitation, the reimbursements for a Fund shall be suspended. The Adviser may seek reimbursement only for expenses waived or paid by it during the three fiscal years prior to such reimbursement; provided, however, that such expenses may only be reimbursed to the extent they were waived or paid after the date of the Waiver Agreement (or any similar agreement). The Board may terminate this expense reimbursement arrangement at any time. For the six months
60
| Acclivity Funds |
| NOTES TO FINANCIAL STATEMENTS (Unaudited)(Continued) |
| June 30, 2021 |
ended June 30, 2021, the Adviser waived advisory fees and reimbursed the Mid Cap Fund and Small Cap Fund for expenses in the amounts of $56,603 and $63,589, respectively.
The following amounts are subject to recapture by the Funds by the following date:
| 12/31/2022 | 12/31/2023 | |||||||
| Mid Cap | N/A | $ | 107,373 | |||||
| Small Cap | $ | 135,510 | $ | 117,329 | ||||
Distributor – The distributor for the Funds is Northern Lights Distributors, LLC (the “Distributor”). The Board has adopted the Trust’s Master Distribution and Shareholder Servicing Plans for Class N shares (the “Plan”) pursuant to Rule 12b-1 under the 1940 Act to pay for ongoing distribution- related activities or shareholder services. Under the Plan, the Funds are permitted to pay a fee at an annual rate of 0.25% of the average daily net assets of Class N shares. For the six months ended June 30, 2021, pursuant to the Class N Plan, the Mid Cap Fund and Small Cap Fund incurred $0 and $49 in 12b-1 fees, respectively.
The Distributor acts as the Funds’ principal underwriter in a continuous public offering of each Fund’s shares.
In addition, certain affiliates of the Distributor provide services to the Funds as follows:
Gemini Fund Services, LLC (“GFS”) – GFS, an affiliate of the Distributor, provides administration, fund accounting, and transfer agent services to the Trust. Pursuant to separate servicing agreements with GFS, the Funds pay GFS customary fees for providing administration, fund accounting, and transfer agency services to the Funds. Certain officers of the Trust are also officers of GFS and are not paid any fees directly by the Funds for serving in such capacities.
Northern Lights Compliance Services, LLC (“NLCS”) – NLCS, an affiliate of GFS and the Distributor, provides a Chief Compliance Officer to the Trust, as well as related compliance services, pursuant to a consulting agreement between NLCS and the Trust. Under the terms of such agreement, NLCS receives customary fees from the Funds.
Blu Giant, LLC (“Blu Giant”) – Blu Giant, an affiliate of GFS and the Distributor, provides EDGAR conversion and filing services as well as print management services for the Funds on an ad-hoc basis. For the provision of these services, Blu Giant receives customary fees from the Funds.
| 5. | AGGREGATE UNREALIZED APPRECIATION AND DEPRECIATION – TAX BASIS |
The identified cost of investments in securities owned by each Fund for federal income tax purposes, and its respective gross unrealized appreciation and depreciation at June 30, 2021, were as follows:
| Gross | Gross | |||||||||||||||
| Tax | Unrealized | Unrealized | Net Unrealized | |||||||||||||
| Cost | Appreciation | Depreciation | Appreciation | |||||||||||||
| Mid Cap Fund | $ | 235,363 | $ | 61,070 | $ | (4,189 | ) | $ | 56,881 | |||||||
| Small Cap Fund | 3,234,452 | 1,421,252 | (52,763 | ) | 1,368,489 | |||||||||||
61
| Acclivity Funds |
| NOTES TO FINANCIAL STATEMENTS (Unaudited)(Continued) |
| June 30, 2021 |
| 6. | SHAREHOLDERS & TAX COMPONENTS OF CAPITAL |
The tax character of fund distributions paid for the periods ended December 31, 2020 and December 31, 2019 was as follows:
| For fiscal year or period | Ordinary | Long-Term | ||||||||||
| ended December 31, 2020 | Income | Capital Gains | Total | |||||||||
| Mid Cap Fund | $ | — | $ | — | $ | — | ||||||
| Small Cap Fund | 55,589 | 266 | 55,855 | |||||||||
| For fiscal period ended | Ordinary | Long-Term | ||||||||||
| December 31, 2019 | Income | Capital Gains | Total | |||||||||
| Small Cap Fund | $ | 15,059 | $ | — | $ | 15,059 | ||||||
As of December 31, 2020, the components of accumulated earnings on a tax basis were as follows:
| Undistributed | Undistributed | Capital Loss | Other | Total | ||||||||||||||||||||||||
| Ordinary | Long-Term | Post October | Carry | Book/Tax | Unrealized | Accumulated | ||||||||||||||||||||||
| Income | Capital Gains | Loss | Forwards | Differences | Appreciation | Earnings | ||||||||||||||||||||||
| Mid Cap Fund | $ | 1,187 | $ | — | $ | — | $ | (15,169 | ) | $ | — | $ | 30,775 | $ | 16,793 | |||||||||||||
| Small Cap Fund | 46,060 | — | (6,398 | ) | (400,118 | ) | — | 643,953 | 283,497 | |||||||||||||||||||
The difference between book basis and tax basis distributable earnings is primarily attributable to the tax deferral of losses on wash sales, adjustments for partnerships, and C-Corporation return of capital distributions.
Capital losses incurred after October 31 within the fiscal year are deemed to arise on the first business day of the following fiscal year for tax purposes. The Small Cap Fund incurred and elected to defer such capital losses of $6,398.
62
| Acclivity Funds |
| NOTES TO FINANCIAL STATEMENTS (Unaudited)(Continued) |
| June 30, 2021 |
At December 31, 2020, the Funds had capital loss carry forwards for federal income tax purposes available to offset future capital gains as follows:
| Non-Expiring | Non-Expiring | |||||||||||
| Short-Term | Long-Term | Total | ||||||||||
| Mid Cap Fund | $ | 15,169 | $ | — | $ | 15,169 | ||||||
| Small Cap Fund | 391,432 | 8,686 | 400,118 | |||||||||
| 7. | CONTROL OWNERSHIP |
The beneficial ownership, either directly or indirectly, of more than 25% of the voting securities of a Fund creates presumption of control of the Fund, under Section 2(a)(9) of the 1940 Act. As of June 30, 2021, beneficial ownership in excess of 25% for the Funds is as follows:
| % of Outstanding | ||||
| Beneficial Owner | Shares | |||
| Mid Cap Fund | Innealta Capital, LLC | 100% | ||
| Small Cap Fund | National Financial Services, LLC | 71% |
The Trust has no knowledge as to whether all or any portion of the shares owned of record are also owned beneficially.
| 8. | SUBSEQUENT EVENTS |
Subsequent events after the date of the Statements of Assets and Liabilities have been evaluated through the date the financial statements were issued. Management has determined that no events or transactions occurred requiring adjustment or disclosure in the financial statements.
63
| Acclivity Funds |
| EXPENSE EXAMPLES (Unaudited) |
| June 30, 2021 |
As a shareholder of a Fund, you incur two types of costs: (1) transaction costs including redemption fees; and (2) ongoing costs, including advisory fees; distribution and/or service (12b-1) fees; and other Fund expenses. This example is intended to help you understand your ongoing costs (in dollars) of investing in the Funds and to compare these costs with the ongoing costs of investing in other mutual funds.
The example is based on an investment of $1,000 invested at the beginning of the period and held for the entire period from January 1, 2021 through June 30, 2021.
Actual Expenses
The “Actual Expenses” line in the table below provides information about actual account values and actual expenses. You may use the information below together with the amount you invested, to estimate the expenses that you paid over the period. Simply divide your account value by $1,000 (for example, an $8,600 account value divided by $1,000 = 8.6), then multiply the result by the number in the table under the heading entitled “Expenses Paid During Period” to estimate the expenses you paid on your account during this period.
Hypothetical Example for Comparison Purposes
The “Hypothetical” line in the table below provides information about hypothetical account values and hypothetical expenses based on the Funds’ actual expense ratios and an assumed rate of return of 5% per year before expenses, which are not the Funds’ actual returns. The hypothetical account values and expenses may not be used to estimate the actual ending account balances or expenses you paid for the period. You may use this information to compare this 5% hypothetical example with the 5% hypothetical examples that appear in the shareholder reports of other funds.
Please note that the expenses shown in the table are meant to highlight your ongoing costs only and do not reflect any transactional costs, such as redemption fees. Therefore, the table is useful in comparing ongoing costs only, and will not help you determine the relative total costs of owning different funds. In addition, if these transactional costs were included, your costs would have been higher.
| Beginning | Expenses Paid | Annualized | ||||||||||||||
| Account Value | Ending Account | During Period * | Expense Ratio | |||||||||||||
| Actual | 1/1/21 | Value 6/30/21 | 1/1/21-6/30/21 | During Period | ||||||||||||
| Acclivity Mid Cap Multi-Style Fund | ||||||||||||||||
| Class I | $ | 1,000.00 | $ | 1,163.00 | $ | 2.36 | 0.44% | |||||||||
| Class N | 1,000.00 | 1,163.00 | 3.70 | 0.69% | ||||||||||||
| Acclivity Small Cap Value Fund | ||||||||||||||||
| Class I | $ | 1,000.00 | $ | 1,312.30 | $ | 2.75 | 0.48% | |||||||||
| Class N | 1,000.00 | 1,310.40 | 4.18 | 0.73% | ||||||||||||
| Hypothetical (5% return before Expenses) | ||||||||||||||||
| Acclivity Mid Cap Multi-Style Fund | ||||||||||||||||
| Class I | $ | 1,000.00 | $ | 1,022.61 | $ | 2.21 | 0.44% | |||||||||
| Class N | 1,000.00 | 1,021.37 | 3.46 | 0.69% | ||||||||||||
| Acclivity Small Cap Value Fund | ||||||||||||||||
| Class I | $ | 1,000.00 | $ | 1,022.41 | $ | 2.41 | 0.48% | |||||||||
| Class N | 1,000.00 | 1,021.17 | 3.66 | 0.73% | ||||||||||||
| * | Expenses are equal to the average account value over the period, multiplied by a Fund’s annualized expense ratio, multiplied by the number of days in the period (181) divided by the number of days in the fiscal year (365). |
64
| Acclivity Funds |
| SUPPLEMENTAL INFORMATION (Unaudited) |
| June 30, 2021 |
FACTORS CONSIDERED BY THE TRUSTEES IN THE APPROVAL OF THE RENEWAL OF THE INVESTMENT ADVISORY AGREEMENT
At a Regular meeting (the “Meeting”) of the Board of Trustees (the “Board”) of Northern Lights Fund Trust II (the “Trust”) held on October 14, 2020, the Board, including the disinterested Trustees (the “Independent Trustees”), considered the renewal of the Investment Advisory Agreement between the Trust, on behalf of the Acclivity Small Cap Value Fund (“Acclivity Small Cap Value”) and Innealta Capital, LLC (“Innealta”) (the “Innealta Advisory Agreement”).
Based on their evaluation of the information provided by Innealta in conjunction with Acclivity Small Cap Value’s other service providers, the Board, by a unanimous vote (including a separate vote of the Independent Trustees), approved the renewal of the Innealta Advisory Agreement with respect to Acclivity Small Cap Value.
In advance of the Meeting, the Board requested and received materials to assist them in considering the renewal of the Innealta Advisory Agreement. The materials provided contained information with respect to the factors enumerated below, including the Innealta Advisory Agreement, a memorandum prepared by the Trust’s outside legal counsel discussing in detail the Trustees’ fiduciary obligations and the factors they should assess in considering the continuation of the Innealta Advisory Agreement and comparative information relating to the advisory fee and other expenses of Acclivity Small Cap Value. The materials also included due diligence materials relating to Innealta (including due diligence questionnaires completed by Innealta, select financial information of Innealta, bibliographic information regarding Innealta’s key management and investment advisory personnel, and comparative fee information relating to Acclivity Small Cap Value) and other pertinent information. At the Meeting, the Independent Trustees were advised by counsel that is experienced in Investment Company Act of 1940 matters and that is independent of fund management and met with such counsel separately from fund management.
The Board reviewed and discussed the written materials that were provided in advance of the Meeting and deliberated on the renewal of the Innealta Advisory Agreement with respect to Acclivity Small Cap Value. The Board relied upon the advice of independent legal counsel and their own business judgment in determining the material factors to be considered in evaluating the Innealta Advisory Agreement and the weight to be given to each such factor. The conclusions reached by the Board were based on a comprehensive evaluation of all of the information provided and were not the result of any one factor. Moreover, each Trustee may have afforded different weight to the various factors in reaching his conclusions with respect to the Innealta Advisory Agreement. In considering the approval of the renewal of the Innealta Advisory Agreement, the Board reviewed and analyzed various factors that they determined were relevant, including the factors enumerated below.
Nature, Extent and Quality of Services. The Board then reviewed materials provided by Innealta related to the approval of the renewal of the Innealta Advisory Agreement, including Innealta’s Form ADV and related schedules, a description of the manner in which investment decisions are made and executed, a review of the personnel performing services for Acclivity Small Cap Value, including the team of individuals that primarily monitor and execute the investment process. The Board discussed the extent of Innealta’s research capabilities, the quality of Innealta’s compliance infrastructure and the experience of its management personnel. The Board noted the recent hiring of Dr. Glenn Freed as an investment strategist and portfolio manager for certain Acclivity Funds. Additionally, the Board received satisfactory responses from the representative of Innealta with respect to a series of important questions, including: whether Innealta was involved in any lawsuits or pending regulatory actions; whether the management of other accounts would conflict with its management of Acclivity Small Cap Value; whether there were procedures in place to adequately allocate trades among its respective clients; and whether Innealta’s CCO would routinely review the portfolio managers’ performance of their duties to ensure compliance under Innealta’s compliance program. The Board also reviewed the information provided on the practices for monitoring compliance with Acclivity Small Cap Value’s investment limitations. The Board also discussed details of Innealta’s compliance program with the CCO of the Trust. The Board noted that the CCO of the Trust continued to represent that Innealta’s policies and procedures were reasonably designed to prevent violations of applicable federal securities laws. The Board also noted Innealta’s representation that the prospectus and statement of additional information for Acclivity Small Cap Value accurately describe the investment strategies of Acclivity Small Cap Value. The Board
65
| Acclivity Funds |
| SUPPLEMENTAL INFORMATION (Unaudited)(Continued) |
| June 30, 2021 |
then reviewed the capitalization of Innealta based on financial information provided, and representations made by Innealta and its representatives, and concluded that Innealta was sufficiently well-capitalized, or Innealta’s owners had the ability to make additional contributions in order to meet its obligations to Acclivity Small Cap Value. The Board concluded that Innealta had sufficient quality and depth of personnel, resources, investment methods and compliance policies and procedures essential to performing its duties under the Innealta Advisory Agreement and that the nature, overall quality and extent of the management services to be provided by Innealta to Acclivity Small Cap Value were satisfactory.
Performance. The Board then discussed the reports prepared by Broadridge and reviewed the performance for the one year and since inception periods for Acclivity Small Cap Value as of August 31, 2020. The Board noted that Acclivity Small Cap Value outperformed the peer group median and Morningstar category median but underperformed its benchmark (the S&P 500 Total Return Index) for the one year period, and outperformed the peer group median but underperformed the Morningstar category median and benchmark for the since inception period. The Board noted the portfolio managers’ ability to manage risk and the recent addition of investment team personnel. After further discussion, the Board concluded that Acclivity Small Cap Value’s past performance was acceptable and generally in line with its risk level.
Fees and Expenses. As to the costs of the services to be provided by Innealta, the Board reviewed and discussed the Acclivity Small Cap Value’s advisory fee and total operating expenses as compared to its peer group and its Morningstar category as presented in the Broadridge Reports. The Board reviewed the contractual arrangements, noting that Innealta charges an advisory fee at an annual rate of 0.39% of the average daily net assets of Acclivity Small Cap Value under the Innealta Advisory Agreement. The Board noted the advisory fee for Acclivity Small Cap Value was significantly lower than the peer group median and Morningstar category median. The Board also reviewed the net expenses for Acclivity Small Cap Value as compared to its peer group and Morningstar category. The Board then reviewed the Operating Expenses Limitation Agreement noting that Innealta had agreed to waive or limit its advisory fee and/or reimburse expenses at least until April 30, 2022, in order to limit net annual operating expenses, exclusive of certain fees, so as not to exceed 0.48% and 0.73% of Acclivity Small Cap Value’s average net assets for Class I and Class N shares, respectively and found such arrangements to be beneficial to shareholders. The Board concluded that, based on Innealta’s experience, expertise and services provided to Acclivity Small Cap Value, the advisory fee charged by Innealta for Acclivity Small Cap Value was not unreasonable. The Board also noted their approval to lower the advisory fee and expense cap of Acclivity Small Cap Value at its meeting on April 22, 2020.
Profitability. The Board also considered the level of profits that could be expected to accrue to Innealta with respect to Acclivity Small Cap Value based on profitability reports and analyses prepared by Innealta and reviewed by the Board and the selected financial information of Innealta provided by Innealta. After review and discussion, the Board concluded that the anticipated profit from Innealta’s relationship with Acclivity Small Cap Value was not excessive.
Economies of Scale. As to the extent to which Acclivity Small Cap Value would realize economies of scale as it grew, and whether the fee levels reflect these economies of scale for the benefit of investors, the Board discussed the current size of Acclivity Small Cap Value, Innealta’s expectations for growth of Acclivity Small Cap Value, and concluded that any material economies of scale would not be achieved in the near term.
Conclusion. Having requested and received such information from Innealta as the Board believed to be reasonably necessary to evaluate the terms of the Innealta Advisory Agreement, and as assisted by the advice of independent counsel, the Board, including a majority of the Independent Trustees voting separately, determined that (a) the terms of the Innealta Advisory Agreement are not unreasonable with respect to Acclivity Small Cap Value; (b) the investment advisory fee payable for Acclivity Small Cap Value pursuant to the Innealta Advisory Agreement is not unreasonable; and (c) the Innealta Advisory Agreement is in the best interests of Acclivity Small Cap Value and its shareholders. In considering the renewal of the Innealta Advisory Agreement, the Board did not identify any one factor as all important, but rather considered these factors collectively and determined that approval of the renewal of the Innealta Advisory Agreement was in the best interest Acclivity Small Cap Value and its shareholders. Moreover, the Board noted that each Trustee may have afforded different weight to the various factors in reaching his conclusions with respect to the Innealta Advisory Agreement.
66
Privacy Policy
Rev. May 2021
| FACTS | WHAT DOES NORTHERN LIGHTS FUND TRUST II (“NLFT II”) DO WITH YOUR PERSONAL INFORMATION? | |
| Why? | Financial companies choose how they share your personal information. Federal law gives consumers the right to limit some but not all sharing. Federal law also requires us to tell you how we collect, share, and protect your personal information. Please read this notice carefully to understand what we do. | |
| What? | The
types of personal information we collect and share depend on the product or service you have with us. This information can
include: | |
● Social Security number
● Employment information
● Account balances |
● Account transactions
● Income
● Investment experience | |
When you are no longer our customer, we continue to share your information as described in this notice. | ||
| How? | All financial companies need to share a customer’s personal information to run their everyday business - to process transactions, maintain customer accounts, and report to credit bureaus. In the section below, we list the reasons financial companies can share their customer’s personal information; the reasons NLFT II chooses to share; and whether you can limit this sharing. | |
| Reasons we can share your personal information | Does
NLFT II share? |
Can
you limit this sharing? |
For our everyday business purposes — such as to process your transactions, maintain your account(s), respond to court orders and legal investigations, or report to credit bureaus |
Yes | No |
For our marketing purposes — to offer our products and services to you |
Yes | No |
For joint marketing with other financial companies |
Yes | No |
For our affiliates’ everyday business purposes — information about your transactions and experiences |
Yes | No |
For our affiliates’ everyday business purposes — information about your creditworthiness |
No | We don’t share |
For nonaffiliates to market to you |
No | We don’t share |
| Questions? | Call 1-631-490-4300 |
67
| Who we are | ||
| Who is providing this notice? | Northern Lights Fund Trust II | |
| What we do | ||
| How does NLFT II protect my personal information? | To
protect your personal information from unauthorized access and use, we use security measures that comply with federal law. These
measures include computer safeguards and secured files and buildings. | |
| How does NLFT II collect my personal information? | We
collect your personal information, for example, when you | |
● open an account
● give us your income information
● provide employment information
|
● provide account information
● give us your contact information | |
| We also collect your personal information from others, such as credit bureaus, affiliates, or other companies. | ||
| Why can’t I limit all sharing? | Federal law gives you the right to limit only
● sharing for affiliates’ everyday business purposes—information about your creditworthiness
● affiliates from using your information to market to you
● sharing for nonaffiliates to market to you
State laws and individual companies may give you additional rights to limit sharing. | |
| Definitions | ||
| Affiliates | Companies related by common ownership or control. They can be financial and nonfinancial companies.
● NLFT II has no affiliates.
| |
| Nonaffiliates | Companies not related by common ownership or control. They can be financial and nonfinancial companies.
● NLFT II does not share with nonaffiliates so they can market to you. | |
| Joint marketing | A formal agreement between nonaffiliated financial companies that together market financial products and services to you.
● Our joint marketing partners include other financial service companies. | |
68
PROXY VOTING POLICY
Information regarding how the Funds voted proxies relating to portfolio securities for the most recent twelve month period ended June 30 as well as a description of the policies and procedures that the Funds use to determine how to vote proxies is available without charge, upon request, by calling 1-855-873-3837 or by referring to the Securities and Exchange Commission’s (“SEC”) website at http://www.sec.gov.
PORTFOLIO HOLDINGS
Funds file a complete schedule of portfolio holdings with the Securities and Exchange Commission (the “SEC”) for the first and third quarters of each fiscal year as an exhibit to its reports on Form N-PORT, within sixty days after the end of the period. Form N-PORT reports are available at the SEC’s website at www.sec.gov.
| INVESTMENT ADVISER |
| Innealta Capital, LLC |
| 13215 Bee Cave Pkwy, Bldg A, Suite 240 |
| Austin, Texas 78738 |
| ADMINISTRATOR |
| Gemini Fund Services, LLC |
| 4221 North 203rd Street, Suite 100 |
| Elkhorn, Nebraska 68022 |
| Acclivity-SAR-21 |
(a) Include a copy of the report transmitted to stockholders pursuant to Rule 30e-1 under the Act (17 CFR 270.30e-1).
(b) Include a copy of each notice transmitted to stockholders in reliance on Rule 30e-3 under the Act (17 CFR 270.30e-3) that contains disclosures specified by paragraph (c)(3) of that rule.
Item 2. Code of Ethics. Not applicable.
Item 3. Audit Committee Financial Expert. Not applicable.
Item 4. Principal Accountant Fees and Services. Not applicable.
Item 5. Audit Committee of Listed Companies. Not applicable to open-end investment companies.
Item 6. Schedule of Investments. Schedule of investments in securities of unaffiliated issuers is included under Item 1.
Item 7. Disclosure of Proxy Voting Policies and Procedures for Closed-End Funds. Not applicable to open-end investment companies.
Item 8. Portfolio Managers of Closed-End Management Investment Companies. Not applicable to open-end investment companies.
Item 9. Purchases of Equity Securities by Closed-End Funds. Not applicable to open-end investment companies.
Item 10. Submission of Matters to a Vote of Security Holders. None
Item 11. Controls and Procedures.
(a) Based on an evaluation of the Registrant’s disclosure controls and procedures as of a date within 90 days of filing date of this Form N-CSR, the principal executive officer and principal financial officer of the Registrant have concluded that the disclosure controls and procedures of the Registrant are reasonably designed to ensure that the information required in filings on Form N-CSR is recorded, processed, summarized, and reported by the filing date, including that information required to be disclosed is accumulated and communicated to the Registrant’s management, including the Registrant’s principal executive officer and principal financial officer, as appropriate to allow timely decisions regarding required disclosure.
(b) There were no significant changes in the Registrant’s internal control over financial reporting that occurred during the Registrant’s last fiscal half-year that have materially affected, or are reasonably likely to materially affect, the Registrant’s internal control over financial reporting.
Item 12. Disclosure of Securities Lending Activities for Closed-End Management Investment Companies. Not applicable to open-end investment companies.
Item 13. Exhibits.
(a)(1) Not applicable.
(a)(3) Not applicable for open-end investment companies.
SIGNATURES
Pursuant to the requirements of the Securities Exchange Act of 1934 and the Investment Company Act of 1940, the registrant has duly caused this report to be signed on its behalf by the undersigned, thereunto duly authorized.
(Registrant) Northern Lights Fund Trust II
By (Signature and Title)
/s/ Kevin E. Wolf
Kevin E. Wolf, Principal Executive Officer/President
Date 09/03/21
Pursuant to the requirements of the Securities Exchange Act of 1934 and the Investment Company Act of 1940, this report has been signed below by the following persons on behalf of the registrant and in the capacities and on the dates indicated.
By (Signature and Title)
/s/ Kevin E. Wolf
Kevin E. Wolf, Principal Executive Officer/President
Date 09/03/21
By (Signature and Title)
/s/ Erik Naviloff
Erik Naviloff, Principal Financial Officer/Treasurer
Date 09/03/21
CERTIFICATIONS
I, Kevin E. Wolf, certify that:
1. I have reviewed this report on Form N-CSR of Acclivity Mid Cap Multi-Style Fund and Acclivity Small Cap Value Fund (each a series of Northern Lights Fund Trust II);
2. Based on my knowledge, this report does not contain any untrue statement of a material fact or omit to state a material fact necessary to make the statements made, in light of the circumstances under which such statements were made, not misleading with respect to the period covered by this report;
3. Based on my knowledge, the financial statements, and other financial information included in this report, fairly present in all material respects the financial condition, results of operations, changes in net assets, and cash flows (if the financial statements are required to include a statement of cash flows) of the registrant as of, and for, the periods presented in this report;
4. The registrant's other certifying officer(s) and I are responsible for establishing and maintaining disclosure controls and procedures (as defined in Rule 30a-3(c) under the Investment Company Act of 1940) and internal control over financial reporting (as defined in Rule 30a-3(d) under the Investment Company Act of 1940) for the registrant and have:
a) designed such disclosure controls and procedures, or caused such disclosure controls and procedures to be designed under our supervision, to ensure that material information relating to the registrant, including its consolidated subsidiaries, is made known to us by others within those entities, particularly during the period in which this report is being prepared;
b) designed such internal control over financial reporting, or caused such internal control over financial reporting to be designed under our supervision, to provide reasonable assurance regarding the reliability of financial reporting and the preparation of financial statements for external purposes in accordance with generally accepted accounting principles;
c) evaluated the effectiveness of the registrant's disclosure controls and procedures and presented in this report our conclusions about the effectiveness of the disclosure controls and procedures, as of a date within 90 days prior to the filing date of this report based on such evaluation; and
d) disclosed in this report any change in the registrant’s internal control over financial reporting that occurred during the second fiscal quarter of the period covered by this report that has materially affected, or is reasonably likely to materially affect, the registrant’s internal control over financial reporting; and
5. The registrant's other certifying officer(s) and I have disclosed to the registrant's auditors and the audit committee of the registrant's board of directors (or persons performing the equivalent functions):
a) all significant deficiencies and material weaknesses in the design or operation of internal control over financial reporting which are reasonably likely to adversely affect the registrant's ability to record, process, summarize, and report financial information; and
b) any fraud, whether or not material, that involves management or other employees who have a significant role in the registrant's internal control over financial reporting.
Date: 09/03/21 /s/ Kevin E. Wolf
Kevin E. Wolf
Principal Executive Officer/President
I, Erik Naviloff, certify that:
1. I have reviewed this report on Form N-CSR of Acclivity Mid Cap Multi-Style Fund and Acclivity Small Cap Value Fund (each a series of Northern Lights Fund Trust II);
2. Based on my knowledge, this report does not contain any untrue statement of a material fact or omit to state a material fact necessary to make the statements made, in light of the circumstances under which such statements were made, not misleading with respect to the period covered by this report;
3. Based on my knowledge, the financial statements, and other financial information included in this report, fairly present in all material respects the financial condition, results of operations, changes in net assets, and cash flows (if the financial statements are required to include a statement of cash flows) of the registrant as of, and for, the periods presented in this report;
4. The registrant's other certifying officer(s) and I are responsible for establishing and maintaining disclosure controls and procedures (as defined in Rule 30a-3(c) under the Investment Company Act of 1940) and internal control over financial reporting (as defined in Rule 30a-3(d) under the Investment Company Act of 1940) for the registrant and have:
a) designed such disclosure controls and procedures, or caused such disclosure controls and procedures to be designed under our supervision, to ensure that material information relating to the registrant, including its consolidated subsidiaries, is made known to us by others within those entities, particularly during the period in which this report is being prepared;
b) designed such internal control over financial reporting, or caused such internal control over financial reporting to be designed under our supervision, to provide reasonable assurance regarding the reliability of financial reporting and the preparation of financial statements for external purposes in accordance with generally accepted accounting principles;
c) evaluated the effectiveness of the registrant's disclosure controls and procedures and presented in this report our conclusions about the effectiveness of the disclosure controls and procedures, as of a date within 90 days prior to the filing date of this report based on such evaluation; and
d) disclosed in this report any change in the registrant’s internal control over financial reporting that occurred during the second fiscal quarter of the period covered by this report that has materially affected, or is reasonably likely to materially affect, the registrant’s internal control over financial reporting; and
5. The registrant's other certifying officer(s) and I have disclosed to the registrant's auditors and the audit committee of the registrant's board of directors (or persons performing the equivalent functions):
a) all significant deficiencies and material weaknesses in the design or operation of internal control over financial reporting which are reasonably likely to adversely affect the registrant's ability to record, process, summarize, and report financial information; and
b) any fraud, whether or not material, that involves management or other employees who have a significant role in the registrant's internal control over financial reporting.
Date: 09/03/21 /s/ Erik Naviloff
Erik Naviloff
Principal Financial
Officer/Treasurer
certification
Kevin E. Wolf , Principal Executive Officer/President, and Erik Naviloff, Principal Financial Officer/Treasurer of Northern Lights Fund Trust II (the “Registrant”), each certify to the best of his knowledge that:
1. The Registrant’s periodic report on Form N-CSR for the period ended June 30, 2021 (the “Form N-CSR”) fully complies with the requirements of Sections 15(d) of the Securities Exchange Act of 1934, as amended; and
2. The information contained in the Form N-CSR fairly presents, in all material respects, the financial condition and results of operations of the Registrant.
| Principal Executive Officer/President | Principal Financial Officer/Treasurer | |
| Northern Lights Fund Trust II | Northern Lights Fund Trust II | |
| /s/Kevin E. Wolf | /s/ Erik Naviloff | |
| Kevin E. Wolf | Erik Naviloff | |
| Date: 09/03/21 | Date: 09/03/21 |
A signed original of this written statement required by Section 906 of the Sarbanes-Oxley Act of 2002 has been provided to the Northern Lights Fund Trust II and will be retained by the Northern Lights Fund Trust II and furnished to the Securities and Exchange Commission (the “Commission”) or its staff upon request.
This certification is being furnished to the Commission solely pursuant to 18 U.S.C. § 1350 and is not being filed as part of the Form N-CSR filed with the Commission.
Serious News for Serious Traders! Try StreetInsider.com Premium Free!
You May Also Be Interested In
- Interra Provides Rip Copper Molybdenum Project Exploration Update
- Amendment of the terms concerning Convertible Bonds 2021/1, 2021/2, 2021/3, 2021/4 and 2022/1 issued by Digitalist Group Plc
- Future Works Announces Official Launch: Unlocking Leaps in Innovation with Bespoke AI Solutions
Create E-mail Alert Related Categories
SEC FilingsSign up for StreetInsider Free!
Receive full access to all new and archived articles, unlimited portfolio tracking, e-mail alerts, custom newswires and RSS feeds - and more!
