

Form N-CSRS EATON VANCE SERIES TRUST For: Jun 30
 Tweet
Tweet Share
Share
UNITED STATES
SECURITIES AND EXCHANGE COMMISSION
Washington, D.C. 20549
Form N-CSR
CERTIFIED SHAREHOLDER REPORT OF REGISTERED
MANAGEMENT INVESTMENT COMPANIES
Investment Company Act File Number: 811-02589
Eaton Vance Series Trust
(Exact Name of Registrant as Specified in Charter)
Two International Place, Boston, Massachusetts 02110
(Address of Principal Executive Offices)
Deidre E. Walsh
Two International Place, Boston, Massachusetts 02110
(Name and Address of Agent for Services)
(617) 482-8260
(Registrant’s Telephone Number)
December 31
Date of Fiscal Year End
June 30, 2021
Date of Reporting Period
| Item 1. | Reports to Stockholders |

Eaton Vance
Tax-Managed Growth Fund 1.0
Semiannual Report
June 30, 2021

Commodity Futures Trading Commission Registration. The Commodity Futures Trading Commission (“CFTC”) has adopted regulations that subject registered investment companies and advisers to regulation by the CFTC if a fund invests more than a prescribed level of its assets in certain CFTC-regulated instruments (including futures, certain options and swap agreements) or markets itself as providing investment exposure to such instruments. The investment adviser has claimed an exclusion from the definition of “commodity pool operator” under the Commodity Exchange Act with respect to its management of the Fund. Accordingly, neither the Fund nor the adviser with respect to the operation of the Fund is subject to CFTC regulation. Because of its management of other strategies, the Fund’s adviser is registered with the CFTC as a commodity pool operator. The adviser is also registered as a commodity trading advisor.
Fund shares are not insured by the FDIC and are not deposits or other obligations of, or guaranteed by, any depository institution. Shares are subject to investment risks, including possible loss of principal invested.
Semiannual Report June 30, 2021
Eaton Vance
Tax-Managed Growth Fund 1.0
| 2 | ||||
| 2 | ||||
| 3 | ||||
| 4 | ||||
| 5 | ||||
| 32 | ||||
| 33 | ||||
| 34 | ||||
| 35 | ||||
| 37 |
Eaton Vance
Tax-Managed Growth Fund 1.0
June 30, 2021
Portfolio Managers Lewis R. Piantedosi, Michael A. Allison, CFA and Yana S. Barton, CFA
| % Average Annual Total Returns | Inception Date | Performance Inception Date |
Six Months | One Year | Five Years | Ten Years | ||||||||||||||||||
| Fund at NAV |
03/29/1966 | 03/29/1966 | 14.89 | % | 44.23 | % | 18.29 | % | 14.75 | % | ||||||||||||||
|
| ||||||||||||||||||||||||
| S&P 500® Index |
— | — | 15.25 | % | 40.79 | % | 17.64 | % | 14.83 | % | ||||||||||||||
| % After-Tax Returns | Inception Date | Performance Inception Date |
One Year | Five Years | Ten Years | |||||||||||||||||||
| After Taxes on Distributions |
03/29/1966 | 03/29/1966 | 43.99 | % | 17.99 | % | 14.43 | % | ||||||||||||||||
| After Taxes on Distributions and Sale of Fund Shares |
— | — | 26.37 | 15.36 | 12.74 | |||||||||||||||||||
See Endnotes and Additional Disclosures in this report.
Past performance is no guarantee of future results. Returns are historical and are calculated by determining the percentage change in net asset value (NAV) or offering price (as applicable) with all distributions reinvested. Investment return and principal value will fluctuate so that shares, when redeemed, may be worth more or less than their original cost. Performance for periods less than or equal to one year is cumulative. Performance is for the stated time period only; due to market volatility, current Fund performance may be lower or higher than the quoted return. For performance as of the most recent month-end, please refer to eatonvance.com.
| 2 |
Eaton Vance
Tax-Managed Growth Fund 1.0
June 30, 2021
Endnotes and Additional Disclosures
| 3 |
Eaton Vance
Tax-Managed Growth Fund 1.0
June 30, 2021
Example: As a Fund shareholder, you incur two types of costs: (1) transaction costs, including sales charges (loads) on purchases and redemption fees (if applicable); and (2) ongoing costs, including management fees; distribution and/or service fees; and other Fund expenses. This Example is intended to help you understand your ongoing costs (in dollars) of Fund investing and to compare these costs with the ongoing costs of investing in other mutual funds. The Example is based on an investment of $1,000 invested at the beginning of the period and held for the entire period (January 1, 2021 – June 30, 2021).
Actual Expenses: The first section of the table below provides information about actual account values and actual expenses. You may use the information in this section, together with the amount you invested, to estimate the expenses that you paid over the period. Simply divide your account value by $1,000 (for example, an $8,600 account value divided by $1,000 = 8.6), then multiply the result by the number in the first section under the heading entitled “Expenses Paid During Period” to estimate the expenses you paid on your account during this period.
Hypothetical Example for Comparison Purposes: The second section of the table below provides information about hypothetical account values and hypothetical expenses based on the actual Fund expense ratio and an assumed rate of return of 5% per year (before expenses), which is not the actual Fund return. The hypothetical account values and expenses may not be used to estimate the actual ending account balance or expenses you paid for the period. You may use this information to compare the ongoing costs of investing in your Fund and other funds. To do so, compare this 5% hypothetical example with the 5% hypothetical examples that appear in the shareholder reports of the other funds.
Please note that the expenses shown in the table are meant to highlight your ongoing costs only and do not reflect any transactional costs, such as sales charges (loads) or redemption fees (if applicable). Therefore, the second section of the table is useful in comparing ongoing costs only, and will not help you determine the relative total costs of owning different funds. In addition, if these transactional costs were included, your costs would be higher.
| Beginning Account Value (1/1/21) |
Ending Account Value (6/30/21) |
Expenses Paid During Period* (1/1/21 – 6/30/21) |
Annualized Expense Ratio |
|||||||||||||
| Actual |
||||||||||||||||
| $ | 1,000.00 | $ | 1,148.90 | $ | 2.40 | 0.45 | % | |||||||||
| Hypothetical |
||||||||||||||||
| (5% return per year before expenses) |
| |||||||||||||||
| $ | 1,000.00 | $ | 1,022.60 | $ | 2.26 | 0.45 | % | |||||||||
| * | Expenses are equal to the Fund’s annualized expense ratio, multiplied by the average account value over the period, multiplied by 181/365 (to reflect the one-half year period). The Example assumes that the $1,000 was invested at the net asset value per share determined at the close of business on December 31, 2020. The Example reflects the expenses of both the Fund and the Portfolio. |
| 4 |
Eaton Vance
Tax-Managed Growth Fund 1.0
June 30, 2021
Statement of Assets and Liabilities (Unaudited)
| Assets | June 30, 2021 | |||
| Investment in Tax-Managed Growth Portfolio, at value (identified cost, $202,367,085) |
$ | 1,337,054,974 | ||
| Total assets |
$ | 1,337,054,974 | ||
| Liabilities | ||||
| Payable for Fund shares redeemed |
$ | 45,588 | ||
| Payable to affiliates: |
||||
| Trustees’ fees |
125 | |||
| Accrued expenses |
76,916 | |||
| Total liabilities |
$ | 122,629 | ||
| Net Assets |
$ | 1,336,932,345 | ||
| Sources of Net Assets | ||||
| Paid-in capital |
$ | 24,482,324 | ||
| Distributable earnings |
1,312,450,021 | |||
| Total |
$ | 1,336,932,345 | ||
| Net Asset Value and Redemption Price Per Share | ||||
| ($1,336,932,345 ÷ 693,815 shares of beneficial interest outstanding) |
$ | 1,926.93 | ||
| 5 | See Notes to Financial Statements. |
Eaton Vance
Tax-Managed Growth Fund 1.0
June 30, 2021
Statement of Operations (Unaudited)
| Investment Income | Six Months Ended June 30, 2021 |
|||
| Dividends allocated from Portfolio (net of foreign taxes, $93,871) |
$ | 7,294,519 | ||
| Expenses allocated from Portfolio |
(2,706,719 | ) | ||
| Total investment income from Portfolio |
$ | 4,587,800 | ||
| Expenses | ||||
| Trustees’ fees and expenses |
$ | 250 | ||
| Custodian fee |
32,217 | |||
| Transfer and dividend disbursing agent fees |
45,017 | |||
| Professional fees |
21,119 | |||
| Printing and postage |
2,468 | |||
| Miscellaneous |
8,228 | |||
| Total expenses |
$ | 109,299 | ||
| Net investment income |
$ | 4,478,501 | ||
| Realized and Unrealized Gain (Loss) from Portfolio | ||||
| Net realized gain (loss) — |
||||
| Investment transactions(1) |
$ | 15,116,101 | ||
| Foreign currency transactions |
(174 | ) | ||
| Net realized gain |
$ | 15,115,927 | ||
| Change in unrealized appreciation (depreciation) — |
||||
| Investments |
$ | 156,195,918 | ||
| Foreign currency |
(3,626 | ) | ||
| Net change in unrealized appreciation (depreciation) |
$ | 156,192,292 | ||
| Net realized and unrealized gain |
$ | 171,308,219 | ||
| Net increase in net assets from operations |
$ | 175,786,720 | ||
| (1) | Includes $15,273,187 of net realized gains from redemptions in-kind. |
| 6 | See Notes to Financial Statements. |
Eaton Vance
Tax-Managed Growth Fund 1.0
June 30, 2021
Statements of Changes in Net Assets
| Increase (Decrease) in Net Assets | Six Months Ended June 30, 2021 |
Year Ended December 31, 2020 |
||||||
| From operations — |
||||||||
| Net investment income |
$ | 4,478,501 | $ | 10,798,713 | ||||
| Net realized gain |
15,115,927 | 26,115,697 | ||||||
| Net change in unrealized appreciation (depreciation) |
156,192,292 | 189,846,732 | ||||||
| Net increase in net assets from operations |
$ | 175,786,720 | $ | 226,761,142 | ||||
| Distributions to shareholders |
$ | (4,549,936 | ) | $ | (10,770,512 | ) | ||
| Transactions in shares of beneficial interest — |
||||||||
| Net asset value of shares issued to shareholders in payment of distributions declared |
$ | 1,205,297 | $ | 2,676,508 | ||||
| Cost of shares redeemed |
(32,196,850 | ) | (55,713,335 | ) | ||||
| Net decrease in net assets from Fund share transactions |
$ | (30,991,553 | ) | $ | (53,036,827 | ) | ||
| Net increase in net assets |
$ | 140,245,231 | $ | 162,953,803 | ||||
| Net Assets | ||||||||
| At beginning of period |
$ | 1,196,687,114 | $ | 1,033,733,311 | ||||
| At end of period |
$ | 1,336,932,345 | $ | 1,196,687,114 | ||||
| 7 | See Notes to Financial Statements. |
Eaton Vance
Tax-Managed Growth Fund 1.0
June 30, 2021
Financial Highlights
| Six Months Ended June 30, 2021 (Unaudited) |
Year Ended December 31, | |||||||||||||||||||||||
| 2020 | 2019 | 2018 | 2017 | 2016 | ||||||||||||||||||||
| Net asset value — Beginning of period |
$ | 1,683.170 | $ | 1,378.390 | $ | 1,075.910 | $ | 1,146.130 | $ | 946.160 | $ | 880.890 | ||||||||||||
| Income (Loss) From Operations | ||||||||||||||||||||||||
| Net investment income(1) |
$ | 6.371 | $ | 14.813 | $ | 15.815 | $ | 14.556 | $ | 13.613 | $ | 12.991 | ||||||||||||
| Net realized and unrealized gain (loss) |
243.889 | 304.817 | 302.465 | (70.176 | ) | 200.107 | 65.579 | |||||||||||||||||
| Total income (loss) from operations |
$ | 250.260 | $ | 319.630 | $ | 318.280 | $ | (55.620 | ) | $ | 213.720 | $ | 78.570 | |||||||||||
| Less Distributions | ||||||||||||||||||||||||
| From net investment income |
$ | (6.500 | ) | $ | (14.850 | ) | $ | (15.800 | ) | $ | (14.180 | ) | $ | (13.750 | ) | $ | (13.300 | ) | ||||||
| Tax return of capital |
— | — | — | (0.420 | ) | — | — | |||||||||||||||||
| Total distributions |
$ | (6.500 | ) | $ | (14.850 | ) | $ | (15.800 | ) | $ | (14.600 | ) | $ | (13.750 | ) | $ | (13.300 | ) | ||||||
| Net asset value — End of period |
$ | 1,926.930 | $ | 1,683.170 | $ | 1,378.390 | $ | 1,075.910 | $ | 1,146.130 | $ | 946.160 | ||||||||||||
| Total Return(2) |
14.89 | %(3) | 23.49 | % | 29.83 | % | (5.04 | )% | 22.73 | % | 9.00 | % | ||||||||||||
| Ratios/Supplemental Data | ||||||||||||||||||||||||
| Net assets, end of period (000’s omitted) |
$ | 1,336,932 | $ | 1,196,687 | $ | 1,033,733 | $ | 861,445 | $ | 983,065 | $ | 827,340 | ||||||||||||
| Ratios (as a percentage of average daily net assets):(4) |
||||||||||||||||||||||||
| Expenses |
0.45 | %(5) | 0.46 | % | 0.47 | % | 0.48 | % | 0.48 | % | 0.49 | % | ||||||||||||
| Net investment income |
0.71 | %(5) | 1.06 | % | 1.27 | % | 1.23 | % | 1.31 | % | 1.46 | % | ||||||||||||
| Portfolio Turnover of the Portfolio(6) |
0 | %(3)(7) | 1 | % | 1 | % | 1 | % | 0 | %(7) | 1 | % | ||||||||||||
| (1) | Computed using average shares outstanding. |
| (2) | Returns are historical and are calculated by determining the percentage change in net asset value with all distributions reinvested. |
| (3) | Not annualized. |
| (4) | Includes the Fund’s share of the Portfolio’s allocated expenses. |
| (5) | Annualized. |
| (6) | Excludes the value of portfolio securities contributed or distributed as a result of in-kind shareholder transactions. The portfolio turnover of the Portfolio including in-kind contributions and distributions of securities was 2%, 6%, 6%, 6%, 5% and 6% for the six months ended June 30, 2021 and the years ended December 31, 2020, 2019, 2018, 2017 and 2016, respectively. |
| (7) | Amount is less than 0.5%. |
| 8 | See Notes to Financial Statements. |
Eaton Vance
Tax-Managed Growth Fund 1.0
June 30, 2021
Notes to Financial Statements (Unaudited)
1 Significant Accounting Policies
Eaton Vance Tax-Managed Growth Fund 1.0 (the Fund) is a diversified series of the Eaton Vance Series Trust (the Trust). The Trust is a Massachusetts business trust registered under the Investment Company Act of 1940, as amended, as an open-end management investment company. The Fund invests all of its investable assets in interests in Tax-Managed Growth Portfolio (the Portfolio), a Massachusetts business trust, having the same investment objective and policies as the Fund. The value of the Fund’s investment in the Portfolio reflects the Fund’s proportionate interest in the net assets of the Portfolio (4.0% at June 30, 2021). The performance of the Fund is directly affected by the performance of the Portfolio. The financial statements of the Portfolio, including the portfolio of investments, are included elsewhere in this report and should be read in conjunction with the Fund’s financial statements.
The following is a summary of significant accounting policies of the Fund. The policies are in conformity with accounting principles generally accepted in the United States of America (U.S. GAAP). The Fund is an investment company and follows accounting and reporting guidance in the Financial Accounting Standards Board (FASB) Accounting Standards Codification Topic 946 “Financial Services — Investment Companies.”
A Investment Valuation — Valuation of securities by the Portfolio is discussed in Note 1A of the Portfolio’s Notes to Financial Statements, which are included elsewhere in this report.
B Income — The Fund’s net investment income or loss consists of the Fund’s pro-rata share of the net investment income or loss of the Portfolio, less all actual and accrued expenses of the Fund.
C Federal Taxes — The Fund’s policy is to comply with the provisions of the Internal Revenue Code applicable to regulated investment companies and to distribute to shareholders each year substantially all of its net investment income, and all or substantially all of its net realized capital gains. Accordingly, no provision for federal income or excise tax is necessary.
As of June 30, 2021, the Fund had no uncertain tax positions that would require financial statement recognition, de-recognition, or disclosure. The Fund files a U.S. federal income tax return annually after its fiscal year-end, which is subject to examination by the Internal Revenue Service for a period of three years from the date of filing.
D Expenses — The majority of expenses of the Trust are directly identifiable to an individual fund. Expenses which are not readily identifiable to a specific fund are allocated taking into consideration, among other things, the nature and type of expense and the relative size of the funds.
E Use of Estimates — The preparation of the financial statements in conformity with U.S. GAAP requires management to make estimates and assumptions that affect the reported amounts of assets and liabilities at the date of the financial statements and the reported amounts of income and expense during the reporting period. Actual results could differ from those estimates.
F Indemnifications — Under the Trust’s organizational documents, its officers and Trustees may be indemnified against certain liabilities and expenses arising out of the performance of their duties to the Fund. Under Massachusetts law, if certain conditions prevail, shareholders of a Massachusetts business trust (such as the Trust) could be deemed to have personal liability for the obligations of the Trust. However, the Trust’s Declaration of Trust contains an express disclaimer of liability on the part of Fund shareholders and the By-laws provide that the Trust shall assume, upon request by the shareholder, the defense on behalf of any Fund shareholders. Moreover, the By-laws also provide for indemnification out of Fund property of any shareholder held personally liable solely by reason of being or having been a shareholder for all loss or expense arising from such liability. Additionally, in the normal course of business, the Fund enters into agreements with service providers that may contain indemnification clauses. The Fund’s maximum exposure under these arrangements is unknown as this would involve future claims that may be made against the Fund that have not yet occurred.
G Other — Investment transactions are accounted for on a trade date basis.
H Interim Financial Statements — The interim financial statements relating to June 30, 2021 and for the six months then ended have not been audited by an independent registered public accounting firm, but in the opinion of the Fund’s management, reflect all adjustments, consisting only of normal recurring adjustments, necessary for the fair presentation of the financial statements.
2 Distributions to Shareholders and Income Tax Information
It is the present policy of the Fund to make quarterly distributions of all or substantially all of its net investment income and to distribute annually all or substantially all of its net realized capital gains (reduced by available capital loss carryforwards from prior years). Distributions to shareholders are recorded on the ex-dividend date. Shareholders may reinvest income and capital gain distributions in additional shares of the Fund at the net asset value as of the ex-dividend date or, at the election of the shareholder, receive distributions in cash. Distributions to shareholders are determined in accordance with income tax regulations, which may differ from U.S. GAAP. As required by U.S. GAAP, only distributions in excess of tax basis earnings and profits are reported in the financial statements as a return of capital. Permanent differences between book and tax accounting relating to distributions are reclassified to paid-in capital. For tax purposes, distributions from short-term capital gains are considered to be from ordinary income.
At December 31, 2020, the Fund, for federal income tax purposes, had deferred capital losses of $3,275,486 which would reduce its taxable income arising from future net realized gains on investment transactions, if any, to the extent permitted by the Internal Revenue Code, and thus would reduce the
| 9 |
Eaton Vance
Tax-Managed Growth Fund 1.0
June 30, 2021
Notes to Financial Statements (Unaudited) — continued
amount of distributions to shareholders, which would otherwise be necessary to relieve the Fund of any liability for federal income or excise tax. The deferred capital losses are treated as arising on the first day of the Fund’s next taxable year and retain the same short-term or long-term character as when originally deferred. Of the deferred capital losses at December 31, 2020, $3,275,486 are short-term.
3 Transactions with Affiliates
Effective March 1, 2021, the Fund entered into an investment advisory agreement with Eaton Vance Management (EVM). Pursuant to the agreement, the Fund pays an investment adviser fee on its average daily net assets that are not invested in other investment companies for which EVM or its affiliates serve as investment adviser and receive an advisory fee, at a per annum rate that is the same as that payable by the Portfolio. For the six months ended June 30, 2021, the Fund incurred no investment adviser fee on such assets. To the extent the Fund’s assets are invested in the Portfolio, the Fund is allocated its pro rata share of the Portfolio’s investment adviser fee. The Portfolio has engaged Boston Management and Research (BMR) to render investment advisory services. See Note 2 of the Portfolio’s Notes to Financial Statements which are included elsewhere in this report. EVM also serves as the administrator to the Fund, but receives no compensation.
EVM provides sub-transfer agency and related services to the Fund pursuant to a Sub-Transfer Agency Support Services Agreement. For the six months ended June 30, 2021, EVM earned $14,773 from the Fund pursuant to such agreement, which is included in transfer and dividend disbursing agent fees on the Statement of Operations.
Trustees and officers of the Fund who are members of EVM’s or BMR’s organizations receive remuneration for their services to the Fund out of the investment adviser fee. Certain officers and Trustees of the Fund and the Portfolio are officers of the above organizations.
4 Investment Transactions
For the six months ended June 30, 2021, decreases in the Fund’s investment in the Portfolio aggregated $35,930,706. Decreases in the Fund’s investment in the Portfolio include distributions of securities as the result of redemptions in-kind with a value of $31,969,582.
5 Shares of Beneficial Interest
The Fund’s Declaration of Trust permits the Trustees to issue an unlimited number of full and fractional shares of beneficial interest (without par value). Transactions in Fund shares were as follows:
| Six Months Ended June 30, 2021 (Unaudited) |
Year Ended December 31, 2020 |
|||||||
| Issued to shareholders electing to receive payments of distributions in Fund shares |
665 | 1,957 | ||||||
| Redemptions |
(17,823 | ) | (40,943 | ) | ||||
| Net decrease |
(17,158 | ) | (38,986 | ) | ||||
6 Risks and Uncertainties
Pandemic Risk
An outbreak of respiratory disease caused by a novel coronavirus was first detected in China in late 2019 and subsequently spread internationally. This coronavirus has resulted in closing borders, enhanced health screenings, changes to healthcare service preparation and delivery, quarantines, cancellations, disruptions to supply chains and customer activity, as well as general concern and uncertainty. Health crises caused by outbreaks, such as the coronavirus outbreak, may exacerbate other pre-existing political, social and economic risks and disrupt normal market conditions and operations. The impact of this outbreak has negatively affected the worldwide economy, the economies of individual countries, individual companies, and the market in general, and may continue to do so in significant and unforeseen ways, as may other epidemics and pandemics that may arise in the future. Any such impact could adversely affect the Fund’s performance, or the performance of the securities in which the Fund invests.
| 10 |
Tax-Managed Growth Portfolio
June 30, 2021
Portfolio of Investments (Unaudited)
| 11 | See Notes to Financial Statements. |
Tax-Managed Growth Portfolio
June 30, 2021
Portfolio of Investments (Unaudited) — continued
| 12 | See Notes to Financial Statements. |
Tax-Managed Growth Portfolio
June 30, 2021
Portfolio of Investments (Unaudited) — continued
| 13 | See Notes to Financial Statements. |
Tax-Managed Growth Portfolio
June 30, 2021
Portfolio of Investments (Unaudited) — continued
| 14 | See Notes to Financial Statements. |
Tax-Managed Growth Portfolio
June 30, 2021
Portfolio of Investments (Unaudited) — continued
| 15 | See Notes to Financial Statements. |
Tax-Managed Growth Portfolio
June 30, 2021
Portfolio of Investments (Unaudited) — continued
| 16 | See Notes to Financial Statements. |
Tax-Managed Growth Portfolio
June 30, 2021
Portfolio of Investments (Unaudited) — continued
| 17 | See Notes to Financial Statements. |
Tax-Managed Growth Portfolio
June 30, 2021
Portfolio of Investments (Unaudited) — continued
| 18 | See Notes to Financial Statements. |
Tax-Managed Growth Portfolio
June 30, 2021
Portfolio of Investments (Unaudited) — continued
| 19 | See Notes to Financial Statements. |
Tax-Managed Growth Portfolio
June 30, 2021
Portfolio of Investments (Unaudited) — continued
| 20 | See Notes to Financial Statements. |
Tax-Managed Growth Portfolio
June 30, 2021
Portfolio of Investments (Unaudited) — continued
| 21 | See Notes to Financial Statements. |
Tax-Managed Growth Portfolio
June 30, 2021
Statement of Assets and Liabilities (Unaudited)
| Assets | June 30, 2021 | |||
| Unaffiliated investments, at value (identified cost, $14,461,090,952) |
$ | 32,794,900,791 | ||
| Affiliated investments, at value (identified cost, $261,994,833) |
393,344,012 | |||
| Cash |
91,156 | |||
| Dividends receivable |
13,956,656 | |||
| Dividends receivable from affiliated investments |
7,005 | |||
| Receivable for investments sold |
4,981,656 | |||
| Tax reclaims receivable |
2,036,166 | |||
| Total assets |
$ | 33,209,317,442 | ||
| Liabilities | ||||
| Payable to affiliates: |
||||
| Investment adviser fee |
$ | 10,871,799 | ||
| Trustees’ fees |
27,125 | |||
| Accrued expenses |
2,392,047 | |||
| Total liabilities |
$ | 13,290,971 | ||
| Commitments and contingencies (Note 9) |
||||
| Net Assets applicable to investors’ interest in Portfolio |
$ | 33,196,026,471 | ||
| 22 | See Notes to Financial Statements. |
Tax-Managed Growth Portfolio
June 30, 2021
Statement of Operations (Unaudited)
| Investment Income | Six Months Ended June 30, 2021 |
|||
| Dividends (net of foreign taxes, $2,232,557) |
$ | 172,106,554 | ||
| Dividends from affiliated investments |
974,471 | |||
| Total investment income |
$ | 173,081,025 | ||
| Expenses | ||||
| Investment adviser fee |
$ | 61,717,653 | ||
| Trustees’ fees and expenses |
54,250 | |||
| Custodian fee |
1,851,489 | |||
| Professional fees |
310,429 | |||
| Miscellaneous |
403,455 | |||
| Total expenses |
$ | 64,337,276 | ||
| Net investment income |
$ | 108,743,749 | ||
| Realized and Unrealized Gain (Loss) | ||||
| Net realized gain (loss) — |
||||
| Investment transactions(1) |
$ | 348,431,334 | ||
| Investment transactions — affiliated investments(1) |
10,137,238 | |||
| Foreign currency transactions |
(3,999 | ) | ||
| Net realized gain |
$ | 358,564,573 | ||
| Change in unrealized appreciation (depreciation) — |
||||
| Investments |
$ | 3,698,967,736 | ||
| Investments — affiliated investments |
27,769,991 | |||
| Foreign currency |
(86,875 | ) | ||
| Net change in unrealized appreciation (depreciation) |
$ | 3,726,650,852 | ||
| Net realized and unrealized gain |
$ | 4,085,215,425 | ||
| Net increase in net assets from operations |
$ | 4,193,959,174 | ||
| (1) | Aggregate amount includes $362,340,517 of net realized gains from redemptions in-kind. |
| 23 | See Notes to Financial Statements. |
Tax-Managed Growth Portfolio
June 30, 2021
Statements of Changes in Net Assets
| Increase (Decrease) in Net Assets | Six Months Ended June 30, 2021 (Unaudited) |
Year Ended December 31, 2020 |
||||||
| From operations — |
||||||||
| Net investment income |
$ | 108,743,749 | $ | 242,011,047 | ||||
| Net realized gain |
358,564,573 | 582,853,151 | ||||||
| Net change in unrealized appreciation (depreciation) |
3,726,650,852 | 4,456,295,637 | ||||||
| Net increase in net assets from operations |
$ | 4,193,959,174 | $ | 5,281,159,835 | ||||
| Capital transactions — |
||||||||
| Contributions |
$ | 1,843,671,385 | $ | 1,891,540,171 | ||||
| Withdrawals |
(828,318,212 | ) | (1,199,338,464 | ) | ||||
| Net increase in net assets from capital transactions |
$ | 1,015,353,173 | $ | 692,201,707 | ||||
| Net increase in net assets |
$ | 5,209,312,347 | $ | 5,973,361,542 | ||||
| Net Assets | ||||||||
| At beginning of period |
$ | 27,986,714,124 | $ | 22,013,352,582 | ||||
| At end of period |
$ | 33,196,026,471 | $ | 27,986,714,124 | ||||
| 24 | See Notes to Financial Statements. |
Tax-Managed Growth Portfolio
June 30, 2021
Financial Highlights
| Six Months Ended June 30, 2021 (Unaudited) |
Year Ended December 31, | |||||||||||||||||||||||
| Ratios/Supplemental Data | 2020 | 2019 | 2018 | 2017 | 2016 | |||||||||||||||||||
| Ratios (as a percentage of average daily net assets): |
||||||||||||||||||||||||
| Expenses |
0.43 | %(1) | 0.44 | % | 0.45 | % | 0.46 | % | 0.46 | % | 0.47 | % | ||||||||||||
| Net investment income |
0.73 | %(1) | 1.07 | % | 1.28 | % | 1.25 | % | 1.33 | % | 1.48 | % | ||||||||||||
| Portfolio Turnover(2) |
0 | %(3)(4) | 1 | % | 1 | % | 1 | % | 0 | %(3) | 1 | % | ||||||||||||
| Total Return |
14.90 | %(4) | 23.42 | % | 29.87 | % | (5.02 | )% | 22.76 | % | 9.06 | % | ||||||||||||
| Net assets, end of period (000’s omitted) |
$ | 33,196,026 | $ | 27,986,714 | $ | 22,013,353 | $ | 16,016,046 | $ | 16,224,690 | $ | 12,577,024 | ||||||||||||
| (1) | Annualized. |
| (2) | Excludes the value of portfolio securities contributed or distributed as a result of in-kind shareholder transactions. The portfolio turnover of the Portfolio including in-kind contributions and distributions of securities was 2%, 6%, 6%, 6%, 5% and 6% for the six months ended June 30, 2021 and the years ended December 31, 2020, 2019, 2018, 2017 and 2016, respectively. |
| (3) | Amount is less than 0.5%. |
| (4) | Not annualized. |
| 25 | See Notes to Financial Statements. |
Eaton Vance
Tax-Managed Growth Portfolio
June 30, 2021
Notes to Financial Statements (Unaudited)
1 Significant Accounting Policies
Tax-Managed Growth Portfolio (the Portfolio) is a Massachusetts business trust registered under the Investment Company Act of 1940, as amended (the 1940 Act), as a diversified, open-end management investment company. The Portfolio’s investment objective is to achieve long-term, after-tax returns for interestholders through investing in a diversified portfolio of equity securities. The Declaration of Trust permits the Trustees to issue interests in the Portfolio. At June 30, 2021, Eaton Vance Tax-Managed Growth Fund 1.0, Eaton Vance Tax-Managed Growth Fund 1.1, Eaton Vance Tax-Managed Growth Fund 1.2 and Eaton Vance Tax-Managed Equity Asset Allocation Fund held an interest of 4.0%, 6.8%, 3.6%, and 0.8% respectively, in the Portfolio. In addition, an unregistered fund managed by the adviser to the Portfolio held an aggregate interest of 84.8% in the Portfolio.
The following is a summary of significant accounting policies of the Portfolio. The policies are in conformity with accounting principles generally accepted in the United States of America (U.S. GAAP). The Portfolio is an investment company and follows accounting and reporting guidance in the Financial Accounting Standards Board (FASB) Accounting Standards Codification Topic 946 “Financial Services — Investment Companies.”
A Investment Valuation — The following methodologies are used to determine the market value or fair value of investments.
Equity Securities. Equity securities listed on a U.S. securities exchange generally are valued at the last sale or closing price on the day of valuation or, if no sales took place on such date, at the mean between the closing bid and ask prices on the exchange where such securities are principally traded. Equity securities listed on the NASDAQ Global or Global Select Market generally are valued at the NASDAQ official closing price. Unlisted or listed securities for which closing sales prices or closing quotations are not available are valued at the mean between the latest available bid and ask prices.
Foreign Securities and Currencies. Foreign securities and currencies are valued in U.S. dollars, based on foreign currency exchange rate quotations supplied by a third party pricing service. The pricing service uses a proprietary model to determine the exchange rate. Inputs to the model include reported trades and implied bid/ask spreads. The daily valuation of exchange-traded foreign securities generally is determined as of the close of trading on the principal exchange on which such securities trade. Events occurring after the close of trading on foreign exchanges may result in adjustments to the valuation of foreign securities to more accurately reflect their fair value as of the close of regular trading on the New York Stock Exchange. When valuing foreign equity securities that meet certain criteria, the Portfolio’s Trustees have approved the use of a fair value service that values such securities to reflect market trading that occurs after the close of the applicable foreign markets of comparable securities or other instruments that have a strong correlation to the fair-valued securities.
Affiliated Fund. The Portfolio may invest in Eaton Vance Cash Reserves Fund, LLC (Cash Reserves Fund), an affiliated investment company managed by Eaton Vance Management (EVM). While Cash Reserves Fund is not a registered money market mutual fund, it conducts all of its investment activities in accordance with the requirements of Rule 2a-7 under the 1940 Act. Investments in Cash Reserves Fund are valued at the closing net asset value per unit on the valuation day. Cash Reserves Fund generally values its investment securities based on available market quotations provided by a third party pricing service.
Fair Valuation. Investments for which valuations or market quotations are not readily available or are deemed unreliable are valued at fair value using methods determined in good faith by or at the direction of the Trustees of the Portfolio in a manner that most fairly reflects the security’s “fair value”, which is the amount that the Portfolio might reasonably expect to receive for the security upon its current sale in the ordinary course. Each such determination is based on a consideration of relevant factors, which are likely to vary from one pricing context to another. These factors may include, but are not limited to, the type of security, the existence of any contractual restrictions on the security’s disposition, the price and extent of public trading in similar securities of the issuer or of comparable companies or entities, quotations or relevant information obtained from broker/dealers or other market participants, information obtained from the issuer, analysts, and/or the appropriate stock exchange (for exchange-traded securities), an analysis of the company’s or entity’s financial statements, and an evaluation of the forces that influence the issuer and the market(s) in which the security is purchased and sold.
B Investment Transactions — Investment transactions for financial statement purposes are accounted for on a trade date basis. Realized gains and losses on investments sold are determined on the basis of identified cost.
C Income — Dividend income is recorded on the ex-dividend date for dividends received in cash and/or securities. However, if the ex-dividend date has passed, certain dividends from foreign securities are recorded as the Portfolio is informed of the ex-dividend date. Withholding taxes on foreign dividends and capital gains have been provided for in accordance with the Portfolio’s understanding of the applicable countries’ tax rules and rates. In consideration of recent decisions rendered by European courts, the Portfolio has filed additional tax reclaims for previously withheld taxes on dividends earned in certain European Union countries. These filings are subject to various administrative and judicial proceedings within these countries. Due to the uncertainty as to the ultimate resolution of these proceedings, the likelihood of receipt of these reclaims, and the potential timing of payment, no amounts are reflected in the financial statements for such reclaims. Interest income is recorded on the basis of interest accrued, adjusted for amortization of premium or accretion of discount.
D Federal Taxes — The Portfolio has elected to be treated as a partnership for federal tax purposes. No provision is made by the Portfolio for federal or state taxes on any taxable income of the Portfolio because each investor in the Portfolio is ultimately responsible for the payment of any taxes on its share of taxable income. Since at least one of the Portfolio’s investors is a regulated investment company that invests all or substantially all of its assets in the Portfolio, the Portfolio normally must satisfy the applicable source of income and diversification requirements (under the Internal Revenue Code) in order for its investors to satisfy them. The Portfolio will allocate, at least annually among its investors, each investor’s distributive share of the Portfolio’s net investment income, net realized capital gains and losses and any other items of income, gain, loss, deduction or credit.
| 26 |
Eaton Vance
Tax-Managed Growth Portfolio
June 30, 2021
Notes to Financial Statements (Unaudited) — continued
As of June 30, 2021, the Portfolio had no uncertain tax positions that would require financial statement recognition, de-recognition, or disclosure. The Portfolio files a U.S. federal income tax return annually after its fiscal year-end, which is subject to examination by the Internal Revenue Service for a period of three years from the date of filing.
E Foreign Currency Translation — Investment valuations, other assets, and liabilities initially expressed in foreign currencies are translated each business day into U.S. dollars based upon current exchange rates. Purchases and sales of foreign investment securities and income and expenses denominated in foreign currencies are translated into U.S. dollars based upon currency exchange rates in effect on the respective dates of such transactions. Recognized gains or losses on investment transactions attributable to changes in foreign currency exchange rates are recorded for financial statement purposes as net realized gains and losses on investments. That portion of unrealized gains and losses on investments that results from fluctuations in foreign currency exchange rates is not separately disclosed.
F Use of Estimates — The preparation of the financial statements in conformity with U.S. GAAP requires management to make estimates and assumptions that affect the reported amounts of assets and liabilities at the date of the financial statements and the reported amounts of income and expense during the reporting period. Actual results could differ from those estimates.
G Indemnifications — Under the Portfolio’s organizational documents, its officers and Trustees may be indemnified against certain liabilities and expenses arising out of the performance of their duties to the Portfolio. Under Massachusetts law, if certain conditions prevail, interestholders in the Portfolio could be deemed to have personal liability for the obligations of the Portfolio. However, the Portfolio’s Declaration of Trust contains an express disclaimer of liability on the part of Portfolio interestholders. Additionally, in the normal course of business, the Portfolio enters into agreements with service providers that may contain indemnification clauses. The Portfolio’s maximum exposure under these arrangements is unknown as this would involve future claims that may be made against the Portfolio that have not yet occurred.
H Interim Financial Statements — The interim financial statements relating to June 30, 2021 and for the six months then ended have not been audited by an independent registered public accounting firm, but in the opinion of the Portfolio’s management, reflect all adjustments, consisting only of normal recurring adjustments, necessary for the fair presentation of the financial statements.
2 Investment Adviser Fee and Other Transactions with Affiliates
The investment adviser fee is earned by Boston Management and Research (BMR) as compensation for investment advisory services rendered to the Portfolio. On March 1, 2021, Morgan Stanley acquired Eaton Vance Corp. (the “Transaction”) and BMR became an indirect, wholly-owned subsidiary of Morgan Stanley. In connection with the Transaction, the Portfolio entered into a new investment advisory agreement (the “New Agreement”) with BMR, which took effect on March 1, 2021. Pursuant to the New Agreement (and the Portfolio’s investment advisory agreement with BMR in effect prior to March 1, 2021), the investment adviser fee is computed at an annual rate of 0.625% of the Portfolio’s average daily net assets up to $500 million and is payable monthly. The advisory fee on net assets of $500 million or more is reduced as follows:
| Average Daily Net Assets | Annual Fee Rate (for each level) |
|||
| $500 million but less than $1 billion |
0.5625 | % | ||
| $1 billion but less than $1.5 billion |
0.5000 | % | ||
| $1.5 billion but less than $7 billion |
0.4375 | % | ||
| $7 billion but less than $10 billion |
0.4250 | % | ||
| $10 billion but less than $15 billion |
0.4125 | % | ||
| $15 billion but less than $20 billion |
0.4000 | % | ||
| $20 billion but less than $25 billion |
0.3900 | % | ||
| $25 billion and over |
0.3800 | % | ||
For the six months ended June 30, 2021, the Portfolio’s investment adviser fee amounted to $61,717,653 or 0.41% (annualized) of the Portfolio’s average daily net assets. The Portfolio invests its cash in Cash Reserves Fund. EVM does not currently receive a fee for advisory services provided to Cash Reserves Fund.
Officers and Trustees of the Portfolio who are members of EVM’s or BMR’s organizations receive remuneration for their services to the Portfolio out of the investment adviser fee. Trustees of the Portfolio who are not affiliated with the investment adviser may elect to defer receipt of all or a percentage of their annual fees in accordance with the terms of the Trustees Deferred Compensation Plan. For the six months ended June 30, 2021, no significant amounts have been deferred. Certain officers and Trustees of the Portfolio are officers of the above organizations.
| 27 |
Eaton Vance
Tax-Managed Growth Portfolio
June 30, 2021
Notes to Financial Statements (Unaudited) — continued
3 Purchases and Sales of Investments
Purchases and sales of investments, other than short-term obligations, aggregated $84,834,779 and $23,831,728, respectively, for the six months ended June 30, 2021. In addition, investors contributed securities with an aggregate market value of $1,835,042,177 and investments having an aggregate market value of $716,882,921 were distributed in payment for capital withdrawals during the six months ended June 30, 2021.
4 Federal Income Tax Basis of Investments
The cost and unrealized appreciation (depreciation) of investments of the Portfolio at June 30, 2021, as determined on a federal income tax basis, were as follows:
| Aggregate cost |
$ | 3,948,941,996 | ||
| Gross unrealized appreciation |
$ | 29,256,103,525 | ||
| Gross unrealized depreciation |
(16,800,718 | ) | ||
| Net unrealized appreciation |
$ | 29,239,302,807 | ||
5 Restricted Securities
At June 30, 2021, the Portfolio owned the following securities (representing 0.9% of net assets) which were restricted as to public resale and not registered under the Securities Act of 1933. The Portfolio has various registration rights (exercisable under a variety of circumstances) with respect to these securities. The value of these securities is determined based on valuations provided by brokers when available, or if not available, they are valued at fair value using methods determined in good faith by or at the direction of the Trustees.
| Common Stocks | Date of Acquisition |
Eligible for Resale |
Shares | Cost | Value | |||||||||||||||
| Arista Networks, Inc. |
12/17/20 | 12/17/21 | 105,064 | $ | 30,000,276 | $ | 38,065,738 | |||||||||||||
| Arista Networks, Inc. |
3/18/21 | 3/18/22 | 72,500 | 20,964,888 | 26,260,252 | |||||||||||||||
| Broadcom, Inc. |
12/17/20 | 12/17/21 | 14,025 | 5,955,945 | 6,687,681 | |||||||||||||||
| CACI International, Inc., Class A |
6/17/21 | 6/17/22 | 6,200 | 1,636,477 | 1,580,953 | |||||||||||||||
| Caterpillar, Inc. |
3/18/21 | 3/18/22 | 6,950 | 1,622,835 | 1,512,113 | |||||||||||||||
| Church & Dwight Co., Inc. |
12/17/20 | 12/17/21 | 17,504 | 1,516,161 | 1,491,691 | |||||||||||||||
| Cigna Corp. |
12/17/20 | 12/17/21 | 7,416 | 1,500,098 | 1,758,111 | |||||||||||||||
| DexCom, Inc. |
9/17/20 | 9/17/21 | 30,000 | 11,808,737 | 12,810,000 | |||||||||||||||
| Exact Sciences Corp. |
6/17/21 | 6/17/22 | 8,313 | 1,000,068 | 1,032,717 | |||||||||||||||
| Integra LifeSciences Holdings Corp. |
9/17/20 | 9/17/21 | 200,000 | 9,395,300 | 13,648,000 | |||||||||||||||
| Integra LifeSciences Holdings Corp. |
12/17/20 | 12/17/21 | 200,000 | 12,154,703 | 13,648,000 | |||||||||||||||
| Integra LifeSciences Holdings Corp. |
3/18/21 | 3/18/22 | 730,000 | 49,717,329 | 49,802,746 | |||||||||||||||
| Linde PLC |
9/17/20 | 9/17/21 | 12,068 | 3,000,148 | 3,488,859 | |||||||||||||||
| Littelfuse, Inc. |
6/17/21 | 6/17/22 | 39,181 | 10,000,149 | 9,977,436 | |||||||||||||||
| Match Group, Inc. |
12/17/20 | 12/17/21 | 260,261 | 40,028,133 | 41,967,086 | |||||||||||||||
| Northrop Grumman Corp. |
9/17/20 | 9/17/21 | 2,913 | 1,000,028 | 1,058,672 | |||||||||||||||
| O’Reilly Automotive, Inc. |
6/17/21 | 6/17/22 | 59,492 | 31,782,975 | 33,669,807 | |||||||||||||||
| Skechers USA, Inc., Class A |
6/17/21 | 6/17/22 | 45,345 | 2,232,125 | 2,258,412 | |||||||||||||||
| Snap, Inc., Class A |
3/18/21 | 3/18/22 | 469,399 | 30,000,055 | 31,975,252 | |||||||||||||||
| Visa, Inc., Class A |
3/18/21 | 3/18/22 | 29,956 | 6,676,445 | 7,002,036 | |||||||||||||||
| Zoetis, Inc. |
6/17/21 | 6/17/22 | 54,359 | 10,000,029 | 10,122,239 | |||||||||||||||
| Zscaler, Inc. |
6/17/21 | 6/17/22 | 10,000 | 2,121,320 | 2,159,196 | |||||||||||||||
| Total Restricted Securities |
$ | 284,114,224 | $ | 311,976,997 | ||||||||||||||||
| 28 |
Eaton Vance
Tax-Managed Growth Portfolio
June 30, 2021
Notes to Financial Statements (Unaudited) — continued
6 Line of Credit
The Portfolio participates with other portfolios and funds managed by EVM and its affiliates in an $800 million unsecured line of credit agreement with a group of banks, which is in effect through October 26, 2021. Borrowings are made by the Portfolio solely for temporary purposes related to redemptions and other short-term cash needs. Interest is charged to the Portfolio based on its borrowings at an amount above either the Eurodollar rate or Federal Funds rate. In addition, a fee computed at an annual rate of 0.15% on the daily unused portion of the line of credit is allocated among the participating portfolios and funds at the end of each quarter. In connection with the renewal of the agreement in October 2020, an upfront fee and arrangement fee totaling $950,000 was incurred that was allocated to the participating portfolios and funds. Because the line of credit is not available exclusively to the Portfolio, it may be unable to borrow some or all of its requested amounts at any particular time. The Portfolio did not have any significant borrowings or allocated fees during the six months ended June 30, 2021.
7 Investments in Affiliated Issuers and Funds
At June 30, 2021, the value of the Portfolio’s investment in affiliated issuers and funds was $393,344,012, which represents 1.2% of the Portfolio’s net assets. Transactions in affiliated issuers and funds by the Portfolio for the six months ended June 30, 2021 were as follows:
| Name | Value, beginning of period |
Purchases | Sales proceeds |
Net realized gain (loss) |
Change in unrealized appreciation (depreciation) |
Value, end of period |
Dividend income |
Shares/ Units, end of period |
||||||||||||||||||||||||
| Common Stocks |
||||||||||||||||||||||||||||||||
| Morgan Stanley(1) |
$ | — | $ | — | $ | (19,197,725 | ) | $ | 10,137,238 | $ | 27,768,998 | $ | 224,466,747 | $ | 898,290 | 2,448,105 | ||||||||||||||||
| Short-Term Investments |
|
|||||||||||||||||||||||||||||||
| Eaton Vance Cash Reserves Fund, LLC |
$ | 202,615,051 | $ | 168,199,148 | $ | (201,937,927 | ) | $ | — | $ | 993 | $ | 168,877,265 | $ | 76,181 | 168,877,265 | ||||||||||||||||
| $ | 10,137,238 | $ | 27,769,991 | $ | 393,344,012 | $ | 974,471 | |||||||||||||||||||||||||
| (1) | Affiliated issuer as of March 1, 2021. |
8 Fair Value Measurements
Under generally accepted accounting principles for fair value measurements, a three-tier hierarchy to prioritize the assumptions, referred to as inputs, is used in valuation techniques to measure fair value. The three-tier hierarchy of inputs is summarized in the three broad levels listed below.
| • | Level 1 – quoted prices in active markets for identical investments |
| • | Level 2 – other significant observable inputs (including quoted prices for similar investments, interest rates, prepayment speeds, credit risk, etc.) |
| • | Level 3 – significant unobservable inputs (including a fund’s own assumptions in determining the fair value of investments) |
In cases where the inputs used to measure fair value fall in different levels of the fair value hierarchy, the level disclosed is determined based on the lowest level input that is significant to the fair value measurement in its entirety. The inputs or methodology used for valuing securities are not necessarily an indication of the risk associated with investing in those securities.
| 29 |
Eaton Vance
Tax-Managed Growth Portfolio
June 30, 2021
Notes to Financial Statements (Unaudited) — continued
At June 30, 2021, the hierarchy of inputs used in valuing the Portfolio’s investments, which are carried at value, were as follows:
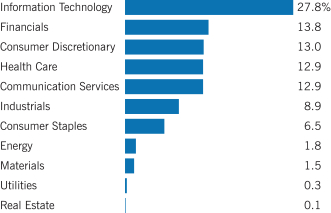
| Asset Description | Level 1 | Level 2 | Level 3* | Total | ||||||||||||
| Common Stocks |
||||||||||||||||
| Communication Services |
$ | 4,256,938,176 | $ | 31,975,252 | $ | — | $ | 4,288,913,428 | ||||||||
| Consumer Discretionary |
4,288,272,177 | 35,928,219 | 1,642,608 | 4,325,843,004 | ||||||||||||
| Consumer Staples |
2,021,757,306 | 139,398,786 | — | 2,161,156,092 | ||||||||||||
| Energy |
602,233,483 | — | — | 602,233,483 | ||||||||||||
| Financials |
4,550,435,897 | 13,276,069 | — | 4,563,711,966 | ||||||||||||
| Health Care |
4,228,449,857 | 60,957,702 | — | 4,289,407,559 | ||||||||||||
| Industrials |
2,947,946,277 | 3,093,066 | — | 2,951,039,343 | ||||||||||||
| Information Technology |
9,168,074,772 | 45,398,920 | — | 9,213,473,692 | ||||||||||||
| Materials |
481,715,245 | 2,568,408 | — | 484,283,653 | ||||||||||||
| Real Estate |
35,643,973 | — | — | 35,643,973 | ||||||||||||
| Utilities |
103,297,559 | — | — | 103,297,559 | ||||||||||||
| Total Common Stocks |
$ | 32,684,764,722 | $ | 332,596,422 | ** | $ | 1,642,608 | $ | 33,019,003,752 | |||||||
| Preferred Stocks |
$ | 324,101 | $ | — | $ | — | $ | 324,101 | ||||||||
| Warrants |
39,685 | — | — | 39,685 | ||||||||||||
| Short-Term Investments |
— | 168,877,265 | — | 168,877,265 | ||||||||||||
| Total Investments |
$ | 32,685,128,508 | $ | 501,473,687 | $ | 1,642,608 | $ | 33,188,244,803 | ||||||||
| * | None of the unobservable inputs for Level 3 assets, individually or collectively, had a material impact on the Portfolio. |
| ** | Includes foreign equity securities whose values were adjusted to reflect market trading of comparable securities or other correlated instruments that occurred after the close of trading in their applicable foreign markets. |
Level 3 investments at the beginning and/or end of the period in relation to net assets were not significant and accordingly, a reconciliation of Level 3 assets for the six months ended June 30, 2021 is not presented.
9 Legal Proceedings
In November 2010, the Portfolio was named as defendant and a putative member of the proposed defendant class of shareholders in the case entitled Official Committee of Unsecured Creditors (UCC) of the Tribune Company v. FitzSimons, et al. (the “FitzSimons action”) as a result of its ownership of shares in the Tribune Company (Tribune) in 2007 when Tribune effected a leveraged buyout transaction (LBO) and was converted to a privately held company. The UCC, which was replaced by a Litigation Trustee pursuant to Tribune’s plan of reorganization, seeks to recover payments of the proceeds of the LBO. The FitzSimons action is part of a multi-district litigation proceeding in the Southern District of New York. This action was dismissed by the District Court in January 2017, and the dismissal is currently on appeal in the Second Circuit Court of Appeals. The value of the proceeds received by the Portfolio is approximately $48,237,000 (equal to 0.1% of net assets at June 30, 2021). The Portfolio cannot predict the outcome of the FitzSimons action or the effect, if any, on the Portfolio’s net asset value.
In June 2011, a group of Tribune creditors also filed multiple actions against former Tribune shareholders involving state law constructive fraudulent conveyance claims arising out of the LBO (the “SLFC actions”). The Portfolio was named as a defendant in one of the SLFC actions filed in United States District Court — District of Massachusetts by Deutsche Bank Trust Co. Americas which sought to recover the proceeds received in connection with the LBO from former shareholders. The SLFC actions were also part of the multi-district litigation proceeding in the Southern District of New York. The SLFC actions were dismissed by the District Court in September 2013, and the Second Circuit Court of Appeals affirmed the dismissal of the SLFC actions in December 2019. The Supreme Court of the United States denied the plaintiff-appellants Writ of Certiorari petition in April 2021. The attorneys’ fees and costs related to these actions have been expensed by the Portfolio as incurred.
| 30 |
Eaton Vance
Tax-Managed Growth Portfolio
June 30, 2021
Notes to Financial Statements (Unaudited) — continued
10 Risks and Uncertainties
Pandemic Risk
An outbreak of respiratory disease caused by a novel coronavirus was first detected in China in late 2019 and subsequently spread internationally. This coronavirus has resulted in closing borders, enhanced health screenings, changes to healthcare service preparation and delivery, quarantines, cancellations, disruptions to supply chains and customer activity, as well as general concern and uncertainty. Health crises caused by outbreaks, such as the coronavirus outbreak, may exacerbate other pre-existing political, social and economic risks and disrupt normal market conditions and operations. The impact of this outbreak has negatively affected the worldwide economy, the economies of individual countries, individual companies, and the market in general, and may continue to do so in significant and unforeseen ways, as may other epidemics and pandemics that may arise in the future. Any such impact could adversely affect the Portfolio’s performance, or the performance of the securities in which the Portfolio invests.
| 31 |
Eaton Vance
Tax-Managed Growth Fund 1.0
June 30, 2021
Joint Special Meeting of Shareholders (Unaudited)
Eaton Vance Tax-Managed Growth Fund 1.0 (the “Fund”) held a Joint Special Meeting of Shareholders on February 18, 2021 for the following purposes: (1) to approve a new investment advisory agreement with Eaton Vance Management to serve as the Fund’s investment adviser (“Proposal 1”); and (2) to provide voting instructions to the Fund, which invests pursuant to a master-feeder arrangement, with respect to the approval of a new investment advisory agreement with Boston Management and Research (“BMR”) to serve as investment adviser to Tax-Managed Growth Portfolio (“Proposal 2”). The shareholder meeting results are as follows:
| Number of Shares(1) | ||||||||||||||||
| For | Against | Abstain(2) | Broker Non-Votes(2) |
|||||||||||||
| Proposal 1 |
474,649.819 | 6,299.314 | 3,589.989 | 0 | ||||||||||||
| Proposal 2 |
473,508.381 | 6,189.016 | 4,841.725 | 0 | ||||||||||||
| (1) | Fractional shares were voted proportionately. |
| (2) | Abstentions and broker non-votes (i.e., shares for which a broker returns a proxy but for which (i) the beneficial owner has not voted and (ii) the broker holding the shares does not have discretionary authority to vote on the particular matter) were treated as shares that were present at the meeting for purposes of establishing a quorum, but had the effect of a negative vote on each Proposal. |
Interestholder Meeting
Tax-Managed Growth Portfolio (the “Portfolio”) held a Joint Special Meeting of Interestholders on February 19, 2021 in order to approve a new investment advisory agreement with BMR to serve as the Portfolio’s investment adviser (the “Proposal”). The interestholder meeting results are as follows:
| For | Against | Abstain(1) | ||||
| 92.718% | 2.093% | 5.189 | % | |||
| Results may not total 100% due to rounding. |
| (1) | Abstentions were treated as interests that were present at the meeting for purposes of establishing a quorum, but had the effect of a negative vote on the Proposal. |
| 32 |
Eaton Vance
Tax-Managed Growth Fund 1.0
June 30, 2021
Liquidity Risk Management Program
The Fund has implemented a written liquidity risk management program (Program) and related procedures to manage its liquidity in accordance with Rule 22e-4 under the Investment Company Act of 1940, as amended (Liquidity Rule). The Liquidity Rule defines “liquidity risk” as the risk that a fund could not meet requests to redeem shares issued by the fund without significant dilution of the remaining investors’ interests in the fund. The Fund’s Board of Trustees/Directors has designated the investment adviser to serve as the administrator of the Program and the related procedures. The administrator has established a Liquidity Risk Management Oversight Committee (Committee) to perform the functions necessary to administer the Program. As part of the Program, the administrator is responsible for identifying illiquid investments and categorizing the relative liquidity of the Fund’s investments in accordance with the Liquidity Rule. Under the Program, the administrator assesses, manages, and periodically reviews the Fund’s liquidity risk, and is responsible for making certain reports to the Fund’s Board of Trustees/Directors and the Securities and Exchange Commission (SEC) regarding the liquidity of the Fund’s investments, and to notify the Board of Trustees/Directors and the SEC of certain liquidity events specified in the Liquidity Rule. The liquidity of the Fund’s portfolio investments is determined based on a number of factors including, but not limited to, relevant market, trading and investment-specific considerations under the Program.
At a meeting of the Fund’s Board of Trustees/Directors on June 8, 2021, the Committee provided a written report to the Fund’s Board of Trustees/Directors pertaining to the operation, adequacy, and effectiveness of implementation of the Program, as well as the operation of the highly liquid investment minimum (if applicable) for the period January 1, 2020 through December 31, 2020 (Review Period). The Program operated effectively during the Review Period, supporting the administrator’s ability to assess, manage and monitor Fund liquidity risk, including during periods of market volatility and net redemptions. During the Review Period, the Fund met redemption requests on a timely basis.
There can be no assurance that the Program will achieve its objectives in the future.
| 33 |
Tax-Managed Growth Fund 1.0
June 30, 2021
Officers of Eaton Vance Tax-Managed Growth Fund 1.0
Officers of Tax-Managed Growth Portfolio
Trustees of Eaton Vance Tax-Managed Growth Fund 1.0 and Tax-Managed Growth Portfolio
| * | Interested Trustee |
| 34 |
Eaton Vance Funds
| Privacy Notice | April 2021 |
| FACTS | WHAT DOES EATON VANCE DO WITH YOUR PERSONAL INFORMATION? | |
| Why? | Financial companies choose how they share your personal information. Federal law gives consumers the right to limit some but not all sharing. Federal law also requires us to tell you how we collect, share, and protect your personal information. Please read this notice carefully to understand what we do. | |
| What? | The types of personal information we collect and share depend on the product or service you have with us. This information can include:
∎ Social Security number and income ∎ investment experience and risk tolerance ∎ checking account number and wire transfer instructions | |
| How? | All financial companies need to share customers’ personal information to run their everyday business. In the section below, we list the reasons financial companies can share their customers’ personal information; the reasons Eaton Vance chooses to share; and whether you can limit this sharing. | |
| Reasons we can share your personal information |
Does Eaton Vance share? | Can you limit this sharing? | ||
| For our everyday business purposes — such as to process your transactions, maintain your account(s), respond to court orders and legal investigations, or report to credit bureaus | Yes | No | ||
| For our marketing purposes — to offer our products and services to you | Yes | No | ||
| For joint marketing with other financial companies | No | We don’t share | ||
| For our investment management affiliates’ everyday business purposes — information about your transactions, experiences, and creditworthiness | Yes | Yes | ||
| For our affiliates’ everyday business purposes — information about your transactions and experiences | Yes | No | ||
| For our affiliates’ everyday business purposes — information about your creditworthiness | No | We don’t share | ||
| For our investment management affiliates to market to you | Yes | Yes | ||
| For our affiliates to market to you | No | We don’t share | ||
| For nonaffiliates to market to you | No | We don’t share |
| To limit our sharing | Call toll-free 1-800-262-1122 or email: [email protected]
Please note:
If you are a new customer, we can begin sharing your information 30 days from the date we sent this notice. When you are no longer our customer, we continue to share your information as described in this notice. However, you can contact us at any time to limit our sharing. | |
| Questions? | Call toll-free 1-800-262-1122 or email: [email protected] | |
| 35 |
Eaton Vance Funds
| Privacy Notice — continued | April 2021 |
| Page 2 |
| Who we are | ||
| Who is providing this notice? | Eaton Vance Management, Eaton Vance Distributors, Inc., Eaton Vance Trust Company, Eaton Vance Management (International) Limited, Eaton Vance Advisers International Ltd., Eaton Vance Global Advisors Limited, Eaton Vance Management’s Real Estate Investment Group, Boston Management and Research, Calvert Research and Management, Eaton Vance and Calvert Fund Families and our investment advisory affiliates (“Eaton Vance”) (see Investment Management Affiliates definition below) | |
| What we do | ||
| How does Eaton Vance protect my personal information? | To protect your personal information from unauthorized access and use, we use security measures that comply with federal law. These measures include computer safeguards and secured files and buildings. We have policies governing the proper handling of customer information by personnel and requiring third parties that provide support to adhere to appropriate security standards with respect to such information. | |
| How does Eaton Vance collect my personal information? | We collect your personal information, for example, when you
∎ open an account or make deposits or withdrawals from your account ∎ buy securities from us or make a wire transfer ∎ give us your contact information
We also collect your personal information from others, such as credit bureaus, affiliates, or other companies. | |
| Why can’t I limit all sharing? | Federal law gives you the right to limit only
∎ sharing for affiliates’ everyday business purposes — information about your creditworthiness ∎ affiliates from using your information to market to you ∎ sharing for nonaffiliates to market to you
State laws and individual companies may give you additional rights to limit sharing. See below for more on your rights under state law. | |
| Definitions | ||
| Investment Management Affiliates | Eaton Vance Investment Management Affiliates include registered investment advisers, registered broker-dealers, and registered and unregistered funds. Investment Management Affiliates does not include entities associated with Morgan Stanley Wealth Management, such as Morgan Stanley Smith Barney LLC and Morgan Stanley & Co. | |
| Affiliates | Companies related by common ownership or control. They can be financial and nonfinancial companies.
∎ Our affiliates include companies with a Morgan Stanley name and financial companies such as Morgan Stanley Smith Barney LLC and Morgan Stanley & Co. | |
| Nonaffiliates | Companies not related by common ownership or control. They can be financial and nonfinancial companies.
∎ Eaton Vance does not share with nonaffiliates so they can market to you. | |
| Joint marketing | A formal agreement between nonaffiliated financial companies that together market financial products or services to you.
∎ Eaton Vance doesn’t jointly market. | |
| Other important information | ||
| Vermont: Except as permitted by law, we will not share personal information we collect about Vermont residents with Nonaffiliates unless you provide us with your written consent to share such information.
California: Except as permitted by law, we will not share personal information we collect about California residents with Nonaffiliates and we will limit sharing such personal information with our Affiliates to comply with California privacy laws that apply to us. | ||
| 36 |
Eaton Vance Funds
Delivery of Shareholder Documents. The Securities and Exchange Commission (SEC) permits funds to deliver only one copy of shareholder documents, including prospectuses, proxy statements and shareholder reports, to fund investors with multiple accounts at the same residential or post office box address. This practice is often called “householding” and it helps eliminate duplicate mailings to shareholders. Eaton Vance, or your financial intermediary, may household the mailing of your documents indefinitely unless you instruct Eaton Vance, or your financial intermediary, otherwise. If you would prefer that your Eaton Vance documents not be householded, please contact Eaton Vance at 1-800-262-1122, or contact your financial intermediary. Your instructions that householding not apply to delivery of your Eaton Vance documents will typically be effective within 30 days of receipt by Eaton Vance or your financial intermediary.
Portfolio Holdings. Each Eaton Vance Fund and its underlying Portfolio(s) (if applicable) files a schedule of portfolio holdings on Part F to Form N-PORT with the SEC. Certain information filed on Form N-PORT may be viewed on the Eaton Vance website at www.eatonvance.com, by calling Eaton Vance at 1-800-262-1122 or in the EDGAR database on the SEC’s website at www.sec.gov.
Proxy Voting. From time to time, funds are required to vote proxies related to the securities held by the funds. The Eaton Vance Funds or their underlying Portfolios (if applicable) vote proxies according to a set of policies and procedures approved by the Funds’ and Portfolios’ Boards. You may obtain a description of these policies and procedures and information on how the Funds or Portfolios voted proxies relating to portfolio securities during the most recent 12-month period ended June 30, without charge, upon request, by calling 1-800-262-1122 and by accessing the SEC’s website at www.sec.gov.
| 37 |
This Page Intentionally Left Blank
This Page Intentionally Left Blank
This Page Intentionally Left Blank
| * | FINRA BrokerCheck. Investors may check the background of their Investment Professional by contacting the Financial Industry Regulatory Authority (FINRA). FINRA BrokerCheck is a free tool to help investors check the professional background of current and former FINRA-registered securities firms and brokers. FINRA BrokerCheck is available by calling 1-800-289-9999 and at www.FINRA.org. The FINRA BrokerCheck brochure describing this program is available to investors at www.FINRA.org. |

7696 6.30.21
| Item 2. | Code of Ethics |
Not required in this filing.
| Item 3. | Audit Committee Financial Expert |
Not required in this filing.
| Item 4. | Principal Accountant Fees and Services |
Not required in this filing.
| Item 5. | Audit Committee of Listed Registrants |
Not applicable.
| Item 6. | Schedule of Investments |
Please see schedule of investments contained in the Report to Stockholders included under Item 1 of this Form N-CSR.
| Item 7. | Disclosure of Proxy Voting Policies and Procedures for Closed-End Management Investment Companies |
Not applicable.
| Item 8. | Portfolio Managers of Closed-End Management Investment Companies |
Not applicable.
| Item 9. | Purchases of Equity Securities by Closed-End Management Investment Company and Affiliated Purchasers |
Not applicable.
| Item 10. | Submission of Matters to a Vote of Security Holders |
No material changes.
| Item 11. | Controls and Procedures |
(a) It is the conclusion of the registrant’s principal executive officer and principal financial officer that the effectiveness of the registrant’s current disclosure controls and procedures (such disclosure controls and procedures having been evaluated within 90 days of the date of this filing) provide reasonable assurance that the information required to be disclosed by the registrant has been recorded, processed, summarized and reported within the time period specified in the Commission’s rules and forms and that the information required to be disclosed by the registrant has been accumulated and communicated to the registrant’s principal executive officer and principal financial officer in order to allow timely decisions regarding required disclosure.
(b) There have been no changes in the registrant’s internal controls over financial reporting during the period covered by this report that has materially affected, or is reasonably likely to materially affect, the registrant’s internal control over financial reporting.
| Item 12. | Disclosure of Securities Lending Activities for Closed-End Management Investment Companies |
Not applicable.
| Item 13. | Exhibits |
| (a)(1) |
Registrant’s Code of Ethics – Not applicable (please see Item 2). | |
| Treasurer’s Section 302 certification. | ||
| President’s Section 302 certification. | ||
| Combined Section 906 certification. | ||
Signatures
Pursuant to the requirements of the Securities Exchange Act of 1934 and the Investment Company Act of 1940, the registrant has duly caused this report to be signed on its behalf by the undersigned, thereunto duly authorized.
| Eaton Vance Series Trust | ||
| By: | /s/ Eric A. Stein | |
| Eric A. Stein | ||
| President | ||
| Date: | August 19, 2021 | |
Pursuant to the requirements of the Securities Exchange Act of 1934 and the Investment Company Act of 1940, this report has been signed below by the following persons on behalf of the registrant and in the capacities and on the dates indicated.
| By: | /s/ James F. Kirchner | |
| James F. Kirchner | ||
| Treasurer | ||
| Date: | August 19, 2021 | |
| By: | /s/ Eric A. Stein | |
| Eric A. Stein | ||
| President | ||
| Date: | August 19, 2021 | |
Eaton Vance Series Trust
FORM N-CSR
Exhibit 13(a)(2)(i)
CERTIFICATION
I, James F. Kirchner, certify that:
1. I have reviewed this report on Form N-CSR of Eaton Vance Series Trust;
2. Based on my knowledge, this report does not contain any untrue statement of a material fact or omit to state a material fact necessary to make the statements made, in light of the circumstances under which such statements were made, not misleading with respect to the period covered by this report;
3. Based on my knowledge, the financial statements, and other financial information included in this report, fairly present in all material respects the financial condition, results of operations, changes in net assets, and cash flows (if the financial statements are required to include a statement of cash flows) of the registrant as of, and for, the periods presented in this report;
4. The registrant’s other certifying officer(s) and I are responsible for establishing and maintaining disclosure controls and procedures (as defined in Rule 30a-3(c) under the Investment Company Act of 1940) and internal control over financial reporting (as defined in Rule 30a-3(d) under the Investment Company Act of 1940) for the registrant and have:
(a) Designed such disclosure controls and procedures, or caused such disclosure controls and procedures to be designed under our supervision, to ensure that material information relating to the registrant, including its consolidated subsidiaries, is made known to us by others within those entities, particularly during the period in which this report is being prepared;
(b) Designed such internal control over financial reporting, or caused such internal control over financial reporting to be designed under our supervision, to provide reasonable assurance regarding the reliability of financial reporting and the preparation of financial statements for external purposes in accordance with generally accepted accounting principles;
(c) Evaluated the effectiveness of the registrant’s disclosure controls and procedures and presented in this report our conclusions about the effectiveness of the disclosure controls and procedures, as of a date within 90 days prior to the filing date of this report based on such evaluation; and
(d) Disclosed in this report any change in the registrant’s internal control over financial reporting that occurred during the period covered by this report that has materially affected, or is reasonably likely to materially affect, the registrant’s internal control over financial reporting; and
5. The registrant’s other certifying officer(s) and I have disclosed to the registrant’s auditors and the audit committee of the registrant’s board of directors (or persons performing the equivalent functions):
(a) All significant deficiencies and material weaknesses in the design or operation of internal control over financial reporting which are reasonably likely to adversely affect the registrant’s ability to record, process, summarize, and report financial information; and
(b) Any fraud, whether or not material, that involves management or other employees who have a significant role in the registrant’s internal control over financial reporting.
| Date: August 19, 2021 | /s/ James F. Kirchner | |||||
| James F. Kirchner | ||||||
| Treasurer |
Eaton Vance Series Trust
FORM N-CSR
Exhibit 13(a)(2)(ii)
CERTIFICATION
I, Eric A. Stein, certify that:
1. I have reviewed this report on Form N-CSR of Eaton Vance Series Trust;
2. Based on my knowledge, this report does not contain any untrue statement of a material fact or omit to state a material fact necessary to make the statements made, in light of the circumstances under which such statements were made, not misleading with respect to the period covered by this report;
3. Based on my knowledge, the financial statements, and other financial information included in this report, fairly present in all material respects the financial condition, results of operations, changes in net assets, and cash flows (if the financial statements are required to include a statement of cash flows) of the registrant as of, and for, the periods presented in this report;
4. The registrant’s other certifying officer(s) and I are responsible for establishing and maintaining disclosure controls and procedures (as defined in Rule 30a-3(c) under the Investment Company Act of 1940) and internal control over financial reporting (as defined in Rule 30a-3(d) under the Investment Company Act of 1940) for the registrant and have:
(a) Designed such disclosure controls and procedures, or caused such disclosure controls and procedures to be designed under our supervision, to ensure that material information relating to the registrant, including its consolidated subsidiaries, is made known to us by others within those entities, particularly during the period in which this report is being prepared;
(b) Designed such internal control over financial reporting, or caused such internal control over financial reporting to be designed under our supervision, to provide reasonable assurance regarding the reliability of financial reporting and the preparation of financial statements for external purposes in accordance with generally accepted accounting principles;
(c) Evaluated the effectiveness of the registrant’s disclosure controls and procedures and presented in this report our conclusions about the effectiveness of the disclosure controls and procedures, as of a date within 90 days prior to the filing date of this report based on such evaluation; and
(d) Disclosed in this report any change in the registrant’s internal control over financial reporting that occurred during the period covered by this report that has materially affected, or is reasonably likely to materially affect, the registrant’s internal control over financial reporting; and
5. The registrant’s other certifying officer(s) and I have disclosed to the registrant’s auditors and the audit committee of the registrant’s board of directors (or persons performing the equivalent functions):
(a) All significant deficiencies and material weaknesses in the design or operation of internal control over financial reporting which are reasonably likely to adversely affect the registrant’s ability to record, process, summarize, and report financial information; and
(b) Any fraud, whether or not material, that involves management or other employees who have a significant role in the registrant’s internal control over financial reporting.
| Date: August 19, 2021 | /s/ Eric A. Stein | |||||
| Eric A. Stein | ||||||
| President |
Form N-CSR Item 13(b) Exhibit
CERTIFICATION PURSUANT TO
18 U.S.C. SECTION 1350,
AS ADOPTED PURSUANT TO
SECTION 906 OF THE SARBANES-OXLEY ACT OF 2002
The undersigned hereby certify in their capacity as Treasurer and President, respectively, of Eaton Vance Series Trust (the “Trust”) that:
| (a) | The Semiannual Report of the Trust on Form N-CSR for the period ended June 30, 2021 (the “Report”) fully complies with the requirements of Section 13(a) or 15(d) of the Securities Exchange Act of 1934, as amended; and |
| (b) | The information contained in the Report fairly presents, in all material respects, the financial condition and the results of operations of the Trust for such period. |
A signed original of this written statement required by section 906 has been provided to the Trust and will be retained by the Trust and furnished to the Securities and Exchange Commission or its staff upon request.
Eaton Vance Series Trust
Date: August 19, 2021
| /s/ James F. Kirchner |
| James F. Kirchner |
| Treasurer |
| Date: August 19, 2021 |
| /s/ Eric A. Stein |
| Eric A. Stein |
| President |
Serious News for Serious Traders! Try StreetInsider.com Premium Free!
You May Also Be Interested In
- Proposals to the Annual General Meeting of Municipality Finance Plc
- Linde Increases Production Capacity and Reduces Emissions in Florida
- Company announcement no 9/2024 Annual account 2023
Create E-mail Alert Related Categories
SEC FilingsSign up for StreetInsider Free!
Receive full access to all new and archived articles, unlimited portfolio tracking, e-mail alerts, custom newswires and RSS feeds - and more!
