

Form N-CSRS COHEN & STEERS REIT & For: Jun 30
 Tweet
Tweet Share
ShareUNITED STATES
SECURITIES AND EXCHANGE COMMISSION
Washington, D.C. 20549
FORM N-CSR
CERTIFIED SHAREHOLDER REPORT OF REGISTERED
MANAGEMENT INVESTMENT COMPANIES
Investment Company Act File Number: 811-21326
Cohen & Steers REIT and Preferred and Income Fund, Inc.
(Exact name of registrant as specified in charter)
280 Park Avenue, New York, NY 10017
(Address of principal executive offices) (Zip code)
Dana A. DeVivo
Cohen & Steers Capital Management, Inc.
280 Park Avenue
New York, New York 10017
(Name and address of agent for service)
Registrant’s telephone number, including area code: (212) 832-3232
Date of fiscal year end: December 31
Date of reporting period: June 30, 2021
Item 1. Reports to Stockholders.
COHEN & STEERS REIT AND PREFERRED AND INCOME FUND, INC.
To Our Shareholders:
We would like to share with you our report for the six months ended June 30, 2021. The total returns for Cohen & Steers REIT and Preferred and Income Fund, Inc. (the Fund) and its comparative benchmarks were:
| Six Months Ended June 30, 2021 |
||||
| Cohen & Steers REIT and Preferred and Income Fund at Net Asset Valuea |
17.07 | %b | ||
| Cohen & Steers REIT and Preferred and Income Fund at Market Valuea |
22.83 | % | ||
| FTSE Nareit All Equity REITs Indexc |
21.35 | % | ||
| ICE BofA Fixed Rate Preferred Securities Indexc |
1.99 | % | ||
| Blended Benchmark—50% FTSE Nareit All Equity REITs Index/50% ICE BofA Fixed Rate Preferred Securities Index |
11.36 | % | ||
| S&P 500 Indexc |
15.25 | % | ||
The performance data quoted represent past performance. Past performance is no guarantee of future results. The investment return and the principal value of an investment will fluctuate and shares, if sold, may be worth more or less than their original cost. Current performance may be lower or higher than the performance data quoted. Performance results reflect the effects of leverage, resulting from borrowings under a credit agreement. Current total returns of the Fund can be obtained by visiting our website at cohenandsteers.com. The Fund’s returns assume the reinvestment of all dividends and distributions at prices obtained under the Fund’s dividend reinvestment plan. Index performance does not reflect the deduction of any fees, taxes or expenses. An investor cannot invest directly in an index. Performance figures for periods shorter than one year are not annualized.
Managed Distribution Policy
The Fund, acting in accordance with an exemptive order received from the U.S. Securities and Exchange Commission (SEC) and with approval of its Board of Directors (the Board), adopted a managed distribution policy under which the Fund intends to include long-term capital gains, where applicable, as part of the regular monthly cash distributions to its shareholders (the Plan). The Plan gives the Fund greater flexibility to realize long-term capital gains and to distribute those gains on a regular monthly basis. In accordance with the Plan, the Fund currently distributes $0.124 per share on a monthly basis.
| a | As a closed-end investment company, the price of the Fund’s exchange-traded shares will be set by market forces and can deviate from the net asset value (NAV) per share of the Fund. |
| b | The returns shown are based on NAVs reported on December 31, 2020 and June 30, 2021 and may differ from the returns shown in the Financial Highlights, which reflect adjustments made to the NAVs in accordance with accounting principles generally accepted in the United States of America (GAAP). |
| c | The FTSE Nareit All Equity REITs Index contains all tax-qualified REITs with more than 50% of total assets in qualifying real estate assets other than mortgages secured by real property that also meet minimum size and liquidity criteria. ICE BofA Fixed Rate Preferred Securities Index tracks the performance of fixed-rate U.S. dollar-denominated preferred securities issued in the U.S. domestic market. The S&P 500 Index is an unmanaged index of 500 large capitalization stocks that is frequently used as a general measure of U.S. stock market performance. Benchmark returns are shown for comparative purposes only and may not be representative of the Fund’s portfolio. |
1
COHEN & STEERS REIT AND PREFERRED AND INCOME FUND, INC.
The Fund may pay distributions in excess of the Fund’s investment company taxable income and net realized gains. This excess would be a return of capital distributed from the Fund’s assets. Distributions of capital decrease the Fund’s total assets and, therefore, could have the effect of increasing the Fund’s expense ratio. In addition, in order to make these distributions, the Fund may have to sell portfolio securities at a less than opportune time.
Shareholders should not draw any conclusions about the Fund’s investment performance from the amount of these distributions or from the terms of the Fund’s Plan. The Fund’s total return based on NAV is presented in the table above as well as in the Financial Highlights table.
The Plan provides that the Board of Directors may amend or terminate the Plan at any time without prior notice to Fund shareholders; however, at this time, there are no reasonably foreseeable circumstances that might cause the termination. The termination of the Plan could have the effect of creating a trading discount (if the Fund’s stock is trading at or above NAV) or widening an existing trading discount.
Market Review
In the six-month period ended June 30, 2021, U.S. real estate securities continued to rally from their lows in early 2020, as progress in vaccine distribution allowed for a general lifting of restrictions on public gatherings, business activities and travel. Economic reopening and additional fiscal relief led to increasing activity, generating stronger demand for real estate. Supply growth in many property sectors slowed amid labor shortages and rising construction costs, giving landlords greater pricing power to negotiate rents. Borrowing costs for many public real estate companies remained near historical lows. These positive conditions drove improving investor optimism, resulting in higher earnings multiples.
Preferred securities modestly advanced in the period, which was an ultimately positive period for credit-sensitive assets as optimism about economic reopenings outweighed the negative effect of rising bond yields. Global economic news was generally favorable, aided by significant fiscal stimulus and positive COVID vaccine rollout trends. Bond yields rose, with the yield on the 10-year U.S. Treasury increasing from 0.9% to 1.5% by period end. While this trend weighed on the prices of longer-duration high-quality bonds, preferred securities had a positive return as the improving credit outlook more than countered interest-rate concerns in terms of investor sentiment.
Fund Performance
The Fund had a positive total return for the period and outperformed its blended benchmark on both a NAV and market price basis.
For REIT common shares, returns were positive across all property types. The regional mall and shopping center sectors were among the strongest performers, as easing virus concerns led to a sharp rise in foot traffic and retail sales from depressed levels. The Fund’s overweight in regional malls aided relative performance, although the benefit was more than countered by the effect of our underweight in shopping centers.
Self storage, which had been one of the more resilient sectors through the pandemic, continued to see strong demand amid continued moving activity, driving rates for new customers up 50–70% from 2020 levels. The Fund’s overweight in self storage companies contributed positively to performance.
2
COHEN & STEERS REIT AND PREFERRED AND INCOME FUND, INC.
Leasing trends for apartments in U.S. coastal markets have bounced back fast and Sunbelt markets remained exceptionally strong, fueled by strong housing demand. Our underweight and stock selection in apartments detracted from relative performance. The Fund did not invest in Avalon Bay Communities and was underweight Equity Residential, which both gained more than 30% in the period.
Infrastructure and industrial REITs, which were among the few sectors to advance in 2020, added to those gains in the period but slightly trailed the index. The Fund’s allocation to infrastructure did not have a meaningful impact on relative performance (beneficial underweight offset by the effect of stock selection). Stock selection in the industrial sector hindered relative performance, in part due to an overweight in Americold Realty Trust, a food-focused industrial company that had only a modest gain. Elsewhere of note, an overweight in the health care sector aided performance, as did stock selection in the sector.
Preferred securities modestly advanced in the six months. Banks, the main issuer of preferred securities, saw solid improvements in earnings, credit quality and capital markets activity during the period. And after substantially building their loan-loss reserves in the second half of 2020, banks released large amounts of those excess loan-loss reserves in early 2021 due to optimism about economic reopenings and given factors such as strong consumer balance sheets. Our underweight and security selection in banking aided the Fund’s relative performance. Contributors included an out-of-benchmark allocation to a perpetual security from Texas Capital Bancshares that had a sizable gain.
The insurance sector had a positive but lesser return compared with banking securities. Security selection in insurance helped the Fund’s relative performance, as did security selection in real estate, telecommunications and utilities. Detractors included our overweights in the pipelines and energy sectors.
From an asset allocation standpoint, the Fund’s overweight in REIT common shares and underweight in preferreds helped performance compared with the blended benchmark, given the much stronger returns generated by REITs.
Impact of Leverage on Fund Performance
The Fund employs leverage as part of a yield-enhancement strategy. Leverage, which can increase total return in rising markets (just as it can have the opposite effect in declining markets), contributed significantly to the Fund’s performance for the six-month period ended June 30, 2021.
Impact of Derivatives on Fund Performance
The Fund used derivatives in the form of forward foreign currency exchange contracts for managing currency risk on certain Fund positions denominated in foreign currencies. These instruments did not have a material effect on the Fund’s total return for the six-month period ended June 30, 2021.
The Fund also engaged in the buying and selling of single stock options with the intention of enhancing total returns and reducing overall volatility. These contracts did not have a material effect on the Fund’s total return for the six-month period ended June 30, 2021.
3
COHEN & STEERS REIT AND PREFERRED AND INCOME FUND, INC.
In connection with its use of leverage, the Fund pays interest on a portion of its borrowings based on a floating rate under the terms of its credit agreement. To reduce the impact that an increase in interest rates could have on the performance of the Fund with respect to these borrowings, the Fund used interest rate swaps to exchange a portion of the floating rate for a fixed rate. The Fund also used “swaptions,” which are options to enter into swaps with the intention of managing interest-rate risk. The Fund’s use of swaps and swaptions did not have a material effect on the Fund’s total return for the for the six-month period ended June 30, 2021. In addition, the Fund used certain equity options with the intention of managing interest-rate risk. These options did not have a material effect on the Fund’s total return for the for the six-month period ended June 30, 2021.
Sincerely,

|

| |
| WILLIAM F. SCAPELL | JASON YABLON | |
| Portfolio Manager | Portfolio Manager | |

MATHEW KIRSCHNER
Portfolio Manager
The views and opinions in the preceding commentary are subject to change without notice and are as of the date of the report. There is no guarantee that any market forecast set forth in the commentary will be realized. This material represents an assessment of the market environment at a specific point in time, should not be relied upon as investment advice and is not intended to predict or depict performance of any investment.
Visit Cohen & Steers online at cohenandsteers.com
For more information about the Cohen & Steers family of mutual funds, visit cohenandsteers.com. Here you will find fund net asset values, fund fact sheets and portfolio highlights, as well as educational resources and timely market updates.
Our website also provides comprehensive information about Cohen & Steers, including our most recent press releases, profiles of our senior investment professionals and their investment approach to each asset class. The Cohen & Steers family of mutual funds specializes in liquid real assets, including real estate securities, listed infrastructure and natural resource equities, as well as preferred securities and other income solutions.
4
COHEN & STEERS REIT AND PREFERRED AND INCOME FUND, INC.
Our Leverage Strategy
(Unaudited)
Our current leverage strategy utilizes borrowings up to the maximum permitted by the Investment Company Act of 1940 to provide additional capital for the Fund, with an objective of increasing net income available for shareholders. As of June 30, 2021, leverage represented 25% of the Fund’s managed assets.
Through a combination of variable and fixed rate financing, the Fund has locked in interest rates on a significant portion of this additional capital through 2027 (where we effectively reduce our variable rate obligation and lock in our fixed rate obligation over various terms). Locking in a significant portion of our leveraging costs is designed to protect the dividend-paying ability of the Fund. The use of leverage increases the volatility of the Fund’s NAV in both up and down markets. However, we believe that locking in portions of the Fund’s leveraging costs for the various terms partially protects the Fund’s expenses from an increase in short-term interest rates.
Leverage Factsa,b
| Leverage (as a % of managed assets) |
25% | |
| % Variable Rate Financing |
15% | |
| Variable Rate |
0.9% | |
| % Fixed Rate Financingc,d |
85% | |
| Weighted Average Rate on Fixed Financing |
2.8% | |
| Weighted Average Term on Fixed Financing |
5.1 years |
The Fund seeks to enhance its dividend yield through leverage. The use of leverage is a speculative technique and there are special risks and costs associated with leverage. The NAV of the Fund’s shares may be reduced by the issuance and ongoing costs of leverage. So long as the Fund is able to invest in securities that produce an investment yield that is greater than the total cost of leverage, the leverage strategy will produce higher current net investment income for shareholders. On the other hand, to the extent that the total cost of leverage exceeds the incremental income gained from employing such leverage, shareholders would realize lower net investment income. In addition to the impact on net income, the use of leverage will have an effect of magnifying capital appreciation or depreciation for shareholders. Specifically, in an up market, leverage will typically generate greater capital appreciation than if the Fund were not employing leverage. Conversely, in down markets, the use of leverage will generally result in greater capital depreciation than if the Fund had been unlevered. To the extent that the Fund is required or elects to reduce its leverage, the Fund may incur breakage fees under the Fund’s credit arrangement and may need to liquidate investments, including under adverse economic conditions which may result in capital losses potentially reducing returns to shareholders. There can be no assurance that a leveraging strategy will be successful during any period in which it is employed.
| a | Data as of June 30, 2021. Information is subject to change. |
| b | See Note 7 in Notes to Financial Statements. |
| c | Represents a combination of fixed rate borrowings and fixed payer interest rate swap contracts. |
| d | The Fund entered into forward-starting interest rate swap contracts with interest receipts and payments commencing on December 24, 2021 and December 24, 2022 (effective dates). |
5
COHEN & STEERS REIT AND PREFERRED AND INCOME FUND, INC.
June 30, 2021
Top Ten Holdingsa
(Unaudited)
| Security |
Value | % of Managed Assets |
||||||
| American Tower Corp. |
$ | 84,839,628 | 5.0 | |||||
| Public Storage |
53,945,590 | 3.2 | ||||||
| Prologis, Inc. |
46,513,306 | 2.7 | ||||||
| Equinix, Inc. |
45,767,462 | 2.7 | ||||||
| Simon Property Group, Inc. |
41,424,269 | 2.4 | ||||||
| Crown Castle International Corp. |
40,210,500 | 2.4 | ||||||
| Duke Realty Corp. |
39,453,725 | 2.3 | ||||||
| Healthpeak Properties, Inc. |
38,765,606 | 2.3 | ||||||
| UDR, Inc. |
37,164,750 | 2.2 | ||||||
| Ventas, Inc. |
32,106,588 | 1.9 | ||||||
| a | Top ten holdings (excluding short-term investments and derivative instruments) are determined on the basis of the value of individual securities held. The Fund may also hold positions in other securities issued by the companies listed above. See the Schedule of Investments for additional details on such other positions. |
Sector Breakdownb
(Based on Managed Assets)
(Unaudited)
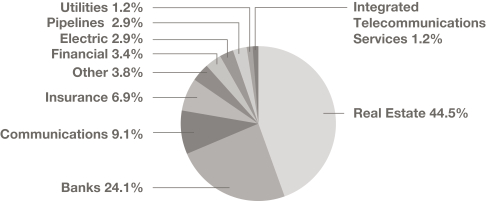
| b | Excludes derivative instruments. |
6
COHEN & STEERS REIT AND PREFERRED AND INCOME FUND, INC.
SCHEDULE OF INVESTMENTS
June 30, 2021 (Unaudited)
| Shares | Value | |||||||||||
| COMMON STOCK |
69.4% | |||||||||||
| COMMUNICATIONS—TOWERS |
12.1% | |||||||||||
| American Tower Corp.a,b |
|
314,058 | $ | 84,839,628 | ||||||||
| Crown Castle International Corp.a,b |
|
206,102 | 40,210,500 | |||||||||
| SBA Communications Corp.a,b |
|
92,539 | 29,492,179 | |||||||||
|
|
|
|||||||||||
| 154,542,307 | ||||||||||||
|
|
|
|||||||||||
| REAL ESTATE |
57.3% | |||||||||||
| DATA CENTERS |
6.3% | |||||||||||
| CyrusOne, Inc.a,b |
|
355,017 | 25,390,816 | |||||||||
| Digital Realty Trust, Inc.a |
|
63,588 | 9,567,451 | |||||||||
| Equinix, Inc.a |
|
57,024 | 45,767,462 | |||||||||
|
|
|
|||||||||||
| 80,725,729 | ||||||||||||
|
|
|
|||||||||||
| HEALTH CARE |
9.2% | |||||||||||
| Healthcare Trust of America, Inc., Class A |
|
461,914 | 12,333,104 | |||||||||
| Healthpeak Properties, Inc.a,b,c |
|
1,164,482 | 38,765,606 | |||||||||
| Medical Properties Trust, Inc.a |
|
203,285 | 4,086,028 | |||||||||
| Ventas, Inc.a,b |
|
562,287 | 32,106,588 | |||||||||
| Welltower, Inc. |
|
364,009 | 30,249,148 | |||||||||
|
|
|
|||||||||||
| 117,540,474 | ||||||||||||
|
|
|
|||||||||||
| HOTEL |
2.4% | |||||||||||
| DiamondRock Hospitality Co.d |
|
821,964 | 7,973,051 | |||||||||
| Host Hotels & Resorts, Inc.a,b,d |
|
1,333,895 | 22,796,265 | |||||||||
|
|
|
|||||||||||
| 30,769,316 | ||||||||||||
|
|
|
|||||||||||
| INDUSTRIALS |
8.2% | |||||||||||
| Americold Realty Trusta,b |
|
376,428 | 14,247,800 | |||||||||
| BG LLH, LLC (Lineage Logistics)e,f |
|
61,115 | 4,807,878 | |||||||||
| Duke Realty Corp.a |
|
833,236 | 39,453,725 | |||||||||
| Prologis, Inc.a |
|
389,135 | 46,513,306 | |||||||||
|
|
|
|||||||||||
| 105,022,709 | ||||||||||||
|
|
|
|||||||||||
| NET LEASE |
6.2% | |||||||||||
| NETSTREIT Corp.a |
|
332,914 | 7,676,997 | |||||||||
| Spirit Realty Capital, Inc.a,b |
|
318,368 | 15,230,725 | |||||||||
| VEREIT, Inc.a,b |
|
670,059 | 30,775,810 | |||||||||
| VICI Properties, Inc.a,b |
|
826,471 | 25,637,130 | |||||||||
|
|
|
|||||||||||
| 79,320,662 | ||||||||||||
|
|
|
|||||||||||
See accompanying notes to financial statements.
7
COHEN & STEERS REIT AND PREFERRED AND INCOME FUND, INC.
SCHEDULE OF INVESTMENTS—(Continued)
June 30, 2021 (Unaudited)
| Shares | Value | |||||||||||
| OFFICE |
0.5% | |||||||||||
| Kilroy Realty Corp.a,b |
|
85,222 | $ | 5,934,860 | ||||||||
|
|
|
|||||||||||
| RESIDENTIAL |
9.2% | |||||||||||
| APARTMENT |
5.6% | |||||||||||
| Apartment Income REIT Corp.a,b |
|
305,090 | 14,470,419 | |||||||||
| Essex Property Trust, Inc.a |
|
68,655 | 20,597,187 | |||||||||
| UDR, Inc.a,b |
|
758,774 | 37,164,750 | |||||||||
|
|
|
|||||||||||
| 72,232,356 | ||||||||||||
|
|
|
|||||||||||
| MANUFACTURED HOME |
2.4% | |||||||||||
| Sun Communities, Inc.a,b |
|
176,046 | 30,174,284 | |||||||||
|
|
|
|||||||||||
| SINGLE FAMILY |
1.2% | |||||||||||
| Invitation Homes, Inc.a,b |
|
407,328 | 15,189,261 | |||||||||
|
|
|
|||||||||||
| TOTAL RESIDENTIAL |
|
117,595,901 | ||||||||||
|
|
|
|||||||||||
| SELF STORAGE |
6.7% | |||||||||||
| Extra Space Storage, Inc.a |
|
190,727 | 31,244,897 | |||||||||
| Public Storagea,b,c |
|
179,406 | 53,945,590 | |||||||||
|
|
|
|||||||||||
| 85,190,487 | ||||||||||||
|
|
|
|||||||||||
| SHOPPING CENTERS |
5.4% | |||||||||||
| COMMUNITY CENTER |
2.1% | |||||||||||
| Kimco Realty Corp. |
|
706,301 | 14,726,376 | |||||||||
| Regency Centers Corp. |
|
189,804 | 12,160,742 | |||||||||
|
|
|
|||||||||||
| 26,887,118 | ||||||||||||
|
|
|
|||||||||||
| REGIONAL MALL |
3.3% | |||||||||||
| Simon Property Group, Inc.a,b |
|
317,476 | 41,424,269 | |||||||||
|
|
|
|||||||||||
| TOTAL SHOPPING CENTERS |
|
68,311,387 | ||||||||||
|
|
|
|||||||||||
| SPECIALTY |
1.0% | |||||||||||
| Lamar Advertising Co., Class A |
|
122,750 | 12,817,555 | |||||||||
|
|
|
|||||||||||
| TIMBER |
2.2% | |||||||||||
| Weyerhaeuser Co.a,b |
|
826,907 | 28,462,139 | |||||||||
|
|
|
|||||||||||
| TOTAL REAL ESTATE |
|
731,691,219 | ||||||||||
|
|
|
|||||||||||
| TOTAL COMMON
STOCK |
|
886,233,526 | ||||||||||
|
|
|
|||||||||||
See accompanying notes to financial statements.
8
COHEN & STEERS REIT AND PREFERRED AND INCOME FUND, INC.
SCHEDULE OF INVESTMENTS—(Continued)
June 30, 2021 (Unaudited)
| Shares | Value | |||||||||||
| PREFERRED SECURITIES—$25 PAR VALUE |
14.5% | |||||||||||
| BANKS |
3.4% | |||||||||||
| Bank of Hawaii Corp., 4.375%, Series Ag |
|
113,200 | $ | 2,884,336 | ||||||||
| Citigroup, Inc., 6.875% to 11/15/23, Series Ka,g,h |
|
71,345 | 2,044,034 | |||||||||
| Dime Community Bancshares, Inc., 5.50%g |
|
89,986 | 2,384,629 | |||||||||
| First Citizens BancShares, Inc./NC, 5.375%, Series Ag |
|
81,147 | 2,225,862 | |||||||||
| First Horizon Corp., 4.70%, Series Fg |
|
102,800 | 2,616,260 | |||||||||
| Fulton Financial Corp., 5.125%, Series Ag |
|
37,800 | 1,014,174 | |||||||||
| GMAC Capital Trust I, 5.941% (3 Month US LIBOR + 5.785%), due 2/15/40, Series 2 (TruPS) (FRN)i |
|
59,051 | 1,494,581 | |||||||||
| Huntington Bancshares, Inc., 5.70%, Series Cg |
|
73,000 | 1,919,900 | |||||||||
| JPMorgan Chase & Co., 4.625%, Series LLg |
|
72,400 | 1,928,012 | |||||||||
| New York Community Bancorp, Inc., 6.375% to 3/17/27, Series Ag,h |
|
73,081 | 2,114,234 | |||||||||
| Regions Financial Corp., 5.70% to 5/15/29, Series Ca,g,h |
|
149,000 | 4,410,400 | |||||||||
| Signature Bank/New York NY, 5.00%, Series ag |
|
134,588 | 3,510,055 | |||||||||
| Synovus Financial Corp., 5.875% to 7/1/24, Series Eg,h |
|
47,000 | 1,281,220 | |||||||||
| Texas Capital Bancshares, Inc., 5.75%, Series Bg |
|
142,300 | 4,076,895 | |||||||||
| Washington Federal, Inc., 4.875%, Series Ag |
|
86,200 | 2,305,850 | |||||||||
| Wells Fargo & Co., 5.85% to 9/15/23, Series Qa,g,h |
|
117,122 | 3,226,711 | |||||||||
| Wells Fargo & Co., 4.75%, Series Za,g |
|
144,893 | 3,788,952 | |||||||||
|
|
|
|||||||||||
| 43,226,105 | ||||||||||||
|
|
|
|||||||||||
| ELECTRIC |
1.0% | |||||||||||
| CMS Energy Corp., 5.875%, due 3/1/79a |
|
82,426 | 2,284,849 | |||||||||
| CMS Energy Corp., 4.20%, Series Cg |
|
161,200 | 4,084,002 | |||||||||
| Integrys Holding, Inc., 6.00% to 8/1/23, due 8/1/73a,h |
|
122,977 | 3,277,337 | |||||||||
| Southern Co./The, 4.95%, due 1/30/80, Series 2020a |
|
108,800 | 2,918,016 | |||||||||
|
|
|
|||||||||||
| 12,564,204 | ||||||||||||
|
|
|
|||||||||||
| ELECTRIC—FOREIGN |
0.5% | |||||||||||
| Brookfield BRP Holdings Canada, Inc., 4.625% (Canada)g |
|
78,000 | 1,978,860 | |||||||||
| Brookfield Infrastructure Finance ULC, 5.00%, due 5/24/81 (Canada) |
|
81,825 | 2,078,355 | |||||||||
| Brookfield Infrastructure Partners LP, 5.125%, Series 13 (Canada)g |
|
93,591 | 2,448,340 | |||||||||
| Brookfield Renewable Partners LP, 5.25%, Series 17 (Canada)g |
|
9,364 | 245,337 | |||||||||
|
|
|
|||||||||||
| 6,750,892 | ||||||||||||
|
|
|
|||||||||||
See accompanying notes to financial statements.
9
COHEN & STEERS REIT AND PREFERRED AND INCOME FUND, INC.
SCHEDULE OF INVESTMENTS—(Continued)
June 30, 2021 (Unaudited)
| Shares | Value | |||||||||||
| FINANCIAL |
2.3% | |||||||||||
| DIVERSIFIED FINANCIAL SERVICES |
1.1% | |||||||||||
| Apollo Global Management, Inc., 6.375%, Series Bg |
|
89,970 | $ | 2,416,594 | ||||||||
| Carlyle Finance LLC, 4.625%, due 5/15/61 |
|
40,312 | 1,025,537 | |||||||||
| Federal Agricultural Mortgage Corp., 4.875%, Series Gg |
|
155,200 | 4,010,368 | |||||||||
| KKR Group Finance Co. IX LLC, 4.625%, due 4/1/61 |
|
110,402 | 2,849,476 | |||||||||
| National Rural Utilities Cooperative Finance Corp., 5.50%, due 5/15/64, Series US |
|
45,320 | 1,240,862 | |||||||||
| Synchrony Financial, 5.625%, Series Ag |
|
90,000 | 2,462,400 | |||||||||
|
|
|
|||||||||||
| 14,005,237 | ||||||||||||
|
|
|
|||||||||||
| INVESTMENT BANKER/BROKER |
1.0% | |||||||||||
| Charles Schwab Corp./The, 4.45%, Series Jg |
|
115,798 | 3,068,647 | |||||||||
| Morgan Stanley, 6.875% to 1/15/24, Series Fa,g,h |
|
151,245 | 4,280,233 | |||||||||
| Morgan Stanley, 6.375% to 10/15/24, Series Ia,g,h |
|
111,338 | 3,237,709 | |||||||||
| Morgan Stanley, 5.85% to 4/15/27, Series Kg,h |
|
59,056 | 1,743,333 | |||||||||
|
|
|
|||||||||||
| 12,329,922 | ||||||||||||
|
|
|
|||||||||||
| INVESTMENT ADVISORY SERVICES—FOREIGN |
0.2% | |||||||||||
| Brookfield Finance, Inc., 4.625%, due 10/16/80, Series 50 (Canada) |
|
88,400 | 2,278,952 | |||||||||
|
|
|
|||||||||||
| TOTAL FINANCIAL |
|
28,614,111 | ||||||||||
|
|
|
|||||||||||
| INDUSTRIALS—CHEMICALS |
0.7% | |||||||||||
| CHS, Inc., 7.10% to 3/31/24, Series 2a,g,h |
|
150,229 | 4,283,029 | |||||||||
| CHS, Inc., 6.75% to 9/30/24, Series 3g,h |
|
90,453 | 2,566,152 | |||||||||
| CHS, Inc., 7.50%, Series 4a,g |
|
74,495 | 2,173,764 | |||||||||
|
|
|
|||||||||||
| 9,022,945 | ||||||||||||
|
|
|
|||||||||||
| INSURANCE |
2.4% | |||||||||||
| LIFE/HEALTH INSURANCE |
1.2% | |||||||||||
| Athene Holding Ltd., 6.35% to 6/30/29, Series Ag,h |
|
78,974 | 2,321,836 | |||||||||
| Athene Holding Ltd., 6.375% to 6/30/25, Series Cg,h |
|
75,707 | 2,137,209 | |||||||||
| Athene Holding Ltd., 4.875%, Series Da,g |
|
80,400 | 2,076,732 | |||||||||
| Brighthouse Financial, Inc., 5.375%, Series Ca,g |
|
144,000 | 3,918,240 | |||||||||
| CNO Financial Group, Inc., 5.125%, due 11/25/60 |
|
44,151 | 1,189,869 | |||||||||
| Equitable Holdings, Inc., 5.25%, Series Ag |
|
66,084 | 1,774,355 | |||||||||
| Globe Life, Inc., 4.25%, due 6/15/61 |
|
67,459 | 1,761,355 | |||||||||
|
|
|
|||||||||||
| 15,179,596 | ||||||||||||
|
|
|
|||||||||||
See accompanying notes to financial statements.
10
COHEN & STEERS REIT AND PREFERRED AND INCOME FUND, INC.
SCHEDULE OF INVESTMENTS—(Continued)
June 30, 2021 (Unaudited)
| Shares | Value | |||||||||||
| MULTI-LINE—FOREIGN |
0.2% | |||||||||||
| Aegon Funding Co. LLC, 5.10%, due 12/15/49 (Netherlands)a |
|
89,000 | $ | 2,391,430 | ||||||||
|
|
|
|||||||||||
| PROPERTY CASUALTY |
0.5% | |||||||||||
| Assurant, Inc., 5.25%, due 1/15/61a |
|
77,761 | 2,102,657 | |||||||||
| Enstar Group Ltd., 7.00% to 9/1/28, Series Da,g,h |
|
132,981 | 3,933,578 | |||||||||
| Selective Insurance Group, Inc., 4.60%, Series Bg |
|
24,311 | 618,229 | |||||||||
|
|
|
|||||||||||
| 6,654,464 | ||||||||||||
|
|
|
|||||||||||
| REINSURANCE |
0.5% | |||||||||||
| Arch Capital Group Ltd., 5.25%, Series Eg |
|
67,337 | 1,709,686 | |||||||||
| Arch Capital Group Ltd., 5.45%, Series Fa,g |
|
112,593 | 2,946,559 | |||||||||
| Arch Capital Group Ltd., 4.55%, Series Gg |
|
72,800 | 1,878,968 | |||||||||
|
|
|
|||||||||||
| 6,535,213 | ||||||||||||
|
|
|
|||||||||||
| TOTAL INSURANCE |
|
30,760,703 | ||||||||||
|
|
|
|||||||||||
| INTEGRATED TELECOMMUNICATIONS SERVICES |
1.2% | |||||||||||
| AT&T, Inc., 4.75%, Series Ca,g |
|
58,000 | 1,542,220 | |||||||||
| Telephone and Data Systems, Inc., 6.625%, Series UUg |
|
139,700 | 4,069,461 | |||||||||
| United States Cellular Corp., 5.50%, due 3/1/70 |
|
162,400 | 4,253,256 | |||||||||
| United States Cellular Corp., 5.50%, due 6/1/70 |
|
71,578 | 1,856,018 | |||||||||
| United States Cellular Corp., 6.25%, due 9/1/69 |
|
133,600 | 3,656,632 | |||||||||
|
|
|
|||||||||||
| 15,377,587 | ||||||||||||
|
|
|
|||||||||||
| PIPELINES |
0.5% | |||||||||||
| Energy Transfer LP, 7.625% to 8/15/23, Series Dg,h |
|
135,000 | 3,431,700 | |||||||||
| Energy Transfer LP, 7.60% to 5/15/24, Series Eg,h |
|
111,530 | 2,788,250 | |||||||||
|
|
|
|||||||||||
| 6,219,950 | ||||||||||||
|
|
|
|||||||||||
| PIPELINES—FOREIGN |
0.2% | |||||||||||
| Enbridge, Inc., 6.375% to 4/15/23, due 4/15/78, Series B (Canada)a,h |
|
112,871 | 3,057,675 | |||||||||
|
|
|
|||||||||||
| REAL ESTATE |
1.3% | |||||||||||
| DIVERSIFIED |
0.3% | |||||||||||
| Lexington Realty Trust, 6.50%, Series C ($50 Par Value)a,g |
|
76,536 | 4,607,467 | |||||||||
|
|
|
|||||||||||
| HOTEL |
0.2% | |||||||||||
| Pebblebrook Hotel Trust, 6.375%, Series Gg |
|
81,600 | 2,224,416 | |||||||||
|
|
|
|||||||||||
See accompanying notes to financial statements.
11
COHEN & STEERS REIT AND PREFERRED AND INCOME FUND, INC.
SCHEDULE OF INVESTMENTS—(Continued)
June 30, 2021 (Unaudited)
| Shares | Value | |||||||||||
| INDUSTRIALS |
0.3% | |||||||||||
| Monmouth Real Estate Investment Corp., 6.125%, Series Cg |
|
140,000 | $ | 3,537,800 | ||||||||
|
|
|
|||||||||||
| OFFICE |
0.4% | |||||||||||
| Brookfield Property Partners LP, 5.75%, Series Ag |
|
104,400 | 2,606,868 | |||||||||
| Brookfield Property Partners LP, 6.375%, Series A2g |
|
92,000 | 2,419,600 | |||||||||
|
|
|
|||||||||||
| 5,026,468 | ||||||||||||
|
|
|
|||||||||||
| SELF STORAGE |
0.1% | |||||||||||
| National Storage Affiliates Trust, 6.00%, Series Ag |
|
61,179 | † | 1,651,833 | ||||||||
|
|
|
|||||||||||
| TOTAL REAL ESTATE |
|
17,047,984 | ||||||||||
|
|
|
|||||||||||
| UTILITIES |
0.7% | |||||||||||
| GAS UTILITIES |
0.6% | |||||||||||
| Sempra Energy, 5.75%, due 7/1/79 |
|
77,200 | 2,123,772 | |||||||||
| South Jersey Industries, Inc., 5.625%, due 9/16/79a |
|
136,000 | 3,572,720 | |||||||||
| Spire, Inc., 5.90%, Series Ag |
|
78,037 | 2,206,886 | |||||||||
|
|
|
|||||||||||
| 7,903,378 | ||||||||||||
|
|
|
|||||||||||
| MULTI-UTILITIES |
0.1% | |||||||||||
| NiSource, Inc., 6.50% to 3/15/24, Series Bg,h |
|
50,551 | 1,448,792 | |||||||||
|
|
|
|||||||||||
| TOTAL UTILITIES |
|
9,352,170 | ||||||||||
|
|
|
|||||||||||
| UTILITIES—FOREIGN |
0.3% | |||||||||||
| Algonquin Power & Utilities Corp., 6.20% to 7/1/24, due 7/1/79, Series 19-A (Canada)a,h |
|
110,080 | 3,071,232 | |||||||||
|
|
|
|||||||||||
| TOTAL PREFERRED
SECURITIES—$25 PAR VALUE |
|
185,065,558 | ||||||||||
|
|
|
|||||||||||
| Principal Amount |
||||||||||||
| PREFERRED SECURITIES—CAPITAL SECURITIES |
47.4% | |||||||||||
| BANKS |
13.9% | |||||||||||
| Ally Financial, Inc., 4.70% to 5/15/26, Series Ba,g,h |
|
$ | 3,200,000 | 3,322,240 | ||||||||
| Ally Financial, Inc., 4.70% to 5/15/28, Series Cg,h |
|
5,140,000 | 5,218,642 | |||||||||
| Bank of America Corp., 5.875% to 3/15/28, Series FFa,g,h |
|
6,831,000 | 7,827,028 | |||||||||
| Bank of America Corp., 6.10% to 3/17/25, Series AAa,g,h |
|
2,950,000 | 3,314,517 | |||||||||
| Bank of America Corp., 6.25% to 9/5/24, Series Xa,g,h |
|
11,250,000 | 12,452,344 | |||||||||
| Bank of America Corp., 6.50% to 10/23/24, Series Za,g,h |
|
3,763,000 | 4,271,005 | |||||||||
See accompanying notes to financial statements.
12
COHEN & STEERS REIT AND PREFERRED AND INCOME FUND, INC.
SCHEDULE OF INVESTMENTS—(Continued)
June 30, 2021 (Unaudited)
| Principal Amount |
Value | |||||||||
| Capital One Financial Corp., 3.95% to 9/1/26, Series Mg,h |
$ | 1,842,000 | $ | 1,885,748 | ||||||
| Citigroup Capital III, 7.625%, due 12/1/36a |
4,700,000 | 7,002,779 | ||||||||
| Citigroup, Inc., 3.875% to 2/18/26a,g,h |
7,820,000 | 8,005,725 | ||||||||
| Citigroup, Inc., 4.00% to 12/10/25, Series Wg,h |
1,720,000 | 1,782,350 | ||||||||
| Citigroup, Inc., 5.00% to 9/12/24, Series Ua,g,h |
4,094,000 | 4,295,015 | ||||||||
| Citigroup, Inc., 5.95% to 5/15/25, Series Pa,g,h |
3,500,000 | 3,839,325 | ||||||||
| Citigroup, Inc., 6.25% to 8/15/26, Series Ta,g,h |
4,335,000 | 5,076,155 | ||||||||
| Citizens Financial Group, Inc., 5.65% to 10/6/25, Series Fa,g,h |
1,000,000 | 1,107,500 | ||||||||
| Citizens Financial Group, Inc., 6.375% to 4/6/24, Series Ca,g,h |
1,800,000 | 1,917,000 | ||||||||
| CoBank ACB, 6.125%, Series Ga,b,g |
46,500 | † | 4,789,500 | |||||||
| CoBank ACB, 6.25% to 10/1/22, Series Fa,g,h |
33,000 | † | 3,498,000 | |||||||
| CoBank ACB, 6.25% to 10/1/26, Series Ia,b,g,h |
4,334,000 | 4,854,080 | ||||||||
| Comerica, Inc., 5.625% to 7/1/25a,g,h |
1,430,000 | 1,587,300 | ||||||||
| Dresdner Funding Trust I, 8.151%, due 6/30/31, 144Aa,j |
935,906 | 1,343,025 | ||||||||
| Farm Credit Bank of Texas, 5.70% to 9/15/25, Series 4, 144Ag,h,j |
2,875,000 | 3,122,969 | ||||||||
| Farm Credit Bank of Texas, 6.75% to 9/15/23, 144Aa,g,h,j |
63,000 | † | 6,835,500 | |||||||
| First Horizon Bank, 3.75% (3 Month US LIBOR + 0.85%, Floor 3.75%), 144A (FRN)g,i,j |
2,500 | † | 2,043,750 | |||||||
| Goldman Sachs Group, Inc./The, 3.80% to 5/10/26, Series Tg,h |
1,730,000 | 1,765,119 | ||||||||
| Goldman Sachs Group, Inc./The, 5.50% to 8/10/24, Series Qg,h |
1,990,000 | 2,187,826 | ||||||||
| Huntington Bancshares, Inc., 4.45% to 10/15/27, Series Gg,h |
3,543,000 | 3,791,010 | ||||||||
| Huntington Bancshares, Inc., 5.625% to 7/15/30, Series Fg,h |
2,290,000 | 2,667,850 | ||||||||
| JPMorgan Chase & Co., 3.65% to 6/1/26, Series KKg,h |
6,000,000 | 6,015,900 | ||||||||
| JPMorgan Chase & Co., 4.60% to 2/1/25, Series HHg,h |
1,802,000 | 1,869,665 | ||||||||
| JPMorgan Chase & Co., 5.00% to 8/1/24, Series FFg,h |
4,150,000 | 4,388,936 | ||||||||
See accompanying notes to financial statements.
13
COHEN & STEERS REIT AND PREFERRED AND INCOME FUND, INC.
SCHEDULE OF INVESTMENTS—(Continued)
June 30, 2021 (Unaudited)
| Principal Amount |
Value | |||||||||||
| JPMorgan Chase & Co., 6.10% to 10/1/24, Series Xg,h |
|
$ | 5,330,000 | $ | 5,833,019 | |||||||
| JPMorgan Chase & Co., 6.125% to 4/30/24, Series Ug,h |
|
2,305,000 | 2,498,620 | |||||||||
| JPMorgan Chase & Co., 6.75% to 2/1/24, Series Sa,g,h |
|
7,336,000 | 8,139,109 | |||||||||
| Regions Financial Corp., 5.75% to 6/15/25, Series Dg,h |
|
990,000 | 1,108,800 | |||||||||
| SVB Financial Group, 4.00% to 5/15/26, Series Cg,h |
|
4,540,000 | 4,632,162 | |||||||||
| Truist Financial Corp., 4.95% to 9/1/25, Series Pg,h |
|
1,898,000 | 2,089,698 | |||||||||
| Truist Financial Corp., 5.10% to 3/1/30, Series Qa,g,h |
|
3,830,000 | 4,313,537 | |||||||||
| Truist Financial Corp., 5.125% to 12/15/27, Series Ma,b,g,h |
|
4,500,000 | 4,837,500 | |||||||||
| Wells Fargo & Co., 3.90% to 3/15/26, Series BBg,h |
|
11,740,000 | 12,161,759 | |||||||||
| Wells Fargo & Co., 5.875% to 6/15/25, Series Ug,h |
|
3,630,000 | 4,074,348 | |||||||||
| Wells Fargo & Co., 5.95%, due 12/15/36a |
|
3,700,000 | 5,096,706 | |||||||||
|
|
|
|||||||||||
| 176,863,061 | ||||||||||||
|
|
|
|||||||||||
| BANKS—FOREIGN |
14.9% | |||||||||||
| Abanca Corp. Bancaria SA, 6.00% to 1/20/26 (Spain)g,h,k,l |
|
1,200,000 | 1,519,097 | |||||||||
| Banco Bilbao Vizcaya Argentaria SA, 6.50% to 3/5/25, Series 9 (Spain)a,g,h,l |
|
2,400,000 | 2,616,000 | |||||||||
| Banco BPM SpA, 6.125% to 1/21/25 (Italy)g,h,k,l |
|
1,400,000 | 1,769,097 | |||||||||
| Banco BPM SpA, 6.50% to 1/19/26 (Italy)g,h,k,l |
|
600,000 | 779,911 | |||||||||
| Banco de Sabadell SA, 5.75% to 3/15/26 (Spain)g,h,k,l |
|
1,600,000 | 2,008,926 | |||||||||
| Banco de Sabadell SA, 6.50% to 5/18/22 (Spain)g,h,k,l |
|
400,000 | 488,354 | |||||||||
| Banco Santander SA, 4.75% to 11/12/26 (Spain)g,h |
|
6,000,000 | 6,087,000 | |||||||||
| Bank of China Hong Kong Ltd., 5.90% to 9/14/23, 144A (Hong Kong)a,g,h,j |
|
4,800,000 | 5,175,168 | |||||||||
| Bank of Ireland Group PLC, 6.00% to 9/1/25 (Ireland)g,h,k,l |
|
1,000,000 | 1,321,118 | |||||||||
| Bank of Ireland Group PLC, 7.50% to 5/19/25 (Ireland)g,h,k,l |
|
1,800,000 | 2,526,558 | |||||||||
| Bank of Montreal, 4.30% to 10/26/25, due 11/26/80 (Canada)h |
|
1,400,000 | 1,192,270 | |||||||||
| Bank of Nova Scotia/The, 4.90% to 6/4/25 (Canada)a,g,h |
|
2,740,000 | 3,014,000 | |||||||||
| Barclays PLC, 6.125% to 12/15/25 (United Kingdom)g,h,l |
|
2,600,000 | 2,884,362 | |||||||||
| Barclays PLC, 7.125% to 6/15/25 (United Kingdom)g,h,l |
|
1,800,000 | 2,850,981 | |||||||||
| Barclays PLC, 7.875% to 3/15/22 (United Kingdom)g,h,k,l |
|
3,600,000 | 3,759,300 | |||||||||
| Barclays PLC, 8.00% to 6/15/24 (United Kingdom)a,g,h,l |
|
3,400,000 | 3,869,625 | |||||||||
| BNP Paribas SA, 6.625% to 3/25/24, 144A (France)a,g,h,j,l |
|
1,796,000 | 1,974,199 | |||||||||
| BNP Paribas SA, 7.00% to 8/16/28, 144A (France)a,g,h,j,l |
|
2,400,000 | 2,883,900 | |||||||||
See accompanying notes to financial statements.
14
COHEN & STEERS REIT AND PREFERRED AND INCOME FUND, INC.
SCHEDULE OF INVESTMENTS—(Continued)
June 30, 2021 (Unaudited)
| Principal Amount |
Value | |||||||||
| BNP Paribas SA, 7.195% to 6/25/37, 144A (France)a,g,h,j |
$ | 800,000 | $ | 855,000 | ||||||
| BNP Paribas SA, 7.375% to 8/19/25, 144A (France)a,g,h,j,l |
6,100,000 | 7,114,521 | ||||||||
| Commerzbank AG, 4.25% to 10/9/27 (Germany)g,h,k,l |
1,800,000 | 2,166,916 | ||||||||
| Credit Agricole SA, 6.875% to 9/23/24, 144A (France)a,g,h,j,l |
2,000,000 | 2,241,390 | ||||||||
| Credit Agricole SA, 7.875% to 1/23/24, 144A (France)a,g,h,j,l |
3,200,000 | 3,624,010 | ||||||||
| Credit Agricole SA, 8.125% to 12/23/25, 144A (France)a,g,h,j,l |
5,500,000 | 6,700,985 | ||||||||
| Credit Suisse Group AG, 5.25% to 2/11/27, 144A (Switzerland)g,h,j,l |
2,400,000 | 2,544,000 | ||||||||
| Credit Suisse Group AG, 6.375% to 8/21/26, 144A (Switzerland)a,g,h,j,l |
3,700,000 | 4,127,221 | ||||||||
| Credit Suisse Group AG, 7.125% to 7/29/22 (Switzerland)g,h,k,l |
3,400,000 | 3,550,416 | ||||||||
| Credit Suisse Group AG, 7.25% to 9/12/25, 144A (Switzerland)a,g,h,j,l |
2,000,000 | 2,262,390 | ||||||||
| Credit Suisse Group AG, 7.50% to 7/17/23, 144A (Switzerland)a,g,h,j,l |
6,400,000 | 6,976,000 | ||||||||
| Credit Suisse Group AG, 7.50% to 12/11/23, 144A (Switzerland)a,g,h,j,l |
1,800,000 | 2,000,781 | ||||||||
| Danske Bank A/S, 4.375% to 5/18/26 (Denmark)g,h,k,l |
2,000,000 | 2,023,750 | ||||||||
| Danske Bank A/S, 7.00% to 6/26/25 (Denmark)g,h,k,l |
800,000 | 897,500 | ||||||||
| Deutsche Bank AG, 4.789% to 4/30/25 (Germany)g,h,k,l |
1,600,000 | 1,606,000 | ||||||||
| Deutsche Bank AG, 6.00% to 10/30/25 (Germany)g,h,l |
800,000 | 849,000 | ||||||||
| Deutsche Bank AG, 7.50% to 4/30/25 (Germany)g,h,l |
1,400,000 | 1,562,680 | ||||||||
| HSBC Capital Funding Dollar 1 LP, 10.176% to 6/30/30, 144A (United Kingdom)a,b,g,h,j |
2,367,000 | 3,924,344 | ||||||||
| HSBC Holdings PLC, 4.60% to 12/17/30 (United Kingdom)g,h,l |
1,800,000 | 1,872,000 | ||||||||
| HSBC Holdings PLC, 6.375% to 3/30/25 (United Kingdom)b,g,h,l |
3,800,000 | 4,241,465 | ||||||||
| HSBC Holdings PLC, 6.50% to 3/23/28 (United Kingdom)a,g,h,l |
2,100,000 | 2,412,386 | ||||||||
See accompanying notes to financial statements.
15
COHEN & STEERS REIT AND PREFERRED AND INCOME FUND, INC.
SCHEDULE OF INVESTMENTS—(Continued)
June 30, 2021 (Unaudited)
| Principal Amount |
Value | |||||||||
| ING Groep N.V., 4.875% to 5/16/29 (Netherlands)g,h,k,l |
$ | 1,600,000 | $ | 1,675,000 | ||||||
| ING Groep N.V., 5.75% to 11/16/26 (Netherlands)g,h,l |
1,400,000 | 1,551,809 | ||||||||
| ING Groep N.V., 6.75% to 4/16/24 (Netherlands)g,h,k,l |
400,000 | 442,002 | ||||||||
| ING Groep N.V., 6.875% to 4/16/22 (Netherlands)g,h,k,l |
1,200,000 | 1,249,880 | ||||||||
| Intesa Sanpaolo SpA, 5.50% to 3/1/28, Series EMTN (Italy)g,h,k,l |
1,650,000 | 2,157,028 | ||||||||
| Intesa Sanpaolo SpA, 7.70% to 9/17/25, 144A (Italy)g,h,j,l |
1,800,000 | 2,066,616 | ||||||||
| Lloyds Banking Group PLC, 6.413% to 10/1/35, 144A (United Kingdom)g,h,j |
1,200,000 | 1,629,000 | ||||||||
| Lloyds Banking Group PLC, 6.657% to 5/21/37, 144A (United Kingdom)g,h,j |
1,500,000 | 2,106,083 | ||||||||
| Lloyds Banking Group PLC, 7.50% to 6/27/24 (United Kingdom)a,g,h,l |
1,666,000 | 1,899,573 | ||||||||
| Lloyds Banking Group PLC, 7.50% to 9/27/25 (United Kingdom)g,h,l |
1,600,000 | 1,876,000 | ||||||||
| Macquarie Bank Ltd./London, 6.125% to 3/8/27, 144A (Australia)g,h,j,l |
1,350,000 | 1,477,690 | ||||||||
| Nationwide Building Society, 5.75% to 6/20/27 (United Kingdom)g,h,k,l |
1,000,000 | 1,552,754 | ||||||||
| Natwest Group PLC, 4.60% to 6/28/31 (United Kingdom)g,h,l |
2,600,000 | 2,618,720 | ||||||||
| Natwest Group PLC, 6.00% to 12/29/25 (United Kingdom)g,h,l |
1,400,000 | 1,563,912 | ||||||||
| Natwest Group PLC, 8.00% to 8/10/25 (United Kingdom)g,h,l |
3,300,000 | 3,913,239 | ||||||||
| Nordea Bank Abp, 6.625% to 3/26/26, 144A (Finland)g,h,j,l |
2,000,000 | 2,295,430 | ||||||||
| Piraeus Financial Holdings SA, 8.75% to 6/16/26 (Greece)g,h,k,l |
1,000,000 | 1,168,047 | ||||||||
| Royal Bank of Canada, 3.65% to 10/24/26, due 11/24/81 (Canada)h |
2,000,000 | 1,615,231 | ||||||||
| Royal Bank of Canada, 4.50% to 10/24/25, due 11/24/80, Series 1 (Canada)h |
2,800,000 | 2,404,869 | ||||||||
| Societe Generale SA, 4.75% to 5/26/26, 144A (France)g,h,j,l |
1,800,000 | 1,869,750 | ||||||||
See accompanying notes to financial statements.
16
COHEN & STEERS REIT AND PREFERRED AND INCOME FUND, INC.
SCHEDULE OF INVESTMENTS—(Continued)
June 30, 2021 (Unaudited)
| Principal Amount |
Value | |||||||||||
| Societe Generale SA, 5.375% to 11/18/30, 144A (France)g,h,j,l |
|
$ | 1,000,000 | $ | 1,061,250 | |||||||
| Societe Generale SA, 6.75% to 4/6/28, 144A (France)g,h,j,l |
|
5,000,000 | 5,671,900 | |||||||||
| Societe Generale SA, 7.375% to 9/13/21, 144A (France)a,g,h,j,l |
|
600,000 | 606,858 | |||||||||
| Societe Generale SA, 7.875% to 12/18/23, 144A (France)g,h,j,l |
|
1,400,000 | 1,568,448 | |||||||||
| Societe Generale SA, 8.00% to 9/29/25, 144A (France)g,h,j,l |
|
2,600,000 | 3,063,125 | |||||||||
| Standard Chartered PLC, 4.75% to 1/14/31, 144A (United Kingdom)g,h,j,l |
|
1,000,000 | 1,029,595 | |||||||||
| Standard Chartered PLC, 7.014% to 7/30/37, 144A (United Kingdom)g,h,j |
|
2,800,000 | 3,843,000 | |||||||||
| Standard Chartered PLC, 7.50% to 4/2/22, 144A (United Kingdom)g,h,j,l |
|
2,400,000 | 2,506,152 | |||||||||
| Standard Chartered PLC, 7.75% to 4/2/23, 144A (United Kingdom)g,h,j,l |
|
2,300,000 | 2,513,187 | |||||||||
| Stichting AK Rabobank Certificaten, 2.188% (Netherlands)g,k |
|
2,119,425 | 3,389,530 | |||||||||
| Svenska Handelsbanken AB, 4.375% to 3/1/27 (Sweden)g,h,k,l |
|
600,000 | 636,705 | |||||||||
| Svenska Handelsbanken AB, 4.75% to 3/1/31 (Sweden)g,h,k,l |
|
3,200,000 | 3,390,160 | |||||||||
| UBS Group AG, 6.875% to 8/7/25 (Switzerland)g,h,k,l |
|
2,000,000 | 2,281,990 | |||||||||
| UBS Group AG, 7.00% to 1/31/24, 144A (Switzerland)g,h,j,l |
|
3,400,000 | 3,746,613 | |||||||||
| UBS Group AG, 7.00% to 2/19/25 (Switzerland)g,h,k,l |
|
1,600,000 | 1,849,600 | |||||||||
| UniCredit SpA, 4.50% to 12/3/27 (Italy)g,h,k,l |
|
1,800,000 | 2,133,859 | |||||||||
| UniCredit SpA, 7.50% to 6/3/26 (Italy)g,h,k,l |
|
600,000 | 845,426 | |||||||||
| UniCredit SpA, 8.00% to 6/3/24 (Italy)g,h,k,l |
|
2,600,000 | 2,900,381 | |||||||||
|
|
|
|||||||||||
| 190,443,033 | ||||||||||||
|
|
|
|||||||||||
| ELECTRIC |
1.4% | |||||||||||
| CenterPoint Energy, Inc., 6.125% to 9/1/23, Series Aa,g,h |
|
1,020,000 | 1,084,388 | |||||||||
| CMS Energy Corp., 4.75% to 3/1/30, due 6/1/50a,h |
|
2,300,000 | 2,568,812 | |||||||||
| Duke Energy Corp., 4.875% to 9/16/24a,g,h |
|
2,300,000 | 2,449,500 | |||||||||
| Sempra Energy, 4.875% to 10/15/25g,h |
|
5,430,000 | 5,905,125 | |||||||||
See accompanying notes to financial statements.
17
COHEN & STEERS REIT AND PREFERRED AND INCOME FUND, INC.
SCHEDULE OF INVESTMENTS—(Continued)
June 30, 2021 (Unaudited)
| Principal Amount |
Value | |||||||||||
| Southern California Edison Co., 6.25% to 2/1/22, Series Eg,h |
|
$ | 1,400,000 | $ | 1,425,284 | |||||||
| Southern Co./The, 3.75% to 6/15/26, due 9/15/51, Series 21-Ah |
|
3,774,000 | 3,802,871 | |||||||||
|
|
|
|||||||||||
| 17,235,980 | ||||||||||||
|
|
|
|||||||||||
| ELECTRIC—FOREIGN |
0.9% | |||||||||||
| Electricite de France SA, 2.625% to 12/1/27 (France)g,h,k |
|
2,000,000 | 2,388,101 | |||||||||
| Emera, Inc., 6.75% to 6/15/26, due 6/15/76, Series 16-A (Canada)a,h |
|
8,300,000 | 9,735,859 | |||||||||
|
|
|
|||||||||||
| 12,123,960 | ||||||||||||
|
|
|
|||||||||||
| FINANCIAL |
2.3% | |||||||||||
| Apollo Management Holdings LP, 4.95% to 12/17/24, due 1/14/50, 144Aa,h,j |
|
1,424,000 | 1,480,960 | |||||||||
| Ares Finance Co. III LLC, 4.125% to 6/30/26, due 6/30/51, 144Ah,j |
|
1,480,000 | 1,483,700 | |||||||||
| Charles Schwab Corp./The, 4.00% to 12/1/30, Series Hg,h |
|
4,370,000 | 4,475,973 | |||||||||
| Charles Schwab Corp./The, 4.00% to 6/1/26, Series Ig,h |
|
12,355,000 | 12,910,975 | |||||||||
| Charles Schwab Corp./The, 5.375% to 6/1/25, Series Gg,h |
|
5,383,000 | 5,963,287 | |||||||||
| Discover Financial Services, 6.125% to 6/23/25, Series Dg,h |
|
790,000 | 889,501 | |||||||||
| ILFC E-Capital Trust I, 3.66% to 8/12/21, due 12/21/65, 144Aj |
|
3,009,000 | 2,498,162 | |||||||||
|
|
|
|||||||||||
| 29,702,558 | ||||||||||||
|
|
|
|||||||||||
| FOOD |
1.3% | |||||||||||
| Dairy Farmers of America, Inc., 7.875%, 144Ae,g,j |
|
52,100 | † | 5,236,050 | ||||||||
| Dairy Farmers of America, Inc., 7.875%, Series B, 144Ag,j |
|
82,000 | † | 8,405,000 | ||||||||
| Land O’ Lakes, Inc., 7.00%, 144Ag,j |
|
1,650,000 | 1,709,812 | |||||||||
| Land O’ Lakes, Inc., 7.25%, 144Ag,j |
|
945,000 | 1,005,206 | |||||||||
|
|
|
|||||||||||
| 16,356,068 | ||||||||||||
|
|
|
|||||||||||
See accompanying notes to financial statements.
18
COHEN & STEERS REIT AND PREFERRED AND INCOME FUND, INC.
SCHEDULE OF INVESTMENTS—(Continued)
June 30, 2021 (Unaudited)
| Principal Amount |
Value | |||||||||||
| INDUSTRIALS—DIVERSIFIED MANUFACTURING |
0.2% | |||||||||||
| General Electric Co., 5.00% (3 Month US LIBOR + 3.33%), Series D (FRN)a,b,g,i |
|
$ | 2,123,000 | $ | 2,083,194 | |||||||
|
|
|
|||||||||||
| INSURANCE |
6.7% | |||||||||||
| LIFE/HEALTH INSURANCE |
2.4% | |||||||||||
| Equitable Holdings, Inc., 4.95% to 9/15/25, Series Bg,h |
|
3,480,000 | 3,793,200 | |||||||||
| MetLife Capital Trust IV, 7.875%, due 12/15/37, 144A (TruPS)a,j |
|
2,381,000 | 3,321,495 | |||||||||
| MetLife, Inc., 5.875% to 3/15/28, Series Dg,h |
|
1,071,000 | 1,239,993 | |||||||||
| MetLife, Inc., 9.25%, due 4/8/38, 144Aa,b,j |
|
7,665,000 | 11,634,161 | |||||||||
| MetLife, Inc., 10.75%, due 8/1/39a |
|
3,592,000 | 6,221,413 | |||||||||
| SBL Holdings, Inc., 6.50% to 11/13/26, 144Ag,h,j |
|
3,120,000 | 3,108,300 | |||||||||
| SBL Holdings, Inc., 7.00% to 5/13/25, 144Ag,h,j |
|
2,100,000 | 2,123,625 | |||||||||
|
|
|
|||||||||||
| 31,442,187 | ||||||||||||
|
|
|
|||||||||||
| LIFE/HEALTH INSURANCE—FOREIGN |
0.3% | |||||||||||
| Legal & General Group PLC, 5.625% to 3/24/31 (United Kingdom)g,h,k,l |
|
1,500,000 | 2,330,438 | |||||||||
| Rothesay Life PLC, 6.875% to 9/12/28 (United Kingdom)g,h,k,l |
|
1,200,000 | 1,913,313 | |||||||||
|
|
|
|||||||||||
| 4,243,751 | ||||||||||||
|
|
|
|||||||||||
| MULTI-LINE |
0.8% | |||||||||||
| American International Group, Inc., 5.75% to 4/1/28, due 4/1/48, Series A-9a,h |
|
1,719,000 | 1,971,868 | |||||||||
| American International Group, Inc., 8.175% to 5/15/38, due 5/15/58a,h |
|
3,930,000 | 5,697,333 | |||||||||
| Hartford Financial Services Group, Inc./The, 2.281% (3 Month US LIBOR + 2.125%), due 2/12/47, 144A, Series ICON (FRN)i,j |
|
2,200,000 | 2,127,399 | |||||||||
|
|
|
|||||||||||
| 9,796,600 | ||||||||||||
|
|
|
|||||||||||
| MULTI-LINE—FOREIGN |
0.6% | |||||||||||
| AXA SA, 6.379% to 12/14/36, 144A (France)a,g,h,j |
|
2,399,000 | 3,337,885 | |||||||||
| CNP Assurances, 4.875% to 4/7/31 (France)g,h,k |
|
1,800,000 | 1,892,811 | |||||||||
| UnipolSai Assicurazioni SpA, 6.375% to 4/27/30 (Italy)g,h,k,l |
|
1,500,000 | 2,051,333 | |||||||||
|
|
|
|||||||||||
| 7,282,029 | ||||||||||||
|
|
|
|||||||||||
See accompanying notes to financial statements.
19
COHEN & STEERS REIT AND PREFERRED AND INCOME FUND, INC.
SCHEDULE OF INVESTMENTS—(Continued)
June 30, 2021 (Unaudited)
| Principal Amount |
Value | |||||||||||
| PROPERTY CASUALTY |
0.9% | |||||||||||
| Assurant, Inc., 7.00% to 3/27/28, due 3/27/48a,h |
|
$ | 2,900,000 | $ | 3,356,373 | |||||||
| Enstar Finance LLC, 5.75% to 9/1/25, due 9/1/40h |
|
2,484,000 | 2,639,250 | |||||||||
| Markel Corp., 6.00% to 6/1/25g,h |
|
2,200,000 | 2,461,250 | |||||||||
| PartnerRe Finance B LLC, 4.50% to 4/1/30, due 10/1/50h |
|
2,660,000 | 2,786,350 | |||||||||
|
|
|
|||||||||||
| 11,243,223 | ||||||||||||
|
|
|
|||||||||||
| PROPERTY CASUALTY—FOREIGN |
1.2% | |||||||||||
| Athora Netherlands NV, 6.25% to 11/16/22 (Netherlands)g,h,k |
|
3,200,000 | 3,387,648 | |||||||||
| Athora Netherlands NV, 7.00% to 6/19/25 (Netherlands)g,h,k,l |
|
1,600,000 | 2,182,994 | |||||||||
| Lancashire Holdings Ltd., 5.625% to 3/18/31, due 9/18/41 (United Kingdom)h,k |
|
2,400,000 | 2,581,500 | |||||||||
| QBE Insurance Group Ltd., 5.875% to 5/12/25, 144A (Australia)g,h,j |
|
2,000,000 | 2,188,000 | |||||||||
| QBE Insurance Group Ltd., 5.875% to 6/17/26, due 6/17/46, Series EMTN (Australia)h,k |
|
2,600,000 | 2,890,944 | |||||||||
| QBE Insurance Group Ltd., 6.75% to 12/2/24, due 12/2/44 (Australia)h,k |
|
2,403,000 | 2,740,802 | |||||||||
|
|
|
|||||||||||
| 15,971,888 | ||||||||||||
|
|
|
|||||||||||
| REINSURANCE |
0.5% | |||||||||||
| AXIS Specialty Finance LLC, 4.90% to 1/15/30, due 1/15/40a,h |
|
2,350,000 | 2,494,878 | |||||||||
| Global Atlantic Finance Co., 4.70% to 7/15/26, due 10/15/51, 144Ah,j |
|
3,410,000 | 3,418,320 | |||||||||
|
|
|
|||||||||||
| 5,913,198 | ||||||||||||
|
|
|
|||||||||||
| TOTAL INSURANCE |
|
85,892,876 | ||||||||||
|
|
|
|||||||||||
| INTEGRATED TELECOMMUNICATIONS SERVICES—FOREIGN |
0.4% | |||||||||||
| Vodafone Group PLC, 4.125% to 3/4/31, due 6/4/81 (United Kingdom)h |
|
3,180,000 | 3,179,205 | |||||||||
| Vodafone Group PLC, 7.00% to 1/4/29, due 4/4/79 (United Kingdom)a,h |
|
2,030,000 | 2,461,350 | |||||||||
|
|
|
|||||||||||
| 5,640,555 | ||||||||||||
|
|
|
|||||||||||
See accompanying notes to financial statements.
20
COHEN & STEERS REIT AND PREFERRED AND INCOME FUND, INC.
SCHEDULE OF INVESTMENTS—(Continued)
June 30, 2021 (Unaudited)
| Principal Amount |
Value | |||||||||||
| OIL & GAS—FOREIGN |
0.9% | |||||||||||
| BP Capital Markets PLC, 4.875% to 3/22/30 (United Kingdom)a,g,h |
|
$ | 10,350,000 | $ | 11,390,175 | |||||||
|
|
|
|||||||||||
| PIPELINES |
0.3% | |||||||||||
| Energy Transfer LP, 6.50% to 11/15/26, Series Hg,h |
|
2,520,000 | 2,575,440 | |||||||||
| Energy Transfer LP, 7.125% to 5/15/30, Series Gg,h |
|
1,400,000 | 1,449,000 | |||||||||
|
|
|
|||||||||||
| 4,024,440 | ||||||||||||
|
|
|
|||||||||||
| PIPELINES—FOREIGN |
2.8% | |||||||||||
| Enbridge, Inc., 5.75% to 4/15/30, due 7/15/80, Series 20-A (Canada)h |
|
4,620,000 | 5,162,850 | |||||||||
| Enbridge, Inc., 6.00% to 1/15/27, due 1/15/77, Series 16-A (Canada)a,h |
|
4,012,000 | 4,453,320 | |||||||||
| Enbridge, Inc., 6.25% to 3/1/28, due 3/1/78 (Canada)a,h |
|
5,330,000 | 5,825,620 | |||||||||
| Transcanada Trust, 5.50% to 9/15/29, due 9/15/79 (Canada)a,h |
|
9,014,000 | 9,859,063 | |||||||||
| Transcanada Trust, 5.625% to 5/20/25, due 5/20/75 (Canada)h |
|
2,733,000 | 2,965,305 | |||||||||
| Transcanada Trust, 5.875% to 8/15/26, due 8/15/76, Series 16-A (Canada)a,h |
|
7,002,000 | 7,824,735 | |||||||||
|
|
|
|||||||||||
| 36,090,893 | ||||||||||||
|
|
|
|||||||||||
| REAL ESTATE—RETAIL—FOREIGN |
0.7% | |||||||||||
| Scentre Group Trust 2, 4.75% to 6/24/26, due 9/24/80, 144A (Australia)h,j |
|
4,000,000 | 4,275,000 | |||||||||
| Scentre Group Trust 2, 5.125% to 6/24/30, due 9/24/80, 144A (Australia)h,j |
|
4,000,000 | 4,270,000 | |||||||||
|
|
|
|||||||||||
| 8,545,000 | ||||||||||||
|
|
|
|||||||||||
| UTILITIES |
0.7% | |||||||||||
| ELECTRIC UTILITIES |
0.6% | |||||||||||
| Edison International, 5.375% to 3/15/26, Series Ag,h |
|
3,860,000 | 3,897,828 | |||||||||
| NextEra Energy Capital Holdings, Inc., 5.65% to 5/1/29, due 5/1/79a,h |
|
3,150,000 | 3,668,263 | |||||||||
|
|
|
|||||||||||
| 7,566,091 | ||||||||||||
|
|
|
|||||||||||
See accompanying notes to financial statements.
21
COHEN & STEERS REIT AND PREFERRED AND INCOME FUND, INC.
SCHEDULE OF INVESTMENTS—(Continued)
June 30, 2021 (Unaudited)
| Principal Amount |
Value | |||||||||||
| GAS UTILITIES |
0.1% | |||||||||||
| South Jersey Industries, Inc., 5.02%, due 4/15/31 |
|
$ | 1,040,000 | $ | 1,102,499 | |||||||
|
|
|
|||||||||||
| TOTAL UTILITIES |
|
8,668,590 | ||||||||||
|
|
|
|||||||||||
| TOTAL PREFERRED
SECURITIES—CAPITAL SECURITIES |
|
605,060,383 | ||||||||||
|
|
|
|||||||||||
| Shares | ||||||||||||
| SHORT-TERM INVESTMENTS |
0.5% | |||||||||||
| MONEY MARKET FUNDS |
||||||||||||
| State Street Institutional Treasury Money Market Fund, Premier Class, 0.01%m |
|
6,716,242 | 6,716,242 | |||||||||
|
|
|
|||||||||||
| TOTAL SHORT-TERM
INVESTMENTS |
6,716,242 | |||||||||||
|
|
|
|||||||||||
| PURCHASED OPTION CONTRACTS |
0.0% | 128,476 | ||||||||||
|
|
|
|||||||||||
| TOTAL INVESTMENTS IN
SECURITIES |
131.8% | 1,683,204,185 | ||||||||||
| WRITTEN OPTION CONTRACTS |
(0.0) | (304,132 | ) | |||||||||
| LIABILITIES IN EXCESS OF OTHER ASSETS |
(31.8) | (406,074,801 | ) | |||||||||
|
|
|
|
|
|||||||||
| NET ASSETS (Equivalent to $26.83 per share based on 47,590,154 shares of common stock outstanding) |
100.0% | $ | 1,276,825,252 | |||||||||
|
|
|
|
|
|||||||||
Exchange-Traded Option Contracts
Written Options
Equity Options
| Description | Exercise Price |
Expiration Date |
Number of Contracts |
Notional Amountn |
Premiums Received |
Value | ||||||||||||||||||
| Call—Host Hotels & Resorts, Inc. |
$ | 19.00 | 10/15/21 | 1,316 | $ | (2,249,044 | ) | $ | (96,814 | ) | $ | (56,588 | ) | |||||||||||
| Call—Ventas, Inc. |
57.50 | 8/20/21 | 461 | (2,632,310 | ) | (72,978 | ) | (92,200 | ) | |||||||||||||||
| Put—Regency Centers Corp. |
60.00 | 8/20/21 | 245 | (1,569,715 | ) | (30,028 | ) | (25,725 | ) | |||||||||||||||
| Put—Welltower, Inc. |
75.00 | 9/17/21 | 270 | (2,243,700 | ) | (33,093 | ) | (33,750 | ) | |||||||||||||||
| Put—Weyerhaeuser Co |
32.00 | 8/20/21 | 769 | (2,646,898 | ) | (45,037 | ) | (49,985 | ) | |||||||||||||||
|
|
||||||||||||||||||||||||
| 3,061 | $ | (11,341,667 | ) | $ | (277,950 | ) | $ | (258,248 | ) | |||||||||||||||
|
|
||||||||||||||||||||||||
See accompanying notes to financial statements.
22
COHEN & STEERS REIT AND PREFERRED AND INCOME FUND, INC.
SCHEDULE OF INVESTMENTS—(Continued)
June 30, 2021 (Unaudited)
Over-The-Counter Option Contracts
Purchased Options
Interest Rate Swaptions
| Description | Counterparty | Exercise Rate |
Expiration Date |
Notional Amounto |
Premiums Paid |
Value | ||||||||||||||||
| Option to receive 3-month LIBOR Quarterly, Pay 1.75% Semiannually, maturing 9/21/31 |
Goldman Sachs International | 1.75 | % | 9/17/21 | $22,339,000 | $444,477 | $87,993 | |||||||||||||||
|
|
||||||||||||||||||||||
Equity Options
| Description | Counterparty | Exercise Price |
Expiration Date |
Number of Contracts |
Notional Amountn |
Premiums Paid |
Value | |||||||||||||||||||
| Put—iShares iBoxx Investment Grade Corporate Bond ETF |
Goldman Sachs International | $128.00 | 9/17/21 | 750 | $10,077,000 | $311,250 | $40,483 | |||||||||||||||||||
|
|
||||||||||||||||||||||||||
Over-The-Counter Option Contracts
Written Options
Interest Rate Swaptions
| Description | Counterparty | Exercise Rate |
Expiration Date |
Notional Amounto |
Premiums Received |
Value | ||||||||||||||||
| Option to pay 3-month LIBOR Quarterly, Receive 2.00% Semiannually, maturing 9/21/31 |
Goldman Sachs International | 2.00 | % | 9/17/21 | $(22,339,000 | ) | $(259,086 | ) | $(31,453 | ) | ||||||||||||
|
|
||||||||||||||||||||||
Equity Options
| Description | Counterparty | Exercise Price |
Expiration Date |
Number of Contracts |
Notional Amountn |
Premiums Received |
Value | |||||||||||||||||||
| Put—iShares iBoxx Investment Grade Corporate Bond ETF |
Goldman Sachs International | $121.00 | 9/17/21 | (750 | ) | $(10,077,000 | ) | $(129,683 | ) | $(14,431 | ) | |||||||||||||||
|
|
||||||||||||||||||||||||||
See accompanying notes to financial statements.
23
COHEN & STEERS REIT AND PREFERRED AND INCOME FUND, INC.
SCHEDULE OF INVESTMENTS—(Continued)
June 30, 2021 (Unaudited)
Centrally Cleared Interest Rate Swap Contracts
| Notional Amount |
Fixed Rate Payable |
Fixed Payment Frequency |
Floating Rate Receivable (resets monthly) |
Floating Payment Frequency |
Maturity Date | Value | Upfront Receipts (Payments) |
Unrealized Appreciation (Depreciation) |
||||||||||||||||||||||
| $105,000,000 | 0.670%p | Monthly | 1 Month LIBORp | Monthly | 9/15/25 | $ | 555,804 | $ | — | $ | 555,804 | |||||||||||||||||||
| 87,500,000 | 1.240% | Monthly | 0.088%q | Monthly | 2/3/26 | (1,828,614 | ) | (32,962 | ) | (1,861,576 | ) | |||||||||||||||||||
| 65,000,000 | 0.762% | Monthly | 0.072%q | Monthly | 9/15/26 | 414,375 | — | 414,375 | ||||||||||||||||||||||
| 105,000,000 | 1.237%p | Monthly | 1 Month LIBORp | Monthly | 9/15/27 | 254,858 | — | 254,858 | ||||||||||||||||||||||
|
|
|
|||||||||||||||||||||||||||||
| $ | (603,577 | ) | $ | (32,962 | ) | $ | (636,539 | ) | ||||||||||||||||||||||
|
|
|
|||||||||||||||||||||||||||||
Forward Foreign Currency Exchange Contracts
| Counterparty | Contracts to Deliver |
In Exchange For |
Settlement Date |
Unrealized Appreciation (Depreciation) |
||||||||||||||||
| Brown Brothers Harriman |
EUR | 1,818,965 | USD | 2,164,292 | 7/2/21 | $ | 7,454 | |||||||||||||
| Brown Brothers Harriman |
EUR | 765,899 | USD | 936,242 | 7/2/21 | 28,077 | ||||||||||||||
| Brown Brothers Harriman |
EUR | 1,210,305 | USD | 1,465,086 | 7/2/21 | 29,967 | ||||||||||||||
| Brown Brothers Harriman |
EUR | 18,886,471 | USD | 23,055,471 | 7/2/21 | 660,835 | ||||||||||||||
| Brown Brothers Harriman |
GBP | 6,934,247 | USD | 9,845,868 | 7/2/21 | 253,724 | ||||||||||||||
| Brown Brothers Harriman |
USD | 26,873,888 | EUR | 22,681,640 | 7/2/21 | 20,870 | ||||||||||||||
| Brown Brothers Harriman |
USD | 560,140 | GBP | 395,323 | 7/2/21 | (13,289 | ) | |||||||||||||
| Brown Brothers Harriman |
USD | 9,025,611 | GBP | 6,538,924 | 7/2/21 | 19,682 | ||||||||||||||
| Brown Brothers Harriman |
CAD | 2,013,591 | USD | 1,661,461 | 7/6/21 | 37,081 | ||||||||||||||
| Brown Brothers Harriman |
CAD | 4,457,925 | USD | 3,688,870 | 7/6/21 | 92,625 | ||||||||||||||
| Brown Brothers Harriman |
USD | 5,216,735 | CAD | 6,471,516 | 7/6/21 | 3,890 | ||||||||||||||
| Brown Brothers Harriman |
EUR | 22,744,523 | USD | 26,963,973 | 8/3/21 | (23,162 | ) | |||||||||||||
| Brown Brothers Harriman |
GBP | 6,302,963 | USD | 8,699,885 | 8/3/21 | (19,835 | ) | |||||||||||||
| Brown Brothers Harriman |
CAD | 6,481,025 | USD | 5,223,937 | 8/4/21 | (4,296 | ) | |||||||||||||
|
|
||||||||||||||||||||
| $ | 1,093,623 | |||||||||||||||||||
|
|
||||||||||||||||||||
See accompanying notes to financial statements.
24
COHEN & STEERS REIT AND PREFERRED AND INCOME FUND, INC.
SCHEDULE OF INVESTMENTS—(Continued)
June 30, 2021 (Unaudited)
Glossary of Portfolio Abbreviations
| CAD |
Canadian Dollar | |
| EMTN |
Euro Medium Term Note | |
| EUR |
Euro Currency | |
| FRN |
Floating Rate Note | |
| GBP |
Great British Pound | |
| LIBOR |
London Interbank Offered Rate | |
| REIT |
Real Estate Investment Trust | |
| TruPS |
Trust Preferred Securities | |
| USD |
United States Dollar |
Note: Percentages indicated are based on the net assets of the Fund.
| † | Represents shares. |
| a | All or a portion of the security is pledged as collateral in connection with the Fund’s revolving credit agreement. $849,900,839 in aggregate has been pledged as collateral. |
| b | A portion of the security has been rehypothecated in connection with the Fund’s revolving credit agreement. $383,474,669 in aggregate has been rehypothecated. |
| c | All or a portion of the security is pledged in connection with written option contracts. $31,496,914 in aggregate has been pledged as collateral. |
| d | Non-income producing security. |
| e | Security value is determined based on significant unobservable inputs (Level 3). |
| f | Restricted security. Aggregate holdings equal 0.4% of the net assets of the Fund. This security was acquired on August 3, 2020, at a cost of $3,755,469 ($62.50 per share). Security value is determined based on significant unobservable inputs Level 3). |
| g | Perpetual security. Perpetual securities have no stated maturity date, but they may be called/redeemed by the issuer. |
| h | Security converts to floating rate after the indicated fixed-rate coupon period. |
| i | Variable rate. Rate shown is in effect at June 30, 2021. |
| j | Securities exempt from registration under Rule 144A of the Securities Act of 1933. These securities may only be resold to qualified institutional buyers. Aggregate holdings amounted to $164,426,925 which represents 12.9% of the net assets of the Fund, of which 0.0% are illiquid. |
| k | Securities exempt from registration under Regulation S of the Securities Act of 1933. These securities are subject to resale restrictions. Aggregate holdings amounted to $74,449,189 which represents 5.8% of the net assets of the Fund, of which 0.0% are illiquid. |
See accompanying notes to financial statements.
25
COHEN & STEERS REIT AND PREFERRED AND INCOME FUND, INC.
SCHEDULE OF INVESTMENTS—(Continued)
June 30, 2021 (Unaudited)
| l | Contingent Capital security (CoCo). CoCos are debt or preferred securities with loss absorption characteristics built into the terms of the security for the benefit of the issuer. Aggregate holdings amounted to $163,685,616, which represents 12.8% of the net assets of the Fund (9.6% of the managed assets of the Fund). |
| m | Rate quoted represents the annualized seven-day yield. |
| n | Amount represents number of contracts multiplied by notional contract size multiplied by the underlying price. |
| o | Amount represents number of contracts multiplied by notional contract size. |
| p | The Fund entered into two forward-starting interest rate swap contracts with interest receipts and payments commencing on December 24, 2021 and December 24, 2022, respectively (effective dates). |
| q | Based on 1 month LIBOR. Represents rates in effect at June 30, 2021. |
See accompanying notes to financial statements.
26
COHEN & STEERS REIT AND PREFERRED AND INCOME FUND, INC.
STATEMENT OF ASSETS AND LIABILITIES
June 30, 2021 (Unaudited)
| ASSETS: |
| |||
| Investments in securities, at valuea (Identified cost—$1,300,682,634) |
$ | 1,683,204,185 | ||
| Cash |
69,226 | |||
| Cash collateral pledged for interest rate swap contracts |
8,703,399 | |||
| Foreign currency, at value (Identified cost—$195,511) |
192,571 | |||
| Receivable for: |
||||
| Investment securities sold |
11,828,071 | |||
| Dividends and interest |
9,145,830 | |||
| Unrealized appreciation on forward foreign currency exchange contracts |
1,154,205 | |||
| Other assets |
23,402 | |||
|
|
|
|||
| Total Assets |
1,714,320,889 | |||
|
|
|
|||
| LIABILITIES: |
| |||
| Written option contracts, at value (Premiums received—$666,719) |
304,132 | |||
| Unrealized depreciation on forward foreign currency exchange contracts |
60,582 | |||
| Payable for: |
||||
| Credit agreementb |
425,000,000 | |||
| Investment securities purchased |
9,575,084 | |||
| Investment management fees |
911,752 | |||
| Interest expense |
758,637 | |||
| Variation margin on interest rate swap contracts |
328,669 | |||
| Cash collateral received for over-the-counter option contracts |
300,000 | |||
| Administration fees |
84,162 | |||
| Other liabilities |
172,619 | |||
|
|
|
|||
| Total Liabilities |
437,495,637 | |||
|
|
|
|||
| NET ASSETS |
$ | 1,276,825,252 | ||
|
|
|
|||
| NET ASSETS consist of: |
| |||
| Paid-in capital |
$ | 808,735,609 | ||
| Total distributable earnings/(accumulated loss) |
468,089,643 | |||
|
|
|
|||
| $ | 1,276,825,252 | |||
|
|
|
|||
| NET ASSET VALUE PER SHARE: |
| |||
| ($1,276,825,252 ÷ 47,590,154 shares outstanding) |
$ | 26.83 | ||
|
|
|
|||
| MARKET PRICE PER SHARE |
$ | 27.22 | ||
|
|
|
|||
| MARKET PRICE PREMIUM (DISCOUNT) TO NET ASSET VALUE PER SHARE |
1.45 | % | ||
|
|
|
|||
| a | Includes $849,900,839 pledged, of which $383,474,669 has been rehypothecated, in connection with the Fund’s credit agreement, as described in Note 7. |
| b | Amount includes $105,000,000 maturing after June 30, 2022. |
See accompanying notes to financial statements.
27
COHEN & STEERS REIT AND PREFERRED AND INCOME FUND, INC.
STATEMENT OF OPERATIONS
For the Six Months Ended June 30, 2021 (Unaudited)
| Investment Income: |
| |||
| Dividend income |
$ | 13,776,049 | ||
| Interest income |
13,115,390 | |||
| Rehypothecation income |
149,318 | |||
|
|
|
|||
| Total Investment Income |
27,040,757 | |||
|
|
|
|||
| Expenses: |
| |||
| Investment management fees |
5,186,614 | |||
| Interest expense |
4,591,390 | |||
| Administration fees |
547,746 | |||
| Shareholder reporting expenses |
187,994 | |||
| Professional fees |
48,541 | |||
| Custodian fees and expenses |
40,607 | |||
| Directors’ fees and expenses |
22,073 | |||
| Transfer agent fees and expenses |
11,296 | |||
| Miscellaneous |
52,368 | |||
|
|
|
|||
| Total Expenses |
10,688,629 | |||
|
|
|
|||
| Net Investment Income (Loss) |
16,352,128 | |||
|
|
|
|||
| Net Realized and Unrealized Gain (Loss): |
| |||
| Net realized gain (loss) on: |
| |||
| Investments in securities |
49,043,472 | |||
| Written option contracts |
1,016,916 | |||
| Interest rate swap contracts |
(560,839 | ) | ||
| Forward foreign currency exchange contracts |
(1,243,811 | ) | ||
| Foreign currency transactions |
8,188 | |||
|
|
|
|||
| Net realized gain (loss) |
48,263,926 | |||
|
|
|
|||
| Net change in unrealized appreciation (depreciation) on: |
| |||
| Investments in securities |
118,401,151 | |||
| Written option contracts |
58,156 | |||
| Interest rate swap contracts |
3,330,039 | |||
| Forward foreign currency exchange contracts |
1,939,815 | |||
| Foreign currency translations |
(19,294 | ) | ||
|
|
|
|||
| Net change in unrealized appreciation (depreciation) |
123,709,867 | |||
|
|
|
|||
| Net Realized and Unrealized Gain (Loss) |
171,973,793 | |||
|
|
|
|||
| Net Increase (Decrease) in Net Assets Resulting from Operations |
$ | 188,325,921 | ||
|
|
|
|||
See accompanying notes to financial statements.
28
COHEN & STEERS REIT AND PREFERRED AND INCOME FUND, INC.
STATEMENT OF CHANGES IN NET ASSETS (Unaudited)
| For the Six Months Ended June 30, 2021 |
For the Year Ended December 31, 2020 |
|||||||
| Change in Net Assets: |
| |||||||
| From Operations: |
| |||||||
| Net investment income (loss) |
$ | 16,352,128 | $ | 37,566,765 | ||||
| Net realized gain (loss) |
48,263,926 | 38,816,211 | ||||||
| Net change in unrealized appreciation (depreciation) |
123,709,867 | (58,413,218 | ) | |||||
|
|
|
|
|
|||||
| Net increase (decrease) in net assets resulting from operations |
188,325,921 | 17,969,758 | ||||||
|
|
|
|
|
|||||
| Distributions to Shareholders |
(35,401,152 | ) | (70,802,304 | ) | ||||
|
|
|
|
|
|||||
| Capital Stock Transactions: |
| |||||||
| Increase (decrease) in net assets from Fund share transactions |
213,606 | — | ||||||
|
|
|
|
|
|||||
| Total increase (decrease) in net assets |
153,138,375 | (52,832,546 | ) | |||||
| Net Assets: |
| |||||||
| Beginning of period |
1,123,686,877 | 1,176,519,423 | ||||||
|
|
|
|
|
|||||
| End of period |
$ | 1,276,825,252 | $ | 1,123,686,877 | ||||
|
|
|
|
|
|||||
See accompanying notes to financial statements.
29
COHEN & STEERS REIT AND PREFERRED AND INCOME FUND, INC.
STATEMENT OF CASH FLOWS
For the Six Months Ended June 30, 2021 (Unaudited)
| Increase (Decrease) in Cash: |
| |||
| Cash Flows from Operating Activities: |
| |||
| Net increase (decrease) in net assets resulting from operations |
$ | 188,325,921 | ||
| Adjustments to reconcile net increase (decrease) in net assets resulting from operations to net cash provided by operating activities: |
||||
| Purchases of long-term investments |
(394,908,373 | ) | ||
| Proceeds from sales and maturities of long-term investments |
386,115,012 | |||
| Net purchases, sales and maturities of short-term investments |
3,926,449 | |||
| Net amortization of premium on investments in securities |
913,055 | |||
| Net decrease in dividends and interest receivable and other assets |
511,820 | |||
| Net increase in payable for cash collateral received for over-the-counter option contracts |
300,000 | |||
| Net decrease in interest expense payable, accrued expenses and other liabilities |
(68,112 | ) | ||
| Net increase in payable for variation margin on interest rate swap contracts |
281,224 | |||
| Net increase in premiums received from written option contracts |
36,768 | |||
| Net change in unrealized appreciation on written option contracts |
(58,156 | ) | ||
| Net change in unrealized appreciation on investments in securities |
(118,401,151 | ) | ||
| Net change in unrealized appreciation on forward foreign currency exchange contracts |
(1,939,815 | ) | ||
| Net realized gain on investments in securities |
(49,043,472 | ) | ||
|
|
|
|||
| Cash provided by operating activities |
15,991,170 | |||
|
|
|
|||
| Cash Flows from Financing Activities: |
| |||
| Drawdown on revolving credit agreement |
25,000,000 | |||
| Dividends paid |
(35,413,495 | ) | ||
|
|
|
|||
| Cash used for financing activities |
(10,413,495 | ) | ||
|
|
|
|||
| Increase (decrease) in cash and restricted cash |
5,577,675 | |||
| Cash and restricted cash at beginning of period (including foreign currency) |
3,387,521 | |||
|
|
|
|||
| Cash and restricted cash at end of period (including foreign currency) |
$ | 8,965,196 | ||
|
|
|
|||
Supplemental Disclosure of Cash Flow Information and Non-Cash Activities:
For the six months ended June 30, 2021, interest paid was $4,733,876.
For the six months ended June 30, 2021, as part of exchange offers on three of the Fund’s investments, the Fund received shares of new securities valued at $7,540,837.
For the six months ended June 30, 2021, reinvestment of dividends was $213,606.
See accompanying notes to financial statements.
30
COHEN & STEERS REIT AND PREFERRED AND INCOME FUND, INC.
STATEMENT OF CASH FLOWS—(Continued)
For the Six Months Ended June 30, 2021 (Unaudited)
The following table provides a reconciliation of cash and restricted cash reported within the Statement of Assets and Liabilities that sums to the total of such amounts shown on the Statement of Cash Flows.
| Cash |
$ | 69,226 | ||
| Restricted cash |
8,703,399 | |||
| Foreign currency |
192,571 | |||
|
|
|
|||
| Total cash and restricted cash shown on the Statement of Cash Flows |
$ | 8,965,196 | ||
|
|
|
Restricted cash consists of cash that has been pledged to cover the Fund’s collateral or margin obligations under derivative contracts. It is reported on the Statement of Assets and Liabilities as cash collateral pledged for interest rate swap contracts.
See accompanying notes to financial statements.
31
COHEN & STEERS REIT AND PREFERRED AND INCOME FUND, INC.
FINANCIAL HIGHLIGHTS (Unaudited)
The following table includes selected data for a share outstanding throughout each period and other performance information derived from the financial statements. It should be read in conjunction with the financial statements and notes thereto.
| For the Six Months Ended June 30, 2021 |
For the Year Ended December 31, | |||||||||||||||||||||||
| Per Share Operating Data: |
2020 | 2019 | 2018 | 2017 | 2016 | |||||||||||||||||||
| Net asset value, beginning of period |
$23.62 | $24.73 | $19.98 | $22.80 | $21.75 | $21.63 | ||||||||||||||||||
|
|
|
|
|
|
|
|
|
|
|
|
|
|||||||||||||
| Income (loss) from investment operations: |
||||||||||||||||||||||||
| Net investment income (loss)a |
0.34 | 0.79 | 0.87 | 0.88 | 0.94 | 1.03 | ||||||||||||||||||
| Net realized and unrealized gain (loss) |
3.61 | (0.41 | ) | 5.37 | (2.21 | )b | 1.60 | 0.57 | ||||||||||||||||
|
|
|
|
|
|
|
|
|
|
|
|
|
|||||||||||||
| Total from investment operations |
3.95 | 0.38 | 6.24 | (1.33 | ) | 2.54 | 1.60 | |||||||||||||||||
|
|
|
|
|
|
|
|
|
|
|
|
|
|||||||||||||
| Less dividends and distributions to shareholders from: |
||||||||||||||||||||||||
| Net investment income |
(0.74 | ) | (0.51 | ) | (0.85 | ) | (0.92 | ) | (0.92 | ) | (0.97 | ) | ||||||||||||
| Net realized gain |
— | (0.98 | ) | (0.64 | ) | (0.57 | ) | (0.57 | ) | (0.51 | ) | |||||||||||||
|
|
|
|
|
|
|
|
|
|
|
|
|
|||||||||||||
| Total dividends and distributions to shareholders |
(0.74 | ) | (1.49 | ) | (1.49 | ) | (1.49 | ) | (1.49 | ) | (1.48 | ) | ||||||||||||
|
|
|
|
|
|
|
|
|
|
|
|
|
|||||||||||||
| Net increase (decrease) in net asset value |
3.21 | (1.11 | ) | 4.75 | (2.82 | ) | 1.05 | 0.12 | ||||||||||||||||
|
|
|
|
|
|
|
|
|
|
|
|
|
|||||||||||||
| Net asset value, end of period |
$26.83 | $23.62 | $24.73 | $19.98 | $22.80 | $21.75 | ||||||||||||||||||
|
|
|
|
|
|
|
|
|
|
|
|
|
|||||||||||||
| Market value, end of period |
$27.22 | $22.83 | $23.79 | $17.80 | $21.27 | $19.12 | ||||||||||||||||||
|
|
|
|
|
|
|
|
|
|
|
|
|
|||||||||||||
| Total net asset value returnc |
17.02 | %d | 2.87 | % | 32.35 | % | –5.20 | %b | 12.65 | % | 8.43 | % | ||||||||||||
|
|
|
|
|
|
|
|
|
|
|
|
|
|||||||||||||
| Total market value returnc |
22.83 | %d | 3.36 | % | 42.92 | % | –9.47 | % | 19.58 | % | 11.79 | % | ||||||||||||
|
|
|
|
|
|
|
|
|
|
|
|
|
|||||||||||||
See accompanying notes to financial statements.
32
COHEN & STEERS REIT AND PREFERRED AND INCOME FUND, INC.
FINANCIAL HIGHLIGHTS (Unaudited)—(Continued)
| For the Six Months Ended June 30, 2021 |
For the Year Ended December 31, | |||||||||||||||||||||||
| Ratios/Supplemental Data: |
2020 | 2019 | 2018 | 2017 | 2016 | |||||||||||||||||||
| Net assets, end of period (in millions) |
$1,276.8 | $1,123.7 | $1,176.5 | $950.3 | $1,084.7 | $1,034.6 | ||||||||||||||||||
|
|
|
|
|
|
|
|
|
|
|
|
|
|||||||||||||
| Ratios to average daily net assets: |
||||||||||||||||||||||||
| Expenses |
1.82 | %e | 2.07 | % | 1.96 | % | 1.93 | %b | 1.67 | % | 1.65 | % | ||||||||||||
|
|
|
|
|
|
|
|
|
|
|
|
|
|||||||||||||
| Expenses (excluding interest expense) |
1.04 | %e | 1.04 | % | 1.02 | % | 1.05 | % | 1.01 | % | 1.01 | % | ||||||||||||
|
|
|
|
|
|
|
|
|
|
|
|
|
|||||||||||||
| Net investment income (loss) |
2.78 | %e | 3.56 | % | 3.72 | % | 4.10 | % | 4.19 | % | 4.64 | % | ||||||||||||
|
|
|
|
|
|
|
|
|
|
|
|
|
|||||||||||||
| Ratio of expenses to average daily managed assetsf |
1.34 | %e | 1.55 | % | 1.49 | % | 1.43 | % | 1.26 | % | 1.24 | % | ||||||||||||
|
|
|
|
|
|
|
|
|
|
|
|
|
|||||||||||||
| Portfolio turnover rate |
24 | %d | 57 | % | 53 | % | 39 | % | 26 | % | 46 | % | ||||||||||||
|
|
|
|
|
|
|
|
|
|
|
|
|
|||||||||||||
| Credit Agreement |
||||||||||||||||||||||||
| Asset coverage ratio for credit agreement |
400 | % | 381 | % | 436 | % | 372 | % | 410 | % | 396 | % | ||||||||||||
|
|
|
|
|
|
|
|
|
|
|
|
|
|||||||||||||
| Asset coverage per $1,000 for credit agreement |
$4,004 | $3,809 | $4,361 | $3,715 | $4,099 | $3,956 | ||||||||||||||||||
|
|
|
|
|
|
|
|
|
|
|
|
|
|||||||||||||
| Amount of loan outstanding (in millions) |
$425.0 | $400.0 | $350.0 | $350.0 | $350.0 | $350.0 | ||||||||||||||||||
|
|
|
|
|
|
|
|
|
|
|
|
|
|||||||||||||
| a | Calculation based on average shares outstanding. |
| b | During the reporting period the Fund settled legal claims against one issuer of securities previously held by the Fund. As a result, the net realized and unrealized gain (loss) on investments per share includes proceeds received from the settlement. Without these proceeds the net realized and unrealized gain (loss) on investments per share would have been $(2.22). Additionally, the expense ratio includes extraordinary expenses related to the direct action. Without these expenses, the ratio of expenses to average daily net assets would have been 1.92%. Excluding the proceeds from and expenses relating to the settlements, the total return on a NAV basis would have been -5.24%. |
| c | Total net asset value return measures the change in net asset value per share over the period indicated. Total market value return is computed based upon the Fund’s market price per share and excludes the effects of brokerage commissions. Dividends and distributions are assumed, for purposes of these calculations, to be reinvested at prices obtained under the Fund’s dividend reinvestment plan. |
| d | Not annualized. |
| e | Annualized. |
| f | Average daily managed assets represent net assets plus the outstanding balance of the credit agreement. |
See accompanying notes to financial statements.
33
COHEN & STEERS REIT AND PREFERRED AND INCOME FUND, INC.
NOTES TO FINANCIAL STATEMENTS (Unaudited)
Note 1. Organization and Significant Accounting Policies
Cohen & Steers REIT and Preferred and Income Fund, Inc. (the Fund) was incorporated under the laws of the State of Maryland on March 25, 2003 and is registered under the Investment Company Act of 1940 (the 1940 Act) as a diversified, closed-end management investment company. The Fund’s primary investment objective is high current income. The Fund’s secondary investment objective is capital appreciation.
The following is a summary of significant accounting policies consistently followed by the Fund in the preparation of its financial statements. The Fund is an investment company and, accordingly, follows the investment company accounting and reporting guidance of the Financial Accounting Standards Board Accounting Standards Codification (ASC) Topic 946—Investment Companies. The accounting policies of the Fund are in conformity with accounting principles generally accepted in the United States of America (GAAP). The preparation of the financial statements in accordance with GAAP requires management to make estimates and assumptions that affect the reported amounts of assets and liabilities at the date of the financial statements and the reported amounts of income and expenses during the reporting period. Actual results could differ from those estimates.
Portfolio Valuation: Investments in securities that are listed on the New York Stock Exchange (NYSE) are valued, except as indicated below, at the last sale price reflected at the close of the NYSE on the business day as of which such value is being determined. If there has been no sale on such day, the securities are valued at the mean of the closing bid and ask prices on such day or, if no ask price is available, at the bid price. Centrally cleared interest rate swaps are valued at the price determined by the relevant exchange or clearinghouse. Exchange-traded options are valued at their last sale price as of the close of options trading on applicable exchanges on the valuation date. In the absence of a last sale price on such day, options are valued at the average of the quoted bid and ask prices as of the close of business. Over-the-counter (OTC) options are valued based upon prices provided by a third-party pricing service or counterparty. Forward foreign currency exchange contracts are valued daily at the prevailing forward exchange rate.
Securities not listed on the NYSE but listed on other domestic or foreign securities exchanges (including NASDAQ) are valued in a similar manner. Securities traded on more than one securities exchange are valued at the last sale price reflected at the close of the exchange representing the principal market for such securities on the business day as of which such value is being determined. If after the close of a foreign market, but prior to the close of business on the day the securities are being valued, market conditions change significantly, certain non-U.S. equity holdings may be fair valued pursuant to procedures established by the Board of Directors.
Readily marketable securities traded in the OTC market, including listed securities whose primary market is believed by Cohen & Steers Capital Management, Inc. (the investment manager) to be OTC, are valued on the basis of prices provided by a third-party pricing service or third-party broker-dealers when such prices are believed by the investment manager, pursuant to delegation by the Board of Directors, to reflect the fair value of such securities.
Fixed-income securities are valued on the basis of prices provided by a third-party pricing service or third-party broker-dealers when such prices are believed by the investment manager, pursuant to delegation by the Board of Directors, to reflect the fair market value of such securities. The pricing
34
COHEN & STEERS REIT AND PREFERRED AND INCOME FUND, INC.
NOTES TO FINANCIAL STATEMENTS (Unaudited)—(Continued)
services or broker-dealers use multiple valuation techniques to determine fair value. In instances where sufficient market activity exists, the pricing services or broker-dealers may utilize a market-based approach through which quotes from market makers are used to determine fair value. In instances where sufficient market activity may not exist or is limited, the pricing services or broker-dealers also utilize proprietary valuation models which may consider market transactions in comparable securities and the various relationships between securities in determining fair value and/or characteristics such as benchmark yield curves, option-adjusted spreads, credit spreads, estimated default rates, coupon rates, anticipated timing of principal repayments, underlying collateral, and other unique security features which are then used to calculate the fair values.
Short-term debt securities with a maturity date of 60 days or less are valued at amortized cost, which approximates fair value. Investments in open-end mutual funds are valued at net asset value (NAV).
The policies and procedures approved by the Fund’s Board of Directors delegate authority to make fair value determinations to the investment manager, subject to the oversight of the Board of Directors. The investment manager has established a valuation committee (Valuation Committee) to administer, implement and oversee the fair valuation process according to the policies and procedures approved annually by the Board of Directors. Among other things, these procedures allow the Fund to utilize independent pricing services, quotations from securities and financial instrument dealers and other market sources to determine fair value.
Securities for which market prices are unavailable, or securities for which the investment manager determines that the bid and/or ask price or a counterparty valuation does not reflect market value, will be valued at fair value, as determined in good faith by the Valuation Committee, pursuant to procedures approved by the Fund’s Board of Directors. Circumstances in which market prices may be unavailable include, but are not limited to, when trading in a security is suspended, the exchange on which the security is traded is subject to an unscheduled close or disruption or material events occur after the close of the exchange on which the security is principally traded. In these circumstances, the Fund determines fair value in a manner that fairly reflects the market value of the security on the valuation date based on consideration of any information or factors it deems appropriate. These may include, but are not limited to, recent transactions in comparable securities, information relating to the specific security and developments in the markets.
For equity securities, including restricted securities, where observable inputs are limited, assumptions about market activity and risk are used and these securities would be categorized as Level 2 or 3 in the hierarchy, depending on the relative significance of the valuation inputs. Securities, including private placements or other restricted securities, for which observable inputs are not available are valued using alternate valuation approaches, including the market approach, the income approach and cost approach, and are categorized as Level 3 in the hierarchy. The market approach considers factors including the price of recent investments in the same or a similar security or financial metrics of comparable securities. The income approach considers factors including expected future cash flows, security specific risks and corresponding discount rates. The cost approach considers factors including the value of the security’s underlying assets and liabilities.
The Fund’s use of fair value pricing may cause the NAV of Fund shares to differ from the NAV that would be calculated using market quotations. Fair value pricing involves subjective judgments and it is
35
COHEN & STEERS REIT AND PREFERRED AND INCOME FUND, INC.
NOTES TO FINANCIAL STATEMENTS (Unaudited)—(Continued)
possible that the fair value determined for a security may be materially different than the value that could be realized upon the sale of that security.
Fair value is defined as the price that the Fund would expect to receive upon the sale of an investment or expect to pay to transfer a liability in an orderly transaction with an independent buyer in the principal market or, in the absence of a principal market, the most advantageous market for the investment or liability. The hierarchy of inputs that are used in determining the fair value of the Fund’s investments is summarized below.
| • | Level 1—quoted prices in active markets for identical investments |
| • | Level 2—other significant observable inputs (including quoted prices for similar investments, interest rates, credit risk, etc.) |
| • | Level 3—significant unobservable inputs (including the Fund’s own assumptions in determining the fair value of investments) |
The inputs or methodology used for valuing investments may or may not be an indication of the risk associated with those investments. Changes in valuation techniques may result in transfers into or out of an assigned level within the disclosure hierarchy.
The following is a summary of the inputs used as of June 30, 2021 in valuing the Fund’s investments carried at value:
| Total | Quoted Prices in Active Markets for Identical Investments (Level 1) |
Other Significant Observable Inputs (Level 2) |
Significant Unobservable Inputs (Level 3) |
|||||||||||||
| Common Stock: |
||||||||||||||||
| Real Estate—Industrials |
$ | 105,022,709 | $ | 100,214,831 | $ | — | $ | 4,807,878 | a | |||||||
| Other Industries |
781,210,817 | 781,210,817 | — | — | ||||||||||||
| Preferred Securities— |
||||||||||||||||
| $25 Par Value: |
||||||||||||||||
| Electric |
12,564,204 | 5,202,865 | 7,361,339 | — | ||||||||||||
| Insurance |
30,760,703 | 28,999,348 | 1,761,355 | — | ||||||||||||
| Other Industries |
141,740,651 | 141,740,651 | — | — | ||||||||||||
| Preferred Securities— |
||||||||||||||||
| Capital Securities: |
||||||||||||||||
| Food |
16,356,068 | — | 11,120,018 | 5,236,050 | b | |||||||||||
| Other Industries |
588,704,315 | — | 588,704,315 | — | ||||||||||||
| Purchased Option Contracts |
128,476 | — | 128,476 | — | ||||||||||||
| Short-Term Investments |
6,716,242 | — | 6,716,242 | — | ||||||||||||
|
|
|
|
|
|
|
|
|
|||||||||
| Total Investments in Securitiesc |
$ | 1,683,204,185 | $ | 1,057,368,512 | $ | 615,791,745 | $ | 10,043,928 | ||||||||
|
|
|
|
|
|
|
|
|
|||||||||
36
COHEN & STEERS REIT AND PREFERRED AND INCOME FUND, INC.
NOTES TO FINANCIAL STATEMENTS (Unaudited)—(Continued)
| Total | Quoted Prices in Active Markets for Identical Investments (Level 1) |
Other Significant Observable Inputs (Level 2) |
Significant Unobservable Inputs (Level 3) |
|||||||||||||
| Forward Foreign Currency |
$ | 1,154,205 | $ | — | $ | 1,154,205 | $ | — | ||||||||
| Interest Rate Swap Contracts |
1,225,037 | — | 1,225,037 | — | ||||||||||||
|
|
|
|
|
|
|
|
|
|||||||||
| Total Derivative Assetsc |
$ | 2,379,242 | $ | — | $ | 2,379,242 | $ | — | ||||||||
|
|
|
|
|
|
|
|
|
|||||||||
| Forward Foreign Currency |
$ | (60,582 | ) | $ | — | $ | (60,582 | ) | $ | — | ||||||
| Interest Rate Swap Contracts |
(1,861,576 | ) | — | (1,861,576 | ) | — | ||||||||||
| Written Option Contracts |
(304,132 | ) | (258,248 | ) | (45,884 | ) | — | |||||||||
|
|
|
|
|
|
|
|
|
|||||||||
| Total Derivative Liabilitiesc |
$ | (2,226,290 | ) | $ | (258,248 | ) | $ | (1,968,042 | ) | $ | — | |||||
|
|
|
|
|
|
|
|
|
|||||||||
| a | Restricted security, where observable inputs are limited, has been fair valued by the Valuation Committee, pursuant to the Fund’s fair value procedures and classified as Level 3 security. |
| b | Level 3 investments are valued by a third-party pricing service. The inputs for these securities are not readily available or cannot be reasonably estimated. A change in the significant unobservable inputs could result in a significantly lower or higher value in such Level 3 investments. |
| c | Portfolio holdings are disclosed individually on the Schedule of Investments. |
The following is a reconciliation of investments for which significant unobservable inputs (Level 3) were used in determining fair value:
| Total Investments in Securities |
Written Option Contracts |
|||||||
| Balance as of December 31, 2020 |
$ | 16,615,001 | $ | (9,240 | ) | |||
| Purchases |
69,809 | a | — | |||||
| Realized gain (loss) |
— | 186,707 | ||||||
| Transfer out of Level 3b |
(8,405,000 | ) | — | |||||
| Change in unrealized appreciation (depreciation) |
1,764,118 | (177,467 | ) | |||||
|
|
|
|
|
|||||
| Balance as of June 30, 2021 |
$ | 10,043,928 | $ | — | ||||
|
|
|
|
|
|||||
The change in unrealized appreciation (depreciation) attributable to securities owned on June 30, 2021 which were valued using significant unobservable inputs (Level 3) amounted to $1,272,118.
| a | Represents additional shares acquired through dividend reinvest. |
| b | As of December 31, 2020, the Fund used significant unobservable inputs in determining the value of this investment. As of June 30, 2021, the same investment was transferred from Level 3 to Level 2 as a result of the availability of observable inputs |
37
COHEN & STEERS REIT AND PREFERRED AND INCOME FUND, INC.
NOTES TO FINANCIAL STATEMENTS (Unaudited)—(Continued)
The following table summarizes the quantitative inputs and assumptions used for investments categorized in Level 3 of the fair value hierarchy.
| Fair Value at June 30, 2021 |
Valuation |
Unobservable |
Amount |
Valuation Impact | ||||||||
| Common Stock— |
$ | 4,807,878 | Market Comparable Companies | Enterprise Value/ EBITDAb Multiple Liquidity Discount | 24.8x 15% |
Increase Decrease | ||||||
| a | Represents the directional change in the fair value of the Level 3 investments that could have resulted from an increase in the corresponding input as of period end. A decrease to the unobservable input would have had the opposite effect. Significant changes in these inputs may result in a materially higher or lower fair value measurement. |
| b | Earnings Before Interest, Taxes, Depreciation and Amortization. |
Security Transactions and Investment Income: Security transactions are recorded on trade date. Realized gains and losses on investments sold are recorded on the basis of identified cost. Interest income, which includes the amortization of premiums and accretion of discounts, is recorded on the accrual basis. Dividend income is recorded on the ex-dividend date, except for certain dividends on foreign securities, which are recorded as soon as the Fund is informed after the ex-dividend date. Distributions from real estate investment trusts (REITs) are recorded as ordinary income, net realized capital gain or return of capital based on information reported by the REITs and management’s estimates of such amounts based on historical information. These estimates are adjusted when the actual source of distributions is disclosed by the REITs and actual amounts may differ from the estimated amounts.
Foreign Currency Translation: The books and records of the Fund are maintained in U.S. dollars. Investment securities and other assets and liabilities denominated in foreign currencies are translated into U.S. dollars based upon prevailing exchange rates on the date of valuation. Purchases and sales of investment securities and income and expense items denominated in foreign currencies are translated into U.S. dollars based upon prevailing exchange rates on the respective dates of such transactions. The Fund does not isolate that portion of the results of operations resulting from fluctuations in foreign exchange rates on investments from the fluctuations arising from changes in market prices of securities held. Such fluctuations are included with the net realized and unrealized gain or loss on investments.
Net realized foreign currency transaction gains or losses arise from sales of foreign currencies, (excluding gains and losses on forward foreign currency exchange contracts, which are presented separately, if any) currency gains or losses realized between the trade and settlement dates on securities transactions, and the difference between the amounts of dividends, interest, and foreign withholding taxes recorded on the Fund’s books and the U.S. dollar equivalent of the amounts actually received or paid. Net unrealized foreign currency translation gains and losses arise from changes in the values of assets and liabilities, other than investments in securities, on the date of valuation, resulting
38
COHEN & STEERS REIT AND PREFERRED AND INCOME FUND, INC.
NOTES TO FINANCIAL STATEMENTS (Unaudited)—(Continued)
from changes in exchange rates. Pursuant to U.S. federal income tax regulations, certain foreign currency gains/losses included in realized and unrealized gains/losses are included in or are a reduction of ordinary income for federal income tax purposes.
Forward Foreign Currency Exchange Contracts: The Fund enters into forward foreign currency exchange contracts to hedge the currency exposure associated with certain of its non-U.S. dollar denominated securities. A forward foreign currency exchange contract is a commitment between two parties to purchase or sell foreign currency at a set price on a future date. The market value of a forward foreign currency exchange contract fluctuates with changes in foreign currency exchange rates. These contracts are marked to market daily and the change in value is recorded by the Fund as unrealized appreciation and/or depreciation on forward foreign currency exchange contracts. Realized gains or losses equal to the difference between the value of the contract at the time it was opened and the value at the time it was closed are included in net realized gain or loss on forward foreign currency exchange contracts. For federal income tax purposes, the Fund has made an election to treat gains and losses from forward foreign currency exchange contracts as capital gains and losses.
Forward foreign currency exchange contracts involve elements of market risk in excess of the amounts reflected on the Statement of Assets and Liabilities. The Fund bears the risk of an unfavorable change in the foreign exchange rate underlying the contract. Risks may also arise upon entering these contracts from the potential inability of the counterparties to meet the terms of their contracts. In connection with these contracts, securities may be identified as collateral in accordance with the terms of the respective contracts.
Option Contracts: The Fund may purchase and write exchange-listed and OTC put or call options on securities, stock indices and other financial instruments for hedging purposes, to enhance portfolio returns and/or reduce overall volatility.
When the Fund writes (sells) an option, an amount equal to the premium received by the Fund is recorded on the Statement of Assets and Liabilities as a liability. The amount of the liability is subsequently marked-to-market to reflect the current market value of the option written. When an option expires, the Fund realizes a gain on the option to the extent of the premium received. Premiums received from writing options which are exercised or closed are added to or offset against the proceeds or amount paid on the transaction to determine the realized gain or loss. If a put option on a security is exercised, the premium reduces the cost basis of the security purchased by the Fund. If a call option is exercised, the premium is added to the proceeds of the security sold to determine the realized gain or loss. The Fund, as writer of an option, bears the market risk of an unfavorable change in the price of the underlying investment. Other risks include the possibility of an illiquid options market or the inability of the counterparties to fulfill their obligations under the contracts.
Put and call options purchased are accounted for in the same manner as portfolio securities. Premiums paid for purchasing options which expire are treated as realized losses. Premiums paid for purchasing options which are exercised or closed are added to the amounts paid or offset against the proceeds on the underlying investment transaction to determine the realized gain or loss when the underlying transaction is executed. The risk associated with purchasing an option is that the Fund pays a premium whether or not the option is exercised. Additionally, the Fund bears the risk of loss of the premium and change in market value should the counterparty not perform under the contract.
39
COHEN & STEERS REIT AND PREFERRED AND INCOME FUND, INC.
NOTES TO FINANCIAL STATEMENTS (Unaudited)—(Continued)
Interest Rate Swaption Contracts: The Fund may write or purchase interest rate swaptions which are options to enter into a pre-defined swap agreement at a specified date in the future. The writer of the swaption becomes the counterparty to the swap if the buyer exercises the swaption. The interest rate swaption agreement will specify whether the buyer of the swaption will be a fixed-rate receiver or a fixed-rate payer upon exercise.
Centrally Cleared Interest Rate Swap Contracts: The Fund uses interest rate swaps in connection with borrowing under its credit agreement. The interest rate swaps are intended to reduce interest rate risk by countering the effect that an increase in short-term interest rates could have on the performance of the Fund’s shares as a result of the floating rate structure of interest owed pursuant to the credit agreement. When entering into interest rate swaps, the Fund agrees to pay the other party to the interest rate swap (which is known as the counterparty) a fixed rate payment in exchange for the counterparty’s agreement to pay the Fund a variable rate payment that was intended to approximate the Fund’s variable rate payment obligation on the credit agreement, the accruals for which would begin at a specific date in the future (“the effective date”). The payment obligation is based on the notional amount of the swap. Depending on the state of interest rates in general, the use of interest rate swaps could enhance or harm the overall performance of the Fund. Swaps are marked-to-market daily and changes in the value are recorded as unrealized appreciation (depreciation).
Immediately following execution of the swap agreement, the swap agreement is novated to a central counterparty (the CCP) and the Fund’s counterparty on the swap agreement becomes the CCP. The Fund is required to interface with the CCP through a broker. Upon entering into a centrally cleared swap, the Fund is required to deposit initial margin with the broker in the form of cash or securities in an amount that varies depending on the size and risk profile of the particular swap. Securities deposited as initial margin are designated on the Schedule of Investments and cash deposited is recorded on the Statement of Assets and Liabilities as cash collateral pledged for interest rate swap contracts. The daily change in valuation of centrally cleared swaps is recorded as a receivable or payable for variation margin on interest rate swap contracts in the Statement of Assets and Liabilities. Any upfront payments paid or received upon entering into a swap agreement would be recorded as assets or liabilities, respectively, in the Statement of Assets and Liabilities, and amortized or accreted over the life of the swap and recorded as realized gain (loss) in the Statement of Operations. Payments received from or paid to the counterparty during the term of the swap agreement, or at termination, are recorded as realized gain (loss) in the Statement of Operations.
Swap agreements involve, to varying degrees, elements of market and counterparty risk, and exposure to loss in excess of the related amounts reflected on the Statement of Assets and Liabilities. Such risks involve the possibility that there will be no liquid market for these agreements, that the counterparty to the agreements may default on its obligation to perform or disagree as to the meaning of contractual terms in the agreements and that there may be unfavorable changes in interest rates.
Dividends and Distributions to Shareholders: Dividends from net investment income and capital gain distributions are determined in accordance with U.S. federal income tax regulations, which may differ from GAAP. Dividends from net investment income, if any, are typically declared quarterly and paid monthly. Net realized capital gains, unless offset by any available capital loss carryforward, are typically distributed to shareholders at least annually. Dividends and distributions to shareholders are
40
COHEN & STEERS REIT AND PREFERRED AND INCOME FUND, INC.
NOTES TO FINANCIAL STATEMENTS (Unaudited)—(Continued)
recorded on the ex-dividend date and are automatically reinvested in full and fractional shares of the Fund in accordance with the Fund’s Reinvestment Plan, unless the shareholder has elected to have them paid in cash.
The Fund has a managed distribution policy in accordance with exemptive relief issued by the U.S. Securities and Exchange Commission (SEC). The Plan gives the Fund greater flexibility to realize long-term capital gains throughout the year and to distribute those gains on a more regular basis to shareholders. Therefore, regular monthly distributions throughout the year may include a portion of estimated realized long-term capital gains, along with net investment income, short-term capital gains and return of capital, which is not taxable. In accordance with the Plan, the Fund is required to adhere to certain conditions in order to distribute long-term capital gains during the year.
Dividends from net investment income are subject to recharacterization for tax purposes. Based upon the results of operations for the six months ended June 30, 2021, the investment manager considers it likely that a portion of the dividends will be reclassified to distributions from net realized gain upon the final determination of the Fund’s taxable net income after December 31, 2021, the Fund’s fiscal year end.
Distributions Subsequent to June 30, 2021: The following distributions have been declared by the Fund’s Board of Directors and are payable subsequent to the period end of this report.
| Ex-Date | Record Date | Payable Date | Amount | |||||||||||
| 7/13/21 | 7/14/21 | 7/30/21 | $ | 0.124 | ||||||||||
| 8/17/21 | 8/18/21 | 8/31/21 | $ | 0.124 | ||||||||||
| 9/14/21 | 9/15/21 | 9/30/21 | $ | 0.124 | ||||||||||
Income Taxes: It is the policy of the Fund to continue to qualify as a regulated investment company (RIC), if such qualification is in the best interest of the shareholders, by complying with the requirements of Subchapter M of the Internal Revenue Code applicable to RICs, and by distributing substantially all of its taxable earnings to its shareholders. Also, in order to avoid the payment of any federal excise taxes, the Fund will distribute substantially all of its net investment income and net realized gains on a calendar year basis. Accordingly, no provision for federal income or excise tax is necessary. Dividend and interest income from holdings in non-U.S. securities is recorded net of non-U.S. taxes paid. Management has analyzed the Fund’s tax positions taken on federal and applicable state income tax returns as well as its tax positions in non-U.S. jurisdictions in which it trades for all open tax years and has concluded that as of June 30, 2021, no additional provisions for income tax are required in the Fund’s financial statements. The Fund’s tax positions for the tax years for which the applicable statutes of limitations have not expired are subject to examination by the Internal Revenue Service, state departments of revenue and by foreign tax authorities.
Note 2. Investment Management Fees, Administration Fees and Other Transactions with Affiliates
Investment Management Fees: Cohen & Steers Capital Management, Inc. serves as the Fund’s investment manager pursuant to an investment management agreement (the investment management agreement). Under the terms of the investment management agreement, the investment manager
41
COHEN & STEERS REIT AND PREFERRED AND INCOME FUND, INC.
NOTES TO FINANCIAL STATEMENTS (Unaudited)—(Continued)
provides the Fund with day-to-day investment decisions and generally manages the Fund’s investments in accordance with the stated policies of the Fund, subject to the supervision of the Board of Directors.
For the services provided to the Fund, the investment manager receives a fee, accrued daily and paid monthly, at the annual rate of 0.65% of the average daily managed assets of the Fund. Managed assets are equal to the net assets plus the amount of any borrowings used for leverage outstanding.
Administration Fees: The Fund has entered into an administration agreement with the investment manager under which the investment manager performs certain administrative functions for the Fund and receives a fee, accrued daily and paid monthly, at the annual rate of 0.06% of the average daily managed assets of the Fund. For the six months ended June 30, 2021, the Fund incurred $478,764 in fees under this administration agreement. Additionally, the Fund pays State Street Bank and Trust Company as co-administrator under a fund accounting and administration agreement.
Directors’ and Officers’ Fees: Certain directors and officers of the Fund are also directors, officers and/or employees of the investment manager. The Fund does not pay compensation to directors and officers affiliated with the investment manager except for the Chief Compliance Officer, who received compensation from the investment manager, which was reimbursed by the Fund, in the amount of $4,166 for the six months ended June 30, 2021.
Note 3. Purchases and Sales of Securities
Purchases and sales of securities, excluding short-term investments, for the six months ended June 30, 2021, totaled $403,656,687 and $384,996,111, respectively.
Note 4. Derivative Investments
The following tables present the value of derivatives held at June 30, 2021 and the effect of derivatives held during the six months ended June 30, 2021, along with the respective location in the financial statements.
Statement of Assets and Liabilities
| Assets |
Liabilities |
|||||||||||
| Derivatives |
Location |
Fair Value | Location |
Fair Value | ||||||||
| Equity Risk: |
||||||||||||
| Purchased Option Contracts—Over-the-Counter |
Investments in securities, at value |
$ | 40,483 | — | $ | — | ||||||
| Written Option Contracts— Exchange-Tradeda |
— | — | Written option contracts, at value |
258,248 | ||||||||
| Written Option Contracts—Over-the-Counter |
— | — | Written option contracts, at value |
14,431 | ||||||||
42
COHEN & STEERS REIT AND PREFERRED AND INCOME FUND, INC.
NOTES TO FINANCIAL STATEMENTS (Unaudited)—(Continued)
| Assets |
Liabilities |
|||||||||||
| Derivatives |
Location |
Fair Value | Location |
Fair Value | ||||||||
| Foreign Exchange Risk: |
||||||||||||
| Forward Foreign Currency Exchange Contractsb |
Unrealized appreciation | $ | 1,154,205 | Unrealized depreciation | $ | 60,582 | ||||||
| Interest Rate Risk: |
||||||||||||
|
Interest Rate Swap Contractsa |
— | — | Payable for variation margin on interest rate swap contracts | (636,539 | )c | |||||||
| Purchased Option Contracts—Over-the-Counter |
Investments in securities, at value |
87,993 | ||||||||||
| Written Option Contracts—Over-the-Counter |
— | — | Written option contracts, at value |
31,453 | ||||||||
| a | Not subject to a master netting agreement or another similar arrangement. |
| b | Forward foreign currency exchange contracts executed with Brown Brothers Harriman are not subject to a master netting agreement or another similar arrangement. |
| c | Amount represents the cumulative depreciation on interest rate swap contracts as reported on the Schedule of Investments. The Statement of Assets and Liabilities only reflects the current day variation margin payable to the broker. |
Statement of Operations
| Derivatives |
Location |
Realized Gain (Loss) |
Change in Unrealized Appreciation (Depreciation) |
|||||||
| Equity Risk: |
||||||||||
| Purchased Options Contractsa |
Net Realized and Unrealized Gain (Loss) | $ | (92,434 | ) | $ | (270,767 | ) | |||
| Written Option Contracts |
Net Realized and Unrealized Gain (Loss) | 1,016,916 | (169,477 | ) | ||||||
| Foreign Exchange Risk: |
||||||||||
| Forward Foreign Currency Exchange Contracts |
Net Realized and Unrealized Gain (Loss) | (1,243,811 | ) | 1,939,815 | ||||||
| Interest Rate Risk: |
||||||||||
| Interest Rate Swap Contracts |
Net Realized and Unrealized Gain (Loss) | (560,839 | ) | 3,330,039 | ||||||
| Purchased Options Contractsa |
Net Realized and Unrealized Gain (Loss) | — | (356,484 | ) | ||||||
| Written Option Contracts |
Net Realized and Unrealized Gain (Loss) | — | 227,633 | |||||||
| a | Purchased options are included in net realized gain (loss) and change in unrealized appreciation (depreciation) on investments in securities. |
43
COHEN & STEERS REIT AND PREFERRED AND INCOME FUND, INC.
NOTES TO FINANCIAL STATEMENTS (Unaudited)—(Continued)
At June 31, 2021, the Fund’s derivative assets and liabilities (by type), which are subject to a master netting agreement, are as follows:
| Derivative Financial Instruments |
Assets | Liabilities | ||||||
| Equity Risk: |
||||||||
| Purchased Option Contracts—Over-the-Countera |
$ | 40,483 | $ | — | ||||
| Written Option Contracts—Over-the-Counter |
— | 14,431 | ||||||
| Interest Rate Risk: |
||||||||
| Purchased Option Contracts—Over-the-Countera |
87,993 | — | ||||||
| Written Option Contracts—Over-the-Counter |
— | 31,453 | ||||||
| a | Purchased options are included in investments in securities, at value on the Statement of Assets & Liabilities. |
The following table presents the Fund’s derivative assets and liabilities by counterparty net of amounts available for offset under a master netting agreement and net of the related collateral received and pledged by the Fund, if any, as of June 30, 2021:
| Counterparty |
Gross Amount of Assets Presented in the Statement of Assets and Liabilities |
Financial Instruments and Derivatives Available for Offset |
Collateral Receiveda |
Net Amount of Derivative Assetb |
||||||||||||
| Goldman Sachs International |
$ | 128,476 | $ | (45,884 | ) | $ | (82,592 | ) | $ | — | ||||||
| Counterparty |
Gross Amount of Liabilities Presented in the Statement of Assets and Liabilities |
Financial Instruments and Derivatives Available for Offset |
Collateral Pledgeda |
Net Amount of Derivative Liabilitiesb |
||||||||||||
| Goldman Sachs International |
$ | 45,884 | $ | (45,884 | ) | $ | — | $ | — | |||||||
| a | Collateral received or pledged is limited to the net derivative asset or net derivative liability amounts. Actual collateral amounts received or pledged may be higher than amounts above. |
| b | Net amount represents the net receivable from the counterparty or net payable due to the counterparty in the event of default. |
44
COHEN & STEERS REIT AND PREFERRED AND INCOME FUND, INC.
NOTES TO FINANCIAL STATEMENTS (Unaudited)—(Continued)
The following summarizes the volume of the Fund’s option contracts, interest rate swap contracts and forward foreign currency exchange contracts activity for the six months ended June 30, 2021:
| Purchased Option Contractsa,b |
Written Option Contractsa,b |
Interest Rate Swap Contracts |
Forward Foreign Currency Exchange Contracts |
|||||||||||||
| Average Notional Amount |
$ | 33,795,873 | $ | 34,868,400 | $ | 283,928,571 | $ | 39,161,138 | ||||||||
| a | Average notional amounts represent the average for all months in which the Fund had written option contracts outstanding at month end. For the period, this represents four months and six months for purchased and written option contracts, respectively. |
| b | Notional amount is calculated using the number of contracts multiplied by notional contract size multiplied by the underlying price. |
Note 5. Income Tax Information
As of June 30, 2021, the federal tax cost and net unrealized appreciation (depreciation) in value of investments held were as follows:
| Cost of investments in securities for federal income tax purposes |
$ | 1,300,682,634 | ||
|
|
|
|||
| Gross unrealized appreciation on investments |
$ | 385,719,815 | ||
| Gross unrealized depreciation on investments |
(3,109,649 | ) | ||
|
|
|
|||
| Net unrealized appreciation (depreciation) on investments |
$ | 382,610,166 | ||
|
|
|
Note 6. Capital Stock
The Fund is authorized to issue 100 million shares of common stock at a par value of $0.001 per share.
During the six months ended June 30, 2021, the Fund issued 7,961 shares of common stock at $213,606 for the reinvestment of dividends. During the year ended December 31, 2020, the Fund did not issue shares of common stock for the reinvestment of dividends.
On December 8, 2020, the Board of Directors approved the continuation of the delegation of its authority to management to effect repurchases, pursuant to management’s discretion and subject to market conditions and investment considerations, of up to 10% of the Fund’s common shares outstanding (Share Repurchase Program) as of January 1, 2021 through December 31, 2021.
During the six months ended June 30, 2021 and the year ended December 31, 2020, the Fund did not effect any repurchases.
45
COHEN & STEERS REIT AND PREFERRED AND INCOME FUND, INC.
NOTES TO FINANCIAL STATEMENTS (Unaudited)—(Continued)
Note 7. Borrowings
The Fund has entered into an amended and restated credit agreement (the credit agreement) with BNP Paribas Prime Brokerage International, Ltd. (BNPP) in which the Fund pays a monthly financing charge based on a combination of LIBOR-based variable and fixed rates. The commitment amount of the credit agreement is $450,000,000. The Fund may pay a fee of 0.45% per annum on any unused portion of the credit agreement. BNPP may not change certain terms of the credit agreement except upon 360 days’ notice. Also, if the Fund violates certain conditions, the credit agreement may be terminated. The Fund is required to pledge portfolio securities as collateral in an amount up to two times the loan balance outstanding (or more depending on the terms of the credit agreement) and has granted a security interest in the securities pledged to, and in favor of, BNPP as security for the loan balance outstanding. If the Fund fails to meet certain requirements, or maintain other financial covenants required under the credit agreement, the Fund may be required to repay immediately, in part or in full, the loan balance outstanding under the credit agreement, necessitating the sale of portfolio securities at potentially inopportune times. Under the terms of the credit agreement, the Fund may, upon prior written notice to BNPP, prepay all or a portion of the fixed rate portions of the credit facility. In the event of such prepayment, the Fund will receive or pay any gain or loss associated with BNPP’s interest rate hedge with respect to the applicable fixed rate portions of the credit facility, which could be material in certain circumstances (breakage fee). The credit agreement also permits, subject to certain conditions, BNPP to rehypothecate portfolio securities pledged by the Fund up to the amount of the loan balance outstanding and the Fund will receive a portion of the fees earned by BNPP in connection with the rehypothecated securities. The Fund continues to receive dividends and interest on rehypothecated securities. The Fund also has the right under the credit agreement to recall the rehypothecated securities from BNPP on demand. If BNPP fails to deliver the recalled security in a timely manner, the Fund will be compensated by BNPP for any fees or losses related to the failed delivery or, in the event a recalled security will not be returned by BNPP, the Fund, upon notice to BNPP, may reduce the loan balance outstanding by the amount of the recalled security failed to be returned.
As of June 30, 2021, the Fund had outstanding borrowings of $425,000,000 at a weighted average rate of 2.1%. The fair value of these borrowings at June 30, 2021 was approximately $430,046,733, including estimated breakage fees of approximately $5,046,733 in the event of a prepayment of all of the fixed rate financing. The borrowings are classified as Level 2 within the fair value hierarchy. During the six months ended June 30, 2021, the Fund borrowed an average daily balance of $423,204,420 at a weighted average borrowing cost of 2.2%.
Note 8. Other Risks
Market Price Discount from Net Asset Value: Shares of closed-end investment companies frequently trade at a discount from their NAV. This characteristic is a risk separate and distinct from the risk that NAV could decrease as a result of investment activities. Whether investors will realize gains or losses upon the sale of the shares will depend not upon the Fund’s NAV but entirely upon whether the market price of the shares at the time of sale is above or below the investor’s purchase price for the
46
COHEN & STEERS REIT AND PREFERRED AND INCOME FUND, INC.
NOTES TO FINANCIAL STATEMENTS (Unaudited)—(Continued)
shares. Because the market price of the shares is determined by factors such as relative supply of and demand for shares in the market, general market and economic conditions, and other factors beyond the control of the Fund, the shares may trade at, above or below NAV.
Common Stock Risk. The Fund may invest in common stocks. Common stocks are subject to special risks. Although common stocks have historically generated higher average returns than fixed-income securities over the long-term, common stocks also have experienced significantly more volatility in returns. Common stocks may be more susceptible to adverse changes in market value due to issuer specific events or general movements in the equities markets. A drop in the stock market may depress the price of common stocks held by the Fund. Common stock prices fluctuate for many reasons, including changes to investors’ perceptions of the financial condition of an issuer or the general condition of the relevant stock market, or the occurrence of political or economic events affecting issuers. For example, an adverse event, such as an unfavorable earnings report, may depress the value of common stock in which the Fund has invested; the price of common stock of an issuer may be particularly sensitive to general movements in the stock market; or a drop in the stock market may depress the price of most or all of the common stocks held by the Fund. Also, common stock of an issuer in the Fund’s portfolio may decline in price if the issuer fails to make anticipated dividend payments because, among other reasons, the issuer of the security experiences a decline in its financial condition. The common stocks in which the Fund will invest are typically subordinated to preferred securities, bonds and other debt instruments in a company’s capital structure in terms of priority to corporate income and assets, and, therefore, will be subject to greater risk than the preferred securities or debt instruments of such issuers. In addition, common stock prices may be sensitive to rising interest rates as the costs of capital rise and borrowing costs increase.
Real Estate Market Risk: Since the Fund concentrates its assets in companies engaged in the real estate industry, an investment in the Fund will be closely linked to the performance of the real estate markets. Risks of investing in real estate securities include falling property values due to increasing vacancies, declining rents resulting from economic, legal, tax, political or technological developments, lack of liquidity, limited diversification, and sensitivity to certain economic factors such as interest-rate changes and market recessions. Real estate company prices also may drop because of the failure of borrowers to pay their loans and poor management, and residential developers, in particular, could be negatively impacted by falling home prices, slower mortgage origination and rising construction costs. The risks of investing in REITs are similar to those associated with direct investments in real estate securities.
REIT Risk: In addition to the risks of securities linked to the real estate industry, REITs are subject to certain other risks related to their structure and focus. REITs generally are dependent upon management skills and may not be diversified. REITs are also subject to heavy cash flow dependency, defaults by borrowers and self-liquidation. In addition, REITs could possibly fail to (i) qualify for favorable tax treatment under applicable tax law, or (ii) maintain their exemptions from registration under the 1940 Act. The above factors may also adversely affect a borrower’s or a lessee’s ability to meet its obligations to the REIT. In the event of a default by a borrower or lessee, the REIT may experience delays in enforcing its rights as a mortgagee or lessor and may incur substantial costs associated with protecting its investments.
47
COHEN & STEERS REIT AND PREFERRED AND INCOME FUND, INC.
NOTES TO FINANCIAL STATEMENTS (Unaudited)—(Continued)
Small- and Medium-Sized Companies Risk. Real estate companies in the industry tend to be small-to medium-sized companies in relation to the equity markets as a whole. There may be less trading in a smaller company’s stock, which means that buy and sell transactions in that stock could have a larger impact on the stock’s price than is the case with larger company stocks. Smaller companies also may have fewer lines of business so that changes in any one line of business may have a greater impact on a smaller company’s stock price than is the case for a larger company. Further, smaller company stocks may perform differently in different cycles than larger company stocks. Accordingly, real estate company shares can, and at times will, perform differently than large company stocks.
Preferred Securities Risk: Preferred securities are subject to credit risk, which is the risk that a security will decline in price, or the issuer of the security will fail to make dividend, interest or principal payments when due, because the issuer experiences a decline in its financial status. Preferred securities are also subject to interest rate risk and may decline in value because of changes in market interest rates. The Fund may be subject to a greater risk of rising interest rates than would normally be the case in an environment of low interest rates and the effect of potential government fiscal policy initiatives and resulting market reaction to those initiatives. In addition, an issuer may be permitted to defer or omit distributions. Preferred securities are also generally subordinated to bonds and other debt instruments in a company’s capital structure. During periods of declining interest rates, an issuer may be able to exercise an option to redeem (call) its issue at par earlier than scheduled, and the Fund may be forced to reinvest in lower yielding securities. Certain preferred securities may be substantially less liquid than many other securities, such as common stocks. Generally, preferred security holders have no voting rights with respect to the issuing company unless certain events occur. Certain preferred securities may give the issuers special redemption rights allowing the securities to be redeemed prior to a specified date if certain events occur, such as changes to tax or securities laws.
Contingent Capital Securities Risk: Contingent capital securities (sometimes referred to as “CoCos”) are debt or preferred securities with loss absorption characteristics built into the terms of the security, for example, a mandatory conversion into common stock of the issuer under certain circumstances, such as the issuer’s capital ratio falling below a certain level. Since the common stock of the issuer may not pay a dividend, investors in these instruments could experience a reduced income rate, potentially to zero, and conversion would deepen the subordination of the investor, hence worsening the investor’s standing in a bankruptcy. Some CoCos provide for a reduction in the value of principal amount of the security under such circumstances. In addition, most CoCos are considered to be high yield or “junk” securities and are therefore subject to the risks of investing in below investment grade securities. Finally, CoCo issuers can, at their discretion, suspend dividend distributions on their CoCo securities and are more likely to do so in response to negative economic conditions and/or government regulation. Omitted distributions are typically non-cumulative and will not be paid on a future date. Any omitted distribution may negatively impact the returns or distribution rate of the Fund.
Credit and Below Investment Grade Securities Risk: Preferred securities may be rated below investment grade or may be unrated. Below-investment-grade securities, or equivalent unrated securities, which are commonly known as “high-yield bonds” or “junk bonds,” generally involve greater volatility of price and risk of loss of income and principal, and may be more susceptible to real or
48
COHEN & STEERS REIT AND PREFERRED AND INCOME FUND, INC.
NOTES TO FINANCIAL STATEMENTS (Unaudited)—(Continued)
perceived adverse economic and competitive industry conditions than higher grade securities. It is reasonable to expect that any adverse economic conditions could disrupt the market for lower-rated securities, have an adverse impact on the value of those securities and adversely affect the ability of the issuers of those securities to repay principal and interest on those securities.
Leverage Risk: The use of leverage is a speculative technique and there are special risks and costs associated with leverage. The NAV of the Fund’s shares may be reduced by the issuance and ongoing costs of leverage. So long as the Fund is able to invest in securities that produce an investment yield that is greater than the total cost of leverage, the leverage strategy will produce higher current net investment income for the shareholders. On the other hand, to the extent that the total cost of leverage exceeds the incremental income gained from employing such leverage, shareholders would realize lower net investment income. In addition to the impact on net income, the use of leverage will have an effect of magnifying capital appreciation or depreciation for shareholders. Specifically, in an up market, leverage will typically generate greater capital appreciation than if the Fund were not employing leverage. Conversely, in down markets, the use of leverage will generally result in greater capital depreciation than if the Fund had been unlevered. To the extent that the Fund is required or elects to reduce its leverage, the Fund may incur applicable breakage fees under the Fund’s credit arrangement and may need to liquidate investments, including under adverse economic conditions which may result in capital losses potentially reducing returns to shareholders. The use of leverage also results in the investment management fees payable to the investment manager being higher than if the Fund did not use leverage and can increase operating costs, which may reduce total return. There can be no assurance that a leveraging strategy will be successful during any period in which it is employed.
Liquidity Risk: Liquidity risk is the risk that particular investments of the Fund may become difficult to sell or purchase. The market for certain investments may become less liquid or illiquid due to adverse changes in the conditions of a particular issuer or due to adverse market or economic conditions. In addition, dealer inventories of certain securities, which provide an indication of the ability of dealers to engage in “market making,” are at, or near, historic lows in relation to market size, which has the potential to increase price volatility in the fixed income markets in which the Fund invests. Federal banking regulations may also cause certain dealers to reduce their inventories of certain securities, which may further decrease the Fund’s ability to buy or sell such securities. As a result of this decreased liquidity, the Fund may have to accept a lower price to sell a security, sell other securities to raise cash, or give up an investment opportunity, any of which could have a negative effect on performance. Further, transactions in less liquid or illiquid securities may entail transaction costs that are higher than those for transactions in liquid securities.
Foreign (Non-U.S.) Securities Risk: The Fund directly purchases securities of foreign issuers. Risks of investing in foreign securities include currency risks, future political and economic developments and possible imposition of foreign withholding taxes on income or proceeds payable on the securities. In addition, there may be less publicly available information about a foreign issuer than about a domestic issuer, and foreign issuers may not be subject to the same accounting, auditing and financial recordkeeping standards and requirements as domestic issuers. Moreover, securities of many foreign issuers and their markets may be less liquid and their prices more volatile than securities of comparable U.S. issuers.
49
COHEN & STEERS REIT AND PREFERRED AND INCOME FUND, INC.
NOTES TO FINANCIAL STATEMENTS (Unaudited)—(Continued)
Investing in securities of companies in emerging markets may entail special risks relating to potential economic, political or social instability and the risks of expropriation, nationalization, confiscation, trade sanctions or embargoes or the imposition of restrictions on foreign investment, the lack of hedging instruments, and repatriation of capital invested. The securities and real estate markets of some emerging market countries have in the past experienced substantial market disruptions and may do so in the future.
Foreign Currency Risk: Although the Fund will report its NAV and pay dividends in U.S. dollars, foreign securities often are purchased with and make any dividend and interest payments in foreign currencies. Therefore, the Fund’s investments in foreign securities will be subject to foreign currency risk, which means that the Fund’s NAV could decline solely as a result of changes in the exchange rates between foreign currencies and the U.S. dollar. Certain foreign countries may impose restrictions on the ability of issuers of foreign securities to make payment of principal, dividends and interest to investors located outside the country, due to blockage of foreign currency exchanges or otherwise. The Fund may, but is not required to, engage in various investments that are designed to hedge the Fund’s foreign currency risks, and such investments are subject to the risks described under “Derivatives and Hedging Transactions Risk” below.
Derivatives and Hedging Transactions Risk: The Fund’s use of derivatives, including for the purpose of hedging interest rate or foreign currency risks, presents risks different from, and possibly greater than, the risks associated with investing directly in traditional securities. Among the risks presented are counterparty risk, financial leverage risk, liquidity risk, OTC trading risk and tracking risk. The use of derivatives can lead to losses because of adverse movements in the price or value of the underlying asset, index or rate, which may be magnified by certain features of the derivatives.
Options Risk. Gains on options transactions depend on the investment manager’s ability to predict correctly the direction of stock prices, indexes, interest rates, and other economic factors, and unanticipated changes may cause poorer overall performance for the Fund than if it had not engaged in such transactions. A rise in the value of the security or index underlying a call option written by the Fund exposes the Fund to possible loss or loss of opportunity to realize appreciation in the value of any portfolio securities underlying or otherwise related to the call option. By writing a put option, the Fund assumes the risk of a decline in the underlying security or index. There can be no assurance that a liquid market will exist when the Fund seeks to close out an option position, and for certain options not traded on an exchange no market usually exists. Trading could be interrupted, for example, because of supply and demand imbalances arising from a lack of either buyers or sellers, or an options exchange could suspend trading after the price has risen or fallen more than the maximum specified by the exchange.
Although the Fund may be able to offset to some extent any adverse effects of being unable to liquidate an option position, that Fund may experience losses in some cases as a result of such inability, may not be able to close its position and, in such an event would be unable to control its losses.
Geopolitical Risk: Occurrence of global events similar to those in recent years, such as war, terrorist attacks, natural or environmental disasters, country instability, infectious disease epidemics, such as that caused by the COVID-19 virus, market instability, debt crises and downgrades, embargoes, tariffs, sanctions and other trade barriers and other governmental trade or market control
50
COHEN & STEERS REIT AND PREFERRED AND INCOME FUND, INC.
NOTES TO FINANCIAL STATEMENTS (Unaudited)—(Continued)
programs, the potential exit of a country from its respective union and related geopolitical events, may result in market volatility and may have long-lasting impacts on both the U.S. and global financial markets. Additionally, those events, as well as other changes in foreign and domestic political and economic conditions, could adversely affect individual issuers or related groups of issuers, securities markets, interest rates, secondary trading, credit ratings, inflation, investor sentiment and other factors affecting the value of the Fund’s investments.
An outbreak of respiratory disease caused by a novel coronavirus designated as COVID-19 has resulted in, among other things, extreme volatility in the financial markets and severe losses, reduced liquidity of many instruments, significant travel restrictions, significant disruptions to business operations, supply chains and customer activity, lower consumer demand for goods and services, service and event cancellations, reductions and other changes, strained healthcare systems, as well as general concern and uncertainty. The impact of the COVID-19 outbreak has negatively affected the global economy, the economies of individual countries, and the financial performance of individual issuers, sectors, industries, asset classes, and markets in significant and unforeseen ways. Pandemics may also exacerbate other pre-existing political, social, economic, market and financial risks. The effects of the outbreak in developing or emerging market countries may be greater due to less established health care systems and supply chains. The COVID-19 pandemic and its effects may result in a sustained economic downturn or a global recession, ongoing market volatility and/or decreased liquidity in the financial markets, exchange trading suspensions and closures, higher default rates, domestic and foreign political and social instability and damage to diplomatic and international trade relations. While some vaccines have been developed and approved for use by various governments, the political, social, economic, market and financial risks of COVID-19 could persist for years to come. The foregoing could impair the Fund’s ability to maintain operational standards, disrupt the operations of the Fund’s service providers, adversely affect the value and liquidity of the Fund’s investments, and negatively impact the Fund’s performance and your investment in the Fund.
On January 31, 2020, the United Kingdom (UK) withdrew from the European Union (EU) (referred to as Brexit), commencing a transition period that ended on December 31, 2020. On January 1, 2021, the EU-UK Trade and Cooperation Agreement, a bilateral trade and cooperation deal governing the future relationship between the UK and the EU, provisionally went into effect. The UK Parliament ratified the agreement in December 2020 and the EU Parliament ratified the agreement in April 2021. The agreement must now be approved by EU member states to enter into force officially. Brexit has resulted in volatility in European and global markets and could have negative long-term impacts on financial markets in the UK and throughout Europe. There is considerable uncertainty about the potential consequences of Brexit, the EU-UK Trade and Cooperation Agreement, how future negotiations of trade relations will proceed, and how the financial markets will react to all of the preceding. As this process unfolds, markets may be further disrupted. Given the size and importance of the UK’s economy, uncertainty about its legal, political and economic relationship with the remaining member states of the EU may continue to be a source of instability.
Growing tensions, including trade disputes, between the United States and other nations, or among foreign powers, and possible diplomatic, trade or other sanctions could adversely impact the global economy, financial markets and the Fund. The strengthening or weakening of the U.S. dollar
51
COHEN & STEERS REIT AND PREFERRED AND INCOME FUND, INC.
NOTES TO FINANCIAL STATEMENTS (Unaudited)—(Continued)
relative to other currencies may, among other things, adversely affect the Fund’s investments denominated in non-U.S. dollar currencies. It is difficult to predict when similar events affecting the U.S. or global financial markets may occur, the effects that such events may have, and the duration of those effects.
Regulatory Risk: The U.S. government has proposed and adopted multiple regulations that could have a long-lasting impact on the Fund and on the mutual fund industry in general. The SEC’s final rules, related requirements and amendments to modernize reporting and disclosure, along with other potential upcoming regulations, could, among other things, restrict the Fund’s ability to engage in transactions or increase overall expenses of the Fund. In addition, the SEC, Congress, various exchanges and regulatory and self-regulatory authorities, both domestic and foreign, have undertaken reviews of the use of derivatives by registered investment companies, which could affect the nature and extent of instruments used by the Fund. While the full extent of all of these regulations is still unclear, these regulations and actions may adversely affect both the Fund and the instruments in which the Fund invests and its ability to execute its investment strategy. Similarly, regulatory developments in other countries may have an unpredictable and adverse impact on the Fund.
The SEC has recently adopted a rule relating to a registered investment company’s use of derivatives and similar transactions that could potentially require the Fund to observe more stringent requirements than are currently imposed by the 1940 Act. The new rule will replace present SEC and SEC staff regulatory guidance related to limits on a registered investment company’s use of derivative instruments and certain other transactions, such as short sales and reverse repurchase agreements. The rule may substantially curtail the Fund’s ability to use derivative instruments as part of the Fund’s investment strategy and could ultimately prevent the Fund from being able to achieve its investment goals.
LIBOR Risk: Many financial instruments are tied to the London Interbank Offered Rate, or “LIBOR,” to determine payment obligations, financing terms, hedging strategies, or investment value. LIBOR is the offered rate for short-term Eurodollar deposits between major international banks. In 2017, the head of the UK Financial Conduct Authority (the FCA) announced a desire to phase out the use of LIBOR by the end of 2021. Alternatives to LIBOR are in development in many major financial markets. For example, the U.S. Federal Reserve has begun publishing a Secured Overnight Financing Rate (SOFR), a broad measure of secured overnight U.S. Treasury repo rates, as a possible replacement for U.S. dollar LIBOR. Bank working groups and regulators in other countries have suggested other alternatives for their markets, including the Sterling Overnight Interbank Average Rate (SONIA) in England. Other countries are introducing their own local-currency-denominated alternative reference rates for short-term lending and global consensus on alternative rates is lacking. The FCA and LIBOR’s administrator, ICE Benchmark Administration (IBA), announced a delay in the phase out of a majority of the U.S. dollar LIBOR publications until mid-2023, with the remainder of LIBOR publications to end at the end of 2021. It is possible that the FCA may compel the IBA to publish a subset of LIBOR settings after these dates on a “synthetic” basis, but any such publications would be considered non-representative of the underlying market. There remains uncertainty and risk regarding the willingness and ability of issuers and lenders to include enhanced provisions in new and existing contracts or instruments, the suitability
52
COHEN & STEERS REIT AND PREFERRED AND INCOME FUND, INC.
NOTES TO FINANCIAL STATEMENTS (Unaudited)—(Continued)
of the proposed replacement rates, and the process for amending existing contracts and instruments remains unclear. As such, the transition away from LIBOR may lead to increased volatility and illiquidity in markets that are tied to LIBOR, reduced values of, inaccurate valuations of, and miscalculations of payment amounts for LIBOR-related investments or investments in issuers that utilize LIBOR, increased difficulty in borrowing or refinancing and reduced effectiveness of hedging strategies, adversely affecting the Fund’s performance or NAV. In addition, any alternative reference rate may be an ineffective substitute resulting in prolonged adverse market conditions for the Fund. Since the usefulness of LIBOR as a benchmark could deteriorate during the transition period, these effects could occur prior to the cessation of LIBOR publications.
Note 9. Other
In the normal course of business, the Fund enters into contracts that provide general indemnifications. The Fund’s maximum exposure under these arrangements is dependent on claims that may be made against the Fund in the future and, therefore, cannot be estimated; however, based on experience, the risk of material loss from such claims is considered remote.
Note 10. Subsequent Events
Management has evaluated events and transactions occurring after June 30, 2021 through the date that the financial statements were issued, and has determined that no additional disclosure in the financial statements is required.
53
COHEN & STEERS REIT AND PREFERRED AND INCOME FUND, INC.
PROXY RESULTS (Unaudited)
Cohen & Steers REIT and Preferred and Income Fund, Inc. shareholders voted on the following proposals at the annual meeting held on April 22, 2021. The description of each proposal and number of shares voted are as follows:
| Common Shares | Shares Voted For |
Authority Withheld |
||||||
| To elect Directors: |
||||||||
| George Grossman |
37,278,139 | 813,253 | ||||||
| Jane F. Magpiong |
37,463,507 | 627,885 | ||||||
| Robert H. Steers |
37,277,167 | 814,225 | ||||||
| C. Edward Ward, Jr. |
37,240,785 | 850,607 | ||||||
54
COHEN & STEERS REIT AND PREFERRED AND INCOME FUND, INC.
(The following pages are unaudited)
AVERAGE ANNUAL TOTAL RETURNS
(Periods ended June 30, 2021)
| Based on Net Asset Value | Based on Market Value | |||||||||||||||||||||||||||||||||
| One Year | Five Years | Ten Years | Since Inception (6/27/03) |
One Year | Five Years | Ten Years | Since Inception (6/27/03) |
|||||||||||||||||||||||||||
| 35.07 | % | 10.76 | % | 12.69 | % | 10.52 | % | 52.01 | % | 13.69 | % | 13.34 | % | 10.33 | % | |||||||||||||||||||
The performance data quoted represent past performance. Past performance is no guarantee of future results. The investment return will vary and the principal value of an investment will fluctuate and shares, if sold, may be worth more or less than their original cost. Current performance may be lower or higher than the performance data quoted. Performance results reflect the effect of leverage from utilization of borrowings under a credit agreement and/or from the issuance of preferred shares. Current total returns of the Fund can be obtained by visiting our website at cohenandsteers.com. The Fund’s returns assume the reinvestment of all dividends and distributions at prices obtained under the Fund’s dividend reinvestment plan.
REINVESTMENT PLAN
We urge shareholders who want to take advantage of this plan and whose shares are held in ‘Street Name’ to consult your broker as soon as possible to determine if you must change registration into your own name to participate.
OTHER INFORMATION
A description of the policies and procedures that the Fund uses to determine how to vote proxies relating to portfolio securities is available (i) without charge, upon request, by calling 866-277-0757, (ii) on our website at cohenandsteers.com or (iii) on the SEC’s website at http://www.sec.gov. In addition, the Fund’s proxy voting record for the most recent 12-month period ended June 30 is available by August 31 of each year (i) without charge, upon request, by calling 866-277-0757 or (ii) on the SEC’s website at http://www.sec.gov.
Disclosures of the Fund’s complete holdings are required to be made monthly on Form N-PORT, with every third month made available to the public by the SEC 60 days after the end of the Fund’s fiscal quarter. The Fund’s Form N-PORT is available (i) without charge, upon request, by calling 866-277-0757 or (ii) on the SEC’s website at http://www.sec.gov.
Please note that distributions paid by the Fund to shareholders are subject to recharacterization for tax purposes and are taxable up to the amount of the Fund’s investment company taxable income and net realized gains. Distributions in excess of the Fund’s investment company taxable income and net realized gains are a return of capital distributed from the Fund’s assets. To the extent this occurs, the Fund’s shareholders of record will be notified of the estimated amount of capital returned to shareholders for each such distribution and this information will also be available at cohenandsteers.com. The final tax treatment of all distributions is reported to shareholders on their 1099-DIV forms, which are mailed after the close of each calendar year. Distributions of capital decrease the Fund’s total assets and, therefore, could have the effect of increasing the Fund’s expense ratio. In addition, in order to make these distributions, the Fund may have to sell portfolio securities at a less than opportune time.
55
COHEN & STEERS REIT AND PREFERRED AND INCOME FUND, INC.
Notice is hereby given in accordance with Rule 23c-1 under the 1940 Act that the Fund may purchase, from time to time, shares of its common stock in the open market.
The following information in this semi-annual report is a summary of certain changes since the Fund’s most recent annual shareholder report. This information may not reflect all of the changes that have occurred since you purchased the Fund.
Changes to Portfolio Management Team
Effective May 1, 2021, Thomas Bohjalian no longer serves as a portfolio manager of the Fund. William Scapell, Jason Yablon and Mathew Kirschner continue to serve as portfolio managers of the Fund.
Changes to the Board of Directors
On March 8, 2021, the Board of Directors voted to set the number of directors on the Fund’s Board of Directors to ten. In addition, the Board of Directors elected Ms. Ramona Rogers-Windsor as a Director of the Fund.
Ramona Rogers-Windsor: In addition to serving as a Director of the Cohen & Steers funds, Ms. Rogers-Windsor serves as a member of the Capital Southwest Board of Directors since March 2021 and a member of the Thomas Jefferson University Board of Trustees since December 2020. Previously, Ms. Rogers-Windsor spent over 23 years in investment management with Northwestern Mutual Investment Company, LLC, most recently as Managing Director and Portfolio Manager. Prior to that, Ms. Rogers-Windsor served as a financial officer with Northwestern Mutual Life. Ms. Rogers-Windsor has over 38 years of experience across multiple segments of the financial services industry and has previously served on the boards of several non-profit organizations. Ms. Rogers-Windsor holds a BS in Accounting from Marquette University and is a Certified Public Accountant and a Chartered Financial Analyst charterholder.
Investment in Illiquid Securities
Effective October 1, 2021, the Fund’s limit on illiquid securities will be increased to 15% of the Fund’s total assets. Previously, the Fund was permitted to invest up to 10% of its total assets in illiquid securities. This restriction is measured at the time of investment.
Investment Policy Clarification
The Fund’s investments in securities of real estate companies may also include private real estate investments. Private real estate investments include debt or equity investments in private real estate operating companies that own or manage real estate, privately offered REITs, mortgages secured by commercial or residential real estate, securities issued by real estate companies prior to an IPO, private investments in public equity (PIPEs) and joint ventures which invest in residential and commercial real estate. The Fund expects to invest directly or indirectly in certain real estate and real estate-related investments through one or more private REIT subsidiaries (each, a REIT Subsidiary). The Fund’s private real estate investments may consist of real estate joint ventures where the Fund (generally through the REIT Subsidiary) partners with a real estate operator. These investments may include retail, office, hotel, healthcare, multifamily residential, industrial and other properties. The Investment Manager believes that the REIT Subsidiary will allow it to access more attractive investment opportunities than would otherwise be the case.
56
COHEN & STEERS REIT AND PREFERRED AND INCOME FUND, INC.
Private real estate investments are generally less liquid than public real estate investments and may involve complex investment structures. In addition, private real estate investments may have higher capital requirements and transactions involving this asset class may be more complex than those of public real estate investments. Making private real estate investments involves a high degree of sophistication, and returns are subject to the skill and decision-making process of the Investment Manager, as well as local, regional, and national market conditions. As is common in the real estate industry, many of the Fund’s investments in private real estate will be leveraged. For example, the Fund (through the REIT Subsidiary) expects to make investments in real estate joint ventures which obtain debt financing consisting of property level debt. Property level debt will be secured by real estate owned through the REIT Subsidiary. Typically, these joint venture investments would solely own real estate assets and would borrow from a lender using the owned property as mortgage collateral. If one of the Fund’s investments were to default on a loan, the lender’s recourse would be to the mortgaged property and the lender would typically not have a claim to other assets of the Fund or its subsidiaries. Such property level debt is generally not recourse to the Fund and the Fund will not treat these non-recourse borrowings as senior securities (as defined in the 1940 Act) for purposes of complying with the 1940 Act’s limitations on leverage unless the financial statements of the entity holding such property-level debt are consolidated with the Fund’s financial statements. See “Recourse Financings Risk.” The Fund intends to manage its investments to avoid treating such non-recourse borrowings as senior securities, although there is no guarantee that the Fund will be successful in doing so, and failure to do so may impede the Fund’s ability to achieve its investment objective and decrease returns to shareholders. There is no guarantee that the Fund’s investments will be able to obtain mortgage loans on attractive terms or at all. In certain limited cases, property level debt may be recourse to the Fund. The Fund’s private real estate investments may also include direct or indirect interests in companies or properties with highly leveraged capital structures. The cumulative effect of the use of leverage by the Fund or the real estate investments in which the Fund invests could result in substantial losses, exceeding those that would have been incurred had leverage not been employed. Because of the leveraged nature of the Fund’s private real estate investments, the Fund’s economic exposure to these investments may be greater than the percentage of the Fund’s total assets invested in such investments.
In addition to the risks described under Note 8, including Real Estate Market Risk, REIT Risk, Small- and Medium-Sized Companies Risk, Regulatory Risk and Geopolitical Risk, the Fund’s private real estate investments are also subject to the following risks:
Private Real Estate Risk: The Fund’s investments in private real estate include additional risks. For example, lease defaults, terminations by one or more tenants or landlord-tenant disputes may reduce the Fund’s revenues and net income. Any of these situations may result in extended periods during which there is a significant decline in revenues or no revenues generated by a property. If this occurred, it could adversely affect the Fund’s results of operations.
The Fund’s financial position and its ability to make distributions may also be adversely affected by financial difficulties experienced by any major tenants, including bankruptcy, insolvency or a general downturn in the business, or in the event any major tenants do not renew or extend their relationship as their lease terms expire. A tenant in bankruptcy may be able to restrict the ability to collect unpaid rents or interest during the bankruptcy proceeding. Furthermore, dealing with a tenants’ bankruptcy or other default may divert management’s attention and cause the Fund to incur substantial legal and other costs.
57
COHEN & STEERS REIT AND PREFERRED AND INCOME FUND, INC.
The Fund’s investments in real estate will be pressured in challenging economic and rental market conditions. If the Fund is unable to re-let or renew leases for all or substantially all of the space at these properties, if the rental rates upon such renewal or re-letting are significantly lower than expected, or if the Fund’s reserves for these purposes prove inadequate, the Fund will experience a reduction in net income and may be required to reduce or eliminate cash distributions.
The Fund may obtain only limited warranties when it purchases an equity investment in private commercial real estate. The purchase of properties with limited warranties increases the risk that the Fund may lose some or all of its invested capital in the property, as well as the loss of rental income from that property if an issue should arise that decreases the value of that property and is not covered by the limited warranties. If any of these results occur, it may have a material adverse effect on the Fund’s business, financial condition and results of operations and the Fund’s ability to make distributions.
The Fund’s investments in private real estate may be substantially less liquid than many other securities, such as common stocks or U.S. government securities.
REIT Subsidiary Risk: Investments in the REIT Subsidiary are subject to risks associated with the direct ownership of real estate. The REIT Subsidiary may be affected by changes in the real estate markets generally as well as changes in the values of any properties owned by the REIT Subsidiary or securing any mortgages owned by the REIT Subsidiary (which changes in value could be influenced by market conditions for real estate in general or fluctuations in the value of rights to natural resources appurtenant to the property held by the REIT Subsidiary). If the REIT Subsidiary’s underlying assets are concentrated in properties used by a particular industry, it will be subject to risks associated with such industry. The REIT Subsidiary may be wholly-owned (except for its preferred shareholders) by the Fund, or may be owned by more than one Cohen & Steers closed-end fund.
Restrictions under the Internal Revenue Code applicable to regulated investment companies such as the Fund can limit investments in private real estate, or cause such investments to be structured in a less tax-advantaged manner. The REIT Subsidiary will not be diversified and will be subject to heavy cash flow dependency, possible lack of availability of financing, changes in interest rates, prepayment and defaults by borrowers, self-liquidation, adverse economic conditions, adverse changes in tax laws, and the possibility of failing to maintain an exemption under the 1940 Act. Any rental income or income from the disposition of real estate could adversely affect the REIT Subsidiary’s ability to retain its tax status, which would have adverse tax consequences. The REIT Subsidiary is subject to the risk that it will need to liquidate a holding at an economically inopportune time.
By investing through a REIT Subsidiary, the Fund bears a proportionate share of the fees and expenses of the REIT Subsidiary (including, among other things operating costs, transaction expenses, administrative and custody fees, legal expenses and custody expenses). Thus, investing through a REIT Subsidiary may cause the Fund to be subject to higher operating expenses than if it invested directly.
To the extent the REIT Subsidiary holds mortgages, it will be subject to the following risks: (1) during periods of declining interest rates, mortgagors may be inclined to prepay their mortgages, which prepayment may diminish the yield on securities issued by the REIT Subsidiary; and (2) when interest rates rise, the value of the REIT Subsidiary’s investment in fixed rate obligations can be expected to decline.
58
COHEN & STEERS REIT AND PREFERRED AND INCOME FUND, INC.
The REIT Subsidiary may have limited diversification because it may invest in a limited number of properties, a narrow geographic area, or a single type of property. The REIT Subsidiary will not be traded on a national securities exchange and an investment therein is, therefore, generally less liquid. The REIT Subsidiary may also be difficult to value.
The REIT Subsidiary may be affected by changes in the value of the underlying real property, fluctuations in the demand for real estate, defaults by tenants, and decreases in market rates for rent. To the extent it invests in mortgages or otherwise derives income from the collection of interest payments, the REIT Subsidiary may be affected by the quality of credit extended, prepayments and defaults by borrowers, and changes in market interest rates, and may be more susceptible to interest rate risk.
The REIT Subsidiary likely will depend on its ability to generate cash flow to make distributions to the Fund. The Fund’s investments in the REIT Subsidiary could cause the Fund to recognize income in excess of cash received from those investments and, as a result, the Fund may be required to sell portfolio investments, including when it is not advantageous to do so, in order to make distributions. By investing in the REIT Subsidiary, the Fund is indirectly exposed to risks associated with the REIT Subsidiary’s investments. The REIT Subsidiary may invest in real estate and real estate-related investments through wholly-owned special purpose companies. Because the REIT Subsidiary will not be registered under the 1940 Act, the Fund, as an investor in the REIT Subsidiary, will not have the protections afforded to investors in registered investment companies. Changes in the laws of the United States, under which the Fund and the REIT Subsidiary are organized, including the regulations under the Code, could result in the inability of the Fund and/or the REIT Subsidiary to operate as intended, and could negatively affect the Fund and it shareholders. Ownership of and investment through the REIT Subsidiary by a closed-end management investment company is relatively novel investment strategy. Differences between the statutory and regulatory regimes applicable to a management investment company and a REIT present additional challenges and risks with regard to the REIT Subsidiary’s qualification as a REIT under the Code, which could result in the REIT Subsidiary and the Fund having additional tax liability, and reduce the Fund’s current income.
The REIT Subsidiary could default on its obligations or go bankrupt. The REIT Subsidiary will be operated as a separate company and will observe its own corporate formalities (i.e., it will maintain its own separate books & records, and execute agreements in its own name and on its own behalf).
Accordingly, creditors and other claimants should only be able to look to the REIT Subsidiary and its assets for settlement of their claims against the REIT Subsidiary. Creditors and other claimants against the REIT Subsidiary will not have general recourse against the Fund unless the Fund guarantees the debt or obligations of the REIT Subsidiary. See “Recourse Financings Risk.” The REIT Subsidiary is responsible for its own legal costs in defending against any such claims, but those legal costs may diminish its returns, and thus ultimately diminish returns to Fund shareholders. Although the REIT Subsidiary will be organized so that it is generally responsible for its own debts and obligations, there is no guarantee that creditors and other claimants against the REIT Subsidiary will not try to reach the assets of the Fund, even where there is no legal basis for recourse to the Fund’s assets. The Fund intends to dispute any such claims, but to the extent it does so it may incur legal costs that will diminish its returns to shareholders.
59
COHEN & STEERS REIT AND PREFERRED AND INCOME FUND, INC.
The REIT Subsidiary may use derivatives for speculative or hedging purposes and non-hedging purposes (that is, to seek to increase total return). The REIT Subsidiary may incur leverage for investment or other purposes, which may increase its volatility. The REIT Subsidiary may invest without limitation in restricted and illiquid investments and equity securities without limitation as to market capitalization, including micro-cap companies, the prices of which may be subject to erratic market movements.
As noted above, the REIT Subsidiary may be owned by multiple Cohen & Steers funds, including the Fund. The Investment Manager believes that having multiple funds invest through a single REIT Subsidiary may result in economies of scale for shareholders as expenses will be shared across a larger asset base. However, the use of a shared REIT Subsidiary involves certain risks. Although any funds investing through a shared REIT Subsidiary will have similar investment strategies with respect to private real estate investments and therefore are likely to be aligned with respect to their acquisition, holding and disposition of investments through the REIT Subsidiary, it is possible that the strategies of one fund might change to the extent that it no longer wishes to invest through the REIT Subsidiary. In such a case, its ability to dispose of its interest, and its indirect interest in the private real estate investments held through the REIT Subsidiary, will be limited. Similarly, it is possible that the other fund owners of the REIT Subsidiary may wish to dispose of their interest in the REIT Subsidiary (or interests in the private real estate investments held by the REIT Subsidiary) potentially necessitating a sale of real property investments at a time or price that the Fund believes is disadvantageous. In addition, it is possible that the Fund may be prevented from making investments that would be advantageous to it because the other owners of the REIT Subsidiary do not wish to make such an investment (for example, because of portfolio construction, diversification or other concerns).
Real Estate Joint Venture Risks: The Fund through the REIT Subsidiary may enter into real estate joint ventures with third parties to make investments. The Fund may also make investments in partnerships or other co-ownership arrangements or participations. Such investments may involve risks not otherwise present with other methods of investment, including, for instance, the following risks and conflicts of interest:
| • | the real estate joint venture partner in an investment could become insolvent or bankrupt; |
| • | fraud or other misconduct by the real estate joint venture partner; |
| • | the Fund may share decision-making authority with its real estate joint venture partner regarding certain major decisions affecting the ownership of the real estate joint venture and the joint venture property, such as the sale of the property or the making of additional capital contributions for the benefit of the property, which may prevent the Fund from taking actions that are opposed by its real estate joint venture partner; |
| • | under certain real estate joint venture arrangements, neither party may have the power to unilaterally direct the activities of the venture and, under certain circumstances, an impasse could result regarding cash distributions, reserves, or a proposed sale or refinancing of the investment, and this impasse could have an adverse impact on the real estate joint venture, which could adversely impact the operations and profitability of the real estate joint venture and/or the amount and timing of distributions the Fund receives from the real estate joint venture; |
| • | the real estate joint venture partner may at any time have economic or business interests or goals that are or that become in conflict with the Fund’s business interests or goals, including, for instance, the operation of the properties; |
60
COHEN & STEERS REIT AND PREFERRED AND INCOME FUND, INC.
| • | the real estate joint venture partner may be structured differently than the Fund for tax purposes and this could create conflicts of interest; |
| • | the Fund may rely upon its real estate joint venture partner to manage the day-to-day operations of the real estate joint venture and underlying assets, as well as to prepare financial information for the real estate joint venture and any failure to perform these obligations may have a negative impact on the Fund’s performance and results of operations; |
| • | the real estate joint venture partner may experience a change of control, which could result in new management of the real estate joint venture partner with less experience or conflicting interests to the Fund and be disruptive to the Fund’s business; |
| • | the real estate joint venture partner may be in a position to take action contrary to the Fund’s instructions or requests or contrary to the Fund’s policies or objectives; |
| • | the terms of the real estate joint ventures could restrict the Fund’s ability to sell or transfer its interest to a third party when it desires on advantageous terms, which could result in reduced liquidity; |
| • | the Fund or its real estate joint venture partner may have the right to trigger a buy-sell arrangement, which could cause the Fund to sell its interest, or acquire its partner’s interest, at a time when the Fund otherwise would not have initiated such a transaction; and |
| • | the real estate joint venture partner may not have sufficient personnel or appropriate levels of expertise to adequately support the Fund’s initiatives. |
In addition, disputes between the Fund and its real estate joint venture partner may result in litigation or arbitration that would increase the Fund’s expenses and prevent the Fund’s officers and trustees from focusing their time and efforts on the Fund’s business. Any of the above might subject the Fund to liabilities and thus reduce its returns on the investment with that real estate joint venture partner.
Restricted and Illiquid Securities Risk: The Fund may invest in investments that may be illiquid (i.e., securities that may be difficult to sell at a desirable time or price). Illiquid securities are securities that are not readily marketable and may include some restricted securities, which are securities that may not be resold to the public without an effective registration statement under the Securities Act or, if they are unregistered, may be sold only in a privately negotiated transaction or pursuant to an exemption from registration. Illiquid investments involve the risk that the securities will not be able to be sold at the time desired by the Fund or at prices approximating the value at which the Fund is carrying the securities on its books. Restricted securities and illiquid securities are often more difficult to value and the sale of such securities often requires more time and results in higher brokerage charges or dealer discounts and other selling expenses than does the sale of liquid securities trading on national securities exchanges or in the OTC markets. Contractual restrictions on the resale of securities result from negotiations between the issuer and purchaser of such securities and therefore vary substantially in length and scope. To dispose of a restricted security that the Fund has a contractual right to sell, the Fund may first be required to cause the security to be registered. A considerable period may elapse between a decision to sell the securities and the time when the Fund would be permitted to sell, during which time the Fund would bear market risks.
Recourse Financings Risk: In certain cases, financings for the Fund’s commercial real estate properties may be recourse to the Fund. Generally, commercial real estate financings are structured as non-recourse to the borrower, which limits a lender’s recourse to the property pledged as collateral for the loan, and not the other assets of the borrower or to any parent of borrower, in the event of a loan
61
COHEN & STEERS REIT AND PREFERRED AND INCOME FUND, INC.
default. However, lenders customarily will require that a creditworthy parent entity enter into so-called “recourse carveout” guarantees to protect the lender against certain bad-faith or other intentional acts of the borrower in violation of the loan documents.
Valuation Risk: The Fund is subject to valuation risk, which is the risk that one or more of the assets in which the Fund invests are priced incorrectly, due to factors such as incomplete data, market instability or human error. If the Fund ascribes a higher value to assets and their value subsequently drops or fails to rise because of market factors, returns on the Fund’s investment may be lower than expected and could experience losses.
Within the parameters of the Fund’s valuation guidelines, the valuation methodologies used to value the Fund’s assets, in particular the Fund’s private real estate investments, will involve subjective judgments and projections and that ultimately may not materialize. Ultimate realization of the value of an asset depends to a great extent on economic, market and other conditions beyond the Fund’s control and the control of the Investment Manager and the Fund’s independent valuation firms. Rapidly changing market conditions or material events may not be immediately reflected in our daily NAV.
Real Property Valuation: The Fund intends to retain an independent valuation services firm (the Independent Valuation Advisor) to assist the Investment Manager in the determination of the Funds’ fair value of private real estate investments, including those held through a REIT Subsidiary. While the Independent Valuation Advisor will provide valuations of the real property investments, it is not responsible for, and does not calculate, the Fund’s or REIT Subsidiary’s daily NAV. The Fund’s valuation policies may change from time to time.
The REIT Subsidiary’s real property investments will primarily be through joint ventures with an operating partner. The operating partner will be responsible (subject to oversight by the Investment Manager) for maintaining the joint venture’s official books and records along with other pertinent information that will be the basis upon which the Independent Valuation Advisor will prepare their appraisals as described below.
The Independent Valuation Advisor is expected to administer the real property valuation process for investments held by the REIT Subsidiary and is expected to select (subject to the Investment Manager’s approval) and manage the process associated with third-party appraisal firms with respect to the valuation of the Fund’s real property investments.
Investments in newly acquired properties are expected to be initially valued at cost. Each property is then expected to be valued by an independent third-party appraisal firm within approximately 90 to 120 days after it was acquired and no less than annually thereafter. Each third-party appraisal will be reviewed by the Independent Valuation Advisor and the Valuation Committee for reasonableness.
Each month, the Investment Manager, with the assistance of the Independent Valuation Advisor, will determine an accrual schedule for the daily value of each real property investment based on an estimated month-end income accrual for each real property. The Fund expects that the REIT Subsidiary will use the daily values determined in such accrual schedule for purposes of calculating its NAV. Any material changes to the valuation of real property investments of the REIT Subsidiary, and related changes to the daily accrual schedule for any real property investment, will be reflected in the NAV calculation beginning with the first NAV calculated after a revised valuation is determined and approved by the CNS Valuation Committee.
62
COHEN & STEERS REIT AND PREFERRED AND INCOME FUND, INC.
The Investment Manager will monitor for material events that the Investment Manager believes may be expected to have a material impact on the most recent estimated fair values of such real property investment. Possible examples of such a material change include an unexpected termination or renewal of a material lease, a material change in vacancies, an unanticipated structural or environmental event at a property, capital market events, tenant bankruptcy, recent financial results or changes in the capital structure of the property, terrorism events, natural disasters or other force majeure events, any regulatory changes that affect the investment, or a significant industry event or adjustment to the industry outlook that may cause the value of real property to change materially. Upon the occurrence of such a material event that is likely to have a material impact on the most recent estimated values of the impacted real property investments and provided that the Investment Manager is aware that such event has occurred, the Investment Manager will instruct the Independent Valuation Advisor to evaluate the impact of the event on the fair value of such investment. However, rapidly changing market conditions or material events may not be immediately reflected in the Fund’s or REIT Subsidiary’s daily NAV.
The Investment Manager will value the real properties using the valuation methodology it deems most appropriate and consistent with industry best practices and market conditions. The Investment Manager expects the primary methodology used to value real property investments will be the income approach, whereby value is derived by determining the present value of an asset’s stream of future cash flows (for example, discounted cash flow analysis). Consistent with industry practices, the income approach incorporates actual contractual lease income, professional judgments regarding comparable rental and operating expense data, the capitalization or discount rate and projections of future rent and expenses based on appropriate market evidence, and other subjective factors. Other methodologies that may also be used to value properties include, among other approaches, sales comparisons and cost approaches.
Real estate appraisals are reported on a free and clear basis (i.e. any property-level indebtedness that may be in place is not incorporated into the valuation). Property level debt will be valued separately in accordance with GAAP. Real properties held through joint ventures generally will be valued in a manner that is consistent with the methods described above. Once the value of a real property held by the joint venture and the fair value of any other assets and liabilities of the joint venture is determined, the value of the REIT Subsidiary’s interest in the joint venture would then be determined by the Investment Manager using a hypothetical liquidation calculation to value the REIT Subsidiary’s interest in the joint venture.
APPROVAL OF INVESTMENT MANAGEMENT AGREEMENT
The Board of Directors of the Fund, including a majority of the directors who are not parties to the Fund’s investment management agreement (the Management Agreement), or interested persons of any such party (the Independent Directors), has the responsibility under the Investment Company Act of 1940 to approve the Fund’s Management Agreement for its initial two year term and its continuation annually thereafter at a meeting of the Board of Directors called for the purpose of voting on the approval or continuation. The Management Agreement was discussed at a meeting of the Independent Directors, in their capacity as the Contract Review Committee, held on June 8, 2021 and at meetings of the full Board of Directors held on March 16, 2021 and June 15, 2021. The Independent Directors, in their capacity as the Contract Review Committee, also discussed the Management Agreement in executive session on June 15, 2021. At the meeting of the full Board of Directors on June 15, 2021, the Management Agreement was unanimously continued for a term ending June 30, 2022 by the Fund’s
63
COHEN & STEERS REIT AND PREFERRED AND INCOME FUND, INC.
Board of Directors, including the Independent Directors. The Independent Directors were represented by independent counsel who assisted them in their deliberations during the meetings and executive session.
In considering whether to continue the Management Agreement, the Board of Directors reviewed materials provided by an independent data provider, which included, among other items, fee, expense and performance information compared to peer funds (the Peer Funds and, collectively with the Fund, the Peer Group) and performance comparisons to a larger category universe; summary information prepared by the Fund’s investment manager (the Investment Manager); and a memorandum from counsel to the Independent Directors outlining the legal duties of the Board of Directors. The Board of Directors also spoke directly with representatives of the independent data provider and met with investment management personnel. In addition, the Board of Directors considered information provided from time to time by the Investment Manager throughout the year at meetings of the Board of Directors, including presentations by portfolio managers relating to the investment performance of the Fund and the investment strategies used in pursuing the Fund’s objective. The Board of Directors also considered information provided in response to a request for information submitted by counsel to the Independent Directors, as well as information provided in response to a supplemental request. Additionally, the Independent Directors noted that in connection with their considerations, that they had received information from the Investment Manager about, and discussed with the Investment Manager, the operations of its business continuity plan and related matters and the operations of third party service providers during the COVID-19 pandemic. In particular, the Board of Directors considered the following:
(i) The nature, extent and quality of services to be provided by the Investment Manager: The Board of Directors reviewed the services that the Investment Manager provides to the Fund, including, but not limited to, making the day-to-day investment decisions for the Fund, placing orders for the investment and reinvestment of the Fund’s assets, furnishing information to the Board of Directors of the Fund regarding the Fund’s portfolio, providing individuals to serve as Fund officers, managing the Fund’s debt leverage level, and generally managing the Fund’s investments in accordance with the stated policies of the Fund. The Board of Directors also discussed with officers and portfolio managers of the Fund the types of transactions conducted on behalf of the Fund. Additionally, the Board of Directors took into account the services provided by the Investment Manager to its other funds and accounts, including those that have investment objectives and strategies similar to those of the Fund. The Board of Directors also considered the education, background and experience of the Investment Manager’s personnel, particularly noting the potential benefit that the portfolio managers’ work experience and favorable reputation can have on the Fund. The Board of Directors further noted the Investment Manager’s ability to attract qualified and experienced personnel. The Board of Directors also considered the administrative services provided by the Investment Manager, including compliance and accounting services. After consideration of the above factors, among others, the Board of Directors concluded that the nature, extent and quality of services provided by the Investment Manager are satisfactory and appropriate.
(ii) Investment performance of the Fund and the Investment Manager: The Board of Directors considered the investment performance of the Fund compared to Peer Funds and compared to a relevant linked blended benchmark. The Board of Directors noted that the Fund’s dual focus on REITs and preferred securities is uncommon and as a result, the Peer Funds generally consisted of real-estate only or preferred-only funds, making it difficult to make quantitative comparisons of the Fund’s
64
COHEN & STEERS REIT AND PREFERRED AND INCOME FUND, INC.
performance with that of the Peer Funds. The Board of Directors noted that the Fund outperformed the Peer Group medians for the three-, five- and ten-year periods ended March 31, 2021, ranking the Fund in the first, second and first quintiles, respectively, and underperformed the Peer Group median for the one-year period ended March 31, 2021, ranking the Fund in the fourth quintile. The Fund outperformed the linked blended benchmark for the one-, three-, five- and ten-year periods ended March 31, 2021. The Board of Directors engaged in discussions with the Investment Manager regarding the contributors to and detractors from the Fund’s performance during the period, the relevant implications of the continuing COVID-19 pandemic, as well as the impact of leverage on the Fund’s performance. The Board of Directors also considered supplemental information provided by the Investment Manager, including a narrative summary of various factors affecting performance and the Investment Manager’s performance in managing similarly managed funds and accounts. The Board of Directors determined that Fund performance, in light of all the considerations noted above, supported the continuation of the Management Agreement.
(iii) Cost of the services to be provided and profits to be realized by the Investment Manager from the relationship with the Fund: The Board of Directors considered the contractual and actual management fees paid by the Fund as well as the Fund’s total expense ratios. As part of its analysis, the Board of Directors gave consideration to the fee and expense analyses provided by the independent data provider. The Board of Directors considered that the Fund’s actual management fees at managed and common asset levels are lower than the Peer Group medians, ranking in the first quintile for each. The Board of Directors noted that the Fund’s total expense ratio including investment-related expenses at common asset levels represented the Peer Group median, ranking the Fund in the third quintile. The Fund’s total expense ratio including investment-related expenses at managed asset levels was higher than the Peer Group median, ranking the Fund in the fourth quintile. The Board of Directors also noted that the Fund’s total expense ratios excluding investment-related expenses at managed and common asset levels were lower than the Peer Group medians, ranking in the first quintile for each. The Board of Directors considered the impact of leverage levels on the Fund’s fees and expenses at managed and common asset levels. In light of the considerations above, the Board of Directors concluded that the Fund’s current expense structure was satisfactory.
The Board of Directors also reviewed information regarding the profitability to the Investment Manager of its relationship with the Fund. The Board of Directors considered the level of the Investment Manager’s profits and whether the profits were reasonable for the Investment Manager. The Board of Directors took into consideration other benefits to be derived by the Investment Manager in connection with the Management Agreement, noting particularly the research and related services, within the meaning of Section 28(e) of the Securities Exchange Act of 1934, that the Investment Manager receives by allocating the Fund’s brokerage transactions. The Board of Directors further considered that the Investment Manager continues to reinvest profits back in the business, including upgrading and/or implementing new trading, compliance and accounting systems, and by adding investment personnel to the portfolio management teams. The Board of Directors also considered the administrative services provided by the Investment Manager and the associated administration fee paid to the Investment Manager for such services under the Administration Agreement. The Board of Directors determined that the services received under the Administration Agreement are beneficial to the Fund. The Board of Directors concluded that the profits realized by the Investment Manager from its relationship with the Fund were reasonable and consistent with the Investment Manager’s fiduciary duties.
65
COHEN & STEERS REIT AND PREFERRED AND INCOME FUND, INC.
(iv) The extent to which economies of scale would be realized as the Fund grows and whether fee levels would reflect such economies of scale: The Board of Directors noted that, as a closed-end fund, the Fund would not be expected to have inflows of capital that might produce increasing economies of scale. The Board of Directors determined that, given the Fund’s closed-end structure, there were no significant economies of scale that were not already being shared with shareholders. In considering economies of scale, the Board of Directors also noted, as discussed above in (iii), that the Investment Manager continues to reinvest profits back in the business.
(v) Comparison of services to be rendered and fees to be paid to those under other investment management contracts, such as contracts of the same and other investment advisors or other clients: As discussed above in (iii), the Board of Directors compared the fees paid under the Management Agreement to those under other investment management contracts of other investment advisors managing Peer Funds. The Board of Directors also compared the services rendered and fees paid under the Management Agreement to fees paid, including the ranges of such fees, under the Investment Manager’s other fund management agreements and advisory contracts with institutional and other clients with similar investment mandates, noting that the Investment Manager provides more services to the Fund than it does for institutional or subadvised accounts. The Board of Directors also considered the entrepreneurial risk and financial exposure assumed by the Investment Manager in developing and managing the Fund that the Investment Manager does not have with institutional and other clients and other differences in the management of registered investment companies and institutional accounts. The Board of Directors determined that on a comparative basis the fees under the Management Agreement were reasonable in relation to the services provided.
No single factor was cited as determinative to the decision of the Board of Directors, and each Director may have assigned different weights to the various factors. Rather, after weighing all of the considerations and conclusions discussed above, the Board of Directors, including the Independent Directors, unanimously approved the continuation of the Management Agreement.
66
COHEN & STEERS REIT AND PREFERRED AND INCOME FUND, INC.
Cohen & Steers Privacy Policy
| Facts | What Does Cohen & Steers Do With Your Personal Information? | |
| Why? | Financial companies choose how they share your personal information. Federal law gives consumers the right to limit some but not all sharing. Federal law also requires us to tell you how we collect, share, and protect your personal information. Please read this notice carefully to understand what we do. | |
| What? | The types of personal information we collect and share depend on the product or service you have with us. This information can include:
• Social Security number and account balances
• Transaction history and account transactions
• Purchase history and wire transfer instructions | |
| How? | All financial companies need to share customers’ personal information to run their everyday business. In the section below, we list the reasons financial companies can share their customers’ personal information; the reasons Cohen & Steers chooses to share; and whether you can limit this sharing. | |
| Reasons we can share your personal information | Does Cohen & Steers share? |
Can you limit this sharing? | ||
| For our everyday business purposes— such as to process your transactions, maintain your account(s), respond to court orders and legal investigations, or reports to credit bureaus |
Yes | No | ||
| For our marketing purposes— to offer our products and services to you |
Yes | No | ||
| For joint marketing with other financial companies— | No | We don’t share | ||
| For our affiliates’ everyday business purposes— information about your transactions and experiences |
No | We don’t share | ||
| For our affiliates’ everyday business purposes— information about your creditworthiness |
No | We don’t share | ||
| For our affiliates to market to you— | No | We don’t share | ||
| For non-affiliates to market to you— | No | We don’t share | ||
| Questions? Call 800.330.7348 | ||||
67
COHEN & STEERS REIT AND PREFERRED AND INCOME FUND, INC.
Cohen & Steers Privacy Policy—(Continued)
| Who we are | ||
| Who is providing this notice? | Cohen & Steers Capital Management, Inc., Cohen & Steers Asia Limited, Cohen & Steers Japan Limited, Cohen & Steers UK Limited, Cohen & Steers Ireland Limited, Cohen & Steers Securities, LLC, Cohen & Steers Private Funds and Cohen & Steers Open and Closed-End Funds (collectively, Cohen & Steers). | |
| What we do | ||
| How does Cohen & Steers protect my personal information? | To protect your personal information from unauthorized access and use, we use security measures that comply with federal law. These measures include computer safeguards and secured files and buildings. We restrict access to your information to those employees who need it to perform their jobs, and also require companies that provide services on our behalf to protect your information. | |
| How does Cohen & Steers collect my personal information? | We collect your personal information, for example, when you:
• Open an account or buy securities from us
• Provide account information or give us your contact information
• Make deposits or withdrawals from your account
We also collect your personal information from other companies. | |
| Why can’t I limit all sharing? | Federal law gives you the right to limit only:
• sharing for affiliates’ everyday business purposes—information about your creditworthiness
• affiliates from using your information to market to you
• sharing for non-affiliates to market to you
State law and individual companies may give you additional rights to limit sharing. | |
| Definitions | ||
| Affiliates | Companies related by common ownership or control. They can be financial and nonfinancial companies.
• Cohen & Steers does not share with affiliates. | |
| Non-affiliates | Companies not related by common ownership or control. They can be financial and nonfinancial companies.
• Cohen & Steers does not share with non-affiliates. | |
| Joint marketing | A formal agreement between non-affiliated financial companies that together market financial products or services to you.
• Cohen & Steers does not jointly market. | |
68
COHEN & STEERS REIT AND PREFERRED AND INCOME FUND, INC.
Cohen & Steers Open-End Mutual Funds
Distributed by Cohen & Steers Securities, LLC.
Please consider the investment objectives, risks, charges and expenses of any Cohen & Steers U.S. registered open-end fund carefully before investing. A summary prospectus and prospectus containing this and other information can be obtained by calling 800-330-7348 or by visiting cohenandsteers.com. Please read the summary prospectus and prospectus carefully before investing.
69
COHEN & STEERS REIT AND PREFERRED AND INCOME FUND, INC.
70
eDelivery AVAILABLE
Stop traditional mail delivery;
receive your shareholder reports
and prospectus online.
Sign up at cohenandsteers.com

Cohen & Steers
REIT and
Preferred and
Income Fund (RNP)
Semiannual Report June 30, 2021
As permitted by regulations adopted by the U.S. Securities and Exchange Commission, paper copies of the Fund’s annual and semi-annual shareholder reports are no longer sent by mail, unless you specifically requested paper copies of the reports. Instead, the reports are made available on the Fund’s website at www.cohenandsteers.com, and you will be notified by mail each time a report is posted and provided with a website link to access the report.
If you have already elected to receive shareholder reports electronically, you will not be affected by this change and you need not take any action. You may elect to receive shareholder reports and other communications from a Fund electronically anytime by contacting your financial intermediary or, if you are a direct investor, by signing up at www.cohenandsteers.com.
You may elect to receive all future reports in paper, free of charge, at anytime. If you invest through a financial intermediary, you can contact your financial intermediary or, if you are a direct investor, you can call (866) 227-0757 to let the Fund know you wish to continue receiving paper copies of your shareholder reports. Your election to receive reports in paper will apply to all Funds held in your account if you invest through your financial intermediary or all Funds held within the fund complex if you invest directly with the Fund.
RNPSAR
Item 2. Code of Ethics.
Not applicable.
Item 3. Audit Committee Financial Expert.
Not applicable.
Item 4. Principal Accountant Fees and Services.
Not applicable.
Item 5. Audit Committee of Listed Registrants.
Not applicable.
Item 6. Schedule of Investments.
Included in Item 1 above.
Item 7. Disclosure of Proxy Voting Policies and Procedures for Closed-End Management Investment Companies.
Not applicable.
Item 8. Portfolio Managers of Closed-End Management Investment Companies.
| (a) | Not applicable. |
| (b) | Thomas Bohjalian retired from Cohen & Steers Capital Management, Inc. on June 30, 2021. Effective May 1, 2021, Thomas Bohjalian no longer served as a portfolio manager of the registrant. |
Item 9. Purchases of Equity Securities by Closed-End Management Investment Company and Affiliated Purchasers.
None.
Item 10. Submission of Matters to a Vote of Security Holders.
None.
Item 11. Controls and Procedures.
| (a) | The registrant’s principal executive officer and principal financial officer have concluded that the registrant’s disclosure controls and procedures are reasonably designed to ensure that |
| information required to be disclosed by the registrant in this Form N-CSR was recorded, processed, summarized and reported within the time periods specified in the Securities and Exchange Commission’s rules and forms, based upon such officers’ evaluation of these controls and procedures as of a date within 90 days of the filing date of this report. |
| (b) | There were no changes in the registrant’s internal control over financial reporting that occurred during the period covered by this report that have materially affected, or are reasonably likely to materially affect, the registrant’s internal control over financial reporting. |
Item 12. Disclosure of Securities Lending Activities for Closed-End Management Investment Companies.
| (a) | For the fiscal year ended December 31, 2020, the registrant had the following dollar amounts of income and fees/compensation related to its securities lending activities: |
| Total | ||||
| Gross income from securities lending activities | $489,654 | |||
| Fees and/or compensation for securities lending activities and related services |
||||
| Fees paid to securities lending agent from a revenue split |
409,650 | |||
| Fees paid for cash collateral management services (including fees deducted from a pooled cash collateral reinvestment vehicle) that are not included in the revenue split |
— | |||
|
Administrative fees that are not included in the revenue split |
— | |||
|
Indemnification fee not included in the revenue split |
— | |||
| Rebates paid to borrowers; |
— | |||
| Other fees relating to the securities lending program not included in the revenue split |
— | |||
| Aggregate fees/compensation for securities lending activities and related services | $409,650 | |||
| Net income from securities lending activities | $80,004 | |||
| (b) | During the registrants most recent fiscal year ended December 31, 2020, BNP Paribas (“BNPP”) served as the registrant’s securities lending agent. |
As a securities lending agent, BNPP is responsible for the implementation and administration of the registrant’s securities lending program. Pursuant to its respective Securities Lending Agreement (“Securities Lending Agreement”) with the registrant, BNPP, as a general matter, performs various services, including the following:
| • | Locating borrowers; |
| • | Monitoring daily the value of the loaned securities and collateral (i.e. the collateral posted by the party borrowing); |
| • | Negotiation of loan terms; |
| • | Selection of securities to be loaned; |
| • | Recordkeeping and account servicing; |
| • | Monitoring of dividend activity and material proxy votes relating to loaned securities, and; |
| • | Arranging for return of loaned securities to the registrant at loan termination. |
BNPP is compensated for the above-described services from its securities lending revenue split. The table above shows what the registrant earned and the fees and compensation it paid in connections with its securities lending activities during its most recent fiscal year.
Item 13. Exhibits.
(a)(1) Not applicable.
(a)(3) Not applicable.
(a)(4) Not applicable.
SIGNATURES
Pursuant to the requirements of the Securities Exchange Act of 1934 and the Investment Company Act of 1940, the registrant has duly caused this report to be signed on its behalf by the undersigned, thereunto duly authorized.
COHEN & STEERS REIT AND PREFERRED AND INCOME FUND, INC.
| By: | /s/ Adam M. Derechin | |||
| Name: Adam M. Derechin Title: Principal Executive Officer (President and Chief Executive Officer) | ||||
| Date: | September 3, 2021 | |||
Pursuant to the requirements of the Securities Exchange Act of 1934 and the Investment Company Act of 1940, this report has been signed below by the following persons on behalf of the registrant and in the capacities and on the dates indicated.
| By: | /s/ Adam M. Derechin | |||
| Name: Adam M. Derechin Title: Principal Executive Officer (President and Chief Executive Officer) | ||||
| By: | /s/ James Giallanza | |||
| Name: James Giallanza Title: Principal Financial Officer (Chief Financial Officer) | ||||
| Date: September 3, 2021 | ||||
EX-99.CERT
EXHIBIT 13 (a)(2)
RULE 30a-2(a) CERTIFICATIONS
I, Adam M. Derechin, certify that:
| 1. | I have reviewed this report on Form N-CSR of Cohen & Steers REIT and Preferred and Income Fund, Inc.; |
| 2. | Based on my knowledge, this report does not contain any untrue statement of a material fact or omit to state a material fact necessary to make the statements made, in light of the circumstances under which such statements were made, not misleading with respect to the period covered by this report; |
| 3. | Based on my knowledge, the financial statements, and other financial information included in this report, fairly present in all material respects the financial condition, results of operations, changes in net assets, and cash flows (if the financial statements are required to include a statement of cash flows) of the registrant as of, and for, the periods presented in this report; |
| 4. | The registrant’s other certifying officer and I are responsible for establishing and maintaining disclosure controls and procedures (as defined in Rule 30a-3(c) under the Investment Company Act of 1940) and internal control over financial reporting (as defined in Rule 30a-3(d) under the Investment Company Act of 1940) for the registrant and have: |
| (a) | designed such disclosure controls and procedures, or caused such disclosure controls and procedures to be designed under our supervision, to ensure that material information relating to the registrant, including its consolidated subsidiaries, is made known to us by others within those entities, particularly during the period in which this report is being prepared; |
| (b) | designed such internal control over financial reporting, or caused such internal control over financial reporting to be designed under our supervision, to provide reasonable assurance regarding the reliability of financial reporting and the preparation of financial statements for external purposes in accordance with generally accepted accounting principles; |
| (c) | evaluated the effectiveness of the registrant’s disclosure controls and procedures and presented in this report our conclusions about the effectiveness of the disclosure controls and procedures, as of a date within 90 days prior to the filing date of this report based on such evaluation; and |
| (d) | disclosed in this report any change in the registrant’s internal control over financial reporting that occurred during the period covered by this report that has materially affected, or is reasonably likely to materially affect, the registrant’s internal control over financial reporting; and |
| 5. | The registrant’s other certifying officer and I have disclosed to the registrant’s auditors and the audit committee of the registrant’s board of directors (or persons performing the equivalent functions): |
| (a) | all significant deficiencies and material weaknesses in the design or operation of internal control over financial reporting which are reasonably likely to adversely affect the registrant’s ability to record, process, summarize, and report financial information; and |
| (b) | any fraud, whether or not material, that involves management or other employees who have a significant role in the registrant’s internal control over financial reporting. |
| Date: September 3, 2021 |
| /s/ Adam M. Derechin |
| Adam M. Derechin |
| Principal Executive Officer (President and Chief Executive Officer) |
EX-99.CERT
EXHIBIT 13 (a)(2)
RULE 30a-2(a) CERTIFICATIONS
I, James Giallanza, certify that:
| 1. | I have reviewed this report on Form N-CSR of Cohen & Steers REIT and Preferred and Income Fund, Inc.; |
| 2. | Based on my knowledge, this report does not contain any untrue statement of a material fact or omit to state a material fact necessary to make the statements made, in light of the circumstances under which such statements were made, not misleading with respect to the period covered by this report; |
| 3. | Based on my knowledge, the financial statements, and other financial information included in this report, fairly present in all material respects the financial condition, results of operations, changes in net assets, and cash flows (if the financial statements are required to include a statement of cash flows) of the registrant as of, and for, the periods presented in this report; |
| 4. | The registrant’s other certifying officer and I are responsible for establishing and maintaining disclosure controls and procedures (as defined in Rule 30a-3(c) under the Investment Company Act of 1940) and internal control over financial reporting (as defined in Rule 30a-3(d) under the Investment Company Act of 1940) for the registrant and have: |
| (a) | designed such disclosure controls and procedures, or caused such disclosure controls and procedures to be designed under our supervision, to ensure that material information relating to the registrant, including its consolidated subsidiaries, is made known to us by others within those entities, particularly during the period in which this report is being prepared; |
| (b) | designed such internal control over financial reporting, or caused such internal control over financial reporting to be designed under our supervision, to provide reasonable assurance regarding the reliability of financial reporting and the preparation of financial statements for external purposes in accordance with generally accepted accounting principles; |
| (c) | evaluated the effectiveness of the registrant’s disclosure controls and procedures and presented in this report our conclusions about the effectiveness of the disclosure controls and procedures, as of a date within 90 days prior to the filing date of this report based on such evaluation; and |
| (d) | disclosed in this report any change in the registrant’s internal control over financial reporting that occurred during the period covered by this report that has materially affected, or is reasonably likely to materially affect, the registrant’s internal control over financial reporting; and |
| 5. | The registrant’s other certifying officer and I have disclosed to the registrant’s auditors and the audit committee of the registrant’s board of directors (or persons performing the equivalent functions): |
| (a) | all significant deficiencies and material weaknesses in the design or operation of internal control over financial reporting which are reasonably likely to adversely affect the registrant’s ability to record, process, summarize, and report financial information; and |
| (b) | any fraud, whether or not material, that involves management or other employees who have a significant role in the registrant’s internal control over financial reporting. |
| Date: September 3, 2021 |
| /s/ James Giallanza |
| James Giallanza |
| Principal Financial Officer (Chief Financial Officer) |
EX-99.906CERT
EXHIBIT 13 (b)
RULE 30a-2(b) CERTIFICATIONS
In connection with the report of Cohen & Steers REIT and Preferred and Income Fund, Inc. (the “Company”) on Form N-CSR as filed with the Securities and Exchange Commission on the date hereof (the “Report”), I, Adam M. Derechin, Principal Executive Officer of the Company, certify, pursuant to 18 U.S.C. §1350, as adopted pursuant to Section 906 of the Sarbanes-Oxley Act of 2002, that:
| (1) | The Report fully complies with the requirements of Section 13(a) or 15(d) of the Securities Exchange Act of 1934, as applicable; and |
| (2) | The information contained in the Report fairly presents, in all material respects, the financial condition and results of operations of the Company. |
| /s/ Adam M. Derechin |
| Adam M. Derechin |
| Principal Executive Officer (President and Chief Executive Officer) |
| Date: September 3, 2021 |
EX-99.906CERT
EXHIBIT 13 (b)
RULE 30a-2(b) CERTIFICATIONS
In connection with the report of Cohen & Steers REIT and Preferred and Income Fund, Inc. (the “Company”) on Form N-CSR as filed with the Securities and Exchange Commission on the date hereof (the “Report”), I, James Giallanza, Principal Financial Officer of the Company, certify, pursuant to 18 U.S.C. §1350, as adopted pursuant to Section 906 of the Sarbanes-Oxley Act of 2002, that:
| (1) | The Report fully complies with the requirements of Section 13(a) or 15(d) of the Securities Exchange Act of 1934, as applicable; and |
| (2) | The information contained in the Report fairly presents, in all material respects, the financial condition and results of operations of the Company. |
| /s/ James Giallanza |
| James Giallanza |
| Principal Financial Officer (Chief Financial Officer) |
| Date: September 3, 2021 |
Exhibit 13(c)

Notification of Sources of Distribution
Pursuant to Section 19(a) of the Investment Company Act of 1940
Cohen & Steers REIT and Preferred and Income Fund, Inc. (RNP)
Cohen & Steers REIT and Preferred and Income Fund, Inc. (NYSE: RNP) (the “Fund”), acting in accordance with an exemptive order received from the Securities and Exchange Commission and with approval of its Board of Directors, adopted a managed distribution policy under which the Fund intends to include long-term capital gains, where applicable, as part of the regular monthly cash distributions to its shareholders. This policy will give the Fund greater flexibility to realize long-term capital gains and to distribute those gains on a regular monthly basis.
The Board of Directors of the Fund declared a monthly distribution per share for the month of January 2021. Please review the following information and important disclosures set forth below.
| Amount of Distribution |
Ex-Dividend Date |
Record Date |
Payable Date | |||
| $0.124 | January 12, 2021 | January 13, 2021 | January 29, 2021 |
The following table sets forth the estimated amounts of the current distribution and the cumulative distributions paid this fiscal year-to-date from the sources indicated in the table. All amounts are expressed per common share.
| DISTRIBUTION ESTIMATES | January 2021 | YEAR-TO-DATE (YTD) January 31, 2021* | ||||||
| Source | Per Share Amount |
% of Current Distribution |
Per Share Amount |
% of 2021 Distributions | ||||
|
Net Investment Income |
$0.0000 | 0.00% | $0.0000 | 0.00% | ||||
|
Net Realized Short-Term Capital Gains |
$0.0000 | 0.00% | $0.0000 | 0.00% | ||||
|
Net Realized Long-Term Capital Gains |
$0.1240 | 100.00% | $0.1240 | 100.00% | ||||
| Return of Capital (or other Capital Source) |
$0.0000 | 0.00% | $0.0000 | 0.00% | ||||
|
Total Current Distribution |
$0.1240 | 100.00% | $0.1240 | 100.00% | ||||
You should not draw any conclusions about the Fund’s investment performance from the amount of this distribution or from the terms of the Fund’s managed distribution policy. The amounts and sources of distributions reported in this Notice are only estimates, are likely to change over time, and are not being provided for tax reporting purposes. The actual amounts and sources of the amounts for accounting and tax reporting purposes will depend upon the Fund’s investment experience during the remainder of its fiscal year and may be subject to changes based on tax regulations. The amounts and sources of distributions year-to-date may be subject to additional adjustments.
*THE FUND WILL SEND YOU A FORM 1099-DIV FOR THE CALENDAR YEAR THAT WILL TELL YOU HOW TO REPORT THESE DISTRIBUTIONS FOR FEDERAL INCOME TAX PURPOSES.
The Fund’s Year-to-date Cumulative Total Return for fiscal year 2020 (January 1, 2020 through December 31, 2020) is set forth below. Shareholders should take note of the relationship between the Year-to-date Cumulative Total Return with the Fund’s Cumulative Distribution Rate for 2021. In addition, the Fund’s Average Annual Total Return for the five-year period ending December 31, 2020 is set forth below. Shareholders should note the relationship between the Average Annual Total Return with the Fund’s Current Annualized Distribution Rate for 2021. The performance and distribution rate information disclosed in the table is based on the Fund’s net asset value per share (NAV). The Fund’s NAV is calculated as the total market value of all the securities and other assets held by the Fund minus the total liabilities, divided by the total number of shares outstanding. While NAV performance may be indicative of the Fund’s investment performance, it does not measure the value of a shareholder’s individual investment in the Fund. The value of a shareholder’s investment in the Fund is determined by the Fund’s market price, which is based on the supply and demand for the Fund’s shares in the open market.
280 Park Avenue, New York, NY 10017-1216 Tel: 212.832.3232 Fax: 212-832-3622
Fund Performance and Distribution Rate Information:
| Year-to-date January 1, 2020 to December 31, 2020 | ||
| Year-to-date Cumulative Total Return1 | 2.83% | |
| Cumulative Distribution Rate2 | 0.53% | |
| Five-year period ending December 31, 2020 | ||
| Average Annual Total Return3 | 9.52% | |
|
Current Annualized Distribution Rate4 |
6.30% | |
| 1. | Year-to-date Cumulative Total Return is the percentage change in the Fund’s NAV over the year-to-date time period including distributions paid and assuming reinvestment of those distributions. |
| 2. | Cumulative Distribution Rate for the Fund’s current fiscal period (January 1, 2021 through January 31, 2021) measured on the dollar value of distributions in the year-to-date period as a percentage of the Fund’s NAV as of December 31, 2020. |
| 3. | Average Annual Total Return represents the compound average of the Annual NAV Total Returns of the Fund for the five-year period ending December 31, 2020. Annual NAV Total Return is the percentage change in the Fund’s NAV over a year including distributions paid and assuming reinvestment of those distributions. |
| 4. | The Current Annualized Distribution Rate is the current fiscal period’s distribution rate annualized as a percentage of the Fund’s NAV as of December 31, 2020. |
This Fund has a managed distribution policy that seeks to deliver the Fund’s long term total return potential through regular monthly distributions declared at a fixed rate per share. Distributions may be paid in part or in full from net investment income, realized capital gains and by returning capital, or a combination thereof. Shareholders should note, however, that if the Fund’s aggregate net investment income and net realized capital gains are less than the amount of the distribution level, the difference will be distributed from the Fund’s assets and will constitute a return of the shareholder’s capital. A return of capital is not taxable; rather it reduces a shareholder’s tax basis in his or her shares of the Fund. The Board of Directors of the Fund may amend, terminate or suspend the managed distribution policy at any time, which could have an adverse effect on the market price of the Fund’s shares.
Shareholders should not use the information provided in preparing their tax returns. Shareholders will receive a Form 1099-DIV for the calendar year indicating how to report fund distributions for federal income tax purposes.
Exhibit 13(c)
Notification of Sources of Distribution
Pursuant to Section 19(a) of the Investment Company Act of 1940
Cohen & Steers REIT and Preferred and Income Fund, Inc. (RNP)
Cohen & Steers REIT and Preferred and Income Fund, Inc. (NYSE: RNP) (the “Fund”), acting in accordance with an exemptive order received from the Securities and Exchange Commission and with approval of its Board of Directors, adopted a managed distribution policy under which the Fund intends to include long-term capital gains, where applicable, as part of the regular monthly cash distributions to its shareholders. This policy will give the Fund greater flexibility to realize long-term capital gains and to distribute those gains on a regular monthly basis.
The Board of Directors of the Fund declared a monthly distribution per share for the month of February 2021. Please review the following information and important disclosures set forth below.
| Amount of Distribution |
Ex-Dividend Date |
Record Date |
Payable Date | |||
| $0.124 | February 9, 2021 | February 10, 2021 | February 26, 2021 |
The following table sets forth the estimated amounts of the current distribution and the cumulative distributions paid this fiscal year-to-date from the sources indicated in the table. All amounts are expressed per common share.
| DISTRIBUTION ESTIMATES | February 2021 | YEAR-TO-DATE (YTD) February 28, 2021* | ||||||
| Source | Per Share Amount |
% of Current Distribution |
Per Share Amount |
% of 2021 Distributions | ||||
|
Net Investment Income |
$0.0000 | 0.00% | $0.0000 | 0.00% | ||||
|
Net Realized Short-Term Capital Gains |
$0.0000 | 0.00% | $0.0000 | 0.00% | ||||
|
Net Realized Long-Term Capital Gains |
$0.1240 | 100.00% | $0.2480 | 100.00% | ||||
| Return of Capital (or other Capital Source) |
$0.0000 | 0.00% | $0.0000 | 0.00% | ||||
|
Total Current Distribution |
$0.1240 | 100.00% | $0.2480 | 100.00% | ||||
You should not draw any conclusions about the Fund’s investment performance from the amount of this distribution or from the terms of the Fund’s managed distribution policy. The amounts and sources of distributions reported in this Notice are only estimates, are likely to change over time, and are not being provided for tax reporting purposes. The actual amounts and sources of the amounts for accounting and tax reporting purposes will depend upon the Fund’s investment experience during the remainder of its fiscal year and may be subject to changes based on tax regulations. The amounts and sources of distributions year-to-date may be subject to additional adjustments.
*THE FUND WILL SEND YOU A FORM 1099-DIV FOR THE CALENDAR YEAR THAT WILL TELL YOU HOW TO REPORT THESE DISTRIBUTIONS FOR FEDERAL INCOME TAX PURPOSES.
The Fund’s Year-to-date Cumulative Total Return for fiscal year 2021 (January 1, 2021 through January 31, 2021) is set forth below. Shareholders should take note of the relationship between the Year-to-date Cumulative Total Return with the Fund’s Cumulative Distribution Rate for 2021. In addition, the Fund’s Average Annual Total Return for the five-year period ending January 31, 2021 is set forth below. Shareholders should note the relationship between the Average Annual Total Return with the Fund’s Current Annualized Distribution Rate for 2021. The performance and distribution rate information disclosed in the table is based on the Fund’s net asset value per share (NAV). The Fund’s NAV is calculated as the total market value of all the securities and other assets held by the Fund minus the total liabilities, divided by the total number of shares outstanding. While NAV performance may be indicative of the Fund’s investment performance, it does not measure the value of a shareholder’s individual investment in the Fund. The value of a shareholder’s investment in the Fund is determined by the Fund’s market price, which is based on the supply and demand for the Fund’s shares in the open market.
280 Park Avenue, New York, NY 10017-1216 Tel: 212.832.3232 Fax: 212-832-3622
Fund Performance and Distribution Rate Information:
| Year-to-date January 1, 2021 to January 31, 2021 | ||
| Year-to-date Cumulative Total Return1 | -1.03% | |
| Cumulative Distribution Rate2 | 1.07% | |
| Five-year period ending January 31, 2021 | ||
| Average Annual Total Return3 | 9.77% | |
|
Current Annualized Distribution Rate4 |
6.40% | |
| 1. | Year-to-date Cumulative Total Return is the percentage change in the Fund’s NAV over the year-to-date time period including distributions paid and assuming reinvestment of those distributions. |
| 2. | Cumulative Distribution Rate for the Fund’s current fiscal period (January 1, 2021 through February 28, 2021) measured on the dollar value of distributions in the year-to-date period as a percentage of the Fund’s NAV as of January 31, 2021. |
| 3. | Average Annual Total Return represents the compound average of the Annual NAV Total Returns of the Fund for the five-year period ending January 31, 2021.Annual NAV Total Return is the percentage change in the Fund’s NAV over a year including distributions paid and assuming reinvestment of those distributions. |
| 4. | The Current Annualized Distribution Rate is the current fiscal period’s distribution rate annualized as a percentage of the Fund’s NAV as of January 31, 2021. |
This Fund has a managed distribution policy that seeks to deliver the Fund’s long term total return potential through regular monthly distributions declared at a fixed rate per share. Distributions may be paid in part or in full from net investment income, realized capital gains and by returning capital, or a combination thereof. Shareholders should note, however, that if the Fund’s aggregate net investment income and net realized capital gains are less than the amount of the distribution level, the difference will be distributed from the Fund’s assets and will constitute a return of the shareholder’s capital. A return of capital is not taxable; rather it reduces a shareholder’s tax basis in his or her shares of the Fund. The Board of Directors of the Fund may amend, terminate or suspend the managed distribution policy at any time, which could have an adverse effect on the market price of the Fund’s shares.
Shareholders should not use the information provided in preparing their tax returns. Shareholders will receive a Form 1099-DIV for the calendar year indicating how to report fund distributions for federal income tax purposes.
Exhibit 13(c)
Notification of Sources of Distribution
Pursuant to Section 19(a) of the Investment Company Act of 1940
Cohen & Steers REIT and Preferred and Income Fund, Inc. (RNP)
Cohen & Steers REIT and Preferred and Income Fund, Inc. (NYSE: RNP) (the “Fund”), acting in accordance with an exemptive order received from the Securities and Exchange Commission and with approval of its Board of Directors, adopted a managed distribution policy under which the Fund intends to include long-term capital gains, where applicable, as part of the regular monthly cash distributions to its shareholders. This policy will give the Fund greater flexibility to realize long-term capital gains and to distribute those gains on a regular monthly basis.
The Board of Directors of the Fund declared a monthly distribution per share for the month of March 2021. Please review the following information and important disclosures set forth below.
| Amount of Distribution |
Ex-Dividend Date |
Record Date |
Payable Date | |||
| $0.124 | March 16, 2021 | March 17, 2021 | March 31, 2021 |
The following table sets forth the estimated amounts of the current distribution and the cumulative distributions paid this fiscal year-to-date from the sources indicated in the table. All amounts are expressed per common share.
| DISTRIBUTION ESTIMATES | March 2021 | YEAR-TO-DATE (YTD) March 31, 2021* | ||||||
| Source | Per Share Amount |
% of Current Distribution |
Per Share Amount |
% of 2021 Distributions | ||||
|
Net Investment Income |
$0.0000 | 0.00% | $0.0000 | 0.00% | ||||
|
Net Realized Short-Term Capital Gains |
$0.0000 | 0.00% | $0.0000 | 0.00% | ||||
|
Net Realized Long-Term Capital Gains |
$0.1240 | 100.00% | $0.3720 | 100.00% | ||||
| Return of Capital (or other Capital Source) |
$0.0000 | 0.00% | $0.0000 | 0.00% | ||||
|
Total Current Distribution |
$0.1240 | 100.00% | $0.3720 | 100.00% | ||||
You should not draw any conclusions about the Fund’s investment performance from the amount of this distribution or from the terms of the Fund’s managed distribution policy. The amounts and sources of distributions reported in this Notice are only estimates, are likely to change over time, and are not being provided for tax reporting purposes. The actual amounts and sources of the amounts for accounting and tax reporting purposes will depend upon the Fund’s investment experience during the remainder of its fiscal year and may be subject to changes based on tax regulations. The amounts and sources of distributions year-to-date may be subject to additional adjustments.
*THE FUND WILL SEND YOU A FORM 1099-DIV FOR THE CALENDAR YEAR THAT WILL TELL YOU HOW TO REPORT THESE DISTRIBUTIONS FOR FEDERAL INCOME TAX PURPOSES.
The Fund’s Year-to-date Cumulative Total Return for fiscal year 2021 (January 1, 2021 through February 28, 2021) is set forth below. Shareholders should take note of the relationship between the Year-to-date Cumulative Total Return with the Fund’s Cumulative Distribution Rate for 2021. In addition, the Fund’s Average Annual Total Return for the five-year period ending February 28, 2021 is set forth below. Shareholders should note the relationship between the Average Annual Total Return with the Fund’s Current Annualized Distribution Rate for 2021. The performance and distribution rate information disclosed in the table is based on the Fund’s net asset value per share (NAV). The Fund’s NAV is calculated as the total market value of all the securities and other assets held by the Fund minus the total liabilities, divided by the total number of shares outstanding. While NAV performance may be indicative of the Fund’s investment performance, it does not measure the value of a shareholder’s individual investment in the Fund. The value of a shareholder’s investment in the Fund is determined by the Fund’s market price, which is based on the supply and demand for the Fund’s shares in the open market.
280 Park Avenue, New York, NY 10017-1216 Tel: 212.832.3232 Fax: 212-832-3622
Fund Performance and Distribution Rate Information:
| Year-to-date January 1, 2021 to February 28, 2021 | ||
| Year-to-date Cumulative Total Return1 | 1.42% | |
| Cumulative Distribution Rate2 | 1.57% | |
| Five-year period ending February 28, 2021 | ||
| Average Annual Total Return3 | 10.67% | |
|
Current Annualized Distribution Rate4 |
6.28% | |
| 1. | Year-to-date Cumulative Total Return is the percentage change in the Fund’s NAV over the year-to-date time period including distributions paid and assuming reinvestment of those distributions. |
| 2. | Cumulative Distribution Rate for the Fund’s current fiscal period (January 1, 2021 through March 31, 2021) measured on the dollar value of distributions in the year-to-date period as a percentage of the Fund’s NAV as of February 28, 2021. |
| 3. | Average Annual Total Return represents the compound average of the Annual NAV Total Returns of the Fund for the five-year period ending February 28, 2021.Annual NAV Total Return is the percentage change in the Fund’s NAV over a year including distributions paid and assuming reinvestment of those distributions. |
| 4. | The Current Annualized Distribution Rate is the current fiscal period’s distribution rate annualized as a percentage of the Fund’s NAV as of February 28, 2021. |
This Fund has a managed distribution policy that seeks to deliver the Fund’s long term total return potential through regular monthly distributions declared at a fixed rate per share. Distributions may be paid in part or in full from net investment income, realized capital gains and by returning capital, or a combination thereof. Shareholders should note, however, that if the Fund’s aggregate net investment income and net realized capital gains are less than the amount of the distribution level, the difference will be distributed from the Fund’s assets and will constitute a return of the shareholder’s capital. A return of capital is not taxable; rather it reduces a shareholder’s tax basis in his or her shares of the Fund. The Board of Directors of the Fund may amend, terminate or suspend the managed distribution policy at any time, which could have an adverse effect on the market price of the Fund’s shares.
Shareholders should not use the information provided in preparing their tax returns. Shareholders will receive a Form 1099-DIV for the calendar year indicating how to report fund distributions for federal income tax purposes.
Exhibit 13(c)
Notification of Sources of Distribution
Pursuant to Section 19(a) of the Investment Company Act of 1940
Cohen & Steers REIT and Preferred and Income Fund, Inc. (RNP)
Cohen & Steers REIT and Preferred and Income Fund, Inc. (NYSE: RNP) (the “Fund”), acting in accordance with an exemptive order received from the Securities and Exchange Commission and with approval of its Board of Directors, adopted a managed distribution policy under which the Fund intends to include long-term capital gains, where applicable, as part of the regular monthly cash distributions to its shareholders. This policy will give the Fund greater flexibility to realize long-term capital gains and to distribute those gains on a regular monthly basis.
The Board of Directors of the Fund declared a monthly distribution per share for the month of April 2021. Please review the following information and important disclosures set forth below.
| Amount of Distribution |
Ex-Dividend Date |
Record Date |
Payable Date | |||
| $0.124 | April 13, 2021 | April 14, 2021 | April 30, 2021 |
The following table sets forth the estimated amounts of the current distribution and the cumulative distributions paid this fiscal year-to-date from the sources indicated in the table. All amounts are expressed per common share.
| DISTRIBUTION ESTIMATES | April 2021 | YEAR-TO-DATE (YTD) April 30, 2021* | ||||||
| Source | Per Share Amount |
% of Current Distribution |
Per Share Amount |
% of 2021 Distributions | ||||
|
Net Investment Income |
$0.0000 | 0.00% | $0.0000 | 0.00% | ||||
|
Net Realized Short-Term Capital Gains |
$0.0000 | 0.00% | $0.0000 | 0.00% | ||||
|
Net Realized Long-Term Capital Gains |
$0.1240 | 100.00% | $0.4960 | 100.00% | ||||
| Return of Capital (or other Capital Source) |
$0.0000 | 0.00% | $0.0000 | 0.00% | ||||
|
Total Current Distribution |
$0.1240 | 100.00% | $0.4960 | 100.00% | ||||
You should not draw any conclusions about the Fund’s investment performance from the amount of this distribution or from the terms of the Fund’s managed distribution policy. The amounts and sources of distributions reported in this Notice are only estimates, are likely to change over time, and are not being provided for tax reporting purposes. The actual amounts and sources of the amounts for accounting and tax reporting purposes will depend upon the Fund’s investment experience during the remainder of its fiscal year and may be subject to changes based on tax regulations. The amounts and sources of distributions year-to-date may be subject to additional adjustments.
*THE FUND WILL SEND YOU A FORM 1099-DIV FOR THE CALENDAR YEAR THAT WILL TELL YOU HOW TO REPORT THESE DISTRIBUTIONS FOR FEDERAL INCOME TAX PURPOSES.
The Fund’s Year-to-date Cumulative Total Return for fiscal year 2021 (January 1, 2021 through March 31, 2021) is set forth below. Shareholders should take note of the relationship between the Year-to-date Cumulative Total Return with the Fund’s Cumulative Distribution Rate for 2021. In addition, the Fund’s Average Annual Total Return for the five-year period ending March 31, 2021 is set forth below. Shareholders should note the relationship between the Average Annual Total Return with the Fund’s Current Annualized Distribution Rate for 2021. The performance and distribution rate information disclosed in the table is based on the Fund’s net asset value per share (NAV). The Fund’s NAV is calculated as the total market value of all the securities and other assets held by the Fund minus the total liabilities, divided by the total number of shares outstanding. While NAV performance may be indicative of the Fund’s investment performance, it does not measure the value of a shareholder’s individual investment in the Fund. The value of a shareholder’s investment in the Fund is determined by the Fund’s market price, which is based on the supply and demand for the Fund’s shares in the open market.
280 Park Avenue, New York, NY 10017-1216 Tel: 212.832.3232 Fax: 212-832-3622
Fund Performance and Distribution Rate Information:
| Year-to-date January 1, 2021 to March 31, 2021 | ||
| Year-to-date Cumulative Total Return1 | 5.98% | |
| Cumulative Distribution Rate2 | 2.01% | |
| Five-year period ending March 31, 2021 | ||
| Average Annual Total Return3 | 9.86% | |
|
Current Annualized Distribution Rate4 |
6.04% | |
| 1. | Year-to-date Cumulative Total Return is the percentage change in the Fund’s NAV over the year-to-date time period including distributions paid and assuming reinvestment of those distributions. |
| 2. | Cumulative Distribution Rate for the Fund’s current fiscal period (January 1, 2021 through April 30, 2021) measured on the dollar value of distributions in the year-to-date period as a percentage of the Fund’s NAV as of March 31, 2021. |
| 3. | Average Annual Total Return represents the compound average of the Annual NAV Total Returns of the Fund for the five-year period ending March 31, 2021.Annual NAV Total Return is the percentage change in the Fund’s NAV over a year including distributions paid and assuming reinvestment of those distributions. |
| 4. | The Current Annualized Distribution Rate is the current fiscal period’s distribution rate annualized as a percentage of the Fund’s NAV as of March 31, 2021. |
This Fund has a managed distribution policy that seeks to deliver the Fund’s long term total return potential through regular monthly distributions declared at a fixed rate per share. Distributions may be paid in part or in full from net investment income, realized capital gains and by returning capital, or a combination thereof. Shareholders should note, however, that if the Fund’s aggregate net investment income and net realized capital gains are less than the amount of the distribution level, the difference will be distributed from the Fund’s assets and will constitute a return of the shareholder’s capital. A return of capital is not taxable; rather it reduces a shareholder’s tax basis in his or her shares of the Fund. The Board of Directors of the Fund may amend, terminate or suspend the managed distribution policy at any time, which could have an adverse effect on the market price of the Fund’s shares.
Shareholders should not use the information provided in preparing their tax returns. Shareholders will receive a Form 1099-DIV for the calendar year indicating how to report fund distributions for federal income tax purposes.
Exhibit 13(c)
Notification of Sources of Distribution
Pursuant to Section 19(a) of the Investment Company Act of 1940
Cohen & Steers REIT and Preferred and Income Fund, Inc. (RNP)
Cohen & Steers REIT and Preferred and Income Fund, Inc. (NYSE: RNP) (the “Fund”), acting in accordance with an exemptive order received from the Securities and Exchange Commission and with approval of its Board of Directors, adopted a managed distribution policy under which the Fund intends to include long-term capital gains, where applicable, as part of the regular monthly cash distributions to its shareholders. This policy will give the Fund greater flexibility to realize long-term capital gains and to distribute those gains on a regular monthly basis.
The Board of Directors of the Fund declared a monthly distribution per share for the month of May 2021. Please review the following information and important disclosures set forth below.
| Amount of Distribution |
Ex-Dividend Date |
Record Date |
Payable Date | |||
| $0.124 | May 11, 2021 | May 12, 2021 | May 28, 2021 |
The following table sets forth the estimated amounts of the current distribution and the cumulative distributions paid this fiscal year-to-date from the sources indicated in the table. All amounts are expressed per common share.
| DISTRIBUTION ESTIMATES | May 2021 | YEAR-TO-DATE (YTD) May 31, 2021* | ||||||
| Source | Per Share Amount |
% of Current Distribution |
Per Share Amount |
% of 2021 Distributions | ||||
|
Net Investment Income |
$0.0000 | 0.00% | $0.0000 | 0.00% | ||||
|
Net Realized Short-Term Capital Gains |
$0.0000 | 0.00% | $0.0000 | 0.00% | ||||
|
Net Realized Long-Term Capital Gains |
$0.1240 | 100.00% | $0.6200 | 100.00% | ||||
| Return of Capital (or other Capital Source) |
$0.0000 | 0.00% | $0.0000 | 0.00% | ||||
|
Total Current Distribution |
$0.1240 | 100.00% | $0.6200 | 100.00% | ||||
You should not draw any conclusions about the Fund’s investment performance from the amount of this distribution or from the terms of the Fund’s managed distribution policy. The amounts and sources of distributions reported in this Notice are only estimates, are likely to change over time, and are not being provided for tax reporting purposes. The actual amounts and sources of the amounts for accounting and tax reporting purposes will depend upon the Fund’s investment experience during the remainder of its fiscal year and may be subject to changes based on tax regulations. The amounts and sources of distributions year-to-date may be subject to additional adjustments.
*THE FUND WILL SEND YOU A FORM 1099-DIV FOR THE CALENDAR YEAR THAT WILL TELL YOU HOW TO REPORT THESE DISTRIBUTIONS FOR FEDERAL INCOME TAX PURPOSES.
The Fund’s Year-to-date Cumulative Total Return for fiscal year 2021 (January 1, 2021 through April 30, 2021) is set forth below. Shareholders should take note of the relationship between the Year-to-date Cumulative Total Return with the Fund’s Cumulative Distribution Rate for 2021. In addition, the Fund’s Average Annual Total Return for the five-year period ending April 30, 2021 is set forth below. Shareholders should note the relationship between the Average Annual Total Return with the Fund’s Current Annualized Distribution Rate for 2021. The performance and distribution rate information disclosed in the table is based on the Fund’s net asset value per share (NAV). The Fund’s NAV is calculated as the total market value of all the securities and other assets held by the Fund minus the total liabilities, divided by the total number of shares outstanding. While NAV performance may be indicative of the Fund’s investment performance, it does not measure the value of a shareholder’s individual investment in the Fund. The value of a shareholder’s investment in the Fund is determined by the Fund’s market price, which is based on the supply and demand for the Fund’s shares in the open market.
280 Park Avenue, New York, NY 10017-1216 Tel: 212.832.3232 Fax: 212-832-3622
Fund Performance and Distribution Rate Information:
| Year-to-date January 1, 2021 to April 30, 2021 | ||
| Year-to-date Cumulative Total Return1 | 13.53% | |
| Cumulative Distribution Rate2 | 2.36% | |
| Five-year period ending April 30, 2021 | ||
| Average Annual Total Return3 | 11.63% | |
|
Current Annualized Distribution Rate4 |
5.67% | |
| 1. | Year-to-date Cumulative Total Return is the percentage change in the Fund’s NAV over the year-to-date time period including distributions paid and assuming reinvestment of those distributions. |
| 2. | Cumulative Distribution Rate for the Fund’s current fiscal period (January 1, 2021 through May 31, 2021) measured on the dollar value of distributions in the year-to-date period as a percentage of the Fund’s NAV as of April 30, 2021. |
| 3. | Average Annual Total Return represents the compound average of the Annual NAV Total Returns of the Fund for the five-year period ending April 30, 2021.Annual NAV Total Return is the percentage change in the Fund’s NAV over a year including distributions paid and assuming reinvestment of those distributions. |
| 4. | The Current Annualized Distribution Rate is the current fiscal period’s distribution rate annualized as a percentage of the Fund’s NAV as of April 30, 2021. |
This Fund has a managed distribution policy that seeks to deliver the Fund’s long term total return potential through regular monthly distributions declared at a fixed rate per share. Distributions may be paid in part or in full from net investment income, realized capital gains and by returning capital, or a combination thereof. Shareholders should note, however, that if the Fund’s aggregate net investment income and net realized capital gains are less than the amount of the distribution level, the difference will be distributed from the Fund’s assets and will constitute a return of the shareholder’s capital. A return of capital is not taxable; rather it reduces a shareholder’s tax basis in his or her shares of the Fund. The Board of Directors of the Fund may amend, terminate or suspend the managed distribution policy at any time, which could have an adverse effect on the market price of the Fund’s shares.
Shareholders should not use the information provided in preparing their tax returns. Shareholders will receive a Form 1099-DIV for the calendar year indicating how to report fund distributions for federal income tax purposes.
Exhibit 13(c)
Notification of Sources of Distribution
Pursuant to Section 19(a) of the Investment Company Act of 1940
Cohen & Steers REIT and Preferred and Income Fund, Inc. (RNP)
Cohen & Steers REIT and Preferred and Income Fund, Inc. (NYSE: RNP) (the “Fund”), acting in accordance with an exemptive order received from the Securities and Exchange Commission and with approval of its Board of Directors, adopted a managed distribution policy under which the Fund intends to include long-term capital gains, where applicable, as part of the regular monthly cash distributions to its shareholders. This policy will give the Fund greater flexibility to realize long-term capital gains and to distribute those gains on a regular monthly basis.
The Board of Directors of the Fund declared a monthly distribution per share for the month of June 2021. Please review the following information and important disclosures set forth below.
| Amount of Distribution |
Ex-Dividend Date |
Record Date |
Payable Date | |||
| $0.124 | June 15, 2021 | June 16, 2021 | June 30, 2021 |
The following table sets forth the estimated amounts of the current distribution and the cumulative distributions paid this fiscal year-to-date from the sources indicated in the table. All amounts are expressed per common share.
| DISTRIBUTION ESTIMATES | June 2021 | YEAR-TO-DATE (YTD) June 30, 2021* | ||||||
| Source | Per Share Amount |
% of Current Distribution |
Per Share Amount |
% of 2021 Distributions | ||||
|
Net Investment Income |
$0.0000 | 0.00% | $0.0000 | 0.00% | ||||
|
Net Realized Short-Term Capital Gains |
$0.0000 | 0.00% | $0.0000 | 0.00% | ||||
|
Net Realized Long-Term Capital Gains |
$0.1240 | 100.00% | $0.7440 | 100.00% | ||||
| Return of Capital (or other Capital Source) |
$0.0000 | 0.00% | $0.0000 | 0.00% | ||||
|
Total Current Distribution |
$0.1240 | 100.00% | $0.7440 | 100.00% | ||||
You should not draw any conclusions about the Fund’s investment performance from the amount of this distribution or from the terms of the Fund’s managed distribution policy. The amounts and sources of distributions reported in this Notice are only estimates, are likely to change over time, and are not being provided for tax reporting purposes. The actual amounts and sources of the amounts for accounting and tax reporting purposes will depend upon the Fund’s investment experience during the remainder of its fiscal year and may be subject to changes based on tax regulations. The amounts and sources of distributions year-to-date may be subject to additional adjustments.
*THE FUND WILL SEND YOU A FORM 1099-DIV FOR THE CALENDAR YEAR THAT WILL TELL YOU HOW TO REPORT THESE DISTRIBUTIONS FOR FEDERAL INCOME TAX PURPOSES.
The Fund’s Year-to-date Cumulative Total Return for fiscal year 2021 (January 1, 2021 through May 31, 2021) is set forth below. Shareholders should take note of the relationship between the Year-to-date Cumulative Total Return with the Fund’s Cumulative Distribution Rate for 2021. In addition, the Fund’s Average Annual Total Return for the five-year period ending May 31, 2021 is set forth below. Shareholders should note the relationship between the Average Annual Total Return with the Fund’s Current Annualized Distribution Rate for 2021. The performance and distribution rate information disclosed in the table is based on the Fund’s net asset value per share (NAV). The Fund’s NAV is calculated as the total market value of all the securities and other assets held by the Fund minus the total liabilities, divided by the total number of shares outstanding. While NAV performance may be indicative of the Fund’s investment performance, it does not measure the value of a shareholder’s individual investment in the Fund. The value of a shareholder’s investment in the Fund is determined by the Fund’s market price, which is based on the supply and demand for the Fund’s shares in the open market.
280 Park Avenue, New York, NY 10017-1216 Tel: 212.832.3232 Fax: 212-832-3622
Fund Performance and Distribution Rate Information:
| Year-to-date January 1, 2021 to May 31, 2021 | ||
| Year-to-date Cumulative Total Return1 | 13.97% | |
| Cumulative Distribution Rate2 | 2.84% | |
| Five-year period ending May 31, 2021 | ||
| Average Annual Total Return3 | 11.19% | |
|
Current Annualized Distribution Rate4 |
5.67% | |
| 1. | Year-to-date Cumulative Total Return is the percentage change in the Fund’s NAV over the year-to-date time period including distributions paid and assuming reinvestment of those distributions. |
| 2. | Cumulative Distribution Rate for the Fund’s current fiscal period (January 1, 2021 through June 30, 2021) measured on the dollar value of distributions in the year-to-date period as a percentage of the Fund’s NAV as of May 31, 2021. |
| 3. | Average Annual Total Return represents the compound average of the Annual NAV Total Returns of the Fund for the five-year period ending May 31, 2021.Annual NAV Total Return is the percentage change in the Fund’s NAV over a year including distributions paid and assuming reinvestment of those distributions. |
| 4. | The Current Annualized Distribution Rate is the current fiscal period’s distribution rate annualized as a percentage of the Fund’s NAV as of May 31, 2021. |
This Fund has a managed distribution policy that seeks to deliver the Fund’s long term total return potential through regular monthly distributions declared at a fixed rate per share. Distributions may be paid in part or in full from net investment income, realized capital gains and by returning capital, or a combination thereof. Shareholders should note, however, that if the Fund’s aggregate net investment income and net realized capital gains are less than the amount of the distribution level, the difference will be distributed from the Fund’s assets and will constitute a return of the shareholder’s capital. A return of capital is not taxable; rather it reduces a shareholder’s tax basis in his or her shares of the Fund. The Board of Directors of the Fund may amend, terminate or suspend the managed distribution policy at any time, which could have an adverse effect on the market price of the Fund’s shares.
Shareholders should not use the information provided in preparing their tax returns. Shareholders will receive a Form 1099-DIV for the calendar year indicating how to report fund distributions for federal income tax purposes.
Serious News for Serious Traders! Try StreetInsider.com Premium Free!
You May Also Be Interested In
- CIDARA Therapeutics ALERT: Bragar Eagel & Squire, P.C. is Investigating Cidara Therapeutics, Inc. on Behalf of Cidara Therapeutics Stockholders and Encourages Investors to Contact the Firm
- ROSEN, A TOP RANKED LAW FIRM, Encourages CI&T Inc Investors to Inquire About Securities Class Action Investigation – CINT
- GLOBAL CORD ALERT: Bragar Eagel & Squire, P.C. Announces that a Class Action Lawsuit Has Been Filed Against Global Cord Blood Corporation and Encourages Investors to Contact the Firm
Create E-mail Alert Related Categories
SEC FilingsSign up for StreetInsider Free!
Receive full access to all new and archived articles, unlimited portfolio tracking, e-mail alerts, custom newswires and RSS feeds - and more!
