

Form N-CSRS BLACKROCK MUNIYIELD PENN For: Jan 31
 Tweet
Tweet Share
ShareUNITED STATES
SECURITIES AND EXCHANGE COMMISSION
Washington, D.C. 20549
FORM N-CSR
CERTIFIED SHAREHOLDER REPORT OF REGISTERED MANAGEMENT
INVESTMENT COMPANIES
Investment Company Act file number: 811-07136
| Name of Fund: | BlackRock MuniYield Pennsylvania Quality Fund (MPA) |
| Fund Address: | 100 Bellevue Parkway, Wilmington, DE 19809 |
Name and address of agent for service: John M. Perlowski, Chief Executive Officer, BlackRock MuniYield Pennsylvania Quality Fund, 55 East 52nd Street, New York, NY 10055
Registrant’s telephone number, including area code: (800) 882-0052, Option 4
Date of fiscal year end: 07/31/2021
Date of reporting period: 01/31/2021
Item 1 – Report to Stockholders
(a) The Report to Shareholders is attached herewith.
|
|
JANUARY 31, 2021 |

| 2021 Semi-Annual Report (Unaudited)
| ||
BlackRock MuniHoldings California Quality Fund, Inc. (MUC)
BlackRock MuniHoldings New Jersey Quality Fund, Inc. (MUJ)
BlackRock MuniYield Investment Quality Fund (MFT)
BlackRock MuniYield Michigan Quality Fund, Inc. (MIY)
BlackRock MuniYield Pennsylvania Quality Fund (MPA)
|
Not FDIC Insured • May Lose Value • No Bank Guarantee
|


| 2 | T H I S P A G E I S N O T P A R T O F Y O U R F U N D R E P O R T |
| Page | ||
| 2 | ||
| Semi-Annual Report: |
||
| 4 | ||
| 5 | ||
| 5 | ||
| 6 | ||
| Financial Statements: |
||
| 21 | ||
| 49 | ||
| 51 | ||
| 53 | ||
| 56 | ||
| 58 | ||
| 63 | ||
| 73 | ||
| 76 |
| 3 |
| Municipal Market Overview For the Reporting Period Ended January 31, 2021 |
Municipal Market Conditions
Municipal bonds posted positive total returns during the period amid increased volatility. Initial strong performance reversed abruptly as a result of the COVID-19 pandemic induced economic shutdown. Performance plummeted -10.87% during a two-week period in March 2020, before rebounding on valuation-based buying. (For comparison, the -11.86% correction in 2008 spanned more than a month.) Fiscal stimulus, monetary policy accommodation, and the partial re-opening of the economy combined to stabilize the market and drive strong performance throughout the summer months. Performance briefly stalled on U.S. election uncertainty, but more recently benefited from a favorable technical backdrop, vaccine optimism, and expectation for additional fiscal aid from the newly unified Democratic government.
| Strong technical support during most of the period temporarily waned as COVID-19 fears spurred risk-off sentiment resulting in record outflows. During the 12 months ended January 31, 2021, municipal bond funds experienced net inflows totaling $40 billion, drawn down by nearly $46 billion in outflows during the months of March and April 2020 (based on data from the Investment Company Institute). For the same 12-month period, new issuance was robust at $448 billion but slowed during the height of the pandemic |
|
S&P Municipal Bond Index Total Returns as of January 31, 2021 6 months: 2.06% 12 months: 3.85% | ||
| as market liquidity became constrained amid the flight to quality. Taxable municipal issuance was elevated as issuers increasingly advance refunded tax-exempt debt in the taxable municipal market for cost savings. | ||||
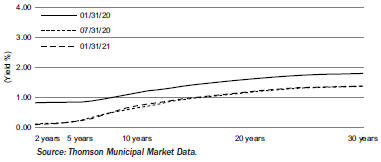
A Closer Look at Yields
AAA Municipal Yield Curves
|
|
|
From January 31, 2020 to January 31, 2021, yields on AAA-rated 30-year municipal bonds decreased by 42 basis points (“bps”) from 1.80% to 1.38%, while ten-year rates decreased by 43 bps from 1.15% to 0.72% and five-year rates decreased by 62 bps from 0.84% to 0.22% (as measured by Thomson Municipal Market Data). As a result, the municipal yield curve bull steepened over the 12-month period with the spread between two- and 30-year maturities steepening by 30 bps, lagging the 106 bps of steepening experienced in the U.S. Treasury curve.
After dislocating at the height of the pandemic, consistent municipal outperformance in the intermediate and long-end of the curve has resulted in extremely rich valuations with ten- and 30-year municipal-to-Treasury ratios at all-time tights. |
Financial Conditions of Municipal Issuers
The COVID-19 pandemic has been an unprecedented shock to the system impacting nearly every sector in the municipal market. Fortunately, most states and municipalities were in excellent fiscal health before the crisis, and the federal government is poised to provide another massive federal aid injection. Direct state and local government aid will provide additional support to own-source government tax receipts, which have outperformed the dire predictions made earlier in 2020. Essential public services such as power, water, and sewer remain protected segments. State housing authority bonds, flagship universities, and strong national and regional health systems have absorbed the impact of the economic shock. While some segments face daunting financial challenges, the combination of new federal stimulus and vaccine distribution should augment economic activity and, consequently, bolster revenue receipts in these sectors as well. Critical providers (safety net hospitals, mass transit systems, airports) with limited resources may still experience fiscal strain, but the additional aid and the re-opening of the economy should bring better operating results in the second half of 2021. BlackRock anticipates that a small subset of the market, mainly non-rated stand-alone projects, will remain susceptible to credit deterioration. Again, however, the effective vaccine regimen and prospects for improved distribution suggest that a rebound in economic activity could reduce the number of potential defaults in riskier non-rated credits. While credit fundamentals are expected to improve noticeably across the municipal space, BlackRock advocates careful credit selection as the market must still navigate near-term uncertainty.
The opinions expressed are those of BlackRock as of January 31, 2021 and are subject to change at any time due to changes in market or economic conditions. The comments should not be construed as a recommendation of any individual holdings or market sectors. Investing involves risk including loss of principal. Bond values fluctuate in price so the value of your investment can go down depending on market conditions. Fixed income risks include interest-rate and credit risk. Typically, when interest rates rise, there is a corresponding decline in bond values. Credit risk refers to the possibility that the bond issuer will not be able to make principal and interest payments. There may be less information on the financial condition of municipal issuers than for public corporations. The market for municipal bonds may be less liquid than for taxable bonds. Some investors may be subject to Alternative Minimum Tax (“AMT”). Capital gains distributions, if any, are taxable.
The S&P Municipal Bond Index, a broad, market value-weighted index, seeks to measure the performance of the U.S. municipal bond market. All bonds in the index are exempt from U.S. federal income taxes or subject to the AMT. Past performance is not an indication of future results. Index performance is shown for illustrative purposes only. It is not possible to invest directly in an index.
| 4 | 2 0 2 1 B L A C K R O C K S E M I - A N N U A L R E P O R T T O S H A R E H O L D E R S |
| The Benefits and Risks of Leveraging |
The Funds may utilize leverage to seek to enhance the distribution rate on, and net asset value (“NAV”) of, their common shares (“Common Shares”). However, there is no guarantee that these objectives can be achieved in all interest rate environments.
In general, the concept of leveraging is based on the premise that the financing cost of leverage, which is based on short-term interest rates, is normally lower than the income earned by a Fund on its longer-term portfolio investments purchased with the proceeds from leverage. To the extent that the total assets of each Fund (including the assets obtained from leverage) are invested in higher-yielding portfolio investments, each Fund’s shareholders benefit from the incremental net income. The interest earned on securities purchased with the proceeds from leverage (after paying the leverage costs) is paid to shareholders in the form of dividends, and the value of these portfolio holdings (less the leverage liability) is reflected in the per share NAV.
To illustrate these concepts, assume a Fund’s Common Shares capitalization is $100 million and it utilizes leverage for an additional $30 million, creating a total value of $130 million available for investment in longer-term income securities. If prevailing short-term interest rates are 3% and longer-term interest rates are 6%, the yield curve has a strongly positive slope. In this case, a Fund’s financing costs on the $30 million of proceeds obtained from leverage are based on the lower short-term interest rates. At the same time, the securities purchased by a Fund with the proceeds from leverage earn income based on longer-term interest rates. In this case, a Fund’s financing cost of leverage is significantly lower than the income earned on a Fund’s longer-term investments acquired from such leverage proceeds, and therefore the holders of Common Shares (“Common Shareholders”) are the beneficiaries of the incremental net income.
However, in order to benefit Common Shareholders, the return on assets purchased with leverage proceeds must exceed the ongoing costs associated with the leverage. If interest and other costs of leverage exceed a Fund’s return on assets purchased with leverage proceeds, income to shareholders is lower than if a Fund had not used leverage. Furthermore, the value of the Funds’ portfolio investments generally varies inversely with the direction of long-term interest rates, although other factors can influence the value of portfolio investments. In contrast, the value of each Fund’s obligations under its respective leverage arrangement generally does not fluctuate in relation to interest rates. As a result, changes in interest rates can influence the Funds’ NAVs positively or negatively. Changes in the future direction of interest rates are very difficult to predict accurately, and there is no assurance that a Fund’s intended leveraging strategy will be successful.
The use of leverage also generally causes greater changes in each Fund’s NAV, market price and dividend rates than comparable portfolios without leverage. In a declining market, leverage is likely to cause a greater decline in the NAV and market price of a Fund’s Common Shares than if the Fund were not leveraged. In addition, each Fund may be required to sell portfolio securities at inopportune times or at distressed values in order to comply with regulatory requirements applicable to the use of leverage or as required by the terms of leverage instruments, which may cause the Fund to incur losses. The use of leverage may limit a Fund’s ability to invest in certain types of securities or use certain types of hedging strategies. Each Fund incurs expenses in connection with the use of leverage, all of which are borne by Common Shareholders and may reduce income to the Common Shares. Moreover, to the extent the calculation of each Fund’s investment advisory fees includes assets purchased with the proceeds of leverage, the investment advisory fees payable to the Funds’ investment adviser will be higher than if the Funds did not use leverage.
To obtain leverage, each Fund has issued Variable Rate Demand Preferred Shares (“VRDP Shares”) or Variable Rate Muni Term Preferred Shares (“VMTP Shares”) (collectively, “Preferred Shares”) and/or leveraged its assets through the use of tender option bond trusts (“TOB Trusts”) as described in the Notes to Financial Statements.
Under the Investment Company Act of 1940, as amended (the “1940 Act”), each Fund is permitted to issue debt up to 33 1/3% of its total managed assets or equity securities (e.g., Preferred Shares) up to 50% of its total managed assets. A Fund may voluntarily elect to limit its leverage to less than the maximum amount permitted under the 1940 Act. In addition, a Fund may also be subject to certain asset coverage, leverage or portfolio composition requirements imposed by the Preferred Shares’ governing instruments or by agencies rating the Preferred Shares, which may be more stringent than those imposed by the 1940 Act.
If a Fund segregates or designates on its books and records cash or liquid assets having a value not less than the value of a Fund’s obligations under the TOB Trust (including accrued interest), then the TOB Trust is not considered a senior security and is not subject to the foregoing limitations and requirements imposed by the 1940 Act.
Derivative Financial Instruments
The Funds may invest in various derivative financial instruments. These instruments are used to obtain exposure to a security, commodity, index, market, and/or other assets without owning or taking physical custody of securities, commodities and/or other referenced assets or to manage market, equity, credit, interest rate, foreign currency exchange rate, commodity and/or other risks. Derivative financial instruments may give rise to a form of economic leverage and involve risks, including the imperfect correlation between the value of a derivative financial instrument and the underlying asset, possible default of the counterparty to the transaction or illiquidity of the instrument. The Funds’ successful use of a derivative financial instrument depends on the investment adviser’s ability to predict pertinent market movements accurately, which cannot be assured. The use of these instruments may result in losses greater than if they had not been used, may limit the amount of appreciation a Fund can realize on an investment and/or may result in lower distributions paid to shareholders. The Funds’ investments in these instruments, if any, are discussed in detail in the Notes to Financial Statements.
| T H E B E N E F I T S A N D R I S K S O F L E V E R A G I N G / D E R I V A T I V E F I N A N C I A L I N S T R U M E N T S |
5 |
| Fund Summary as of January 31, 2021 | BlackRock MuniHoldings California Quality Fund, Inc. (MUC) |
Investment Objective
BlackRock MuniHoldings California Quality Fund, Inc.’s (MUC) (the “Fund”) investment objective is to provide shareholders with current income exempt from U.S. federal income taxes and California personal income taxes. The Fund seeks to achieve its investment objective by investing primarily in municipal obligations exempt from U.S. federal income taxes (except that the interest may be subject to the U.S. federal alternative minimum tax) and California personal income taxes. Under normal market conditions, the Fund invests at least 80% of its assets in investment grade municipal obligations with remaining maturities of one year or more at the time of investment. The municipal obligations in which the Fund primarily invests are either rated investment grade quality, or are considered by the Fund’s investment adviser to be of comparable quality, at the time of investment. The Fund may invest up to 20% of its managed assets in securities that are rated below investment grade, or are considered by the Fund’s investment adviser to be of comparable quality, at the time of purchase. The Fund may invest directly in securities or synthetically through the use of derivatives.
No assurance can be given that the Fund’s investment objective will be achieved.
Fund Information
| Symbol on New York Stock Exchange |
MUC | |
| Initial Offering Date |
February 27, 1998 | |
| Yield on Closing Market Price as of January 31, 2021 ($15.00)(a) |
4.40% | |
| Tax Equivalent Yield(b) |
9.59% | |
| Current Monthly Distribution per Common Share(c) |
$0.0550 | |
| Current Annualized Distribution per Common Share(c) |
$0.6600 | |
| Leverage as of January 31, 2021(d) |
38% | |
| (a) | Yield on closing market price is calculated by dividing the current annualized distribution per share by the closing market price. Past performance is not an indication of future results. |
| (b) | Tax equivalent yield assumes the maximum marginal U.S. federal and state tax rate of 54.1%, which includes the 3.8% Medicare tax. Actual tax rates will vary based on income, exemptions and deductions. Lower taxes will result in lower tax equivalent yields. |
| (c) | The distribution rate is not constant and is subject to change. |
| (d) | Represents VMTP Shares and TOB Trusts as a percentage of total managed assets, which is the total assets of the Fund, including any assets attributable to VMTP Shares and TOB Trusts, minus the sum of its accrued liabilities. Does not reflect derivatives or other instruments that may give rise to economic leverage. For a discussion of leveraging techniques utilized by the Fund, please see The Benefits and Risks of Leveraging and Derivative Financial Instruments. |
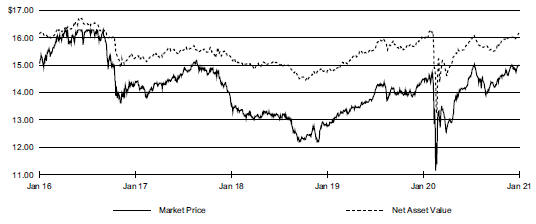
Market Price and Net Asset Value Per Share Summary
| 01/31/21 | 07/31/20 | Change | High | Low | ||||||||||||||||
| Market Price |
$ | 15.00 | $ | 14.67 | 2.25 | % | $ | 15.09 | $ | 13.79 | ||||||||||
| Net Asset Value |
16.16 | 15.95 | 1.32 | 16.16 | 15.50 | |||||||||||||||
Market Price and Net Asset Value History for the Past Five Years
| 6 | 2 0 2 1 B L A C K R O C K S E M I - A N N U A L R E P O R T T O S H A R E H O L D E R S |
| Fund Summary as of January 31, 2021 (continued) | BlackRock MuniHoldings California Quality Fund, Inc. (MUC) |
Performance
Returns for the six months ended January 31, 2021 were as follows:
| Returns Based On | ||||||||
| Market Price | NAV | |||||||
| MUC(a)(b) |
4.52 | % | 3.57 | % | ||||
| Lipper California Municipal Debt Funds(c) |
3.82 | 3.45 | ||||||
| (a) | All returns reflect reinvestment of dividends and/or distributions at actual reinvestment prices. Performance results reflect the Fund’s use of leverage. |
| (b) | The Fund’s discount to NAV narrowed during the period, which accounts for the difference between performance based on market price and performance based on NAV. |
| (c) | Average return. Returns reflect reinvestment of dividends and/or distributions at NAV on the ex-dividend date as calculated by Lipper. |
Performance results may include adjustments made for financial reporting purposes in accordance with U.S. generally accepted accounting principles.
Past performance is not an indication of future results.
More information about the Fund’s historical performance can be found in the “Closed End Funds” section of blackrock.com.
The following discussion relates to the Fund’s absolute performance based on NAV:
Municipal bonds delivered positive returns in the six-month period. Although U.S. Treasury yields moved higher (as prices fell), the tax-exempt market posted a gain due to a decline in yield spreads. Investors grew increasingly optimistic about the economic outlook for 2021, particularly after the approval of a vaccine for COVID-19 in early November 2020. Inflows into the market were consistent and traditional tax-exempt supply trended lower, creating a positive supply-and-demand dynamic that aided performance.
Despite the challenges to state and local budgets from COVID-19, California’s credit quality held up well across most sectors. The potential for higher federal tax rates in the future, together with investors’ ongoing demand for income, created a favorable technical backdrop for tax-exempt munis in high-tax states such as California. With that said, adverse population and business migration trends bear watching.
Positions in bonds with maturities of 20 years and above benefited performance, as longer-term debt outpaced short-term issues. The Fund was also helped by its positions in high yield and BBB rated securities, particularly its holdings in the tobacco sector and Puerto Rico sales tax debt.
The Fund’s use of leverage, which augmented income and amplified the effect of rising prices, was a further contributor. The Fund actively sought to manage interest rate risk using U.S. Treasury futures. Since U.S. Treasury yields rose, as prices fell, this strategy contributed to results.
Reinvestment risk remained a headwind since the proceeds from bonds that matured or were called needed to be reinvested at lower yields compared with bonds that were issued when yields were higher.
The views expressed reflect the opinions of BlackRock as of the date of this report and are subject to change based on changes in market, economic or other conditions. These views are not intended to be a forecast of future events and are no guarantee of future results.
| F U N D S U M M A R Y |
7 |
| Fund Summary as of January 31, 2021 (continued) | BlackRock MuniHoldings California Quality Fund, Inc. (MUC) |
Overview of the Fund’s Total Investments
| (a) | Excludes short-term securities. |
| (b) | For Fund compliance purposes, the Fund’s sector classifications refer to one or more of the sector sub-classifications used by one or more widely recognized market indexes or rating group indexes, and/or as defined by the investment adviser. These definitions may not apply for purposes of this report, which may combine such sector sub-classifications for reporting ease. |
| (c) | Rounds to less than 1% of total investments. |
| (d) | Scheduled maturity dates and/or bonds that are subject to potential calls by issuers over the next five years. |
| (e) | For financial reporting purposes, credit quality ratings shown above reflect the highest rating assigned by either S&P Global Ratings or Moody’s Investors Service, Inc. if ratings differ. These rating agencies are independent, nationally recognized statistical rating organizations and are widely used. Investment grade ratings are credit ratings of BBB/Baa or higher. Below investment grade ratings are credit ratings of BB/Ba or lower. Investments designated N/R are not rated by either rating agency. Unrated investments do not necessarily indicate low credit quality. Credit quality ratings are subject to change. |
| (f) | The investment adviser evaluates the credit quality of unrated investments based upon certain factors including, but not limited to, credit ratings for similar investments and financial analysis of sectors and individual investments. Using this approach, the investment adviser has deemed certain of these unrated securities as investment grade quality. As of January 31, 2021 and July 31, 2020, the market value of unrated securities deemed by the investment adviser to be investment grade each represents less than 1% of the Fund’s total investments. |
| 8 | 2 0 2 1 B L A C K R O C K S E M I - A N N U A L R E P O R T T O S H A R E H O L D E R S |
| Fund Summary as of January 31, 2021 | BlackRock MuniHoldings New Jersey Quality Fund, Inc. (MUJ) |
Investment Objective
BlackRock MuniHoldings New Jersey Quality Fund, Inc.’s (MUJ) (the “Fund”) investment objective is to provide shareholders with current income exempt from U.S. federal income tax and New Jersey personal income taxes. The Fund seeks to achieve its investment objective by investing primarily in long-term, investment grade municipal obligations exempt from U.S federal income taxes (except that the interest may be subject to the U.S. federal alternative minimum tax) and New Jersey personal income taxes. The municipal obligations in which the Fund primarily invests are either rated investment grade quality, or are considered by the Fund’s investment adviser to be of comparable quality, at the time of investment. Under normal market conditions, the Fund invests at least 80% of its assets in municipal obligations with remaining maturities of one year or more at the time of investment. The Fund may invest up to 20% of its managed assets in securities that are rated below investment grade, or are considered by the Fund’s investment adviser to be of comparable quality, at the time of purchase. The Fund may invest directly in securities or synthetically through the use of derivatives.
No assurance can be given that the Fund’s investment objective will be achieved.
Fund Information
| Symbol on New York Stock Exchange |
MUJ | |
| Initial Offering Date |
March 11, 1998 | |
| Yield on Closing Market Price as of January 31, 2021 ($14.46)(a) |
5.23% | |
| Tax Equivalent Yield(b) |
10.79% | |
| Current Monthly Distribution per Common Share(c) |
$0.0630 | |
| Current Annualized Distribution per Common Share(c) |
$0.7560 | |
| Leverage as of January 31, 2021(d) |
38% | |
| (a) | Yield on closing market price is calculated by dividing the current annualized distribution per share by the closing market price. Past performance is not an indication of future results. |
| (b) | Tax equivalent yield assumes the maximum marginal U.S. federal and state tax rate of 51.55%, which includes the 3.8% Medicare tax. Actual tax rates will vary based on income, exemptions and deductions. Lower taxes will result in lower tax equivalent yields. |
| (c) | The distribution rate is not constant and is subject to change. |
| (d) | Represents VRDP Shares and TOB Trusts as a percentage of total managed assets, which is the total assets of the Fund, including any assets attributable to VRDP Shares and TOB Trusts, minus the sum of its accrued liabilities. Does not reflect derivatives or other instruments that may give rise to economic leverage. For a discussion of leveraging techniques utilized by the Fund, please see The Benefits and Risks of Leveraging and Derivative Financial Instruments. |
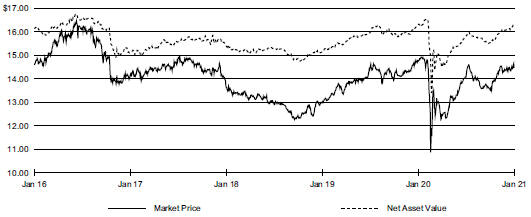
Market Price and Net Asset Value Per Share Summary
| 01/31/21 | 07/31/20 | Change | High | Low | ||||||||||||||||
| Market Price |
$ | 14.46 | $ | 14.21 | 1.76 | % | $ | 14.66 | $ | 13.51 | ||||||||||
| Net Asset Value |
16.28 | 15.83 | 2.84 | 16.28 | 15.50 | |||||||||||||||
Market Price and Net Asset Value History for the Past Five Years
| F U N D S U M M A R Y |
9 |
| Fund Summary as of January 31, 2021 (continued) | BlackRock MuniHoldings New Jersey Quality Fund, Inc. (MUJ) |
Performance
Returns for the six months ended January 31, 2021 were as follows:
| Returns Based On | ||||||||
| Market Price | NAV | |||||||
| MUJ(a)(b) |
4.43 | % | 5.54 | % | ||||
| Lipper New Jersey Municipal Debt Funds(c) |
5.39 | 4.81 | ||||||
| (a) | All returns reflect reinvestment of dividends and/or distributions at actual reinvestment prices. Performance results reflect the Fund’s use of leverage. |
| (b) | The Fund’s discount to NAV widened during the period, which accounts for the difference between performance based on market price and performance based on NAV. |
| (c) | Average return. Returns reflect reinvestment of dividends and/or distributions at NAV on the ex-dividend date as calculated by Lipper. |
Performance results may include adjustments made for financial reporting purposes in accordance with U.S. generally accepted accounting principles.
Past performance is not an indication of future results.
More information about the Fund’s historical performance can be found in the “Closed End Funds” section of blackrock.com.
The following discussion relates to the Fund’s absolute performance based on NAV:
Municipal bonds delivered positive returns in the six-month period. Although U.S. Treasury yields moved higher (as prices fell), the tax-exempt market posted a gain due to a decline in yield spreads. Investors grew increasingly optimistic about the economic outlook for 2021, particularly after the approval of a vaccine for COVID-19 in early November 2020. Inflows into the market were consistent and traditional tax-exempt supply trended lower, creating a positive supply-and-demand dynamic that aided performance.
New Jersey tax-backed bonds outperformed the national market. Credit spreads tightened during the period due to elevated investor demand for higher yielding investment-grade bonds, coupled with tax revenues that were more resilient than expected.
High yield municipal bonds outperformed the broader market, led by more liquid tobacco and Puerto Rico bonds. The state tax-backed sector—which benefited from the strength in both the state of New Jersey and Puerto Rico bonds—was the primary contributor. The transportation also contributed, but to a lesser extent. Positions in A and BBB rated bonds were the largest contributors on a ratings basis. At a time in which longer-maturity bonds outperformed short-term issues, the Fund’s holdings in bonds with maturities of 20 years and above further helped performance.
The Fund’s use of leverage, which augmented income and amplified the effect of rising prices, was a further contributor. The Fund actively sought to manage interest rate risk using U.S. Treasury futures. Since U.S. Treasury yields rose, as prices fell, this strategy contributed to results.
Reinvestment risk remained a headwind since the proceeds from bonds that matured or were called needed to be reinvested at lower yields compared with bonds that were issued when yields were higher.
The views expressed reflect the opinions of BlackRock as of the date of this report and are subject to change based on changes in market, economic or other conditions. These views are not intended to be a forecast of future events and are no guarantee of future results.
| 10 | 2 0 2 1 B L A C K R O C K S E M I - A N N U A L R E P O R T T O S H A R E H O L D E R S |
| Fund Summary as of January 31, 2021 (continued) | BlackRock MuniHoldings New Jersey Quality Fund, Inc. (MUJ) |
Overview of the Fund’s Total Investments
| (a) | Excludes short-term securities. |
| (b) | For Fund compliance purposes, the Fund’s sector classifications refer to one or more of the sector sub-classifications used by one or more widely recognized market indexes or rating group indexes, and/or as defined by the investment adviser. These definitions may not apply for purposes of this report, which may combine such sector sub-classifications for reporting ease. |
| (c) | Scheduled maturity dates and/or bonds that are subject to potential calls by issuers over the next five years. |
| (d) | For financial reporting purposes, credit quality ratings shown above reflect the highest rating assigned by either S&P Global Ratings or Moody’s Investors Service, Inc. if ratings differ. These rating agencies are independent, nationally recognized statistical rating organizations and are widely used. Investment grade ratings are credit ratings of BBB/Baa or higher. Below investment grade ratings are credit ratings of BB/Ba or lower. Investments designated N/R are not rated by either rating agency. Unrated investments do not necessarily indicate low credit quality. Credit quality ratings are subject to change. |
| (e) | Rounds to less than 1% of total investments. |
| (f) | The investment adviser evaluates the credit quality of unrated investments based upon certain factors including, but not limited to, credit ratings for similar investments and financial analysis of sectors and individual investments. Using this approach, the investment adviser has deemed certain of these unrated securities as investment grade quality. As of January 31, 2021 and July 31, 2020, the market value of unrated securities deemed by the investment adviser to be investment grade each represents less than 1% of the Fund’s total investments. |
| F U N D S U M M A R Y |
11 |
| Fund Summary as of January 31, 2021 | BlackRock MuniYield Investment Quality Fund (MFT) |
Investment Objective
BlackRock MuniYield Investment Quality Fund’s (MFT) (the “Fund”) investment objective is to provide shareholders with as high a level of current income exempt from U.S. federal income taxes as is consistent with its investment policies and prudent investment management. The Fund seeks to achieve its investment objective by investing at least 80% of its assets in municipal obligations exempt from U.S. federal income taxes (except that the interest may be subject to the U.S. federal alternative minimum tax). Under normal market conditions, the Fund invests primarily in long-term municipal obligations that are investment grade quality, or are considered by the Fund’s investment adviser to be of comparable quality, at the time of investment. The Fund may invest up to 20% of its managed assets in securities that are rated below investment grade, or are considered by the Fund’s investment adviser to be of comparable quality, at the time of purchase. The Fund may invest directly in securities or synthetically through the use of derivatives.
On June 16, 2020, the Board of Trustees of MFT and the Board of Trustees of BlackRock Municipal Income Trust II (BLE) each approved the reorganization of MFT into BLE. The reorganization was approved by each Fund’s shareholders and is expected to occur during the second quarter of 2021, subject to the satisfaction of customary closing conditions.
No assurance can be given that the Fund’s investment objective will be achieved.
Fund Information
| Symbol on New York Stock Exchange |
MFT | |
| Initial Offering Date |
October 30, 1992 | |
| Yield on Closing Market Price as of January 31, 2021 ($14.52)(a) |
4.96% | |
| Tax Equivalent Yield(b) |
8.38% | |
| Current Monthly Distribution per Common Share(c) |
$0.0600 | |
| Current Annualized Distribution per Common Share(c) |
$0.7200 | |
| Leverage as of January 31, 2021(d) |
40% | |
| (a) | Yield on closing market price is calculated by dividing the current annualized distribution per share by the closing market price. Past performance is not an indication of future results. |
| (b) | Tax equivalent yield assumes the maximum marginal U.S. federal tax rate of 40.8%, which includes the 3.8% Medicare tax. Actual tax rates will vary based on income, exemptions and deductions. Lower taxes will result in lower tax equivalent yields. |
| (c) | The distribution rate is not constant and is subject to change. |
| (d) | Represents VMTP Shares and TOB Trusts as a percentage of total managed assets, which is the total assets of the Fund, including any assets attributable to VMTP Shares and TOB Trusts, minus the sum of its accrued liabilities. Does not reflect derivatives or other instruments that may give rise to economic leverage. For a discussion of leveraging techniques utilized by the Fund, please see The Benefits and Risks of Leveraging. |
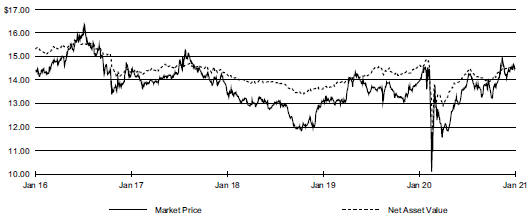
Market Price and Net Asset Value Per Share Summary
| 01/31/21 | 07/31/20 | Change | High | Low | ||||||||||||||||
| Market Price |
$ | 14.52 | $ | 13.97 | 3.94 | % | $ | 15.00 | $ | 13.17 | ||||||||||
| Net Asset Value |
14.69 | 14.37 | 2.23 | 14.69 | 13.94 | |||||||||||||||
Market Price and Net Asset Value History for the Past Five Years
| 12 | 2 0 2 1 B L A C K R O C K S E M I - A N N U A L R E P O R T T O S H A R E H O L D E R S |
| Fund Summary as of January 31, 2021 (continued) | BlackRock MuniYield Investment Quality Fund (MFT) |
Performance
Returns for the six months ended January 31, 2021 were as follows:
| Returns Based On | ||||||||
| Market Price | NAV | |||||||
| MFT(a)(b) |
6.57 | % | 4.82 | % | ||||
| Lipper General & Insured Municipal Debt Funds (Leveraged)(c) |
6.44 | 5.39 | ||||||
| (a) | All returns reflect reinvestment of dividends and/or distributions at actual reinvestment prices. Performance results reflect the Fund’s use of leverage. |
| (b) | The Fund’s discount to NAV narrowed during the period, which accounts for the difference between performance based on market price and performance based on NAV. |
| (c) | Average return. Returns reflect reinvestment of dividends and/or distributions at NAV on the ex-dividend date as calculated by Lipper. |
Performance results may include adjustments made for financial reporting purposes in accordance with U.S. generally accepted accounting principles.
Past performance is not an indication of future results.
More information about the Fund’s historical performance can be found in the “Closed End Funds” section of blackrock.com.
The following discussion relates to the Fund’s absolute performance based on NAV:
Municipal bonds delivered positive returns in the six-month period. Although U.S. Treasury yields moved higher (as prices fell), the tax-exempt market posted a gain due to a decline in yield spreads. Investors grew increasingly optimistic about the economic outlook for 2021, particularly after the approval of a vaccine for COVID-19 in early November 2020. Inflows into the market were consistent and traditional tax-exempt supply trended lower, creating a positive supply-and-demand dynamic that aided performance.
Given that municipal yields were little changed during the period, income was a large driver of performance. The use of leverage further augmented income as funding costs remained at depressed levels.
Yield spreads declined as the fundamental and technical backdrop for the asset class improved. As a result, some of the sectors impacted the most by COVID-19—such as health care and state tax-backed issues from lower-rated issuers (including Illinois, New Jersey and Puerto Rico)—started to recover. Holdings in the transportation sector also aided results. Additionally, longer-dated holdings with maturities of 20 years and above outperformed. The Fund actively sought to manage interest rate risk using U.S. Treasury futures. Since U.S. Treasury yields rose, as prices fell, this strategy contributed to results.
Reinvestment risk remained a headwind since the proceeds from bonds that matured or were called needed to be reinvested at lower yields compared to bonds that were issued when yields were higher.
The views expressed reflect the opinions of BlackRock as of the date of this report and are subject to change based on changes in market, economic or other conditions. These views are not intended to be a forecast of future events and are no guarantee of future results.
| F U N D S U M M A R Y |
13 |
| Fund Summary as of January 31, 2021 (continued) | BlackRock MuniYield Investment Quality Fund (MFT) |
Overview of the Fund’s Total Investments
| (a) | Excludes short-term securities. |
| (b) | For Fund compliance purposes, the Fund’s sector classifications refer to one or more of the sector sub-classifications used by one or more widely recognized market indexes or rating group indexes, and/or as defined by the investment adviser. These definitions may not apply for purposes of this report, which may combine such sector sub-classifications for reporting ease. |
| (c) | Scheduled maturity dates and/or bonds that are subject to potential calls by issuers over the next five years. |
| (d) | For financial reporting purposes, credit quality ratings shown above reflect the highest rating assigned by either S&P Global Ratings or Moody’s Investors Service, Inc. if ratings differ. These rating agencies are independent, nationally recognized statistical rating organizations and are widely used. Investment grade ratings are credit ratings of BBB/Baa or higher. Below investment grade ratings are credit ratings of BB/Ba or lower. Investments designated N/R are not rated by either rating agency. Unrated investments do not necessarily indicate low credit quality. Credit quality ratings are subject to change. |
| (e) | The investment adviser evaluates the credit quality of unrated investments based upon certain factors including, but not limited to, credit ratings for similar investments and financial analysis of sectors and individual investments. Using this approach, the investment adviser has deemed certain of these unrated securities as investment grade quality. As of January 31, 2021 and July 31, 2020, the market value of unrated securities deemed by the investment adviser to be investment grade represents 3% and 3%, respectively, of the Fund’s total investments. |
| 14 | 2 0 2 1 B L A C K R O C K S E M I - A N N U A L R E P O R T T O S H A R E H O L D E R S |
| Fund Summary as of January 31, 2021 | BlackRock MuniYield Michigan Quality Fund, Inc. (MIY) |
Investment Objective
BlackRock MuniYield Michigan Quality Fund, Inc.’s (MIY) (the “Fund”) investment objective is to provide shareholders with as high a level of current income exempt from U.S. federal and Michigan income taxes as is consistent with its investment policies and prudent investment management. The Fund seeks to achieve its investment objective by investing at least 80% of its assets in municipal obligations exempt from U.S. federal income taxes (except that the interest may be subject to the U.S. federal alternative minimum tax) and Michigan income taxes. Under normal market conditions, the Fund invests primarily in long-term municipal obligations that are investment grade quality, or are considered by the Fund’s investment adviser to be of comparable quality, at the time of investment. The Fund may invest up to 20% of its managed assets in securities that are rated below investment grade, or are considered by the Fund’s investment adviser to be of comparable quality, at the time of purchase. The Fund may invest directly in securities or synthetically through the use of derivatives.
No assurance can be given that the Fund’s investment objective will be achieved.
Fund Information
| Symbol on New York Stock Exchange |
MIY | |
| Initial Offering Date |
October 30, 1992 | |
| Yield on Closing Market Price as of January 31, 2021 ($14.80)(a) |
4.54% | |
| Tax Equivalent Yield(b) |
8.26% | |
| Current Monthly Distribution per Common Share(c) |
$0.0560 | |
| Current Annualized Distribution per Common Share(c) |
$0.6720 | |
| Leverage as of January 31, 2021(d) |
37% | |
| (a) | Yield on closing market price is calculated by dividing the current annualized distribution per share by the closing market price. Past performance is not an indication of future results. |
| (b) | Tax equivalent yield assumes the maximum marginal U.S. federal and state tax rate of 45.05%, which includes the 3.8% Medicare tax. Actual tax rates will vary based on income, exemptions and deductions. Lower taxes will result in lower tax equivalent yields. |
| (c) | The distribution rate is not constant and is subject to change. |
| (d) | Represents VRDP Shares and TOB Trusts as a percentage of total managed assets, which is the total assets of the Fund, including any assets attributable to VRDP Shares and TOB Trusts, minus the sum of its accrued liabilities. Does not reflect derivatives or other instruments that may give rise to economic leverage. For a discussion of leveraging techniques utilized by the Fund, please see The Benefits and Risks of Leveraging. |
Market Price and Net Asset Value Per Share Summary
| 01/31/21 | 07/31/20 | Change | High | Low | ||||||||||||||||
| Market Price |
$ | 14.80 | $ | 14.24 | 3.93 | % | $ | 14.84 | $ | 13.50 | ||||||||||
| Net Asset Value |
16.01 | 15.88 | 0.82 | 16.02 | 15.52 | |||||||||||||||
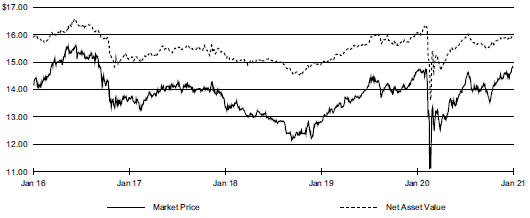
Market Price and Net Asset Value History for the Past Five Years
| F U N D S U M M A R Y |
15 |
| Fund Summary as of January 31, 2021 (continued) | BlackRock MuniYield Michigan Quality Fund, Inc. (MIY) |
Performance
Returns for the six months ended January 31, 2021 were as follows:
| Returns Based On | ||||||||
| Market Price | NAV | |||||||
| MIY(a)(b) |
6.32 | % | 3.14 | % | ||||
| Lipper Other States Municipal Debt Funds(c) |
7.28 | 3.26 | ||||||
| (a) | All returns reflect reinvestment of dividends and/or distributions at actual reinvestment prices. Performance results reflect the Fund’s use of leverage. |
| (b) | The Fund’s discount to NAV narrowed during the period, which accounts for the difference between performance based on market price and performance based on NAV. |
| (c) | Average return. Returns reflect reinvestment of dividends and/or distributions at NAV on the ex-dividend date as calculated by Lipper. |
Performance results may include adjustments made for financial reporting purposes in accordance with U.S. generally accepted accounting principles.
Past performance is not an indication of future results.
More information about the Fund’s historical performance can be found in the “Closed End Funds” section of blackrock.com.
The following discussion relates to the Fund’s absolute performance based on NAV:
Municipal bonds delivered positive returns in the six-month period. Although U.S. Treasury yields moved higher (as prices fell), the tax-exempt market posted a gain due to a decline in yield spreads. Investors grew increasingly optimistic about the economic outlook for 2021, particularly after the approval of a vaccine for COVID-19 in early November 2020. Inflows into the market were consistent and traditional tax-exempt supply trended lower, creating a positive supply-and-demand dynamic that aided performance.
Michigan performed in line with the national market. Michigan’s economy has improved and diversified since the 2008-2009 recession, albeit with a continued dependency on the auto industry. Net migration turned positive in 2017 for the first time in that decade, helping the state recover its prior population losses. More recently, however, the COVID-19 pandemic disrupted economic progress. The pandemic and subsequent shutdowns led to a revenue shortfall of approximately $2.2 billion in Michigan’s general fund in the 2020 fiscal year, causing the state to draw from its “rainy day” fund. The state government has indicated it will steadily replenish the fund over the next two fiscal years.
The Fund’s positions in sectors that were most affected by COVID-19 in early 2020—including state tax-backed, transportation and health care issues—contributed strongly to performance as yield spreads narrowed considerably in anticipation of a recovery. The Fund’s holdings in lower-rated securities also aided performance amid investors’ ongoing search for yield.
The Fund’s use of leverage, which augmented income and amplified the effect of rising prices, was a further contributor.
Reinvestment risk remained a headwind since the proceeds from bonds that matured or were called needed to be reinvested at lower yields compared with bonds that were issued when yields were higher.
The views expressed reflect the opinions of BlackRock as of the date of this report and are subject to change based on changes in market, economic or other conditions. These views are not intended to be a forecast of future events and are no guarantee of future results.
| 16 | 2 0 2 1 B L A C K R O C K S E M I - A N N U A L R E P O R T T O S H A R E H O L D E R S |
| Fund Summary as of January 31, 2021 (continued) | BlackRock MuniYield Michigan Quality Fund, Inc. (MIY) |
Overview of the Fund’s Total Investments
| (a) | Excludes short-term securities. |
| (b) | For Fund compliance purposes, the Fund’s sector classifications refer to one or more of the sector sub-classifications used by one or more widely recognized market indexes or rating group indexes, and/or as defined by the investment adviser. These definitions may not apply for purposes of this report, which may combine such sector sub-classifications for reporting ease. |
| (c) | Scheduled maturity dates and/or bonds that are subject to potential calls by issuers over the next five years. |
| (d) | For financial reporting purposes, credit quality ratings shown above reflect the highest rating assigned by either S&P Global Ratings or Moody’s Investors Service, Inc. if ratings differ. These rating agencies are independent, nationally recognized statistical rating organizations and are widely used. Investment grade ratings are credit ratings of BBB/Baa or higher. Below investment grade ratings are credit ratings of BB/Ba or lower. Investments designated N/R are not rated by either rating agency. Unrated investments do not necessarily indicate low credit quality. Credit quality ratings are subject to change. |
| (e) | Rounds to less than 1% of total investments. |
| (f) | The investment adviser evaluates the credit quality of unrated investments based upon certain factors including, but not limited to, credit ratings for similar investments and financial analysis of sectors and individual investments. Using this approach, the investment adviser has deemed certain of these unrated securities as investment grade quality. As of January 31, 2021 and July 31, 2020, the market value of unrated securities deemed by the investment adviser to be investment grade each represents less than 1% of the Fund’s total investments. |
| F U N D S U M M A R Y |
17 |
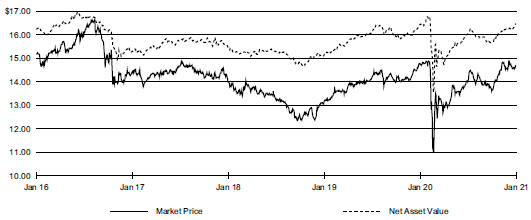
| Fund Summary as of January 31, 2021 | BlackRock MuniYield Pennsylvania Quality Fund (MPA) |
Investment Objective
BlackRock MuniYield Pennsylvania Quality Fund’s (MPA) (the “Fund”) investment objective is to provide shareholders with as high a level of current income exempt from U.S. federal and Pennsylvania income taxes as is consistent with its investment policies and prudent investment management. The Fund seeks to achieve its investment objective by investing at least 80% of its assets in municipal obligations exempt from U.S. federal income taxes (except that the interest may be subject to the U.S. federal alternative minimum tax) and Pennsylvania income taxes. Under normal market conditions, the Fund invests primarily in long-term municipal obligations that are investment grade quality, or are considered by the Fund’s investment adviser to be of comparable quality, at the time of investment. The Fund may invest up to 20% of its managed assets in securities that are rated below investment grade, or are considered by the Fund’s investment adviser to be of comparable quality, at the time of purchase. The Fund may invest directly in securities or synthetically through the use of derivatives.
No assurance can be given that the Fund’s investment objective will be achieved.
Fund Information
| Symbol on New York Stock Exchange |
MPA | |
| Initial Offering Date. |
October 30, 1992 | |
| Yield on Closing Market Price as of January 31, 2021 ($14.67)(a) |
4.50% | |
| Tax Equivalent Yield(b) |
8.02% | |
| Current Monthly Distribution per Common Share(c) |
$0.0550 | |
| Current Annualized Distribution per Common Share(c) |
$0.6600 | |
| Leverage as of January 31, 2021(d) |
38% | |
| (a) | Yield on closing market price is calculated by dividing the current annualized distribution per share by the closing market price. Past performance is not an indication of future results. |
| (b) | Tax equivalent yield assumes the maximum marginal U.S. federal and state tax rate of 43.87%, which includes the 3.8% Medicare tax. Actual tax rates will vary based on income, exemptions and deductions. Lower taxes will result in lower tax equivalent yields. |
| (c) | The distribution rate is not constant and is subject to change. |
| (d) | Represents VRDP Shares and TOB Trusts as a percentage of total managed assets, which is the total assets of the Fund, including any assets attributable to VRDP Shares and TOB Trusts, minus the sum of its accrued liabilities. Does not reflect derivatives or other instruments that may give rise to economic leverage. For a discussion of leveraging techniques utilized by the Fund, please see The Benefits and Risks of Leveraging and Derivative Financial Instruments. |
Market Price and Net Asset Value Per Share Summary
| 01/31/21 | 07/31/20 | Change | High | Low | ||||||||||||||||
| Market Price |
$ | 14.67 | $ | 14.09 | 4.12 | % | $ | 14.92 | $ | 13.57 | ||||||||||
| Net Asset Value |
16.46 | 16.09 | 2.30 | 16.46 | 15.66 | |||||||||||||||
Market Price and Net Asset Value History for the Past Five Years
| 18 | 2 0 2 1 B L A C K R O C K S E M I - A N N U A L R E P O R T T O S H A R E H O L D E R S |
| Fund Summary as of January 31, 2021 (continued) | BlackRock MuniYield Pennsylvania Quality Fund (MPA) |
Performance
Returns for the six months ended January 31, 2021 were as follows:
| Returns Based On | ||||||||
| Market Price | NAV | |||||||
| MPA(a)(b) |
6.53 | % | 4.66 | % | ||||
| Lipper Pennsylvania Municipal Debt Funds(c) |
4.69 | 3.85 | ||||||
| (a) | All returns reflect reinvestment of dividends and/or distributions at actual reinvestment prices. Performance results reflect the Fund’s use of leverage. |
| (b) | The Fund’s discount to NAV narrowed during the period, which accounts for the difference between performance based on market price and performance based on NAV. |
| (c) | Average return. Returns reflect reinvestment of dividends and/or distributions at NAV on the ex-dividend date as calculated by Lipper. |
Performance results may include adjustments made for financial reporting purposes in accordance with U.S. generally accepted accounting principles.
Past performance is not an indication of future results.
More information about the Fund’s historical performance can be found in the “Closed End Funds” section of blackrock.com.
The following discussion relates to the Fund’s absolute performance based on NAV:
Municipal bonds delivered positive returns in the six-month period. Although U.S. Treasury yields moved higher (as prices fell), the tax-exempt market posted a gain due to a decline in yield spreads. Investors grew increasingly optimistic about the economic outlook for 2021, particularly after the approval of a vaccine for COVID-19 in early November 2020. Inflows into the market were consistent and traditional tax-exempt supply trended lower, creating a positive supply-and-demand dynamic that aided performance..
Pennsylvania tax-backed bonds outperformed the national market. Credit spreads tightened during the period due to elevated investor demand for higher yielding investment-grade bonds, coupled with tax revenues that were more resilient than expected.
High yield municipal bonds outperformed the broader market, led by more liquid tobacco and Puerto Rico bonds. On a sector basis, health care, state tax backed state and transportation issues produced the highest returns. A material portion of the return in the state tax-backed states sector came from the Fund’s position in Puerto Rico. Holdings in longer-maturity debt, particularly securities maturing in 20 years or more, outpaced short-term issues.
The Fund’s use of leverage, which augmented income and amplified the effect of rising prices, was a further contributor. The Fund actively sought to manage interest rate risk using U.S. Treasury futures. Since U.S. Treasury yields rose, as prices fell, this strategy contributed to results.
Reinvestment risk remained a headwind since the proceeds from bonds that matured or were called needed to be reinvested at lower yields compared with bonds that were issued when yields were higher.
The views expressed reflect the opinions of BlackRock as of the date of this report and are subject to change based on changes in market, economic or other conditions. These views are not intended to be a forecast of future events and are no guarantee of future results.
| F U N D S U M M A R Y |
19 |
| Fund Summary as of January 31, 2021 (continued) | BlackRock MuniYield Pennsylvania Quality Fund (MPA) |
Overview of the Fund’s Total Investments
| (a) | Excludes short-term securities. |
| (b) | For Fund compliance purposes, the Fund’s sector classifications refer to one or more of the sector sub-classifications used by one or more widely recognized market indexes or rating group indexes, and/or as defined by the investment adviser. These definitions may not apply for purposes of this report, which may combine such sector sub-classifications for reporting ease. |
| (c) | Scheduled maturity dates and/or bonds that are subject to potential calls by issuers over the next five years. |
| (d) | For financial reporting purposes, credit quality ratings shown above reflect the highest rating assigned by either S&P Global Ratings or Moody’s Investors Service, Inc. if ratings differ. These rating agencies are independent, nationally recognized statistical rating organizations and are widely used. Investment grade ratings are credit ratings of BBB/Baa or higher. Below investment grade ratings are credit ratings of BB/Ba or lower. Investments designated N/R are not rated by either rating agency. Unrated investments do not necessarily indicate low credit quality. Credit quality ratings are subject to change. |
| (e) | Rounds to less than 1% of total investments. |
| (f) | The investment adviser evaluates the credit quality of unrated investments based upon certain factors including, but not limited to, credit ratings for similar investments and financial analysis of sectors and individual investments. Using this approach, the investment adviser has deemed certain of these unrated securities as investment grade quality. As of January 31, 2021 and July 31, 2020, the market value of unrated securities deemed by the investment adviser to be investment grade represents 2% and 2%, respectively, of the Fund’s total investments. |
| 20 | 2 0 2 1 B L A C K R O C K S E M I - A N N U A L R E P O R T T O S H A R E H O L D E R S |
| Schedule of Investments (unaudited) January 31, 2021 |
BlackRock MuniHoldings California Quality Fund, Inc. (MUC) (Percentages shown are based on Net Assets) |
| S C H E D U L E O F I N V E S T M E N T S |
21 |
| Schedule of Investments (unaudited) (continued) January 31, 2021 |
BlackRock MuniHoldings California Quality Fund, Inc. (MUC) (Percentages shown are based on Net Assets) |
| 22 | 2 0 2 1 B L A C K R O C K S E M I - A N N U A L R E P O R T T O S H A R E H O L D E R S |
| Schedule of Investments (unaudited) (continued) January 31, 2021 |
BlackRock MuniHoldings California Quality Fund, Inc. (MUC) (Percentages shown are based on Net Assets) |
| S C H E D U L E O F I N V E S T M E N T S |
23 |
| Schedule of Investments (unaudited) (continued) January 31, 2021 |
BlackRock MuniHoldings California Quality Fund, Inc. (MUC) (Percentages shown are based on Net Assets) |
Affiliates
Investments in issuers considered to be affiliate(s) of the Fund during the six-months ended January 31, 2021 for purposes of Section 2(a)(3) of the Investment Company Act of 1940, as amended, were as follows:
|
|
||||||||||||||||||||||||||||||||||||||||
| Affiliated Issuer | Value at 07/31/20 |
Purchases at Cost |
Proceeds from Sales |
Net Realized Gain (Loss) |
Change in Unrealized Appreciation (Depreciation) |
Value at 01/31/21 |
Shares Held at 01/31/21 |
Income | Capital Gain Distributions from Underlying Funds |
| ||||||||||||||||||||||||||||||
|
|
||||||||||||||||||||||||||||||||||||||||
| BlackRock Liquidity Funds California Money Fund, Institutional Class |
$ | 1,871,730 | $ | 13,286,156 | (a) | $ | — | $ | (1,554 | ) | $ | 1,481 | $ | 15,157,813 | 15,156,298 | $ | 1,378 | $ | — | |||||||||||||||||||||
|
|
|
|
|
|
|
|
|
|
|
|||||||||||||||||||||||||||||||
| (a) | Represents net amount purchased (sold). |
For Fund compliance purposes, the Fund’s sector classifications refer to one or more of the sector sub-classifications used by one or more widely recognized market indexes or rating group indexes, and/or as defined by the investment adviser. These definitions may not apply for purposes of this report, which may combine such sector sub-classifications for reporting ease.
| 24 | 2 0 2 1 B L A C K R O C K S E M I - A N N U A L R E P O R T T O S H A R E H O L D E R S |
| Schedule of Investments (unaudited) (continued) January 31, 2021 |
BlackRock MuniHoldings California Quality Fund, Inc. (MUC) |
Derivative Financial Instruments Outstanding as of Period End
Futures Contracts
|
|
||||||||||||||||
| Description | Number of Contracts |
Expiration Date |
Notional Amount (000) |
Value/ Unrealized Appreciation (Depreciation) |
||||||||||||
|
|
||||||||||||||||
| Short Contracts |
||||||||||||||||
| 10-Year U.S. Treasury Note |
176 | 03/22/21 | $ | 24,118 | $ | 144,729 | ||||||||||
| Long U.S. Treasury Bond |
64 | 03/22/21 | 10,798 | 312,026 | ||||||||||||
|
|
|
|||||||||||||||
| $ | 456,755 | |||||||||||||||
|
|
|
|||||||||||||||
Derivative Financial Instruments Categorized by Risk Exposure
As of period end, the fair values of derivative financial instruments located in the Statements of Assets and Liabilities were as follows:
|
|
||||||||||||||||||||||||||||
| |
Commodity Contracts |
|
|
Credit Contracts |
|
|
Equity Contracts |
|
|
Foreign Currency Exchange Contracts |
|
|
Interest Rate Contracts |
|
|
Other Contracts |
|
Total | ||||||||||
|
|
||||||||||||||||||||||||||||
| Assets — Derivative Financial Instruments |
||||||||||||||||||||||||||||
| Futures contracts |
||||||||||||||||||||||||||||
| Unrealized appreciation on futures |
$ | — | $ | — | $ | — | $ | — | $ | 456,755 | $ | — | $ | 456,755 | ||||||||||||||
|
|
|
|
|
|
|
|
|
|
|
|
|
|
|
|||||||||||||||
| (a) | Net cumulative unrealized appreciation (depreciation) on futures contracts and centrally cleared swaps, if any, are reported in the Schedule of Investments. In the Statements of Assets and Liabilities, only current day’s variation margin is reported in receivables or payables and the net cumulative unrealized appreciation (depreciation) is included in accumulated earnings (loss). |
For the six months ended January 31, 2021, the effect of derivative financial instruments in the Statements of Operations was as follows:
|
|
||||||||||||||||||||||||||||
| Commodity Contracts |
Credit Contracts |
Equity Contracts |
Foreign Currency Exchange Contracts |
Interest Rate Contracts |
Other Contracts |
Total | ||||||||||||||||||||||
|
|
||||||||||||||||||||||||||||
| Net Change in Unrealized Appreciation (Depreciation) on |
||||||||||||||||||||||||||||
| Futures contracts |
$ | — | $ | — | $ | — | $ | — | $ | 456,755 | $ | — | $ | 456,755 | ||||||||||||||
|
|
|
|
|
|
|
|
|
|
|
|
|
|
|
|||||||||||||||
Average Quarterly Balances of Outstanding Derivative Financial Instruments
| Futures contracts |
||||
| Average notional value of contracts — short |
$ | 17,457,750 |
For more information about the Fund’s investment risks regarding derivative financial instruments, refer to the Notes to Financial Statements.
Fair Value Hierarchy as of Period End
Various inputs are used in determining the fair value of financial instruments. For a description of the input levels and information about the Fund’s policy regarding valuation of financial instruments, refer to the Notes to Financial Statements.
The following table summarizes the Fund’s investments and derivative financial instruments categorized in the disclosure hierarchy. The breakdown of the Fund’s investments into major categories is disclosed in the Schedule of Investments above.
|
|
||||||||||||||||
| Level 1 | Level 2 | Level 3 | Total | |||||||||||||
|
|
||||||||||||||||
| Assets |
||||||||||||||||
| Investments |
||||||||||||||||
| Long-Term Investments |
||||||||||||||||
| Municipal Bonds |
$ | — | $ | 716,403,592 | $ | — | $ | 716,403,592 | ||||||||
| Municipal Bonds Transferred to Tender Option Bond Trusts |
— | 336,854,627 | — | 336,854,627 | ||||||||||||
| Short-Term Securities |
||||||||||||||||
| Money Market Funds |
15,157,813 | — | — | 15,157,813 | ||||||||||||
|
|
|
|
|
|
|
|
|
|||||||||
| $ | 15,157,813 | $ | 1,053,258,219 | $ | — | $ | 1,068,416,032 | |||||||||
|
|
|
|
|
|
|
|
|
|||||||||
| S C H E D U L E O F I N V E S T M E N T S |
25 |
| Schedule of Investments (unaudited) (continued) January 31, 2021 |
BlackRock MuniHoldings California Quality Fund, Inc. (MUC) |
Fair Value Hierarchy as of Period End (continued)
|
|
||||||||||||||||
| Level 1 | Level 2 | Level 3 | Total | |||||||||||||
|
|
||||||||||||||||
| Derivative Financial Instruments(a) |
||||||||||||||||
| Assets |
||||||||||||||||
| Interest Rate Contracts |
$ | 456,755 | $ | — | $ | — | $ | 456,755 | ||||||||
|
|
|
|
|
|
|
|
|
|||||||||
| (a) | Derivative financial instruments are futures contracts. Futures contracts are valued at the unrealized appreciation (depreciation) on the instrument. |
The Fund may hold assets and/or liabilities in which the fair value approximates the carrying amount for financial statement purposes. As of period end, such assets and/or liabilities are categorized within the disclosure hierarchy as follows:
|
|
||||||||||||||||
| Level 1 | Level 2 | Level 3 | Total | |||||||||||||
|
|
||||||||||||||||
| Liabilities |
||||||||||||||||
| TOB Trust Certificates |
$ | — | $ | (158,512,208 | ) | $ | — | $ | (158,512,208 | ) | ||||||
| VMTP Shares at Liquidation Value |
— | (254,000,000 | ) | — | (254,000,000 | ) | ||||||||||
|
|
|
|
|
|
|
|
|
|||||||||
| $ | — | $ | (412,512,208 | ) | $ | — | $ | (412,512,208 | ) | |||||||
|
|
|
|
|
|
|
|
|
|||||||||
See notes to financial statements.
| 26 | 2 0 2 1 B L A C K R O C K S E M I - A N N U A L R E P O R T T O S H A R E H O L D E R S |
| Schedule of Investments (unaudited) January 31, 2021 |
BlackRock MuniHoldings New Jersey Quality Fund, Inc. (MUJ) (Percentages shown are based on Net Assets) |
| S C H E D U L E O F I N V E S T M E N T S |
27 |
| Schedule of Investments (unaudited) (continued) January 31, 2021 |
BlackRock MuniHoldings New Jersey Quality Fund, Inc. (MUJ) (Percentages shown are based on Net Assets) |
| 28 | 2 0 2 1 B L A C K R O C K S E M I - A N N U A L R E P O R T T O S H A R E H O L D E R S |
| Schedule of Investments (unaudited) (continued) January 31, 2021 |
BlackRock MuniHoldings New Jersey Quality Fund, Inc. (MUJ) (Percentages shown are based on Net Assets) |
| S C H E D U L E O F I N V E S T M E N T S |
29 |
| Schedule of Investments (unaudited) (continued) January 31, 2021 |
BlackRock MuniHoldings New Jersey Quality Fund, Inc. (MUJ) (Percentages shown are based on Net Assets) |
Affiliates
Investments in issuers considered to be affiliate(s) of the Fund during the six-months ended January 31, 2021 for purposes of Section 2(a)(3) of the Investment Company Act of 1940, as amended, were as follows:
|
|
||||||||||||||||||||||||||||||||||||||||
| Affiliated Issuer | Value at 07/31/20 |
Purchases at Cost |
Proceeds from Sales |
Net Realized Gain (Loss) |
Change in Unrealized Appreciation (Depreciation) |
Value at 01/31/21 |
Shares Held at 01/31/21 |
Income | Capital Gain Distributions from Underlying Funds |
|||||||||||||||||||||||||||||||
|
|
||||||||||||||||||||||||||||||||||||||||
| BlackRock Liquidity Funds, MuniCash, Institutional Class |
$ | 871,428 | $ | 8,004,342 | (a) | $ | — | $ | 656 | $ | (347 | ) | $ | 8,876,079 | 8,874,304 | $ | 343 | $ | — | |||||||||||||||||||||
|
|
|
|
|
|
|
|
|
|
|
|||||||||||||||||||||||||||||||
| (a) | Represents net amount purchased (sold). |
For Fund compliance purposes, the Fund’s sector classifications refer to one or more of the sector sub-classifications used by one or more widely recognized market indexes or rating group indexes, and/or as defined by the investment adviser. These definitions may not apply for purposes of this report, which may combine such sector sub-classifications for reporting ease.
| 30 | 2 0 2 1 B L A C K R O C K S E M I - A N N U A L R E P O R T T O S H A R E H O L D E R S |
| Schedule of Investments (unaudited) (continued) January 31, 2021 |
BlackRock MuniHoldings New Jersey Quality Fund, Inc. (MUJ) |
Derivative Financial Instruments Outstanding as of Period End
Futures Contracts
|
|
||||||||||||||||
| Description | Number of Contracts |
Expiration Date |
Notional Amount (000) |
Value/ Unrealized Appreciation (Depreciation) |
||||||||||||
|
|
||||||||||||||||
| Short Contracts |
||||||||||||||||
| 10-Year U.S. Treasury Note |
81 | 03/22/21 | $ | 11,100 | $ | 85,950 | ||||||||||
| Long U.S. Treasury Bond |
22 | 03/22/21 | 3,712 | 132,426 | ||||||||||||
|
|
|
|||||||||||||||
| $ | 218,376 | |||||||||||||||
|
|
|
|||||||||||||||
Derivative Financial Instruments Categorized by Risk Exposure
As of period end, the fair values of derivative financial instruments located in the Statements of Assets and Liabilities were as follows:
|
|
||||||||||||||||||||||||||||
| |
Commodity Contracts |
|
|
Credit Contracts |
|
|
Equity Contracts |
|
|
Foreign Currency Exchange Contracts |
|
|
Interest Rate Contracts |
|
|
Other Contracts |
|
Total | ||||||||||
|
|
||||||||||||||||||||||||||||
| Assets — Derivative Financial Instruments |
||||||||||||||||||||||||||||
| Futures contracts |
||||||||||||||||||||||||||||
| Unrealized appreciation on futures contracts(a) |
$ | — | $ | — | $ | — | $ | — | $ | 218,376 | $ | — | $ | 218,376 | ||||||||||||||
|
|
|
|
|
|
|
|
|
|
|
|
|
|
|
|||||||||||||||
| (a) | Net cumulative unrealized appreciation (depreciation) on futures contracts and centrally cleared swaps, if any, are reported in the Schedule of Investments. In the Statements of Assets and Liabilities, only current day’s variation margin is reported in receivables or payables and the net cumulative unrealized appreciation (depreciation) is included in accumulated earnings (loss). |
For the six months ended January 31, 2021, the effect of derivative financial instruments in the Statements of Operations was as follows:
|
|
||||||||||||||||||||||||||||
| Commodity Contracts |
Credit Contracts |
Equity Contracts |
Foreign Currency Exchange |
Interest Rate Contracts |
Other Contracts |
Total | ||||||||||||||||||||||
|
|
||||||||||||||||||||||||||||
| Net Realized Gain (Loss) from |
||||||||||||||||||||||||||||
| Futures contracts |
$ | — | $ | — | $ | — | $ | — | $ | 379,487 | $ | — | $ | 379,487 | ||||||||||||||
|
|
|
|
|
|
|
|
|
|
|
|
|
|
|
|||||||||||||||
| Net Change in Unrealized Appreciation (Depreciation) on |
|
|||||||||||||||||||||||||||
| Futures contracts |
$ | — | $ | — | $ | — | $ | — | $ | 218,376 | $ | — | $ | 218,376 | ||||||||||||||
|
|
|
|
|
|
|
|
|
|
|
|
|
|
|
|||||||||||||||
Average Quarterly Balances of Outstanding Derivative Financial Instruments
| Futures contracts |
||||
| Average notional value of contracts — short |
$ | 22,654,406 |
For more information about the Fund’s investment risks regarding derivative financial instruments, refer to the Notes to Financial Statements.
Fair Value Hierarchy as of Period End
Various inputs are used in determining the fair value of financial instruments. For a description of the input levels and information about the Fund’s policy regarding valuation of financial instruments, refer to the Notes to Financial Statements.
The following table summarizes the Fund’s investments and derivative financial instruments categorized in the disclosure hierarchy. The breakdown of the Fund’s investments into major categories is disclosed in the Schedule of Investments above.
|
|
||||||||||||||||
| Level 1 | Level 2 | Level 3 | Total | |||||||||||||
|
|
||||||||||||||||
| Assets |
||||||||||||||||
| Investments |
||||||||||||||||
| Long-Term Investments |
||||||||||||||||
| Municipal Bonds |
$ | — | $ | 672,278,281 | $ | — | $ | 672,278,281 | ||||||||
| Municipal Bonds Transferred to Tender Option Bond Trusts |
— | 114,957,329 | — | 114,957,329 | ||||||||||||
| Short-Term Securities |
||||||||||||||||
| Money Market Funds |
8,876,079 | — | — | 8,876,079 | ||||||||||||
|
|
|
|
|
|
|
|
|
|||||||||
| $ | 8,876,079 | $ | 787,235,610 | $ | — | $ | 796,111,689 | |||||||||
|
|
|
|
|
|
|
|
|
|||||||||
| S C H E D U L E O F I N V E S T M E N T S |
31 |
| Schedule of Investments (unaudited) (continued) January 31, 2021 |
BlackRock MuniHoldings New Jersey Quality Fund, Inc. (MUJ) |
Fair Value Hierarchy as of Period End (continued)
|
|
||||||||||||||||
| Level 1 | Level 2 | Level 3 | Total | |||||||||||||
|
|
||||||||||||||||
| Derivative Financial Instruments(a) |
||||||||||||||||
| Assets |
||||||||||||||||
| Interest Rate Contracts |
$ | 218,376 | $ | — | $ | — | $ | 218,376 | ||||||||
|
|
|
|
|
|
|
|
|
|||||||||
| (a) | Derivative financial instruments are futures contracts. Futures contracts are valued at the unrealized appreciation (depreciation) on the instrument. |
The Fund may hold assets and/or liabilities in which the fair value approximates the carrying amount for financial statement purposes. As of period end, such assets and/or liabilities are categorized within the disclosure hierarchy as follows:
|
|
||||||||||||||||
| Level 1 | Level 2 | Level 3 | Total | |||||||||||||
|
|
||||||||||||||||
| Liabilities |
||||||||||||||||
| TOB Trust Certificates |
$ | — | $ | (61,534,134 | ) | $ | — | $ | (61,534,134 | ) | ||||||
| VRDP Shares at Liquidation Value |
— | (237,100,000 | ) | — | (237,100,000 | ) | ||||||||||
|
|
|
|
|
|
|
|
|
|||||||||
| $ | — | $ | (298,634,134 | ) | $ | — | $ | (298,634,134 | ) | |||||||
|
|
|
|
|
|
|
|
|
|||||||||
See notes to financial statements.
| 32 | 2 0 2 1 B L A C K R O C K S E M I - A N N U A L R E P O R T T O S H A R E H O L D E R S |
| Schedule of Investments (unaudited) January 31, 2021 |
BlackRock MuniYield Investment Quality Fund (MFT) (Percentages shown are based on Net Assets) |
| S C H E D U L E O F I N V E S T M E N T S |
33 |
| Schedule of Investments (unaudited) (continued) January 31, 2021 |
BlackRock MuniYield Investment Quality Fund (MFT) (Percentages shown are based on Net Assets) |
| 34 | 2 0 2 1 B L A C K R O C K S E M I - A N N U A L R E P O R T T O S H A R E H O L D E R S |
| Schedule of Investments (unaudited) (continued) January 31, 2021 |
BlackRock MuniYield Investment Quality Fund (MFT) (Percentages shown are based on Net Assets) |
| S C H E D U L E O F I N V E S T M E N T S |
35 |
| Schedule of Investments (unaudited) (continued) January 31, 2021 |
BlackRock MuniYield Investment Quality Fund (MFT) (Percentages shown are based on Net Assets) |
| 36 | 2 0 2 1 B L A C K R O C K S E M I - A N N U A L R E P O R T T O S H A R E H O L D E R S |
| Schedule of Investments (unaudited) (continued) January 31, 2021 |
BlackRock MuniYield Investment Quality Fund (MFT) (Percentages shown are based on Net Assets) |
| S C H E D U L E O F I N V E S T M E N T S |
37 |
| Schedule of Investments (unaudited) (continued) January 31, 2021 |
BlackRock MuniYield Investment Quality Fund (MFT) |
Affiliates
Investments in issuers considered to be affiliate(s) of the Fund during the six-months ended January 31, 2021 for purposes of Section 2(a)(3) of the Investment Company Act of 1940, as amended, were as follows:
|
|
||||||||||||||||||||||||||||||||||||
| Affiliated Issuer | Value at 07/31/20 |
Purchases at Cost |
Proceeds from Sales |
Net Realized Gain (Loss) |
Change in Unrealized Appreciation (Depreciation) |
Value at 01/31/21 |
Shares Held at 01/31/21 |
Income | Capital Gain |
|||||||||||||||||||||||||||
|
|
||||||||||||||||||||||||||||||||||||
| BlackRock Liquidity Funds, MuniCash, Institutional Class |
$ | 698,478 | $ | 277,522 | (a) | $ | — | $ | 16 | $ | — | $ | 976,016 | 975,821 | $ | 33 | $ | — | ||||||||||||||||||
|
|
|
|
|
|
|
|
|
|
|
|||||||||||||||||||||||||||
| (a) | Represents net amount purchased (sold). |
Fair Value Hierarchy as of Period End
Various inputs are used in determining the fair value of financial instruments. For a description of the input levels and information about the Fund’s policy regarding valuation of financial instruments, refer to the Notes to Financial Statements.
The following table summarizes the Fund’s investments categorized in the disclosure hierarchy. The breakdown of the Fund’s investments into major categories is disclosed in the Schedule of Investments above.
|
|
||||||||||||||||
| Level 1 | Level 2 | Level 3 | Total | |||||||||||||
|
|
||||||||||||||||
| Assets |
||||||||||||||||
| Investments |
||||||||||||||||
| Long-Term Investments |
||||||||||||||||
| Municipal Bonds |
$ | — | $ | 155,097,318 | $ | — | $ | 155,097,318 | ||||||||
| Municipal Bonds Transferred to Tender Option Bond Trusts |
— | 52,693,502 | — | 52,693,502 | ||||||||||||
| Short-Term Securities |
||||||||||||||||
| Money Market Funds |
976,016 | — | — | 976,016 | ||||||||||||
|
|
|
|
|
|
|
|
|
|||||||||
| $ | 976,016 | $ | 207,790,820 | $ | — | $ | 208,766,836 | |||||||||
|
|
|
|
|
|
|
|
|
|||||||||
The Fund may hold assets and/or liabilities in which the fair value approximates the carrying amount for financial statement purposes. As of period end, such assets and/or liabilities are categorized within the disclosure hierarchy as follows:
|
|
||||||||||||||||
| Level 1 | Level 2 | Level 3 | Total | |||||||||||||
|
|
||||||||||||||||
| Liabilities |
||||||||||||||||
| TOB Trust Certificates |
$ | — | $ | (27,589,669 | ) | $ | — | $ | (27,589,669 | ) | ||||||
| VMTP Shares at Liquidation Value |
— | (56,500,000 | ) | — | (56,500,000 | ) | ||||||||||
|
|
|
|
|
|
|
|
|
|||||||||
| $ | — | $ | (84,089,669 | ) | $ | — | $ | (84,089,669 | ) | |||||||
|
|
|
|
|
|
|
|
|
|||||||||
See notes to financial statements.
| 38 | 2 0 2 1 B L A C K R O C K S E M I - A N N U A L R E P O R T T O S H A R E H O L D E R S |
| Schedule of Investments (unaudited) January 31, 2021 |
BlackRock MuniYield Michigan Quality Fund, Inc. (MIY) (Percentages shown are based on Net Assets) |
| S C H E D U L E O F I N V E S T M E N T S |
39 |
| Schedule of Investments (unaudited) (continued) January 31, 2021 |
BlackRock MuniYield Michigan Quality Fund, Inc. (MIY) (Percentages shown are based on Net Assets) |
| 40 | 2 0 2 1 B L A C K R O C K S E M I - A N N U A L R E P O R T T O S H A R E H O L D E R S |
| Schedule of Investments (unaudited) (continued) January 31, 2021 |
BlackRock MuniYield Michigan Quality Fund, Inc. (MIY) (Percentages shown are based on Net Assets) |
| S C H E D U L E O F I N V E S T M E N T S |
41 |
| Schedule of Investments (unaudited) (continued) January 31, 2021 |
BlackRock MuniYield Michigan Quality Fund, Inc. (MIY) |
Affiliates
Investments in issuers considered to be affiliate(s) of the Fund during the six-months ended January 31, 2021 for purposes of Section 2(a)(3) of the Investment Company Act of 1940, as amended, were as follows:
| Affiliated Issuer | Value at 07/31/20 |
Purchases at Cost |
Proceeds from Sales |
Net Realized Gain (Loss) |
Change in Unrealized Appreciation (Depreciation) |
Value at 01/31/21 |
Shares Held at 01/31/21 |
Income | Capital Gain Distributions from Underlying Funds |
|||||||||||||||||||||||||||
| BlackRock Liquidity Funds, MuniCash, Institutional Class |
$ | 3,877,972 | $ | 2,008,108 | (a) | $ | — | $ | 327 | $ | 12 | $ | 5,886,419 | 5,885,241 | $ | 217 | $ | — | ||||||||||||||||||
|
|
|
|
|
|
|
|
|
|
|
|||||||||||||||||||||||||||
| (a) | Represents net amount purchased (sold). |
For Fund compliance purposes, the Fund’s sector classifications refer to one or more of the sector sub-classifications used by one or more widely recognized market indexes or rating group indexes, and/or as defined by the investment adviser. These definitions may not apply for purposes of this report, which may combine such sector sub-classifications for reporting ease.
Fair Value Hierarchy as of Period End
Various inputs are used in determining the fair value of financial instruments. For a description of the input levels and information about the Fund’s policy regarding valuation of financial instruments, refer to the Notes to Financial Statements.
The following table summarizes the Fund’s investments categorized in the disclosure hierarchy. The breakdown of the Fund’s investments into major categories is disclosed in the Schedule of Investments above.
|
|
||||||||||||||||
| Level 1 | Level 2 | Level 3 | Total | |||||||||||||
|
|
||||||||||||||||
| Assets |
||||||||||||||||
| Investments |
||||||||||||||||
| Long-Term Investments |
||||||||||||||||
| Municipal Bonds |
$ | — | $ | 653,343,707 | $ | — | $ | 653,343,707 | ||||||||
| Municipal Bonds Transferred to Tender Option Bond Trusts |
— | 81,448,118 | — | 81,448,118 | ||||||||||||
| Short-Term Securities |
||||||||||||||||
| Money Market Funds |
5,886,419 | — | — | 5,886,419 | ||||||||||||
|
|
|
|
|
|
|
|
|
|||||||||
| $ | 5,886,419 | $ | 734,791,825 | $ | — | $ | 740,678,244 | |||||||||
|
|
|
|
|
|
|
|
|
|||||||||
The Fund may hold assets and/or liabilities in which the fair value approximates the carrying amount for financial statement purposes. As of period end, such assets and/or liabilities are categorized within the disclosure hierarchy as follows:
|
|
||||||||||||||||
| Level 1 | Level 2 | Level 3 | Total | |||||||||||||
|
|
||||||||||||||||
| Liabilities |
||||||||||||||||
| TOB Trust Certificates |
$ | — | $ | (41,362,055 | ) | $ | — | $ | (41,362,055 | ) | ||||||
| VRDP Shares at Liquidation Value |
— | (231,900,000 | ) | — | (231,900,000 | ) | ||||||||||
|
|
|
|
|
|
|
|
|
|||||||||
| $ | — | $ | (273,262,055 | ) | $ | — | $ | (273,262,055 | ) | |||||||
|
|
|
|
|
|
|
|
|
|||||||||
See notes to financial statements.
| 42 | 2 0 2 1 B L A C K R O C K S E M I - A N N U A L R E P O R T T O S H A R E H O L D E R S |
| Schedule of Investments (unaudited) January 31, 2021 |
BlackRock MuniYield Pennsylvania Quality Fund (MPA) (Percentages shown are based on Net Assets) |
| S C H E D U L E O F I N V E S T M E N T S |
43 |
| Schedule of Investments (unaudited) (continued) January 31, 2021 |
BlackRock MuniYield Pennsylvania Quality Fund (MPA) (Percentages shown are based on Net Assets) |
| 44 | 2 0 2 1 B L A C K R O C K S E M I - A N N U A L R E P O R T T O S H A R E H O L D E R S |
| Schedule of Investments (unaudited) (continued) January 31, 2021 |
BlackRock MuniYield Pennsylvania Quality Fund (MPA) (Percentages shown are based on Net Assets) |
| S C H E D U L E O F I N V E S T M E N T S |
45 |
| Schedule of Investments (unaudited) (continued) January 31, 2021 |
BlackRock MuniYield Pennsylvania Quality Fund (MPA) (Percentages shown are based on Net Assets) |
Affiliates
Investments in issuers considered to be affiliate(s) of the Fund during the six-months ended January 31, 2021 for purposes of Section 2(a)(3) of the Investment Company Act of 1940, as amended, were as follows:
| Affiliated Issuer | Value at 07/31/20 |
Purchases at Cost |
Proceeds from Sales |
Net Realized Gain (Loss) |
Change in Unrealized Appreciation (Depreciation) |
Value at 01/31/21 |
Shares Held at 01/31/21 |
Income | Capital Gain Distributions from Underlying Funds |
|||||||||||||||||||||||||||
| BlackRock Liquidity Funds, MuniCash, Institutional Class |
$ | 1,880,644 | $ | 1,875,934 | (a) | $ | — | $ | (82 | ) | $ | 187 | $ | 3,756,683 | 3,755,932 | $ | 149 | $ | — | |||||||||||||||||
|
|
|
|
|
|
|
|
|
|
|
|||||||||||||||||||||||||||
| (a) | Represents net amount purchased (sold). |
For Fund compliance purposes, the Fund’s sector classifications refer to one or more of the sector sub-classifications used by one or more widely recognized market indexes or rating group indexes, and/or as defined by the investment adviser. These definitions may not apply for purposes of this report, which may combine such sector sub-classifications for reporting ease.
Derivative Financial Instruments Outstanding as of Period End
Futures Contracts
| Description |
Number of Contracts |
Expiration Date |
Notional Amount (000) |
Value/ Unrealized Appreciation (Depreciation) |
||||||||||||
| Short Contracts |
||||||||||||||||
| 10-Year U.S. Treasury Note. |
39 | 03/22/21 | $ | 5,344 | $ | 41,383 | ||||||||||
| Long U.S. Treasury Bond |
15 | 03/22/21 | 2,531 | 90,290 | ||||||||||||
|
|
|
|||||||||||||||
| $ | 131,673 | |||||||||||||||
|
|
|
|||||||||||||||
| 46 | 2 0 2 1 B L A C K R O C K S E M I - A N N U A L R E P O R T T O S H A R E H O L D E R S |
| Schedule of Investments (unaudited) (continued) January 31, 2021 |
BlackRock MuniYield Pennsylvania Quality Fund (MPA) |
Derivative Financial Instruments Categorized by Risk Exposure
As of period end, the fair values of derivative financial instruments located in the Statements of Assets and Liabilities were as follows:
| Commodity Contracts |
Credit Contracts |
Equity Contracts |
Foreign Currency Exchange Contracts |
Interest Rate Contracts |
Other Contracts |
Total | ||||||||||||||||||||||
| Assets — Derivative Financial Instruments |
||||||||||||||||||||||||||||
| Futures contracts |
||||||||||||||||||||||||||||
| Unrealized appreciation on futures contracts(a) |
$ | — | $ | — | $ | — | $ | — | $ | 131,673 | $ | — | $ | 131,673 | ||||||||||||||
|
|
|
|
|
|
|
|
|
|
|
|
|
|
|
|||||||||||||||
| (a) | Net cumulative unrealized appreciation (depreciation) on futures contracts and centrally cleared swaps, if any, are reported in the Schedule of Investments. In the Statements of Assets and Liabilities, only current day’s variation margin is reported in receivables or payables and the net cumulative unrealized appreciation (depreciation) is included in accumulated earnings (loss). |
For the six months ended January 31, 2021, the effect of derivative financial instruments in the Statements of Operations was as follows:
| Commodity Contracts |
Credit Contracts |
Equity Contracts |
Foreign Currency Exchange Contracts |
Interest Rate Contracts |
Other Contracts |
Total | ||||||||||||||||||||||
| Net Realized Gain (Loss) from |
||||||||||||||||||||||||||||
| Futures contracts |
$ | — | $ | — | $ | — | $ | — | $ | 212,850 | $ | — | $ | 212,850 | ||||||||||||||
|
|
|
|
|
|
|
|
|
|
|
|
|
|
|
|||||||||||||||
| Net Change in Unrealized Appreciation (Depreciation) on |
||||||||||||||||||||||||||||
| Futures contracts |
$ | — | $ | — | $ | — | $ | — | $ | 131,673 | $ | — | $ | 131,673 | ||||||||||||||
|
|
|
|
|
|
|
|
|
|
|
|
|
|
|
|||||||||||||||
Average Quarterly Balances of Outstanding Derivative Financial Instruments
|
|
||||
| Futures contracts |
||||
| Average notional value of contracts — short |
$ | 11,932,188 | ||
|
|
||||
For more information about the Fund’s investment risks regarding derivative financial instruments, refer to the Notes to Financial Statements.
Fair Value Hierarchy as of Period End
Various inputs are used in determining the fair value of financial instruments. For a description of the input levels and information about the Fund’s policy regarding valuation of financial instruments, refer to the Notes to Financial Statements.
The following table summarizes the Fund’s investments and derivative financial instruments categorized in the disclosure hierarchy. The breakdown of the Fund’s investments into major categories is disclosed in the Schedule of Investments above.
| Level 1 | Level 2 | Level 3 | Total | |||||||||||||
| Assets |
||||||||||||||||
| Investments |
||||||||||||||||
| Long-Term Investments |
||||||||||||||||
| Municipal Bonds |
$ | — | $ | 255,667,842 | $ | — | $ | 255,667,842 | ||||||||
| Municipal Bonds Transferred to Tender Option Bond Trusts |
— | 94,039,826 | — | 94,039,826 | ||||||||||||
| Short-Term Securities |
||||||||||||||||
| Money Market Funds |
3,756,683 | — | — | 3,756,683 | ||||||||||||
|
|
|
|
|
|
|
|
|
|||||||||
| $ | 3,756,683 | $ | 349,707,668 | $ | — | $ | 353,464,351 | |||||||||
|
|
|
|
|
|
|
|
|
|||||||||
| Derivative Financial Instruments(a) |
||||||||||||||||
| Assets |
||||||||||||||||
| Interest Rate Contracts |
$ | 131,673 | $ | — | $ | — | $ | 131,673 | ||||||||
|
|
|
|
|
|
|
|
|
|||||||||
| (a) | Derivative financial instruments are futures contracts. Futures contracts are valued at the unrealized appreciation (depreciation) on the instrument. |
| S C H E D U L E O F I N V E S T M E N T S |
47 |
| Schedule of Investments (unaudited) (continued) January 31, 2021 |
BlackRock MuniYield Pennsylvania Quality Fund (MPA) |
The Fund may hold assets and/or liabilities in which the fair value approximates the carrying amount for financial statement purposes. As of period end, such assets and/or liabilities are categorized within the disclosure hierarchy as follows:
|
|
||||||||||||||||
| Level 1 | Level 2 | Level 3 | Total | |||||||||||||
|
|
||||||||||||||||
| Liabilities |
||||||||||||||||
| TOB Trust Certificates |
$ | — | $ | (51,926,581 | ) | $ | — | $ | (51,926,581 | ) | ||||||
| VRDP Shares at Liquidation Value |
— | (82,600,000 | ) | — | (82,600,000 | ) | ||||||||||
|
|
|
|
|
|
|
|
|
|||||||||
| $ | — | $ | (134,526,581 | ) | $ | — | $ | (134,526,581 | ) | |||||||
|
|
|
|
|
|
|
|
|
|||||||||
See notes to financial statements.
| 48 | 2 0 2 1 B L A C K R O C K S E M I - A N N U A L R E P O R T T O S H A R E H O L D E R S |
Statements of Assets and Liabilities (unaudited)
January 31, 2021
| MUC | MUJ | MFT | MIY | |||||||||||||
| ASSETS |
||||||||||||||||
| Investments at value — unaffiliated(a) |
$ | 1,053,258,219 | $ | 787,235,610 | $ | 207,790,820 | $ | 734,791,825 | ||||||||
| Investments at value — affiliated(b) |
15,157,813 | 8,876,079 | 976,016 | 5,886,419 | ||||||||||||
| Cash |
105,500 | 42,031 | — | — | ||||||||||||
| Cash pledged for futures contracts |
481,000 | 192,000 | — | — | ||||||||||||
| Receivables: |
||||||||||||||||
| Investments sold |
— | — | 312,854 | — | ||||||||||||
| Dividends — affiliated |
132 | 63 | 9 | 53 | ||||||||||||
| Interest — unaffiliated |
13,008,484 | 5,327,102 | 2,048,008 | 7,438,885 | ||||||||||||
| Variation margin on futures contracts |
92,521 | 36,295 | — | — | ||||||||||||
| Prepaid expenses |
9,173 | — | 5,224 | 313,935 | ||||||||||||
|
|
|
|
|
|
|
|
|
|||||||||
| Total assets |
1,082,112,842 | 801,709,180 | 211,132,931 | 748,431,117 | ||||||||||||
|
|
|
|
|
|
|
|
|
|||||||||
| ACCRUED LIABILITIES |
||||||||||||||||
| Payables: |
||||||||||||||||
| Investments purchased |
3,748,445 | 11,168,512 | 1,714,141 | 1,107,470 | ||||||||||||
| Income dividend distributions — Common Shares |
2,255,137 | 1,895,492 | 508,777 | 1,652,534 | ||||||||||||
| Interest expense and fees |
82,594 | 28,234 | 9,821 | 21,492 | ||||||||||||
| Investment advisory fees |
471,965 | 332,700 | 88,141 | 308,428 | ||||||||||||
| Directors’ and Officer’s fees |
391,936 | 3,945 | 1,073 | 3,767 | ||||||||||||
| Other accrued expenses |
180,648 | 210,168 | 62,511 | 141,034 | ||||||||||||
| Reorganization costs |
— | — | 110,769 | — | ||||||||||||
|
|
|
|
|
|
|
|
|
|||||||||
| Total accrued liabilities |
7,130,725 | 13,639,051 | 2,495,233 | 3,234,725 | ||||||||||||
|
|
|
|
|
|
|
|
|
|||||||||
| OTHER LIABILITIES |
||||||||||||||||
| TOB Trust Certificates |
158,512,208 | 61,534,134 | 27,589,669 | 41,362,055 | ||||||||||||
| VRDP Shares, at liquidation value of $100,000 per share, net of deferred |
— | 236,675,590 | — | 231,500,148 | ||||||||||||
| VMTP Shares, at liquidation value of $100,000 per share(c)(d)(e) |
254,000,000 | — | 56,500,000 | — | ||||||||||||
|
|
|
|
|
|
|
|
|
|||||||||
| Total other liabilities |
412,512,208 | 298,209,724 | 84,089,669 | 272,862,203 | ||||||||||||
|
|
|
|
|
|
|
|
|
|||||||||
| Total liabilities |
419,642,933 | 311,848,775 | 86,584,902 | 276,096,928 | ||||||||||||
|
|
|
|
|
|
|
|
|
|||||||||
| NET ASSETS APPLICABLE TO COMMON SHAREHOLDERS |
$ | 662,469,909 | $ | 489,860,405 | $ | 124,548,029 | $ | 472,334,189 | ||||||||
|
|
|
|
|
|
|
|
|
|||||||||
| NET ASSETS APPLICABLE TO COMMON SHAREHOLDERS CONSIST OF |
||||||||||||||||
| Paid-in capital(f)(g)(h) |
$ | 581,297,061 | $ | 423,165,204 | $ | 113,430,341 | $ | 418,130,162 | ||||||||
| Accumulated earnings |
81,172,848 | 66,695,201 | 11,117,688 | 54,204,027 | ||||||||||||
|
|
|
|
|
|
|
|
|
|||||||||
| NET ASSETS APPLICABLE TO COMMON SHAREHOLDERS |
$ | 662,469,909 | $ | 489,860,405 | $ | 124,548,029 | $ | 472,334,189 | ||||||||
|
|
|
|
|
|
|
|
|
|||||||||
| Netasset value per Common Share |
$ | 16.16 | $ | 16.28 | $ | 14.69 | $ | 16.01 | ||||||||
|
|
|
|
|
|
|
|
|
|||||||||
| (a) Investments at cost — unaffiliated |
$ | 952,736,549 | $ | 713,911,643 | $ | 188,887,477 | $ | 673,850,753 | ||||||||
| (b) Investments at cost — affiliated |
$ | 15,156,409 | $ | 8,876,061 | $ | 976,016 | $ | 5,884,952 | ||||||||
| (c) Preferred Shares outstanding |
2,540 | 2,371 | 565 | 2,319 | ||||||||||||
| (d) Preferred Shares authorized |
18,140 | 9,847 | 1,000,000 | 8,919 | ||||||||||||
| (e) Par value per Preferred Share |
$ | 0.10 | $ | 0.10 | $ | 0.05 | $ | 0.10 | ||||||||
| (f) Common Shares outstanding |
41,002,483 | 30,087,169 | 8,479,614 | 29,509,535 | ||||||||||||
| (g) Common Shares authorized |
199,981,860 | 199,990,153 | Unlimited | 199,991,081 | ||||||||||||
| (h) Par value per Common Share |
$ | 0.10 | $ | 0.10 | $ | 0.10 | $ | 0.10 | ||||||||
See notes to financial statements.
| F I N A N C I A L S T A T E M E N T S |
49 |
Statements of Assets and Liabilities (unaudited) (continued)
January 31, 2021
| MPA | ||||
|
|
||||
| ASSETS |
||||
| Investments at value — unaffiliated(a) |
$ | 349,707,668 | ||
| Investments at value — affiliated(b) |
3,756,683 | |||
| Cash pledged for futures contracts |
110,000 | |||
| Receivables: |
||||
| Dividends — affiliated |
31 | |||
| Interest — unaffiliated |
3,270,652 | |||
| Variation margin on futures contracts |
21,198 | |||
| Prepaid expenses |
78,857 | |||
|
|
|
|||
| Total assets |
356,945,089 | |||
|
|
|
|||
| ACCRUED LIABILITIES |
||||
| Bank overdraft |
24,309 | |||
| Payables: |
||||
| TOB Trust loan |
2,575,449 | |||
| Income dividend distributions — Common Shares |
731,877 | |||
| Interest expense and fees |
20,558 | |||
| Investment advisory fees |
147,074 | |||
| Directors’ and Officer’s fees |
12,013 | |||
| Other accrued expenses |
116,643 | |||
|
|
|
|||
| Total accrued liabilities |
3,627,923 | |||
|
|
|
|||
| OTHER LIABILITIES |
||||
| TOB Trust Certificates |
51,926,581 | |||
| VRDP Shares, at liquidation value of $100,000 per share, net of deferred offering costs(c)(d)(e) |
82,320,817 | |||
|
|
|
|||
| Total other liabilities |
134,247,398 | |||
|
|
|
|||
| Total liabilities |
137,875,321 | |||
|
|
|
|||
| NET ASSETS APPLICABLE TO COMMON SHAREHOLDERS |
$ | 219,069,768 | ||
|
|
|
|||
| NET ASSETS APPLICABLE TO COMMON SHAREHOLDERS CONSIST OF |
||||
| Paid-in capital(f)(g)(h) |
$ | 194,013,187 | ||
| Accumulated earnings |
25,056,581 | |||
|
|
|
|||
| NET ASSETS APPLICABLE TO COMMON SHAREHOLDERS |
$ | 219,069,768 | ||
|
|
|
|||
| Net asset value per Common Share |
$ | 16.46 | ||
|
|
|
|||
| (a) Investments at cost — unaffiliated |
$ | 320,002,780 | ||
| (b) Investments at cost — affiliated |
$ | 3,756,496 | ||
| (c) Preferred Shares outstanding |
826 | |||
| (d) Preferred Shares authorized |
1,000,000 | |||
| (e) Par value per Preferred Share |
$ | 0.05 | ||
| (f) Common Shares outstanding |
13,306,848 | |||
| (g) Common Shares authorized |
Unlimited | |||
| (h) Par value per Common Share |
$ | 0.10 | ||
See notes to financial statements.
| 50 | 2 0 2 1 B L A C K R O C K S E M I - A N N U A L R E P O R T T O S H A R E H O L D E R S |
Statements of Operations (unaudited)
Six Months Ended January 31, 2021
| MUC | MUJ | MFT | MIY | |||||||||||||
|
|
||||||||||||||||
| INVESTMENT INCOME |
||||||||||||||||
| Dividends — affiliated |
$ | 1,378 | $ | 343 | $ | 33 | $ | 217 | ||||||||
| Interest — unaffiliated |
18,092,412 | 14,764,466 | 4,078,818 | 13,511,598 | ||||||||||||
|
|
|
|
|
|
|
|
|
|||||||||
| Total investment income |
18,093,790 | 14,764,809 | 4,078,851 | 13,511,815 | ||||||||||||
|
|
|
|
|
|
|
|
|
|||||||||
| EXPENSES |
||||||||||||||||
| Investment advisory |
2,942,230 | 1,957,344 | 517,174 | 1,823,445 | ||||||||||||
| Directors and Officer |
74,736 | 14,017 | 4,105 | 13,836 | ||||||||||||
| Accounting services |
68,992 | 55,605 | 21,896 | 53,723 | ||||||||||||
| Professional |
64,219 | 55,107 | 34,236 | 43,527 | ||||||||||||
| Rating agency |
25,553 | 25,553 | 25,553 | 25,553 | ||||||||||||
| Transfer agent |
21,695 | 20,069 | 13,011 | 20,668 | ||||||||||||
| Registration |
6,841 | 5,039 | 4,074 | 4,943 | ||||||||||||
| Custodian |
4,655 | 3,842 | 4,451 | 3,646 | ||||||||||||
| Printing and postage |
538 | 974 | 1,066 | 708 | ||||||||||||
| Liquidity fees |
— | 12,179 | — | — | ||||||||||||
| Remarketing fees on Preferred Shares |
— | 11,936 | — | — | ||||||||||||
| Reorganization |
— | — | 170,621 | — | ||||||||||||
| Miscellaneous |
8,767 | 76,570 | 6,862 | 7,614 | ||||||||||||
|
|
|
|
|
|
|
|
|
|||||||||
| Total expenses excluding interest expense, fees and amortization of offering costs |
3,218,226 | 2,238,235 | 803,049 | 1,997,663 | ||||||||||||
| Interest expense, fees and amortization of offering costs(a) |
1,669,719 | 1,370,456 | 391,875 | 1,408,973 | ||||||||||||
|
|
|
|
|
|
|
|
|
|||||||||
| Total expenses |
4,887,945 | 3,608,691 | 1,194,924 | 3,406,636 | ||||||||||||
| Less: |
||||||||||||||||
| Fees waived and/or reimbursed by the Manager |
(177,934 | ) | (2,630 | ) | (34,908 | ) | (1,575 | ) | ||||||||
|
|
|
|
|
|
|
|
|
|||||||||
| Total expenses after fees waived and/or reimbursed |
4,710,011 | 3,606,061 | 1,160,016 | 3,405,061 | ||||||||||||
|
|
|
|
|
|
|
|
|
|||||||||
| Net investment income |
13,383,779 | 11,158,748 | 2,918,835 | 10,106,754 | ||||||||||||
|
|
|
|
|
|
|
|
|
|||||||||
| REALIZED AND UNREALIZED GAIN (LOSS) |
||||||||||||||||
| Net realized gain (loss) from: |
||||||||||||||||
| Investments — unaffiliated |
(11,186 | ) | 182,352 | 291,341 | 150,552 | |||||||||||
| Investments — affiliated |
(1,554 | ) | 656 | 16 | 327 | |||||||||||
| Futures contracts |
— | 379,487 | — | — | ||||||||||||
|
|
|
|
|
|
|
|
|
|||||||||
| (12,740 | ) | 562,495 | 291,357 | 150,879 | ||||||||||||
|
|
|
|
|
|
|
|
|
|||||||||
| Net change in unrealized appreciation (depreciation) on: |
||||||||||||||||
| Investments — unaffiliated |
8,007,551 | 12,684,035 | 2,516,496 | 2,944,548 | ||||||||||||
| Investments — affiliated |
1,481 | (347 | ) | — | 12 | |||||||||||
| Futures contracts |
456,755 | 218,376 | — | — | ||||||||||||
|
|
|
|
|
|
|
|
|
|||||||||
| 8,465,787 | 12,902,064 | 2,516,496 | 2,944,560 | |||||||||||||
|
|
|
|
|
|
|
|
|
|||||||||
| Net realized and unrealized gain |
8,453,047 | 13,464,559 | 2,807,853 | 3,095,439 | ||||||||||||
|
|
|
|
|
|
|
|
|
|||||||||
| NET INCREASE IN NET ASSETS APPLICABLE TO COMMON SHAREHOLDERS RESULTING FROM OPERATIONS |
$ | 21,836,826 | $ | 24,623,307 | $ | 5,726,688 | $ | 13,202,193 | ||||||||
|
|
|
|
|
|
|
|
|
|||||||||
| (a) | Related to TOB Trusts, VMTP Shares and/or VRDP Shares. |
See notes to financial statements.
| F I N A N C I A L S T A T E M E N T S |
51 |
Statements of Operations (unaudited) (continued)
Six Months Ended January 31, 2021
| MPA | ||||
|
|
||||
| INVESTMENT INCOME |
||||
| Dividends — affiliated |
$ | 149 | ||
| Interest — unaffiliated |
6,245,666 | |||
|
|
|
|||
| Total investment income |
6,245,815 | |||
|
|
|
|||
| EXPENSES |
||||
| Investment advisory |
865,272 | |||
| Liquidity fees |
339,278 | |||
| Professional |
41,140 | |||
| Accounting services |
31,052 | |||
| Rating agency |
25,553 | |||
| Remarketing fees on Preferred Shares |
21,204 | |||
| Transfer agent |
16,415 | |||
| Directors and Officer |
8,112 | |||
| Registration |
4,080 | |||
| Custodian |
1,237 | |||
| Printing and postage |
955 | |||
| Miscellaneous |
9,357 | |||
|
|
|
|||
|
Total expenses excluding interest expense, fees and amortization of offering costs |
1,363,655 | |||
| Interest expense, fees and amortization of offering costs(a) |
279,979 | |||
|
|
|
|||
| Total expenses |
1,643,634 | |||
| Less: |
||||
| Fees waived and/or reimbursed by the Manager |
(1,093 | ) | ||
|
|
|
|||
| Total expenses after fees waived and/or reimbursed |
1,642,541 | |||
|
|
|
|||
| Net investment income |
4,603,274 | |||
|
|
|
|||
| REALIZED AND UNREALIZED GAIN (LOSS) |
||||
| Net realized gain (loss) from: |
||||
| Investments — unaffiliated |
132,663 | |||
| Investments — affiliated |
(82 | ) | ||
| Futures contracts |
212,850 | |||
|
|
|
|||
| 345,431 | ||||
|
|
|
|||
| Net change in unrealized appreciation (depreciation) on: |
||||
| Investments — unaffiliated |
4,243,785 | |||
| Investments — affiliated |
187 | |||
| Futures contracts |
131,673 | |||
|
|
|
|||
| 4,375,645 | ||||
|
|
|
|||
| Net realized and unrealized gain |
4,721,076 | |||
|
|
|
|||
| NET INCREASE IN NET ASSETS APPLICABLE TO COMMON SHAREHOLDERS |
$ | 9,324,350 | ||
|
|
|
|||
| (a) | Related to TOB Trusts and/or VRDP Shares. |
See notes to financial statements.
| 52 | 2 0 2 1 B L A C K R O C K S E M I - A N N U A L R E P O R T T O S H A R E H O L D E R S |
Statements of Changes in Net Assets
| MUC | MUJ | |||||||||||||||
|
|
|
|
|
|||||||||||||
|
Six Months Ended |
Year Ended 07/31/20 |
Six Months Ended |
Year Ended 07/31/20 |
|||||||||||||
|
|
||||||||||||||||
| INCREASE (DECREASE) IN NET ASSETS APPLICABLE TO COMMON SHAREHOLDERS |
||||||||||||||||
| OPERATIONS |
||||||||||||||||
| Net investment income |
$ | 13,383,779 | $ | 23,910,053 | $ | 11,158,748 | $ | 20,766,165 | ||||||||
| Net realized gain (loss) |
(12,740 | ) | (14,683,337 | ) | 562,495 | (5,204,338 | ) | |||||||||
| Net change in unrealized appreciation |
8,465,787 | 29,113,036 | 12,902,064 | 216,496 | ||||||||||||
|
|
|
|
|
|
|
|
|
|||||||||
| Net increase in net assets applicable to Common Shareholders resulting from operations |
21,836,826 | 38,339,752 | 24,623,307 | 15,778,323 | ||||||||||||
|
|
|
|
|
|
|
|
|
|||||||||
| DISTRIBUTIONS TO COMMON SHAREHOLDERS(a) |
||||||||||||||||
| Decrease in net assets resulting from distributions to Common Shareholders |
(13,202,800 | ) | (22,325,852 | ) | (11,072,078 | ) | (19,607,452 | ) | ||||||||
|
|
|
|
|
|
|
|
|
|||||||||
| CAPITAL SHARE TRANSACTIONS |
||||||||||||||||
| Redemption of shares resulting from share repurchase program (including transaction costs) |
— | — | — | (886,136 | ) | |||||||||||
|
|
|
|
|
|
|
|
|
|||||||||
| NET ASSETS APPLICABLE TO COMMON SHAREHOLDERS |
||||||||||||||||
| Total increase (decrease) in net assets applicable to Common Shareholders |
8,634,026 | 16,013,900 | 13,551,229 | (4,715,265 | ) | |||||||||||
| Beginning of period |
653,835,883 | 637,821,983 | 476,309,176 | 481,024,441 | ||||||||||||
|
|
|
|
|
|
|
|
|
|||||||||
| End of period |
$ | 662,469,909 | $ | 653,835,883 | $ | 489,860,405 | $ | 476,309,176 | ||||||||
|
|
|
|
|
|
|
|
|
|||||||||
| (a) | Distributions for annual periods determined in accordance with U.S. federal income tax regulations. |
See notes to financial statements.
| F I N A N C I A L S T A T E M E N T S |
53 |
Statements of Changes in Net Assets (continued)
| MFT | MIY | |||||||||||||||
|
|
|
|
|
|||||||||||||
| Six Months Ended 01/31/21 (unaudited) |
Year Ended 07/31/20 |
Six Months Ended 01/31/21 (unaudited) |
Year Ended 07/31/20 |
|||||||||||||
|
|
||||||||||||||||
| INCREASE (DECREASE) IN NET ASSETS APPLICABLE TO COMMON SHAREHOLDERS |
||||||||||||||||
| OPERATIONS |
||||||||||||||||
| Net investment income |
$ | 2,918,835 | $ | 5,470,606 | $ | 10,106,754 | $ | 18,741,480 | ||||||||
| Net realized gain (loss) |
291,357 | (2,229,117 | ) | 150,879 | (4,427,689 | ) | ||||||||||
| Net change in unrealized appreciation |
2,516,496 | 2,868,601 | 2,944,560 | 8,459,328 | ||||||||||||
|
|
|
|
|
|
|
|
|
|||||||||
| Net increase in net assets applicable to Common Shareholders resulting from operations |
5,726,688 | 6,110,090 | 13,202,193 | 22,773,119 | ||||||||||||
|
|
|
|
|
|
|
|
|
|||||||||
| DISTRIBUTIONS TO COMMON SHAREHOLDERS(a) |
||||||||||||||||
| Decrease in net assets resulting from distributions to Common Shareholders |
(3,001,581 | ) | (5,205,604 | ) | (9,620,108 | ) | (17,499,956 | ) | ||||||||
|
|
|
|
|
|
|
|
|
|||||||||
| CAPITAL SHARE TRANSACTIONS |
||||||||||||||||
| Reinvestment of common distributions |
12,869 | 11,012 | — | — | ||||||||||||
| Redemption of shares resulting from share repurchase program (including transaction costs) |
— | — | — | (886,694 | ) | |||||||||||
|
|
|
|
|
|
|
|
|
|||||||||
| Net increase (decrease) in net assets derived from capital share transactions |
12,869 | 11,012 | — | (886,694 | ) | |||||||||||
|
|
|
|
|
|
|
|
|
|||||||||
| NET ASSETS APPLICABLE TO COMMON SHAREHOLDERS |
||||||||||||||||
| Total increase in net assets applicable to Common Shareholders |
2,737,976 | 915,498 | 3,582,085 | 4,386,469 | ||||||||||||
| Beginning of period |
121,810,053 | 120,894,555 | 468,752,104 | 464,365,635 | ||||||||||||
|
|
|
|
|
|
|
|
|
|||||||||
| End of period |
$ | 124,548,029 | $ | 121,810,053 | $ | 472,334,189 | $ | 468,752,104 | ||||||||
|
|
|
|
|
|
|
|
|
|||||||||
| (a) | Distributions for annual periods determined in accordance with U.S. federal income tax regulations. |
See notes to financial statements.
| 54 | 2 0 2 1 B L A C K R O C K S E M I - A N N U A L R E P O R T T O S H A R E H O L D E R S |
Statements of Changes in Net Assets (continued)
| MPA | ||||||||
|
|
|
|||||||
| Six Months Ended 01/31/21 (unaudited) |
Year Ended 07/31/20 |
|||||||
|
|
||||||||
| INCREASE (DECREASE) IN NET ASSETS APPLICABLE TO COMMON SHAREHOLDERS |
||||||||
| OPERATIONS |
||||||||
| Net investment income |
$ | 4,603,274 | $ | 8,621,926 | ||||
| Net realized gain (loss) |
345,431 | (3,034,767 | ) | |||||
| Net change in unrealized appreciation |
4,375,645 | 2,289,761 | ||||||
|
|
|
|
|
|||||
| Net increase in net assets applicable to Common Shareholders resulting from operations |
9,324,350 | 7,876,920 | ||||||
|
|
|
|
|
|||||
| DISTRIBUTIONS TO COMMON SHAREHOLDERS(a) |
||||||||
| Decrease in net assets resulting from distributions to Common Shareholders |
(4,391,260 | ) | (7,602,490 | ) | ||||
|
|
|
|
|
|||||
| CAPITAL SHARE TRANSACTIONS |
||||||||
| Redemption of shares resulting from share repurchase program (including transaction costs) |
(18,678 | ) | (478,011 | ) | ||||
|
|
|
|
|
|||||
| NET ASSETS APPLICABLE TO COMMON SHAREHOLDERS |
||||||||
| Total increase (decrease) in net assets applicable to Common Shareholders |
4,914,412 | (203,581 | ) | |||||
| Beginning of period |
214,155,356 | 214,358,937 | ||||||
|
|
|
|
|
|||||
| End of period |
$ | 219,069,768 | $ | 214,155,356 | ||||
|
|
|
|
|
|||||
| (a) | Distributions for annual periods determined in accordance with U.S. federal income tax regulations. |
See notes to financial statements.
| F I N A N C I A L S T A T E M E N T S |
55 |
Statements of Cash Flows (unaudited)
Six Months Ended January 31, 2021
| MUC | MUJ | MFT | MIY | |||||||||||||
|
|
||||||||||||||||
| CASH PROVIDED BY (USED FOR) OPERATING ACTIVITIES |
||||||||||||||||
| Net increase in net assets resulting from operations |
$ | 21,836,826 | $ | 24,623,307 | $ | 5,726,688 | $ | 13,202,193 | ||||||||
| Adjustments to reconcile net increase in net assets resulting from operations to net cash provided by operating activities |
||||||||||||||||
| Proceeds from sales of long-term investments |
28,298,550 | 41,610,086 | 16,333,414 | 12,240,407 | ||||||||||||
| Purchases of long-term investments |
(18,746,877 | ) | (25,029,069 | ) | (16,914,524 | ) | (12,901,850 | ) | ||||||||
| Net purchases of short-term securities |
(13,286,156 | ) | (8,004,342 | ) | (277,522 | ) | (2,008,108 | ) | ||||||||
| Amortization of premium and accretion of discount on investments and other fees |
3,380,592 | 380,337 | 397,099 | 2,175,095 | ||||||||||||
| Net realized (gain) loss on investments |
12,740 | (183,008 | ) | (291,357 | ) | (150,879 | ) | |||||||||
| Net unrealized appreciation on investments |
(8,009,032 | ) | (12,683,688 | ) | (2,516,496 | ) | (2,944,560 | ) | ||||||||
| (Increase) Decrease in Assets |
||||||||||||||||
| Receivables |
||||||||||||||||
| Dividends — affiliated |
(66 | ) | 170 | (2 | ) | 90 | ||||||||||
| Interest — unaffiliated |
487,958 | 210,335 | (30,435 | ) | 76,929 | |||||||||||
| Variation margin on futures contracts |
(92,521 | ) | (36,295 | ) | — | — | ||||||||||
| Prepaid expenses |
11,796 | 37,583 | 28,830 | (192,243 | ) | |||||||||||
| Increase (Decrease) in Liabilities |
||||||||||||||||
| Payables |
||||||||||||||||
| Interest expense and fees |
(306,257 | ) | (65,777 | ) | (23,910 | ) | (38,950 | ) | ||||||||
| Investment advisory fees |
10,211 | 4,431 | 2,279 | 2,925 | ||||||||||||
| Directors’ and Officer’s fees |
46,149 | 643 | 156 | 768 | ||||||||||||
| Other accrued expenses |
(18,623 | ) | 46,968 | (26,485 | ) | 5,795 | ||||||||||
| Reorganization costs |
— | — | 71,681 | — | ||||||||||||
|
|
|
|
|
|
|
|
|
|||||||||
| Net cash provided by operating activities |
13,625,290 | 20,911,681 | 2,479,416 | 9,467,612 | ||||||||||||
|
|
|
|
|
|
|
|
|
|||||||||
| CASH PROVIDED BY (USED FOR) FINANCING ACTIVITIES |
||||||||||||||||
| Cash dividends paid to Common Shareholders |
(13,038,790 | ) | (10,921,642 | ) | (2,963,222 | ) | (9,472,560 | ) | ||||||||
| Repayments of TOB Trust Certificates |
— | (9,765,607 | ) | (893,960 | ) | — | ||||||||||
| Repayments of Loan for TOB Trust Certificates |
— | — | (554,061 | ) | — | |||||||||||
| Proceeds from TOB Trust Certificates |
— | — | 1,761,778 | — | ||||||||||||
| Proceeds from Loan for TOB Trust Certificates |
— | — | 554,061 | — | ||||||||||||
| Decrease in bank overdraft |
— | — | (384,012 | ) | — | |||||||||||
| Amortization of deferred offering costs |
— | 9,599 | — | 4,948 | ||||||||||||
|
|
|
|
|
|
|
|
|
|||||||||
| Net cash used for financing activities |
(13,038,790 | ) | (20,677,650 | ) | (2,479,416 | ) | (9,467,612 | ) | ||||||||
|
|
|
|
|
|
|
|
|
|||||||||
| CASH |
||||||||||||||||
| Net increase in restricted and unrestricted cash |
586,500 | 234,031 | — | — | ||||||||||||
| Restricted and unrestricted cash at beginning of period |
— | — | — | — | ||||||||||||
|
|
|
|
|
|
|
|
|
|||||||||
| Restricted and unrestricted cash at end of period |
$ | 586,500 | $ | 234,031 | $ | — | $ | — | ||||||||
|
|
|
|
|
|
|
|
|
|||||||||
| SUPPLEMENTAL DISCLOSURE OF CASH FLOW INFORMATION |
||||||||||||||||
| Cash paid during the period for interest expense |
$ | 1,975,976 | $ | 1,426,634 | $ | 415,785 | $ | 1,442,975 | ||||||||
|
|
|
|
|
|
|
|
|
|||||||||
| NON-CASH FINANCING ACTIVITIES |
||||||||||||||||
| Capital shares issued in reinvestment of distributions paid to Common Shareholders |
$ | — | $ | — | $ | 12,869 | $ | — | ||||||||
|
|
|
|
|
|
|
|
|
|||||||||
| RECONCILIATION OF RESTRICTED AND UNRESTRICTED CASH AT THE END OF PERIOD TO THE STATEMENTS OF ASSETS AND LIABILITIES |
||||||||||||||||
| Cash |
$ | 105,500 | $ | 42,031 | $ | — | $ | — | ||||||||
| Cash pledged |
||||||||||||||||
| Futures contracts |
481,000 | 192,000 | — | — | ||||||||||||
|
|
|
|
|
|
|
|
|
|||||||||
| $ | 586,500 | $ | 234,031 | $ | — | $ | — | |||||||||
|
|
|
|
|
|
|
|
|
|||||||||
See notes to financial statements.
| 56 | 2 0 2 1 B L A C K R O C K S E M I - A N N U A L R E P O R T T O S H A R E H O L D E R S |
Statements of Cash Flows (unaudited) (continued)
Six Months Ended January 31, 2021
| MPA | ||||
|
|
||||
| CASH PROVIDED BY (USED FOR) OPERATING ACTIVITIES |
||||
| Net increase in net assets resulting from operations |
$ | 9,324,350 | ||
| Adjustments to reconcile net increase in net assets resulting from operations to net cash provided by operating activities |
||||
| Proceeds from sales of long-term investments |
17,290,841 | |||
| Purchases of long-term investments |
(16,318,913 | ) | ||
| Net purchases of short-term securities |
(1,875,934 | ) | ||
| Amortization of premium and accretion of discount on investments and other fees |
624,213 | |||
| Net realized gain on investments |
(132,581 | ) | ||
| Net unrealized appreciation on investments |
(4,243,972 | ) | ||
| (Increase) Decrease in Assets |
||||
| Receivables |
||||
| Dividends — affiliated |
33 | |||
| Interest — unaffiliated |
(18,787 | ) | ||
| Variation margin on futures contracts |
(21,198 | ) | ||
| Prepaid expenses |
30,486 | |||
| Increase (Decrease) in Liabilities |
||||
| Payables |
||||
| Interest expense and fees |
(69,091 | ) | ||
| Investment advisory fees |
2,986 | |||
| Directors’ and Officer’s fees |
1,724 | |||
| Other accrued expenses |
(14,251 | ) | ||
|
|
|
|||
| Net cash provided by operating activities |
4,579,906 | |||
|
|
|
|||
| CASH PROVIDED BY (USED FOR) FINANCING ACTIVITIES |
||||
| Cash dividends paid to Common Shareholders |
(4,392,092 | ) | ||
| Repayments of TOB Trust Certificates |
(544,551 | ) | ||
| Repayments of Loan for TOB Trust Certificates |
(560,000 | ) | ||
| Net payments on redemption of Common Shares |
(59,457 | ) | ||
| Proceeds from TOB Trust Certificates |
564,999 | |||
| Proceeds from Loan for TOB Trust Certificates |
560,000 | |||
| Decrease in bank overdraft |
(45,159 | ) | ||
| Amortization of deferred offering costs |
6,354 | |||
|
|
|
|||
| Net cash used for financing activities |
(4,469,906 | ) | ||
|
|
|
|||
| CASH |
||||
| Net increase in restricted and unrestricted cash |
110,000 | |||
| Restricted and unrestricted cash at beginning of period |
— | |||
|
|
|
|||
| Restricted and unrestricted cash at end of period |
$ | 110,000 | ||
|
|
|
|||
| SUPPLEMENTAL DISCLOSURE OF CASH FLOW INFORMATION |
||||
| Cash paid during the period for interest expense. |
$ | 342,716 | ||
|
|
|
|||
| RECONCILIATION OF RESTRICTED AND UNRESTRICTED CASH AT THE END OF PERIOD TO THE STATEMENTS OF ASSETS AND LIABILITIES |
||||
| Cash pledged |
||||
| Futures contracts |
110,000 | |||
|
|
|
|||
| $ | 110,000 | |||
|
|
|
|||
See notes to financial statements.
| F I N A N C I A L S T A T E M E N T S |
57 |
(For a share outstanding throughout each period)
| M UC |
||||||||||||||||||||||||||||||||
| Six Months Ended |
Year Ended July 31, |
|||||||||||||||||||||||||||||||
| (unaudited) | 2020 | 2019 | 2018 | 2017 | 2016 | |||||||||||||||||||||||||||
| Net asset value, beginning of period. |
$ | 15.95 | $ | 15.56 | $ | 15.03 | $ | 15.53 | $ | 16.51 | $ | 15.78 | ||||||||||||||||||||
|
|
|
|
|
|
|
|
|
|
|
|
|
|||||||||||||||||||||
| Net investment income(a) |
0.33 | 0.58 | 0.57 | 0.64 | 0.69 | 0.77 | ||||||||||||||||||||||||||
| Net realized and unrealized gain (loss) |
0.20 | 0.35 | 0.54 | (0.47 | ) | (0.93 | ) | 0.76 | ||||||||||||||||||||||||
|
|
|
|
|
|
|
|
|
|
|
|
|
|||||||||||||||||||||
| Net increase (decrease) from investment operations |
0.53 | 0.93 | 1.11 | 0.17 | (0.24 | ) | 1.53 | |||||||||||||||||||||||||
|
|
|
|
|
|
|
|
|
|
|
|
|
|||||||||||||||||||||
| Distributions to Common Shareholders(b) |
||||||||||||||||||||||||||||||||
| From net investment income |
(0.32 | ) | (0.54 | ) | (0.57 | ) | (0.67 | ) | (0.74 | ) | (0.80 | ) | ||||||||||||||||||||
| From net realized gain |
— | — | (0.01 | ) | — | — | — | |||||||||||||||||||||||||
|
|
|
|
|
|
|
|
|
|
|
|
|
|||||||||||||||||||||
| Total distributions to Common Shareholders |
(0.32 | ) | (0.54 | ) | (0.58 | ) | (0.67 | ) | (0.74 | ) | (0.80 | ) | ||||||||||||||||||||
|
|
|
|
|
|
|
|
|
|
|
|
|
|||||||||||||||||||||
| Net asset value, end of period |
$ | 16.16 | $ | 15.95 | $ | 15.56 | $ | 15.03 | $ | 15.53 | $ | 16.51 | ||||||||||||||||||||
|
|
|
|
|
|
|
|
|
|
|
|
|
|||||||||||||||||||||
| Market price, end of period |
$ | 15.00 | $ | 14.67 | $ | 14.00 | $ | 13.07 | $ | 14.75 | $ | 16.28 | ||||||||||||||||||||
|
|
|
|
|
|
|
|
|
|
|
|
|
|||||||||||||||||||||
| Total Return Applicable to Common Shareholders(c) |
||||||||||||||||||||||||||||||||
| Based on net asset value |
3.57 | %(d) | 6.55 | % | 8.17 | % | 1.54 | % | (1.08 | )% | 10.20 | % | ||||||||||||||||||||
|
|
|
|
|
|
|
|
|
|
|
|
|
|||||||||||||||||||||
| Based on market price |
4.52 | %(d) | 8.92 | % | 11.92 | % | (7.03 | )% | (4.73 | )% | 20.08 | % | ||||||||||||||||||||
|
|
|
|
|
|
|
|
|
|
|
|
|
|||||||||||||||||||||
| Ratios to Average Net Assets Applicable to Common Shareholders |
||||||||||||||||||||||||||||||||
| Total expenses |
1.49 | %(e)(f) | 2.11 | % | 2.58 | % | 2.38 | % | 2.04 | % | 1.60 | % | ||||||||||||||||||||
|
|
|
|
|
|
|
|
|
|
|
|
|
|||||||||||||||||||||
| Total expenses after fees waived and/or reimbursed |
1.44 | %(e)(f) | 2.05 | % | 2.50 | % | 2.29 | % | 1.96 | % | 1.55 | % | ||||||||||||||||||||
|
|
|
|
|
|
|
|
|
|
|
|
|
|||||||||||||||||||||
| Total expenses after fees waived and/or reimbursed and excluding interest expense, fees, and amortization of offering cost(g) |
0.93 | %(e)(f) | 0.92 | % | 0.92 | % | 0.93 | % | 0.93 | % | 0.93 | % | ||||||||||||||||||||
|
|
|
|
|
|
|
|
|
|
|
|
|
|||||||||||||||||||||
| Net investment income to Common Shareholders |
4.09 | %(e)(f) | 3.75 | % | 3.82 | % | 4.20 | % | 4.44 | % | 4.79 | % | ||||||||||||||||||||
|
|
|
|
|
|
|
|
|
|
|
|
|
|||||||||||||||||||||
| Supplemental Data |
||||||||||||||||||||||||||||||||
| Net assets applicable to Common Shareholders, end of period (000) |
$ | 662,470 | $ | 653,836 | $ | 637,822 | $ | 616,387 | $ | 636,865 | $ | 677,128 | ||||||||||||||||||||
|
|
|
|
|
|
|
|
|
|
|
|
|
|||||||||||||||||||||
| VMTP Shares outstanding at $100,000 liquidation value, end of period (000) |
$ | 254,000 | $ | 254,000 | $ | 254,000 | $ | 254,000 | $ | 254,000 | $ | 254,000 | ||||||||||||||||||||
|
|
|
|
|
|
|
|
|
|
|
|
|
|||||||||||||||||||||
| Asset coverage per VMTP Shares at $100,000 liquidation value, end of period |
$ | 360,815 | $ | 357,416 | $ | 351,111 | $ | 342,672 | $ | 350,734 | $ | 366,586 | ||||||||||||||||||||
|
|
|
|
|
|
|
|
|
|
|
|
|
|||||||||||||||||||||
| Borrowings outstanding, end of period (000) |
$ | 158,512 | $ | 158,512 | $ | 159,555 | $ | 185,905 | $ | 181,685 | $ | 169,699 | ||||||||||||||||||||
|
|
|
|
|
|
|
|
|
|
|
|
|
|||||||||||||||||||||
| Portfolio turnover rate |
2 | % | 16 | % | 24 | % | 24 | % | 19 | % | 21 | % | ||||||||||||||||||||
|
|
|
|
|
|
|
|
|
|
|
|
|
|||||||||||||||||||||
| (a) | Based on average Common Shares outstanding. |
| (b) | Distributions for annual periods determined in accordance with U.S. federal income tax regulations. |
| (c) | Total returns based on market price, which can be significantly greater or less than the net asset value, may result in substantially different returns. Where applicable, excludes the effects of any sales charges and assumes the reinvestment of distributions at actual reinvestment prices. |
| (d) | Aggregate total return. |
| (e) | Annualized. |
| (f) | Excludes expenses incurred indirectly as a result of investments in underlying funds of 0.01%. |
| (g) | Interest expense, fees and amortization of offering costs related to TOB Trusts and/or VMTP Shares. See Note 4 and Note 10 of the Notes to Financial Statements for details. |
See notes to financial statements.
| 58 | 2 0 2 1 B L A C K R O C K S E M I - A N N U A L R E P O R T T O S H A R E H O L D E R S |
Financial Highlights (continued)
(For a share outstanding throughout each period)
|
|
MUJ | |||||||||||||||||||||||||||||||
| Six Months Ended 01/31/21 |
Year Ended July 31, |
|||||||||||||||||||||||||||||||
| (unaudited) | 2020 | 2019 | 2018 | 2017 | 2016 | |||||||||||||||||||||||||||
|
Net asset value, beginning of period. |
$ | 15.83 | $ | 15.95 | $ | 15.28 | $ | 15.57 | $ | 16.55 | $ | 15.62 | ||||||||||||||||||||
|
|
|
|
|
|
|
|
|
|
|
|
|
|||||||||||||||||||||
| Net investment income(a) |
0.37 | 0.69 | 0.66 | 0.71 | 0.77 | 0.84 | ||||||||||||||||||||||||||
| Net realized and unrealized gain (loss) |
0.45 | (0.16 | ) | 0.64 | (0.26 | ) | (0.94 | ) | 0.96 | |||||||||||||||||||||||
|
|
|
|
|
|
|
|
|
|
|
|
|
|||||||||||||||||||||
| Net increase (decrease) from investment operations |
0.82 | 0.53 | 1.30 | 0.45 | (0.17 | ) | 1.80 | |||||||||||||||||||||||||
|
|
|
|
|
|
|
|
|
|
|
|
|
|||||||||||||||||||||
| Distributions to Common Shareholders from net investment income(b) |
(0.37 | ) | (0.65 | ) | (0.63 | ) | (0.74 | ) | (0.81 | ) | (0.87 | ) | ||||||||||||||||||||
|
|
|
|
|
|
|
|
|
|
|
|
|
|||||||||||||||||||||
| Net asset value, end of period |
$ | 16.28 | $ | 15.83 | $ | 15.95 | $ | 15.28 | $ | 15.57 | $ | 16.55 | ||||||||||||||||||||
|
|
|
|
|
|
|
|
|
|
|
|
|
|||||||||||||||||||||
| Market price, end of period |
$ | 14.46 | $ | 14.21 | $ | 14.43 | $ | 12.90 | $ | 14.88 | $ | 16.12 | ||||||||||||||||||||
|
|
|
|
|
|
|
|
|
|
|
|
|
|||||||||||||||||||||
| Total Return Applicable to Common Shareholders(c) |
||||||||||||||||||||||||||||||||
| Based on net asset value. |
5.54 | %(d) | 3.98 | % | 9.44 | % | 3.52 | % | (0.57 | )% | 12.39 | % | ||||||||||||||||||||
|
|
|
|
|
|
|
|
|
|
|
|
|
|||||||||||||||||||||
| Based on market price |
4.43 | %(d) | 3.17 | % | 17.28 | % | (8.55 | )% | (2.44 | )% | 26.20 | % | ||||||||||||||||||||
|
|
|
|
|
|
|
|
|
|
|
|
|
|||||||||||||||||||||
| Ratios to Average Net Assets Applicable to Common Shareholders |
| |||||||||||||||||||||||||||||||
| Total expenses |
1.50 | %(e) | 2.14 | % | 2.49 | % | 2.23 | % | 1.89 | % | 1.52 | % | ||||||||||||||||||||
|
|
|
|
|
|
|
|
|
|
|
|
|
|||||||||||||||||||||
| Total expenses after fees waived and/or reimbursed |
1.50 | %(e) | 2.14 | % | 2.49 | % | 2.23 | % | 1.89 | % | 1.52 | % | ||||||||||||||||||||
|
|
|
|
|
|
|
|
|
|
|
|
|
|||||||||||||||||||||
| Total expenses after fees waived and/or reimbursed and excluding interest expense, fees, and amortization of offering cost(f)(g) |
0.93 | %(e) | 0.92 | % | 0.92 | % | 0.93 | % | 0.91 | % | 0.90 | % | ||||||||||||||||||||
|
|
|
|
|
|
|
|
|
|
|
|
|
|||||||||||||||||||||
| Net investment income to Common Shareholders |
4.64 | %(e) | 4.39 | % | 4.28 | % | 4.60 | % | 4.95 | % | 5.27 | % | ||||||||||||||||||||
|
|
|
|
|
|
|
|
|
|
|
|
|
|||||||||||||||||||||
| Supplemental Data |
||||||||||||||||||||||||||||||||
| Net assets, end of period (000) |
$ | 489,860 | $ | 476,309 | $ | 481,024 | $ | 460,727 | $ | 469,417 | $ | 499,058 | ||||||||||||||||||||
|
|
|
|
|
|
|
|
|
|
|
|
|
|||||||||||||||||||||
| VRDP Shares outstanding at $100,000 liquidation value, end of period (000) |
$ | 237,100 | $ | 237,100 | $ | 237,100 | $ | 237,100 | $ | 237,100 | $ | 237,100 | ||||||||||||||||||||
|
|
|
|
|
|
|
|
|
|
|
|
|
|||||||||||||||||||||
| Asset coverage per VRDP Shares at $100,000 liquidation value, end of period |
$ | 306,605 | $ | 300,890 | $ | 302,878 | $ | 294,318 | $ | 297,983 | $ | 310,484 | ||||||||||||||||||||
|
|
|
|
|
|
|
|
|
|
|
|
|
|||||||||||||||||||||
| Borrowings outstanding, end of period (000) |
$ | 61,534 | $ | 71,300 | $ | 59,415 | $ | 62,747 | $ | 63,877 | $ | 55,089 | ||||||||||||||||||||
|
|
|
|
|
|
|
|
|
|
|
|
|
|||||||||||||||||||||
| Portfolio turnover rate |
4 | % | 13 | % | 8 | % | 14 | % | 8 | % | 9 | % | ||||||||||||||||||||
|
|
|
|
|
|
|
|
|
|
|
|
|
|||||||||||||||||||||
| (a) | Based on average Common Shares outstanding. |
| (b) | Distributions for annual periods determined in accordance with U.S. federal income tax regulations. |
| (c) | Total returns based on market price, which can be significantly greater or less than the net asset value, may result in substantially different returns. Where applicable, excludes the effects of any sales charges and assumes the reinvestment of distributions at actual reinvestment prices. |
| (d) | Aggregate total return. |
| (e) | Annualized. |
| (f) | Interest expense, fees and amortization of offering costs related to TOB Trusts and/or VRDP Shares. See Note 4 and Note 10 of the Notes to Financial Statements for details. |
| (g) | The total expense ratio after fees waived and/or reimbursed and excluding interest expense, fees, amortization of offering costs, liquidity and remarketing fees as follows: |
|
Six Months Ended 01/31/21 (unaudited) |
Year Ended July 31, | |||||||||||||||||||||||||||
| 2020 | 2019 | 2018 | 2017 | 2016 | ||||||||||||||||||||||||
| Expense ratios |
0.92 | % | 0.91 | % | 0.91 | % | 0.93 | % | 0.91 | % | 0.89 | % | ||||||||||||||||
|
|
|
|
|
|
|
|
|
|
|
|
|
|||||||||||||||||
See notes to financial statements.
| F I N A N C I A L H I G H L I G H T S |
59 |
Financial Highlights (continued)
(For a share outstanding throughout each period)
| MFT | ||||||||||||||||||||||||||||||||||
| Six Months Ended 01/31/21 |
Year Ended July 31, | |||||||||||||||||||||||||||||||||
| (unaudited) |
2020 |
2019 |
2018 |
2017 |
2016 |
|||||||||||||||||||||||||||||
|
Net asset value, beginning of period |
$ | 14.37 | $ | 14.26 | $ | 13.90 | $ | 14.60 | $ | 15.55 | $ | 14.95 | ||||||||||||||||||||||
|
|
|
|
|
|
|
|
|
|
|
|
|
|||||||||||||||||||||||
| Net investment income(a) |
0.34 | 0.65 | 0.65 | 0.74 | 0.79 | 0.83 | ||||||||||||||||||||||||||||
| Net realized and unrealized gain (loss) |
0.33 | 0.07 | 0.41 | (0.64 | ) | (0.91 | ) | 0.62 | ||||||||||||||||||||||||||
|
|
|
|
|
|
|
|
|
|
|
|
|
|||||||||||||||||||||||
| Net increase (decrease) from investment operations |
0.67 | 0.72 | 1.06 | 0.10 | (0.12 | ) | 1.45 | |||||||||||||||||||||||||||
|
|
|
|
|
|
|
|
|
|
|
|
|
|||||||||||||||||||||||
| Distributions to Common Shareholders from net investment income(b) |
(0.35 | ) | (0.61 | ) | (0.70 | ) | (0.80 | ) | (0.83 | ) | (0.85 | ) | ||||||||||||||||||||||
|
|
|
|
|
|
|
|
|
|
|
|
|
|||||||||||||||||||||||
| Net asset value, end of period |
$ | 14.69 | $ | 14.37 | $ | 14.26 | $ | 13.90 | $ | 14.60 | $ | 15.55 | ||||||||||||||||||||||
|
|
|
|
|
|
|
|
|
|
|
|
|
|||||||||||||||||||||||
| Market price, end of period |
$ | 14.52 | $ | 13.97 | $ | 13.59 | $ | 13.03 | $ | 14.67 | $ | 16.09 | ||||||||||||||||||||||
|
|
|
|
|
|
|
|
|
|
|
|
|
|||||||||||||||||||||||
| Total Return Applicable to Common Shareholders(c) |
||||||||||||||||||||||||||||||||||
| Based on net asset value |
4.82 | %(d) | 5.48 | % | 8.21 | % | 0.92 | % | (0.51 | )% | 10.31 | % | ||||||||||||||||||||||
|
|
|
|
|
|
|
|
|
|
|
|
|
|||||||||||||||||||||||
| Based on market price |
6.57 | %(d) | 7.60 | % | 10.01 | % | (5.85 | )% | (3.39 | )% | 27.63 | % | ||||||||||||||||||||||
|
|
|
|
|
|
|
|
|
|
|
|
|
|||||||||||||||||||||||
| Ratios to Average Net Assets Applicable to Common Shareholders |
||||||||||||||||||||||||||||||||||
| Total expenses |
1.96 | %(e)(f) | 2.30 | %(g) | 2.82 | % | 2.47 | % | 2.07 | % | 1.61 | % | ||||||||||||||||||||||
|
|
|
|
|
|
|
|
|
|
|
|
|
|||||||||||||||||||||||
| Total expenses after fees waived and/or reimbursed |
1.90 | %(e)(f) | 2.30 | %(g) | 2.82 | % | 2.47 | % | 2.07 | % | 1.61 | % | ||||||||||||||||||||||
|
|
|
|
|
|
|
|
|
|
|
|
|
|||||||||||||||||||||||
| Total expenses after fees waived and/or reimbursed and excluding interest expense, fees, and amortization of offering cost(h) |
1.26 | %(e)(f) | 1.07 | %(g) | 1.05 | % | 1.03 | % | 1.00 | % | 0.96 | % | ||||||||||||||||||||||
|
|
|
|
|
|
|
|
|
|
|
|
|
|||||||||||||||||||||||
| Net investment income to Common Shareholders |
4.79 | %(e) | 4.58 | % | 4.68 | % | 5.23 | % | 5.35 | % | 5.45 | % | ||||||||||||||||||||||
|
|
|
|
|
|
|
|
|
|
|
|
|
|||||||||||||||||||||||
| Supplemental Data |
||||||||||||||||||||||||||||||||||
| Net assets, end of period (000) |
$ | 124,548 | $ | 121,810 | $ | 120,895 | $ | 117,795 | $ | 123,705 | $ | 131,739 | ||||||||||||||||||||||
|
|
|
|
|
|
|
|
|
|
|
|
|
|||||||||||||||||||||||
| VMTP Shares outstanding at $100,000 liquidation value, end of period (000) |
$ | 56,500 | $ | 56,500 | $ | 56,500 | $ | 56,500 | $ | 56,500 | $ | 56,500 | ||||||||||||||||||||||
|
|
|
|
|
|
|
|
|
|
|
|
|
|||||||||||||||||||||||
| Asset coverage per VMTP Shares at $100,000 liquidation value, end of period |
$ | 320,439 | $ | 315,593 | $ | 313,973 | $ | 308,487 | $ | 318,947 | $ | 333,167 | ||||||||||||||||||||||
|
|
|
|
|
|
|
|
|
|
|
|
|
|||||||||||||||||||||||
| Borrowings outstanding, end of period (000) |
$ | 27,590 | $ | 26,722 | $ | 26,002 | $ | 28,786 | $ | 27,229 | $ | 21,953 | ||||||||||||||||||||||
|
|
|
|
|
|
|
|
|
|
|
|
|
|||||||||||||||||||||||
| Portfolio turnover rate |
8 | % | 36 | % | 39 | % | 30 | % | 34 | % | 21 | % | ||||||||||||||||||||||
|
|
|
|
|
|
|
|
|
|
|
|
|
|||||||||||||||||||||||
| (a) | Based on average Common Shares outstanding. |
| (b) | Distributions for annual periods determined in accordance with U.S. federal income tax regulations. |
| (c) | Total returns based on market price, which can be significantly greater or less than the net asset value, may result in substantially different returns. Where applicable, excludes the effects of any sales charges and assumes the reinvestment of distributions at actual reinvestment prices. |
| (d) | Aggregate total return. |
| (e) | Annualized. |
| (f) | Includes non-recurring expenses of reorganization costs. Without these costs, total expenses, total expenses after fees waived and/or reimbursed and total expenses after fees waived and/or reimbursed and excluding interest expense, fees and amortization of offering costs would have been 1.68%, 1.68% and 1.04%, respectively. |
| (g) | Includes non-recurring expenses of reorganization costs. Without these costs, total expenses, total expenses after fees waived and/or reimbursed and total expenses after fees waived and/or reimbursed and excluding interest expense, fees and amortization of offering costs would have been 2.26%, 2.26% and 1.03%, respectively. |
| (h) | Interest expense, fees and amortization of offering costs related to TOB Trusts and/or VRDP Shares. See Note 4 and Note 10 of the Notes to Financial Statements for details. |
See notes to financial statements.
| 60 | 2 0 2 1 B L A C K R O C K S E M I - A N N U A L R E P O R T T O S H A R E H O L D E R S |
Financial Highlights (continued)
(For a share outstanding throughout each period)
| MIY | ||||||||||||||||||||||||||||
| Six Months Ended 01/31/21 |
Year Ended July 31, | |||||||||||||||||||||||||||
| (unaudited) | 2020 | 2019 | 2018 | 2017 | 2016 | |||||||||||||||||||||||
|
Net asset value, beginning of period |
|
$ | 15.88 | $ | 15.70 | $ | 15.04 | $ | 15.48 | $ | 16.36 | $ | 15.48 | |||||||||||||||
|
|
|
|
|
|
|
|
|
|
|
|
|
|||||||||||||||||
| Net investment income(a) |
0.34 | 0.63 | 0.62 | 0.69 | 0.75 | 0.79 | ||||||||||||||||||||||
| Net realized and unrealized gain (loss) |
0.12 | 0.14 | 0.66 | (0.42 | ) | (0.86 | ) | 0.92 | ||||||||||||||||||||
|
|
|
|
|
|
|
|
|
|
|
|
|
|||||||||||||||||
| Net increase (decrease) from investment operations |
0.46 | 0.77 | 1.28 | 0.27 | (0.11 | ) | 1.71 | |||||||||||||||||||||
|
|
|
|
|
|
|
|
|
|
|
|
|
|||||||||||||||||
| Distributions to Common Shareholders from net investment income(b) |
(0.33 | ) | (0.59 | ) | (0.62 | ) | (0.71 | ) | (0.77 | ) | (0.83 | ) | ||||||||||||||||
|
|
|
|
|
|
|
|
|
|
|
|
|
|||||||||||||||||
| Net asset value, end of period |
$ | 16.01 | $ | 15.88 | $ | 15.70 | $ | 15.04 | $ | 15.48 | $ | 16.36 | ||||||||||||||||
|
|
|
|
|
|
|
|
|
|
|
|
|
|||||||||||||||||
| Market price, end of period |
$ | 14.80 | $ | 14.24 | $ | 14.24 | $ | 12.89 | $ | 14.19 | $ | 15.38 | ||||||||||||||||
|
|
|
|
|
|
|
|
|
|
|
|
|
|||||||||||||||||
| Total Return Applicable to Common Shareholders(c) |
||||||||||||||||||||||||||||
| Based on net asset value |
3.14 | %(d) | 5.52 | % | 9.42 | % | 2.37 | % | (0.07 | )% | 11.99 | % | ||||||||||||||||
|
|
|
|
|
|
|
|
|
|
|
|
|
|||||||||||||||||
| Based on market price |
6.32 | %(d) | 4.31 | % | 15.80 | % | (4.29 | )% | (2.56 | )% | 23.28 | % | ||||||||||||||||
|
|
|
|
|
|
|
|
|
|
|
|
|
|||||||||||||||||
| Ratios to Average Net Assets Applicable to Common Shareholders |
||||||||||||||||||||||||||||
| Total expenses |
1.45 | %(e) | 2.07 | % | 2.46 | % | 2.16 | % | 1.88 | % | 1.54 | %(f) | ||||||||||||||||
|
|
|
|
|
|
|
|
|
|
|
|
|
|||||||||||||||||
| Total expenses after fees waived and/or reimbursed |
1.45 | %(e) | 2.07 | % | 2.46 | % | 2.16 | % | 1.88 | % | 1.54 | %(f) | ||||||||||||||||
|
|
|
|
|
|
|
|
|
|
|
|
|
|||||||||||||||||
| Total expenses after fees waived and/or reimbursed and excluding interest expense, fees, and amortization of offering cost(g)(h) |
0.85 | %(e) | 1.20 | % | 1.09 | % | 0.89 | % | 0.89 | % | 0.93 | %(f) | ||||||||||||||||
|
|
|
|
|
|
|
|
|
|
|
|
|
|||||||||||||||||
| Net investment income to Common Shareholders |
4.31 | %(e) | 4.06 | % | 4.11 | % | 4.49 | % | 4.81 | % | 5.02 | % | ||||||||||||||||
|
|
|
|
|
|
|
|
|
|
|
|
|
|||||||||||||||||
| Supplemental Data |
||||||||||||||||||||||||||||
| Net assets applicable to Common Shareholders, end of period (000) |
$ | 472,334 | $ | 468,752 | $ | 464,366 | $ | 444,947 | $ | 457,888 | $ | 483,968 | ||||||||||||||||
|
|
|
|
|
|
|
|
|
|
|
|
|
|||||||||||||||||
| VRDP Shares outstanding at $100,000 liquidation value, end of period (000) |
$ | 231,900 | $ | 231,900 | $ | 231,900 | $ | 231,900 | $ | 231,900 | $ | 231,900 | ||||||||||||||||
|
|
|
|
|
|
|
|
|
|
|
|
|
|||||||||||||||||
| Asset coverage per VRDP Shares at $100,000 liquidation value, end of period |
$ | 303,680 | $ | 302,135 | $ | 300,244 | $ | 291,870 | $ | 297,450 | $ | 308,697 | ||||||||||||||||
|
|
|
|
|
|
|
|
|
|
|
|
|
|||||||||||||||||
| Borrowings outstanding, end of period (000) |
$ | 41,362 | $ | 41,362 | $ | 64,527 | $ | 60,002 | $ | 52,002 | $ | 51,227 | ||||||||||||||||
|
|
|
|
|
|
|
|
|
|
|
|
|
|||||||||||||||||
| Portfolio turnover rate |
1 | % | 9 | % | 15 | % | 8 | % | 13 | % | 19 | % | ||||||||||||||||
|
|
|
|
|
|
|
|
|
|
|
|
|
|||||||||||||||||
| (a) | Based on average Common Shares outstanding. |
| (b) | Distributions for annual periods determined in accordance with U.S. federal income tax regulations. |
| (c) | Total returns based on market price, which can be significantly greater or less than the net asset value, may result in substantially different returns. Where applicable, excludes the effects of any sales charges and assumes the reinvestment of distributions at actual reinvestment prices. |
| (d) | Aggregate total return. |
| (e) | Annualized. |
| (f) | Includes reorganization costs associated with the Fund’s reorganization. Without these costs total expenses, total expenses after fees waived and/or reimbursed and total expenses after fees waived and/or reimbursed and excluding interest expense, fees and amortization of offering costs would have been 1.49%, 1.49% and 0.88%, respectively. |
| (g) | Interest expense, fees and amortization of offering costs related to TOB Trusts and/or VRDP Shares. See Note 4 and Note 10 of the Notes to Financial Statements for details. |
| (h) | The total expense ratio after fees waived and/or reimbursed and excluding interest expense, fees, amortization of offering costs, liquidity and remarketing fees as follows: |
|
Six Months Ended 01/31/21 (unaudited) |
Year Ended July 31, | |||||||||||||||||||||||||||
| 2020 | 2019 | 2018 | 2017 | 2016 | ||||||||||||||||||||||||
| Expense ratios |
0.85 | % | 0.88 | % | 0.90 | % | 0.89 | % | 0.89 | % | 0.93 | % | ||||||||||||||||
|
|
|
|
|
|
|
|
|
|
|
|
|
|||||||||||||||||
See notes to financial statements.
| F I N A N C I A L H I G H L I G H T S |
61 |
Financial Highlights (continued)
(For a share outstanding throughout each period)
| MPA | ||||||||||||||||||||||||||||
| Six Months Ended 01/31/21 (unaudited) |
Year Ended July 31, | |||||||||||||||||||||||||||
|
2020 |
2019 |
2018 |
2017 |
2016 |
||||||||||||||||||||||||
|
Net asset value, beginning of period |
|
$ | 16.09 | $ | 16.06 | $ | 15.27 | $ | 15.74 | $ | 16.76 | $ | 15.77 | |||||||||||||||
|
|
|
|
|
|
|
|
|
|
|
|
|
|||||||||||||||||
| Net investment income(a) |
0.35 | 0.65 | 0.63 | 0.71 | 0.76 | 0.80 | ||||||||||||||||||||||
| Net realized and unrealized gain (loss) |
0.35 | (0.05 | ) | 0.80 | (0.47 | ) | (1.03 | ) | 1.02 | |||||||||||||||||||
|
|
|
|
|
|
|
|
|
|
|
|
|
|||||||||||||||||
| Net increase (decrease) from investment operations |
0.70 | 0.60 | 1.43 | 0.24 | (0.27 | ) | 1.82 | |||||||||||||||||||||
|
|
|
|
|
|
|
|
|
|
|
|
|
|||||||||||||||||
| Distributions to Common Shareholders from net investment income(b) |
(0.33 | ) | (0.57 | ) | (0.64 | ) | (0.71 | ) | (0.75 | ) | (0.83 | ) | ||||||||||||||||
|
|
|
|
|
|
|
|
|
|
|
|
|
|||||||||||||||||
| Net asset value, end of period |
$ | 16.46 | $ | 16.09 | $ | 16.06 | $ | 15.27 | $ | 15.74 | $ | 16.76 | ||||||||||||||||
|
|
|
|
|
|
|
|
|
|
|
|
|
|||||||||||||||||
| Market price, end of period |
$ | 14.67 | $ | 14.09 | $ | 14.18 | $ | 13.26 | $ | 14.69 | $ | 16.07 | ||||||||||||||||
|
|
|
|
|
|
|
|
|
|
|
|
|
|||||||||||||||||
| Total Return Applicable to Common Shareholders(c) |
||||||||||||||||||||||||||||
| Based on net asset value |
4.66 | %(d) | 4.33 | % | 10.32 | % | 2.09 | % | (1.20 | )% | 12.38 | % | ||||||||||||||||
|
|
|
|
|
|
|
|
|
|
|
|
|
|||||||||||||||||
| Based on market price |
6.53 | %(d) | 3.47 | % | 12.18 | % | (5.01 | )% | (3.83 | )% | 25.87 | % | ||||||||||||||||
|
|
|
|
|
|
|
|
|
|
|
|
|
|||||||||||||||||
| Ratios to Average Net Assets Applicable to Common Shareholders |
||||||||||||||||||||||||||||
| Total expenses |
1.53 | %(e) | 2.13 | % | 2.55 | % | 2.26 | % | 1.91 | % | 1.46 | % | ||||||||||||||||
|
|
|
|
|
|
|
|
|
|
|
|
|
|||||||||||||||||
| Total expenses after fees waived and/or reimbursed |
1.53 | %(e) | 2.12 | % | 2.55 | % | 2.26 | % | 1.91 | % | 1.46 | % | ||||||||||||||||
|
|
|
|
|
|
|
|
|
|
|
|
|
|||||||||||||||||
| Total expenses after fees waived and/or reimbursed and excluding interest expense, fees, and amortization of offering cost(f)(g) |
1.27 | %(e) | 1.23 | % | 0.99 | % | 0.95 | % | 0.94 | % | 0.89 | % | ||||||||||||||||
|
|
|
|
|
|
|
|
|
|
|
|
|
|||||||||||||||||
| Net investment income to Common Shareholders |
4.28 | %(e) | 4.08 | % | 4.11 | % | 4.56 | % | 4.83 | % | 4.98 | % | ||||||||||||||||
|
|
|
|
|
|
|
|
|
|
|
|
|
|||||||||||||||||
| Supplemental Data |
||||||||||||||||||||||||||||
| Net assets applicable to Common Shareholders, end of period (000) |
$ | 219,070 | $ | 214,155 | $ | 214,359 | $ | 203,956 | $ | 210,170 | $ | 223,738 | ||||||||||||||||
|
|
|
|
|
|
|
|
|
|
|
|
|
|||||||||||||||||
| VRDP Shares outstanding at $100,000 liquidation value, end of period (000) |
$ | 82,600 | $ | 82,600 | $ | 82,600 | $ | 82,600 | $ | 82,600 | $ | 82,600 | ||||||||||||||||
|
|
|
|
|
|
|
|
|
|
|
|
|
|||||||||||||||||
| Asset coverage per VRDP Shares at $100,000 liquidation value, end of period |
$ | 365,218 | $ | 359,268 | $ | 359,514 | $ | 346,921 | $ | 354,444 | $ | 370,869 | ||||||||||||||||
|
|
|
|
|
|
|
|
|
|
|
|
|
|||||||||||||||||
| Borrowings outstanding, end of period (000) |
$ | 51,927 | $ | 54,482 | $ | 52,814 | $ | 58,176 | $ | 55,826 | $ | 48,710 | ||||||||||||||||
|
|
|
|
|
|
|
|
|
|
|
|
|
|||||||||||||||||
| Portfolio turnover rate |
4 | % | 12 | % | 21 | % | 21 | % | 15 | % | 17 | % | ||||||||||||||||
|
|
|
|
|
|
|
|
|
|
|
|
|
|||||||||||||||||
| (a) | Based on average Common Shares outstanding. |
| (b) | Distributions for annual periods determined in accordance with U.S. federal income tax regulations. |
| (c) | Total returns based on market price, which can be significantly greater or less than the net asset value, may result in substantially different returns. Where applicable, excludes the effects of any sales charges and assumes the reinvestment of distributions at actual reinvestment prices. |
| (d) | Aggregate total return. |
| (e) | Annualized. |
| (f) | Interest expense, fees and amortization of offering costs related to TOB Trusts and/or VRDP Shares. See Note 4 and Note 10 of the Notes to Financial Statements for details. |
| (g) | The total expense ratio after fees waived and/or reimbursed and excluding interest expense, fees, amortization of offering costs, liquidity and remarketing fees as follows: |
|
Six Months Ended 01/31/21 (unaudited) |
Year Ended July 31, | |||||||||||||||||||||||||||
| 2020 | 2019 | 2018 | 2017 | 2016 | ||||||||||||||||||||||||
| Expense ratios |
0.94 | % | 0.93 | % | 0.96 | % | 0.95 | % | 0.94 | % | 0.89 | % | ||||||||||||||||
|
|
|
|
|
|
|
|
|
|
|
|
|
|||||||||||||||||
See notes to financial statements.
| 62 | 2 0 2 1 B L A C K R O C K S E M I - A N N U A L R E P O R T T O S H A R E H O L D E R S |
Notes to Financial Statements (unaudited)
| 1. | ORGANIZATION |
The following are registered under the Investment Company Act of 1940, as amended (the “1940 Act”), as closed-end management investment companies and are referred to herein collectively as the “Funds”, or individually as a “Fund”:
| Fund Name | Herein Referred To As | Organized | Diversification Classification | |||||
| BlackRock MuniHoldings California Quality Fund, Inc. |
MUC | Maryland | Diversified | |||||
| BlackRock MuniHoldings New Jersey Quality Fund, Inc. |
MUJ | Maryland | Non-diversified | |||||
| BlackRock MuniYield Investment Quality Fund |
MFT | Massachusetts | Diversified | |||||
| BlackRock MuniYield Michigan Quality Fund, Inc. |
MIY | Maryland | Non-diversified | |||||
| BlackRock MuniYield Pennsylvania Quality Fund |
MPA | Massachusetts | Non-diversified | |||||
The Boards of Directors and Boards of Trustees of the Funds are collectively referred to throughout this report as the “Board,” and the directors/trustees thereof are collectively referred to throughout this report as “Directors”. The Funds determine and make available for publication the net asset values (“NAVs”) of their Common Shares on a daily basis.
On June 16, 2020, the Board of Trustees of MFT and the Board of Trustees of BlackRock Municipal Income Trust II (BLE), each approved the reorganization of MFT into BLE. The reorganization was approved by each Fund’s shareholders and is expected to occur during the second quarter of 2021, subject to the satisfaction of customary closing conditions.
The Funds, together with certain other registered investment companies advised by BlackRock Advisors, LLC (the “Manager”) or its affiliates, are included in a complex of non-index fixed-income mutual funds and all BlackRock-advised closed-end funds referred to as the BlackRock Fixed-Income Complex.
| 2. | SIGNIFICANT ACCOUNTING POLICIES |
The financial statements are prepared in conformity with accounting principles generally accepted in the United States of America (“U.S. GAAP”), which may require management to make estimates and assumptions that affect the reported amounts of assets and liabilities in the financial statements, disclosure of contingent assets and liabilities at the date of the financial statements and the reported amounts of increases and decreases in net assets from operations during the reporting period. Actual results could differ from those estimates. Each Fund is considered an investment company under U.S. GAAP and follows the accounting and reporting guidance applicable to investment companies. Below is a summary of significant accounting policies:
Investment Transactions and Income Recognition: For financial reporting purposes, investment transactions are recorded on the dates the transactions are executed. Realized gains and losses on investment transactions are determined using the specific identification method. Dividend income and capital gain distributions, if any, are recorded on the ex-dividend date. Non-cash dividends, if any, are recorded on the ex-dividend date at fair value. Interest income, including amortization and accretion of premiums and discounts on debt securities, is recognized daily on an accrual basis.
Segregation and Collateralization: In cases where a Fund enters into certain investments (e.g., futures contracts) or certain borrowings (e.g.,TOB Trust transactions) that would be treated as “senior securities” for 1940 Act purposes, a Fund may segregate or designate on its books and records cash or liquid assets having a market value at least equal to the amount of its future obligations under such investments or borrowings. Doing so allows the investment or borrowings to be excluded from treatment as a “senior security.” Furthermore, if required by an exchange or counterparty agreement, the Funds may be required to deliver/deposit cash and/or securities to/with an exchange, or broker-dealer or custodian as collateral for certain investments or obligations.
Distributions: Distributions from net investment income are declared and paid monthly. Distributions of capital gains are recorded on the ex-dividend date and made at least annually. The character and timing of distributions are determined in accordance with U.S. federal income tax regulations, which may differ from U.S. GAAP.
Distributions to Preferred Shareholders are accrued and determined as described in Note 10.
Deferred Compensation Plan: Under the Deferred Compensation Plan (the “Plan”) approved by each Fund’s Board, the directors who are not “interested persons” of the Funds, as defined in the 1940 Act (“Independent Directors”), may defer a portion of their annual complex-wide compensation. Deferred amounts earn an approximate return as though equivalent dollar amounts had been invested in common shares of certain funds in the BlackRock Fixed-Income Complex selected by the Independent Directors. This has the same economic effect for the Independent Directors as if the Independent Directors had invested the deferred amounts directly in certain funds in the BlackRock Fixed-Income Complex.
The Plan is not funded and obligations thereunder represent general unsecured claims against the general assets of each Fund, as applicable. Deferred compensation liabilities, if any, are included in the Directors’ and Officer’s fees payable in the Statements of Assets and Liabilities and will remain as a liability of the Funds until such amounts are distributed in accordance with the Plan.
Indemnifications: In the normal course of business, a Fund enters into contracts that contain a variety of representations that provide general indemnification. A Fund’s maximum exposure under these arrangements is unknown because it involves future potential claims against a Fund, which cannot be predicted with any certainty.
Other: Expenses directly related to a Fund are charged to that Fund. Other operating expenses shared by several funds, including other funds managed by the Manager, are prorated among those funds on the basis of relative net assets or other appropriate methods.
| N O T E S T O F I N A N C I A L S T A T E M E N T S |
63 |
Notes to Financial Statements (unaudited) (continued)
| 3. | INVESTMENT VALUATION AND FAIR VALUE MEASUREMENTS |
Investment Valuation Policies: Each Fund’s investments are valued at fair value (also referred to as “market value” within the financial statements) each day that the Fund is open for business and, for financial reporting purposes, as of the report date. U.S. GAAP defines fair value as the price a fund would receive to sell an asset or pay to transfer a liability in an orderly transaction between market participants at the measurement date. Each Fund determines the fair values of its financial instruments using various independent dealers or pricing services under policies approved by the Board. If a security’s market price is not readily available or does not otherwise accurately represent the fair value of the security, the security will be valued in accordance with a policy approved by the Board as reflecting fair value. The BlackRock Global Valuation Methodologies Committee (the “Global Valuation Committee”) is the committee formed by management to develop global pricing policies and procedures and to oversee the pricing function for all financial instruments.
Fair Value Inputs and Methodologies: The following methods and inputs are used to establish the fair value of each Fund’s assets and liabilities:
| • | Fixed-income investments for which market quotations are readily available are generally valued using the last available bid price or current market quotations provided by independent dealers or third party pricing services. Pricing services generally value fixed-income securities assuming orderly transactions of an institutional round lot size, but a fund may hold or transact in such securities in smaller, odd lot sizes. Odd lots may trade at lower prices than institutional round lots. The pricing services may use matrix pricing or valuation models that utilize certain inputs and assumptions to derive values, including transaction data (e.g., recent representative bids and offers), market data, credit quality information, perceived market movements, news, and other relevant information. Certain fixed-income securities, including asset- backed and mortgage related securities may be valued based on valuation models that consider the estimated cash flows of each tranche of the entity, establish a benchmark yield and develop an estimated tranche specific spread to the benchmark yield based on the unique attributes of the tranche. The amortized cost method of valuation may be used with respect to debt obligations with sixty days or less remaining to maturity unless the Manager determines such method does not represent fair value. |
| • | Investments in open-end U.S. mutual funds (including money market funds) are valued at that day’s published NAV. |
| • | Futures contracts are valued based on that day’s last reported settlement or trade price on the exchange where the contract is traded. |
If events (e.g., a market closure, market volatility, company announcement or a natural disaster) occur that are expected to materially affect the value of such investment, or in the event that application of these methods of valuation results in a price for an investment that is deemed not to be representative of the market value of such investment, or if a price is not available, the investment will be valued by the Global Valuation Committee, or its delegate, in accordance with a policy approved by the Board as reflecting fair value (“Fair Valued Investments”). The fair valuation approaches that may be used by the Global Valuation Committee include market approach, income approach and cost approach. Valuation techniques such as discounted cash flow, use of market comparables and matrix pricing are types of valuation approaches and are typically used in determining fair value. When determining the price for Fair Valued Investments, the Global Valuation Committee, or its delegate, seeks to determine the price that each Fund might reasonably expect to receive or pay from the current sale or purchase of that asset or liability in an arm’s-length transaction. Fair value determinations shall be based upon all available factors that the Global Valuation Committee, or its delegate, deems relevant and consistent with the principles of fair value measurement. The pricing of all Fair Valued Investments is subsequently reported to the Board or a committee thereof on a quarterly basis.
Fair Value Hierarchy: Various inputs are used in determining the fair value of financial instruments. These inputs to valuation techniques are categorized into a fair value hierarchy consisting of three broad levels for financial reporting purposes as follows:
| • | Level 1 – Unadjusted price quotations in active markets/exchanges for identical assets or liabilities that each Fund has the ability to access; |
| • | Level 2 – Other observable inputs (including, but not limited to, quoted prices for similar assets or liabilities in markets that are active, quoted prices for identical or similar assets or liabilities in markets that are not active, inputs other than quoted prices that are observable for the assets or liabilities (such as interest rates, yield curves, volatilities, prepayment speeds, loss severities, credit risks and default rates) or other market–corroborated inputs); and |
| • | Level 3 – Unobservable inputs based on the best information available in the circumstances, to the extent observable inputs are not available (including the Global Valuation Committee’s assumptions used in determining the fair value of financial instruments). |
The hierarchy gives the highest priority to unadjusted quoted prices in active markets for identical assets or liabilities (Level 1 measurements) and the lowest priority to unobservable inputs (Level 3 measurements). Accordingly, the degree of judgment exercised in determining fair value is greatest for instruments categorized in Level 3. The inputs used to measure fair value may fall into different levels of the fair value hierarchy. In such cases, for disclosure purposes, the fair value hierarchy classification is determined based on the lowest level input that is significant to the fair value measurement in its entirety. Investments classified within Level 3 have significant unobservable inputs used by the Global Valuation Committee in determining the price for Fair Valued Investments. Level 3 investments include equity or debt issued by privately held companies or funds that may not have a secondary market and/or may have a limited number of investors. The categorization of a value determined for financial instruments is based on the pricing transparency of the financial instruments and is not necessarily an indication of the risks associated with investing in those securities.
| 4. | SECURITIES AND OTHER INVESTMENTS |
Zero-Coupon Bonds: Zero-coupon bonds are normally issued at a significant discount from face value and do not provide for periodic interest payments. These bonds may experience greater volatility in market value than other debt obligations of similar maturity which provide for regular interest payments.
Forward Commitments, When-Issued and Delayed Delivery Securities: Certain Funds may purchase securities on a when-issued basis and may purchase or sell securities on a forward commitment basis. Settlement of such transactions normally occurs within a month or more after the purchase or sale commitment is made. A Fund may purchase securities under such conditions with the intention of actually acquiring them, but may enter into a separate agreement to sell the securities before the settlement
| 64 | 2 0 2 1 B L A C K R O C K S E M I - A N N U A L R E P O R T T O S H A R E H O L D E R S |
Notes to Financial Statements (unaudited) (continued)
date. Since the value of securities purchased may fluctuate prior to settlement, a Fund may be required to pay more at settlement than the security is worth. In addition, a Fund is not entitled to any of the interest earned prior to settlement. When purchasing a security on a delayed delivery basis, a Fund assumes the rights and risks of ownership of the security, including the risk of price and yield fluctuations. In the event of default by the counterparty, a Fund’s maximum amount of loss is the unrealized appreciation of unsettled when-issued transactions.
Municipal Bonds Transferred to TOB Trusts: Certain Funds leverage their assets through the use of “TOB Trust” transactions. The funds transfer municipal bonds into a special purpose trust (a “TOB Trust”). A TOB Trust issues two classes of beneficial interests: short-term floating rate interests (“TOB Trust Certificates”), which are sold to third party investors, and residual inverse floating rate interests (“TOB Residuals”), which are issued to the participating funds that contributed the municipal bonds to the TOB Trust. The TOB Trust Certificates have interest rates that reset weekly and their holders have the option to tender such certificates to the TOB Trust for redemption at par and any accrued interest at each reset date. The TOB Residuals held by a fund provide the fund with the right to cause the holders of a proportional share of the TOB Trust Certificates to tender their certificates to the TOB Trust at par plus accrued interest. The funds may withdraw a corresponding share of the municipal bonds from the TOB Trust. Other funds managed by the investment adviser may also contribute municipal bonds to a TOB Trust into which a fund has contributed bonds. If multiple BlackRock-advised funds participate in the same TOB Trust, the economic rights and obligations under the TOB Residuals will be shared among the funds ratably in proportion to their participation in the TOB Trust.
TOB Trusts are supported by a liquidity facility provided by a third party bank or other financial institution (the “Liquidity Provider”) that allows the holders of the TOB Trust Certificates to tender their certificates in exchange for payment of par plus accrued interest on any business day. The tendered TOB Trust Certificates are remarketed by a Remarketing Agent. In the event of a failed remarketing, the TOB Trust may draw upon a loan from the Liquidity Provider to purchase the tendered TOB Trust Certificates. Any loans made by the Liquidity Provider will be secured by the purchased TOB Trust Certificates held by the TOB Trust and will be subject to an increased interest rate based on number of days the loan is outstanding.
The TOB Trust may be collapsed without the consent of a fund, upon the occurrence of a termination event as defined in the TOB Trust agreement. Upon the occurrence of a termination event, a TOB Trust would be liquidated with the proceeds applied first to any accrued fees owed to the trustee of the TOB Trust, the Remarketing Agent and the Liquidity Provider. Upon certain termination events, TOB Trust Certificates holders will be paid before the TOB Residuals holders (i.e., the Funds) whereas in other termination events, TOB Trust Certificates holders and TOB Residuals holders will be paid pro rata.
While a fund’s investment policies and restrictions expressly permit investments in inverse floating rate securities, such as TOB Residuals, they restrict the ability of a fund to borrow money for purposes of making investments. MFT, MIY and MPA management believes that a fund’s restrictions on borrowings do not apply to the funds’ TOB Trust transactions. Each fund’s transfer of the municipal bonds to a TOB Trust is considered a secured borrowing for financial reporting purposes. The cash received by the TOB Trust from the sale of the TOB Trust Certificates, less certain transaction expenses, is paid to a fund. A fund typically invests the cash received in additional municipal bonds.
Accounting for TOB Trusts: The municipal bonds deposited into a TOB Trust are presented in a fund’s Schedule of Investments and the TOB Trust Certificates are shown in Other Liabilities in the Statements of Assets and Liabilities. Any loans drawn by the TOB Trust pursuant to the liquidity facility to purchase tendered TOB Trust Certificates are shown as Loan for TOB Trust Certificates. The carrying amount of a fund’s payable to the holder of the TOB Trust Certificates, as reported in the Statements of Assets and Liabilities as TOB Trust Certificates, approximates its fair value.
Interest income, including amortization and accretion of premiums and discounts, from the underlying municipal bonds is recorded by a fund on an accrual basis. Interest expense incurred on the TOB Trust transaction and other expenses related to remarketing, administration, trustee, liquidity and other services to a TOB Trust are shown as interest expense, fees and amortization of offering costs in the Statements of Operations. Fees paid upon creation of the TOB Trust are recorded as debt issuance costs and are amortized to interest expense, fees and amortization of offering costs in the Statements of Operations to the expected maturity of the TOB Trust. In connection with the restructurings of the TOB Trusts to non-bank sponsored TOB Trusts, a fund incurred non-recurring, legal and restructuring fees, which are recorded as interest expense, fees and amortization of offering costs in the Statements of Operations.
| Fund Name | Interest Expense | Liquidity Fees | Other Expenses | Total | ||||||||||
| MUC |
$ | 118,216 | $ | 359,727 | $ | 106,806 | $ 584,749 | |||||||
| MUJ |
58,238 | 115,087 | 67,094 | 240,419 | ||||||||||
| MFT |
22,022 | 55,761 | 26,976 | 104,759 | ||||||||||
| MIY |
41,969 | 87,779 | 23,636 | 153,384 | ||||||||||
| MPA |
44,712 | 117,693 | 35,047 | 197,452 | ||||||||||
For the six months ended January 31, 2021, the following table is a summary of each Fund’s TOB Trusts:
| Fund Name |
|
Underlying Municipal Bonds Transferred to TOB Trusts |
(a) |
|
Liability for TOB
Trust |
|
Range of Interest Rates on TOB Trust Certificates at Period End |
|
Average TOB
Trust |
|
Daily Weighted Average Rate of Interest and Other Expenses on TOB Trusts | |||||
| MUC |
$ | 336,854,627 | $ | 158,512,208 | 0.05% — 0.14% | $ | 158,512,208 | 0.73% | ||||||||
| MUJ |
114,957,329 | 61,534,134 | 0.04 — 0.24 | 62,660,687 | 0.76 | |||||||||||
| MFT |
52,693,502 | 27,589,669 | 0.06 — 0.27 | 27,734,295 | 0.75 | |||||||||||
| MIY |
81,448,118 | 41,362,055 | 0.07 — 0.22 | 41,362,055 | 0.73 |
| N O T E S T O F I N A N C I A L S T A T E M E N T S |
65 |
Notes to Financial Statements (unaudited) (continued)
| Fund Name |
|
Underlying Municipal Bonds Transferred to TOB Trusts |
(a) |
|
Liability for TOB Trust Certificates |
(b) |
Range of Interest Rates on TOB Trust Certificates at Period End |
|
Average TOB
Trust |
|
Daily Weighted Average Rate of Interest and Other Expenses on TOB Trusts | |||||
| MPA |
$ | 94,039,826 | $ | 51,926,581 | 0.07% — 0.27% | $ | 54,441,078 | 0.72% |
| (a) | The municipal bonds transferred to a TOB Trust are generally high grade municipal bonds. In certain cases, when municipal bonds transferred are lower grade municipal bonds, the TOB Trust transaction may include a credit enhancement feature that provides for the timely payment of principal and interest on the bonds to the TOB Trust by a credit enhancement provider in the event of default of the municipal bond. The TOB Trust would be responsible for the payment of the credit enhancement fee and the funds, as TOB Residuals holders, would be responsible for reimbursement of any payments of principal and interest made by the credit enhancement provider. The maximum potential amounts owed by the funds, for such reimbursements, as applicable, are included in the maximum potential amounts disclosed for recourse TOB Trusts in the Schedules of Investments. |
| (b) | TOB Trusts may be structured on a non-recourse or recourse basis. When a Fund invests in TOB Trusts on a non-recourse basis, the Liquidity Provider may be required to make a payment under the liquidity facility to allow the TOB Trust to repurchase TOB Trust Certificates. The Liquidity Provider will be reimbursed from the liquidation of bonds held in the TOB Trust. If a fund invests in a TOB Trust on a recourse basis, a fund enters into a reimbursement agreement with the Liquidity Provider where a fund is required to reimburse the Liquidity Provider for any shortfall between the amount paid by the Liquidity Provider and proceeds received from liquidation of municipal bonds held in the TOB Trust (the “Liquidation Shortfall”). As a result, if a fund invests in a recourse TOB Trust, a fund will bear the risk of loss with respect to any Liquidation Shortfall. If multiple funds participate in any such TOB Trust, these losses will be shared ratably, including the maximum potential amounts owed by a fund at January 31, 2021, in proportion to their participation in the TOB Trust. The recourse TOB Trusts are identified in the Schedules of Investments including the maximum potential amounts owed by a fund at January 31, 2021. |
For the six months ended January 31, 2021, the following table is a summary of each Fund’s Loan for TOB Trust Certificates:
| Fund Name | Loans Outstanding at Period End |
Range of Interest Rates on Loans at Period End |
Average Loans Outstanding |
Daily Weighted Average Rate of Interest and Other Expenses on Loans | ||||||||||
| MFT |
$ | — | — | % | $ | 3,011 | 0.71% | |||||||
| MPA |
— | — | 3,043 | 0.71 | ||||||||||
| 5. | DERIVATIVE FINANCIAL INSTRUMENTS |
The Funds engage in various portfolio investment strategies using derivative contracts both to increase the returns of the Funds and/or to manage their exposure to certain risks such as credit risk, equity risk, interest rate risk, foreign currency exchange rate risk, commodity price risk or other risks (e.g., inflation risk). Derivative financial instruments categorized by risk exposure are included in the Schedules of Investments. These contracts may be transacted on an exchange or over-the-counter (“OTC”).
Futures Contracts: Futures contracts are purchased or sold to gain exposure to, or manage exposure to, changes in interest rates (interest rate risk) and changes in the value of equity securities (equity risk) or foreign currencies (foreign currency exchange rate risk).
Futures contracts are exchange-traded agreements between the Funds and a counterparty to buy or sell a specific quantity of an underlying instrument at a specified price and on a specified date. Depending on the terms of a contract, it is settled either through physical delivery of the underlying instrument on the settlement date or by payment of a cash amount on the settlement date. Upon entering into a futures contract, the Funds are required to deposit initial margin with the broker in the form of cash or securities in an amount that varies depending on a contract’s size and risk profile. The initial margin deposit must then be maintained at an established level over the life of the contract. Amounts pledged, which are considered restricted, are included in cash pledged for futures contracts in the Statements of Assets and Liabilities.
Securities deposited as initial margin are designated in the Schedules of Investments and cash deposited, if any, are shown as cash pledged for futures contracts in the Statements of Assets and Liabilities. Pursuant to the contract, the Funds agree to receive from or pay to the broker an amount of cash equal to the daily fluctuation in market value of the contract (“variation margin”). Variation margin is recorded as unrealized appreciation (depreciation) and, if any, shown as variation margin receivable (or payable) on futures contracts in the Statements of Assets and Liabilities. When the contract is closed, a realized gain or loss is recorded in the Statements of Operations equal to the difference between the notional amount of the contract at the time it was opened and the notional amount at the time it was closed. The use of futures contracts involves the risk of an imperfect correlation in the movements in the price of futures contracts and interest rates, foreign currency exchange rates or underlying assets.
| 6. | INVESTMENT ADVISORY AGREEMENT AND OTHER TRANSACTIONS WITH AFFILIATES |
Investment Advisory: Each Fund entered into an Investment Advisory Agreement with the Manager, the Funds’ investment adviser and an indirect, wholly-owned subsidiary of BlackRock, Inc. (“BlackRock”), to provide investment advisory and administrative services. The Manager is responsible for the management of each Fund’s portfolio and provides the personnel, facilities, equipment and certain other services necessary to the operations of each Fund.
For such services, each Fund pays the Manager a monthly fee at an annual rate equal to the following percentages of the average daily value of each Fund’s net assets:
| MUC | MUJ | MFT | MIY | MPA | ||||||||||||||
| Investment advisory fees |
0.55 | % | 0.50 | % | 0.50 | % | 0.49 | % | 0.49% | |||||||||
| 66 | 2 0 2 1 B L A C K R O C K S E M I - A N N U A L R E P O R T T O S H A R E H O L D E R S |
Notes to Financial Statements (unaudited) (continued)
For purposes of calculating these fees, “net assets” mean the total assets of the Fund minus the sum of its accrued liabilities (which does not include liabilities represented by TOB Trusts and the liquidation preference of any outstanding preferred shares). It is understood that the liquidation preference of any outstanding preferred stock (other than accumulated dividends) and TOB Trusts is not considered a liability in determining a Fund’s NAV.
Expense Waivers and Reimbursements: With respect to each Fund, the Manager contractually agreed to waive its investment advisory fees by the amount of investment advisory fees each Fund pays to the Manager indirectly through its investment in affiliated money market funds (the “affiliated money market fund waiver”) through June 30, 2022. The contractual agreement may be terminated upon 90 days’ notice by a majority of the Independent Directors, or by a vote of a majority of the outstanding voting securities of a Fund. These amounts are included in fees waived and/or reimbursed by the Manager in the Statements of Operations. For the six months ended January 31, 2021, the amounts waived were as follows:
|
|
||||
| Fund Name | Amounts Waived | |||
|
|
||||
| MUC |
$ | 2,623 | ||
| MUJ |
2,630 | |||
| MFT |
207 | |||
| MIY |
1,575 | |||
| MPA |
1,093 | |||
|
|
||||
The Manager contractually agreed to waive its investment advisory fee with respect to any portion of each Fund’s assets invested in affiliated equity and fixed-income mutual funds and affiliated exchange-traded funds that have a contractual management fee through June 30, 2022. The agreement can be renewed for annual periods thereafter, and may be terminated on 90 days’ notice, each subject to approval by a majority of the Funds’ Independent Directors. For the six months ended January 31, 2021, there were no fees waived and/or reimbursed by the Manager pursuant to this arrangement.
The Manager, for MUC, voluntarily agreed to waive its investment advisory fee on the proceeds of the Preferred Shares and TOB Trusts that exceed 35% of total assets minus the sum of its accrued liabilities (which does not include liabilities represented by TOB Trusts and the liquidation preference of any outstanding preferred shares). The voluntary waiver may be reduced or discontinued at any time without notice. This amount is included in fees waived and/or reimbursed by the Manager in the Statements of Operations. For the six months ended January 31, 2021 the waiver was $175,311.
The Manager reimbursed MFT $34,701 for reorganization costs.
Directors and Officers: Certain directors and/or officers of the Fund are directors and/or officers of BlackRock or its affiliates. The Funds reimburse the Manager for a portion of the compensation paid to the Funds’ Chief Compliance Officer, which is included in Directors and Officer in the Statements of Operations.
| 7. | PURCHASES AND SALES |
For the six months ended January 31, 2021, purchases and sales of investments, excluding short-term investments, were as follows:
|
|
||||||||
| Fund Name | Purchases | Sales | ||||||
|
|
||||||||
| MUC |
$ | 22,495,322 | $ | 28,188,550 | ||||
| MUJ |
33,207,581 | 41,610,086 | ||||||
| MFT |
18,505,441 | 16,432,035 | ||||||
| MIY |
14,009,320 | 6,597,812 | ||||||
| MPA |
12,765,004 | 17,290,841 | ||||||
|
|
||||||||
| 8. | INCOME TAX INFORMATION |
It is each Fund’s policy to comply with the requirements of the Internal Revenue Code of 1986, as amended, applicable to regulated investment companies, and to distribute substantially all of its taxable income to its shareholders. Therefore, no U.S. federal income tax provision is required.
Each Fund files U.S. federal and various state and local tax returns. No income tax returns are currently under examination. The statute of limitations on each Fund’s U.S. federal tax returns generally remains open for a period of three fiscal years after they are filed. The statutes of limitations on each Fund’s state and local tax returns may remain open for an additional year depending upon the jurisdiction.
Management has analyzed tax laws and regulations and their application to the Funds as of January 31, 2021, inclusive of the open tax return years, and does not believe that there are any uncertain tax positions that require recognition of a tax liability in the Funds’ financial statements.
As of July 31, 2020, the Funds had non-expiring capital loss carryforwards available to offset future realized capital gains as follows:
|
|
||||
| Fund Name | Non-Expiring | |||
|
|
||||
| MUC |
$ | 21,514,268 | ||
| MUJ |
9,101,106 | |||
| MFT |
8,205,159 | |||
| MIY |
8,241,632 | |||
| MPA |
5,788,133 | |||
|
|
||||
| N O T E S T O F I N A N C I A L S T A T E M E N T S |
67 |
Notes to Financial Statements (unaudited) (continued)
As of January 31, 2021, gross unrealized appreciation and depreciation based on cost of investments (including short positions and derivatives, if any) for U.S. federal income tax purposes were as follows:
|
|
||||||||||||||||
| Fund Name | Tax Cost | Gross Unrealized Appreciation |
Gross Unrealized Depreciation |
Net Unrealized Appreciation |
||||||||||||
|
|
||||||||||||||||
| MUC |
$ | 810,263,678 | $ | 101,088,253 | $ | (991,351 | ) | $ | 100,096,902 | |||||||
| MUJ |
662,047,137 | 73,615,929 | (867,135 | ) | 72,748,794 | |||||||||||
| MFT |
162,503,352 | 18,962,111 | (288,296 | ) | 18,673,815 | |||||||||||
| MIY |
638,574,899 | 60,950,152 | (208,862 | ) | 60,741,290 | |||||||||||
| MPA |
271,835,382 | 31,509,804 | (1,675,743 | ) | 29,834,061 | |||||||||||
|
|
||||||||||||||||
| 9. | PRINCIPAL RISKS |
In the normal course of business, certain Funds invest in securities or other instruments and may enter into certain transactions, and such activities subject each Fund to various risks, including among others, fluctuations in the market (market risk) or failure of an issuer to meet all of its obligations. The value of securities or other instruments may also be affected by various factors, including, without limitation: (i) the general economy; (ii) the overall market as well as local, regional or global political and/or social instability; (iii) regulation, taxation or international tax treaties between various countries; or (iv) currency, interest rate and price fluctuations. Local, regional or global events such as war, acts of terrorism, the spread of infectious illness or other public health issues, recessions, or other events could have a significant impact on the Funds and their investments.
A Fund structures and “sponsors” the TOB Trusts in which it holds TOB Residuals and has certain duties and responsibilities, which may give rise to certain additional risks including, but not limited to, compliance, securities law and operational risks.
Should short-term interest rates rise, the Funds’ investments in the TOB Trusts may adversely affect the Funds’ net investment income and dividends to Common Shareholders. Also, fluctuations in the market value of municipal bonds deposited into the TOB Trust may adversely affect the Funds’ NAVs per share.
The U.S. Securities and Exchange Commission (“SEC”) and various federal banking and housing agencies have adopted credit risk retention rules for securitizations (the “Risk Retention Rules”). The Risk Retention Rules would require the sponsor of a TOB Trust to retain at least 5% of the credit risk of the underlying assets supporting the TOB Trust’s municipal bonds. The Risk Retention Rules may adversely affect the Funds’ ability to engage in TOB Trust transactions or increase the costs of such transactions in certain circumstances.
TOB Trusts constitute an important component of the municipal bond market. Any modifications or changes to rules governing TOB Trusts may adversely impact the municipal market and the Funds, including through reduced demand for and liquidity of municipal bonds and increased financing costs for municipal issuers. The ultimate impact of any potential modifications on the TOB Trust market and the overall municipal market is not yet certain.
Each Fund may invest without limitation in illiquid or less liquid investments or investments in which no secondary market is readily available or which are otherwise illiquid, including private placement securities. A Fund may not be able to readily dispose of such investments at prices that approximate those at which a Fund could sell such investments if they were more widely traded and, as a result of such illiquidity, a Fund may have to sell other investments or engage in borrowing transactions if necessary to raise funds to meet its obligations. Limited liquidity can also affect the market price of investments, thereby adversely affecting a Fund’s net asset value and ability to make dividend distributions. Privately issued debt securities are often of below investment grade quality, frequently are unrated and present many of the same risks as investing in below investment grade public debt securities.
Market Risk: Each Fund may be exposed to prepayment risk, which is the risk that borrowers may exercise their option to prepay principal earlier than scheduled during periods of declining interest rates, which would force each Fund to reinvest in lower yielding securities. Each Fund may also be exposed to reinvestment risk, which is the risk that income from each Fund’s portfolio will decline if each Fund invests the proceeds from matured, traded or called fixed-income securities at market interest rates that are below each Fund portfolio’s current earnings rate.
Municipal securities are subject to the risk that litigation, legislation or other political events, local business or economic conditions, credit rating downgrades, or the bankruptcy of the issuer could have a significant effect on an issuer’s ability to make payments of principal and/or interest or otherwise affect the value of such securities. Municipal securities can be significantly affected by political or economic changes, including changes made in the law after issuance of the securities, as well as uncertainties in the municipal market related to, taxation, legislative changes or the rights of municipal security holders, including in connection with an issuer insolvency. Municipal securities backed by current or anticipated revenues from a specific project or specific assets can be negatively affected by the discontinuance of the tax benefits supporting the project or assets or the inability to collect revenues for the project or from the assets. Municipal securities may be less liquid than taxable bonds, and there may be less publicly available information on the financial condition of municipal security issuers than for issuers of other securities.
An outbreak of respiratory disease caused by a novel coronavirus has developed into a global pandemic and has resulted in closing borders, quarantines, disruptions to supply chains and customer activity, as well as general concern and uncertainty. The impact of this pandemic, and other global health crises that may arise in the future, could affect the economies of many nations, individual companies and the market in general in ways that cannot necessarily be foreseen at the present time. This pandemic may result in substantial market volatility and may adversely impact the prices and liquidity of a fund’s investments. The duration of this pandemic and its effects cannot be determined with certainty.
Counterparty Credit Risk: The Funds may be exposed to counterparty credit risk, or the risk that an entity may fail to or be unable to perform on its commitments related to unsettled or open transactions, including making timely interest and/or principal payments or otherwise honoring its obligations. The Funds manage counterparty credit risk by entering into transactions only with counterparties that the Manager believes have the financial resources to honor their obligations and by monitoring the financial stability of
| 68 | 2 0 2 1 B L A C K R O C K S E M I - A N N U A L R E P O R T T O S H A R E H O L D E R S |
Notes to Financial Statements (unaudited) (continued)
those counterparties. Financial assets, which potentially expose the Funds to market, issuer and counterparty credit risks, consist principally of financial instruments and receivables due from counterparties. The extent of the Funds’ exposure to market, issuer and counterparty credit risks with respect to these financial assets is approximately their value recorded in the Statements of Assets and Liabilities, less any collateral held by the Funds.
A derivative contract may suffer a mark-to-market loss if the value of the contract decreases due to an unfavorable change in the market rates or values of the underlying instrument. Losses can also occur if the counterparty does not perform under the contract.
With exchange-traded futures, there is less counterparty credit risk to the Funds since the exchange or clearinghouse, as counterparty to such instruments, guarantees against a possible default. The clearinghouse stands between the buyer and the seller of the contract; therefore, credit risk is limited to failure of the clearinghouse. While offset rights may exist under applicable law, a Fund does not have a contractual right of offset against a clearing broker or clearinghouse in the event of a default (including the bankruptcy or insolvency). Additionally, credit risk exists in exchange-traded futures with respect to initial and variation margin that is held in a clearing broker’s customer accounts. While clearing brokers are required to segregate customer margin from their own assets, in the event that a clearing broker becomes insolvent or goes into bankruptcy and at that time there is a shortfall in the aggregate amount of margin held by the clearing broker for all its clients, typically the shortfall would be allocated on a pro rata basis across all the clearing broker’s customers, potentially resulting in losses to the Funds.
Concentration Risk: A diversified portfolio, where this is appropriate and consistent with a fund’s objectives, minimizes the risk that a price change of a particular investment will have a material impact on the NAV of a fund. The investment concentrations within certain Fund’s portfolio are disclosed in its Schedule of Investments.
Certain Funds invest a substantial amount of their assets in issuers located in a single state or limited number of states. When a Fund concentrates its investments in this manner, it assumes the risk that economic, regulatory, political or social conditions affecting that state or group of states could have a significant impact on the fund and could affect the income from, or the value or liquidity of, the fund’s portfolio. Investment percentages in specific states or U.S. territories are presented in the Schedules of Investments.
Certain Funds invest a significant portion of their assets in securities within a single or limited number of market sectors. When a Fund concentrates its investments in this manner, it assumes the risk that economic, regulatory, political and social conditions affecting such sectors may have a significant impact on the Fund and could affect the income from, or the value or liquidity of, the Fund’s portfolio. Investment percentages in specific sectors are presented in the Schedules of Investments.
Certain Funds invest a significant portion of their assets in fixed-income securities and/or use derivatives tied to the fixed-income markets. Changes in market interest rates or economic conditions may affect the value and/or liquidity of such investments. Interest rate risk is the risk that prices of bonds and other fixed-income securities will increase as interest rates fall and decrease as interest rates rise. The Funds may be subject to a greater risk of rising interest rates due to the current period of historically low rates.
LIBOR Transition Risk: The United Kingdom’s Financial Conduct Authority announced a phase out of the London Interbank Offered Rate (“LIBOR”) by the end of 2021, and it is expected that LIBOR will cease to be published after that time. The Funds may be exposed to financial instruments tied to LIBOR to determine payment obligations, financing terms, hedging strategies or investment value. The transition process away from LIBOR might lead to increased volatility and illiquidity in markets for, and reduce the effectiveness of new hedges placed against, instruments whose terms currently include LIBOR. The ultimate effect of the LIBOR transition process on the Funds is uncertain.
| 10. | CAPITAL SHARE TRANSACTIONS |
MFT and MPA are authorized to issue an unlimited number of Common Shares, all of which were initially classified as Common Shares. MUC, MUJ and MIY each is authorized to issue 200 million shares, all of which were initially classified as Common Shares. The par value for each Fund’s Common Shares is $0.10. The par value for each Fund’s Preferred Shares outstanding is $0.10, except for MFT and MPA, which is $0.05. The Board is authorized, however, to reclassify any unissued Common Shares to Preferred Shares without the approval of Common Shareholders. MFT and MPA are authorized to issue 1 million Preferred Shares.
Common Shares
For the periods shown, shares issued and outstanding increased by the following amounts as a result of dividend reinvestment:
|
|
||||||||
| Fund Name | Six Months Ended 01/31/21 |
Year Ended 07/31/20 |
||||||
|
|
||||||||
| MFT |
895 | 847 | ||||||
|
|
||||||||
For the six months ended January 31, 2021 and the year ended July 31, 2020, shares issued and outstanding remained constant for MUC.
The Funds participate in an open market share repurchase program (the “Repurchase Program”). From December 1, 2019 through November 30, 2020, each Fund may repurchase up to 5% of its outstanding common shares under the Repurchase Program, based on common shares outstanding as of the close of business on November 30, 2019, subject to certain conditions.
On September 28, 2020, each Fund announced a continuation of its open market share repurchase program. Commencing on December 1, 2020, each Fund may repurchase through November 30, 2021, up to 5% of its common shares outstanding as of the close of business on November 30, 2020, subject to certain conditions. There is no assurance that the Funds will purchase shares in any particular amounts.
| N O T E S T O F I N A N C I A L S T A T E M E N T S |
69 |
Notes to Financial Statements (unaudited) (continued)
The total cost of the shares repurchased is reflected in MUJ, MIY and MPA’s Statements of Changes in Net Assets. For the periods shown, shares repurchased and cost, including transaction costs were as follows:
| MUJ | MIY | MPA | ||||||||||||||||||||||
|
|
|
|
|
|
|
|||||||||||||||||||
| Shares | Amounts | Shares | Amounts | Shares | Amounts | |||||||||||||||||||
|
|
||||||||||||||||||||||||
| Six Months Ended January 31, 2021 |
— | $ | — | — | $ | — | 1,307 | $ | 18,678 | |||||||||||||||
| Year Ended July 31, 2020 |
66,696 | 886,136 | 68,734 | 886,694 | 35,471 | 478,011 | ||||||||||||||||||
|
|
||||||||||||||||||||||||
Preferred Shares
A Fund’s Preferred Shares rank prior to its Common Shares as to the payment of dividends by the Fund and distribution of assets upon dissolution or liquidation of the Fund. The 1940 Act prohibits the declaration of any dividend on Common Shares or the repurchase of Common Shares if the Fund fails to maintain asset coverage of at least 200% of the liquidation preference of the Fund’s outstanding Preferred Shares. In addition, pursuant to the Preferred Shares’ governing instruments, a Fund is restricted from declaring and paying dividends on classes of shares ranking junior to or on parity with its Preferred Shares or repurchasing such shares if the Fund fails to declare and pay dividends on the Preferred Shares, redeem any Preferred Shares required to be redeemed under the Preferred Shares’ governing instruments or comply with the basic maintenance amount requirement of the ratings agencies rating the Preferred Shares.
Holders of Preferred Shares have voting rights equal to the voting rights of holders of Common Shares (one vote per share) and vote together with holders of Common Shares (one vote per share) as a single class on certain matters. Holders of Preferred Shares, voting as a separate class, are also entitled to (i) elect two members of the Board, (ii) elect the full Board if dividends on the Preferred Shares are not paid for a period of two years and (iii) a separate class vote to amend the Preferred Share governing documents. In addition, the 1940 Act requires the approval of the holders of a majority of any outstanding Preferred Shares, voting as a separate class, to (a) adopt any plan of reorganization that would adversely affect the Preferred Shares, (b) change a Fund’s sub-classification as a closed-end investment company or change its fundamental investment restrictions or (c) change its business so as to cease to be an investment company.
VRDP Shares
MUJ, MIY and MPA (for purposes of this section, each a “VRDP Fund”), have issued Series W-7 VRDP Shares, $100,000 liquidation preference per share, in one or more privately negotiated offerings to qualified institutional buyers as defined pursuant to Rule 144A under the Securities Act of 1933, as amended (the “Securities Act”). The VRDP Shares include a liquidity feature and may be subject to a special rate period. As of period end, the VRDP Shares outstanding were as follows:
|
|
||||||||||||||||
| Fund Name | Issue Date |
Shares Issued |
Aggregate Principal |
Maturity Date |
||||||||||||
|
|
||||||||||||||||
| MUJ |
06/30/11 | 1,727 | $ | 172,700,000 | 07/01/41 | |||||||||||
| 04/13/15 | 644 | 64,400,000 | 07/01/41 | |||||||||||||
| MIY |
04/21/11 | 1,446 | 144,600,000 | 05/01/41 | ||||||||||||
| 09/14/15 | 873 | 87,300,000 | 05/01/41 | |||||||||||||
| MPA |
05/19/11 | 663 | 66,300,000 | 06/01/41 | ||||||||||||
| 04/13/15 | 163 | 16,300,000 | 06/01/41 | |||||||||||||
|
|
||||||||||||||||
Redemption Terms: A VRDP Fund is required to redeem its VRDP Shares on the maturity date, unless earlier redeemed or repurchased. Six months prior to the maturity date, a VRDP Fund is required to begin to segregate liquid assets with the Fund’s custodian to fund the redemption. In addition, a VRDP Fund is required to redeem certain of its outstanding VRDP Shares if it fails to comply with certain asset coverage, basic maintenance amount or leverage requirements.
Subject to certain conditions, the VRDP Shares may also be redeemed, in whole or in part, at any time at the option of a VRDP Fund. The redemption price per VRDP Share is equal to the liquidation preference per share plus any outstanding unpaid dividends.
Liquidity Feature: VRDP Shares are subject to a fee agreement between the VRDP Fund and the liquidity provider that requires a per annum liquidity fee and, in some cases, an upfront or initial commitment fee, payable to the liquidity provider. These fees, if applicable, are shown as liquidity fees in the Statements of Operations. As of period end, the fee agreement is set to expire, unless renewed or terminated in advance, as follows:
|
|
||||||||||||
| MUJ | MIY | MPA | ||||||||||
|
|
||||||||||||
| Expiration date |
04/30/22 | 07/09/21 | 07/02/21 | |||||||||
|
|
||||||||||||
The VRDP Shares are also subject to a purchase agreement in connection with the liquidity feature. In the event a purchase agreement is not renewed or is terminated in advance, and the VRDP Shares do not become subject to a purchase agreement with an alternate liquidity provider, the VRDP Shares will be subject to mandatory purchase by the liquidity provider prior to the termination of the purchase agreement. In the event of such mandatory purchase, a VRDP Fund is required to redeem the VRDP Shares six months after the purchase date. Immediately after such mandatory purchase, the VRDP Fund is required to begin to segregate liquid assets with its custodian to fund the redemption. There is no assurance that a VRDP Fund will replace such redeemed VRDP Shares with any other preferred shares or other form of leverage.
Remarketing: A VRDP Fund may incur remarketing fees on the aggregate principal amount of all its VRDP Shares, which, if any, are included in remarketing fees on Preferred Shares in the Statements of Operations. During any special rate period (as described below), a VRDP Fund may incur nominal or no remarketing fees.
| 70 | 2 0 2 1 B L A C K R O C K S E M I - A N N U A L R E P O R T T O S H A R E H O L D E R S |
Notes to Financial Statements (unaudited) (continued)
Ratings: As of period end, the VRDP Shares were assigned the following ratings:
|
|
||||||||||||||||
| Fund Name | Moody’s Investors Service, Inc. Long-Term Ratings |
Fitch Ratings, Inc. Long-Term Ratings |
Fitch Ratings, Inc. Short-Term Ratings |
S&P Global Short-Term Ratings |
||||||||||||
|
|
||||||||||||||||
| MUJ |
Aa2 | AAA | N/A | N/A | ||||||||||||
| MIY |
Aa2 | AAA | N/A | N/A | ||||||||||||
| MPA |
Aa2 | AAA | F1+ | A-1+ | ||||||||||||
|
|
||||||||||||||||
Any short-term ratings on VRDP Shares are directly related to the short-term ratings of the liquidity provider for such VRDP Shares. Changes in the credit quality of the liquidity provider could cause a change in the short-term credit ratings of the VRDP Shares as rated by Moody’s Investors Service, Inc., Fitch Ratings, Inc. and S&P Global Ratings. The liquidity provider may be terminated prior to the scheduled termination date if the liquidity provider fails to maintain short-term debt ratings in one of the two highest rating categories.
Special Rate Period: A VRDP Fund has commenced a “special rate period” with respect to its VRDP Shares, during which the VRDP Shares will not be subject to any remarketing and the dividend rate will be based on a predetermined methodology. During a special rate period, short-term ratings on VRDP Shares are withdrawn. As of period end, the following VRDP Funds have commenced or are set to commence a special rate period:
|
|
||||||||
| Fund Name | Commencement Date |
Expiration Date as of Period Ended 01/31/21 |
||||||
|
|
||||||||
| MUJ |
04/17/14 | 04/15/22 | ||||||
| MIY |
06/25/20 | 06/25/21 | ||||||
|
|
||||||||
Prior to the expiration date, the VRDP Fund and the VRDP Shares holder may mutually agree to extend the special rate period. If a special rate period is not extended, the VRDP Shares will revert to remarketable securities upon the termination of the special rate period and will be remarketed and available for purchase by qualified institutional investors.
During the special rate period: (i) the liquidity and fee agreements remain in effect, (ii) VRDP Shares remain subject to mandatory redemption by the VRDP Fund on the maturity date, (iii) VRDP Shares will not be remarketed or subject to optional or mandatory tender events, (iv) the VRDP Fund is required to comply with the same asset coverage, basic maintenance amount and leverage requirements for the VRDP Shares as is required when the VRDP Shares are not in a special rate period, (v) the VRDP Fund will pay dividends monthly based on the sum of an agreed upon reference rate and a percentage per annum based on the long-term ratings assigned to the VRDP Shares and (vi) the VRDP Fund will pay nominal or no fees to the liquidity provider and remarketing agent.
Dividends: Except during the Special Rate Period as described above, dividends on the VRDP Shares are payable monthly at a variable rate set weekly by the remarketing agent. Such dividend rates are generally based upon a spread over a base rate and cannot exceed a maximum rate. A change in the short-term credit rating of the liquidity provider or the VRDP Shares may adversely affect the dividend rate paid on such shares, although the dividend rate paid on the VRDP Shares is not directly based upon either short-term rating. In the event of a failed remarketing, the dividend rate of the VRDP Shares will be reset to a maximum rate. The maximum rate is determined based on, among other things, the long-term preferred share rating assigned to the VRDP Shares and the length of time that the VRDP Shares fail to be remarketed.
For the six months ended January 31, 2021, the annualized dividend rate for the VRDP Shares were as follows:
|
|
||||||||||||
| MUJ | MIY | MPA | ||||||||||
|
|
||||||||||||
| Dividend rates |
0.95 | % | 1.08 | % | 0.18% | |||||||
|
|
||||||||||||
For the six months ended January 31, 2021, VRDP Shares issued and outstanding of each VRDP Fund remained constant.
VMTP Shares
MUC and MFT (for purposes of this section, each a “VMTP Fund”) have issued Series W-7 VMTP Shares, $100,000 liquidation preference per share, in one or more privately negotiated offerings to qualified institutional buyers as defined pursuant to Rule 144A under the Securities Act. The VMTP Shares are subject to certain restrictions on transfer, and a VMTP Fund may also be required to register its VMTP Shares for sale under the Securities Act under certain circumstances. As of period end, the VMTP Shares outstanding and assigned long-term ratings were as follows:
|
|
||||||||||||||||||||||||
| Fund Name | Issue Date |
Shares Issued |
Aggregate Principal |
Term Redemption Date |
Moody’s Rating |
Fitch Rating |
||||||||||||||||||
|
|
||||||||||||||||||||||||
| MUC |
03/22/12 | 2,540 | $ | 254,000,000 | 03/30/22 | Aa2 | AAA | |||||||||||||||||
| MFT |
12/16/11 | 565 | 56,500,000 | 07/02/23 | Aa1 | AAA | ||||||||||||||||||
|
|
||||||||||||||||||||||||
Redemption Terms: Each VMTP Fund is required to redeem its VMTP Shares on the term redemption date, unless earlier redeemed or repurchased or unless extended. There is no assurance that a term will be extended further or that any VMTP Shares will be replaced with any other preferred shares or other form of leverage upon the redemption or repurchase of the VMTP Shares. Six months prior to the term redemption date, a VMTP Fund is required to begin to segregate liquid assets with its custodian to fund the redemption. In addition, a VMTP Fund is required to redeem certain of its outstanding VMTP Shares if it fails to comply with certain asset coverage, basic maintenance amount or leverage requirements.
| N O T E S T O F I N A N C I A L S T A T E M E N T S |
71 |
Notes to Financial Statements (unaudited) (continued)
Subject to certain conditions, VMTP Shares may be redeemed, in whole or in part, at any time at the option of the VMTP Fund. With respect to MUC, the redemption price per VMTP Share is equal to the liquidation preference per share plus any outstanding unpaid dividends. With respect to MFT, the redemption price per VMTP Share is equal to the liquidation preference per share plus any outstanding unpaid dividends and applicable redemption premium. If MFT redeems the VMTP Shares prior to the term redemption date and the VMTP Shares have long-term ratings above A1/A+ or its equivalent by the ratings agencies then rating the VMTP Shares, then such redemption may be subject to a prescribed redemption premium (up to 2% of the liquidation preference) payable to the holder of the VMTP Shares based on the time remaining until the term redemption date, subject to certain exceptions for redemptions that are required to comply with minimum asset coverage requirements.
Dividends: Dividends on the VMTP Shares are declared daily and payable monthly at a variable rate set weekly at a fixed rate spread to the Securities Industry and Financial Markets Association (“SIFMA”) Municipal Swap Index or to a percentage of the one-month LIBOR rate, as set forth in the VMTP Shares governing instrument. The fixed spread is determined based on the long-term preferred share rating assigned to the VMTP Shares by the ratings agencies then rating the VMTP Shares.
The dividend rate on VMTP Shares is subject to a step-up spread if the VMTP Fund fails to comply with certain provisions, including, among other things, the timely payment of dividends, redemptions or gross-up payments, and complying with certain asset coverage and leverage requirements.
For the six months ended January 31, 2021, the average annualized dividend rates for the VMTP Shares were as follows:
|
|
||||||||
| MUC | MFT | |||||||
|
|
||||||||
| Dividend rates |
0.85 | % | 1.02% | |||||
|
|
||||||||
For the six months ended January 31, 2021, VMTP Shares issued and outstanding of each VMTP Fund remained constant.
Offering Costs: The Funds incurred costs in connection with the issuance of VRDP and VMTP Shares, which were recorded as a direct deduction from the carrying value of the related debt liability and will be amortized over the life of the VRDP and VMTP Shares with the exception of any upfront fees paid by a VRDP Fund to the liquidity provider which, if any, were amortized over the life of the liquidity agreement. Amortization of these costs is included in interest expense, fees and amortization of offering costs in the Statements of Operations.
Financial Reporting: The VRDP and VMTP Shares are considered debt of the issuer; therefore, the liquidation preference, which approximates fair value of the VRDP and VMTP Shares, is recorded as a liability in the Statements of Assets and Liabilities net of deferred offering costs. Unpaid dividends are included in interest expense and fees payable in the Statements of Assets and Liabilities, and the dividends accrued and paid on the VRDP and VMTP Shares are included as a component of interest expense, fees and amortization of offering costs in the Statements of Operations. The VRDP and VMTP Shares are treated as equity for tax purposes. Dividends paid to holders of the VRDP and VMTP Shares are generally classified as tax-exempt income for tax-reporting purposes. Dividends and amortization of deferred offering costs on VRDP and VMTP Shares are included in interest expense, fees and amortization of offering costs in the Statements of Operations:
|
|
||||||||
| Fund Name | Dividends Accrued | Deferred Offering Costs Amortization |
||||||
|
|
||||||||
| MUC |
$ | 1,084,970 | $ | — | ||||
| MUJ |
1,120,438 | 9,599 | ||||||
| MFT |
287,116 | — | ||||||
| MIY |
1,250,641 | 4,948 | ||||||
| MPA |
76,173 | 6,354 | ||||||
|
|
||||||||
| 11. | SUBSEQUENT EVENTS |
Management’s evaluation of the impact of all subsequent events on the Funds’ financial statements was completed through the date the financial statements were issued and the following items were noted:
The Funds declared and paid or will pay distributions to Common Shareholders and Preferred Shareholders as follows:
|
|
||||||||||||||||||||||||
| Dividend Per Common Share | Preferred Shares(a) | |||||||||||||||||||||||
|
|
|
|
|
|||||||||||||||||||||
| Fund Name |
Paid | (b) | Declared | (c) | Declared | (d) | Shares | Series | Declared | |||||||||||||||
|
|
||||||||||||||||||||||||
| MUC |
$ | 0.055000 | $ | 0.055000 | $ | — | VMTP | W-7 | $ | 152,191 | ||||||||||||||
| MUJ |
0.063000 | 0.063000 | — | VRDP | W-7 | 158,435 | ||||||||||||||||||
| MFT |
0.060000 | 0.060000 | 0.094071 | VMTP | W-7 | 42,739 | ||||||||||||||||||
| MIY |
0.056000 | 0.056000 | — | VRDP | W-7 | 186,791 | ||||||||||||||||||
| MPA |
0.055000 | 0.055000 | — | VRDP | W-7 | 7,038 | ||||||||||||||||||
|
|
||||||||||||||||||||||||
| (a) | Dividends declared for period February 1, 2021 to February 28, 2021. |
| (b) | Net investment income dividend paid on March 1, 2021 to Common Shareholders of record on February 16, 2021. |
| (c) | Net investment income dividend declared on March 1, 2021, payable to Common Shareholders of record on March 15, 2021. |
| (d) | Net investment income special dividend declared on March 19, 2021, payable to Common Shareholders of record on April 8, 2021. |
| 72 | 2 0 2 1 B L A C K R O C K S E M I - A N N U A L R E P O R T T O S H A R E H O L D E R S |
Proxy Results
At a Joint Special Meeting of Shareholders of BlackRock MuniYield Investment Quality Fund held on Tuesday, December 15, 2020 and adjourned to Friday, January 21, 2021, Fund shareholders were asked to vote on the following proposals:
Common and Preferred Shareholders
Proposal 1(C). The common shareholders and holders of Variable Rate Muni Term Preferred Shares (“VMTP Shares” and the holders thereof, “VMTP Holders”) of BlackRock MuniYield Investment Quality Fund (“MFT”) were being asked to vote as a single class on a proposal to approve an Agreement and Plan of Reorganization between MFT and BlackRock Municipal Income Trust II (the “Acquiring Fund” and such Agreement and Plan of Reorganization, the “MFT Reorganization Agreement”) and the transactions contemplated therein, including (i) the acquisition by the Acquiring Fund of substantially all of MFT’s assets and the assumption by the Acquiring Fund of substantially all of MFT’s liabilities in exchange solely for newly issued common shares and VMTP Shares of the Acquiring Fund, which will be distributed to the common shareholders (although cash may be distributed in lieu of fractional common shares) and VMTP Holders, respectively, of MFT, and which shall constitute the sole consideration to be distributed or paid to the common shareholders (although cash may be distributed in lieu of fractional common shares) and the VMTP Holders in respect of their common shares and VMTP Shares, respectively, and (ii) the termination by MFT of its registration under the Investment Company Act of 1940, as amended, and the liquidation, dissolution and termination of MFT in accordance with its Declaration of Trust and Massachusetts law (the “MFT Reorganization”).
With respect to Proposal 1(C), the shares of the Fund were voted as follows:
Preferred Shareholders
Proposal 1(D). The VMTP Holders of MFT, were being asked to vote as a separate class on a proposal to approve the MFT Reorganization Agreement and the MFT Reorganization.
With respect to Proposal 1(D), the shares of the Fund were voted as follows:
Fund Certification
The Funds are listed for trading on the NYSE and have filed with the NYSE their annual chief executive officer certification regarding compliance with the NYSE’s listing standards. The Funds filed with the SEC the certification of its chief executive officer and chief financial officer required by Section 302 of the Sarbanes-Oxley Act.
Regulation Regarding Derivatives
On October 28, 2020, the Securities and Exchange Commission (the “SEC”) adopted new regulations governing the use of derivatives by registered investment companies (“Rule 18f-4”). The Funds will be required to implement and comply with Rule 18f-4 by the third quarter of 2022. Once implemented, Rule 18f-4 will impose limits on the amount of derivatives a fund can enter into, eliminate the asset segregation framework currently used by funds to comply with Section 18 of the 1940 Act, treat derivatives as senior securities so that a failure to comply with the limits would result in a statutory violation and require funds whose use of derivatives is more than a limited specified exposure amount to establish and maintain a comprehensive derivatives risk management program and appoint a derivatives risk manager.
Environmental, Social and Governance (“ESG”) Integration
Although a Fund does not seek to implement a specific ESG, impact or sustainability strategy unless otherwise disclosed, Fund management will consider ESG characteristics as part of the investment process for actively managed Funds. These considerations will vary depending on a Fund’s particular investment strategies and may include consideration of third-party research as well as consideration of proprietary BlackRock research across the ESG risks and opportunities regarding an issuer. Fund management will consider those ESG characteristics it deems relevant or additive when making investment decisions for a Fund. The ESG characteristics utilized in a Fund’s investment process are anticipated to evolve over time and one or more characteristics may not be relevant with respect to all issuers that are eligible for investment. ESG characteristics are not the sole considerations when making investment decisions for a Fund. Further, investors can differ in their views of what constitutes positive or negative ESG characteristics. As a result, a Fund may invest in issuers that do not reflect the beliefs and values with respect to ESG of any particular investor. ESG considerations may affect a Fund’s exposure to certain companies or industries and a Fund may forego certain investment opportunities. While Fund management views ESG considerations as having the potential to contribute to a Fund’s long-term performance, there is no guarantee that such results will be achieved.
Dividend Policy
Each Fund’s dividend policy is to distribute all or a portion of its net investment income to its shareholders on a monthly basis. In order to provide shareholders with a more stable level of distributions, the Funds may at times pay out less than the entire amount of net investment income earned in any particular month and may at times in any particular month pay out such accumulated but undistributed income in addition to net investment income earned in that month. As a result, the distributions paid by the Funds for any particular month may be more or less than the amount of net investment income earned by the Funds during such month. The Funds’ current accumulated but
| A D D I T I O N A L I N F O R M A T I O N |
73 |
Additional Information (continued)
Dividend Policy (continued)
undistributed net investment income, if any, is disclosed as accumulated earnings (loss) in the Statements of Assets and Liabilities, which comprises part of the financial information included in this report.
General Information
The Funds do not make available copies of their Statements of Additional Information because the Funds’ shares are not continuously offered, which means that the Statement of Additional Information of each Fund has not been updated after completion of the respective Fund’s offerings and the information contained in each Fund’s Statement of Additional Information may have become outdated.
The following information is a summary of certain changes since July 31, 2020. This information may not reflect all of the changes that have occurred since you purchased the relevant Fund.
Effective October 19, 2020, each of MUC, MUJ and MIY has elected to be subject to the Maryland Control Share Acquisition Act (the “MCSAA”). In general, the MCSAA limits the ability of holders of “control shares” to vote those shares above various threshold levels that start at 10% unless the other stockholders of MUC, MUJ and MIY, as applicable, reinstate those voting rights at a meeting of stockholders as provided in the MCSAA. “Control shares” are generally defined in the MCSAA as shares of stock that, if aggregated with all other shares of stock that are either (i) owned by a person or (ii) as to which that person is entitled to exercise or direct the exercise of voting power, except solely by virtue of a revocable proxy, would entitle that person to exercise voting power in electing directors above various thresholds of voting power starting at 10%. MUC’s, MUJ’s and MIY’s Bylaws also provide that the provisions of the MCSAA shall not apply to the voting rights of the holders of any shares of preferred stock of MUC, MUJ and MIY, but the MCSAA would apply to any common stock held by the same holder.
Except if noted otherwise herein, there were no changes to the Funds’ charters or by-laws that would delay or prevent a change of control of the Funds that were not approved by the shareholders. Except if noted otherwise herein, there have been no changes in the persons who are primarily responsible for the day-to-day management of the Funds’ portfolios.
In accordance with Section 23(c) of the Investment Company Act of 1940, each Fund may from time to time purchase shares of its common stock in the open market or in private transactions.
Quarterly performance, semi-annual and annual reports, current net asset value and other information regarding the Funds may be found on BlackRock’s website, which can be accessed at blackrock.com. Any reference to BlackRock’s website in this report is intended to allow investors public access to information regarding the Funds and does not, and is not intended to, incorporate BlackRock’s website in this report.
Electronic Delivery
Shareholders can sign up for e-mail notifications of quarterly statements, annual and semi-annual shareholder reports by enrolling in the electronic delivery program. Electronic copies of shareholder reports are available on BlackRock’s website.
To enroll in electronic delivery:
Shareholders Who Hold Accounts with Investment Advisers, Banks or Brokerages:
Please contact your financial adviser. Please note that not all investment advisers, banks or brokerages may offer this service.
Householding
The Funds will mail only one copy of shareholder documents, annual and semi-annual reports, Rule 30e-3 notices and proxy statements, to shareholders with multiple accounts at the same address. This practice is commonly called “householding” and is intended to reduce expenses and eliminate duplicate mailings of shareholder documents. Mailings of your shareholder documents may be householded indefinitely unless you instruct us otherwise. If you do not want the mailing of these documents to be combined with those for other members of your household, please call the Funds at (800) 882-0052.
Availability of Quarterly Schedule of Investments
The Funds file their complete schedule of portfolio holdings with the SEC for the first and third quarters of each fiscal year as an exhibit to their reports on Form N-PORT. The Funds’ Forms N-PORT are available on the SEC’s website at sec.gov. Additionally, each Fund makes its portfolio holdings for the first and third quarters of each fiscal year available at blackrock.com/fundreports.
Availability of Proxy Voting Policies and Procedures
A description of the policies and procedures that the Funds use to determine how to vote proxies relating to portfolio securities is available upon request and without charge (1) by calling (800) 882-0052; (2) at blackrock.com; and (3) on the SEC’s website at sec.gov.
| 74 | 2 0 2 1 B L A C K R O C K S E M I - A N N U A L R E P O R T T O S H A R E H O L D E R S |
Additional Information (continued)
Availability of Proxy Voting Record
Information about how the Funds voted proxies relating to securities held in the Funds’ portfolios during the most recent 12-month period ended June 30 is available upon request and without charge (1) at blackrock.com; or by calling (800) 882-0052 and (2) on the SEC’s website at sec.gov.
Availability of Fund Updates
BlackRock will update performance and certain other data for the Funds on a monthly basis on its website in the “Closed-end Funds” section of blackrock.com as well as certain other material information as necessary from time to time. Investors and others are advised to check the website for updated performance information and the release of other material information about the Funds. This reference to BlackRock’s website is intended to allow investors public access to information regarding the Funds and does not, and is not intended to, incorporate BlackRock’s website in this report.
BlackRock Privacy Principles
BlackRock is committed to maintaining the privacy of its current and former fund investors and individual clients (collectively, “Clients”) and to safeguarding their non-public personal information. The following information is provided to help you understand what personal information BlackRock collects, how we protect that information and why in certain cases we share such information with select parties.
If you are located in a jurisdiction where specific laws, rules or regulations require BlackRock to provide you with additional or different privacy-related rights beyond what is set forth below, then BlackRock will comply with those specific laws, rules or regulations.
BlackRock obtains or verifies personal non-public information from and about you from different sources, including the following: (i) information we receive from you or, if applicable, your financial intermediary, on applications, forms or other documents; (ii) information about your transactions with us, our affiliates, or others; (iii) information we receive from a consumer reporting agency; and (iv) from visits to our websites.
BlackRock does not sell or disclose to non-affiliated third parties any non-public personal information about its Clients, except as permitted by law or as is necessary to respond to regulatory requests or to service Client accounts. These non-affiliated third parties are required to protect the confidentiality and security of this information and to use it only for its intended purpose.
We may share information with our affiliates to service your account or to provide you with information about other BlackRock products or services that may be of interest to you. In addition, BlackRock restricts access to non-public personal information about its Clients to those BlackRock employees with a legitimate business need for the information. BlackRock maintains physical, electronic and procedural safeguards that are designed to protect the non-public personal information of its Clients, including procedures relating to the proper storage and disposal of such information.
Fund and Service Providers
| Investment Adviser |
VRDP Remarketing Agent | |
| BlackRock Advisors, LLC |
BofA Securities, Inc.(a) | |
| Wilmington, DE 19809 |
New York, NY 10036 | |
| Accounting Agent and Custodian |
TD Securities (USA) LLC(b) | |
| State Street Bank and Trust Company |
New York, NY 10019 | |
| Boston, MA 02111 |
||
| VRDP Tender and Paying Agent and VMTP Redemption and Paying Agent | ||
| Transfer Agent |
The Bank of New York Mellon | |
| Computershare Trust Company, N.A. |
New York, NY 10286 | |
| Canton, MA 02021 |
||
| Independent Registered Public Accounting Firm | ||
| VRDP Liquidity Provider |
Deloitte & Touche LLP | |
| Bank of America, N.A.(a) |
Boston, MA 02116 | |
| New York, NY 10036 |
||
| Legal Counsel | ||
| The Toronto-Dominion Bank(b) |
Willkie Farr & Gallagher LLP | |
| New York, NY 10019 |
New York, NY 10019 | |
| (a) For MUJ. |
Address of the Funds | |
| (b) For MPA and MIY. |
100 Bellevue Parkway | |
| Wilmington, DE 19809 | ||
| A D D I T I O N A L I N F O R M A T I O N |
75 |
Glossary of Terms Used in this Report
Portfolio Abbreviation
| AGC | Assured Guaranty Corp. | |
| AGM | Assured Guaranty Municipal Corp. | |
| AGM-CR | AGM Insured Custodial Receipt | |
| AMBAC | AMBAC Assurance Corp. | |
| AMT | Alternative Minimum Tax | |
| ARB | Airport Revenue Bonds | |
| BAM | Build America Mutual Assurance Co. | |
| BHAC | Berkshire Hathaway Assurance Corp. | |
| CAB | Capital Appreciation Bonds | |
| COP | Certificates of Participation | |
| FHA | Federal Housing Administration | |
| FHLMC | Federal Home Loan Mortgage Corp. | |
| FNMA | Federal National Mortgage Association | |
| GNMA | Government National Mortgage Association | |
| GO | General Obligation Bonds | |
| GTD | GTD Guaranteed | |
| M/F | Multi-Family | |
| NPFGC | National Public Finance Guarantee Corp. | |
| Q-SBLF | Qualified School Bond Loan Fund | |
| RB | Revenue Bond | |
| S/F | Single-Family | |
| SAB | Special Assessment Bonds | |
| SAN | State Aid Notes | |
| SAW | State Aid Withholding | |
| SONYMA | State of New York Mortgage Agency | |
| ST | Special Tax | |
| TA | Tax Allocation | |
| 76 | 2 0 2 1 B L A C K R O C K S E M I - A N N U A L R E P O R T T O S H A R E H O L D E R S |
Want to know more?
blackrock.com | 800-882-0052
This report is intended for current holders. It is not a prospectus. Past performance results shown in this report should not be considered a representation of future performance. The Funds have leveraged their Common Shares, which creates risks for Common Shareholders, including the likelihood of greater volatility of net asset value and market price of the Common Shares, and the risk that fluctuations in short-term interest rates may reduce the Common Shares’ yield. Statements and other information herein are as dated and are subject to change.
MQUAL5-01/21-SAR
|
|

|
(b) Not Applicable
| Item 2 – | Code of Ethics – Not Applicable to this semi-annual report |
| Item 3 – | Audit Committee Financial Expert – Not Applicable to this semi-annual report |
| Item 4 – | Principal Accountant Fees and Services – Not Applicable to this semi-annual report |
| Item 5 – | Audit Committee of Listed Registrant – Not Applicable to this semi-annual report |
| Item 6 – | Investments |
(a) The registrant’s Schedule of Investments is included as part of the Report to Stockholders filed under Item 1 of this Form.
(b) Not Applicable due to no such divestments during the semi-annual period covered since the previous Form N-CSR filing.
| Item 7 – | Disclosure of Proxy Voting Policies and Procedures for Closed-End Management Investment Companies – Not Applicable to this semi-annual report |
| Item 8 – | Portfolio Managers of Closed-End Management Investment Companies |
(a) Not Applicable to this semi-annual report.
(b) As of the date of this filing, there have been no changes in any of the portfolio managers identified in the most recent annual report on Form N-CSR.
| Item 9 – | Purchases of Equity Securities by Closed-End Management Investment Company and Affiliated Purchasers |
| Period | (a) Total | (b) Average | (c) Total Number of | (d) Maximum Number of | ||||
| Number of Shares Purchased | Price Paid per Share | Shares Purchased as Part of Publicly Announced Plans or Programs | Shares that May Yet Be Purchased Under the Plans or Programs1 | |||||
| August 1-31, 2020 | 1,307 | $14.2804 | 1,307 | 630,403 | ||||
| September 1-30, 2020 | 0 | $0 | 0 | 630,403 | ||||
| October 1-31, 2020 | 0 | $0 | 0 | 630,403 | ||||
| November 1-30, 2020 | 0 | $0 | 0 | 630,403 | ||||
| December 1-31, 2020 | 0 | $0 | 0 | 665,342 | ||||
| January 1-31, 2021 | 0 | $0 | 0 | 665,342 | ||||
| Total: | 1,307 | $14.2804 | 1,307 | 665,342 |
1 On September 5, 2019, the Fund announced a continuation of its open market share repurchase program. Commencing on December 1, 2019, the Fund may repurchase through November 30, 2020, up to 5% of its common shares outstanding as of the close of business on November 30, 2019, subject to certain conditions. On September 28, 2020, the Fund announced a further continuation of its open market share repurchase program. Commencing on December 1, 2020, the Fund may repurchase through November 30, 2021, up to 5% of its common shares outstanding as of the close of business on November 30, 2020, subject to certain conditions.
| Item 10 – | Submission of Matters to a Vote of Security Holders – There have been no material changes to these procedures. |
| Item 11 – | Controls and Procedures |
(a) The registrant’s principal executive and principal financial officers, or persons performing similar functions, have concluded that the registrant’s disclosure controls and procedures (as defined in Rule 30a-3(c) under the Investment Company Act of 1940, as amended (the “1940 Act”)) are effective as of a date within 90 days of the filing of this report based on the evaluation of these controls and procedures required by Rule 30a-3(b) under the 1940 Act and Rule 13a-15(b) under the Securities Exchange Act of 1934, as amended.
(b) There were no changes in the registrant’s internal control over financial reporting (as defined in Rule 30a-3(d) under the 1940 Act) that occurred during the period covered by this report that have materially affected, or are reasonably likely to materially affect, the registrant’s internal control over financial reporting.
| Item 12 – | Disclosure of Securities Lending Activities for Closed-End Management Investment |
Companies – Not Applicable
| Item 13 – | Exhibits attached hereto |
(a)(1) Code of Ethics – Not Applicable to this semi-annual report
(a)(2) Section 302 Certifications are attached
(a)(3) Not Applicable
(a)(4) Not Applicable
(b) Section 906 Certifications are attached
Pursuant to the requirements of the Securities Exchange Act of 1934 and the Investment Company Act of 1940, the registrant has duly caused this report to be signed on its behalf by the undersigned, thereunto duly authorized.
BlackRock MuniYield Pennsylvania Quality Fund
| By: | /s/ John M. Perlowski | |||
| John M. Perlowski | ||||
| Chief Executive Officer (principal executive officer) of | ||||
| BlackRock MuniYield Pennsylvania Quality Fund |
Date: April 5, 2021
Pursuant to the requirements of the Securities Exchange Act of 1934 and the Investment Company Act of 1940, this report has been signed below by the following persons on behalf of the registrant and in the capacities and on the dates indicated.
| By: | /s/ John M. Perlowski | |||
| John M. Perlowski | ||||
| Chief Executive Officer (principal executive officer) of | ||||
| BlackRock MuniYield Pennsylvania Quality Fund |
Date: April 5, 2021
| By: | /s/ Trent Walker | |||
| Trent Walker | ||||
| Chief Financial Officer (principal financial officer) of | ||||
| BlackRock MuniYield Pennsylvania Quality Fund |
Date: April 5, 2021
EX-99. CERT
CERTIFICATION PURSUANT TO RULE 30a-2(a) UNDER THE 1940 ACT AND SECTION 302 OF THE SARBANES-OXLEY ACT OF 2002
I, John M. Perlowski, Chief Executive Officer (principal executive officer) of BlackRock MuniYield Pennsylvania Quality Fund, certify that:
1. I have reviewed this report on Form N-CSR of BlackRock MuniYield Pennsylvania Quality Fund;
2. Based on my knowledge, this report does not contain any untrue statement of a material fact or omit to state a material fact necessary to make the statements made, in light of the circumstances under which such statements were made, not misleading with respect to the period covered by this report;
3. Based on my knowledge, the financial statements, and other financial information included in this report, fairly present in all material respects the financial condition, results of operations, changes in net assets, and cash flows (if the financial statements are required to include a statement of cash flows) of the registrant as of, and for, the periods presented in this report;
4. The registrant’s other certifying officer(s) and I are responsible for establishing and maintaining disclosure controls and procedures (as defined in Rule 30a-3(c) under the Investment Company Act of 1940) and internal control over financial reporting (as defined in Rule 30a-3(d) under the Investment Company Act of 1940) for the registrant and have:
a) designed such disclosure controls and procedures, or caused such disclosure controls and procedures to be designed under our supervision, to ensure that material information relating to the registrant, including its consolidated subsidiaries, is made known to us by others within those entities, particularly during the period in which this report is being prepared;
b) designed such internal control over financial reporting, or caused such internal control over financial reporting to be designed under our supervision, to provide reasonable assurance regarding the reliability of financial reporting and the preparation of financial statements for external purposes in accordance with generally accepted accounting principles;
c) evaluated the effectiveness of the registrant’s disclosure controls and procedures and presented in this report our conclusions about the effectiveness of the disclosure controls and procedures, as of a date within 90 days prior to the filing date of this report based on such evaluation; and
d) disclosed in this report any change in the registrant’s internal control over financial reporting that occurred during the period covered by this report that has materially affected, or is reasonably likely to materially affect, the registrant’s internal control over financial reporting; and
5. The registrant’s other certifying officer(s) and I have disclosed to the registrant’s auditors and the audit committee of the registrant’s board of directors (or persons performing the equivalent functions):
a) all significant deficiencies and material weaknesses in the design or operation of internal control over financial reporting which are reasonably likely to adversely affect the registrant’s ability to record, process, summarize, and report financial information; and
b) any fraud, whether or not material, that involves management or other employees who have a significant role in the registrant’s internal control over financial reporting.
Date: April 5, 2021
/s/ John M. Perlowski
John M. Perlowski
Chief Executive Officer (principal executive officer) of
BlackRock MuniYield Pennsylvania Quality Fund
EX-99. CERT
CERTIFICATION PURSUANT TO RULE 30a-2(a) UNDER THE 1940 ACT AND SECTION 302 OF THE SARBANES-OXLEY ACT OF 2002
I, Trent Walker, Chief Financial Officer (principal financial officer) of BlackRock MuniYield Pennsylvania Quality Fund, certify that:
1. I have reviewed this report on Form N-CSR of BlackRock MuniYield Pennsylvania Quality Fund;
2. Based on my knowledge, this report does not contain any untrue statement of a material fact or omit to state a material fact necessary to make the statements made, in light of the circumstances under which such statements were made, not misleading with respect to the period covered by this report;
3. Based on my knowledge, the financial statements, and other financial information included in this report, fairly present in all material respects the financial condition, results of operations, changes in net assets, and cash flows (if the financial statements are required to include a statement of cash flows) of the registrant as of, and for, the periods presented in this report;
4. The registrant’s other certifying officer(s) and I are responsible for establishing and maintaining disclosure controls and procedures (as defined in Rule 30a-3(c) under the Investment Company Act of 1940) and internal control over financial reporting (as defined in Rule 30a-3(d) under the Investment Company Act of 1940) for the registrant and have:
a) designed such disclosure controls and procedures, or caused such disclosure controls and procedures to be designed under our supervision, to ensure that material information relating to the registrant, including its consolidated subsidiaries, is made known to us by others within those entities, particularly during the period in which this report is being prepared;
b) designed such internal control over financial reporting, or caused such internal control over financial reporting to be designed under our supervision, to provide reasonable assurance regarding the reliability of financial reporting and the preparation of financial statements for external purposes in accordance with generally accepted accounting principles;
c) evaluated the effectiveness of the registrant’s disclosure controls and procedures and presented in this report our conclusions about the effectiveness of the disclosure controls and procedures, as of a date within 90 days prior to the filing date of this report based on such evaluation; and
d) disclosed in this report any change in the registrant’s internal control over financial reporting that occurred during the period covered by this report that has materially affected, or is reasonably likely to materially affect, the registrant’s internal control over financial reporting; and
5. The registrant’s other certifying officer(s) and I have disclosed to the registrant’s auditors and the audit committee of the registrant’s board of directors (or persons performing the equivalent functions):
a) all significant deficiencies and material weaknesses in the design or operation of internal control over financial reporting which are reasonably likely to adversely affect the registrant’s ability to record, process, summarize, and report financial information; and
b) any fraud, whether or not material, that involves management or other employees who have a significant role in the registrant’s internal control over financial reporting.
Date: April 5, 2021
/s/ Trent Walker
Trent Walker
Chief Financial Officer (principal financial officer) of
BlackRock MuniYield Pennsylvania Quality Fund
Exhibit 99.906CERT
Certification Pursuant to Rule 30a-2(b) under the 1940 Act and
Section 906 of the Sarbanes-Oxley Act of 2002
Pursuant to 18 U.S.C. § 1350, the undersigned officer of BlackRock MuniYield Pennsylvania Quality Fund (the “registrant”), hereby certifies, to the best of his knowledge, that the registrant’s Report on Form N-CSR for the period ended January 31, 2021 (the “Report”) fully complies with the requirements of Section 13(a) of the Securities Exchange Act of 1934, as amended, and that the information contained in the Report fairly presents, in all material respects, the financial condition and results of operations of the registrant.
Date: April 5, 2021
/s/ John M. Perlowski
John M. Perlowski
Chief Executive Officer (principal executive officer) of
BlackRock MuniYield Pennsylvania Quality Fund
Pursuant to 18 U.S.C. § 1350, the undersigned officer of BlackRock MuniYield Pennsylvania Quality Fund (the “registrant”), hereby certifies, to the best of his knowledge, that the registrant’s Report on Form N-CSR for the period ended January 31, 2021 (the “Report”) fully complies with the requirements of Section 13(a) of the Securities Exchange Act of 1934, as amended, and that the information contained in the Report fairly presents, in all material respects, the financial condition and results of operations of the registrant.
Date: April 5, 2021
/s/ Trent Walker
Trent Walker
Chief Financial Officer (principal financial officer) of
BlackRock MuniYield Pennsylvania Quality Fund
This certification is being furnished pursuant to Rule 30a-2(b) under the Investment Company Act of 1940, as amended, and 18 U.S.C. § 1350 and is not being filed as part of the Form N-CSR with the Securities and Exchange Commission.
Serious News for Serious Traders! Try StreetInsider.com Premium Free!
You May Also Be Interested In
- HSBC Continental Europe: Post Stabilisation Notice
- BGHL (GBP): NAV(s)
- Konsolidator maintains its financial expectations for 2024
Create E-mail Alert Related Categories
SEC FilingsSign up for StreetInsider Free!
Receive full access to all new and archived articles, unlimited portfolio tracking, e-mail alerts, custom newswires and RSS feeds - and more!
