UNITED
STATES
SECURITIES
AND EXCHANGE COMMISSION
Washington,
D.C. 20549
FORM N-CSR
CERTIFIED SHAREHOLDER REPORT
OF REGISTERED MANAGEMENT INVESTMENT COMPANIES
| Investment
Company Act file number: |
811-04611 |
| |
|
| Exact
name of registrant as specified in charter: |
abrdn Asia-Pacific Income Fund,
Inc. |
| |
|
| Address
of principal executive offices: |
1900 Market Street, Suite 200 |
| |
Philadelphia, PA 19103 |
| |
|
| Name
and address of agent for service: |
Sharon Ferrari |
| |
abrdn Inc. |
| |
1900 Market Street, Suite 200 |
| |
Philadelphia, PA 19103 |
| |
|
| Registrant’s
telephone number, including area code: |
1-800-522-5465 |
| |
|
| Date
of fiscal year end: |
October 31 |
| |
|
| Date
of reporting period: |
April 30, 2026 |
Item 1. Reports to Stockholders.
(a) A copy of the report transmitted to shareholders
pursuant to Rule 30e-1 under the Investment Company Act of 1940 (the “1940 Act”) is filed herewith.
abrdn Asia-Pacific Income Fund, Inc. (FAX)
Semi-Annual Report
April 30, 2026
Letter to Shareholders (unaudited)
Dear Shareholder,
We present the Semi-Annual
Report, which covers the activities of abrdn Asia-Pacific Income Fund, Inc. (the “Fund”), for the six-month period ended April 30, 2026. The Fund’s principal investment objective is to seek current
income. The Fund may also achieve incidental capital appreciation.
Total Investment Return1
For the six-month period
ended April 30, 2026, the total return to shareholders of the Fund based on the net asset value (“NAV”) and market price of the Fund, respectively, compared to the Fund’s benchmark, is as
follows:
| NAV2,3
| 0.86%
|
| Market Price2
| 3.40%
|
| Blended Benchmark4
| 1.14%
|
For more information about
Fund performance, please visit the Fund on the web at www.aberdeenfax.com. Here, you can view quarterly commentary on the Fund's performance, monthly fact sheets, distribution and performance information, and other
Fund literature.
NAV, Market Price and
Premium(+)/Discount(-)
The below table represents a
comparison between the current six-month period end and the prior fiscal year end of the Fund's market price to NAV and associated Premium(+) and Discount(-).
|
|
|
|
|
|
| NAV
| Closing
Market
Price
| Premium(+)/
Discount(-)
|
| 4/30/2026
| $15.70
| $15.02
| -4.33%
|
| 10/31/2025
| $16.60
| $15.49
| -6.69%
|
During the six-month period
ended April 30, 2026, the Fund’s NAV was within a range of $15.30 to $16.77 and the Fund’s market price traded within a range of $14.23 to $16.36. During the six-month period ended April 30, 2026, the
Fund’s shares traded within a range of a premium(+)/discount(-) of -8.22% to -2.27%.
On September 9, 2024, the Fund effected a
1-for-6 reverse stock split. The effect of this reverse stock split was to reduce the number of shares outstanding in the Fund, while maintaining the Fund's and each stockholder's aggregate net asset value. All
historical per share information has been retroactively adjusted to reflect this reverse stock split.
Reorganization
On May 18, 2026, the Fund
announced that it had successfully completed the reorganization of abrdn Global Income Fund, Inc. (“FCO”) into FAX after the close of regular business on May 15, 2026 ("Reorganization"). In the
Reorganization, common stockholders of FCO received an amount of FAX common stock with a net asset value equal to the aggregate net asset value of their holdings of FCO common stock, as determined at the close of
regular business on May 15, 2026. As a result, common stockholders of FCO received 0.176821 of newly-issued FAX common stock for every 1 share of FCO common stock that they had previously held. Any applicable
fractional shares were paid as cash-in-lieu to the applicable holder. The Reorganization was structured as a tax-free transaction.
Managed Distribution Policy
The Fund's distributions to
common shareholders and the annualized distribution rates based on market price and NAV, respectively, for the six-month period ended April 30, 2026, and the fiscal years ended October 31, 2025 and October 31, 2024
are shown in the table below:
|
| Distribution
per share to
common
shareholders
| Market
Price
| Annualized
distribution
rate
based on
market price
| NAV
| Annualized
distribution
rate
based on
NAV
|
| 4/30/2026
| $0.99
| $15.02
| 13.2%
| $15.70
| 12.6%
|
| 10/31/2025
| $1.98
| $15.49
| 12.8%
| $16.60
| 11.9%
|
| 10/31/2024
| $1.98
| $16.40
| 12.1%
| $17.70
| 11.2%
|
Since all distributions are
paid after deducting applicable withholding taxes, the effective distribution rate may be higher for those U.S. investors who are able to claim a tax credit.
On May 11, 2026 and June 9,
2026, the Fund announced that it will pay on May 29, 2026 and June 30, 2026, respectively, a distribution of U.S. $0.1650 per share to all shareholders of record as of May 21, 2026 and June 23, 2026, respectively.
{foots1}
| 1
| Past performance is no guarantee of future results. Investment returns and principal value will fluctuate and shares, when sold, may be worth more or less than original cost. Current performance may be
lower or higher than the performance quoted. Net asset value return data includes investment management fees, custodial charges and administrative fees (such as Director and legal fees) and assumes the reinvestment of
all distributions.
|
{foots1}
| 2
| Assuming the reinvestment of dividends and distributions.
|
{foots1}
| 3
| The Fund’s total return is based on the reported NAV for each financial reporting period end and may differ from what is reported on the Financial Highlights due to financial statement rounding or adjustments.
|
{foots1}
| 4
| Blended Benchmark as defined in Total Investment Return section on Page 5.
|
| abrdn Asia-Pacific Income Fund, Inc.
| 1
|
Letter to Shareholders (unaudited) (continued)
The Fund’s policy is to provide
investors with a stable monthly distribution out of current income, supplemented by realized capital gains and, to the extent necessary, paid-in capital, which is a non-taxable return of capital. This policy is
subject to an annual review as well as regular review at the Fund's Board of Directors (the "Board") quarterly meetings, unless market conditions require an earlier evaluation.
Portfolio Allocation
As of April 30, 2026, the
Fund held 74.8% of its total investments in Asian debt securities, 6.0% in Latin America debt securities, 5.8% in Supranational (Offshore Indian denominated securities) debt securities, 4.3% in Australian debt
securities and 9.1% in other debt securities and cash.
The Fund's currency exposure
as of April 30, 2026 was 46.9% in U.S. Dollar, 30.8% in various Asian currencies, and 22.3% in other currencies.
Credit Quality
As of April 30, 2026, 30.1%
of the Fund’s total investments were invested in securities where either the issue or the issuer was rated A or better by S&P Global Ratings (“S&P”)*, Moody’s Investors Services, Inc. (“Moody’s”)** or Fitch Ratings, Inc. (“Fitch”).***
Fund’s Leverage
The table below summarizes
certain key terms of the Fund’s current leverage:
| Amount ($ in millions)
| Maturity
|
| 364-day Revolving Credit Facility
| $66
| July 30, 2026
|
| 5-Year Series B Mandatory Redeemable Preferred Shares
| $100
| October 3, 2029
|
| 15-Year Series C Senior Secured Notes
| $50
| February 8, 2032
|
| 15-Year Series D Senior Secured Notes
| $100
| August 10, 2032
|
| 15-Year Series E Senior Secured Notes
| $100
| June 19, 2034
|
As of April 30, 2026, the
combined $250 million 15-Year Series C, D and E Senior Secured Notes are rated AAA by Kroll.
A more detailed description of
the Fund’s leverage can be found in the Notes to Financial Statements.
Unclaimed Share Accounts
Please be advised that
abandoned or unclaimed property laws for certain states require financial organizations to transfer (escheat) unclaimed property (including Fund shares) to the state. Each state has its own definition of unclaimed
property, and Fund shares could be considered “unclaimed property” due to account inactivity (e.g., no owner-generated activity for a certain period), returned mail (e.g., when mail sent to
a shareholder is returned to the Fund's transfer agent as undeliverable), or a combination of both. If your Fund shares are categorized as unclaimed, your financial advisor or the Fund's transfer agent will
follow the applicable state’s statutory requirements to contact you, but if unsuccessful, laws may require that the shares be escheated to the appropriate state. If this happens, you will have to contact the
state to recover your property, which may involve time and expense. For more information on unclaimed property and how to maintain an active account, please contact your financial adviser or the Fund's transfer
agent.
Open Market Repurchase Program
The Board has approved an
open market repurchase and discount management policy (the “Program”). The Program allows the Fund to purchase, in the open market, its outstanding shares of common stock, with the amount and timing of any
repurchase determined at the discretion of the Fund's Investment Manager. Such purchases may be made opportunistically at certain discounts to NAV per share in the reasonable judgment of management based on historical
discount levels and current market conditions. If shares are repurchased, the Fund reports repurchase activity on its website on a monthly basis. For the six-month period ended April 30, 2026, the Fund did not
repurchase any shares through the Program.
On a quarterly basis, the
Board will receive information on any transactions made pursuant to this policy during the prior quarter. Under the terms of the Program, the Fund is permitted to repurchase during each 12-month period ended October
31 up to 10% of its outstanding shares of common stock outstanding as of October 31 of the prior year.
Portfolio Holdings Disclosure
The Fund's complete schedule
of portfolio holdings for the second and fourth quarters of each fiscal year are included in the Fund's semi-annual and annual reports to shareholders. The Fund files its complete schedule of portfolio holdings with
the Securities and Exchange Commission (the “SEC”) for the first and third quarters of
{foots1}
| *
| S&P’s ratings are expressed as letter grades that range from ‘AAA’ to ‘D’ to communicate the agency’s opinion of relative level of credit risk.Ratings from
‘AA’ to ‘CCC’ may be modified by the addition of a plus (+) or minus (-) sign to show relative standing within the major ratingcategories. The investment grade category is a rating from
‘AAA’ to ‘BBB-’.
|
{foots1}
| **
| Moody’s is an independent, unaffiliated research company that rates fixed income securities. Moody’s assigns ratings on the basis of risk andthe borrower’s ability to make interest
payments.Typically, securities are assigned a rating from‘Aaa’ to ‘C’, with ‘Aaa’ being the highest qualityand ‘C’ the lowest quality.
|
{foots1}
| ***
| Fitch is an international credit rating agency. Fitch ratings range from AAA (reliable and stable) to D (high risk).
|
| 2
| abrdn Asia-Pacific Income Fund, Inc.
|
Letter to Shareholders (unaudited) (concluded)
each fiscal year as an exhibit to its
reports on Form N-PORT. These reports are available on the SEC’s website at http://www.sec.gov. The Fund makes the information available to shareholders upon request and without charge by calling Investor
Relations toll-free at 1-800-522-5465.
Proxy Voting
A description of the policies
and procedures that the Fund uses to determine how to vote proxies relating to portfolio securities and information regarding how the Fund voted proxies relating to portfolio securities during the most recent 12-month
period ended June 30 is available by August 31 of the relevant year: (1) upon request without charge by calling Investor Relations toll-free at 1-800-522-5465; and (2) on the SEC’s website
at www.sec.gov.
Investor Relations Information
As part of Aberdeen's
commitment to shareholders, we invite you to visit the Fund on the web at www.aberdeenfax.com. Here, you can view monthly fact sheets, quarterly commentary, distribution and performance information, as well as other
Fund literature. Enroll in Aberdeen's email services to receive content related to your fund. In addition, you will receive monthly factsheets based on your preferences. Sign up today at www.aberdeenfax.com.
Contact Us:
| •
| Visit: www.aberdeenfax.com
|
| •
| Call: 1-800-522-5465 (toll free in the U.S.).
|
Yours sincerely,
/s/ Alan Goodson
Alan Goodson
President
{foots1}
All amounts are U.S. Dollars
unless otherwise stated.
| abrdn Asia-Pacific Income Fund, Inc.
| 3
|
5All historical per share information has been
retroactively adjusted to reflect the 1-6 reverse stock split.
Loan Facilities and the Use of Leverage
The amounts borrowed under the Revolving
Loan Facility, the Term Loan Facility and the Notes and other funds obtained through various forms of leverage, including the Series B MRPS, may be invested to return higher rates than the rates pursuant to which
interest or dividends are paid under such forms of leverage. However, the cost of leverage could exceed the income earned by the Fund on the proceeds of such leverage. To the extent that the Fund is unable to invest
the proceeds from the use of leverage in assets which pay interest at a rate which exceeds the rate paid on the leverage, the yield on the Fund's common stock will decrease. In addition, in the event of a general
market decline in the value of assets in which the Fund invests, the effect of that decline will be magnified in the Fund because of the additional assets purchased with the proceeds of the leverage.
The Fund obtained leverage
via bank borrowing and other forms of leverage during the reporting period. On July 31, 2024, the Fund entered into a 364-day $100 million revolving credit loan facility with a syndicate led by The Bank of Nova Scotia
(the “Revolving Loan Facility”). On October 3, 2024, the Fund issued a private offering of 4 million shares of Series B Mandatory Redeemable Preferred Shares due October 4, 2029 (the “Series B
MRPS”). The Series B MRPS have a liquidation value of $100 million and are rated “AA-” by Kroll.
As of April 30, 2026, the
Fund had $250,000,000 in aggregate principal amount of senior secured notes rated `AAA’ by Kroll Ratings outstanding ($50,000,000 in 3.87% Series C Senior Secured Notes due February 8, 2032, $100,000,000 in
3.70% Series D Senior Secured Notes due August 10, 2032 and $100,000,000 in 3.73% Series E Senior Secured Notes due June 19, 2034) (collectively, the “Notes”).
The Fund’s leveraged
capital structure creates special risks not associated with unleveraged funds having similar investment objectives and policies. The funds borrowed pursuant to the Revolving Credit Facility and the Notes may
constitute a substantial lien and burden by reason of their prior claim against the income of the Fund and against the net assets of the Fund in liquidation. The Fund is limited in its ability to declare dividends or
other distributions under the terms of the various forms of leverage. In the event of an event of default under the Revolving Credit Facility, the lenders have the right to cause a liquidation of the collateral (i.e.,
sell portfolio securities and other assets of the Fund) and, if any such default is not cured, the lenders may be able to control the liquidation as well. If an event of default occurs under the Note Purchase
Agreement, the holders of the Notes have the right to cause a liquidation of the collateral (i.e., cause the sale of portfolio securities and other assets of the Fund). A
liquidation of the Fund’s collateral
assets in an event of default, or a voluntary paydown of the Revolving Credit Facility, Series B MRPS or the Notes in order to avoid an event of default, would typically involve administrative expenses and sometimes
penalties. Additionally, such liquidations often involve selling off of portions of the Fund’s assets at inopportune times which can result in losses when markets are unfavorable.
The Revolving Credit Facility
Agreement, and the Note Purchase Agreement, includes usual and customary covenants for the applicable type of transaction. These covenants impose on the Fund asset coverage requirements, Fund composition
requirements and limits on certain investments, such as illiquid investments, which are more stringent than those imposed on the Fund by the 1940 Act. The covenants or guidelines could impede the Fund’s
investment manager or sub-adviser from fully managing the Fund’s portfolio in accordance with the Fund’s investment objective and policies. Furthermore, non-compliance with such covenants or the occurrence
of other events could lead to the cancellation of any and/or all of the forms of leverage. As of April 30, 2026, the Fund was in compliance with all covenants under the agreements relating to the various forms of
leverage. Under the Fund's loan facilities, the Fund is charged interest on amounts borrowed at a variable rate, which may be based on a reference rate such as the Secured Overnight Financing Rate
(“SOFR”), plus a spread. Additionally, the Fund may invest in certain debt securities, derivatives or other financial instruments that utilize SOFR as a “benchmark” or “reference
rate” for various interest rate calculations.
Interest Rate Swaps
As of April 30, 2026, the
Fund held interest rate swap agreements with an aggregate notional amount of $66,000,000, which represented 100% of the Fund’s Revolving Credit Facility balance outstanding. Under the terms of the
agreements currently in effect, the Fund receives a floating rate of interest and pays fixed rates of interest for the terms and based upon the notional amounts set forth below.
Remaining
Term as of
April 30, 2026
| Receive/(Pay)
Floating
Rate
| Amount
(in $ thousands)
| Fixed Rate
Payable (%)
|
| 39 months
| Receive
| $31,000.0
| 3.40%
|
| 70 months
| Receive
| $20,000.0
| 3.40%
|
| 82 months
| Receive
| $25,000.0
| 3.38%
|
| 70 months
| Pay
| $10,000.0
| 3.40%
|
| 4
| abrdn Asia-Pacific Income Fund, Inc.
|
Total Investment Return (unaudited)
The following table summarizes
the average annual Fund performance compared to the Fund’s blended benchmark and the Bloomberg Asian-Pacific Aggregate Index for the six-month (not annualized), 1-year, 3-year, 5-year and 10-year periods
ended April 30, 2026.
|
| 6 Months
| 1 Year
| 3 Years
| 5 Years
| 10 Years
|
| Net Asset Value (NAV)
| 0.86%
| 6.81%
| 6.30%
| -0.16%
| 2.29%
|
| Market Price
| 3.40%
| 9.97%
| 10.11%
| 0.88%
| 3.08%
|
| Blended Benchmark*
| 1.14%
| 5.58%
| 5.29%
| 1.43%
| 2.87%
|
| Bloomberg Asian-Pacific Aggregate Index1
| -0.04%
| -2.39%
| -1.30%
| -3.69%
| -1.41%
|
| *
| The blended benchmark is summarized in the table below:
|
| Blended Benchmark Constituents
| Weight
|
| Bloomberg AusBond Composite Index2
| 10.0%
|
| Markit iBoxx Asian Local Bond Index3
| 40.0%
|
| J.P. Morgan Asian Credit Diversified Index4
| 35.0%
|
| J.P. Morgan EMBI Global Diversified Index5
| 15.0%
|
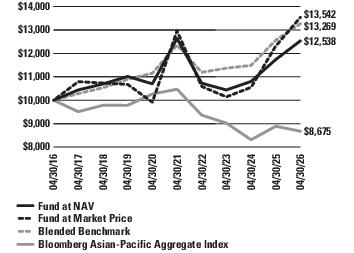
Performance of a $10,000
Investment (as of April 30, 2026)
This graph shows the change in
value of a hypothetical investment of $10,000 in the Fund for the periods indicated. For comparison, the same investment is shown in the indicated index.
The Fund changed its investment
strategies effective June 24, 2020, following shareholder approval of the changes. Performance information for periods prior to June 24, 2020 does not reflect the current investment strategy. Please see Note 1 in the
Notes to Financial Statements for details.
abrdn Inc. has entered into
an agreement with the Fund to limit investor relations services fees, without which performance would be lower. This agreement aligns with the term of the advisory agreement and may not be terminated prior to the end
of the current term of the advisory agreement. See Note 3 in the Notes to Financial Statements.
Returns represent past
performance. Total investment return at NAV is based on changes in the NAV of Fund shares and assumes reinvestment of dividends and distributions, if any, at market prices pursuant to the dividend reinvestment program
sponsored by the Fund’s transfer agent. All return data at NAV includes fees charged to the Fund, which are listed in the Fund’s Statement of Operations under “Expenses.” Total investment
return at market value is based on changes in the market price at which the Fund’s shares traded on the NYSE American during the period and assumes reinvestment of dividends and distributions, if any, at market
prices pursuant to the dividend reinvestment program sponsored by the Fund’s transfer agent. The Fund’s total investment return is based on the reported NAV as of the financial reporting period end date of
April 30, 2026. Because the Fund’s shares trade in the stock market based on investor demand, the Fund may trade at a price higher or lower than its NAV. Therefore, returns are calculated based on both market
price and NAV. Past performance is no guarantee of future results. The performance information provided does not reflect the deduction of taxes that a shareholder would pay on distributions received
from the Fund or the sale of Fund shares. The current performance
| abrdn Asia-Pacific Income Fund, Inc.
| 5
|
Total Investment Return (unaudited) (concluded)
of the Fund may be lower or higher than the
figures shown. The Fund’s yield, return, market price and NAV will fluctuate. Performance information current to the most recent month-end is available at www.aberdeenfax.com or by calling 800-522-5465.
The annualized net operating
expense ratio based on the six-month period ended April 30, 2026 was 4.25%. The annualized net operating expenses excluding interest expense and distributions to Series B Mandatory Redeemable Preferred Shares based on
the six-month period ended April 30, 2026 was 1.44%.
| 6
| abrdn Asia-Pacific Income Fund, Inc.
|
Portfolio Composition (as a percentage of net assets) (unaudited)
As of April 30, 2026
Quality of Investments(1)(2)
As of April 30, 2026, 30.1%
of the Fund’s investments were invested in securities where either the issue or the issuer was rated “A” or better by S&P, Moody’s or Fitch or, if unrated, was judged to be of equivalent
quality by abrdn Asia Limited (the “Investment Manager”). The following table shows the ratings of securities held by the Fund as of April 30, 2026, compared with October 31, 2025 and April 30, 2025:
| Date
| AAA/Aaa
%
| AA/Aa
%
| A
%
| BBB/Baa
%
| BB/Ba*
%
| B*
%
| B or below*
%
| NR**
%
|
| April 30, 2026
| 7.9
| 4.3
| 17.9
| 41.2
| 16.5
| 5.8
| 3.2
| 3.2
|
| October 31, 2025
| 6.5
| 5.1
| 16.6
| 44.6
| 17.4
| 4.9
| 3.2
| 1.7
|
| April 30, 2025
| 4.7
| 4.4
| 13.8
| 48.8
| 18.0
| 4.0
| 4.3
| 2.0
|
| *
| Below investment grade
|
| **
| Not Rated
|
Geographic Composition(2)
The table below shows the
geographical composition of the Fund’s total investments as of April 30, 2026, compared with October 31, 2025 and April 30, 2025:
| Date
| Asia
(Including NZ)
%
| Latin America
%
| Supranational
%
| Australia
%
| Other, < 5
%
|
| April 30, 2026
| 74.8
| 6.0
| 5.8
| 4.3
| 9.1
|
| October 31, 2025
| 72.3
| 4.0
| 4.4
| 3.9
| 15.4
|
| April 30, 2025
| 74.9
| 4.2
| 5.1
| 5.4
| 10.4
|
Currency Composition(2)
The table below shows the
currency composition of the Fund’s total investments as of April 30, 2026, compared with October 31, 2025 and April 30, 2025:
| Date
| U.S. Dollar
%
| Asian Currencies
(Including NZ Dollar)
%
| Other, < 5
%
|
| April 30, 2026
| 46.9
| 30.8
| 22.3
|
| October 31, 2025
| 47.6
| 36.1
| 16.3
|
| April 30, 2025
| 48.8
| 39.5
| 11.7
|
Maturity Composition(2)
The average maturity of the
Fund’s total investments was 5.2 years as of April 30, 2026, compared with 7.0 years as of October 31, 2025, and 7.6 years as of April 30, 2025. The following table shows the maturity composition of the
Fund’s investments as of April 30, 2026, compared with October 31, 2025 and April 30, 2025:
| Date
| 0 to 5 Years
%
| 5 to 10 Years
%
| 10 Years & Over
%
|
| April 30, 2026
| 58.3
| 31.0
| 10.7
|
| October 31, 2025
| 51.8
| 33.2
| 15.0
|
| April 30, 2025
| 51.8
| 29.2
| 19.0
|
Modified Duration
As of April 30, 2026, the
modified duration* of the Fund was 5.2 years. This calculation excludes the interest rate swaps that are used to manage the leverage of the Fund. Excluding swaps will decrease portfolio duration.
| abrdn Asia-Pacific Income Fund, Inc.
| 7
|
Portfolio Composition (as a percentage of net assets) (unaudited) (concluded)
As of April 30, 2026
| *
| Modified duration is a measure of the sensitivity of the price of a bond to the fluctuations in interest rates.
|
| (1)
| For financial reporting purposes, credit quality ratings shown above reflect the lowest rating assigned by either S&P, Moody’s or Fitch if ratings differ. These rating agencies are
independent, nationally recognized statistical rating organizations and are widely used. Investment grade ratings are credit ratings of BBB/Baa or higher. Below investment grade ratings are credit ratings of BB/Ba or
lower. Investments designated NR are not rated by these rating agencies. Unrated investments do not necessarily indicate low credit quality. Credit quality ratings are subject to change. The Investment Manager
evaluates the credit quality of unrated investments based upon, but not limited to, credit ratings for similar investments.
|
| (2)
| % reflected in below table do not reflect exposure to derivatives.
|
| 8
| abrdn Asia-Pacific Income Fund, Inc.
|
Summary of Key Rates (unaudited)
The following table summarizes
the movements of key interest rates and currencies from April 30, 2026 compared to October 31, 2025 and April 30, 2025.
|
|
| Apr–26
| Oct–25
| Apr-25
|
| Australia
| 90 day Bank Bills
| 4.38%
| 3.64%
| 3.88%
|
|
| 10 yr bond
| 5.07%
| 4.30%
| 4.12%
|
|
| currency local per 1USD
| $1.39
| $1.53
| $1.56
|
| South Korea
| 90 day commercial paper
| 2.81%
| 2.55%
| 2.71%
|
|
| 10 yr bond
| 3.92%
| 3.06%
| 2.57%
|
|
| currency local per 1USD
| ₩156.71
| ₩154.06
| ₩142.64
|
| Thailand
| 3-month deposit rate
| 0.65%
| 0.80%
| 1.00%
|
|
| 10 yr bond
| 2.18%
| 1.70%
| 1.88%
|
|
| currency local per 1USD
| ฿32.60
| ฿32.34
| ฿33.41
|
| Philippines
| 90 day T-Bills
| 4.62%
| 4.90%
| 5.49%
|
|
| 10 yr bond
| 6.93%
| 5.93%
| 6.27%
|
|
| currency local per 1USD
| ₱61.48
| ₱58.85
| ₱55.86
|
| Malaysia
| 3-Month T-Bills
| 2.91%
| 2.83%
| 3.11%
|
|
| 10 yr bond
| 3.57%
| 3.49%
| 3.66%
|
|
| currency local per 1USD
| RM3.97
| RM4.19
| RM4.32
|
| Singapore
| 3-month T-Bills
| 1.37%
| 1.39%
| 2.46%
|
|
| 10 yr bond
| 2.11%
| 1.91%
| 2.48%
|
|
| currency local per 1USD
| S$1.27
| S$1.30
| S$1.31
|
| India
| 3-month T-Bills
| 5.28%
| 5.44%
| 5.89%
|
|
| 10 yr bond
| 7.04%
| 6.53%
| 6.36%
|
|
| currency local per 1USD
| ₹94.91
| ₹88.77
| ₹84.48
|
| Indonesia
| 3-month deposit rate
| 3.81%
| 3.92%
| 4.28%
|
|
| 10 yr bond
| 6.83%
| 6.06%
| 6.86%
|
|
| currency local per 1USD
| Rp17,310.00
| Rp16,630.00
| Rp16,600.00
|
| China Onshore
| 3-month Bill Yield
| 1.08%
| 1.29%
| 1.47%
|
|
| 10 yr bond
| 1.75%
| 1.79%
| 1.63%
|
|
| currency local per 1USD
| ¥6.83
| ¥7.11
| ¥7.26
|
| Sri Lanka
| 3-month Generic Govt Yield
| 8.12%
| 7.59%
| 7.68%
|
|
| 10 yr bond
| 11.01%
| 11.16%
| 11.41%
|
|
| currency local per 1USD
| Rs319.60
| Rs304.45
| Rs299.48
|
| USD Denominated Bonds
| Indonesia (10 year, Government Bond)
| 4.99%
| 4.51%
| 5.40%
|
|
| Sri Lanka (3 year, Sovereign Bond)
| 9.20%
| 8.93%
| 20.86%
|
| abrdn Asia-Pacific Income Fund, Inc.
| 9
|
Portfolio of Investments (unaudited)
As of April 30, 2026
|
| Principal
Amount
| Value
|
| GOVERNMENT BONDS—75.5%
|
|
| BRAZIL—4.2%
|
|
|
| Brazil Notas do Tesouro Nacional
|
|
|
|
| 10.00%, 01/01/2029
| BRL
| 73,000,000
| $ 13,626,596
|
| 10.00%, 01/01/2033
|
| 30,000,000
| 5,109,430
|
| 10.00%, 01/01/2035
|
| 50,000,000
| 8,262,652
|
| Total Brazil
|
| 26,998,678
|
| CHINA—6.8%
|
|
|
| China Government Bonds
|
|
|
|
| 1.46%, 05/25/2028
| CNY
| 14,000,000
| 2,058,112
|
| 1.63%, 10/25/2030
|
| 65,000,000
| 9,574,077
|
| 1.67%, 05/25/2035
|
| 175,500,000
| 25,537,968
|
| 1.88%, 04/25/2055
|
| 50,500,000
| 6,798,913
|
| Total China
|
| 43,969,070
|
| DOMINICAN REPUBLIC—0.7%
|
|
|
| Dominican Republic International Bonds, 13.63%, 02/03/2033(a)(b)
| DOP
| 219,950,000
| 4,412,864
|
| HONG KONG—3.7%
|
|
|
| Airport Authority
|
|
|
|
| 4.88%, 01/12/2033(a)(b)
| $
| 1,350,000
| 1,383,219
|
| 5.13%, 01/15/2035(a)(b)
|
| 2,131,000
| 2,228,382
|
| Hong Kong Government Infrastructure Bonds Programme
|
|
|
|
| 2.76%, 04/25/2028
| HKD
| 48,000,000
| 6,148,098
|
| 1.97%, 05/15/2030
| CNY
| 52,700,000
| 7,802,318
|
| 3.17%, 07/24/2035
| HKD
| 50,000,000
| 6,454,773
|
| Total Hong Kong
|
| 24,016,790
|
| INDIA—0.8%
|
|
|
| Export-Import Bank of India
|
|
|
|
| 5.50%, 01/18/2033(a)
| $
| 2,500,000
| 2,567,564
|
| 5.75%, 01/12/2056(a)
|
| 2,500,000
| 2,495,572
|
| India Government Bonds, 7.40%, 09/19/2062
| INR
| 46,520,000
| 465,963
|
| Total India
|
| 5,529,099
|
| INDONESIA—12.4%
|
|
|
| Indonesia Government International Bonds
|
|
|
|
| 2.45%, 03/04/2029
| CNY
| 43,000,000
| 6,286,165
|
| 2.50%, 10/31/2030
|
| 23,500,000
| 3,416,632
|
| 8.50%, 10/12/2035(a)
| $
| 12,880,000
| 15,943,217
|
| 7.75%, 01/17/2038(a)
|
| 6,000,000
| 7,227,646
|
| Indonesia Treasury Bonds
|
|
|
|
| 9.00%, 03/15/2029
| IDR
| 160,000,000,000
| 9,808,027
|
| 8.25%, 05/15/2029
|
| 200,000,000,000
| 12,051,791
|
| 8.75%, 05/15/2031
|
| 235,000,000,000
| 14,752,733
|
| 9.50%, 07/15/2031
|
| 16,000,000,000
| 1,032,985
|
| 7.00%, 02/15/2033
|
| 125,000,000,000
| 7,264,179
|
| 8.38%, 04/15/2039
|
| 38,500,000,000
| 2,487,943
|
| Total Indonesia
|
| 80,271,318
|
| KAZAKHSTAN—0.4%
|
|
|
| Development Bank of Kazakhstan JSC, 16.95%, 05/08/2029(a)
| KZT
| 1,125,500,000
| 2,426,475
|
| KYRGYZSTAN—0.4%
|
|
|
| Kyrgyz Republic International Bonds, 7.75%, 06/03/2030(a)
| $
| 2,760,000
| 2,817,071
|
|
| Principal
Amount
| Value
|
|
|
|
| LAOS—0.4%
|
|
|
| Laos Government International Bonds, 11.25%, 11/12/2030(a)(c)
| $
| 2,300,000
| $ 2,420,750
|
| MALAYSIA—13.5%
|
|
|
| Malaysia Government Bonds
|
|
|
|
| 3.90%, 11/16/2027
| MYR
| 5,000,000
| 1,275,077
|
| 3.52%, 04/20/2028
|
| 20,000,000
| 5,066,723
|
| 3.73%, 06/15/2028
|
| 5,000,000
| 1,272,577
|
| 3.89%, 08/15/2029
|
| 20,000,000
| 5,136,883
|
| 3.58%, 07/15/2032
|
| 60,000,000
| 15,204,935
|
| 3.84%, 04/15/2033
|
| 20,000,000
| 5,137,933
|
| 4.64%, 11/07/2033
|
| 30,000,000
| 8,094,326
|
| 3.83%, 07/05/2034
|
| 17,000,000
| 4,361,432
|
| 4.25%, 05/31/2035
|
| 20,000,000
| 5,299,335
|
| 4.76%, 04/07/2037
|
| 10,000,000
| 2,749,247
|
| 4.70%, 10/15/2042
|
| 6,500,000
| 1,784,630
|
| 4.18%, 05/16/2044
|
| 7,000,000
| 1,812,918
|
| 4.07%, 06/15/2050
|
| 9,800,000
| 2,481,870
|
| Malaysia Government Investment Issue
|
|
|
|
| 3.60%, 07/31/2028
|
| 50,000,000
| 12,699,426
|
| 3.64%, 08/30/2030
|
| 50,000,000
| 12,743,171
|
| 3.97%, 07/16/2040
|
| 10,000,000
| 2,546,780
|
| Total Malaysia
|
| 87,667,263
|
| MEXICO—4.2%
|
|
|
| Mexico Bonos, 8.50%, 05/31/2029
| MXN
| 469,000,000
| 26,990,623
|
| MONGOLIA—0.6%
|
|
|
| Development Bank of Mongolia LLC, 8.50%, 07/03/2028(a)
| $
| 3,800,000
| 3,916,311
|
| PAKISTAN—4.5%
|
|
|
| Pakistan Government International Bonds, 6.88%, 12/05/2027(a)
|
| 1,500,000
| 1,505,544
|
| Pakistan Investment Bonds
|
|
|
|
| 14.00%, 02/15/2027
| PKR
| 5,200,000,000
| 18,878,761
|
| 14.00%, 09/20/2027
|
| 2,400,000,000
| 8,768,911
|
| Total Pakistan
|
| 29,153,216
|
| PHILIPPINES—8.4%
|
|
|
| Philippines Government Bonds
|
|
|
|
| 6.38%, 07/27/2030
| PHP
| 260,000,000
| 4,146,631
|
| 6.13%, 01/18/2031
|
| 222,000,000
| 3,492,732
|
| 8.00%, 07/19/2031
|
| 755,000,000
| 12,856,085
|
| 6.75%, 09/15/2032
|
| 482,080,000
| 7,791,197
|
| 6.63%, 08/17/2033
|
| 88,270,000
| 1,405,341
|
| 6.25%, 01/25/2034
|
| 275,170,000
| 4,264,808
|
| 9.25%, 11/05/2034
|
| 252,430,000
| 4,681,462
|
| 8.00%, 09/30/2035
|
| 202,300,000
| 3,502,036
|
| Philippines Government International Bonds
|
|
|
|
| 6.38%, 10/23/2034
| $
| 6,500,000
| 7,070,398
|
| 5.50%, 01/17/2048
|
| 5,200,000
| 5,018,146
|
| Total Philippines
|
| 54,228,836
|
| SAUDI ARABIA—0.4%
|
|
|
| Saudi Government International Bonds, 5.75%, 01/16/2054(a)
|
| 3,000,000
| 2,880,419
|
| 10
| abrdn Asia-Pacific Income Fund, Inc.
|
Portfolio of Investments (unaudited) (continued)
As of April 30, 2026
|
| Principal
Amount
| Value
|
| GOVERNMENT BONDS (continued)
|
|
| SINGAPORE—3.1%
|
|
|
| Housing & Development Board, 2.60%, 10/30/2029(a)
| SGD
| 7,500,000
| $ 6,033,413
|
| Singapore Government Bonds
|
|
|
|
| 2.88%, 09/01/2027
|
| 1,700,000
| 1,359,145
|
| 2.75%, 03/01/2035
|
| 4,300,000
| 3,564,190
|
| 3.25%, 06/01/2054(a)
|
| 9,400,000
| 9,055,624
|
| Total Singapore
|
| 20,012,372
|
| SOUTH AFRICA—3.8%
|
|
|
| Republic of South Africa Government Bonds
|
|
|
|
| 8.25%, 03/31/2032
| ZAR
| 256,987,600
| 15,231,320
|
| 8.50%, 01/31/2037
|
| 165,000,000
| 9,527,148
|
| Total South Africa
|
| 24,758,468
|
| SOUTH KOREA—2.4%
|
|
|
| Export-Import Bank of Korea, 5.13%, 01/11/2033
| $
| 2,184,000
| 2,264,660
|
| Korea Housing Finance Corp., 5.13%, 01/21/2030(a)
|
| 3,500,000
| 3,593,724
|
| Korea Treasury Bonds, 2.50%, 03/10/2052
| KRW
| 18,300,000,000
| 9,568,359
|
| Total South Korea
|
| 15,426,743
|
| SRI LANKA—0.2%
|
|
|
| Sri Lanka Government International Bonds, 3.35%, 03/15/2033(a)(c)(d)
| $
| 1,500,000
| 1,336,763
|
| THAILAND—3.9%
|
|
|
| Thailand Government Bonds
|
|
|
|
| 1.66%, 03/17/2030
| THB
| 96,000,000
| 2,963,760
|
| 2.80%, 06/17/2034
|
| 45,000,000
| 1,448,577
|
| 2.41%, 03/17/2035
|
| 320,000,000
| 10,020,664
|
| 3.40%, 06/17/2036
|
| 60,000,000
| 2,019,079
|
| 2.70%, 06/17/2040
|
| 110,000,000
| 3,402,267
|
| 2.98%, 06/17/2045
|
| 180,000,000
| 5,430,901
|
| Total Thailand
|
| 25,285,248
|
| TURKEY—0.4%
|
|
|
| Turkiye Ihracat Kredi Bankasi AS, 6.88%, 07/03/2028(a)
| $
| 2,500,000
| 2,553,178
|
| URUGUAY—0.3%
|
|
|
| Uruguay Government International Bonds, 8.25%, 05/21/2031
| UYU
| 79,419,234
| 2,041,393
|
| Total Government Bonds
|
| 489,112,948
|
| CORPORATE BONDS—74.4%
|
|
| AUSTRALIA—6.9%
|
|
|
| Australia & New Zealand Banking Group Ltd., (fixed rate to 08/12/2027, variable rate thereafter),
5.91%, 08/12/2027(b)
| AUD
| 900,000
| 649,471
|
| Commonwealth Bank of Australia
|
|
|
|
| (fixed rate to 11/09/2027, variable rate thereafter), 6.86%, 11/09/2027(a)(b)
|
| 4,000,000
| 2,925,849
|
| (fixed rate to 03/15/2033, variable rate thereafter), 6.70%, 03/15/2033(b)
|
| 7,500,000
| 5,529,703
|
|
| Principal
Amount
| Value
|
|
|
|
|
|
|
|
| National Australia Bank Ltd.
|
|
|
|
| (fixed rate to 08/03/2027, variable rate thereafter), 6.32%, 08/03/2027(a)(b)
| AUD
| 7,500,000
| $ 5,442,013
|
| (fixed rate to 03/09/2028, variable rate thereafter), 6.16%, 03/09/2028(a)(b)
|
| 1,500,000
| 1,086,988
|
| 6.43%, 01/12/2033(a)
| $
| 1,000,000
| 1,066,758
|
| NBN Co. Ltd., 4.15%, 09/16/2030(a)(b)
|
| 2,907,000
| 2,867,927
|
| Perenti Finance Pty. Ltd., 7.50%, 04/26/2029(a)(b)
|
| 3,800,000
| 3,918,920
|
| Santos Finance Ltd., 4.13%, 09/14/2027(a)(b)
|
| 4,900,000
| 4,860,514
|
| Wesfarmers Ltd., 2.55%, 06/23/2031(a)(b)
| AUD
| 7,000,000
| 4,302,552
|
| Westpac Banking Corp.
|
|
|
|
| (fixed rate to 06/23/2028, variable rate thereafter), 6.49%, 06/23/2028(a)(b)
|
| 5,000,000
| 3,647,736
|
| (fixed rate to 06/23/2033, variable rate thereafter), 6.93%, 06/23/2033(a)(b)
|
| 5,000,000
| 3,731,754
|
| (fixed rate to 11/15/2033, variable rate thereafter), 7.20%, 11/15/2033(b)
|
| 6,000,000
| 4,545,665
|
| Total Australia
|
| 44,575,850
|
| CHINA—8.4%
|
|
|
| Alibaba Group Holding Ltd.
|
|
|
|
| 4.50%, 11/28/2034(b)
| $
| 2,500,000
| 2,442,118
|
| 5.63%, 11/26/2054(b)
|
| 2,350,000
| 2,338,269
|
| CFAMC III Co. Ltd., 4.75%, 04/27/2027(a)
|
| 4,500,000
| 4,502,697
|
| China Hongqiao Group Ltd.
|
|
|
|
| 7.05%, 01/10/2028(a)
|
| 2,300,000
| 2,369,435
|
| 6.93%, 11/29/2028(a)
|
| 2,252,000
| 2,340,444
|
| China Oil & Gas Group Ltd., 7.00%, 02/04/2029(a)(b)
|
| 5,000,000
| 4,913,636
|
| Far East Horizon Ltd.
|
|
|
|
| 6.63%, 04/16/2027(a)
|
| 4,800,000
| 4,838,104
|
| 5.25%, 01/13/2029(a)
|
| 2,413,000
| 2,363,990
|
| Fortune Star BVI Ltd., 8.50%, 05/19/2028(a)(b)
|
| 4,700,000
| 4,810,042
|
| Health & Happiness H&H International Holdings Ltd., 9.13%, 07/24/2028(a)(b)
|
| 4,900,000
| 5,122,590
|
| Industrial & Commercial Bank of China Ltd., Series 2022-1, 3.28%, 01/20/2032(b)
| CNY
| 30,000,000
| 4,444,389
|
| Meituan, 5.13%, 11/05/2035(a)(b)
| $
| 2,495,000
| 2,426,219
|
| New Metro Global Ltd., 11.80%, 03/09/2029(a)
|
| 2,500,000
| 2,404,546
|
| Shui On Development Holding Ltd., 9.75%, 01/26/2029(a)(b)
|
| 4,850,000
| 4,896,056
|
| Zhongsheng Group Holdings Ltd., 5.98%, 01/30/2028(a)(b)
|
| 4,310,000
| 4,176,035
|
| Total China
|
| 54,388,570
|
| abrdn Asia-Pacific Income Fund, Inc.
| 11
|
Portfolio of Investments (unaudited) (continued)
As of April 30, 2026
|
| Principal
Amount
| Value
|
| CORPORATE BONDS (continued)
|
|
| FRANCE—0.9%
|
|
|
| BNP Paribas SA, VRN, (fixed rate to 08/14/2028, variable rate thereafter), 8.50%,
08/14/2028(a)(e)
| $
| 5,240,000
| $ 5,536,401
|
| GEORGIA—1.4%
|
|
|
| Bank of Georgia JSC, VRN, (fixed rate to 07/16/2029, variable rate thereafter), 9.50%, 07/16/2029(a)(e)
|
| 2,500,000
| 2,609,403
|
| Georgia Global Utilities JSC, 8.88%, 07/25/2029(a)(b)
|
| 4,119,000
| 4,269,809
|
| Silk Road Group Holding LLC, 7.50%, 09/15/2030(a)(b)
|
| 2,379,000
| 2,396,804
|
| Total Georgia
|
| 9,276,016
|
| HONG KONG—9.8%
|
|
|
| AIA Group Ltd., 5.63%, 10/25/2027(a)(b)
|
| 3,750,000
| 3,824,664
|
| Cas Capital No. 2 Ltd., VRN, (fixed rate to 01/13/2031, variable rate thereafter), 6.25%, 01/13/2031(a)(e)
|
| 4,900,000
| 4,926,839
|
| China Ping An Insurance Overseas Holdings Ltd., 5.00%, 10/08/2035(a)(b)
|
| 1,260,000
| 1,238,534
|
| CS Treasury Management Services P Ltd., 9.00%, 06/05/2026(a)(d)(e)
|
| 2,500,000
| 2,553,857
|
| Elect Global Investments Ltd., VRN, (fixed rate to 09/11/2030, variable rate thereafter), 7.20%,
09/11/2030(a)(e)
|
| 4,600,000
| 4,847,115
|
| Hongkong Land Finance Cayman Islands Co. Ltd., 5.25%, 07/14/2033(a)(b)
|
| 5,000,000
| 5,124,714
|
| Hutchison Whampoa Finance CI Ltd., 7.50%, 08/01/2027(a)
|
| 15,500,000
| 16,092,361
|
| Hutchison Whampoa International 03/33 Ltd., 7.45%, 11/24/2033(a)
|
| 980,000
| 1,134,501
|
| Melco Resorts Finance Ltd.
|
|
|
|
| 7.63%, 04/17/2032(a)(b)
|
| 4,769,000
| 4,918,382
|
| 7.63%, 04/17/2032(a)(b)
|
| 3,000,000
| 3,093,970
|
| MTR Corp. CI Ltd., VRN, (fixed rate to 09/24/2035, variable rate thereafter), 5.63%, 09/24/2035(a)(e)
|
| 3,000,000
| 3,121,127
|
| MTR Corp. Ltd.
|
|
|
|
| 5.58%, 01/29/2038(a)(b)
| AUD
| 5,000,000
| 3,496,906
|
| 5.25%, 04/01/2055(a)(b)
| $
| 1,300,000
| 1,292,371
|
| NWD MTN Ltd., 8.63%, 02/08/2028(a)(b)
|
| 3,200,000
| 3,023,514
|
| Prudential Funding Asia PLC, VRN, (fixed rate to 08/03/2028, variable rate thereafter),
2.95%, 08/03/2028(a)(b)
|
| 5,400,000
| 5,157,753
|
| Total Hong Kong
|
| 63,846,608
|
|
| Principal
Amount
| Value
|
|
|
|
| INDIA—9.6%
|
|
|
| Axis Bank Ltd., VRN, (fixed rate to 09/08/2026, variable rate thereafter), 4.10%, 09/08/2026(a)(e)
| $
| 2,500,000
| $ 2,478,039
|
| Continuum Green Energy India Pvt/Co-Issuers, 7.50%, 06/26/2033(a)(b)(c)
|
| 940,750
| 972,830
|
| Greenko Power II Ltd., 4.30%, 12/13/2028(a)(b)(c)
|
| 3,505,880
| 3,349,285
|
| Greenko Wind Projects Mauritius Ltd., 7.25%, 09/27/2028(a)(b)(c)
|
| 1,310,050
| 1,321,775
|
| HDFC Bank Ltd., Series AB1, 7.69%, 01/27/2033
| INR
| 660,000,000
| 6,911,216
|
| IIFL Finance Ltd., 8.75%, 07/24/2028(a)
| $
| 1,148,000
| 1,172,569
|
| India Cleantech Energy, 4.70%, 08/10/2026(a)(b)(c)
|
| 988,500
| 984,806
|
| India Green Power Holdings, 4.00%, 02/22/2027(a)(b)(c)
|
| 4,857,600
| 4,779,623
|
| Indian Railway Finance Corp. Ltd., Series 129, 8.45%, 12/04/2028
| INR
| 50,000,000
| 535,869
|
| Manappuram Finance Ltd., 7.38%, 05/12/2028(a)(c)
| $
| 1,100,000
| 1,114,468
|
| Muthoot Finance Ltd., 7.13%, 02/14/2028(a)(c)
|
| 2,389,000
| 2,425,288
|
| Power Finance Corp. Ltd., 6.15%, 12/06/2028(a)
|
| 7,112,000
| 7,355,422
|
| REC Ltd.
|
|
|
|
| 5.63%, 04/11/2028(a)
|
| 3,443,000
| 3,497,649
|
| 4.75%, 09/27/2029(a)
|
| 3,800,000
| 3,792,607
|
| Renew Treasury Ifsc Pvt Ltd., 6.50%, 02/02/2031(a)(b)
|
| 1,213,000
| 1,208,207
|
| ReNew Wind Energy AP2/ReNew Power Pvt Ltd. other 9 Subsidiaries, 4.50%, 07/14/2028(a)(b)
|
| 1,050,000
| 1,009,735
|
| Sammaan Capital Ltd.
|
|
|
|
| 9.70%, 07/03/2027(a)
|
| 1,734,000
| 1,779,365
|
| 8.95%, 08/28/2028(a)
|
| 1,500,000
| 1,552,851
|
| 7.50%, 10/16/2030(a)
|
| 1,000,000
| 997,292
|
| Shriram Finance Ltd., 6.63%, 04/22/2027(a)
|
| 5,000,000
| 5,075,974
|
| UPL Corp. Ltd.
|
|
|
|
| 4.50%, 03/08/2028(a)
|
| 2,641,000
| 2,549,416
|
| 4.63%, 06/16/2030(a)
|
| 1,300,000
| 1,192,947
|
| Vedanta Resources Finance II PLC
|
|
|
|
| 10.25%, 06/03/2028(a)(b)
|
| 1,000,000
| 1,025,637
|
| 10.88%, 09/17/2029(a)(b)
|
| 1,700,000
| 1,806,426
|
| 9.13%, 10/15/2032(a)(b)
|
| 1,400,000
| 1,455,943
|
| 9.85%, 04/24/2033(a)(b)
|
| 1,800,000
| 1,918,921
|
| Total India
|
| 62,264,160
|
| INDONESIA—4.2%
|
|
|
| Bank Mandiri Persero Tbk. PT, 5.25%, 04/10/2031(a)
|
| 1,178,000
| 1,190,271
|
| Bank Negara Indonesia Persero Tbk. PT, VRN, (fixed rate to 10/22/2031, variable rate thereafter), 7.15%,
10/22/2031(a)(e)
|
| 4,112,000
| 4,146,188
|
| 12
| abrdn Asia-Pacific Income Fund, Inc.
|
Portfolio of Investments (unaudited) (continued)
As of April 30, 2026
|
| Principal
Amount
| Value
|
| CORPORATE BONDS (continued)
|
|
| INDONESIA (continued)
|
|
|
| Krakatau Posco PT, 6.38%, 06/11/2029(a)
| $
| 4,750,000
| $ 4,798,833
|
| LLPL Capital Pte. Ltd., 6.88%, 02/04/2039(a)(c)
|
| 4,127,025
| 4,194,741
|
| Medco Cypress Tree Pte. Ltd., 8.63%, 05/19/2030(a)(b)
|
| 2,251,000
| 2,349,806
|
| Medco Maple Tree Pte. Ltd., 8.96%, 04/27/2029(a)(b)
|
| 2,206,000
| 2,276,120
|
| Nickel Industries Ltd., 9.00%, 09/30/2030(a)(b)
|
| 1,619,000
| 1,683,183
|
| Pertamina Geothermal Energy PT, 5.15%, 04/27/2028(a)(b)
|
| 1,892,000
| 1,902,295
|
| Perusahaan Perseroan Persero PT Perusahaan Listrik Negara
|
|
|
|
| REGS, 6.15%, 05/21/2048(a)
|
| 1,500,000
| 1,451,230
|
| 6.15%, 05/21/2048(a)
|
| 3,129,000
| 3,027,265
|
| Total Indonesia
|
| 27,019,932
|
| JAPAN—2.3%
|
|
|
| Nippon Life Insurance Co., VRN, (fixed rate to 04/30/2035, variable rate thereafter), 6.50%,
04/30/2035(a)(b)
|
| 3,170,000
| 3,338,860
|
| NTT Finance Corp., 5.50%, 07/16/2035(a)(b)
|
| 1,800,000
| 1,831,459
|
| Rakuten Group, Inc., 11.25%, 02/15/2027(a)
|
| 4,500,000
| 4,678,722
|
| SoftBank Corp., 5.33%, 07/09/2035(a)(b)
|
| 5,000,000
| 4,948,138
|
| Total Japan
|
| 14,797,179
|
| KAZAKHSTAN—1.1%
|
|
|
| Development Bank of Kazakhstan JSC, 10.95%, 05/06/2026(a)
| KZT
| 3,265,000,000
| 7,044,191
|
| MACAO—2.4%
|
|
|
| MGM China Holdings Ltd., 7.13%, 06/26/2031(a)(b)
| $
| 3,600,000
| 3,744,782
|
| Sands China Ltd., 5.40%, 08/08/2028(b)
|
| 5,000,000
| 5,057,300
|
| Studio City Finance Ltd., 5.00%, 01/15/2029(a)(b)
|
| 3,800,000
| 3,621,518
|
| Wynn Macau Ltd., 5.63%, 08/26/2028(a)(b)
|
| 3,000,000
| 2,977,620
|
| Total Macao
|
| 15,401,220
|
| MALAYSIA—3.1%
|
|
|
| DRB-Hicom Bhd., IMTN, 5.10%, 12/12/2029
| MYR
| 5,000,000
| 1,313,266
|
| Gohl Capital Holdings Ltd., VRN, (fixed rate to 10/29/2031, variable rate thereafter), 7.63%,
10/29/2031(a)(e)
| $
| 1,000,000
| 988,750
|
| Khazanah Capital Ltd., 4.76%, 09/05/2034(a)
|
| 3,900,000
| 3,891,330
|
| Pengerang LNG Two Sdn Bhd.
|
|
|
|
| IMTN, 2.86%, 10/20/2028
| MYR
| 5,000,000
| 1,242,230
|
| IMTN, 2.92%, 10/19/2029
|
| 5,000,000
| 1,235,243
|
| Petroliam Nasional Bhd., 7.63%, 10/15/2026(a)
| $
| 2,000,000
| 2,029,983
|
|
| Principal
Amount
| Value
|
|
|
|
|
|
|
|
| Petronas Capital Ltd.
|
|
|
|
| 2.48%, 01/28/2032(a)(b)
| $
| 2,000,000
| $ 1,799,593
|
| 5.85%, 04/03/2055(a)(b)
|
| 2,800,000
| 2,905,005
|
| 4.80%, 04/21/2060(a)(b)
|
| 2,600,000
| 2,301,604
|
| Tenaga Nasional Bhd., 7.50%, 01/15/2096(a)
|
| 2,700,000
| 2,691,090
|
| Total Malaysia
|
| 20,398,094
|
| MONGOLIA—0.8%
|
|
|
| Tsetsens Mining & Energy LLC, 11.38%, 02/05/2031(a)(b)
|
| 5,000,000
| 5,186,021
|
| MOROCCO—0.4%
|
|
|
| OCP SA, 7.50%, 05/02/2054(a)(b)
|
| 2,672,000
| 2,849,207
|
| NIGERIA—0.5%
|
|
|
| Dangote Fertiliser Ltd., 7.75%, 05/05/2031(a)(b)
|
| 3,088,000
| 3,130,460
|
| PHILIPPINES—0.7%
|
|
|
| AC Energy Finance International Ltd., 5.10%, 11/25/2026(a)(e)
|
| 3,000,000
| 2,526,858
|
| Smphi SG Holdings Pte. Ltd., 4.75%, 09/16/2030(a)(b)
|
| 2,200,000
| 2,180,188
|
| Total Philippines
|
| 4,707,046
|
| SAUDI ARABIA—1.6%
|
|
|
| Greensaif Pipelines Bidco SARL, 6.10%, 08/23/2042(a)(c)
|
| 5,014,000
| 5,102,071
|
| SNB Funding Ltd., VRN, (fixed rate to 06/24/2030, variable rate thereafter), 6.00%,
06/24/2030(a)(b)
|
| 5,000,000
| 5,021,771
|
| Total Saudi Arabia
|
| 10,123,842
|
| SERBIA—0.9%
|
|
|
| Telecommunications Co. Telekom Srbija AD Belgrade, 8.00%, 05/22/2028(f)(g)
| EUR
| 5,000,000
| 5,858,272
|
| SINGAPORE—3.2%
|
|
|
| Avation Group S Pte. Ltd., 8.50%, 05/15/2031(a)(b)
| $
| 3,961,000
| 3,699,711
|
| GLP Pte. Ltd., 9.75%, 05/20/2028(a)
|
| 3,000,000
| 2,358,577
|
| Oversea-Chinese Banking Corp. Ltd., VRN, (fixed rate to 09/08/2030, variable rate thereafter), 4.55%,
09/08/2030(a)(b)
|
| 5,000,000
| 4,950,748
|
| Temasek Financial I Ltd., 1.85%, 07/30/2030(a)(b)
| CNY
| 66,000,000
| 9,643,323
|
| Total Singapore
|
| 20,652,359
|
| SOUTH KOREA—3.9%
|
|
|
| Busan Bank Co. Ltd., 3.63%, 07/25/2026(a)
| $
| 5,100,000
| 5,087,787
|
| Hanwha Life Insurance Co. Ltd., VRN, (fixed rate to 06/24/2030, variable rate thereafter), 6.30%,
06/24/2030(a)(b)
|
| 2,500,000
| 2,575,000
|
| LG Energy Solution Ltd., 5.38%, 04/02/2030(a)
|
| 4,330,000
| 4,368,865
|
| Shinhan Bank Co. Ltd., 4.50%, 03/26/2028(a)
|
| 5,000,000
| 4,990,923
|
| abrdn Asia-Pacific Income Fund, Inc.
| 13
|
Portfolio of Investments (unaudited) (continued)
As of April 30, 2026
|
| Principal
Amount
| Value
|
| CORPORATE BONDS (continued)
|
|
| SOUTH KOREA (continued)
|
|
|
| Tongyang Life Insurance Co. Ltd., VRN, (fixed rate to 05/07/2030, variable rate thereafter), 6.25%,
05/07/2030(a)(b)
| $
| 4,738,000
| $ 4,894,276
|
| Woori Bank, VRN, (fixed rate to 07/24/2029, variable rate thereafter), 6.38%,
07/24/2029(a)(e)
|
| 3,500,000
| 3,625,229
|
| Total South Korea
|
| 25,542,080
|
| SWITZERLAND—0.4%
|
|
|
| UBS Group AG, VRN, (fixed rate to 11/13/2028, variable rate thereafter), 9.25%,
11/13/2028(a)(e)
|
| 2,700,000
| 2,921,738
|
| THAILAND—3.2%
|
|
|
| Advanced Info Service PCL, 4.89%, 03/04/2036(a)(b)
|
| 2,005,000
| 1,967,126
|
| Bangkok Bank PCL
|
|
|
|
| 9.03%, 03/15/2029(a)
|
| 1,200,000
| 1,327,981
|
| VRN, (fixed rate to 03/25/2035, variable rate thereafter), 6.06%, 03/25/2035(a)(b)
|
| 6,500,000
| 6,573,559
|
| GC Treasury Center Co. Ltd., VRN, (fixed rate to 03/10/2035, variable rate thereafter), 7.13%,
03/10/2035(a)(e)
|
| 5,000,000
| 4,949,148
|
| Muangthai Capital PCL
|
|
|
|
| 6.88%, 09/30/2028(a)(c)
|
| 1,824,000
| 1,833,738
|
| 7.55%, 07/21/2030(a)(c)
|
| 1,650,000
| 1,673,682
|
| Thaioil Treasury Center Co. Ltd., VRN, (fixed rate to 01/15/2031, variable rate
thereafter), 6.10%, 01/15/2031(a)(e)
|
| 2,326,000
| 2,276,547
|
| Total Thailand
|
| 20,601,781
|
| UNITED ARAB EMIRATES—2.9%
|
|
|
| Abu Dhabi Commercial Bank PJSC, VRN, (fixed rate to 09/10/2029, variable rate thereafter), 5.36%,
09/10/2029(a)(b)
|
| 4,800,000
| 4,792,023
|
| DP World Ltd., 6.85%, 07/02/2037(a)
|
| 2,700,000
| 2,902,733
|
| First Abu Dhabi Bank PJSC, VRN, (fixed rate to 10/04/2028, variable rate thereafter), 6.32%,
10/04/2028(a)(b)
|
| 5,000,000
| 5,123,445
|
| Galaxy Pipeline Assets Bidco Ltd., 2.63%, 03/31/2036(a)(c)
|
| 7,237,000
| 6,276,275
|
| Total United Arab Emirates
|
| 19,094,476
|
|
| Principal
Amount
| Value
|
|
|
|
| UNITED KINGDOM—4.0%
|
|
|
| HSBC Holdings PLC
|
|
|
|
| (fixed rate to 11/03/2027, variable rate thereafter), 7.39%, 11/03/2027(b)
| $
| 3,500,000
| $ 3,641,838
|
| VRN, (fixed rate to 03/07/2028, variable rate thereafter), 8.00%, 03/07/2028(e)
|
| 6,700,000
| 6,985,795
|
| Standard Chartered PLC
|
|
|
|
| VRN, (fixed rate to 11/16/2027, variable rate thereafter), 7.77%, 11/16/2027(a)(b)
|
| 3,000,000
| 3,139,950
|
| VRN, (fixed rate to 01/09/2028, variable rate thereafter), 6.30%, 01/09/2028(a)(b)
|
| 7,276,000
| 7,470,214
|
| VRN, (fixed rate to 11/14/2035, variable rate thereafter), 7.00%, 11/14/2035(a)(e)
|
| 4,400,000
| 4,491,802
|
| Total United Kingdom
|
| 25,729,599
|
| UNITED STATES—1.2%
|
|
|
| Equinix Asia Financing Corp. Pte. Ltd., 3.50%, 03/15/2030(a)(b)
| SGD
| 3,000,000
| 2,378,694
|
| Hyundai Capital America, 6.38%, 04/08/2030(a)(b)
| $
| 5,100,000
| 5,359,497
|
| Total United States
|
| 7,738,191
|
| UZBEKISTAN—0.4%
|
|
|
| Uzbekneftegaz JSC, 8.75%, 05/07/2030(a)
|
| 2,348,000
| 2,522,993
|
| VIETNAM—0.2%
|
|
|
| Mong Duong Finance Holdings BV, 5.13%, 05/07/2029(a)(b)(c)
|
| 1,158,762
| 1,143,316
|
| Total Corporate Bonds
|
| 482,349,602
|
| SUPRANATIONAL—9.0%
|
|
|
|
| Asian Infrastructure Investment Bank, 6.65%, 06/30/2033(a)
| INR
| 725,000,000
| 7,162,353
|
| Corp. Andina de Fomento, 8.25%, 04/26/2034
|
| 320,000,000
| 3,357,213
|
| European Bank for Reconstruction & Development
|
|
|
|
| 6.75%, 03/14/2031
|
| 850,000,000
| 8,601,757
|
| 6.75%, 01/13/2032
|
| 162,600,000
| 1,642,782
|
| Inter-American Development Bank
|
|
|
|
| 7.35%, 10/06/2030
|
| 720,000,000
| 7,514,770
|
| EMTN, 7.00%, 04/17/2033
|
| 850,000,000
| 8,602,205
|
| International Bank for Reconstruction & Development
|
|
|
|
| 7.05%, 07/22/2029
|
| 137,000,000
| 1,399,306
|
| 6.50%, 04/17/2030
|
| 146,000,000
| 1,475,325
|
| 7.00%, 01/25/2031
|
| 1,250,000,000
| 12,500,560
|
| 4.93%, 11/03/2032
| PHP
| 242,000,000
| 3,783,349
|
| International Finance Corp., 10.00%, 04/15/2029
| MNT
| 8,700,000,000
| 2,432,206
|
| Total Supranational
|
|
| 58,471,826
|
| 14
| abrdn Asia-Pacific Income Fund, Inc.
|
Portfolio of Investments (unaudited) (continued)
As of April 30, 2026
|
| Shares
| Value
|
| SHORT-TERM INVESTMENT—2.3%
|
|
| State Street Institutional U.S. Government Money Market Fund, Premier Class, 3.60%(h)
|
| 14,697,609
| $ 14,697,609
|
| Total Short-Term Investment
|
| 14,697,609
|
Total Investments
(Cost $1,058,853,524)(i)—161.2%
| 1,044,631,985
|
| Long Term Debt Securities
| (316,000,000)
|
| Mandatory Redeemable Preferred Stock at Liquidation Value
| (100,000,000)
|
| Other Assets in Excess of Liabilities—3.0%
| 19,552,043
|
| Net Assets—100.0%
| $648,184,028
|
| (a)
| Denotes a security issued under Regulation S or Rule 144A.
|
| (b)
| The maturity date presented for these instruments represents the next call/put date.
|
| (c)
| Sinkable security.
|
| (d)
| Step bond. Rate disclosed is as of April 30, 2026.
|
| (e)
| Perpetual maturity. Maturity date presented represents the next call date.
|
| (f)
| Illiquid security.
|
| (g)
| Level 3 security. See Note 2(a) of the accompanying Notes to Financial Statements.
|
| (h)
| Registered investment company advised by State Street Investment Management. The rate shown is the 7 day yield as of April 30, 2026.
|
| (i)
| See accompanying Notes to Financial Statements for tax unrealized appreciation/(depreciation) of securities.
|
| AUD
| Australian Dollar
|
| BRL
| Brazilian Real
|
| CNY
| Chinese Yuan Renminbi
|
| DOP
| Dominican Republic Peso
|
| EMTN
| Euro Medium Term Note
|
| EUR
| Euro Currency
|
| HKD
| Hong Kong Dollar
|
| IDR
| Indonesian Rupiah
|
| INR
| Indian Rupee
|
| KRW
| South Korean Won
|
| KZT
| Kazakhstan Tenge
|
| MNT
| Mongolia Tughrik
|
| MTN
| Medium Term Note
|
| MXN
| Mexican Peso
|
| MYR
| Malaysian Ringgit
|
| PHP
| Philippine Peso
|
| PKR
| Pakistan Rupee
|
| PLC
| Public Limited Company
|
| SGD
| Singapore Dollar
|
| THB
| Thai Baht
|
| USD
| U.S. Dollar
|
| UYU
| Uruguayan Peso
|
| VRN
| Variable Rate Note
|
| ZAR
| South African Rand
|
| AUD
| Australian Dollar
|
| CNH
| Chinese Yuan Renminbi Offshore
|
| EUR
| Euro Currency
|
| HKD
| Hong Kong Dollar
|
| IDR
| Indonesian Rupiah
|
| KRW
| South Korean Won
|
| MYR
| Malaysian Ringgit
|
| PHP
| Philippine Peso
|
| SGD
| Singapore Dollar
|
| THB
| Thai Baht
|
| USD
| U.S. Dollar
|
| As of April 30, 2026, the Fund held the following futures contracts:
|
| Futures Contracts
| Number of
Contracts
Long/(Short)
| Expiration
Date
| Notional
Amount
| Market
Value
| Unrealized
Appreciation/
(Depreciation)
|
| Long Contract Positions
|
|
|
|
|
|
| Korea Treasury Bond - 10 Year
| 205
| 6/16/2026
| $15,340,101
| $14,996,292
| $(343,809)
|
| Korea Treasury Bond - 3 Year
| 665
| 6/16/2026
| 46,613,070
| 46,418,183
| (194,887)
|
| Ultra United States Treasury Note—10 year
| 273
| 6/18/2026
| 32,760,456
| 31,403,531
| (1,356,925)
|
| United States Treasury Note 6%—10 year
| 425
| 6/18/2026
| 48,019,027
| 47,002,344
| (1,016,683)
|
| United States Treasury Note 6%—5 Year
| 453
| 6/30/2026
| 49,653,713
| 48,849,680
| (804,033)
|
|
|
|
|
|
| $(3,716,337)
|
| Short Contract Positions
|
|
|
|
|
|
| United States Treasury Note 6%—10 year
| (284)
| 6/18/2026
| $(31,856,023)
| $(31,408,625)
| $447,398
|
|
|
|
|
|
| $(3,268,939)
|
| As of April 30, 2026, the Fund held the following forward foreign currency contracts:
|
Purchase Contracts
Settlement Date*
| Counterparty
| Currency
Purchased
| Amount
Purchased
| Currency
Sold
| Amount
Sold
| Fair Value
| Unrealized
Appreciation/
(Depreciation)
|
| Australian Dollar/United States Dollar
|
|
|
|
|
|
| 07/17/2026
| HSBC Bank PLC
| AUD
| 124,014,924
| USD
| 88,587,543
| $89,157,324
| $569,781
|
| abrdn Asia-Pacific Income Fund, Inc.
| 15
|
Portfolio of Investments (unaudited) (continued)
As of April 30, 2026
Purchase Contracts
Settlement Date*
| Counterparty
| Currency
Purchased
| Amount
Purchased
| Currency
Sold
| Amount
Sold
| Fair Value
| Unrealized
Appreciation/
(Depreciation)
|
| Chinese Yuan Renminbi Offshore/United States Dollar
|
|
|
|
|
|
| 05/29/2026
| Royal Bank of Canada
| CNH
| 76,750,000
| USD
| 11,291,382
| $11,253,738
| $(37,644)
|
| Indonesian Rupiah/United States Dollar
|
|
|
|
|
|
| 05/22/2026
| Citibank N.A.
| IDR
| 102,174,656,000
| USD
| 5,950,833
| 5,903,092
| (47,741)
|
| 05/22/2026
| Royal Bank of Canada
| IDR
| 47,976,798,000
| USD
| 2,801,207
| 2,771,837
| (29,370)
|
| Philippine Peso/United States Dollar
|
|
|
|
|
|
| 06/17/2026
| Citibank N.A.
| PHP
| 362,659,000
| USD
| 6,031,906
| 5,897,614
| (134,292)
|
| Singapore Dollar/United States Dollar
|
|
|
|
|
|
| 07/10/2026
| HSBC Bank PLC
| SGD
| 32,651,312
| USD
| 25,767,560
| 25,772,900
| 5,340
|
| South Korean Won/United States Dollar
|
|
|
|
|
|
| 07/02/2026
| Deutsche Bank AG
| KRW
| 8,490,188,000
| USD
| 5,736,303
| 5,773,730
| 37,427
|
| 07/02/2026
| Royal Bank of Canada
| KRW
| 47,269,141,000
| USD
| 31,500,171
| 32,145,257
| 645,086
|
| Thai Baht/United States Dollar
|
|
|
|
|
|
| 05/15/2026
| Standard Chartered Bank
| THB
| 167,185,560
| USD
| 5,214,706
| 5,132,442
| (82,264)
|
| Total
| $183,807,934
| $926,323
|
Sale Contracts
Settlement Date*
| Counterparty
| Currency
Purchased
| Amount
Purchased
| Currency
Sold
| Amount
Sold
| Fair Value
| Unrealized
Appreciation/
(Depreciation)
|
| United States Dollar/Chinese Yuan Renminbi Offshore
|
|
|
|
|
|
| 05/29/2026
| HSBC Bank PLC
| USD
| 3,584,060
| CNH
| 24,398,000
| $3,577,442
| $6,618
|
| United States Dollar/Euro
|
|
|
|
|
|
| 06/04/2026
| Royal Bank of Canada
| USD
| 5,769,813
| EUR
| 4,950,000
| 5,817,679
| (47,866)
|
| United States Dollar/Hong Kong Dollar
|
|
|
|
|
|
| 06/12/2026
| BNP Paribas S.A.
| USD
| 12,572,097
| HKD
| 98,000,000
| 12,530,604
| 41,493
|
| United States Dollar/Indonesian Rupiah
|
|
|
|
|
|
| 05/22/2026
| Royal Bank of Canada
| USD
| 26,177,687
| IDR
| 446,074,327,000
| 25,771,733
| 405,954
|
| United States Dollar/Malaysian Ringgit
|
|
|
|
|
|
| 06/12/2026
| BNP Paribas S.A.
| USD
| 4,634,424
| MYR
| 18,312,000
| 4,615,929
| 18,495
|
| 06/12/2026
| Deutsche Bank AG
| USD
| 19,805,389
| MYR
| 78,128,300
| 19,693,898
| 111,491
|
| United States Dollar/Philippine Peso
|
|
|
|
|
|
| 06/17/2026
| Citibank N.A.
| USD
| 6,027,114
| PHP
| 363,889,000
| 5,917,616
| 109,498
|
| 06/17/2026
| Deutsche Bank AG
| USD
| 11,391,314
| PHP
| 689,072,000
| 11,205,789
| 185,525
|
| United States Dollar/Singapore Dollar
|
|
|
|
|
|
| 07/10/2026
| HSBC Bank PLC
| USD
| 7,379,042
| SGD
| 9,344,000
| 7,375,568
| 3,474
|
| 07/20/2026
| Royal Bank of Canada
| USD
| 3,105,029
| SGD
| 3,924,000
| 3,099,528
| 5,501
|
| United States Dollar/South Korean Won
|
|
|
|
|
|
| 07/02/2026
| Citibank N.A.
| USD
| 3,006,770
| KRW
| 4,415,122,000
| 3,002,492
| 4,278
|
| United States Dollar/Thai Baht
|
|
|
|
|
|
| 05/15/2026
| Standard Chartered Bank
| USD
| 3,046,010
| THB
| 97,709,000
| 2,999,576
| 46,434
|
| Total
| $105,607,854
| $890,895
|
| Unrealized appreciation on forward foreign currency exchange contracts
| $2,196,395
|
| Unrealized depreciation on forward foreign currency exchange contracts
| $(379,177)
|
| *
| Certain contracts with different trade dates and like characteristics have been shown net.
|
| 16
| abrdn Asia-Pacific Income Fund, Inc.
|
Portfolio of Investments (unaudited) (concluded)
As of April 30, 2026
| As of April 30, 2026, the Fund held the following centrally cleared interest rate swaps:
|
| Currency
| Notional
Amount
| Expiration
Date
| Counterparty
| Receive
(Pay)
Floating
Rate
| Floating
Rate
Index
| Fixed
Rate
| Frequency of
Paid
Payments
Made
| Premiums
Paid
(Received)
| Value
| Unrealized
Appreciation/
(Depreciation)
|
| USD
| 31,000,000
| 08/23/2029
| Morgan Stanley
| Receive
| 1-day SOFR
| 3.40%
| Annually
| $(188)
| $393,737
| $393,925
|
| USD
| 20,000,000
| 03/17/2032
| Morgan Stanley
| Receive
| 1-day SOFR
| 3.40%
| Annually
| -
| 395,070
| 395,070
|
| USD
| 25,000,000
| 03/17/2033
| Morgan Stanley
| Receive
| 1-day SOFR
| 3.38%
| Annually
| -
| 665,146
| 665,146
|
|
|
| $(188)
| $1,453,953
| $1,454,141
|
| USD
| 10,000,000
| 03/17/2032
| Morgan Stanley
| Pay
| 1-day SOFR
| 3.40%
| Annually
| (177,132)
| (197,542)
| (20,410)
|
|
|
| $(177,132)
| $(197,542)
| $(20,410)
|
|
|
| $(177,320)
| $1,256,411
| $1,433,731
|
See accompanying Notes to Financial
Statements.
| abrdn Asia-Pacific Income Fund, Inc.
| 17
|
Statement of Assets and Liabilities (unaudited)
As of April 30, 2026
| Assets
|
|
| Investments, at value (cost $1,044,155,915)
| $ 1,029,934,375
|
| Short-term investment, at value (cost $14,697,609)
| 14,697,609
|
| Foreign currency, at value (cost $4,052,299)
| 3,862,841
|
| Cash
| 3,179,348
|
| Cash at broker for interest rate swaps
| 1,796,271
|
| Cash at broker for futures contracts
| 3,468,960
|
| Cash at broker for forward foreign currency contracts
| 40,000
|
| Interest receivable
| 16,801,520
|
| Unrealized appreciation on forward foreign currency exchange contracts
| 2,196,395
|
| Prepaid expenses in connection with revolving credit facility, senior secured notes and
Series B Mandatory Redeemable Preferred Shares (Notes 7 & 8)
| 1,911,012
|
| Total assets
| 1,077,888,331
|
| Liabilities
|
|
| Senior secured notes payable (Note 8)
| 250,000,000
|
Series B Mandatory Redeemable Preferred Shares ($25.00 liquidation value per share, 4,000,000 shares outstanding)
(Note 7)
| 100,000,000
|
| Revolving Credit Facility payable (Note 9)
| 66,000,000
|
| Payable for investments purchased
| 7,544,281
|
| Interest payable on revolving credit facility and senior secured notes
| 3,593,302
|
| Investment management fees payable (Note 3)
| 570,902
|
| Dividend payable on Series B Mandatory Redeemable Preferred Shares
| 529,100
|
| Variation margin payable for futures contracts
| 480,853
|
| Unrealized depreciation on forward foreign currency exchange contracts
| 379,177
|
| Administration fees payable (Note 3)
| 122,564
|
| Variation margin payable on centrally cleared swap contracts
| 69,252
|
| Investor relations fees payable (Note 3)
| 46,050
|
| Director fees payable
| 20,467
|
| Deferred foreign capital gains tax (Note 2i)
| 4,997
|
| Other accrued expenses
| 343,358
|
| Total liabilities
| 429,704,303
|
|
|
| Net Assets Applicable to Common Shareholders
| $648,184,028
|
| Composition of Net Assets
|
|
| Common stock (par value $0.010 per share) (Note 5)
| $ 412,826
|
| Paid-in capital in excess of par
| 922,055,821
|
| Accumulated loss
| (274,284,619)
|
| Net Assets Applicable to Common Shareholders
| $648,184,028
|
| Net asset value per share based on 41,282,628 shares issued and outstanding
| $15.70
|
See accompanying Notes to
Financial Statements.
| 18
| abrdn Asia-Pacific Income Fund, Inc.
|
Statement of Operations (unaudited)
For the Six-Month Period Ended April 30, 2026
| Net Investment Income
|
|
| Investment Income:
|
|
| Interest and amortization/accretion of discount and premium and other income (net of
foreign withholding taxes of $634,598)
| $ 31,060,465
|
| Total investment income
| 31,060,465
|
| Expenses:
|
|
| Investment management fee (Note 3)
| 3,115,873
|
| Administration fee (Note 3)
| 667,805
|
| Revolving credit facility and senior secured notes expenses
| 257,617
|
| Custodian’s fees and expenses
| 159,729
|
| Directors' fees and expenses
| 128,963
|
| Legal fees and expenses
| 125,158
|
| Reports to shareholders and proxy solicitation
| 83,631
|
| Investor relations fees and expenses (Note 3)
| 75,370
|
| Independent auditors’ fees and tax expenses
| 51,409
|
| Transfer agent’s fees and expenses
| 39,171
|
| Insurance expense
| 21,123
|
| Miscellaneous
| 67,731
|
| Total operating expenses, excluding interest expense and distributions to Series B Mandatory Redeemable Preferred Shares
| 4,793,580
|
| Interest expense (Notes 8 & 9)
| 6,677,983
|
| Distributions to Series B Mandatory Redeemable Preferred Shares (Note 7)
| 2,710,475
|
| Total expenses
| 14,182,038
|
|
|
| Net investment income applicable to common shareholders
| 16,878,427
|
| Net Realized/Unrealized Gain/(Loss):
|
|
| Net realized gain/(loss) from:
|
|
| Investments (including $111,192 foreign capital gains tax) (Note 2i)
| (2,682,227)
|
| Futures contracts
| (1,592,136)
|
| Interest rate swaps
| 397,432
|
| Forward foreign currency exchange contracts
| 4,765,858
|
| Foreign currency transactions
| (16,680,724)
|
|
| (15,791,797)
|
| Net change in unrealized appreciation/depreciation on:
|
|
| Investments (including change in deferred foreign capital gains tax of $276,892) (Note 2i)
| (16,732,014)
|
| Interest rate swaps
| 830,601
|
| Futures contracts
| (3,807,086)
|
| Forward foreign currency exchange contracts
| 1,689,779
|
| Foreign currency translation
| 20,617,899
|
|
| 2,599,179
|
| Net realized and unrealized gain from investments, interest rate swaps, futures
contracts, forward foreign currency exchange and foreign currencies
| (13,192,618)
|
| Change in Net Assets Applicable to Common Shareholders Resulting from Operations
| $3,685,809
|
See accompanying Notes to
Financial Statements.
| abrdn Asia-Pacific Income Fund, Inc.
| 19
|
Statements of Changes in Net Assets
|
| For the
Six-Month
Period Ended
April 30, 2026
(unaudited)
| For the
Year Ended
October 31, 2025
|
| Increase/(Decrease) in Net Assets Applicable to Common Shareholders:
|
|
|
| Operations:
|
|
|
| Net investment income
| $16,878,427
| $29,165,003
|
| Net realized loss from investments, interest rate swaps, futures contracts, forward foreign currency exchange contracts
and foreign currency transactions
| (15,791,797)
| (68,523,486)
|
| Net change in unrealized appreciation on investments, interest rate swaps, futures
contracts, forward foreign currency exchange and foreign currency translations
| 2,599,179
| 75,754,017
|
| Net increase in net assets applicable to common shareholders resulting from
operations
| 3,685,809
| 36,395,534
|
| Distributions to Common Shareholders From:
|
|
|
| Distributable earnings
| (40,869,820)
| (1,526,125)
|
| Return of capital
| –
| (80,213,516)
|
| Net decrease in net assets applicable to common shareholders from distributions
| (40,869,820)
| (81,739,641)
|
| Change in net assets applicable to common shareholders
| (37,184,011)
| (45,344,107)
|
| Net Assets Applicable to Common Shareholders:
|
|
|
| Beginning of period
| 685,368,039
| 730,712,146
|
| End of period
| $648,184,028
| $685,368,039
|
Amounts listed as
“–” are $0 or round to $0.
See accompanying Notes to
Financial Statements.
| 20
| abrdn Asia-Pacific Income Fund, Inc.
|
Statement of Cash Flows (unaudited)
For the Six-Month Period Ended April
30, 2026
| Cash flows from operating activities:
|
|
| Net increase/(decrease) in net assets resulting from operations
| $ 3,685,809
|
Adjustments to reconcile net increase in net assets resulting
from operations to net cash provided by operating activities:
|
|
| Investments purchased
| (248,210,774)
|
| Investments sold and principal repayments
| 297,755,873
|
| Net change in short-term investments, excluding foreign government bonds
| (5,456,697)
|
| Net amortization/accretion of premium/(discount)
| 1,907,849
|
| Decrease in interest, dividends and other receivables
| 1,239,353
|
| Net change in unrealized appreciation on forward foreign currency exchange contracts
| (1,689,779)
|
| Decrease in prepaid expenses
| 204,236
|
| Decrease in interest payable on revolving credit facility, senior secured notes and Series B Mandatory
Redeemable Preferred Shares
| (5,236)
|
| Decrease in accrued investment management fees payable
| (40,973)
|
| Decrease in other accrued expenses
| (49,565)
|
| Decrease in variation margin for futures contracts
| 5,070,263
|
| Net change in unrealized depreciation of investments
| 16,732,014
|
| Net change in unrealized appreciation on foreign currency translation
| (20,617,899)
|
| Net realized loss on investments transactions
| 2,682,227
|
| Net cash provided by operating activities
| 53,206,701
|
| Cash flows from financing activities:
|
|
| Decrease in payable to custodian
| $ (186,181)
|
| Repayment of Revolving Credit Facility
| (10,000,000)
|
| Distributions paid to common shareholders
| (40,869,820)
|
| Decrease in variation margin for swap contracts
| 88,014
|
| Net cash used in financing activities
| (50,967,987)
|
| Effect of exchange rate on cash
| (45,691)
|
| Net change in cash
| 2,193,023
|
| Unrestricted and restricted cash and foreign currency, beginning of period
| 10,154,397
|
| Unrestricted and restricted cash and foreign currency, end of period
| $12,347,420
|
| Supplemental disclosure of cash flow information:
|
|
| Cash paid for interest and fees on borrowing
| $6,683,219
|
| Cash paid for dividend and related expenses on preferred shares
| $2,700,500
|
See accompanying Notes to
Financial Statements.
| abrdn Asia-Pacific Income Fund, Inc.
| 21
|
Statement of Cash Flows (unaudited) (concluded)
For the Six-Month Period Ended April
30, 2026
| Reconciliation of unrestricted and restricted cash to the statement of assets and liabilities
|
|
| Cash
| $ 3,179,348
|
| Foreign currency, at value
| 3,862,841
|
| Cash at broker for interest rate swaps
| 1,796,271
|
| Cash at broker for futures contracts
| 3,468,960
|
| Cash at broker for forward foreign currency contracts
| 40,000
|
|
| $12,347,420
|
See accompanying Notes to
Financial Statements.
| 22
| abrdn Asia-Pacific Income Fund, Inc.
|
|
| For the
Six-Month
Period Ended
April 30,
| For the Fiscal Years Ended October 31,
|
|
| 2026
(unaudited)
| 2025
| 2024
| 2023
| 2022
| 2021
|
| PER SHARE OPERATING PERFORMANCE(a):
|
|
|
|
|
|
|
| Net asset value per common share, beginning of period
| $16.60
| $17.70
| $16.98
| $17.10
| $26.28
| $27.90
|
| Net investment income(b)
| 0.41
| 0.71
| 0.99
| 1.08
| 1.02
| 1.08
|
| Net realized and unrealized gains/(losses) on investments, interest
rate swaps, futures contracts and foreign currency transactions
| (0.32)
| 0.17
| 1.71
| 0.78
| (8.22)
| (0.72)
|
| Total from investment operations applicable to common shareholders
| 0.09
| 0.88
| 2.70
| 1.86
| (7.20)
| 0.36
|
| Distributions to common shareholders from:
|
|
|
|
|
|
|
| Net investment income
| (0.99)
| (0.04)
| (0.95)
| (0.90)
| (0.54)
| (1.08)
|
| Return of capital
| –
| (1.94)
| (1.03)
| (1.08)
| (1.44)
| (0.90)
|
| Total distributions
| (0.99)
| (1.98)
| (1.98)
| (1.98)
| (1.98)
| (1.98)
|
| Net asset value per common share, end of period
| $15.70
| $16.60
| $17.70
| $16.98
| $17.10
| $26.28
|
| Market price, end of period
| $15.02
| $15.49
| $16.40
| $14.34
| $14.22
| $25.32
|
| Total Investment Return Based on(c):
|
|
|
|
|
|
|
| Market price
| 3.40%
| 6.99%
| 29.01%
| 13.96%
| (37.59%)
| 19.87%
|
| Net asset value
| 0.86%
| 6.24%
| 17.59%
| 12.21%
| (27.70%)
| 1.67%
|
| Ratio to Average Net Assets Applicable to Common Shareholders/Supplementary Data(d):
|
|
|
|
|
|
|
| Net assets applicable to common shareholders, end of period (000 omitted)
| $648,184
| $685,368
| $730,712
| $700,835
| $705,932
| $1,085,384
|
| Average net assets applicable to common shareholders (000 omitted)
| $672,557
| $695,432
| $743,325
| $767,851
| $919,052
| $1,165,019
|
| Gross operating expenses
| 4.25%(e)
| 4.22%
| 3.31%
| 3.33%
| 3.15%
| 2.57%
|
| Net operating expenses, excluding interest expense and distributions to Series A and Series B Mandatory
Redeemable Preferred Shares
| 1.44%(e)
| 1.41%
| 1.27%
| 1.29%
| 1.36%
| 1.16%
|
| Net Investment income
| 5.06%(e)
| 4.19%
| 5.48%
| 5.86%
| 4.71%
| 3.75%
|
| Portfolio turnover
| 24%(f)
| 34%
| 30%
| 21%
| 26%
| 44%
|
| Senior securities:
|
|
|
|
|
|
|
| Senior securities outstanding (000 omitted)
| $316,000
| $326,000
| $326,000
| $326,000
| $315,000
| $450,000
|
| Asset coverage per $1,000 on senior securities at period end(g)
| $3,368
| $3,409
| $3,548
| $3,150
| $3,400
| $3,523
|
| Preferred shares outstanding (000 omitted)
| $100,000
| $100,000
| $100,000
| $–
| $50,000
| $50,000
|
| Asset coverage per $1,000 on total leverage at period end(h)
| $2,558
| $2,609
| $2,715
| $3,150
| $2,934
| $3,171
|
| Asset coverage per share of preferred shares at period end(i)
| $266.05
| $277.84
| $289.18
| $–
| $535.47
| $792.69
See accompanying Notes to Financial Statements.
|
| abrdn Asia-Pacific Income Fund, Inc.
| 23
|
Financial Highlights (concluded)
|
| For the
Six-Month
Period Ended
April 30,
| For the Fiscal Years Ended October 31,
|
|
| 2026
(unaudited)
| 2025
| 2024
| 2023
| 2022
| 2021
|
| Liquidation value per share of preferred shares
| $25.00
| $25
| $25
| $–
| $25
| $25
|
| (a)
| On September 9, 2024, the Fund implemented a 1 for 6 reverse stock split. Net asset value and per share amounts have been updated to reflect the transaction. See Note 5.
|
| (b)
| Based on average shares outstanding.
|
| (c)
| Total investment return based on market value is calculated assuming that shares of the Fund’s common stock were purchased at the closing market price as of the beginning of the period, dividends,
capital gains and other distributions were reinvested as provided for in the Fund’s dividend reinvestment plan and then sold at the closing market price per share on the last day of the period. The computation
does not reflect any sales commission investors may incur in purchasing or selling shares of the Fund. The total investment return based on the net asset value is similarly computed except that the Fund’s net
asset value is substituted for the closing market value.
|
| (d)
| Ratios calculated on the basis of income, expenses and preferred share dividends applicable to both the common and preferred shares relative to the average net assets of common shareholders. For
the fiscal years ended October 31, 2025, 2024, 2023, 2022, and 2021, the ratios of net investment income before preferred stock dividends to average net assets of common shareholders were 4.98%, 5.53%, 5.95%, 4.91%,
and 3.93%, respectively.
|
| (e)
| Annualized.
|
| (f)
| Not annualized.
|
| (g)
| Asset coverage per $1,000 on senior securities is calculated by dividing net assets plus the amount of any borrowings, including Preferred Shares, for investment purposes by the amount of any senior
securities, which includes the revolving credit facility and then multiplying by $1,000.
|
| (h)
| Asset coverage per $1,000 on total leverage is calculated as the Fund's total assets, less all liabilities and indebtedness not represented by the Fund's senior securities or the a liquidation
preference of preferred shares, divided by secured senior securities representing indebtedness plus the aggregate liquidation preference of preferred shares and then multiplying by $1,000.
|
| (i)
| Asset coverage per share of preferred shares is calculated by subtracting the fund's total liabilities (not including senior securities or the liquidation preference of preferred
shares) from the fund's total assets and dividing by shares of outstanding preferred stock (based on a per share liquidation preference of $25.00).
|
Amounts listed as
“–” are $0 or round to $0.
See accompanying Notes to
Financial Statements.
| 24
| abrdn Asia-Pacific Income Fund, Inc.
|
Notes to Financial Statements (unaudited)
April 30, 2026
1. Organization
abrdn Asia-Pacific Income
Fund, Inc. (the “Fund” or "FAX") was incorporated in Maryland on March 14, 1986 as a closed-end, non-diversified management investment company. The Fund’s principal investment objective is to seek
current income. The Fund may also achieve incidental capital appreciation. To achieve its investment objectives, the Fund normally invests at least 80% of its total assets, plus the amount of any borrowings for
investment purposes, in "Asia-Pacific debt securities,” which include: (1) debt securities of Asia-Pacific Country issuers, including securities issued by Asia-Pacific Country governmental entities, as well as
by banks, companies and other entities which are located in Asia-Pacific Countries, whether or not denominated in an Asia-Pacific Country currency; (2) debt securities of other issuers, denominated in, or linked to,
the currency of an Asia-Pacific Country, including securities issued by supranational issuers, such as The World Bank and derivative debt securities that replicate, or substitute for, the currency of an Asia-Pacific
Country; (3) debt securities issued by entities which, although not located in an Asia-Pacific Country, derive at least 50% of their revenues from Asia-Pacific Countries or have at least 50% of their assets located in
Asia-Pacific Countries; and (4) debt securities issued by a wholly-owned subsidiary of an entity located in an Asia-Pacific Country, provided that the debt securities are guaranteed by the parent entity located in the
Asia-Pacific Country (the “80% Policy”). With reference to items (3) and (4) above, Asia-Pacific debt securities may be denominated in an Asia-Pacific Country currency or U.S. dollars. “Asia-Pacific
Countries” (each, an “Asia-Pacific Country”) means countries included in “Asia” and “Oceania” in the United Nations (“UN”) geographic regions used by the UN
Statistics Division. The 80% Policy is fundamental and may not be changed without a vote of shareholders. There can be no assurance that the Fund will achieve its investment objectives. The ability of issuers of debt
securities held by the Fund to meet their obligations may be affected by economic developments in a specific industry, country or region.
The maximum exposure to any
one “Investment Grade Country” (other than the U.S.) is limited to 25% of the Fund's total assets and the maximum exposure to any one “Non-Investment Grade Country” is limited to 15% of the
Fund's total assets. Investment Grade Countries are those countries whose sovereign debt is rated not less than Baa3 by Moody’s Investors Service, Inc. (“Moody’s”), BBB- by S&P Global
Ratings (“S&P”) or BBB- by Fitch Ratings, Inc. ("Fitch") or comparably rated by another appropriate nationally or internationally recognized ratings agency. Non-Investment Grade Countries are those
that are not Investment Grade Countries.
2. Summary of Significant
Accounting Policies
The Fund is an investment
company and accordingly follows the investment company accounting and reporting guidance of the Financial Accounting Standards Board ("FASB") Accounting Standards
Codification Topic 946 Financial
Services-Investment Companies. The following is a summary of significant accounting policies followed by the Fund in the preparation of its financial statements. The policies conform to generally accepted accounting
principles in the United States of America ("U.S. GAAP"). The preparation of financial statements requires management to make estimates and assumptions that affect the reported amounts of assets and liabilities,
disclosure of contingent assets and liabilities at the date of the financial statements, and the reported amounts of income and expenses for the period. Actual results could differ from those estimates. The accounting
records of the Fund are maintained in U.S. Dollars and the U.S. Dollar is used as both the functional and reporting currency. However, the Australian Dollar is the functional currency for U.S. federal tax purposes.
a. Security Valuation:
The Fund values its
securities at fair value, consistent with regulatory requirements. "Fair value" is defined in the Fund's Valuation and Liquidity Procedures as the price that could be received to sell an asset or paid to transfer a
liability in an orderly transaction between willing market participants without a compulsion to transact at the measurement date, also referred to as market value. Pursuant to Rule 2a-5 under the Investment Company
Act of 1940, as amended (the "1940 Act"), the Board of Directors of the Fund (the "Board") designated abrdn Asia Limited (“abrdn Asia” or the “Investment Manager”) as the valuation designee
("Valuation Designee") for the Fund to perform the fair value determinations relating to Fund investments for which market quotations are not readily available or deemed unreliable.
In accordance with the
authoritative guidance on fair value measurements and disclosures under U.S. GAAP, the Fund discloses the fair value of its investments using a three-level hierarchy that classifies the inputs to valuation techniques
used to measure the fair value. The hierarchy assigns Level 1, the highest level, measurements to valuations based upon unadjusted quoted prices in active markets for identical assets, Level 2 measurements to
valuations based upon other significant observable inputs, including adjusted quoted prices in active markets for similar assets, and Level 3, the lowest level, measurements to valuations based upon unobservable
inputs that are significant to the valuation. Inputs refer broadly to the assumptions that market participants would use in pricing the asset or liability, including assumptions about risk, for example, the risk
inherent in a particular valuation technique used to measure fair value including a pricing model and/or the risk inherent in the inputs to the valuation technique. Inputs may be observable or unobservable. Observable
inputs are inputs that reflect the assumptions market participants would use in pricing the asset or liability, which are based on market data obtained from sources independent of the reporting entity. Unobservable
inputs are inputs that reflect the reporting entity’s own
| abrdn Asia-Pacific Income Fund, Inc.
| 25
|
Notes to Financial Statements (unaudited) (continued)
April 30, 2026
assumptions about the assumptions market
participants would use in pricing the asset or liability developed based on the best information available in the circumstances. A financial instrument’s level within the fair value hierarchy is based upon
the lowest level of any input that is significant to the fair value measurement.
Open-end mutual funds are
valued at the respective NAV as reported by such company. The prospectuses for the registered open-end management investment companies in which the Fund invests explain the circumstances under which those companies
will use fair value pricing and the effects of using fair value pricing. Closed-end funds and exchange-traded funds ("ETFs") are valued at the market price of the security at the Valuation Time (defined below). A
security using any of these pricing methodologies is generally determined to be a Level 1 investment.
Long-term debt and other
fixed-income securities are valued at the last quoted or evaluated bid price on the valuation date provided by an independent pricing service provider. If there are no current day bids, the security is valued at the
previously applied bid. Pricing services generally price debt securities assuming orderly transactions of an institutional "round lot" size and the strategies employed by the Investment Manager as Valuation Designee
generally trade in round lot sizes. In certain circumstances, some trades may occur in smaller "odd lot" sizes which may be effected at lower or higher prices than institutional round lot trades. Short-term debt
securities (such as commercial paper and U.S. treasury bills) having a remaining maturity of 60 days or less are valued at amortized cost, if it represents the best approximation of fair value. Debt and other
fixed-income securities are generally determined to be Level 2 investments.
Short-term investments are
comprised of cash and cash equivalents invested in short-term investment funds which are redeemable daily. The Fund sweeps available cash into the State Street Institutional U.S. Government Money Market Fund,
which has elected to qualify as a “government money market fund” pursuant to Rule 2a-7 under the 1940 Act, and has an objective, which is not guaranteed, to maintain a
$1.00 per share NAV. Generally, these
investment types are categorized as Level 1 investments.
Derivatives are valued at
fair value. Exchange traded derivatives are generally Level 1 investments and over-the-counter and centrally cleared derivatives are generally Level 2 investments. Forward foreign currency contracts are generally
valued based on the bid price of the forward rates and the current spot rate. Forward exchange rate quotations are available for scheduled settlement dates, such as 1-, 3-, 6-, 9- and 12-month periods. An interpolated
valuation is derived based on the actual settlement dates of the forward contracts held. Futures contracts are valued at the settlement price or at the last bid price if no settlement price is available. Interest rate
swaps agreements are generally valued by an approved pricing agent based on the terms of the swap agreement (including future cash flows).
In the event that a
security’s market quotations are not readily available or are deemed unreliable (for reasons other than because the foreign exchange on which it trades closes before the Valuation Time), the security is valued
at fair value as determined by the Valuation Designee, taking into account the relevant factors and surrounding circumstances using valuation policies and procedures approved by the Board. Under normal circumstances
the Valuation Time is as of the close of regular trading on the New York Stock Exchange ("NYSE") (usually 4:00 p.m. Eastern Time). A security that has been fair valued by the Valuation Designee may be classified
as Level 2 or Level 3 depending on the nature of the inputs.
The three-level hierarchy of
inputs is summarized below:
Level 1 - quoted prices
(unadjusted) in active markets for identical investments;
Level 2 - other significant observable
inputs (including valuation factors, quoted prices for similar securities, interest rates, prepayment speeds, and credit risk, etc.); or
Level 3 - significant unobservable inputs
(including the Fund’s own assumptions in determining the fair value of investments).
| 26
| abrdn Asia-Pacific Income Fund, Inc.
|
Notes to Financial Statements (unaudited) (continued)
April 30, 2026
A summary of standard inputs is
listed below:
| Security Type
| Standard Inputs
|
| Debt and other fixed-income securities
| Reported trade data, broker-dealer price quotations, benchmark yields, issuer spreads on
comparable securities, credit quality, yield, and maturity.
|
| Forward foreign currency contracts
| Forward exchange rate quotations.
|
| Swap agreements
| Market information pertaining to the underlying reference assets, i.e., credit spreads,
credit event probabilities, fair values, forward rates, and volatility measures.
|
The following is a summary of
the inputs used as of April 30, 2026 in valuing the Fund's investments and other financial instruments at fair value. The inputs or methodology used for valuing securities are not necessarily an indication of the risk
associated with investing in those securities. Please refer to the Portfolio of Investments for a detailed breakout of the security types:
| Investments, at Value
| Level 1 – Quoted
Prices
| Level 2 – Other Significant
Observable Inputs
| Level 3 – Significant
Unobservable Inputs
| Total
|
| Assets
|
|
|
| Investments in Securities
|
|
|
|
| Corporate Bonds
| $–
| $476,491,330
| $5,858,272
| $482,349,602
|
| Government Bonds
| –
| 489,112,948
| –
| 489,112,948
|
| Supranational
| –
| 58,471,826
| –
| 58,471,826
|
| Short-Term Investment
| 14,697,609
| –
| –
| 14,697,609
|
| Total Investments
| $14,697,609
| $1,024,076,104
| $5,858,272
| $1,044,631,985
|
| Other Financial Instruments
|
|
|
|
| Centrally Cleared Interest Rate Swap Agreements
| $–
| $1,454,141
| $–
| $1,454,141
|
| Foreign Currency Exchange Contracts
| –
| 2,196,395
| –
| 2,196,395
|
| Futures Contracts
| 447,398
| –
| –
| 447,398
|
| Total Other Financial Instruments
| 447,398
| 3,650,536
| –
| 4,097,934
|
| Total Investment Assets
| $15,145,007
| $1,027,726,640
| $5,858,272
| $1,048,729,919
|
| Liabilities
|
|
|
| Other Financial Instruments
|
|
|
|
| Centrally Cleared Interest Rate Swap Agreements
| $–
| $(20,410)
| $–
| $(20,410)
|
| Foreign Currency Exchange Contracts
| –
| (379,177)
| –
| (379,177)
|
| Futures Contracts
| (3,716,337)
| –
| –
| (3,716,337)
|
| Total Investment Liabilities
| $(3,716,337)
| $(399,587)
| $–
| $(4,115,924)
|
Amounts listed as
“–” are $0 or round to $0.
| abrdn Asia-Pacific Income Fund, Inc.
| 27
|
Notes to Financial Statements (unaudited) (continued)
April 30, 2026
Rollforward of Level 3 Fair Value Measurements
For the Six Months Ended April 30, 2026
|
Investments
in Securities
| Balance
as of
October 31,
2025
| Accrued
Discounts
(Premiums)
| Net Realized
Gain (Loss)
and Change
in Unrealized
Appreciation/
Depreciation
| Net
Sales
| Balance
as of
April 30,
2026
| Change in
Unrealized
Appreciation/
Depreciation
from
Investments
Held at
April 30,
2026
|
| Corporate Bonds
|
|
|
|
|
|
|
| Serbia
| $5,798,982
| $5,000
| $54,290
| $-
| $5,858,272
| $54,290
|
| Total
| $5,798,982
| $5,000
| $54,290
| $-
| $5,858,272
| $54,290
|
Amounts listed as
“–” are $0 or round to $0.
| Description
| Fair Value at
April 30, 2026
| Valuation Technique (s)
| Unobservable Inputs
| Range
| Weighted
Average
| Relationship
Between
Fair Value
and Input;
if Input value
increases then
Fair Value:
|
| Corporate Bonds
| $5,858,272
| Income Approach
| Discount Rate
| 8.13%
| 8.13%
| Decreases
|
| Total
| $5,858,272
|
|
|
|
|
|
b. Restricted
Securities:
Restricted securities are privately-placed
securities whose resale is restricted under U.S. securities laws. The Fund may invest in restricted securities, including unregistered securities eligible for resale without registration pursuant to Rule 144A and
privately-placed securities of U.S. and non-U.S. issuers offered outside the U.S. without registration pursuant to Regulation S under the Securities Act of 1933, as amended (the "1933 Act"). Rule 144A securities may
be freely traded among certain qualified institutional investors, such as the Fund, but resale of such securities in the U.S. is permitted only in limited circumstances.
c. Foreign Currency
Translation:
Foreign securities,
currencies, and other assets and liabilities denominated in foreign currencies are translated into U.S. Dollars at the exchange rate of said currencies against the U.S. Dollar, as of the Valuation Time, as provided by
an independent pricing service approved by the Board.
Foreign currency amounts are
translated into U.S. Dollars on the following basis:
(i) fair value of investment
securities, other assets and liabilities – at the current daily rates of exchange at the Valuation Time; and
(ii) purchases and sales of investment
securities, income and expenses – at the relevant rates of exchange prevailing on the respective dates of such transactions.
The Fund isolates that
portion of the results of operations arising from changes in the foreign exchange rates due to the fluctuations in the market prices of the securities held at the end of the reporting period. Similarly, the Fund
isolates the effect of changes in foreign exchange rates from the fluctuations arising from changes in the market prices of portfolio securities sold during the reporting period. The effect of changes in foreign
exchange rates from the fluctuations arising from changes in the market prices of portfolio securities sold during the reported period is reported in the accompanying Statement of Cash Flows within the investments
sold and principal repayments caption.
Net realized foreign exchange
gains or losses represent foreign exchange gains and losses from transactions in foreign currencies and forward foreign currency contracts, exchange gains or losses realized between the trade date and settlement date
on security transactions, and the difference between the amounts of interest and dividends recorded on the Fund’s books and the U.S. Dollar equivalent of the amounts actually received.
| 28
| abrdn Asia-Pacific Income Fund, Inc.
|
Notes to Financial Statements (unaudited) (continued)
April 30, 2026
Foreign security and currency transactions
may involve certain considerations and risks not typically associated with those of domestic origin, including unanticipated movements in the value of the foreign currency relative to the U.S. Dollar. Generally, when
the U.S. Dollar rises in value against foreign currency, the Fund's investments denominated in that foreign currency will lose value because the foreign currency is worth fewer U.S. Dollars; the opposite effect occurs
if the U.S. Dollar falls in relative value.
d. Derivative Financial
Instruments:
The Fund is authorized to
use derivatives to manage currency risk, credit risk, and interest rate risk and to replicate, or use as a substitute for, physical securities. Losses may arise due to changes in the value of the contract or if the
counterparty does not perform under the contract. The use of derivative instruments involves, to varying degrees, elements of market risk in excess of the amount recognized in the Statement of Assets and
Liabilities.
Forward Foreign Currency Exchange
Contracts:
A forward foreign currency
exchange contract ("forward contract") involves an obligation to purchase and sell a specific currency at a future date, which may be any fixed number of days from the date of the contract agreed upon by the parties,
at a price set at the time of the contract. Forward contracts are used to manage the Fund's currency exposure in an efficient manner. They are used to sell unwanted currency exposure that comes with holding securities
in a market, or to buy currency exposure where the exposure from holding securities is insufficient to give the desired currency exposure either in absolute terms or relative to a particular benchmark or index. The
use of forward contracts allows for the separation of investment decision-making between foreign exchange holdings and their currencies.
The forward contract is
marked-to-market daily and the change in market value is recorded by the Fund as unrealized appreciation or depreciation. Forward contracts' prices are received daily from an independent pricing provider. When
the forward contract is closed, the Fund records a realized gain or loss equal to the difference between the value at the time it was opened and the value at the time it was closed. These realized and unrealized gains
and losses are reported on the Statement of Operations. The Fund could be exposed to risks if the counterparties to the contracts are unable to meet the terms of their contracts or from unanticipated movements in
exchange rates. During the six-month period ended April 30, 2026, the Fund used forward contracts to hedge its currency exposure.
While the Fund may enter
into forward contracts to seek to reduce currency exchange rate risks, transactions in such contracts involve certain risks. The Fund could be exposed to risks if the counterparties to the contracts are unable to meet
the terms of their contracts and from unanticipated movements in exchange rates. Thus, while the Fund may benefit from such transactions, unanticipated changes in
currency prices may result in a poorer
overall performance for the Fund than if it had not engaged in any such transactions. Moreover, there may be an imperfect correlation between the Fund’s portfolio holdings or securities quoted or denominated in
a particular currency and forward contracts entered into by the Fund. Such imperfect correlation may prevent the Fund from achieving a complete hedge, which will expose the Fund to the risk of foreign exchange
loss.
Forward contracts are
subject to the risk that the counterparties to such contracts may default on their obligations. Since a forward foreign currency exchange contract is not guaranteed by an exchange or clearing house, a default on the
contract would deprive the Fund of unrealized profits, transaction costs or the benefits of a currency hedge or force the Fund to cover its purchase or sale commitments, if any, at the market price at the time of the
default.
Futures Contracts:
The Fund may invest in
financial futures contracts (“futures contracts”) for the purpose of hedging its existing portfolio securities, or securities that the Fund intends to purchase, against fluctuations in value caused by
changes in prevailing market interest rates or prices. Futures contracts may also be entered into for non-hedging purposes, however, in those instances, (a) either the aggregate initial margin and premiums
required to establish the Fund's position may not exceed 5% of the Fund's NAV after taking into account unrealized profits and unrealized losses on any such contract into which it has entered into, or (b) the
aggregate net notional value of the Fund’s position may not exceed 100% of the Fund's NAV after taking into account unrealized profits and unrealized losses on any such contract which it has entered
into.
Upon entering into a
futures contract, the Fund is required to pledge to the broker an amount of cash and/or other assets equal to a certain percentage of the contract amount. This payment is known as initial margin. Subsequent payments,
known as “variation margin,” are calculated each day, depending on the daily fluctuations in the fair value of the underlying assets. An unrealized gain/(loss) equal to the variation margin is recognized
on a daily basis. When the contract expires or is closed, the gain/(loss) is realized and is presented in the Statement of Operations as a net realized gain/(loss) on futures contracts. Futures contracts are valued
daily at their last quoted sale price on the exchange on which they are traded.
A “sale” of a
futures contract means a contractual obligation to deliver the securities or foreign currency called for by the contract at a fixed price at a specified time in the future. A “purchase” of a futures
contract means a contractual obligation to acquire the securities or foreign currency at a fixed price at a specified time in the future.
There are significant risks
associated with the Fund's use of futures contracts, including the following: (1) the success of a hedging strategy may depend on the ability of the Fund's investment manager and/or subadviser to predict movements in
the prices of individual securities,
| abrdn Asia-Pacific Income Fund, Inc.
| 29
|
Notes to Financial Statements (unaudited) (continued)
April 30, 2026
fluctuations in markets and movements in
interest rates; (2) there may be an imperfect or no correlation between the movement in the price of futures contracts, interest rates and the fair value of the securities held by the Fund; (3) there may not be a
liquid secondary market for a futures contract; (4) trading restrictions or limitations may be imposed by an exchange; and (5) government regulations may restrict trading in futures contracts. In addition, should
market conditions change unexpectedly, the Fund may not achieve the anticipated benefits of the futures contracts and may realize a loss.
During the six-month period
ended April 30, 2026, the Fund used U.S. Treasury futures to efficiently manage U.S. interest rate exposure and hedge the U.S. interest rate risk.
Swaps:
A swap is an agreement that
obligates two parties to exchange a series of cash flows and/or meet certain obligations at specified intervals based upon or calculated by reference to changes in specified prices or rates (interest rates in the case
of interest rate swaps, currency exchange rates in the case of currency swaps) or the occurrence of a credit event with respect to an underlying reference obligation (in the case of a credit default swap) for a
specified amount of an underlying asset or notional principal amount. The Fund will enter into swaps only on a net basis, which means that the two payment streams are netted out, with the Fund receiving or paying, as
the case may be, only the amount of the difference between the two payments. Except for currency swaps and credit default swaps, the notional principal amount is used solely to calculate the payment streams but is not
exchanged. With respect to currency swaps, actual principal amounts of currencies may be exchanged by the counterparties at the initiation, and again upon the termination of the transaction.
Traditionally, swaps were
customized, privately negotiated agreements executed between two parties (“OTC Swaps”) but since 2013, certain swaps are required to be cleared pursuant to rules and regulations related to the Dodd –
Frank Wall Street Reform and Consumer Protection Act (“Dodd Frank”) and/or Regulation (EU) No 648/2012 on OTC Derivatives, Central Counterparties and Trade Repositories (“EMIR”) (“Cleared
Swaps”). Like OTC Swaps, Cleared Swaps are negotiated bilaterally. Unlike OTC Swaps, the act of clearing results in two swaps executed between each of the parties and a
central counterparty (“CCP”),
and thus the counterparty credit exposure of the parties is to the CCP rather than to one another. Upon entering into a Cleared Swap, the Fund is required to pledge an amount of cash and/or other assets equal to a
certain percentage of the contract amount. This payment is known as “initial margin”. Subsequent payments, known as “variation margin,” are calculated each day, depending on the daily
fluctuations in the fair value of the underlying assets. An unrealized gain/(loss) equal to the variation margin is recognized on a daily basis. When the contract matures or is terminated, the gain or loss is realized
and is presented in the Statements of Operations as a net realized gain or loss on swap contracts. The margin requirements associated with OTC Swaps and Cleared Swaps may not be the same.
Entering into swap
agreements involves, to varying degrees, elements of credit, market and interest rate risk in excess of the amounts reported on the Statement of Assets and Liabilities. Such risks involve the possibility that there
will be no liquid market for these agreements, that the counterparty to the agreements may default on its obligation to perform and that there may be unfavorable changes in the value of the index or securities
underlying the agreement. The Fund's maximum risk of loss from counterparty risk related to swaps is the fair value of the contract. This risk is mitigated by the posting of collateral by the counterparties to the
Fund to cover the Fund's exposure to the counterparty.
Interest Rate Swaps:
The Fund may use interest
rate swap contracts to manage its exposure to interest rates. Interest rate swap contracts typically represent the exchange between the Fund and a counterparty of respective commitments to make variable rate and fixed
rate payments with respect to a notional amount of principal. Interest rate swap contracts may have a term that is greater than one year, but typically require periodic interim settlement in cash, at which time the
specified value of the variable interest rate is reset for the next settlement period. Net payments of interest are recorded as realized gains or losses. During the period that the swap contract is open, the contract
is marked-to-market as the net amount due to or from the Fund and changes in the value of swap contracts are recorded as unrealized gains or losses.
| 30
| abrdn Asia-Pacific Income Fund, Inc.
|
Notes to Financial Statements (unaudited) (continued)
April 30, 2026
Summary of Derivative
Instruments:
The Fund may use
derivatives for various purposes as noted above. The following is a summary of the fair value of derivative instruments, not accounted for as hedging instruments, as of April 30, 2026:
|
| Risk Exposure Category
|
|
|
| Interest
Rate
Contracts
| Foreign
Currency
Contracts
| Total
|
|
|
| Assets:
|
| Unrealized appreciation on:
|
| Forward Foreign Currency Exchange Contracts
| $–
| $2,196,395
| $2,196,395
|
| Futures Contracts
| 447,398
| –
| 447,398
|
| Swap Contracts
| 1,454,141
| –
| 1,454,141
|
| Total
| $1,901,539
| $2,196,395
| $4,097,934
|
| Liabilities:
|
| Unrealized depreciation on:
|
| Forward Foreign Currency Exchange Contracts
| $–
| $379,177
| $379,177
|
| Futures Contracts
| 3,716,337
| –
| 3,716,337
|
| Swap Contracts
| 20,410
| –
| 20,410
|
| Total
| $3,736,747
| $379,177
| $4,115,924
|
Amounts listed as
“–” are $0 or round to $0.
The Fund has transactions
that may be subject to enforceable master netting agreements. A reconciliation of the gross amounts on the Statement of Assets and Liabilities as of April 30, 2026 to the net amounts by broker and derivative type,
including any collateral received or pledged, is included in the following tables:
|
|
|
|
|
| Gross Amounts Not Offset
in the Statement of
Assets and Liabilities
|
| Gross Amounts Not Offset
in the Statement of
Assets and Liabilities
|
|
| Gross Amounts
of Assets
Presented in
Statement of
Assets and
Liabilities
| Financial
Instruments
| Collateral
Received
| Net
Amount
| Gross Amounts
of Liabilities
Presented in
Statement of
Assets and
Liabilities
| Financial
Instruments
| Collateral
Pledged
| Net
Amount
|
| Description
| Assets
| Liabilities
|
| Foreign Currency Exchange Contracts
|
| BNP Paribas S.A.
| $59,988
| $–
| $–
| $59,988
| $–
| $–
| $–
| $–
|
| Citibank N.A.
| 113,776
| (113,776)
| –
| –
| 182,033
| (113,776)
| (40,000)
| 28,257
|
| Deutsche Bank AG
| 334,443
| –
| –
| 334,443
| –
| –
| –
| –
|
| HSBC Bank PLC
| 585,213
| –
| –
| 585,213
| –
| –
| –
| –
|
| Royal Bank of Canada
| 1,056,541
| (114,880)
| –
| 941,661
| 114,880
| (114,880)
| –
| –
|
| Standard Chartered Bank
| 46,434
| (46,434)
| –
| –
| 82,264
| (46,434)
| –
| 35,830
|
Amounts listed as
“–” are $0 or round to $0.
| abrdn Asia-Pacific Income Fund, Inc.
| 31
|
Notes to Financial Statements (unaudited) (continued)
April 30, 2026
The effect of derivative
instruments on the Statement of Operations for the six-month period ended April 30, 2026:
|
| Risk Exposure Category
|
|
|
| Interest
Rate
Contracts
| Foreign
Currency
Contracts
| Total
|
|
|
Realized Gain/(Loss) on Derivatives Recognized
as a Result of Operations:
|
| Futures Contracts
| $(1,591,298)
| $–
| $(1,591,298)
|
| Forward Foreign Currency Exchange Contracts
| –
| 4,765,858
| 4,765,858
|
| Swap Contracts
| 397,432
| –
| 397,432
|
| Total
| $(1,193,866)
| $4,765,858
| $3,571,992
|
Net Change in Unrealized Appreciation/Depreciation on
Derivatives Recognized as a Result of Operations:
|
| Futures Contracts
| $(3,807,086)
| $–
| $(3,807,086)
|
| Forward Foreign Currency Exchange Contracts
| –
| 1,689,779
| 1,689,779
|
| Swap Contracts
| 830,601
| –
| 830,601
|
| Total
| $(2,976,485)
| $1,689,779
| $(1,286,706)
|
Amounts listed as
“–” are $0 or round to $0.
Information about derivatives reflected as
of the date of this report is generally indicative of the type of activity during the six-month period ended April 30, 2026. The table below summarizes the weighted average values of derivatives holdings for the Fund
during the six-month period ended April 30, 2026.
| Derivative
| Average Monthly
Notional Value
|
| Long Futures Contracts
| $179,625,609
|
| Short Futures Contracts
| $(25,616,277)
|
| Swap Contracts at Notional Amount
| $79,333,333
|
| Foreign Currency Contracts Purchased
| $212,146,257
|
| Foreign Currency Contracts Sold
| $134,756,537
|
e. Bank Loans:
The Fund may invest in bank
loans. Bank loans include floating and fixed-rate debt obligations. Floating rate loans are debt obligations issued by companies or other entities with floating interest rates that reset periodically. Bank loans may
include, but are not limited to, term loans, delayed funding loans, bridge loans and revolving credit facilities. Loan interest will primarily take the form of assignments purchased in the primary or secondary market
but may include participations. Floating rate loans are secured by specific collateral of the borrower and are senior to most other securities of the borrower (e.g., common stock or debt instruments) in the event of
bankruptcy. Floating rate loans are often issued in connection with recapitalizations, acquisitions, leveraged buyouts, and refinancings. Floating rate loans are typically structured and administered by a financial
institution that acts as the agent of the lenders participating in the
floating rate loan. Floating rate loans may
be acquired directly through the agent, as an assignment from another lender who holds a direct interest in the floating rate loan, or as a participation interest in another lender’s portion of the floating rate
loan.
The Fund may also enter into,
or acquire participations in, delayed funding loans and revolving credit facilities. Delayed funding loans and revolving credit facilities are borrowings in which the Fund agrees to make loans up to a maximum amount
upon demand by the borrowing issuer for a specified term. A revolving credit facility differs from a delayed funding loan in that as the borrowing issuer repays the loan, an amount equal to the repayment is again made
available to the borrowing issuer under the facility. The borrowing issuer may at any time borrow and repay amounts so long as, in the aggregate, at any given time the amount borrowed does not exceed the maximum
amount established by the loan agreement. Delayed funding loans and revolving credit facilities usually provide for floating or variable rates of interest.
See “Bank Loan
Risk” under “Portfolio Investment Risks” for information regarding the risks associated with an investment in bank loans.
f. Security Transactions,
Investment Income and Expenses:
Security transactions are
recorded on the trade date. Realized gains/(losses) from security and foreign currency transactions are calculated on the identified cost basis. Interest income and expenses are recorded on an accrual basis. Discounts
and premiums on
| 32
| abrdn Asia-Pacific Income Fund, Inc.
|
Notes to Financial Statements (unaudited) (continued)
April 30, 2026
securities purchased are accreted or
amortized on an effective yield basis over the estimated lives of the respective securities.
g. Distributions:
The Fund has a managed
distribution policy to pay distributions from net investment income supplemented by net realized foreign exchange gains, net realized short-term capital gains, net realized long-term capital gains and return of
capital distributions, if necessary, on a monthly basis. The stable distribution policy is subject to regular review by the Board. The Fund will also declare and pay distributions at least annually from net realized
gains on investment transactions and net realized foreign exchange gains, if any. Dividends and distributions to shareholders are recorded on the ex-dividend date. Dividends and distributions to shareholders are
determined in accordance with federal income tax regulations, which may differ from U.S. GAAP.
Distributions to Series B
Mandatory Redeemable Preferred Shares (the “Series B MRPS”) shareholders are accrued daily and paid quarterly based on an annual rate of 5.391%. The Fund may not pay distributions to its preferred
shareholders unless the Fund's asset coverage ratios for the Series B MRPS, as calculated in accordance with the 1940 Act, is in excess of 225%. The character of distributions to Series B MRPS shareholders made during
a year may differ from their ultimate characterization for federal income tax purposes. For tax purposes, the Fund's distributions to Series B MRPS shareholders for the six-month period ended April 30, 2026 were 100%
net investment income.
h. Federal Income Taxes:
The Fund intends to
continue to qualify as a “regulated investment company” by complying with the provisions available to certain investment companies, as defined in Subchapter M of the Code, and to make distributions of net
investment income and net realized capital gains sufficient to relieve the Fund from all federal income taxes. Therefore, no federal income tax provision is required. The Fund recognizes the tax benefits of uncertain
tax positions only where the position is "more likely than not" to be sustained assuming examination by tax authorities. Management of the Fund has concluded that there are no significant uncertain tax positions that
would require recognition in the financial statements. Since tax authorities can examine previously filed tax returns, the Fund's U.S. federal and state tax returns for each of the most recent four fiscal years up to
the most recent fiscal year ended October 31, 2025 are subject to such review.
i. Foreign Withholding
Tax:
Dividend and interest
income from non-U.S. sources received by the Fund are generally subject to non-U.S. withholding taxes. In addition, the Fund may be subject to capital gains tax in certain countries in which it invests. The above
taxes may be reduced or eliminated under
the terms of applicable U.S. income tax
treaties with some of these countries. The Fund accrues such taxes when the related income is earned.
In addition, when the Fund
sells securities within certain countries in which it invests, the capital gains realized may be subject to tax. Based on these market requirements and as required under U.S. GAAP, the Fund accrues deferred
capital gains tax on securities currently held that have unrealized appreciation within these countries. The amount of deferred capital gains tax accrued, if any, is reported on the Statement of Assets and
Liabilities.
3. Agreements and Transactions
with Affiliates
a. Investment Manager,
Investment Sub-Adviser, and Fund Administration:
abrdn Asia serves as
Investment Manager to the Fund, pursuant to a management agreement. abrdn Investments Limited (the "Sub-Adviser") serves as the sub-adviser pursuant to a sub-advisory agreement with the Investment Manager. The
Investment Manager and the Sub-Adviser (collectively, the “Advisers”) are wholly-owned indirect subsidiaries of Aberdeen Group plc, formerly known as abrdn plc. In rendering advisory services, the Advisers
may use the resources of investment advisor subsidiaries of Aberdeen group plc. These affiliates have entered into procedures pursuant to which investment professionals from affiliates may render portfolio management
and research services as associated persons of the Advisers.
The Investment Manager
manages the Fund’s investments and makes investment decisions on behalf of the Fund including the selection of and the placement of orders with brokers and dealers to execute portfolio transactions on behalf of
the Fund. The Sub-Adviser manages the portion of the Fund’s assets that the Investment Manager allocates to it. The Sub-Adviser is paid by the Investment Manager, not the Fund.
The management agreement
provides the Investment Manager with a fee, payable monthly by the Fund, at the following annual rates: 0.65% of the Fund’s average weekly Managed Assets up to $200 million, 0.60% of Managed Assets between $200
million and $500 million, 0.55% of Managed Assets between $500 million and $900 million, 0.50% of Managed Assets between $900 million and $1.75 billion and 0.45% of Managed Assets in excess of $1.75 billion. Managed
Assets is defined in the management agreement to mean total assets of the Fund, including any form of investment leverage, minus all accrued expenses incurred in the normal course of operations, but not excluding any
liabilities or obligations attributable to investment leverage obtained through (i) indebtedness of any type (including, without limitation, borrowing through a credit facility or the issuance of debt securities),
(ii) the issuance of preferred stock or other similar preference securities, (iii) the reinvestment of collateral
| abrdn Asia-Pacific Income Fund, Inc.
| 33
|
Notes to Financial Statements (unaudited) (continued)
April 30, 2026
received for securities loaned in accordance
with the Fund’s investment objectives and policies, and/or (iv) any other means.
For the six-month period ended
April 30, 2026, the Fund paid the Investment Manager $3,115,873.
abrdn Inc., an affiliate of
the Investment Manager and Sub-Adviser, is the Fund’s Administrator pursuant to an agreement under which abrdn Inc. receives a fee payable monthly by the Fund, at an annual fee rate of 0.125% of the Fund’s
average weekly Managed Assets up to $1 billion, 0.10% of the Fund’s average weekly Managed Assets between $1 billion and $2 billion, and 0.075% of the Fund’s average weekly Managed Assets in excess of $2
billion. For the six-month period ended April 30, 2026, abrdn Inc. earned $667,805 from the Fund for administration fees.
b. Investor Relations:
Under the terms of the
Investor Relations Services Agreement, abrdn Inc. provides and/or engages third parties to provide investor relations services to the Fund and certain other funds advised by abrdn Asia or its affiliates as part of an
Investor Relations Program. Under the Investor Relations Services Agreement, the Fund owes a portion of the fees related to the Investor Relations Program (the "Fund's Portion"). However, investor relations services
fees are limited by abrdn Inc. so that the Fund will only pay up to an annual rate of 0.05% of the Fund's average weekly net assets. Any difference between the capped rate of 0.05% of the Fund's average weekly net
assets and the Fund's Portion is paid for by abrdn Inc.
During the six-month period
ended April 30, 2026, the Fund incurred investor relations fees of approximately $75,370. For the six-month period ended April 30, 2026, abrdn Inc. did not bear any portion of the investor relations fees for the Fund
because the Fund’s contribution was below 0.05% of the Fund’s average weekly net assets on an annual basis.
4. Investment Transactions
Purchases and sales of
investment securities (excluding short-term securities) for the six-month period ended April 30, 2026, were $249,298,964 and $281,516,503, respectively.
5. Capital
The authorized capital of
the Fund is 400 million shares of $0.01 par value per share of common stock. During the six-month period ended April 30, 2026, the Fund repurchased no shares pursuant to its Open Market Repurchase Program, see Note 6
for further information. On September 9, 2024, the Fund effected a 1-for-6 reverse stock split. The effect of this reverse stock split was to reduce the number of shares outstanding in the Fund, while maintaining the
Fund's and each stockholder's aggregate net asset value.
As of April 30, 2026, there were 41,282,628
shares of common stock issued and outstanding.
6. Open Market Repurchase
Program
The Board has approved an
open market repurchase and discount management policy (the “Program”). The Program allows the Fund to purchase, in the open market, its outstanding shares of common stock, with the amount and timing of any
repurchase determined at the discretion of the Fund's investment manager. Such purchases may be made opportunistically at certain discounts to NAV per share in the reasonable judgment of management based on historical
discount levels and current market conditions. If shares are repurchased, the Fund reports repurchase activity on its website on a monthly basis. For the six-month period ended April 30, 2026, the Fund did not
repurchase any shares through the Program.
On a quarterly basis, the
Board will receive information on any transactions made pursuant to this policy during the prior quarter. Under the terms of the Program, the Fund is permitted to repurchase during each 12-month period ended October
31 up to 10% of its outstanding shares of common stock outstanding as of October 31 of the prior year.
7. Preferred Shares
As of April 30, 2026 the
Fund had 4,000,000 shares of Series B MRPS, rated ‘AA-’ by Kroll, outstanding with an aggregate liquidation preference of $100,000,000 ($25 per share). The following table shows the mandatory redemption
date, annual fixed rate, aggregate liquidation preference and estimated fair value of the Series B MRPS as of April 30, 2026.
Mandatory
Redemption
Date
| Annual
Fixed
Rate
| Aggregate
Liquidation
Preference
| Estimated
Fair
Value
|
| October 03, 2029
| 5.39%
| $100,000,000
| $101,260,546
|
Holders of the Series B MRPS
are entitled to receive quarterly cumulative cash dividend payments on the first business day following each calendar quarter at an annual fixed rate of 5.39% until maturity. The Series B MRPS were issued in private
placement offerings to institutional investors and are not listed on any exchange or automated quotation system. Distributions are accrued daily and paid quarterly and are presented in the Statement of Assets and
Liabilities as a dividend payable to preferred shareholders. For the six-month period ended April 30, 2026, the Fund accrued $2,710,475 in distributions to preferred shareholders.
The Series B MRPS rank senior
to all of the Fund’s outstanding shares of common stock and on a parity with shares of any other series of preferred stock as to the payment of dividends to which the shares are
| 34
| abrdn Asia-Pacific Income Fund, Inc.
|
Notes to Financial Statements (unaudited) (continued)
April 30, 2026
entitled and the distribution of assets upon
dissolution, liquidation or winding up of the affairs of the Fund.
The estimated fair value of
Series B MRPS was calculated, for disclosure purposes, by discounting future cash flows by a rate equal to the current U.S. Treasury rate with an equivalent maturity date, plus the spread between the U.S. insurance
and financial debt rate and the U.S. Treasury rate plus a market spread for the issuance of preferred shares.
The Series B MRPS are
redeemable in certain circumstances at the option of the Fund. The Series B MRPS are also subject to mandatory redemption, unless otherwise prohibited by the 1940 Act, if the Fund fails to maintain (1) asset coverage,
as determined in accordance with Section 18(h) of the 1940 Act, of at least 225%, with respect to all outstanding preferred stock, as of the last day of any month or (2) eligible assets with an aggregate agency
discounted value at least equal to the basic maintenance amount as provided in the Fund’s rating agency guidelines. As of April 30, 2026, the Fund was in compliance with the asset coverage and basic maintenance
requirements of the Series B MRPS.
Except for matters which do
not require the vote of the holders of the Series B MRPS under the 1940 Act and except as otherwise provided in the Fund’s Charter or Bylaws, or as otherwise required by applicable law, holders of the Series B
MRPS have one vote per share and generally vote together with holders of common stock as a single class on all matters submitted to the Fund’s shareholders. The holders of the Series B MRPS, voting separately as
a single class, have the right to elect at least two directors to the Fund's Board.
8. Senior Secured Notes
As of April 30, 2026, the
Fund had $250,000,000 in aggregate principal amount of senior secured notes rated ‘AAA’ by Kroll
outstanding ($50,000,000 in 3.87% Series C
Senior Secured Notes due February 8, 2032, $100,000,000 in 3.70% Series D Senior Secured Notes due August 10, 2032 and $100,000,000 in 3.73% Series E Senior Secured Notes due June 19, 2034) (collectively, the
“Notes”). The Notes are secured obligations of the Fund and, upon liquidation, dissolution or winding up of the Fund, will rank senior to all unsecured and unsubordinated indebtedness and senior to any
common or preferred stock pari passu in priority and security with all other secured indebtedness. Holders of the Notes are entitled to receive cash interest payments semi-annually until maturity. The Series C Notes,
the Series D Notes and the Series E Notes accrue interest at annual fixed rates of 3.87%, 3.70% and 3.73%, respectively.
The Notes were issued in
private placement offerings to institutional investors and are not listed on any exchange or automated quotation system.
The estimated fair value of
each series of fixed-rate Notes was calculated, for disclosure purposes, by discounting future cash flows by a rate equal to the current U.S. Treasury rate with an equivalent maturity date, plus either 1) the spread
between the interest rate on recently issued debt and the U.S. Treasury rate with a similar maturity date or 2) if there has not been a recent debt issuance, the spread between the AAA corporate finance debt rate and
the U.S. Treasury rate with an equivalent maturity date. The following table shows the maturity date, interest rate, notional/carrying amount and estimated fair value for each series of Notes outstanding as of April
30, 2026.
| Series
| Maturity Date
| Interest Rate
| Notional/
Carrying Amount
| Estimated Fair Value
|
| Series C
| February 8, 2032
| 3.87%
| $50,000,000
| $47,204,950
|
| Series D
| August 10, 2032
| 3.70%
| $100,000,000
| $92,844,908
|
| Series E
| June 19, 2034
| 3.73%
| $100,000,000
| $90,538,760
|
9. Credit
Facility
On July 30, 2025, the Fund executed an
amendment and assignment of the $100,000,000 senior secured revolving credit loan facility (the “Revolving Credit Facility”) with a syndicate of banks with The Bank of Nova Scotia, acting as administrative
agent. As of April 30, 2026, the Fund had $66,000,000 outstanding under the Revolving Credit Facility. Under the terms of the Revolving Credit Facility and the Agreement and applicable regulations, the Fund is
required to
maintain certain asset coverage ratios for the
amount of its outstanding borrowings.
For the six-month period
ended April 30, 2026, the average interest rate on the Revolving Credit Facility was 5.28% and the average balance of the Revolving Credit Facility was $74,066,298.
The Revolving Credit Facility
has a term of one year and is not a perpetual form of leverage; there can be no assurance that the
| abrdn Asia-Pacific Income Fund, Inc.
| 35
|
Notes to Financial Statements (unaudited) (continued)
April 30, 2026
Revolving Credit Facility will be available
for renewal on acceptable terms, if at all. Bank loan fees and expenses included in the Statement of Operations include fees for the renewal of the Revolving Credit Facility as well as commitment fees for any portion
of the loan facility not drawn upon at any time during the period.
10. Risks of Leveraged Capital
Structure
The Fund may use leverage
to the maximum extent permitted by the 1940 Act, which permits leverage to exceed 33 1/3% of the Fund’s total assets (including the amount obtained through leverage) in certain circumstances.
The amounts borrowed under
the Revolving Credit Facility and the Notes, may be invested to return higher rates than the rates pursuant to which interests or dividends are paid under such forms of leverage. However, the cost of leverage could
exceed the income earned by the Fund on the proceeds of such leverage. To the extent that the Fund is unable to invest the proceeds from the use of leverage in assets which pay interest at a rate which exceeds the
rate paid on the leverage, the yield on the Fund’s common stock will decrease. In addition, in the event of a general market decline in the value of assets in which the Fund invests, the effect of that decline
will be magnified in the Fund because of the additional assets purchased with the proceeds of the leverage.
The Fund’s leveraged
capital structure creates special risks not associated with unleveraged funds having similar investment objectives and policies. The funds borrowed pursuant to the Revolving Credit Facility and the Notes may
constitute a substantial lien and burden by reason of their prior claim against the income of the Fund and against the net assets of the Fund in liquidation. The Fund is limited in its ability to declare dividends or
other distributions under the terms of the various forms of leverage. In the event of an event of default under the Revolving Credit Facility, the lenders have the right to cause a liquidation of the collateral (i.e.,
sell portfolio securities and other assets of the Fund) and, if any such default is not cured, the lenders may be able to control the liquidation as well. In the event of an event of default under the Note Purchase
Agreement, the holders of the Notes have the right to cause a liquidation of the collateral (i.e., sell portfolio securities and other assets of the Fund). A liquidation of the Fund’s collateral assets in an
event of default, or a voluntary paydown of the Revolving Credit Facility, the Notes in order to avoid an event of default, would typically involve administrative expenses and sometimes penalties. Additionally, such
liquidations often involve selling off of portions of the Fund’s assets at inopportune times which can result in losses when markets are unfavorable.
Each of the Revolving Credit
Facility Agreement, and the Note Purchase Agreement includes usual and customary covenants for the applicable type of transaction. These covenants impose on the Fund asset coverage requirements, Fund composition
requirements
and limits on certain investments, such as
illiquid investments, which are more stringent than those imposed on the Fund by the 1940 Act. The covenants or guidelines could impede the Investment Manager or Sub-Adviser from fully managing the Fund’s
portfolio in accordance with the Fund’s investment objective and policies. Furthermore, non-compliance with such covenants or the occurrence of other events could lead to the cancellation of any and/or all of
the forms of leverage. As of April 30, 2026, the Fund was in compliance with all covenants under the agreements relating to the various forms of leverage.
During the six-month period
ended April 30, 2026, the Fund incurred fees of approximately $257,617 for the Revolving Credit Facility and Notes.
11. Portfolio Investment
Risks
a. Bank Loan Risk:
There are some risks
associated with an investment in bank loans including credit risk, interest rate risk, illiquid securities risk, and prepayment risk. There is also the possibility that the collateral securing a loan, if any, may be
difficult to liquidate or be insufficient to cover the amount owed under the loan. These risks could cause the Fund to lose income or principal on a particular investment, which in turn could affect the Fund’s
returns. In addition, bank loans may settle on a delayed basis, resulting in the proceeds from the sale of such loans not being readily available to make additional investments or distributions. To the extent the
extended settlement process gives rise to short-term liquidity needs, the Fund may hold additional cash, sell investments or temporarily borrow from banks or other lenders. Additionally, in certain circumstances,
loans may not be deemed to be securities, and in the event of fraud or misrepresentation by a borrower, lenders and purchasers of interests in loans, such as the Fund, will not have the protection of the anti-fraud
provisions of the federal securities laws, as would be the case for bonds or stocks. Instead, in such cases, lenders generally rely on the contractual provisions in the loan agreement itself and common law fraud
protections under applicable state law.
b. Credit and Market
Risk:
A debt instrument’s
price depends, in part, on the credit quality of the issuer, borrower, counterparty, or underlying collateral and can decline in response to changes in the actual or perceived financial condition of the issuer,
borrower, counterparty, or underlying collateral, or changes in specific or general market, economic, industry, political, regulatory, geopolitical, or other conditions. Funds that invest in high yield and emerging
market instruments are subject to certain additional credit and market risks. The yields of high yield and emerging market debt obligations reflect, among other things, perceived credit risk. The Fund's investments in
securities rated below investment grade
| 36
| abrdn Asia-Pacific Income Fund, Inc.
|
Notes to Financial Statements (unaudited) (continued)
April 30, 2026
typically involve risks not associated with
higher rated securities including, among others, greater risk of not receiving timely and/or ultimate payment of interest and principal, greater market price volatility, and less liquid secondary market trading.
Economic, financial or political events, trading and tariff arrangements, war, terrorism, natural disasters, public health issues like pandemics or epidemics, and other circumstances in one country or region could
have profound impacts on global economies or markets.
c. Focus Risk:
The Fund may have elements
of risk not typically associated with investments in the United States due to focused investments in a limited number of countries or regions subject to foreign securities or currency risks. Such focused investments
may subject the Fund to additional risks resulting from political or economic conditions in such countries or regions and the possible imposition of adverse governmental laws or currency exchange restrictions could
cause the securities and their markets to be less liquid and their prices to be more volatile than those of comparable U.S. securities.
d. High-Yield Bonds and
Other Lower-Rated Securities Risk:
The Fund’s
investments in high-yield bonds (commonly referred to as “junk bonds”) and other lower-rated securities will subject the Fund to substantial risk of loss. Investments in high-yield bonds are speculative
and issuers of these securities are generally considered to be less financially secure and less able to repay interest and principal than issuers of investment-grade securities. Prices of high-yield bonds tend to be
very volatile. These securities are less liquid than investment-grade debt securities and may be difficult to price or sell, particularly in times of negative sentiment toward high-yield securities.
e. Interest Rate Risk:
The prices of fixed income
securities respond to economic developments, particularly interest rate changes, as well as to perceptions about the creditworthiness of individual issuers, including governments. Generally, the Fund's fixed income
securities will decrease in value if interest rates rise and vice versa, and the volatility of lower-rated securities is even greater than that of higher-rated securities. Also, longer-term securities are generally
more volatile, so the average maturity or duration of these securities affects risk.
The Fund may be subject to
greater interest rate risk due to the changing interest rate environment and the effect of potential
government fiscal and monetary policy
initiatives and resulting market reaction to those initiatives. Changes in interest rates or a lack of market participants may lead to decreased liquidity and increased volatility in the fixed-income or debt markets,
making it more difficult for the Fund to sell its holdings.
f. Risk Associated with
Foreign Securities and Currencies:
Investments in securities
of foreign issuers carry certain risks not ordinarily associated with investments in securities of U.S. issuers. These risks include future political and economic developments, and the possible imposition of exchange
controls or other foreign governmental laws and restrictions. In addition, with respect to certain countries, there is the possibility of expropriation of assets, confiscatory taxation, and political or social
instability or diplomatic developments, which could adversely affect investments in those countries. Foreign securities may also be harder to price than U.S. securities.
Certain countries also may
impose substantial restrictions on investments in their capital markets by foreign entities, including restrictions on investments in issuers of industries deemed sensitive to relevant national interests. These
factors may limit the investment opportunities available and result in a lack of liquidity and high price volatility with respect to securities of issuers from developing countries.
The value of foreign
currencies relative to the U.S. Dollar fluctuates in response to market, economic, political, regulatory, geopolitical or other conditions. A decline in the value of a foreign currency versus the U.S. Dollar reduces
the value in U.S. Dollars of investments denominated in that foreign currency. This risk may impact the Fund more greatly to the extent the Fund does not hedge its currency risk, or hedging techniques used by the
Advisers are unsuccessful.
12. Contingencies
In the normal course of
business, the Fund may provide general indemnifications pursuant to certain contracts and organizational documents. The Fund's maximum exposure under these arrangements is dependent on future claims that may be made
against the Fund, and therefore, cannot be estimated; however, the Fund expects the risk of loss from such claims to be remote.
| abrdn Asia-Pacific Income Fund, Inc.
| 37
|
Notes to Financial Statements (unaudited) (continued)
April 30, 2026
13. Tax Information
The U.S. federal income tax
basis of the Fund's investments (including derivatives, if applicable) and the net unrealized depreciation as of April 30, 2026, were as follows:
Tax Cost of
Securities
| Unrealized
Appreciation
| Unrealized
Depreciation
| Net
Unrealized
Appreciation/
(Depreciation)
|
| $1,064,515,722
| $45,489,049
| $(65,390,776)
| $(19,901,727)
|
14. Segment Reporting
In this reporting period, the Fund adopted
FASB Accounting Standards Update 2023-07, Segment Reporting (Topic 280) - Improvements to Reportable Segment Disclosures ("ASU 2023-07"). Adoption of the new standard impacted disclosures only and did not
affect the Fund's financial position nor the results of its operations. Operating segments are components of a public entity that engage in business activities from which it may recognize revenues and
incur expenses, have discrete financial information available, and have their operating results regularly reviewed by the public entity’s chief operating decision maker (“CODM”) when
assessing segment performance and making decisions about segment resources.
The Chief Financial Officer
of the Fund acts as the Fund's CODM. The CODM monitors the operating results of the Fund as a whole, and the Fund's asset allocation is managed in accordance with its Prospectus. The Fund operates as a single
operating and reporting segment pursuant to its investment objective and principal investment strategy. The Fund's portfolio composition, total returns, expense ratios and changes in net assets used by the CODM to
assess segment performance and make resource allocations are consistent with the information presented within the Fund's financial statements. Segment assets are reflected on the Fund's Statement of Assets and
Liabilities as “Total Assets” and significant segment expenses are listed on the Statement of Operations.
15. Recent Accounting
Pronouncements
In December 2023, the FASB
issued Accounting Standards Update 2023-09 (“ASU 2023-09”), Income Taxes (Topic 740) Improvements to Income Tax Disclosures, which amends quantitative and qualitative income tax disclosure requirements in
order to increase disclosure consistency, bifurcate income tax information by jurisdiction and remove information that is no longer beneficial. The Fund has adopted ASU 2023-09 as of December 31, 2025.
16. Subsequent Events
Management has evaluated
the need for disclosures and/or adjustments resulting from subsequent events through the date the
financial statements were issued. Based on
this evaluation, no disclosures and/or adjustments were required to the financial statements as of April 30, 2026, other than as noted below.
On May 11, 2026 and June 9,
2026, the Fund announced that it will pay on May 29, 2026 and June 30, 2026, respectively, a distribution of U.S. $0.1650 per share to all shareholders of record as of May 21, 2026 and June 23, 2026, respectively.
Effective May 15, 2026, the
Fund acquired all of the assets and assumed all of the liabilities of the abrdn Global Income Fund, Inc. (the “Acquired Fund”) pursuant to plans of reorganization approved by the Board on September 11,
2025 (“Reorganization”).
The acquisition was accomplished
by a tax-free exchange as follows:
13,508,920 shares of the
Acquired Fund, fair valued at $37,045,701 for 2,388,658 shares of the Acquiring Fund.
The investment portfolio and
cash of the Acquired Fund, with a fair value of $36,568,348 and identified cost of $36,062,313 were the principal assets acquired by the Fund. For financial reporting purposes, assets received and shares issued by the
Fund were recorded at value; however, the cost basis of the investments received from the Acquired Fund was carried forward to align ongoing reporting of the Fund’s realized and unrealized gains and losses with
amounts distributable to shareholders for tax purposes. The Acquiring Fund acquired capital loss carryovers of $5,154,708 which is subject to loss limitations from the Acquired Fund. Immediately prior to the merger,
the investment portfolio and cash of the Fund was $631,072,474.
The chart below shows a summary
of net assets and shares outstanding, before and after the Reorganization.
| 38
| abrdn Asia-Pacific Income Fund, Inc.
|
Notes to Financial Statements (unaudited) (concluded)
April 30, 2026
|
| Shares
Outstanding
| Net Assets
| Net Asset
Value
Per Share
| Net Unrealized
Appreciation
(Depreciation)
| Accumulated
Net Realized
Gain/(Loss)
|
| Before Reorganization
|
|
|
|
|
|
| abrdn Global Income Fund, Inc.
| 13,508,920
| $37,045,701
| $2.74
| $507,274
| $(25,815,543)
|
| abrdn Asia-Pacific Income Fund, Inc.
| 41,282,628
| 640,256,036
| 15.51
| (40,093,818)
| (383,774,007)
|
| Total
|
| $677,301,737
|
| $(39,586,544)
| $(409,589,550)
|
|
| Shares
Outstanding
| Net Assets
| Net Asset
Value
Per Share
| Net Unrealized
Appreciation
(Depreciation)
| Accumulated
Net Realized
Gain/(Loss)
|
| After Reorganization
|
|
|
|
|
|
| abrdn Asia-Pacific Income Fund, Inc.
| 43,671,286
| $677,301,737
| $15.51
| $(39,586,544)
| $(409,589,550)
|
| abrdn Asia-Pacific Income Fund, Inc.
| 39
|
Dividend Reinvestment and Optional Cash Purchase
Plan (Unaudited)
The Fund intends to distribute to
shareholders substantially all of its net investment income and to distribute any net realized capital gains at least annually. Net investment income for this purpose is income other than net realized long-term and
short-term capital gains net of expenses. Pursuant to the Dividend Reinvestment and Optional Cash Purchase Plan (the “Plan”), shareholders whose shares of common stock are registered in their own names
will be deemed to have elected to have all distributions automatically reinvested by Computershare Trust Company N.A. (the “Plan Agent”) in the Fund shares pursuant to the Plan, unless such shareholders
elect to receive distributions in cash. Shareholders who elect to receive distributions in cash will receive such distributions paid by check in U.S. Dollars mailed directly to the shareholder by the Plan Agent, as
dividend paying agent. In the case of shareholders such as banks, brokers or nominees that hold shares for others who are beneficial owners, the Plan Agent will administer the Plan on the basis of the number of shares
certified from time to time by the shareholders as representing the total amount registered in such shareholders’ names and held for the account of beneficial owners that have not elected to receive
distributions in cash. Investors that own shares registered in the name of a bank, broker or other nominee should consult with such nominee as to participation in the Plan through such nominee and may be required to
have their shares registered in their own names in order to participate in the Plan. Please note that the Fund does not issue certificates so all shares will be registered in book entry form. The Plan Agent serves as
agent for the shareholders in administering the Plan. If the Directors of the Fund declare an income dividend or a capital gains distribution payable either in the Fund’s common stock or in cash, nonparticipants
in the Plan will receive cash and participants in the Plan will receive common stock, to be issued by the Fund or purchased by the Plan Agent in the open market, as provided below. If the market price per share (plus
expected per share fees) on the valuation date equals or exceeds NAV per share on that date, the Fund will issue new shares to participants at NAV; provided, however, that if the NAV is less than 95% of the market
price on the valuation date, then such shares will be issued at 95% of the market price. The valuation date will be the payable date for such distribution or dividend or, if that date is not a trading day on the NYSE
American, the immediately preceding trading date. If NAV exceeds the market price of Fund shares at such time, or if the Fund should declare an income dividend or capital gains distribution payable only in cash, the
Plan Agent will, as agent for the participants, buy Fund shares in the open market, on the NYSE American or elsewhere, for the participants’ accounts on, or shortly after, the payment date. If, before the Plan
Agent has completed its purchases, the market price exceeds the NAV of the Fund's share, the average per share purchase price paid by the Plan Agent may exceed the NAV of the Fund’s shares, resulting in the
acquisition of fewer shares than if the distribution had been paid in shares issued by the Fund on the dividend payment date. Because of
the foregoing difficulty with respect to
open-market purchases, the Plan provides that if the Plan Agent is unable to invest the full dividend amount in open-market purchases during the purchase period or if the market discount shifts to a market premium
during the purchase period, the Plan Agent will cease making open-market purchases and will receive the uninvested portion of the dividend amount in newly issued shares at the close of business on the last purchase
date.
Participants have the option
of making additional cash payments of a minimum of $50 per investment (by check, one-time online bank debit or recurring automatic monthly ACH debit) to the Plan Agent for investment in the Fund’s common stock,
with an annual maximum contribution of $250,000. The Plan Agent will wait up to three business days after receipt of a check or electronic funds transfer to ensure it receives good funds. Following confirmation of
receipt of good funds, the Plan Agent will use all such funds received from participants to purchase Fund shares in the open market on the 25th day of each month or the next trading day if the 25th is not a trading
day.
If the participant sets up
recurring automatic monthly ACH debits, funds will be withdrawn from his or her U.S. bank account on the 20th of each month or the next business day if the 20th is not a banking business day and invested on the next
investment date. The Plan Agent maintains all shareholder accounts in the Plan and furnishes written confirmations of all transactions in an account, including information needed by shareholders for personal and tax
records. Shares in the account of each Plan participant will be held by the Plan Agent in the name of the participant, and each shareholder’s proxy will include those shares purchased pursuant to the Plan. There
will be no brokerage charges with respect to common shares issued directly by the Fund. However, each participant will pay a per share fee of $0.02 incurred with respect to the Plan Agent’s open market purchases
in connection with the reinvestment of dividends, capital gains distributions and voluntary cash payments made by the participant. Per share fees include any applicable brokerage commissions the Plan Agent is required
to pay.
Participants also have the
option of selling their shares through the Plan. The Plan supports two types of sales orders. Batch order sales are submitted on each market day and will be grouped with other sale requests to be sold. The price will
be the average sale price obtained by Computershare’s broker, net of fees, for each batch order and will be sold generally within 2 business days of the request during regular open market hours. Please note that
all written sales requests are always processed by Batch Order. ($10 and $0.12 per share). Market Order sales will sell at the next available trade. The shares are sold real time when they hit the market, however an
available trade must be presented to complete this transaction. Market Order sales may only
| 40
| abrdn Asia-Pacific Income Fund, Inc.
|
Dividend Reinvestment and Optional Cash Purchase
Plan (Unaudited) (concluded)
be requested by phone at 1-800-647-0584 or
using Investor Center through www.computershare.com/buyaberdeen. ($25 and $0.12 per share).
The receipt of dividends and
distributions under the Plan will not relieve participants of any income tax that may be payable on such dividends or distributions. The Fund or the Plan Agent may terminate the Plan as applied to any voluntary cash
payments made and any dividend or distribution paid subsequent to notice of the termination sent to members of the Plan at least 30 days prior to the record date for such dividend or distribution. The Plan also may be
amended by
the Fund or the Plan Agent, but (except when
necessary or appropriate to comply with applicable law or the rules or policies of the Securities and Exchange Commission or any other regulatory authority) only by mailing a written notice at least 30 days prior to
the effective date to the participants in the Plan. All correspondence concerning the Plan should be directed to the Plan Agent by phone at 1-800-647-0584, using Investor Center through www.computershare.com/buyaberdeen or in writing to Computershare Trust Company N.A., P.O. Box 43006, Providence, RI 02940-3078.
| abrdn Asia-Pacific Income Fund, Inc.
| 41
|
[THIS PAGE INTENTIONALLY LEFT BLANK]
[THIS PAGE INTENTIONALLY LEFT BLANK]
[THIS PAGE INTENTIONALLY LEFT BLANK]
Directors
Rahn Porter, Chair effective May 27, 2026*
Radhika Ajmera
Christian Pittard
Moritz Sell
* P. Gerald Malone was a Director and Chair as of
April 30, 2026 and retired from the Board effective May 27, 2026 as presented in the annual proxy.
Investment Manager
abrdn Asia Limited
7 Straits View
#23-04 Marina One East Tower
Singapore 018936
Investment Sub-Adviser
abrdn Investments Limited
1 George Street
Edinburgh, EH2 2LL
United Kingdom
Administrator
abrdn Inc.
1900 Market Street, Suite 200
Philadelphia, PA 19103
Custodian
State Street Bank and Trust Company
John Adams Building
1776 Heritage Drive
North Quincy, MA 02171
Transfer Agent
Computershare Trust Company, N.A.
P.O. Box 43006
Providence, RI 02940-3078
Independent Registered Public
Accounting Firm
KPMG LLP
191 West Nationwide Blvd., Suite 500
Columbus, OH 43215
Legal Counsel
Dechert LLP
1900 K Street N.W.
Washington, D.C. 20006
Investor Relations
abrdn Inc.
1900 Market Street, Suite 200
Philadelphia, PA 19103
1-800-522-5465
[email protected]
The Financial Statements
as of April 30, 2026, included in this report, were not audited and accordingly, no opinion is expressed thereon.
Notice is hereby given in
accordance with Section 23(c) of the Investment Company Act of 1940, as amended, that the Fund may purchase, from time to time, shares of its common stock in the open market.
Shares of abrdn
Asia-Pacific Income Fund, Inc. are traded on the NYSE American under the symbol “FAX.” Information about the Fund’s net asset value and market price is available at www.aberdeenfax.com.
This report, including
the financial information herein, is transmitted to the shareholders of abrdn Asia-Pacific Income Fund, Inc. for their general information only. It does not have regard to the specific investment objectives, financial
situation and the particular needs of any specific person. Past performance is no guarantee of future results.
(b) Not applicable.
Item 2. Code of Ethics.
This item is inapplicable to semi-annual report on Form N-CSR.
Item 3. Audit Committee Financial Expert.
This item is inapplicable to semi-annual report on Form N-CSR.
Item 4. Principal Accountant Fees and Services.
This item is inapplicable to semi-annual report on Form N-CSR.
Item 5. Audit Committee of Listed Registrants.
This item is inapplicable to semi-annual report on Form N-CSR.
Item 6. Investments.
(a) Schedule of Investments in securities of unaffiliated
issuers as of close of the reporting period is included as part of the Report to Shareholders filed under Item 1 of this Form N-CSR.
(b) Not applicable.
Item 7. Financial Statements and Financial
Highlights for Open-End Management Investment Companies.
Not applicable.
Item 8. Changes in and Disagreements with Accountants
for Open-End Management Investment Companies.
Not applicable.
Item 9. Proxy Disclosures for Open-End Management
Investment Companies.
Not applicable.
Item 10. Remuneration Paid to Directors, Officers,
and Others of Open-End Management Investment Companies.
Not applicable.
Item 11. Statement Regarding Basis for Approval
of Investment Advisory Contract.
Not applicable.
Item 12. Disclosure of Proxy Voting Policies and Procedures for
Closed-End Management Investment Companies.
This item is inapplicable to semi-annual report on Form N-CSR.
Item 13. Portfolio Managers of Closed-End Management Investment
Companies.
| (a) | Not applicable to semi-annual report on Form N-CSR. |
| (b) | There has been no change, as of the date of this filing, in any of the portfolio managers identified in response to paragraph (a)(1)
of this Item in the registrant’s most recently filed annual report on Form N-CSR. |
Item 14. Purchases of Equity Securities by Closed-End Management
Investment Company and Affiliated Purchasers.
| Period |
|
(a) Total No.
of Shares
Purchased |
|
|
(b) Average
Price Paid per
Share |
|
|
(c) Total No.
of Shares
Purchased as
Part of
Publicly
Announced Plans
or Programs(1) |
|
|
(d) Maximum No.
of Shares that
May Yet Be
Purchased Under
the Plans or
Programs(1) |
|
| Month #1 (Nov. 1, 2025 — Nov. 30, 2025) |
|
|
— |
|
|
|
— |
|
|
|
— |
|
|
4,128,262 |
|
| Month #2 (Dec. 1, 2025 — Dec. 31, 2025) |
|
|
— |
|
|
|
— |
|
|
|
— |
|
|
4,128,262 |
|
| Month #3 (Jan. 1, 2026 — Jan. 31, 2026) |
|
|
— |
|
|
|
— |
|
|
|
— |
|
|
4,128,262 |
|
| Month #4 (Feb. 1, 2026 — Feb. 28, 2026) |
|
|
— |
|
|
|
— |
|
|
|
— |
|
|
4,128,262 |
|
| Month #5 (Mar. 1, 2026 — Mar. 31, 2026) |
|
|
— |
|
|
|
— |
|
|
|
— |
|
|
4,128,262 |
|
| Month #6 (Apr. 1, 2026 — Apr. 30, 2026) |
|
|
— |
|
|
|
— |
|
|
|
— |
|
|
4,128,262 |
|
| Total |
|
|
— |
|
|
|
— |
|
|
|
— |
|
|
|
|
| |
(1) |
On March 1, 2001, the Board of Trustees approved an open market share repurchase program (the “Program”). The Program allows the Fund to purchase, in the open market, its outstanding common shares, with the amount and timing of any repurchase determined at the discretion of the Fund’s investment adviser. Such purchases may be made opportunistically at certain discounts to NAV per share in the reasonable judgment of management based on historical discount levels and current market conditions. On a quarterly basis, the Fund’s Board will receive information on any transactions made pursuant to this policy during the prior quarter and management will post the number of shares repurchased on the Fund's website on a monthly basis. Under the terms of the Program, the Fund is permitted to repurchase up to 10% of its outstanding shares of common stock in the open market during any 12 month period as of October 31 of the prior year. For the period ended April 30, 2026, the Fund did not repurchase any shares through this program. |
Item 15. Submission of Matters to a Vote of Security Holders.
During the period ended April 30, 2026, there were no material changes
to the procedures by which shareholders may recommend nominees to the Registrant’s Board of Directors.
Item 16. Controls and Procedures.
| (a) | The Registrant’s principal executive and principal financial officers, or persons performing similar
functions, have concluded that the Registrant’s disclosure controls and procedures (as defined in Rule 30a-3(c) under the Investment
Company Act of 1940 (the “Act”) (17 CFR 270.30a-3(c))) are effective, as of a date within 90 days of the filing date of the
report that includes the disclosure required by this paragraph, based on the evaluation of these controls and procedures required by Rule
30a-3(b) under the Act (17 CFR 270.30a3(b)) and Rule 13a-15(b) or 15d-15(b) under the Securities Exchange Act of 1934, as amended (17
CFR 240.13a-15(b) or 240.15d15(b)). |
| (b) | There were no changes in the Registrant’s internal control over financial reporting (as defined
in Rule 30a-3(d) under the Act (17 CFR 270.30a-3(d))) that occurred during the period covered by this report that has materially
affected, or is reasonably likely to materially affect, the Registrant’s internal control over financial reporting. |
| Item 17. | Disclosure of Securities Lending Activities for Closed-End Management Investment Companies. |
Not applicable.
Item 18. Recovery of Erroneously Awarded Compensation.
Not applicable.
Item 19. Exhibits.
| (a)(2) | Any policy required by the listing standards adopted pursuant to Rule 10D-1 under the Exchange Act (17
CFR 240.10D-1) by the registered national securities exchange or registered national securities association upon which the registrant’s
securities are listed. Not applicable. |
| (a)(4) | Any written solicitation to purchase securities under Rule 23c-1 under the 1940 Act (17 CFR 270.23c-1)
sent or given during the period covered by the report by or on behalf of the registrant to 10 or more persons. Not applicable. |
| (a)(5) | Change in Registrant’s independent public accountant.
Not applicable. |
SIGNATURES
Pursuant to the requirements of the Securities
Exchange Act of 1934 and the Investment Company Act of 1940, the Registrant has duly caused this report to be signed on its behalf by
the undersigned, thereunto duly authorized.
| abrdn Asia-Pacific Income Fund, Inc. |
|
| By: |
/s/
Alan Goodson |
|
| |
Alan Goodson, |
|
| |
Principal Executive Officer of abrdn Asia-Pacific
Income Fund, Inc. |
|
Date: July 9, 2026
Pursuant to the requirements of the Securities
Exchange Act of 1934 and the Investment Company Act of 1940, this report has been signed below by the following persons on behalf of
the Registrant and in the capacities and on the dates indicated.
| By: |
/s/
Alan Goodson |
|
| |
Alan Goodson, |
|
| |
Principal Executive Officer of abrdn Asia-Pacific
Income Fund, Inc. |
|
Date: July 9, 2026
| By: |
/s/
Sharon Ferrari |
|
| |
Sharon Ferrari, |
|
| |
Principal Financial Officer of abrdn Asia-Pacific
Income Fund, Inc. |
|
Date: July 9, 2026
ATTACHMENTS / EXHIBITS
EXHIBIT 99.CERT
EXHIBIT 99.906CERT






 Tweet
Tweet Share
Share E-mail