

Form N-CSR WESMARK FUNDS For: Dec 31
 Tweet
Tweet Share
ShareUnited States
Securities and Exchange Commission
Washington, D.C. 20549
FORM N-CSR
CERTIFIED SHAREHOLDER REPORT OF REGISTERED
MANAGEMENT INVESTMENT COMPANIES
811-07925
(Investment Company Act file number)
WesMark Funds
(Exact name of registrant as specified in charter)
One Bank Plaza, 5th floor
Wheeling, WV 26003
(Address of principal executive offices)
(304) 234-9000
(Registrant’s telephone number)
Karen Gilomen, Esq.
ALPS Fund Services, Inc.
1290 Broadway, Suite 1100
Denver, CO 80203
(Name and address of agent for service)
Date of fiscal year end: December 31
Date of reporting period: January 1 – December 31, 2018
Item 1. Reports to Stockholders.

President’s Message
| December 31, 2018 |
Dear Fellow Shareholders:
After starting on a positive note, 2018 moved to a year of uncertainty including concern as to the sustainability of the current economic cycle as it approached a ten-year mark. We are able to recite the common list of worries and look at a number of these as expected at this point in the economic cycle; manageable from a policy standpoint and, while impacting financial market volatility, perhaps creating opportunities for investors.
After what had become a rather predictable pattern of low first quarter Gross Domestic Product (GDP) growth, second quarter GDP growth was reported at a 4.2% annual rate surpassing consensus estimates and setting the stage for full year growth that would significantly exceed the average annual increase in GDP over the past nine years. As it became evident that the third quarter would show a deceleration in growth, investors became concerned with the timing of the arrival of the next domestic recession. A Federal Reserve that continued to move rates higher on a schedule that seemed to ignore economic fundamentals, decelerating earnings growth for 2019, and tariffs and trade were among a growing litany of issues that preoccupied investors who began to view even favorable earnings results and outlooks with skepticism.
The year brought few economic surprises as job growth continued with an average monthly increase in non-farm payrolls of 223,000, the unemployment rate and weekly unemployment claims remained at multi-decade lows, inflation remained constrained, increased discretionary income supported a consumer ready and willing to spend, and fiscal policy provided an offset to tightening monetary policy. This environment was expected to provide continued support for equity markets but a look forward late in the year brought a sudden change in the attitude for risk.
All major equity indexes were negative for the year. U.S. large capitalization outperformed mid-capitalization which outperformed small capitalization all of whom outperformed international equities, both developed and emerging. Defensive sectors were strong in the fourth quarter as investors reduced portfolio risk. The full year saw three periods of declines in equity prices that exceeded 10% from recent highs culminating in a 19.8% drop in the Standard & Poor 500 Index from late September to late December. Fixed income indexes that included corporate or foreign debt were also negative for the year. U.S. Government Debt indexes provided positive returns in the low single digits as the risk off trade intensified. Portfolio duration remained key as interest rate increases reduced the value of fixed income securities. Credit spreads widened as the year progressed as demand for higher rates accompanied fears of declining credit worthiness of corporate and foreign debt. The calm of 2017 was replaced with volatility. A volatility more typical of equity markets, although usually not concentrated in the short time periods that were witnessed in 2018.
A discussion of the volatility in the U.S. financial markets for 2018 is not complete without a review of the events that occurred beginning with the meeting of the Federal Reserve on December 19, 2018. The increase in the target Federal Funds rate was expected but the responses to questions at the press conference, the composition of the now famous “dot plot”, forward guidance that included “some” further gradual rate increases will still be needed and unchanged plans for the pace of reduction of the more than $4 trillion balance sheet sent investors rushing to the sidelines. Treasury Secretary Mnuchin attempted to reassure financial markets by answering the unasked question confirming that there was ample liquidity to stave off any shocks to the system. Mnuchin called the chief executives of the nation’s six largest banks and they confirmed that they have ample liquidity to lend to consumers, businesses and perform other market operations. He followed this by convening a call of officials from the Federal Reserve, the Securities and Exchange Commission and the Commodities Futures Trading Commission to discuss any unusual liquidity problems. Mnuchin then reassured the public that the President was not going to fire Fed Chair Jerome Powell. Then late in December the U.S. government entered a partial shutdown when Congress failed to appropriate funds needed to fully operate the government. We strongly believe that a period of economic growth does not just die of old age but is ended by policy errors such as the ones that were witnessed leading up to December 24, 2018.
As 2018 ended, the Federal Reserve devoted a significant amount of public time to clarifying their current policy position making sure that investors knew they were in fact cognizant of a slowing global economy, that an extended battle over tariffs would indeed have a negative impact on growth and that their actions would definitely be data dependent.
Corporations have used the extended period of low interest rates to increase debt and accelerate capital spending, increase dividends, and repurchase shares. Capital spending needs to remain a focus as the tight employment markets have begun to cause an acceleration in wage rates. There becomes a need to enhance productivity through plant and equipment spending in order to maintain the current near record operating margins. The consumer’s support of the economy needs a greater contribution from corporate spending in order to maintain growth at levels consistent with the current economic cycle. This push from the fiscal policy changes, including lower tax rates, provided needed support as an offset to the Federal Reserve’s continuing policy of interest rate normalization. However, we continue our view that the current Fed policy is one of being less accommodative, not restrictive.
The Funds ended the year with net assets of $840.8 million. Fund flows and investment performance resulted in a decline in assets under management for the Fund complex. The WesMark Tactical Opportunity Fund, established on March 1, 2017, continued to experience positive fund flows.
Your investment in and support of the WesMark Funds is important to us and, as always, we thank you. Our processes are always changing striving to provide a competitive result to you, our investors. Our investment in the resources necessary to execute a successful investment plan for all of our funds is always top of mind. Your support is instrumental to this success. Should you have any questions or need additional information about the Funds, please visit our website www.wesmarkfunds.com or call 1-800-864-1013.
| Sincerely, | |
 |
|
| David B. Ellwood, CFA | |
|
President, WesMark Funds |
| www.wesmarkfunds.com |  |


Beginning on January 1, 2021, as permitted by regulations adopted by the U.S. Securities and Exchange Commission, paper copies of the Funds’ annual and semi-annual shareholder reports will no longer be sent by mail, unless you specifically request paper copies of the reports. Instead, the reports will be made available on the Funds’ website (www.wesmarkfunds.com), and you will be notified by mail each time a report is posted and provided with a website link to access the report.
If you already elected to receive shareholder reports electronically, you will not be affected by this change and you need not take any action. You may elect to receive shareholder reports and other communications from a Fund electronically anytime by contacting your financial intermediary (such as a broker-dealer or bank) or, if you are a direct investor, by enrolling at www.wesmarkfunds.com.
Beginning on January 1, 2019, you may elect to receive all future reports in paper free of charge. If you invest through a financial intermediary, you can contact your financial intermediary to request that you continue to receive paper copies of your shareholder reports. If you invest directly with a Fund, you can call 1-800-864-1013 to let the Fund know you wish to continue receiving paper copies of your shareholder reports. Your election to receive reports in paper will apply to all funds held in your account if you invest through your financial intermediary or all funds held with the fund complex if you invest directly with a Fund.
Table of Contents
| December 31, 2018 |
| Management’s Discussion of Fund Performance | |
| Small Company Growth Fund | 2 |
| Growth Fund | 5 |
| Balanced Fund | 8 |
| Government Bond Fund | 11 |
| West Virginia Municipal Bond Fund | 14 |
| Tactical Opportunity Fund | 17 |
| Small Company Growth Fund | |
| Portfolio of Investments Summary Table | 20 |
| Portfolio of Investments | 21 |
| Growth Fund | |
| Portfolio of Investments Summary Table | 23 |
| Portfolio of Investments | 24 |
| Balanced Fund | |
| Portfolio of Investments Summary Table | 26 |
| Portfolio of Investments | 27 |
| Government Bond Fund | |
| Portfolio of Investments Summary Table | 32 |
| Portfolio of Investments | 33 |
| West Virginia Municipal Bond Fund | |
| Portfolio of Investments Summary Table | 39 |
| Portfolio of Investments | 40 |
| Tactical Opportunity Fund | |
| Portfolio of Investments Summary Table | 45 |
| Portfolio of Investments | 46 |
| Statements of Assets and Liabilities | 47 |
| Statements of Operations | 49 |
| Statements of Changes in Net Assets | 50 |
| Financial Highlights | 53 |
| Notes to Financial Statements | 59 |
| Report of Independent Registered Public Accounting Firm | 71 |
| Shareholder Expense Example | 72 |
| Board of Trustees and Trust Officers | 73 |
| Additional Information | 75 |
| Glossary of Terms | 76 |
| Annual Report » December 31, 2018 |  |
Management’s Discussion of Fund Performance
| WesMark Small Company Growth Fund | December 31, 2018 (Unaudited) |
Equity markets started 2018 off on a positive note, led by changes in corporate and personal taxes and their hopeful impact on the overall economy. Small cap companies, who typically have higher tax rates relative to their larger peers, saw expectations for earnings forecasts move well above long-term average growth rates. The initial optimism was reflected in equity markets as indexes moved to all-time highs within the first month of the year. However, the positivity did not last long as a number of issues pushed equity indexes lower in February. The nearly 10% decline in the S&P 500 ended the record streak without a 3% correction. The 448 calendar days without a 3% correction easily surpassed the prior record of 370 days set in 1996. Small cap indexes dropped nearly 9% during this period. It was our view at the time that the steep drop in indexes was not a signal for a bear market, but a return to more normal equity volatility. Our thesis was verified as equity markets recovered, led by strong earnings growth and sustained economic growth, moving to near highs in mid-September. Small cap equity indexes reached their near-term peak earlier in the month. At this point fears of an aggressive Federal Reserve, slowing global economic growth and slowing earnings growth in 2019 caused many investors to attitude for riskier asset classes. Small cap indexes tumbled in September and October, getting a slight reprieve in November, before falling further in December. The largest decline posted on December 24th, brought coal instead of gifts for investors. From the near-term peak to the December 24th close, the Russell 2000 Index dropped 27.2% and stood at levels on par with 2016 closing prices. Following the holiday, equity prices moved higher, but still finished the year negative. For 2018, the WesMark Small Company Growth Fund returned -13.7%, compared to the Russell 2000 Index drop of 11.0%, and the Lipper Small-Cap Core Fund category decline of 12.7%. Over the past five years, the WesMark Small Company Growth Fund earned an average annual total return of 1.7%, versus 4.4% and 3.4% for the Russell 2000 Index and Lipper Small-Cap Core Fund, respectively.
The strong momentum from the first half of 2018 allowed growth indexes to post results that were slightly better than their value focused peers over the full year. The Russell 2000 Growth Index dropped 9.3%, while the Russell 2000 Value Index fell by 12.9% for the full year. During the final quarter of the year, value indexes performed better relative to growth, but both were down nearly 20% for the quarter. The fourth quarter declines erased all of the positive returns generated to that point. The results were similar for the WesMark Small Company Growth Fund, gaining 6.2% in the first nine months of 2018 compared to a return of -19.5% posted for the final quarter of the year. Once again larger cap counterparts outperformed their smaller peers, with the S&P 500 Index declining by 4.4% and the S&P Mid Cap Index dropping 11.1% for 2018.
The Fund’s relative performance for the period was affected by both sector allocation decisions and stock selection. From a sector perspective, returns were negative across all sectors except for the healthcare index. For 2018, the S&P 600 Health Care Index posted a gain of 9.8%. Even the more defensive sectors like utilities and consumer staples posted declines for the year. The S&P 600 Utilities Index fell by 3.2% and the S&P 600 Consumer Staples dropped by 6.4%, leaving very few sectors where small cap investors could have sought shelter in the volatile year. The more cyclical and commodity focused sectors produced the largest declines for the years, with the S&P 600 Energy and S&P 600 Materials sectors falling by 23.1% and 43.0%, respectively. As a result, sector selection was as important as stock selection. Going forward, we will continue to monitor our sector decisions over the next year, particularly given world economic growth projections and the outlook for earnings.
Our decision to overweight the health care sector proved correct; however, stock selection was not as helpful to performance. Our holdings within the sector dropped by 2.8%. For the year our approach was find companies with a specific product set that would either improve productivity within hospitals or medical offices, or services that would help companies maximize research and development budgets. For the year, slightly less than half the companies posted positive returns, led by CareDx, Align Technology and Icon Plc.
The largest absolute weighting for the Fund was in the Industrial sector, at 24.7% compared to the 14.7% for the benchmark. The decision to overweight the sector did not help performance, as the sector return trailed the benchmark. Selection was also hindrance as our holdings dropped 20.4% compared to a decline of 12.9% for the S&P 600 Industrials. With half the holdings posting results that were below the sector benchmark, with two holdings positive for the year led by Lennox International and Forward Air Corp. It was our expectation that the changes in corporate tax policy, paired with rising labor costs, would lead to an acceleration in capital expenditures during the year. In addition, a number of our holdings were focused in the transportation space. Our thesis was the tight market and the shift in consumer preferences would lead to strong earnings growth for the space.
Closely following our Industrial exposure was the Health Care weighting at 24.6% and the Information Technology at 23.6%. Our allocation to the Information Technology sector, is well above the 14.9% for the benchmark. Our selections within the sector was more accretive to overall performance than was our overweight to the sector. For the full year, our holdings posted a return of 8.0%, well above the S&P 600 Information Technology Index’s -9.4% return. The decision to overweight the sector in 2018 was grounded in our belief that valuations were attractive and earnings growth should accelerate given the anticipated global economic growth rates. Nearly half of our Information technology holdings reported positive returns, led by Tableau Software, Rapid7, and Nutanix, up 73.8%, 67.8% and 63.6%, respectively.
Financials account for the largest weighting within the benchmark. However, the Fund was underweight the benchmark with a 13.0% allocation. This marked a slight increase from the prior year, as several of our holdings were acquired by other companies. Our focus for the year was a shift into more regional banks, as we felt the increasing short-term rates would also help push borrowing rates higher. Instead, the yield curve flattened during much of 2018. And while net interest margins moved higher, they were not as strong as we initial expected. In addition, the market volatility and concerns about an aggressive Federal Reserve slowed loan demand in the first quarter. However, as economic growth accelerated in the second and third quarters, lending activity improved. While, the demand for loans improved, many other borrowers were paying off loans more quickly than expected. The result was flat or low increases in loan balances outstanding. The downturn accelerated following the election as concerns about increased regulation gathered momentum.
| 2 |  |
www.wesmarkfunds.com |
Management’s Discussion of Fund Performance
| December 31, 2018 (Unaudited) | WesMark Small Company Growth Fund |
Two of our more disappointing sectors within the Fund for the year were Energy and Consumer Discretionary. Our decision to underweight the Energy sector helped as the returns were significantly under that of the benchmark. For much of the middle part of 2018, we maintained a 0% weight in the space, as falling energy prices weighed on the underlying companies. Supporting the returns was an acquisition of one of our holdings during the year. The premium paid allowed us to post a modest gain in that position, still for the year our holdings were down 17.3%. Toward the end of 2018 we build a small position in the energy space in an effort take advantage of rising energy prices and the expected increase in earnings. Within the Consumer Discretionary space both weighting and selection were incorrect for the year. Our underweight in Consumer Discretionary, a sector that outperformed the broad benchmark, combined with poor stock selection resulted in returns that were not as accretive to the Fund as they should have been. Still we managed to report positive returns in Freshpet and Foot Locker, up 93.4% and 16.9%, respectively for 2018.
Our top ten holdings accounted for 36.1% of the overall market value of the Fund. The average performance for these holdings were solid for 2018, with seven of the top ten posting returns that exceed the benchmark and five with positive returns.
TOP 10 EQUITY HOLDINGS
| Security Name | % of Total Net Assets |
| Integrated Device Technology, Inc. | 4.7% |
| Hexcel Corp. | 4.4% |
| Quanta Services, Inc. | 4.1% |
| Allscripts Healthcare Solutions, Inc. | 3.9% |
| Lennox International, Inc. | 3.8% |
| Hill-Rom Holdings, Inc. | 3.6% |
| Pure Storage, Inc., Class A | 3.5% |
| Moog, Inc., Class A | 2.8% |
| Syneos Health, Inc. | 2.7% |
| Foot Locker, Inc. | 2.6% |
| Total Net Assets | 36.1% |
Also see Glossary of Terms on page 76.
Performance data quoted represents past performance which is no guarantee of future results.
An investment in the Funds involves risk, including loss of principal. Investment in the Funds is subject to investment risks, including, without limitation, market risk, credit risk, interest rate risk, risks related to ETF net asset value and market price, foreign securities risk, commodity risk, manager risks, risks of investing in real estate investment trust (REITs), and risks related to company size.
The views in this report were those of the Fund Managers as of the letter’s publication date and may not reflect his views on the date this letter is first distributed or anytime thereafter. These views are intended to assist readers in understanding the Fund’s investment methodology and do not constitute investment advice.
| Annual Report | December 31, 2018 | |
3 |
Management’s Discussion of Fund Performance
| WesMark Small Company Growth Fund | December 31, 2018 (Unaudited) |
GROWTH
of $10,000 invested in WesMark Small Company Growth Fund
The graph below illustrates the hypothetical investment of $10,000* in the WesMark Small Company Growth Fund (the “Fund”)
from December 31, 2008 to December 31, 2018, compared to the Russell 2000® Index (“Russell 2000®”)** and the
Lipper Small Cap Core Funds Average (“LSCCFA”).***
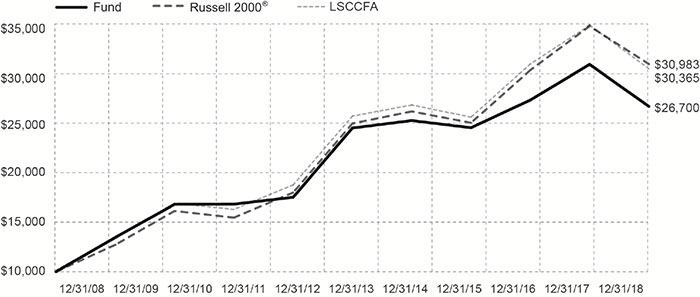
AVERAGE ANNUAL TOTAL RETURN for the periods ended December 31, 2018
| 1 Year | 5 Years | 10 Years |
| -13.72% | 1.73% | 10.32% |
Total Annual Fund Operating Expense (as of most current Prospectus): 1.25%
Performance data quoted represents past performance which is no guarantee of future results. Investment return and principal value will fluctuate so that an investor’s shares, when redeemed, may be worth more or less than their original cost. Mutual fund performance changes over time and current performance may be lower or higher than what is stated. For current to the most recent month end performance and after-tax returns call 1-800-864-1013. Returns shown do not reflect the deduction of taxes that a shareholder would pay on Fund distributions or the redemption of Fund shares. Mutual funds are not obligations of or guaranteed by any bank and are not federally insured.
Small-company stocks may be less liquid and subject to greater price volatility than large capitalization stocks.
| * | Represents a hypothetical investment of $10,000 in the Fund. The Fund’s performance assumes the reinvestment of all dividends and distributions. The Russell 2000® and LSCCFA have been adjusted to reflect reinvestment of dividends on securities in the index and average. |
| ** | The Russell 2000® is not adjusted to reflect sales charges, expenses, or other fees that the Securities and Exchange Commission (SEC) requires to be reflected in the Fund’s performance. The Russell 2000® measures the performance of the 2,000 smallest companies in the Russell 3000® Index, which represents approximately 10% of the total market capitalization of the Russell 3000® Index. The index is unmanaged and unlike the Fund, is not affected by cash flows. It is not possible to invest directly in an index. |
| *** | Lipper figures represent the average of the total returns reported by all of the mutual funds designated by Lipper, Inc. as falling into the respective categories indicated. These figures do not reflect sales charges. It is not possible to invest directly in an average. |
| 4 | |
www.wesmarkfunds.com |
Management’s Discussion of Fund Performance
| December 31, 2018 (Unaudited) | WesMark Growth Fund |
The WesMark Growth Fund provided a total return of -6.19% for the year ended December 31, 2018 as compared to the Lipper Large-Cap Core Funds Average of -5.64% placing the Fund in the third quartile of the Lipper Large-Cap Core Funds peer group. After experiencing a year of low volatility, 2018 returned to more normal trading patterns with twenty 2% daily moves in stocks (Standard & Poor 500 Index) including six with moves greater than 3%. All major equity markets were negative for the full year and there were three market declines greater than 10% from near-term highs.
The equity markets began the year with positive momentum but this was short lived as February experienced the first decline of the year of greater than 10%, declining 10.1% from the high reached in late January. The concluding greater than 10% decline of the year resulted in a -19.8% move from September 20, 2018 to December 24, 2018. Market leadership shifted as the year progressed and investors became more defensive and removed risk from their portfolios. Healthcare and Utilities provided the strongest returns, 6.5% and 4.1%, respectively, for the full year with Energy and Materials experiencing the lowest returns -18.1 and -14.7%, respectively. Leadership in the first nine months of the year was found in Information Technology and Consumer Discretionary. As concerns regarding slowing global economic growth became more apparent, energy prices continued to decline, and trade and tariffs impacted corporate spending plans, the tone of the market began to change.
The Fund maintained an overweight position in Healthcare and Information Technology. Healthcare, the largest sector allocation, provided a positive full year portfolio return of 11.9%, exceeding the sector benchmark return of 6.5%. Information Technology provided a positive full year portfolio return of 6.9%, exceeding the benchmark return of -0.3%. In both cases sector allocation and security selection provided positive value to Fund’s 2018 total return. Positive contributions to the return in Healthcare were found in Merck, Abbott Labs and Zoetis as successful research and development efforts resulted in the approval and introduction of a number of new drugs that are expected to provide upside to the revenue and earnings growth of these companies as the development of humanized antibodies and biologics propel drug therapies to a new level. Zoetis focuses on the growing demand for healthcare for both companion and production animals. Negative to the Healthcare portfolio return were Celgene, whose acquisition by Bristol-Myers Squibb was announced in early 2019, and CVS Health Corp. who is digesting the acquisition of Aetna Inc. which created a healthcare powerhouse. Strength in salesforce.com, Adobe, and MasterCard contributed to the Information Technology return offset in part by weakness in Apple Inc. and Skyworks Solutions, a supplier to Apple Inc. Cloud data storage and software subscriptions are two of the forces driving change in the Information Technology sector. Demand from products that just a few years ago were considered technology deficient have come to the forefront of technology demand. Subscription services from the installed base of hardware has become a key element of growth for many content and software providers. Energy was maintained at a below market weighting in the Fund but a focus on Exploration and Production resulted in a portfolio sector return below that of the sector benchmark. The Fund’s underweight allocation to Consumer Staples was a positive contributor to performance but security selection eliminated any benefit of that allocation decision.
The year brought much volatility and change to the equity markets, with significant price declines witnessed in nearly all sectors as the year ended, which resulted in a challenging year for equity fund performance in general. As the fourth quarter progressed, the Fund maintained an increased cash position and reduced allocations to higher beta and higher valuation securities in an effort to maintain value and lessen the downside risk. Nearly every cyclical sector reached its 2018 low on December 24th and quickly began to move higher as the year came to an end. We maintain a long-term outlook in our portfolio management discipline and believe with volatility comes opportunities.
TOP 10 EQUITY HOLDINGS
| Security Name | % of Total Net Assets |
| Amazon.com, Inc. | 5.4% |
| UnitedHealth Group, Inc. | 4.3% |
| Apple, Inc. | 3.8% |
| Zoetis, Inc. | 3.7% |
| SPDR® S&P 500® ETF Trust | 3.1% |
| Raytheon Co. | 3.1% |
| salesforce.com, Inc. | 3.0% |
| Abbott Laboratories | 2.8% |
| Broadcom, Ltd. | 2.8% |
| Mastercard, Inc., Class A | 2.5% |
| Total Net Assets | 34.5% |
| Annual Report | December 31, 2018 | |
5 |
Management’s Discussion of Fund Performance
| WesMark Growth Fund | December 31, 2018 (Unaudited) |
Also see Glossary of Terms on page 76.
Performance data quoted represents past performance which is no guarantee of future results.
Diversification does not eliminate the risk of experiencing investment losses.
An investment in the Funds involves risk, including loss of principal. Investment in the Funds is subject to investment risks, including, without limitation, market risk, credit risk, interest rate risk, risks related to ETF net asset value and market price, foreign securities risk, commodity risk, manager risks, risks of investing in real estate investment trust (REITs), and risks related to company size.
The views in this report were those of the Fund Managers as of the letter’s publication date and may not reflect his views on the date this letter is first distributed or anytime thereafter. These views are intended to assist readers in understanding the Fund’s investment methodology and do not constitute investment advice.
Lipper, Inc., a Reuters company, is a nationally recognized organization that ranks the performance of mutual funds within a universe of funds that have similar investment objectives. Rankings are historical and are based on total returns with capital gains and dividends reinvested. For the 10-, 5-, 3- and 1- year periods, the Growth Fund was ranked 403 out of 408, 532 out of 536, 573 out of 596, and 643 out of 674 as of 12/31/18 in the Large Cap Core Funds category. Lipper does not guarantee the accuracy of the information. Lipper rankings are not intended to predict future results.
| 6 | |
www.wesmarkfunds.com |
Management’s Discussion of Fund Performance
| December 31, 2018 (Unaudited) | WesMark Growth Fund |
GROWTH of $10,000 invested in WesMark Growth Fund
The graph below illustrates the hypothetical investment of $10,000* in the WesMark Growth Fund (the “Fund”) from December 31, 2008 to December 31, 2018, compared to the Standard and Poor’s 500® Index (“S&P 500®”)** and Lipper Large Cap Core Funds Average (“LLCC”).***
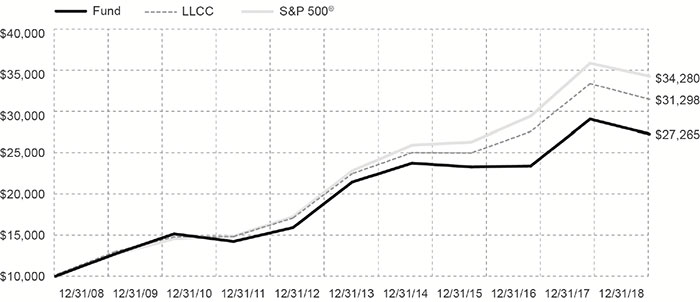
AVERAGE ANNUAL TOTAL RETURN for the periods ended December 31, 2018
| 1 Year | 5 Years | 10 Years |
| -6.19% | 4.91% | 10.55% |
Total Annual Fund Operating Expense (as of most current Prospectus): 1.14%
Performance data quoted represents past performance which is no guarantee of future results. Investment return and principal value will fluctuate so that an investor’s shares, when redeemed, may be worth more or less than their original cost. Mutual fund performance changes over time and current performance may be lower or higher than what is stated. For current to the most recent month end performance and after-tax returns call 1-800-864-1013. Returns shown do not reflect the deduction of taxes that a shareholder would pay on Fund distributions or the redemption of Fund shares. Mutual funds are not obligations of or guaranteed by any bank and are not federally insured.
| * | Represents a hypothetical investment of $10,000 in the Fund. The Fund’s performance assumes the reinvestment of all dividends and distributions. The S&P 500® and LLCC have been adjusted to reflect reinvestment of dividends on securities in the indexs and average. |
| ** | The S&P 500® is not adjusted to reflect sales charges, expenses or other fees that the SEC requires to be reflected in the Fund’s performance. The index is unmanaged and unlike the Fund, it is not affected by cash flows. It is not possible to invest directly in an index. |
| *** | Lipper figures represent the average of the total returns reported by all of the mutual funds designated by Lipper, Inc. as falling into the respective category indicated. These figures do not reflect sales charges. It is not possible to invest directly in an average. |
| Annual Report | December 31, 2018 | |
7 |
Management’s Discussion of Fund Performance
| WesMark Balanced Fund | December 31, 2018 (Unaudited) |
The WesMark Balanced Fund provided a total return of -4.58% for the year ended December 31, 2018 compared to the Lipper Balanced Fund Average of -5.52%, placing the Fund in the second quartile for the year. The Fund seeks to achieve capital appreciation and income by allocating its assets primarily among fixed income and equity securities. The asset allocation at year-end was 38.6% fixed income, 54.7% common equity, and 6.7% cash equivalents. The fixed income allocation was increased during the year as interest rates moved higher primarily in response to the actions of the Federal Reserve to normalize their interest rate policy. The Fund continued to maintain a relatively short fixed income structure with a modified duration of 3.58 years compared to the prior period duration of 4.50 years. All fixed income securities held in the Fund at year-end remained investment grade as determined by a Nationally Recognized Statistical Rating Organization. The largest exposure in the fixed income allocation was U.S. Corporate debt which provided a return for the Fund’s fixed income sector of 1.2% compared to the Lipper Core Bond Funds Index return of -0.69%. Taxable municipal bonds provided a return of 2.1% compared to the benchmark 1.3%. The Fund’s income structure remained in a position to benefit from a rising interest rate environment and a steeper yield curve. Interest rates did increase as the year progressed but the slope of the yield curve remained unusually flat. Four increases in the target Federal Funds rate drove short-term rates higher and a view of contained inflation caused intermediate and long-term rates to decline. As the year ended there was an inversion in the yield curve between one and three years with a positive slope as we extended our look farther along the curve. The rate spread between the 3 month Treasury bill and the 10 year Treasury note ended the year at 31 basis points compared to a 10 year average spread of 213 basis points. This flattening has caused concern regarding the sustainability of the current economic cycle.
The equity markets focus in 2018 remained on Growth in the first three quarters of the year at which time economic uncertainty, among other issues, brought a focus to value in an effort to reduce risk and volatility. Higher equity yields did receive competition from higher fixed income yields resulting in period of decline for those higher yield sectors including Utilities and Consumer Staples. Utilities managed to end the year with a positive total return of 4.11%. Deterioration in operating results drove the normally defensive Consumer Staples sector to a negative total return of -8.39%
Within the S&P 500, Value total return for the year was -8.97% compared to Growth total return of -0.01%. The Balanced Fund’s equity total return was -6.8% heavily impacted by the-9.2% return in December. The portfolio’s largest equity allocation was Information Technology and Healthcare with a bias to those companies having a current dividend and a history of increasing the dividend on a regular basis. Healthcare provided a positive absolute and relative contribution to the Fund’s return while Information Technology was negative in both absolute and relative terms. Positive contributions to the equity performance was driven by individual company contribution and not overall sector allocation. Boeing, Merck and Verizon led on the upside for the full year and Hanesbrands and Arthur J. Gallagher & Co. provided a positive contribution for the relatively short period that they were a part of the portfolio. AT&T Inc. underperformed rival Verizon with returns of -24.7% and 11.1%, respectively. Each has chosen a different path to participate in the rapidly changing telecommunication and content acquisition strategy with Verizon being viewed as the leader at this time. Lockheed Martin and United Parcel Service were notable negatives to performance. Lockheed Martin was damaged by Defense Department budget uncertainty and United Parcel Service has felt the margin pressure of rapidly growing demand on its infrastructure.
Higher available cash flow as a result of the Tax Cuts and Jobs Act brought dividend increases to a significant number of stocks held in the portfolio. This combined with share repurchases to enhance full year total return. While the year-over-year benefit of the tax changes will not repeat in 2019, the benefit of higher cash flow remains.
TOP 10 EQUITY HOLDINGS
| Security Name | % of Total Net Assets |
| Apple, Inc. | 4.0% |
| Pfizer, Inc. | 2.6% |
| AbbVie, Inc. | 2.3% |
| Cisco Systems, Inc. | 2.1% |
| Chevron Corp. | 2.0% |
| Discover Financial Services | 2.0% |
| DowDuPont, Inc. | 1.9% |
| Merck & Co., Inc. | 1.9% |
| Texas Instruments, Inc. | 1.9% |
| Amgen, Inc. | 1.8% |
| Total Net Assets | 22.5% |
| 8 | |
www.wesmarkfunds.com |
Management’s Discussion of Fund Performance
| December 31, 2018 (Unaudited) | WesMark Balanced Fund |
Also see Glossary of Terms on page 76.
Performance data quoted represents past performance which is no guarantee of future results.
An investment in the Funds involves risk, including loss of principal. Investment in the Funds is subject to investment risks, including, without limitation, market risk, credit risk, interest rate risk, risks related to ETF net asset value and market price, foreign securities risk, commodity risk, manager risks, risks of investing in real estate investment trust (REITs), and risks related to company size.
The views in this report were those of the Fund Managers as of the letter’s publication date and may not reflect his views on the date this letter is first distributed or anytime thereafter. These views are intended to assist readers in understanding the Fund’s investment methodology and do not constitute investment advice.
Lipper, Inc., a Reuters company, is a nationally recognized organization that ranks the performance of mutual funds within a universe of funds that have similar investment objectives. Rankings are historical and are based on total return with capital gains and dividends reinvested. For the 10-, 5-, 3-, and 1-year periods, the Balanced Fund was ranked 231 out of 431, 162 out of 511, 157 out of 544, and 182 out of 584 as of 12/31/18 in the Balanced Funds category. Lipper does not guarantee the accuracy of this information. Lipper rankings are not intended to predict future results.
| Annual Report | December 31, 2018 | |
9 |
Management’s Discussion of Fund Performance
| WesMark Balanced Fund | December 31, 2018 (Unaudited) |
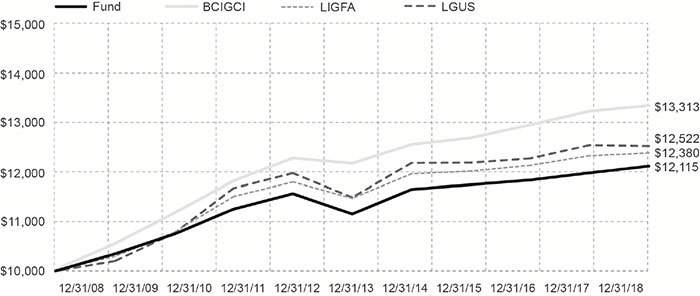
GROWTH of $10,000 invested in WesMark Balanced Fund
The graph below illustrates the hypothetical investment of $10,000* in the WesMark Balanced Fund (the “Fund”) from December 31, 2008 to December 31, 2018, compared to the Standard and Poor’s 500® Index (“S&P 500®”)**, the Barclays Capital Intermediate U.S. Government/Credit Index (“BCIGCI”)***, the Lipper Balanced Funds Average (“LBFA”) ††, and a combined index consisting of 60% S&P 500® and 40% BCIGCI (“Balanced Composite Index”)†.

AVERAGE ANNUAL TOTAL RETURN for the periods ended December 31, 2018
| 1 Year | 5 Years | 10 Years |
| -4.58% | 4.09% | 7.79% |
Total Annual Fund Operating Expense (as of most current Prospectus): 1.24%
Performance data quoted represents past performance which is no guarantee of future results. Investment return and principal value will fluctuate so that an investor’s shares, when redeemed, may be worth more or less than their original cost. Mutual fund performance changes over time and current performance may be lower or higher than what is stated. For current to the most recent month end performance and after-tax returns call 1-800-864-1013. Returns shown do not reflect the deduction of taxes that a shareholder would pay on Fund distributions or the redemption of Fund shares. Mutual funds are not obligations of or guaranteed by any bank and are not federally insured.
Bond prices are sensitive to changes in interest rates and a rise in interest rates can cause a decline in their prices.
| * | Represents a hypothetical investment of $10,000 in the Fund. The Fund’s performance assumes the reinvestment of all dividends and distributions. The S&P 500®, BCIGCI, LBFA, and Balanced Composite Index have been adjusted to reflect reinvestment of dividends on securities in the index and average. |
| ** | The S&P 500® is not adjusted to reflect sales charges, expenses or other fees that the SEC requires to be reflected in the Fund’s performance. The index is unmanaged and unlike the Fund, it is not affected by cash flows. It is not possible to invest directly in an index. |
| *** | The BCIGCI is not adjusted to reflect sales charges, expenses or other fees that the SEC requires to be reflected in the Fund’s performance. The BCIGCI is an unmanaged market value weighted performance index for government and corporate fixed rate debt issues with maturities between one and ten years. The index is unmanaged and unlike the Fund, is not affected by cash flows. It is not possible to invest directly in an index. |
| † | The Balanced Composite Index is not adjusted to reflect sales charges, expenses or other fees that the SEC requires to be reflected in the Fund’s performance. The Balanced Composite Index is an unmanaged index, comprised 60% S&P 500® and 40% BCIGCI, and unlike the Fund, is not affected by cash flows. It is not possible to invest directly in an index or average. |
| †† | Lipper figures represent the average of the total returns reported by all of the mutual funds designated by Lipper, Inc. as falling into the respective category indicated. These figures do not reflect sales charges. It is not possible to invest directly in an average. |
| 10 | |
www.wesmarkfunds.com |
Management’s Discussion of Fund Performance
| December 31, 2018 (Unaudited) | WesMark Government Bond Fund |
Global financial market volatility picked up in calendar year 2018 (the “report period”), pointing to investor anxiety of a more serious deterioration in global macroeconomic conditions. Overall, fixed income assets delivered unexceptional performance but still bested their equity brethren. The two main risk variables for fixed income securities of rising interest rates and widening credit spreads occurred simultaneously within the period.
The Federal Reserve is three years into a tightening monetary policy cycle, making this the second longest such cycle in the last 50 years. The average tightening cycle over this time period has been approximately 15 months. The Federal Reserve’s monetary policy is critical for the current business cycle. Out of the 12 previous US interest rate hike cycles since 1955, eight have resulted in a recession for the US economy. As 2018 progressed, the question became whether the Federal Reserve could normalize monetary policy without derailing domestic and international growth expectations.
Within the report period, the transition toward a less accommodative central bank stance and higher federal funds rate had lessened investors’ appetite for risk. The report period began with investor optimism, fueled by domestic tax cuts, expecting the US economy to continue its expansion despite a less accommodative central bank and also expecting the European Union to follow suit.
In the fourth quarter of 2018, uncertainty related to the direction of the Federal Reserve’s policy on interest rates, global and Chinese economic growth expectations, the outlook for corporate earnings, trade disputes and the ongoing federal government shutdown instilled a flight to quality. The flight to quality trade in the fourth quarter of 2018 induced a rally in Treasury prices, as the 10 year US Treasury Yield declined from a peak of 3.24% on November 8, 2018 to close 2018 at 2.69%, a 55 basis point rally. The yield on the 10 year US Treasury began the year at 2.41%. The overall bond market performance, as measured by the Bloomberg Barclays Aggregate Index provided a total return of 0.01% for the period, predominantly due to the late fourth quarter rate rally. Within the fixed income sector for 2018, the degree of relative performance was driven by credit quality. For the report period, the top performer was the three month US Treasury Bill at 1.96%, followed by the US Government Sponsored Agency Securities at 1.24% and short duration Mortgage Backed Securities at 1.01%. The 10 year US Treasury had a return of 0.85% for the period. The laggards were high yield debt at -2.11%, corporate debt -2.52% and emerging markets -4.15%. Credit risk assets underperformed due in part to a shift in investor sentiment following the fourth quarter decline in the equity markets as credit spreads widened relative to US Treasury securities.
The slope of the US yield curve flattened in 2018. Historically, as the Federal Open Market Committee raises short term interest rates, the yield curve flattens as short term rates rise more than longer term rates. The Federal Open Market Committee increased the Federal Funds rate with four 25 basis point moves in 2018 ending the period at 2.50%.
The yield on the 10 year US Treasury began 2018 at 2.40%, peaked at 3.24% on November 8, 2018 and ended the year at 2.68%. Within the fourth quarter of 2018 investors overestimated the resilience of global growth in the face of tighter domestic monetary policy, international headwinds and investor sentiment shifting from equity securities. In the fourth quarter of 2018, as macroeconomic conditions slowed, inflation expectations plummeted on a combination of Consumer Price Index (CPI) releases that were below expectations and a 37% decline in the price of oil. Changes in inflation had the largest impact on the short end of the yield curve. As the Federal Reserve maintained its policy of increasing short-term interest rates, while inflation remained below their 2% target rate, the short end of the yield curve inverted in the fourth quarter. At the end of the report period, the yield on the one year US Treasury was 2.59% and the yield on the three year US Treasury was 2.45%. The spread between the 2 year US Treasury and the 10 year US Treasury began the period at 52 basis points and ended the period at 20 basis points. During this time, the yield on the 2 year US Treasury increased 60 basis points while the yield on the 10 year US Treasury increased 28 basis points.
For 2018, non-farm payrolls increased on-average by 220,000 per month with an unemployment rate of 3.9% at the end of the report period as compared to 4.1% in December 2017. The labor force participation rate ended the period at 63.1% compared to 62.7% at the end of 2017. Real average hourly earnings increased 3.2% in the period as compared to 2.5% in the prior period. The rate of inflation, as measured by the Consumer Price Index, ended the reporting period at 1.9% compared to 0.1% at the end of the prior report period. Given economic headwinds, both domestically and internationally in the fourth quarter, inflation expectations declined approximately 50 basis points while real interest rates surged at the short end of the yield curve given the Federal Reserve continued tightening of interest rates. Core prices, which exclude food and energy, increased 2.2% in the period as compared to 0.3% the prior period. Within the period, energy prices declined 0.3% while food prices increased 1.6%.
The ISM Manufacturing Index ended 2018 on a relatively soft note at 54.1 as compared to the year ago level of 59.3. The ISM Non-Manufacturing Index was 57.6 at the end of the report period compared to 56.0 at the end of the prior report period, but below its November 2018 peak of 60.0. Total mortgage securities guaranteed by Fannie Mae and Freddie Mac represented 73% of the Fund as of December 31, 2018 as compared to 74% on December 31, 2017. Within the mortgage allocation, Fannie Mae and Freddie Mac guaranteed mortgage pools (MBS) comprised 11% with Collateralized Mortgage Obligations (CMO) comprising 62%. The average interest rate for the mortgage pools were 2.79% while the average interest rate for the CMO’s was 2.45%. US Treasury securities accounted for 5% of the portfolio with Small Business Administration securities accounting for 2%. Taxable municipal securities accounted for 20% of the portfolio and the average interest rate was 3.94%. Mortgage related securities within the fund had a total return of 1.7% compared to the Lipper US Government Mortgage Index return of 1.0%. Taxable municipal securities had a total return of 3.1% compared to the Lipper Intermediate Municipal Fund Index return of 1.1%.
| Annual Report | December 31, 2018 | |
11 |
Management’s Discussion of Fund Performance
| WesMark Government Bond Fund | December 31, 2018 (Unaudited) |
The WesMark Government Bond Fund provided a total return of 1.15% for the report period. The Lipper General US Government Fund Average return was -0.02% and the Barclay US Government/Credit Bond Index was -0.42% for the same period. The duration of the securities held in the fund was 5.0 years on December 31, 2018, compared to 5.1 years on December 31, 2017.
Entering 2018, expectations of increased Mortgage Backed Securities (MBS) supply, as the Federal Reserve began to reduce its $4.5 trillion balance sheet, dominated investor sentiment. Through the first three quarters of 2018 current coupon MBS spreads to the comparable US Treasury trended slightly upward. However, as interest rate volatility spiked in the fourth quarter, the spread widened and reached 98 basis points. Despite the widening of MBS spreads to the comparable US Treasury, MBS outperformed most fixed income asset classes during the year. MBS provided greater liquidity, a solid credit rating, and experienced strong foreign and domestic demand. As economic uncertainty developed in the fourth quarter and fundamental risks in credit sector assets increased, US Agency MBS provided strong relative performance. Within the report period, MBS had a positive return of 1.0%, outperforming investment grade corporate securities and high yield securities.
As the year came to a close and economic uncertainty and interest rate volatility increased, the short duration and high credit quality of the WesMark Government Bond fund enhanced its performance relative to its benchmark.
TOP 10 BOND HOLDINGS
| Name | Rate | Maturity | % of Total Net Assets |
| U.S. Treasury Bond US TREASURY N/B T 7 5/8 02/15/25 | 7.625% | DUE 2/15/2025 | 4.5% |
| Government National Mortgage Association GNR 2016-154 UP GNR 2016-154 UP | 3.000% | DUE 5/20/2045 | 2.8% |
| Government National Mortgage Association GNR 2014-25 PA GNR 2014-25 PA | 2.250% | DUE 1/20/2044 | 2.2% |
| Government National Mortgage Association GNR 2016-77 MB GNR 2016-77 MB | 2.000% | DUE 9/20/2045 | 2.2% |
| Fannie Mae REMICS FNR 2018-3 LD FNR 2018-3 LD | 3.000% | DUE 8/25/2046 | 2.0% |
| Fannie Mae REMICS FNR 2017-89 PL FNR 2017-89 PL | 3.000% | DUE 6/25/2043 | 2.0% |
| Government National Mortgage Association GNR 2005-26 ZA GNR 2005-26 ZA | 5.500% | DUE 1/20/2035 | 1.9% |
| Freddie Mac REMICS FHR 4629 QG FHR 4629 QG | 2.500% | DUE 11/15/2046 | 1.9% |
| Fannie Mae REMICS FNR 2012-134 AE FNR 2012-134 AE | 1.750% | DUE 7/25/2040 | 1.8% |
| Fannie Mae REMICS FNR 2016-90 DA FNR 2016-90 DA | 3.000% | DUE 8/25/2046 | 1.8% |
| Total Net Assets | 23.1% |
Also see Glossary of Terms on page 76.
Performance data quoted represents past performance which is no guarantee of future results.
An investment in the Funds involves risk, including loss of principal. Investment in the Funds is subject to investment risks, including, without limitation, market risk, credit risk, interest rate risk, risks related to ETF net asset value and market price, foreign securities risk, commodity risk, manager risks, risks of investing in real estate investment trust (REITs), and risks related to company size.
The views in this report were those of the Fund Managers as of the letter’s publication date and may not reflect his views on the date this letter is first distributed or anytime thereafter. These views are intended to assist readers in understanding the Fund’s investment methodology and do not constitute investment advice.
| 12 | |
www.wesmarkfunds.com |
Management’s Discussion of Fund Performance
| December 31, 2018 (Unaudited) | WesMark Government Bond Fund |
GROWTH of $10,000 invested in WesMark Government Bond Fund
The graph below illustrates the hypothetical investment of $10,000* in the WesMark Government Bond Fund (the “Fund”) from December 31, 2008 to December 31, 2018, compared to the Barclays Capital Intermediate U.S. Government/Credit Index (“BCIGCI”)**, the Lipper Intermediate U.S. Government Funds Average (“LIGFA”)***, and the Lipper General U.S. Government Funds Average (“LGUS”).***
AVERAGE ANNUAL TOTAL RETURN for the periods ended December 31, 2018
| 1 Year | 5 Years | 10 Years |
| 1.15% | 1.67% | 1.94% |
Total Annual Fund Operating Expense (as of most current Prospectus): 1.00%
Performance data quoted represents past performance which is no guarantee of future results. Investment return and principal value will fluctuate so that an investor’s shares, when redeemed, may be worth more or less than their original cost. Mutual fund performance changes over time and current performance may be lower or higher than what is stated. For current to the most recent month end performance and after-tax returns call 1-800-864-1013. Returns shown do not reflect the deduction of taxes that a shareholder would pay on Fund distributions or the redemption of Fund shares. Mutual funds are not obligations of or guaranteed by any bank and are not federally insured.
Bond prices are sensitive to changes in interest rates and a rise in interest rates can cause a decline in their prices. The value of some mortgage-backed securities may be particularly sensitive to changes in prevailing interest rates, and although the securities are generally supported by some form of government or private insurance, there is no assurance that private guarantors or insurers will meet their obligations.
| * | Represents a hypothetical investment of $10,000 in the Fund. The Fund’s performance assumes the reinvestment of all dividends and distributions. The BCIGCI, LIGFA and the LGUS have been adjusted to reflect reinvestment of dividends on securities in the index and averages. |
| ** | The BCIGCI is an unmanaged market value weighted performance index for government and corporate fixed rate debt issues with maturities between one and ten years. BCIGCI is not adjusted to reflect sales charges, expenses, or other fees that the SEC requires to be reflected in the Fund’s performance. The index is unmanaged and unlike the Fund, is not affected by cash flows. It is not possible to invest directly in an index. |
| *** | Lipper figures represent the average of the total returns reported by all of the mutual funds designated by Lipper, Inc. as falling into the respective categories indicated. These figures do not reflect sales charges. It is not possible to invest directly in an average. |
| Annual Report | December 31, 2018 | |
13 |
Management’s Discussion of Fund Performance
| WesMark West Virginia Municipal Bond Fund | December 31, 2018 (Unaudited) |
The Tax Cuts and Jobs Act of 2017 (TCJA) set the stage for the municipal market in 2018. By eliminating the use of tax- free municipal bonds to advance refund outstanding debt, Congress effectively reduced new municipal issue supply. The TCJA also reduced demand for municipal tax- free debt due to the reduction in the corporate income tax rate from 35% to 21%, limiting the incentive for bank and insurance companies to own municipal bonds. New municipal debt issuance for 2018 was $329.2 billion, down 20% from the 2017 level of $411 billion. Advanced refunding issuance declined more than 50% for the year, as compared to 2017. In 2018, retail investors focused on the shorter end of the municipal yield curve with maturities of 10 years or less, while institutional demand was negative on the longer end of the municipal yield curve as institutional investors reduced holdings by $25 billion year-over-year.
West Virginia’s economy, after a period of decline, has returned to a period of economic growth driven by the energy markets and the contribution from natural gas and a stabilization of the coal industry. Employment increases in the service sectors have provided an offset to job losses in other industries resulting in a notable decline in the state’s unemployment rate. The state of West Virginia’s unemployment rate at the end of 2018 was 5.1%, a decline of 0.3% from the December 2017 unemployment rate of 5.4%.
West Virginia’s Gross Domestic Product has begun to increase. Natural gas markets benefit from an ongoing buildout of the pipeline network moving an abundance of natural gas and natural gas byproducts to markets where demand and pricing is stronger. Exports are an important part of West Virginia’s economy and are not limited to energy but include chemicals, machinery, and auto components, among others.
In 2018, there was limited issuance of West Virginia municipal securities, with three competitive issues and 26 negotiated transactions. In May 2018, the State of West Virginia sold two series of general obligation bonds for highways totaling approximately $632 million. This was the largest competitive sale for the state and the second largest sale on record. The negotiated calendar was heavily weighted towards health care with Cabell General Hospital issuing $240 million and the United Group, led by West Virginia University Medical Center, issuing $218 million. The West Virginia Parkway Authority issued $166 million.
In 2017, Moody’s Investors Service downgraded the State of West Virginia’s general obligation debt to Aa2 from Aa1. Within the current report period, the state took steps to improve its credit worthiness. For example, Moody’s Investor Service noted the state maintained a healthy liquidity position, which can provide financial flexibility to weather a slower than expected economic rebound. In addition, Standard and Poor’s noted that the state made progress in addressing its underfunded pension liabilities.
The Federal Reserve is three years into a tightening monetary policy cycle, making this the second longest tightening cycle in the last 50 years. The average tightening cycle over this time period has been approximately 15 months. Of the 12 previous US interest rate hike cycles since 1955, eight have resulted in a recession for the US economy. As 2018 progressed, the market questioned whether the Federal Reserve could normalize monetary policy without derailing domestic and international growth expectations.
Within the report period, as the Federal Reserve continued its policy of increasing short -term interest rates, the US Treasury yield curve flattened with short- term interest rates increasing more than longer term interest rates. The municipal bond yield curve did not flatten to the same degree as the US Treasury yield curve within the period, as individual investor demand for short maturity securities increased while institutional demand for longer dated maturities waned. The spread between the 2 year municipal bond and the 15 year municipal bond ended the report period at 79 basis points while the spread between the 2 year US Treasury and the 15 year US Treasury ended the period at 26 basis points. The ratio of the Thomson Reuters Municipal Market Data (MMD) AAA rated municipal yield compared to the comparable US Treasury yield is an industry barometer used to evaluate the relative value of AAA rated municipal securities compared to the comparable US Treasury. The 10 year MMD AAA rated municipal yield to the 10- year US Treasury yield ratio began the report period at 82% and ended the report period at 85%. The 2 year MMD AAA rated municipal yield to the 2- year US Treasury yield ratio began the period at 80% and ended the report period at 70%. Within the report period, as individual investors demand for short term municipal securities increased and institutional investors demand for longer dated municipal securities declined, shorter term municipal bonds performed well relative to longer term municipal bonds and appreciated in value relative to their US Treasury counterparts.
The WesMark West Virginia Municipal Bond Fund had a total return of 0.47% in 2018. The Fund’s benchmark, the Barclays Municipal Bond 5 year index total return was 1.69% for the report period and the Lipper Other States Municipal Debt Fund average was 0.68%. The duration of the fund was 4.1 years as of December 31, 2018, as compared to 4.5 years on December 31, 2017. The net investment income dividend (excluding capital gain distribution) was $0.21 per share for the report period compared to $0.21 per share for the prior report period. Approximately 97.63% of the dividend was derived from West Virginia Municipal Securities and was exempt from federal and state income tax for West Virginia residents. The portfolio did not contain any securities subject to Alternative Minimum Tax. At the end of the report period, 85% of the portfolio securities were BBB rated or higher with 5% rated AAA. The securities within the fund had an average maturity of 8.25 years, which exceeded the Barclay Municipal 5 Year Index. The funds longer average maturity structure limited its performance relative to the benchmark, as municipal credit spreads relative to US Treasuries widened to a greater degree on longer dated maturities.
| 14 | |
www.wesmarkfunds.com |
Management’s Discussion of Fund Performance
| December 31, 2018 (Unaudited) | WesMark West Virginia Municipal Bond Fund |
TOP 10 BOND HOLDINGS
| Name | % of Total Net Assets |
| Preston County Board of Education General Obligation Unlimited Bonds | 3.2% |
| West Virginia Building Commission Lease Revenue Bonds (West Virginia Regional Jail) | 2.8% |
| West Virginia Water Development Authority Infrastructure Revenue Bonds (West Virginia Infrastructure Jobs Program) | 2.6% |
| West Virginia Building Commission Lease Revenue Bonds (West Virginia Regional Jail) | 2.3% |
| West Virginia Higher Education Policy Commission Revenue Bonds (Higher Education Facilities) | 1.7% |
| West Virginia Economic Development Authority Lease Revenue Bonds (Correctional Juvenile & Public) | 1.6% |
| Parkersburg, West Virginia, Waterworks & Sewer System Revenue Bonds | 1.6% |
| Hampshire County, West Virginia, Building Commission Revenue Bonds | 1.5% |
| West Virginia Economic Development Authority Lease Revenue Bonds (State Office Building & Parking Lot) | 1.5% |
| West Virginia Economic Development Authority Lease Revenue Bonds (State Office Building) | 1.5% |
| Total Net Assets | 20.3% |
Also see Glossary of Terms on page 76.
Performance data quoted represents past performance which is no guarantee of future results.
An investment in the Funds involves risk, including loss of principal. Investment in the Funds is subject to investment risks, including, without limitation, market risk, credit risk, interest rate risk, risks related to ETF net asset value and market price, foreign securities risk, commodity risk, manager risks, risks of investing in real estate investment trust (REITs), and risks related to company size.
The views in this report were those of the Fund Managers as of the letter’s publication date and may not reflect his views on the date this letter is first distributed or anytime thereafter. These views are intended to assist readers in understanding the Fund’s investment methodology and do not constitute investment advice.
| Annual Report | December 31, 2018 | |
15 |
Management’s Discussion of Fund Performance
| WesMark West Virginia Municipal Bond Fund | December 31, 2018 (Unaudited) |
GROWTH of $10,000 invested in WesMark West Virginia Municipal Bond Fund
The graph below illustrates the hypothetical investment of $10,000* in the WesMark West Virginia Municipal Bond Fund (the “Fund”) from December 31, 2008 to December 31, 2018, compared to the Barclays Capital Municipal Bond 5 Year Total Return Index (“BCM5I”)** and the Lipper Intermediate Municipal Debt Funds Average (“LIMDFA”).***
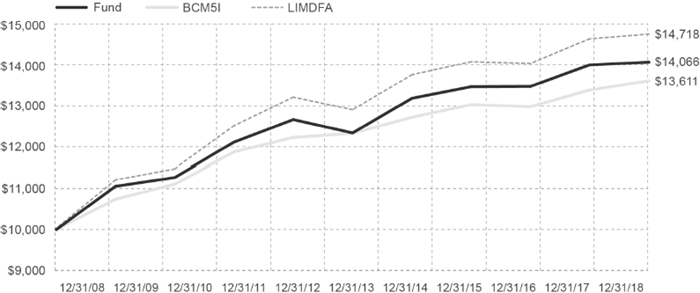
AVERAGE ANNUAL TOTAL RETURN for the periods ended December 31, 2018
| 1 Year | 5 Years | 10 Years |
| 0.47% | 2.66% | 3.47% |
Total Annual Fund Operating Expense (as of most current Prospectus): 1.08%
Performance data quoted represents past performance which is no guarantee of future results. Investment return and principal value will fluctuate so that an investor’s shares, when redeemed, may be worth more or less than their original cost. Mutual fund performance changes over time and current performance may be lower or higher than what is stated. For current to the most recent month end performance and after-tax returns call 1-800-864-1013. Returns shown do not reflect the deduction of taxes that a shareholder would pay on Fund distributions or the redemption of Fund shares. Mutual funds are not obligations of or guaranteed by any bank and are not federally insured.
Bond prices are sensitive to changes in interest rates and a rise in interest rates can cause a decline in their prices.
| * | Represents a hypothetical investment of $10,000 in the Fund. The Fund’s performance assumes the reinvestment of all dividends and distributions. The BCM5I and the LIMDFA have been adjusted to reflect reinvestment of dividends on securities in the index and average. |
| ** | The BCM5I is an unmanaged market value weighted performance index for major municipal bonds of all quality ratings with an average maturity of approximately five years. BCM5I is not adjusted to reflect sales charges, expenses, or other fees that the SEC requires to be reflected in the Fund’s performance. The index is unmanaged and unlike the Fund, is not affected by cash flows. It is not possible to invest directly in an index. |
| *** | Lipper figures represent the average of the total returns reported by all of the mutual funds designated by Lipper, Inc. as falling into the respective category indicated. These figures do not reflect sales charges. It is not possible to invest directly in an average. |
| 16 | |
www.wesmarkfunds.com |
Management’s Discussion of Fund Performance
| December 31, 2018 (Unaudited) | WesMark Tactical Opportunity Fund |
We began 2018 with an allocation to equity markets that was slightly below the upper end of our range. In addition, the fixed income allocation was slightly below our neutral allocation. Within the fixed income allocation we had a larger exposure to short-term and floating rate debt. Our view was that the Federal Reserve would continue to increase rates, particularly if employment trends persisted. Our equity holdings had larger allocations to more cyclical sectors, such as Consumer Discretionary and Information Technology sectors. Our reasoning was that the changes to corporate and personal tax rates would help boost domestic consumption. While optimistic, we were guarded given the strong run equity markets had, thus we wrote a number of call options on existing positions which has the effect of capping the gains in the securities in exchange for a premium payment from a counterparty. As equity markets suffered their largest decline in over a year in late January and early February, we added to our equity positions. We felt the selloff was not driven by changes in the underlying fundamentals. At such time we felt that domestic economic growth would likely accelerate in the following quarters and a number of our leading economic indicators were pointing to improving economic conditions. As equity markets recovered a number of our equity positions subject to written call options were called away. As a result, we saw our cash position increase.
As we began the second quarter, we felt that higher quality names would benefit from the expected economic and market conditions. In addition, some of our work in the alternative investment space brought to our attention the CBOE PutWrite Index. Over a thirty year period, this index has generated slightly higher annualized returns with lower standard deviations, relative to other equity and covered call portfolios. Also, our view was for equity market volatility to be more in line with historical averages, rather than what was experienced in 2017. As a result, we sought ways to reduce our volatility while maintaining our equity market exposure. Thus, we build a position in an ETF that tracks the above mentioned Index.
Our strategy held for most of the second and third quarters. However, as equity markets recovered and the number of economic headwinds increased, we moved to be more in line with our neutral weights. The equity holdings also shifted to income more defensive sectors like Health Care and Consumer Staples and value focused holdings. In addition, we used a number of written call options to help hedge our holdings. Within our fixed income holdings we increased the duration to be more in line with the overall benchmark, as rates moved closer to 3%. We still maintained a sizable position in floating rate bonds, as the Federal Reserve continued to suggest they would increase short term rates in upcoming meetings.
Equity markets reached their near-term peak toward the end of the third quarter. At that point the ongoing rhetoric regarding trade and tariffs with China, concerns regarding slowing economic and earnings growth lead many investors to reassess their risk tolerance. However, based on our view of economic conditions we remained steadfast in our allocations. The equity position in the Fund remained at our neutral target, with modest international exposure and domestic holdings that were more defensive. Within our alternative strategies we held our PutWrite holding, a Long/Short equity position and a smaller allocation to gold. With fixed yields closer to 3.2%, our floating rate allocation performed well, but we were slightly early on intermediate duration bonds. Returns on a year-to-date basis were positive, and we remained well above our Lipper category average return. However, equity markets dropped in October as trade and tariff issues accelerated. Markets recovered modestly in November as there was a temporary stay in increased tariffs. In the interim, we used the cash to increase equites that declined. Within fixed income we closed out our floating rate allocation, instead adding to fixed rate, intermediate term duration holdings. It was our belief that the Federal Reserve would soon paused its path of rate hikes.
As we closed out 2018, we slightly increased our fixed income holdings and remained slightly above the neutral target. Our equity allocation remained primarily domestic focused with a preference for quality, value and defensive positions. Cash remained a little higher, as we remained focused on using pullbacks to add to holdings.
Since the Fund’s inception, March 1, 2017, the WesMark Tactical Opportunity Fund posted a total return of 2.7%. That compared to the MSCI All World Index of 6.4% and the U.S. BarCap Aggregate Bond Index of 3.2% for same period. Since inception period, our Tactical Composite Index, consisting of 60% MSCI All World Index, 30% U.S. BarCap Aggregate Bond Index and 10% HFRI Fund of Funds Composite Index posted a return of 4.9%. For 2018, the WesMark Tactical Opportunity Fund return was -5.2%, compared to the Lipper Flexible Portfolio category’s return of -7.23%.
For the year, several of our industry specific holdings posted solid returns. Our decision to focus on global technology and internet-focuses holdings, iShares Global Technology ETF (+27.1%) and First Trust Dow Jones Internet Index ETF (+27.2%) helped performance during the period. The S&P 500 Health Care Index was one of the best performing sectors for the year. As a result, our iShares US Medical Devices ETF (+15.4%) and the SPDR Health Care ETF (+4.1%) helped performance for the year. The majority of our holdings that posted positive returns for 2018 were in the fixed income and non-traditional asset classes. As the yields on the 10-year Treasury moved closer to 3%, we modified our fixed income allocation to include more intermediate duration holdings. The Vanguard Total Bond Market ETF rose 1.9% during our holding period. Our positions in the U.S. dollar and gold related products also added to our returns for the year, while the diversified commodity ETF gained 5.8% for the holding period. Several of our largest underperforming holdings were offset by options written on the positions or used to offset gains.
Our top ten holdings accounted for 82.1% of the overall market value of the Fund. The average performance for these holdings were mixed for 2018, with four of the top ten posting positive returns.
| Annual Report | December 31, 2018 | |
17 |
Management’s Discussion of Fund Performance
| WesMark Tactical Opportunity Fund | December 31, 2018 (Unaudited) |
TOP 10 EQUITY HOLDINGS
| Security Name | % of Total Net Assets |
| SPDR® S&P 500® ETF Trust | 17.3% |
| Vanguard® Total Bond Market ETF | 16.8% |
| Vanguard® Mega Cap Value ETF | 12.0% |
| iShares® Floating Rate Bond ETF | 10.6% |
| iShares® Core U.S. Aggregate Bond ETF | 5.4% |
| iShares® Edge MSCI USA Quality Factor ETF | 4.9% |
| Health Care Select Sector SPDR® Fund | 4.6% |
| Consumer Staples Select Sector SPDR Fund | 4.6% |
| SPDR® Gold Shares | 3.0% |
| iShares® Russell 2000® ETF | 2.9% |
| Total Net Assets | 82.1% |
Also see Glossary of Terms on page 76.
Performance data quoted represents past performance which is no guarantee of future results.
An investment in the Funds involves risk, including loss of principal. Investment in the Funds is subject to investment risks, including, without limitation, market risk, credit risk, interest rate risk, risks related to ETF net asset value and market price, foreign securities risk, commodity risk, manager risks, risks of investing in real estate investment trust (REITs), and risks related to company size.
The views in this report were those of the Fund Managers as of the letter’s publication date and may not reflect his views on the date this letter is first distributed or anytime thereafter. These views are intended to assist readers in understanding the Fund’s investment methodology and do not constitute investment advice.
| 18 | |
www.wesmarkfunds.com |
Management’s Discussion of Fund Performance
| December 31, 2018 (Unaudited) | WesMark Tactical Opportunity Fund |
GROWTH of $10,000 invested in WesMark Tactical Opportunity Fund
The graph below illustrates the hypothetical investment of $10,000* in the WesMark Tactical Opportunity Fund (the “Fund”) from March 1, 2017 to December 31, 2018, compared to the Tactical Composite Index (“Composite”)**, the Morgan Stanley Capital International All Country World Index (“MSCI ACWI”)***, and the Barclays US Aggregate Index (“US BarCap Agg”).****
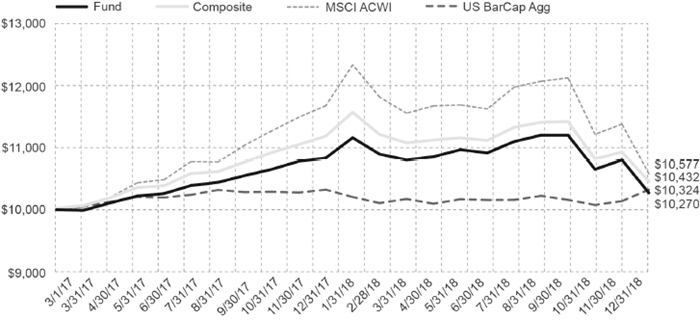
AVERAGE ANNUAL TOTAL RETURN for the periods ended December 31, 2018
| 1 Year | Since Inception (3/1/17) |
| -5.20% | 1.46% |
Total Annual Fund Operating Expense (as of most current Prospectus): 2.24%
Total Annual Fund Operating Expense After Fee Waiver (as of most current Prospectus): 2.01%
Performance data quoted represents past performance which is no guarantee of future results. Investment return and principal value will fluctuate so that an investor’s shares, when redeemed, may be worth more or less than their original cost. Mutual fund performance changes over time and current performance may be lower or higher than what is stated. For current to the most recent month end performance and after-tax returns call 1-800-864-1013. Returns shown do not reflect the deduction of taxes that a shareholder would pay on Fund distributions or the redemption of Fund shares. Mutual funds are not obligations of or guaranteed by any bank and are not federally insured.
Bond prices are sensitive to changes in interest rates and a rise in interest rates can cause a decline in their prices.
| * | Represents a hypothetical investment of $10,000 in the Fund. The Fund’s performance assumes the reinvestment of all dividends and distributions. The Composite, the MSCI ACWI and the US BarCap Agg have been adjusted to reflect reinvestment of dividends on securities in the index and average. |
| ** | The Tactical Composite Index is comprised of a combination of 60% MSCI ACWI, 30% Barclays US Aggregate Index and 10% HFRI Fund^ of Funds Composite Index. |
| *** | The MSCI ACWI is a market capitalization weighted index designed to provide a broad measure of equity market performance throughout the world and is comprised of stocks from both developed and emerging markets. |
| **** | The US BarCap Agg measures the performance of the U.S. investment grade bond market. |
| ^ | The Hedge Fund Research, Inc. (HFRI) Fund of Funds Composite Index is an equal weighted index that consists of over 800 constituent hedge funds, including both domestic and offshore funds. |
| Annual Report | December 31, 2018 | |
19 |
Portfolio of Investments Summary Table
| WesMark Small Company Growth Fund | December 31, 2018 (Unaudited) |
At December 31, 2018, the Fund's Portfolio Composition(1) was as follows:
| Portfolio Composition | Percentage of Total Net Assets |
| COMMON STOCKS | 96.2% |
| SHORT TERM INVESTMENTS(2) | 0.2% |
| OTHER ASSETS AND LIABILITIES - NET(3) | 3.6% |
| TOTAL NET ASSETS | 100.0% |
At December 31, 2018, the Fund's Sector composition(4) was as follows:
| Sector Composition | Percentage of Total Net Assets |
| Health Care | 23.7% |
| Industrials | 23.8% |
| Information Technology | 22.8% |
| Financials | 13.2% |
| Consumer Discretionary | 8.6% |
| Consumer Staples | 1.9% |
| Materials | 1.1% |
| Energy | 1.1% |
| Equity Portfolio Sub-Total | 96.2% |
| Short Term Investments(2) | 0.2% |
| Other Assets and Liabilities - Net(3) | 3.6% |
| Total Net Assets | 100.0% |
| (1) | See the Fund's Prospectus and Statement of Additional Information for a description of the types of securities in which the Fund invests. |
| (2) | Short Term Investments include investment in a money market mutual fund. |
| (3) | Assets, other than investments in securities, less liabilities. |
| (4) | Securities are assigned to a sector classification by the Fund's advisor. |
| 20 | |
www.wesmarkfunds.com |
Portfolio of Investments
| December 31, 2018 | WesMark Small Company Growth Fund |
| Shares/Principal Amount | Value | |||||||
| COMMON STOCKS-96.2% | ||||||||
| CONSUMER DISCRETIONARY-8.6% | ||||||||
| Apparel Retail-2.6% | ||||||||
| 40,000 | Foot Locker, Inc. | $ | 2,128,000 | |||||
| Automotive Retail-1.8% | ||||||||
| 18,767 | Lithia Motors, Inc., Class A | 1,432,485 | ||||||
| Education Services-2.0% | ||||||||
| 58,608 | Chegg, Inc.(1) | 1,665,639 | ||||||
| Home Furnishing & Retail-1.0% | ||||||||
| 26,919 | Sleep Number Corp.(1) | 854,140 | ||||||
| Specialized Consumer Services-0.7% | ||||||||
| 14,228 | Weight Watchers International, Inc.(1) | 548,489 | ||||||
| Specialty Stores-0.5% | ||||||||
| 27,959 | Michaels Cos., Inc.(1) | 378,565 | ||||||
| TOTAL CONSUMER DISCRETIONARY | 7,007,318 | |||||||
| CONSUMER STAPLES-1.9% | ||||||||
| Packaged Foods & Meats-1.9% | ||||||||
| 23,989 | Freshpet, Inc.(1) | 771,486 | ||||||
| 42,968 | Simply Good Foods Co.(1) | 812,095 | ||||||
| 1,583,581 | ||||||||
| TOTAL CONSUMER STAPLES | 1,583,581 | |||||||
| ENERGY-1.1% | ||||||||
| Oil & Gas Exploration & Production-1.1% | ||||||||
| 45,575 | EQT Corp. | 860,912 | ||||||
| TOTAL ENERGY | 860,912 | |||||||
| FINANCIALS-13.2% | ||||||||
| Asset Management & Custody Banks-0.8% | ||||||||
| 61,132 | Victory Capital Holdings, Inc., Class A(1) | 624,769 | ||||||
| Insurance Brokers-0.7% | ||||||||
| 22,116 | Health Insurance Innovations, Inc., Class A(1) | 591,161 | ||||||
| Investment Banking & Brokerage-2.3% | ||||||||
| 45,541 | Stifel Financial Corp. | 1,886,308 | ||||||
| Shares/Principal Amount | Value | |||||||
| Life & Health Insurance-1.1% | ||||||||
| 34,337 | Trupanion, Inc.(1) | $ | 874,220 | |||||
| Regional Banks-8.3% | ||||||||
| 23,345 | BancorpSouth Bank | 610,238 | ||||||
| 16,169 | Banner Corp. | 864,718 | ||||||
| 29,682 | Cadence BanCorp | 498,064 | ||||||
| 29,614 | CenterState Bank Corp. | 623,079 | ||||||
| 33,762 | First Bancorp/Southern Pines, NC | 1,102,667 | ||||||
| 20,474 | Franklin Financial Network, Inc.(1) | 539,899 | ||||||
| 34,078 | Fulton Financial Corp. | 527,527 | ||||||
| 52,504 | Old National Bancorp | 808,562 | ||||||
| 9,400 | Pinnacle Financial Partners, Inc. | 433,340 | ||||||
| 28,160 | Trustmark Corp. | 800,589 | ||||||
| 6,808,683 | ||||||||
| TOTAL FINANCIALS | 10,785,141 | |||||||
| HEALTH CARE-23.7% | ||||||||
| Biotechnology-0.7% | ||||||||
| 23,517 | CareDx, Inc.(1) | 591,217 | ||||||
| Health Care Equipment-5.7% | ||||||||
| 33,228 | Hill-Rom Holdings, Inc. | 2,942,339 | ||||||
| 29,846 | Integra LifeSciences Holdings Corp.(1) | 1,346,055 | ||||||
| 28,010 | Misonix, Inc.(1) | 448,440 | ||||||
| 4,736,834 | ||||||||
| Health Care Supplies-1.9% | ||||||||
| 22,218 | Neogen Corp.(1) | 1,266,426 | ||||||
| 121,156 | Senseonics Holdings, Inc.(1) | 313,794 | ||||||
| 1,580,220 | ||||||||
| Health Care Technology-8.5% | ||||||||
| 331,486 | Allscripts Healthcare Solutions, Inc.(1) | 3,195,525 | ||||||
| 9,160 | athenahealth, Inc.(1) | 1,208,479 | ||||||
| 14,599 | Teladoc Health, Inc.(1) | 723,672 | ||||||
| 46,063 | Vocera Communications, Inc.(1) | 1,812,579 | ||||||
| 6,940,255 | ||||||||
| Life Sciences Tools & Services-6.9% | ||||||||
| 14,284 | Charles River Laboratories International, Inc.(1) | 1,616,663 | ||||||
| 13,595 | ICON PLC(1) | 1,756,610 | ||||||
| 55,062 | Syneos Health, Inc.(1) | 2,166,690 | ||||||
| 5,539,963 | ||||||||
| TOTAL HEALTH CARE | 19,388,489 | |||||||
| Annual Report | December 31, 2018 | |
21 |
Portfolio of Investments
| WesMark Small Company Growth Fund | December 31, 2018 |
| Shares/Principal Amount | Value | |||||||
| INDUSTRIALS-23.8% | ||||||||
| Aerospace & Defense-7.2% | ||||||||
| 62,330 | Hexcel Corp. | $ | 3,574,002 | |||||
| 29,246 | Moog, Inc., Class A | 2,265,980 | ||||||
| 5,839,982 | ||||||||
| Air Freight & Logistics-1.7% | ||||||||
| 32,120 | Atlas Air Worldwide Holdings, Inc.(1) | 1,355,143 | ||||||
| Airlines-1.8% | ||||||||
| 14,650 | Allegiant Travel Co. | 1,468,223 | ||||||
| Building Products-5.7% | ||||||||
| 44,987 | AAON, Inc. | 1,577,244 | ||||||
| 14,065 | Lennox International, Inc. | 3,078,266 | ||||||
| 4,655,510 | ||||||||
| Construction & Engineering-4.1% | ||||||||
| 109,810 | Quanta Services, Inc. | 3,305,281 | ||||||
| Heavy Electrical Equipment-0.8% | ||||||||
| 26,175 | TPI Composites, Inc.(1) | 643,382 | ||||||
| Trading Companies & Distributors-1.4% | ||||||||
| 11,414 | United Rentals, Inc.(1) | 1,170,277 | ||||||
| Trucking-1.1% | ||||||||
| 18,411 | Ryder System, Inc. | 886,490 | ||||||
| TOTAL INDUSTRIALS | 19,324,288 | |||||||
| INFORMATION TECHNOLOGY-22.8% | ||||||||
| Application Software-2.8% | ||||||||
| 106,869 | Hortonworks, Inc.(1) | 1,541,051 | ||||||
| 37,716 | LivePerson, Inc.(1) | 711,324 | ||||||
| 2,252,375 | ||||||||
| Data Processing & Outsourced Services-2.1% | ||||||||
| 71,206 | I3 Verticals, Inc., Class A(1) | 1,716,065 | ||||||
| Electronic Equipment & Instruments-1.6% | ||||||||
| 17,549 | OSI Systems, Inc.(1) | 1,286,342 | ||||||
| Internet Software & Services-0.9% | ||||||||
| 67,622 | Quotient Technology, Inc.(1) | 722,203 | ||||||
| Semiconductors-4.7% | ||||||||
| 78,985 | Integrated Device Technology, Inc.(1) | 3,825,244 | ||||||
| Shares/Principal Amount | Value | |||||||
| Systems Software-6.3% | ||||||||
| 74,010 | FireEye, Inc.(1) | $ | 1,199,702 | |||||
| 7,336 | Proofpoint, Inc.(1) | 614,830 | ||||||
| 14,993 | Qualys, Inc.(1) | 1,120,577 | ||||||
| 28,401 | Rapid7, Inc.(1) | 884,975 | ||||||
| 5,923 | Tableau Software, Inc., Class A(1) | 710,760 | ||||||
| 11,220 | Varonis Systems, Inc.(1) | 593,538 | ||||||
| 5,124,382 | ||||||||
| Technology Distributors-0.9% | ||||||||
| 9,232 | SYNNEX Corp. | 746,315 | ||||||
| Technology Hardware, Storage & Peripherals-3.5% | ||||||||
| 175,634 | Pure Storage, Inc., Class A(1) | 2,824,195 | ||||||
| TOTAL INFORMATION TECHNOLOGY | 18,497,121 | |||||||
| MATERIALS-1.1% | ||||||||
| Forest Products-1.1% | ||||||||
| 40,500 | Louisiana-Pacific Corp. | 899,910 | ||||||
| TOTAL MATERIALS | 899,910 | |||||||
| TOTAL COMMON STOCKS | ||||||||
| (Cost 59,219,492) | 78,346,760 | |||||||
| SHORT TERM INVESTMENTS-0.2% | ||||||||
| Mutual Funds-0.2% | ||||||||
| 138,321 | Federated Government Obligations Fund 7-Day Yield 2.264% (at net asset value) | 138,321 | ||||||
| TOTAL SHORT TERM INVESTMENTS | ||||||||
| (Cost $138,321) | 138,321 | |||||||
| TOTAL INVESTMENTS-96.4% | ||||||||
| (Cost $59,357,813) | 78,485,081 | |||||||
| OTHER ASSETS AND LIABILITIES-NET(2)-3.6% | 2,953,624 | |||||||
| NET ASSETS-100.0% | $ | 81,438,705 | ||||||
| (1) | Non-income producing security. |
| (2) | Assets, other than investments in securities, less liabilities. |
| Note - | The categories of investments are shown as a percentage of net assets at December 31, 2018. |
See Notes to Financial Statements which are an integral part of the Financial Statements.
| 22 | |
www.wesmarkfunds.com |
Portfolio of Investments Summary Table
| December 31, 2018 (Unaudited) | WesMark Growth Fund |
At December 31, 2018, the Fund's Portfolio Composition(1) was as follows:
| Portfolio Composition | Percentage of Total Net Assets |
| COMMON STOCKS | 87.4% |
| EXCHANGE TRADED FUNDS | 4.6% |
| SHORT TERM INVESTMENTS(2) | 4.1% |
| OTHER ASSETS AND LIABILITIES - NET(3) | 3.9% |
| TOTAL NET ASSETS | 100.0% |
At December 31, 2018, the Fund's Sector composition(4) was as follows:
| Sector Composition | Percentage of Total Net Assets |
| Information Technology | 26.4% |
| Health Care | 22.3% |
| Consumer Discretionary | 13.9% |
| Financials | 10.7% |
| Industrials | 9.4% |
| U.S. Sector Focused Equity | 3.1% |
| Consumer Staples | 3.1% |
| Materials | 1.6% |
| Exchange Traded Funds | 1.5% |
| Equity Portfolio Sub-Total | 92.0% |
| Short Term Investments(2) | 4.1% |
| Other Assets and Liabilities - Net(3) | 3.9% |
| Total Net Assets | 100.0% |
| (1) | See the Fund's Prospectus and Statement of Additional Information for a description of the types of securities in which the Fund invests. |
| (2) | Short Term Investments include investment in a money market mutual fund. |
| (3) | Assets, other than investments in securities, less liabilities. |
| (4) | Securities are assigned to a sector classification by the Fund's advisor. |
| Annual Report | December 31, 2018 | |
23 |
Portfolio of Investments
| WesMark Growth Fund | December 31, 2018 |
| Shares/Principal Amount | Value | |||||||
| COMMON STOCKS-87.4% | ||||||||
| CONSUMER DISCRETIONARY-13.9% | ||||||||
| Apparel Retail-1.1% | ||||||||
| 20,000 | Burlington Stores, Inc.(1) | $ | 3,253,400 | |||||
| General Merchandise Stores-2.2% | ||||||||
| 69,000 | Dollar Tree, Inc.(1) | 6,232,080 | ||||||
| Home Improvement Retail-2.0% | ||||||||
| 34,000 | Home Depot, Inc. | 5,841,880 | ||||||
| Internet & Direct Marketing Retail-5.4% | ||||||||
| 10,250 | Amazon.com, Inc.(1) | 15,395,192 | ||||||
| Movies & Entertainment-2.3% | ||||||||
| 60,000 | Walt Disney Co. | 6,579,000 | ||||||
| Restaurants-0.9% | ||||||||
| 50,000 | Restaurant Brands International, Inc. | 2,615,000 | ||||||
| TOTAL CONSUMER DISCRETIONARY | 39,916,552 | |||||||
| CONSUMER STAPLES-3.1% | ||||||||
| Distillers & Vintners-2.0% | ||||||||
| 36,000 | Constellation Brands, Inc., Class A | 5,789,520 | ||||||
| Packaged Foods & Meats-1.1% | ||||||||
| 75,000 | Mondelez International, Inc., Class A | 3,002,250 | ||||||
| TOTAL CONSUMER STAPLES | 8,791,770 | |||||||
| FINANCIALS -10.7% | ||||||||
| Asset Management & Custody Banks-2.3% | ||||||||
| 16,450 | BlackRock, Inc. | 6,461,889 | ||||||
| Consumer Finance-1.0% | ||||||||
| 39,700 | Capital One Financial Corp. | 3,000,923 | ||||||
| Diversified Banks-2.0% | ||||||||
| 125,000 | Wells Fargo & Co. | 5,760,000 | ||||||
| Investment Banking & Brokerage-1.4% | ||||||||
| 100,000 | Morgan Stanley | 3,965,000 | ||||||
| Shares/Principal Amount | Value | |||||||
| Property & Casualty Insurance-2.0% | ||||||||
| 44,000 | Chubb, Ltd. | $ | 5,683,920 | |||||
| Regional Banks-2.0% | ||||||||
| 130,000 | BB&T Corp. | 5,631,600 | ||||||
| TOTAL FINANCIALS | 30,503,332 | |||||||
| HEALTH CARE-22.3% | ||||||||
| Biotechnology-3.2% | ||||||||
| 35,000 | Amgen, Inc. | 6,813,450 | ||||||
| 36,000 | Celgene Corp.(1) | 2,307,240 | ||||||
| 9,120,690 | ||||||||
| Health Care Equipment-2.8% | ||||||||
| 110,000 | Abbott Laboratories | 7,956,300 | ||||||
| Life Sciences Tools & Services-4.1% | ||||||||
| 62,500 | Iqvia Holdings, Inc.(1) | 7,260,625 | ||||||
| 21,000 | Thermo Fisher Scientific, Inc. | 4,699,590 | ||||||
| 11,960,215 | ||||||||
| Managed Health Care-4.3% | ||||||||
| 50,000 | UnitedHealth Group, Inc. | 12,456,000 | ||||||
| Pharmaceuticals-7.9% | ||||||||
| 130,000 | Elanco Animal Health, Inc.(1) | 4,098,900 | ||||||
| 28,250 | Johnson & Johnson | 3,645,663 | ||||||
| 57,000 | Merck & Co., Inc. | 4,355,370 | ||||||
| 125,000 | Zoetis, Inc. | 10,692,500 | ||||||
| 22,792,433 | ||||||||
| TOTAL HEALTH CARE | 64,285,638 | |||||||
| INDUSTRIALS-9.4% | ||||||||
| Aerospace & Defense-6.1% | ||||||||
| 17,100 | Boeing Co. | 5,514,750 | ||||||
| 58,400 | Raytheon Co. | 8,955,640 | ||||||
| 42,500 | Spirit AeroSystems Holdings, Inc., Class A | 3,063,825 | ||||||
| 17,534,215 | ||||||||
| Air Freight & Logistics-2.1% | ||||||||
| 38,000 | FedEx Corp. | 6,130,540 | ||||||
| Industrial Conglomerates-1.2% | ||||||||
| 25,000 | Honeywell International, Inc. | 3,303,000 | ||||||
| TOTAL INDUSTRIALS | 26,967,755 | |||||||
| 24 | |
www.wesmarkfunds.com |
Portfolio of Investments
| December 31, 2018 | WesMark Growth Fund |
| Shares/Principal Amount | Value | |||||||
| INFORMATION TECHNOLOGY-26.4% | ||||||||
| Application Software-5.6% | ||||||||
| 20,000 | Adobe Systems, Inc.(1) | $ | 4,524,800 | |||||
| 63,000 | salesforce.com, Inc.(1) | 8,629,110 | ||||||
| 30,000 | SAP SE, Sponsored ADR | 2,986,500 | ||||||
| 16,140,410 | ||||||||
| Communications Equipment-3.8% | ||||||||
| 70,000 | Apple, Inc. | 11,041,800 | ||||||
| Data Processing & Outsourced Services-5.7% | ||||||||
| 38,600 | Mastercard, Inc., Class A | 7,281,890 | ||||||
| 42,000 | PayPal Holdings, Inc.(1) | 3,531,780 | ||||||
| 75,000 | Worldpay, Inc., Class A(1) | 5,732,250 | ||||||
| 16,545,920 | ||||||||
| Internet Software & Services-4.8% | ||||||||
| 6,000 | Alphabet, Inc., Class A(1) | 6,269,760 | ||||||
| 3,016 | Alphabet, Inc., Class C(1) | 3,123,400 | ||||||
| 33,500 | Facebook, Inc., Class A(1) | 4,391,515 | ||||||
| 13,784,675 | ||||||||
| Semiconductors-2.8% | ||||||||
| 31,211 | Broadcom, Ltd. | 7,936,333 | ||||||
| Systems Software-3.7% | ||||||||
| 50,000 | Microsoft Corp. | 5,078,500 | ||||||
| 123,000 | Oracle Corp. | 5,553,450 | ||||||
| 10,631,950 | ||||||||
| TOTAL INFORMATION TECHNOLOGY | 76,081,088 | |||||||
| MATERIALS-1.6% | ||||||||
| Specialty Chemicals-1.6% | ||||||||
| 45,000 | PPG Industries, Inc. | 4,600,350 | ||||||
| TOTAL MATERIALS | 4,600,350 | |||||||
| TOTAL COMMON STOCKS | ||||||||
| (Cost 140,826,045) | 251,146,485 | |||||||
| EXCHANGE TRADED FUNDS-4.6% | ||||||||
| 36,000 | SPDR® S&P 500® ETF Trust | 8,997,120 | ||||||
| 161,500 | SPDR® S&P® Oil & Gas Exploration & Production ETF | 4,284,595 | ||||||
| TOTAL EXCHANGE TRADED FUNDS | ||||||||
| (Cost $15,622,311) | 13,281,715 | |||||||
| Shares/Principal Amount | Value | |||||||
| SHORT TERM INVESTMENTS-4.1% | ||||||||
| Mutual Funds-4.1% | ||||||||
| 11,803,812 | Federated Government Obligations Fund 7-Day Yield 2.264% (at net asset value) | $ | 11,803,812 | |||||
| TOTAL SHORT TERM INVESTMENTS | ||||||||
| (Cost $11,803,812) | 11,803,812 | |||||||
| TOTAL INVESTMENTS-96.1% | ||||||||
| (Cost $168,252,168) | 276,232,012 | |||||||
| OTHER ASSETS AND LIABILITIES-NET(2)-3.9% | 11,208,772 | |||||||
| NET ASSETS-100.0% | $ | 287,440,784 | ||||||
| (1) | Non-income producing security. |
| (2) | Assets, other than investments in securities, less liabilities. |
| Note - | The categories of investments are shown as a percentage of net assets at December 31, 2018. |
See Notes to Financial Statements which are an integral part of the Financial Statements.
| Annual Report | December 31, 2018 | |
25 |
Portfolio of Investments Summary Table
| WesMark Balanced Fund | December 31, 2018 (Unaudited) |
At December 31, 2018, the Fund's Portfolio Composition(1) was as follows:
| Portfolio Composition | Percentage of Total Net Assets |
| COMMON STOCKS | 54.2% |
| CORPORATE BONDS | 16.2% |
| U.S. GOVERNMENT AGENCY - MORTGAGE BACKED SECURITIES | 7.7% |
| U.S. GOVERNMENT AGENCY - COLLATERALIZED MORTGAGE OBLIGATIONS | 6.7% |
| TAXABLE MUNICIPAL BONDS | 4.9% |
| U.S. GOVERNMENT AGENCY SECURITIES | 2.4% |
| FIXED INCOME PORTFOLIO SUB-TOTAL | 37.9% |
| SHORT TERM INVESTMENTS(2) | 1.9% |
| OTHER ASSETS AND LIABILITIES - NET(3) | 6.0% |
| TOTAL NET ASSETS | 100.0% |
At December 31, 2018, the Fund's Sector composition(4) was as follows:
| Sector Composition | Percentage of Total Net Assets |
| Health Care | 10.4% |
| Information Technology | 10.3% |
| Financials | 8.1% |
| Industrials | 7.0% |
| Energy | 6.1% |
| Consumer Staples | 5.4% |
| Utilities | 2.0% |
| Materials | 1.9% |
| Real Estate | 1.9% |
| Telecommunication Services | 1.1% |
| Equity Portfolio Sub-Total | 54.2% |
| U.S. Government Agencies (Combined) | 16.8% |
| Corporate Bonds | 16.2% |
| Taxable Municipal Bonds | 4.9% |
| Fixed Income Portfolio Sub-Total | 37.9% |
| Short Term Investments(2) | 1.9% |
| Other Assets and Liabilities - Net(3) | 6.0% |
| Total Net Assets | 100.0% |
| (1) | See the Fund's Prospectus and Statement of Additional Information for a description of the types of securities in which the Fund invests. |
| (2) | Short Term Investments include investment in a money market mutual fund. |
| (3) | Assets, including written options, less liabilities. |
| (4) | Securities are assigned to a sector classification by the Fund's advisor. |
| 26 | |
www.wesmarkfunds.com |
Portfolio of Investments
| December 31, 2018 | WesMark Balanced Fund |
| Shares/Principal Amount | Value | |||||||
| COMMON STOCKS-54.2% | ||||||||
| CONSUMER STAPLES-5.4% | ||||||||
| Household Products-1.2% | ||||||||
| 13,500 | Procter & Gamble Co. | $ | 1,240,920 | |||||
| Hypermarkets & Super Centers-1.1% | ||||||||
| 12,000 | Wal-Mart Stores, Inc. | 1,117,800 | ||||||
| Soft Drinks-2.6% | ||||||||
| 20,000 | Coca-Cola Co. | 947,000 | ||||||
| 16,000 | PepsiCo, Inc. | 1,767,680 | ||||||
| 2,714,680 | ||||||||
| Tobacco-0.5% | ||||||||
| 10,000 | Altria Group, Inc. | 493,900 | ||||||
| TOTAL CONSUMER STAPLES | 5,567,300 | |||||||
| ENERGY-6.1% | ||||||||
| Integrated Oil & Gas-3.8% | ||||||||
| 19,100 | Chevron Corp. | 2,077,889 | ||||||
| 35,000 | TOTAL SA Sponsored ADR | 1,826,300 | ||||||
| 3,904,189 | ||||||||
| Oil & Gas Refining & Marketing-1.0% | ||||||||
| 13,000 | Valero Energy Corp. | 974,610 | ||||||
| Oil & Gas Storage & Transportation-1.3% | ||||||||
| 84,000 | Kinder Morgan, Inc. | 1,291,920 | ||||||
| TOTAL ENERGY | 6,170,719 | |||||||
| FINANCIALS-8.1% | ||||||||
| Consumer Finance-2.0% | ||||||||
| 35,000 | Discover Financial Services | 2,064,300 | ||||||
| Diversified Banks-2.5% | ||||||||
| 10,000 | JPMorgan Chase & Co. | 976,200 | ||||||
| 34,000 | US Bancorp | 1,553,800 | ||||||
| 2,530,000 | ||||||||
| Property & Casualty Insurance-1.6% | ||||||||
| 13,000 | Chubb, Ltd. | 1,679,340 | ||||||
| Regional Banks-2.0% | ||||||||
| 25,000 | BB&T Corp. | 1,083,000 | ||||||
| 8,000 | PNC Financial Services Group, Inc. | 935,280 | ||||||
| 2,018,280 | ||||||||
| TOTAL FINANCIALS | 8,291,920 | |||||||
| Shares/Principal Amount | Value | |||||||
| HEALTH CARE-10.4% | ||||||||
| Biotechnology-4.1% | ||||||||
| 25,000 | AbbVie, Inc. | $ | 2,304,750 | |||||
| 9,500 | Amgen, Inc. | 1,849,365 | ||||||
| 4,154,115 | ||||||||
| Health Care Equipment-1.8% | ||||||||
| 20,000 | Medtronic PLC | 1,819,200 | ||||||
| Pharmaceuticals-4.5% | ||||||||
| 25,000 | Merck & Co., Inc. | 1,910,250 | ||||||
| 60,000 | Pfizer, Inc. | 2,619,000 | ||||||
| 4,529,250 | ||||||||
| TOTAL HEALTH CARE | 10,502,565 | |||||||
| INDUSTRIALS-7.0% | ||||||||
| Aerospace & Defense-3.0% | ||||||||
| 3,000 | Boeing Co. | 967,500 | ||||||
| 6,000 | Lockheed Martin Corp. | 1,571,040 | ||||||
| 4,500 | United Technologies Corp. | 479,160 | ||||||
| 3,017,700 | ||||||||
| Airlines-0.5% | ||||||||
| 10,000 | Delta Air Lines, Inc. | 499,000 | ||||||
| Construction Machinery & Heavy Equipment-1.0% | ||||||||
| 7,800 | Caterpillar, Inc. | 991,146 | ||||||
| Industrial Conglomerates-2.5% | ||||||||
| 9,000 | 3M Co. | 1,714,860 | ||||||
| 6,000 | Honeywell International, Inc. | 792,720 | ||||||
| 2,507,580 | ||||||||
| TOTAL INDUSTRIALS | 7,015,426 | |||||||
| INFORMATION TECHNOLOGY-10.3% | ||||||||
| Communications Equipment-6.1% | ||||||||
| 26,000 | Apple, Inc. | 4,101,240 | ||||||
| 50,000 | Cisco Systems, Inc. | 2,166,500 | ||||||
| 6,267,740 | ||||||||
| IT Consulting & Other Services-1.2% | ||||||||
| 23,000 | Leidos Holdings, Inc. | 1,212,560 | ||||||
| Semiconductors-3.0% | ||||||||
| 85,000 | Cypress Semiconductor Corp. | 1,081,200 | ||||||
| 20,000 | Texas Instruments, Inc. | 1,890,000 | ||||||
| 2,971,200 | ||||||||
| TOTAL INFORMATION TECHNOLOGY | 10,451,500 | |||||||
| Annual Report | December 31, 2018 | |
27 |
Portfolio of Investments
| WesMark Balanced Fund | December 31, 2018 |
| Shares/Principal Amount | Value | |||||||
| MATERIALS-1.9% | ||||||||
| Chemicals-1.9% | ||||||||
| 36,666 | DowDuPont, Inc. | $ | 1,960,898 | |||||
| TOTAL MATERIALS | 1,960,898 | |||||||
| REAL ESTATE-1.9% | ||||||||
| Industrial REITS-0.8% | ||||||||
| 13,000 | Prologis, Inc. REIT | 763,360 | ||||||
| Specialized REITS-1.1% | ||||||||
| 10,800 | Digital Realty Trust, Inc. REIT | 1,150,740 | ||||||
| TOTAL REAL ESTATE | 1,914,100 | |||||||
| TELECOMMUNICATION SERVICES-1.1% | ||||||||
| Integrated Telecommunication Services-1.1% | ||||||||
| 20,000 | Verizon Communications, Inc. | 1,124,400 | ||||||
| TOTAL TELECOMMUNICATION SERVICES | 1,124,400 | |||||||
| UTILITIES-2.0% | ||||||||
| Electric Utilities-1.1% | ||||||||
| 13,025 | Duke Energy Corp. | 1,124,057 | ||||||
| Multi-Utilities-0.9% | ||||||||
| 13,250 | Dominion Energy, Inc. | 946,845 | ||||||
| TOTAL UTILITIES | 2,070,902 | |||||||
| TOTAL COMMON STOCKS | ||||||||
| (Cost 40,356,823) | 55,069,730 | |||||||
| CORPORATE BONDS-16.2% | ||||||||
| Banks-1.0% | ||||||||
| $ | 1,000,000 | Wells Fargo & Co., Subordinated Notes, 3.450%, 2/13/2023 | 979,890 | |||||
| Communications Equipment-1.0% | ||||||||
| 1,000,000 | Apple, Inc., 3M US L + 1.13%, 2/23/2021(1) | 1,015,664 | ||||||
| Consumer Finance-0.5% | ||||||||
| 500,000 | Capital One Financial Corp., 3M US L + 0.95%, 3/9/2022(1) | 492,140 | ||||||
| Shares/Principal Amount | Value | |||||||
| Diversified Chemicals-0.9% | ||||||||
| $ | 1,000,000 | Dow Chemical Co., Sr. Unsecured Notes, 3.000%, 11/15/2022 | $ | 970,815 | ||||
| Industrial Gases-0.8% | ||||||||
| 835,000 | Air Products & Chemicals, Inc., Sr. Unsecured Notes, 3.350%, 7/31/2024 | 840,966 | ||||||
| Integrated Telecommunication Services-1.9% | ||||||||
| 1,000,000 | AT&T, Inc., Sr. Unsecured Notes, 3.950%, 1/15/2025 | 979,559 | ||||||
| 1,000,000 | Verizon Communications, Inc., Sr. Unsecured Notes, 3M US L + 1.00%, 3/16/2022(1) | 1,001,541 | ||||||
| 1,981,100 | ||||||||
| Internet Software & Services-1.9% | ||||||||
| 2,000,000 | Ebay, Inc., Sr. Unsecured Notes, 3M US L + 0.87%, 1/30/2023(1) | 1,982,873 | ||||||
| Investment Banking & Brokerage-1.0% | ||||||||
| 1,000,000 | Goldman Sachs Group, Inc., Sr. Unsecured Notes, 3M US L + 1.60%, 11/29/2023(1) | 991,667 | ||||||
| Life Sciences Tools & Services-0.5% | ||||||||
| 500,000 | Agilent Technologies, Inc., Sr. Unsecured Notes, 3.200%, 10/1/2022 | 494,368 | ||||||
| Oil & Gas Exploration & Production -0.5% | ||||||||
| 500,000 | Devon Energy Corp., Sr. Unsecured Notes, 3.250%, 5/15/2022 | 487,586 | ||||||
| Packaged Foods & Meats-0.5% | ||||||||
| 500,000 | Kraft Heinz Foods Co., Sr. Unsecured Notes, 3.125%, 9/12/2021 | 489,099 | ||||||
| Pharmaceuticals-1.5% | ||||||||
| 500,000 | Pfizer, Inc., Sr. Unsecured Notes, 3.400%, 5/15/2024 | 503,846 | ||||||
| 28 | |
www.wesmarkfunds.com |
Portfolio of Investments
| December 31, 2018 | WesMark Balanced Fund |
| Shares/Principal Amount | Value | |||||||
| $ | 1,000,000 | Zoetis, Inc., Sr. Unsecured Notes, 3.250%, 2/1/2023 | $ | 984,484 | ||||
| 1,488,330 | ||||||||
| Real Estate-0.7% | ||||||||
| 750,000 | Simon Property Group LP, Sr. Unsecured Notes, 2.750%, 2/1/2023 | 727,399 | ||||||
| Regional Banks-2.4% | ||||||||
| 500,000 | PNC Bank NA, Subordinated Notes, 2.950%, 1/30/2023 | 487,209 | ||||||
| 1,000,000 | PNC Bank NA, Sr. Unsecured Notes, 3M US L + 0.50%, 7/27/2022(1) | 990,485 | ||||||
| 1,000,000 | PNC Bank NA, Sr. Unsecured Notes, 3.250%, 6/1/2025 | 971,722 | ||||||
| 2,449,416 | ||||||||
| Software & Services-1.1% | ||||||||
| 400,000 | Autodesk, Inc., Sr. Unsecured Notes, 3.600%, 12/15/2022 | 396,937 | ||||||
| 750,000 | Oracle Corp., Sr. Unsecured Notes, 3.400%, 7/8/2024 | 749,013 | ||||||
| 1,145,950 | ||||||||
| TOTAL CORPORATE BONDS | ||||||||
| (Cost $16,874,664) | 16,537,263 | |||||||
| U.S. GOVERNMENT AGENCY - COLLATERALIZED MORTGAGE OBLIGATIONS-6.7% | ||||||||
| Agency Collat PAC CMO-2.0% | ||||||||
| 1,983,600 | Series 2018-126, Class DA, 3.500%, 1/20/2048 | 2,016,959 | ||||||
| Federal Home Loan Mortgage Corp.-1.6% | ||||||||
| 675,725 | Series 2015-4517, Class PC, 2.500%, 5/15/2044 | 658,868 | ||||||
| 968,607 | Series 2017-4665, Class JA, 4.000%, 12/15/2042 | 986,759 | ||||||
| 1,645,627 | ||||||||
| Federal National Mortgage Association-2.1% | ||||||||
| 701,403 | Series 2003-39, Class JC, 4.000%, 5/25/2033, REMIC | 725,222 | ||||||
| 232,096 | Series 2012-100, Class NA, 2.000%, 11/25/2041, REMIC | 226,383 | ||||||
| Shares/Principal Amount | Value | |||||||
| $ | 475,757 | Series 2012-54, Class WA, 3.000%, 4/25/2032, REMIC | $ | 475,415 | ||||
| 463,401 | Series 2013-72, Class HG, 3.000%, 4/25/2033, REMIC | 463,520 | ||||||
| 293,985 | Series 2013-9, Class KB, 2.500%, 12/25/2042, REMIC | 286,702 | ||||||
| 2,177,242 | ||||||||
| Government National Mortgage Association-1.0% | ||||||||
| 409,333 | Series 2012-84, Class TA, 2.500%, 3/20/2042 | 397,124 | ||||||
| 624,097 | Series 2013-88, Class LV, 2.500%, 9/16/2026 | 616,847 | ||||||
| 1,013,971 | ||||||||
| TOTAL U.S. GOVERNMENT AGENCY - COLLATERALIZED MORTGAGE OBLIGATIONS | ||||||||
| (Cost $6,934,907) | 6,853,799 | |||||||
| U.S. GOVERNMENT AGENCY - MORTGAGE BACKED SECURITIES-7.7% | ||||||||
| Commercial Mortgage-Backed Securities-2.0% | ||||||||
| 1,500,000 | Series 2015-UBS8, Class A4, 3.809%, 11/15/2025 | 1,526,178 | ||||||
| 500,000 | Series 2012-C3, Class A4, 3.091%, 9/10/2022 | 499,104 | ||||||
| 2,025,282 | ||||||||
| Federal Home Loan Mortgage Corp.-0.7% | ||||||||
| 255,142 | Pool G18527, 3.000%, 10/1/2029 | 255,461 | ||||||
| 431,000 | 3.100%, 3/29/2023 | 431,152 | ||||||
| 686,613 | ||||||||
| Federal National Mortgage Association-1.4% | ||||||||
| 442,946 | Pool AM3301, 2.350%, 5/1/2023 | 436,310 | ||||||
| 383,202 | Pool MA1449, 3.000%, 5/1/2028 | 384,290 | ||||||
| 651,371 | Pool AM6756, 3.570%, 10/1/2029 | 666,425 | ||||||
| 1,487,025 | ||||||||
| FGLMC Collateral-1.9% | ||||||||
| 1,894,149 | 3.500%, 9/1/2033 | 1,918,137 | ||||||
| Small Business Administration Pools-1.7% | ||||||||
| 971,079 | PRIME - 2.50%, 1/25/2042(1) | 974,277 | ||||||
| Annual Report | December 31, 2018 | |
29 |
Portfolio of Investments
| WesMark Balanced Fund | December 31, 2018 |
| Shares/Principal Amount | Value | |||||||
| $ | 794,569 | PRIME - 2.60%, 7/25/2042(1) | $ | 794,072 | ||||
| 1,768,349 | ||||||||
| TOTAL U.S. GOVERNMENT AGENCY - MORTGAGE BACKED SECURITIES | ||||||||
| (Cost $7,904,578) | 7,885,406 | |||||||
| U.S. GOVERNMENT AGENCY SECURITIES-2.4% | ||||||||
| Federal Farm Credit Banks-1.9% | ||||||||
| 2,000,000 | 2.450%, 11/29/2023 | 1,966,500 | ||||||
| Federal Home Loan Banks-0.5% | ||||||||
| 450,000 | 5.250%, 6/10/2022 | 489,275 | ||||||
| TOTAL U.S. GOVERNMENT AGENCY SECURITIES | ||||||||
| (Cost $2,447,374) | 2,455,775 | |||||||
| TAXABLE MUNICIPAL BONDS-4.9% | ||||||||
| Alaska-0.5% | ||||||||
| 500,000 | City of Anchorage, Build America General Obligation Unlimited Bonds, 5.368%, 4/1/2026 | 516,955 | ||||||
| Colorado-0.1% | ||||||||
| 135,000 | Colorado State Housing and Finance Authority Revenue Bonds, Series A-1, 3.900%, 10/1/2032 | 135,567 | ||||||
| Florida-0.8% | ||||||||
| 305,000 | Florida Department of Management Services, Build America Revenue Bonds, 6.825%, 8/1/2029 | 312,079 | ||||||
| 425,000 | Jacksonville Electric Authority, Bulk Power Supply System, Build America Revenue Bonds, 5.450%, 10/1/2025 | 480,148 | ||||||
| 792,227 | ||||||||
| Illinois-0.2% | ||||||||
| 200,000 | City of Lake Forest, Build America General Obligation Unlimited Bonds, Series C, 4.750%, 12/15/2022 | 200,348 | ||||||
| Shares/Principal Amount | Value | |||||||
| Michigan-0.3% | ||||||||
| $ | 270,000 | Belding Area Schools, General Obligation Unlimited Bonds, 6.700%, 5/1/2027 | $ | 285,042 | ||||
| Ohio-0.7% | ||||||||
| 630,000 | Ohio State Water Development Authority, Build America Revenue Bonds, 4.042%, 12/1/2023 | 660,051 | ||||||
| Pennsylvania-1.3% | ||||||||
| 500,000 | Albert Gallatin Area School District, Build America General Obligation Unlimited Bonds, 6.080%, 9/1/2025 | 529,220 | ||||||
| 250,000 | Pittsburgh and Allegheny County, Pennsylvania, Sports and Exhibition Authority Revenue Bonds, 4.271%, 12/15/2027 | 255,540 | ||||||
| 500,000 | State Public School Building Authority, Revenue Bonds, 5.000%, 9/15/2027 | 548,725 | ||||||
| 1,333,485 | ||||||||
| Virginia-0.5% | ||||||||
| 500,000 | Virginia Public Building Authority, Build America Revenue Bonds, 5.500%, 8/1/2027 | 518,110 | ||||||
| Wisconsin-0.5% | ||||||||
| 500,000 | State of Wisconsin Transportation Authority Revenue Bonds, 5.500%, 7/1/2026 | 518,995 | ||||||
| TOTAL TAXABLE MUNICIPAL BONDS | ||||||||
| (Cost $4,761,895) | 4,960,780 | |||||||
| SHORT TERM INVESTMENTS-1.9% | ||||||||
| Mutual Funds-1.9% | ||||||||
| 1,975,097 | Federated Government Obligations Fund 7-Day Yield 2.264% (at net asset value) | 1,975,097 | ||||||
| TOTAL SHORT TERM INVESTMENTS | ||||||||
| (Cost $1,975,097) | 1,975,097 | |||||||
| 30 | |
www.wesmarkfunds.com |
Portfolio of Investments
| December 31, 2018 | WesMark Balanced Fund |
| Shares/Principal Amount | Value | |||
| TOTAL INVESTMENTS-94.0% | ||||
| (Cost $81,255,338) | $ | 95,737,850 | ||
| OTHER ASSETS AND LIABILITIES-NET(2)-6.0% | 6,154,901 | |||
| NET ASSETS-100.0% | $ | 101,892,751 | ||
Investment Abbreviations:
LIBOR - London Interbank Offered Rate
Libor Rates:
3M US L - 3 Month LIBOR as of December 31, 2018 was 2.40% PRIME - US Prime Rate as of December 31, 2018 was 5.00%
| (1) | Floating or variable rate security. The reference rate is described above. The Rate in effect as of December 31, 2018 is based on the reference rate plus the displayed spread as of the security's last reset date. |
| (2) | Assets, other than investments in securities, less liabilities. |
| Note - | The categories of investments are shown as a percentage of net assets at December 31, 2018. |
See Notes to Financial Statements which are an integral part of the Financial Statements.
| Annual Report | December 31, 2018 | |
31 |
Portfolio of Investments Summary Table
| WesMark Government Bond Fund | December 31, 2018 (Unaudited) |
At December 31, 2018, the Fund's Portfolio Composition(1) was as follows:
| Portfolio Composition | Percentage of Total Net Assets |
| U.S. GOVERNMENT AGENCY - COLLATERALIZED MORTGAGE OBLIGATIONS | 65.1% |
| TAXABLE MUNICIPAL BONDS | 19.9% |
| U.S. GOVERNMENT AGENCY - MORTGAGE BACKED SECURITIES | 11.2% |
| U.S. TREASURY BONDS | 4.5% |
| NON-TAXABLE MUNICIPAL BONDS | 0.6% |
| FIXED INCOME PORTFOLIO SUB-TOTAL | 101.3% |
| SHORT TERM INVESTMENTS(2) | 0.8% |
| OTHER ASSETS AND LIABILITIES - NET(3) | -2.1% |
| TOTAL NET ASSETS | 100.0% |
| (1) | See the Fund's Prospectus and Statement of Additional Information for a description of the types of securities in which the Fund invests. |
| (2) | Short Term Investments include investment in a money market mutual fund. |
| (3) | Assets, other than investments in securities, less liabilities. |
| 32 | |
www.wesmarkfunds.com |
Portfolio of Investments
| December 31, 2018 | WesMark Government Bond Fund |
| Shares/Principal Amount | Value | |||||||
| U.S. GOVERNMENT AGENCY - COLLATERALIZED MORTGAGE OBLIGATIONS-65.1% | ||||||||
| Agency Collat CMO-1.3% | ||||||||
| $ | 2,941,527 | Series 2012-273, Class 40, 4.000%, 8/15/2042 | $ | 3,023,278 | ||||
| Agency Collat PAC CMO-2.2% | ||||||||
| 5,210,938 | Series 2014-25, Class PA, 2.250%, 1/20/2044 | 5,090,208 | ||||||
| Federal Home Loan Mortgage Corp.-20.9% | ||||||||
| 1,561,564 | Series 2012-276, Class 25, 2.500%, 9/15/2042 | 1,494,752 | ||||||
| 1,126,322 | Series 2011-3905, Class MP, 2.000%, 3/15/2041, REMIC | 1,098,168 | ||||||
| 500,382 | Series 2011-3919, Class CE, 2.750%, 10/15/2040, REMIC | 494,953 | ||||||
| 2,387,331 | Series 2012-3984, Class PA, 2.000%, 12/15/2039, REMIC | 2,352,691 | ||||||
| 3,853,883 | Series 2012-4002, Class CA, 2.000%, 8/15/2041, REMIC | 3,704,947 | ||||||
| 2,305,362 | Series 2012-4099, Class BD, 2.000%, 6/15/2039, REMIC | 2,239,067 | ||||||
| 2,206,172 | Series 2013-4184, Class PA, 2.000%, 10/15/2042, REMIC | 2,137,531 | ||||||
| 1,540,271 | Series 2013-4187, Class CA, 2.000%, 4/15/2033, REMIC | 1,467,966 | ||||||
| 1,213,717 | Series 2013-4204, Class AD, 1.500%, 8/15/2042, REMIC | 1,155,878 | ||||||
| 1,106,355 | Series 2013-4249, Class KD, 3.000%, 11/15/2042, REMIC | 1,097,129 | ||||||
| 475,944 | Series 2013-4287, Class AB, 2.000%, 12/15/2026, REMIC | 465,400 | ||||||
| 790,705 | Series 2014-4368, Class BE, 2.500%, 5/15/2031, REMIC | 780,956 | ||||||
| 1,211,832 | Series 2015-4472, Class MA, 3.000%, 5/15/2045, REMIC | 1,191,295 | ||||||
| 375,654 | Series 2015-4487, Class DA, 2.500%, 1/15/2045, REMIC | 356,275 | ||||||
| 1,796,027 | Series 2015-4531, Class PD, 2.500%, 5/15/2043, REMIC | 1,754,117 | ||||||
| 3,585,690 | Series 2015-4537, Class AB, 3.000%, 1/15/2043, REMIC | 3,563,491 | ||||||
| 1,583,053 | Series 2016-4546, Class TE, 2.000%, 12/15/2045, REMIC | 1,519,902 | ||||||
| 851,022 | Series 2016-4616, Class HP, 3.000%, 9/15/2046, REMIC | 843,554 | ||||||
| Shares/Principal Amount | Value | |||||||
| $ | 4,433,079 | Series 2016-4629, Class QG, 2.500%, 11/15/2046, REMIC | $ | 4,308,375 | ||||
| 3,587,168 | Series 2016-4631, Class AE, 3.500%, 5/15/2044, REMIC | 3,622,245 | ||||||
| 1,501,590 | Series 2017-4655, Class LA, 3.500%, 3/15/2042, REMIC | 1,509,956 | ||||||
| 3,805,156 | Series 2017-4657, Class TA, 3.500%, 11/15/2041, REMIC | 3,830,492 | ||||||
| 3,156,495 | Series 2017-4661, Class AC, 4.000%, 4/15/2043, REMIC | 3,262,420 | ||||||
| 3,740,490 | Series 2017-4680, Class TA, 4.000%, 7/15/2044, REMIC | 3,834,852 | ||||||
| 48,086,412 | ||||||||
| Federal National Mortgage Association-29.0% | ||||||||
| 669,123 | Series 2003-39, Class JC, 4.000%, 5/25/2033, REMIC | 691,847 | ||||||
| 1,086,461 | Series 2003-44, Class Q, 3.500%, 6/25/2033, REMIC | 1,087,867 | ||||||
| 1,924,545 | Series 2003-W18, Class 2A, 4.172%, 6/25/2043, REMIC (1) | 1,988,040 | ||||||
| 2,144,454 | Series 2010-102, Class PE, 2.000%, 9/25/2040, REMIC | 2,074,715 | ||||||
| 1,622,259 | Series 2010-99, Class CP, 2.750%, 8/25/2040, REMIC | 1,606,269 | ||||||
| 518,464 | Series 2011-121, Class PD, 2.000%, 12/25/2040, REMIC | 504,745 | ||||||
| 2,067,948 | Series 2012-103, Class NG, 1.750%, 11/25/2041, REMIC | 1,936,441 | ||||||
| 3,686,422 | Series 2012-103, Class VC, 3.500%, 9/25/2029, REMIC | 3,702,658 | ||||||
| 447,938 | Series 2012-116, Class PC, 2.000%, 10/25/2042, REMIC | 430,675 | ||||||
| 4,400,934 | Series 2012-134, Class AE, 1.750%, 7/25/2040, REMIC | 4,246,184 | ||||||
| 2,448,964 | Series 2012-153, Class KB, 1.750%, 1/25/2042, REMIC | 2,312,017 | ||||||
| 1,708,870 | Series 2012-17, Class EA, 2.000%, 3/25/2041, REMIC | 1,640,208 | ||||||
| 1,518,488 | Series 2012-30, Class CA, 2.000%, 10/25/2041, REMIC | 1,458,016 | ||||||
| 609,961 | Series 2012-58, Class PA, 2.000%, 4/25/2042, REMIC | 579,044 | ||||||
| 1,281,073 | Series 2012-69, Class PH, 2.750%, 1/25/2042, REMIC | 1,270,568 | ||||||
| 1,898,226 | Series 2013-10, Class NE, 2.000%, 1/25/2042, REMIC | 1,827,283 | ||||||
| Annual Report | December 31, 2018 | |
33 |
Portfolio of Investments
| WesMark Government Bond Fund | December 31, 2018 |
| Shares/Principal Amount | Value | |||||||
| $ | 2,254,406 | Series 2013-102, Class DG, 3.000%, 5/25/2032, REMIC | $ | 2,266,149 | ||||
| 2,314,681 | Series 2013-20, Class YA, 2.000%, 3/25/2042, REMIC | 2,223,412 | ||||||
| 1,591,839 | Series 2013-23, Class CB, 2.000%, 3/25/2033, REMIC | 1,528,777 | ||||||
| 1,795,013 | Series 2013-27, Class HA, 3.000%, 10/25/2042, REMIC | 1,790,114 | ||||||
| 280,161 | Series 2013-42, Class PD, 1.250%, 5/25/2043, REMIC | 249,666 | ||||||
| 791,973 | Series 2014-4, Class KA, 3.000%, 1/25/2044, REMIC | 775,954 | ||||||
| 699,329 | Series 2014-64, Class EB, 2.000%, 4/25/2032, REMIC | 682,766 | ||||||
| 470,899 | Series 2015-35, Class BH, 1.500%, 6/25/2045, REMIC | 447,033 | ||||||
| 3,133,368 | Series 2015-42, Class CA, 3.000%, 3/25/2044, REMIC | 3,105,566 | ||||||
| 3,348,548 | Series 2016-16, Class PD, 3.000%, 12/25/2044, REMIC | 3,293,793 | ||||||
| 1,476,943 | Series 2016-29, Class PC, 2.000%, 8/25/2045, REMIC | 1,420,566 | ||||||
| 4,245,762 | Series 2016-90, Class DA, 3.000%, 8/25/2046, REMIC | 4,204,888 | ||||||
| 3,312,905 | Series 2016-95, Class L, 2.500%, 6/25/2046, REMIC | 3,194,903 | ||||||
| 2,570,400 | Series 2017-1, Class JP, 3.500%, 4/25/2045, REMIC | 2,617,417 | ||||||
| 2,210,986 | Series 2017-31, Class GA, 3.000%, 3/25/2044, REMIC | 2,197,733 | ||||||
| 4,618,508 | Series 2017-89, Class PL, 3.000%, 6/25/2043, REMIC | 4,630,583 | ||||||
| 4,714,296 | Series 2018-3, Class LD, 3.000%, 8/25/2046, REMIC | 4,693,898 | ||||||
| 66,679,795 | ||||||||
| Government National Mortgage Association-10.0% | ||||||||
| 3,993,757 | Series 2005-26, Class ZA, 5.500%, 1/20/2035 | 4,331,144 | ||||||
| 501,999 | Series 2011-11, Class PC, 2.000%, 4/20/2040 | 490,547 | ||||||
| 538,150 | Series 2012-48, Class MA, 2.500%, 4/16/2042 | 522,291 | ||||||
| 611,936 | Series 2012-50, Class ED, 2.250%, 8/20/2040 | 597,063 | ||||||
| Shares/Principal Amount | Value | |||||||
| $ | 1,679,320 | Series 2013-38, Class KA, 1.250%, 2/20/2042 | $ | 1,554,717 | ||||
| 6,519,308 | Series 2016-154, Class UP, 3.000%, 5/20/2045 | 6,506,458 | ||||||
| 1,269,809 | Series 2016-43, Class UC, 3.500%, 3/20/2046 | 1,280,189 | ||||||
| 2,801,177 | Series 2016-55, Class JA, 3.500%, 4/20/2046 | 2,808,176 | ||||||
| 5,295,465 | Series 2016-77, Class MB, 2.000%, 9/20/2045 | 5,063,888 | ||||||
| 23,154,473 | ||||||||
| Other ABS-1.7% | ||||||||
| 1,903,434 | Series 2015-20D, Class 1, 2.510%, 4/1/2035 | 1,833,880 | ||||||
| 2,175,792 | Series 2016-20I, Class 1, 2.030%, 9/1/2036 | 2,055,774 | ||||||
| 3,889,654 | ||||||||
| TOTAL U.S. GOVERNMENT AGENCY - COLLATERALIZED MORTGAGE OBLIGATIONS | ||||||||
| (Cost $153,732,238) | 149,923,820 | |||||||
| U.S. GOVERNMENT AGENCY - MORTGAGE BACKED SECURITIES-11.2% | ||||||||
| Federal Home Loan Mortgage Corp.-0.5% | ||||||||
| 299,024 | Pool C91349, 4.500%, 12/1/2030 | 312,730 | ||||||
| 763,707 | Pool C91361, 4.000%, 3/1/2031 | 783,734 | ||||||
| 1,096,464 | ||||||||
| Federal National Mortgage Association-6.8% | ||||||||
| 2,858,292 | Pool MA0641, 4.000%, 2/1/2031 | 2,937,523 | ||||||
| 1,221,220 | Pool MA0695, 4.000%, 4/1/2031 | 1,255,038 | ||||||
| 755,452 | Pool MA0756, 4.000%, 6/1/2031 | 776,398 | ||||||
| 2,007,241 | Pool MA0818, 4.000%, 8/1/2031 | 2,062,906 | ||||||
| 2,417,875 | Pool MA1459, 3.000%, 6/1/2033 | 2,408,754 | ||||||
| 2,849,941 | Pool AL5169, 4.000%, 4/1/2034 | 2,939,038 | ||||||
| 2,176,798 | Pool 995026, 6.000%, 9/1/2036 | 2,375,737 | ||||||
| 223,298 | Pool AI7929, 4.000%, 8/1/2041 | 227,973 | ||||||
| 653,951 | Pool AL6620, 4.500%, 8/1/2042 | 686,453 | ||||||
| 15,669,820 | ||||||||
| Government National Mortgage Association-3.9% | ||||||||
| 2,401,761 | Pool A09704, 3.000%, 10/20/2036 | 2,362,392 | ||||||
| 2,864,170 | Pool A09713, 3.000%, 4/20/2037 | 2,817,205 | ||||||
| 2,629,328 | Pool AY5131, 3.000%, 6/20/2037 | 2,586,210 | ||||||
| 472,602 | Pool G24828, 4.500%, 10/20/2040 | 487,454 | ||||||
| 34 | |
www.wesmarkfunds.com |
Portfolio of Investments
| December 31, 2018 | WesMark Government Bond Fund |
| Shares/Principal Amount | Value | |||||||
| $ | 413,845 | Pool 589693, 4.500%, 7/15/2029 | $ | 432,021 | ||||
| 347,224 | Pool 781952, 6.000%, 7/15/2035 | 377,790 | ||||||
| 9,063,072 | ||||||||
| TOTAL U.S. GOVERNMENT AGENCY - MORTGAGE BACKED SECURITIES | ||||||||
| (Cost $26,442,284) | 25,829,356 | |||||||
| U.S. TREASURY BONDS-4.5% | ||||||||
| U.S. Treasury Bond-4.5% | ||||||||
| 8,000,000 | 7.625%, 2/15/2025 | 10,279,845 | ||||||
| TOTAL U.S. TREASURY BONDS | ||||||||
| (Cost $10,697,907) | 10,279,845 | |||||||
| TAXABLE MUNICIPAL BONDS-19.9% | ||||||||
| Alabama-0.2% | ||||||||
| 500,000 | University of Alabama, Build America General Obligation Direct Payment Bonds, Series B, 4.900%, 10/1/2026 | 514,655 | ||||||
| Arizona-0.5% | ||||||||
| 1,000,000 | Maricopa County Elementary School District No. 3-Tempe, Build America General Obligation Bonds, Series A, 6.000%, 7/1/2026 | 1,047,600 | ||||||
| California-1.1% | ||||||||
| 500,000 | Pasadena Public Financing Authority, Build America Revenue Bonds, Series B, 6.998%, 3/1/2034 | 665,615 | ||||||
| 1,000,000 | Santa Clara Valley, California, Transportation Authority Sales Tax Revenue, Build America Bonds, 5.876%, 4/1/2032 | 1,179,490 | ||||||
| 725,000 | West Contra Costa, California, Unified School District Bonds, 4.194%, 8/1/2033 | 754,312 | ||||||
| 2,599,417 | ||||||||
| Colorado-0.9% | ||||||||
| 1,000,000 | Larimer County School District No. R-1 Poudre, Build America General Obligation Bonds, 5.603%, 12/15/2025 | 1,056,200 | ||||||
| Shares/Principal Amount | Value | |||||||
| $ | 1,000,000 | Metropolitan State College of Denver, Institutional Enterprise, Build America Revenue Bonds, 5.460%, 12/1/2023 | $ | 1,108,670 | ||||
| 2,164,870 | ||||||||
| Georgia-0.4% | ||||||||
| 705,000 | Atlanta, Georgia, Independent School System Qualified School Construction Bonds, 5.657%, 3/1/2027 | 823,976 | ||||||
| Idaho-0.4% | ||||||||
| 1,000,000 | Idaho State Building Authority Building Revenue State Office Campus Project Revenue Bonds, Series B, 3.580%, 9/1/2032 | 974,870 | ||||||
| Indiana-0.6% | ||||||||
| 770,000 | Evansville Vanderburgh Public Library Leasing Corp. Revenue Bonds, 3.100%, 1/15/2023 | 768,676 | ||||||
| 500,000 | Indiana Finance Authority, Revenue Bonds, Series A, 3.166%, 7/1/2030 | 486,145 | ||||||
| 1,254,821 | ||||||||
| Kansas-0.4% | ||||||||
| 450,000 | City of Olathe, Water & Sewer System, Build America Revenue Bonds, Series A, 5.300%, 7/1/2026 | 462,555 | ||||||
| 380,000 | Johnson County Unified School District No. 232 De Soto, Build America General Obligation Bonds, 5.500%, 9/1/2023 | 389,036 | ||||||
| 851,591 | ||||||||
| Louisiana-0.6% | ||||||||
| City of New Orleans, Louisiana, Public Improvement Bonds: | ||||||||
| 515,000 | Series A, 5.350%, 12/1/2027 | 566,438 | ||||||
| 300,000 | Series A, 5.700%, 12/1/2030 | 333,798 | ||||||
| 500,000 | Series A, 5.750%, 12/1/2033 | 554,955 | ||||||
| 1,455,191 | ||||||||
| Maryland-0.2% | ||||||||
| 465,000 | Baltimore, Maryland, General Obligation Unlimited Bonds, Series C, 3.509%, 10/15/2034 | 450,385 | ||||||
| Annual Report | December 31, 2018 | |
35 |
Portfolio of Investments
| WesMark Government Bond Fund | December 31, 2018 |
| Shares/Principal Amount | Value | |||||||
| Michigan-0.7% | ||||||||
| $ | 605,000 | City of Madison Heights, Michigan, General Obligation Bonds, 3.610%, 1/1/2031 | $ | 593,190 | ||||
| 1,000,000 | Michigan Strategic Fund, Revenue Bonds, 2.522%, 10/15/2023 | 978,590 | ||||||
| 1,571,780 | ||||||||
| Minnesota-0.2% | ||||||||
| 500,000 | Lake City Independent School District No. 813, Minnesota, Build America General Obligation Bonds, 5.200%, 2/1/2026 | 509,850 | ||||||
| Mississippi-0.1% | ||||||||
| 180,000 | Mississippi Development Bank, Revenue Bonds, Series B, 5.150%, 6/1/2023 | 183,265 | ||||||
| New York-1.1% | ||||||||
| 500,000 | New York City, New York Transitional Finance Authority Future Tax Secured Revenue Bonds,, 4.000%, 8/1/2033 | 507,600 | ||||||
| 1,000,000 | New York City, New York, Housing Development Corp. Revenue Bonds, Series D,, 4.253%, 11/1/2035 | 1,007,110 | ||||||
| 500,000 | New York City, New York, Transitional Finance Authority Revenue Bonds, Series A-5, 3.580%, 8/1/2032 | 491,775 | ||||||
| 470,000 | New York State Dormitory Authority State Personal Income Tax Revenue Build America Bonds, 5.500%, 3/15/2030 | 538,916 | ||||||
| 2,545,401 | ||||||||
| North Carolina-0.4% | ||||||||
| 925,000 | County of Guilford, North Carolina, Build America General Obligation Unlimited Bonds, 4.791%, 8/1/2023 | 1,008,194 | ||||||
| Ohio-4.6% | ||||||||
| 1,250,000 | American Municipal Power-Ohio, Inc., Build America Revenue Bonds, 5.964%, 2/15/2024 | 1,292,350 | ||||||
| Shares/Principal Amount | Value | |||||||
| $ | 1,000,000 | Coshocton Ohio City School District General Obligation Unlimited Bonds, 5.087%, 12/1/2026 | $ | 1,029,000 | ||||
| 500,000 | County of Cuyahoga, Variable Purpose, Build America General Obligation Bonds, 5.392%, 12/1/2025 | 549,085 | ||||||
| 500,000 | Hilliard School District, General Obligation Bonds, 5.550%, 12/1/2025 | 567,845 | ||||||
| 1,085,000 | Jackson City, Ohio, School District General Obligation Unlimited Bonds, 3.000%, 12/1/2024 | 1,086,682 | ||||||
| 1,510,000 | Licking Heights, Ohio, Local School District General Obligation Unlimited Bonds, 3.300%, 12/1/2026 | 1,503,386 | ||||||
| 1,040,000 | Miami County, Recovery Zone Economic Development Build America General Obligation Bonds, 6.650%, 12/1/2030 | 1,069,858 | ||||||
| 1,000,000 | Northwest Local School District (Stark Summit & Wayne Counties), General Obligation Bonds, 5.050%, 12/1/2025 | 1,092,790 | ||||||
| 500,000 | Ohio State Water Development Authority, Build America Revenue Bonds, 4.817%, 12/1/2030 | 557,015 | ||||||
| 875,000 | University of Akron, Ohio Revenue Bonds, Series B, 4.299%, 1/1/2033 | 889,429 | ||||||
| 900,000 | Willoughby-Eastlake City School District, Certificate of Participation, Series A, 6.544%, 3/1/2026 | 963,387 | ||||||
| 10,600,827 | ||||||||
| Oregon-0.9% | ||||||||
| 500,000 | Troutdale, Oregon General Obligation Limited Bonds, 3.350%, 6/1/2026 | 500,030 | ||||||
| Washington County, Clean Water Services Sewer, Build America Revenue Bonds: | ||||||||
| 750,000 | 5.228%, 10/1/2025 | 838,283 | ||||||
| 700,000 | 5.701%, 10/1/2030 | 814,548 | ||||||
| 2,152,861 | ||||||||
| 36 | |
www.wesmarkfunds.com |
Portfolio of Investments
| December 31, 2018 | WesMark Government Bond Fund |
| Shares/Principal Amount | Value | |||||||
| Pennsylvania-2.8% | ||||||||
| $ | 1,150,000 | Commonwealth Financing Authority, Revenue Bonds, Series A, 3.743%, 6/1/2029 | $ | 1,160,361 | ||||
| County of Clinton, Pennsylvania, General Obligation Unlimited Bonds: | ||||||||
| 340,000 | 3.580%, 12/1/2027 | 346,793 | ||||||
| 370,000 | 3.780%, 12/1/2029 | 376,061 | ||||||
| 285,000 | 3.880%, 12/1/2030 | 289,449 | ||||||
| 1,000,000 | Lebanon Authority, Build America Revenue Bonds, 5.970%, 12/15/2025 | 1,032,930 | ||||||
| 1,000,000 | Peters Township, Pennsylvania, School District Washington County General Obligation Limited Bonds, 3.310%, 9/1/2026 | 990,360 | ||||||
| 2,000,000 | State Public School Building Authority, Pennsylvania Qualified School Construction Revenue Bonds, Series C, 5.088%, 9/15/2029 | 2,219,500 | ||||||
| 6,415,454 | ||||||||
| South Carolina-0.2% | ||||||||
| 415,000 | Greer Trust, South Carolina, Important Projects Revenue Bonds, Series A, 3.722%, 12/1/2031 | 408,850 | ||||||
| Tennessee-0.5% | ||||||||
| 1,000,000 | Tennessee State School Bond Authority, Qualified School Construction Bonds, 4.848%, 9/15/2027 | 1,114,460 | ||||||
| Texas-2.5% | ||||||||
| 500,000 | City of Austin, Electric Utility System, Build America Revenue Bonds, 5.086%, 11/15/2025 | 543,585 | ||||||
| 500,000 | City of El Paso, Texas, General Obligation Bonds,, 4.944%, 8/15/2033 | 539,160 | ||||||
| 500,000 | Corpus Christi, Texas, Taxable Certificates Obligation Bonds, Series B, 4.950%, 3/1/2038 | 538,675 | ||||||
| Shares/Principal Amount | Value | |||||||
| $ | 1,000,000 | North East Texas Independent School District, Qualified School Construction Bonds, 5.240%, 8/1/2027 | $ | 1,149,740 | ||||
| 545,000 | Texas State A & M University Revenue Bonds, Series C, 4.772%, 5/15/2033 | 580,005 | ||||||
| 2,195,000 | University of Texas System, Build America General Revenue Bonds, Series C, 4.125%, 8/15/2025 | 2,338,992 | ||||||
| 5,690,157 | ||||||||
| Utah-0.1% | ||||||||
| 250,000 | Utah Municipal Power Agency, Revenue Bonds, Series A, 3.237%, 7/1/2028 | 244,953 | ||||||
| West Virginia-0.3% | ||||||||
| Charles Town, West Virginia, Waterworks & Sewage System Revenue Bonds: | ||||||||
| 200,000 | Series D, 4.500%, 6/1/2023 | 199,114 | ||||||
| 345,000 | Series D, 5.000%, 6/1/2028 | 334,022 | ||||||
| 250,000 | West Virginia Housing Development Fund Revenue Bonds, 2.700%, 11/1/2023 | 243,493 | ||||||
| 776,629 | ||||||||
| Wisconsin-0.2% | ||||||||
| 430,000 | Stanley, Wisconsin, Water & Sewer System Revenue Bonds, Series A, 3.570%, 5/1/2031 | 420,600 | ||||||
| TOTAL TAXABLE MUNICIPAL BONDS | ||||||||
| (Cost $45,352,840) | 45,780,657 | |||||||
| NON-TAXABLE MUNICIPAL BONDS-0.6% | ||||||||
| -0.6% | ||||||||
| 1,000,000 | City of Columbus OH, 4.070%, 4/1/2033 | 1,039,870 | ||||||
| 305,000 | City of Wauwatosa WI, 4.200%, 11/1/2034 | 314,733 | ||||||
| 1,354,603 | ||||||||
| TOTAL NON-TAXABLE MUNICIPAL BONDS | ||||||||
| (Cost $1,305,000) | 1,354,603 | |||||||
| Annual Report | December 31, 2018 | |
37 |
Portfolio of Investments
| WesMark Government Bond Fund | December 31, 2018 |
| Shares/Principal Amount | Value | |||||||
| SHORT TERM INVESTMENTS-0.8% | ||||||||
| Mutual Funds-0.8% | ||||||||
| 1,926,945 | Federated Government Obligations Fund 7-Day Yield 2.264% (at net asset value) | $ | 1,926,945 | |||||
| TOTAL SHORT TERM INVESTMENTS | ||||||||
| (Cost $1,926,945) | 1,926,945 | |||||||
| TOTAL INVESTMENTS-102.1% | ||||||||
| (Cost $239,457,214) | 235,095,226 | |||||||
| OTHER ASSETS AND LIABILITIES-NET(2)-(2.1)% | (4,845,029 | ) | ||||||
| NET ASSETS-100.0% | $ | 230,250,197 | ||||||
| (1) | Floating or variable rate security. The reference rate is described above. The Rate in effect as of December 31, 2018 is based on the reference rate plus the displayed spread as of the security's last reset date. |
| (2) | Assets, other than investments in securities, less liabilities. |
| Note - | The categories of investments are shown as a percentage of net assets at December 31, 2018. |
See Notes to Financial Statements which are an integral part of the Financial Statements.
| 38 | |
www.wesmarkfunds.com |
Portfolio of Investments Summary Table
| December 31, 2018 (Unaudited) | WesMark West Virginia Municipal Bond Fund |
At December 31, 2018, the Fund's Portfolio Composition(1) was as follows:
| Portfolio Composition | Percentage of Total Net Assets |
| MUNICIPAL BONDS | 99.3% |
| SHORT TERM INVESTMENTS(2) | 0.0%(2) |
| OTHER ASSETS AND LIABILITIES - NET(3) | 0.7% |
| TOTAL NET ASSETS | 100.0% |
| Years to Maturity of Municipal Bonds | Percentage of Total Net Assets |
| Less than 1 Year | 1.6% |
| 1-3 Years | 7.2% |
| 3-5 Years | 12.3% |
| 5-10 Years | 44.5% |
| 10 Years or Greater | 33.7% |
| Short Term Investments(2) | 0.0%(3) |
| Other Assets and Liabilities - Net(4) | 0.7% |
| TOTAL | 100.0% |
S&P Ratings of Municipal Bonds as Percentage of Total Net Assets (5) |
|
| AAA | 11.8% |
| AA | 32.2% |
| A | 22.2% |
| Not rated by S&P | 33.1% |
| Short Term Investments(2) | 0.0%(3) |
| Other Assets and Liabilities - Net(4) | 0.7% |
| TOTAL PORTFOLIO VALUE | 100.0% |
Moody's Ratings of Municipal Bonds as Percentage of Total Net Assets (5) |
|
| Aaa | 4.5% |
| Aa | 23.6% |
| A | 32.6% |
| B | 0.6% |
| Not rated by Moody's | 38.0% |
| Short Term Investments(2) | 0.0%(3) |
| Other Assets and Liabilities - Net(4) | 0.7% |
| TOTAL PORTFOLIO VALUE | 100.0% |
| (1) | See the Fund's Prospectus and Statement of Additional Information for a description of the types of securities in which the Fund invests. |
| (2) | Short Term Investments include investment in a money market mutual fund. |
| (2) | Amount represents less than 0.05% of net assets. |
| (3) | Assets, other than investments in securities, less liabilities. |
| (3) | These tables depict the long-term credit-quality ratings assigned to the Fund’s portfolio holdings by Standard & Poor’s (S&P) and Moody’s Investors Service (Moody’s), each of which is a Nationally Recognized Statistical Rating Organization (NRSRO). These credit-quality ratings are shown without regard to gradations within a given rating category. For example, securities rated “A-” have been included in the “A” rated category. Rated securities that have been prerefunded, but not rated again by the NRSRO, have been included in the “Not rated by…” category. |
Rated securities include a security with an obligor and/or credit enhancer that has received a rating from an NRSRO with respect to a class of debt obligations that is comparable in priority and security with the security held by the Fund. Credit-quality ratings are an assessment of the risk that a security will default in payment and do not address other risks presented by the security. Please see the descriptions of credit-quality ratings in the Fund’s Statement of Additional Information. Holdings that are rated only by a different NRSRO than the one identified have been included in the “Not rated by…” category.
| Annual Report | December 31, 2018 | |
39 |
Portfolio of Investments
| WesMark West Virginia Municipal Bond Fund | December 31, 2018 |
| Shares/Principal Amount | Value | |||||||
| MUNICIPAL BONDS-99.3% | ||||||||
| Alabama-0.9% | ||||||||
| $ | 930,000 | City of Huntsville, Alabama, General Obligation Limited Bonds, Series B, 4.000%, 6/1/2027 | $ | 989,725 | ||||
| Arizona-0.5% | ||||||||
| 500,000 | City of Phoenix, Arizona, Civic Improvement Corp., Water System Revenue Bonds, 5.000%, 7/1/2025 | 535,815 | ||||||
| Ohio-1.1% | ||||||||
| 1,100,000 | Westerville, Ohio, General Obligation Limited Bonds, 5.000%, 12/1/2028 | 1,256,893 | ||||||
| West Virginia-96.8% | ||||||||
| 1,500,000 | Berkeley County Public Service Sewer District, 4.500%, 10/1/2032 | 1,602,855 | ||||||
| Berkeley County, West Virginia, Board of Education General Obligation Unlimited Bonds: | ||||||||
| 1,170,000 | 3.375%, 5/1/2022 | 1,191,423 | ||||||
| 400,000 | 4.000%, 5/1/2024 | 411,592 | ||||||
| 300,000 | Berkeley County, West Virginia, Building Commission Lease Revenue Bonds (County Facility Project), 3.000%, 12/1/2029 | 300,294 | ||||||
| Berkeley County, West Virginia, Building Commission Lease Revenue Bonds (Judicial Center Project): | ||||||||
| 200,000 | Series B, 2.400%, 12/1/2022 | 201,756 | ||||||
| 100,000 | Series B, 2.600%, 12/1/2023 | 101,236 | ||||||
| 100,000 | Series B, 2.800%, 12/1/2024 | 101,420 | ||||||
| Berkeley County, West Virginia, Public Service District Revenue Bonds: | ||||||||
| 370,000 | Series C, 3.000%, 12/1/2029 | 374,288 | ||||||
| 450,000 | Series C, 3.400%, 12/1/2034 | 453,024 | ||||||
| 345,000 | Series D, 3.000%, 12/1/2024 | 358,914 | ||||||
| 585,000 | Series D, 3.000%, 12/1/2025 | 606,838 | ||||||
| 380,000 | Berkeley County, West Virginia, Public Service District Water Revenue Bonds, Series A, 4.500%, 12/1/2033 | 413,227 | ||||||
| Shares/Principal Amount | Value | |||||||
| Berkeley County, West Virginia, Public Service Sewer District Revenue Bonds: | ||||||||
| $ | 275,000 | 5.000%, 6/1/2027 | $ | 319,022 | ||||
| 950,000 | 5.000%, 6/1/2028 | 1,094,476 | ||||||
| 655,000 | 5.000%, 6/1/2029 | 751,298 | ||||||
| 620,000 | Series A, 5.300%, 3/1/2029 | 621,568 | ||||||
| 285,000 | Series C, 3.500%, 10/1/2025 | 286,790 | ||||||
| Brooke County, West Virginia, Board of Education General Obligation Unlimited Bonds: | ||||||||
| 1,065,000 | 4.000%, 6/1/2025 | 1,170,999 | ||||||
| 1,100,000 | 3.000%, 6/1/2026 | 1,135,013 | ||||||
| 965,000 | 3.000%, 6/1/2027 | 988,218 | ||||||
| 100,000 | 3.000%, 6/1/2030 | 100,172 | ||||||
| Calhoun County, West Virginia, Board of Education General Obligation Unlimited Bonds (Public Schools): | ||||||||
| 195,000 | 3.600%, 6/1/2024 | 201,813 | ||||||
| 205,000 | 3.750%, 6/1/2025 | 212,497 | ||||||
| 215,000 | 3.850%, 6/1/2026 | 222,848 | ||||||
| 265,000 | City of Buckhannon, West Virginia, Commercial Development Revenue Bonds, Series A, 3.700%, 12/1/2028 | 263,039 | ||||||
| 595,000 | City of Buckhannon, West Virginia, Waterworks Revenue Bonds, Series A, 4.000%, 3/1/2029 | 601,848 | ||||||
| City of Charles Town, West Virginia, Waterworks & Sewage System Revenue Bonds: | ||||||||
| 185,000 | Series A, 3.000%, 3/1/2025 | 190,141 | ||||||
| 190,000 | Series A, 3.000%, 3/1/2026 | 194,807 | ||||||
| 620,000 | Series A, 4.000%, 3/1/2029 | 661,726 | ||||||
| 405,000 | Series A, 3.500%, 12/1/2030 | 412,687 | ||||||
| 260,000 | Series B, 3.000%, 10/1/2028 | 262,556 | ||||||
| 310,000 | Series B, 4.000%, 6/1/2031 | 327,289 | ||||||
| 135,000 | Series E, 3.000%, 6/1/2023 | 134,005 | ||||||
| 135,000 | Series E, 3.300%, 6/1/2025 | 134,534 | ||||||
| 125,000 | Series E, 3.400%, 6/1/2026 | 124,106 | ||||||
| City of Charleston, West Virginia, Sewage System Revenue Bonds: | ||||||||
| 310,000 | 4.000%, 7/1/2031 | 330,240 | ||||||
| 275,000 | 4.000%, 7/1/2032 | 292,006 | ||||||
| 40 | |
www.wesmarkfunds.com |
Portfolio of Investments
| December 31, 2018 | WesMark West Virginia Municipal Bond Fund |
| Shares/Principal Amount | Value | |||||||
| City of Clarksburg, West Virginia, Water Revenue Bonds: | ||||||||
| $ | 600,000 | Series A, 2.200%, 9/1/2019 | $ | 597,414 | ||||
| 170,000 | Series E, 3.000%, 6/1/2020 | 170,068 | ||||||
| 180,000 | Series E, 3.000%, 6/1/2022 | 179,015 | ||||||
| City of Fairmont, West Virginia Water Revenue Bonds: | ||||||||
| 520,000 | 2.700%, 7/1/2022 | 520,967 | ||||||
| 500,000 | 4.000%, 7/1/2024 | 505,490 | ||||||
| 605,000 | 3.000%, 7/1/2025 | 606,210 | ||||||
| 575,000 | 3.100%, 7/1/2026 | 576,064 | ||||||
| 1,000,000 | 3.150%, 7/1/2027 | 1,001,170 | ||||||
| City of Huntington, West Virginia, Sewerage System Revenue Bonds: | ||||||||
| 300,000 | 3.000%, 11/1/2026 | 304,923 | ||||||
| 300,000 | 3.000%, 11/1/2028 | 300,912 | ||||||
| 120,000 | City of Kingwood, West Virginia, Sewer System Revenue Bonds, 4.000%, 10/1/2020 | 120,089 | ||||||
| City of Martinsburg, West Virginia, Combined Waterworks & Sewerage System Revenue Bonds: | ||||||||
| 250,000 | Series A, 3.000%, 9/1/2023 | 250,198 | ||||||
| 490,000 | Series A, 3.500%, 9/1/2027 | 490,583 | ||||||
| City of Saint Albans, West Virginia, Combined Waterworks & Sewerage System Revenue Bonds: | ||||||||
| 220,000 | Series A, 4.250%, 6/1/2026 | 230,525 | ||||||
| 600,000 | Series B, 4.000%, 12/1/2027 | 616,932 | ||||||
| City of Wheeling, West Virginia, Waterworks & Sewerage System Revenue Bonds: | ||||||||
| 500,000 | 4.000%, 6/1/2026 | 526,640 | ||||||
| 535,000 | Series A, 3.000%, 6/1/2029 | 541,003 | ||||||
| 555,000 | Series A, 3.000%, 6/1/2030 | 558,546 | ||||||
| Claywood Park Public Service District, West Virginia, Water Revenue Bonds: | ||||||||
| 110,000 | Series C, 3.200%, 11/1/2029 | 107,724 | ||||||
| 225,000 | Series C, 3.400%, 11/1/2031 | 221,083 | ||||||
| 380,000 | Corporation of Shepherdstown, West Virginia, Water Revenue Bonds, 3.300%, 3/1/2032 | 380,327 | ||||||
| Shares/Principal Amount | Value | |||||||
| Fairmont State University, West Virginia, Revenue Bonds: | ||||||||
| $ | 725,000 | Series A, 5.000%, 6/1/2022 | $ | 772,582 | ||||
| 765,000 | Series A, 5.000%, 6/1/2024 | 859,982 | ||||||
| 1,400,000 | Series B, 3.000%, 6/1/2024 | 1,416,590 | ||||||
| 1,000,000 | Series B, 3.100%, 6/1/2025 | 1,012,770 | ||||||
| 1,510,000 | Fayette County, West Virginia Board of Education Pass Through Certificates Revenue Bonds, 3.250%, 10/1/2033(1) | 1,506,014 | ||||||
| Hampshire County, West Virginia, Building Commission Revenue Bonds: | ||||||||
| 355,000 | Series A, 3.000%, 1/1/2029 | 330,441 | ||||||
| 380,000 | Series A, 3.000%, 1/1/2031 | 344,417 | ||||||
| 1,660,000 | Series A, 4.250%, 1/1/2035 | 1,689,631 | ||||||
| Jefferson County, West Virginia, Public Service Sewer District Revenue Bonds: | ||||||||
| 80,000 | Series A, 3.000%, 6/1/2020 | 80,012 | ||||||
| 135,000 | Series A, 3.250%, 6/1/2023 | 135,015 | ||||||
| Monongalia County, West Virginia, Building Commission Lease Revenue Bonds (Monongalia County Building): | ||||||||
| 300,000 | Series A, 4.000%, 2/1/2022 | 311,091 | ||||||
| 250,000 | Series A, 4.000%, 2/1/2023 | 259,397 | ||||||
| 450,000 | Series A, 3.000%, 2/1/2025 | 457,083 | ||||||
| 750,000 | Series A, 3.125%, 2/1/2026 | 761,865 | ||||||
| 1,430,000 | Morgantown, West Virginia, Combined Utility System Revenue Bonds, Series A, 3.500%, 12/1/2035 | 1,410,180 | ||||||
| 200,000 | Morgantown, West Virginia, Combined Utility System Revenue Bonds, Series A, 3.750%, 10/1/2032 | 204,218 | ||||||
| Morgantown, West Virginia, Utility Board Revenue Bonds: | ||||||||
| 1,000,000 | Series A, 3.000%, 12/1/2028 | 1,010,540 | ||||||
| 1,000,000 | Series A, 4.000%, 12/1/2029 | 1,071,390 | ||||||
| 1,210,000 | Series A, 4.000%, 12/1/2030 | 1,288,481 | ||||||
| 1,000,000 | Series A, 4.000%, 12/1/2031 | 1,056,220 | ||||||
| 1,785,000 | Parkersburg, West Virginia, Waterworks & Sewer System Revenue Bonds, Series A, 3.000%, 8/1/2025 | 1,814,738 | ||||||
| Annual Report | December 31, 2018 | |
41 |
Portfolio of Investments
| WesMark West Virginia Municipal Bond Fund | December 31, 2018 |
| Shares/Principal Amount | Value | |||||||
| $ | 600,000 | Pleasants County, West Virginia, Board of Education General Obligation Unlimited Bonds (Public Schools), 4.000%, 5/1/2026 | $ | 625,056 | ||||
| 3,470,000 | Preston County Board of Education General Obligation Unlimited Bonds, 4.000%, 5/1/2026 | 3,614,907 | ||||||
| 265,000 | Putnam County, West Virginia, Public Service District Revenue Bonds, Series A, 3.500%, 4/1/2027 | 265,959 | ||||||
| 1,250,000 | Salem, West Virginia Sewer Revenue Bonds, Series A, 4.000%, 12/1/2032 | 1,285,912 | ||||||
| 500,000 | State of West Virginia, 5.000%, 6/1/2033 | 590,440 | ||||||
| Wayne County, West Virginia, Board of Education General Obligation Unlimited Bonds: | ||||||||
| 660,000 | 3.000%, 6/1/2022 | 682,090 | ||||||
| 1,220,000 | 3.000%, 6/1/2023 | 1,269,678 | ||||||
| 795,000 | 3.000%, 6/1/2026 | 816,211 | ||||||
| West Virginia Building Commission Lease Revenue Bonds (West Virginia Regional Jail): | ||||||||
| 3,000,000 | Series A, 5.375%, 7/1/2021 | 3,202,800 | ||||||
| 2,505,000 | Series C, 5.375%, 7/1/2021 | 2,674,338 | ||||||
| 500,000 | West Virginia Commissioner Of Highways Special Obligation Surface Transportation Improvements Bonds, Series A, 5.000%, 9/1/2029 | 591,235 | ||||||
| 670,000 | West Virginia Economic Development Authority Lease Revenue Bonds (Clarksburg Office Building), 3.500%, 6/1/2030 | 678,060 | ||||||
| 1,750,000 | West Virginia Economic Development Authority Lease Revenue Bonds (Correctional Juvenile & Public), 4.000%, 6/1/2024 | 1,822,293 | ||||||
| West Virginia Economic Development Authority Lease Revenue Bonds (Correctional Juvenile): | ||||||||
| 500,000 | 5.000%, 6/1/2022 | 533,545 | ||||||
| 1,000,000 | 4.000%, 6/1/2023 | 1,043,470 | ||||||
| Shares/Principal Amount | Value | |||||||
| West Virginia Economic Development Authority Lease Revenue Bonds (Department of Environmental Protection): | ||||||||
| $ | 1,280,000 | Series B, 3.375%, 11/1/2025 | $ | 1,322,982 | ||||
| 755,000 | Series B, 3.500%, 11/1/2026 | 780,980 | ||||||
| West Virginia Economic Development Authority Lease Revenue Bonds (State Energy Savings Project): | ||||||||
| 920,000 | 4.500%, 6/1/2020 | 921,886 | ||||||
| 860,000 | 4.750%, 6/1/2022 | 861,806 | ||||||
| 1,650,000 | West Virginia Economic Development Authority Lease Revenue Bonds (State Office Building & Parking Lot), Series A, 4.750%, 8/1/2029 | 1,676,681 | ||||||
| West Virginia Economic Development Authority Lease Revenue Bonds (State Office Building): | ||||||||
| 1,525,000 | Series A, 5.000%, 6/1/2025 | 1,661,930 | ||||||
| 315,000 | Series A, 3.375%, 6/1/2029 | 318,348 | ||||||
| 365,000 | Series B, 3.375%, 10/1/2023 | 376,056 | ||||||
| 390,000 | Series B, 3.500%, 10/1/2024 | 402,156 | ||||||
| 415,000 | Series B, 3.625%, 10/1/2025 | 428,189 | ||||||
| 435,000 | Series B, 3.750%, 10/1/2026 | 449,325 | ||||||
| 545,000 | Series C, 3.000%, 6/1/2023 | 561,835 | ||||||
| 310,000 | Series C, 3.500%, 6/1/2030 | 313,729 | ||||||
| 515,000 | Series D, 5.000%, 6/1/2025 | 595,108 | ||||||
| 600,000 | Series D, 3.250%, 6/1/2028 | 605,880 | ||||||
| 330,000 | Series D, 3.375%, 6/1/2029 | 333,508 | ||||||
| 355,000 | Series D, 3.500%, 6/1/2030 | 359,271 | ||||||
| West Virginia Economic Development Authority Lease Revenue Bonds (The Diamond Project): | ||||||||
| 500,000 | 3.000%, 12/15/2019 | 500,435 | ||||||
| 550,000 | 2.500%, 12/15/2022 | 550,154 | ||||||
| 200,000 | West Virginia Economic Development Authority Lease Revenue Bonds (West Virginia Facilities), Series A, 5.000%, 3/1/2019 | 200,612 | ||||||
| West Virginia Economic Development Authority Lottery Revenue Bonds: | ||||||||
| 305,000 | Series A, 5.000%, 6/15/2028 | 318,813 | ||||||
| 1,000,000 | Series A, 5.000%, 7/1/2032 | 1,163,650 | ||||||
| 42 | |
www.wesmarkfunds.com |
Portfolio of Investments
| December 31, 2018 | WesMark West Virginia Municipal Bond Fund |
| Shares/Principal Amount | Value | |||||||
| $ | 1,500,000 | West Virginia Higher Education Governing Board University Revenue Bonds (Marshall University), 5.000%, 5/1/2023 | $ | 1,556,820 | ||||
| West Virginia Higher Education Policy Commission Revenue Bonds (Higher Education Facilities): | ||||||||
| 1,730,000 | 5.000%, 7/1/2034 | 1,982,165 | ||||||
| 10,000 | Series A, 3.750%, 4/1/2019 | 10,050 | ||||||
| 225,000 | Series A, 3.750%, 4/1/2019 | 226,091 | ||||||
| 10,000 | Series A, 4.000%, 4/1/2020 | 10,273 | ||||||
| 395,000 | Series A, 4.000%, 4/1/2020 | 405,491 | ||||||
| 485,000 | Series A, 5.000%, 4/1/2026 | 504,187 | ||||||
| 360,000 | Series B, 3.200%, 4/1/2024 | 369,497 | ||||||
| 375,000 | Series B, 3.375%, 4/1/2025 | 386,692 | ||||||
| 385,000 | Series B, 3.500%, 4/1/2026 | 397,401 | ||||||
| 400,000 | Series B, 3.600%, 4/1/2027 | 412,484 | ||||||
| 290,000 | West Virginia Hospital Finance Authority Lease Revenue Bonds (Veterans Nursing Home), 5.500%, 3/1/2019 | 290,864 | ||||||
| 1,000,000 | West Virginia Hospital Finance Authority Revenue Bonds (ARCs Improvement), Series D, 4.000%, 6/1/2029 | 1,053,740 | ||||||
| 585,000 | West Virginia Hospital Finance Authority Revenue Bonds (West Virginia University Health System), Series A, 3.375%, 6/1/2029 | 595,951 | ||||||
| West Virginia Housing Development Fund Revenue Bonds: | ||||||||
| 325,000 | Series A, 3.600%, 5/1/2022 | 332,277 | ||||||
| 1,340,000 | Series A, 3.200%, 11/1/2023 | 1,359,537 | ||||||
| 45,000 | Series A, 3.800%, 11/1/2024 | 45,060 | ||||||
| West Virginia School Building Authority Excess Lottery Revenue Bonds: | ||||||||
| 500,000 | Series A, 3.000%, 7/1/2025 | 513,215 | ||||||
| 700,000 | Series A, 3.125%, 7/1/2026 | 719,285 | ||||||
| 370,000 | Series B, 4.000%, 7/1/2023 | 380,841 | ||||||
| West Virginia School Building Authority Lottery Revenue Capital Improvement Bonds: | ||||||||
| 500,000 | Series A, 5.000%, 7/1/2024 | 573,755 | ||||||
| 515,000 | Series A, 5.000%, 7/1/2026 | 577,562 | ||||||
| 535,000 | Series A, 5.000%, 7/1/2027 | 598,285 | ||||||
| Shares/Principal Amount | Value | |||||||
| $ | 300,000 | West Virginia State Bonds, Series A, 3.250%, 6/1/2033 | $ | 298,968 | ||||
| 500,000 | West Virginia State Economic Development Authority Lottery Revenue Bonds, 3.000%, 6/15/2031 | 493,845 | ||||||
| 500,000 | West Virginia State Hospital Finance Authority Refunding West Virginia United Health System, Series A, 4.000%, 6/1/2034 | 514,865 | ||||||
| 700,000 | West Virginia State Housing Development Bonds, Series B, 3.800%, 11/1/2035 | 709,499 | ||||||
| 500,000 | West Virginia State Housing Development Fund Revenue Bonds, Series A, Series A, 3.450%, 11/1/2033 | 501,065 | ||||||
| West Virginia State University Revenue Bonds: | ||||||||
| 335,000 | Series A, 3.000%, 10/1/2020 | 320,484 | ||||||
| 340,000 | Series A, 2.550%, 10/1/2021 | 313,208 | ||||||
| 1,150,000 | West Virginia State University Revenues Revenue Bonds, Series A, 5.250%, 4/1/2028 | 1,324,869 | ||||||
| West Virginia University Revenue Bonds (West Virginia University Project): | ||||||||
| 500,000 | Series A, 5.000%, 10/1/2027 | 549,660 | ||||||
| 345,000 | Series B, 5.000%, 10/1/2025 | 371,248 | ||||||
| 750,000 | Series B, 4.125%, 10/1/2031 | 778,065 | ||||||
| 500,000 | West Virginia Water Development Authority Infrastructure Revenue Bonds, Series A, 5.000%, 10/1/2032 | 559,825 | ||||||
| 2,605,000 | West Virginia Water Development Authority Infrastructure Revenue Bonds (West Virginia Infrastructure Jobs Program), Series A, 5.000%, 10/1/2029 | 2,979,964 | ||||||
| 435,000 | West Virginia Water Development Authority Revenue Bonds (Chesapeake Bay/Greenbrier River Project), Series A, 5.000%, 7/1/2022 | 478,987 | ||||||
| Annual Report | December 31, 2018 | |
43 |
Portfolio of Investments
| WesMark West Virginia Municipal Bond Fund | December 31, 2018 |
| Shares/Principal Amount | Value | |||||||
| $ | 250,000 | West Virginia Water Development Authority Revenue Bonds (Loan Program I), Series B-I, 4.000%, 11/1/2024 | $ | 267,853 | ||||
| 1,395,000 | West Virginia Water Development Authority Revenue Bonds (Loan Program), Series B-I, 4.000%, 11/1/2025 | 1,489,316 | ||||||
| West Virginia Water Development Authority Revenue Bonds (Loan Program II): | ||||||||
| 605,000 | Series A-II, 3.000%, 11/1/2024 | 622,836 | ||||||
| 600,000 | Series A-II, 3.250%, 11/1/2025 | 618,402 | ||||||
| 550,000 | Series A-II, 5.000%, 11/1/2025 | 640,673 | ||||||
| 650,000 | Series A-II, 5.000%, 11/1/2026 | 765,869 | ||||||
| 800,000 | Series A-II, 3.000%, 11/1/2027 | 823,664 | ||||||
| 300,000 | Series A-II, 3.125%, 11/1/2028 | 303,429 | ||||||
| 725,000 | Series B-II, 4.000%, 11/1/2025 | 774,017 | ||||||
| 250,000 | West Virginia Water Development Authority Revenue Bonds (Loan Program IV), Series A-IV, 5.000%, 11/1/2033 | 292,745 | ||||||
| 500,000 | West Virginia, State Parkways Authority Senior Turnpike Toll Revenue Bonds, 5.000%, 6/1/2033 | 588,630 | ||||||
| 1,000,000 | Wood County, West Virginia, Board of Education Public School General Obligation Unlimited Bonds, 3.000%, 6/1/2029 | 1,008,890 | ||||||
| 860,000 | Wood County, West Virginia, Building Commission Lease Revenue Bonds, 4.000%, 1/1/2032 | 882,721 | ||||||
| 110,723,553 | ||||||||
| TOTAL MUNICIPAL BONDS | ||||||||
| (Cost $111,995,462) | 113,505,986 | |||||||
| SHORT TERM INVESTMENTS-0.0% | ||||||||
| Mutual Funds-0.0% | ||||||||
| 23,075 | Federated Government Obligations Fund 7-Day Yield 2.264% (at net asset value) | 23,075 | ||||||
| TOTAL SHORT TERM INVESTMENTS | ||||||||
| (Cost $23,075) | 23,075 | |||||||
| Shares/Principal Amount | Value | |||
| TOTAL INVESTMENTS-99.3% | ||||
| (Cost $112,018,537) | $ | 113,529,061 | ||
| OTHER ASSETS AND LIABILITIES-NET(2)-0.7% | 815,737 | |||
| NET ASSETS-100.0% | $ | 114,344,798 | ||
| (1) | Security exempt from registration under rule 144A of the Securities Act of 1933. These securities may be resold in transactions exempt from registration, normally to qualified institutional buyers. At December 31, 2018, these securities amounted to a value of $1,506,014 or 1.32% of net assets. |
| (2) | Assets, other than investments in securities, less liabilities. |
| Note - | The categories of investments are shown as a percentage of net assets at December 31, 2018. |
See Notes to Financial Statements which are an integral part of the Financial Statements.
| 44 | |
www.wesmarkfunds.com |
Portfolio of Investments Summary Table
| December 31, 2018 (Unaudited) | WesMark Tactical Opportunity Fund |
At December 31, 2018, the Fund's Portfolio Composition(1) was as follows:
| Portfolio Composition |
Percentage of Total Net Assets |
| EXCHANGE TRADED FUNDS | 93.7% |
| SHORT TERM INVESTMENTS(2) | 4.6% |
| OTHER ASSETS AND LIABILITIES - NET(3) | 1.7% |
| TOTAL NET ASSETS | 100.0% |
At December 31, 2018, the Fund's Category composition(4) was as follows:
| Category Composition |
Percentage of Total Net Assets |
| Broad Domestic Fixed Income | 36.6% |
| U.S. Sector Focused Equity | 33.3% |
| U.S. Value Company Focused Equity | 12.0% |
| International (ex. U.S.) Equity | 5.9% |
| Commodities | 3.0% |
| U.S. Small and Mid Cap Equity | 2.9% |
| Portfolio Sub-Total | 93.7% |
| Short Term Investments(2) | 4.6% |
| Other Assets and Liabilities - Net(3) | 1.7% |
| Total Net Assets | 100.0% |
| (1) | See the Fund's Prospectus and Statement of Additional Information for a description of the types of securities in which the Fund invests. |
| (2) | Short Term Investments include investment in a money market mutual fund. |
| (3) | Assets, other than investments in securities, less liabilities. |
| (4) | Securities are assigned to a category classification by the Fund's advisor. |
| Annual Report | December 31, 2018 | |
45 |
Portfolio of Investments
| WesMark Tactical Opportunity Fund | December 31, 2018 |
| Shares/Principal Amount | Value | |||||||
| EXCHANGE TRADED FUNDS-93.7% | ||||||||
| BROAD DOMESTIC FIXED INCOME-36.6% | ||||||||
| 44,933 | Invesco Variable Rate Preferred ETF | $ | 1,025,371 | |||||
| 2,935 | iShares 20+ Year Treasury Bond ETF | 356,632 | ||||||
| 18,027 | iShares® Core U.S. Aggregate Bond ETF | 1,919,695 | ||||||
| 75,392 | iShares® Floating Rate Bond ETF | 3,796,741 | ||||||
| 75,611 | Vanguard® Total Bond Market ETF | 5,989,148 | ||||||
| TOTAL BROAD DOMESTIC FIXED INCOME | 13,087,587 | |||||||
| COMMODITIES-3.0% | ||||||||
| 8,916 | SPDR® Gold Shares(1) | 1,081,065 | ||||||
| TOTAL COMMODITIES | 1,081,065 | |||||||
| INTERNATIONAL (EX. U.S.) EQUITY-5.9% | ||||||||
| 22,604 | iShares® Edge MSCI USA Quality Factor ETF | 1,735,083 | ||||||
| 6,468 | iShares® MSCI EAFE ETF | 380,189 | ||||||
| TOTAL INTERNATIONAL (EX. U.S.) EQUITY | 2,115,272 | |||||||
| U.S. SECTOR FOCUSED EQUITY-33.3% | ||||||||
| 32,649 | Consumer Staples Select Sector SPDR Fund | 1,657,916 | ||||||
| 9,073 | Energy Select Sector SPDR® Fund | 520,337 | ||||||
| 34,071 | Financial Select Sector SPDR® Fund | 811,571 | ||||||
| 19,170 | Health Care Select Sector SPDR® Fund | 1,658,397 | ||||||
| 3,066 | iShares® U.S. Medical Devices ETF | 612,617 | ||||||
| 3,350 | iShares® U.S. Pharmaceuticals ETF | 471,579 | ||||||
| 24,668 | SPDR® S&P 500® ETF Trust | 6,165,027 | ||||||
| TOTAL U.S. SECTOR FOCUSED EQUITY | 11,897,444 | |||||||
| U.S. SMALL AND MID CAP EQUITY-2.9% | ||||||||
| 7,697 | iShares® Russell 2000® ETF | 1,030,628 | ||||||
| TOTAL U.S. SMALL AND MID CAP EQUITY | 1,030,628 | |||||||
| U.S. VALUE COMPANY FOCUSED EQUITY-12.0% | ||||||||
| 59,896 | Vanguard® Mega Cap Value ETF | 4,280,767 | ||||||
| Shares/Principal Amount | Value | |||||||
| TOTAL U.S. VALUE COMPANY FOCUSED EQUITY | $ | 4,280,767 | ||||||
| TOTAL EXCHANGE TRADED FUNDS | ||||||||
| (Cost $34,456,342) | 33,492,763 | |||||||
| SHORT TERM INVESTMENTS-4.6% | ||||||||
| Mutual Funds-4.6% | ||||||||
| 1,641,963 | Federated Government Obligations Fund 7-Day Yield 2.264% (at net asset value) | 1,641,963 | ||||||
| TOTAL SHORT TERM INVESTMENTS | ||||||||
| (Cost $1,641,963) | 1,641,963 | |||||||
| TOTAL INVESTMENTS-98.3% | ||||||||
| (Cost $36,098,305) | 35,134,726 | |||||||
| OTHER ASSETS AND LIABILITIES-NET(2)-1.7% | 599,701 | |||||||
| NET ASSETS-100.0% | $ | 35,734,427 | ||||||
| (1) | Non-income producing security. |
| (2) | Assets, other than investments in securities, less liabilities. |
| Note - | The categories of investments are shown as a percentage of net assets at December 31, 2018. |
See Notes to Financial Statements which are an integral part of the Financial Statements.
| 46 | |
www.wesmarkfunds.com |
Statements of Assets and Liabilities
December 31, 2018
WesMark Small Company Growth Fund | WesMark Growth Fund | WesMark Balanced Fund | WesMark Government Bond Fund | WesMark West Virginia Municipal Bond Fund | WesMark Tactical Opportunity Fund | |||||||||||||||||||
| ASSETS: | ||||||||||||||||||||||||
| Investments in securities, at value (cost - see below) | $ | 78,485,081 | $ | 276,232,012 | $ | 95,737,850 | $ | 235,095,226 | $ | 113,529,061 | $ | 35,134,726 | ||||||||||||
| Cash | 16,959 | 39,547 | 12,835 | 3,108 | 2,745 | 8,333 | ||||||||||||||||||
| RECEIVABLE FOR: | ||||||||||||||||||||||||
| Dividends and interest | 24,837 | 291,340 | 382,648 | 1,195,970 | 997,536 | 35,512 | ||||||||||||||||||
| Investments sold | – | – | 7,265,152 | – | – | – | ||||||||||||||||||
| Fund shares sold | 3,493,012 | 12,813,206 | 2,338,338 | 894,016 | 22,618 | 1,246,520 | ||||||||||||||||||
| Prepaid expenses | 9,876 | 25,889 | 9,695 | 18,311 | 8,762 | 3,069 | ||||||||||||||||||
| Total Assets | 82,029,765 | 289,401,994 | 105,746,518 | 237,206,631 | 114,560,722 | 36,428,160 | ||||||||||||||||||
| LIABILITIES: | ||||||||||||||||||||||||
| PAYABLE FOR: | ||||||||||||||||||||||||
| Investments purchased | 298,850 | – | 2,512,685 | – | – | 350,037 | ||||||||||||||||||
| Fund shares redeemed | 235,000 | 1,841,785 | 1,273,229 | 6,696,354 | 72,331 | 305,843 | ||||||||||||||||||
| Income distribution payable | – | – | – | 149,019 | 69,459 | – | ||||||||||||||||||
| Investment advisory fees | 1 | – | 2 | 11 | – | 1 | ||||||||||||||||||
| Fund Accounting and Administration fees | 11,309 | 19,493 | 16,217 | 32,772 | 24,222 | 8,029 | ||||||||||||||||||
| Audit, Tax, and Legal expenses | 19,616 | 19,615 | 19,615 | 19,615 | 19,615 | 19,615 | ||||||||||||||||||
| Shareholder services fee (Note 5) | 19,083 | 68,580 | 23,392 | 51,510 | 24,830 | 7,080 | ||||||||||||||||||
| Transfer agency expenses | 4,848 | 9,284 | 6,125 | 5,185 | 3,175 | 1,735 | ||||||||||||||||||
| Registration expenses | 98 | – | 430 | – | 271 | – | ||||||||||||||||||
| Printing and Postage expenses | 1,308 | 1,373 | 1,353 | 1,316 | 1,368 | 1,098 | ||||||||||||||||||
| Trustees' fees and expenses | 139 | 139 | 139 | 139 | 139 | 139 | ||||||||||||||||||
| Chief compliance officer fees | 513 | 513 | 513 | 513 | 513 | – | ||||||||||||||||||
| Other accrued liabilities and expenses | 295 | 428 | 67 | – | 1 | 156 | ||||||||||||||||||
| Total Liabilities | 591,060 | 1,961,210 | 3,853,767 | 6,956,434 | 215,924 | 693,733 | ||||||||||||||||||
| Net Assets | $ | 81,438,705 | $ | 287,440,784 | $ | 101,892,751 | $ | 230,250,197 | $ | 114,344,798 | $ | 35,734,427 | ||||||||||||
| Annual Report | December 31, 2018 | |
47 |
Statements of Assets and Liabilities
December 31, 2018
WesMark Small Company Growth Fund | WesMark Growth Fund | WesMark Balanced Fund | WesMark Government Bond Fund | WesMark West Virginia Municipal Bond Fund | WesMark Tactical Opportunity Fund | |||||||||||||||||||
| NET ASSETS CONSIST OF : | ||||||||||||||||||||||||
| Paid-in capital | $ | 63,007,574 | $ | 182,476,453 | $ | 87,055,107 | $ | 235,898,130 | $ | 112,883,100 | $ | 36,856,989 | ||||||||||||
| Total distributable earnings | $ | 18,431,131 | $ | 104,964,331 | $ | 14,837,644 | $ | (5,647,933 | ) | $ | 1,461,698 | $ | (1,122,562 | ) | ||||||||||
| Net Assets | $ | 81,438,705 | $ | 287,440,784 | $ | 101,892,751 | $ | 230,250,197 | $ | 114,344,798 | $ | 35,734,427 | ||||||||||||
| Shares Outstanding, No Par Value, Unlimited Shares Authorized | 7,661,268 | 17,113,189 | 8,653,836 | 23,786,449 | 11,010,897 | 3,571,479 | ||||||||||||||||||
| Net asset value, offering price & redemption price per share | $ | 10.63 | $ | 16.80 | $ | 11.77 | $ | 9.68 | $ | 10.38 | $ | 10.01 | ||||||||||||
| Investments, at identified cost | $ | 59,357,813 | $ | 168,252,168 | $ | 81,255,338 | $ | 239,457,214 | $ | 112,018,537 | $ | 36,098,305 | ||||||||||||
See Notes to Financial Statements which are an integral part of the Financial Statements.
| 48 | |
www.wesmarkfunds.com |
Statements of Operations
For the Year Ended December 31, 2018
WesMark Small Company Growth Fund | WesMark Growth Fund | WesMark Balanced Fund | WesMark Government Bond Fund | WesMark West Virginia Municipal Bond Fund | WesMark Tactical Opportunity Fund | |||||||||||||||||||
| INVESTMENT INCOME: | ||||||||||||||||||||||||
| Dividends, net of foreign taxes* | $ | 736,112 | $ | 4,207,740 | $ | 2,058,816 | $ | – | $ | – | $ | 660,772 | ||||||||||||
| Interest | 80,746 | 297,754 | 1,274,438 | 6,703,894 | 3,548,036 | 31,271 | ||||||||||||||||||
| Total Investment Income | 816,858 | 4,505,494 | 3,333,254 | 6,703,894 | 3,548,036 | 692,043 | ||||||||||||||||||
| EXPENSES: | ||||||||||||||||||||||||
| Investment adviser fee (Note 5) | 754,805 | 2,556,167 | 853,004 | 1,428,561 | 689,238 | 247,066 | ||||||||||||||||||
| Fund Accounting and Administration fees (Note 5) | 105,153 | 210,307 | 120,323 | 203,047 | 139,099 | 73,152 | ||||||||||||||||||
| Custodian fees (Note 5) | 22,334 | 42,702 | 18,888 | 30,938 | 17,862 | 12,585 | ||||||||||||||||||
| Transfer agency expenses (Note 5) | 33,162 | 56,587 | 40,249 | 34,963 | 25,393 | 16,982 | ||||||||||||||||||
| Trustees' fees and expenses (Note 8) | 23,680 | 45,538 | 24,662 | 35,835 | 24,647 | 17,084 | ||||||||||||||||||
| Audit and tax expenses | 18,928 | 18,928 | 18,928 | 18,928 | 18,928 | 18,928 | ||||||||||||||||||
| Legal expenses | 16,749 | 16,749 | 16,749 | 16,749 | 23,224 | 17,249 | ||||||||||||||||||
| Shareholder services fee (Note 5) | 251,602 | 852,055 | 284,334 | 595,234 | 287,183 | 82,355 | ||||||||||||||||||
| Registration expenses | 13,702 | 15,034 | 14,551 | 14,055 | 6,985 | 12,896 | ||||||||||||||||||
| Printing and Postage expenses | 5,589 | 5,659 | 5,646 | 5,598 | 5,649 | 5,373 | ||||||||||||||||||
| Insurance premiums | 4,462 | 15,646 | 5,195 | 11,236 | 5,310 | 1,137 | ||||||||||||||||||
| Offering costs | – | – | – | – | – | 7,255 | ||||||||||||||||||
| Miscellaneous | 3,868 | 12,961 | 4,340 | 10,034 | 4,721 | 341 | ||||||||||||||||||
| Net Expenses | 1,254,034 | 3,848,333 | 1,406,869 | 2,405,178 | 1,248,239 | 512,403 | ||||||||||||||||||
| Net Investment Income (Loss) | (437,176 | ) | 657,161 | 1,926,385 | 4,298,716 | 2,299,797 | 179,640 | |||||||||||||||||
| REALIZED & UNREALIZED GAIN (LOSS) ON INVESTMENTS: | ||||||||||||||||||||||||
| Net realized gain (loss) on investments | 7,797,858 | 13,415,426 | 3,685,453 | 120,468 | (48,870 | ) | (316,415 | ) | ||||||||||||||||
| Net realized gain on written options | – | 369,446 | 73,038 | – | – | 129,935 | ||||||||||||||||||
| Net change in unrealized appreciation (depreciation) of investments | (20,968,952 | ) | (33,265,091 | ) | (10,647,827 | ) | (1,931,374 | ) | (1,621,537 | ) | (2,102,095 | ) | ||||||||||||
| Net change in unrealized appreciation (depreciation) of written options | – | – | (437 | ) | – | – | 8,189 | |||||||||||||||||
| Net realized and unrealized loss on investments | (13,171,094 | ) | (19,480,219 | ) | (6,889,773 | ) | (1,810,906 | ) | (1,670,407 | ) | (2,280,386 | ) | ||||||||||||
| Net Increase (Decrease) in Net Assets Resulting from Operations | $ | (13,608,270 | ) | $ | (18,823,058 | ) | $ | (4,963,388 | ) | $ | 2,487,810 | $ | 629,390 | $ | (2,100,746 | ) | ||||||||
| *Foreign tax withholding | $ | – | $ | 57,067 | $ | 56,216 | $ | – | $ | – | $ | – | ||||||||||||
See Notes to Financial Statements which are an integral part of the Financial Statements.
| Annual Report | December 31, 2018 | |
49 |
Statements of Changes in Net Assets
WesMark Small Company Growth Fund | WesMark Growth Fund | |||||||||||||||
For the Year Ended December 31, 2018 | For the Year Ended December 31, 2017 | For the Year Ended December 31, 2018 | For the Year Ended December 31, 2017 | |||||||||||||
| INCREASE (DECREASE) IN NET ASSETS FROM: | ||||||||||||||||
| OPERATIONS | ||||||||||||||||
| Net investment income (loss) | $ | (437,176 | ) | $ | (325,865 | ) | $ | 657,161 | $ | 429,422 | ||||||
| Net realized gain | 7,797,858 | 9,413,297 | 13,784,872 | 36,207,421 | ||||||||||||
| Net change in unrealized appreciation (depreciation) | (20,968,952 | ) | 3,403,235 | (33,265,091 | ) | 36,564,067 | ||||||||||
| Net increase (decrease) in net assets resulting from operations | (13,608,270 | ) | 12,490,667 | (18,823,058 | ) | 73,200,910 | ||||||||||
| DISTRIBUTIONS TO SHAREHOLDERS (NOTE 4) | ||||||||||||||||
| From distributable earnings | (9,403,046 | ) | (8,287,704 | )(1) | (30,494,326 | ) | (26,466,579 | )(2) | ||||||||
| Decrease in net assets from distributions to shareholders | (9,403,046 | ) | (8,287,704 | ) | (30,494,326 | ) | (26,466,579 | ) | ||||||||
| BENEFICIAL INTEREST TRANSACTIONS (NOTE 3) | ||||||||||||||||
| Proceeds from sale of shares | 10,491,950 | 7,484,940 | 28,385,215 | 18,410,412 | ||||||||||||
| Shares issued in reinvestment of distributions | 3,198,515 | 2,880,502 | 10,179,268 | 8,466,142 | ||||||||||||
| Cost of shares redeemed | (10,301,181 | ) | (10,243,511 | ) | (49,788,102 | ) | (39,696,558 | ) | ||||||||
| Net increase (decrease) resulting from beneficial interest transactions | 3,389,284 | 121,931 | (11,223,619 | ) | (12,820,004 | ) | ||||||||||
| Net Increase (Decrease) in Net Assets | (19,622,032 | ) | 4,324,894 | (60,541,003 | ) | 33,914,327 | ||||||||||
| NET ASSETS: | ||||||||||||||||
| Beginning of Year | 101,060,737 | 96,735,843 | 347,981,787 | 314,067,460 | ||||||||||||
| End of Year | $ | 81,438,705 | $ | 101,060,737 | (3) | $ | 287,440,784 | $ | 347,981,787 | (4) | ||||||
| (1) | For the prior year ended December 31, 2017, Total Distributions consisted of Net Investment Income $0, and Net Realized Gains $8,287,704. |
| (2) | For the prior year ended December 31, 2017, Total Distributions consisted of Net Investment Income $452,847, and Net Realized Gains $26,013,732. |
| (3) | For the prior year ended December 31, 2017, net assets included accumulated net investment income of $17,813. |
| (4) | For the prior year ended December 31, 2017, net assets included accumulated net investment income of $–. |
See Notes to Financial Statements which are an integral part of the Financial Statements.
| 50 | |
www.wesmarkfunds.com |
Statements of Changes in Net Assets
WesMark Balanced Fund | WesMark Government Bond Fund | |||||||||||||||
For the Year Ended December 31, 2018 | For the Year Ended December 31, 2017 | For the Year Ended December 31, 2018 | For the Year Ended December 31, 2017 | |||||||||||||
| INCREASE (DECREASE) IN NET ASSETS FROM: | ||||||||||||||||
| OPERATIONS | ||||||||||||||||
| Net investment income | $ | 1,926,385 | $ | 1,915,186 | $ | 4,298,716 | $ | 5,425,174 | ||||||||
| Net realized gain (loss) | 3,758,491 | 3,148,694 | 120,468 | (1,497,428 | ) | |||||||||||
| Net change in unrealized appreciation (depreciation) | (10,648,264 | ) | 6,558,033 | (1,931,374 | ) | (973,959 | ) | |||||||||
| Net increase (decrease) in net assets resulting from operations | (4,963,388 | ) | 11,621,913 | 2,487,810 | 2,953,787 | |||||||||||
| DISTRIBUTIONS TO SHAREHOLDERS (NOTE 4) | ||||||||||||||||
| From distributable earnings | (5,899,593 | ) | (4,956,375 | )(1) | (4,926,117 | ) | (4,728,307 | )(2) | ||||||||
| Decrease in net assets from distributions to shareholders | (5,899,593 | ) | (4,956,375 | ) | (4,926,117 | ) | (4,728,307 | ) | ||||||||
| BENEFICIAL INTEREST TRANSACTIONS (NOTE 3) | ||||||||||||||||
| Proceeds from sale of shares | 12,962,916 | 13,885,061 | 20,421,630 | 27,938,475 | ||||||||||||
| Shares issued in reinvestment of distributions | 1,015,635 | 853,882 | 651,183 | 688,882 | ||||||||||||
| Cost of shares redeemed | (17,621,273 | ) | (11,582,755 | ) | (38,335,303 | ) | (25,418,838 | ) | ||||||||
| Net increase (decrease) resulting from beneficial interest transactions | (3,642,722 | ) | 3,156,188 | (17,262,490 | ) | 3,208,519 | ||||||||||
| Net Increase (Decrease) in Net Assets | (14,505,703 | ) | 9,821,726 | (19,700,797 | ) | 1,433,999 | ||||||||||
| NET ASSETS: | ||||||||||||||||
| Beginning of Year | 116,398,454 | 106,576,728 | 249,950,994 | 248,516,995 | ||||||||||||
| End of Year | $ | 101,892,751 | $ | 116,398,454 | (3) | $ | 230,250,197 | $ | 249,950,994 | (4) | ||||||
| (1) | For the prior year ended December 31, 2017, Total Distributions consisted of Net Investment Income $1,868,202, and Net Realized Gains $3,088,173. |
| (2) | For the prior year ended December 31, 2017, Total Distributions consisted of Net Investment Income $4,728,307, and Net Realized Gains $–. |
| (3) | For the prior year ended December 31, 2017, net assets included accumulated net investment income of $44,003. |
| (4) | For the prior year ended December 31, 2017, net assets included accumulated net investment income of $144,027. |
See Notes to Financial Statements which are an integral part of the Financial Statements.
| Annual Report | December 31, 2018 | |
51 |
Statements of Changes in Net Assets
WesMark West Virginia Municipal Bond Fund | WesMark Tactical Opportunity Fund | |||||||||||||||
For the Year Ended December 31, 2018 | For the Year Ended December 31, 2017 | For the Year Ended December 31, 2018 | For the Period Ended December 31, 2017(1) | |||||||||||||
| INCREASE (DECREASE) IN NET ASSETS FROM: | ||||||||||||||||
| OPERATIONS | ||||||||||||||||
| Net investment income | $ | 2,299,797 | $ | 2,342,414 | $ | 179,640 | $ | 78,220 | ||||||||
| Net realized gain (loss) | (48,870 | ) | 29,264 | (186,480 | ) | 413,341 | ||||||||||
| Long-term capital gain distributions from other investment companies | – | – | – | 5,431 | ||||||||||||
| Net change in unrealized appreciation (depreciation) | (1,621,537 | ) | 2,019,029 | (2,093,906 | ) | 1,130,328 | ||||||||||
| Net increase (decrease) in net assets resulting from operations | 629,390 | 4,390,707 | (2,100,746 | ) | 1,627,320 | |||||||||||
| DISTRIBUTIONS TO SHAREHOLDERS (NOTE 4) | ||||||||||||||||
| From distributable earnings | (2,299,753 | ) | (2,456,167 | )(2) | (199,253 | ) | (493,062 | )(3) | ||||||||
| Decrease in net assets from distributions to shareholders | (2,299,753 | ) | (2,456,167 | ) | (199,253 | ) | (493,062 | ) | ||||||||
| BENEFICIAL INTEREST TRANSACTIONS (NOTE 3) | ||||||||||||||||
| Proceeds from sale of shares | 8,572,514 | 12,529,445 | 12,326,887 | 27,958,241 | ||||||||||||
| Shares issued in reinvestment of distributions | 379,318 | 478,792 | 22,049 | 26,432 | ||||||||||||
| Cost of shares redeemed | (8,975,963 | ) | (17,071,921 | ) | (2,337,486 | ) | (1,095,955 | ) | ||||||||
| Net increase (decrease) resulting from beneficial interest transactions | (24,131 | ) | (4,063,684 | ) | 10,011,450 | 26,888,718 | ||||||||||
| Net Increase (Decrease) in Net Assets | (1,694,494 | ) | (2,129,144 | ) | 7,711,451 | 28,022,976 | ||||||||||
| NET ASSETS: | ||||||||||||||||
| Beginning of Year or Period | 116,039,292 | 118,168,436 | 28,022,976 | – | ||||||||||||
| End of Year or Period | $ | 114,344,798 | $ | 116,039,292 | (4) | $ | 35,734,427 | $ | 28,022,976 | (5) | ||||||
| (1) | The Wesmark Tactical Opportunity Fund commenced operations on March 1, 2017. |
| (2) | For the prior year ended December 31, 2017, Total Distributions consisted of Net Investment Income $2,342,653, and Net Realized Gains $113,514. |
| (3) | For the prior period ended December 31, 2017, Total Distributions consisted of Net Investment Income $107,991, and Net Realized Gains $385,071. |
| (4) | For the prior year ended December 31, 2017, net assets included accumulated net investment income of $–. |
| (5) | For the prior period ended December 31, 2017, net assets included accumulated net investment income of $4,183. |
See Notes to Financial Statements which are an integral part of the Financial Statements.
| 52 | |
www.wesmarkfunds.com |
Financial Highlights
WesMark Small Company Growth Fund
For the Year Ended December 31, 2018 | For the Year Ended December 31, 2017 | For the Year Ended December 31, 2016 | For the Year Ended December 31, 2015 | For the Year Ended December 31, 2014 | ||||||||||||||||
| PER COMMON SHARE OPERATING PERFORMANCE | ||||||||||||||||||||
| Net Asset Value, Beginning of Year | $ | 13.90 | $ | 13.32 | $ | 12.58 | $ | 13.79 | $ | 13.75 | ||||||||||
| Income (Loss) from Investment Operations: | ||||||||||||||||||||
| Net Investment Income (Loss) | (0.05 | ) | (0.04 | ) | 0.03 | (0.06 | ) | (0.09 | ) | |||||||||||
| Net Realized and Unrealized Gain (Loss) on Investments | (1.89 | ) | 1.81 | 1.41 | (0.32 | ) | 0.51 | |||||||||||||
| Total from Investment Operations | (1.94 | ) | 1.77 | 1.44 | (0.38 | ) | 0.42 | |||||||||||||
| LESS DISTRIBUTIONS TO COMMON SHAREHOLDERS | ||||||||||||||||||||
| From Net Investment Income | – | – | (0.04 | ) | – | – | ||||||||||||||
| From Net Realized Gain on Investments | (1.33 | ) | (1.19 | ) | (0.66 | ) | (0.83 | ) | (0.38 | ) | ||||||||||
| Total Distributions | (1.33 | ) | (1.19 | ) | (0.70 | ) | (0.83 | ) | (0.38 | ) | ||||||||||
| Net Asset Value, End of Year | $ | 10.63 | $ | 13.90 | $ | 13.32 | $ | 12.58 | $ | 13.79 | ||||||||||
| Total Return | (13.72 | )% | 13.19 | % | 11.42 | % | (2.87 | )% | 3.08 | % | ||||||||||
| RATIOS TO AVERAGE NET ASSETS | ||||||||||||||||||||
| Net Expenses | 1.25 | % | 1.24 | % | 1.23 | % | 1.22 | % | 1.22 | % | ||||||||||
| Net Investment Income/(Loss) | (0.43 | )% | (0.33 | )% | 0.26 | % | (0.47 | )% | (0.66 | )% | ||||||||||
| Net Assets Value End of Year (000 omitted) | $ | 81,439 | $ | 101,061 | $ | 96,736 | $ | 92,255 | $ | 97,317 | ||||||||||
| Portfolio Turnover Rate | 88 | % | 49 | % | 41 | % | 45 | % | 16 | % | ||||||||||
See Notes to Financial Statements which are an integral part of the Financial Statements.
| Annual Report | December 31, 2018 | |
53 |
Financial Highlights
WesMark Growth Fund
For the Year Ended December 31, 2018 | For the Year Ended December 31, 2017 | For the Year Ended December 31, 2016 | For the Year Ended December 31, 2015 | For the Year Ended December 31, 2014 | ||||||||||||||||
| PER COMMON SHARE OPERATING PERFORMANCE | ||||||||||||||||||||
| Net Asset Value, Beginning of Year | $ | 20.00 | $ | 17.37 | $ | 18.10 | $ | 19.12 | $ | 17.89 | ||||||||||
| Income (Loss) from Investment Operations: | ||||||||||||||||||||
| Net Investment Income | 0.04 | 0.03 | 0.07 | 0.09 | 0.08 | |||||||||||||||
| Net Realized and Unrealized Gain (Loss) on Investments | (1.32 | ) | 4.19 | 0.03 | (0.45 | ) | 1.82 | |||||||||||||
| Total from Investment Operations | (1.28 | ) | 4.22 | 0.10 | (0.36 | ) | 1.90 | |||||||||||||
| LESS DISTRIBUTIONS TO COMMON SHAREHOLDERS | ||||||||||||||||||||
| From Net Investment Income | (0.04 | ) | (0.03 | ) | (0.07 | ) | (0.09 | ) | (0.08 | ) | ||||||||||
| From Net Realized Gain on Investments | (1.88 | ) | (1.56 | ) | (0.76 | ) | (0.57 | ) | (0.59 | ) | ||||||||||
| Total Distributions | (1.92 | ) | (1.59 | ) | (0.83 | ) | (0.66 | ) | (0.67 | ) | ||||||||||
| Net Asset Value, End of Year | $ | 16.80 | $ | 20.00 | $ | 17.37 | $ | 18.10 | $ | 19.12 | ||||||||||
| Total Return | (6.19 | )% | 24.22 | % | 0.51 | % | (1.94 | )% | 10.66 | % | ||||||||||
| RATIOS TO AVERAGE NET ASSETS | ||||||||||||||||||||
| Net Expenses | 1.13 | % | 1.13 | % | 1.15 | % | 1.14 | % | 1.14 | % | ||||||||||
| Net Investment Income | 0.19 | % | 0.13 | % | 0.40 | % | 0.43 | % | 0.47 | % | ||||||||||
| Net Assets Value End of Year (000 omitted) | $ | 287,441 | $ | 347,982 | $ | 314,067 | $ | 333,729 | $ | 359,487 | ||||||||||
| Portfolio Turnover Rate | 37 | % | 37 | % | 61 | % | 21 | % | 16 | % | ||||||||||
See Notes to Financial Statements which are an integral part of the Financial Statements.
| 54 | |
www.wesmarkfunds.com |
Financial Highlights
WesMark Balanced Fund
For the Year Ended December 31, 2018 | For the Year Ended December 31, 2017 | For the Year Ended December 31, 2016 | For the Year Ended December 31, 2015 | For the Year Ended December 31, 2014 | ||||||||||||||||
| PER COMMON SHARE OPERATING PERFORMANCE | ||||||||||||||||||||
| Net Asset Value, Beginning of Year | $ | 13.05 | $ | 12.30 | $ | 11.65 | $ | 12.67 | $ | 12.09 | ||||||||||
| Income (Loss) from Investment Operations: | ||||||||||||||||||||
| Net Investment Income | 0.23 | 0.22 | 0.20 | 0.19 | 0.20 | |||||||||||||||
| Net Realized and Unrealized Gain (Loss) on Investments | (0.82 | ) | 1.09 | 0.92 | (0.43 | ) | 0.70 | |||||||||||||
| Total from Investment Operations | (0.59 | ) | 1.31 | 1.12 | (0.24 | ) | 0.90 | |||||||||||||
| LESS DISTRIBUTIONS TO COMMON SHAREHOLDERS | ||||||||||||||||||||
| From Net Investment Income | (0.23 | ) | (0.21 | ) | (0.21 | ) | (0.20 | ) | (0.19 | ) | ||||||||||
| From Net Realized Gain on Investments | (0.46 | ) | (0.35 | ) | (0.26 | ) | (0.58 | ) | (0.13 | ) | ||||||||||
| Total Distributions | (0.69 | ) | (0.56 | ) | (0.47 | ) | (0.78 | ) | (0.32 | ) | ||||||||||
| Net Asset Value, End of Year | $ | 11.77 | $ | 13.05 | $ | 12.30 | $ | 11.65 | $ | 12.67 | ||||||||||
| Total Return | (4.58 | )% | 10.77 | % | 9.68 | % | (1.94 | )% | 7.50 | % | ||||||||||
| RATIOS TO AVERAGE NET ASSETS | ||||||||||||||||||||
| Net Expenses | 1.24 | % | 1.23 | % | 1.23 | % | 1.22 | % | 1.22 | % | ||||||||||
| Net Investment Income | 1.69 | % | 1.71 | % | 1.69 | % | 1.57 | % | 1.57 | % | ||||||||||
| Net Assets Value End of Year (000 omitted) | $ | 101,893 | $ | 116,398 | $ | 106,577 | $ | 101,049 | $ | 102,402 | ||||||||||
| Portfolio Turnover Rate | 35 | % | 23 | % | 49 | % | 30 | % | 18 | % | ||||||||||
See Notes to Financial Statements which are an integral part of the Financial Statements.
| Annual Report | December 31, 2018 | |
55 |
Financial Highlights
WesMark Government Bond Fund
For the Year Ended December 31, 2018 | For the Year Ended December 31, 2017 | For the Year Ended December 31, 2016 | For the Year Ended December 31, 2015 | For the Year Ended December 31, 2014 | ||||||||||||||||
| PER COMMON SHARE OPERATING PERFORMANCE | ||||||||||||||||||||
| Net Asset Value, Beginning of Year | $ | 9.77 | $ | 9.84 | $ | 9.94 | $ | 10.03 | $ | 9.78 | ||||||||||
| Income (Loss) from Investment Operations: | ||||||||||||||||||||
| Net Investment Income | 0.17 | 0.21 | 0.14 | 0.14 | 0.16 | |||||||||||||||
| Net Realized and Unrealized Gain (Loss) on Investments | (0.06 | ) | (0.09 | ) | (0.06 | ) | (0.06 | ) | 0.27 | |||||||||||
| Total from Investment Operations | 0.11 | 0.12 | 0.08 | 0.08 | 0.43 | |||||||||||||||
| LESS DISTRIBUTIONS TO COMMON SHAREHOLDERS | ||||||||||||||||||||
| From Net Investment Income | (0.20 | ) | (0.19 | ) | (0.17 | ) | (0.17 | ) | (0.18 | ) | ||||||||||
| From Net Realized Gain on Investments | – | – | (0.01 | ) | – | 0.00 | (1) | |||||||||||||
| Total Distributions | (0.20 | ) | (0.19 | ) | (0.18 | ) | (0.17 | ) | (0.18 | ) | ||||||||||
| Net Asset Value, End of Year | $ | 9.68 | $ | 9.77 | $ | 9.84 | $ | 9.94 | $ | 10.03 | ||||||||||
| Total Return | 1.15 | % | 1.20 | % | 0.79 | % | 0.81 | % | 4.43 | % | ||||||||||
| RATIOS TO AVERAGE NET ASSETS | ||||||||||||||||||||
| Net Expenses | 1.01 | % | 1.00 | % | 1.01 | % | 1.00 | % | 1.00 | % | ||||||||||
| Net Investment Income | 1.81 | % | 2.19 | % | 1.41 | % | 1.51 | % | 1.64 | % | ||||||||||
| Net Assets Value End of Year (000 omitted) | $ | 230,250 | $ | 249,951 | $ | 248,517 | $ | 258,097 | $ | 271,979 | ||||||||||
| Portfolio Turnover Rate | 17 | % | 26 | % | 33 | % | 13 | % | 17 | % | ||||||||||
| (1) | Less than $0.005 per share. |
See Notes to Financial Statements which are an integral part of the Financial Statements.
| 56 | |
www.wesmarkfunds.com |
Financial Highlights
WesMark West Virginia Municipal Bond Fund
For the Year Ended December 31, 2018 | For the Year Ended December 31, 2017 | For the Year Ended December 31, 2016 | For the Year Ended December 31, 2015 | For the Year Ended December 31, 2014 | ||||||||||||||||
| PER COMMON SHARE OPERATING PERFORMANCE | ||||||||||||||||||||
| Net Asset Value, Beginning of Year | $ | 10.54 | $ | 10.36 | $ | 10.57 | $ | 10.59 | $ | 10.16 | ||||||||||
| Income (Loss) from Investment Operations: | ||||||||||||||||||||
| Net Investment Income | 0.21 | 0.21 | 0.21 | 0.23 | 0.25 | |||||||||||||||
| Net Realized and Unrealized Gain (Loss) on Investments | (0.16 | ) | 0.19 | (0.20 | ) | (0.01 | ) | 0.44 | ||||||||||||
| Total from Investment Operations | 0.05 | 0.40 | 0.01 | 0.22 | 0.69 | |||||||||||||||
| LESS DISTRIBUTIONS TO COMMON SHAREHOLDERS | ||||||||||||||||||||
| From Net Investment Income | (0.21 | ) | (0.21 | ) | (0.21 | ) | (0.23 | ) | (0.25 | ) | ||||||||||
| From Net Realized Gain on Investments | – | (0.01 | ) | (0.01 | ) | (0.01 | ) | (0.01 | ) | |||||||||||
| Total Distributions | (0.21 | ) | (0.22 | ) | (0.22 | ) | (0.24 | ) | (0.26 | ) | ||||||||||
| Net Asset Value, End of Year | $ | 10.38 | $ | 10.54 | $ | 10.36 | $ | 10.57 | $ | 10.59 | ||||||||||
| Total Return | 0.47 | % | 3.90 | % | 0.06 | % | 2.14 | % | 6.87 | % | ||||||||||
| RATIOS TO AVERAGE NET ASSETS | ||||||||||||||||||||
| Net Expenses | 1.09 | % | 1.08 | % | 1.05 | % | 0.96 | % | 0.96 | % | ||||||||||
| Net Investment Income | 2.00 | % | 2.01 | % | 2.01 | % | 2.19 | % | 2.38 | % | ||||||||||
| Expense Waiver/Reimbursement(1) | – | – | 0.02 | %(2) | 0.10 | % | 0.10 | % | ||||||||||||
| Net Assets Value End of Year (000 omitted) | $ | 114,345 | $ | 116,039 | $ | 118,168 | $ | 118,456 | $ | 120,968 | ||||||||||
| Portfolio Turnover Rate | 10 | % | 7 | % | 17 | % | 15 | % | 15 | % | ||||||||||
| (1) | This expense decrease from the voluntary waiver is reflected in both the net expense and the net investment income ratios shown. |
| (2) | As of February 29, 2016, the waiver was voluntarily terminated by the Adviser. |
See Notes to Financial Statements which are an integral part of the Financial Statements.
| Annual Report | December 31, 2018 | |
57 |
Financial Highlights
WesMark Tactical Opportunity Fund
For the Year Ended December 31, 2018 | For the Period Ended December 31, 2017(1) | |||||||
| PER COMMON SHARE OPERATING PERFORMANCE | ||||||||
| Net Asset Value, Beginning of Period | $ | 10.62 | $ | 10.00 | ||||
| Income (Loss) from Investment Operations: | ||||||||
| Net Investment Income | 0.05 | 0.04 | ||||||
| Net Realized and Unrealized Gain (Loss) on Investments | (0.60 | ) | 0.80 | |||||
| Total from Investment Operations | (0.55 | ) | 0.84 | |||||
| LESS DISTRIBUTIONS TO COMMON SHAREHOLDERS | ||||||||
| From Net Investment Income | (0.04 | ) | (0.05 | ) | ||||
| From Net Realized Gain on Investments | (0.02 | ) | (0.17 | ) | ||||
| Total Distributions | (0.06 | ) | (0.22 | ) | ||||
| Net Asset Value, End of Period | $ | 10.01 | $ | 10.62 | ||||
| Total Return | (5.20 | )% | 8.33 | %(2) | ||||
| RATIOS TO AVERAGE NET ASSETS | ||||||||
| Net Expenses(3) | 1.56 | % | 1.75 | %(4) | ||||
| Net Investment Income(3)(5) | 0.55 | % | 0.50 | %(4) | ||||
| Expense Waiver/Reimbursement(6) | – | 0.23 | %(4) | |||||
| Net Assets Value End of Period (000 omitted) | $ | 35,734 | $ | 28,023 | ||||
| Portfolio Turnover Rate | 145 | % | 88 | % | ||||
| (1) | The WesMark Tactical Opportunity Fund commenced operations on March 1, 2017. |
| (2) | Total return not annualized for periods less than one full year. |
| (3) | The ratios shown do not include the Fund's proportionate shares of the expenses of the underlying investment companies in which the Fund invests. |
| (4) | Ratios for periods of less than a year are annualized. |
| (5) | Recognition of net investment income is affected by the timing and declaration of dividends by the underlying investment companies in which the Fund invests. |
| (6) | This expense decrease from the voluntary waiver is reflected in both the net expense and the net investment income ratios shown. |
See Notes to Financial Statements which are an integral part of the Financial Statements.
| 58 | |
www.wesmarkfunds.com |
Notes to Financial Statements
December 31, 2018
1. ORGANIZATION
WesMark Funds (the “Trust”) is registered under the Investment Company Act of 1940, as amended (the “Act”), as an open-end management investment company. The Trust consists of six portfolios (individually referred to as the “Fund”, or collectively as the “Funds”), which are presented herein:
| Portfolio Name | Diversification | Investment Objective |
| WesMark Small Company Growth Fund (“Small Company Growth Fund”) |
Diversified | To achieve capital appreciation |
| WesMark Growth Fund (“Growth Fund”) | Diversified | To achieve capital appreciation |
| WesMark Balanced Fund (“Balanced Fund”) | Diversified | To achieve capital appreciation and income |
| WesMark Government Bond Fund (“Government Bond Fund”) |
Diversified | To achieve high current income consistent with preservation of capital |
| WesMark West Virginia Municipal Bond Fund (“West Virginia Municipal Bond Fund”) |
Non-diversified | To achieve current income which is exempt from federal income tax and income taxes imposed by the State of West Virginia |
| WesMark Tactical Opportunity Fund (“Tactical Opportunity Fund”) |
Diversified | To achieve capital appreciation |
The assets of each Fund are segregated and a shareholder’s interest is limited to the Fund in which shares are held.
2. SIGNIFICANT ACCOUNTING POLICIES
The following is a summary of significant accounting policies consistently followed by the Funds in the preparation of their financial statements. These policies are in conformity with generally accepted accounting principles (“GAAP”) in the United States of America.
The accompanying financial statements were prepared in accordance with GAAP in the United States, which require the use of estimates made by management of the Funds. Actual results could differ from those estimates that affect the reported amounts of assets and liabilities and disclosure of contingent assets and liabilities at the date of the financial statements and the reported amounts of increases and decreases in net assets from operations during the reporting period. Each Fund is an investment company and accordingly follows the investment company accounting and reporting guidance of the Financial Accounting Standards Board (FASB) Accounting Standard Codification Topic 946 Financial Services - Investment Companies.
Investment Valuation – In calculating their net asset value (NAV), the Funds generally value investments as follows:
| ›› | Equity securities listed on an exchange or traded through a regulated market system are valued at their last reported sale price or official closing price on their principal exchange or market. |
| ›› | Fixed-income securities acquired with remaining maturities greater than 60 days are valued using price evaluations provided by a pricing service approved by the Board of Trustees (the “Trustees”). |
| ›› | Fixed-income securities acquired with remaining maturities of 60 days or less may be valued using price evaluations provided by a pricing service approved by the Trustees. They may also be valued at their cost (adjusted for the accretion of any discount or amortization of any premium), which approximates value. |
| ›› | Options are generally valued at market values established by the exchanges on which they are traded at the close of trading on such exchanges. |
| ›› | Shares of other mutual funds are valued based upon their reported NAVs. |
If the Funds cannot obtain a price or price evaluation from a pricing service for an investment, the Funds may attempt to value the investment based upon the mean of bid and asked quotations or fair value the investment based on price evaluations, from one or more dealers. If any price, quotation, price evaluation or other pricing source is not readily available when the NAV is calculated, the Funds use the fair value of the investment determined in accordance with the procedures described below. There can be no assurance that the Funds could purchase or sell an investment at the price used to calculate the Funds’ NAVs.
| Annual Report | December 31, 2018 | |
59 |
Notes to Financial Statements
December 31, 2018
Fair Valuation and Significant Events Procedures – The Trustees have authorized the use of pricing services to provide evaluations of the current fair value of certain investments for purposes of calculating the NAV. Factors considered by pricing services in evaluating an investment include the yields or prices of investments of comparable quality, coupon, maturity, call rights and other potential prepayments, terms and type, reported transactions, indications as to values from dealers, and general market conditions. The Funds normally use mean evaluations (a price evaluation indicative of a price between the bid and asked prices for an investment) for fixed-income securities. In the event that market quotations and price evaluations are not available for an investment, the fair value of the investment is determined in accordance with procedures adopted by the Trustees.
The Trustees also have adopted procedures requiring an investment to be priced at its fair value whenever the Adviser determines that a significant event affecting the value of the investment has occurred between the time as of which the price of the investment would otherwise be determined and the time as of which the NAV is computed. An event is considered significant if there is both an affirmative expectation that the investment’s value will change in response to the event and a reasonable basis for quantifying the resulting change in value. Examples of significant events that may occur after the close of the principal market on which a security is traded, or after the time of a price evaluation provided by a pricing service or a dealer, include:
| ›› | With respect to securities traded in foreign markets, significant trends in U.S. equity markets or in the trading of foreign securities index futures or options contracts; |
| ›› | With respect to price evaluations of fixed-income securities determined before the close of regular trading on the NYSE, actions by the Federal Reserve Open Market Committee and other significant trends in U.S. fixed-income markets; and |
| ›› | Corporate announcements concerning matters such as acquisitions, recapitalizations, litigation developments, a natural disaster affecting the issuer’s operations or regulatory changes or market developments affecting the issuer’s industry. |
The Funds may seek to obtain more current quotations or price evaluations from alternative pricing sources. If a reliable alternative pricing source is not available, the Funds will determine the fair value of the investment using another method approved by the Trustees.
A three-tier hierarchy has been established to maximize the use of observable market data and minimize the use of unobservable inputs and to establish classification of fair value measurements for disclosure purposes. Inputs refer broadly to the assumptions that market participants would use in pricing the asset or liability, including assumptions about risk, for example, the risk inherent in a particular valuation approach used to measure fair value including such a pricing model and/or the risk inherent in the inputs to the valuation approach. Observable inputs are inputs that reflect the assumptions market participants would use in pricing the asset or liability developed based on market data obtained from sources independent of the reporting entity. Unobservable inputs are inputs that reflect the reporting entity’s own assumptions about the assumptions market participants would use in pricing the asset or liability developed based on the best information available in the circumstances.
The three-tier hierarchy of inputs is summarized in the three broad Levels listed below.
| Level 1 — | Unadjusted quoted prices in active markets for identical assets or liabilities that the Funds have the ability to access at the measurement date. |
| Level 2 — | Observable inputs other than quoted prices included in Level 1 that are observable for the asset or liability either directly or indirectly.These inputs may include quoted prices for the identical instrument on an inactive market, prices for similar instruments, interest rates, prepayment speeds, credit risk, yield curves, default rates and similar data. |
| Level 3 — | Unobservable inputs for the asset or liability, to the extent relevant observable inputs are not available, representing the Funds’ own assumptions about the assumptions a market participant would use in valuing the asset or liability, and would be based on the best information available. |
| 60 | |
www.wesmarkfunds.com |
Notes to Financial Statements
December 31, 2018
The following is a summary of the inputs used as of December 31, 2018 in valuing the Funds’ investments carried at fair value:
| Small Company Growth Fund | ||||||||||||||||
| Investments in Securities at Value* | Level 1 - Quoted Prices | Level 2 - Inputs | Level 3 - Inputs | Total | ||||||||||||
| Common Stocks | $ | 78,346,760 | $ | – | $ | – | $ | 78,346,760 | ||||||||
| Short Term Investments | 138,321 | – | – | 138,321 | ||||||||||||
| Total | $ | 78,485,081 | $ | – | $ | – | $ | 78,485,081 | ||||||||
| Growth Fund | ||||||||||||||||
| Investments in Securities at Value* | Level 1 - Quoted Prices | Level 2 - Inputs | Level 3 - Inputs | Total | ||||||||||||
| Common Stocks | $ | 251,146,485 | $ | – | $ | – | $ | 251,146,485 | ||||||||
| Exchange Traded Funds | 13,281,715 | – | – | 13,281,715 | ||||||||||||
| Short Term Investments | 11,803,812 | – | – | 11,803,812 | ||||||||||||
| Total | $ | 276,232,012 | $ | – | $ | – | $ | 276,232,012 | ||||||||
| Balanced Fund | ||||||||||||||||
| Investments in Securities at Value* | Level 1 - Quoted Prices | Level 2 - Inputs | Level 3 - Inputs | Total | ||||||||||||
| Common Stocks | $ | 55,069,730 | $ | – | $ | – | $ | 55,069,730 | ||||||||
| Corporate Bonds | – | 16,537,263 | – | 16,537,263 | ||||||||||||
| U.S. Government Agency - Collateralized Mortgage Obligations | – | 6,853,799 | – | 6,853,799 | ||||||||||||
| U.S. Government Agency - Mortgage Backed Securities | – | 7,885,406 | – | 7,885,406 | ||||||||||||
| U.S. Government Agency Securities | – | 2,455,775 | – | 2,455,775 | ||||||||||||
| Taxable Municipal Bonds | – | 4,960,780 | – | 4,960,780 | ||||||||||||
| Short Term Investments | 1,975,097 | – | – | 1,975,097 | ||||||||||||
| Total | $ | 57,044,827 | $ | 38,693,023 | $ | – | $ | 95,737,850 | ||||||||
| Government Bond Fund | ||||||||||||||||
| Investments in Securities at Value* | Level 1 - Quoted Prices | Level 2 - Inputs | Level 3 - Inputs | Total | ||||||||||||
| U.S. Government Agency - Collateralized Mortgage Obligations | $ | – | $ | 149,923,820 | $ | – | $ | 149,923,820 | ||||||||
| U.S. Government Agency - Mortgage Backed Securities | – | 25,829,356 | – | 25,829,356 | ||||||||||||
| U.S. Treasury Bonds | – | 10,279,845 | – | 10,279,845 | ||||||||||||
| Taxable Municipal Bonds | – | 45,780,657 | – | 45,780,657 | ||||||||||||
| Non-Taxable Municipal Bonds | – | 1,354,603 | – | 1,354,603 | ||||||||||||
| Short Term Investments | 1,926,945 | – | – | 1,926,945 | ||||||||||||
| Total | $ | 1,926,945 | $ | 233,168,281 | $ | – | $ | 235,095,226 | ||||||||
| Annual Report | December 31, 2018 | |
61 |
Notes to Financial Statements
December 31, 2018
| West Virginia Municipal Bond Fund | ||||||||||||||||
| Investments in Securities at Value* | Level 1 - Quoted Prices | Level 2 - Inputs | Level 3 - Inputs | Total | ||||||||||||
| Municipal Bonds | $ | – | $ | 113,505,986 | $ | – | $ | 113,505,986 | ||||||||
| Short Term Investments | 23,075 | – | – | 23,075 | ||||||||||||
| Total | $ | 23,075 | $ | 113,505,986 | $ | – | $ | 113,529,061 | ||||||||
| Tactical Opportunity Fund | ||||||||||||||||
| Investments in Securities at Value* | Level 1 - Quoted Prices | Level 2 - Inputs | Level 3 - Inputs | Total | ||||||||||||
| Exchange Traded Funds | $ | 33,492,763 | $ | – | $ | – | $ | 33,492,763 | ||||||||
| Short Term Investments | 1,641,963 | – | – | 1,641,963 | ||||||||||||
| Total | $ | 35,134,726 | $ | – | $ | – | $ | 35,134,726 | ||||||||
All securities of the Funds were valued using either Level 1 or Level 2 inputs during the year ended December 31, 2018. Thus, a reconciliation of assets in which unobservable inputs (Level 3) were used is not applicable for the Funds.
| * | For detailed descriptions of sector and/or geography classifications, see the accompanying Portfolios of Investments. |
Investment Income, Expenses and Distributions – Investment transactions are accounted for on a trade-date basis. Realized gains and losses from investment transactions are recorded on an identified cost basis. Interest income and expenses are accrued daily. Dividend income and distributions to shareholders are recorded on the ex-dividend date. Non-cash dividends included in dividend income, if any, are recorded at fair value. Foreign dividends are recorded on the ex-dividend date or when the Funds are informed of the ex-dividend date. Trust level expenses are allocated to each Fund based on net assets, equally across all Funds, or to a specific Fund, whichever is deemed most appropriate for a particular expense. Each Fund pays its own expenses.
Distributions of net investment income, if any, for the Small Company Growth Fund, Growth Fund, and Tactical Opportunity Fund are declared and paid quarterly. Distributions of net investment income for the Balanced Fund are declared and paid monthly, and distributions of net investment income for the Government Bond Fund and West Virginia Municipal Bond Fund are declared daily and paid monthly. Distributions of capital gains, if any, for Small Company Growth Fund, Growth Fund, Balanced Fund, Government Bond Fund, West Virginia Municipal Bond Fund, and Tactical Opportunity Fund are declared and paid annually.
Premium and Discount Amortization/Paydown Gains and Losses – All premiums and discounts on fixed-income securities are amortized/accreted over the estimated lives of such securities for financial statement purposes using the effective interest method. Gains and losses realized on principal payments of mortgage-backed securities (paydown gains and losses) are classified as part of investment income.
Federal Taxes – It is each Fund’s policy to comply with the Subchapter M provision of the Internal Revenue Code of 1986, as amended, (the “Code”) and to distribute to shareholders each year substantially all of its income. As of and during the year ended December 31, 2018, the Funds did not have a liability for any unrecognized tax benefits. The Funds recognize interest and penalties, if any, related to tax liabilities as income tax expense in the Statements of Operations. The Funds file U.S. federal, state, and local tax returns as required. The Funds’ tax returns are subject to examination by the relevant tax authorities until expiration of the applicable statute of limitations which is generally three years after the filing of the tax return for federal purposes and four years for most state returns. Tax returns for open years have not incorporated uncertain tax positions that require a provision for income taxes and federal and state taxing authorities.
The Funds may be subject to taxes imposed by governments of countries in which they invest. Such taxes are generally based on either income or gains earned or repatriated. The Funds accrue and apply such taxes to net investment income, net realized gains and net unrealized gains as income is earned.
| 62 | |
www.wesmarkfunds.com |
Notes to Financial Statements
December 31, 2018
Withholding taxes on foreign dividends have been provided for in accordance with the Funds’ understanding of the applicable country’s tax rules and rates.
When-Issued and Delayed Delivery Transactions – The Funds may engage in when-issued or delayed delivery transactions. The Funds record when-issued securities on the trade date and maintain security positions such that sufficient liquid assets will be available to make payment for the securities purchased. Securities purchased on a when-issued or delayed delivery basis are marked to market daily and begin earning interest on the settlement date. Losses may occur on these transactions due to changes in market conditions or the failure of counterparties to perform under the contract.
Restricted Securities – Restricted securities are securities that either: (a) cannot be offered for public sale without first being registered, or being able to take advantage of an exemption from registration, under the Securities Act of 1933; or (b) are subject to contractual restrictions on public sales. In some cases, when a security cannot be offered for public sale without first being registered, the issuer of the restricted security has agreed to register such securities for resale, at the issuer’s expense, either upon demand by the Funds or in connection with another registered offering of the securities. Many such restricted securities may be resold in the secondary market in transactions exempt from registration. Restricted securities may be determined to be liquid under criteria established by the Trustees. The Funds will not incur any registration costs upon such resales. The Funds’ restricted securities are valued at the price provided by dealers in the secondary market or, if no market prices are available, at the fair value as determined in accordance with procedures established by and under the general supervision of the Trustees. There were no restricted securities for the Funds as of December 31, 2018.
Derivative Instruments and Hedging Activities – The following discloses the Funds’ use of derivative instruments and hedging activities.
The Funds’ exposure to derivative contracts and hybrid instruments, either directly or indirectly through another investment company, may involve risks different from or possibly greater than the risk associated with investing directly in a security instead of the derivative. Risks include: 1) the value of the derivative may not correlate with the value of the underlying security or may correlate inversely; 2) any potential risk reduction may be offset with gain limitations; 3) derivatives may be difficult to price, thus involving additional payments by the Funds; 4) possible adverse tax consequences; 5) possible unforeseen redemption request by a derivative counter party increasing possible portfolio losses or costs, or preventing a Fund from implementing its investment strategy; and 6) other risks, such as but not limited to, stock market, interest rate, credit, currency, liquidity, and leverage risks.
Market Risk Factors: In pursuit of their investment objectives, certain Funds may use derivatives that increase or decrease a Fund’s exposure to the following market risk factors:
Equity Risk: Equity risk relates to the change in value of equity securities as they relate to increases or decreases in the general market.
Writing Covered Call Options and Purchasing Put Options
The Funds will not write call options on securities unless the securities are held in the Fund’s portfolio or unless the Fund is entitled to them in deliverable forms without further payment or after segregating cash in the amount of any further payment.
The Funds will not purchase put options on securities unless the securities are held in the Fund’s portfolio.
Except with respect to borrowing money, if a percentage limitation is adhered to at the time of investment, a later increase or decrease in percentage resulting from any change in value, or net assets will not result in a violation of such restriction.
Option contracts (options) - are rights to buy or sell a security for a specified price within a specified period. The seller of the option receives a payment, or premium, from the buyer, which the seller keeps regardless of whether the buyer uses (or exercises) the option. Options can trade on exchanges or in the over the counter (OTC) market and may be bought or sold on a wide variety of securities. As of December 31, 2018, there were no options held.
| Annual Report | December 31, 2018 | |
63 |
Notes to Financial Statements
December 31, 2018
A Fund may buy and/or sell the following types of options:
Call Options - A call option gives the holder (buyer) the right to buy the underlying security from the seller (writer) of the option. A Fund may use call options in the following ways:
| ›› | Buy call options on a security in anticipation of an increase in the value of the security; or |
| ›› | Sell call options on a security to generate income from premiums, and in anticipation of a decrease or only limited increase in the value of the underlying security. If a Fund writes a call option on a security that it owns and that call option is exercised, a Fund must deliver the security to the buyer and foregoes any possible profit from an increase in the market price of the security over the exercise price plus the premium received. |
Put Options - A put option gives the holder the right to sell the security to the writer of the option. A Fund may use put options in the following ways:
| ›› | Buy put options on a security in anticipation of a decrease in the value of the security; or |
| ›› | Write put options on a security to generate income from premiums, and in anticipation of an increase or only limited decrease in the value of the security. In writing puts, there is a risk that a Fund may be required to take delivery of the security when its current market price is lower than the exercise price. |
A Fund may also buy or write options, as needed, to close out existing option positions. Finally, a Fund may enter into combinations of options contracts in an attempt to benefit from changes in the prices of those options contracts (without regard to changes in the value of the security).
The effect of derivative instruments on the Statements of Operations for the year ended December 31, 2018:
| Risk Exposure | Statements of Operations Location | Realized Gain/ (Loss) on Derivatives Recognized in Income | Change in Unrealized Appreciation/ (Depreciation) on Derivatives Recognized in Income | |||||||
| WesMark Growth Fund | ||||||||||
| Equity Contracts (Written Options) | Net realized gain (loss) on written options/Net change in unrealized appreciation (depreciation) of written options | $ | 369,446 | $ | – | |||||
| Total | $ | 369,446 | $ | – | ||||||
| WesMark Balanced Fund | ||||||||||
| Equity Contracts (Written Options) | Net realized gain (loss) on written options/Net change in unrealized appreciation (depreciation) of written options | $ | 73,038 | $ | (437 | ) | ||||
| Total | $ | 73,038 | $ | (437 | ) | |||||
| WesMark Tactical Opportunity Fund | ||||||||||
| Equity Contracts (Purchased options) | Net realized gain (loss) on investments/Net change in unrealized appreciation (depreciation) on investments | $ | 3,389 | $ | 2,539 | |||||
| Equity Contracts (Written Options) | Net realized gain (loss) on written options/Net change in unrealized appreciation (depreciation) of written options | $ | 129,935 | $ | 8,189 | |||||
| Total | $ | 133,324 | $ | 10,728 | ||||||
| 64 | |
www.wesmarkfunds.com |
Notes to Financial Statements
December 31, 2018
The WesMark Growth Fund, Balanced Fund and Tactical Opportunity Fund had average written call option notional value of (1,986,121), (1,103,858), and (2,048,770), respectively, during the year ended December 31, 2018. The Tactical Opportunity Fund had average purchased option notional value of $68,675 during the year ended December 31, 2018.
3. SHARES OF BENEFICIAL INTEREST
The following tables summarize share activity:
For the Year Ended December 31, 2018 | For the Year Ended December 31, 2017 | |||||||
| Small Company Growth Fund | ||||||||
| Shares sold | 820,071 | 537,857 | ||||||
| Shares issued to shareholders in payment of distributions declared | 307,846 | 204,291 | ||||||
| Shares redeemed | (736,004 | ) | (733,002 | ) | ||||
| Net increase resulting from share transactions | 391,913 | 9,146 | ||||||
| Common shares outstanding, end of period | 7,661,268 | 7,269,355 | ||||||
For the Year Ended December 31, 2018 | For the Year Ended December 31, 2017 | |||||||
| Growth Fund | ||||||||
| Shares sold | 1,510,304 | 937,579 | ||||||
| Shares issued to shareholders in payment of distributions declared | 617,593 | 421,162 | ||||||
| Shares redeemed | (2,415,437 | ) | (2,041,120 | ) | ||||
| Net decrease resulting from share transactions | (287,540 | ) | (682,379 | ) | ||||
| Common shares outstanding, end of period | 17,113,189 | 17,400,729 | ||||||
For the Year Ended December 31, 2018 | For the Year Ended December 31, 2017 | |||||||
| Balanced Fund | ||||||||
| Shares sold | 1,016,408 | 1,086,448 | ||||||
| Shares issued to shareholders in payment of distributions declared | 84,552 | 65,914 | ||||||
| Shares redeemed | (1,363,863 | ) | (903,655 | ) | ||||
| Net increase/(decrease) resulting from share transactions | (262,903 | ) | 248,707 | |||||
| Common shares outstanding, end of period | 8,653,836 | 8,916,739 | ||||||
For the Year Ended December 31, 2018 | For the Year Ended December 31, 2017 | |||||||
| Government Bond Fund | ||||||||
| Shares sold | 2,133,501 | 2,838,982 | ||||||
| Shares issued to shareholders in payment of distributions declared | 68,041 | 69,877 | ||||||
| Shares redeemed | (3,997,014 | ) | (2,579,039 | ) | ||||
| Net increase/(decrease) resulting from share transactions | (1,795,472 | ) | 329,820 | |||||
| Common shares outstanding, end of period | 23,786,449 | 25,581,921 | ||||||
| Annual Report | December 31, 2018 | |
65 |
Notes to Financial Statements
December 31, 2018
For the Year Ended December 31, 2018 | For the Year Ended December 31, 2017 | |||||||
| West Virginia Municipal Bond Fund | ||||||||
| Shares sold | 827,004 | 1,195,010 | ||||||
| Shares issued to shareholders in payment of distributions declared | 36,690 | 45,608 | ||||||
| Shares redeemed | (866,733 | ) | (1,631,014 | ) | ||||
| Net decrease resulting from share transactions | (3,039 | ) | (390,396 | ) | ||||
| Common shares outstanding, end of period | 11,010,897 | 11,013,936 | ||||||
For the Year Ended December 31, 2018 | For the Period Ended December 31, 2017(1) | |||||||
| Tactical Opportunity Fund | ||||||||
| Shares sold | 1,151,195 | 2,739,537 | ||||||
| Shares issued to shareholders in payment of distributions declared | 2,229 | 2,484 | ||||||
| Shares redeemed | (219,865 | ) | (104,101 | ) | ||||
| Net increase resulting from share transactions | 933,559 | 2,637,920 | ||||||
| Common shares outstanding, end of period | 3,571,479 | 2,637,920 | ||||||
| (1) | The Wesmark Tactical Opportunity Fund commenced operations on March 1, 2017. |
4. FEDERAL TAX INFORMATION AND TAX BASIS
The timing and character of income and capital gain distributions are determined in accordance with income tax regulations, which may differ from GAAP. These differences were primarily attributable to treatment of net operating losses and treatment of non-deductible expenses. For the Funds’ most recent year ended December 31, 2018, permanent differences identified and reclassified among the components of net assets were as follows:
| Fund Name | Paid-in Capital | Total Distributable | ||||||
| Small Company Growth Fund | $ | (419,363 | ) | $ | 419,363 | |||
| Growth Fund | $ | – | $ | – | ||||
| Balanced Fund | $ | – | $ | – | ||||
| Government Bond Fund | $ | – | $ | – | ||||
| West Virginia Municipal Bond Fund | $ | – | $ | – | ||||
| Tactical Opportunity Fund | $ | (7,255 | ) | $ | 7,255 | |||
Net investment income (loss), net realized gains (losses), and total net assets were not affected by these reclassifications.
For federal income tax purposes, the following amounts apply as of December 31, 2018:
| Fund Name | Gross Appreciation (excess of value over tax cost) | Gross Depreciation (excess of tax cost over value) | Net Appreciation (Depreciation) of Foreign Currency and Derivatives | Net Unrealized Appreciation (Depreciation) | Cost of Investments for Income Tax Purposes | |||||||||||||||
| Small Company Growth Fund | $ | 23,656,103 | $ | (4,534,351 | ) | $ | – | $ | 19,121,752 | $ | 59,363,329 | |||||||||
| Growth Fund | $ | 112,385,249 | $ | (4,405,405 | ) | $ | – | $ | 107,979,844 | $ | 168,252,168 | |||||||||
| Balanced Fund | $ | 15,463,718 | $ | (981,206 | ) | $ | – | $ | 14,482,512 | $ | 81,255,338 | |||||||||
| 66 | |
www.wesmarkfunds.com |
Notes to Financial Statements
December 31, 2018
| Fund Name | Gross Appreciation (excess of value over tax cost) | Gross Depreciation (excess of tax cost over value) | Net Appreciation (Depreciation) of Foreign Currency and Derivatives | Net Unrealized Appreciation (Depreciation) | Cost of Investments for Income Tax Purposes | |||||||||||||||
| Government Bond Fund | $ | 1,312,398 | $ | (5,674,386 | ) | $ | – | $ | (4,361,988 | ) | $ | 239,457,214 | ||||||||
| West Virginia Municipal Bond Fund | $ | 1,985,356 | $ | (474,832 | ) | $ | – | $ | 1,510,524 | $ | 112,018,537 | |||||||||
| Tactical Opportunity Fund | $ | 394,996 | $ | (1,397,284 | ) | $ | 1 | $ | (1,002,287 | ) | $ | 36,137,014 | ||||||||
The difference between book and tax basis for unrealized appreciation/(depreciation) for the Funds is attributable to wash sales, deferred dividends, and certain other investments.
The tax character of distributions as reported on the Statements of Changes in Net Assets for the year or period ended December 31, 2018 and December 31, 2017 was as follows:
| For Year Ended December 31, 2018 | ||||||||||||||||
| Fund Name | Tax-Exempt Income | Ordinary Income | Long-Term Capital Gain | Total | ||||||||||||
| Small Company Growth Fund | $ | – | $ | – | $ | 9,403,046 | $ | 9,403,046 | ||||||||
| Growth Fund | $ | – | $ | 1,742,667 | $ | 28,751,659 | $ | 30,494,326 | ||||||||
| Balanced Fund | $ | – | $ | 1,984,219 | $ | 3,915,374 | $ | 5,899,593 | ||||||||
| Government Bond Fund | $ | – | $ | 4,926,117 | $ | – | $ | 4,926,117 | ||||||||
| West Virginia Municipal Bond Fund | $ | 2,256,863 | $ | 42,890 | $ | – | $ | 2,299,753 | ||||||||
| Tactical Opportunity Fund | $ | – | $ | 193,822 | $ | 5,431 | $ | 199,253 | ||||||||
| For Year or Period Ended December 31, 2017 | ||||||||||||||||
| Fund Name | Tax–Exempt Income | Ordinary Income | Long–Term Capital Gain | Total | ||||||||||||
| Small Company Growth Fund | $ | – | $ | 1,232,708 | $ | 7,054,996 | $ | 8,287,704 | ||||||||
| Growth Fund | $ | – | $ | 1,928,696 | $ | 24,537,883 | $ | 26,466,579 | ||||||||
| Balanced Fund | $ | – | $ | 1,868,202 | $ | 3,088,173 | $ | 4,956,375 | ||||||||
| Government Bond Fund | $ | – | $ | 4,728,307 | $ | – | $ | 4,728,307 | ||||||||
| West Virginia Municipal Bond Fund | $ | 2,287,843 | $ | 54,785 | $ | 113,539 | $ | 2,456,167 | ||||||||
| Tactical Opportunity Fund | $ | – | $ | 493,062 | $ | – | $ | 493,062 | ||||||||
As of December 31, 2018, the Funds most recent year end, the components of distributable earnings on a tax basis were as follows:
| Fund Name | Undistributed net investment income | Accumulated net realized gain (loss) on investments | Other cumulative effect of timing differences | Net unrealized appreciation (depreciation) on investments | Total | |||||||||||||||
| Small Company Growth Fund | $ | – | $ | (690,621 | ) | $ | – | $ | 19,121,752 | $ | 18,431,131 | |||||||||
| Growth Fund | $ | 44,927 | $ | (3,060,440 | ) | $ | – | $ | 107,979,844 | $ | 104,964,331 | |||||||||
| Balanced Fund | $ | 7,102 | $ | 330,152 | $ | 17,878 | $ | 14,482,512 | $ | 14,837,644 | ||||||||||
| Government Bond Fund | $ | 143,967 | $ | (1,429,912 | ) | $ | – | $ | (4,361,988 | ) | $ | (5,647,933 | ) | |||||||
| West Virginia Municipal Bond Fund | $ | 44 | $ | (48,870 | ) | $ | – | $ | 1,510,524 | $ | 1,461,698 | |||||||||
| Tactical Opportunity Fund | $ | 45,137 | $ | (165,412 | ) | $ | – | $ | (1,002,287 | ) | $ | (1,122,562 | ) | |||||||
| Annual Report | December 31, 2018 | |
67 |
Notes to Financial Statements
December 31, 2018
Under current law, capital losses maintain their character as short-term or long-term and are carried forward to the next tax year without expiration. As of December 31, 2018, the following amounts are available as carry forwards to the next tax year:
| Non expiring | ||||||||
| Fund Name | ST | LT | ||||||
| Government Bond Fund | $ | 433,474 | $ | 853,783 | ||||
| West Virginia Municipal Bond Fund | $ | 1,513 | $ | 43,633 | ||||
| Tactical Opportunity Fund | $ | 56,480 | $ | – | ||||
The Funds elect to defer to the year ending December 31, 2019, capital losses recognized during the period November 1, 2018 to December 31, 2018 in the amount of:
| Fund Name | Capital Losses | |||
| Small Company Growth Fund | $ | 690,621 | ||
| Growth Fund | $ | 3,060,440 | ||
| Government Bond Fund | $ | 142,655 | ||
| West Virginia Municipal Bond Fund | $ | 3,724 | ||
| Tactical Opportunity Fund | $ | 108,932 | ||
Capital losses arising in the post-October period of the current fiscal year may be deferred to the next fiscal year if the fund elects to defer the recognition of these losses. When this election is made any losses recognized during the period are treated as having occurred on the first day of the next fiscal year separate from and in addition to the application of normal capital loss carryovers as described above.
5. INVESTMENT ADVISER FEE AND OTHER TRANSACTIONS WITH AFFILIATES
Investment Adviser Fee – WesBanco Investment Department is the Funds’ investment adviser (the “Adviser”). The Advisory Agreement between the Funds and the Adviser provides for an annual fee equal to the percentage of each Fund’s average daily net assets as follows:
| Fund Name | Investment Adviser Fee Percentage |
| Small Company Growth Fund | 0.75% |
| Growth Fund | 0.75% |
| Balanced Fund | 0.75% |
| Government Bond Fund | 0.60% |
| West Virginia Municipal Bond Fund | 0.60% |
| Tactical Opportunity Fund | 0.75% |
The Adviser is contractually obligated to waive a portion of its fees and reimburse other expenses until February 28, 2019 in amounts necessary to limit the Tactical Opportunity Fund’s operating expenses (including the organizational expenses of the Fund, but excluding interest expense, fees on borrowings and expenses associated with the Fund’s investment in other investment companies, if any, extraordinary expenses, tax reclaim recovery expenses and proxy-related expenses) to an annual rate (as a percentage of the Fund’s average daily net assets) of 1.75%. This expense limitation arrangement may not be terminated by the Adviser prior to such date unless such termination is approved by the Board. The Adviser is not entitled to recoup any of the fees or expenses waived or reimbursed within this expense limitation arrangement.
For the year ended December 31, 2018, the Adviser did not waive any fees due to expenses being under the limit.
Administrative Fee – ALPS Fund Services, Inc. (“ALPS”) provides the Funds with certain administrative personnel and services. The fees paid to ALPS are based on the daily average aggregate net assets of the Trust for the period, subject to an annual minimum (on the Trust level). The annual minimum fee will be allocated among the Funds using an equal per-Fund allocation. Any remaining amounts of the minimum fee after the per-Fund allocation will be allocated among the Funds based upon the relative net assets of each Fund.
| 68 | |
www.wesmarkfunds.com |
Notes to Financial Statements
December 31, 2018
Transfer Agent Fee – ALPS is the Transfer Agent and Dividend Disbursing Agent for the Funds. ALPS receives an annual base fee per Fund in addition to certain out-of-pocket expenses.
Distribution (12b-1) Fee – ALPS Distributors, Inc. (“ADI”), an affiliate of ALPS, serves as the Funds’ distributor.
The Funds' Trustees previously adopted a Distribution Plan (the "Plan") pursuant to Rule 12b-1 under the Act. The Plan expired on August 31, 2007, and the Funds' Trustees did not approve its renewal. Under the terms of the Plan, the Funds could have compensated the distributor from the net assets of the Funds to finance activities intended to result in the sale of each Fund's shares. The Plan specified that the Funds may have incurred distribution expenses at 0.25% of the daily net assets of each Fund.
Shareholder Services Fee – Under the terms of Shareholder Services Agreements with WesBanco Bank ("WesBanco", an affiliate of the Adviser) and other financial institutions, the Funds may pay WesBanco as well as other financial institutions, up to 0.25% of average daily net assets. The fee is used to finance certain services for shareholders and to maintain shareholder accounts. WesBanco and other financial institutions may voluntarily choose to waive any portion of their fee, which arrangement they can modify or terminate at any time at their sole discretion.
Recordkeeping Fee – The Funds may pay recordkeeping fees on an average net assets basis or on a per account per year basis to financial intermediaries for providing recordkeeping services to the Funds and shareholders.
Custodian Fees – WesBanco, an affiliate of the Adviser, is the Funds’ custodian. The custodian fee paid to WesBanco is based on the level of each Fund’s average daily net assets for the period, plus out-of-pocket expenses. WesBanco may voluntarily choose to waive any portion of its fee. WesBanco can modify or terminate this voluntary waiver at any time at its sole discretion.
Offering Costs – The Tactical Opportunity Fund will bear all expenses incurred in its business and operations, including all organization and initial offering costs (unless assumed by the Adviser), subject to the expense limitation plan. Costs incurred in connection with the offering and initial registration of the Tactical Opportunity Fund have been deferred and will be amortized on a straight-line basis over the first twelve months after commencement of operations.
General – Certain Officers and Trustees of the Funds are Officers and Directors or Trustees of the above companies.
6. INVESTMENT TRANSACTIONS
Purchases and sales of investments, excluding long-term U.S. government securities and short-term obligations, for the year ended December 31, 2018 were as follows:
| Fund | Purchases | Sales | ||||||
| Small Company Growth Fund | $ | 83,840,147 | $ | 91,012,260 | ||||
| Growth Fund | 119,863,619 | 177,550,135 | ||||||
| Balanced Fund | 37,253,432 | 47,290,420 | ||||||
| Government Bond Fund | 26,862,063 | 35,751,154 | ||||||
| West Virginia Municipal Bond Fund | 12,723,230 | 11,044,913 | ||||||
| Tactical Opportunity Fund | 54,490,712 | 44,957,286 | ||||||
Purchases and Sales of U.S. Government Securities, other than short-term securities, for the year ended December 31, 2018 were as follows:
| Fund | Purchases | Sales | ||||||
| Balanced Fund | $ | 579,435 | $ | 4,103,750 | ||||
| Government Bond Fund | 12,078,511 | 11,403,743 | ||||||
7. CONCENTRATION OF RISK
Since the West Virginia Municipal Bond Fund invests a substantial portion of its assets in issuers located in one state, it is more susceptible to factors adversely affecting issuers of that state than would be a comparable tax-exempt mutual fund that invests nationally. In order to reduce the credit risk associated with such factors, at December 31, 2018, 24% of the securities in the portfolio were backed by letters of credit, bond insurance of various financial institutions, or financial guaranty assurance agencies.
| Annual Report | December 31, 2018 | |
69 |
Notes to Financial Statements
December 31, 2018
Additionally, the Funds may invest a portion of their assets in securities of companies that are deemed by the Funds’ management to be classified in similar business sectors. The economic developments within a particular sector may have an adverse effect on the ability of issuers to meet their obligations. Additionally, economic developments may have an effect on the liquidity and volatility of portfolio securities.
8. COMPENSATION OF TRUSTEES
None of the Trustees are entitled to receive any retirement, pension plan or deferred compensation benefits from the Trust. Interested Trustees receive the same compensation as Independent Trustees. No officers of the Funds are compensated by the Funds, but officers may be reimbursed by the Funds for travel and related expenses incurred in performing their duties.
9. NEW ACCOUNTING PRONOUNCEMENTS
On October 4, 2018, the SEC amended Regulation S-X to require certain financial statement disclosure requirements to conform them to US GAAP for investment companies. Effective November 4, 2018, the Funds adopted disclosure requirement changes for Regulation S-X and these changes are reflected throughout this report. The Funds’ adoption of those amendments, effective with the financial statements prepared as of December 31, 2018, had no effect on the Funds’ net assets or results of operations.
In August 2018, the FASB issued ASU 2018-13, which changes the fair value measurement disclosure requirements of FASB ASC Topic 820, Fair Value Measurement. The update to Topic 820 includes new, eliminated, and modified disclosure requirements. ASU 2018-13 is effective for fiscal years beginning after December 15, 2019, including interim periods. Early adoption is permitted for any eliminated or modified disclosures. The Funds have elected to early adopt the eliminated and modified disclosures effective with the financial statements prepared as of December 31, 2018.
| 70 | |
www.wesmarkfunds.com |
Report of Independent Registered Public Accounting Firm
To the Shareholders and Board of Trustees of
WesMark Funds
Opinion on the Financial Statements
We have audited the accompanying statements of assets and liabilities, including the portfolios of investments, of WesMark Funds, comprising WesMark Small Company Growth Fund, WesMark Growth Fund, WesMark Balanced Fund, WesMark Government Bond Fund, WesMark West Virginia Municipal Bond Fund, and WesMark Tactical Opportunity Fund (the “Funds”) as of December 31, 2018, and the related statements of operations for the year then ended, the statements of changes in net assets for each of the two years or periods in the period then ended, including the related notes, and the financial highlights for each of the years or periods indicated in the period then ended (collectively referred to as the “financial statements”). In our opinion, the financial statements present fairly, in all material respects, the financial position of the each of the Funds as of December 31, 2018, the results of their operations for the year then ended, the changes in their net assets for each of the two years or periods in the period then ended, and the financial highlights for each of the years or periods indicated in the period then ended, in conformity with accounting principles generally accepted in the United States of America.
Basis for Opinion
These financial statements are the responsibility of the Funds’ management. Our responsibility is to express an opinion on the Funds’ financial statements based on our audits. We are a public accounting firm registered with the Public Company Accounting Oversight Board (United States) (“PCAOB”) and are required to be independent with respect to the Funds in accordance with the U.S. federal securities laws and the applicable rules and regulations of the Securities and Exchange Commission and the PCAOB.
We conducted our audits in accordance with the standards of the PCAOB. Those standards require that we plan and perform the audit to obtain reasonable assurance about whether the financial statements are free of material misstatement, whether due to error or fraud.
Our audits included performing procedures to assess the risks of material misstatement of the financial statements, whether due to error or fraud, and performing procedures that respond to those risks. Such procedures included examining, on a test basis, evidence regarding the amounts and disclosures in the financial statements. Our procedures included confirmation of securities owned as of December 31, 2018, by correspondence with the custodian and brokers. Our audits also included evaluating the accounting principles used and significant estimates made by management, as well as evaluating the overall presentation of the financial statements. We believe that our audits provide a reasonable basis for our opinion.
We have served as the Funds’ auditor since 2011.

COHEN & COMPANY, LTD.
Cleveland, Ohio
February 26, 2019
| Annual Report | December 31, 2018 | |
71 |
Shareholder Expense Example
December 31, 2018 (Unaudited)
As a shareholder of a Fund, you incur ongoing costs, including management fees and to the extent applicable, shareholder services fees and other Fund expenses. This example is intended to help you to understand your ongoing costs (in dollars) of investing in the Funds and to compare these costs with the ongoing costs of investing in other mutual funds. It is based on an investment of $1,000 invested at the beginning of the period and held for the entire period from July 1, 2018 to December 31, 2018.
ACTUAL EXPENSES
The first line of the table below (“Actual Fund Return”) provides information about actual account values and actual expenses. You may use the information in this section, together with the amount you invested, to estimate the expenses that you incurred over the period. Simply divide your account value by $1,000 (for example, an $8,600 account value divided by $1,000 = 8.6), then multiply the result by the number in the first section under the heading “Expense Paid During Period” to estimate the expenses attributable to your investment during this period.
HYPOTHETICAL EXAMPLE FOR COMPARISON PURPOSES
The second line under each fund of the table below (“Hypothetical Fund Return”) provides information about hypothetical account values and hypothetical expenses based on a Fund’s actual expense ratio and an assumed rate of return of 5% per year before expenses, which is not the Fund’s actual return. Thus, you should not use the hypothetical account values and expenses to estimate the actual ending account balance or your expenses for the period. Rather, these figures are required to be provided to enable you to compare the ongoing costs of investing in the Funds with other funds. To do so, compare this 5% hypothetical example with the 5% hypothetical examples that appear in the shareholder reports of the other funds.
Please note that the expenses shown in the table are meant to highlight your ongoing costs only. Therefore, the second line of the table below (“Hypothetical Fund Return”) is useful in comparing ongoing costs only and will not help you determine the relative total costs of owning different funds.
|
Beginning Account Value July 1, 2018 |
Ending Account Value December 31, 2018 |
Expense Paid During Period(1) |
Net Expense Ratios(2) | |
| WesMark Small Company Growth Fund | ||||
| Actual Fund Return | $1,000.00 | $839.80 | $5.84 | 1.26% |
| Hypothetical Fund Return (assuming a 5% return before expenses) | $1,000.00 | $1,018.85 | $6.41 | 1.26% |
| WesMark Growth Fund | ||||
| Actual Fund Return | $1,000.00 | $903.00 | $5.42 | 1.13% |
| Hypothetical Fund Return (assuming a 5% return before expenses) | $1,000.00 | $1,019.51 | $5.75 | 1.13% |
| WesMark Balanced Fund | ||||
| Actual Fund Return | $1,000.00 | $965.00 | $6.14 | 1.24% |
| Hypothetical Fund Return (assuming a 5% return before expenses) | $1,000.00 | $1,018.95 | $6.31 | 1.24% |
| WesMark Government Bond Fund | ||||
| Actual Fund Return | $1,000.00 | $1,021.10 | $5.15 | 1.01% |
| Hypothetical Fund Return (assuming a 5% return before expenses) | $1,000.00 | $1,020.11 | $5.14 | 1.01% |
| WesMark West Virginia Municipal Bond Fund | ||||
| Actual Fund Return | $1,000.00 | $1,013.10 | $5.53 | 1.09% |
| Hypothetical Fund Return (assuming a 5% return before expenses) | $1,000.00 | $1,019.71 | $5.55 | 1.09% |
| WesMark Tactical Opportunity Fund | ||||
| Actual Fund Return | $1,000.00 | $940.90 | $7.44 | 1.52% |
| Hypothetical Fund Return (assuming a 5% return before expenses) | $1,000.00 | $1,017.54 | $7.73 | 1.52% |
| (1) | Expenses are equal to the Funds' annualized net expense ratios, multiplied by the average account value over the period, multiplied by 181/365 (to reflect the six month period). |
| (2) | Annualized, based on the Fund's most recent fiscal half-year expenses. |
| 72 | |
www.wesmarkfunds.com |
Board of Trustees and Trust Officers
December 31, 2018 (Unaudited)
The Board is responsible for managing the Trust’s business affairs and for exercising all of the Trust’s powers except those reserved for the shareholders. The following tables give information about each Board member and the senior officers of the Funds as of December 31, 2018. Where required, the tables separately list Board members who are “interested persons” of the Funds (i.e., “Interested” Board members) and those who are not (i.e., “Independent” Board members). The WesMark Fund Complex consists of one Investment Company (comprising six portfolios). Unless otherwise noted, each Officer is elected annually and each Board member oversees all portfolios in the WesMark Fund Complex and serves for an indefinite term.
|
Name Age Address* Date Service Began |
Principal Occupations in Past Five Years, other Directorships Held and Previous Positions |
| Independent Trustees | |
Lawrence E. Bandi
TRUSTEE |
Principal Occupations: President, Central Catholic High School, Wheeling, WV.
Other Directorships: Special Wish Foundation; Catholic Charities Health Care West Virginia, Inc. (Charity); Welty Corporation; and New City (Property Development).
Previous Positions: President and Chief Executive Officer, Valley National Gases, Inc. (Gas Supplier); Chief Financial Officer & Vice President, West Virginia Northern Community College (Education); VP & CFO MPD Corporation (Hospitality); Wheeling Convention and Visitors Bureau (Economic Development), and MPD Corporation (Property Management). |
Mark M. Gleason
TRUSTEE |
Principal Occupation: Managing Director, Gleason & Associates (Certified Public Accounting and Consulting Firm)
Other Directorships: Trustee, Various Asbestos Trusts (Investment of Assets and Claim Payment). |
Richard A. Hay
TRUSTEE |
Principal Occupation: Retired.
Previous Occupation: Senior Vice President, UBS Financial Services (Financial Services). |
| Interested Trustees | |
Robert E. Kirkbride**
CHAIRMAN AND TRUSTEE |
Principal Occupations and Other Directorships: Paid Consultant to the Executive Loan Committee of WesBanco Bank, Inc.(Financial Services); Officer and Director, Ohio Valley Land Company (Real Estate Development); Director, The Mountain Company (Holding Company); Director, The Laurel Management Group (Holding Company); Director and Officer, Thunder Corporation (Oil and Gas Production); Member and Manager, Marietta Ventures LLC (real estate development and related consulting). |
J. Christopher Gardill***
TRUSTEE |
Principal Occupations: Member, Phillips, Gardill, Kaiser & Altmeyer, PLLC (private law firm).
Other Directorships: Board Member, Wheeling Vintage Raceboat Regatta (Private Organization); Board Member, Our Lady of Peace School; Director, The Kings' Daughters Childcare Center, Inc.; Director, OVConnect, Inc. (Private Organization); Director, Appalachian Outreach, Inc. (Non-Profit). |
| * | All Trustees may be reached via the Funds at 1290 Broadway, Suite 1100, Denver, CO, 80203. |
| ** | Mr. Kirkbride is an interested person due to his security holdings in WesBanco, Inc. The Funds’ investment adviser, WesBanco Investment Department, is a division of WesBanco Bank, Inc., a wholly owned subsidiary of WesBanco, Inc. Mr. Kirkbride previously served as a Director for WesBanco, Inc. and WesBanco Bank, Inc. and currently serves as a paid consultant to the Executive Loan Committee of WesBanco Bank, Inc. |
| *** | Mr. Gardill is an interested person due to his affiliation with Phillips, Gardill, Kaiser & Altmeyer, PLLC who serves as legal counsel to Wesbanco Inc. and Wesbanco Bank. The Funds' investment adviser, WesBanco Investment Department, is a division of WesBanco Bank, Inc., a wholly owned subsidiary of WesBanco, Inc. Mr. Gardill was also an independent consultant to the Trust Committee of WesBanco Bank, Inc. |
| Annual Report | December 31, 2018 | |
73 |
Board of Trustees and Trust Officers
December 31, 2018 (Unaudited)
|
Name, Age, Address |
Positions Held with Fund Date Service Began |
Principal Occupation(s) and Previous Position(s) |
| Officers | ||
| David B. Ellwood Age: 62 WesBanco Trust and Investment Services One Bank Plaza Wheeling, WV 26003 |
CHIEF EXECUTIVE OFFICER PRESIDENT Began serving: January 2013 |
Principal Occupations: Co-Portfolio Manager, President and Chief Executive Officer of the WesMark Funds; Executive Vice President, WesBanco Trust and Investment Services.
Previous Positions: Chief Financial Officer, WesMark Funds 2009 to January 2013; Vice President, WesMark Funds September 2004 to January 2013. |
| Deborah Ferdon Age: 66 WesBanco Trust and Investment Services One Bank Plaza Wheeling, WV 26003 |
CHIEF COMPLIANCE OFFICER Began serving: September 2004 |
Principal Occupations: Chief Compliance Officer of the WesMark Funds; Chief Compliance Officer and Executive Vice President of WesBanco Investment Department and WesBanco Trust and Investment Services, Registered Principal of WesBanco Securities, Inc. |
| Steven Kellas Age: 52 WesBanco Trust and Investment Services One Bank Plaza Wheeling, WV 26003 |
CHIEF FINANCIAL OFFICER TREASURER Began serving: January 2013 |
Principal Occupations: Co-Portfolio Manager, Treasurer and Chief Financial Officer of the WesMark Funds; Senior Vice President WesBanco Trust and Investment Services.
Previous Position: Co-Portfolio Manager, WesMark Funds 2006-2013; Vice President, WesBanco Trust and Investment Services. |
| Scott Love Age: 42 WesBanco Trust and Investment Services One Bank Plaza Wheeling, WV 26003 |
VICE PRESIDENT Began serving: February 2013 |
Principal Occupation: Co -Portfolio Manager and Vice President of the WesMark Funds, Senior Vice President WesBanco Trust and Investment Services.
Previous Position: Morgan Keegan & Co, 1st Vice President, Economic and Market Strategy, April 2010 to May 2012. |
| Todd P. Zerega Age: 44 700 13th Street, N.W. Washington, D.C. 20005-3690 |
SECRETARY Began serving: September 2004 |
Principal Occupation: Partner, Perkins Coie, LLP.
Previous Positions: Partner, Reed Smith, LLP. |
| Karen Gilomen Age: 48 1290 Broadway, Suite 1100 Denver, CO 80203 |
ASSISTANT SECRETARY Began serving: August 2016 |
Principal Occupation: Senior Counsel and Vice President, ALPS Fund Services, Inc. since August 2016.
Previous Positions: Vice President - General Counsel and Chief Compliance Officer, Monticello Associates, Inc., January 2010 to August 2016. |
| Lori Anderson Age: 37 1290 Broadway, Suite 1100 Denver, CO 80203 |
ASSISTANT TREASURER Began serving: May 2018 |
Principal Occupation: Fund Controller, ALPS Fund Services, Inc. since March 2018.
Previous Positions: Assistant Fund Controller, ALPS Fund Services, August 2014 to March 2018. |
The Funds’ current Statement of Additional Information contains additional information about the Funds’ Trustees and is available, without charge, upon request, by calling the Funds toll-free at 1-800-864-1013.
| 74 | |
www.wesmarkfunds.com |
Additional Information
December 31, 2018 (Unaudited)
Mutual funds are not bank deposits or obligations, are not guaranteed by any bank, and are not insured or guaranteed by the U.S. government, the Federal Deposit Insurance Corporation, the Federal Reserve Board, or any other government agency. Investment in mutual funds involves investment risk, including the possible loss of principal.
This report is authorized for distribution to prospective investors only when preceded or accompanied by the funds’ prospectus which contains facts concerning its objective and policies, management fees, expenses and other information.
VOTING PROXIES ON FUND PORTFOLIO SECURITIES
A description of the policies and procedures that the Funds use to determine how to vote proxies relating to securities held in a Fund’s portfolio is available, without charge and upon request, by calling 1-800-864-1013. A report on Form N-PX of how the Funds voted any such proxies during the most recent 12-month period ended June 30 is available without charge and upon request by calling the Funds toll-free at 1-800-864-1013. This information is also available from the EDGAR database on the SEC’s website at http://www.sec.gov.
QUARTERLY PORTFOLIO SCHEDULE
The Funds file with the SEC a complete schedule of their portfolio holdings, as of the close of the first and third quarters of its fiscal year, on Form N-Q. These filings are also available on the SEC’s website at http://www.sec.gov and may be reviewed and copied at the SEC’s Public Reference Room in Washington, DC (call 1-800-SEC-0330 for information on the operation of the Public Reference Room). You may also access this information on the WesMark Funds website at www.wesmarkfunds.com by clicking on “Quarterly Reports”, then selecting the name of the Fund.
NOTICE TO STOCKHOLDERS
For the year ended December 31, 2018, 98.14% of the distributions from net investment income for West Virginia Municipal Bond Fund are exempt from federal income tax.
Of the ordinary income (including short-term capital gain) distributions made by the Funds during the year ended December 31, 2018, the percentages qualifying for the dividend received deduction available to corporate shareholders are as follows:
| Fund Name | Percentage |
| Growth Fund | 100.00% |
| Balanced Fund | 91.17% |
| Tactical Opportunity Fund | 100.00% |
For the year ended December 31, 2018, the following percentages of total ordinary dividends paid by the Funds are qualifying dividends which may be subject to a maximum tax rate of 15%, as provided for by the Jobs and Growth Tax Relief Act of 2003. Complete information will be reported in conjunction with the reporting of your distributions on Form 1099-DIV. The percentages were as follows:
| Fund Name | Percentage |
| Growth Fund | 100.00% |
| Balanced Fund | 98.16% |
| Tactical Opportunity Fund | 100.00% |
Pursuant to Section 852(b)(3) of the Internal Revenue Code, the Small Company Growth Fund, Growth Fund, Balanced Fund, and Tactical Opportunity Fund designated $9,403,046, $28,751,659, $3,915,374, and $5,431, respectively as long-term capital gain dividends.
| Annual Report | December 31, 2018 | |
75 |
Glossary of Terms
December 31, 2018 (Unaudited)
Basis points – a unit that is equal to 1/100th of 1% and is used to denote the change in a financial instrument.
CBOE PutWrite Index – a benchmark index that measures the performance of a hypothetical portfolio that sells S&P 500 Index put options against collateralized cash reserves held in a money market account.
Collateralized Mortgage Obligation – complex mortgage backed securities that allocate payments and prepayments from an underlying mortgage pools among holders of different classes or tranches of the CMO.
Consumer Price Index (CPI) – a measure of the average change over time in the prices paid by urban consumers for a market basket of consumer goods and services.
Covered call – an options strategy where an investor holds a long position in an asset and writes (sells) call options on that same asset to generate an income stream.
Duration – a measure of a security’s price sensitivity to changes in interest rates. Securities with longer durations are more sensitive to changes in interest rates than securities of shorter durations.
Fannie Mae and Freddie Mac – government sponsored entities that receive support through federal subsidies, loan or other benefits.
Floating rate debt – a debt instrument with a variable interest rate.
HFRI Fund of Funds Composite Index – The Hedge Fund Research, Inc. (HFRI) Fund of Funds Composite Index is an equal weighted index that consists of over 800 constituent hedge funds, including both domestic and offshore funds.
Maturity – maturity date refers to the final payment date of a loan or other financial instrument, at which point the principal (and all remaining interest) is due to be paid.
Mortgage Backed Securities – a type of asset-backed security that is secured by a mortgage or collection of mortgages.
Mortgage Pool – a group of mortgages with similar interest rates and maturity dates “pooled together” for the issuance of a mortgage-backed security. Some mortgage-backed securities issued by Fannie Mae, Freddie Mac and Ginnie Mae are known as “pools” themselves. These are the simplest form of mortgage-backed security.
Options – a contract which offers the buyer the right, but not the obligation, to buy (call option) or sell (put option) the underlying asset at an agreed-upon price during a certain period of time or on a specific date.
Quantitative Easing III (QEIII) – monetary policy implemented by the Federal Reserve in 2012 to purchase $40 billion a month of agency mortgage backed securities (discontinued in October 2014) and also to continue extremely low rate policy until at least mid-2015.
Russell 2000 Index – an index measuring the performance of approximately 2,000 small-cap companies in the Russell 3000 Index, which is made up of 3,000 of the biggest U.S. stocks. The Russell 2000 serves as a benchmark for small-cap stocks in the United States.
S&P 600 – An index of small-cap stocks managed by Standard and Poor's. The S&P 600 SmallCap Index covers a broad range of small cap stocks in the United States. The index is weighted according to market capitalization and covers about 3-4% of the total market for equities in the United States.
Yield – the income return on an investment, such as the interest or dividends received from holding a particular security.
Yield curve – a line that plots the interest rates, at a set point in time, of bonds having equal credit quality but differing maturity dates.
Yield spread – the difference between yields on differing debt instruments of varying maturities, credit ratings and risk, calculated by deducting the yield of one instrument from another.
| 76 | |
www.wesmarkfunds.com |
Glossary of Terms
December 31, 2018 (Unaudited)
Investment Ratings:
| Description |
Standard and Poor’s Long-Term Debt Rating |
Moody’s Investors Service Long-Term Bond Rating |
| Highest rating available. Capacity to pay interest and repay principal is extremely strong. Carry smallest degree of investment risk. | AAA | Aaa |
| Very strong capacity to pay interest and repay principal. Differ from AAA rated securities by very small degree. Still considered high grade obligation. | AA | Aa |
| Strong capacity to pay interest and repay principal although is somewhat more susceptible to adverse effects of changes in circumstances and economic conditions than those rated higher. Considered upper medium grade obligation. | A | A |
| Regarded as having an adequate capacity to pay interest and repay principal. Any adverse economic conditions or changing circumstances are more likely to lead to a weakened capacity to pay vs. those rated higher. Considered medium grade obligation. | BBB | Baa |
| Judged to have speculative elements, but has less near-term vulnerability to default than other speculative=e issues. Faces major ongoing uncertainties or exposure to adverse business, financial, or economic conditions which could lead to inadequate capacity to meet timely interest and principal payments. | BB | Ba |
| Has greater vulnerability to default but currently has capacity to meet interest payments and principal repayments. Adverse business, financial, or economic conditions will likely impair capacity or willingness to pay interest or principal. Generally lack characteristics of the desirable investment. | B | B |
| Currently identifiable vulnerability to default and is dependent upon favorable business, financial, and economic conditions to meet timely payment of interest and repayment of principal. Such issues may be in default or there may be present elements of danger with respect to principal or interest. | CCC | Caa |
| Typically applied to debt subordinated to senior debt that is assigned an actual or implied CCC debt rating (by S&P). Represent obligations which are speculative in a high degree. | CC | Ca |
| Typically applied to debt subordinated to senior debt which has been assigned an actual or implied CCC-debt rating (by S&P). Represents the lowest rated class of bonds. | C | C |
Credit rating firms, such as Standard & Poor's and Moody's, use different designations consisting of upper- and lower-case letters 'A' and 'B' to identify a bond's credit quality rating. 'AAA' and 'AA' (high credit quality) and 'A' and 'BBB' (medium credit quality) are considered investment grade. Credit ratings for bonds below these designations ('BB', 'B', 'CCC', etc.) are considered low credit quality, and are commonly referred to as “junk bonds.”
| Annual Report | December 31, 2018 | |
77 |
Item 2. Code of Ethics.
(a) As of the end of the period covered by this report, the registrant has adopted a code of ethics (the “Section 406 Standards for Investment Companies - Ethical Standards for Principal Executive and Financial Officers”) that applies to the registrant’s Principal Executive Officer and Principal Financial Officer.
(b) Not applicable.
(c) During the period covered by this report, no amendments were made to the provisions of the code of ethics adopted in 2(a) above.
(d) During the period covered by this report, no implicit or explicit waivers to the provisions of the code of ethics adopted in 2(a) above were granted.
(e) Not applicable to the registrant.
(f)(3) The registrant hereby undertakes to provide to any person, without charge, upon request, a copy of the code of ethics referenced in Item 2(a) above. To request a copy of the code of ethics, contact the registrant at 1-800-864-1013.
Item 3. Audit Committee Financial Expert.
The registrant’s Board of Trustees has determined that the following members of the Board’s Audit Committee are each an “audit committee financial expert” and are “independent” for purposes of this Item: Lawrence E. Bandi and Mark M. Gleason.
Item 4. Principal Accountant Fees and Services.
(a) Audit Fees. The aggregate fees billed in each of the fiscal years ended December 31, 2017 and December 31, 2018 for professional services rendered by the principal accountant for the audit of the registrant’s annual financial statements or services that are normally provided by the accountant in connection with statutory and regulatory filings or engagements were $78,000 and $81,000 respectively.
(b) Audit-Related Fees. The aggregate fees billed in each of the fiscal years ended December 31, 2017 and December 31, 2018 for assurance and related services by the principal accountant that are reasonably related to the performance of the audit of the registrant’s financial statements and are not reported under paragraph (a) of this Item were $0 and $0, respectively.
(c) Tax Fees. The aggregate fees billed in each of the fiscal years ended December 31, 2017 and December 31, 2018 for professional services rendered by the principal accountant for tax compliance, tax advice and tax planning were $18,000 and $18,000, respectively.
(d) All Other Fees. The aggregate fees billed in each of the fiscal years ended December 31, 2017 and December 31, 2018 for products and services provided by the principal accountant, other than the services reported in paragraphs (a) through (c) of this Item were $15,100 and $12,500 respectively. These services were provided in connection with conducting Rule 17f-2 examinations and preparing related SEC filings.
(e)(1) Audit Committee Policies Regarding Pre-approval of Services.
The Audit Committee is required to pre-approve audit and non-audit services performed by the independent auditor in order to assure that the provision of such services does not impair the auditor’s independence. Unless a type of service to be provided by the independent auditor has received general pre-approval, it will require specific pre-approval by the Audit Committee. Any proposed services exceeding pre-approved cost levels will require specific pre-approval by the Audit Committee.
Certain services have the general pre-approval of the Audit Committee. The term of the general pre-approval is 12 months from the date of pre-approval, unless the Audit Committee specifically provides for a different period. The Audit Committee will annually review the services that may be provided by the independent auditor without obtaining specific pre-approval from the Audit Committee and may grant general pre-approval for such services. The Audit Committee will revise the list of general pre-approved services from time to time, based on subsequent determinations. The Audit Committee will not delegate its responsibilities to pre-approve services performed by the independent auditor to management.
The Audit Committee has delegated pre-approval authority to its Chairman. The Chairman will report any pre-approval decisions to the Audit Committee at its next scheduled meeting. The Committee will designate another member with such pre-approval authority when the Chairman is unavailable.
AUDIT SERVICES
The annual Audit Services engagement terms and fees will be subject to the specific pre-approval of the Audit Committee. The Audit Committee must approve any changes in terms, conditions and fees resulting from changes in audit scope, registered investment company structure or other matters.
In addition to the annual Audit services engagement specifically approved by the Audit Committee, the Audit Committee may grant general pre-approval for other Audit Services, which are those services that only the independent auditor reasonably can provide. The Audit Committee has pre-approved certain Audit Services; all other Audit Services must be specifically pre-approved by the Audit Committee.
AUDIT-RELATED SERVICES
Audit-Related Services are assurance and related services that are reasonably related to the performance of the audit or review of the registrant’s financial statements or that are traditionally performed by the independent auditor. The Audit Committee believes that the provision of Audit-Related Services does not impair the independence of the auditor, and has pre-approved certain Audit-Related Services; all other Audit-Related Services must be specifically pre-approved by the Audit Committee.
TAX SERVICES
The Audit Committee believes that the independent auditor can provide Tax Services to the registrant such as tax compliance, tax planning and tax advice without impairing the auditor’s independence. However, the Audit Committee will not permit the retention of the independent auditor in connection with a transaction initially recommended by the independent auditor, the purpose of which may be tax avoidance and the tax treatment of which may not be supported in the Internal Revenue Code and related regulations. The Audit Committee has pre-approved certain Tax Services; all Tax Services involving large and complex transactions must be specifically pre-approved by the Audit Committee.
ALL OTHER SERVICES
With respect to the provision of services other than audit, review or attest services the pre-approval requirement is waived if:
| (1) | The aggregate amount of all such services provided constitutes no more than five percent of the total amount of revenues paid by the registrant, the registrant’s adviser (not including any sub-adviser whose role is primarily portfolio management and is subcontracted with or overseen by another investment adviser), and any entity controlling, controlled by, or under common control with the investment adviser that provides ongoing services to the registrant to its accountant during the fiscal year in which the services are provided; |
| (2) | Such services were not recognized by the registrant, the registrant’s adviser (not including any sub-adviser whose role is primarily portfolio management and is subcontracted with or overseen by another investment adviser), and any entity controlling, controlled by, or under common control with the investment adviser that provides ongoing services to the registrant at the time of the engagement to be non-audit services; and |
| (3) | Such services are promptly brought to the attention of the Audit Committee of the issuer and approved prior to the completion of the audit by the Audit Committee or by one or more members of the Audit Committee who are members of the board of directors to whom authority to grant such approvals has been delegated by the Audit Committee. |
The Audit Committee may grant general pre-approval to those permissible non-audit services classified as All Other services that it believes are routine and recurring services, and would not impair the independence of the auditor.
The SEC’s rules and relevant guidance should be consulted to determine the precise definitions of prohibited non-audit services and the applicability of exceptions to certain of the prohibitions.
PRE-APPROVAL FEE LEVELS
Pre-approval fee levels for all services to be provided by the independent auditor will be established annually by the Audit Committee. Any proposed services exceeding these levels will require specific pre-approval by the Audit Committee.
PROCEDURES
Requests or applications to provide services that require specific approval by the Audit Committee will be submitted to the Audit Committee by both the independent auditor and the Principal Accounting Officer and/or Internal Auditor, and must include a joint statement as to whether, in their view, the request or application is consistent with the SEC’s rules on auditor independence.
(e)(2) The services described in paragraphs (c) and (d) of this Item were approved by the registrant’s Audit Committee pursuant to paragraph (c)(7)(i)(C) of Rule 2-01 of Regulation S-X. There were no services of the kind described in paragraph (b) of this Item provided.
(f) Not applicable to registrant.
(g) Non-Audit Fees. The aggregate non-audit fees billed by the registrant’s accountant for services rendered to the registrant, and rendered to the registrant’s investment adviser, and any entity controlling, controlled by, or under common control with the adviser that provides ongoing services to the registrant for each of the fiscal years of the registrant ended December 31, 2017 and December 31, 2018 were $31,100 and $30,500, respectively.
(h) The registrant’s Audit Committee has considered that the provision of non-audit services that were rendered to the registrant’s adviser, and any entity controlling, controlled by, or under common control with the investment adviser that provides ongoing services to the registrant that were not pre-approved pursuant to paragraph (c)(7)(ii) of Rule 2-01 of Regulation S-X is compatible with maintaining the principal accountant’s independence.
Item 5. Audit Committee of Listed Registrants.
Not applicable to the registrant.
Item 6. Investments.
| (a) | The registrant’s “Schedule I – Investments in securities of unaffiliated issuers” (as set forth in 17 CFR 210.12-12) is included in Item 1 of this Form N-CSR. |
| (b) | Not applicable to the registrant. |
Item 7. Disclosure of Proxy Voting Policies and Procedures for Closed-End Management Investment Companies.
Not applicable to the registrant.
Item 8. Portfolio Managers of Closed-End Management Investment Companies.
Not applicable to the registrant.
Item 9. Purchases of Equity Securities by Closed-End Management Investment Company and Affiliated Purchasers.
Not applicable to the registrant.
Item 10. Submission of Matters to a Vote of Security Holders.
No changes to report.
Item 11. Controls and Procedures.
| (a) | The registrant’s principal executive and principal financial officers have concluded that the registrant’s disclosure controls and procedures (as defined in Rule 30a-3(c) under the Investment Company Act of 1940, as amended (17 CFR 270.30a-3(c))), are effective in design and operation and are sufficient to form the basis of the certifications required by Rule 30a-(2) under the Investment Company Act of 1940, as amended, based on their evaluation of these disclosure controls and procedures within 90 days of the filing date of this report on Form N-CSR. |
| (b) | There were no changes in the registrant’s internal control over financial reporting (as defined in Rule 30a-3(d) under the Investment Company Act of 1940, as amended) that occurred during the second fiscal quarter of the period covered by this report that have materially affected, or are reasonably likely to materially affect, the registrant’s internal control over financial reporting. |
Item 12. Disclosure of Securities Lending Activities for Closed-End Management Investment Companies.
Not applicable.
Item 13. Exhibits.
| (a)(1) | Not applicable. |
| (a)(2) | The certifications required by Rule 30a-2(a) of the Investment Company Act of 1940, as amended, and Section 302 of the Sarbanes-Oxley Act of 2002 are attached hereto as Ex.99.Cert. |
| (a)(3) | Not applicable. |
| (b) | A certification of the registrant’s principal executive officer and principal financial officer, as required by Rule 30a-2(b) under the Investment Company Act of 1940, as amended, is attached as Ex.99.906.Cert. |
SIGNATURES
Pursuant to the requirements of the Securities Exchange Act of 1934 and the Investment Company Act of 1940, the registrant has duly caused this report to be signed on its behalf by the undersigned, thereunto duly authorized.
| Registrant | WesMark Funds | |
| By | /s/ David B. Ellwood | |
David B. Ellwood President and Chief Executive Officer (Principal Executive Officer) | ||
| Date | March 8, 2019 | |
Pursuant to the requirements of the Securities Exchange Act of 1934 and the Investment Company Act of 1940, this report has been signed below by the following persons on behalf of the registrant and in the capacities and on the dates indicated.
| By | /s/ David B. Ellwood | |
|
David B. Ellwood President and Chief Executive Officer (Principal Executive Officer) | ||
| Date | March 8, 2019 | |
| By | /s/ Steven Kellas | |
|
Steven Kellas Treasurer and Chief Financial Officer (Principal Financial Officer) | ||
| Date | March 8, 2019 | |
Ex.99.Cert.
I, David B. Ellwood, certify that:
1. I have reviewed this report on Form N-CSR of WesMark Funds (“registrant”);
2. Based on my knowledge, this report does not contain any untrue statement of a material fact or omit to state a material fact necessary to make the statements made, in light of the circumstances under which such statements were made, not misleading with respect to the period covered by this report;
3. Based on my knowledge, the financial statements, and other financial information included in this report, fairly present in all material respects the financial condition, results of operations, changes in net assets, and cash flows (if the financial statements are required to include a statement of cash flows) of the registrant as of, and for, the periods presented in this report;
4. The registrant's other certifying officer and I are responsible for establishing and maintaining disclosure controls and procedures (as defined in rule 30a-3(c) under the Investment Company Act of 1940) and internal control over financial reporting (as defined in Rule 30a-3(d) under the Investment Company Act of 1940) for the registrant and have:
| a. | Designed such disclosure controls and procedures, or caused such disclosure controls and procedures to be designed under our supervision, to ensure that material information relating to the registrant, including its consolidated subsidiaries, is made known to us by others within those entities, particularly during the period in which this report is being prepared; |
| b. | Designed such internal control over financial reporting, or caused such internal control over financial reporting to be designed under our supervision, to provide reasonable assurance regarding the reliability of financial reporting and the preparation of financial statements for external purposes in accordance with generally accepted accounting principles; |
| c. | Evaluated the effectiveness of the registrant's disclosure controls and procedures and presented in this report our conclusions about the effectiveness of the disclosure controls and procedures, as of a date within 90 days prior to the filing date of this report based on such evaluation; and |
| d. | Disclosed in this report any change in the registrant’s internal control over financial reporting that occurred during the second fiscal quarter of the period covered by this report that has materially affected, or is reasonably likely to materially affect, the registrant’s internal control over financial reporting; and |
5. The registrant's other certifying officers and I have disclosed to the registrant's auditors and the audit committee of the registrant's board of directors (or persons performing the equivalent functions):
| a. | All significant deficiencies and material weaknesses in the design or operation of internal control over financial reporting which are reasonably likely to adversely affect the registrant’s ability to record, process, summarize, and report financial information; and |
| b. | Any fraud, whether or not material, that involves management or other employees who have a significant role in the registrant’s internal control over financial reporting. |
| Date: March 8, 2019 | |||
| By: | /s/ David B. Ellwood | ||
| David B. Ellwood | |||
| President and Chief Executive Officer | |||
| (Principal Executive Officer) | |||
Ex.99.Cert.
I, Steven Kellas, certify that:
| 1. | I have reviewed this report on Form N-CSR of WesMark Funds (“registrant”); |
| 2. | Based on my knowledge, this report does not contain any untrue statement of a material fact or omit to state a material fact necessary to make the statements made, in light of the circumstances under which such statements were made, not misleading with respect to the period covered by this report; |
| 3. | Based on my knowledge, the financial statements, and other financial information included in this report, fairly present in all material respects the financial condition, results of operations, changes in net assets, and cash flows (if the financial statements are required to include a statement of cash flows) of the registrant as of, and for, the periods presented in this report; |
| 4. | The registrant's other certifying officer and I are responsible for establishing and maintaining disclosure controls and procedures (as defined in rule 30a-3(c) under the Investment Company Act of 1940) and internal control over financial reporting (as defined in Rule 30a-3(d) under the Investment Company Act of 1940) for the registrant and have: |
| a. | Designed such disclosure controls and procedures, or caused such disclosure controls and procedures to be designed under our supervision, to ensure that material information relating to the registrant, including its consolidated subsidiaries, is made known to us by others within those entities, particularly during the period in which this report is being prepared; |
| b. | Designed such internal control over financial reporting, or caused such internal control over financial reporting to be designed under our supervision, to provide reasonable assurance regarding the reliability of financial reporting and the preparation of financial statements for external purposes in accordance with generally accepted accounting principles; |
| c. | Evaluated the effectiveness of the registrant's disclosure controls and procedures and presented in this report our conclusions about the effectiveness of the disclosure controls and procedures, as of a date within 90 days prior to the filing date of this report based on such evaluation; and |
| d. | Disclosed in this report any change in the registrant’s internal control over financial reporting that occurred during the second fiscal quarter of the period covered by this report that has materially affected, or is reasonably likely to materially affect, the registrant’s internal control over financial reporting; and |
| 5. | The registrant's other certifying officer and I have disclosed to the registrant's auditors and the audit committee of the registrant's board of directors (or persons performing the equivalent functions): |
| a. | All significant deficiencies and material weaknesses in the design or operation of internal control over financial reporting which are reasonably likely to adversely affect the registrant’s ability to record, process, summarize, and report financial information; and |
| b. | Any fraud, whether or not material, that involves management or other employees who have a significant role in the registrant’s internal control over financial reporting. |
| Date: March 8, 2019 | |||
| By: | /s/ Steven Kellas | ||
| Steven Kellas | |||
| Treasurer and Chief Financial Officer | |||
| (Principal Financial Officer) | |||
Ex.99.906.Cert
This certification is furnished pursuant to Section 906 of the Sarbanes-Oxley Act of 2002, 18 U.S.C. § 1350, and accompanies the report on Form N-CSR for the period ended December 31, 2018 of the WesMark Funds (the “Registrant”).
We, the undersigned officers of the Registrant, hereby certify, to the best of our knowledge that the Registrant’s:
| (i) | Form N-CSR fully complies with the requirements of Section 13(a) or Section 15(d), as applicable, of the Securities Exchange Act of 1934 (15 U.S.C. 78m or 78o(d)); and |
| (ii) | information contained in the Form N-CSR fairly presents, in all material respects, the financial condition and results of operations of the Registrant. |
| /s/ David B. Ellwood | ||
| David B. Ellwood | ||
| President and Chief Executive Officer | ||
| (Principal Executive Officer) | ||
| Dated: | March 8, 2019 | |
| /s/ Steven Kellas | ||
| Steven Kellas | ||
| Treasurer and Chief Financial Officer | ||
| (Principal Financial Officer) | ||
| Dated: | March 8, 2019 |
Serious News for Serious Traders! Try StreetInsider.com Premium Free!
You May Also Be Interested In
- Alphabet stock surges 11% to record high on Q1 earnings beat, first-ever dividend
- Interactive Strength Inc. (Nasdaq: TRNR) Strengthens Balance Sheet by Partially Converting Senior Loan to Equity and Extending the Maturity
- Alliance Trust PLC - Net Asset Value
Create E-mail Alert Related Categories
SEC FilingsSign up for StreetInsider Free!
Receive full access to all new and archived articles, unlimited portfolio tracking, e-mail alerts, custom newswires and RSS feeds - and more!
