

Form N-CSR UNIFIED SERIES TRUST For: Aug 31
 Tweet
Tweet Share
Shareunited
states
securities and exchange commission
washington, d.c. 20549
form n-csr
certified shareholder report of registered management
investment companies
| Investment Company Act file number | 811-21237 |
| Unified Series Trust |
| (Exact name of registrant as specified in charter) |
225 Pictoria Drive, Suite 450
Cincinnati, OH 45246
(Address of principal executive offices)
(Zip code)
Zachary P. Richmond
Ultimus Fund Solutions, LLC
225 Pictoria Drive. Suite 450
Cincinnati, OH 45246
(Name and address of agent for service)
| Registrant’s telephone number, including area code: | 513-587-3400 |
Date of fiscal year end: 8/31
Date of reporting period: 8/31/23
Form N-CSR is to be used by management investment companies to file reports with the Commission not later than 10 days after the transmission to stockholders of any report that is required to be transmitted to stockholders under Rule 30e-1 under the Investment Company Act of 1940 (17 CFR 270.30e-1). The Commission may use the information provided on Form N-CSR in its regulatory, disclosure review, inspection and policymaking roles.
A registrant is required to disclose the information specified by Form N-CSR, and the Commission will make this information public. A registrant is not required to respond to the collection of information contained in Form N-CSR unless the Form displays a currently valid Office of Management and Budget (“OMB”) control number. Please direct comments concerning the accuracy of the information collection burden estimate and any suggestions for reducing the burden to Secretary, Securities and Exchange Commission, 450 Fifth Street, NW, Washington, DC 20549-0609. The OMB has reviewed this collection of information under the clearance requirements of 44 U.S.C. § 3507.
Item 1. Reports to Stockholders.
| (a) |
| Tactical Multi-Purpose Fund |
| Annual Report |
| August 31, 2023 |
| Fund Adviser: |
| Fisher Asset Management, LLC |
| 6500 International Parkway, Suite 2050 |
| Plano, Texas 75093 |
| (800) 550-1071 |
Tactical
Multi-Purpose Fund
Management’s Discussion of Fund Performance
(Unaudited)
Dear Shareholder:
Market Commentary and Outlook
Last year, we expected an early grind with a rally late. But the negative drumbeat of war, inflation, interest rate hikes, political rancor and more dragged stocks down into a minor bear market. Usually, stocks move past such widely known factors quickly. But 2022’s constant drip of negatives created a year-long fog of uncertainty. Even when reality turned out to be better than feared—like second-half economic data—pessimists dismissed it, warning worse was still ahead, a classic sign of “the pessimism of disbelief.” However, markets appear to have reckoned with many of these concerns, and improvement on some—like inflation—made the last year a good one for global equities. Stocks rose +15.6% since a year ago and +28.0% since the October 12th 2022 low.
The Q2 2023 end closes a nearly picture-perfect example of the nine-month “Midterm Miracle.” This stretch is history’s most consistently positive, up 91.7% of the time and averaging +19.6% gains. On cue, the S&P 500 surged 25.7% from last September 30 through June. The Midterm Miracle might be over but the positivity party isn’t. In our view, gridlock should remain a tailwind for stocks in the second half—and into 2024. Third years’ second halves aren’t as consistently positive or strong as the first, but gains tend to continue.
Despite these positives, the bull market features a classic “wall of worry”—a barrage of investor fears tamping down sentiment as stocks climb higher. Nearly a year since stocks’ low, the rally is getting a bit more love, but not much. Some don’t acknowledge a new bull market. Many who do see little reason stocks can keep thriving. Today’s wide gulf between sentiment and reality is a classic early bull market feature. The “wall” has many bricks.
The springtime batch of regional bank failures is a big brick in this bull market’s worry wall. It bridged Q1 and Q2, from Silicon Valley Bank’s March failure through First Republic’s travails and sale to JPMorgan Chase in May. In between, headlines painted a dire picture akin to 2008. While lending has slowed—as we expected—it remains healthy at 5.8% y/y as of June 28. Emergency bank borrowing from the Fed has flattened, and new borrowings from the Discount Window—its traditional crisis facility—have tanked. As for the Bank Term Funding Program created early this year, use is up, but this doesn’t seem like a sign of systemic stress, given friendly collateral terms and rates banks can lock in for a year. While more small banks could fail or face profit headwinds and industry consolidation might loom, we think systemic crisis fears have, rightly, evaporated.
1
Tactical
Multi-Purpose Fund
Management’s Discussion of Fund Performance
(Unaudited) (continued)
Of all the drags on sentiment since early 2022, none has dug in quite like inflation. Companies might be coping relatively well, with robust profit margins and a 28.0% MSCI World return from last October’s low, but people are weary. The US inflation rate has slowed markedly since June 2022’s peak, yet many only noticed recently and complain core prices are still rising too fast. People see more stubborn prices in the UK and Europe, worrying stickier inflation there necessitates even more rate hikes, rendering a recession that infects the world. Yet on both sides of the Atlantic, there are many encouraging signs. Sentiment has fallen too far, vastly underrating improvements and creating a big inflation wall of worry.
As for short rates, again, central banks are unpredictable. But this rate hike cycle looks close to done. After slowing its rate hike pace to a quarter point in March and April, the Fed paused in June. This doesn’t preclude more hikes, a possibility many focus on. With inflation moderating, this seems rational.
Not that stocks need a rate pause or cuts, as many argue today. Pundits who focus on this are hyperventilating unnecessarily, considering there is ample evidence stocks already overcame rate hikes. The S&P 500 is up nicely since June 2022, despite most of the Fed’s rate hikes (and their biggest moves) occurring since then. The ECB started hiking last July. Eurozone stocks? Up double digits since then in euros and dollars. UK stocks were among the MSCI World’s best performers in 2022 despite the BoE starting its tightening cycle in December 2021. They hit all-time highs in February amid more hiking.
If all of these rate hikes didn’t prevent stocks from rising over the last year, it seems pretty clear rate hikes aren’t driving markets. It is also clear stocks aren’t waiting for pauses or rate cuts. They are doing what they always do, pricing in expected earnings over the next 3 – 30 months. Those will likely hinge on far more than interest rates.
Expectations for China’s economy were high entering Q2 2023. Fiscal and monetary stimulus was kicking in, the weather was warming up, and people were free to shop and travel. The stage seemed set for a newly reopened economy to roar back. Yet hope got a bit too lofty, and April and May economic data didn’t quite meet it—see widely watched retail sales and industrial production.
Retail sales illustrate the trend. After March’s sales beat expectations, many extrapolated red-hot growth forward. Yet April and May’s growth, while faster than March’s, missed forecasts. We suspect complicated year-over-year comparisons played a role here. April and May 2022 were when Shanghai and other major metro areas were locked down. Analysts rightly factored in a low base. But perhaps they underestimated how society
2
Tactical
Multi-Purpose Fund
Management’s Discussion of Fund Performance
(Unaudited) (continued)
had already learned to adapt to restrictions two years into the pandemic. Perhaps it was because the growth rates in those quarters had their own upward base-effect skew from 2021’s initial reopening boost. Regardless, the miss discouraged those with high hopes for China’s economy.
Tepid data drove fears of China lapsing into an unprecedented economic malaise, with high debt, prolonged property market weakness and poor demographics stymieing growth. However, it looks like China is returning to longer-term economic trends. Slower growth would also match the government’s long-term goal of transitioning away from heavy industry- and export-driven growth to a model buttressed by domestic demand and services—akin to major Western economies. Note, too, a decelerating China still contributes mightily to the global economy: Last year’s 3.0% annual real growth added nearly $490 billion to global GDP when measured in constant 2015 US dollars.
Performance Attribution
The Tactical Multi-Purpose Fund (the “Fund”) seeks positive total returns over the long-term regardless of market conditions in the U.S. and foreign equity markets. The Fund is designed to be used by the Adviser to facilitate moving groups of clients into and out of defensive and special situation investments efficiently, based on the Adviser’s perceptions of market risks and opportunities.
During the fiscal year ended August 31, 2023, the Adviser did not take a defensive position; therefore the Fund was limited in size, with its assets invested mostly in T-Bills and cash equivalents. The Fund returned +3.16% during the fiscal year ended August 31, 2023. During the same period, the Fund’s primary benchmark, the ICE BofA 3-month U.S. Treasury Bill Index, returned 4.28%.
The Fund’s relative underperformance is reflective of its modest investment in T-Bills and cash equivalents for the period, which generated minimal interest. Underperformance as compared to the index is also in part due to the Fund’s 1.00% expense ratio (the performance of the index does not reflect the deduction of expenses). Due to the size of the investment, the Fund maintained a sizeable portion of the investments in cash equivalents to meet expense obligations. However, T-Bills were purchased throughout the period to opportunistically benefit from changes by the Fed to short rates. It is anticipated that similar positioning will continue until the Adviser utilizes the Fund for defensive purposes or prevailing short-term interest rates meaningfully change.
Portfolio Shifts
No portfolio shifts have been made to the Fund.
3
Investment Results (Unaudited)
Average Annual Total Returns(a)
as of August 31, 2023
| Since Inception | |||||
| Fund/Index | One Year | Five Year | (3/30/17) | ||
| Tactical Multi-Purpose Fund | 3.16% | 0.36% | 0.17% | ||
| ICE BofA 3-Month U.S. Treasury Bill(b) | 4.28% | 1.66% | 1.59% |
Total annual operating expenses, as disclosed in the Tactical Multi-Purpose Fund (the “Fund”) prospectus dated December 29, 2022, were 644.33% of average daily net assets (1.14% after fee waivers/expense reimbursements). Fisher Asset Management, LLC, d/b/a Fisher Investments (the “Adviser”) is contractually obligated to limit the Fund’s total annual operating expenses to 1.00% of the Fund’s average daily net assets through December 31, 2027 (excluding portfolio transaction and other investment-related costs (including brokerage fees and commissions); taxes; borrowing costs (such as interest and dividend expenses on securities sold short); acquired fund fees and expenses; fees and expenses associated with investments in other collective investment vehicles or derivative instruments (including for example option and swap fees and expenses); any amounts payable pursuant to a distribution or service plan adopted in accordance with Rule 12b-1 under the Investment Company Act of 1940, as amended, any administrative and/or shareholder servicing fees payable pursuant to a plan adopted by the Board of Trustees; expenses incurred in connection with any merger or reorganization; extraordinary expenses (such as litigation expenses, indemnification of Trust officers and Trustees and contractual indemnification of Fund service providers); and other expenses that the Trustees agree have not been incurred in the ordinary course of the Fund’s business). This expense cap may not be terminated prior to this date except by the Board of Trustees upon 60 days’ written notice to the Adviser. Each expense payment by the Adviser (but not management fee waiver) is subject to recoupment by the Adviser from the Fund in the three years following the date the particular expense payment occurred, but only if such recoupment can be achieved without exceeding the annual expense limitation in effect at the time of the expense payment and any expense limitation in effect at the time of recoupment. Additional information pertaining to the Fund’s expense ratios as of August 31, 2023 can be found in the financial highlights.
The performance quoted represents past performance, which does not guarantee future results. The investment return and principal value of an investment will fluctuate so that an investor’s shares, when redeemed, may be worth more or less than their original cost. The returns shown do not reflect deduction of taxes that a shareholder would pay on Fund distributions or the redemption of Fund shares. Current performance of the Fund may be lower or higher than the performance quoted. The Fund’s investment objective, risks, charges and expenses should be considered carefully before investing. Performance data current to the most recent month-end may be obtained by calling (800) 550-1071.
| (a) | Return figures reflect any change in price per share and assume the reinvestment of all distributions. The Fund’s returns reflect any fee reductions during the applicable periods. If such fee reductions had not occurred, the quoted performance would have been lower. |
| (b) | The ICE BofA 3-Month U.S. Treasury Bill Index (the “Index”) is comprised of a single issue purchased at the beginning of the month and held for a full month. Each month the Index is rebalanced and the issue selected is the outstanding Treasury Bill that matures closest to, but not beyond, three months from the rebalancing date. The Index returns assume reinvestment of all distributions and do not reflect the deduction of taxes and fees. Individuals cannot invest directly in the Index. However, an individual may invest in exchange-traded funds or other investment vehicles that attempt to track the performance of a benchmark index. |
4
Investment Results (Unaudited) (continued)
You should consider the Fund’s investment objective, risks, charges and expenses carefully before you invest. The Fund’s prospectus contains important information about the Fund’s investment objective, potential risks, management fees, charges and expenses, and other information and should be read carefully before investing. You may obtain a current copy of the Fund’s prospectus or performance data current to the most recent month-end by calling (800) 550-1071.
Comparison of the Growth of a $10,000 Investment in the Tactical Multi-Purpose Fund and the ICE BofA U.S. 3-Month Treasury Bill Index.
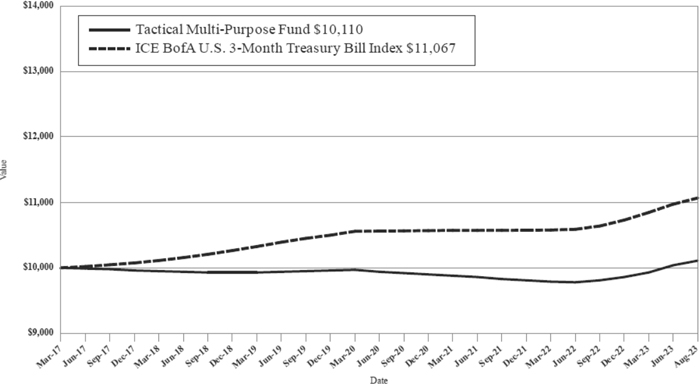
This graph shows the value of a hypothetical initial investment of $10,000 made on March 30, 2017 (commencement of operations) and held through August 31, 2023. THE FUND’S RETURN REPRESENTS PAST PERFORMANCE AND DOES NOT GUARANTEE FUTURE RESULTS. The ICE BofA 3-Month U.S. Treasury Bill Index is an unmanaged index of Treasury securities that assumes reinvestment of all income. The returns shown do not reflect deduction of taxes that a shareholder would pay on Fund distributions or the redemption of Fund shares. Investment returns and principal values will fluctuate so that your shares, when redeemed, may be worth more or less than their original purchase price.
Current performance may be lower or higher than the performance data quoted. For more information on the Fund, and to obtain performance data current to the most recent month-end, or to request a prospectus, please call (800) 550-1071. You should carefully consider the investment objective, potential risks, management fees, and charges and expenses of the Fund before investing. The Fund’s prospectus contains this and other information about the Fund, and should be read carefully before investing.
The Fund is distributed by Ultimus Fund Distributors, LLC, Member FINRA/SIPC.
5
Fund Holdings (Unaudited)
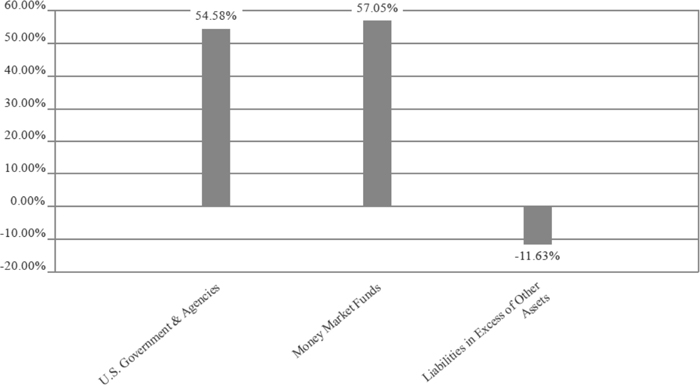
Tactical Multi-Purpose Fund Holdings as of August 31, 2023*
| * | As a percentage of net assets. |
The investment objective of the Fund is to seek positive total returns over the long-term regardless of market conditions in the U.S. and foreign equity markets.
Availability of Portfolio Schedule (Unaudited)
The Fund files its complete schedule of portfolio holdings with the Securities and Exchange Commission (the “SEC”) for the first and third quarters of each fiscal year as an exhibit to its reports on Form N-PORT. The Fund’s Form N-PORT reports are available on the SEC’s website at www.sec.gov.
6
| Tactical Multi-Purpose Fund |
| Schedule of Investments |
| August 31, 2023 |
| Principal | ||||||||
| Amount | Fair Value | |||||||
| U.S. GOVERNMENT & AGENCIES — 54.58% | ||||||||
| United States Treasury Bill, 5.50%, 12/12/2023 | $ | 14,000 | $ | 13,790 | ||||
| Total U.S. Government & Agencies (Cost $13,834) | 13,790 | |||||||
| Shares | ||||||||
| MONEY MARKET FUNDS - 57.05% | ||||||||
| First American Government Obligations Fund, Class X, 5.25%(a) | 14,416 | 14,416 | ||||||
| Total Money Market Funds (Cost $14,416) | 14,416 | |||||||
| Total Investments — 111.63% (Cost $28,250) | 28,206 | |||||||
| Liabilities in Excess of Other Assets — (11.63)% | (2,939 | ) | ||||||
| NET ASSETS — 100.00% | $ | 25,267 | ||||||
| (a) | Rate disclosed is the seven day effective yield as of August 31, 2023. |
See accompanying notes which are an integral part of these financial statements.
7
| Tactical Multi-Purpose Fund |
| Statement of Assets and Liabilities |
| August 31, 2023 |
| Assets | ||||
| Investments in securities at fair value (cost $28,250) | $ | 28,206 | ||
| Interest receivable | 105 | |||
| Receivable from Adviser | 9,115 | |||
| Prepaid expenses | 2,191 | |||
| Total Assets | 39,617 | |||
| Liabilities | ||||
| Payable to affiliates | 2,788 | |||
| Other accrued expenses | 11,562 | |||
| Total Liabilities | 14,350 | |||
| Net Assets | $ | 25,267 | ||
| Net Assets consist of: | ||||
| Paid-in capital | $ | 24,520 | ||
| Accumulated earnings | 747 | |||
| Net Assets | $ | 25,267 | ||
| Shares outstanding (unlimited number of shares authorized, no par value) | 2,500 | |||
| Net asset value, offering and redemption price per share | $ | 10.11 |
See accompanying notes which are an integral part of these financial statements.
8
| Tactical Multi-Purpose Fund |
| Statement of Operations |
| For the year ended August 31, 2023 |
| Investment Income | ||||
| Dividend income | $ | 1,038 | ||
| Interest income | 29 | |||
| Total investment income | 1,067 | |||
| Expenses | ||||
| Fund accounting | 30,002 | |||
| Administration | 30,000 | |||
| Legal | 22,990 | |||
| Trustee | 16,636 | |||
| Compliance services | 12,031 | |||
| Transfer agent | 12,000 | |||
| Audit and tax | 11,076 | |||
| Custodian | 5,000 | |||
| Report printing | 3,367 | |||
| Registration | 391 | |||
| Adviser | 62 | |||
| Miscellaneous | 19,560 | |||
| Total expenses | 163,115 | |||
| Fees waived and/or expenses reimbursed by Adviser | (156,166 | ) | ||
| Fees reduced by Administrator | (6,701 | ) | ||
| Net operating expenses | 248 | |||
| Net investment income | 819 | |||
| Net change in unrealized depreciation of investment securities | (42 | ) | ||
| Net realized and change in unrealized loss on investments | (42 | ) | ||
| Net increase in net assets resulting from operations | $ | 777 |
See accompanying notes which are an integral part of these financial statements.
9
| Tactical Multi-Purpose Fund |
| Statements of Changes in Net Assets |
| August 31, 2023 |
| For the | For the | |||||||
| Year Ended | Year Ended | |||||||
| August 31, | August 31, | |||||||
| 2023 | 2022 | |||||||
| Increase (Decrease) in Net Assets due to: | ||||||||
| Operations | ||||||||
| Net investment income (loss) | $ | 819 | $ | (108 | ) | |||
| Net change in unrealized depreciation of investment securities | (42 | ) | (2 | ) | ||||
| Net increase (decrease) in net assets resulting from operations | 777 | (110 | ) | |||||
| Capital Transactions | ||||||||
| Amount paid for shares redeemed | — | (10 | ) | |||||
| Net decrease in net assets resulting from capital transactions | — | (10 | ) | |||||
| Total Increase (Decrease) in Net Assets | 777 | (120 | ) | |||||
| Net Assets | ||||||||
| Beginning of year | 24,490 | 24,610 | ||||||
| End of year | $ | 25,267 | $ | 24,490 | ||||
| Share Transactions | ||||||||
| Shares redeemed | — | (1 | ) | |||||
| Net decrease in shares | — | (1 | ) | |||||
See accompanying notes which are an integral part of these financial statements.
10
| Tactical Multi-Purpose Fund |
| Financial Highlights |
| (For a share outstanding during each year) |
| For the | For the | For the | For the | For the | ||||||||||||||||
| Year Ended | Year Ended | Year Ended | Year Ended | Year Ended | ||||||||||||||||
| August 31, | August 31, | August 31, | August 31, | August 31, | ||||||||||||||||
| 2023 | 2022 | 2021 | 2020 | 2019 | ||||||||||||||||
| Selected Per Share Data: | ||||||||||||||||||||
| Net asset value, beginning of year | $ | 9.80 | $ | 9.84 | $ | 9.93 | $ | 9.95 | $ | 9.93 | ||||||||||
| Investment operations: | ||||||||||||||||||||
| Net investment income (loss) | 0.33 | (0.04 | ) | (0.09 | ) | (0.02 | ) | 0.02 | ||||||||||||
| Net realized and unrealized loss | (0.02 | ) | — | (a) | — | — | (a) | — | (a) | |||||||||||
| Total from investment operations | 0.31 | (0.04 | ) | (0.09 | ) | (0.02 | ) | 0.02 | ||||||||||||
| Net asset value, end of year | $ | 10.11 | $ | 9.80 | $ | 9.84 | $ | 9.93 | $ | 9.95 | ||||||||||
| Total Return(b) | 3.16 | % | (0.41 | )% | (0.91 | )% | (0.20 | )% | 0.20 | % | ||||||||||
| Ratios and Supplemental Data: | ||||||||||||||||||||
| Net assets, end of year (000 omitted) | $ | 25 | $ | 24 | $ | 25 | $ | 25 | $ | 25 | ||||||||||
| Ratio of net expenses to average net assets | 1.00 | % | 1.00 | % | 1.00 | % | 1.00 | % | 1.00 | % | ||||||||||
| Ratio of gross expenses to average net assets before waiver and reimbursement | 657.38 | % | 644.19 | % | 635.29 | % | 596.00 | % | 589.45 | % | ||||||||||
| Ratio of net investment income (loss) to average net assets | 3.30 | % | (0.44 | )% | (0.91 | )% | (0.20 | )% | 0.15 | % | ||||||||||
| Portfolio turnover rate | 0 | % | 0 | % | 0 | % | 0 | % | 0 | % | ||||||||||
| (a) | Rounds to less than $0.005 per share. |
| (b) | Total return represents the rate that the investor would have earned or lost on an investment in the Fund, assuming reinvestment of distributions. |
See accompanying notes which are an integral part of these financial statements.
11
Tactical
Multi-Purpose Fund
Notes to the Financial Statements
August 31, 2023
NOTE 1. ORGANIZATION
The Tactical Multi-Purpose Fund (the “Fund”) is registered under the Investment Company Act of 1940, as amended (the “1940 Act”), as a non-diversified series of Unified Series Trust (the “Trust”) on November 14, 2016. The Trust is an open-end investment company established under the laws of Ohio by an Agreement and Declaration of Trust dated October 14, 2002, as amended (the “Trust Agreement”). The Trust Agreement permits the Board of Trustees of the Trust (the “Board”) to issue an unlimited number of shares of beneficial interest of separate series without par value. The Fund is one of a series of funds currently authorized by the Board. The Fund commenced operations on March 30, 2017. The investment adviser to the Fund is Fisher Asset Management, LLC, d/b/a Fisher Investments (the “Adviser”). The investment objective of the Fund is to seek positive total returns over the long-term regardless of market conditions in the U.S. and foreign equity markets.
NOTE 2. SIGNIFICANT ACCOUNTING POLICIES
The Fund is an investment company and follows accounting and reporting guidance under Financial Accounting Standards Board Accounting Standards Codification (“ASC”) Topic 946, “Financial Services-Investment Companies”, including Accounting Standards Update 2013-08. The following is a summary of significant accounting policies followed by the Fund in the preparation of its financial statements. These policies are in conformity with generally accepted accounting principles in the United States of America (“GAAP”).
Regulatory update – Tailored Shareholder Reports for Mutual Funds and Exchange-Traded Funds (“ETFs”) – Effective January 24, 2023, the Securities and Exchange Commission (the “SEC”) adopted rule and form amendments to require mutual funds and ETFs to transmit concise and visually engaging streamlined annual and semiannual reports to shareholders that highlight key information. Other information, including financial statements, will no longer appear in a streamlined shareholder report but must be available online, delivered free of charge upon request, and filed on a semiannual basis on Form N-CSR. The rule and form amendments have a compliance date of July 24, 2024. At this time, management is evaluating the impact of these amendments on the shareholder reports for the Fund.
Estimates – The preparation of financial statements in conformity with GAAP requires management to make estimates and assumptions that affect the reported amounts of assets and liabilities and disclosure of contingent assets and liabilities at the date of the financial statements and the reported amounts of increases and decreases in net assets from operations during the reporting period. Actual results could differ from those estimates.
12
Tactical
Multi-Purpose Fund
Notes to the Financial Statements (continued)
August 31, 2023
Federal Income Taxes – The Fund makes no provision for federal income or excise tax. The Fund has qualified and intends to qualify each year as a regulated investment company (“RIC”) under subchapter M of the Internal Revenue Code of 1986, as amended, by complying with the requirements applicable to RICs and by distributing substantially all of its taxable income. The Fund also intends to distribute sufficient net investment income and net realized capital gains, if any, so that it will not be subject to excise tax on undistributed income and gains. If the required amount of net investment income or gains is not distributed, the Fund could incur a tax expense.
As of and during the fiscal year ended August 31, 2023, the Fund did not have any liabilities for any unrecognized tax benefits. The Fund recognizes interest and penalties, if any, related to unrecognized tax benefits as income tax expense in the Statement of Operations when incurred. During the year, the Fund did not incur any interest or penalties. Management of the Fund has reviewed tax positions taken in tax years that remain subject to examination by all major tax jurisdictions, including federal (i.e., the previous three tax year ends and the interim tax period since then, as applicable) and has concluded that no provision for unrecognized tax benefits or expenses is required in these financial statements and does not expect this to change over the next twelve months.
Expenses – Expenses incurred by the Trust that do not relate to a specific fund of the Trust are allocated to the individual funds of the Trust based on each fund’s relative net assets or another appropriate basis (as determined by the Board).
Security Transactions and Related Income – The Fund follows industry practice and records security transactions on the trade date for financial reporting purposes. The specific identification method is used for determining gains or losses for financial statement and income tax purposes. Dividend income is recorded on the ex-dividend date and interest income is recorded on an accrual basis.
Dividends and Distributions – The Fund intends to distribute its net investment income and net realized long-term and short-term capital gains, if any, at least annually. Dividends and distributions to shareholders, which are determined in accordance with income tax regulations, are recorded on the ex-dividend date. The treatment for financial reporting purposes of distributions made to shareholders during the period from net investment income or net realized capital gains may differ from their ultimate treatment for federal income tax purposes. These differences are caused primarily by differences in the timing of the recognition of certain components of income, expense or realized capital gain for federal income tax purposes. Where such differences are permanent in nature, they are reclassified among the components of net assets based on their ultimate characterization for federal income tax purposes. Any such reclassifications will have no effect on net assets, results of operations or net asset value (“NAV”) per share of the Fund.
13
Tactical
Multi-Purpose Fund
Notes to the Financial Statements (continued)
August 31, 2023
NOTE 3. NON-DIVERSIFICATION RISK
The Fund is non-diversified, which means it may invest a greater percentage of its assets in a limited number of issuers as compared to other mutual funds that are more broadly diversified. As a result, the Fund’s share price may be more volatile than the share price of some other mutual funds, and the poor performance of an individual holding in the Fund’s portfolio may have a significant negative impact on the Fund’s performance.
NOTE 4. SECURITIES VALUATION AND FAIR VALUE MEASUREMENTS
The Fund values its portfolio securities at fair value as of the close of regular trading on the New York Stock Exchange (“NYSE”) (normally 4:00 p.m. Eastern Time) on each business day the NYSE is open for business. Fair value is defined as the price that the Fund would receive upon selling an investment in a timely transaction to an independent buyer in the principal or most advantageous market of the investment. GAAP establishes a three-tier hierarchy to maximize the use of observable market data and minimize the use of unobservable inputs and to establish classification of fair value measurements for disclosure purposes.
Inputs refer broadly to the assumptions that market participants would use in pricing the asset or liability, including assumptions about risk (the risk inherent in a particular valuation technique used to measure fair value including a pricing model and/or the risk inherent in the inputs to the valuation technique). Inputs may be observable or unobservable. Observable inputs are inputs that reflect the assumptions market participants would use in pricing the asset or liability developed based on market data obtained and available from sources independent of the reporting entity. Unobservable inputs are inputs that reflect the reporting entity’s own assumptions about the assumptions market participants would use in pricing the asset or liability developed based on the best information available in the circumstances.
Various inputs are used in determining the value of the Fund’s investments. These inputs are summarized in the three broad levels listed below.
| ● | Level 1 – unadjusted quoted prices in active markets for identical investments and/or registered investment companies where the value per share is determined and published and is the basis for current transactions for identical assets or liabilities at the valuation date |
| ● | Level 2 – other significant observable inputs (including, but not limited to, quoted prices for an identical security in an inactive market, quoted prices for similar securities, interest rates, prepayment speeds, credit risk, etc.) |
14
Tactical
Multi-Purpose Fund
Notes to the Financial Statements (continued)
August 31, 2023
| ● | Level 3 – significant unobservable inputs (including the Fund’s own assumptions in determining fair value of investments based on the best information available) |
The inputs used to measure fair value may fall into different levels of the fair value hierarchy. In such cases, for disclosure purposes, the level in the fair value hierarchy which is reported is determined based on the lowest level input that is significant to the fair value measurement in its entirety.
Equity securities that are traded on any stock exchange are generally valued at the last quoted sale price on the security’s primary exchange. Lacking a last sale price, an exchange-traded security is generally valued at its last bid price. Securities traded in the Nasdaq over-the-counter market are generally valued at the Nasdaq Official Closing Price. When using market quotations and when the market is considered active, the security is classified as a Level 1 security. In the event that market quotations are not readily available or are considered unreliable due to market or other events, securities are valued in good faith by the Adviser, as Valuation Designee, under oversight of the Board’s Pricing & Liquidity Committee. The Adviser has adopted written policies and procedures for valuing securities and other assets in circumstances where market quotes are not readily available in conformity with guidelines adopted by the Board. In the event that market quotes are not readily available, and the security or asset cannot be valued pursuant to one of the valuation methods, the value of the security or asset will be determined in good faith by the Valuation Designee pursuant to its policies and procedures. Any fair value provided by the Valuation Designee, is subject to the ultimate review of the pricing methodology by the Pricing & Liquidity Committee of the Board on a quarterly basis. Under these policies, the securities will be classified as Level 2 or 3 within the fair value hierarchy, depending on the inputs used.
Investments in mutual funds, including money market mutual funds, are generally priced at the ending NAV provided by the service agent of the mutual funds. These securities are categorized as Level 1 securities.
Debt securities are valued by using the mean between the closing bid and ask prices provided by a pricing service. If the closing bid and ask prices are not readily available, the pricing service may provide a price determined by a matrix pricing method. Matrix pricing is a mathematical technique used to value fixed income securities without relying exclusively on quoted prices. Matrix pricing takes into consideration recent transactions, yield, liquidity, risk, credit quality, coupon, maturity, type of issue and any other factors or market data the pricing service deems relevant for the actual security being priced and for other securities with similar characteristics. These securities will generally be categorized as Level 2 securities. If the Valuation Designee decides that a price provided by the pricing service does not accurately reflect the fair value of the securities or when prices are not
15
Tactical
Multi-Purpose Fund
Notes to the Financial Statements (continued)
August 31, 2023
readily available from a pricing service, securities are valued at fair value as determined by the Valuation Designee, in conformity with guidelines adopted by and subject to review of the Board through its Pricing & Liquidity Committee. These securities will generally be categorized as Level 3 securities.
In accordance with the Trust’s valuation policies and fair value determinations pursuant to Rule 2a-5 under the 1940 Act, the Valuation Designee is required to consider all appropriate factors relevant to the value of securities for which it has determined other pricing sources are not available or reliable as described above. No single method exists for determining fair value because fair value depends upon the circumstances of each individual case. As a general principle, the current fair value of a security being valued by the Valuation Designee would be the amount that the Fund might reasonably expect to receive upon the current sale. Methods that are in accordance with this principle may, for example, be based on (i) a multiple of earnings; (ii) a discount from market prices of a similar freely traded security (including a derivative security or a basket of securities traded on other markets, exchanges or among dealers); or (iii) yield to maturity with respect to debt issues, or a combination of these and other methods. Fair-value pricing is permitted if, in the Valuation Designee’s opinion, the validity of market quotations appears to be questionable based on factors such as evidence of a thin market in the security based on a small number of quotations, a significant event occurs after the close of a market but before the Fund’s NAV calculation that may affect a security’s value, or the Valuation Designee is aware of any other data that calls into question the reliability of market quotations. The Valuation Designee may obtain assistance from others in fulfilling its duties. For example, it may seek assistance from pricing services, fund administrators, sub-advisers, accountants, or counsel; it may also consult the Trust’s Fair Value Committee. The Valuation Designee, however, remains responsible for the final fair value determination and may not designate or assign that responsibility to any third party.
The following is a summary of the inputs used to value the Fund’s investments as of August 31, 2023:
| Valuation Inputs | ||||||||||||||||
| Assets | Level 1 | Level 2 | Level 3 | Total | ||||||||||||
| U.S. Government & Agencies | $ | — | $ | 13,790 | $ | — | $ | 13,790 | ||||||||
| Money Market Funds | 14,416 | — | — | 14,416 | ||||||||||||
| Total | $ | 14,416 | $ | 13,790 | $ | — | $ | 28,206 | ||||||||
The Fund did not hold any investments at the end of the reporting period for which significant unobservable inputs (Level 3) were used in determining fair value; therefore,
16
Tactical
Multi-Purpose Fund
Notes to the Financial Statements (continued)
August 31, 2023
no reconciliation of Level 3 securities is included for this reporting period. The Fund did not hold any derivative instruments during the reporting period.
NOTE 5. FEES AND OTHER TRANSACTIONS WITH AFFILIATES AND OTHER SERVICE PROVIDERS
The Adviser, under the terms of the management agreement (the “Agreement”) with the Trust with respect to the Fund, manages the Fund’s investments. As compensation for its management services, the Fund is obligated to pay the Adviser a management fee computed and accrued daily and paid monthly at an annual rate of 0.25% of the Fund’s average daily net assets. For the fiscal year ended August 31, 2023, the Adviser earned management fees of $62 from the Fund before the waiver and reimbursement described below.
The Adviser has contractually agreed to limit the Fund’s total annual operating expenses to 1.00% of the Fund’s average daily net assets through December 31, 2027 (excluding portfolio transaction and other investment-related costs (including brokerage fees and commissions); taxes; borrowing costs (such as interest and dividend expenses on securities sold short); acquired fund fees and expenses; fees and expenses associated with investments in other collective investment vehicles or derivative instruments (including for example option and swap fees and expenses); any administrative and/or shareholder servicing fees payable pursuant to a plan adopted by the Board; expenses incurred in connection with any merger or reorganization; extraordinary expenses (such as litigation expenses, indemnification of Trust officers and Trustees and contractual indemnification of Fund service providers); and other expenses that the Trustees agree have not been incurred in the ordinary course of the Fund’s business). This expense cap may not be terminated prior to this date except by the Board upon 60 days’ written notice to the Adviser.
Each expense payment by the Adviser (but not management fee waiver) is subject to recoupment by the Adviser from the Fund in the three years following the date the particular expense payment occurred, but only if such recoupment can be achieved without exceeding the annual expense limitation in effect at the time of the expense payment and any expense limitation in effect at the time of the recoupment. As of August 31, 2023, the Adviser may seek repayment of expense reimbursements in amounts as follows:
| Recoverable Through | ||||
| August 31, 2024 | $ | 155,999 | ||
| August 31, 2025 | 155,959 | |||
| August 31, 2026 | 156,166 | |||
17
Tactical
Multi-Purpose Fund
Notes to the Financial Statements (continued)
August 31, 2023
Ultimus Fund Solutions, LLC (“Ultimus”) provides administration, fund accounting and transfer agent services to the Fund. The Fund pays Ultimus fees in accordance with the agreements for such services.
The Administrator has agreed to waive fees to the extent necessary that the Fund’s total annual operating expenses (excluding taxes, borrowing costs such as interest and dividend expenses on securities sold short, brokerage commissions, acquired fund fees and expenses, shareholder servicing fees paid to financial intermediaries, extraordinary expenses and expenses outside the normal course of business) do not exceed $156,000 annually, based on a twelve-month period commencing April 1 and ending March 31 (the “Annual Period”). The waiver will accrue on a monthly basis such that the Fund’s operating expenses for any month during the Annual Period will not exceed the sum of $13,000 (the “Monthly Expense Cap”), provided that Ultimus may recoup any fees waived by Ultimus in a prior month during the Annual Period to the extent of any unused amount of the Monthly Expense Cap in the current month. The waiver will be suspended and forfeited in any month that the Adviser is not the sole shareholder of the Fund. During the fiscal year ended August 31, 2023, the total amount waived by the Administrator was $6,701.
Northern Lights Compliance Services, LLC (“NLCS”), an affiliate of Ultimus, provides a Chief Compliance Officer to the Trust, as well as related compliance services, pursuant to a consulting agreement between NLCS and the Trust. Under the terms of such agreement, NLCS receives fees from the Fund, which are approved annually by the Board.
Under the terms of a Distribution Agreement with the Trust, Ultimus Fund Distributors, LLC (the “Distributor”) serves as principal underwriter to the Fund. The Distributor is a wholly-owned subsidiary of Ultimus. The Distributor is compensated by the Adviser (not the Fund) for acting as principal underwriter.
Certain officers of the Trust are also employees of Ultimus and such persons are not paid by the Fund for serving in such capacities. One Trustee is a former employee of Ultimus who is not currently paid by the Fund for serving in such capacity.
The Board supervises the business activities of the Trust. Each Trustee serves as a trustee until termination of the Trust unless the Trustee dies, resigns, retires, or is removed. The Chair of the Board and more than 75% of the Trustees are “Independent Trustees,” which means that they are not “interested persons” as defined in the 1940 Act. The Independent Trustees review and establish compensation at least annually. Each Independent Trustee of the Trust receives annual compensation, which is an established amount paid quarterly per fund in the Trust at the time of the regular quarterly Board meetings. The Chair of the Board receives the highest compensation, commensurate with his additional duties
18
Tactical
Multi-Purpose Fund
Notes to the Financial Statements (continued)
August 31, 2023
and each Chair of a committee receives additional compensation as well. Independent Trustees also receive additional fees for attending any special meetings. In addition, the Trust reimburses Independent Trustees for out-of-pocket expenses incurred in conjunction with attendance at meetings.
NOTE 6. INVESTMENT TRANSACTIONS
For the fiscal year ended August 31, 2023, there were no purchases or sales of investment securities, other than short-term investments.
There were no purchases or sales of long-term U.S. government obligations during the fiscal year ended August 31, 2023.
NOTE 7. BENEFICIAL OWNERSHIP
The beneficial ownership, either directly or indirectly, of more than 25% of the voting securities of a fund creates a presumption of control of a fund, under Section 2(a)(9) of the 1940 Act. As of August 31, 2023, the Adviser owned 100% of the Fund’s outstanding shares. As a result, the Adviser may be deemed to control the Fund.
NOTE 8. FEDERAL TAX INFORMATION
At August 31, 2023, the net unrealized appreciation (depreciation) and tax cost of investments for tax purposes was as follows:
| Gross unrealized appreciation | $ | — | ||
| Gross unrealized depreciation | (44 | ) | ||
| Net unrealized depreciation on investments | $ | (44 | ) | |
| Tax cost of investments | $ | 28,250 |
At August 31, 2023, the components of accumulated earnings (deficit) on a tax basis were as follows:
| Undistributed Ordinary Income | $ | 791 | ||
| Unrealized depreciation on investments | (44 | ) | ||
| Total accumulated earnings | $ | 747 |
For tax purposes no distributions were paid by the Fund for the fiscal years 2022 and 2023.
Certain capital losses and specified gains realized after October 31, and net investment losses realized after December 31 of the Fund’s fiscal year may be deferred and treated as occurring on the first business day of the Fund’s following taxable year. For the tax year
19
Tactical
Multi-Purpose Fund
Notes to the Financial Statements (continued)
August 31, 2023
ended August 31, 2023, the Fund deferred qualified late year ordinary losses in the amount of $0.
NOTE 9. COMMITMENTS AND CONTINGENCIES
The Trust indemnifies its officers and Trustees for certain liabilities that may arise from their performance of their duties to the Trust or the Fund. Additionally, in the normal course of business, the Trust enters into contracts that contain a variety of representations and warranties which provide general indemnifications. The Trust’s maximum exposure under these arrangements is unknown, as this would involve future claims that may be made against the Trust that have not yet occurred.
NOTE 10. SUBSEQUENT EVENTS
Management of the Fund has evaluated the need for disclosures and/or adjustments resulting from subsequent events through the date at which these financial statements were issued. Based upon this evaluation, management has determined there were no items requiring adjustment of the financial statements or additional disclosure.
20
Report of Independent Registered Public Accounting Firm
To
the Shareholders of Tactical Multi-Purpose Fund and
Board of Trustees of Unified Series Trust
Opinion on the Financial Statements
We have audited the accompanying statement of assets and liabilities, including the schedule of investments, of Tactical Multi-Purpose Fund (the “Fund”), a series of Unified Series Trust, as of August 31, 2023, the related statement of operations for the year then ended, the statements of changes in net assets for each of the two years in the period then ended, the related notes, and the financial highlights for each of the five years in the period then ended (collectively referred to as the “financial statements”). In our opinion, the financial statements present fairly, in all material respects, the financial position of the Fund as of August 31, 2023, the results of its operations for the year then ended, the changes in net assets for each of the two years in the period then ended, and the financial highlights for each of the five years in the period then ended, in conformity with accounting principles generally accepted in the United States of America.
Basis for Opinion
These financial statements are the responsibility of the Fund’s management. Our responsibility is to express an opinion on the Fund’s financial statements based on our audits. We are a public accounting firm registered with the Public Company Accounting Oversight Board (United States) (“PCAOB”) and are required to be independent with respect to the Fund in accordance with the U.S. federal securities laws and the applicable rules and regulations of the Securities and Exchange Commission and the PCAOB.
We conducted our audits in accordance with the standards of the PCAOB. Those standards require that we plan and perform the audit to obtain reasonable assurance about whether the financial statements are free of material misstatement whether due to error or fraud.
Our audits included performing procedures to assess the risks of material misstatement of the financial statements, whether due to error or fraud, and performing procedures that respond to those risks. Such procedures included examining, on a test basis, evidence regarding the amounts and disclosures in the financial statements. Our procedures included confirmation of securities owned as of August 31, 2023, by correspondence with the custodian. Our audits also included evaluating the accounting principles used and significant estimates made by management, as well as evaluating the overall presentation of the financial statements. We believe that our audits provide a reasonable basis for our opinion.
We have served as the auditor of one or more investment companies advised by Fisher Asset Management, LLC since 2017.

COHEN & COMPANY, LTD.
Chicago, Illinois
October 27, 2023
21
Liquidity Risk Management Program (Unaudited)
The Trust has adopted and implemented a written liquidity risk management program (the “Program”) as required by Rule 22e-4 (the “Liquidity Rule”) under the 1940 Act. The Program is reasonably designed to assess and manage the Fund’s liquidity risk, taking into consideration, among other factors, the Fund’s investment strategy and the liquidity of its portfolio investments during normal and reasonably foreseeable stressed conditions; its short and long-term cash flow projections; and its cash holdings and access to other funding sources. The Board approved the appointment of the Liquidity Administrator Committee, comprising certain Trust officers and employees of the Adviser. The Liquidity Administrator Committee maintains Program oversight and reports to the Board on at least an annual basis regarding the Program’s operational effectiveness through a written report (the “Report”). The Program’s most recent Report, which was presented to the Board for consideration at its meeting held on August 14-15, 2023, outlined the operation of the Program and the adequacy and effectiveness of the Program’s implementation. During the review period, the Fund did not experience unusual stress or disruption to their operations related to purchase and redemption activity. Also, during the review period the Fund held adequate levels of cash and highly liquid investments to meet shareholder redemption activities in accordance with applicable requirements. The Report concluded that the Program is reasonably designed to prevent violation of the Liquidity Rule and has been effectively implemented.
22
Summary of Fund Expenses (Unaudited)
As a shareholder of the Fund, you incur two types of costs: (1) transaction and (2) ongoing costs, including management fees and other Fund expenses. These examples are intended to help you understand your ongoing costs (in dollars) of investing in the Fund and to compare these costs with the ongoing costs of investing in other funds. You may pay brokerage commissions on purchases and sales of exchange-traded fund shares, which are not reflected in the example. The example is based on an investment of $1,000 invested at the beginning of the period and held for the entire period from March 1, 2023 through August 31, 2023.
Actual Expenses
The first line of the table below provides information about actual account values and actual expenses. You may use the information in this line, together with the amount you invested, to estimate the expenses that you paid over the period. Simply divide your account value by $1,000 (for example, an $8,600 account value divided by $1,000 = 8.6), then multiply the result by the number in the first line under the heading “Expenses Paid During Period” to estimate the expenses you paid on your account during this period.
Hypothetical Example for Comparison Purposes
The second line of the table below provides information about hypothetical account values and hypothetical expenses based on the Fund’s actual expense ratio and an assumed rate of return of 5% per year before expenses, which is not the Fund’s actual return. The hypothetical account values and expenses may not be used to estimate the actual ending account balance or expenses you paid for the period. You may use this information to compare the ongoing costs of investing in the Fund and other funds. To do so, compare this 5% hypothetical example with the 5% hypothetical examples that appear in the shareholder reports of other funds.
Expenses shown in the table are meant to highlight your ongoing costs only and do not reflect any transactional costs. Therefore, the second line of the table below is useful in comparing ongoing costs only and will not help you determine the relative total costs of owning different funds. In addition, if transaction costs were included, your costs would have been higher.
| Beginning Account Value March 1, 2023 | Ending Account Value August 31, 2023 | Expenses Paid During Period(a) | Annualized Expense Ratio | ||||||||||||
| Actual | $ | 1,000.00 | $ | 1,021.20 | $ | 5.10 | 1.00% | ||||||||
| Hypothetical(b) | $ | 1,000.00 | $ | 1,020.15 | $ | 5.10 | 1.00% | ||||||||
| (a) | Expenses are equal to the Fund’s annualized expense ratios, multiplied by the average account value over the period, multiplied by 184/365 (to reflect the one-half year period). |
| (b) | Hypothetical assumes 5% annual return before expenses. |
23
Trustees and Officers (Unaudited)
GENERAL QUALIFICATIONS. The Board supervises the business activities of the Trust. Each Trustee serves as a trustee until termination of the Trust unless the Trustee dies, resigns, retires, or is removed. The Chair of the Board and more than 75% of the Trustees are “Independent Trustees”, which means that they are not “interested persons” (as defined in the 1940 Act) of the Trust or any adviser, sub-adviser or distributor of the Trust.
The following table provides information regarding the Independent Trustees.
| Name,
Address*, (Year of Birth), Position with Trust**, Term of Position with Trust |
Principal
Occupation During Past 5 Years and Other Directorships |
| Daniel
J. Condon (1950) Chair, May 2022 to present; Chair of the Audit Committee; Chair of the Governance & Nominating Committee, May 2020 to May 2022; Independent Trustee, December 2002 to present |
Current:
Retired (2017 – present). Previous: Peak Income Plus Fund (May 2022 – February 2023). |
| Kenneth
G.Y. Grant (1949) Chair of the Governance & Nominating Committee, May 2022 to present; Chair, January 2017 to May 2022; Independent Trustee, May 2008 to present |
Current:
Director, Standpoint Multi-Asset (Cayman) Fund, Ltd. (2019 – present); Director, Advisors Charitable Gift Fund (2020 –
present), a Donor Advised Fund; Trustee. Trustee, Peak Income Plus Fund (May 2022 – present). Previous: EVP, Benefit Plans Administrative Services, Inc., provider of retirement benefit plans administration (2019 – 2020); Director, Northeast Retirement Services (NRS) LLC, a transfer agent and fund administrator; and Director, Global Trust Company (GTC), a non-depository trust company sponsoring private investment products (2003 – 2019); EVP, NRS (2003 – 2019); GTC, EVP (2008 – 2019); EVP, Savings Banks Retirement Association (2003 – 2019), provider of qualified retirement benefit plans. |
| Ronald
C. Tritschler (1952) Chair of the Audit Committee, May 2022 to present; Independent Trustee, January 2007 to present; Interested Trustee, December 2002 to December 2006 |
Current:
Chief Executive Officer, Director and Legal Counsel of The Webb Companies, a national real estate company, (2001– present);
Director, Standpoint Multi- Asset (Cayman) Fund, Ltd. (2020 – present); Director of First State Bank of the Southeast (2000
– present). Previous: Trustee, Peak Income Plus Fund (May 2022 – February 2023). |
| Catharine
B. McGauley (1977) Chair of the Pricing & Liquidity Committee, November 2022 to present; Independent Trustee, September 2022 to present |
Current:
Lead Portfolio Manager of Atlantic Charter Insurance, a workers’ compensation insurer, (2010 – present); Investment
Advisor for a Family Office (2015 – present); Senior Analyst/Advisor for a Boston real estate company and related family (2010
– present). Previous: Trustee, Peak Income Plus Fund (May 2022 – February 2023). |
| Freddie
Jacobs, Jr. (1970) Independent Trustee, September 2022 to present |
Current:
Chief Operating Officer and Chief Risk Officer Northeast Retirement Services LLC (NRS), and its subsidiary, Global Trust Company
(GTC). NRS is a transfer agent and fund administrator, GTC is a non- depository trust company sponsoring private investment products
(2021 – present); Chair, Board of Crispus Attucks Fund (2020 – present); Board Member of Camp Harbor View (2020 –
present); Director, Sportsmen’s Tennis and Education Center (2019 – present). Previous: SVP, Senior Risk Officer NRS (2013 – 2021); Trustee, Peak Income Plus Fund (May 2022 – February 2023); Trustee of Buckingham Browne & Nichols (2017 - June 2023). |
| * | The address for each Trustee is 225 Pictoria Drive, Suite 450, Cincinnati, Ohio 45246. |
| ** | As of the date of this report, the Trust consists of 29 series. |
24
Trustees and Officers (Unaudited) (continued)
The following table provides information regarding the Interested Trustees and Officers of the Trust.
| Name,
Address*, (Year of Birth), Position with Trust, Term of Position with Trust |
Principal
Occupation During Past 5 Years and Other Directorships |
| David
R. Carson (1958) Interested Trustee, August 2020 to present; President, January 2016 to August 2021 |
Current:
Retired (2023 – present); Interested Trustee, Mammoth Institutional Credit Access Fund and Mammoth Institutional Equity
Access Fund (November 2022 – present); Interested Trustee, Peak Income Plus Fund (May 2022 – present). Previous: Interested Trustee of Ultimus Managers Trust, (January 2021 – April 2023); Senior Vice President Client Strategies of Ultimus Fund Solutions, LLC, (2013 – April 2023). |
| Martin
R. Dean (1963) President, August 2021 to present; Vice President, November 2020 to August 2021; Chief Compliance Officer, April 2021 to August 2021; Assistant Chief Compliance Officer, January 2016 to April 2021 |
Current:
President, Northern Lights Compliance Services (2023 – present). Previous: Senior Vice President, Head of Fund Compliance of Ultimus Fund Solutions, LLC (2016 – January 2023). |
| Zachary
P. Richmond (1980) Treasurer and Chief Financial Officer, November 2014 to present |
Current: Vice President, Director of Financial Administration for Ultimus Fund Solutions, LLC, (2015 – present). |
| Gweneth
K. Gosselink (1955) Chief Compliance Officer, August 2021 to present |
Current:
Assistant Vice President, Senior Compliance Officer of Ultimus Fund Solutions, LLC, since 2019. Previous: Chief Operating Officer & CCO at Miles Capital, Inc. (2013 – 2019). |
| Elisabeth
Dahl (1962) Secretary, May 2017 to present; Assistant Secretary, March 2016 to May 2017 |
Current: Attorney, Ultimus Fund Solutions, LLC since March 2016. |
| Timothy
J. Shaloo (1970) AML Compliance Officer, August 2023 to present |
Current:
AVP, Compliance Officer (September 2023 – present). Previous: Senior Compliance Analyst, Northern Lights Compliance Services, LLC (2021 – August 2023); Compliance Specialist, Ultimus Fund Solutions, LLC (2016 – 2020). |
| * | The address for each Officer is 225 Pictoria Drive, Suite 450, Cincinnati, Ohio 45246. |
Other Information (Unaudited)
The Fund’s Statement of Additional Information (“SAI”) includes additional information about the trustees and is available without charge, upon request. You may call toll-free at (800) 550-1071 to request a copy of the SAI or to make shareholder inquiries.
25
PRIVACY NOTICE
Rev: January 2020
| FACTS | WHAT DOES TACTICAL MULTI-PURPOSE FUND (THE “FUND”) DO WITH YOUR PERSONAL INFORMATION? |
| Why? | Financial companies choose how they share your personal information. Federal law gives consumers the right to limit some but not all sharing. Federal law also requires us to tell you how we collect, share, and protect your personal information. Please read this notice carefully to understand what we do. |
| What? | The types of personal information we collect and share depend on the product or service you have with us. This information can include:
■ Social Security number
■ account balances and account transactions
■ transaction or loss history and purchase history
When you are no longer our customer, we continue to share your information as described in this notice. |
| How? | All financial companies need to share customers’ personal information to run their everyday business. In the section below, we list the reasons financial companies can share their customers’ personal information; the reasons the Fund chooses to share; and whether you can limit this sharing. |
| Reasons we can share your personal information | Does
the Fund share? |
Can
you limit this sharing? |
| For
our everyday business purposes— such as to process your transactions, maintain your account(s), respond to court orders and legal investigations, or report to credit bureaus |
Yes | No |
| For
our marketing purposes— to offer our products and services to you |
No | We
don’t share |
| For joint marketing with other financial companies | No | We
don’t share |
| For
our affiliates’ everyday business purposes— information about your transactions and experiences |
No | We
don’t share |
| For
our affiliates’ everyday business purposes— information about your creditworthiness |
No | We
don’t share |
| For nonaffiliates to market to you | No | We
don’t share |
| Questions? | Call (800) 550-1071 |
26
| Who we are | |
| Who is providing this notice? | Tactical Multi-Purpose Fund
Ultimus Fund Distributors, LLC (Distributor)
Ultimus Fund Solutions, LLC (Administrator) |
| What we do | |
| How
does the Fund protect my personal information? |
To protect your personal information from unauthorized access and use, we use security measures that comply with federal law. These measures include computer safeguards and secured files and buildings. Our service providers are held accountable for adhering to strict policies and procedures to prevent any misuse of your nonpublic personal information. |
| How
does the Fund collect my personal information? |
We collect your personal information, for example, when you
■ open an account or deposit money
■ make deposits or withdrawals from your account or provide account information
We also collect your personal information from other companies. |
| Why can’t I limit all sharing? | Federal law gives you the right to limit only
■ sharing for affiliates’ everyday business purposes — information about your creditworthiness
■ affiliates from using your information to market to you
■ sharing for nonaffiliates to market to you
State laws and individual companies may give you additional rights to limit sharing. |
| Definitions | |
| Affiliates | Companies related by common ownership or control. They can be financial and nonfinancial companies.
■ Fisher Asset Management, LLC, d/b/a Fisher Investments, the investment adviser to the Fund, could be deemed to be an affiliate. |
| Nonaffiliates | Companies not related by common ownership or control. They can be financial and nonfinancial companies.
■ The Fund does not share your personal information with nonaffiliates so they can market to you |
| Joint marketing | A formal agreement between nonaffiliated financial companies that together market financial products or services to you.
■ The Fund does not jointly market. |
27
Proxy Voting
A description of the policies and procedures that the Fund uses to determine how to vote proxies relating to portfolio securities and information regarding how the Fund voted those proxies during the most recent twelve month period ended June 30, are available (1) without charge upon request by calling the Fund at (800) 550-1071 and (2) in Fund documents filed with the SEC on the SEC’s website at www.sec.gov.
| TRUSTEES | INDEPENDENT REGISTERED PUBLIC ACCOUNTING FIRM |
| Daniel J. Condon, Chair | Cohen & Company, Ltd. |
| David R. Carson | 151 North Franklin Street, Suite 575 |
| Kenneth G.Y. Grant | Chicago, IL 60606 |
| Freddie Jacobs, Jr. | |
| Catharine B. McGauley | |
| Ronald C. Tritschler | |
| OFFICERS | LEGAL COUNSEL |
| Martin R. Dean, President | Thompson Hine LLP |
| Gweneth K. Gosselink, Chief Compliance Officer | 312 Walnut Street, 20th Floor |
| Zachary P. Richmond, Treasurer and Chief Financial Officer | Cincinnati, OH 45202 |
| INVESTMENT ADVISER | CUSTODIAN |
| Fisher Asset Management, LLC | U.S. Bank, N.A. |
| 6500 International Parkway, Suite 2050 | 425 Walnut Street |
| Plano, TX 75093 | Cincinnati, OH 45202 |
| DISTRIBUTOR | ADMINISTRATOR, TRANSFER AGENT AND FUND ACCOUNTANT |
| Ultimus Fund Distributors, LLC | Ultimus Fund Solutions, LLC |
| 225 Pictoria Drive, Suite 450 | 225 Pictoria Drive, Suite 450 |
| Cincinnati, OH 45246 | Cincinnati, OH 45246 |
This report is intended only for the information of shareholders or those who have received the Fund’s prospectus which contains information about the Fund’s management fee and expenses. Please read the prospectus carefully before investing.
Distributed by Ultimus Fund Distributors, LLC
Member FINRA/SIPC
FISHER INVESTMENTS INSTITUTIONAL GROUP FUND FAMILY |
Annual Report
August 31, 2023
Fisher Investments Institutional Group
Stock Fund for Retirement Plans
Fisher Investments Institutional Group
ESG Stock Fund for Retirement Plans
Fisher Investments Institutional Group
Fixed Income Fund for Retirement Plans
Fisher Investments Institutional Group
ESG Fixed Income Fund for Retirement Plans
Fund Adviser:
Fisher Asset Management, LLC
6500 International Parkway, Suite 2050
Plano, Texas 75093
(800) 851-8845
Management Discussion of Fund Performance – (Unaudited)
Dear Shareholder:
Market Outlook
Developed world equities finished solidly positive in both Q2 and 2023’s first half. The main force behind the positive year-to-date return, in our view, is that reality exceeded expectations. We think equities are likely to end the year higher as that force is expected to continue.
Elevated inflation has dominated headlines over the past year, and the UK has been among the developed world’s hardest hit. Though the headline consumer price index (including owner occupiers’ housing costs, or CPI-H) sped up from 7.8% y/y to 7.9% in May, most worry centered on the reacceleration in core CPI-H (which excludes energy, food, alcohol and tobacco prices) to 6.5% y/y, its fastest rate in over 30 years. Separately, UK wage growth jumped 7.2% y/y in the three months through April. These developments spurred conversation that the Bank of England (BoE) has yet to tamp down inflation—and will need to keep hiking rates to do so, which many fear is a headwind for equities.
However, in our view, May’s core CPI acceleration appears tied largely to one-time developments, specifically, a big acceleration in recreation and culture prices related to some live music events and the release of a popular video game. These are one-off events, not permanent changes. We also think the theory that wages drive inflation is a misperception. Rather, the former trails the latter since employers typically factor in living costs when setting wages, making them a late-lagging price that responds to inflationary conditions. Data supports this notion lately in other major economies, including the US and Japan—and in our view, it isn’t any different in the UK.
UK equities have lagged the benchmark in Q2 and for the year, but in our view, their relative struggles appear tied to sentiment more than fundamentals. Several fears, from stubbornly high inflation to recession worries, have taken turns weighing on sentiment. However, we don’t think reality is as poor as perceived. Producer prices are close to a zero percent inflation rate, and broad money supply has contracted in five of the past seven months. These developments suggest inflation should broadly keep easing, regardless of whether the BoE hikes or not, and 13 straight BoE hikes haven’t halted GDP growth. That so many remain dour towards British equities despite this resilience is bullish, in our view.
In continental Europe, more recent data suggest the eurozone’s economic backdrop is mixed. The eurozone composite Purchasing Managers’ Index, which aggregates services and manufacturing, fell to 49.9 in late Q2—right below the level dividing expansion and contraction. However, by sector, services showed growth (52.0) while manufacturing stayed in contraction (43.4). This split has persisted throughout the year, and while heavy industry’s weakness weighs on growth, services comprise the majority of output in the eurozone—so the latter’s prospects have more sway on the region’s economy. Regarding prices, though June headline inflation slowed to 5.5% y/y from 6.1%, core CPI picked up
1
Management Discussion of Fund Performance – (Unaudited)
(continued)
from 5.3% to 5.4% y/y, which was tied partly to a low base effect from a price assistance measure last year (e.g., German transport ticket discounts). However, the pickup in core inflation is consistent with the UK’s minor reacceleration, a reminder that inflation trends are global, and one month’s uptick doesn’t negate broader disinflationary trends.
Germany is another place where reality is not as poor as feared, in our view. Since late 2021, economists have been predicting a German recession, and that oft-forecast downturn appeared to manifest in revised GDP data. Q1 GDP was revised down from flat to -0.3% q/q. Following Q4 2022’s -0.5% q/q dip, the two straight quarterly dips meet one popular definition of recession. Some argue German equities outperformance since last September has been disconnected from fundamentals—and now they point to technical recession and other alleged headwinds (e.g., ongoing ECB rate hikes) to claim the outlook is negative. These worries are likely why German equities have lagged throughout Q2.
In our view, forward-looking equities have moved on from these developments, as recession discussion didn’t prevent Italy, Spain, France and even Germany from outperforming in late Q2. Now, it is always possible developments weigh on returns in the near term. For example, Dutch equities have been a top performer year to date but matched the benchmark in June. The cool down comes as Holland’s Information Technology sector only rose slightly, trailing the MSCI’s Information Technology sector in June, which we believe looks tied to minor political uncertainty. The Dutch government detailed export restrictions on machines that make advanced semiconductor processor chips, impacting Dutch semiconductor firm ASML—which comprises nearly all of the Netherlands’ Information Technology sector by market capitalization. We don’t think this restriction significantly disrupts ASML—the company said it did not expect restrictions to have a material impact on its financial outlook—but the news likely weighed on sentiment.
In Asia, sentiment toward Japanese markets still seems relatively optimistic—especially compared to Western Europe. Many high-profile investors have talked up Japanese markets’ prospects recently, pointing to Japanese firms’ cheap valuations and Q1 GDP improvement (1.9% annualized growth) as reasons to be bullish. But valuations aren’t predictive. Despite arguably being attractive for most of the last decade, Japan’s 12-month forward price-to-earnings (P/E) ratio was continuously lower than the broader index from 2014 – 2019.
Investors also point to Japan’s economic recovery, as growth looks stronger relative to other developed markets. For example, May retail sales rose 1.3% m/m, beating expectations, and have risen five of the past six months. In contrast, eurozone retail sales were flat on a monthly basis in May (latest data available). However, Japan’s recent growth is largely tied to its reopening-related boost and tourism recovery. In our view, that likely tapers off and the country will return to its pre-pandemic growth rates.
2
Management Discussion of Fund Performance – (Unaudited)
(continued)
In Japanese politics, Prime Minister Fumio Kishida announced he won’t dissolve the National Diet nor call a snap election. Some observers thought PM Kishida may seek to take advantage of recent optimism by calling for an early election, with the goal of solidifying his power within the ruling Liberal Democratic Party (LDP). But some issues arose, including snags with the national ID card rollout and controversy surrounding a party hosted by PM Kishida’s son at the official residence. Those stories dented his popularity recently, so PM Kishida appears to be holding off from calling a snap vote—and for now, that reduces some political uncertainty. In our view, Japan remains a mixed bag, but sentiment still seems a bit more optimistic than warranted given ongoing headwinds on domestic demand, arguing for a selective approach.
Gridlock looks prevalent throughout the developed world, particularly in Europe—an underappreciated positive for equities, since it decreases the likelihood of major, uncertainty-inducing legislative changes. Another underappreciated eurozone development: cooling inflation. Eurozone inflation hit 6.1% y/y in May, down from April’s 7.0%, as prices continued to slow from October 2022’s 10.6% rate. Though eurozone inflation remains well above its pre-pandemic rate, the price pressures plaguing businesses and households over the past 12 months continue to ease. That said, over the longer term, broader economic and political conditions swamp country-specific issues—and in the eurozone’s case, even mild growth is likely to exceed low expectations, a bullish force for eurozone equities.
Several developed world central banks hiked rates in Q2. Some met expectations, including the 25 basis-point hikes from Sweden’s Riksbank, the ECB and the Swiss National Bank. Others, however, surprised. Norway’s Norges Bank and the BoE hiked by more than anticipated (50 bps instead of 25 bps). The Reserve Bank of Australia and Bank of Canada resumed rate increases after a pause, which caught observers off guard—the former hiked in May and June (25 bps each time) after an April break while the latter had been on hold since January.
For all the attention rate hikes receive, however, they don’t have a preset market impact. Yes, some countries’ markets are down in US dollar terms ever since their central banks began hiking, including Norway, Canada and Australia. Yet other markets are positive: See the eurozone, Switzerland, the UK and Sweden. In our view, this mixed bag illustrates that rate hikes aren’t automatically bad for equities. Monetary policy is just one factor, among many, that markets consider—worth keeping in mind given all the attention on monetary policy globally.
3
Management Discussion of Fund Performance – (Unaudited)
(continued)
Fisher Investments Institutional Group Stock Fund for Retirement Plans Performance Attribution
The Fisher Investments Institutional Group Stock Fund for Retirement Plans outperformed the MSCI ACWI Investable Market Index for the period from September 1, 2022 through August 31, 2023. During this period, the Fund returned 25.75% while the Fund’s primary benchmark, the MSCI ACWI Investable Market Index, returned 13.32%. Country and sector allocation as well as equity selection contributed to relative return. An overweight to and selection within the United States was the largest contributor to relative return, driven by visual computing company Nvidia, pharmaceutical company Eli Lilly and Company and luxury residential designer Toll Brothers. Additionally, an overweight to and selection within Information Technology contributed to performance as enterprise software and computer hardware conglomerate Oracle, lithography equipment manufacturer ASML Holdings and digital marketing & media solutions provider Adobe outperformed relative to the Information Technology sector within the MSCI ACWI Investable Market Index. Conversely, an underweight to and selection within Japan was the largest detractor from relative returns, driven by computer systems manufacturer FANUC as well as industrial machinery manufacturers SMC Corporation and Daifuku. Further, selection within Industrials detracted from performance as online payroll and human resource technology provider Paycom, diesel and natural gas engine manufacturer Cummins and rail freight company Canadian Pacific Kansas City Limited underperformed other Industrials companies.
Portfolio Shifts
For the period from September 1, 2022 through August 31, 2023, we have increased the Fund’s exposure to the Financials sector. We believe the Financials sector is likely to perform in-line with global markets. Positively, cyclical categories like Financials should perform well in our view, as equities recover from last year’s bear market. Recent high-profile bank failures appear highly isolated in nature—the broader banking system remains robust, with underappreciated balance sheet strength. Banks, worldwide, broadly have the highest capital and liquidity buffers in modern history, providing ample ability to weather economic uncertainty ahead. The strong balance sheet position of banks today allows for continued loan growth and the ability to keep lending margins wide via low dependence on more expensive interest-bearing funding sources.
Similarly, we decreased the Fund’s exposure to the Health Care sector. Health Care is a traditionally defensive sector that tends to underperform in economic rebounds and early bull markets—the environment we anticipate moving forward.
4
Management Discussion of Fund Performance – (Unaudited)
(continued)
Fisher Investments Institutional Group ESG Stock Fund for Retirement Plans
Performance Attribution
The Fisher Investments Institutional Group ESG Stock Fund for Retirement Plans outperformed the MSCI ACWI Investable Market Index for the period from September 1, 2022 through August 31, 2023. During this period, the Fund returned 27.34% while the Fund’s primary benchmark, the MSCI ACWI Investable Market Index, returned 13.32%. Country and sector allocation as well as equity selection contributed to relative outperformance. An overweight to and selection within the United States was the largest contributor to relative outperformance, driven by visual computing company Nvidia, pharmaceutical company Eli Lilly and Company, and industrial manufacturer Lennox International. Additionally, an overweight to and selection within Information Technology contributed to performance as enterprise software and computer hardware conglomerate Oracle, lithography equipment manufacturer ASML Holdings, and cloud computing company Salesforce outperformed relative to the Information Technology sector within the MSCI ACWI Investable Market Index. Conversely, an underweight to and selection within Denmark was the largest detractor from relative return, driven by wind power plant company Vestas Wind Systems. Further, an underweight to and selection within Japan detracted from performance as computer systems manufacturer FANUC and industrial machinery manufacturer Daifuku underperformed relative to Japan within the MSCI ACWI Investable Market Index.
Portfolio Shifts
For the period from September 1, 2022 through August 31, 2023, we increased the Fund’s exposure to Industrials. Lack of qualified labor and rising wages in Emerging Markets, improving productivity in Developed Markets and secular demand for semiconductor manufacturing globally are contributing to increased demand for factory automation equipment and services. Demand for extraction equipment will likely remain strong alongside elevated prices for many metals, particularly those exposed to “green capex” including cobalt, nickel and lithium, benefitting mining equipment manufacturers. The Russian invasion of Ukraine and US-China tensions have driven companies to secure supply chains in their domestic or friendly countries’ markets—likely decreasing global trade but increasing domestic infrastructure investments. However, rising geopolitical tensions have also pulled forward some defense spending.
During the same period, we significantly decreased the Fund’s exposure to Information Technology. Governments around the world may increasingly use antitrust laws to reduce intellectual property royalties, as recently seen in Asia, as well as national security as a rationale to impede cross border M&A, as recently seen in the US. Further, calls for Tech regulation in the US are increasing, ranging from social media legal immunity, anti-competitive business practices and M&A investigations from the Department of Justice
5
Management Discussion of Fund Performance – (Unaudited)
(continued)
and FTC. Global competition between the US and China continues to have downstream impacts on the Technology sector.
Fisher Investments Institutional Group Fixed Income Fund for Retirement Plans Performance Attribution
The Fisher Investments Institutional Group Fixed Income Fund for Retirement Plans outperformed the ICE BofA U.S. Broad Market Index for the period from September 1, 2022 through August 31, 2023. During this period, the Fund returned -0.60% while the Fund’s primary benchmark, the ICE BofA U.S. Broad Market Index, returned -1.32%. A strategic lack of exposure to securitized/collateralized bonds was the largest contributor to relative outperformance as the category underperformed the broader benchmark. Additionally, an overweight to and selection within corporate bonds also contributed to performance. Conversely, a strategic lack of exposure to Quasi & Foreign Government bonds detracted from performance as the category outperformed the broader benchmark. Further, selection within Sovereign bonds also detracted from performance.
Portfolio Shifts
For the period from June 30, 2023 to August 31, 2023, we have increased the Fund’s exposure to sovereign bonds by 6.65%.
Fisher Investments Institutional Group ESG Fixed Income Fund for Retirement Plans
Performance Attribution
The Fisher Investments Institutional Group ESG Fixed Income Fund for Retirement Plans outperformed the ICE BofA U.S. Broad Market Index for the period from September 1, 2022 through August 31, 2023. During this period, the Fund returned -0.69% while the Fund’s primary benchmark, the ICE BofA U.S. Broad Market Index, returned -1.32%. A strategic lack of exposure to securitized/collateralized bonds was the largest contributor to relative outperformance as the category underperformed the broader benchmark. Additionally, an overweight to corporate bonds also contributed to performance. Conversely, selection within sovereign bonds was the largest detractor from relative return. Further, a strategic lack of exposure to Quasi & Foreign Government bonds detracted from performance as the category outperformed the broader benchmark.
Portfolio Shifts
For the period from June 30, 2023 to August 31, 2023, we have increased the Fund’s exposure to sovereign bonds by 4.85%.
6
Investment Results (Unaudited)
Average Annual Total Returns as of August 31, 2023(a)
| Since | |||
| Inception | |||
| One Year | Three Year | (12/13/19) | |
| Fisher Investments Institutional Group Stock Fund for Retirement Plans | 25.75% | 8.75% | 11.31% |
| MSCI ACWI Investable Market Index(b) | 13.32% | 7.29% | 7.42% |
| Expense | |||
| Ratios(c) | |||
| Gross | 0.00% | ||
| With Applicable Waivers | 0.00% |
The performance quoted represents past performance, which does not guarantee future results. The investment return and principal value of an investment will fluctuate so that an investor’s shares, when redeemed, may be worth more or less than their original cost. The returns shown do not reflect deduction of taxes that a shareholder would pay on Fisher Investments Institutional Group Stock Fund for Retirement Plans (the “Fund”) distributions or the redemption of Fund shares. The Fund’s investment objective, risks, charges and expenses should be considered carefully before investing. Current performance may be lower or higher than the performance quoted. Performance data current to the most recent month-end may be obtained by calling (800) 851-8845.
| (a) | Return figures reflect any change in price per share and assume the reinvestment of all distributions. |
| (b) | The MSCI ACWI Investable Market Index is designed to represent performance of the full opportunity set of large and mid-cap stocks across 23 developed markets and 24 emerging markets. Individuals cannot invest directly in an index; however, an individual can invest in exchange traded funds or other investment vehicles that attempt to track the performance of a benchmark index. Index returns assume reinvestment of dividends and do not reflect any fees or expenses. |
| (c) | The expense ratios are from the Fund’s prospectus dated December 29, 2022. Fisher Asset Management, LLC, d/b/a Fisher Investments (the “Adviser”) has contractually agreed to pay all of the operating expenses of the Fund except portfolio transaction and other investment related costs (including brokerage fees and commissions, and fees and expenses associated with investments in derivative instruments, such as option and swap fees and expenses), taxes, borrowing costs (such as interest and dividend expense on securities sold short), extraordinary expenses, and any indirect expenses (such as fees and expenses associated with investment in acquired funds and other collective investment vehicles). The Fund is available only to eligible retirement plans receiving the Adviser’s managed account or other services. The Fund does not pay a management fee to the Adviser. Retirement plans, plan sponsors and/or plan participants pay a separate fee for the Adviser’s services and also pay fees to record keepers and administrators. If paid from plan assets, these fees will reduce the net return to plan participants but are not reflected in net fund performance. |
The Fund’s investment objective, strategies, risks, charges and expenses should be considered carefully before investing. The Fund’s prospectus contains this and other important information about the Fund and may be obtained by calling (800) 851-8845. Please read it carefully before investing.
7
Investment Results (Unaudited) (continued)
Comparison of the Growth of a $10,000 Investment in the Fisher Investments Institutional Group Stock Fund for Retirement Plans and the MSCI ACWI Investable Market Index (Unaudited)
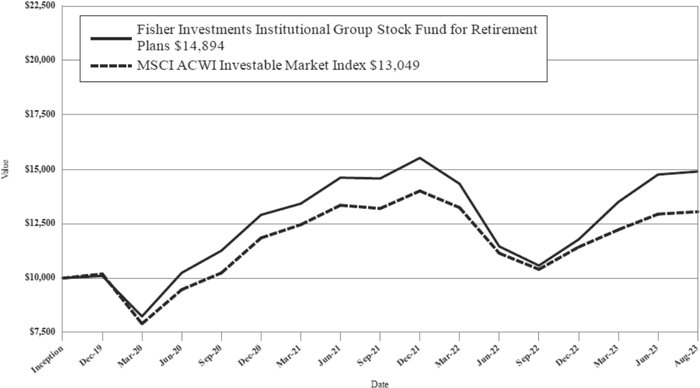
This graph shows the value of a hypothetical initial investment of $10,000 made on December 13, 2019 (commencement of operations) and held through August 31, 2023. The MSCI ACWI Investable Market Index is designed to represent performance of the full opportunity set of large and mid-cap stocks across 23 developed and 24 emerging markets. THE FUND’S RETURN REPRESENTS PAST PERFORMANCE AND DOES NOT GUARANTEE OR PREDICT FUTURE RESULTS. The returns shown do not reflect deduction of taxes that a shareholder would pay on Fund distributions or the redemption of Fund shares. Investment returns and principal values will fluctuate so that an investor’s shares, when redeemed, may be worth more or less than their original cost.
Current performance may be lower or higher than the performance data quoted. For more information on the Fund, and to obtain performance data current to the most recent month-end, or to request a prospectus, please call (800) 851-8845. You should carefully consider the investment objective, risks, charges and expenses of the Fund before investing. The Fund’s prospectus contains this and other information about the Fund and should be read carefully before investing.
The Fund is distributed by Ultimus Fund Distributors, LLC, member FINRA/SIPC.
8
Investment Results (Unaudited) (continued)
Average Annual Total Returns as of August 31, 2023(a)
| Since | |||
| Inception | |||
| One Year | Three Year | (12/13/19) | |
| Fisher Investments Institutional Group ESG Stock Fund for Retirement Plans | 27.34% | 9.18% | 11.66% |
| MSCI ACWI Investable Market Index(b) | 13.32% | 7.29% | 7.42% |
| Expense | |||
| Ratios(c) | |||
| Gross | 0.00% | ||
| With Applicable Waivers | 0.00% |
The performance quoted represents past performance, which does not guarantee future results. The investment return and principal value of an investment will fluctuate so that an investor’s shares, when redeemed, may be worth more or less than their original cost. The returns shown do not reflect deduction of taxes that a shareholder would pay on Fisher Investments Institutional Group ESG Stock Fund for Retirement Plans (the “Fund”) distributions or the redemption of Fund shares. The Fund’s investment objective, risks, charges and expenses should be considered carefully before investing. Current performance may be lower or higher than the performance quoted. Performance data current to the most recent month-end may be obtained by calling (800) 851-8845.
| (a) | Return figures reflect any change in price per share and assume the reinvestment of all distributions. |
| (b) | The MSCI ACWI Investable Market Index is designed to represent performance of the full opportunity set of large and mid-cap stocks across 23 developed markets and 24 emerging markets. Individuals cannot invest directly in an index; however, an individual can invest in exchange traded funds or other investment vehicles that attempt to track the performance of a benchmark index. Index returns assume reinvestment of dividends and do not reflect any fees or expenses. |
| (c) | The expense ratios are from the Fund’s prospectus dated December 29, 2022. Fisher Asset Management, LLC, d/b/a Fisher Investments (the “Adviser”) has contractually agreed to pay all of the operating expenses of the Fund except portfolio transaction and other investment related costs (including brokerage fees and commissions, and fees and expenses associated with investments in derivative instruments, such as option and swap fees and expenses), taxes, borrowing costs (such as interest and dividend expense on securities sold short), extraordinary expenses, and any indirect expenses (such as fees and expenses associated with investment in acquired funds and other collective investment vehicles). The Fund is available only to eligible retirement plans receiving the Adviser’s managed account or other services. The Fund does not pay a management fee to the Adviser. Retirement plans, plan sponsors and/or plan participants pay a separate fee for the Adviser’s services and also pay fees to record keepers and administrators. If paid from plan assets, these fees will reduce the net return to plan participants but are not reflected in net fund performance. |
The Fund’s investment objective, strategies, risks, charges and expenses should be considered carefully before investing. The Fund’s prospectus contains this and other important information about the Fund and may be obtained by calling (800) 851-8845. Please read it carefully before investing.
9
Investment Results (Unaudited) (continued)
Comparison of the Growth of a $10,000 Investment in the Fisher Investments Institutional Group ESG Stock Fund for Retirement Plans and the MSCI ACWI Investable Market Index (Unaudited)
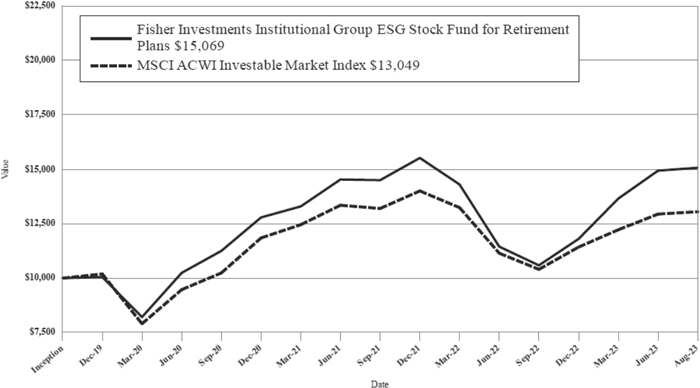
This graph shows the value of a hypothetical initial investment of $10,000 made on December 13, 2019 (commencement of operations) and held through August 31, 2023. The MSCI ACWI Investable Market Index is designed to represent performance of the full opportunity set of large and mid-cap stocks across 23 developed and 24 emerging markets. THE FUND’S RETURN REPRESENTS PAST PERFORMANCE AND DOES NOT GUARANTEE OR PREDICT FUTURE RESULTS. The returns shown do not reflect deduction of taxes that a shareholder would pay on Fund distributions or the redemption of Fund shares. Investment returns and principal values will fluctuate so that an investor’s shares, when redeemed, may be worth more or less than their original cost.
Current performance may be lower or higher than the performance data quoted. For more information on the Fund, and to obtain performance data current to the most recent month-end, or to request a prospectus, please call (800) 851-8845. You should carefully consider the investment objective, risks, charges and expenses of the Fund before investing. The Fund’s prospectus contains this and other information about the Fund and should be read carefully before investing.
The Fund is distributed by Ultimus Fund Distributors, LLC, member FINRA/SIPC.
10
Investment Results (Unaudited) (continued)
Average Annual Total Returns as of August 31, 2023(a)
| Since | |||
| Inception | |||
| One Year | Three Year | (12/13/19) | |
| Fisher Investments Institutional Group Fixed Income Fund for Retirement Plans | (0.60)% | (3.81)% | (1.73)% |
| ICE BofA U.S. Broad Market Index(b) | (1.32)% | (4.47)% | (1.91)% |
| Expense | |||
| Ratios(c) | |||
| Gross | 0.01% | ||
| With Applicable Waivers | 0.01% |
The performance quoted represents past performance, which does not guarantee future results. The investment return and principal value of an investment will fluctuate so that an investor’s shares, when redeemed, may be worth more or less than their original cost. The returns shown do not reflect deduction of taxes that a shareholder would pay on Fisher Investments Institutional Group Fixed Income Fund for Retirement Plans (the “Fund”) distributions or the redemption of Fund shares. The Fund’s investment objective, risks, charges and expenses should be considered carefully before investing. Current performance may be lower or higher than the performance quoted. Performance data current to the most recent month-end may be obtained by calling (800) 851-8845.
| (a) | Return figures reflect any change in price per share and assume the reinvestment of all distributions. |
| (b) | The ICE BofA U.S. Broad Market Index measures the performance of U.S. dollar-denominated, investment grade debt securities, including U.S. Treasury notes and bonds, quasi-government securities, corporate securities, residential and commercial mortgage-backed securities and asset-backed securities. Individuals cannot invest directly in an index; however, an individual can invest in exchange traded funds or other investment vehicles that attempt to track the performance of a benchmark index. Index returns assume reinvestment of dividends and do not reflect any fees or expenses. |
| (c) | The expense ratios are from the Fund’s prospectus dated December 29, 2022 and represent acquired fund fees and expenses. Fisher Asset Management, LLC, d/b/a Fisher Investments (the “Adviser”) has contractually agreed to pay all of the operating expenses of the Fund except portfolio transaction and other investment related costs (including brokerage fees and commissions, and fees and expenses associated with investments in derivative instruments, such as option and swap fees and expenses), taxes, borrowing costs (such as interest and dividend expense on securities sold short), extraordinary expenses, and any indirect expenses (such as fees and expenses associated with investment in acquired funds and other collective investment vehicles). The Fund is available only to eligible retirement plans receiving the Adviser’s managed account or other services. The Fund does not pay a management fee to the Adviser. Retirement plans, plan sponsors and/or plan participants pay a separate fee for the Adviser’s services and also pay fees to record keepers and administrators. If paid from plan assets, these fees will reduce the net return to plan participants but are not reflected in net fund performance. |
The Fund’s investment objective, strategies, risks, charges and expenses should be considered carefully before investing. The Fund’s prospectus contains this and other important information about the Fund and may be obtained by calling (800) 851-8845. Please read it carefully before investing.
11
Investment Results (Unaudited) (continued)
Comparison of the Growth of a $10,000 Investment in the Fisher Investments Institutional Group Fixed Income Fund for Retirement Plans and the ICE BofA U.S. Broad Market Index (Unaudited)
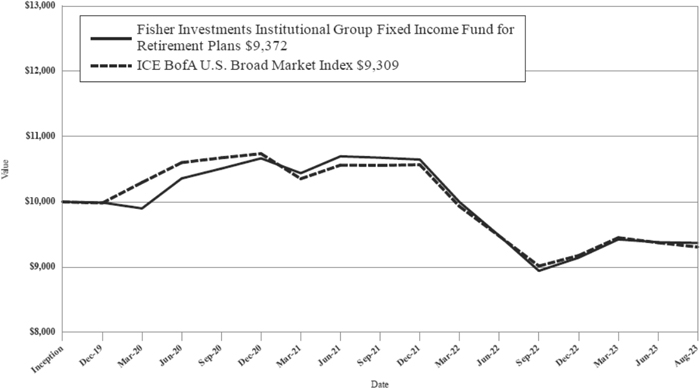
This graph shows the value of a hypothetical initial investment of $10,000 made on December 13, 2019 (commencement of operations) and held through August 31, 2023. The ICE BofA U.S. Broad Market Index measures the performance of U.S. dollar-denominated, investment grade debt securities, including U.S. Treasury notes and bonds, quasi-government securities, corporate securities, residential and commercial mortgage-backed securities, and asset-backed securities. THE FUND’S RETURN REPRESENTS PAST PERFORMANCE AND DOES NOT GUARANTEE OR PREDICT FUTURE RESULTS. The returns shown do not reflect deduction of taxes that a shareholder would pay on Fund distributions or the redemption of Fund shares. Investment returns and principal values will fluctuate so that an investor’s shares, when redeemed, may be worth more or less than their original cost.
Current performance may be lower or higher than the performance data quoted. For more information on the Fund, and to obtain performance data current to the most recent month-end, or to request a prospectus, please call (800) 851-8845. You should carefully consider the investment objective, risks, charges and expenses of the Fund before investing. The Fund’s prospectus contains this and other information about the Fund and should be read carefully before investing.
The Fund is distributed by Ultimus Fund Distributors, LLC, member FINRA/SIPC.
12
Investment Results (Unaudited) (continued)
Average Annual Total Returns as of August 31, 2023(a)
| Since | |||
| Inception | |||
| One Year | Three Year | (12/13/19) | |
| Fisher Investments Institutional Group ESG Fixed Income Fund for Retirement Plans | (0.69)% | (4.07)% | (1.92)% |
| ICE BofA U.S. Broad Market Index(b) | (1.32)% | (4.47)% | (1.91)% |
| Expense | |||
| Ratios(c) | |||
| Gross | 0.02% | ||
| With Applicable Waivers | 0.02% |
The performance quoted represents past performance, which does not guarantee future results. The investment return and principal value of an investment will fluctuate so that an investor’s shares, when redeemed, may be worth more or less than their original cost. The returns shown do not reflect deduction of taxes that a shareholder would pay on Fisher Investments Institutional Group ESG Fixed Income Fund for Retirement Plans (the “Fund”) distributions or the redemption of Fund shares. The Fund’s investment objective, risks, charges and expenses should be considered carefully before investing. Current performance may be lower or higher than the performance quoted. Performance data current to the most recent month-end may be obtained by calling (800) 851-8845.
| (a) | Return figures reflect any change in price per share and assume the reinvestment of all distributions. |
| (b) | The ICE BofA U.S. Broad Market Index measures the performance of U.S. dollar-denominated, investment grade debt securities, including U.S. Treasury notes and bonds, quasi-government securities, corporate securities, residential and commercial mortgage-backed securities and asset-backed securities. Individuals cannot invest directly in an index; however, an individual can invest in exchange traded funds or other investment vehicles that attempt to track the performance of a benchmark index. Index returns assume reinvestment of dividends and do not reflect any fees or expenses. |
| (c) | The expense ratios are from the Fund’s prospectus dated December 29, 2022 and represent acquired fund fees and expenses. Fisher Asset Management, LLC, d/b/a Fisher Investments (the “Adviser”) has contractually agreed to pay all of the operating expenses of the Fund except portfolio transaction and other investment related costs (including brokerage fees and commissions, and fees and expenses associated with investments in derivative instruments, such as option and swap fees and expenses), taxes, borrowing costs (such as interest and dividend expense on securities sold short), extraordinary expenses, and any indirect expenses (such as fees and expenses associated with investment in acquired funds and other collective investment vehicles). The Fund is available only to eligible retirement plans receiving the Adviser’s managed account or other services. The Fund does not pay a management fee to the Adviser. Retirement plans, plan sponsors and/or plan participants pay a separate fee for the Adviser’s services and also pay fees to record keepers and administrators. If paid from plan assets, these fees will reduce the net return to plan participants but are not reflected in net fund performance. |
The Fund’s investment objective, strategies, risks, charges and expenses should be considered carefully before investing. The Fund’s prospectus contains this and other important information about the Fund and may be obtained by calling (800) 851-8845. Please read it carefully before investing.
13
Investment Results (Unaudited) (continued)
Comparison of the Growth of a $10,000 Investment in the Fisher Investments Institutional Group ESG Fixed Income Fund for Retirement Plans and the ICE BofA U.S. Broad Market Index (Unaudited)
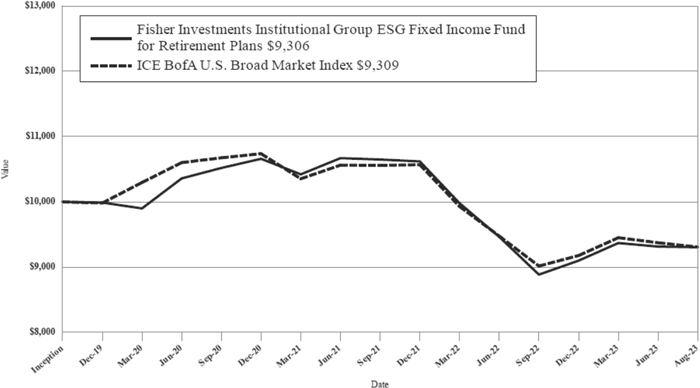
This graph shows the value of a hypothetical initial investment of $10,000 made on December 13, 2019 (commencement of operations) and held through August 31, 2023. The ICE BofA U.S. Broad Market Index measures the performance of U.S. dollar-denominated, investment grade debt securities, including U.S. Treasury notes and bonds, quasi-government securities, corporate securities, residential and commercial mortgage-backed securities, and asset-backed securities. THE FUND’S RETURN REPRESENTS PAST PERFORMANCE AND DOES NOT GUARANTEE OR PREDICT FUTURE RESULTS. The returns shown do not reflect deduction of taxes that a shareholder would pay on Fund distributions or the redemption of Fund shares. Investment returns and principal values will fluctuate so that an investor’s shares, when redeemed, may be worth more or less than their original cost.
Current performance may be lower or higher than the performance data quoted. For more information on the Fund, and to obtain performance data current to the most recent month-end, or to request a prospectus, please call (800) 851-8845. You should carefully consider the investment objective, risks, charges and expenses of the Fund before investing. The Fund’s prospectus contains this and other information about the Fund and should be read carefully before investing.
The Fund is distributed by Ultimus Fund Distributors, LLC, member FINRA/SIPC.
14
Fund Holdings (Unaudited)
Fisher Investments Institutional Group Stock Fund for Retirement Plans Holdings as of August 31, 2023.*
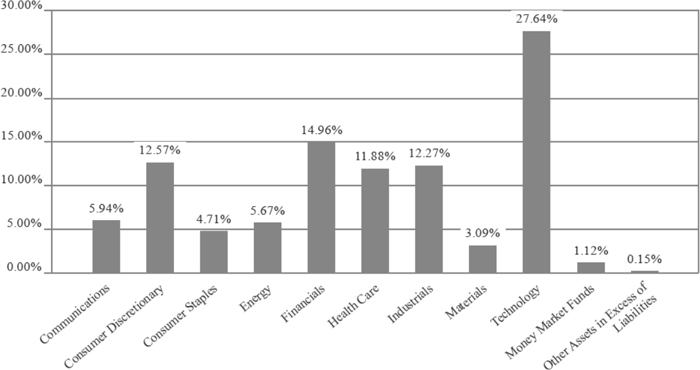
| * | As a percentage of net assets. |
The Fisher Investments Institutional Group Stock Fund for Retirement Plans seeks to outperform, net of fees and expenses, the return of the MSCI ACWI Investable Market Index as its investment objective.
15
Fund Holdings (Unaudited) (continued)
Fisher Investments Institutional Group ESG Stock Fund for Retirement Plans Holdings as of August 31, 2023.*
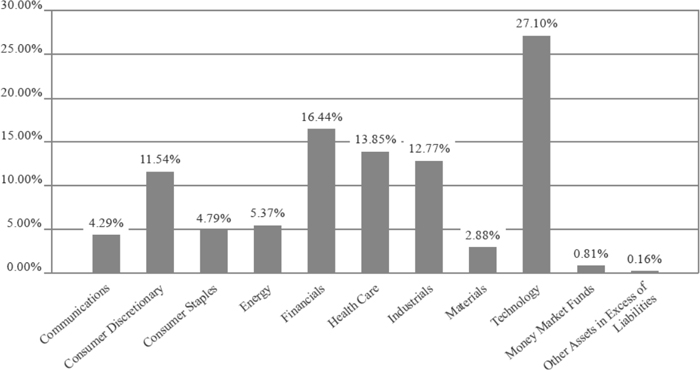
| * | As a percentage of net assets. |
The Fisher Investments Institutional Group ESG Stock Fund for Retirement Plans seeks to outperform, net of fees and expenses, the return of the MSCI ACWI Investable Market Index as its investment objective.
16
Fund Holdings (Unaudited) (continued)
Fisher Investments Institutional Group Fixed Income Fund for Retirement Plans Holdings as of August 31, 2023.*
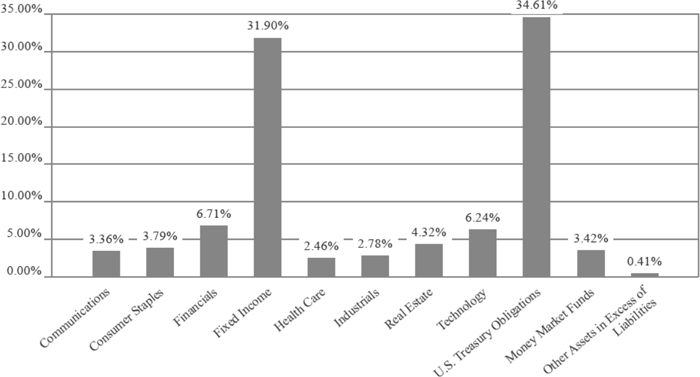
| * | As a percentage of net assets. |
The Fisher Investments Institutional Group Fixed Income Fund for Retirement Plans seeks to outperform, net of fees and expenses, the return of the ICE BofA U.S. Broad Market Index as its investment objective.
17
Fund Holdings (Unaudited) (continued)
Fisher Investments Institutional Group ESG Fixed Income Fund for Retirement Plans Holdings as of August 31, 2023.*
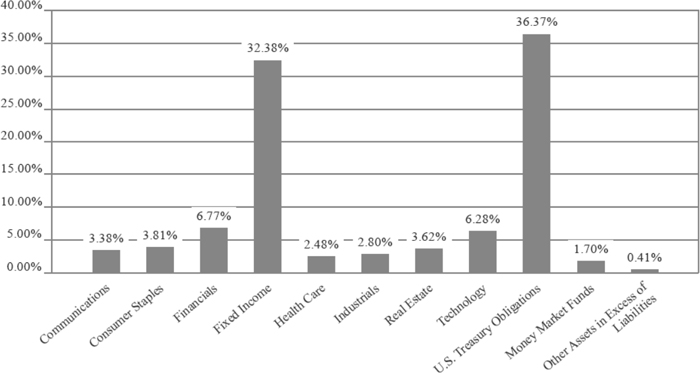
| * | As a percentage of net assets. |
The Fisher Investments Institutional Group ESG Fixed Income Fund for Retirement Plans seeks to outperform, net of fees and expenses, the return of the ICE BofA U.S. Broad Market Index as its investment objective.
Availability of Portfolio Schedule – (Unaudited)
The Funds file their complete schedule of portfolio holdings with the Securities and Exchange Commission (“SEC”) for the first and third quarters of each fiscal year as an exhibit to their reports on Form N-PORT. The Funds’ Form N-PORT reports are available on the SEC’s website at www. sec.gov.
18
| Fisher Investments Institutional Group Stock Fund For Retirement Plans |
| Schedule of Investments |
| August 31, 2023 |
| COMMON STOCKS — 98.73% | Shares | Fair Value | ||||||
| Australia — 0.67% | ||||||||
| Materials — 0.67% | ||||||||
| BHP Group Ltd. | 26 | $ | 756 | |||||
| Rio Tinto Ltd. | 10 | 732 | ||||||
| 1,488 | ||||||||
| Total Australia | 1,488 | |||||||
| Brazil — 0.22% | ||||||||
| Materials — 0.22% | ||||||||
| Vale SA - ADR | 38 | 500 | ||||||
| Total Brazil | 500 | |||||||
| Canada — 1.95% | ||||||||
| Industrials — 0.71% | ||||||||
| Canadian Pacific Kansas City Ltd. | 20 | 1,588 | ||||||
| Materials — 1.24% | ||||||||
| Hudbay Minerals, Inc. | 232 | 1,153 | ||||||
| Lundin Mining Corp. | 208 | 1,613 | ||||||
| 2,766 | ||||||||
| Total Canada | 4,354 | |||||||
| China — 0.95% | ||||||||
| Communications — 0.45% | ||||||||
| Tencent Holdings Ltd. - ADR | 24 | 994 | ||||||
| Consumer Discretionary — 0.25% | ||||||||
| Alibaba Group Holding Ltd. - ADR(a) | 6 | 557 | ||||||
| Health Care — 0.25% | ||||||||
| Sino Biopharmaceutical Ltd. - ADR | 75 | 549 | ||||||
| Total China | 2,100 | |||||||
| France — 3.36% | ||||||||
| Consumer Discretionary — 0.84% | ||||||||
| Kering SA - ADR | 35 | 1,876 | ||||||
| Energy — 0.73% | ||||||||
| TotalEnergies SE | 26 | 1,638 | ||||||
| Financials — 0.67% | ||||||||
| BNP Paribas SA | 23 | 1,490 | ||||||
| Health Care — 0.43% | ||||||||
| Sanofi | 9 | 963 | ||||||
| Technology — 0.69% | ||||||||
| Dassault Systems SE | 39 | 1,549 | ||||||
| Total France | 7,516 | |||||||
| Germany — 4.03% | ||||||||
| Consumer Discretionary — 2.28% | ||||||||
| adidas AG | 12 | 2,401 | ||||||
See accompanying notes which are an integral part of these financial statements.
19
| Fisher Investments Institutional Group Stock Fund For Retirement Plans |
| Schedule of Investments (continued) |
| August 31, 2023 |
| COMMON STOCKS — 98.73% - continued | Shares | Fair Value | ||||||
| Germany — 4.03% - continued | ||||||||
| Consumer Discretionary — 2.28% - continued | ||||||||
| Mercedes-Benz Group AG | 28 | $ | 2,052 | |||||
| Sixt SE | 6 | 641 | ||||||
| 5,094 | ||||||||
| Industrials — 1.75% | ||||||||
| MTU Aero Engines AG | 8 | 1,873 | ||||||
| Siemens AG | 13 | 1,959 | ||||||
| Siemens Energy AG(a) | 4 | 57 | ||||||
| 3,889 | ||||||||
| Total Germany | 8,983 | |||||||
| India — 0.51% | ||||||||
| Technology — 0.51% | ||||||||
| Infosys Ltd. - ADR | 65 | 1,129 | ||||||
| Total India | 1,129 | |||||||
| Italy — 1.33% | ||||||||
| Energy — 0.52% | ||||||||
| Eni SpA | 75 | 1,162 | ||||||
| Financials — 0.81% | ||||||||
| Intesa Sanpaolo SpA | 672 | 1,802 | ||||||
| Total Italy | 2,964 | |||||||
| Japan — 2.67% | ||||||||
| Industrials — 2.67% | ||||||||
| Daifuku Co. Ltd. - ADR | 85 | 781 | ||||||
| FANUC Corp. - ADR | 99 | 1,405 | ||||||
| SMC Corp. - ADR | 98 | 2,389 | ||||||
| Yaskawa Electric Corp. - ADR | 18 | 1,410 | ||||||
| 5,985 | ||||||||
| Total Japan | 5,985 | |||||||
| Korea (Republic of) — 2.08% | ||||||||
| Financials — 0.38% | ||||||||
| KB Financial Group, Inc. | 21 | 858 | ||||||
| Technology — 1.70% | ||||||||
| Samsung Electronics Co. Ltd. - GDR | 3 | 3,789 | ||||||
| Total Korea (Republic of) | 4,647 | |||||||
| Netherlands — 2.95% | ||||||||
| Financials — 0.59% | ||||||||
| ING Groep NV | 93 | 1,322 | ||||||
| Technology — 2.36% | ||||||||
| ASML Holding NV | 8 | 5,276 | ||||||
| Total Netherlands | 6,598 | |||||||
See accompanying notes which are an integral part of these financial statements.
20
| Fisher Investments Institutional Group Stock Fund For Retirement Plans |
| Schedule of Investments (continued) |
| August 31, 2023 |
| COMMON STOCKS — 98.73% - continued | Shares | Fair Value | ||||||
| Spain — 1.72% | ||||||||
| Financials — 1.72% | ||||||||
| Banco Bilbao Vizcaya Argentaria SA | 250 | $ | 1,971 | |||||
| Banco Santander SA | 479 | 1,872 | ||||||
| 3,843 | ||||||||
| Total Spain | 3,843 | |||||||
| Switzerland — 0.59% | ||||||||
| Health Care — 0.59% | ||||||||
| Novartis AG | 13 | 1,314 | ||||||
| Total Switzerland | 1,314 | |||||||
| Taiwan Province of China — 2.85% | ||||||||
| Technology — 2.85% | ||||||||
| Taiwan Semiconductor Manufacturing Co. Ltd. - ADR | 68 | 6,363 | ||||||
| Total Taiwan Province of China | 6,363 | |||||||
| United Kingdom — 2.60% | ||||||||
| Consumer Staples — 0.08% | ||||||||
| Haleon PLC | 44 | 180 | ||||||
| Energy — 1.76% | ||||||||
| BP PLC | 248 | 1,532 | ||||||
| Shell PLC | 77 | 2,386 | ||||||
| 3,918 | ||||||||
| Health Care — 0.76% | ||||||||
| AstraZeneca PLC | 8 | 1,081 | ||||||
| GSK PLC | 35 | 616 | ||||||
| 1,697 | ||||||||
| Total United Kingdom | 5,795 | |||||||
| United States — 70.25% | ||||||||
| Communications — 5.49% | ||||||||
| Alphabet, Inc., Class A(a) | 53 | 7,217 | ||||||
| Meta Platforms, Inc., Class A(a) | 11 | 3,255 | ||||||
| Netflix, Inc.(a) | 3 | 1,301 | ||||||
| Walt Disney Co. (The)(a) | 6 | 502 | ||||||
| 12,275 | ||||||||
| Consumer Discretionary — 9.20% | ||||||||
| Amazon.com, Inc.(a) | 40 | 5,521 | ||||||
| Autoliv, Inc. | 19 | 1,854 | ||||||
| Capri Holdings Ltd.(a) | 37 | 1,942 | ||||||
| General Motors Co. | 47 | 1,575 | ||||||
| Home Depot, Inc. (The) | 8 | 2,643 | ||||||
| Starbucks Corp. | 13 | 1,267 | ||||||
| Toll Brothers, Inc. | 38 | 3,113 | ||||||
| Wynn Resorts Ltd. | 26 | 2,636 | ||||||
| 20,551 | ||||||||
| Consumer Staples — 4.63% | ||||||||
| Costco Wholesale Corp. | 6 | 3,295 | ||||||
See accompanying notes which are an integral part of these financial statements.
21
| Fisher Investments Institutional Group Stock Fund For Retirement Plans |
| Schedule of Investments (continued) |
| August 31, 2023 |
| COMMON STOCKS — 98.73% - continued | Shares | Fair Value | ||||||
| United States — 70.25% - continued | ||||||||
| Consumer Staples — 4.63% - continued | ||||||||
| PepsiCo, Inc. | 13 | $ | 2,313 | |||||
| Procter & Gamble Co. (The) | 17 | 2,624 | ||||||
| Walmart, Inc. | 13 | 2,114 | ||||||
| 10,346 | ||||||||
| Energy — 2.66% | ||||||||
| Chevron Corp. | 15 | 2,416 | ||||||
| Exxon Mobil Corp. | 21 | 2,335 | ||||||
| Marathon Oil Corp. | 45 | 1,186 | ||||||
| 5,937 | ||||||||
| Financials — 10.79% | ||||||||
| American Express Co. | 13 | 2,054 | ||||||
| Bank of America Corp. | 67 | 1,921 | ||||||
| BlackRock, Inc. | 4 | 2,802 | ||||||
| Citigroup, Inc. | 42 | 1,734 | ||||||
| Goldman Sachs Group, Inc. (The) | 5 | 1,639 | ||||||
| Invesco Ltd. | 52 | 828 | ||||||
| Jefferies Financial Group, Inc. | 25 | 892 | ||||||
| JPMorgan Chase & Co. | 14 | 2,049 | ||||||
| MasterCard, Inc., Class A | 5 | 2,063 | ||||||
| Morgan Stanley | 29 | 2,469 | ||||||
| Paycom Software, Inc. | 7 | 2,064 | ||||||
| T. Rowe Price Group, Inc. | 10 | 1,122 | ||||||
| Visa, Inc., Class A | 10 | 2,457 | ||||||
| 24,094 | ||||||||
| Health Care — 9.85% | ||||||||
| Abbott Laboratories | 9 | 926 | ||||||
| Danaher Corp. | 5 | 1,325 | ||||||
| Eli Lilly & Co. | 8 | 4,433 | ||||||
| Exact Sciences Corp.(a) | 14 | 1,171 | ||||||
| Intuitive Surgical, Inc.(a) | 9 | 2,815 | ||||||
| Johnson & Johnson | 13 | 2,102 | ||||||
| Merck & Co., Inc. | 21 | 2,288 | ||||||
| PTC Therapeutics, Inc.(a) | 15 | 593 | ||||||
| Sarepta Therapeutics, Inc.(a) | 5 | 605 | ||||||
| Stryker Corp. | 6 | 1,701 | ||||||
| Thermo Fisher Scientific, Inc. | 3 | 1,671 | ||||||
| UnitedHealth Group, Inc. | 5 | 2,383 | ||||||
| 22,013 | ||||||||
| Industrials — 7.14% | ||||||||
| A.O. Smith Corp. | 23 | 1,668 | ||||||
| AeroVironment, Inc.(a) | 17 | 1,650 | ||||||
| Boeing Co. (The)(a) | 10 | 2,240 | ||||||
| Carrier Global Corp. | 6 | 345 | ||||||
| Cummins, Inc. | 8 | 1,840 | ||||||
| Deere & Co. | 4 | 1,644 | ||||||
| IDEX Corp. | 7 | 1,585 | ||||||
See accompanying notes which are an integral part of these financial statements.
22
| Fisher Investments Institutional Group Stock Fund For Retirement Plans |
| Schedule of Investments (continued) |
| August 31, 2023 |
| COMMON STOCKS — 98.73% - continued | Shares | Fair Value | ||||||
| United States — 70.25% - continued | ||||||||
| Industrials — 7.14% - continued | ||||||||
| Lennox International, Inc. | 7 | $ | 2,637 | |||||
| Otis Worldwide Corp. | 3 | 257 | ||||||
| Raytheon Technologies Corp. | 6 | 516 | ||||||
| Rockwell Automation, Inc. | 5 | 1,560 | ||||||
| 15,942 | ||||||||
| Materials — 0.96% | ||||||||
| Cleveland-Cliffs, Inc.(a) | 69 | 1,055 | ||||||
| Materion Corp. | 10 | 1,088 | ||||||
| 2,143 | ||||||||
| Technology — 19.53% | ||||||||
| Adobe, Inc.(a) | 5 | 2,796 | ||||||
| Advanced Micro Devices, Inc.(a) | 29 | 3,066 | ||||||
| Apple, Inc. | 55 | 10,333 | ||||||
| Autodesk, Inc.(a) | 6 | 1,332 | ||||||
| Intuit, Inc. | 2 | 1,084 | ||||||
| Microsoft Corp. | 27 | 8,849 | ||||||
| NVIDIA Corp. | 21 | 10,364 | ||||||
| Oracle Corp. | 22 | 2,648 | ||||||
| salesforce.com, Inc.(a) | 9 | 1,993 | ||||||
| ServiceNow, Inc.(a) | 2 | 1,178 | ||||||
| 43,643 | ||||||||
| Total United States | 156,944 | |||||||
| Total Common Stocks — (Cost $166,424) | 220,523 | |||||||
| MONEY MARKET FUNDS — 1.12% | ||||||||
| First American Government Obligations Fund, Class X, 5.25%(b) | 2,501 | 2,501 | ||||||
| Total Money Market Funds (Cost $2,501) | 2,501 | |||||||
| Total Investments — 99.85% (Cost $168,925) | 223,024 | |||||||
| Other Assets in Excess of Liabilities — 0.15% | 335 | |||||||
| NET ASSETS — 100.00% | $ | 223,359 | ||||||
| (a) | Non-income producing security. |
| (b) | Rate disclosed is the seven day effective yield as of August 31, 2023. |
ADR - American Depositary Receipt
GDR - Global Depositary Receipt
See accompanying notes which are an integral part of these financial statements.
23
| Fisher Investments Institutional Group ESG Stock Fund For Retirement Plans |
| Schedule of Investments |
| August 31, 2023 |
| COMMON STOCKS — 98.34% | Shares | Fair Value | ||||||
| Canada — 0.69% | ||||||||
| Materials — 0.69% | ||||||||
| Hudbay Minerals Inc. | 158 | $ | 786 | |||||
| Lundin Mining Corp. | 100 | 775 | ||||||
| 1,561 | ||||||||
| Total Canada | 1,561 | |||||||
| China — 0.85% | ||||||||
| Communications — 0.35% | ||||||||
| Tencent Holdings Ltd. - ADR | 19 | 787 | ||||||
| Consumer Discretionary — 0.25% | ||||||||
| Alibaba Group Holding Ltd. - ADR(a) | 6 | 557 | ||||||
| Health Care — 0.25% | ||||||||
| Sino Biopharmaceutical Ltd. - ADR | 76 | 556 | ||||||
| Total China | 1,900 | |||||||
| Denmark — 0.87% | ||||||||
| Industrials — 0.87% | ||||||||
| Vestas Wind Systems A/S(a) | 85 | 1,966 | ||||||
| Total Denmark | 1,966 | |||||||
| France — 3.12% | ||||||||
| Consumer Discretionary — 0.78% | ||||||||
| Kering SA - ADR | 33 | 1,769 | ||||||
| Financials — 1.06% | ||||||||
| BNP Paribas SA | 37 | 2,397 | ||||||
| Health Care — 0.52% | ||||||||
| Sanofi | 11 | 1,177 | ||||||
| Technology — 0.76% | ||||||||
| Dassault Systems SE | 43 | 1,708 | ||||||
| Total France | 7,051 | |||||||
| Germany — 3.72% | ||||||||
| Consumer Discretionary — 2.69% | ||||||||
| adidas AG | 13 | 2,600 | ||||||
| Mercedes-Benz Group AG | 39 | 2,857 | ||||||
| Sixt SE | 6 | 641 | ||||||
| 6,098 | ||||||||
| Industrials — 1.03% | ||||||||
| Siemens AG | 15 | 2,260 | ||||||
| Siemens Energy AG(a) | 4 | 57 | ||||||
| 2,317 | ||||||||
| Total Germany | 8,415 | |||||||
See accompanying notes which are an integral part of these financial statements.
24
| Fisher Investments Institutional Group ESG Stock Fund For Retirement Plans |
| Schedule of Investments (continued) |
| August 31, 2023 |
| COMMON STOCKS — 98.34% - continued | Shares | Fair Value | ||||||
| India — 0.36% | ||||||||
| Technology — 0.36% | ||||||||
| Infosys Ltd. - ADR | 47 | $ | 816 | |||||
| Total India | 816 | |||||||
| Italy — 1.71% | ||||||||
| Energy — 0.84% | ||||||||
| Eni SpA | 123 | 1,906 | ||||||
| Financials — 0.87% | ||||||||
| Intesa Sanpaolo SpA | 730 | 1,958 | ||||||
| Total Italy | 3,864 | |||||||
| Japan — 1.78% | ||||||||
| Industrials — 1.78% | ||||||||
| Daifuku Co. Ltd. - ADR | 64 | 588 | ||||||
| FANUC Corp. - ADR | 92 | 1,305 | ||||||
| Yaskawa Electric Corp. - ADR | 27 | 2,115 | ||||||
| 4,008 | ||||||||
| Total Japan | 4,008 | |||||||
| Korea (Republic of) — 1.54% | ||||||||
| Financials — 0.42% | ||||||||
| KB Financial Group, Inc. | 23 | 939 | ||||||
| Technology — 1.12% | ||||||||
| Samsung Electronics Co. Ltd. - GDR | 2 | 2,526 | ||||||
| Total Korea (Republic of) | 3,465 | |||||||
| Netherlands — 2.33% | ||||||||
| Technology — 2.33% | ||||||||
| ASML Holding NV | 8 | 5,276 | ||||||
| Total Netherlands | 5,276 | |||||||
| Norway — 1.08% | ||||||||
| Energy — 1.08% | ||||||||
| Equinor ASA | 79 | 2,439 | ||||||
| Total Norway | 2,439 | |||||||
| Spain — 1.72% | ||||||||
| Financials — 1.72% | ||||||||
| Banco Bilbao Vizcaya Argentaria SA | 266 | 2,097 | ||||||
| Banco Santander SA | 457 | 1,786 | ||||||
| 3,883 | ||||||||
| Total Spain | 3,883 | |||||||
| Switzerland — 0.69% | ||||||||
| Industrials — 0.69% | ||||||||
| ABB Ltd. | 41 | 1,564 | ||||||
| Total Switzerland | 1,564 | |||||||
See accompanying notes which are an integral part of these financial statements.
25
| Fisher Investments Institutional Group ESG Stock Fund For Retirement Plans |
| Schedule of Investments (continued) |
| August 31, 2023 |
| COMMON STOCKS — 98.34% - continued | Shares | Fair Value | ||||||
| Taiwan Province of China — 2.77% | ||||||||
| Technology — 2.77% | ||||||||
| Taiwan Semiconductor Manufacturing Co. Ltd. - ADR | 67 | $ | 6,269 | |||||
| Total Taiwan Province of China | 6,269 | |||||||
| United Kingdom — 5.10% | ||||||||
| Consumer Staples — 0.59% | ||||||||
| Unilever PLC | 26 | 1,332 | ||||||
| Energy — 2.41% | ||||||||
| BP PLC | 479 | 2,959 | ||||||
| Shell PLC | 81 | 2,474 | ||||||
| 5,433 | ||||||||
| Health Care — 0.60% | ||||||||
| AstraZeneca PLC | 10 | 1,351 | ||||||
| Materials — 1.50% | ||||||||
| Anglo American PLC | 55 | 1,463 | ||||||
| Antofagasta PLC | 105 | 1,927 | ||||||
| 3,390 | ||||||||
| Total United Kingdom | 11,506 | |||||||
| United States — 70.01% | ||||||||
| Communications — 3.94% | ||||||||
| Alphabet, Inc., Class A(a) | 49 | 6,672 | ||||||
| Netflix, Inc.(a) | 4 | 1,735 | ||||||
| Walt Disney Co. (The)(a) | 6 | 502 | ||||||
| 8,909 | ||||||||
| Consumer Discretionary — 7.82% | ||||||||
| Amazon.com, Inc.(a) | 39 | 5,383 | ||||||
| Autoliv, Inc. | 21 | 2,050 | ||||||
| Capri Holdings Ltd.(a) | 36 | 1,890 | ||||||
| General Motors Co. | 58 | 1,944 | ||||||
| Home Depot, Inc. (The) | 8 | 2,643 | ||||||
| NIKE, Inc., Class B | 8 | 814 | ||||||
| Toll Brothers, Inc. | 36 | 2,949 | ||||||
| 17,673 | ||||||||
| Consumer Staples — 4.20% | ||||||||
| Costco Wholesale Corp. | 5 | 2,746 | ||||||
| PepsiCo, Inc. | 16 | 2,847 | ||||||
| Procter & Gamble Co. (The) | 20 | 3,087 | ||||||
| Walmart, Inc. | 5 | 813 | ||||||
| 9,493 | ||||||||
| Energy — 1.04% | ||||||||
| Schlumberger Ltd. | 40 | 2,358 | ||||||
| Financials — 12.37% | ||||||||
| American Express Co. | 14 | 2,212 | ||||||
| Bank of America Corp. | 68 | 1,950 | ||||||
| BlackRock, Inc. | 4 | 2,802 | ||||||
See accompanying notes which are an integral part of these financial statements.
26
| Fisher Investments Institutional Group ESG Stock Fund For Retirement Plans |
| Schedule of Investments (continued) |
| August 31, 2023 |
| COMMON STOCKS — 98.34% - continued | Shares | Fair Value | ||||||
| United States — 70.01% - continued | ||||||||
| Financials — 12.37% - continued | ||||||||
| Citigroup, Inc. | 61 | $ | 2,518 | |||||
| Goldman Sachs Group, Inc. (The) | 5 | 1,639 | ||||||
| Invesco Ltd. | 124 | 1,974 | ||||||
| Jefferies Financial Group, Inc. | 20 | 714 | ||||||
| JPMorgan Chase & Co. | 14 | 2,049 | ||||||
| MasterCard, Inc., Class A | 7 | 2,888 | ||||||
| Morgan Stanley | 26 | 2,213 | ||||||
| Paycom Software, Inc. | 6 | 1,769 | ||||||
| T. Rowe Price Group, Inc. | 14 | 1,571 | ||||||
| Visa, Inc., Class A | 15 | 3,686 | ||||||
| 27,985 | ||||||||
| Health Care — 12.48% | ||||||||
| Abbott Laboratories | 9 | 926 | ||||||
| Danaher Corp. | 5 | 1,325 | ||||||
| Eli Lilly & Co. | 13 | 7,204 | ||||||
| Exact Sciences Corp.(a) | 17 | 1,422 | ||||||
| Intuitive Surgical, Inc.(a) | 9 | 2,815 | ||||||
| Johnson & Johnson | 16 | 2,587 | ||||||
| Merck & Co., Inc. | 25 | 2,725 | ||||||
| PTC Therapeutics, Inc.(a) | 14 | 553 | ||||||
| Sarepta Therapeutics, Inc.(a) | 5 | 605 | ||||||
| Stryker Corp. | 6 | 1,701 | ||||||
| Thermo Fisher Scientific, Inc. | 4 | 2,228 | ||||||
| UnitedHealth Group, Inc. | 5 | 2,383 | ||||||
| Vertex Pharmaceuticals, Inc.(a) | 5 | 1,742 | ||||||
| 28,216 | ||||||||
| Industrials — 8.40% | ||||||||
| A.O. Smith Corp. | 29 | 2,103 | ||||||
| Cummins, Inc. | 10 | 2,300 | ||||||
| Deere & Co. | 5 | 2,055 | ||||||
| HEICO Corp. | 15 | 2,531 | ||||||
| Lennox International, Inc. | 9 | 3,391 | ||||||
| Rockwell Automation, Inc. | 9 | 2,809 | ||||||
| Union Pacific Corp. | 7 | 1,544 | ||||||
| Xylem, Inc. | 22 | 2,278 | ||||||
| 19,011 | ||||||||
| Technology — 19.76% | ||||||||
| Adobe, Inc.(a) | 5 | 2,797 | ||||||
| Advanced Micro Devices, Inc.(a) | 31 | 3,277 | ||||||
| Apple, Inc. | 53 | 9,957 | ||||||
| Autodesk, Inc.(a) | 7 | 1,554 | ||||||
| Intuit, Inc. | 2 | 1,084 | ||||||
| Microsoft Corp. | 28 | 9,176 | ||||||
| NVIDIA Corp. | 23 | 11,353 | ||||||
| Oracle Corp. | 21 | 2,528 | ||||||
| salesforce.com, Inc.(a) | 8 | 1,772 | ||||||
See accompanying notes which are an integral part of these financial statements.
27
| Fisher Investments Institutional Group ESG Stock Fund For Retirement Plans |
| Schedule of Investments (continued) |
| August 31, 2023 |
| COMMON STOCKS — 98.34% - continued | Shares | Fair Value | ||||||
| United States — 70.01% - continued | ||||||||
| Technology — 19.76% - continued | ||||||||
| ServiceNow, Inc.(a) | 2 | $ | 1,178 | |||||
| 44,676 | ||||||||
| Total United States | 158,321 | |||||||
| Total Common Stocks — (Cost $166,097) | 222,304 | |||||||
| PREFERRED STOCKS — 0.69% | Shares | Fair Value | ||||||
| Australia — 0.69% | ||||||||
| Materials — 0.69% | ||||||||
| Fortescue Metals Group Ltd. | 113 | 1,569 | ||||||
| Total Australia | 1,569 | |||||||
| Total Preferred Stocks — (Cost $1,554) | 1,569 | |||||||
| MONEY MARKET FUNDS — 0.81% | ||||||||
| First American Government Obligations Fund, Class X, 5.25%(b) | 1,830 | 1,830 | ||||||
| Total Money Market Funds (Cost $1,830) | 1,830 | |||||||
| Total Investments — 99.84% (Cost $169,481) | 225,703 | |||||||
| Other Assets in Excess of Liabilities — 0.16% | 360 | |||||||
| NET ASSETS — 100.00% | $ | 226,063 | ||||||
| (a) | Non-income producing security. |
| (b) | Rate disclosed is the seven day effective yield as of August 31, 2023. |
ADR - American Depositary Receipt
GDR - Global Depositary Receipt
See accompanying notes which are an integral part of these financial statements.
28
| Fisher Investments Institutional Group Fixed Income Fund For Retirement Plans |
| Schedule of Investments |
| August 31, 2023 |
| Principal | ||||||||
| CORPORATE BONDS — 29.66% | Amount | Fair Value | ||||||
| Communications — 3.36% | ||||||||
| Comcast Corp., 3.55%, 5/1/2028 | $ | 100,000 | $ | 94,443 | ||||
| Consumer Staples — 3.79% | ||||||||
| Procter & Gamble Co. (The), 5.50%, 2/1/2034 | 100,000 | 106,481 | ||||||
| Financials — 6.71% | ||||||||
| BlackRock, Inc., 3.25%, 4/30/2029 | 100,000 | 92,492 | ||||||
| JPMorgan Chase & Co., 4.13%, 12/15/2026 | 100,000 | 96,320 | ||||||
| 188,812 | ||||||||
| Health Care — 2.46% | ||||||||
| Bristol-Myers Squibb Co., 4.55%, 2/20/2048 | 78,000 | 69,215 | ||||||
| Industrials — 2.78% | ||||||||
| Southwest Airlines Co., 7.38%, 3/1/2027 | 75,000 | 78,203 | ||||||
| Real Estate — 4.32% | ||||||||
| Omega Healthcare Investors, Inc., 3.38%, 2/1/2031 | 150,000 | 121,389 | ||||||
| Technology — 6.24% | ||||||||
| International Business Machines Corp., 4.25%, 5/15/2049 | 100,000 | 82,701 | ||||||
| Oracle Corp., 3.25%, 11/15/2027 | 100,000 | 92,701 | ||||||
| 175,402 | ||||||||
| Total Corporate Bonds (Cost $969,023) | 833,945 | |||||||
| U.S. GOVERNMENT & AGENCIES — 34.61% | ||||||||
| United States Treasury Note, 1.50%, 9/30/2024 | 109,700 | 105,322 | ||||||
| United States Treasury Note, 1.50%, 2/15/2025 | 254,000 | 241,191 | ||||||
| United States Treasury Note, 2.63%, 2/15/2029 | 301,100 | 277,271 | ||||||
| United States Treasury Note, 4.50%, 2/15/2036 | 334,000 | 349,551 | ||||||
| Total U.S. Government & Agencies (Cost $1,109,455) | 973,335 | |||||||
| EXCHANGE-TRADED FUNDS — 31.90% | Shares | Fair Value | ||||||
| iShares Broad USD High Yield Corporate Bond ETF | 11,815 | 418,842 | ||||||
| iShares MBS ETF | 5,201 | 477,972 | ||||||
| Total Exchange-Traded Funds (Cost $986,642) | 896,814 | |||||||
| MONEY MARKET FUNDS — 3.42% | ||||||||
| First American Government Obligations Fund, Class X, 5.25%(a) | 96,178 | 96,178 | ||||||
| Total Money Market Funds (Cost $96,178) | 96,178 | |||||||
| Total Investments — 99.59% (Cost $3,161,298) | 2,800,272 | |||||||
| Other Assets in Excess of Liabilities — 0.41% | 11,482 | |||||||
| NET ASSETS — 100.00% | $ | 2,811,754 | ||||||
| (a) | Rate disclosed is the seven day effective yield as of August 31, 2023. |
See accompanying notes which are an integral part of these financial statements.
29
| Fisher Investments Institutional Group ESG Fixed Income Fund for Retirement Plans |
| Schedule of Investments |
| August 31, 2023 |
| Principal | ||||||||
| CORPORATE BONDS — 29.14% | Amount | Fair Value | ||||||
| Communications — 3.38% | ||||||||
| Comcast Corp., 3.55%, 5/1/2028 | $ | 100,000 | $ | 94,443 | ||||
| Consumer Staples — 3.81% | ||||||||
| Procter & Gamble Co. (The), 5.50%, 2/1/2034 | 100,000 | 106,481 | ||||||
| Financials — 6.77% | ||||||||
| BlackRock, Inc., 3.25%, 4/30/2029 | 100,000 | 92,492 | ||||||
| JPMorgan Chase & Co., 4.13%, 12/15/2026 | 100,000 | 96,320 | ||||||
| 188,812 | ||||||||
| Health Care — 2.48% | ||||||||
| Bristol-Myers Squibb Co., 4.55%, 2/20/2048 | 78,000 | 69,215 | ||||||
| Industrials — 2.80% | ||||||||
| Southwest Airlines Co., 7.38%, 3/1/2027 | 75,000 | 78,203 | ||||||
| Real Estate — 3.62% | ||||||||
| Omega Healthcare Investors, Inc., 3.38%, 2/1/2031 | 125,000 | 101,158 | ||||||
| Technology — 6.28% | ||||||||
| International Business Machines Corp., 4.25%, 5/15/2049 | 100,000 | 82,701 | ||||||
| Oracle Corp., 3.25%, 11/15/2027 | 100,000 | 92,701 | ||||||
| 175,402 | ||||||||
| Total Corporate Bonds (Cost $948,591) | 813,714 | |||||||
| U.S. GOVERNMENT & AGENCIES — 36.37% | ||||||||
| United States Treasury Note, 1.50%, 9/30/2024 | 109,900 | 105,514 | ||||||
| United States Treasury Note, 1.50%, 2/15/2025 | 311,000 | 295,316 | ||||||
| United States Treasury Note, 2.63%, 2/15/2029 | 286,700 | 264,010 | ||||||
| United States Treasury Note, 4.50%, 2/15/2036 | 335,000 | 350,599 | ||||||
| Total U.S. Government & Agencies (Cost $1,149,653) | 1,015,439 | |||||||
| EXCHANGE-TRADED FUNDS — 32.38% | Shares | Fair Value | ||||||
| iShares MBS ETF | 5,156 | 473,837 | ||||||
| Nuveen ESG High Yield Corporate Bond ETF | 20,911 | 430,369 | ||||||
| Total Exchange-Traded Funds (Cost $1,006,044) | 904,206 | |||||||
| MONEY MARKET FUNDS — 1.70% | ||||||||
| First American Government Obligations Fund, Class X, 5.25%(a) | 47,526 | 47,526 | ||||||
| Total Money Market Funds (Cost $47,526) | 47,526 | |||||||
| Total Investments — 99.59% (Cost $3,151,814) | 2,780,885 | |||||||
| Other Assets in Excess of Liabilities — 0.41% | 11,357 | |||||||
| NET ASSETS — 100.00% | $ | 2,792,242 | ||||||
| (a) | Rate disclosed is the seven day effective yield as of August 31, 2023. |
See accompanying notes which are an integral part of these financial statements.
30
| Fisher Investments Institutional Group Fund Family |
| Statements of Assets and Liabilities |
| August 31, 2023 |
| Fisher Investments Institutional Group | ||||||||||||||||
| ESG Fixed | ||||||||||||||||
| Stock | ESG Stock | Fixed Income | Income | |||||||||||||
| Fund for | Fund for | Fund for | Fund for | |||||||||||||
| Retirement | Retirement | Retirement | Retirement | |||||||||||||
| Plans | Plans | Plans | Plans | |||||||||||||
| Assets | ||||||||||||||||
| Investments in securities at value (cost $168,925, $169,481, $3,161,298 and $3,151,814, respectively) | $ | 223,024 | $ | 225,703 | $ | 2,800,272 | $ | 2,780,885 | ||||||||
| Foreign currencies, at value (cost $-, $12, $- and $-, respectively) | — | 12 | — | — | ||||||||||||
| Dividends and interest receivable | 335 | 348 | 11,482 | 11,357 | ||||||||||||
| Total Assets | 223,359 | 226,063 | 2,811,754 | 2,792,242 | ||||||||||||
| Net Assets | $ | 223,359 | $ | 226,063 | $ | 2,811,754 | $ | 2,792,242 | ||||||||
| Net Assets consist of: | ||||||||||||||||
| Paid-in capital | $ | 158,148 | $ | 157,696 | $ | 3,224,384 | $ | 3,222,897 | ||||||||
| Accumulated earnings (deficits) | 65,211 | 68,367 | (412,630 | ) | (430,655 | ) | ||||||||||
| Net Assets | $ | 223,359 | $ | 226,063 | $ | 2,811,754 | $ | 2,792,242 | ||||||||
| Shares outstanding (unlimited number of shares authorized, no par value) | 15,645 | 15,610 | 323,178 | 323,110 | ||||||||||||
| Net asset value (“NAV”) and offering price per share | $ | 14.28 | $ | 14.48 | $ | 8.70 | $ | 8.64 | ||||||||
See accompanying notes which are an integral part of these financial statements.
31
| Fisher Investments Institutional Group Fund Family |
| Statements of Operations |
| For the year ended August 31, 2023 |
| Fisher Investments Institutional Group | ||||||||||||||||
| ESG Fixed | ||||||||||||||||
| Stock | ESG Stock | Fixed Income | Income | |||||||||||||
| Fund for | Fund for | Fund for | Fund for | |||||||||||||
| Retirement | Retirement | Retirement | Retirement | |||||||||||||
| Plans | Plans | Plans | Plans | |||||||||||||
| Investment Income | ||||||||||||||||
| Dividend income | $ | 3,415 | $ | 3,384 | $ | 40,979 | $ | 41,333 | ||||||||
| Interest income | — | — | 50,812 | 50,112 | ||||||||||||
| Foreign dividend taxes withheld | (376 | ) | (313 | ) | — | — | ||||||||||
| Total investment income | 3,039 | 3,071 | 91,791 | 91,445 | ||||||||||||
| Net investment income | 3,039 | 3,071 | 91,791 | 91,445 | ||||||||||||
| Net Realized and Change in Unrealized Gain (Loss) on Investments | ||||||||||||||||
| Net realized gain (loss) on investment securities transactions | 10,898 | 12,074 | (94,286 | ) | (95,211 | ) | ||||||||||
| Net realized gain (loss) on foreign currency translations | (5 | ) | 8 | — | — | |||||||||||
| Net change in unrealized appreciation (depreciation) of investment securities and foreign currency translations | 31,766 | 33,469 | (13,808 | ) | (15,731 | ) | ||||||||||
| Net realized and change in unrealized gain (loss) on investments and foreign currency | 42,659 | 45,551 | (108,094 | ) | (110,942 | ) | ||||||||||
| Net increase (decrease) in net assets resulting from operations | $ | 45,698 | $ | 48,622 | $ | (16,303 | ) | $ | (19,497 | ) | ||||||
See accompanying notes which are an integral part of these financial statements.
32
| Fisher Investments Institutional Group Fund Family |
| Statements of Changes in Net Assets |
| Fisher Investments | Fisher Investments | |||||||||||||||
| Institutional Group Stock | Institutional Group ESG Stock | |||||||||||||||
| Fund for Retirement Plans | Fund for Retirement Plans | |||||||||||||||
| For the Year | For the Year | For the Year | For the Year | |||||||||||||
| Ended August | Ended August | Ended August | Ended August | |||||||||||||
| 31, 2023 | 31, 2022 | 31, 2023 | 31, 2022 | |||||||||||||
| Increase (Decrease) in Net Assets due to: | ||||||||||||||||
| Operations | ||||||||||||||||
| Net investment income | $ | 3,039 | $ | 2,846 | $ | 3,071 | $ | 2,846 | ||||||||
| Net realized gain (loss) on investment securities transactions and foreign currency translations | 10,893 | (837 | ) | 12,082 | (715 | ) | ||||||||||
| Net change in unrealized appreciation (depreciation) of investment securities and foreign currency translations | 31,766 | (53,752 | ) | 33,469 | (52,521 | ) | ||||||||||
| Net increase (decrease) in net assets resulting from operations | 45,698 | (51,743 | ) | 48,622 | (50,390 | ) | ||||||||||
| Distributions From: | ||||||||||||||||
| Earnings | (3,263 | ) | (2,617 | ) | (2,881 | ) | (2,359 | ) | ||||||||
| Total distributions | (3,263 | ) | (2,617 | ) | (2,881 | ) | (2,359 | ) | ||||||||
| Capital Transactions | ||||||||||||||||
| Reinvestment of distributions | 3,263 | 2,617 | 2,881 | 2,359 | ||||||||||||
| Amount paid for shares redeemed | — | (14 | ) | — | (13 | ) | ||||||||||
| Net increase in net assets resulting from capital transactions | 3,263 | 2,603 | 2,881 | 2,346 | ||||||||||||
| Total Increase (Decrease) in Net Assets | 45,698 | (51,757 | ) | 48,622 | (50,403 | ) | ||||||||||
| Net Assets | ||||||||||||||||
| Beginning of year | 177,661 | 229,418 | 177,441 | 227,844 | ||||||||||||
| End of year | $ | 223,359 | $ | 177,661 | $ | 226,063 | $ | 177,441 | ||||||||
| Share Transactions | ||||||||||||||||
| Shares issued in reinvestment of distributions | 290 | 174 | 255 | 157 | ||||||||||||
| Shares redeemed | — | (1 | ) | — | (1 | ) | ||||||||||
| Net increase in shares outstanding | 290 | 173 | 255 | 156 | ||||||||||||
See accompanying notes which are an integral part of these financial statements.
33
| Fisher Investments Institutional Group Fund Family |
| Statements of Changes in Net Assets (continued) |
| Fisher Investments | Fisher Investments | |||||||||||||||
| Institutional Group Fixed | Institutional Group ESG Fixed | |||||||||||||||
| Income Fund for Retirement | Income Fund for Retirement | |||||||||||||||
| Plans | Plans | |||||||||||||||
| For the Year | For the Year | For the Year | For the Year | |||||||||||||
| Ended August | Ended August | Ended August | Ended August | |||||||||||||
| 31, 2023 | 31, 2022 | 31, 2023 | 31, 2022 | |||||||||||||
| Increase (Decrease) in Net Assets due to: | ||||||||||||||||
| Operations | ||||||||||||||||
| Net investment income | $ | 91,791 | $ | 57,359 | $ | 91,445 | $ | 57,021 | ||||||||
| Net realized loss on investment securities transactions and foreign currency translations | (94,286 | ) | (22,424 | ) | (95,211 | ) | (20,538 | ) | ||||||||
| Net change in unrealized depreciation of investment securities and foreign currency translations | (13,808 | ) | (442,415 | ) | (15,731 | ) | (451,545 | ) | ||||||||
| Net decrease in net assets resulting from operations | (16,303 | ) | (407,480 | ) | (19,497 | ) | (415,062 | ) | ||||||||
| Distributions From: | ||||||||||||||||
| Earnings | (67,327 | ) | (56,411 | ) | (68,072 | ) | (53,329 | ) | ||||||||
| Total distributions | (67,327 | ) | (56,411 | ) | (68,072 | ) | (53,329 | ) | ||||||||
| Capital Transactions | ||||||||||||||||
| Reinvestment of distributions | 67,327 | 56,411 | 68,072 | 53,329 | ||||||||||||
| Amount paid for shares redeemed | — | (9 | ) | — | (9 | ) | ||||||||||
| Net increase in net assets resulting from capital transactions | 67,327 | 56,402 | 68,072 | 53,320 | ||||||||||||
| Total Decrease in Net Assets | (16,303 | ) | (407,489 | ) | (19,497 | ) | (415,071 | ) | ||||||||
| Net Assets | ||||||||||||||||
| Beginning of year | 2,828,057 | 3,235,546 | 2,811,739 | 3,226,810 | ||||||||||||
| End of year | $ | 2,811,754 | $ | 2,828,057 | $ | 2,792,242 | $ | 2,811,739 | ||||||||
| Share Transactions | ||||||||||||||||
| Shares issued in reinvestment of distributions | 7,828 | 5,569 | 7,962 | 5,275 | ||||||||||||
| Shares redeemed | — | (1 | ) | — | (1 | ) | ||||||||||
| Net increase in shares outstanding | 7,828 | 5,568 | 7,962 | 5,274 | ||||||||||||
See accompanying notes which are an integral part of these financial statements.
34
| Fisher Investments Institutional Group Stock Fund for Retirement Plans |
| Financial Highlights |
| (For a share outstanding during each period) |
| For the | ||||||||||||||||
| For the | For the | For the | Period | |||||||||||||
| Year Ended | Year Ended | Year Ended | Ended | |||||||||||||
| August 31, | August 31, | August 31, | August 31, | |||||||||||||
| 2023 | 2022 | 2021 | 2020(a) | |||||||||||||
| Selected Per Share Data: | ||||||||||||||||
| Net asset value, beginning of period | $ | 11.57 | $ | 15.11 | $ | 11.58 | $ | 10.00 | ||||||||
| Investment operations: | ||||||||||||||||
| Net investment income | 0.19 | 0.18 | 0.17 | 0.10 | ||||||||||||
| Net realized and unrealized gain (loss) | 2.73 | (3.55 | ) | 3.51 | 1.48 | |||||||||||
| Total from investment operations | 2.92 | (3.37 | ) | 3.68 | 1.58 | |||||||||||
| Less distributions to shareholders from: | ||||||||||||||||
| Net investment income | (0.18 | ) | (0.17 | ) | (0.15 | ) | — | |||||||||
| Net realized gains | (0.03 | ) | — | — | — | |||||||||||
| Total distributions | (0.21 | ) | (0.17 | ) | (0.15 | ) | — | |||||||||
| Net asset value, end of period | $ | 14.28 | $ | 11.57 | $ | 15.11 | $ | 11.58 | ||||||||
| Total Return(b) | 25.75 | % | (22.55 | )% | 32.06 | % | 15.80 | % (c) | ||||||||
| Ratios and Supplemental Data: | ||||||||||||||||
| Net assets, end of period (000 omitted) | $ | 223 | $ | 178 | $ | 229 | $ | 174 | ||||||||
| Ratio of net investment income to average net assets | 1.56 | % | 1.37 | % | 1.27 | % | 1.44 | % (d) | ||||||||
| Portfolio turnover rate | 25 | % | 11 | % | 1 | % | 12 | % (c) | ||||||||
| (a) | For the period December 13, 2019 (commencement of operations) to August 31, 2020. |
| (b) | Total return represents the rate that the investor would have earned or lost on an investment in the Fund, assuming reinvestment of distributions. |
| (c) | Not annualized. |
| (d) | Annualized. |
See accompanying notes which are an integral part of these financial statements.
35
| Fisher Investments Institutional Group ESG Stock Fund for Retirement Plans |
| Financial Highlights |
| (For a share outstanding during each period) |
| For the | ||||||||||||||||
| For the | For the | For the | Period | |||||||||||||
| Year Ended | Year Ended | Year Ended | Ended | |||||||||||||
| August 31, | August 31, | August 31, | August 31, | |||||||||||||
| 2023 | 2022 | 2021 | 2020(a) | |||||||||||||
| Selected Per Share Data: | ||||||||||||||||
| Net asset value, beginning of period | $ | 11.56 | $ | 14.98 | $ | 11.58 | $ | 10.00 | ||||||||
| Investment operations: | ||||||||||||||||
| Net investment income | 0.20 | 0.19 | 0.16 | 0.12 | ||||||||||||
| Net realized and unrealized gain (loss) | 2.91 | (3.45 | ) | 3.40 | 1.46 | |||||||||||
| Total from investment operations | 3.11 | (3.26 | ) | 3.56 | 1.58 | |||||||||||
| Less distributions to shareholders from: | ||||||||||||||||
| Net investment income | (0.19 | ) | (0.16 | ) | (0.16 | ) | — | |||||||||
| Total distributions | (0.19 | ) | (0.16 | ) | (0.16 | ) | — | |||||||||
| Net asset value, end of period | $ | 14.48 | $ | 11.56 | $ | 14.98 | $ | 11.58 | ||||||||
| Total Return(b) | 27.34 | % | (22.03 | )% | 31.07 | % | 15.80 | % (c) | ||||||||
| Ratios and Supplemental Data: | ||||||||||||||||
| Net assets, end of period (000 omitted) | $ | 226 | $ | 177 | $ | 228 | $ | 174 | ||||||||
| Ratio of net investment income to average net assets | 1.56 | % | 1.37 | % | 1.23 | % | 1.64 | % (d) | ||||||||
| Portfolio turnover rate | 30 | % | 10 | % | 1 | % | 15 | % (c) | ||||||||
| (a) | For the period December 13, 2019 (commencement of operations) to August 31, 2020. |
| (b) | Total return represents the rate that the investor would have earned or lost on an investment in the Fund, assuming reinvestment of distributions. |
| (c) | Not annualized. |
| (d) | Annualized. |
See accompanying notes which are an integral part of these financial statements.
36
| Fisher Investments Institutional Group Fixed Income Fund for Retirement Plans |
| Financial Highlights |
| (For a share outstanding during each period) |
| For the | ||||||||||||||||
| For the | For the | For the | Period | |||||||||||||
| Year Ended | Year Ended | Year Ended | Ended | |||||||||||||
| August 31, | August 31, | August 31, | August 31, | |||||||||||||
| 2023 | 2022 | 2021 | 2020(a) | |||||||||||||
| Selected Per Share Data: | ||||||||||||||||
| Net asset value, beginning of period | $ | 8.97 | $ | 10.44 | $ | 10.53 | $ | 10.00 | ||||||||
| Investment operations: | ||||||||||||||||
| Net investment income | 0.28 | 0.18 | 0.21 | 0.18 | ||||||||||||
| Net realized and unrealized gain (loss) | (0.34 | ) | (1.47 | ) | 0.04 | 0.35 | ||||||||||
| Total from investment operations | (0.06 | ) | (1.29 | ) | 0.25 | 0.53 | ||||||||||
| Less distributions to shareholders from: | ||||||||||||||||
| Net investment income | (0.21 | ) | (0.18 | ) | (0.27 | ) | — | |||||||||
| Net realized gains | — | — | (b) | (0.07 | ) | — | ||||||||||
| Total distributions | (0.21 | ) | (0.18 | ) | (0.34 | ) | — | |||||||||
| Net asset value, end of period | $ | 8.70 | $ | 8.97 | $ | 10.44 | $ | 10.53 | ||||||||
| Total Return(c) | (0.60 | )% | (12.54 | )% | 2.38 | % | 5.30 | % (d) | ||||||||
| Ratios and Supplemental Data: | ||||||||||||||||
| Net assets, end of period (000 omitted) | $ | 2,812 | $ | 2,828 | $ | 3,236 | $ | 3,160 | ||||||||
| Ratio of net investment income to average net assets | 3.30 | % | 1.89 | % | 2.00 | % | 2.51 | % (e) | ||||||||
| Portfolio turnover rate | 14 | % | 32 | % | 46 | % | 0 | % (d) | ||||||||
| (a) | For the period December 13, 2019 (commencement of operations) to August 31, 2020. |
| (b) | Rounds to less than $0.005 per share. |
| (c) | Total return represents the rate that the investor would have earned or lost on an investment in the Fund, assuming reinvestment of distributions. |
| (d) | Not annualized. |
| (e) | Annualized. |
See accompanying notes which are an integral part of these financial statements.
37
| Fisher Investments Institutional Group ESG Fixed Income Fund for Retirement Plans |
| Financial Highlights |
| (For a share outstanding during each period) |
| For the | ||||||||||||||||
| For the | For the | For the | Period | |||||||||||||
| Year Ended | Year Ended | Year Ended | Ended | |||||||||||||
| August 31, | August 31, | August 31, | August 31, | |||||||||||||
| 2023 | 2022 | 2021 | 2020(a) | |||||||||||||
| Selected Per Share Data: | ||||||||||||||||
| Net asset value, beginning of period | $ | 8.92 | $ | 10.41 | $ | 10.54 | $ | 10.00 | ||||||||
| Investment operations: | ||||||||||||||||
| Net investment income | 0.29 | 0.18 | 0.21 | 0.18 | ||||||||||||
| Net realized and unrealized gain (loss) | (0.35 | ) | (1.50 | ) | — | (b) | 0.36 | |||||||||
| Total from investment operations | (0.06 | ) | (1.32 | ) | 0.21 | 0.54 | ||||||||||
| Less distributions to shareholders from: | ||||||||||||||||
| Net investment income | (0.22 | ) | (0.17 | ) | (0.27 | ) | — | |||||||||
| Net realized gains | — | — | (b) | (0.07 | ) | — | ||||||||||
| Total distributions | (0.22 | ) | (0.17 | ) | (0.34 | ) | — | |||||||||
| Net asset value, end of period | $ | 8.64 | $ | 8.92 | $ | 10.41 | $ | 10.54 | ||||||||
| Total Return(c) | (0.69 | )% | (12.85 | )% | 2.02 | % | 5.40 | % (d) | ||||||||
| Ratios and Supplemental Data: | ||||||||||||||||
| Net assets, end of period (000 omitted) | $ | 2,792 | $ | 2,812 | $ | 3,227 | $ | 3,162 | ||||||||
| Ratio of net investment income to average net assets | 3.31 | % | 1.88 | % | 1.99 | % | 2.46 | % (e) | ||||||||
| Portfolio turnover rate | 14 | % | 33 | % | 46 | % | 0 | % (d) | ||||||||
| (a) | For the period December 13, 2019 (commencement of operations) to August 31, 2020. |
| (b) | Rounds to less than $0.005 per share. |
| (c) | Total return represents the rate that the investor would have earned or lost on an investment in the Fund, assuming reinvestment of distributions. |
| (d) | Not annualized. |
| (e) | Annualized. |
See accompanying notes which are an integral part of these financial statements.
38
| Fisher Investments Institutional Group Fund Family |
| Notes to the Financial Statements |
| August 31, 2023 |
NOTE 1. ORGANIZATION
Fisher Investments Institutional Group Stock Fund for Retirement Plans (the “Stock Fund”), Fisher Investments Institutional Group ESG Stock Fund for Retirement Plans (the “ESG Stock Fund”), Fisher Investments Institutional Group Fixed Income Fund for Retirement Plans (the “Fixed Income Fund”) and the Fisher Investments Institutional Group ESG Fixed Income Fund for Retirement Plans (the “ESG Fixed Income Fund”) (each a “Fund” and collectively the “Funds”) were each registered under the Investment Company Act of 1940, as amended (the “1940 Act”), as a diversified series of Unified Series Trust (the “Trust”) on November 12, 2018. The Trust is an open-end investment company established under the laws of Ohio by an Agreement and Declaration of Trust dated October 14, 2002, as amended (the “Trust Agreement”). The Trust Agreement permits the Board of Trustees of the Trust (the “Board”) to issue an unlimited number of shares of beneficial interest of separate series without par value. Each Fund is one of a series of funds currently authorized by the Board. The Funds commenced operations on December 13, 2019. The investment adviser to the Funds is Fisher Asset Management, LLC, d/b/a Fisher Investments (the “Adviser”). The investment objective of the Stock Fund and ESG Stock Fund is to seek to outperform, net of fees and expenses, the return of the MSCI ACWI Investable Market Index. The investment objective of the Fixed Income Fund and ESG Fixed Income Fund is to seek to outperform, net of fees and expenses, the return of the ICE BofA U.S. Broad Market Index.
NOTE 2. SIGNIFICANT ACCOUNTING POLICIES
The Funds are investment companies and follow accounting and reporting guidance under Financial Accounting Standards Board Accounting Standards Codification (“ASC”) Topic 946, “Financial Services-Investment Companies”, including Accounting Standards Update 2013-08. The following is a summary of significant accounting policies followed by the Funds in the preparation of their financial statements. These policies are in conformity with generally accepted accounting principles in the United States of America (“GAAP”).
Regulatory update – Tailored Shareholder Reports for Mutual Funds and Exchange-Traded Funds (“ETFs”) – Effective January 24, 2023, the Securities and Exchange Commission (the “SEC”) adopted rule and form amendments to require mutual funds and ETFs to transmit concise and visually engaging streamlined annual and semiannual reports to shareholders that highlight key information. Other information, including financial statements, will no longer appear in a streamlined shareholder report but must be available online, delivered free of charge upon request, and filed on a semiannual basis on Form N-CSR. The rule and form amendments have a compliance date of July 24, 2024. At this time, management is evaluating the impact of these amendments on the shareholder reports for the Fund.
39
| Fisher Investments Institutional Group Fund Family |
| Notes to the Financial Statements (continued) |
| August 31, 2023 |
Estimates – The preparation of financial statements in conformity with GAAP requires management to make estimates and assumptions that affect the reported amounts of assets and liabilities and disclosure of contingent assets and liabilities at the date of the financial statements and the reported amounts of increases and decreases in net assets from operations during the reporting period. Actual results could differ from those estimates.
Foreign Currency Translation – The accounting records of the Funds are maintained in U.S. dollars. Foreign currency amounts are translated into U.S. dollars at the current rate of exchange each business day to determine the value of investments, and other assets and liabilities. Purchases and sales of foreign securities, and income and expenses, are translated at the prevailing rate of exchange on the respective date of these transactions. The Funds do not isolate that portion of the results of operations resulting from changes in foreign exchange rates on investments from fluctuations arising from changes in market prices of securities held. These fluctuations are included with the realized and unrealized gain or loss from investments. Net realized gain (loss) on foreign currency translations on the Statements of Operations represents currency gains (losses) realized between the trade and settlement dates on securities transactions, and the difference between the amount of investment income and foreign withholding taxes recorded on the Funds’ books and the U.S. dollar equivalent amounts actually received or paid. The net change in unrealized currency gains (losses) on foreign currency translations for the period is reflected in the Statements of Operations.
Federal Income Taxes – The Funds make no provision for federal income or excise tax. Each Fund has qualified and intends to qualify each year as a regulated investment company (“RIC”) under subchapter M of the Internal Revenue Code of 1986, as amended, by complying with the requirements applicable to RICs and by distributing substantially all of its taxable income. Each Fund also intends to distribute sufficient net investment income and net capital gains, if any, so that it will not be subject to excise tax on undistributed income and gains. If the required amount of net investment income or gains is not distributed, the Funds could incur a tax expense.
As of and during the fiscal year ended August 31, 2023, the Funds did not have any liabilities for any unrecognized tax benefits. The Funds recognize interest and penalties, if any, related to unrecognized tax benefits as income tax expense in the Statements of Operations when incurred. During the year, the Funds did not incur any interest or penalties. Management of the Funds has reviewed tax positions taken in tax years that remain subject to examination by all major tax jurisdictions, including federal (i.e., the previous three tax year ends and the interim tax period since then, as applicable) and has concluded that no provision for unrecognized tax benefits or expenses is required in these financial statements and does not expect this to change over the next twelve months.
40
| Fisher Investments Institutional Group Fund Family |
| Notes to the Financial Statements (continued) |
| August 31, 2023 |
Expenses – Expenses incurred by the Trust that do not relate to a specific Fund are allocated to the individual funds of the Trust based on each Fund’s relative net assets or another appropriate basis (as determined by the Board).
Security Transactions and Related Income – The Funds follow industry practice and record security transactions on the trade date for financial reporting purposes. The specific identification method is used for determining gains or losses for financial statement and income tax purposes. Dividend income is recorded on the ex-dividend date and interest income is recorded on an accrual basis.
Dividends and Distributions – Each Fund intends to distribute its net investment income and net realized long-term and short-term capital gains, if any, at least annually. Dividends and distributions to shareholders, which are determined in accordance with income tax regulations, are recorded on the ex-dividend date. The treatment for financial reporting purposes of distributions made to shareholders during the period from net investment income or net realized capital gains may differ from their ultimate treatment for federal income tax purposes. These differences are caused primarily by differences in the timing of the recognition of certain components of income, expense or realized capital gain for federal income tax purposes. Where such differences are permanent in nature, they are reclassified among the components of the net assets based on their ultimate characterization for federal income tax purposes. Any such reclassifications will have no effect on net assets, results of operations or net asset value (“NAV”) per share of the Funds.
NOTE 3. SECURITIES VALUATION AND FAIR VALUE MEASUREMENTS
Each Fund values its portfolio securities at fair value as of the close of regular trading on the New York Stock Exchange (“NYSE”) (normally 4:00 p.m. Eastern Time) on each business day the NYSE is open for business. Fair value is defined as the price that a Fund would receive upon selling an investment in a timely transaction to an independent buyer in the principal or most advantageous market of the investment. GAAP establishes a three-tier hierarchy to maximize the use of observable market data and minimize the use of unobservable inputs and to establish classification of fair value measurements for disclosure purposes.
Inputs refer broadly to the assumptions that market participants would use in pricing the asset or liability, including assumptions about risk (the risk inherent in a particular valuation technique used to measure fair value including a pricing model and/or the risk inherent in the inputs to the valuation technique). Inputs may be observable or unobservable. Observable inputs are inputs that reflect the assumptions market participants would use in pricing the asset or liability developed based on market data obtained and available from sources independent of the reporting entity. Unobservable inputs are inputs that reflect the
41
| Fisher Investments Institutional Group Fund Family |
| Notes to the Financial Statements (continued) |
| August 31, 2023 |
reporting entity’s own assumptions about the assumptions market participants would use in pricing the asset or liability developed based on the best information available in the circumstances.
Various inputs are used in determining the value of each Fund’s investments. These inputs are summarized in the three broad levels listed below.
| ● | Level 1 – unadjusted quoted prices in active markets for identical investments and/or registered investment companies where the value per share is determined and published and is the basis for current transactions for identical assets or liabilities at the valuation date |
| ● | Level 2 – other significant observable inputs (including, but not limited to, quoted prices for an identical security in an inactive market, quoted prices for similar securities, interest rates, prepayment speeds, credit risk, etc.) |
| ● | Level 3 – significant unobservable inputs (including the Funds’ own assumptions in determining fair value of investments based on the best information available) |
The inputs used to measure fair value may fall into different levels of the fair value hierarchy. In such cases, for disclosure purposes, the level in the fair value hierarchy which is reported is determined based on the lowest level input that is significant to the fair value measurement in its entirety.
Equity securities that are traded on any stock exchange are generally valued at the last quoted sale price on the security’s primary exchange. Lacking a last sale price, an exchange-traded security is generally valued at its last bid price. Securities traded in the Nasdaq over-the-counter market are generally valued at the Nasdaq Official Closing Price. When using market quotations and when the market is considered active, the security is classified as a Level 1 security. In the event that market quotations are not readily available or are considered unreliable due to market or other events, securities are valued in good faith by the Adviser, as Valuation Designee, under the oversight of the Board’s Pricing & Liquidity Committee. The Adviser has adopted written policies and procedures for valuing securities and other assets in circumstances where market quotes are not readily available in conformity with guidelines adopted by the Board. In the event that market quotes are not readily available, and the security or asset cannot be valued pursuant to one of the valuation methods, the value of the security or asset will be determined in good faith by the Valuation Designee pursuant to its policies and procedures. Any fair value provided by the Valuation Designee is subject to the ultimate review of the pricing methodology by the Pricing & Liquidity Committee of the Board on a quarterly basis. Under these policies,
42
| Fisher Investments Institutional Group Fund Family |
| Notes to the Financial Statements (continued) |
| August 31, 2023 |
the securities will be classified as Level 2 or 3 within the fair value hierarchy, depending on the inputs used.
With respect to foreign equity securities that are principally traded on a market outside the United States, the Board has approved the utilization of an independent fair value pricing service to evaluate the effect of market fluctuations on these securities after the close of trading in that foreign market. To the extent that securities are valued using this service, they will be classified as Level 2 securities.
Debt securities are valued by using the mean between the closing bid and ask prices provided by a pricing service. If the closing bid and ask prices are not readily available, the pricing service may provide a price determined by a matrix pricing method. Matrix pricing is a mathematical technique used to value fixed income securities without relying exclusively on quoted prices. Matrix pricing takes into consideration recent transactions, yield, liquidity, risk, credit quality, coupon, maturity, type of issue and any other factors or market data the pricing service deems relevant for the actual security being priced and for other securities with similar characteristics. These securities will generally be categorized as Level 2 securities. If the Valuation Designee, decides that a price provided by the pricing service does not accurately reflect the fair value of the securities or when prices are not readily available from a pricing service, securities are valued at fair value as determined by the Valuation Designee, in conformity with guidelines adopted by and subject to review of the Board through its Pricing & Liquidity Committee. These securities will generally be categorized as Level 3 securities.
Investments in mutual funds, including money market mutual funds, are generally priced at the ending NAV provided by the service agent of the mutual funds. These securities are categorized as Level 1 securities.
In accordance with the Trust’s valuation policies and fair value determinations pursuant to Rule 2a-5 under the 1940 Act, the Valuation Designee is required to consider all appropriate factors relevant to the value of securities for which it has determined other pricing sources are not available or reliable as described above. No single method exists for determining fair value because fair value depends upon the circumstances of each individual case. As a general principle, the current fair value of a security being valued by the Valuation Designee would be the amount that a Fund might reasonably expect to receive upon the current sale. Methods that are in accordance with this principle may, for example, be based on (i) a multiple of earnings; (ii) a discount from market prices of a similar freely traded security (including a derivative security or a basket of securities traded on other markets, exchanges or among dealers); or (iii) yield to maturity with respect to debt issues, or a combination of these and other methods. Fair-value pricing is permitted if, in the Valuation Designee’s opinion, the validity of market quotations appears to be questionable based
43
| Fisher Investments Institutional Group Fund Family |
| Notes to the Financial Statements (continued) |
| August 31, 2023 |
on factors such as evidence of a thin market in the security based on a small number of quotations, a significant event occurs after the close of a market but before a Fund’s NAV calculation that may affect a security’s value, or the Valuation Designee is aware of any other data that calls into question the reliability of market quotations. The Valuation Designee may obtain assistance from others in fulfilling its duties. For example, it may seek assistance from pricing services, fund administrators, sub-advisers, accountants, or counsel; it may also consult the Trust’s Fair Value Committee. The Valuation Designee, however, remains responsible for the final fair value determination and may not designate or assign that responsibility to any third party.
The following is a summary of the inputs used to value the Funds’ investments as of August 31, 2023:
| Stock Fund | Valuation Inputs | |||||||||||||||
| Assets | Level 1 | Level 2 | Level 3 | Total | ||||||||||||
| Common Stocks(a) | $ | 219,974 | $ | 549 | $ | — | $ | 220,523 | ||||||||
| Money Market Funds | 2,501 | — | — | 2,501 | ||||||||||||
| Total | $ | 222,475 | $ | 549 | $ | — | $ | 223,024 | ||||||||
| ESG Stock Fund | Valuation Inputs | |||||||||||||||
| Assets | Level 1 | Level 2 | Level 3 | Total | ||||||||||||
| Common Stocks(a) | $ | 219,274 | $ | 3,030 | $ | — | $ | 222,304 | ||||||||
| Preferred Stocks | 1,569 | — | — | 1,569 | ||||||||||||
| Money Market Funds | 1,830 | — | — | 1,830 | ||||||||||||
| Total | $ | 222,673 | $ | 3,030 | $ | — | $ | 225,703 | ||||||||
| Fixed Income Fund | Valuation Inputs | |||||||||||||||
| Assets | Level 1 | Level 2 | Level 3 | Total | ||||||||||||
| Corporate Bonds(a) | $ | — | $ | 833,945 | $ | — | $ | 833,945 | ||||||||
| U.S. Government & Agencies | — | 973,335 | — | 973,335 | ||||||||||||
| Exchange-Traded Funds | 896,814 | — | — | 896,814 | ||||||||||||
| Money Market Funds | 96,178 | — | — | 96,178 | ||||||||||||
| Total | $ | 992,992 | $ | 1,807,280 | $ | — | $ | 2,800,272 | ||||||||
| ESG Fixed Income Fund | Valuation Inputs | |||||||||||||||
| Assets | Level 1 | Level 2 | Level 3 | Total | ||||||||||||
| Corporate Bonds(a) | $ | — | $ | 813,714 | $ | — | $ | 813,714 | ||||||||
| U.S. Government & Agencies | — | 1,015,439 | — | 1,015,439 | ||||||||||||
| Exchange-Traded Funds | 904,206 | — | — | 904,206 | ||||||||||||
| Money Market Funds | 47,526 | — | — | 47,526 | ||||||||||||
| Total | $ | 951,732 | $ | 1,829,153 | $ | — | $ | 2,780,885 | ||||||||
| (a) | Refer to Schedule of Investments for sector classifications. |
The Funds did not hold any investments at the end of the reporting period in which significant unobservable inputs (Level 3) were used in determining fair value; therefore, no reconciliation of Level 3 securities is included for this reporting period.
44
| Fisher Investments Institutional Group Fund Family |
| Notes to the Financial Statements (continued) |
| August 31, 2023 |
NOTE 4. FEES AND OTHER TRANSACTIONS WITH AFFILIATES AND OTHER SERVICE PROVIDERS
The Adviser, under the terms of the management agreement with the Trust with respect to the Funds, manages the Funds’ investments. The Adviser pays all of the operating expenses of the Funds except portfolio transaction and other investment related costs (including brokerage fees and commissions, and fees and expenses associated with investments in derivative instruments, such as option and swap fees and expenses), taxes, borrowing costs (such as interest and dividend expense on securities sold short), extraordinary expenses, and any indirect expenses (such as fees and expenses associated with investment in acquired funds and other collective investment vehicles). In this regard, it should be noted that most investment companies pay their own operating expenses directly, while the Funds’ expenses, except those specified above, are paid by the Adviser. The Funds do not pay a management fee to the Adviser. Retirement plans, plan sponsors and/or plan participants pay a separate fee for the Adviser’s services and also pay fees to record keepers and administrators.
Ultimus Fund Solutions, LLC (“Ultimus”) provides administration, fund accounting and transfer agent services to the Funds. The Funds pay Ultimus fees in accordance with the agreements for such services.
Northern Lights Compliance Services, LLC (“NLCS”), an affiliate of Ultimus, provides a Chief Compliance Officer to the Trust, as well as related compliance services, pursuant to a consulting agreement between NLCS and the Trust. Under the terms of such agreement, NLCS receives fees from the Funds, which are approved annually by the Board.
Under the terms of a Distribution Agreement with the Trust, Ultimus Fund Distributors, LLC (the “Distributor”) serves as principal underwriter to the Funds. The Distributor is a wholly-owned subsidiary of Ultimus. The Distributor is compensated by the Adviser (not the Funds) for acting as principal underwriter.
Certain officers of the Trust are also employees of Ultimus and such persons are not paid by the Funds for serving in such capacities. One Trustee is a former employee of Ultimus who is not currently paid by the Funds for serving in such capacity.
The Board supervises the business activities of the Trust. Each Trustee serves as a trustee until termination of the Trust unless the Trustee dies, resigns, retires, or is removed. The Chair of the Board and more than 75% of the Trustees are “Independent Trustees”, which means that they are not “interested persons” as defined in the 1940 Act. The Independent Trustees review and establish compensation at least annually. Each Independent Trustee of the Trust receives annual compensation, which is an established amount paid quarterly
45
| Fisher Investments Institutional Group Fund Family |
| Notes to the Financial Statements (continued) |
| August 31, 2023 |
per fund in the Trust at the time of the regular quarterly Board meetings. The Chair of the Board receives the highest compensation, commensurate with his additional duties and each Chair of a committee receives additional compensation as well. Independent Trustees also receive additional fees for attending any special meetings. In addition, the Trust reimburses Independent Trustees for out-of-pocket expenses incurred in conjunction with attendance at meetings.
NOTE 5. INVESTMENT TRANSACTIONS
For the fiscal year ended August 31, 2023, purchases and sales of investment securities, other than short-term investments, were as follows:
| ESG Stock | Fixed Income | ESG Fixed | ||||||||||||||
| Stock Fund | Fund | Fund | Income Fund | |||||||||||||
| Purchases | $ | 49,363 | $ | 60,393 | $ | 218,214 | $ | 197,660 | ||||||||
| Sales | 48,302 | 58,290 | — | — | ||||||||||||
| U.S. Government Purchases | — | — | 238,442 | 292,455 | ||||||||||||
| U.S. Government Sales | — | — | 367,565 | 371,623 | ||||||||||||
NOTE 6. BENEFICIAL OWNERSHIP
The beneficial ownership, either directly or indirectly, of more than 25% of the voting securities of a fund creates a presumption of control of a fund, under Section 2(a)(9) of the 1940 Act. As of August 31, 2023, the Adviser owned 100% of outstanding shares of each of the Stock Fund, ESG Stock Fund, Fixed Income Fund and ESG Fixed Income Fund. As a result, the Adviser may be deemed to control each Fund.
NOTE 7. FEDERAL TAX INFORMATION
At August 31, 2023, the net unrealized appreciation (depreciation) and tax cost of investments for tax purposes was as follows:
| ESG Stock | Fixed Income | ESG Fixed | ||||||||||||||
| Stock Fund | Fund | Fund | Income Fund | |||||||||||||
| Gross unrealized appreciation | $ | 60,381 | $ | 62,073 | $ | — | $ | — | ||||||||
| Gross unrealized depreciation | (6,283 | ) | (5,851 | ) | (360,077 | ) | (369,986 | ) | ||||||||
| Net unrealized appreciation (depreciation) on investments | 54,098 | 56,222 | (360,077 | ) | (369,986 | ) | ||||||||||
| Tax cost of investments | $ | 168,926 | $ | 169,481 | $ | 3,160,349 | $ | 3,150,871 | ||||||||
46
| Fisher Investments Institutional Group Fund Family |
| Notes to the Financial Statements (continued) |
| August 31, 2023 |
The tax character of distributions paid for the fiscal years ended August 31, 2023 and August 31, 2022 were as follows:
| Stock Fund | ESG Stock Fund | |||||||||||||||
| 2023 | 2022 | 2023 | 2022 | |||||||||||||
| Distributions paid from: | ||||||||||||||||
| Ordinary income(a) | $ | 2,795 | $ | 2,617 | $ | 2,881 | $ | 2,359 | ||||||||
| Long-term capital gains | 468 | — | — | — | ||||||||||||
| Total distributions paid | $ | 3,263 | $ | 2,617 | $ | 2,881 | $ | 2,359 | ||||||||
| Fixed Income Fund | ESG Fixed Income Fund | |||||||||||||||
| 2023 | 2022 | 2023 | 2022 | |||||||||||||
| Distributions paid from: | ||||||||||||||||
| Ordinary income(a) | $ | 67,327 | $ | 56,361 | $ | 68,072 | $ | 53,329 | ||||||||
| Long-term capital gains | — | 50 | — | — | ||||||||||||
| Total distributions paid | $ | 67,327 | $ | 56,411 | $ | 68,072 | $ | 53,329 | ||||||||
| (a) | Short-term capital gain distributions are treated as ordinary income for tax purposes. |
At August 31, 2023, the components of accumulated earnings (deficit) on a tax basis were as follows:
| ESG Stock | Fixed Income | ESG Fixed | ||||||||||||||
| Stock Fund | Fund | Fund | Income Fund | |||||||||||||
| Undistributed ordinary income | $ | 2,266 | $ | 2,385 | $ | 64,157 | $ | 62,956 | ||||||||
| Undistributed long-term capital gains | 8,847 | 9,760 | — | — | ||||||||||||
| Accumulated capital and other losses | — | — | (116,710 | ) | (123,625 | ) | ||||||||||
| Unrealized appreciation (depreciation) on investments | 54,098 | 56,222 | (360,077 | ) | (369,986 | ) | ||||||||||
| Total accumulated earnings (deficit) | $ | 65,211 | $ | 68,367 | $ | (412,630 | ) | $ | (430,655 | ) | ||||||
The differences between book-basis and tax-basis unrealized appreciation (depreciation) are attributable primarily to tax deferral of losses on wash sales
As of August 31, 2023, the Fixed Income Fund had accumulated short-term capital loss carryforwards of $308 and long-term capital loss carryforwards of $116,402. The ESG Fixed Income Fund had accumulated short-term capital loss carryforwards of $315 and long-term capital loss carryforwards of $123,310. Capital loss carryforwards are not subject to expiration.
47
| Fisher Investments Institutional Group Fund Family |
| Notes to the Financial Statements (continued) |
| August 31, 2023 |
At August 31, 2023, the Stock Fund utilized short-term capital loss carryforwards of $760 and long-term capital loss carryforwards of $824. The ESG Stock Fund utilized short-term capital loss carryforwards of $1,596 and long-term capital loss carryforwards of $718.
NOTE 8. SECTOR RISK
If a Fund has significant investments in the securities of issuers within a particular sector, any development affecting that sector will have a greater impact on the value of the net assets of a Fund than would be the case if a Fund did not have significant investments in that sector. In addition, this may increase the risk of loss in a Fund and increase the volatility of a Fund’s NAV per share. For instance, economic or market factors, regulatory changes or other developments may negatively impact all companies in a particular sector, and therefore the value of a Fund’s portfolio will be adversely affected. As of August 31, 2023, the Stock Fund and ESG Stock Fund had 27.64% and 27.10%, respectively, of the value of its net assets invested in stocks within the Technology sector.
NOTE 9. COMMITMENTS AND CONTINGENCIES
The Trust indemnifies its officers and Trustees for certain liabilities that may arise from their performance of their duties to the Trust or the Funds. Additionally, in the normal course of business, the Trust enters into contracts that contain a variety of representations and warranties which provide general indemnifications. The Trust’s maximum exposure under these arrangements is unknown, as this would involve future claims that may be made against the Trust that have not yet occurred.
NOTE 10. SUBSEQUENT EVENTS
Management of the Funds has evaluated the need for disclosures and/or adjustments resulting from subsequent events through the date at which these financial statements were issued. Based upon this evaluation, management has determined there were no items requiring adjustment of the financial statements or additional disclosure.
48
| Report of Independent Registered Public Accounting Firm |
To
the Shareholders of Fisher Investments Institutional Group Fund Family and
Board of Trustees of Unified Series Trust
Opinion on the Financial Statements
We have audited the accompanying statements of assets and liabilities, including the schedules of investments, of Fisher Investments Institutional Group Stock Fund for Retirement Plans, Fisher Investments Institutional Group ESG Stock Fund for Retirement Plans, Fisher Investments Institutional Group Fixed Income Fund for Retirement Plans, and Fisher Investments Institutional Group ESG Fixed Income Fund for Retirement Plans (the “Funds”), each a series of Unified Series Trust, as of August 31, 2023, the related statements of operations for the year then ended, the statements of changes in net assets for each of the two years in the period then ended, the related notes, and the financial highlights for the years ended August 31, 2023, 2022, 2021 and for the period December 13, 2019 (commencement of operations) to August 31, 2020 (collectively referred to as the “financial statements”). In our opinion, the financial statements present fairly, in all material respects, the financial position of each of the Funds as of August 31, 2023, the results of their operations for the year then ended, the changes in net assets for each of the two years in the period then ended, and the financial highlights for the years ended August 31, 2023, 2022, 2021 and for the period December 13, 2019 (commencement of operations) to August 31, 2020, in conformity with accounting principles generally accepted in the United States of America.
Basis for Opinion
These financial statements are the responsibility of the Funds’ management. Our responsibility is to express an opinion on the Funds’ financial statements based on our audits. We are a public accounting firm registered with the Public Company Accounting Oversight Board (United States) (“PCAOB”) and are required to be independent with respect to the Funds in accordance with the U.S. federal securities laws and the applicable rules and regulations of the Securities and Exchange Commission and the PCAOB.
We conducted our audits in accordance with the standards of the PCAOB. Those standards require that we plan and perform the audit to obtain reasonable assurance about whether the financial statements are free of material misstatement whether due to error or fraud.
Our audits included performing procedures to assess the risks of material misstatement of the financial statements, whether due to error or fraud, and performing procedures that respond to those risks. Such procedures included examining, on a test basis, evidence regarding the amounts and disclosures in the financial statements. Our procedures included confirmation of securities owned as of August 31, 2023, by correspondence with the custodian. Our audits also included evaluating the accounting principles used and significant estimates made by management, as well as evaluating the overall presentation of the financial statements. We believe that our audits provide a reasonable basis for our opinion.
49
| Report of Independent Registered Public Accounting Firm (continued) |
We have served as the auditor of one or more investment companies advised by Fisher Asset Management, LLC since 2017.
COHEN & COMPANY,
LTD.
Chicago, Illinois
October 27, 2023
50
| Liquidity Risk Management Program (Unaudited) |
The Trust has adopted and implemented a written liquidity risk management program (the “Program”) as required by Rule 22e-4 (the “Liquidity Rule”) under the 1940 Act. The Program is reasonably designed to assess and manage the Funds’ liquidity risk, taking into consideration, among other factors, each Fund’s investment strategy and the liquidity of its portfolio investments during normal and reasonably foreseeable stressed conditions; its short and long-term cash flow projections; and its cash holdings and access to other funding sources. The Board approved the appointment of the Liquidity Administrator Committee, comprising certain Trust officers and employees of the Adviser. The Liquidity Administrator Committee maintains Program oversight and reports to the Board on at least an annual basis regarding the Program’s operational effectiveness through a written report (the “Report”). The Program’s most recent Report, which was presented to the Board for consideration at its meeting held on August 14-15, 2023, outlined the operation of the Program and the adequacy and effectiveness of the Program’s implementation. During the review period, the Funds did not experience unusual stress or disruption to their operations related to purchase and redemption activity. Also, during the review period the Funds held adequate levels of cash and highly liquid investments to meet shareholder redemption activities in accordance with applicable requirements. The Report concluded that the Program is reasonably designed to prevent violation of the Liquidity Rule and has been effectively implemented.
51
| Summary of Fund Expenses (Unaudited) |
As a shareholder of a Fund, you incur two types of costs: (1) transaction costs and (2) ongoing costs, including management fees and other Fund expenses. These examples are intended to help you understand your ongoing costs (in dollars) of investing in each Fund and to compare these costs with the ongoing costs of investing in other funds. Each Fund’s example is based on an investment of $1,000 invested at the beginning of the period and held for the entire period from March 1, 2023 through August 31, 2023.
Actual Expenses
The first line of the table below provides information about actual account values and actual expenses. You may use the information in this line, together with the amount you invested, to estimate the expenses that you paid over the period. Simply divide your account value by $1,000 (for example, an $8,600 account value divided by $1,000 = 8.6), then multiply the result by the number in the first line under the heading “Expenses Paid During Period” to estimate the expenses you paid on your account during this period.
Hypothetical Example for Comparison Purposes
The second line of the table below provides information about hypothetical account values and hypothetical expenses based on each Fund’s actual expense ratio and an assumed rate of return of 5% per year before expenses, which is not the Fund’s actual return. The hypothetical account values and expenses may not be used to estimate the actual ending account balance or expenses you paid for the period. You may use this information to compare the ongoing costs of investing in the Funds and other funds. To do so, compare this 5% hypothetical example with the 5% hypothetical examples that appear in the shareholder reports of other funds.
| Beginning | Ending | |||||||||||||
| Account | Account | Expenses | ||||||||||||
| Value | Value | Paid | Annualized | |||||||||||
| March 1, | August 31, | During | Expense | |||||||||||
| 2023 | 2023 | Period(a) | Ratio | |||||||||||
| Fisher Investments Institutional Group Stock Fund for Retirement Plans | ||||||||||||||
| Actual | $ | 1,000.00 | $ | 1,158.20 | $ | — | –% | |||||||
| Hypothetical(b) | $ | 1,000.00 | $ | 1,025.21 | $ | — | –% | |||||||
| Fisher Investments Institutional Group ESG Stock Fund for Retirement Plans | ||||||||||||||
| Actual | $ | 1,000.00 | $ | 1,170.60 | $ | — | –% | |||||||
| Hypothetical(b) | $ | 1,000.00 | $ | 1,025.21 | $ | — | –% | |||||||
| Fisher Investments Institutional Group Fixed Income Fund for Retirement Plans | ||||||||||||||
| Actual | $ | 1,000.00 | $ | 1,021.10 | $ | — | –% | |||||||
| Hypothetical(b) | $ | 1,000.00 | $ | 1,025.21 | $ | — | –% | |||||||
| Fisher Investments Institutional Group ESG Fixed Income Fund for Retirement Plans | ||||||||||||||
| Actual | $ | 1,000.00 | $ | 1,020.10 | $ | — | –% | |||||||
| Hypothetical(b) | $ | 1,000.00 | $ | 1,025.21 | $ | — | –% | |||||||
| (a) | Expenses are equal to the Fund’s annualized expense ratios, multiplied by the average account value over the period, multiplied by 184/365 (to reflect the one-half year period). |
| (b) | Hypothetical assumes 5% annual return before expenses. |
52
| Additional Federal Income Tax Information (Unaudited) |
The Form 1099-DIV you receive in January 2024 will show the tax status of all distributions paid to your account in calendar year 2023. Shareholders are advised to consult their own tax adviser with respect to the tax consequences of their investment in the Funds. As required by the Internal Revenue Code and/or regulations, shareholders must be notified regarding the status of qualified dividend income for individuals and the dividends received deduction for corporations.
Qualified Dividend Income. The Funds designate the following percentage or up to the maximum amount of such dividends allowable pursuant to the Internal Revenue Code, as qualified dividend income eligible for the reduced tax rate.
| ESG Stock | Fixed Income | ESG Fixed | ||||||
| Stock Fund | Fund | Fund | Income Fund | |||||
| Qualified Dividend Income | 79% | 73% | 0% | 0% | ||||
Qualified Business Income. The Funds designate the following percentage of ordinary income dividends, or up to the maximum amount of such dividends allowable pursuant to the Internal Revenue Code, as qualified business income.
| ESG Stock | Fixed Income | ESG Fixed | ||||||
| Stock Fund | Fund | Fund | Income Fund | |||||
| Qualified Business Income | — | — | — | — | ||||
Dividends Received Deduction. Corporate shareholders are generally entitled to take the dividends received deduction on the portion of the Funds’ dividend distribution that qualifies under tax law. For the Funds’ calendar year 2023 ordinary income dividends, the following percentage qualifies for the corporate dividends received deduction.
| ESG Stock | Fixed Income | ESG Fixed | ||||||
| Stock Fund | Fund | Fund | Income Fund | |||||
| Dividends Received Deduction | 41% | 42% | 0% | 0% | ||||
The Funds designate the following amounts as long-term capital gains distributions. The amounts designated may not agree with long-term capital gains in the tax character of distribution table due to utilization of earnings and profits distributed to shareholders on redemption of shares.
| ESG Stock | Fixed Income | ESG Fixed | ||||||||||||||
| Stock Fund | Fund | Fund | Income Fund | |||||||||||||
| Long-Term Capital Gains Distributions | $ | 468 | $ | — | $ | — | $ | — | ||||||||
53
| Trustees and Officers (Unaudited) |
GENERAL QUALIFICATIONS. The Board supervises the business activities of the Trust. Each Trustee serves as a trustee until termination of the Trust unless the Trustee dies, resigns, retires, or is removed. The Chair of the Board and more than 75% of the Trustees are “Independent Trustees”, which means that they are not “interested persons” (as defined in the 1940 Act) of the Trust or any adviser, sub-adviser or distributor of the Trust.
The following table provides information regarding the Independent Trustees.
| Name,
Address*, (Year of Birth), Position with Trust**, Term of Position with Trust |
Principal
Occupation During Past 5 Years and Other Directorships |
| Daniel
J. Condon (1950) Chair, May 2022 to present; Chair of the Audit Committee; Chair of the Governance & Nominating Committee, May 2020 to May 2022; Independent Trustee, December 2002 to present |
Current: Retired (2017 – present).
Previous: Peak Income Plus Fund (May 2022 – February 2023). |
| Kenneth
G.Y. Grant (1949) Chair of the Governance & Nominating Committee, May 2022 to present; Chair, January 2017 to May 2022; Independent Trustee, May 2008 to present |
Current: Director, Standpoint Multi-Asset (Cayman) Fund, Ltd. (2019 – present); Director, Advisors Charitable Gift Fund (2020 – present), a Donor Advised Fund; Trustee. Trustee, Peak Income Plus Fund (May 2022 – present).
Previous: EVP, Benefit Plans Administrative Services, Inc., provider of retirement benefit plans administration (2019 – 2020); Director, Northeast Retirement Services (NRS) LLC, a transfer agent and fund administrator; and Director, Global Trust Company (GTC), a non-depository trust company sponsoring private investment products (2003 – 2019); EVP, NRS (2003 – 2019); GTC, EVP (2008 – 2019); EVP, Savings Banks Retirement Association (2003 – 2019), provider of qualified retirement benefit plans. |
| Ronald
C. Tritschler (1952) Chair of the Audit Committee, May 2022 to present; Independent Trustee, January 2007 to present; Interested Trustee, December 2002 to December 2006 |
Current: Chief Executive Officer, Director and Legal Counsel of The Webb Companies, a national real estate company, (2001– present); Director, Standpoint Multi-Asset (Cayman) Fund, Ltd. (2020 – present); Director of First State Bank of the Southeast (2000 – present).
Previous: Trustee, Peak Income Plus Fund (May 2022 – February 2023). |
54
| Trustees and Officers (Unaudited) (continued) |
| Catharine
B. McGauley (1977) Chair of the Pricing & Liquidity Committee, November 2022 to present; Independent Trustee, September 2022 to present |
Current: Lead Portfolio Manager of Atlantic Charter Insurance, a workers’ compensation insurer, (2010 – present); Investment Advisor for a Family Office (2015 – present); Senior Analyst/Advisor for a Boston real estate company and related family (2010 – present).
Previous: Trustee, Peak Income Plus Fund (May 2022 – February 2023). |
| Freddie
Jacobs, Jr. (1970) Independent Trustee, September 2022 to present |
Current: Chief Operating Officer and Chief Risk Officer Northeast Retirement Services LLC (NRS), and its subsidiary, Global Trust Company (GTC). NRS is a transfer agent and fund administrator, GTC is a non- depository trust company sponsoring private investment products (2021 – present); Chair, Board of Crispus Attucks Fund (2020 – present); Board Member of Camp Harbor View (2020 – present); Director, Sportsmen’s Tennis and Education Center (2019 – present).
Previous: SVP, Senior Risk Officer NRS (2013 – 2021); Trustee, Peak Income Plus Fund (May 2022 – February 2023); Trustee of Buckingham Browne & Nichols (2017 - June 2023). |
| * | The address for each Trustee is 225 Pictoria Drive, Suite 450, Cincinnati, Ohio 45246. |
| ** | As of the date of this report, the Trust consists of 29 series. |
The following table provides information regarding the Interested Trustees and Officers of the Trust.
| Name,
Address*, (Year of Birth), Position with Trust, Term of Position with Trust |
Principal
Occupation During Past 5 Years and Other Directorships |
| David
R. Carson (1958) Interested Trustee, August 2020 to present; President, January 2016 to August 2021 |
Current: Retired (2023 – present); Interested Trustee, Mammoth Institutional Credit Access Fund and Mammoth Institutional Equity Access Fund (November 2022 – present); Interested Trustee, Peak Income Plus Fund (May 2022 – present).
Previous: Interested Trustee of Ultimus Managers Trust, (January 2021 – April 2023); Senior Vice President Client Strategies of Ultimus Fund Solutions, LLC, (2013 – April 2023). |
55
| Trustees and Officers (Unaudited) (continued) |
| Martin
R. Dean (1963) President, August 2021 to present; Vice President, November 2020 to August 2021; Chief Compliance Officer, April 2021 to August 2021; Assistant Chief Compliance Officer, January 2016 to April 2021 |
Current: President, Northern Lights Compliance Services (2023 – present).
Previous: Senior Vice President, Head of Fund Compliance of Ultimus Fund Solutions, LLC (2016 – January 2023). |
| Zachary
P. Richmond (1980) Treasurer and Chief Financial Officer, November 2014 to present |
Current: Vice President, Director of Financial Administration for Ultimus Fund Solutions, LLC, (2015 – present). |
| Gweneth
K. Gosselink (1955) Chief Compliance Officer, August 2021 to present |
Current: Assistant Vice President, Senior Compliance Officer of Ultimus Fund Solutions, LLC, since 2019.
Previous: Chief Operating Officer & CCO at Miles Capital, Inc. (2013 – 2019). |
| Elisabeth
Dahl (1962) Secretary, May 2017 to present; Assistant Secretary, March 2016 to May 2017 |
Current: Attorney, Ultimus Fund Solutions, LLC since March 2016. |
| Timothy
J. Shaloo (1970) AML Compliance Officer, August 2023 to present |
Current: AVP, Compliance Officer (September 2023 – present).
Previous: Senior Compliance Analyst, Northern Lights Compliance Services, LLC (2021 – August 2023); Compliance Specialist, Ultimus Fund Solutions, LLC (2016 – 2020). |
| * | The address for each Officer is 225 Pictoria Drive, Suite 450, Cincinnati, Ohio 45246. |
| Other Information (Unaudited) |
The Funds’ Statement of Additional Information (“SAI”) includes additional information about the trustees and is available without charge, upon request. You may call toll-free at (800) 431-1716 to request a copy of the SAI or to make shareholder inquiries.
56
| PRIVACY NOTICE | |
| Rev: January 2020 | |
| FACTS | WHAT DO THE FISHER INVESTMENTS INSTITUTIONAL GROUP FUND FAMILY (THE “FUNDS”) DO WITH YOUR PERSONAL INFORMATION? |
| Why? | Financial companies choose how they share your personal information. Federal law gives consumers the right to limit some but not all sharing. Federal law also requires us to tell you how we collect, share, and protect your personal information. Please read this notice carefully to understand what we do. |
| What? | The types of personal information we collect and share depend on the product or service you have with us. This information can include:
■ Social Security number
■ account balances and account transactions
■ transaction or loss history and purchase history
When you are no longer our customer, we continue to share your information as described in this notice. |
| How? | All financial companies need to share customers’ personal information to run their everyday business. In the section below, we list the reasons financial companies can share their customers’ personal information; the reasons the Funds choose to share; and whether you can limit this sharing. |
| Reasons we can share your personal information | Do
the Funds share? |
Can
you limit this sharing? |
For our everyday business purposes— such as to process your transactions, maintain your account(s), respond to court orders and legal investigations, or report to credit bureaus |
Yes | No |
For our marketing purposes— to offer our products and services to you |
No | We don’t share |
| For joint marketing with other financial companies | No | We don’t share |
For our affiliates’ everyday business purposes— information about your transactions and experiences |
No | We don’t share |
For our affiliates’ everyday business purposes— information about your creditworthiness |
No | We don’t share |
| For nonaffiliates to market to you | No | We don’t share |
| Questions? | Call (800) 851-8845 |
57
| Who we are | |
| Who is providing this notice? | Fisher Investments Institutional Group Fund Family Ultimus Fund Distributors, LLC (Distributor) Ultimus Fund Solutions, LLC (Administrator) |
| What we do | |
| How do the Funds protect my personal information? | To protect your personal information from unauthorized access and use, we use security measures that comply with federal law. These measures include computer safeguards and secured files and buildings. Our service providers are held accountable for adhering to strict policies and procedures to prevent any misuse of your nonpublic personal information. |
| How do the Funds collect my personal information? | We collect your personal information, for example, when you
■ open an account or deposit money
■ make deposits or withdrawals from your account or provide account information
We also collect your personal information from other companies. |
| Why can’t I limit all sharing? | Federal law gives you the right to limit only
■ sharing for affiliates’ everyday business purposes—information about your creditworthiness
■ affiliates from using your information to market to you
■ sharing for nonaffiliates to market to you
State laws and individual companies may give you additional rights to limit sharing. |
| Definitions | |
| Affiliates | Companies related by common ownership or control. They can be financial and nonfinancial companies.
■ Fisher Asset Management, LLC d/b/a Fisher Investments, the investment adviser to the Funds, could be deemed to be an affiliate. |
| Nonaffiliates | Companies not related by common ownership or control. They can be financial and nonfinancial companies.
■ The Funds do not share your personal information with nonaffiliates so they can market to you |
| Joint marketing | A formal agreement between nonaffiliated financial companies that together market financial products or services to you.
■ The Funds don’t jointly market. |
58
| PROXY VOTING |
A description of the policies and procedures that each Fund uses to determine how to vote proxies relating to portfolio securities and information regarding how each Fund voted those proxies during the most recent twelve month period ended June 30, are available (1) without charge upon request by calling the Funds at (800) 851-8845 and (2) in Fund documents filed with the SEC on the SEC’s website at www.sec.gov.
| TRUSTEES Daniel J. Condon, Chair David R. Carson Kenneth G.Y. Grant Freddie Jacobs, Jr. Catharine B. McGauley Ronald C. Tritschler |
INDEPENDENT
REGISTERED PUBLIC ACCOUNTING FIRM Cohen & Company, Ltd. 151 North Franklin Street, Suite 575 Chicago, IL 60606 |
| OFFICERS Martin R. Dean, President Gweneth K. Gosselink, Chief Compliance Officer Zachary P. Richmond, Treasurer and Chief Financial Officer |
LEGAL
COUNSEL Thompson Hine LLP 312 Walnut Street, 20th Floor Cincinnati, OH 45202 |
| INVESTMENT
ADVISER Fisher Asset Management, LLC 6500 International Parkway, Suite 2050 Plano, TX 75093 |
CUSTODIAN U.S. Bank, N.A. 425 Walnut Street Cincinnati, OH 45202 |
| DISTRIBUTOR Ultimus Fund Distributors, LLC 225 Pictoria Drive, Suite 450 Cincinnati, OH 45246 |
ADMINISTRATOR,
TRANSFER AGENT AND FUND ACCOUNTANT Ultimus Fund Solutions, LLC 225 Pictoria Drive, Suite 450 Cincinnati, OH 45246 |
This report is intended only for the information of shareholders or those who have received the Funds’ prospectus which contains information about the Funds’ management fee and expenses. Please read the prospectus carefully before investing.
Distributed by Ultimus Fund Distributors, LLC
Member FINRA/SIPC
Fisher4-AR-23
| FISHER INVESTMENTS INSTITUTIONAL |
| GROUP FUND FAMILY |
| Annual Report |
| August 31, 2023 |
| Fisher Investments Institutional Group |
| U.S. Large Cap Equity Environmental and Social Values Fund |
| Fund Adviser: |
| Fisher Asset Management, LLC |
| 6500 International Parkway, Suite 2050 |
| Plano, Texas 75093 |
| (800) 851-8845 |
Fisher
Investments Institutional Group U.S. Large Cap
Equity Environmental and Social Values Fund
Management’s Discussion of Fund Performance
(Unaudited)
Dear Shareholder:
Market Outlook
Despite debt ceiling and “default” fears dominating headlines in Q2, S&P 500 returns were nicely positive as reality outperformed still-negative headlines, with solid gains bringing year-to-date returns as of June 30th, 2023 to 16.9%. With sentiment still quite dour and tailwinds gathering pace, we think this young bull market still has plenty of room to grow.
Information Technology, up 17.2%, and Communication Services, up 13.1%, significantly outperformed in Q2, as sentiment shifted positively, supported by the Bounce Effect—the tendency for bear market laggards to lead in a new bull market. These sectors ended Q2 as the best and third best-performers quarter to date. Tech and Tech-like sectors’ strong performance in the bounce off October’s low is emblematic of how bull markets begin. These categories fell more than the market last year, souring many investors’ views of their future. But that sentiment is proving excessively negative, in our view.
Financials rebounded in Q2, finishing up 5.3%, though year-to-date returns are still negative. First Republic’s failure in early May triggered some weakness and stirred fear, but no big plunge materialized. By the end of May, though, it appeared most investors shook off First Republic’s failure and moved on. There is little fundamental sign of trouble, either. Emergency Fed lending remained well below March and April levels. Meanwhile, the Fed’s Senior Loan Officer Opinion Survey showed slightly tighter credit standards and moderately weaker demand—merely extending the trend from before March’s banking failures. Loan demand was weakest for offices and multifamily properties amid commercial real estate fears—but these are well-known worries, not a shock to markets. Overall, we believe lending remains healthy.
Equities’ rise off last year’s bear market low surpassed 20.0% in early June, ending the month up 26.0% from October’s low. Headlines focused on this threshold, claiming it indicated a “new bull market” is underway. We don’t think hitting this milestone has any forward-looking significance, though the reactions were a telling sentiment snapshot. Even those who now acknowledge a bull market has run since last October aren’t uniformly bullish. Many portray the rally as a mirage of Big Tech outperformance masking weaker returns among the broad swath of S&P 500 constituents.
Yes, market breadth has narrowed, but we think this is a logical consequence of the bull market bounce. Tech saw the largest fall in the downturn, and the worst performers usually bounce fastest on the way up. Additionally, there is nothing inherently wrong with rapidly falling breadth—it is actually quite bullish historically. That said, it is worth noting that
1
Fisher
Investments Institutional Group U.S. Large Cap
Equity Environmental and Social Values Fund
Management’s Discussion of Fund Performance
(Unaudited) (continued)
the rally broadened in late Q2. Furthermore, the Tech rally slowed late quarter, lagging amid artificial intelligence (AI) regulatory fears and talk of new chip export restrictions for China. However, in our view, all the focus on AI seems to distract investors from Tech and Tech-like equities’ leadership since the low having a lot to do with the Bounce Effect. These firms are also true growth equities—likely attractive to many investors in the slowing-but-growing economy around us.
On the economic front, data was mixed in Q2—though most still topped analysts’ low expectations. Many were worried about June’s real personal consumption expenditures (PCE) flat reading, along with April’s downward revision to 0.2% m/m from 0.5%— arguing that the data points to consumer weakness. As ever, the bigger picture seems more nuanced. Goods spending weighed on the headline figure—down -0.4% m/m—while services rose 0.2% m/m. This is simply an extension of the longer-term trend—with the same apparent in Purchasing Managers’ Indices: S&P Global’s June manufacturing PMI fell into a deeper contraction (46.3) from May’s 48.4. Meanwhile, services—the much larger US GDP contributor—saw continued growth at a robust 54.1. While slightly slower than May’s revised 54.9, this was the second-fastest growth rate since April 2022. In our view, the market doesn’t appear to be previewing consumer weakness. Consumer Discretionary’s 14.6% return was second only to Information Technology 17.2% in the second quarter, while Consumer Staples underperformed significantly (0.5%). Even starker, the Consumer Discretionary and Consumer Staples sector’s year-to-date returns ended June at 33.1% and 1.3%, respectively. The divide seemingly highlights strong demand for nonessentials—it doesn’t seem to us that equities anticipate consumers cutting back amid a financial downturn.
Elsewhere, the housing market showed signs of stabilizing—undercutting low demand fears. Housing starts were up big—21.7% m/m. Single-family starts rose 18.5% m/m. This isn’t surprising, given consumers are increasingly opting for turnkey homes due to lower associated maintenance and renovation costs—while elevated mortgage rates mean fewer homeowners are willing to sell and lose their current (lower) rates, limiting existing home supply. New construction is the main way real estate contributes to GDP. To us, that appears to be flipping from a modest headwind to an underappreciated small tailwind.
Meanwhile, the Fed paused its rate hike cycle in mid-June. Commentators have speculated the Fed isn’t done hiking—with such views seemingly confirmed by Fed Chair Jerome Powell stating that more 2023 hikes are possible. Plus, many dismissed May’s cooling inflation as too little to prevent the Fed from hiking further—supposedly threatening equities. We think this take is misguided. First, inflation slowed meaningfully in May:
2
Fisher
Investments Institutional Group U.S. Large Cap
Equity Environmental and Social Values Fund
Management’s Discussion of Fund Performance
(Unaudited) (continued)
Headline CPI cooled 0.1% m/m versus April’s 0.4%—and 4.0% y/y from April’s 4.9%. Personal Consumption Expenditures (PCE) and core PCE prices slowed, too—to 0.1% m/m and 0.3%, respectively, from April’s matching 0.4% readings. Owner’s equivalent rent skewed CPI and PCE higher—masking even cooler underlying inflation. Headline PCE is now more than halfway back to the Fed’s target, and monetary policy impacts are felt with a long and indeterminate lag. Whether the Fed sees it this way or not (and whether or not it acts) is unknowable—but regardless, the end of rate hikes seems much closer than the beginning. Second, and crucially, equities don’t care about the Fed’s unpredictable moves. Consider: Equities spiked briefly after late Q2’s Fed pause but were flat the next week. Returns since last summer show the Fed pausing—or even cutting rates—isn’t necessary for equities to climb: Equities are up 19.5% since the Fed began hiking in 75 basis point increments last June.
Debt ceiling fears reached their peak mid-quarter, with many claiming failure to raise the limit by early June risked a “default” on the US’s obligations. We have long documented the fallacy of such notions, considering default is only the failure to pay interest and principal on Treasurys. The government can roll over maturing bonds after hitting the ceiling, so interest is the only question. There is ample revenue to cover it and, in our view, a constitutional requirement to do so. Regardless, Congress regularly fights over the limit in typical political fashion, only to eventually raise it.
While we think the debt ceiling is mostly political theatrics, some claim fear over it drove Tech and Tech-like Communication Services equities up, leading US markets through the quarter. Commentators argued the possibility of a US “default” caused investors to ditch US Treasurys in favor of alternative “safe havens”—namely, Tech. But this argument has several flaws, in our view. First, we think AI enthusiasm partly underpinned Tech’s rise, given semiconductors—a crucial component in AI development—rose significantly, leading the Tech sector’s returns. Furthermore, we have found the hardest-hit bear market sectors bounce highest in a new bull market. Given Tech’s 2022 bear market decline, that Bounce Effect seems to be playing out as expected now. Then, too, the better-than-expected Q1 earnings season helped reality beat expectations. While backward-looking, we think this provided a sentiment boost for equities.
Some of this year’s big fears faded quickly in Q2. Much-feared regional banks continued their recovery, rising 6.7% overall in June. Fed borrowing was muted since First Republic’s failure in May while June saw a slight uptick. Overall borrowing was flat. Furthermore, overall loan growth remained stable, despite some short-term wiggles—and small bank lending even ticked up slightly. As discussed, debt ceiling fears disappeared as well, after
3
Fisher
Investments Institutional Group U.S. Large Cap
Equity Environmental and Social Values Fund
Management’s Discussion of Fund Performance
(Unaudited) (continued)
lawmakers finalized an early-June resolution. We see this as a sign gridlock is alive and well—with major legislation unable to pass, uncertainty remains low, fueling equities higher.
Performance Attribution
The Fisher Investments Institutional Group U.S. Large Cap Equity Environmental and Social Values Fund outperformed the S&P 500 Index for the period from September 1, 2022 through August 31, 2023. During this period, the Fund returned 27.02% while the Fund’s primary benchmark, the S&P 500 Index, returned 15.94%. Sector allocation and equity selection contributed to relative return. An overweight to and selection within Semiconductors & Semiconductor Equipment was the largest contributor to relative outperformance, driven by Nvidia. Additionally, an underweight to and selection within Health Care contributed to performance, as medical device manufacturer Intuitive Surgical, orthodontics company Align Technology and pharmaceutical company Merck outperformed relative to the Health Care sector within the S&P 500 Index. Conversely, an overweight to and selection within Financials detracted from performance, driven by digital payments company PayPal, consumer bank First Republic and financial services company Bank of America.
Portfolio Shifts
For the period from September 1, 2022 through August 31, 2023, we reduced the Fund’s exposure to the Information Technology sector and increased the Fund’s exposure to Industrials. While still overweight the Information Technology sector, the Fund’s exposure was brought closer to the benchmark as US-China tensions and Antitrust regulation may weigh on sentiment. Industrials moved to an overweight in the strategy to capture potential future demand for automation equipment and infrastructure projects. In addition, Industrials may benefit as the market shifts toward cyclical value categories in the early cycle.
4
Investment Results (Unaudited)
Average Annual Total Returns(a) as of August 31, 2023
| Since | |||
| Inception | |||
| Fund/Index | One Year | Three Year | (7/17/20) |
| Fisher Investments Institutional Group U.S. Large Cap Equity Environmental and Social Values Fund | 27.02% | 10.73% | 14.36% |
| S&P 500 Index(b) | 15.94% | 10.52% | 13.09% |
| Expense | |||
| Ratios(c) | |||
| Gross | 3.11% | ||
| With Applicable Fee Waivers and Expense Reimbursements | 0.47% |
The performance quoted represents past performance, which does not guarantee future results. The investment return and principal value of an investment will fluctuate so that an investor’s shares, when redeemed, may be worth more or less than their original cost. The returns shown do not reflect deduction of taxes that a shareholder would pay on Fisher Investments Institutional Group U.S. Large Cap Environmental and Social Values Fund (the “Fund”) distributions or the redemption of Fund shares. Current performance of the Fund may be lower or higher than the performance quoted. The Fund’s investment objective, risks, charges and expenses should be considered carefully before investing. Performance data current to the most recent month end may be obtained by calling (800) 851-8845.
| (a) | Return figures reflect any change in price per share and assume the reinvestment of all distributions. |
| (b) | The S&P 500 Index (“S&P Index”) is a widely recognized unmanaged index of equity securities and is representative of a broader domestic equity market and range of securities than is found in the Fund’s portfolio. Individuals cannot invest directly in the S&P Index; however, an individual can invest in exchange traded funds or other investment vehicles that attempt to track the performance of a benchmark index. Index returns assume reinvestment of dividends and do not reflect any fees or expenses. |
| (c) | The expense ratios are from the Fund’s prospectus dated December 29, 2022. Fisher Asset Management, LLC, d/b/a Fisher Investments (the “Adviser”) has contractually agreed to waive its management fee and/or reimburse the Fund’s other expenses in order to limit the Fund’s total annual operating expenses to 0.47% of the Fund’s average daily net assets through December 31, 2027 (excluding portfolio transaction and other investment-related costs (including brokerage fees and commissions); taxes; borrowing costs (such as interest and dividend expenses on securities sold short); acquired fund fees and expenses; certain fees and expenses associated with investments in other collective investment vehicles or derivative instruments (including for example option and swap fees and expenses); any administrative and/or shareholder servicing fees payable pursuant to a plan adopted by the Board of Trustees; expenses incurred in connection with any merger or reorganization; extraordinary expenses (such as litigation expenses, indemnification of Trust officers and Trustees and contractual indemnification of Fund service providers); and other expenses that the Trustees agree have not been incurred in the ordinary course of the Fund’s business). This expense cap may not be terminated prior to this date except by the Board of Trustees upon 60 days’ written |
5
Investment Results (Unaudited) (continued)
notice to the Adviser. Each waiver/expense payment by the Adviser is subject to recoupment by the Adviser from the Fund in the three years following the date the particular waiver/expense payment occurred, but only if such recoupment can be achieved without exceeding the annual expense limitation in effect at the time of the waiver/expense payment and any expense limitation in effect at the time of the recoupment. Additional information pertaining to the Fund’s expense ratios as of August 31, 2023 can be found in the financial highlights.
The Fund’s investment objective, strategies, risks, charges and expenses should be considered carefully before investing. The Fund’s prospectus contains this and other important information about the Fund and may be obtained by calling (800) 851-8845. Please read it carefully before investing.
6
Investment Results (Unaudited) (continued)
Comparison of the Growth of a $10,000 Investment in the Fisher Investments Institutional Group U.S. Large Cap Equity Environmental and Social Values Fund and the S&P 500 Index.
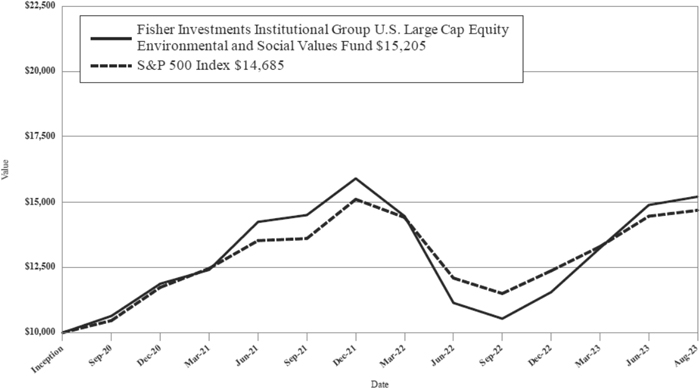
This graph shows the value of a hypothetical initial investment of $10,000 made on July 17, 2020 (commencement of operations) and held through August 31, 2023. S&P 500 Index is a widely recognized unmanaged index of equity securities and is representative of a broader domestic equity market and range of securities than is found in the Fund’s portfolio. Individuals cannot invest directly in an index; however, an individual may invest in exchange-traded funds or other investment vehicles that attempt to track the performance of a benchmark index. The returns shown do not reflect deduction of taxes that a shareholder would pay on Fund distributions or the redemption of Fund shares. Investment returns and principal values will fluctuate so that your shares, when redeemed, may be worth more or less than their original purchase price. THE FUND’S RETURN REPRESENTS PAST PERFORMANCE AND DOES NOT GUARANTEE OR PREDICT FUTURE RESULTS.
Current performance may be lower or higher than the performance data quoted. For more information on the Fund, and to obtain performance data current to the most recent month-end, or to request a prospectus, please call (800) 851-8845. You should carefully consider the investment objective, potential risks, management fees, and charges and expenses of the Fund before investing. The Fund’s prospectus contains this and other information about the Fund and should be read carefully before investing.
The Fund is distributed by Ultimus Fund Distributors, LLC, Member FINRA/SIPC.
7
Fund Holdings (Unaudited)
Fisher Investments Institutional Group U.S. Large Cap Equity Environmental and Social Values Fund Holdings as of August 31, 2023*
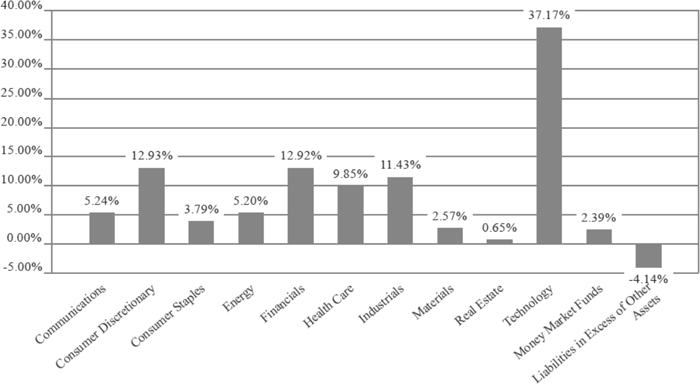
| * | As a percentage of net assets. |
The investment objective of the Fund is to seek to outperform, net of fees and expenses, the return of the S&P 500 Index.
Availability of Portfolio Schedule (Unaudited)
The Fund files its complete schedule of portfolio holdings with the Securities and Exchange Commission (the “SEC”) for the first and third quarters of each fiscal year as an exhibit to its reports on Form N-PORT. The Fund’s Form N-PORT reports are available on the SEC’s website at www.sec.gov.
8
| Fisher Investments Institutional Group U.S. Large Cap |
| Equity Environmental and Social Values Fund |
| Schedule of Investments |
| August 31, 2023 |
| COMMON STOCKS — 101.75% | Shares | Fair Value | ||||||
| Communications — 5.24% | ||||||||
| Alphabet, Inc., Class A(a) | 59 | $ | 8,034 | |||||
| Netflix, Inc.(a) | 9 | 3,903 | ||||||
| 11,937 | ||||||||
| Consumer Discretionary — 12.93% | ||||||||
| Amazon.com, Inc.(a) | 57 | 7,867 | ||||||
| Aptiv PLC(a) | 20 | 2,029 | ||||||
| Ford Motor Co. | 132 | 1,601 | ||||||
| General Motors Co. | 49 | 1,642 | ||||||
| Hilton Worldwide Holdings, Inc. | 9 | 1,338 | ||||||
| Home Depot, Inc. (The) | 26 | 8,587 | ||||||
| KB Home | 65 | 3,302 | ||||||
| NIKE, Inc., Class B | 14 | 1,424 | ||||||
| Yum! Brands, Inc. | 13 | 1,682 | ||||||
| 29,472 | ||||||||
| Consumer Staples — 3.79% | ||||||||
| Costco Wholesale Corp. | 4 | 2,197 | ||||||
| General Mills, Inc. | 18 | 1,218 | ||||||
| Kimberly-Clark Corp. | 6 | 773 | ||||||
| PepsiCo, Inc. | 12 | 2,135 | ||||||
| Procter & Gamble Co. (The) | 15 | 2,315 | ||||||
| 8,638 | ||||||||
| Energy — 5.20% | ||||||||
| ConocoPhillips | 25 | 2,976 | ||||||
| Halliburton Co. | 52 | 2,008 | ||||||
| Hess Corp. | 23 | 3,554 | ||||||
| Pioneer Natural Resources Co. | 8 | 1,903 | ||||||
| Schlumberger Ltd. | 24 | 1,415 | ||||||
| 11,856 | ||||||||
| Financials — 12.92% | ||||||||
| American Express Co. | 24 | 3,792 | ||||||
| Bank of America Corp. | 108 | 3,095 | ||||||
| BlackRock, Inc. | 6 | 4,203 | ||||||
| Citigroup, Inc. | 71 | 2,932 | ||||||
| Goldman Sachs Group, Inc. (The) | 12 | 3,933 | ||||||
| JPMorgan Chase & Co. | 21 | 3,073 | ||||||
| PayPal Holdings, Inc.(a) | 36 | 2,250 | ||||||
| T. Rowe Price Group, Inc. | 18 | 2,020 | ||||||
| Visa, Inc., Class A | 17 | 4,177 | ||||||
| 29,475 | ||||||||
| Health Care — 9.85% | ||||||||
| Abbott Laboratories | 20 | 2,058 | ||||||
| Amgen, Inc. | 5 | 1,282 | ||||||
| Biogen, Inc.(a) | 6 | 1,604 | ||||||
| Eli Lilly & Co. | 5 | 2,771 | ||||||
| Intuitive Surgical, Inc.(a) | 15 | 4,690 | ||||||
| Johnson & Johnson | 19 | 3,072 | ||||||
See accompanying notes which are an integral part of these financial statements.
9
| Fisher Investments Institutional Group U.S. Large Cap |
| Equity Environmental and Social Values Fund |
| Schedule of Investments (continued) |
| August 31, 2023 |
| COMMON STOCKS — 101.75% - continued | Shares | Fair Value | ||||||
| Health Care — 9.85% - continued | ||||||||
| Medtronic PLC | 16 | $ | 1,304 | |||||
| Merck & Co., Inc. | 28 | 3,051 | ||||||
| Pfizer, Inc. | 20 | 708 | ||||||
| UnitedHealth Group, Inc. | 4 | 1,906 | ||||||
| Viatris, Inc. | 1 | 11 | ||||||
| 22,457 | ||||||||
| Industrials — 11.43% | ||||||||
| 3M Co. | 7 | 747 | ||||||
| Caterpillar, Inc. | 11 | 3,092 | ||||||
| Cummins, Inc. | 11 | 2,530 | ||||||
| Eaton Corp. PLC | 13 | 2,995 | ||||||
| Emerson Electric Co. | 32 | 3,145 | ||||||
| HEICO Corp. | 16 | 2,699 | ||||||
| Norfolk Southern Corp. | 11 | 2,255 | ||||||
| Otis Worldwide Corp. | 27 | 2,310 | ||||||
| Rockwell Automation, Inc. | 12 | 3,745 | ||||||
| United Parcel Service, Inc., Class B | 15 | 2,541 | ||||||
| 26,059 | ||||||||
| Materials — 2.57% | ||||||||
| Nucor Corp. | 34 | 5,851 | ||||||
| Real Estate — 0.65% | ||||||||
| Prologis, Inc. | 12 | 1,490 | ||||||
| Technology — 37.17% | ||||||||
| Adobe, Inc.(a) | 8 | 4,475 | ||||||
| Advanced Micro Devices, Inc.(a) | 34 | 3,594 | ||||||
| Apple, Inc. | 95 | 17,848 | ||||||
| Autodesk, Inc.(a) | 12 | 2,663 | ||||||
| Cisco Systems, Inc. | 38 | 2,179 | ||||||
| Intel Corp. | 41 | 1,441 | ||||||
| Marvell Technology, Inc. | 59 | 3,437 | ||||||
| Microsoft Corp. | 44 | 14,422 | ||||||
| MSCI, Inc. | 11 | 5,980 | ||||||
| NVIDIA Corp. | 30 | 14,806 | ||||||
| Oracle Corp. | 29 | 3,491 | ||||||
| QUALCOMM, Inc. | 17 | 1,947 | ||||||
| salesforce.com, Inc.(a) | 27 | 5,980 | ||||||
| Texas Instruments, Inc. | 15 | 2,521 | ||||||
| 84,784 | ||||||||
| Total Common Stocks (Cost $174,155) | 232,019 | |||||||
| MONEY MARKET FUNDS - 2.39% | ||||||||
| First American Government Obligations Fund, Class X, 5.25%(b) | 5,446 | 5,446 | ||||||
| Total Money Market Funds (Cost $5,446) | 5,446 | |||||||
See accompanying notes which are an integral part of these financial statements.
10
| Fisher Investments Institutional Group U.S. Large Cap |
| Equity Environmental and Social Values Fund |
| Schedule of Investments (continued) |
| August 31, 2023 |
| Fair Value | ||||
| Total Investments — 104.14% (Cost $179,601) | $ | 237,465 | ||
| Liabilities in Excess of Other Assets — (4.14)% | (9,447 | ) | ||
| NET ASSETS — 100.00% | $ | 228,018 | ||
| (a) | Non-income producing security. |
| (b) | Rate disclosed is the seven day effective yield as of August 31, 2023. |
See accompanying notes which are an integral part of these financial statements.
11
| Fisher Investments Institutional Group U.S. Large Cap |
| Equity Environmental and Social Values Fund |
| Statement of Assets and Liabilities |
| August 31, 2023 |
| Assets | ||||
| Investments in securities at fair value (cost $179,601) | $ | 237,465 | ||
| Dividends receivable | 380 | |||
| Receivable from Adviser | 13,369 | |||
| Prepaid expenses | 2,956 | |||
| Total Assets | 254,170 | |||
| Liabilities | ||||
| Payable to affiliates | 4,917 | |||
| Accrued audit and tax fees | 17,900 | |||
| Other accrued expenses | 3,335 | |||
| Total Liabilities | 26,152 | |||
| Net Assets | $ | 228,018 | ||
| Net Assets consist of: | ||||
| Paid-in capital | $ | 160,611 | ||
| Accumulated earnings | 67,407 | |||
| Net Assets | $ | 228,018 | ||
| Shares outstanding (unlimited number of shares authorized, no par value) | 15,839 | |||
| Net asset value, offering and redemption price per share | $ | 14.40 |
See accompanying notes which are an integral part of these financial statements.
12
| Fisher Investments Institutional Group U.S. Large Cap |
| Equity Environmental and Social Values Fund |
| Statement of Operations |
| For the year ended August 31, 2023 |
| Investment Income | ||||
| Dividend income | $ | 3,073 | ||
| Total investment income | 3,073 | |||
| Expenses | ||||
| Administration | 49,764 | |||
| Legal | 19,994 | |||
| Audit and tax | 17,725 | |||
| Trustee | 16,636 | |||
| Compliance services | 12,031 | |||
| Transfer agent | 12,000 | |||
| Report printing | 4,156 | |||
| Custodian | 2,501 | |||
| Registration | 1,529 | |||
| Pricing | 1,123 | |||
| Adviser | 776 | |||
| Miscellaneous | 20,649 | |||
| Total expenses | 158,884 | |||
| Fees waived and/or expenses reimbursed by Adviser | (157,972 | ) | ||
| Net operating expenses | 912 | |||
| Net investment income | 2,161 | |||
| Net Realized and Change in Unrealized Gain (Loss) on Investments | ||||
| Net realized gain on investment securities transactions | 7,398 | |||
| Net change in unrealized appreciation of investment securities | 38,845 | |||
| Net realized and change in unrealized gain on investments | 46,243 | |||
| Net increase in net assets resulting from operations | $ | 48,404 |
See accompanying notes which are an integral part of these financial statements.
13
| Fisher Investments Institutional Group U.S. Large Cap |
| Equity Environmental and Social Values Fund |
| Statements of Changes in Net Assets |
| For the Year | For the Year | |||||||
| Ended August | Ended August | |||||||
| 31, 2023 | 31, 2022 | |||||||
| Increase (Decrease) in Net Assets due to: | ||||||||
| Operations | ||||||||
| Net investment income | $ | 2,161 | $ | 1,406 | ||||
| Net realized gain on investment securities transactions | 7,398 | 7,217 | ||||||
| Net change in unrealized appreciation (depreciation) of investment securities | 38,845 | (58,231 | ) | |||||
| Net increase (decrease) in net assets resulting from operations | 48,404 | (49,608 | ) | |||||
| Distributions From: | ||||||||
| Earnings | (1,063 | ) | (4,897 | ) | ||||
| Net realized gains | (4,150 | ) | — | |||||
| Total distributions | (5,213 | ) | (4,897 | ) | ||||
| Capital Transactions | ||||||||
| Reinvestment of distributions | 5,213 | 4,896 | ||||||
| Amount paid for shares redeemed | — | (13 | ) | |||||
| Net increase in net assets resulting from capital transactions | 5,213 | 4,883 | ||||||
| Total Increase (Decrease) in Net Assets | 48,404 | (49,622 | ) | |||||
| Net Assets | ||||||||
| Beginning of year | 179,614 | 229,236 | ||||||
| End of year | $ | 228,018 | $ | 179,614 | ||||
| Share Transactions | ||||||||
| Shares issued in reinvestment of distributions | 479 | 317 | ||||||
| Shares redeemed | — | (1 | ) | |||||
| Net increase in shares | 479 | 316 | ||||||
See accompanying notes which are an integral part of these financial statements.
14
| Fisher Investments Institutional Group U.S. Large Cap |
| Equity Environmental and Social Values Fund |
| Financial Highlights |
| (For a share outstanding during each period) |
| For the | ||||||||||||||||
| For the | For the | For the | Period | |||||||||||||
| Year Ended | Year Ended | Year Ended | Ended | |||||||||||||
| August 31, | August 31, | August 31, | August 31, | |||||||||||||
| 2023 | 2022 | 2021 | 2020(a) | |||||||||||||
| Selected Per Share Data: | ||||||||||||||||
| Net asset value, beginning of period | $ | 11.69 | $ | 15.24 | $ | 11.20 | $ | 10.00 | ||||||||
| Investment operations: | ||||||||||||||||
| Net investment income | 0.08 | 0.09 | 0.07 | 0.01 | ||||||||||||
| Net realized and unrealized gain (loss) | 2.97 | (3.32 | ) | 4.00 | 1.19 | |||||||||||
| Total from investment operations | 3.05 | (3.23 | ) | 4.07 | 1.20 | |||||||||||
| Less distributions to shareholders from: | ||||||||||||||||
| Net investment income | (0.07 | ) | (0.07 | ) | (0.03 | ) | — | |||||||||
| Net realized gains | (0.27 | ) | (0.25 | ) | — | — | ||||||||||
| Total distributions | (0.34 | ) | (0.32 | ) | (0.03 | ) | — | |||||||||
| Net asset value, end of period | $ | 14.40 | $ | 11.69 | $ | 15.24 | $ | 11.20 | ||||||||
| Total Return(b) | 27.02 | % | (21.68 | )% | 36.46 | % | 12.00 | % (c) | ||||||||
| Ratios and Supplemental Data: | ||||||||||||||||
| Net assets, end of period (000 omitted) | $ | 228 | $ | 180 | $ | 229 | $ | 168 | ||||||||
| Ratio of net expenses to average net assets | 0.47 | % | 0.47 | % | 0.47 | % | 0.47 | % (d) | ||||||||
| Ratio of gross expenses to average net assets before waiver and reimbursement | 81.87 | % | 71.11 | % | 74.51 | % | 185.76 | % (d) | ||||||||
| Ratio of net investment income to average net assets | 1.11 | % | 0.67 | % | 0.60 | % | 0.60 | % (d) | ||||||||
| Portfolio turnover rate | 33 | % | 12 | % | 9 | % | — | % (c) | ||||||||
| (a) | For the period July 17, 2020 (commencement of operations) to August 31, 2020. |
| (b) | Total return represents the rate that the investor would have earned or lost on an investment in the Fund, assuming reinvestment of distributions. |
| (c) | Not annualized. |
| (d) | Annualized. |
See accompanying notes which are an integral part of these financial statements.
15
| Fisher Investments Institutional Group U.S. Large Cap |
| Equity Environmental and Social Values Fund |
| Notes to the Financial Statements |
| August 31, 2023 |
NOTE 1. ORGANIZATION
Fisher Investments Institutional Group U.S. Large Cap Equity Environmental and Social Values Fund (the “Fund”) is registered under the Investment Company Act of 1940, as amended (the “1940 Act”), as a diversified series of Unified Series Trust (the “Trust”) on November 12, 2018. The Trust is an open-end investment company established under the laws of Ohio by an Agreement and Declaration of Trust dated October 14, 2002, as amended (the “Trust Agreement”). The Trust Agreement permits the Board of Trustees of the Trust (the “Board”) to issue an unlimited number of shares of beneficial interest of separate series without par value. The Fund is one of a series of funds currently authorized by the Board. The Fund commenced operations on July 17, 2020. The investment adviser to the Fund is Fisher Asset Management, LLC, d/b/a Fisher Investments (the “Adviser”). The investment objective of the Fund is to seek to outperform, net of fees and expenses, the return of the S&P 500 Index.
NOTE 2. SIGNIFICANT ACCOUNTING POLICIES
The Fund is an investment company and follows accounting and reporting guidance under Financial Accounting Standards Board Accounting Standards Codification (“ASC”) Topic 946, “Financial Services-Investment Companies”, including Accounting Standards Update 2013-08. The following is a summary of significant accounting policies followed by the Fund in the preparation of its financial statements. These policies are in conformity with generally accepted accounting principles in the United States of America (“GAAP”).
Regulatory update – Tailored Shareholder Reports for Mutual Funds and Exchange-Traded Funds (“ETFs”) – Effective January 24, 2023, the Securities and Exchange Commission (the “SEC”) adopted rule and form amendments to require mutual funds and ETFs to transmit concise and visually engaging streamlined annual and semiannual reports to shareholders that highlight key information. Other information, including financial statements, will no longer appear in a streamlined shareholder report but must be available online, delivered free of charge upon request, and filed on a semiannual basis on Form N-CSR. The rule and form amendments have a compliance date of July 24, 2024. At this time, management is evaluating the impact of these amendments on the shareholder reports for the Fund.
Estimates – The preparation of financial statements in conformity with GAAP requires management to make estimates and assumptions that affect the reported amounts of assets and liabilities and disclosure of contingent assets and liabilities at the date of the financial statements and the reported amounts of increases and decreases in net assets from operations during the reporting period. Actual results could differ from those estimates.
16
| Fisher Investments Institutional Group U.S. Large Cap |
| Equity Environmental and Social Values Fund |
| Notes to the Financial Statements (continued) |
| August 31, 2023 |
Federal Income Taxes – The Fund makes no provision for federal income or excise tax. The Fund has qualified and intends to qualify each year as a regulated investment company (“RIC”) under subchapter M of the Internal Revenue Code of 1986, as amended, by complying with the requirements applicable to RICs and by distributing substantially all of its taxable income. The Fund also intends to distribute sufficient net investment income and net realized capital gains, if any, so that it will not be subject to excise tax on undistributed income and gains. If the required amount of net investment income or gains is not distributed, the Fund could incur a tax expense.
As of and during the fiscal year ended August 31, 2023, the Fund did not have any liabilities for any unrecognized tax benefits. The Fund recognizes interest and penalties, if any, related to unrecognized tax benefits as income tax expense in the Statement of Operations when incurred. During the year, the Fund did not incur any interest or penalties. Management of the Fund has reviewed tax positions taken in tax years that remain subject to examination by all major tax jurisdictions, including federal (i.e., the previous three tax year ends and the interim tax period since then, as applicable) and has concluded that no provision for unrecognized tax benefits or expenses is required in these financial statements and does not expect this to change over the next twelve months.
Expenses – Expenses incurred by the Trust that do not relate to a specific fund of the Trust are allocated to the individual funds of the Trust based on each fund’s relative net assets or another appropriate basis (as determined by the Board).
Security Transactions and Related Income – The Fund follows industry practice and records security transactions on the trade date for financial reporting purposes. The specific identification method is used for determining gains or losses for financial statements and income tax purposes. Dividend income is recorded on the ex-dividend date and interest income is recorded on an accrual basis. Withholding taxes on foreign dividends and related reclaims have been provided for in accordance with the Fund’s understanding of the applicable country’s tax rules and rates.
Dividends and Distributions – The Fund intends to distribute its net investment income and net realized long-term and short-term capital gains, if any, at least annually. Dividends and distributions to shareholders, which are determined in accordance with income tax regulations, are recorded on the ex-dividend date. The treatment for financial reporting purposes of distributions made to shareholders during the period from net investment income or net realized capital gains may differ from their ultimate treatment for federal income tax purposes. These differences are caused primarily by differences in the timing of the recognition of certain components of income, expense or realized capital gain for federal income tax purposes. Where such differences are permanent in nature, they are reclassified among the components of net assets based on their ultimate characterization
17
| Fisher Investments Institutional Group U.S. Large Cap |
| Equity Environmental and Social Values Fund |
| Notes to the Financial Statements (continued) |
| August 31, 2023 |
for federal income tax purposes. Any such reclassifications will have no effect on net assets, results of operations or net asset value (“NAV”) per share of the Fund.
NOTE 3. SECURITIES VALUATION AND FAIR VALUE MEASUREMENTS
The Fund values its portfolio securities at fair value as of the close of regular trading on the New York Stock Exchange (“NYSE”) (normally 4:00 p.m. Eastern Time) on each business day the NYSE is open for business. Fair value is defined as the price that the Fund would receive upon selling an investment in a timely transaction to an independent buyer in the principal or most advantageous market of the investment. GAAP establishes a three-tier hierarchy to maximize the use of observable market data and minimize the use of unobservable inputs and to establish classification of fair value measurements for disclosure purposes.
Inputs refer broadly to the assumptions that market participants would use in pricing the asset or liability, including assumptions about risk (the risk inherent in a particular valuation technique used to measure fair value including a pricing model and/or the risk inherent in the inputs to the valuation technique). Inputs may be observable or unobservable. Observable inputs are inputs that reflect the assumptions market participants would use in pricing the asset or liability developed based on market data obtained and available from sources independent of the reporting entity. Unobservable inputs are inputs that reflect the reporting entity’s own assumptions about the assumptions market participants would use in pricing the asset or liability developed based on the best information available in the circumstances.
Various inputs are used in determining the value of the Fund’s investments. These inputs are summarized in the three broad levels listed below.
| ● | Level 1 – unadjusted quoted prices in active markets for identical investments and/or registered investment companies where the value per share is determined and published and is the basis for current transactions for identical assets or liabilities at the valuation date |
| ● | Level 2 – other significant observable inputs (including, but not limited to, quoted prices for an identical security in an inactive market, quoted prices for similar securities, interest rates, prepayment speeds, credit risk, etc.) |
| ● | Level 3 – significant unobservable inputs (including the Fund’s own assumptions in determining fair value of investments based on the best information available) |
The inputs used to measure fair value may fall into different levels of the fair value hierarchy. In such cases, for disclosure purposes, the level in the fair value hierarchy which
18
| Fisher Investments Institutional Group U.S. Large Cap |
| Equity Environmental and Social Values Fund |
| Notes to the Financial Statements (continued) |
| August 31, 2023 |
is reported is determined based on the lowest level input that is significant to the fair value measurement in its entirety.
Equity securities that are traded on any stock exchange are generally valued at the last quoted sale price on the security’s primary exchange. Lacking a last sale price, an exchange-traded security is generally valued at its last bid price. Securities traded in the Nasdaq over-the-counter market are generally valued at the Nasdaq Official Closing Price. When using market quotations and when the market is considered active, the security is classified as a Level 1 security. In the event that market quotations are not readily available or are considered unreliable due to market or other events, securities are valued in good faith by the Adviser, as Valuation Designee, under oversight of the Board’s Pricing & Liquidity Committee. The Adviser has adopted written policies and procedures for valuing securities and other assets in circumstances where market quotes are not readily available in conformity with guidelines adopted by the Board. In the event that market quotes are not readily available, and the security or asset cannot be valued pursuant to one of the valuation methods, the value of the security or asset will be determined in good faith by the Valuation Designee pursuant to its policies and procedures. Any fair value provided by the Valuation Designee is subject to the ultimate review of the pricing methodology by the Pricing & Liquidity Committee of the Board on a quarterly basis. Under these policies, the securities will be classified as Level 2 or 3 within the fair value hierarchy, depending on the inputs used.
Investments in mutual funds, including money market mutual funds, are generally priced at the ending NAV provided by the service agent of the mutual funds. These securities are categorized as Level 1 securities.
In accordance with the Trust’s valuation policies and fair value determinations pursuant to Rule 2a-5 under the 1940 Act, the Valuation Designee is required to consider all appropriate factors relevant to the value of securities for which it has determined other pricing sources are not available or reliable as described above. No single method exists for determining fair value because fair value depends upon the circumstances of each individual case. As a general principle, the current fair value of a security being valued by the Valuation Designee would be the amount that the Fund might reasonably expect to receive upon the current sale. Methods that are in accordance with this principle may, for example, be based on (i) a multiple of earnings; (ii) a discount from market prices of a similar freely traded security (including a derivative security or a basket of securities traded on other markets, exchanges or among dealers); or (iii) yield to maturity with respect to debt issues, or a combination of these and other methods. Fair-value pricing is permitted if, in the Valuation Designee’s opinion, the validity of market quotations appears to be questionable based on factors such as evidence of a thin market in the security based on a small number
19
| Fisher Investments Institutional Group U.S. Large Cap |
| Equity Environmental and Social Values Fund |
| Notes to the Financial Statements (continued) |
| August 31, 2023 |
of quotations, a significant event occurs after the close of a market but before the Fund’s NAV calculation that may affect a security’s value, or the Valuation Designee is aware of any other data that calls into question the reliability of market quotations. The Valuation Designee may obtain assistance from others in fulfilling its duties. For example, it may seek assistance from pricing services, fund administrators, sub-advisers, accountants, or counsel; it may also consult the Trust’s Fair Value Committee. The Valuation Designee, however, remains responsible for the final fair value determination and may not designate or assign that responsibility to any third party.
The following is a summary of the inputs used to value the Fund’s investments as of August 31, 2023:
| Valuation Inputs | ||||||||||||||||
| Assets | Level 1 | Level 2 | Level 3 | Total | ||||||||||||
| Common Stocks(a) | $ | 232,019 | $ | — | $ | — | $ | 232,019 | ||||||||
| Money Market Funds | 5,446 | — | — | 5,446 | ||||||||||||
| Total | $ | 237,465 | $ | — | $ | — | $ | 237,465 | ||||||||
| (a) | Refer to Schedule of Investments for sector classifications. |
The Fund did not hold any investments at the end of the reporting period for which significant unobservable inputs (Level 3) were used in determining fair value; therefore, no reconciliation of Level 3 securities is included for this reporting period.
NOTE 4. FEES AND OTHER TRANSACTIONS WITH AFFILIATES AND OTHER SERVICE PROVIDERS
The Adviser, under the terms of the management agreement (the “Agreement”) with the Trust with respect to the Fund, manages the Fund’s investments. As compensation for its management services, the Fund is obligated to pay the Adviser a management fee computed and accrued daily and paid monthly at an annual rate of 0.40% of the Fund’s average daily net assets. For the fiscal year ended August 31, 2023, the Adviser earned management fees of $776 from the Fund before the waiver and reimbursement described below.
The Adviser has contractually agreed to waive its management fee and/or to reimburse the Fund’s other expenses in order to limit the Fund’s total annual operating expenses to 0.47% of the Fund’s average daily net assets through December 31, 2027 (excluding portfolio transaction and other investment-related costs (including brokerage fees and commissions); taxes; borrowing costs (such as interest and dividend expenses on securities sold short); acquired fund fees and expenses; fees and expenses associated with investments in other collective investment vehicles or derivative instruments (including for example option and swap fees and expenses); any administrative and/or shareholder servicing fees payable pursuant to a plan adopted by the Board; expenses incurred in connection with any merger
20
| Fisher Investments Institutional Group U.S. Large Cap |
| Equity Environmental and Social Values Fund |
| Notes to the Financial Statements (continued) |
| August 31, 2023 |
or reorganization; extraordinary expenses (such as litigation expenses, indemnification of Trust officers and Trustees and contractual indemnification of Fund service providers); and other expenses that the Trustees agree have not been incurred in the ordinary course of the Fund’s business). This expense cap may not be terminated prior to this date except by the Board upon 60 days’ written notice to the Adviser. For the fiscal year ended August 31, 2023, the Adviser waived fees and reimbursed expenses in the amount of $157,972 for the Fund. At August 31, 2023, the Adviser owed the Fund $13,369.
Each waiver/expense payment by the Adviser (but not management fee waiver) is subject to recoupment by the Adviser from the Fund in the three years following the date the particular waiver/expense payment occurred, but only if such recoupment can be achieved without exceeding the annual expense limitation in effect at the time of the waiver/expense payment and any expense limitation in effect at the time of the recoupment. As of August 31, 2023, the Adviser may seek repayment of expense reimbursements in amounts as follows:
| Recoverable Through | ||||
| August 31, 2024 | $ | 139,012 | ||
| August 31, 2025 | 147,523 | |||
| August 31, 2026 | 157,972 |
Ultimus Fund Solutions, LLC (“Ultimus”) provides administration, fund accounting and transfer agent services to the Fund. The Fund pays Ultimus fees in accordance with the agreements for such services.
Northern Lights Compliance Services, LLC (“NLCS”), an affiliate of Ultimus, provides a Chief Compliance Officer to the Trust, as well as related compliance services, pursuant to a consulting agreement between NLCS and the Trust. Under the terms of such agreement, NLCS receives fees from the Fund, which are approved annually by the Board.
Under the terms of a Distribution Agreement with the Trust, Ultimus Fund Distributors, LLC (the “Distributor”) serves as principal underwriter to the Fund. The Distributor is a wholly-owned subsidiary of Ultimus. The Distributor is compensated by the Adviser (not the Fund) for acting as principal underwriter.
Certain officers of the Trust are also employees of Ultimus and such persons are not paid by the Fund for serving in such capacities. One Trustee is a former employee of Ultimus who is not currently paid by the Fund for serving in such capacity.
The Board supervises the business activities of the Trust. Each Trustee serves as a trustee until termination of the Trust unless the Trustee dies, resigns, retires, or is removed. The Chair of the Board and more than 75% of the Trustees are “Independent Trustees,” which
21
| Fisher Investments Institutional Group U.S. Large Cap |
| Equity Environmental and Social Values Fund |
| Notes to the Financial Statements (continued) |
| August 31, 2023 |
means that they are not “interested persons” as defined in the 1940 Act. The Independent Trustees review and establish compensation at least annually. Each Independent Trustee of the Trust receives annual compensation, which is an established amount paid quarterly per fund in the Trust at the time of the regular quarterly Board meetings. The Chair of the Board receives the highest compensation, commensurate with his additional duties and each Chair of a committee receives additional compensation as well. Independent Trustees also receive additional fees for attending any special meetings. In addition, the Trust reimburses Independent Trustees for out-of-pocket expenses incurred in conjunction with attendance at meetings.
NOTE 5. INVESTMENT TRANSACTIONS
For the fiscal year ended August 31, 2023, purchases and sales of investment securities, other than short-term investments, were $64,730 and $69,493, respectively.
There were no purchases or sales of long-term U.S. government obligations during the fiscal year ended August 31, 2023.
NOTE 6. BENEFICIAL OWNERSHIP
The beneficial ownership, either directly or indirectly, of more than 25% of the voting securities of a fund creates a presumption of control of a fund, under Section 2(a)(9) of the 1940 Act. As of August 31, 2023, the Adviser owned 100% of the Fund’s outstanding shares. As a result, the Adviser may be deemed to control the Fund.
NOTE 7. FEDERAL TAX INFORMATION
At August 31, 2023, the net unrealized appreciation (depreciation) and tax cost of investments for tax purposes was as follows:
| Gross unrealized appreciation | $ | 66,326 | ||
| Gross unrealized depreciation | (8,488 | ) | ||
| Net unrealized appreciation on investments | $ | 57,838 | ||
| Tax cost of investments | $ | 179,627 |
The tax character of distributions paid for the fiscal years ended August 31, 2023 and August 31, 2022 were as follows:
| 2023 | 2022 | |||||||
| Distributions paid from: | ||||||||
| Ordinary income(a) | $ | 1,138 | $ | 3,305 | ||||
| Long-term capital gains | 4,075 | 1,592 | ||||||
| Total distributions paid | $ | 5,213 | $ | 4,897 | ||||
| (a) | Short-term capital gain distributions are treated as ordinary income for tax purposes. |
22
| Fisher Investments Institutional Group U.S. Large Cap |
| Equity Environmental and Social Values Fund |
| Notes to the Financial Statements (continued) |
| August 31, 2023 |
At August 31, 2023, the components of accumulated earnings (deficit) on a tax basis were as follows:
| Undistributed ordinary income | $ | 2,159 | ||
| Undistributed long-term capital gains | 7,408 | |||
| Unrealized appreciation on investments | 57,838 | |||
| Total accumulated earnings | $ | 67,405 |
The differences between book-basis and tax-basis unrealized appreciation (depreciation) are attributable primarily to tax deferral of losses on wash sales
NOTE 8. SECTOR RISK
If the Fund has significant investments in the securities of issuers within a particular sector, any development affecting that sector will have a greater impact on the value of the net assets of the Fund than would be the case if the Fund did not have significant investments in that sector. In addition, this may increase the risk of loss in the Fund and increase the volatility of the Fund’s NAV per share. For instance, economic or market factors, regulatory changes or other developments may negatively impact all companies in a particular sector, and therefore the value of the Fund’s portfolio will be adversely affected. As of August 31, 2023, the Fund had 37.17% of the value of its net assets invested in stocks within the Technology sector.
NOTE 9. COMMITMENTS AND CONTINGENCIES
The Trust indemnifies its officers and Trustees for certain liabilities that may arise from their performance of their duties to the Trust or the Fund. Additionally, in the normal course of business, the Trust enters into contracts that contain a variety of representations and warranties which provide general indemnifications. The Trust’s maximum exposure under these arrangements is unknown, as this would involve future claims that may be made against the Trust that have not yet occurred.
NOTE 10. SUBSEQUENT EVENTS
Management of the Fund has evaluated the need for disclosures and/or adjustments resulting from subsequent events through the date at which these financial statements were issued. Based upon this evaluation, management has determined there were no items requiring adjustment of the financial statements or additional disclosure.
23
| Report of Independent Registered Public Accounting Firm |
To the Shareholders of Fisher Investments Institutional Group Fund Family and
Board of Trustees of Unified Series Trust
Opinion on the Financial Statements
We have audited the accompanying statement of assets and liabilities, including the schedule of investments, of Fisher Investments Institutional Group U.S. Large Cap Equity Environmental and Social Values Fund (the “Fund”), a series of Unified Series Trust, as of August 31, 2023, the related statement of operations for the year then ended, the statements of changes in net assets for each of the two years in the period then ended, the related notes, and the financial highlights for the years ended August 31, 2023, 2022, 2021 and for the period July 17, 2020 (commencement of operations) to August 31, 2020 (collectively referred to as the “financial statements”). In our opinion, the financial statements present fairly, in all material respects, the financial position of the Fund as of August 31, 2023, the results of its operations for the year then ended, the changes in net assets for each of the two years in the period then ended, and the financial highlights for the years ended August 31, 2023, 2022, 2021 and for the period July 17, 2020 (commencement of operations) to August 31, 2020, in conformity with accounting principles generally accepted in the United States of America.
Basis for Opinion
These financial statements are the responsibility of the Fund’s management. Our responsibility is to express an opinion on the Fund’s financial statements based on our audits. We are a public accounting firm registered with the Public Company Accounting Oversight Board (United States) (“PCAOB”) and are required to be independent with respect to the Fund in accordance with the U.S. federal securities laws and the applicable rules and regulations of the Securities and Exchange Commission and the PCAOB.
We conducted our audits in accordance with the standards of the PCAOB. Those standards require that we plan and perform the audit to obtain reasonable assurance about whether the financial statements are free of material misstatement whether due to error or fraud.
Our audits included performing procedures to assess the risks of material misstatement of the financial statements, whether due to error or fraud, and performing procedures that respond to those risks. Such procedures included examining, on a test basis, evidence regarding the amounts and disclosures in the financial statements. Our procedures included confirmation of securities owned as of August 31, 2023, by correspondence with the custodian. Our audits also included evaluating the accounting principles used and significant estimates made by management, as well as evaluating the overall presentation of the financial statements. We believe that our audits provide a reasonable basis for our opinion.
We have served as the auditor of one or more investment companies advised by Fisher Asset Management, LLC since 2017.
COHEN & COMPANY, LTD.
Chicago, Illinois
October 27, 2023
24
| Liquidity Risk Management Program (Unaudited) |
The Trust has adopted and implemented a written liquidity risk management program (the “Program”) as required by Rule 22e-4 (the “Liquidity Rule”) under the 1940 Act. The Program is reasonably designed to assess and manage the Fund’s liquidity risk, taking into consideration, among other factors, the Fund’s investment strategy and the liquidity of its portfolio investments during normal and reasonably foreseeable stressed conditions; its short and long- term cash flow projections; and its cash holdings and access to other funding sources. The Board approved the appointment of the Liquidity Administrator Committee, comprising certain Trust officers and employees of the Adviser. The Liquidity Administrator Committee maintains Program oversight and reports to the Board on at least an annual basis regarding the Program’s operational effectiveness through a written report (the “Report”). The most recent Report, which was presented to the Board for consideration at its meeting held on August 14-15, 2023, outlined the operation of the Program and the adequacy and effectiveness of the Program’s implementation. During the review period, the Fund did not experience unusual stress or disruption to its operations related to purchase and redemption activity. Also, during the review period the Fund held adequate levels of cash and highly liquid investments to meet shareholder redemption activities in accordance with applicable requirements. The Report concluded that the Program is reasonably designed to prevent violation of the Liquidity Rule and has been effectively implemented.
25
| Summary of Fund Expenses (Unaudited) |
As a shareholder of the Fund, you incur two types of costs: (1) transaction costs and (2) ongoing costs, including management fees and other Fund expenses. These examples are intended to help you understand your ongoing costs (in dollars) of investing in the Fund and to compare these costs with the ongoing costs of investing in other funds. The example is based on an investment of $1,000 invested at the beginning of the period and held for the entire period from March 1, 2023 through August 31, 2023.
Actual Expenses
The first line of the table below provides information about actual account values and actual expenses. You may use the information in this line, together with the amount you invested, to estimate the expenses that you paid over the period. Simply divide your account value by $1,000 (for example, an $8,600 account value divided by $1,000 = 8.6), then multiply the result by the number in the first line under the heading “Expenses Paid During Period” to estimate the expenses you paid on your account during this period.
Hypothetical Example for Comparison Purposes
The second line of the table below provides information about hypothetical account values and hypothetical expenses based on the Fund’s actual expense ratio and an assumed rate of return of 5% per year before expenses, which is not the Fund’s actual return. The hypothetical account values and expenses may not be used to estimate the actual ending account balance or expenses you paid for the period. You may use this information to compare the ongoing costs of investing in the Fund and other funds. To do so, compare this 5% hypothetical example with the 5% hypothetical examples that appear in the shareholder reports of other funds.
| Beginning | Ending | |||||||||
| Account | Account | Expenses | ||||||||
| Value | Value | Paid | Annualized | |||||||
| March 1, | August 31, | During | Expense | |||||||
| 2023 | 2023 | Period(a) | Ratio | |||||||
| Actual | $1,000.00 | $1,215.20 | $ | 2.63 | 0.47% | |||||
| Hypothetical(b) | $1,000.00 | $1,022.83 | $ | 2.40 | 0.47% | |||||
| (a) | Expenses are equal to the Fund’s annualized expense ratios, multiplied by the average account value over the period, multiplied by 184/365 (to reflect the one-half year period). |
| (b) | Hypothetical assumes 5% annual return before expenses. |
26
| Additional Federal Income Tax Information (Unaudited) |
The Form 1099-DIV you receive in January 2024 will show the tax status of all distributions paid to your account in calendar year 2023. Shareholders are advised to consult their own tax adviser with respect to the tax consequences of their investment in the Fund. As required by the Internal Revenue Code and/or regulations, shareholders must be notified regarding the status of qualified dividend income for individuals and the dividends received deduction for corporations.
Qualified Dividend Income. The Fund designates approximately 79% or up to the maximum amount of such dividends allowable pursuant to the Internal Revenue Code, as qualified dividend income eligible for a reduced tax rate.
Qualified Business Income. The Fund designates approximately 0% of its ordinary income dividends, or up to the maximum amount of such dividends allowable pursuant to the Internal Revenue Code, as qualified business income.
Dividends Received Deduction. Corporate shareholders are generally entitled to take the dividends received deduction on the portion of the Fund’s dividend distribution that qualifies under tax law. For the Fund’s calendar year 2023 ordinary income dividends, 78% qualifies for the corporate dividends received deduction.
For the year ended August 31, 2023, the Fund designated $4,075 as long-term capital gain distributions.
27
| Trustees and Officers (Unaudited) |
GENERAL QUALIFICATIONS. The Board supervises the business activities of the Trust. Each Trustee serves as a trustee until termination of the Trust unless the Trustee dies, resigns, retires, or is removed. The Chair of the Board and more than 75% of the Trustees are “Independent Trustees”, which means that they are not “interested persons” (as defined in the 1940 Act) of the Trust or any adviser, sub-adviser or distributor of the Trust.
The following table provides information regarding the Independent Trustees.
| Name,
Address*, (Year of Birth), Position with Trust**, Term of Position with Trust |
Principal
Occupation During Past 5 Years and Other Directorships |
| Daniel
J. Condon (1950) Chair, May 2022 to present; Chair of the Audit Committee; Chair of the Governance & Nominating Committee, May 2020 to May 2022; Independent Trustee, December 2002 to present |
Current: Retired (2017 – present).
Previous: Peak Income Plus Fund (May 2022 – February 2023). |
| Kenneth
G.Y. Grant (1949) Chair of the Governance & Nominating Committee, May 2022 to present; Chair, January 2017 to May 2022; Independent Trustee, May 2008 to present |
Current: Director, Standpoint Multi-Asset (Cayman) Fund, Ltd. (2019 – present); Director, Advisors Charitable Gift Fund (2020 – present), a Donor Advised Fund; Trustee. Trustee, Peak Income Plus Fund (May 2022 – present).
Previous: EVP, Benefit Plans Administrative Services, Inc., provider of retirement benefit plans administration (2019 – 2020); Director, Northeast Retirement Services (NRS) LLC, a transfer agent and fund administrator; and Director, Global Trust Company (GTC), a non-depository trust company sponsoring private investment products (2003 – 2019); EVP, NRS (2003 – 2019); GTC, EVP (2008 – 2019); EVP, Savings Banks Retirement Association (2003 – 2019), provider of qualified retirement benefit plans. |
| Ronald
C. Tritschler (1952) Chair of the Audit Committee, May 2022 to present; Independent Trustee, January 2007 to present; Interested Trustee, December 2002 to December 2006 |
Current: Chief Executive Officer, Director and Legal Counsel of The Webb Companies, a national real estate company, (2001– present); Director, Standpoint Multi-Asset (Cayman) Fund, Ltd. (2020 – present); Director of First State Bank of the Southeast (2000 – present).
Previous: Trustee, Peak Income Plus Fund (May 2022 – February 2023). |
28
| Trustees and Officers (Unaudited) (continued) |
| Catharine
B. McGauley (1977) Chair of the Pricing & Liquidity Committee, November 2022 to present; Independent Trustee, September 2022 to present |
Current: Lead Portfolio Manager of Atlantic Charter Insurance, a workers’ compensation insurer, (2010 – present); Investment Advisor for a Family Office (2015 – present); Senior Analyst/Advisor for a Boston real estate company and related family (2010 – present).
Previous: Trustee, Peak Income Plus Fund (May 2022 – February 2023). |
| Freddie
Jacobs, Jr. (1970) Independent Trustee, September 2022 to present |
Current: Chief Operating Officer and Chief Risk Officer Northeast Retirement Services LLC (NRS), and its subsidiary, Global Trust Company (GTC). NRS is a transfer agent and fund administrator, GTC is a non- depository trust company sponsoring private investment products (2021 – present); Chair, Board of Crispus Attucks Fund (2020 – present); Board Member of Camp Harbor View (2020 – present); Director, Sportsmen’s Tennis and Education Center (2019 – present).
Previous: SVP, Senior Risk Officer NRS (2013 – 2021); Trustee, Peak Income Plus Fund (May 2022 – February 2023); Trustee of Buckingham Browne & Nichols (2017 - June 2023). |
| * | The address for each Trustee is 225 Pictoria Drive, Suite 450, Cincinnati, Ohio 45246. |
| ** | As of the date of this report, the Trust consists of 29 series. |
The following table provides information regarding the Interested Trustees and Officers of the Trust.
| Name,
Address*, (Year of Birth), Position with Trust, Term of Position with Trust |
Principal
Occupation During Past 5 Years and Other Directorships |
| David
R. Carson (1958) Interested Trustee, August 2020 to present; President, January 2016 to August 2021 |
Current: Retired (2023 – present); Interested Trustee, Mammoth Institutional Credit Access Fund and Mammoth Institutional Equity Access Fund (November 2022 – present); Interested Trustee, Peak Income Plus Fund (May 2022 – present).
Previous: Interested Trustee of Ultimus Managers Trust, (January 2021 – April 2023); Senior Vice President Client Strategies of Ultimus Fund Solutions, LLC, (2013 – April 2023). |
29
| Trustees and Officers (Unaudited) (continued) |
| Martin
R. Dean (1963) President, August 2021 to present; Vice President, November 2020 to August 2021; Chief Compliance Officer, April 2021 to August 2021; Assistant Chief Compliance Officer, January 2016 to April 2021 |
Current: President, Northern Lights Compliance Services (2023 – present).
Previous: Senior Vice President, Head of Fund Compliance of Ultimus Fund Solutions, LLC (2016 – January 2023). |
| Zachary
P. Richmond (1980) Treasurer and Chief Financial Officer, November 2014 to present |
Current: Vice President, Director of Financial Administration for Ultimus Fund Solutions, LLC, (2015 – present). |
| Gweneth
K. Gosselink (1955) Chief Compliance Officer, August 2021 to present |
Current: Assistant Vice President, Senior Compliance Officer of Ultimus Fund Solutions, LLC, since 2019.
Previous: Chief Operating Officer & CCO at Miles Capital, Inc. (2013 – 2019). |
| Elisabeth
Dahl (1962) Secretary, May 2017 to present; Assistant Secretary, March 2016 to May 2017 |
Current: Attorney, Ultimus Fund Solutions, LLC since March 2016. |
| Timothy
J. Shaloo (1970) AML Compliance Officer, August 2023 to present |
Current: AVP, Compliance Officer (September 2023 – present).
Previous: Senior Compliance Analyst, Northern Lights Compliance Services, LLC (2021 – August 2023); Compliance Specialist, Ultimus Fund Solutions, LLC (2016 – 2020). |
| * | The address for each Officer is 225 Pictoria Drive, Suite 450, Cincinnati, Ohio 45246. |
| Other Information (Unaudited) |
The Fund’s Statement of Additional Information (“SAI”) includes additional information about the trustees and is available without charge, upon request. You may call toll-free at (800) 851-8845 to request a copy of the SAI or to make shareholder inquiries.
30
| PRIVACY NOTICE | |
| Rev: January 2020 | |
| FACTS | WHAT DOES FISHER INVESTMENTS INSTITUTIONAL GROUP U.S. LARGE CAP EQUITY ENVIRONMENTAL AND SOCIAL VALUES FUND (THE “FUND”) DO WITH YOUR PERSONAL INFORMATION? |
| Why? | Financial companies choose how they share your personal information. Federal law gives consumers the right to limit some but not all sharing. Federal law also requires us to tell you how we collect, share, and protect your personal information. Please read this notice carefully to understand what we do. |
| What? | The types of personal information we collect and share depend on the product or service you have with us. This information can include:
■ Social Security number
■ account balances and account transactions
■ transaction or loss history and purchase history
When you are no longer our customer, we continue to share your information as described in this notice. |
| How? | All financial companies need to share customers’ personal information to run their everyday business. In the section below, we list the reasons financial companies can share their customers’ personal information; the reasons the Fund chooses to share; and whether you can limit this sharing. |
| Reasons we can share your personal information | Does
the Fund share? |
Can
you limit this sharing? |
For our everyday business purposes— such as to process your transactions, maintain your account(s), respond to court orders and legal investigations, or report to credit bureaus |
Yes | No |
For our marketing purposes— to offer our products and services to you |
No | We don’t share |
| For joint marketing with other financial companies | No | We don’t share |
For our affiliates’ everyday business purposes— information about your transactions and experiences |
No | We don’t share |
For our affiliates’ everyday business purposes— information about your creditworthiness |
No | We don’t share |
| For nonaffiliates to market to you | No | We don’t share |
| Questions? | Call (800) 851-8845 |
31
| Who we are | |
| Who is providing this notice? | Fisher Investments Institutional Group U.S. Large Cap Equity Environmental and Social Values Fund Ultimus Fund Distributors, LLC (Distributor) Ultimus Fund Solutions, LLC (Administrator) |
| What we do | |
| How does the Fund protect my personal information? | To protect your personal information from unauthorized access and use, we use security measures that comply with federal law. These measures include computer safeguards and secured files and buildings. Our service providers are held accountable for adhering to strict policies and procedures to prevent any misuse of your nonpublic personal information. |
| How does the Fund collect my personal information? | We collect your personal information, for example, when you
■ open an account or deposit money
■ make deposits or withdrawals from your account or provide account information
We also collect your personal information from other companies. |
| Why can’t I limit all sharing? | Federal law gives you the right to limit only
■ sharing for affiliates’ everyday business purposes — information about your creditworthiness
■ affiliates from using your information to market to you
■ sharing for nonaffiliates to market to you
State laws and individual companies may give you additional rights to limit sharing. |
| Definitions | |
| Affiliates | Companies related by common ownership or control. They can be financial and nonfinancial companies.
■ Fisher Asset Management, LLC d/b/a Fisher Investments, the investment adviser to the Fund, could be deemed to be an affiliate. |
| Nonaffiliates | Companies not related by common ownership or control. They can be financial and nonfinancial companies.
■ The Fund does not share your personal information with nonaffiliates so they can market to you. |
| Joint marketing | A formal agreement between nonaffiliated financial companies that together market financial products or services to you.
■ The Fund does not jointly market. |
32
Proxy Voting
A description of the policies and procedures that the Fund uses to determine how to vote proxies relating to portfolio securities and information regarding how the Fund voted those proxies during the most recent twelve month period ended June 30, are available (1) without charge upon request by calling the Fund at (800) 851-8845 and (2) in Fund documents filed with the SEC on the SEC’s website at www.sec.gov.
TRUSTEES Daniel J. Condon, Chair David R. Carson Kenneth G.Y. Grant Freddie
Jacobs, Jr. Ronald C. Tritschler |
INDEPENDENT REGISTERED PUBLIC ACCOUNTING FIRM Cohen & Company, Ltd. 151 North Franklin Street, Suite 575 Chicago, IL 60606 |
OFFICERS Martin R. Dean, President Gweneth K. Gosselink, Chief Compliance Officer Zachary P. Richmond, Treasurer and Chief Financial Officer |
LEGAL COUNSEL Thompson Hine LLP 312 Walnut Street, 20th Floor Cincinnati, OH 45202 |
INVESTMENT ADVISER Fisher Asset Management, LLC 6500 International Parkway, Suite 2050 Plano, TX 75093 |
CUSTODIAN U.S. Bank, N.A. 425 Walnut Street Cincinnati, OH 45202 |
DISTRIBUTOR Ultimus Fund Distributors, LLC 225 Pictoria Drive, Suite 450 Cincinnati, OH 45246 |
ADMINISTRATOR, TRANSFER AGENT AND FUND ACCOUNTANT Ultimus
Fund Solutions, LLC Cincinnati, OH 45246 |
This report is intended only for the information of shareholders or those who have received the Fund’s prospectus which contains information about the Fund’s management fee and expenses. Please read the prospectus carefully before investing.
Distributed by Ultimus Fund Distributors, LLC
Member FINRA/SIPC
Fisher2-AR-23
FISHER INVESTMENTS INSTITUTIONAL GROUP FUND FAMILY |
Annual Report
August 31, 2023
Fisher Investments Institutional Group
U.S. Small Cap Equity Fund
Fund Adviser:
Fisher Asset Management, LLC
6500 International Parkway, Suite 2050
Plano, Texas 75093
(800) 851-8845
Fisher Investments Institutional Group U.S. Small Cap Equity Fund
Management’s Discussion of Fund Performance (Unaudited)
Dear Shareholder:
Market Outlook
Despite debt ceiling and “default” fears dominating headlines in Q2, S&P 500 returns were nicely positive as reality outperformed still-negative headlines, with solid gains bringing year-to-date returns as of June 30th, 2023 to 16.9%. With sentiment still quite dour and tailwinds gathering pace, we think this young bull market still has plenty of room to grow.
Information Technology, up 17.2%, and Communication Services, up 13.1%, significantly outperformed in Q2, as sentiment shifted positively, supported by the Bounce Effect—the tendency for bear market laggards to lead in a new bull market. These sectors ended Q2 as the best and third best-performers quarter to date. Tech and Tech-like sectors’ strong performance in the bounce off October’s low is emblematic of how bull markets begin. These categories fell more than the market last year, souring many investors’ views of their future. But that sentiment is proving excessively negative, in our view.
Financials rebounded in Q2, finishing up 5.3%, though year-to-date returns are still negative. First Republic’s failure in early May triggered some weakness and stirred fear, but no big plunge materialized. By the end of May, though, it appeared most investors shook off First Republic’s failure and moved on. There is little fundamental sign of trouble, either. Emergency Fed lending remained well below March and April levels. Meanwhile, the Fed’s Senior Loan Officer Opinion Survey showed slightly tighter credit standards and moderately weaker demand—merely extending the trend from before March’s banking failures. Loan demand was weakest for offices and multifamily properties amid commercial real estate fears—but these are well-known worries, not a shock to markets. Overall, we believe lending remains healthy.
Equities’ rise off last year’s bear market low surpassed 20.0% in early June, ending the month up 26.0% from October’s low. Headlines focused on this threshold, claiming it indicated a “new bull market” is underway. We don’t think hitting this milestone has any forward-looking significance, though the reactions were a telling sentiment snapshot. Even those who now acknowledge a bull market has run since last October aren’t uniformly bullish. Many portray the rally as a mirage of Big Tech outperformance masking weaker returns among the broad swath of S&P 500 constituents.
Yes, market breadth has narrowed, but we think this is a logical consequence of the bull market bounce. Tech saw the largest fall in the downturn, and the worst performers usually bounce fastest on the way up. Additionally, there is nothing inherently wrong with rapidly falling breadth—it is actually quite bullish historically. That said, it is worth noting that
1
Fisher Investments Institutional Group U.S. Small Cap Equity Fund
Management’s Discussion of Fund Performance (Unaudited) (continued)
the rally broadened in late Q2. Furthermore, the Tech rally slowed late quarter, lagging amid artificial intelligence (AI) regulatory fears and talk of new chip export restrictions for China. However, in our view, all the focus on AI seems to distract investors from Tech and Tech-like equities’ leadership since the low having a lot to do with the Bounce Effect. These firms are also true growth equities—likely attractive to many investors in the slowing-but-growing economy around us.
On the economic front, data was mixed in Q2—though most still topped analysts’ low expectations. Many were worried about June’s real personal consumption expenditures (PCE) flat reading, along with April’s downward revision to 0.2% m/m from 0.5%— arguing that the data points to consumer weakness. As ever, the bigger picture seems more nuanced. Goods spending weighed on the headline figure—down -0.4% m/m—while services rose 0.2% m/m. This is simply an extension of the longer-term trend—with the same apparent in Purchasing Managers’ Indices: S&P Global’s June manufacturing PMI fell into a deeper contraction (46.3) from May’s 48.4. Meanwhile, services—the much larger US GDP contributor—saw continued growth at a robust 54.1. While slightly slower than May’s revised 54.9, this was the second-fastest growth rate since April 2022. In our view, the market doesn’t appear to be previewing consumer weakness. Consumer Discretionary’s 14.6% return was second only to Information Technology 17.2% in the second quarter, while Consumer Staples underperformed significantly (0.5%). Even starker, the Consumer Discretionary and Consumer Staples sectors year-to-date returns ended June at 33.1% and 1.3%, respectively. The divide seemingly highlights strong demand for nonessentials—it doesn’t seem to us that equities anticipate consumers cutting back amid a financial downturn.
Elsewhere, the housing market showed signs of stabilizing—undercutting low demand fears. Housing starts were up big—21.7% m/m. Single-family starts rose 18.5% m/m. This isn’t surprising, given consumers are increasingly opting for turnkey homes due to lower associated maintenance and renovation costs—while elevated mortgage rates mean fewer homeowners are willing to sell and lose their current (lower) rates, limiting existing home supply. New construction is the main way real estate contributes to GDP. To us, that appears to be flipping from a modest headwind to an underappreciated small tailwind.
2
Fisher Investments Institutional Group U.S. Small Cap Equity Fund
Management’s Discussion of Fund Performance (Unaudited) (continued)
Meanwhile, the Fed paused its rate hike cycle in mid-June. Commentators have speculated the Fed isn’t done hiking—with such views seemingly confirmed by Fed Chair Jerome Powell stating that more 2023 hikes are possible. Plus, many dismissed May’s cooling inflation as too little to prevent the Fed from hiking further—supposedly threatening equities. We think this take is misguided. First, inflation slowed meaningfully in May:
Headline CPI cooled 0.1% m/m versus April’s 0.4%—and 4.0% y/y from April’s 4.9%. Personal Consumption Expenditures (PCE) and core PCE prices slowed, too—to 0.1% m/m and 0.3%, respectively, from April’s matching 0.4% readings. Owner’s equivalent rent skewed CPI and PCE higher—masking even cooler underlying inflation. Headline PCE is now more than halfway back to the Fed’s target, and monetary policy impacts are felt with a long and indeterminate lag. Whether the Fed sees it this way or not (and whether or not it acts) is unknowable—but regardless, the end of rate hikes seems much closer than the beginning. Second, and crucially, equities don’t care about the Fed’s unpredictable moves. Consider: Equities spiked briefly after late Q2’s Fed pause but were flat the next week. Returns since last summer show the Fed pausing—or even cutting rates—isn’t necessary for equities to climb: Equities are up 19.5% since the Fed began hiking in 75 basis point increments last June.
Debt ceiling fears reached their peak mid quarter, with many claiming failure to raise the limit by early June risked a “default” on the US’s obligations. We have long documented the fallacy of such notions, considering default is only the failure to pay interest and principal on Treasurys. The government can roll over maturing bonds after hitting the ceiling, so interest is the only question. There is ample revenue to cover it and, in our view, a constitutional requirement to do so. Regardless, Congress regularly fights over the limit in typical political fashion, only to eventually raise it.
While we think the debt ceiling is mostly political theatrics, some claim fear over it drove Tech and Tech-like Communication Services equities up leading US markets through the quarter. Commentators argued the possibility of a US “default” caused investors to ditch US Treasurys in favor of alternative “safe havens”—namely, Tech. But this argument has several flaws, in our view. First, we think AI enthusiasm partly underpinned Tech’s rise, given semiconductors—a crucial component in AI development—rose significantly, leading the Tech sector’s returns. Furthermore, we have found the hardest-hit bear market sectors bounce highest in a new bull market. Given Tech’s 2022 bear market decline, that bounce effect seems to be playing out as expected now. Then, too, the better-than-expected Q1 earnings season helped reality beat expectations. While backward-looking, we think this provided a sentiment boost for equities.
Some of this year’s big fears faded quickly in Q2. Much-feared regional banks continued their recovery, rising 6.7% overall in June. Fed borrowing was muted since First Republic’s failure in May while June saw a slight uptick. Overall borrowing was flat. Furthermore, overall loan growth remained stable, despite some short-term wiggles—and small bank lending even ticked up slightly. As discussed, debt ceiling fears disappeared as well, after
3
Fisher Investments Institutional Group U.S. Small Cap Equity Fund
Management’s Discussion of Fund Performance (Unaudited) (continued)
lawmakers finalized an early-June resolution. We see this as a sign gridlock is alive and well—with major legislation unable to pass, uncertainty remains low, fueling equities higher.
Performance Attribution
The Fisher Investments Institutional Group U.S. Small Cap Equity Fund outperformed the Russell 2000 Index for the period from September 1, 2022 through August 31, 2023. During this period, the Fund returned 12.68% while the Fund’s primary benchmark, the Russell 2000 Index, returned 4.65%. Sector allocation and equity selection contributed to relative return. Selection within Health Care was the largest contributor to relative outperformance, driven by clinical development services company Medpace Holdings, clinical-stage biotechnology company ImmunoGen, Inc. and screening and diagnostics company Exact Sciences Corporation. Additionally, an overweight to and selection within Consumer Discretionary contributed to performance as construction and development company M/I Homes, apparel retailer Abercrombie & Fitch, and fast casual restaurant Shake Shack outperformed relative to the Consumer Discretionary sector within the Russell 2000 Index. Conversely, selection within Information Technology was the largest detractor from relative return, driven by data analytics software company Alteryx, AI software company LivePerson and voice over IP company 8x8. Further, selection within Materials detracted from performance as mining companies Alcoa Corporation and Cleveland-Cliffs as well as garden products manufacturer Scotts Miracle-Gro underperformed relative to the Materials sector within the Russell 2000 Index.
Portfolio Shifts
For the period from September 1, 2022 through August 31, 2023, we have increased the Fund’s exposure to the Financials sector. We believe the Financials sector is likely to perform in-line with global markets. Positively, cyclical categories like Financials should perform well in our view, as equities recover from last year’s bear market. Recent high-profile bank failures appear highly isolated in nature—the broader banking system remains robust, with underappreciated balance sheet strength. Banks, worldwide, broadly have the highest capital and liquidity buffers in modern history, providing ample ability to weather economic uncertainty ahead. The strong balance sheet position of banks today allows for continued loan growth and the ability to keep lending margins wide via low dependence on more expensive interest-bearing funding sources.
Similarly, we decreased the Fund’s exposure to the Health Care sector. Health Care is a traditionally defensive sector that tends to underperform in economic rebounds and early bull markets—the environment we anticipate moving forward.
4
Investment Results (Unaudited)
Average Annual Total Returns(a) as of August 31, 2023
| Since | |||
| Inception | |||
| Fund/Index | One Year | Three Year | (7/17/20) |
| Fisher Investments Institutional Group U.S. Small Cap Equity Fund | 12.68% | 7.50% | 8.78% |
| Russell 2000 Index(b) | 4.65% | 8.12% | 9.87% |
| Expense | |||
| Ratios(c) | |||
| Gross | 72.50% | ||
| With Applicable Fee Waivers and Expense Reimbursements | 0.75% |
The performance quoted represents past performance, which does not guarantee future results. The investment return and principal value of an investment will fluctuate so that an investor’s shares, when redeemed, may be worth more or less than their original cost. The returns shown do not reflect deduction of taxes that a shareholder would pay on Fisher Investments Institutional Group U.S. Small Cap Equity Fund (the “Fund”) distributions or the redemption of Fund shares. Current performance of the Fund may be lower or higher than the performance quoted. The Fund’s investment objective, risks, charges and expenses should be considered carefully before investing. Performance data current to the most recent month end may be obtained by calling (800) 851-8845.
| (a) | Return figures reflect any change in price per share and assume the reinvestment of all distributions. |
| (b) | The Russell 2000 Index (“Russell Index”) is a widely recognized unmanaged index of equity securities and is representative of a broader domestic equity market and range of securities than are found in the Fund’s portfolio. Individuals cannot invest directly in the Russell Index; however, an individual can invest in exchange traded funds or other investment vehicles that attempt to track the performance of a benchmark index. Index returns assume reinvestment of dividends and do not reflect any fees or expenses. |
| (c) | The expense ratios are from the Fund’s prospectus dated December 29, 2022. Fisher Asset Management, LLC, d/b/a Fisher Investments (the “Adviser”) has contractually agreed to waive its management fee and/or reimburse the Fund’s other expenses in order to limit the Fund’s total annual operating expenses to 0.75% of the Fund’s average daily net assets through December 31, 2027 (excluding portfolio transaction and other investment-related costs (including brokerage fees and commissions); taxes; borrowing costs (such as interest and dividend expenses on securities sold short); acquired fund fees and expenses; certain fees and expenses associated with investments in other collective investment vehicles or derivative instruments (including for example option and swap fees and expenses); any administrative and/or shareholder servicing fees payable pursuant to a plan adopted by the Board of Trustees; expenses incurred in connection with any merger or reorganization; extraordinary expenses (such as litigation expenses, indemnification of Trust officers and Trustees and contractual indemnification of Fund service providers); and other expenses that the Trustees agree have not been incurred in the ordinary course of the Fund’s business). This expense cap may not be terminated prior to this date except by the Board of Trustees upon 60 days’ written notice to the Adviser. Each waiver/expense payment by the Adviser is subject to recoupment by the |
5
Investment Results (Unaudited) (continued)
Adviser from the Fund in the three years following the date the particular waiver/expense payment occurred, but only if such recoupment can be achieved without exceeding the annual expense limitation in effect at the time of the waiver/expense payment and any expense limitation in effect at the time of recoupment. Additional information pertaining to the Fund’s expense ratios as of August 31, 2023 can be found in the financial highlights.
The Fund’s investment objective, strategies, risks, charges and expenses should be considered carefully before investing. The Fund’s prospectus contains this and other important information about the Fund and may be obtained by calling (800) 851-8845. Please read it carefully before investing.
6
Investment Results (Unaudited) (continued)
Comparison of the Growth of a $10,000 Investment in the Fisher Investments Institutional Group U.S. Small Cap Equity Fund and the Russell 2000 Index.
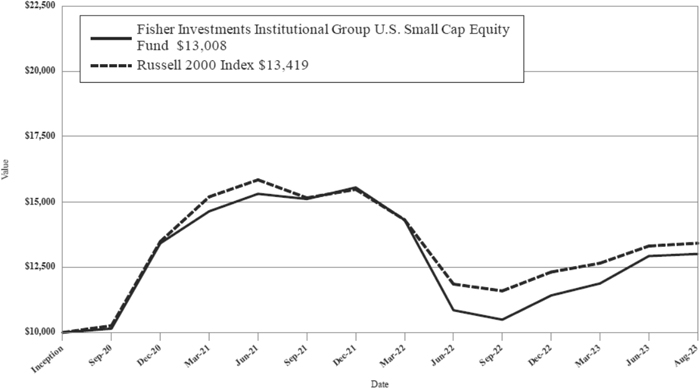
The graph shows the value of a hypothetical initial investment of $10,000 made on July 17, 2020 (commencement of operations) and held through August 31, 2023. Russell 2000 Index is a widely recognized unmanaged index of equity securities and is representative of a broader domestic equity market and range of securities than is found in the Fund’s portfolio. Individuals cannot invest directly in an index; however, an individual may invest in exchange traded funds or other investment vehicles that attempt to track the performance of a benchmark index. The returns shown do not reflect deduction of taxes that a shareholder would pay on Fund distributions or the redemption of Fund shares. Investment returns and principal values will fluctuate so that your shares, when redeemed, may be worth more or less than their original purchase price. THE FUND’S RETURN REPRESENTS PAST PERFORMANCE AND DOES NOT GUARANTEE OR PREDICT FUTURE RESULTS.
Current performance may be lower or higher than the performance data quoted. For more information on the Fund, and to obtain performance data current to the most recent month-end, or to request a prospectus, please call (800) 851-8845. You should carefully consider the investment objective, potential risks, management fees, and charges and expenses of the Fund before investing. The Fund’s prospectus contains this and other information about the Fund and should be read carefully before investing.
The Fund is distributed by Ultimus Fund Distributors, LLC, Member FINRA/SIPC.
7
Fund Holdings (Unaudited)
Fisher Investments Institutional Group U.S. Small Cap Equity Fund Holdings as of August 31, 2023*
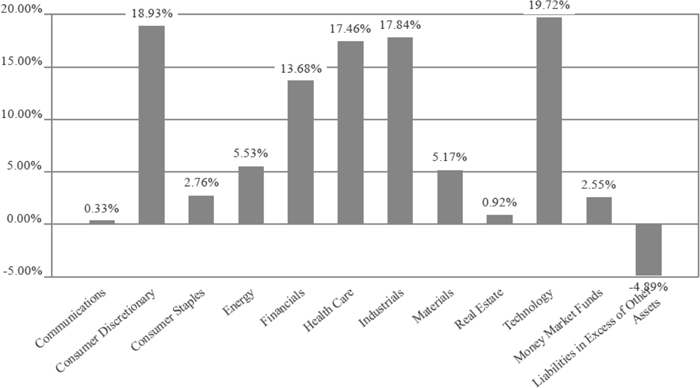
| * | As a percentage of net assets. |
The investment objective of the Fund is to seek to outperform, net of fees and expenses, the return of the Russell 2000 Index.
Availability of Portfolio Schedule (Unaudited)
The Fund files its complete schedule of portfolio holdings with the Securities and Exchange Commission (the “SEC”) for the first and third quarters of each fiscal year as an exhibit to its reports on Form N-PORT. The Fund’s Form N-PORT reports are available on the SEC’s website at www. sec.gov.
8
| Fisher Investments Institutional Group U.S. Small Cap Equity Fund |
| Schedule of Investments |
| August 31, 2023 |
| COMMON STOCKS — 102.34% | Shares | Fair Value | ||||||
| Communications — 0.33% | ||||||||
| 8X8, Inc.(a) | 199 | $ | 647 | |||||
| Consumer Discretionary — 18.93% | ||||||||
| Abercrombie & Fitch Co., Class A(a) | 63 | 3,386 | ||||||
| Builders FirstSource, Inc.(a) | 63 | 9,137 | ||||||
| Gap, Inc. (The) | 95 | 1,100 | ||||||
| Goodyear Tire & Rubber Co. (The)(a) | 69 | 891 | ||||||
| Hibbett, Inc. | 19 | 880 | ||||||
| M.D.C. Holdings, Inc. | 33 | 1,566 | ||||||
| M/I Homes, Inc.(a) | 37 | 3,633 | ||||||
| National Vision Holdings, Inc.(a) | 34 | 623 | ||||||
| Papa John’s International, Inc. | 35 | 2,650 | ||||||
| Pool Corp. | 5 | 1,828 | ||||||
| Revolve Group, Inc.(a) | 96 | 1,406 | ||||||
| Shake Shack, Inc., Class A(a) | 32 | 2,240 | ||||||
| Six Flags Entertainment Corp.(a) | 75 | 1,722 | ||||||
| Taylor Morrison Home Corp.(a) | 36 | 1,706 | ||||||
| Thor Industries, Inc. | 11 | 1,153 | ||||||
| Upbound Group, Inc. | 37 | 1,133 | ||||||
| Urban Outfitters, Inc.(a) | 40 | 1,328 | ||||||
| Wolverine World Wide, Inc. | 69 | 558 | ||||||
| 36,940 | ||||||||
| Consumer Staples — 2.76% | ||||||||
| Boston Beer Co., Inc. (The), Class A(a) | 5 | 1,827 | ||||||
| Freshpet, Inc.(a) | 47 | 3,549 | ||||||
| 5,376 | ||||||||
| Energy — 5.53% | ||||||||
| ChampionX Corp. | 136 | 4,909 | ||||||
| Helmerich & Payne, Inc. | 12 | 480 | ||||||
| Oceaneering International, Inc.(a) | 99 | 2,256 | ||||||
| Ovintiv, Inc. | 67 | 3,146 | ||||||
| 10,791 | ||||||||
| Financials — 13.68% | ||||||||
| Cadence Bank | 123 | 2,815 | ||||||
| Columbia Banking System, Inc. | 92 | 1,884 | ||||||
| Evercore Partners, Inc., Class A | 19 | 2,661 | ||||||
| First Merchants Corp. | 94 | 2,805 | ||||||
| Home BancShares, Inc. | 85 | 1,885 | ||||||
| Independent Bank Corp. | 42 | 2,269 | ||||||
| Moelis & Co., Class A | 40 | 1,896 | ||||||
| Old National Bancorp | 123 | 1,877 | ||||||
| Piper Sandler Companies | 18 | 2,682 | ||||||
| South State Corp. | 26 | 1,880 | ||||||
| Stifel Financial Corp. | 25 | 1,625 | ||||||
| Victory Capital Holdings, Inc. | 34 | 1,170 | ||||||
See accompanying notes which are an integral part of these financial statements.
9
| Fisher Investments Institutional Group U.S. Small Cap Equity Fund |
| Schedule of Investments (continued) |
| August 31, 2023 |
| COMMON STOCKS — 102.34% - continued | Shares | Fair Value | ||||||
| Financials — 13.68% - continued | ||||||||
| Virtus Investment Partners, Inc. | 6 | $ | 1,243 | |||||
| 26,692 | ||||||||
| Health Care — 17.46% | ||||||||
| Agios Pharmaceuticals, Inc.(a) | 37 | 1,015 | ||||||
| Align Technology, Inc.(a) | 8 | 2,961 | ||||||
| Alkermes PLC(a) | 14 | 409 | ||||||
| Avid Bioservices, Inc.(a) | 47 | 555 | ||||||
| Azenta, Inc.(a) | 27 | 1,524 | ||||||
| BioCryst Pharmaceuticals, Inc.(a) | 74 | 526 | ||||||
| Charles River Laboratories International, Inc.(a) | 5 | 1,034 | ||||||
| CONMED Corp. | 59 | 6,576 | ||||||
| Exact Sciences Corp.(a) | 13 | 1,088 | ||||||
| Haemonetics Corp.(a) | 29 | 2,602 | ||||||
| Halozyme Therapeutics, Inc.(a) | 17 | 724 | ||||||
| ImmunoGen, Inc.(a) | 126 | 1,996 | ||||||
| Ironwood Pharmaceuticals, Inc.(a) | 85 | 748 | ||||||
| Ligand Pharmaceuticals, Inc., Class B(a) | 13 | 855 | ||||||
| Medpace Holdings, Inc.(a) | 12 | 3,243 | ||||||
| Myriad Genetics, Inc.(a) | 40 | 714 | ||||||
| Neurocrine Biosciences Inc.(a) | 6 | 653 | ||||||
| OmniAb, Inc. - Earnout Shares(a)(b) | 4 | — | ||||||
| OmniAb, Inc. - Earnout Shares(a)(b) | 4 | — | ||||||
| Shockwave Medical, Inc.(a) | 5 | 1,102 | ||||||
| Vericel Corp.(a) | 26 | 854 | ||||||
| WillScot Mobile Mini Holdings Corp.(a) | 119 | 4,880 | ||||||
| 34,059 | ||||||||
| Industrials — 17.84% | ||||||||
| Cactus, Inc., Class A | 87 | 4,642 | ||||||
| Casella Waste Systems, Inc., Class A(a) | 31 | 2,442 | ||||||
| Ceridian HCM Holding, Inc.(a) | 16 | 1,160 | ||||||
| Chart Industries, Inc.(a) | 20 | 3,612 | ||||||
| Columbus McKinnon Corp. | 71 | 2,675 | ||||||
| H&E Equipment Services, Inc. | 60 | 2,719 | ||||||
| HEICO Corp. | 6 | 1,012 | ||||||
| Lincoln Electric Holdings, Inc. | 14 | 2,694 | ||||||
| Mercury Systems, Inc.(a) | 32 | 1,256 | ||||||
| Montrose Environmental Group Inc.(a) | 51 | 1,960 | ||||||
| Paycom Software, Inc. | 6 | 1,769 | ||||||
| Paylocity Holdings Corp.(a) | 30 | 6,015 | ||||||
| Vicor Corp.(a) | 42 | 2,846 | ||||||
| 34,802 | ||||||||
| Materials — 5.17% | ||||||||
| Alcoa Corp. | 56 | 1,684 | ||||||
| Cleveland-Cliffs, Inc.(a) | 100 | 1,529 | ||||||
| Steel Dynamics, Inc. | 17 | 1,812 | ||||||
| UFP Industries, Inc. | 29 | 3,026 | ||||||
See accompanying notes which are an integral part of these financial statements.
10
| Fisher Investments Institutional Group U.S. Small Cap Equity Fund |
| Schedule of Investments (continued) |
| August 31, 2023 |
| COMMON STOCKS — 102.34% - continued | Shares | Fair Value | ||||||
| Materials — 5.17% - continued | ||||||||
| Worthington Industries, Inc. | 27 | $ | 2,033 | |||||
| 10,084 | ||||||||
| Real Estate — 0.92% | ||||||||
| Macerich Co. (The) | 153 | 1,789 | ||||||
| Technology — 19.72% | ||||||||
| Advanced Energy Industries, Inc. | 51 | 6,021 | ||||||
| Alarm.com Holdings, Inc.(a) | 40 | 2,343 | ||||||
| Allscripts Healthcare Solutions, Inc.(a) | 275 | 3,679 | ||||||
| Alteryx, Inc., Class A(a) | 49 | 1,446 | ||||||
| Amkor Technology, Inc. | 39 | 1,090 | ||||||
| Box, Inc., Class A(a) | 34 | 900 | ||||||
| Cerence, Inc.(a) | 32 | 835 | ||||||
| Diodes, Inc.(a) | 64 | 5,239 | ||||||
| Donnelley Financial Solutions, Inc.(a) | 38 | 1,872 | ||||||
| Dropbox, Inc., Class A(a) | 38 | 1,056 | ||||||
| Five9, Inc.(a) | 11 | 796 | ||||||
| Knowles Corp.(a) | 123 | 1,972 | ||||||
| LivePerson, Inc.(a) | 74 | 311 | ||||||
| Manhattan Associates, Inc.(a) | 6 | 1,216 | ||||||
| Omnicell, Inc.(a) | 25 | 1,422 | ||||||
| Pegasystems, Inc. | 14 | 695 | ||||||
| Power Integrations, Inc. | 14 | 1,176 | ||||||
| Qualys, Inc.(a) | 6 | 934 | ||||||
| Silicon Laboratories, Inc.(a) | 7 | 944 | ||||||
| SPS Commerce, Inc.(a) | 7 | 1,303 | ||||||
| Synaptics, Inc.(a) | 15 | 1,313 | ||||||
| Tenable Holdings, Inc.(a) | 14 | 635 | ||||||
| Ultra Clean Holdings, Inc.(a) | 37 | 1,301 | ||||||
| 38,499 | ||||||||
| Total Common Stocks (Cost $170,487) | 199,679 | |||||||
| MONEY MARKET FUNDS - 2.55% | ||||||||
| First American Government Obligations Fund, Class X, 5.25%(c) | 4,983 | 4,983 | ||||||
| Total Money Market Funds (Cost $4,983) | 4,983 | |||||||
| Total Investments — 104.89% (Cost $175,470) | 204,662 | |||||||
| Liabilities in Excess of Other Assets — (4.89)% | (9,543 | ) | ||||||
| NET ASSETS — 100.00% | $ | 195,119 | ||||||
| (a) | Non-income producing security. |
| (b) | Security is currently being valued according to the fair value procedures of the Adviser, as Valuation Designee, under oversight of the Board’s Pricing & Liquidity Committee. |
| (c) | Rate disclosed is the seven day effective yield as of August 31, 2023. |
See accompanying notes which are an integral part of these financial statements.
11
| Fisher Investments Institutional Group U.S. Small Cap Equity Fund |
| Statement of Assets and Liabilities |
| August 31, 2023 |
| Assets | ||||
| Investments in securities at fair value (cost $175,470) | $ | 204,662 | ||
| Dividends receivable | 253 | |||
| Receivable from Adviser | 13,621 | |||
| Prepaid expenses | 2,963 | |||
| Total Assets | 221,499 | |||
| Liabilities | ||||
| Payable to affiliates | 4,917 | |||
| Accrued audit and tax fees | 17,900 | |||
| Other accrued expenses | 3,563 | |||
| Total Liabilities | 26,380 | |||
| Net Assets | $ | 195,119 | ||
| Net Assets consist of: | ||||
| Paid-in capital | $ | 176,731 | ||
| Accumulated earnings | 18,388 | |||
| Net Assets | $ | 195,119 | ||
| Shares outstanding (unlimited number of shares authorized, no par value) | 17,282 | |||
| Net asset value, offering and redemption price per share | $ | 11.29 |
See accompanying notes which are an integral part of these financial statements.
12
| Fisher Investments Institutional Group U.S. Small Cap Equity Fund |
| Statement of Operations |
| For the year ended August 31, 2023 |
| Investment Income | ||||
| Dividend income (net of foreign taxes withheld of $1) | $ | 1,695 | ||
| Total investment income | 1,695 | |||
| Expenses | ||||
| Administration | 49,764 | |||
| Legal | 19,994 | |||
| Audit and tax | 17,726 | |||
| Trustee | 16,636 | |||
| Compliance services | 12,031 | |||
| Transfer agent | 12,000 | |||
| Report printing | 4,246 | |||
| Custodian | 2,544 | |||
| Pricing | 1,564 | |||
| Registration | 1,529 | |||
| Adviser | 1,225 | |||
| Miscellaneous | 21,762 | |||
| Total expenses | 161,021 | |||
| Fees waived and expenses reimbursed by Adviser | (159,670 | ) | ||
| Net operating expenses | 1,351 | |||
| Net investment income | 344 | |||
| Net Realized and Change in Unrealized Gain (Loss) on Investments | ||||
| Net realized loss on investment securities transactions | (9,693 | ) | ||
| Net change in unrealized appreciation of investment securities | 31,301 | |||
| Net realized and change in unrealized gain on investments | 21,608 | |||
| Net increase in net assets resulting from operations | $ | 21,952 |
See accompanying notes which are an integral part of these financial statements.
13
| Fisher Investments Institutional Group U.S. Small Cap Equity Fund |
| Statements of Changes in Net Assets |
| For the Year | For the Year | |||||||
| Ended August | Ended August | |||||||
| 31, 2023 | 31, 2022 | |||||||
| Increase (Decrease) in Net Assets due to: | ||||||||
| Operations | ||||||||
| Net investment income (loss) | $ | 344 | $ | (409 | ) | |||
| Net realized gain (loss) on investment securities transactions | (9,693 | ) | 14,605 | |||||
| Net change in unrealized appreciation (depreciation) of investment securities | 31,301 | (75,719 | ) | |||||
| Net increase (decrease) in net assets resulting from operations | 21,952 | (61,523 | ) | |||||
| Distributions From: | ||||||||
| Earnings | — | (13,339 | ) | |||||
| Net realized gains | (13,142 | ) | — | |||||
| Total distributions | (13,142 | ) | (13,339 | ) | ||||
| Capital Transactions | ||||||||
| Reinvestment of distributions | 13,143 | 13,338 | ||||||
| Amount paid for shares redeemed | — | (13 | ) | |||||
| Net increase in net assets resulting from capital transactions | 13,143 | 13,325 | ||||||
| Total Increase (Decrease) in Net Assets | 21,953 | (61,537 | ) | |||||
| Net Assets | ||||||||
| Beginning of year | 173,166 | 234,703 | ||||||
| End of year | $ | 195,119 | $ | 173,166 | ||||
| Share Transactions | ||||||||
| Shares issued in reinvestment of distributions | 1,337 | 926 | ||||||
| Shares redeemed | — | (1 | ) | |||||
| Net increase in shares | 1,337 | 925 | ||||||
See accompanying notes which are an integral part of these financial statements.
14
| Fisher Investments Institutional Group U.S. Small Cap Equity Fund |
| Financial Highlights |
(For a share outstanding during each period)
| For the | ||||||||||||||||
| For the | For the | For the | Period | |||||||||||||
| Year Ended | Year Ended | Year Ended | Ended | |||||||||||||
| August 31, | August 31, | August 31, | August 31, | |||||||||||||
| 2023 | 2022 | 2021 | 2020(a) | |||||||||||||
| Selected Per Share Data: | ||||||||||||||||
| Net asset value, beginning of period | $ | 10.86 | $ | 15.63 | $ | 10.47 | $ | 10.00 | ||||||||
| Investment operations: | ||||||||||||||||
| Net investment income (loss) | 0.02 | (0.03 | ) | (0.03 | ) | — | (b) | |||||||||
| Net realized and unrealized gain (loss) | 1.23 | (3.85 | ) | 5.21 | 0.47 | |||||||||||
| Total from investment operations | 1.25 | (3.88 | ) | 5.18 | 0.47 | |||||||||||
| Less distributions to shareholders from: | ||||||||||||||||
| Net realized gains | (0.82 | ) | (0.89 | ) | (0.02 | ) | — | |||||||||
| Total distributions | (0.82 | ) | (0.89 | ) | (0.02 | ) | — | |||||||||
| Net asset value, end of period | $ | 11.29 | $ | 10.86 | $ | 15.63 | $ | 10.47 | ||||||||
| Total Return(c) | 12.68 | % | (26.23 | )% | 49.47 | % | 4.70 | % (d) | ||||||||
| Ratios and Supplemental Data: | ||||||||||||||||
| Net assets, end of period (000 omitted) | $ | 195 | $ | 173 | $ | 235 | $ | 157 | ||||||||
| Ratio of net expenses to average net assets | 0.75 | % | 0.75 | % | 0.75 | % | 0.75 | % (e) | ||||||||
| Ratio of gross expenses to average net assets before waiver and reimbursement | 89.41 | % | 72.50 | % | 68.54 | % | 188.33 | % (e) | ||||||||
| Ratio of net investment income (loss) to average net assets | 0.19 | % | (0.20 | )% | (0.23 | )% | 0.30 | % (e) | ||||||||
| Portfolio turnover rate | 26 | % | 30 | % | 24 | % | 2 | % (d) | ||||||||
| (a) | For the period July 17, 2020 (commencement of operations) to August 31, 2020. |
| (b) | Rounds to less than $0.005 per share. |
| (c) | Total return represents the rate that the investor would have earned or lost on an investment in the Fund, assuming reinvestment of distributions. |
| (d) | Not annualized. |
| (e) | Annualized. |
See accompanying notes which are an integral part of these financial statements.
15
| Fisher Investments Institutional Group U.S. Small Cap Equity Fund |
| Notes to the Financial Statements |
| August 31, 2023 |
NOTE 1. ORGANIZATION
Fisher Investments Institutional Group U.S. Small Cap Equity Fund (the “Fund”) is registered under the Investment Company Act of 1940, as amended (the “1940 Act”), as a diversified series of Unified Series Trust (the “Trust”) on November 12, 2018. The Trust is an open-end investment company established under the laws of Ohio by an Agreement and Declaration of Trust dated October 14, 2002, as amended (the “Trust Agreement”). The Trust Agreement permits the Board of Trustees of the Trust (the “Board”) to issue an unlimited number of shares of beneficial interest of separate series without par value. The Fund is one of a series of funds currently authorized by the Board. The Fund commenced operations on July 17, 2020. The investment adviser to the Fund is Fisher Asset Management, LLC, d/b/a Fisher Investments (the “Adviser”). The investment objective of the Fund is to seek to outperform, net of fees and expenses, the return of the Russell 2000 Index.
NOTE 2. SIGNIFICANT ACCOUNTING POLICIES
The Fund is an investment company and follows accounting and reporting guidance under Financial Accounting Standards Board Accounting Standards Codification (“ASC”) Topic 946, “Financial Services-Investment Companies”, including Accounting Standards Update 2013-08. The following is a summary of significant accounting policies followed by the Fund in the preparation of its financial statements. These policies are in conformity with generally accepted accounting principles in the United States of America (“GAAP”).
Regulatory update – Tailored Shareholder Reports for Mutual Funds and Exchange-Traded Funds (“ETFs”) – Effective January 24, 2023, the Securities and Exchange Commission (the “SEC”) adopted rule and form amendments to require mutual funds and ETFs to transmit concise and visually engaging streamlined annual and semiannual reports to shareholders that highlight key information. Other information, including financial statements, will no longer appear in a streamlined shareholder report but must be available online, delivered free of charge upon request, and filed on a semiannual basis on Form N-CSR. The rule and form amendments have a compliance date of July 24, 2024. At this time, management is evaluating the impact of these amendments on the shareholder reports for the Fund.
Estimates – The preparation of financial statements in conformity with GAAP requires management to make estimates and assumptions that affect the reported amounts of assets and liabilities and disclosure of contingent assets and liabilities at the date of the financial statements and the reported amounts of increases and decreases in net assets from operations during the reporting period. Actual results could differ from those estimates.
16
| Fisher Investments Institutional Group U.S. Small Cap Equity Fund |
| Notes to the Financial Statements (continued) |
| August 31, 2023 |
Federal Income Taxes – The Fund makes no provision for federal income or excise tax. The Fund has qualified and intends to qualify each year as a regulated investment company (“RIC”) under subchapter M of the Internal Revenue Code of 1986, as amended, by complying with the requirements applicable to RICs and by distributing substantially all of its taxable income. The Fund also intends to distribute sufficient net investment income and net realized capital gains, if any, so that it will not be subject to excise tax on undistributed income and gains. If the required amount of net investment income or gains is not distributed, the Fund could incur a tax expense.
As of and during the fiscal year ended August 31, 2023, the Fund did not have any liabilities for any unrecognized tax benefits. The Fund recognizes interest and penalties, if any, related to unrecognized tax benefits as income tax expense in the Statement of Operations when incurred. During the year, the Fund did not incur any interest or penalties. Management of the Fund has reviewed tax positions taken in tax years that remain subject to examination by all major tax jurisdictions, including federal (i.e., the previous three tax year ends and the interim tax period since then, as applicable) and has concluded that no provision for unrecognized tax benefits or expenses is required in these financial statements and does not expect this to change over the next twelve months.
Expenses – Expenses incurred by the Trust that do not relate to a specific fund of the Trust are allocated to the individual funds of the Trust based on each fund’s relative net assets or another appropriate basis (as determined by the Board).
Security Transactions and Related Income – The Fund follows industry practice and records security transactions on the trade date for financial reporting purposes. The specific identification method is used for determining gains or losses for financial statements and income tax purposes. Dividend income is recorded on the ex-dividend date and interest income is recorded on an accrual basis. Distributions received from investments in real estate investment trusts (“REITs”) that represent a return of capital or capital gain are recorded as a reduction of the cost of investment or as a realized gain, respectively. The calendar year-end amounts of ordinary income, capital gains, and return of capital included in distributions received from the Fund’s investments in REITs are reported to the Fund after the end of the calendar year; accordingly, the Fund estimates these amounts for accounting purposes until the characterization of REIT distributions is reported. Estimates are based on the most recent REIT distributions information available. Withholding taxes on foreign dividends and related reclaims have been provided for in accordance with the Fund’s understanding of the applicable country’s tax rules and rates. Discounts and premiums on securities purchased are accreted or amortized using the effective interest method.
17
| Fisher Investments Institutional Group U.S. Small Cap Equity Fund |
| Notes to the Financial Statements (continued) |
| August 31, 2023 |
Dividends and Distributions – The Fund intends to distribute its net investment income and net realized long-term and short-term capital gains, if any, at least annually. Dividends and distributions to shareholders, which are determined in accordance with income tax regulations, are recorded on the ex-dividend date. The treatment for financial reporting purposes of distributions made to shareholders during the period from net investment income or net realized capital gains may differ from their ultimate treatment for federal income tax purposes. These differences are caused primarily by differences in the timing of the recognition of certain components of income, expense or realized capital gain for federal income tax purposes. Where such differences are permanent in nature, they are reclassified among the components of net assets based on their ultimate characterization for federal income tax purposes. Any such reclassifications will have no effect on net assets, results of operations or net asset value (“NAV”) per share of the Fund.
NOTE 3. SECURITIES VALUATION AND FAIR VALUE MEASUREMENTS
The Fund values its portfolio securities at fair value as of the close of regular trading on the New York Stock Exchange (“NYSE”) (normally 4:00 p.m. Eastern Time) on each business day the NYSE is open for business. Fair value is defined as the price that the Fund would receive upon selling an investment in a timely transaction to an independent buyer in the principal or most advantageous market of the investment. GAAP establishes a three-tier hierarchy to maximize the use of observable market data and minimize the use of unobservable inputs and to establish classification of fair value measurements for disclosure purposes.
Inputs refer broadly to the assumptions that market participants would use in pricing the asset or liability, including assumptions about risk (the risk inherent in a particular valuation technique used to measure fair value including a pricing model and/or the risk inherent in the inputs to the valuation technique). Inputs may be observable or unobservable. Observable inputs are inputs that reflect the assumptions market participants would use in pricing the asset or liability developed based on market data obtained and available from sources independent of the reporting entity. Unobservable inputs are inputs that reflect the reporting entity’s own assumptions about the assumptions market participants would use in pricing the asset or liability developed based on the best information available in the circumstances.
Various inputs are used in determining the value of the Fund’s investments. These inputs are summarized in the three broad levels listed below.
| ● | Level 1 – unadjusted quoted prices in active markets for identical investments and/or registered investment companies where the value per share is determined and published |
18
| Fisher Investments Institutional Group U.S. Small Cap Equity Fund |
| Notes to the Financial Statements (continued) |
| August 31, 2023 |
and is the basis for current transactions for identical assets or liabilities at the valuation date
| ● | Level 2 – other significant observable inputs (including, but not limited to, quoted prices for an identical security in an inactive market, quoted prices for similar securities, interest rates, prepayment speeds, credit risk, etc.) |
| ● | Level 3 – significant unobservable inputs (including the Fund’s own assumptions in determining fair value of investments based on the best information available) |
The inputs used to measure fair value may fall into different levels of the fair value hierarchy. In such cases, for disclosure purposes, the level in the fair value hierarchy which is reported is determined based on the lowest level input that is significant to the fair value measurement in its entirety.
Equity securities that are traded on any stock exchange are generally valued at the last quoted sale price on the security’s primary exchange. Lacking a last sale price, an exchange-traded security is generally valued at its last bid price. Securities traded in the Nasdaq over-the-counter market are generally valued at the Nasdaq Official Closing Price. When using market quotations and when the market is considered active, the security is classified as a Level 1 security. In the event that market quotations are not readily available or are considered unreliable due to market or other events, securities are valued in good faith by the Adviser, as Valuation Designee, under oversight of the Board’s Pricing & Liquidity Committee. The Adviser has adopted written policies and procedures for valuing securities and other assets in circumstances where market quotes are not readily available in conformity with guidelines adopted by the Board. In the event that market quotes are not readily available, and the security or asset cannot be valued pursuant to one of the valuation methods, the value of the security or asset will be determined in good faith by the Valuation Designee pursuant to its policies and procedures. Any fair value provided by the Valuation Designee is subject to the ultimate review of the pricing methodology by the Pricing & Liquidity Committee of the Board on a quarterly basis. Under these policies, the securities will be classified as Level 2 or 3 within the fair value hierarchy, depending on the inputs used.
Investments in mutual funds, including money market mutual funds, are generally priced at the ending NAV provided by the service agent of the mutual funds. These securities are categorized as Level 1 securities.
In accordance with the Trust’s valuation policies and fair value determinations pursuant to Rule 2a-5 under the 1940 Act, the Valuation Designee is required to consider all appropriate factors relevant to the value of securities for which it has determined other pricing sources
19
| Fisher Investments Institutional Group U.S. Small Cap Equity Fund |
| Notes to the Financial Statements (continued) |
| August 31, 2023 |
are not available or reliable as described above. No single method exists for determining fair value because fair value depends upon the circumstances of each individual case. As a general principle, the current fair value of a security being valued by the Valuation Designee would be the amount that the Fund might reasonably expect to receive upon the current sale. Methods that are in accordance with this principle may, for example, be based on (i) a multiple of earnings; (ii) a discount from market prices of a similar freely traded security (including a derivative security or a basket of securities traded on other markets, exchanges or among dealers); or (iii) yield to maturity with respect to debt issues, or a combination of these and other methods. Fair-value pricing is permitted if, in the Valuation Designee’s opinion, the validity of market quotations appears to be questionable based on factors such as evidence of a thin market in the security based on a small number of quotations, a significant event occurs after the close of a market but before the Fund’s NAV calculation that may affect a security’s value, or the Valuation Designee is aware of any other data that calls into question the reliability of market quotations. The Valuation Designee may obtain assistance from others in fulfilling its duties. For example, it may seek assistance from pricing services, fund administrators, sub-advisers, accountants, or counsel; it may also consult the Trust’s Fair Value Committee. The Valuation Designee, however, remains responsible for the final fair value determination and may not designate or assign that responsibility to any third party.
The following is a summary of the inputs used to value the Fund’s investments as of August 31, 2023:
| Valuation Inputs | ||||||||||||||||
| Assets | Level 1 | Level 2 | Level 3 | Total | ||||||||||||
| Common Stocks(a) | $ | 199,679 | $ | — | $ | — | (b) | $ | 199,679 | |||||||
| Money Market Funds | 4,983 | — | — | 4,983 | ||||||||||||
| Total | $ | 204,662 | $ | — | $ | — | $ | 204,662 | ||||||||
| (a) | Refer to Schedule of Investments for sector classifications. |
| (b) | OmniAb, Inc. is currently being fair valued according to the fair value procedures of the Adviser, as Valuation Designee, under oversight of the Board’s Pricing & Liquidity Committee. |
NOTE 4. FEES AND OTHER TRANSACTIONS WITH AFFILIATES AND OTHER SERVICE PROVIDERS
The Adviser, under the terms of the management agreement (the “Agreement”) with the Trust with respect to the Fund, manages the Fund’s investments. As compensation for its management services, the Fund is obligated to pay the Adviser a management fee computed and accrued daily and paid monthly at an annual rate of 0.68% of the Fund’s average daily net assets. For the fiscal year ended August 31, 2023, the Adviser earned management fees of $1,225 from the Fund before the waiver and reimbursement described below.
20
| Fisher Investments Institutional Group U.S. Small Cap Equity Fund |
| Notes to the Financial Statements (continued) |
| August 31, 2023 |
The Adviser has contractually agreed to waive its management fee and/or to reimburse the Fund’s other expenses in order to limit the Fund’s total annual operating expenses to 0.75% of the Fund’s average daily net assets through December 31, 2027 (excluding portfolio transaction and other investment-related costs (including brokerage fees and commissions); taxes; borrowing costs (such as interest and dividend expenses on securities sold short); acquired fund fees and expenses; fees and expenses associated with investments in other collective investment vehicles or derivative instruments (including for example option and swap fees and expenses); any administrative and/or shareholder servicing fees payable pursuant to a plan adopted by the Board; expenses incurred in connection with any merger or reorganization; extraordinary expenses (such as litigation expenses, indemnification of Trust officers and Trustees and contractual indemnification of Fund service providers); and other expenses that the Trustees agree have not been incurred in the ordinary course of the Fund’s business). This expense cap may not be terminated prior to this date except by the Board. For the fiscal year ended August 31, 2023, the Adviser waived fees and reimbursed expenses in the amount of $159,670 for the Fund. At August 31, 2023, the Adviser owed the Fund $13,621.
Each waiver/expense payment by the Adviser (but not management fee waiver) is subject to recoupment by the Adviser from the Fund in the three years following the date the particular waiver/expense payment occurred, but only if such recoupment can be achieved without exceeding the annual expense limitation in effect at the time of the waiver/expense payment and any expense limitation in effect at the time of the recoupment. As of August 31, 2023, the Adviser may seek repayment of expense reimbursements in amounts as follows:
| Recoverable Through | ||||
| August 31, 2024 | $ | 139,672 | ||
| August 31, 2025 | 148,379 | |||
| August 31, 2026 | 159,670 | |||
Ultimus Fund Solutions, LLC (“Ultimus”) provides administration, fund accounting and transfer agent services to the Fund. The Fund pays Ultimus fees in accordance with the agreements for such services.
Northern Lights Compliance Services, LLC (“NLCS”), an affiliate of Ultimus, provides a Chief Compliance Officer to the Trust, as well as related compliance services, pursuant to a consulting agreement between NLCS and the Trust. Under the terms of such agreement, NLCS receives fees from the Fund, which are approved annually by the Board.
Under the terms of a Distribution Agreement with the Trust, Ultimus Fund Distributors, LLC (the “Distributor”) serves as principal underwriter to the Fund. The Distributor is a
21
| Fisher Investments Institutional Group U.S. Small Cap Equity Fund |
| Notes to the Financial Statements (continued) |
| August 31, 2023 |
wholly-owned subsidiary of Ultimus. The Distributor is compensated by the Adviser (not the Fund) for acting as principal underwriter.
Certain officers of the Trust are also employees of Ultimus and such persons are not paid by the Fund for serving in such capacities. One Trustee is a former employee of Ultimus who is not currently paid by the Fund for serving in such capacity.
The Board supervises the business activities of the Trust. Each Trustee serves as a trustee until termination of the Trust unless the Trustee dies, resigns, retires, or is removed. The Chair of the Board and more than 75% of the Trustees are “Independent Trustees,” which means that they are not “interested persons” as defined in the 1940 Act. The Independent Trustees review and establish compensation at least annually. Each Independent Trustee of the Trust receives annual compensation, which is an established amount paid quarterly per fund in the Trust at the time of the regular quarterly Board meetings. The Chair of the Board receives the highest compensation, commensurate with his additional duties and each Chair of a committee receives additional compensation as well. Independent Trustees also receive additional fees for attending any special meetings. In addition, the Trust reimburses Independent Trustees for out-of-pocket expenses incurred in conjunction with attendance at meetings.
NOTE 5. INVESTMENT TRANSACTIONS
For the fiscal year ended August 31, 2023, purchases and sales of investment securities, other than short-term investments, were $47,250 and $53,689, respectively.
There were no purchases or sales of long-term U.S. government obligations during the fiscal year ended August 31, 2023.
NOTE 6. BENEFICIAL OWNERSHIP
The beneficial ownership, either directly or indirectly, of more than 25% of the voting securities of a fund creates a presumption of control of a fund, under Section 2(a)(9) of the 1940 Act. As of August 31, 2023, the Adviser owned 100% of the Fund’s outstanding shares. As a result, the Adviser may be deemed to control the Fund.
22
| Fisher Investments Institutional Group U.S. Small Cap Equity Fund |
| Notes to the Financial Statements (continued) |
| August 31, 2023 |
NOTE 7. FEDERAL TAX INFORMATION
At August 31, 2023, the net unrealized appreciation (depreciation) and tax cost of investments for tax purposes was as follows:
| Gross unrealized appreciation | $ | 57,056 | ||
| Gross unrealized depreciation | (28,436 | ) | ||
| Net unrealized appreciation on investments | $ | 28,620 | ||
| Tax cost of investments | $ | 176,042 |
The tax character of distributions paid for the fiscal years ended August 31, 2023 and August 31, 2022 were as follows:
| 2023 | 2022 | |||||||
| Distributions paid from: | ||||||||
| Ordinary income(a) | $ | 1 | $ | 10,864 | ||||
| Long-term capital gains | 13,141 | 2,475 | ||||||
| Total distributions paid | $ | 13,142 | $ | 13,339 | ||||
| (a) | Short-term capital gain distributions are treated as ordinary income for tax purposes. |
At August 31, 2023, the components of accumulated earnings (deficit) on a tax basis were as follows:
| Undistributed ordinary income | $ | 42 | ||
| Accumulated capital and other losses | (10,274 | ) | ||
| Unrealized appreciation on investments | 28,620 | |||
| Total accumulated earnings | $ | 18,388 |
As of August 31, 2023, the Fund had accumulated short-term capital loss carryforwards of $1,994 and long-term capital loss carryforwards of $8,280, not subject to expiration.
The differences between book-basis and tax-basis unrealized appreciation (depreciation) are attributable primarily to tax deferral of losses on wash sales
NOTE 8. SECTOR RISK
If the Fund has significant investments in the securities of issuers within a particular sector, any development affecting that sector will have a greater impact on the value of the net assets of the Fund than would be the case if the Fund did not have significant investments in that sector. In addition, this may increase the risk of loss in the Fund and increase the volatility of the Fund’s NAV per share. For instance, economic or market factors, regulatory
23
| Fisher Investments Institutional Group U.S. Small Cap Equity Fund |
| Notes to the Financial Statements (continued) |
| August 31, 2023 |
changes or other developments may negatively impact all companies in a particular sector, and therefore the value of the Fund’s portfolio will be adversely affected.
NOTE 9. COMMITMENTS AND CONTINGENCIES
The Trust indemnifies its officers and Trustees for certain liabilities that may arise from their performance of their duties to the Trust or the Fund. Additionally, in the normal course of business, the Trust enters into contracts that contain a variety of representations and warranties which provide general indemnifications. The Trust’s maximum exposure under these arrangements is unknown, as this would involve future claims that may be made against the Trust that have not yet occurred.
NOTE 10. SUBSEQUENT EVENTS
Management of the Fund has evaluated the need for disclosures and/or adjustments resulting from subsequent events through the date at which these financial statements were issued. Based upon this evaluation, management has determined there were no items requiring adjustment of the financial statements or additional disclosure.
24
| Report of Independent Registered Public Accounting Firm |
To
the Shareholders of Fisher Investments Institutional Group Fund Family and
Board of Trustees of Unified Series Trust
Opinion on the Financial Statements
We have audited the accompanying statement of assets and liabilities, including the schedule of investments, of Fisher Investments Institutional Group U.S. Small Cap Equity Fund (the “Fund”), a series of Unified Series Trust, as of August 31, 2023, the related statement of operations for the year then ended, the statements of changes in net assets for each of the two years in the period then ended, the related notes, and the financial highlights for the years ended August 31, 2023, 2022, 2021 and for the period July 17, 2020 (commencement of operations) to August 31, 2020 (collectively referred to as the “financial statements”). In our opinion, the financial statements present fairly, in all material respects, the financial position of the Fund as of August 31, 2023, the results of its operations for the year then ended, the changes in net assets for each of the two years in the period then ended, and the financial highlights for the years ended August 31, 2023, 2022, 2021 and for the period July 17, 2020 (commencement of operations) to August 31, 2020, in conformity with accounting principles generally accepted in the United States of America.
Basis for Opinion
These financial statements are the responsibility of the Fund’s management. Our responsibility is to express an opinion on the Fund’s financial statements based on our audits. We are a public accounting firm registered with the Public Company Accounting Oversight Board (United States) (“PCAOB”) and are required to be independent with respect to the Fund in accordance with the U.S. federal securities laws and the applicable rules and regulations of the Securities and Exchange Commission and the PCAOB.
We conducted our audits in accordance with the standards of the PCAOB. Those standards require that we plan and perform the audit to obtain reasonable assurance about whether the financial statements are free of material misstatement whether due to error or fraud.
Our audits included performing procedures to assess the risks of material misstatement of the financial statements, whether due to error or fraud, and performing procedures that respond to those risks. Such procedures included examining, on a test basis, evidence regarding the amounts and disclosures in the financial statements. Our procedures included confirmation of securities owned as of August 31, 2023, by correspondence with the custodian. Our audits also included evaluating the accounting principles used and significant estimates made by management, as well as evaluating the overall presentation of the financial statements. We believe that our audits provide a reasonable basis for our opinion.
We have served as the auditor of one or more investment companies advised by Fisher Asset Management, LLC since 2017.
COHEN & COMPANY, LTD.
Chicago, Illinois
October 27, 2023
25
| Liquidity Risk Management Program (Unaudited) |
The Trust has adopted and implemented a written liquidity risk management program (the “Program”) as required by Rule 22e-4 (the “Liquidity Rule”) under the 1940 Act. The Program is reasonably designed to assess and manage the Fund’s liquidity risk, taking into consideration, among other factors, the Fund’s investment strategy and the liquidity of its portfolio investments during normal and reasonably foreseeable stressed conditions; its short and long- term cash flow projections; and its cash holdings and access to other funding sources. The Board approved the appointment of the Liquidity Administrator Committee, comprising certain Trust officers and employees of the Adviser. The Liquidity Administrator Committee maintains Program oversight and reports to the Board on at least an annual basis regarding the Program’s operational effectiveness through a written report (the “Report”). The most recent Report, which was presented to the Board for consideration at its meeting held on August 14-15, 2023, outlined the operation of the Program and the adequacy and effectiveness of the Program’s implementation. During the review period, the Fund did not experience unusual stress or disruption to its operations related to purchase and redemption activity. Also, during the review period the Fund held adequate levels of cash and highly liquid investments to meet shareholder redemption activities in accordance with applicable requirements. The Report concluded that the Program is reasonably designed to prevent violation of the Liquidity Rule and has been effectively implemented.
26
| Summary of Fund Expenses (Unaudited) |
As a shareholder of the Fund, you incur two types of costs: (1) transaction costs and (2) ongoing costs, including management fees and other Fund expenses. These examples are intended to help you understand your ongoing costs (in dollars) of investing in the Fund and to compare these costs with the ongoing costs of investing in other funds. The example is based on an investment of $1,000 invested at the beginning of the period and held for the entire period from March 1, 2023 through August 31, 2023.
Actual Expenses
The first line of the table below provides information about actual account values and actual expenses. You may use the information in this line, together with the amount you invested, to estimate the expenses that you paid over the period. Simply divide your account value by $1,000 (for example, an $8,600 account value divided by $1,000 = 8.6), then multiply the result by the number in the first line under the heading “Expenses Paid During Period” to estimate the expenses you paid on your account during this period.
Hypothetical Example for Comparison Purposes
The second line of the table below provides information about hypothetical account values and hypothetical expenses based on the Fund’s actual expense ratio and an assumed rate of return of 5% per year before expenses, which is not the Fund’s actual return. The hypothetical account values and expenses may not be used to estimate the actual ending account balance or expenses you paid for the period. You may use this information to compare the ongoing costs of investing in the Fund and other funds. To do so, compare this 5% hypothetical example with the 5% hypothetical examples that appear in the shareholder reports of other funds.
| Beginning | Ending | |||||||||
| Account | Account | Expenses | ||||||||
| Value | Value | Paid | Annualized | |||||||
| March 1, | August 31, | During | Expense | |||||||
| 2023 | 2023 | Period(a) | Ratio | |||||||
| Actual | $1,000.00 | $1,043.40 | $ | 3.86 | 0.75% | |||||
| Hypothetical(b) | $1,000.00 | $1,021.42 | $ | 3.82 | 0.75% | |||||
| (a) | Expenses are equal to the Fund’s annualized expense ratios, multiplied by the average account value over the period, multiplied by 184/365 (to reflect the one-half year period). |
| (b) | Hypothetical assumes 5% annual return before expenses. |
27
| Additional Federal Income Tax Information (Unaudited) |
The Form 1099-DIV you receive in January 2024 will show the tax status of all distributions paid to your account in calendar year 2023. Shareholders are advised to consult their own tax adviser with respect to the tax consequences of their investment in the Fund. As required by the Internal Revenue Code and/or regulations, shareholders must be notified regarding the status of qualified dividend income for individuals and the dividends received deduction for corporations.
Qualified Dividend Income. The Fund designates approximately 100% or up to the maximum amount of such dividends allowable pursuant to the Internal Revenue Code, as qualified dividend income eligible for a reduced tax rate.
Qualified Business Income. The Fund designates approximately 0% of its ordinary income dividends, or up to the maximum amount of such dividends allowable pursuant to the Internal Revenue Code, as qualified business income.
Dividends Received Deduction. Corporate shareholders are generally entitled to take the dividends received deduction on the portion of the Fund’s dividend distribution that qualifies under tax law. For the Fund’s calendar year 2023 ordinary income dividends, 100% qualifies for the corporate dividends received deduction.
For the fiscal year ended August 31, 2023, the Fund designated $13,141 as long-term capital gain distributions.
28
| Trustees and Officers (Unaudited) |
GENERAL QUALIFICATIONS. The Board supervises the business activities of the Trust. Each Trustee serves as a trustee until termination of the Trust unless the Trustee dies, resigns, retires, or is removed. The Chair of the Board and more than 75% of the Trustees are “Independent Trustees”, which means that they are not “interested persons” (as defined in the 1940 Act) of the Trust or any adviser, sub-adviser or distributor of the Trust.
The following table provides information regarding the Independent Trustees.
| Name,
Address*, (Year of Birth), Position with Trust**, Term of Position with Trust |
Principal
Occupation During Past 5 Years and Other Directorships |
| Daniel
J. Condon (1950) Chair, May 2022 to present; Chair of the Audit Committee; Chair of the Governance & Nominating Committee, May 2020 to May 2022; Independent Trustee, December 2002 to present |
Current: Retired (2017 – present).
Previous: Peak Income Plus Fund (May 2022 – February 2023). |
| Kenneth
G.Y. Grant (1949) Chair of the Governance & Nominating Committee, May 2022 to present; Chair, January 2017 to May 2022; Independent Trustee, May 2008 to present |
Current: Director, Standpoint Multi-Asset (Cayman) Fund, Ltd. (2019 – present); Director, Advisors Charitable Gift Fund (2020 – present), a Donor Advised Fund; Trustee. Trustee, Peak Income Plus Fund (May 2022 – present).
Previous: EVP, Benefit Plans Administrative Services, Inc., provider of retirement benefit plans administration (2019 – 2020); Director, Northeast Retirement Services (NRS) LLC, a transfer agent and fund administrator; and Director, Global Trust Company (GTC), a non-depository trust company sponsoring private investment products (2003 – 2019); EVP, NRS (2003 – 2019); GTC, EVP (2008 – 2019); EVP, Savings Banks Retirement Association (2003 – 2019), provider of qualified retirement benefit plans. |
| Ronald
C. Tritschler (1952) Chair of the Audit Committee, May 2022 to present; Independent Trustee, January 2007 to present; Interested Trustee, December 2002 to December 2006 |
Current: Chief Executive Officer, Director and Legal Counsel of The Webb Companies, a national real estate company, (2001– present); Director, Standpoint Multi-Asset (Cayman) Fund, Ltd. (2020 – present); Director of First State Bank of the Southeast (2000 – present).
Previous: Trustee, Peak Income Plus Fund (May 2022 – February 2023). |
29
| Trustees and Officers (Unaudited) (continued) |
| Catharine
B. McGauley (1977) Chair of the Pricing & Liquidity Committee, November 2022 to present; Independent Trustee, September 2022 to present |
Current: Lead Portfolio Manager of Atlantic Charter Insurance, a workers’ compensation insurer, (2010 – present); Investment Advisor for a Family Office (2015 – present); Senior Analyst/Advisor for a Boston real estate company and related family (2010 – present).
Previous: Trustee, Peak Income Plus Fund (May 2022 – February 2023). |
| Freddie
Jacobs, Jr. (1970) Independent Trustee, September 2022 to present |
Current: Chief Operating Officer and Chief Risk Officer Northeast Retirement Services LLC (NRS), and its subsidiary, Global Trust Company (GTC). NRS is a transfer agent and fund administrator, GTC is a non- depository trust company sponsoring private investment products (2021 – present); Chair, Board of Crispus Attucks Fund (2020 – present); Board Member of Camp Harbor View (2020 – present); Director, Sportsmen’s Tennis and Education Center (2019 – present).
Previous: SVP, Senior Risk Officer NRS (2013 – 2021); Trustee, Peak Income Plus Fund (May 2022 – February 2023); Trustee of Buckingham Browne & Nichols (2017 - June 2023). |
| * | The address for each Trustee is 225 Pictoria Drive, Suite 450, Cincinnati, Ohio 45246. |
| ** | As of the date of this report, the Trust consists of 29 series. |
The following table provides information regarding the Interested Trustees and Officers of the Trust.
| Name,
Address*, (Year of Birth), Position with Trust, Term of Position with Trust |
Principal
Occupation During Past 5 Years and Other Directorships |
| David
R. Carson (1958) Interested Trustee, August 2020 to present; President, January 2016 to August 2021 |
Current: Retired (2023 – present); Interested Trustee, Mammoth Institutional Credit Access Fund and Mammoth Institutional Equity Access Fund (November 2022 – present); Interested Trustee, Peak Income Plus Fund (May 2022 – present).
Previous: Interested Trustee of Ultimus Managers Trust, (January 2021 – April 2023); Senior Vice President Client Strategies of Ultimus Fund Solutions, LLC, (2013 – April 2023). |
30
| Trustees and Officers (Unaudited) (continued) |
| Martin
R. Dean (1963) President, August 2021 to present; Vice President, November 2020 to August 2021; Chief Compliance Officer, April 2021 to August 2021; Assistant Chief Compliance Officer, January 2016 to April 2021 |
Current: President, Northern Lights Compliance Services (2023 – present).
Previous: Senior Vice President, Head of Fund Compliance of Ultimus Fund Solutions, LLC (2016 – January 2023). |
| Zachary
P. Richmond (1980) Treasurer and Chief Financial Officer, November 2014 to present |
Current: Vice President, Director of Financial Administration for Ultimus Fund Solutions, LLC, (2015 – present). |
| Gweneth
K. Gosselink (1955) Chief Compliance Officer, August 2021 to present |
Current: Assistant Vice President, Senior Compliance Officer of Ultimus Fund Solutions, LLC, since 2019.
Previous: Chief Operating Officer & CCO at Miles Capital, Inc. (2013 – 2019). |
| Elisabeth
Dahl (1962) Secretary, May 2017 to present; Assistant Secretary, March 2016 to May 2017 |
Current: Attorney, Ultimus Fund Solutions, LLC since March 2016. |
| Timothy
J. Shaloo (1970) AML Compliance Officer, August 2023 to present |
Current: AVP, Compliance Officer (September 2023 – present).
Previous: Senior Compliance Analyst, Northern Lights Compliance Services, LLC (2021 – August 2023); Compliance Specialist, Ultimus Fund Solutions, LLC (2016 – 2020). |
| * | The address for each Officer is 225 Pictoria Drive, Suite 450, Cincinnati, Ohio 45246. |
| Other Information (Unaudited) |
The Fund’s Statement of Additional Information (“SAI”) includes additional information about the trustees and is available without charge, upon request. You may call toll-free at (800) 851-8845 to request a copy of the SAI or to make shareholder inquiries.
31
PRIVACY NOTICE
| Rev: January 2020 |
| FACTS | WHAT DOES FISHER INVESTMENTS INSTITUTIONAL GROUP U.S. SMALL CAP EQUITY FUND (THE “FUND”) DO WITH YOUR PERSONAL INFORMATION? | ||
| Why? | Financial companies choose how they share your personal information. Federal law gives consumers the right to limit some but not all sharing. Federal law also requires us to tell you how we collect, share, and protect your personal information. Please read this notice carefully to understand what we do. | ||
| What? | The types of personal information we collect and share depend on the product or service you have with us. This information can include:
■ Social Security number
■ account balances and account transactions
■ transaction or loss history and purchase history
When you are no longer our customer, we continue to share your information as described in this notice. | ||
| How? | All financial companies need to share customers’ personal information to run their everyday business. In the section below, we list the reasons financial companies can share their customers’ personal information; the reasons the Fund chooses to share; and whether you can limit this sharing. | ||
| Reasons we can share your personal information | Does
the Fund share? |
Can
you limit this sharing? | |
For our everyday business purposes – such as to process your transactions, maintain your account(s), respond to court orders and legal investigations, or report to credit bureaus |
Yes | No | |
For our marketing purposes – to offer our products and services to you |
No | We don’t share | |
| For joint marketing with other financial companies | No | We don’t share | |
For our affiliates’ everyday business purposes – information about your transactions and experiences |
No | We don’t share | |
For our affiliates’ everyday business purposes – information about your creditworthiness |
No | We don’t share | |
| For nonaffiliates to market to you | No | We don’t share | |
| Questions? | Call (800) 851-8845 | ||
32
| Who we are | |
| Who is providing this notice? | Fisher Investments Institutional Group U.S. Small Cap Equity Fund Ultimus Fund Distributors, LLC (Distributor) Ultimus Fund Solutions, LLC (Administrator) |
| What we do | |
| How does the Fund protect my personal information? | To protect your personal information from unauthorized access and use, we use security measures that comply with federal law. These measures include computer safeguards and secured files and buildings. Our service providers are held accountable for adhering to strict policies and procedures to prevent any misuse of your nonpublic personal information. |
| How does the Fund collect my personal information? | We collect your personal information, for example, when you
■ open an account or deposit money
■ make deposits or withdrawals from your account or provide account information
We also collect your personal information from other companies. |
| Why can’t I limit all sharing? | Federal law gives you the right to limit only
■ sharing for affiliates’ everyday business purposes – information about your creditworthiness
■ affiliates from using your information to market to you
■ sharing for nonaffiliates to market to you
State laws and individual companies may give you additional rights to limit sharing. |
| Definitions | |
| Affiliates | Companies related by common ownership or control. They can be financial and nonfinancial companies.
■ Fisher Asset Management, LLC, d/b/a Fisher Investments, the investment adviser to the Fund, could be deemed to be an affiliate. |
| Nonaffiliates | Companies not related by common ownership or control. They can be financial and nonfinancial companies.
■ The Fund does not share your personal information with nonaffiliates so they can market to you. |
| Joint marketing | A formal agreement between nonaffiliated financial companies that together market financial products or services to you.
■ The Fund does not jointly market. |
33
| PROXY VOTING |
A description of the policies and procedures that the Fund uses to determine how to vote proxies relating to portfolio securities and information regarding how the Fund voted those proxies during the most recent twelve month period ended June 30, are available (1) without charge upon request by calling the Fund at (800) 851-8845 and (2) in Fund documents filed with the SEC on the SEC’s website at www.sec.gov.
| TRUSTEES Daniel J. Condon, Chair David R. Carson Kenneth G.Y. Grant Freddie Jacobs, Jr. Catharine B. McGauley Ronald C. Tritschler |
INDEPENDENT
REGISTERED PUBLIC ACCOUNTING FIRM Cohen & Company, Ltd. 151 North Franklin Street, Suite 575 Chicago, IL 60606 |
| OFFICERS Martin R. Dean, President Gweneth K. Gosselink, Chief Compliance Officer Zachary P. Richmond, Treasurer and Chief Financial Officer |
LEGAL
COUNSEL Thompson Hine LLP 312 Walnut Street, 20th Floor Cincinnati, OH 45202 |
| INVESTMENT
ADVISER Fisher Asset Management, LLC 6500 International Parkway, Suite 2050 Plano, TX 75093 |
CUSTODIAN U.S. Bank, N.A. 425 Walnut Street Cincinnati, OH 45202 |
| DISTRIBUTOR Ultimus Fund Distributors, LLC 225 Pictoria Drive, Suite 450 Cincinnati, OH 45246 |
ADMINISTRATOR,
TRANSFER AGENT AND FUND ACCOUNTANT Ultimus Fund Solutions, LLC 225 Pictoria Drive, Suite 450 Cincinnati, OH 45246 |
This report is intended only for the information of shareholders or those who have received the Fund’s prospectus which contains information about the Fund’s management fee and expenses. Please read the prospectus carefully before investing.
Distributed by Ultimus Fund Distributors, LLC
Member FINRA/SIPC
Fisher3-AR-23
| FISHER INVESTMENTS INSTITUTIONAL |
| GROUP FUND FAMILY |
Annual Report
August 31, 2023
Fisher Investments Institutional Group
All Foreign Equity Environmental and Social Values Fund
Fund Adviser:
Fisher Asset Management, LLC
6500 International Parkway, Suite 2050
Plano, Texas 75093
(800) 851-8845
| Fisher Investments Institutional Group All Foreign Equity |
| Environmental and Social Values Fund |
| Management’s Discussion of Fund Performance |
| (Unaudited) |
Dear Shareholder:
Market Outlook
Developed world equities finished solidly positive in both Q2 and 2023’s first half. The main force behind the positive year-to-date return, in our view, is that reality exceeded expectations. We think equities are likely to end the year higher as that force is expected to continue.
Elevated inflation has dominated headlines over the past year, and the UK has been among the developed world’s hardest hit. Though the headline consumer price index (including owner occupiers’ housing costs, or CPI-H) sped up from 7.8% y/y to 7.9% in May, most worry centered on the reacceleration in core CPI-H (which excludes energy, food, alcohol and tobacco prices) to 6.5% y/y, its fastest rate in over 30 years. Separately, UK wage growth jumped 7.2% y/y in the three months through April. These developments spurred conversation that the Bank of England (BoE) has yet to tamp down inflation—and will need to keep hiking rates to do so, which many fear is a headwind for equities.
However, in our view, May’s core CPI acceleration appears tied largely to one-time developments, specifically, a big acceleration in recreation and culture prices related to some live music events and the release of a popular video game. These are one-off events, not permanent changes. We also think the theory that wages drive inflation is a misperception. Rather, the former trails the latter since employers typically factor in living costs when setting wages, making them a late-lagging price that responds to inflationary conditions. Data supports this notion lately in other major economies, including the US and Japan—and in our view, it isn’t any different in the UK.
UK equities have lagged the benchmark in Q2 and for the year, but in our view, their relative struggles appear tied to sentiment more than fundamentals. Several fears, from stubbornly high inflation to recession worries, have taken turns weighing on sentiment. However, we don’t think reality is as poor as perceived. Producer prices are close to a zero percent inflation rate, and broad money supply has contracted in five of the past seven months. These developments suggest inflation should broadly keep easing, regardless of whether the BoE hikes or not, and 13 straight BoE hikes haven’t halted GDP growth. That so many remain dour towards British equities despite this resilience is bullish, in our view.
In continental Europe, more recent data suggest the eurozone’s economic backdrop is mixed. The eurozone composite Purchasing Managers’ Index, which aggregates services and manufacturing, fell to 49.9 in late Q2—right below the level dividing expansion and contraction. However, by sector, services showed growth (52.0) while manufacturing
1
| Fisher Investments Institutional Group All Foreign Equity |
| Environmental and Social Values Fund |
| Management’s Discussion of Fund Performance |
| (Unaudited) (continued) |
stayed in contraction (43.4). This split has persisted throughout the year, and while heavy industry’s weakness weighs on growth, services comprise the majority of output in the eurozone—so the latter’s prospects have more sway on the region’s economy. Regarding prices, though June headline inflation slowed to 5.5% y/y from 6.1%, core CPI picked up from 5.3% to 5.4% y/y, which was tied partly to a low base effect from a price assistance measure last year (e.g., German transport ticket discounts). However, the pickup in core inflation is consistent with the UK’s minor reacceleration, a reminder that inflation trends are global, and one month’s uptick doesn’t negate broader disinflationary trends.
Germany is another place where reality is not as poor as feared, in our view. Since late 2021, economists have been predicting a German recession, and that oft-forecast downturn appeared to manifest in revised GDP data. Q1 GDP was revised down from flat to -0.3% q/q. Following Q4 2022’s -0.5% q/q dip, the two straight quarterly dips meet one popular definition of recession. Some argue German equities outperformance since last September has been disconnected from fundamentals—and now they point to technical recession and other alleged headwinds (e.g., ongoing ECB rate hikes) to claim the outlook is negative. These worries are likely why German equities have lagged throughout Q2.
In our view, forward-looking equities have moved on from these developments, as recession discussion didn’t prevent Italy, Spain, France and even Germany from outperforming in late Q2. Now, it is always possible developments weigh on returns in the near term. For example, Dutch equities have been a top performer year to date but matched the benchmark in June. The cool down comes as Holland’s Information Technology sector only rose slightly, trailing the MSCI’s Information Technology sector in June, which we believe looks tied to minor political uncertainty. The Dutch government detailed export restrictions on machines that make advanced semiconductor processor chips, impacting Dutch semiconductor firm ASML—which comprises nearly all of the Netherlands’ Information Technology sector by market capitalization. We don’t think this restriction significantly disrupts ASML—the company said it did not expect restrictions to have a material impact on its financial outlook—but the news likely weighed on sentiment.
In Asia, sentiment toward Japanese markets still seems relatively optimistic—especially compared to Western Europe. Many high-profile investors have talked up Japanese markets’ prospects recently, pointing to Japanese firms’ cheap valuations and Q1 GDP improvement (1.9% annualized growth) as reasons to be bullish. But valuations aren’t predictive. Despite arguably being attractive for most of the last decade, Japan’s 12-month forward price-to-earnings (P/E) ratio was continuously lower than the broader index from 2014 – 2019.
2
| Fisher Investments Institutional Group All Foreign Equity |
| Environmental and Social Values Fund |
| Management’s Discussion of Fund Performance |
| (Unaudited) (continued) |
Investors also point to Japan’s economic recovery, as growth looks stronger relative to other developed markets. For example, May retail sales rose 1.3% m/m, beating expectations, and have risen five of the past six months. In contrast, eurozone retail sales were flat on a monthly basis in May (latest data available). However, Japan’s recent growth is largely tied to its reopening-related boost and tourism recovery. In our view, that likely tapers off and the country will return to its pre-pandemic growth rates.
In Japanese politics, Prime Minister Fumio Kishida announced he won’t dissolve the National Diet nor call a snap election. Some observers thought PM Kishida may seek to take advantage of recent optimism by calling for an early election, with the goal of solidifying his power within the ruling Liberal Democratic Party (LDP). But some issues arose, including snags with the national ID card rollout and controversy surrounding a party hosted by PM Kishida’s son at the official residence. Those stories dented his popularity recently, so PM Kishida appears to be holding off from calling a snap vote—and for now, that reduces some political uncertainty. In our view, Japan remains a mixed bag, but sentiment still seems a bit more optimistic than warranted given ongoing headwinds on domestic demand, arguing for a selective approach.
Gridlock looks prevalent throughout the developed world, particularly in Europe—an underappreciated positive for equities, since it decreases the likelihood of major, uncertainty-inducing legislative changes. Another underappreciated eurozone development: cooling inflation. Eurozone inflation hit 6.1% y/y in May, down from April’s 7.0%, as prices continued to slow from October 2022’s 10.6% rate. Though eurozone inflation remains well above its pre-pandemic rate, the price pressures plaguing businesses and households over the past 12 months continue to ease. That said, over the longer term, broader economic and political conditions swamp country-specific issues—and in the eurozone’s case, even mild growth is likely to exceed low expectations, a bullish force for eurozone equities.
Several developed world central banks hiked rates in Q2. Some met expectations, including the 25 basis-point hikes from Sweden’s Riksbank, the ECB and the Swiss National Bank. Others, however, surprised. Norway’s Norges Bank and the BoE hiked by more than anticipated (50 bps instead of 25 bps). The Reserve Bank of Australia and Bank of Canada resumed rate increases after a pause, which caught observers off guard—the former hiked in May and June (25 bps each time) after an April break while the latter had been on hold since January.
For all the attention rate hikes receive, however, they don’t have a preset market impact. Yes, some countries’ markets are down in US dollar terms ever since their central banks began hiking, including Norway, Canada and Australia. Yet other markets are positive: See
3
| Fisher Investments Institutional Group All Foreign Equity |
| Environmental and Social Values Fund |
| Management’s Discussion of Fund Performance |
| (Unaudited) (continued) |
the eurozone, Switzerland, the UK and Sweden. In our view, this mixed bag illustrates that rate hikes aren’t automatically bad for equities. Monetary policy is just one factor, among many, that markets consider—worth keeping in mind given all the attention on monetary policy globally.
Performance Attribution
The Fisher Investments Institutional Group All Foreign Equity Environmental and Social Values Fund outperformed the MSCI ACWI ex U.S. Index for the period from September 1, 2022 through August 31, 2023. During this period, the Fund returned 18.20% while the Fund’s primary benchmark, the MSCI ACWI ex U.S. Index, returned 11.89%. Country, sector and equity selection contributed to relative return. An overweight to and selection within Information Technology was the largest contributor to relative return, driven by semiconductor manufacturing companies ASML Holding and NXP Semiconductors as well as e-commerce company Shopify. Additionally, an overweight to and selection within Consumer Discretionary contributed as luxury goods company Hermes International, e-commerce company MercadoLibre and clothing company Industria de Diseno Textil outperformed relative to the Consumer Discretionary sector within the MSCI ACWI ex U.S. Index.. Conversely, an underweight to and selection within Japan detracted from performance, driven by e-commerce company JD.com, robotics and automation company FANUC Corporation and agricultural machinery company Kubota Corporation. Further, an overweight to and selection within Norway detracted from performance as petroleum refining company Equinor underperformed relative to Norway within the MSCI ACWI ex U.S. Index.
Portfolio Shifts
For the period from September 1, 2022 through August 31, 2023, we increased the Fund’s relative exposure to China. A number of headwinds weighed on growth more than expected last year, but the government has responded with policy support, including removing zero-COVID policies, interest and reserve rate requirement cuts, tax cuts and other measures to support businesses. Economic stability is the government’s top priority this year as the country exits lockdowns. We believe select Chinese equities continue to represent bounce candidates in the early stages of the new bull market.
On a sector level, we shifted the portfolio to a relative overweight within the Consumer Discretionary sector. Inflation is likely to moderate, reducing a major headwind for economically sensitive categories such as autos, auto components, hotels, restaurants, and retail, which mostly fell more than the market during the 2022 downturn, and we believe are likely to perform well as markets rebound.
4
| Investment Results (Unaudited) |
Average Annual Total Returns(a) as of August 31, 2023
| Since | |||
| Inception | |||
| Fund/Index | One Year | Three Year | (7/17/20) |
| Fisher Investments Institutional Group All Foreign Equity Environmental and Social Values Fund | 18.20% | 4.63% | 5.64% |
| MSCI ACWI ex U.S. Index(b) | 11.89% | 3.99% | 5.12% |
| Expense | |||
| Ratios(c) | |||
| Gross | 93.97% | ||
| With Applicable Fee Waivers and Expense Reimbursements | 0.68% | ||
The performance quoted represents past performance, which does not guarantee future results. The investment return and principal value of an investment will fluctuate so that an investor’s shares, when redeemed, may be worth more or less than their original cost. The returns shown do not reflect deduction of taxes that a shareholder would pay on Fisher Investments Institutional Group All Foreign Equity Environmental and Social Values Fund (the “Fund”) distributions or the redemption of Fund shares. Current performance of the Fund may be lower or higher than the performance quoted. The Fund’s investment objective, risks, charges and expenses should be considered carefully before investing. Performance data current to the most recent month-end may be obtained by calling (800) 851-8845.
| (a) | Return figures reflect any change in price per share and assume the reinvestment of all distributions. |
| (b) | The MSCI ACWI ex U.S. Index is a stock market index comprising of non-U.S. stocks from 23 developed market countries and 24 emerging market countries. Individuals cannot invest directly in an index; however, an individual can invest in exchange-traded funds or other investment vehicles that attempt to track the performance of a benchmark index. Index returns assume reinvestment of dividends and do not reflect any fees or expenses. |
| (c) | The expense ratios are from the Fund’s prospectus dated December 29, 2022. Fisher Asset Management, LLC, d/b/a Fisher Investments (the “Adviser”) has contractually agreed to waive its management fee and/or to reimburse the Fund’s other expenses in order to limit the Fund’s total annual operating expenses to 0.68% of the Fund’s average daily net assets through December 31, 2027 (excluding portfolio transaction and other investment-related costs (including brokerage fees and commissions); taxes; borrowing costs (such as interest and dividend expenses on securities sold short); acquired fund fees and expenses; certain fees and expenses associated with investments in other collective investment vehicles or derivative instruments (including for example option and swap fees and expenses); any administrative and/or shareholder servicing fees payable pursuant to a plan adopted by the Board of Trustees; expenses incurred in connection with any merger or reorganization; extraordinary expenses (such as litigation expenses, indemnification of Trust officers and Trustees and contractual indemnification of Fund service providers); and other expenses that the Trustees agree have not been incurred in the ordinary course of the Fund’s business). This expense cap may not be terminated prior to this date except by the Board of Trustees upon 60 days’ written notice to the Adviser. Each waiver/expense payment by the Adviser is subject to recoupment by the |
5
| Investment Results (Unaudited) (continued) |
Adviser from the Fund in the three years following the date the particular waiver/expense payment occurred, but only if such recoupment can be achieved without exceeding the annual expense limitation in effect at the time of the waiver/expense payment and any expense limitation in effect at the time of the recoupment. Additional information pertaining to the Fund’s expense ratios as of August 31, 2023 can be found in the financial highlights.
The Fund’s investment objective, strategies, risks, charges and expenses should be considered carefully before investing. The Fund’s prospectus contains this and other important information about the Fund and may be obtained by calling (800) 851-8845. Please read it carefully before investing.
6
| Investment Results (Unaudited) (continued) |
Comparison of the Growth of a $10,000 Investment in the Fisher Investments Institutional Group All Foreign Equity Environmental and Social Values Fund and the MSCI ACWI ex U.S. Index.
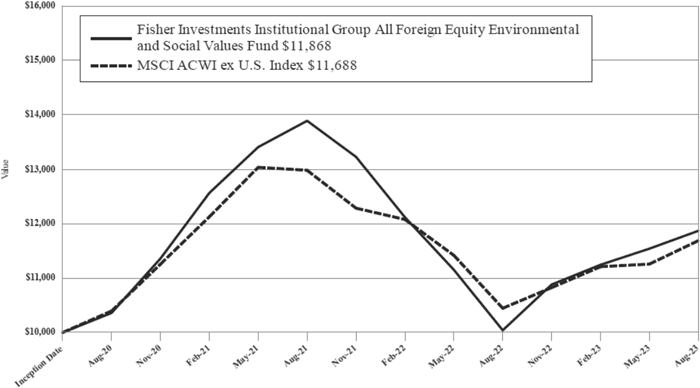
This graph shows the value of a hypothetical initial investment of $10,000 made on July 17, 2020 (commencement of operations) and held through August 31, 2023. The MSCI ACWI ex U.S. Index is a stock market index comprising of non-U.S. stocks from 23 developed market countries and 24 emerging market countries that assumes reinvestment of all dividends. The returns shown do not reflect deduction of taxes that a shareholder would pay on Fund distributions or the redemption of Fund shares. Investment returns and principal values will fluctuate so that your shares, when redeemed, may be worth more or less than their original purchase price. THE FUND’S RETURN REPRESENTS PAST PERFORMANCE AND DOES NOT GUARANTEE FUTURE RESULTS.
Current performance may be lower or higher than the performance data quoted. For more information on the Fund, and to obtain performance data current to the most recent month-end, or to request a prospectus, please call (800) 851-8845. You should carefully consider the investment objective, potential risks, management fees, and charges and expenses of the Fund before investing. The Fund’s prospectus contains this and other information about the Fund, and should be read carefully before investing.
The Fund is distributed by Ultimus Fund Distributors, LLC, Member FINRA/SIPC.
7
| Fund Holdings (Unaudited) |
Fisher Investments Institutional Group All Foreign Equity Environmental and Social Values Fund Holdings as of August 31, 2023*
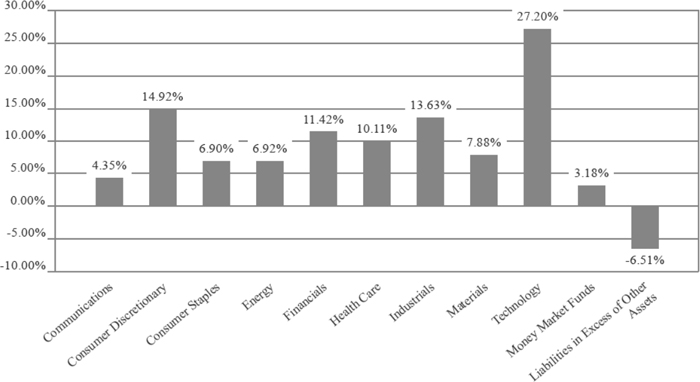
| * | As a percentage of net assets. |
The investment objective of the Fund is to seek to outperform, net of fees and expenses, the return of the MSCI ACWI ex U.S. Index.
| Availability of Portfolio Schedule (Unaudited) |
The Fund files its complete schedule of portfolio holdings with the Securities and Exchange Commission (the “SEC”) for the first and third quarters of each fiscal year as an exhibit to its reports on Form N-PORT. The Fund’s Form N-PORT reports are available on the SEC’s website at www. sec.gov.
8
| Fisher Investments Institutional Group All Foreign Equity |
| Environmental and Social Values Fund |
| Schedule of Investments |
| August 31, 2023 |
| COMMON STOCKS — 103.33% | Shares | Fair Value | ||||||
| Argentina — 2.32% | ||||||||
| Consumer Discretionary — 2.32% | ||||||||
| MercadoLibre, Inc.(a) | 3 | $ | 4,117 | |||||
| Total Argentina | 4,117 | |||||||
| Australia — 2.00% | ||||||||
| Health Care — 1.00% | ||||||||
| CSL Ltd. | 10 | 1,772 | ||||||
| Technology — 1.00% | ||||||||
| XERO LTD(a) | 22 | 1,783 | ||||||
| Total Australia | 3,555 | |||||||
| Canada — 1.42% | ||||||||
| Technology — 1.42% | ||||||||
| Shopify, Inc., Class A(a) | 38 | 2,527 | ||||||
| Total Canada | 2,527 | |||||||
| China — 6.38% | ||||||||
| Communications — 2.17% | ||||||||
| NetEase, Inc. - ADR | 19 | 1,966 | ||||||
| Tencent Holdings Ltd. - ADR | 46 | 1,904 | ||||||
| 3,870 | ||||||||
| Consumer Discretionary — 3.22% | ||||||||
| Alibaba Group Holding Ltd. - ADR(a) | 19 | 1,765 | ||||||
| Geely Automobile Holdings Ltd. | 800 | 994 | ||||||
| Haier Smart Home Co. Ltd., H Shares | 350 | 1,082 | ||||||
| JD.com, Inc. - ADR | 26 | 863 | ||||||
| Meituan - ADR | 31 | 1,030 | ||||||
| 5,734 | ||||||||
| Consumer Staples — 0.52% | ||||||||
| China Mengniu Dairy Co. Ltd.(a) | 275 | 926 | ||||||
| Health Care — 0.47% | ||||||||
| WuXi Biologics Cayman Inc.(a) | 150 | 844 | ||||||
| Total China | 11,374 | |||||||
| Denmark — 4.52% | ||||||||
| Energy — 0.97% | ||||||||
| Vestas Wind Systems A/S(a) | 75 | 1,735 | ||||||
| Health Care — 3.55% | ||||||||
| Coloplast A/S - ADR | 51 | 582 | ||||||
| Novo Nordisk A/S, Class B | 31 | 5,747 | ||||||
| 6,329 | ||||||||
| Total Denmark | 8,064 | |||||||
| France — 16.55% | ||||||||
| Consumer Discretionary — 5.47% | ||||||||
| Cia Generale de Establissements Michelin SCA | 45 | 1,411 | ||||||
See accompanying notes which are an integral part of these financial statements.
9
| Fisher Investments Institutional Group All Foreign Equity | |||||
| Environmental and Social Values Fund | |||||
| Schedule of Investments (continued) | |||||
| August 31, 2023 | |||||
| COMMON STOCKS — 103.33% - continued | Shares | Fair Value | ||||||
| France — 16.55% - continued | ||||||||
| Consumer Discretionary — 5.47% - continued | ||||||||
| Hermes International SA | 3 | $ | 6,187 | |||||
| Kering SA | 4 | 2,145 | ||||||
| 9,743 | ||||||||
| Consumer Staples — 1.73% | ||||||||
| L’Oreal SA | 7 | 3,082 | ||||||
| Financials — 2.19% | ||||||||
| BNP Paribas SA | 25 | 1,620 | ||||||
| Credit Agricole SA | 116 | 1,467 | ||||||
| Societe Generale SA | 29 | 825 | ||||||
| 3,912 | ||||||||
| Health Care — 1.20% | ||||||||
| Sanofi | 20 | 2,140 | ||||||
| Industrials — 1.46% | ||||||||
| Aeroports de Paris | 14 | 1,847 | ||||||
| Vinci SA - ADR | 27 | 752 | ||||||
| 2,599 | ||||||||
| Materials — 2.53% | ||||||||
| Cie de Saint-Gobain | 69 | 4,504 | ||||||
| Technology — 1.97% | ||||||||
| Dassault Systems SE | 70 | 2,780 | ||||||
| Teleperformance | 3 | 416 | ||||||
| Worldline SA/France(a) | 10 | 326 | ||||||
| 3,522 | ||||||||
| Total France | 29,502 | |||||||
| Germany — 7.55% | ||||||||
| Consumer Staples — 1.55% | ||||||||
| Beiersdorf AG | 21 | 2,752 | ||||||
| Financials — 1.60% | ||||||||
| Deutsche Boerse AG | 16 | 2,845 | ||||||
| Industrials — 3.69% | ||||||||
| Deutsche Post AG | 73 | 3,412 | ||||||
| Siemens AG | 21 | 3,164 | ||||||
| 6,576 | ||||||||
| Technology — 0.71% | ||||||||
| SAP SE | 9 | 1,258 | ||||||
| Total Germany | 13,431 | |||||||
| India — 2.48% | ||||||||
| Financials — 1.47% | ||||||||
| HDFC Bank Ltd. - ADR | 42 | 2,617 | ||||||
See accompanying notes which are an integral part of these financial statements.
10
| Fisher Investments Institutional Group All Foreign Equity |
| Environmental and Social Values Fund |
| Schedule of Investments (continued) |
| August 31, 2023 |
| COMMON STOCKS — 103.33% - continued | Shares | Fair Value | ||||||
| India — 2.48% - continued | ||||||||
| Technology — 1.01% | ||||||||
| Infosys Ltd. - ADR | 104 | $ | 1,806 | |||||
| Total India | 4,423 | |||||||
| Indonesia — 1.90% | ||||||||
| Financials — 1.90% | ||||||||
| Bank Rakyat Indonesia Persero Tbk PT - ADR | 187 | 3,387 | ||||||
| Total Indonesia | 3,387 | |||||||
| Israel — 1.44% | ||||||||
| Technology — 1.44% | ||||||||
| NICE-Systems Ltd. - ADR(a) | 7 | 1,364 | ||||||
| Wix.com Ltd.(a) | 12 | 1,185 | ||||||
| 2,549 | ||||||||
| Total Israel | 2,549 | |||||||
| Italy — 1.82% | ||||||||
| Energy — 1.32% | ||||||||
| Eni SpA | 152 | 2,356 | ||||||
| Financials — 0.50% | ||||||||
| Intesa Sanpaolo SpA | 329 | 882 | ||||||
| Total Italy | 3,238 | |||||||
| Japan — 10.42% | ||||||||
| Communications — 0.68% | ||||||||
| M3, Inc. | 61 | 1,218 | ||||||
| Health Care — 1.99% | ||||||||
| Eisai Co Ltd - ADR | 67 | 1,061 | ||||||
| Hoya Corp. - ADR | 14 | 1,551 | ||||||
| Terumo Corp. - ADR | 31 | 937 | ||||||
| 3,549 | ||||||||
| Industrials — 7.07% | ||||||||
| Daifuku Co. Ltd. - ADR | 80 | 735 | ||||||
| FANUC Corp. - ADR | 116 | 1,646 | ||||||
| Keyence Corp. | 14 | 5,826 | ||||||
| Kubota Corp. | 100 | 1,605 | ||||||
| Recruit Holdings Co. Ltd. - ADR | 390 | 2,773 | ||||||
| 12,585 | ||||||||
| Technology — 0.68% | ||||||||
| OBIC Co. Ltd. | 7 | 1,219 | ||||||
| Total Japan | 18,571 | |||||||
| Korea (Republic of) — 5.11% | ||||||||
| Communications — 0.82% | ||||||||
| NAVER Corp. | 9 | 1,458 | ||||||
See accompanying notes which are an integral part of these financial statements.
11
| Fisher Investments Institutional Group All Foreign Equity |
| Environmental and Social Values Fund |
| Schedule of Investments (continued) |
| August 31, 2023 |
| COMMON STOCKS — 103.33% - continued | Shares | Fair Value | ||||||
| Korea (Republic of) — 5.11% - continued | ||||||||
| Financials — 1.31% | ||||||||
| KB Financial Group, Inc. | 57 | $ | 2,328 | |||||
| Technology — 2.98% | ||||||||
| Samsung Electronics Co. Ltd. | 105 | 5,304 | ||||||
| Total Korea (Republic of) | 9,090 | |||||||
| Netherlands — 11.09% | ||||||||
| Consumer Discretionary — 0.90% | ||||||||
| Stellantis NV | 86 | 1,603 | ||||||
| Financials — 0.81% | ||||||||
| ING Groep NV | 102 | 1,450 | ||||||
| Technology — 9.38% | ||||||||
| Adyen NV(a) | 1 | 838 | ||||||
| ASML Holding NV | 12 | 7,914 | ||||||
| NXP Semiconductors NV | 28 | 5,760 | ||||||
| Wolters Kluwer NV | 18 | 2,172 | ||||||
| 16,684 | ||||||||
| Total Netherlands | 19,737 | |||||||
| Norway — 1.32% | ||||||||
| Energy — 1.32% | ||||||||
| Equinor ASA | 76 | 2,347 | ||||||
| Total Norway | 2,347 | |||||||
| Spain — 3.33% | ||||||||
| Consumer Discretionary — 1.03% | ||||||||
| Industria de Diseno Textil SA | 48 | 1,841 | ||||||
| Energy — 1.84% | ||||||||
| Repsol SA | 211 | 3,254 | ||||||
| Financials — 0.46% | ||||||||
| Banco Santander SA | 209 | 817 | ||||||
| Total Spain | 5,912 | |||||||
| Sweden — 0.94% | ||||||||
| Consumer Discretionary — 0.94% | ||||||||
| H&M Hennes & Mauritz AB, Class B | 109 | 1,668 | ||||||
| Total Sweden | 1,668 | |||||||
| Switzerland — 1.41% | ||||||||
| Industrials — 1.41% | ||||||||
| ABB Ltd. | 66 | 2,512 | ||||||
| Total Switzerland | 2,512 | |||||||
See accompanying notes which are an integral part of these financial statements.
12
| Fisher Investments Institutional Group All Foreign Equity |
| Environmental and Social Values Fund |
| Schedule of Investments (continued) |
| August 31, 2023 |
| COMMON STOCKS — 103.33% - continued | Shares | Fair Value | ||||||
| Taiwan Province of China — 4.58% | ||||||||
| Technology — 4.58% | ||||||||
| Taiwan Semiconductor Manufacturing Co. Ltd. - ADR | 87 | $ | 8,140 | |||||
| Total Taiwan Province of China | 8,140 | |||||||
| United Kingdom — 16.75% | ||||||||
| Communications — 0.68% | ||||||||
| WPP PLC | 124 | 1,203 | ||||||
| Consumer Discretionary — 1.04% | ||||||||
| Next PLC | 21 | 1,859 | ||||||
| Consumer Staples — 3.10% | ||||||||
| Coca-Cola European Partners PLC | 57 | 3,654 | ||||||
| Reckitt Benckiser Group PLC | 26 | 1,878 | ||||||
| 5,532 | ||||||||
| Energy — 1.47% | ||||||||
| BP PLC | 425 | 2,625 | ||||||
| Financials — 1.18% | ||||||||
| Barclays PLC | 628 | 1,172 | ||||||
| London Stock Exchange Group PLC | 9 | 932 | ||||||
| 2,104 | ||||||||
| Health Care — 1.90% | ||||||||
| AstraZeneca PLC | 25 | 3,377 | ||||||
| Materials — 5.35% | ||||||||
| Anglo American PLC | 106 | 2,821 | ||||||
| Antofagasta PLC | 218 | 3,998 | ||||||
| Rio Tinto PLC | 44 | 2,716 | ||||||
| 9,535 | ||||||||
| Technology — 2.03% | ||||||||
| Experian PLC | 103 | 3,605 | ||||||
| Total United Kingdom | 29,840 | |||||||
| Total Common Stocks (Cost $164,911) | 183,984 | |||||||
| MONEY MARKET FUNDS - 3.18% | ||||||||
| First American Government Obligations Fund, Class X, 5.25%(b) | 5,660 | 5,660 | ||||||
| Total Money Market Funds (Cost $5,660) | 5,660 | |||||||
| Total Investments — 106.51% (Cost $170,571) | 189,644 | |||||||
| Liabilities in Excess of Other Assets — (6.51)% | (11,592 | ) | ||||||
| NET ASSETS — 100.00% | $ | 178,052 | ||||||
| (a) | Non-income producing security. |
| (b) | Rate disclosed is the seven day effective yield as of August 31, 2023. |
ADR - American Depositary Receipt.
See accompanying notes which are an integral part of these financial statements.
13
| Fisher Investments Institutional Group All Foreign Equity |
| Environmental and Social Values Fund |
| Statement of Assets and Liabilities |
| August 31, 2023 |
| Assets | ||||
| Investments in securities at fair value (cost $170,571) | $ | 189,644 | ||
| Dividends receivable | 350 | |||
| Receivable from Adviser | 13,889 | |||
| Prepaid expenses | 2,960 | |||
| Total Assets | 206,843 | |||
| Liabilities | ||||
| Payable to affiliates | 4,917 | |||
| Accrued audit and tax fees | 18,450 | |||
| Other accrued expenses | 5,424 | |||
| Total Liabilities | 28,791 | |||
| Net Assets | $ | 178,052 | ||
| Net Assets consist of: | ||||
| Paid-in capital | $ | 159,993 | ||
| Accumulated earnings | 18,059 | |||
| Net Assets | $ | 178,052 | ||
| Shares outstanding (unlimited number of shares authorized, no par value) | 15,838 | |||
| Net asset value, offering and redemption price per share | $ | 11.24 | ||
See accompanying notes which are an integral part of these financial statements.
14
| Fisher Investments Institutional Group All Foreign Equity |
| Environmental and Social Values Fund |
| Statement of Operations |
| For the year ended August 31, 2023 |
| Investment Income | ||||
| Dividend income (net of foreign taxes withheld of $790) | $ | 4,026 | ||
| Total investment income | 4,026 | |||
| Expenses | ||||
| Administration | 49,765 | |||
| Legal | 19,994 | |||
| Audit and tax | 18,276 | |||
| Trustee | 16,636 | |||
| Compliance services | 12,031 | |||
| Transfer agent | 12,000 | |||
| Custodian | 8,419 | |||
| Report printing | 4,402 | |||
| Pricing | 4,121 | |||
| Registration | 1,529 | |||
| Adviser | 1,019 | |||
| Miscellaneous | 27,000 | |||
| Total expenses | 175,192 | |||
| Fees waived and/or expenses reimbursed by Adviser | (174,056 | ) | ||
| Net operating expenses | 1,136 | |||
| Net investment income | 2,890 | |||
| Net Realized and Change in Unrealized Gain (Loss) on Investments | ||||
| Net realized loss on investment securities transactions | (452 | ) | ||
| Net realized loss on foreign currency translations | (27 | ) | ||
| Net change in unrealized appreciation of investment securities | 24,945 | |||
| Net change in unrealized appreciation of foreign currency | 7 | |||
| Net realized and change in unrealized gain on investments | 24,473 | |||
| Net increase in net assets resulting from operations | $ | 27,363 | ||
See accompanying notes which are an integral part of these financial statements.
15
| Fisher Investments Institutional Group All Foreign Equity |
| Environmental and Social Values Fund |
| Statements of Changes in Net Assets |
| For the Year | For the Year | |||||||
| Ended August | Ended August | |||||||
| 31, 2023 | 31, 2022 | |||||||
| Increase (Decrease) in Net Assets due to: | ||||||||
| Operations | ||||||||
| Net investment income | $ | 2,890 | $ | 2,838 | ||||
| Net realized loss on investment securities transactions | (479 | ) | (1,345 | ) | ||||
| Net change in unrealized appreciation (depreciation) of investment securities | 24,952 | (59,177 | ) | |||||
| Net increase (decrease) in net assets resulting from operations | 27,363 | (57,684 | ) | |||||
| Distributions From: | ||||||||
| Earnings | (2,634 | ) | (6,731 | ) | ||||
| Total distributions | (2,634 | ) | (6,731 | ) | ||||
| Capital Transactions | ||||||||
| Reinvestment of distributions | 2,634 | 6,730 | ||||||
| Amount paid for shares redeemed | — | (11 | ) | |||||
| Net increase in net assets resulting from capital transactions | 2,634 | 6,719 | ||||||
| Total Increase (Decrease) in Net Assets | 27,363 | (57,696 | ) | |||||
| Net Assets | ||||||||
| Beginning of year | 150,689 | 208,385 | ||||||
| End of year | $ | 178,052 | $ | 150,689 | ||||
| Share Transactions | ||||||||
| Shares issued in reinvestment of distributions | 263 | 521 | ||||||
| Shares redeemed | — | (1 | ) | |||||
| Net increase in shares | 263 | 520 | ||||||
See accompanying notes which are an integral part of these financial statements.
16
| Fisher Investments Institutional Group All Foreign Equity |
| Environmental and Social Values Fund |
| Financial Highlights |
| (For a share outstanding during each period) |
| For the | ||||||||||||||||
| For the | For the | For the | Period | |||||||||||||
| Year Ended | Year Ended | Year Ended | Ended | |||||||||||||
| August 31, | August 31, | August 31, | August 31, | |||||||||||||
| 2023 | 2022 | 2021 | 2020(a) | |||||||||||||
| Selected Per Share Data: | ||||||||||||||||
| Net asset value, beginning of period | $ | 9.67 | $ | 13.84 | $ | 10.36 | $ | 10.00 | ||||||||
| Investment operations: | ||||||||||||||||
| Net investment income | 0.18 | 0.19 | 0.14 | 0.01 | ||||||||||||
| Net realized and unrealized gain (loss) | 1.56 | (3.91 | ) | 3.38 | 0.35 | |||||||||||
| Total from investment operations | 1.74 | (3.72 | ) | 3.52 | 0.36 | |||||||||||
| Less distributions to shareholders from: | ||||||||||||||||
| Net investment income | (0.17 | ) | (0.16 | ) | (0.04 | ) | — | |||||||||
| Net realized gains | — | (0.29 | ) | — | — | |||||||||||
| Total distributions | (0.17 | ) | (0.45 | ) | (0.04 | ) | — | |||||||||
| Net asset value, end of period | $ | 11.24 | $ | 9.67 | $ | 13.84 | $ | 10.36 | ||||||||
| Total Return(b) | 18.20 | % | (27.71 | )% | 34.07 | % | 3.60 | % (c) | ||||||||
| Ratios and Supplemental Data: | ||||||||||||||||
| Net assets, end of period (000 omitted) | $ | 178 | $ | 151 | $ | 208 | $ | 155 | ||||||||
| Ratio of net expenses to average net assets | 0.68 | % | 0.68 | % | 0.68 | % | 0.68 | % (d) | ||||||||
| Ratio of gross expenses to average net assets before waiver and reimbursement | 104.85 | % | 93.97 | % | 80.18 | % | 201.44 | % (d) | ||||||||
| Ratio of net investment income to average net assets | 1.73 | % | 1.56 | % | 1.15 | % | 0.98 | % (d) | ||||||||
| Portfolio turnover rate | 18 | % | 22 | % | 17 | % | 4 | % (c) | ||||||||
| (a) | For the period July 17, 2020 (commencement of operations) to August 31, 2020. |
| (b) | Total return represents the rate that the investor would have earned or lost on an investment in the Fund, assuming reinvestment of distributions. |
| (c) | Not annualized. |
| (d) | Annualized. |
See accompanying notes which are an integral part of these financial statements.
17
| Fisher Investments Institutional Group All Foreign Equity |
| Environmental and Social Values Fund |
| Notes to the Financial Statements |
| August 31, 2023 |
NOTE 1. ORGANIZATION
Fisher Investments Institutional Group All Foreign Equity Environmental and Social Values Fund (the “Fund”) is registered under the Investment Company Act of 1940, as amended (the “1940 Act”), as a diversified series of Unified Series Trust (the “Trust”) on November 12, 2018. The Trust is an open-end investment company established under the laws of Ohio by an Agreement and Declaration of Trust dated October 14, 2002, as amended (the “Trust Agreement”). The Trust Agreement permits the Board of Trustees of the Trust (the “Board”) to issue an unlimited number of shares of beneficial interest of separate series without par value. The Fund is one of a series of funds currently authorized by the Board. The Fund commenced operations on July 17, 2020. The investment adviser to the Fund is Fisher Asset Management, LLC, d/b/a Fisher Investments (the “Adviser”). The investment objective of the Fund is to seek to outperform, net of fees and expenses, the return of the MSCI ACWI ex U.S. Index.
NOTE 2. SIGNIFICANT ACCOUNTING POLICIES
The Fund is an investment company and follows accounting and reporting guidance under Financial Accounting Standards Board Accounting Standards Codification (“ASC”) Topic 946, “Financial Services-Investment Companies”, including Accounting Standards Update 2013-08. The following is a summary of significant accounting policies followed by the Fund in the preparation of its financial statements. These policies are in conformity with generally accepted accounting principles in the United States of America (“GAAP”).
Regulatory update – Tailored Shareholder Reports for Mutual Funds and Exchange-Traded Funds (“ETFs”) – Effective January 24, 2023, the Securities and Exchange Commission (the “SEC”) adopted rule and form amendments to require mutual funds and ETFs to transmit concise and visually engaging streamlined annual and semiannual reports to shareholders that highlight key information. Other information, including financial statements, will no longer appear in a streamlined shareholder report but must be available online, delivered free of charge upon request, and filed on a semiannual basis on Form N-CSR. The rule and form amendments have a compliance date of July 24, 2024. At this time, management is evaluating the impact of these amendments on the shareholder reports for the Fund.
Estimates – The preparation of financial statements in conformity with GAAP requires management to make estimates and assumptions that affect the reported amounts of assets and liabilities and disclosure of contingent assets and liabilities at the date of the financial statements and the reported amounts of increases and decreases in net assets from operations during the reporting period. Actual results could differ from those estimates.
18
| Fisher Investments Institutional Group All Foreign Equity |
| Environmental and Social Values Fund |
| Notes to the Financial Statements (continued) |
| August 31, 2023 |
Foreign Currency Translation – The accounting records of the Fund are maintained in U.S. dollars. Foreign currency amounts are translated into U.S. dollars at the current rate of exchange each business day to determine the value of investments, and other assets and liabilities. Purchases and sales of foreign securities, and income and expenses, are translated at the prevailing rate of exchange on the respective date of these transactions. The Fund does not isolate that portion of the results of operations resulting from changes in foreign exchange rates on investments from fluctuations arising from changes in market prices of securities held. These fluctuations are included with the realized and unrealized gain or loss from investments. Net realized gain (loss) on foreign currency translations on the Statement of Operations represents currency gains (losses) realized between the trade and settlement dates on securities transactions, and the difference between the amount of investment income and foreign withholding taxes recorded on the Fund’s books and the U.S. dollar equivalent amounts actually received or paid. The change in unrealized currency gains (losses) on foreign currency translations for the period is reflected in the Statement of Operations.
Federal Income Taxes – The Fund makes no provision for federal income or excise tax. The Fund has qualified and intends to qualify each year as a regulated investment company (“RIC”) under subchapter M of the Internal Revenue Code of 1986, as amended, by complying with the requirements applicable to RICs and by distributing substantially all of its taxable income. The Fund also intends to distribute sufficient net investment income and net realized capital gains, if any, so that it will not be subject to excise tax on undistributed income and gains. If the required amount of net investment income or gains is not distributed, the Fund could incur a tax expense.
As of and during the fiscal year ended August 31, 2023, the Fund did not have any liabilities for any unrecognized tax benefits. The Fund recognizes interest and penalties, if any, related to unrecognized tax benefits as income tax expense in the Statement of Operations when incurred. During the fiscal year ended August 31, 2023, the Fund did not incur any interest or penalties. Management of the Fund has reviewed tax positions taken in tax years that remain subject to examination by all major tax jurisdictions, including federal (i.e., the previous three tax year ends and the interim tax period since then, as applicable) and has concluded that no provision for unrecognized tax benefits or expenses is required in these financial statements and does not expect this to change over the next twelve months.
Expenses – Expenses incurred by the Trust that do not relate to a specific fund of the Trust are allocated to the individual funds of the Trust based on each fund’s relative net assets or another appropriate basis (as determined by the Board).
Security Transactions and Related Income – The Fund follows industry practice and records security transactions on the trade date for financial reporting purposes. The specific
19
| Fisher Investments Institutional Group All Foreign Equity |
| Environmental and Social Values Fund |
| Notes to the Financial Statements (continued) |
| August 31, 2023 |
identification method is used for determining gains or losses for financial statements and income tax purposes. Dividend income is recorded on the ex-dividend date and interest income is recorded on an accrual basis. Withholding taxes on foreign dividends and related reclaims have been provided for in accordance with the Fund’s understanding of the applicable country’s tax rules and rates.
Dividends and Distributions – The Fund intends to distribute its net investment income and net realized long-term and short-term capital gains, if any, at least annually. Dividends and distributions to shareholders, which are determined in accordance with income tax regulations, are recorded on the ex-dividend date. The treatment for financial reporting purposes of distributions made to shareholders during the period from net investment income or net realized capital gains may differ from their ultimate treatment for federal income tax purposes. These differences are caused primarily by differences in the timing of the recognition of certain components of income, expense or realized capital gain for federal income tax purposes. Where such differences are permanent in nature, they are reclassified among the components of net assets based on their ultimate characterization for federal income tax purposes. Any such reclassifications will have no effect on net assets, results of operations or net asset value (“NAV”) per share of the Fund.
NOTE 3. SECURITIES VALUATION AND FAIR VALUE MEASUREMENTS
The Fund values its portfolio securities at fair value as of the close of regular trading on the New York Stock Exchange (“NYSE”) (normally 4:00 p.m. Eastern Time) on each business day the NYSE is open for business. Fair value is defined as the price that the Fund would receive upon selling an investment in a timely transaction to an independent buyer in the principal or most advantageous market of the investment. GAAP establishes a three-tier hierarchy to maximize the use of observable market data and minimize the use of unobservable inputs and to establish classification of fair value measurements for disclosure purposes.
Inputs refer broadly to the assumptions that market participants would use in pricing the asset or liability, including assumptions about risk (the risk inherent in a particular valuation technique used to measure fair value including a pricing model and/or the risk inherent in the inputs to the valuation technique). Inputs may be observable or unobservable. Observable inputs are inputs that reflect the assumptions market participants would use in pricing the asset or liability developed based on market data obtained and available from sources independent of the reporting entity. Unobservable inputs are inputs that reflect the reporting entity’s own assumptions about the assumptions market participants would use in pricing the asset or liability developed based on the best information available in the circumstances.
20
| Fisher Investments Institutional Group All Foreign Equity |
| Environmental and Social Values Fund |
| Notes to the Financial Statements (continued) |
| August 31, 2023 |
Various inputs are used in determining the value of the Fund’s investments. These inputs are summarized in the three broad levels listed below.
| ● | Level 1 – unadjusted quoted prices in active markets for identical investments and/or registered investment companies where the value per share is determined and published and is the basis for current transactions for identical assets or liabilities at the valuation date |
| ● | Level 2 – other significant observable inputs (including, but not limited to, quoted prices for an identical security in an inactive market, quoted prices for similar securities, interest rates, prepayment speeds, credit risk, etc.) |
| ● | Level 3 – significant unobservable inputs (including the Fund’s own assumptions in determining fair value of investments based on the best information available) |
The inputs used to measure fair value may fall into different levels of the fair value hierarchy. In such cases, for disclosure purposes, the level in the fair value hierarchy which is reported is determined based on the lowest level input that is significant to the fair value measurement in its entirety.
Equity securities that are traded on any stock exchange are generally valued at the last quoted sale price on the security’s primary exchange. Lacking a last sale price, an exchange-traded security is generally valued at its last bid price. Securities traded in the Nasdaq over-the-counter market are generally valued at the Nasdaq Official Closing Price. When using market quotations and when the market is considered active, the security is classified as a Level 1 security. In the event that market quotations are not readily available or are considered unreliable due to market or other events, securities are valued in good faith by the Adviser, as Valuation Designee, under oversight of the Board’s Pricing & Liquidity Committee. The Adviser has adopted written policies and procedures for valuing securities and other assets in circumstances where market quotes are not readily available in conformity with guidelines adopted by the Board. In the event that market quotes are not readily available, and the security or asset cannot be valued pursuant to one of the valuation methods, the value of the security or asset will be determined in good faith by the Valuation Designee pursuant to its policies and procedures. Any fair value provided by the Valuation Designee, is subject to the ultimate review of the pricing methodology by the Pricing & Liquidity Committee of the Board on a quarterly basis. Under these policies, the securities will be classified as Level 2 or 3 within the fair value hierarchy, depending on the inputs used.
With respect to foreign equity securities that are principally traded on a market outside the United States, the Board has approved the utilization of an independent fair value pricing
21
| Fisher Investments Institutional Group All Foreign Equity |
| Environmental and Social Values Fund |
| Notes to the Financial Statements (continued) |
| August 31, 2023 |
service to evaluate the effect of market fluctuations on these securities after the close of trading in that foreign market. To the extent that securities are valued using this service, they will be classified as Level 2 securities.
Investments in mutual funds, including money market mutual funds, are generally priced at the ending NAV provided by the service agent of the mutual funds. These securities are categorized as Level 1 securities.
In accordance with the Trust’s valuation policies and fair value determinations pursuant to Rule 2a-5 under the 1940 Act, the Valuation Designee is required to consider all appropriate factors relevant to the value of securities for which it has determined other pricing sources are not available or reliable as described above. No single method exists for determining fair value because fair value depends upon the circumstances of each individual case. As a general principle, the current fair value of a security being valued by the Valuation Designee would be the amount that the Fund might reasonably expect to receive upon the current sale. Methods that are in accordance with this principle may, for example, be based on (i) a multiple of earnings; (ii) a discount from market prices of a similar freely traded security (including a derivative security or a basket of securities traded on other markets, exchanges or among dealers); or (iii) yield to maturity with respect to debt issues, or a combination of these and other methods. Fair-value pricing is permitted if, in the Valuation Designee’s opinion, the validity of market quotations appears to be questionable based on factors such as evidence of a thin market in the security based on a small number of quotations, a significant event occurs after the close of a market but before the Fund’s NAV calculation that may affect a security’s value, or the Valuation Designee is aware of any other data that calls into question the reliability of market quotations. The Valuation Designee may obtain assistance from others in fulfilling its duties. For example, it may seek assistance from pricing services, fund administrators, sub-advisers, accountants, or counsel; it may also consult the Trust’s Fair Value Committee. The Valuation Designee, however, remains responsible for the final fair value determination and may not designate or assign that responsibility to any third party.
The following is a summary of the inputs used to value the Fund’s investments as of August 31, 2023:
| Valuation Inputs | ||||||||||||||||
| Assets | Level 1 | Level 2 | Level 3 | Total | ||||||||||||
| Common Stocks(a) | $ | 183,984 | $ | — | $ | — | $ | 183,984 | ||||||||
| Money Market Funds | 5,660 | — | — | 5,660 | ||||||||||||
| Total | $ | 189,644 | $ | — | $ | — | $ | 189,644 | ||||||||
| (a) | Refer to Schedule of Investments for sector classifications. |
22
| Fisher Investments Institutional Group All Foreign Equity |
| Environmental and Social Values Fund |
| Notes to the Financial Statements (continued) |
| August 31, 2023 |
The Fund did not hold any investments at the end of the reporting period for which significant unobservable inputs (Level 3) were used in determining fair value; therefore, no reconciliation of Level 3 securities is included for this reporting period.
NOTE 4. FEES AND OTHER TRANSACTIONS WITH AFFILIATES AND OTHER SERVICE PROVIDERS
The Adviser, under the terms of the management agreement (the “Agreement”) with the Trust with respect to the Fund, manages the Fund’s investments. As compensation for its management services, the Fund is obligated to pay the Adviser a management fee computed and accrued daily and paid monthly at an annual rate of 0.61% of the Fund’s average daily net assets. For the fiscal year ended August 31, 2023, the Adviser earned management fees of $1,019 from the Fund before the fee waiver and expense reimbursement described below.
The Adviser has contractually agreed to waive its management fee and/or to reimburse the Fund’s other expenses in order to limit the Fund’s total annual operating expenses to 0.68% of the Fund’s average daily net assets through December 31, 2027 (excluding portfolio transaction and other investment-related costs (including brokerage fees and commissions); taxes; borrowing costs (such as interest and dividend expenses on securities sold short); acquired fund fees and expenses; fees and expenses associated with investments in other collective investment vehicles or derivative instruments (including for example option and swap fees and expenses); any administrative and/or shareholder servicing fees payable pursuant to a plan adopted by the Board; expenses incurred in connection with any merger or reorganization; extraordinary expenses (such as litigation expenses, indemnification of Trust officers and Trustees and contractual indemnification of Fund service providers); and other expenses that the Trustees agree have not been incurred in the ordinary course of the Fund’s business). This expense cap may not be terminated prior to this date except by the Board upon 60 days’ written notice to the Adviser. For the fiscal year ended August 31, 2023, the Adviser waived fees and/or reimbursed expenses in the amount of $174,056 for the Fund. At August 31, 2023, the Adviser owed the Fund $13,889.
Each waiver/expense payment by the Adviser is subject to recoupment by the Adviser from the Fund in the three years following the date the particular waiver/expense payment occurred, but only if such recoupment can be achieved without exceeding the annual expense limitation in effect at the time of the waiver/expense payment and any expense limitation in effect at the time of the recoupment. As of August 31, 2023, the Adviser may seek repayment of expense reimbursements in amounts as follows:
| Recoverable Through | ||||
| August 31, 2024 | $ | 147,330 | ||
23
| Fisher Investments Institutional Group All Foreign Equity |
| Environmental and Social Values Fund |
| Notes to the Financial Statements (continued) |
| August 31, 2023 |
| Recoverable Through | ||||
| August 31, 2025 | 169,173 | |||
| August 31, 2026 | 174,056 | |||
Ultimus Fund Solutions, LLC (“Ultimus”) provides administration, fund accounting and transfer agent services to the Fund. The Fund pays Ultimus fees in accordance with the agreements for such services.
Northern Lights Compliance Services, LLC (“NLCS”), an affiliate of Ultimus, provides a Chief Compliance Officer to the Trust, as well as related compliance services, pursuant to a consulting agreement between NLCS and the Trust. Under the terms of such agreement, NLCS receives fees from the Fund, which are approved annually by the Board.
Under the terms of a Distribution Agreement with the Trust, Ultimus Fund Distributors, LLC (the “Distributor”) serves as principal underwriter to the Fund. The Distributor is a wholly-owned subsidiary of Ultimus. The Distributor is compensated by the Adviser (not the Fund) for acting as principal underwriter.
Certain officers of the Trust are also employees of Ultimus and such persons are not paid by the Fund for serving in such capacities. One Trustee is a former employee of Ultimus who is not currently paid by the Fund for serving in such capacity.
The Board supervises the business activities of the Trust. Each Trustee serves as a trustee until termination of the Trust unless the Trustee dies, resigns, retires, or is removed. The Chair of the Board and more than 75% of the Trustees are “Independent Trustees,” which means that they are not “interested persons” as defined in the 1940 Act. The Independent Trustees review and establish compensation at least annually. Each Independent Trustee of the Trust receives annual compensation, which is an established amount paid quarterly per fund in the Trust at the time of the regular quarterly Board meetings. The Chair of the Board receives the highest compensation, commensurate with his additional duties and each Chair of a committee receives additional compensation as well. Independent Trustees also receive additional fees for attending any special meetings. In addition, the Trust reimburses Independent Trustees for out-of-pocket expenses incurred in conjunction with attendance at meetings.
NOTE 5. INVESTMENT TRANSACTIONS
For the fiscal year ended August 31, 2023, purchases and sales of investment securities, other than short-term investments, were $33,229 and $30,749, respectively.
There were no purchases or sales of long-term U.S. government obligations during the fiscal year ended August 31, 2023.
24
| Fisher Investments Institutional Group All Foreign Equity |
| Environmental and Social Values Fund |
| Notes to the Financial Statements (continued) |
| August 31, 2023 |
NOTE 6. BENEFICIAL OWNERSHIP
The beneficial ownership, either directly or indirectly, of more than 25% of the voting securities of a fund creates a presumption of control of a fund, under Section 2(a)(9) of the 1940 Act. As of August 31, 2023, the Adviser owned 100% of the Fund’s outstanding shares. As a result, the Adviser may be deemed to control the Fund.
NOTE 7. FEDERAL TAX INFORMATION
At August 31, 2023, the net unrealized appreciation (depreciation) and tax cost of investments for tax purposes was as follows:
| Gross unrealized appreciation | $ | 36,032 | ||
| Gross unrealized depreciation | (17,783 | ) | ||
| Net unrealized appreciation on investments | $ | 18,249 | ||
| Tax cost of investments | $ | 171,395 |
The tax character of distributions paid for the fiscal years ended August 31, 2023 and August 31, 2022 were as follows:
| 2023 | 2022 | |||||||
| Distributions paid from: | ||||||||
| Ordinary income(a) | $ | 2,634 | $ | 4,604 | ||||
| Long-term capital gains | — | 2,127 | ||||||
| Total distributions paid | $ | 2,634 | $ | 6,731 | ||||
| (a) | Short-term capital gain distributions are treated as ordinary income for tax purposes. |
At August 31, 2023, the components of accumulated earnings (deficit) on a tax basis were as follows:
| Undistributed ordinary income | $ | 2,433 | ||
| Accumulated capital and other losses | (2,623 | ) | ||
| Unrealized appreciation on investments | 18,249 | |||
| Total accumulated earnings | $ | 18,059 |
The differences between book-basis and tax-basis unrealized appreciation (depreciation) are attributable primarily to tax deferral of losses on wash sales
As of August 31, 2023, the Fund had accumulated short-term capital loss carryforwards of $2,210 and long-term capital loss carryforwards of $413, not subject to expiration.
25
| Fisher Investments Institutional Group All Foreign Equity |
| Environmental and Social Values Fund |
| Notes to the Financial Statements (continued) |
| August 31, 2023 |
NOTE 8. SECTOR RISK
If the Fund has significant investments in the securities of issuers within a particular sector, any development affecting that sector will have a greater impact on the value of the net assets of the Fund than would be the case if the Fund did not have significant investments in that sector. In addition, this may increase the risk of loss in the Fund and increase the volatility of the Fund’s NAV per share. For instance, economic or market factors, regulatory changes or other developments may negatively impact all companies in a particular sector, and therefore the value of the Fund’s portfolio will be adversely affected. As of August 31, 2023, the Fund had 27.20% of the value of its net assets invested in stocks within the Technology sector.
NOTE 9. COMMITMENTS AND CONTINGENCIES
The Trust indemnifies its officers and Trustees for certain liabilities that may arise from their performance of their duties to the Trust or the Fund. Additionally, in the normal course of business, the Trust enters into contracts that contain a variety of representations and warranties which provide general indemnifications. The Trust’s maximum exposure under these arrangements is unknown, as this would involve future claims that may be made against the Trust that have not yet occurred.
NOTE 10. SUBSEQUENT EVENTS
Management of the Fund has evaluated the need for disclosures and/or adjustments resulting from subsequent events through the date at which these financial statements were issued. Based upon this evaluation, management has determined there were no items requiring adjustment of the financial statements or additional disclosure.
26
| Report of Independent Registered Public Accounting Firm |
To the Shareholders of Fisher Investment Institutional Group Fund Family and
Board of Trustees of Unified Series Trust
Opinion on the Financial Statements
We have audited the accompanying statement of assets and liabilities, including the schedule of investments, of Fisher Investments Institutional Group All Foreign Equity Environmental and Social Values Fund (the “Fund”), a series of Unified Series Trust as of August 31, 2023, the related statement of operations for the year then ended, the statements of changes in net assets for each of the two years in the period then ended, the related notes, and the financial highlights for the years ended August 31, 2023, 2022, 2021 and for the period July 17, 2020 (commencement of operations) to August 31, 2020 (collectively referred to as the “financial statements”). In our opinion, the financial statements present fairly, in all material respects, the financial position of the Fund as of August 31, 2023, the results of its operations for the year then ended, the changes in net assets for each of the two years in the period then ended, and the financial highlights for the years ended August 31, 2023, 2022, 2021 and for the period July 17, 2020 (commencement of operations) to August 31, 2020, in conformity with accounting principles generally accepted in the United States of America.
Basis for Opinion
These financial statements are the responsibility of the Fund’s management. Our responsibility is to express an opinion on the Fund’s financial statements based on our audits. We are a public accounting firm registered with the Public Company Accounting Oversight Board (United States) (“PCAOB”) and are required to be independent with respect to the Fund in accordance with the U.S. federal securities laws and the applicable rules and regulations of the Securities and Exchange Commission and the PCAOB.
We conducted our audits in accordance with the standards of the PCAOB. Those standards require that we plan and perform the audit to obtain reasonable assurance about whether the financial statements are free of material misstatement whether due to error or fraud.
Our audits included performing procedures to assess the risks of material misstatement of the financial statements, whether due to error or fraud, and performing procedures that respond to those risks. Such procedures included examining, on a test basis, evidence regarding the amounts and disclosures in the financial statements. Our procedures included confirmation of securities owned as of August 31, 2023, by correspondence with the custodian. Our audits also included evaluating the accounting principles used and significant estimates made by management, as well as evaluating the overall presentation of the financial statements. We believe that our audits provide a reasonable basis for our opinion.
We have served as the auditor of one or more investment companies advised by Fisher Asset Management, LLC since 2017.
COHEN & COMPANY, LTD.
Chicago, Illinois
October 27, 2023
27
| Liquidity Risk Management Program (Unaudited) |
The Trust has adopted and implemented a written liquidity risk management program (the “Program”) as required by Rule 22e-4 (the “Liquidity Rule”) under the 1940 Act. The Program is reasonably designed to assess and manage the Fund’s liquidity risk, taking into consideration, among other factors, the Fund’s investment strategy and the liquidity of its portfolio investments during normal and reasonably foreseeable stressed conditions; its short and long- term cash flow projections; and its cash holdings and access to other funding sources. The Board approved the appointment of the Liquidity Administrator Committee, comprising certain Trust officers and employees of the Adviser. The Liquidity Administrator Committee maintains Program oversight and reports to the Board on at least an annual basis regarding the Program’s operational effectiveness through a written report (the “Report”). The most recent Report, which was presented to the Board for consideration at its meeting held on August 14-15, 2023, outlined the operation of the Program and the adequacy and effectiveness of the Program’s implementation. During the review period, the Fund did not experience unusual stress or disruption to its operations related to purchase and redemption activity. Also, during the review period the Fund held adequate levels of cash and highly liquid investments to meet shareholder redemption activities in accordance with applicable requirements. The Report concluded that the Program is reasonably designed to prevent violation of the Liquidity Rule and has been effectively implemented.
28
| Summary of Fund Expenses (Unaudited) |
As a shareholder of the Fund, you incur two types of costs: (1) transaction costs and (2) ongoing costs, including management fees; and other Fund expenses. These examples are intended to help you understand your ongoing costs (in dollars) of investing in the Fund and to compare these costs with the ongoing costs of investing in other funds. You may pay brokerage commissions on purchases and sales of exchange-traded fund shares, which are not reflected in the example. The example is based on an investment of $1,000 invested at the beginning of the period and held for the entire period from March 1, 2023 through August 31, 2023.
Actual Expenses
The first line of the table below provides information about actual account values and actual expenses. You may use the information in this line, together with the amount you invested, to estimate the expenses that you paid over the period. Simply divide your account value by $1,000 (for example, an $8,600 account value divided by $1,000 = 8.6), then multiply the result by the number in the first line under the heading “Expenses Paid During Period” to estimate the expenses you paid on your account during this period.
Hypothetical Example for Comparison Purposes
The second line of the table below provides information about hypothetical account values and hypothetical expenses based on the Fund’s actual expense ratio and an assumed rate of return of 5% per year before expenses, which is not the Fund’s actual return. The hypothetical account values and expenses may not be used to estimate the actual ending account balance or expenses you paid for the period. You may use this information to compare the ongoing costs of investing in the Fund and other funds. To do so, compare this 5% hypothetical example with the 5% hypothetical examples that appear in the shareholder reports of other funds.
| Beginning | Ending | |||||||||
| Account | Account | Expenses | ||||||||
| Value | Value | Paid | Annualized | |||||||
| March 1, | August 31, | During | Expense | |||||||
| 2023 | 2023 | Period(a) | Ratio | |||||||
| Actual | $1,000.00 | $1,055.40 | $ | 3.52 | 0.68% | |||||
| Hypothetical(b) | $1,000.00 | $1,021.78 | $ | 3.47 | 0.68% | |||||
| (a) | Expenses are equal to the Fund’s annualized expense ratios, multiplied by the average account value over the period, multiplied by 184/365 (to reflect the one-half year period). |
| (b) | Hypothetical assumes 5% annual return before expenses. |
29
| Additional Federal Income Tax Information (Unaudited) |
The Form 1099-DIV you receive in January 2024 will show the tax status of all distributions paid to your account in calendar year 2023. Shareholders are advised to consult their own tax adviser with respect to the tax consequences of their investment in the Fund. As required by the Internal Revenue Code and/or regulations, shareholders must be notified regarding the status of qualified dividend income for individuals and the dividends received deduction for corporations.
Qualified Dividend Income. The Fund designates approximately 100% or up to the maximum amount of such dividends allowable pursuant to the Internal Revenue Code, as qualified dividend income eligible for a reduced tax rate.
Qualified Business Income. The Fund designates approximately 0% of its ordinary income dividends, or up to the maximum amount of such dividends allowable pursuant to the Internal Revenue Code, as qualified business income.
Dividends Received Deduction. Corporate shareholders are generally entitled to take the dividends received deduction on the portion of the Fund’s dividend distribution that qualifies under tax law. For the Fund’s calendar year 2023 ordinary income dividends, 0% qualifies for the corporate dividends received deduction.
30
| Trustees and Officers (Unaudited) |
GENERAL QUALIFICATIONS. The Board supervises the business activities of the Trust. Each Trustee serves as a trustee until termination of the Trust unless the Trustee dies, resigns, retires, or is removed. The Chair of the Board and more than 75% of the Trustees are “Independent Trustees”, which means that they are not “interested persons” (as defined in the 1940 Act) of the Trust or any adviser, sub-adviser or distributor of the Trust.
The following table provides information regarding the Independent Trustees.
| Name,
Address*, (Year of Birth), Position with Trust**, Term of Position with Trust |
Principal
Occupation During Past 5 Years and Other Directorships |
| Daniel
J. Condon (1950) Chair, May 2022 to present; Chair of the Audit Committee; Chair of the Governance & Nominating Committee, May 2020 to May 2022; Independent Trustee, December 2002 to present |
Current: Retired (2017 – present).
Previous: Peak Income Plus Fund (May 2022 – February 2023). |
| Kenneth
G.Y. Grant (1949) Chair of the Governance & Nominating Committee, May 2022 to present; Chair, January 2017 to May 2022; Independent Trustee, May 2008 to present |
Current: Director, Standpoint Multi-Asset (Cayman) Fund, Ltd. (2019 – present); Director, Advisors Charitable Gift Fund (2020 – present), a Donor Advised Fund; Trustee. Trustee, Peak Income Plus Fund (May 2022 – present).
Previous: EVP, Benefit Plans Administrative Services, Inc., provider of retirement benefit plans administration (2019 – 2020); Director, Northeast Retirement Services (NRS) LLC, a transfer agent and fund administrator; and Director, Global Trust Company (GTC), a non-depository trust company sponsoring private investment products (2003 – 2019); EVP, NRS (2003 – 2019); GTC, EVP (2008 – 2019); EVP, Savings Banks Retirement Association (2003 – 2019), provider of qualified retirement benefit plans. |
| Ronald
C. Tritschler (1952) Chair of the Audit Committee, May 2022 to present; Independent Trustee, January 2007 to present; Interested Trustee, December 2002 to December 2006 |
Current: Chief Executive Officer, Director and Legal Counsel of The Webb Companies, a national real estate company, (2001– present); Director, Standpoint Multi-Asset (Cayman) Fund, Ltd. (2020 – present); Director of First State Bank of the Southeast (2000 – present).
Previous: Trustee, Peak Income Plus Fund (May 2022 – February 2023). |
31
| Trustees and Officers (Unaudited) (continued) |
| Catharine
B. McGauley (1977) Chair of the Pricing & Liquidity Committee, November 2022 to present; Independent Trustee, September 2022 to present |
Current: Lead Portfolio Manager of Atlantic Charter Insurance, a workers’ compensation insurer, (2010 – present); Investment Advisor for a Family Office (2015 – present); Senior Analyst/Advisor for a Boston real estate company and related family (2010 – present).
Previous: Trustee, Peak Income Plus Fund (May 2022 – February 2023). |
| Freddie
Jacobs, Jr. (1970) Independent Trustee, September 2022 to present |
Current: Chief Operating Officer and Chief Risk Officer Northeast Retirement Services LLC (NRS), and its subsidiary, Global Trust Company (GTC). NRS is a transfer agent and fund administrator, GTC is a non- depository trust company sponsoring private investment products (2021 – present); Chair, Board of Crispus Attucks Fund (2020 – present); Board Member of Camp Harbor View (2020 – present); Director, Sportsmen’s Tennis and Education Center (2019 – present).
Previous: SVP, Senior Risk Officer NRS (2013 – 2021); Trustee, Peak Income Plus Fund (May 2022 – February 2023); Trustee of Buckingham Browne & Nichols (2017 - June 2023). |
| * | The address for each Trustee is 225 Pictoria Drive, Suite 450, Cincinnati, Ohio 45246. |
| ** | As of the date of this report, the Trust consists of 29 series. |
The following table provides information regarding the Interested Trustees and Officers of the Trust.
| Name,
Address*, (Year of Birth), Position with Trust, Term of Position with Trust |
Principal
Occupation During Past 5 Years and Other Directorships |
| David
R. Carson (1958) Interested Trustee, August 2020 to present; President, January 2016 to August 2021 |
Current: Retired (2023 – present); Interested Trustee, Mammoth Institutional Credit Access Fund and Mammoth Institutional Equity Access Fund (November 2022 – present); Interested Trustee, Peak Income Plus Fund (May 2022 – present).
Previous: Interested Trustee of Ultimus Managers Trust, (January 2021 – April 2023); Senior Vice President Client Strategies of Ultimus Fund Solutions, LLC, (2013 – April 2023). |
32
| Trustees and Officers (Unaudited) (continued) |
| Martin
R. Dean (1963) President, August 2021 to present; Vice President, November 2020 to August 2021; Chief Compliance Officer, April 2021 to August 2021; Assistant Chief Compliance Officer, January 2016 to April 2021 |
Current: President, Northern Lights Compliance Services (2023 – present).
Previous: Senior Vice President, Head of Fund Compliance of Ultimus Fund Solutions, LLC (2016 – January 2023). |
| Zachary
P. Richmond (1980) Treasurer and Chief Financial Officer, November 2014 to present |
Current: Vice President, Director of Financial Administration for Ultimus Fund Solutions, LLC, (2015 – present). |
| Gweneth
K. Gosselink (1955) Chief Compliance Officer, August 2021 to present |
Current: Assistant Vice President, Senior Compliance Officer of Ultimus Fund Solutions, LLC, since 2019.
Previous: Chief Operating Officer & CCO at Miles Capital, Inc. (2013 – 2019). |
| Elisabeth
Dahl (1962) Secretary, May 2017 to present; Assistant Secretary, March 2016 to May 2017 |
Current: Attorney, Ultimus Fund Solutions, LLC since March 2016. |
| Timothy
J. Shaloo (1970) AML Compliance Officer, August 2023 to present |
Current: AVP, Compliance Officer (September 2023 – present).
Previous: Senior Compliance Analyst, Northern Lights Compliance Services, LLC (2021 – August 2023); Compliance Specialist, Ultimus Fund Solutions, LLC (2016 – 2020). |
| * | The address for each Officer is 225 Pictoria Drive, Suite 450, Cincinnati, Ohio 45246. |
| Other Information (Unaudited) |
The Fund’s Statement of Additional Information (“SAI”) includes additional information about the trustees and is available without charge, upon request. You may call toll-free at (800) 851-8845 to request a copy of the SAI or to make shareholder inquiries.
33
PRIVACY NOTICE
Rev: January 2020
| FACTS | WHAT DOES FISHER INVESTMENTS INSTITUTIONAL GROUP ALL FOREIGN EQUITY ENVIRONMENTAL AND SOCIAL VALUES FUND (THE “FUND”) DO WITH YOUR PERSONAL INFORMATION? |
| Why? | Financial companies choose how they share your personal information. Federal law gives consumers the right to limit some but not all sharing. Federal law also requires us to tell you how we collect, share, and protect your personal information. Please read this notice carefully to understand what we do. |
| What? | The types of personal information we collect and share depend on the product or service you have with us. This information can include:
● Social Security number
● account balances and account transactions
● transaction or loss history and purchase history
When you are no longer our customer, we continue to share your information as described in this notice. |
| How? | All financial companies need to share customers’ personal information to run their everyday business. In the section below, we list the reasons financial companies can share their customers’ personal information; the reasons the Fund chooses to share; and whether you can limit this sharing. |
| Reasons we can share your personal information | Does
the Fund share? |
Can
you limit this sharing? |
For our everyday business purposes— such as to process your transactions, maintain your account(s), respond to court orders and legal investigations, or report to credit bureaus |
Yes | No |
For our marketing purposes— to offer our products and services to you |
No | We don’t share |
| For joint marketing with other financial companies | No | We don’t share |
For our affiliates’ everyday business purposes— information about your transactions and experiences |
No | We don’t share |
For our affiliates’ everyday business purposes— information about your creditworthiness |
No | We don’t share |
| For nonaffiliates to market to you | No | We don’t share |
| Questions? | Call (800) 851-8845 |
34
| Who we are | |
| Who is providing this notice? | Fisher Investments Institutional Group All Foreign Equity Environmental and Social Values Fund Ultimus Fund Distributors, LLC (Distributor) Ultimus Fund Solutions, LLC (Administrator) |
| What we do | |
| How does the Fund protect my personal information? | To protect your personal information from unauthorized access and use, we use security measures that comply with federal law. These measures include computer safeguards and secured files and buildings. Our service providers are held accountable for adhering to strict policies and procedures to prevent any misuse of your nonpublic personal information. |
| How does the Fund collect my personal information? | We collect your personal information, for example, when you
● open an account or deposit money
● make deposits or withdrawals from your account or provide account information
We also collect your personal information from other companies. |
| Why can’t I limit all sharing? | Federal law gives you the right to limit only
● sharing for affiliates’ everyday business purposes—information about your creditworthiness
● affiliates from using your information to market to you
● sharing for nonaffiliates to market to you
State laws and individual companies may give you additional rights to limit sharing. |
| Definitions | |
| Affiliates | Companies related by common ownership or control. They can be financial and nonfinancial companies.
● Fisher Asset Management, LLC, d/b/a Fisher Investments, the investment adviser to the Fund, could be deemed to be an affiliate. |
| Nonaffiliates | Companies not related by common ownership or control. They can be financial and nonfinancial companies.
● The Fund does not share your personal information with nonaffiliates so they can market to you |
| Joint marketing | A formal agreement between nonaffiliated financial companies that together market financial products or services to you.
● The Fund does not jointly market. |
35
| Proxy Voting |
A description of the policies and procedures that the Fund uses to determine how to vote proxies relating to portfolio securities and information regarding how the Fund voted those proxies during the most recent twelve month period ended June 30, are available (1) without charge upon request by calling the Fund at (800) 851-8845 and (2) in Fund documents filed with the SEC on the SEC’s website at www.sec.gov.
| TRUSTEES Daniel J. Condon, Chair David R. Carson Kenneth G.Y. Grant Freddie Jacobs, Jr. Catharine B. McGauley Ronald C. Tritschler |
INDEPENDENT
REGISTERED PUBLIC ACCOUNTING FIRM Cohen & Company, Ltd. 151 North Franklin Street, Suite 575 Chicago, IL 60606 |
OFFICERS Chief Compliance Officer Zachary P. Richmond, Treasurer and Chief Financial Officer |
LEGAL
COUNSEL Thompson Hine LLP 312 Walnut Street, 20th Floor Cincinnati, OH 45202 |
| INVESTMENT
ADVISER Fisher Asset Management, LLC 6500 International Parkway, Suite 2050 Plano, TX 75093 |
CUSTODIAN U.S. Bank, N.A. 425 Walnut Street Cincinnati, OH 45202 |
| DISTRIBUTOR Ultimus Fund Distributors, LLC 225 Pictoria Drive, Suite 450 Cincinnati, OH 45246 |
ADMINISTRATOR,
TRANSFER AGENT AND FUND ACCOUNTANT Ultimus Fund Solutions, LLC 225 Pictoria Drive, Suite 450 Cincinnati, OH 45246 |
This report is intended only for the information of shareholders or those who have received the Fund’s prospectus which contains information about the Fund’s management fee and expenses. Please read the prospectus carefully before investing.
Distributed by Ultimus Fund Distributors, LLC
Member FINRA/SIPC
Fisher1-AR-23

OneAscent Large Cap Core ETF (OALC)
OneAscent Core Plus Bond ETF (OACP)
OneAscent International Equity ETF (OAIM)
OneAscent Emerging Markets ETF (OAEM)
NYSE Arca, Inc.
Annual Report
August 31, 2023
OneAscent Investment Solutions, LLC
23 Inverness Center Parkway
Birmingham, Alabama 35242
Telephone: 1-800-222-8274
Management Discussion of Fund Performance (Unaudited)
Dear Shareholder,
It is our privilege to share with you the Annual Report for the OneAscent Investment Solutions suite of Exchange Traded Funds (ETFs) as of August 31, 2023.
At OneAscent, we believe that business is one of the most powerful engines that God has given us to impact the world. Because of this power, we believe investors should invest intentionally. We should consider not only who business may be impacting (i.e., People and Places), but also how those groups are being impacted (i.e., positively or negatively). To put it simply, OneAscent seeks to eliminate companies whose products or practices are causing harm while elevating those companies that make the world a better place. Our aim is to identify and invest in companies who not only make great investments but are also great businesses.
Since its founding in 2017, OneAscent has remained committed to developing investment solutions designed to help investors live aligned with what they value most. We call this Values-Based Investing. Over the past year, we have had the privilege to expand and deepen that commitment through the launch of OneAscent Emerging Markets ETF (September 2022) and OneAscent International Equity ETF (September 2022) in addition to OneAscent Large Cap Core ETF (November 2021) and OneAscent Core Plus Bond ETF (March 2022). We invite you to learn more about values-based investing and the comprehensive suite of OneAscent investment solutions available by visiting our website at investments.oneascent.com.
On behalf of our team at OneAscent, we want to extend our sincerest thanks and appreciation for the trust you have placed in us. We are honored to partner with you, as together, we seek to invest in businesses that bless the world.
Sincerely,

Cole Pearson, President
OneAscent Investment Solutions
1
Management Discussion of Fund Performance (Unaudited) (continued)
FUND PERFORMANCE AND REVIEW
OneAscent Large Cap Core ETF
The OneAscent Large Cap ETF (the “Fund”) returned 15.48% for the year ended August 31, 2023, compared to 15.94% for the S&P 500® Index. The Fund slightly underperformed during this period after giving back some of the outperformance it achieved over the first half of the fiscal year.
The new portfolio manager continued to change the structure of the Fund within the period, creating significant portfolio turnover. The Fund concentrated its holdings to approximately 50 stocks and placed greater emphasis on valuation and quality of the overall portfolio.
The Fund had a significant overweight to the Technology sector which proved to be the biggest contributor to performance over the period. Stocks in the Consumer Staples and Healthcare sectors were the next biggest contributors. Communications, Real Estate, and cash were the biggest detractors to performance.
In terms of individual stocks held in the portfolio, Align Technology (1% average weighting), Adobe (2.3%), and Arch Capital Group (1.2%) were the biggest contributors to performance. SVB Financial (0.6%), Nvidia (1.2%), and Crown Castle (1.2%) were the biggest detractors of performance. While the Fund sold its small position in SVB Financial before it declined sharply in March of this year, its underperformance leading up to that month still adversely affected the portfolio. The opposite situation was true for Nvidia, as the Fund liquidated its position early in 2023 for valuation purposes and, consequently, before the artificial intelligence euphoria hit the market. The Fund did not benefit from the stock’s price increase, which attributed to much of the Fund’s underperformance in Q2 2023.
Staying true to our “Elevate” mandate, the portfolio manager chose to invest in companies whose products and services may have a positive overall effect on society. Therefore, we chose not to invest in most of the “Magnificent Seven” – the top seven stocks in the S&P 500 by market cap. Consequently, these stocks (Apple, Microsoft, Meta Platforms, Alphabet, Amazon, Tesla, and Nvidia) together accounted for 38% of the index’s performance in the fiscal year. Therefore, OneAscent is proud to report performance for the Fund that was very similar to the index, despite not owning five of the stocks and only owning Microsoft and Nvidia for part of the year.
OneAscent Core Plus Bond ETF
The OneAscent Core Plus Bond ETF (the “Fund”) returned -1.05% for the year ended August 31, 2023, compared to the -1.19% return of its benchmark, the Bloomberg U.S. Aggregate Bond Index.
2
Management Discussion of Fund Performance (Unaudited) (continued)
The U.S. economy continued to defy predictions of a recession as the strong labor market and steady consumer spending contributed to better-than-expected growth. Inflation moved lower but remains elevated. Stronger growth and moderating inflation increased hopes for a soft landing, which supported risk assets.
The Fund remained defensively positioned with an up-in-quality profile given less attractive valuations and decelerating economic data, along with increasing risk of a policy induced economic downturn. In response to ongoing hawkish rhetoric from the Federal Reserve during the year, the Fund maintained its generally duration-neutral stance and flatter overall yield curve profile.
The Fund benefited from overweight positions in corporates and commercial mortgage-backed securities (CMBS), and a meaningful underweight to Treasuries; spread product outperformed treasuries during a year where rates rose. The Fund’s off-benchmark taxable municipal holdings also contributed favorably, as the sector continued to benefit from a supply-demand imbalance given scarcity value.
Holdings are selected based on the portfolio manager’s impact framework or on sustainable best practices leadership criteria. Impact holdings comprised around 53% of the Fund’s assets at year-end.
OneAscent International Equity ETF
The OneAscent International Equity ETF (the “Fund”) returned 21.89% from its inception date of September 14, 2022 through August 31, 2023, compared to the MSCI ACWI ex-USA Index’s return of 13.57%. Similar to the U.S., stock market returns around the world were strong over this period.
Effective stock selection accounted for most of the Fund’s outperformance in the period, as all sectors contributed positively to performance except for Consumer Discretionary and the Fund’s cash position. Technology was the biggest contributor followed by Industrials and Consumer Staples.
By region, companies from Europe contributed the most to the Fund’s outperformance, while the lone position in India, which underperformed the overall market, led to slight underperformance in Central Asia. By stock, CRH Plc (with an average weight of 3.3%), Topicus.com (2.2%), and ASML Holding (3%) were the biggest contributors. Dentium (0.4%), Nabtesco (2%), and HDFC Bank (2.3%) were the biggest detractors.
OneAscent’s team is pleased with the Fund’s strong outperformance during a strong market environment, especially with such positive overall stock selection attribution through all sectors and regions. OneAscent continues to strive to find great companies that are making a positive contribution to society all around the world.
3
Management Discussion of Fund Performance (Unaudited) (continued)
OneAscent Emerging Markets ETF
The OneAscent Emerging Markets ETF (the “Fund”) returned 11.77% from its inception date of September 14, 2022 through August 31, 2023, compared to the MSCI Emerging Market Index’s return of 4.48%. Equity market returns in Emerging Markets over this period were less strong than Developed Markets mainly because of underperformance in China.
The Fund’s overweight in technology companies drove much of the performance in the period; technology was the best performing sector by far, and the Fund held a 31% position, compared to 18% for the index. Good stock selection in Consumer Discretionary accounted for the second biggest contribution to the outperformance of the Fund followed by Consumer Staples. The Fund’s underweight position in Energy, Materials, and Communications were ultimately the only three negative sector contributions to the portfolio. Cash held in the portfolio made a positive contribution as the U.S. dollar performed strongly against most other currencies during the fiscal year.
A large underweight in China and large overweight position in Taiwan proved to be the two biggest contributing factors by country. The Chinese market fell by nearly 5% during the period while Taiwan stocks were up 15% on average. An underweight position in Brazil along with poor stock selection accounted for the biggest detraction by country. The portfolio had zero exposure to Turkey and Eastern European countries that had very strong stock returns overall in the period, which also provided a slight drag on performance.
Overall, OneAscent is pleased with the Fund’s allocation and the portfolio manager’s stock selection decisions over this period. The Fund continues to underweight its allocation to China due to concerns of the country’s impact on the world, including systematic theft of intellectual property, human rights abuses, and the government’s growing aggression on the geopolitical stage.
4
Investment Results (Unaudited)
Average Annual Total Returns* as of August 31, 2023
| Since | ||||
| Inception | ||||
| One Year | (11/15/2021) | |||
| OneAscent Large Cap Core ETF - NAV | 15.48% | (3.47)% | ||
| OneAscent Large Cap Core ETF - Market Price | 15.24% | (3.45)% | ||
| S&P 500® Index(a) | 15.94% | (0.48)% |
Total annual operating expenses based on estimated amounts for the current fiscal year, as disclosed in the OneAscent Large Cap Core ETF’s (the “Fund”) prospectus dated December 29, 2022 were 0.82% of average daily net assets. Additional information pertaining to the Fund’s expense ratio as of August 31, 2023 can be found in the financial highlights.
The performance quoted represents past performance, which does not guarantee future results. The investment return and principal value of an investment will fluctuate so that an investor’s shares, when redeemed, may be worth more or less than their original cost. The returns shown do not reflect deduction of taxes that a shareholder would pay on Fund distributions or the redemption of Fund shares. Current performance of the Fund may be lower or higher than the performance quoted. Performance data current to the most recent month end may be obtained by calling (800) 222-8274. The Fund’s per share net asset value (“NAV”) is the value of one share of the Fund as calculated in accordance with the standard formula for valuing shares. The NAV return is based on the NAV of the Fund and the market return is based on the market price per share of the Fund. The price used to calculate market return (“Market Price”) is determined by using the midpoint between the highest bid and the lowest offer on the primary stock exchange on which the shares of the Fund are listed for trading, as of the time that the Fund’s NAV is calculated. Market Price and NAV returns assume that dividends and capital gain distributions have been reinvested in the Fund at Market Price and NAV, respectively. Since exchange-traded funds are bought and sold at prices set by the market, which can result in a premium or discount to NAV, the returns calculated using Market Price can differ from those calculated using NAV. For more information about current performance, holdings or historical premiums/discounts, please visit the Fund’s website at http://investments.oneascent.com.
| * | Return figures reflect any change in price per share and assume the reinvestment of all distributions. |
| (a) | The S&P 500® Index is a widely recognized unmanaged index of 500 large capitalization companies and is representative of a broader market and range of securities than are found in the Fund’s portfolio. Index returns do not reflect the deduction of expenses, which have been deducted from the Fund’s returns. Index returns assume reinvestment of all distributions and do not reflect the deduction of taxes and fees. Individuals cannot invest directly in an index. |
The Fund’s investment objective, strategies, risks, charges and expenses must be considered carefully before investing. The prospectus contains this and other important information about the Fund and may be obtained by calling (800) 222-8274. Please read it carefully before investing.
The Fund is distributed by Northern Lights Distributors, LLC, Member FINRA/SIPC.
5
Investment Results (Unaudited) (continued)
Comparison of the Growth of a $10,000 Investment in the OneAscent Large Cap Core ETF (NAV) and the S&P 500® Index (Unaudited)
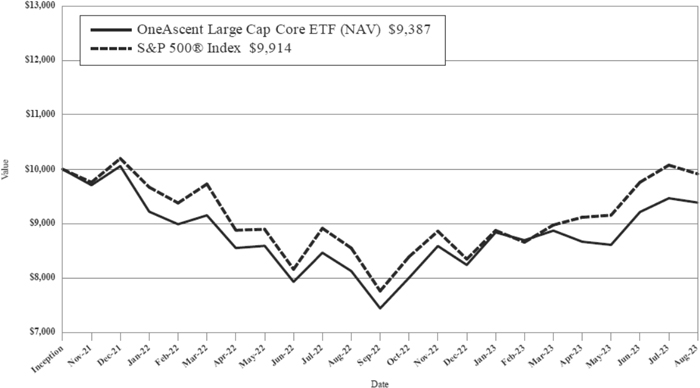
The chart above assumes an initial investment of $10,000 made on November 15, 2021 (commencement of operations) and held through August 31, 2023. THE ONEASCENT LARGE CAP CORE ETF’S RETURNS REPRESENT PAST PERFORMANCE AND DO NOT GUARANTEE FUTURE RESULTS. The S&P 500® Index is a widely recognized unmanaged index of 500 large capitalization companies and is representative of a broader market and range of securities than are found in the OneAscent Large Cap Core ETF’s portfolio. The returns shown do not reflect deduction of taxes that a shareholder would pay on the OneAsecnt Large Cap Core ETF distributions or the redemption of shares. Investment returns and principal values will fluctuate so that your shares, when redeemed, may be worth more or less than their original purchase price.
Current performance may be lower or higher than the performance data quoted. For more information on the OneAscent Large Cap Core ETF, and to obtain performance data current to the most recent month-end, or to request a prospectus, please call (800) 222-8274. The OneAscent Large Cap Core ETF’s prospectus contains important information about the OneAscent Large Cap Core ETF’s investment objective, potential risks, management fees, charges and expenses, and other information. Please read the prospectus or summary prospectus carefully before investing.
The Fund is distributed by Northern Lights Distributors, LLC, Member FINRA/SIPC.
6
Investment Results (Unaudited) (continued)
Average Annual Total Returns* as of August 31, 2023
| Since | ||||
| Inception | ||||
| One Year | (3/30/2022) | |||
| OneAscent Core Plus Bond ETF - NAV | (1.05)% | (4.43)% | ||
| OneAscent Core Plus Bond ETF - Market Price | (0.85)% | (4.46)% | ||
| Bloomberg U.S. Aggregate Bond Index(a) | (1.19)% | (4.40)% |
Total annual operating expenses based on estimated amounts for the current fiscal year, as disclosed in the OneAscent Core Plus Bond ETF’s (the “Fund”) prospectus dated December 29, 2022 were 0.76% of average daily net assets. OneAscent Investment Solutions, LLC (the “Adviser”) has contractually agreed to waive its management fee and/or reimburse expenses so that total annual Fund operating expenses, excluding portfolio transaction and other investment-related costs (including brokerage fees and commissions); taxes; borrowing costs (such as interest and dividend expenses on securities sold short); acquired fund fees and expenses; fees and expenses associated with investments in other collective investment vehicles or derivative instruments (including for example option and swap fees and expenses); any administrative and/or shareholder servicing fees payable pursuant to a plan adopted by the Board of Trustees; expenses incurred in connection with any merger or reorganization; extraordinary expenses (such as litigation expenses, indemnification of Trust officers and Trustees and contractual indemnification of Fund service providers); and other expenses that the Trustees agree have not been incurred in the ordinary course of the Fund’s business, do not exceed 1.00% through December 31, 2023. This expense cap may not be terminated prior to this date except by the Board of Trustees upon sixty (60) days’ written notice to the Adviser and may not be terminated by the Adviser without the Board of Trustees’ consent. Each waiver/expense payment by the Adviser is subject to recoupment by the Adviser from the Fund in the three years following the date the particular waiver/expense payment occurred, but only if such recoupment can be achieved without exceeding the annual expense limitation in effect at the time of the waiver/expense payment and any expense limitation in effect at the time of the recoupment. Additional information pertaining to the Fund’s expense ratio as of August 31, 2023 can be found in the financial highlights.
The performance quoted represents past performance, which does not guarantee future results. The investment return and principal value of an investment will fluctuate so that an investor’s shares, when redeemed, may be worth more or less than their original cost. The returns shown do not reflect deduction of taxes that a shareholder would pay on Fund distributions or the redemption of Fund shares. Current performance of the Fund may be lower or higher than the performance quoted. Performance data current to the most recent month end may be obtained by calling (800) 222-8274. The Fund’s per share net asset value (“NAV”) is the value of one share of the Fund as calculated in accordance with the standard formula for valuing shares. The NAV return is based on the NAV of the Fund and the market return is based on the market price per share of the Fund. The price used to calculate market return (“Market Price”) is determined by using the midpoint between the highest bid and the lowest offer on the primary stock exchange on which the shares of the Fund are listed for trading, as of the time that the Fund’s NAV is calculated. Market Price and NAV returns assume that dividends and capital gain distributions have been reinvested in the Fund at Market Price and NAV, respectively. Since exchange-traded funds are bought and sold at prices set by the market, which can result in a premium or discount to NAV, the returns calculated using Market Price can differ from those calculated using NAV. For more information about current performance, holdings or historical premiums/discounts, please visit the Fund’s website at http://investments.oneascent.com.
| * | Return figures reflect any change in price per share and assume the reinvestment of all distributions. |
| (a) | The Bloomberg U.S. Aggregate Bond Index is a broad based, market capitalization-weighted bond market index representing intermediate term investment grade bonds traded in the United |
7
Investment Results (Unaudited) (continued)
States and is representative of a broader market and range of securities than are found in the Fund’s portfolio. Index returns do not reflect the deduction of expenses, which have been deducted from the Fund’s returns. Index returns assume reinvestment of all distributions and do not reflect the deduction of taxes and fees. Individuals cannot invest directly in an index.
The Fund’s investment objectives, strategies, risks, charges and expenses must be considered carefully before investing. The prospectus contains this and other important information about the Fund and may be obtained by calling (800) 222-8274. Please read it carefully before investing.
The Fund is distributed by Northern Lights Distributors, LLC, Member FINRA/SIPC.
8
Investment Results (Unaudited) (continued)
Comparison of the Growth of a $10,000 Investment in the OneAscent Core Plus Bond ETF (NAV) and the Bloomberg U.S. Aggregate Bond Index (Unaudited)
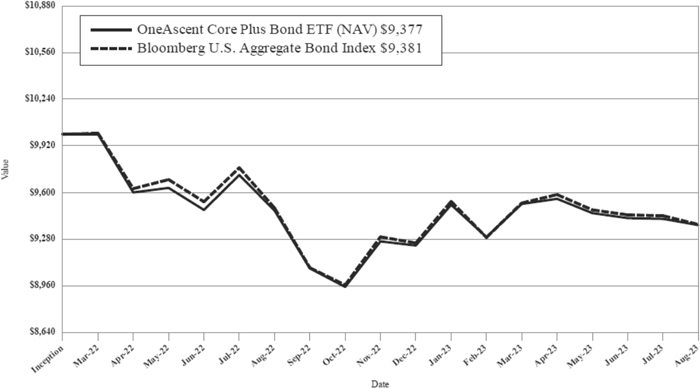
The chart above assumes an initial investment of $10,000 made on March 30, 2022 (commencement of operations) and held through August 31, 2023. THE ONEASCENT CORE PLUS BOND ETF’S RETURNS REPRESENT PAST PERFORMANCE AND DO NOT GUARANTEE FUTURE RESULTS. The Bloomberg U.S. Aggregate Bond Index is a broad based, market capitalization-weighted bond market index representing intermediate term investment grade bonds traded in the United States and is representative of a broader market and range of securities than are found in the OneAscent Core Plus Bond ETF’s portfolio. The returns shown do not reflect deduction of taxes that a shareholder would pay on the OneAsecnt Core Plus Bond ETF distributions or the redemption of shares. Investment returns and principal values will fluctuate so that your shares, when redeemed, may be worth more or less than their original purchase price.
Current performance may be lower or higher than the performance data quoted. For more information on the OneAscent Core Plus Bond ETF, and to obtain performance data current to the most recent month-end, or to request a prospectus, please call (800) 222-8274. The OneAscent Core Plus Bond ETF’s prospectus contains important information about the OneAscent Core Plus Bond ETF’s investment objectives, potential risks, management fees, charges and expenses, and other information. Please read the prospectus or summary prospectus carefully before investing.
The Fund is distributed by Northern Lights Distributors, LLC, Member FINRA/SIPC.
9
Investment Results (Unaudited) (continued)
Total Returns* as of August 31, 2023
| Since | |
| Inception | |
| (9/14/2022) | |
| OneAscent International Equity ETF - NAV | 21.89% |
| OneAscent International Equity ETF - Market Price | 22.48% |
| MSCI ACWI ex USA Index(a) | 13.57% |
Total annual operating expenses based on estimated amounts for the current fiscal year, as disclosed in the OneAscent International Equity ETF’s (the “Fund”) prospectus dated August 16, 2022 were 1.29% of average daily net assets (0.95% after fee waivers/expense reimbursements by the Adviser). The Adviser has contractually agreed to waive its management fee and/or reimburse expenses so that total annual Fund operating expenses, excluding portfolio transaction and other investment-related costs (including brokerage fees and commissions); taxes; borrowing costs (such as interest and dividend expenses on securities sold short); acquired fund fees and expenses; fees and expenses associated with investments in other collective investment vehicles or derivative instruments (including for example option and swap fees and expenses); any administrative and/or shareholder servicing fees payable pursuant to a plan adopted by the Board of Trustees; expenses incurred in connection with any merger or reorganization; extraordinary expenses (such as litigation expenses, indemnification of Trust officers and Trustees and contractual indemnification of Fund service providers); and other expenses that the Trustees agree have not been incurred in the ordinary course of the Fund’s business, do not exceed 0.95% through December 31, 2023. This expense cap may not be terminated prior to this date except by the Board of Trustees upon sixty (60) days’ written notice to the Adviser and may not be terminated by the Adviser without the Board of Trustees’ consent. Each waiver/expense payment by the Adviser is subject to recoupment by the Adviser from the Fund in the three years following the date the particular waiver/expense payment occurred, but only if such recoupment can be achieved without exceeding the annual expense limitation in effect at the time of the waiver/expense payment and any expense limitation in effect at the time of the recoupment. Additional information pertaining to the Fund’s expense ratio as of August 31, 2023 can be found in the financial highlights.
The performance quoted represents past performance, which does not guarantee future results. The investment return and principal value of an investment will fluctuate so that an investor’s shares, when redeemed, may be worth more or less than their original cost. The returns shown do not reflect deduction of taxes that a shareholder would pay on Fund distributions or the redemption of Fund shares. Current performance of the Fund may be lower or higher than the performance quoted. Performance data current to the most recent month end may be obtained by calling (800) 222-8274. The Fund’s per share net asset value (“NAV”) is the value of one share of the Fund as calculated in accordance with the standard formula for valuing shares. The NAV return is based on the NAV of the Fund and the market return is based on the market price per share of the Fund. The price used to calculate market return (“Market Price”) is determined by using the midpoint between the highest bid and the lowest offer on the primary stock exchange on which the shares of the Fund are listed for trading, as of the time that the Fund’s NAV is calculated. Market Price and NAV returns assume that dividends and capital gain distributions have been reinvested in the Fund at Market Price and NAV, respectively. Since exchange-traded funds are bought and sold at prices set by the market, which can result in a premium or discount to NAV, the returns calculated using Market Price can differ from those calculated using NAV. For more information about current performance, holdings or historical premiums/discounts, please visit the Fund’s website at http://investments.oneascent.com.
| * | Return figures reflect any change in price per share and assume the reinvestment of all distributions. |
10
Investment Results (Unaudited) (continued)
The Fund’s returns reflect any fee reductions during the applicable period. If such fee reductions had not occurred, the quoted performance would have been lower. Total returns for less than one year are not annualized.
| (a) | The MSCI ACWI ex USA Index captures large and mid cap representation across 22 of 23 Developed Markets countries (excluding the U.S.) and 24 Emerging Markets countries. The index covers approximately 85% of the global equity opportunity set outside the U.S. Index returns do not reflect the deduction of expenses, which have been deducted from the Fund’s returns. Index returns assume reinvestment of all distributions and do not reflect the deduction of taxes and fees. Individuals cannot invest directly in an index. |
The Fund’s investment objective, strategies, risks, charges and expenses must be considered carefully before investing. The prospectus contains this and other important information about the Fund and may be obtained by calling (800) 222-8274. Please read it carefully before investing.
The Fund is distributed by Northern Lights Distributors, LLC, Member FINRA/SIPC.
11
Investment Results (Unaudited) (continued)
Comparison of the Growth of a $10,000 Investment in the OneAscent International Equity ETF (NAV) and the MSCI ACWI ex USA Index (Unaudited)
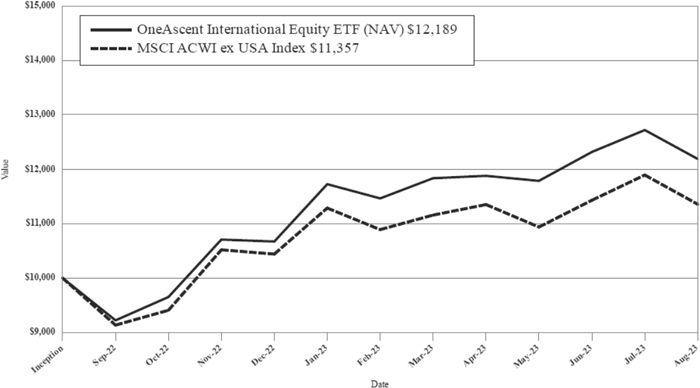
The chart above assumes an initial investment of $10,000 made on September 14, 2022 (commencement of operations) and held through August 31, 2023. THE ONEASCENT INTERNATIONAL EQUITY ETF’S RETURNS REPRESENT PAST PERFORMANCE AND DO NOT GUARANTEE FUTURE RESULTS. The MSCI ACWI ex USA Index captures large and mid cap representation across 22 of 23 Developed Markets countries (excluding the U.S.) and 24 Emerging Markets countries. The index covers approximately 85% of the global equity opportunity set outside the U.S. The MSCI ACWI ex USA Index is a widely recognized unmanaged index of equity prices and are representative of a broader market and range of securities than are found in the OneAscent International Equity ETF’s portfolio. The returns shown do not reflect deduction of taxes that a shareholder would pay on the OneAsecnt International Equity ETF distributions or the redemption of shares. Investment returns and principal values will fluctuate so that your shares, when redeemed, may be worth more or less than their original purchase price.
Current performance may be lower or higher than the performance data quoted. For more information on the OneAscent International Equity ETF, and to obtain performance data current to the most recent month-end, or to request a prospectus, please call (800) 222-8274. The OneAscent International Equity ETF’s prospectus contains important information about the OneAscent International Equity ETF’s investment objectives, potential risks, management fees, charges and expenses, and other information. Please read the prospectus or summary prospectus carefully before investing.
The Fund is distributed by Northern Lights Distributors, LLC, Member FINRA/SIPC.
12
Investment Results (Unaudited) (continued)
Total Returns* as of August 31, 2023
| Since | |
| Inception | |
| (9/14/2022) | |
| OneAscent Emerging Markets ETF - NAV | 11.77% |
| OneAscent Emerging Markets ETF - Market Price | 11.45% |
| MSCI Emerging Markets Index(a) | 4.48% |
Total annual operating expenses based on estimated amounts for the current fiscal year, as disclosed in the OneAscent Emerging Markets ETF’s (the “Fund”) prospectus dated August 16, 2022 were 2.12% of average daily net assets (1.25% after fee waivers/expense reimbursements by the Adviser). The Adviser has contractually agreed to waive its management fee and/or reimburse expenses so that total annual Fund operating expenses, excluding portfolio transaction and other investment-related costs (including brokerage fees and commissions); taxes; borrowing costs (such as interest and dividend expenses on securities sold short); acquired fund fees and expenses; fees and expenses associated with investments in other collective investment vehicles or derivative instruments (including for example option and swap fees and expenses); any administrative and/or shareholder servicing fees payable pursuant to a plan adopted by the Board of Trustees; expenses incurred in connection with any merger or reorganization; extraordinary expenses (such as litigation expenses, indemnification of Trust officers and Trustees and contractual indemnification of Fund service providers); and other expenses that the Trustees agree have not been incurred in the ordinary course of the Fund’s business, do not exceed 1.25% through December 31, 2023. This expense cap may not be terminated prior to this date except by the Board of Trustees upon sixty (60) days’ written notice to the Adviser and may not be terminated by the Adviser without the Board of Trustees’ consent. Each waiver/expense payment by the Adviser is subject to recoupment by the Adviser from the Fund in the three years following the date the particular waiver/expense payment occurred, but only if such recoupment can be achieved without exceeding the annual expense limitation in effect at the time of the waiver/expense payment and any expense limitation in effect at the time of the recoupment. Additional information pertaining to the Fund’s expense ratio as of August 31, 2023 can be found in the financial highlights.
The performance quoted represents past performance, which does not guarantee future results. The investment return and principal value of an investment will fluctuate so that an investor’s shares, when redeemed, may be worth more or less than their original cost. The returns shown do not reflect deduction of taxes that a shareholder would pay on Fund distributions or the redemption of Fund shares. Current performance of the Fund may be lower or higher than the performance quoted. Performance data current to the most recent month end may be obtained by calling (800) 222-8274. The Fund’s per share net asset value (“NAV”) is the value of one share of the Fund as calculated in accordance with the standard formula for valuing shares. The NAV return is based on the NAV of the Fund and the market return is based on the market price per share of the Fund. The price used to calculate market return (“Market Price”) is determined by using the midpoint between the highest bid and the lowest offer on the primary stock exchange on which the shares of the Fund are listed for trading, as of the time that the Fund’s NAV is calculated. Market Price and NAV returns assume that dividends and capital gain distributions have been reinvested in the Fund at Market Price and NAV, respectively. Since exchange-traded funds are bought and sold at prices set by the market, which can result in a premium or discount to NAV, the returns calculated using Market Price can differ from those calculated using NAV. For more information about current performance, holdings or historical premiums/discounts, please visit the Fund’s website at http://investments.oneascent.com.
| * | Return figures reflect any change in price per share and assume the reinvestment of all distributions. |
13
Investment Results (Unaudited) (continued)
The Funds’ returns reflect any fee reductions during the applicable period. If such fee reductions had not occurred, the quoted performance would have been lower. Total returns for less than one year are not annualized.
| (a) | The MSCI Emerging Markets Index captures large and mid-cap representation across 24 Emerging Markets countries. The Index covers approximately 85% of the free float-adjusted market capitalization in each country. Index returns do not reflect the deduction of expenses, which have been deducted from the Fund’s returns. Index returns assume reinvestment of all distributions and do not reflect the deduction of taxes and fees. Individuals cannot invest directly in an index. |
The Fund’s investment objective, strategies, risks, charges and expenses must be considered carefully before investing. The prospectus contains this and other important information about the Fund and may be obtained by calling (800) 222-8274. Please read it carefully before investing.
The Fund is distributed by Northern Lights Distributors, LLC, Member FINRA/SIPC.
14
Investment Results (Unaudited) (continued)
Comparison of the Growth of a $10,000 Investment in the OneAscent Emerging Markets ETF (NAV) and the MSCI Emerging Markets Index (Unaudited)
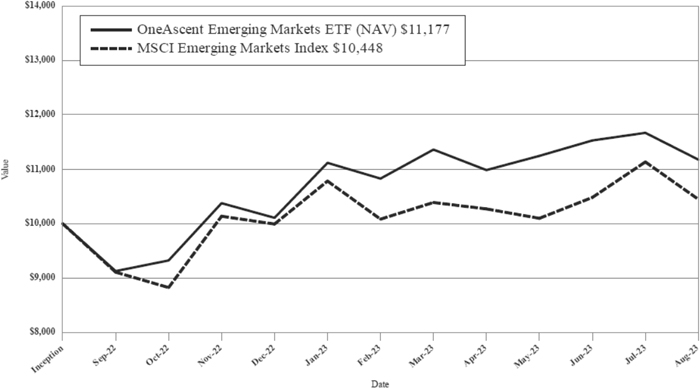
The chart above assumes an initial investment of $10,000 made on September 14, 2022 (commencement of operations) and held through August 31, 2023. THE ONEASCENT EMERGING MARKETS ETF’S RETURNS REPRESENT PAST PERFORMANCE AND DO NOT GUARANTEE FUTURE RESULTS. The MSCI Emerging Markets Index is a widely recognized unmanaged index of equity prices and is representative of a broader market and range of securities than are found in the OneAscent Emerging Markets ETF’s portfolio. The returns shown do not reflect deduction of taxes that a shareholder would pay on the OneAsecnt Emerging Markets ETF distributions or the redemption of shares. Investment returns and principal values will fluctuate so that your shares, when redeemed, may be worth more or less than their original purchase price.
Current performance may be lower or higher than the performance data quoted. For more information on the OneAscent Emerging Markets ETF, and to obtain performance data current to the most recent month-end, or to request a prospectus, please call (800) 222-8274. The OneAscent Emerging Markets ETF’s prospectus contains important information about the OneAscent Emerging Markets ETF’s investment objectives, potential risks, management fees, charges and expenses, and other information. Please read the prospectus or summary prospectus carefully before investing.
The Fund is distributed by Northern Lights Distributors, LLC, Member FINRA/SIPC.
15
Fund Holdings (Unaudited)
OneAscent Large Cap Core ETF Holdings as of August 31, 2023.*
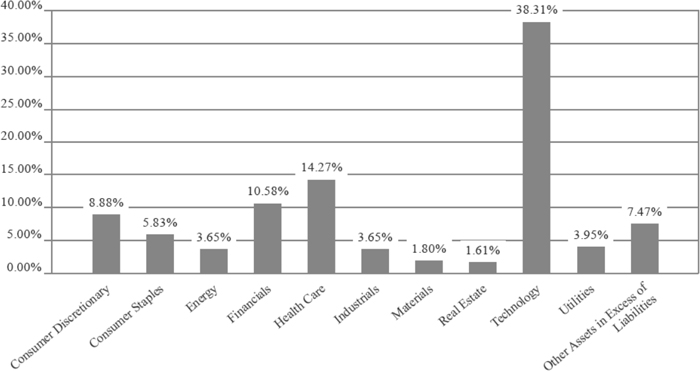
| * | As a percentage of net assets. |
The investment objective of the OneAscent Large Cap Core ETF is to seek capital appreciation.
Portfolio holdings are subject to change.
OneAscent Core Plus Bond ETF Holdings as of August 31, 2023.*
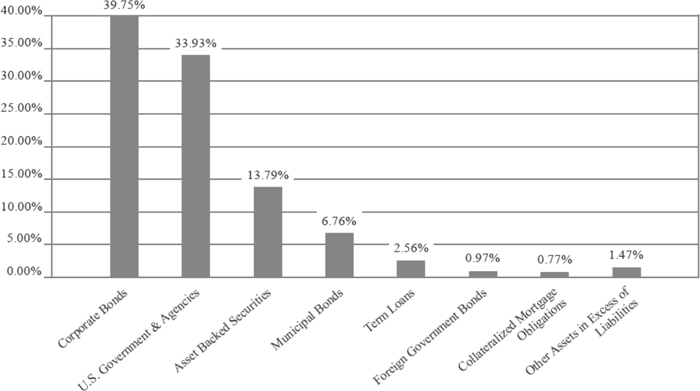
| * | As a percentage of net assets. |
16
Fund Holdings (Unaudited)
The investment objective of the OneAscent Core Plus Bond ETF is to seek total return, with an emphasis on income as the source of that total return, while giving special consideration to certain values-based and impact criteria.
Portfolio holdings are subject to change.
OneAscent International Equity ETF Holdings as of August 31, 2023.*
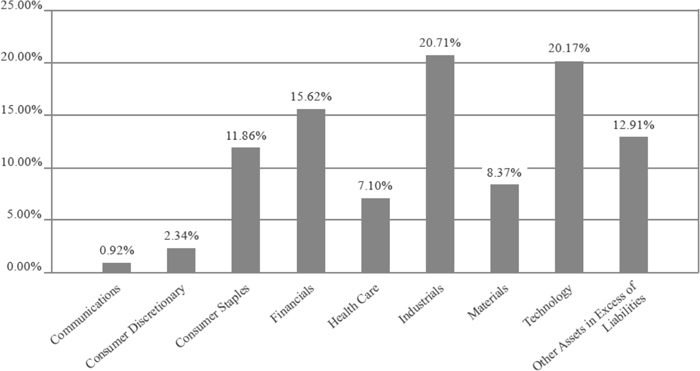
| * | As a percentage of net assets. |
The investment objective of the OneAscent International Equity ETF is to seek long-term capital appreciation.
Portfolio holdings are subject to change.
17
Fund Holdings (Unaudited)
OneAscent Emerging Markets ETF Holdings as of August 31, 2023.*
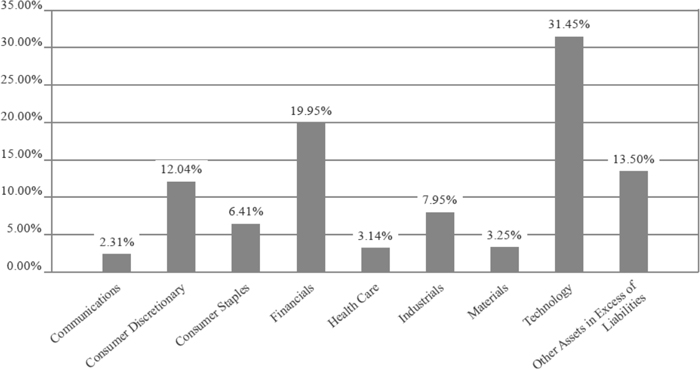
| * | As a percentage of net assets. |
The investment objective of the OneAscent Emerging Markets ETF is to seek long-term capital appreciation.
Portfolio holdings are subject to change.
Availability of Portfolio Schedule (Unaudited)
The Funds file a complete schedule of portfolio holdings with the Securities and Exchange Commission (the “SEC”) for the first and third quarters of each fiscal year as an exhibit to its reports on Form N-PORT. Each Fund’s Form N-PORT reports are available on the SEC’s website at http:// www.sec.gov or on the Funds’ website at http://investments.oneascent.com.
18
| OneAscent Large Cap Core ETF |
| Schedule of Investments |
| August 31, 2023 |
| COMMON STOCKS — 92.53% | Shares | Fair Value | ||||||
| Consumer Discretionary — 8.88% | ||||||||
| Booking Holdings, Inc.(a) | 234 | $ | 726,577 | |||||
| General Motors Co. | 17,317 | 580,293 | ||||||
| Lennar Corp., Class B | 5,393 | 575,217 | ||||||
| NVR, Inc.(a) | 107 | 682,374 | ||||||
| Ralph Lauren Corp. | 4,397 | 512,822 | ||||||
| Ulta Beauty, Inc.(a) | 588 | 244,038 | ||||||
| 3,321,321 | ||||||||
| Consumer Staples — 5.83% | ||||||||
| Bunge Ltd. | 11,810 | 1,350,119 | ||||||
| Seaboard Corp. | 220 | 829,473 | ||||||
| 2,179,592 | ||||||||
| Energy — 3.65% | ||||||||
| Chevron Corp. | 4,496 | 724,306 | ||||||
| Phillips 66 | 3,951 | 451,046 | ||||||
| Valero Energy Corp. | 1,458 | 189,394 | ||||||
| 1,364,746 | ||||||||
| Financials — 10.58% | ||||||||
| Ameriprise Financial, Inc. | 2,346 | 791,963 | ||||||
| Arch Capital Group Ltd.(a) | 3,034 | 233,193 | ||||||
| Chubb Ltd. | 6,149 | 1,235,150 | ||||||
| Interactive Brokers Group, Inc., Class A | 4,560 | 415,325 | ||||||
| W.R. Berkley Corp. | 20,659 | 1,277,965 | ||||||
| 3,953,596 | ||||||||
| Health Care — 14.27% | ||||||||
| Abbott Laboratories | 13,115 | 1,349,534 | ||||||
| Hologic, Inc.(a) | 17,385 | 1,299,354 | ||||||
| Incyte Corp.(a) | 8,981 | 579,545 | ||||||
| Molina Healthcare, Inc.(a) | 4,742 | 1,470,589 | ||||||
| QuidelOrtho Corp.(a) | 1,971 | 162,332 | ||||||
| Royalty Pharma PLC, Class A | 9,365 | 279,264 | ||||||
| Vertex Pharmaceuticals, Inc.(a) | 560 | 195,070 | ||||||
| 5,335,688 | ||||||||
| Industrials — 3.65% | ||||||||
| AGCO Corp. | 1,978 | 256,210 | ||||||
| Keysight Technologies, Inc.(a) | 4,400 | 586,520 | ||||||
| PACCAR, Inc. | 6,354 | 522,871 | ||||||
| 1,365,601 | ||||||||
| Materials — 1.80% | ||||||||
| Albemarle Corp. | 1,583 | 314,558 | ||||||
| Mosaic Co. (The) | 3,795 | 147,436 | ||||||
| Nucor Corp. | 1,233 | 212,199 | ||||||
| 674,193 | ||||||||
| Real Estate — 1.61% | ||||||||
| Crown Castle International Corp. | 5,988 | 601,794 | ||||||
| Technology — 38.31% | ||||||||
| Adobe, Inc.(a) | 2,612 | 1,460,996 | ||||||
See accompanying notes which are an integral part of these financial statements.
19
| OneAscent Large Cap Core ETF |
| Schedule of Investments (continued) |
| August 31, 2023 |
| COMMON STOCKS — 92.53% - continued | Shares | Fair Value | ||||||
| Technology — 38.31% - continued | ||||||||
| Akamai Technologies, Inc.(a) | 2,749 | $ | 288,892 | |||||
| Applied Materials, Inc. | 5,162 | 788,546 | ||||||
| Avnet, Inc. | 13,966 | 708,775 | ||||||
| Broadcom, Inc. | 774 | 714,317 | ||||||
| Cisco Systems, Inc. | 25,779 | 1,478,425 | ||||||
| Gartner, Inc.(a) | 3,597 | 1,257,799 | ||||||
| Jabil, Inc. | 2,023 | 231,472 | ||||||
| Lam Research Corp. | 697 | 489,573 | ||||||
| Microchip Technology, Inc. | 5,853 | 479,010 | ||||||
| Oracle Corp. | 9,704 | 1,168,265 | ||||||
| Palo Alto Networks, Inc.(a) | 3,758 | 914,321 | ||||||
| PTC, Inc.(a) | 1,671 | 245,921 | ||||||
| Pure Storage, Inc., Class A(a) | 9,692 | 354,630 | ||||||
| Qorvo, Inc.(a) | 6,890 | 739,917 | ||||||
| Qualys, Inc.(a) | 5,107 | 794,905 | ||||||
| Salesforce, Inc.(a) | 2,319 | 513,566 | ||||||
| ServiceNow, Inc.(a) | 1,275 | 750,758 | ||||||
| SPS Commerce, Inc.(a) | 2,061 | 383,614 | ||||||
| Workday, Inc., Class A(a) | 2,276 | 556,482 | ||||||
| 14,320,184 | ||||||||
| Utilities — 3.95% | ||||||||
| Clearway Energy, Inc., Class C | 17,446 | 432,137 | ||||||
| FirstEnergy Corp. | 7,025 | 253,392 | ||||||
| Sempra | 11,244 | 789,554 | ||||||
| 1,475,083 | ||||||||
| Total Common Stocks/Investments — 92.53% (Cost $32,063,773) | 34,591,798 | |||||||
| Other Assets in Excess of Liabilities — 7.47% | 2,791,326 | |||||||
| NET ASSETS — 100.00% | $ | 37,383,124 | ||||||
| (a) | Non-income producing security. |
See accompanying notes which are an integral part of these financial statements.
20
| OneAscent Core Plus Bond ETF |
| Schedule of Investments |
| August 31, 2023 |
| Principal | ||||||||
| ASSET BACKED SECURITIES — 13.79% | Amount | Fair Value | ||||||
| Century Plaza Towers, Series 2019-CPT, Class B, 3.10%, 11/13/2039(a)(b) | $ | 740,000 | $ | 563,752 | ||||
| COMM Mortgage Trust, Series 2022-HC, Class B, 3.17%, 1/10/2039(a) | 1,000,000 | 815,995 | ||||||
| DBUBS Mortgage Trust, Series 2017-BRBK, Class A, 3.45%, 10/10/2034(a) | 1,000,000 | 913,281 | ||||||
| Frontier Issuer, LLC, Series 1, Class C, 11.50%, 8/20/2053(a) | 1,000,000 | 979,760 | ||||||
| GoodLeap Sustainable Home Solutions Trust, Series 2022-3CS, Class B, 5.50%, 7/20/2049(a) | 1,250,000 | 1,058,572 | ||||||
| GoodLeap Sustainable Home Solutions Trust, Series 2022-3CS, Class B, 5.52%, 2/22/2055(a) | 1,052,487 | 1,000,695 | ||||||
| Helios Issuer, LLC, Series 2023-B, Class C, 6.00%, 8/22/2050(a) | 900,000 | 788,932 | ||||||
| Hertz Vehicle Financing, LLC, Series 2023-2A, Class C, 7.13%, 9/25/2029(a) | 900,000 | 887,937 | ||||||
| J.P. Morgan Chase Commercial Mortgage Securities Trust, Series 2020- | ||||||||
| 609M, Class A, 6.80%, 10/15/2033 (US0001M + 1.370bps)(a)(b) | 1,000,000 | 929,415 | ||||||
| Mosaic Solar Loan Trust, Series 2022-3A, Class A, 6.16%, 6/20/2053(a) | 864,624 | 861,291 | ||||||
| Mosaic Solar Loan Trust, Series 2023-2A, Class C, 8.18%, 9/22/2053(a) | 500,000 | 450,290 | ||||||
| Natixis Commercial Mortgage Securities Trust, Series 2019-MILE, Class A, 6.89%, 7/15/2036 (US0001M + 1.500bps)(a)(b) | 848,857 | 783,611 | ||||||
| One Bryant Park Trust, Series 2019-OBP, Class A, 2.52%, 9/15/2054(a) | 500,000 | 407,243 | ||||||
| One Market Plaza Trust, Series 2017-1MKT, Class A, 3.61%, 2/10/2024(a) | 1,000,000 | 928,887 | ||||||
| One Market Plaza Trust, Series 2017-1MKT, Class C, 4.02%, 2/10/2032(a) | 500,000 | 434,074 | ||||||
| STWD Mortgage Trust, Series 2021-LIH, Class B, 7.01%, 11/15/2036 (US0001M + 1.656bps)(a)(b) | 1,000,000 | 968,444 | ||||||
| Sunrun Jupiter Issuer, LLC, Series 2022-1A, Class A, 4.75%, 7/30/2057(a) | 934,186 | 804,771 | ||||||
| Tesla Auto Lease Trust, Series 2023-A, Class A2, 5.86%, 8/20/2025(a) | 500,000 | 499,831 | ||||||
| Tesla Auto Lease Trust, Series 2023-A, Class A3, 5.89%, 6/22/2026(a) | 500,000 | 498,995 | ||||||
| Vivint Solar Financing V, LLC, Series 2018-1A, Class B, 7.37%, 4/30/2048(a) | 577,791 | 524,756 | ||||||
| Total Asset Backed Securities (Cost $16,060,867) | 15,100,532 | |||||||
| COLLATERALIZED MORTGAGE OBLIGATIONS — 0.77% | ||||||||
| Freddie Mac Multiclass Certificates, Series 2022-P013, Class A2, 2.85%, 2/25/2032(b) | 1,000,000 | 842,379 | ||||||
| Total Collateralized Mortgage Obligations (Cost $946,941) | 842,379 | |||||||
| CORPORATE BONDS — 39.75% | ||||||||
| Consumer Discretionary — 2.79% | ||||||||
| Conservation Fund, Series 2019, 3.47%, 12/15/2029 | 1,000,000 | 859,699 | ||||||
| Magna International, Inc., 2.45%, 6/15/2030 | 1,000,000 | 842,482 | ||||||
| NHP Foundation (The), 6.00%, 12/1/2033 | 500,000 | 531,281 | ||||||
| Walmart, Inc., 1.80%, 9/22/2031 | 1,000,000 | 819,567 | ||||||
| 3,053,029 | ||||||||
| Consumer Staples — 1.56% | ||||||||
| PepsiCo, Inc., 3.90%, 7/18/2032 | 1,100,000 | 1,044,400 | ||||||
| Unilever Capital Corp., 2.63%, 8/12/2051 | 1,000,000 | 658,582 | ||||||
| 1,702,982 | ||||||||
See accompanying notes which are an integral part of these financial statements.
21
| OneAscent Core Plus Bond ETF |
| Schedule of Investments (continued) |
| August 31, 2023 |
| Principal | ||||||||
| CORPORATE BONDS — 39.75% - continued | Amount | Fair Value | ||||||
| Energy — 2.68% | ||||||||
| BP Capital Markets America, Inc., 4.81%, 2/13/2033 | $ | 1,000,000 | $ | 968,821 | ||||
| BP Capital Markets America, Inc., 2.77%, 11/10/2050 | 1,000,000 | 631,484 | ||||||
| ConocoPhillips Co., 5.05%, 9/15/2033 | 500,000 | 497,701 | ||||||
| Equinor ASA, 3.95%, 5/15/2043 | 1,000,000 | 839,049 | ||||||
| 2,937,055 | ||||||||
| Financials — 9.00% | ||||||||
| BB Blue Financing DAC, Series A2, 4.40%, 9/20/2029 | 1,000,000 | 983,676 | ||||||
| BB Blue Financing DAC, Series A1, 4.40%, 9/20/2037 | 1,000,000 | 974,166 | ||||||
| BNP Paribas S.A., 8.50%, Perpetual (H15T5Y + 4.354bps)(a)(b) | 1,000,000 | 999,000 | ||||||
| GPS Blue Financing DAC, 5.65%, 11/9/2041(a) | 1,000,000 | 1,040,955 | ||||||
| ING Groep N.V., 1.40%, 7/1/2026 (H15T1Y + 1.100bps)(a)(b) | 1,000,000 | 920,008 | ||||||
| Intesa Sanpaolo SpA, 6.63%, 6/20/2033(a) | 500,000 | 494,899 | ||||||
| Muenchener Rueckversicherungs-Gesellschaft A.G., 5.88%, 5/23/2042 (H15T5Y + 3.982bps)(a)(b) | 1,000,000 | 987,141 | ||||||
| National Bank of Canada, MTN, 0.55%, 11/15/2024 (H15T1Y + 0.400bps)(b) | 1,000,000 | 989,036 | ||||||
| OMERS Finance Trust, 4.00%, 4/19/2052(a) | 1,000,000 | 783,279 | ||||||
| Province of British Columbia Canada, 4.20%, 7/6/2033 | 850,000 | 829,988 | ||||||
| Province of Quebec Canada, 1.90%, 4/21/2031 | 1,000,000 | 835,420 | ||||||
| 9,837,568 | ||||||||
| Health Care — 1.59% | ||||||||
| Amgen, Inc., 5.25%, 3/2/2033 | 925,000 | 920,854 | ||||||
| Takeda Pharmaceutical Co., Ltd., 2.05%, 3/31/2030 | 1,000,000 | 823,498 | ||||||
| 1,744,352 | ||||||||
| Industrials — 3.42% | ||||||||
| Delta Air Lines Pass Through Trust, Series 2020-1, Class A, 2.50%, 6/10/2028 | 1,435,979 | 1,260,333 | ||||||
| Otis Worldwide Corp., 3.11%, 2/15/2040 | 1,000,000 | 753,281 | ||||||
| Tote Shipholdings, LLC, 3.40%, 10/16/2040 | 994,000 | 906,228 | ||||||
| Vessel Management Services, Inc., 3.48%, 1/16/2037 | 897,000 | 823,344 | ||||||
| 3,743,186 | ||||||||
| Materials — 1.76% | ||||||||
| Cemex S.A.B. de C.V., 9.13%, Perpetual (H15T5Y + 490.700bps)(a)(b) | 625,000 | 651,571 | ||||||
| FMG Resources (August 2006) Pty Ltd., 6.13%, 4/15/2032(a) | 500,000 | 465,711 | ||||||
| Newmont Corp., 2.25%, 10/1/2030 | 1,000,000 | 813,494 | ||||||
| 1,930,776 | ||||||||
| Multi-Nationals — 6.47% | ||||||||
| Central American Bank for Economic Integration, 5.00%, 2/9/2026(a) | 250,000 | 247,426 | ||||||
| European Investment Bank, 0.75%, 9/23/2030 | 1,000,000 | 789,713 | ||||||
| Inter-American Development Bank, GMTN, 3.50%, 4/12/2033 | 1,000,000 | 940,877 | ||||||
| Inter-American Investment Corp., 2.63%, 4/22/2025 | 1,000,000 | 959,098 | ||||||
| International Bank for Reconstruction & Development, EMTN, Zero Coupon, 3/31/2028 | 500,000 | 487,441 | ||||||
| International Finance Facility for Immunisation Co., MTN, 1.00%, 4/21/2026 | 1,000,000 | 904,839 | ||||||
| Kreditanstalt fuer Wiederaufbau, 1.00%, 10/1/2026 | 1,000,000 | 899,089 | ||||||
| OPEC Fund for International Development (The), 4.50%, 1/26/2026(a) | 1,000,000 | 982,368 | ||||||
See accompanying notes which are an integral part of these financial statements.
22
| OneAscent Core Plus Bond ETF |
| Schedule of Investments (continued) |
| August 31, 2023 |
| Principal | ||||||||
| CORPORATE BONDS — 39.75% - continued | Amount | Fair Value | ||||||
| United States International Development Finance, 3.43%, 6/1/2033 | $ | 941,662 | $ | 867,309 | ||||
| 7,078,160 | ||||||||
| Real Estate — 1.68% | ||||||||
| HAT Holdings I, LLC/HAT Holdings II, LLC, 3.38%, 6/15/2026(a) | 1,000,000 | 898,713 | ||||||
| Preservation of Affordable Housing, Inc., 4.48%, 12/1/2032 | 1,000,000 | 943,200 | ||||||
| 1,841,913 | ||||||||
| Technology — 1.72% | ||||||||
| Apple, Inc., 3.00%, 6/20/2027 | 1,000,000 | 944,312 | ||||||
| Intel Corp., 4.15%, 8/5/2032 | 1,000,000 | 942,169 | ||||||
| 1,886,481 | ||||||||
| Utilities — 7.08% | ||||||||
| AES Corp. (The), 5.45%, 6/1/2028 | 1,000,000 | 981,839 | ||||||
| Ameren Illinois Co., 2.90%, 6/15/2051 | 1,000,000 | 645,542 | ||||||
| Duke Energy Carolinas, LLC, 3.55%, 3/15/2052 | 1,000,000 | 728,554 | ||||||
| Duke Energy Progress, LLC, 3.45%, 3/15/2029 | 850,000 | 780,946 | ||||||
| National Rural Utilities Cooperative Finance Corp., 5.25%, 4/20/2046 (US0003M + 3.630bps)(b) | 1,000,000 | 943,750 | ||||||
| New York State Electric & Gas Corp., 2.15%, 10/1/2031(a) | 1,000,000 | 770,176 | ||||||
| Public Service Electric and Gas Co., MTN, 5.13%, 3/15/2053 | 400,000 | 390,960 | ||||||
| San Diego Gas & Electric Co., 2.95%, 8/15/2051 | 1,000,000 | 654,672 | ||||||
| Topaz Solar Farms, LLC, 5.75%, 9/30/2039(a) | 982,740 | 930,159 | ||||||
| Vistra Corp., 7.00%, Perpetual (H15T5Y + 5.740bps)(a)(b) | 1,000,000 | 926,744 | ||||||
| 7,753,342 | ||||||||
| Total Corporate Bonds (Cost $46,653,371) | 43,508,844 | |||||||
| FOREIGN GOVERNMENT BONDS — 0.97% | ||||||||
| Canada Government International Bond, 2.88%, 4/28/2025 | 1,100,000 | 1,062,409 | ||||||
| Total Foreign Government Bonds (Cost $1,099,963) | 1,062,409 | |||||||
| MUNICIPAL BONDS — 6.76% | ||||||||
| District of Columbia — 1.55% | ||||||||
| District of Columbia, Revenue, 3.85%, 2/28/2025 | 1,750,000 | 1,697,953 | ||||||
| Florida — 0.93% | ||||||||
| Florida Development Finance Corp., Revenue, Series A, 7.25%, 7/1/2057 | 1,000,000 | 1,020,517 | ||||||
| Indiana — 0.00% | ||||||||
| Fort Wayne, Solid Waste Facility, Revenue, Series 2022A-2, 10.75%, 12/1/2029(c) | 234,358 | 23 | ||||||
| Montana — 0.95% | ||||||||
| Gallatin County Industrial Development, Revenue, Series B, 11.50%, 9/1/2027 | 1,000,000 | 1,046,371 | ||||||
| New Hampshire — 0.78% | ||||||||
| New Hampshire Business Finance Authority, Revenue,, 5.49%, 7/1/2033(a) (b) | 850,000 | 850,000 | ||||||
| New York — 1.75% | ||||||||
| Metropolitan Transportation Authority, Revenue, 5.18%, 11/15/2049 | 1,000,000 | 926,386 | ||||||
See accompanying notes which are an integral part of these financial statements.
23
| OneAscent Core Plus Bond ETF |
| Schedule of Investments (continued) |
| August 31, 2023 |
| Principal | ||||||||
| MUNICIPAL BONDS — 6.76% - continued | Amount | Fair Value | ||||||
| New York — 1.75%- continued | ||||||||
| New York State Energy Research & Development Authority, Revenue, Series A, 4.87%, 4/1/2037 | $ | 1,130,000 | $ | 985,018 | ||||
| 1,911,404 | ||||||||
| Pennsylvania — 0.38% | ||||||||
| Redevelopment Authority of the City of Philadelphia, Revenue, Series A, 4.94%, 9/1/2031 | 425,000 | 416,729 | ||||||
| Wisconsin — 0.42% | ||||||||
| Fond du Lac County Social Bonds, Revenue, Series A, 5.57%, 11/1/2051 | 500,000 | 462,217 | ||||||
| Total Municipal Bonds (Cost $7,930,866) | 7,405,214 | |||||||
| TERM LOANS — 2.56% | ||||||||
| Utilities — 1.71% | ||||||||
| ExGen Renewables IV, LLC, 7.24%, 12/15/2027 (US0001M + 250.000bps)(b) | 889,974 | 886,414 | ||||||
| TerraForm Power Operating, LLC, 7.91%, 5/30/2029 (TSFR1M + 275.000bps)(b) | 990,000 | 982,887 | ||||||
| 1,869,301 | ||||||||
| Industrials — 0.85% | ||||||||
| LTR Intermediate Holdings, Inc., 9.60%, 5/7/2028 (US0001M + 450.000bps)(b) | 989,924 | 933,004 | ||||||
| Total Term Loans (Cost $2,839,836) | 2,802,305 | |||||||
| U.S. GOVERNMENT & AGENCIES — 33.93% | ||||||||
| Fannie Mae Pool, 4.00%, 5/1/2044 | 827,985 | 781,990 | ||||||
| Fannie Mae Pool, 2.00%, 6/1/2051 | 934,510 | 749,229 | ||||||
| Fannie Mae Pool, 2.50%, 2/1/2052 | 197,953 | 165,576 | ||||||
| Fannie Mae Pool, 2.50%, 2/1/2052 | 2,210,515 | 1,851,721 | ||||||
| Fannie Mae Pool, 3.00%, 4/1/2052 | 2,712,426 | 2,358,634 | ||||||
| Fannie Mae Pool, 3.50%, 4/1/2052 | 2,720,373 | 2,434,686 | ||||||
| Fannie Mae Pool, 5.00%, 5/1/2052 | 178,793 | 173,527 | ||||||
| Fannie Mae Pool, 5.00%, 7/1/2052 | 436,362 | 423,556 | ||||||
| Fannie Mae Pool, 4.00%, 8/1/2052 | 1,101,420 | 1,017,807 | ||||||
| Fannie Mae Pool, 4.50%, 8/1/2052 | 2,025,804 | 1,922,965 | ||||||
| Fannie Mae Pool, 3.50%, 9/1/2052 | 192,325 | 172,030 | ||||||
| Fannie Mae Pool, 4.00%, 9/1/2052 | 190,119 | 175,725 | ||||||
| Fannie Mae Pool, 4.50%, 9/1/2052 | 1,175,046 | 1,115,365 | ||||||
| Fannie Mae Pool, 5.00%, 9/1/2052 | 333,778 | 324,055 | ||||||
| Fannie Mae Pool, 4.00%, 10/1/2052 | 1,322,431 | 1,222,176 | ||||||
| Fannie Mae Pool, 4.50%, 10/1/2052 | 189,422 | 179,796 | ||||||
| Fannie Mae Pool, 5.00%, 10/25/2052 | 701,145 | 680,668 | ||||||
| Fannie Mae Pool, 4.50%, 11/1/2052 | 133,425 | 126,641 | ||||||
| Fannie Mae Pool, 5.00%, 2/1/2053 | 130,031 | 126,193 | ||||||
| Fannie Mae Pool, 5.50%, 6/1/2053 | 253,952 | 250,917 | ||||||
| Federal National Mortgage Association, 0.88%, 8/5/2030 | 1,000,000 | 794,006 | ||||||
| Freddie Mac Pool, 3.00%, 2/1/2052 | 200,813 | 174,622 | ||||||
| Freddie Mac Pool, 2.00%, 3/1/2052 | 1,086,495 | 875,154 | ||||||
See accompanying notes which are an integral part of these financial statements.
24
| OneAscent Core Plus Bond ETF |
| Schedule of Investments (continued) |
| August 31, 2023 |
| Principal | ||||||||
| U.S. GOVERNMENT & AGENCIES — 33.93% - continued | Amount | Fair Value | ||||||
| Freddie Mac Pool, 4.00%, 4/1/2052 | $ | 191,645 | $ | 177,217 | ||||
| Ginnie Mae II Pool, 2.50%, 9/20/2051 | 1,457,707 | 1,244,288 | ||||||
| Ginnie Mae II Pool, 3.00%, 12/20/2051 | 1,724,232 | 1,521,627 | ||||||
| Ginnie Mae II Pool, 2.50%, 5/20/2052 | 321,232 | 274,016 | ||||||
| Ginnie Mae II Pool, 3.00%, 5/20/2052 | 101,783 | 89,627 | ||||||
| Ginnie Mae II Pool, 3.50%, 7/20/2052 | 393,085 | 357,299 | ||||||
| Ginnie Mae II Pool, 4.00%, 9/20/2052 | 1,044,270 | 973,924 | ||||||
| Ginnie Mae II Pool, 4.50%, 12/20/2052 | 733,029 | 698,907 | ||||||
| United States Treasury Bond, 2.38%, 2/15/2042 | 483,000 | 359,599 | ||||||
| United States Treasury Note, 4.75%, 7/31/2025 | 920,000 | 917,413 | ||||||
| United States Treasury Note, 4.13%, 7/31/2028 | 1,747,000 | 1,736,491 | ||||||
| United States Treasury Note, 4.00%, 7/31/2030 | 120,000 | 118,613 | ||||||
| United States Treasury Note, 3.88%, 8/15/2033 | 4,879,000 | 4,794,761 | ||||||
| United States Treasury Note, 4.38%, 8/15/2043 | 3,102,000 | 3,095,699 | ||||||
| United States Treasury Note, 3.63%, 5/15/2053 | 2,982,000 | 2,690,789 | ||||||
| Total U.S. Government & Agencies (Cost $38,748,851) | 37,147,309 | |||||||
| Total Investments — 98.53% (Cost $114,280,695) | 107,868,992 | |||||||
| Other Assets in Excess of Liabilities — 1.47% | 1,613,779 | |||||||
| NET ASSETS — 100.00% | $ | 109,482,771 | ||||||
| (a) | Security exempt from registration under Rule 144A or Section 4(a)(2) of the Securities Act of 1933. The security may be resold in transactions exempt from registration, normally to qualified institutional buyers. |
| (b) | Variable rate security. Interest rate resets periodically. The rate shown is the effective interest rate as of August 31, 2023. For securities based on a published reference rate and spread, the reference rate and spread (in basis points) are indicated parenthetically. Certain variable rate securities are not based on a published reference rate and spread but are determined by the issuer or agent and are based on current market conditions. These securities, therefore, do not indicate a reference rate and spread. |
| (c) | In default. |
EMTN - Euro Medium Term Note
GMTN - Global Medium Term Note
MTN - Medium Term Note
See accompanying notes which are an integral part of these financial statements.
25
| OneAscent International Equity ETF |
| Schedule of Investments |
| August 31, 2023 |
| COMMON STOCKS — 87.09% | Shares | Fair Value | ||||||
| Communications — 0.92% | ||||||||
| Trip.com Group Ltd. (China)(a) | 19,286 | $ | 760,881 | |||||
| Consumer Discretionary — 2.34% | ||||||||
| Valeo S.A. (France) | 98,848 | 1,930,416 | ||||||
| Consumer Staples — 11.86% | ||||||||
| Carrefour S.A. (France) | 80,542 | 1,544,078 | ||||||
| Dollarama, Inc. (Canada) | 27,577 | 1,787,751 | ||||||
| Kimberly-Clark de Mexico SAB de CV (Mexico) | 1,192,242 | 2,684,962 | ||||||
| L’Oreal S.A. (France) | 3,119 | 1,373,213 | ||||||
| Nestle S.A. - ADR (Switzerland) | 20,025 | 2,405,603 | ||||||
| 9,795,607 | ||||||||
| Financials — 15.62% | ||||||||
| AIA Group Ltd. (Hong Kong) | 106,697 | 968,694 | ||||||
| Bangkok Bank PCL (Thailand) | 508,485 | 2,460,622 | ||||||
| Bank Rakyat Indonesia Persero Tbk P.T. (Indonesia) | 7,480,670 | 2,727,123 | ||||||
| DBS Group Holdings Ltd. (Singapore) | 113,687 | 2,800,939 | ||||||
| HDFC Bank Ltd. - ADR (India) | 25,942 | 1,616,446 | ||||||
| KBC Group N.V. (Belgium) | 35,481 | 2,331,268 | ||||||
| 12,905,092 | ||||||||
| Health Care — 7.10% | ||||||||
| Dentium Co. Ltd. (South Korea)(a) | 11,848 | 1,104,757 | ||||||
| PHC Holdings Corp. (Japan) | 122,080 | 1,197,628 | ||||||
| Santen Pharmaceutical Co. Ltd. (Japan) | 190,532 | 1,774,191 | ||||||
| Straumann Holding AG (Switzerland) | 11,772 | 1,785,757 | ||||||
| 5,862,333 | ||||||||
| Industrials — 20.71% | ||||||||
| Adecco Group AG (Switzerland) | 52,647 | 2,272,519 | ||||||
| CAE, Inc. (Canada)(a) | 81,423 | 1,963,532 | ||||||
| Daikin Industries Ltd. (Japan) | 8,882 | 1,540,265 | ||||||
| Element Fleet Management Corp. (Canada) | 186,717 | 2,869,636 | ||||||
| Ferguson plc (United Kingdom) | 11,751 | 1,912,081 | ||||||
| Intertek Group plc (United Kingdom) | 25,179 | 1,320,493 | ||||||
| Mitsubishi Electric Corp. (Japan) | 140,392 | 1,832,824 | ||||||
| MTU Aero Engines A.G. (Germany) | 9,047 | 2,118,197 | ||||||
| Nabtesco Corp. (Japan) | 65,657 | 1,245,335 | ||||||
| 17,074,882 | ||||||||
| Materials — 8.37% | ||||||||
| CRH plc (Ireland) | 55,263 | 3,184,952 | ||||||
| Givaudan S.A. (Switzerland) | 436 | 1,455,061 | ||||||
| Smurfit Kappa Group plc (Ireland) | 54,064 | 2,274,712 | ||||||
| 6,914,725 | ||||||||
| Technology — 20.17% | ||||||||
| ASML Holding N.V. - ADR (Netherlands) | 3,706 | 2,447,924 | ||||||
| ASMPT Ltd. (Hong Kong) | 205,816 | 2,061,482 | ||||||
| Constellation Software, Inc. (Canada) | 872 | 1,790,845 | ||||||
| Murata Manufacturing Co. Ltd. (Japan) | 28,895 | 1,625,904 | ||||||
| Nomura Research Institute Ltd. (Japan) | 64,201 | 1,847,101 | ||||||
See accompanying notes which are an integral part of these financial statements.
26
| OneAscent International Equity ETF |
| Schedule of Investments (continued) |
| August 31, 2023 |
| COMMON STOCKS — 87.09% - continued | Shares | Fair Value | ||||||
| Technology — 20.17% - continued | ||||||||
| Novatek Microelectronics Corp. (Taiwan Province of China) | 66,000 | $ | 827,122 | |||||
| NXP Semiconductors NV (Netherlands) | 8,066 | 1,659,338 | ||||||
| Taiwan Semiconductor Manufacturing Co., Ltd. - ADR (Taiwan Province of China) | 25,444 | 2,380,795 | ||||||
| Topicus.com, Inc. (Canada)(a) | 26,378 | 2,008,462 | ||||||
| 16,648,973 | ||||||||
| Total Common Stocks (Cost $63,276,025) | 71,892,909 | |||||||
| RIGHTS - 0.00%(b) | ||||||||
| Technology — 0.00%(b) | ||||||||
| Constellation Software, Inc., (Canada) Expiration Date 10/30/2023 | 872 | 484 | ||||||
| Total Rights (Cost $387) | 484 | |||||||
| WARRANTS - 0.00%(b) | ||||||||
| Technology — 0.00%(b) | ||||||||
| Constellation Software, Inc., (Canada) Expiration Date 3/31/2040(c) | 872 | — | ||||||
| Total Warrants (Cost $0) | — | |||||||
| Total Investments — 87.09% (Cost $63,276,412) | 71,893,393 | |||||||
| Other Assets in Excess of Liabilities — 12.91% | 10,655,690 | |||||||
| NET ASSETS — 100.00% | $ | 82,549,083 | ||||||
| (a) | Non-income producing security. |
| (b) | Less than 0.005%. |
| (c) | Security is currently being valued according to the fair value procedures of the Adviser, as Valuation Designee, under oversight of the Board’s Pricing & Liquidity Committee. |
ADR - American Depositary Receipt
See accompanying notes which are an integral part of these financial statements.
27
| OneAscent Emerging Markets ETF |
| Schedule of Investments |
| August 31, 2023 |
| COMMON STOCKS — 86.50% | Shares | Fair Value | ||||||
| Communications — 2.31% | ||||||||
| Trip.com Group Ltd. (China)(a) | 18,372 | $ | 724,822 | |||||
| Consumer Discretionary — 12.04% | ||||||||
| Ace Hardware Indonesia Tbk P.T. (Indonesia) | 13,698,179 | 656,836 | ||||||
| China Literature Ltd. (Cayman Islands)(a) | 207,693 | 834,232 | ||||||
| Coway Co. Ltd. (South Korea) | 10,411 | 339,571 | ||||||
| Haier Smart Home Co. Ltd., H Shares (China) | 360,855 | 1,115,832 | ||||||
| MercadoLibre, Inc. (Argentina)(a) | 333 | 456,996 | ||||||
| Sendas Distribuidora S.A. (Brazil) | 163,400 | 382,518 | ||||||
| 3,785,985 | ||||||||
| Consumer Staples — 6.41% | ||||||||
| Charoen Pokphand Foods PCL (Thailand) | 553,638 | 327,185 | ||||||
| Indofood CBP Sukses Makmur Tbk P.T. (Indonesia) | 964,220 | 709,358 | ||||||
| Kimberly-Clark de Mexico SAB de CV (Mexico) | 433,704 | 976,713 | ||||||
| 2,013,256 | ||||||||
| Financials — 19.95% | ||||||||
| Banco Bradesco S.A. - ADR (Brazil) | 148,579 | 444,251 | ||||||
| Bangkok Bank PCL (Thailand) | 197,337 | 954,938 | ||||||
| Bank Rakyat Indonesia Persero Tbk P.T. (Indonesia) | 3,195,641 | 1,164,990 | ||||||
| BB Seguridade Participacoes S.A. (Brazil) | 104,100 | 640,676 | ||||||
| Chailease Holding Co. Ltd. (Taiwan Province of China) | 168,940 | 940,675 | ||||||
| HDFC Bank Ltd. - ADR (India) | 14,359 | 894,709 | ||||||
| Hong Kong Exchanges & Clearing Ltd. (Hong Kong) | 14,371 | 557,077 | ||||||
| Regional S.A.B. de C.V. (Mexico) | 91,271 | 672,410 | ||||||
| 6,269,726 | ||||||||
| Health Care — 3.14% | ||||||||
| Dentium Co. Ltd. (South Korea)(a) | 10,580 | 986,523 | ||||||
| Industrials — 7.95% | ||||||||
| China Airlines Ltd. (Taiwan Province of China) | 1,212,000 | 859,251 | ||||||
| Sarana Menara Nusantara Tbk P.T. (Indonesia) | 9,115,260 | 616,705 | ||||||
| Sporton International, Inc. (Taiwan Province of China) | 59,400 | 477,950 | ||||||
| Voltronic Power Technology Corp. (Taiwan Province of China) | 12,000 | 545,831 | ||||||
| 2,499,737 | ||||||||
| Materials — 3.25% | ||||||||
| Hanwha Solutions Corp. (South Korea)(a) | 14,159 | 389,659 | ||||||
| Orbia Advance Corp. SAB de CV (Mexico) | 283,571 | 631,126 | ||||||
| 1,020,785 | ||||||||
| Technology — 31.45% | ||||||||
| Accton Technology Corp. (Taiwan Province of China) | 61,000 | 914,674 | ||||||
| ASMPT Ltd. (Hong Kong) | 92,070 | 922,186 | ||||||
| DB HiTek Co. Ltd. (South Korea) | 13,307 | 537,512 | ||||||
| eMemory Technology, Inc. (Taiwan Province of China) | 6,000 | 341,615 | ||||||
| Infosys Ltd. - ADR (India) | 38,250 | 664,403 | ||||||
| MediaTek, Inc. (Taiwan Province of China) | 28,000 | 619,236 | ||||||
| Novatek Microelectronics Corp. (Taiwan Province of China) | 46,000 | 576,479 | ||||||
| Powerchip Semiconductor Manufacturing Corp. (Taiwan Province of China) | 270,000 | 235,884 | ||||||
See accompanying notes which are an integral part of these financial statements.
28
| OneAscent Emerging Markets ETF |
| Schedule of Investments (continued) |
| August 31, 2023 |
| COMMON STOCKS — 86.50% - continued | Shares | Fair Value | ||||||
| Technology — 31.45% - continued | ||||||||
| Samsung Electronics Co. Ltd. (South Korea) | 42,521 | $ | 2,147,752 | |||||
| Samsung SDI Co. Ltd. (South Korea) | 1,304 | 604,506 | ||||||
| Taiwan Semiconductor Manufacturing Co. Ltd. (Taiwan Province of China) | 114,000 | 1,963,298 | ||||||
| Unimicron Technology Corp. (Taiwan Province of China) | 61,000 | 354,963 | ||||||
| 9,882,508 | ||||||||
| Total Common Stocks/Investments — 86.50% (Cost $25,347,207) | 27,183,342 | |||||||
| Other Assets in Excess of Liabilities — 13.50% | 4,242,369 | |||||||
| NET ASSETS — 100.00% | $ | 31,425,711 | ||||||
| (a) | Non-income producing security. |
ADR - American Depositary Receipt
See accompanying notes which are an integral part of these financial statements.
29
| OneAscent ETFs |
| Statements of Assets and Liabilities |
| August 31, 2023 |
| OneAscent | OneAscent | OneAscent | OneAscent | |||||||||||||
| Large Cap | Core Plus | International | Emerging | |||||||||||||
| Core ETF | Bond ETF | Equity ETF | Markets ETF | |||||||||||||
| Assets | ||||||||||||||||
| Investments in securities, at fair value (cost $32,063,773, $114,280,695, $63,276,412 and $25,347,207) | $ | 34,591,798 | $ | 107,868,992 | $ | 71,893,393 | $ | 27,183,342 | ||||||||
| Foreign currency (cost $–, $41, $13,009 and $40,646) | — | 42 | 13,009 | 40,646 | ||||||||||||
| Cash | 2,787,616 | 1,773,384 | 10,501,803 | 4,220,796 | ||||||||||||
| Dividend and interest receivable | 50,958 | 799,462 | 65,496 | 30,714 | ||||||||||||
| Tax reclaims receivable | 472 | — | 166,508 | 4,819 | ||||||||||||
| Prepaid offering cost | — | — | 445 | 445 | ||||||||||||
| Prepaid expenses | 2,265 | 2,915 | 2,797 | 2,145 | ||||||||||||
| Total Assets | 37,433,109 | 110,444,795 | 82,643,451 | 31,482,907 | ||||||||||||
| Liabilities | ||||||||||||||||
| Payable for investments purchased | — | 497,045 | — | — | ||||||||||||
| Payable for distributions to shareholders | — | 371,420 | — | — | ||||||||||||
| Payable to Adviser | 10,895 | 46,132 | 41,310 | 11,712 | ||||||||||||
| Payable to affiliates | 7,857 | 11,664 | 7,874 | 7,457 | ||||||||||||
| Payable to audit and tax | 18,450 | 19,000 | 19,450 | 19,450 | ||||||||||||
| Other accrued expenses | 12,783 | 16,763 | 25,734 | 18,577 | ||||||||||||
| Total Liabilities | 49,985 | 962,024 | 94,368 | 57,196 | ||||||||||||
| Net Assets | $ | 37,383,124 | $ | 109,482,771 | $ | 82,549,083 | $ | 31,425,711 | ||||||||
| Net Assets consist of: | ||||||||||||||||
| Paid-in capital | $ | 43,139,741 | $ | 120,816,420 | $ | 72,665,922 | $ | 28,711,075 | ||||||||
| Accumulated earnings (deficit) | (5,756,617 | ) | (11,333,649 | ) | 9,883,161 | 2,714,636 | ||||||||||
| Net Assets | $ | 37,383,124 | $ | 109,482,771 | $ | 82,549,083 | $ | 31,425,711 | ||||||||
| Shares outstanding (unlimited number of shares authorized, no par value) | 1,600,000 | 4,900,000 | 2,725,000 | 1,125,000 | ||||||||||||
| Net asset value per share | $ | 23.36 | $ | 22.34 | $ | 30.29 | $ | 27.93 | ||||||||
See accompanying notes which are an integral part of these financial statements.
30
| OneAscent ETFs |
| Statements of Operations |
| For the period ended August 31, 2023 |
| OneAscent | ||||||||||||||||
| OneAscent | OneAscent | OneAscent | Emerging | |||||||||||||
| Large Cap | Core Plus | International | Markets | |||||||||||||
| Core ETF | Bond ETF | Equity ETF(a) | ETF(a) | |||||||||||||
| Investment Income | ||||||||||||||||
| Dividend income (net of foreign taxes withheld of $–, $–, $241,060 and $113,524) | $ | 496,477 | $ | 118,199 | $ | 1,939,474 | $ | 638,103 | ||||||||
| Interest income | 122,098 | 4,667,167 | 208,345 | 70,643 | ||||||||||||
| Total investment income | 618,575 | 4,785,366 | 2,147,819 | 708,746 | ||||||||||||
| Expenses | ||||||||||||||||
| Adviser | 148,381 | 520,202 | 529,467 | 187,110 | ||||||||||||
| Administration | 63,665 | 93,501 | 66,728 | 59,440 | ||||||||||||
| Custodian | 26,309 | 21,355 | 43,131 | 38,932 | ||||||||||||
| Legal | 20,576 | 23,071 | 18,961 | 18,961 | ||||||||||||
| Trustee | 17,964 | 17,964 | 17,964 | 17,964 | ||||||||||||
| Audit and tax | 17,831 | 18,931 | 19,995 | 20,351 | ||||||||||||
| Compliance services | 12,604 | 19,550 | 12,604 | 12,604 | ||||||||||||
| Report printing | 11,168 | 9,812 | 5,421 | 4,921 | ||||||||||||
| Transfer agent | 10,330 | 10,892 | 11,292 | 10,433 | ||||||||||||
| Insurance | 3,354 | 4,135 | 655 | 503 | ||||||||||||
| Pricing | 1,352 | 20,886 | 2,174 | 1,911 | ||||||||||||
| Offering | — | — | 8,721 | 8,721 | ||||||||||||
| Organizational | — | — | 17,193 | 17,193 | ||||||||||||
| Miscellaneous | 32,040 | 36,810 | 43,282 | 40,088 | ||||||||||||
| Total expenses | 365,574 | 797,109 | 797,588 | 439,132 | ||||||||||||
| Fees waived by Adviser | — | — | (115,720 | ) | (122,001 | ) | ||||||||||
| Net operating expenses | 365,574 | 797,109 | 681,868 | 317,131 | ||||||||||||
| Net investment income | 253,001 | 3,988,257 | 1,465,951 | 391,615 | ||||||||||||
| Net Realized and Change in Unrealized Gain (Loss) on Investments | ||||||||||||||||
| Net realized gain (loss) on: | ||||||||||||||||
| Investment securities | (2,900,770 | ) | (3,237,355 | ) | 4,787,658 | 1,481,702 | ||||||||||
| Foreign currency transactions | — | — | (7,942 | ) | (68,010 | ) | ||||||||||
| Change in unrealized appreciation (depreciation) on: | ||||||||||||||||
| Investment securities | 8,916,299 | (2,003,263 | ) | 8,616,981 | 1,836,135 | |||||||||||
| Foreign currency translations | — | — | 680 | (84 | ) | |||||||||||
| Net realized and change in unrealized gain (loss) on investment securities | 6,015,529 | (5,240,618 | ) | 13,397,377 | 3,249,743 | |||||||||||
| Net increase (decrease) in net assets resulting from operations | $ | 6,268,530 | $ | (1,252,361 | ) | $ | 14,863,328 | $ | 3,641,358 | |||||||
| (a) | For the period September 14, 2022 (commencement of operations) to August 31, 2023. |
See accompanying notes which are an integral part of these financial statements.
31
| OneAscent ETFs |
| Statements of Changes in Net Assets |
| OneAscent Large Cap Core ETF | OneAscent Core Plus Bond ETF | |||||||||||||||
| For the Year | For the Period | For the Year | For the Period | |||||||||||||
| Ended August | Ended August | Ended August | Ended August | |||||||||||||
| 31, 2023 | 31, 2022(a) | 31, 2023 | 31, 2022(b) | |||||||||||||
| Increase (Decrease) in Net Assets due to: | ||||||||||||||||
| Operations | ||||||||||||||||
| Net investment income | $ | 253,001 | $ | 127,620 | $ | 3,988,257 | $ | 1,108,585 | ||||||||
| Net realized loss on investment securities and foreign currency transactions | (2,900,770 | ) | (5,133,241 | ) | (3,237,355 | ) | (1,724,603 | ) | ||||||||
| Change in unrealized appreciation (depreciation) on investment securities and foreign currency translations | 8,916,299 | (6,392,154 | ) | (2,003,263 | ) | (4,408,440 | ) | |||||||||
| Net increase (decrease) in net assets resulting from operations | 6,268,530 | (11,397,775 | ) | (1,252,361 | ) | (5,024,458 | ) | |||||||||
| Distributions to Shareholders From: | ||||||||||||||||
| Earnings | (223,290 | ) | (33,250 | ) | (3,982,255 | ) | (1,074,575 | ) | ||||||||
| Total distributions | (223,290 | ) | (33,250 | ) | (3,982,255 | ) | (1,074,575 | ) | ||||||||
| Capital Transactions | ||||||||||||||||
| Proceeds from shares sold | 4,666,376 | 73,618,036 | 18,161,265 | 115,196,878 | ||||||||||||
| Amount paid for shares redeemed | (31,706,173 | ) | (3,809,330 | ) | (9,007,277 | ) | (3,534,446 | ) | ||||||||
| Net increase (decrease) in net assets resulting from capital transactions | (27,039,797 | ) | 69,808,706 | 9,153,988 | 111,662,432 | |||||||||||
| Total Increase (Decrease) in Net Assets | (20,994,557 | ) | 58,377,681 | 3,919,372 | 105,563,399 | |||||||||||
| Net Assets | ||||||||||||||||
| Beginning of period | $ | 58,377,681 | $ | — | $ | 105,563,399 | $ | — | ||||||||
| End of period | $ | 37,383,124 | $ | 58,377,681 | $ | 109,482,771 | $ | 105,563,399 | ||||||||
| Share Transactions | ||||||||||||||||
| Shares sold | 225,000 | 3,050,000 | 800,000 | 4,650,000 | ||||||||||||
| Shares redeemed | (1,500,000 | ) | (175,000 | ) | (400,000 | ) | (150,000 | ) | ||||||||
| Net increase (decrease) in shares outstanding | (1,275,000 | ) | 2,875,000 | 400,000 | 4,500,000 | |||||||||||
| (a) | For the period November 15, 2021 (commencement of operations) to August 31, 2022. |
| (b) | For the period March 30, 2022 (commencement of operations) to August 31, 2022. |
See accompanying notes which are an integral part of these financial statements.
32
| OneAscent ETFs |
| Statements of Changes in Net Assets (continued) |
| OneAscent | OneAscent | |||||||
| International | Emerging | |||||||
| Equity ETF | Markets ETF | |||||||
| For the Period | For the Period | |||||||
| Ended August | Ended August | |||||||
| 31, 2023(a) | 31, 2023(a) | |||||||
| Increase (Decrease) in Net Assets due to: | ||||||||
| Operations | ||||||||
| Net investment income | $ | 1,465,951 | $ | 391,615 | ||||
| Net realized gain on investment securities and foreign currency transactions | 4,779,716 | 1,413,692 | ||||||
| Change in unrealized appreciation on investment securities and foreign currency translations | 8,617,661 | 1,836,051 | ||||||
| Net increase in net assets resulting from operations | 14,863,328 | 3,641,358 | ||||||
| Distributions to Shareholders From: | ||||||||
| Earnings | (330,755 | ) | (9,360 | ) | ||||
| Total distributions | (330,755 | ) | (9,360 | ) | ||||
| Capital Transactions | ||||||||
| Proceeds from shares sold | 95,799,674 | 41,066,695 | ||||||
| Amount paid for shares redeemed | (27,783,164 | ) | (13,272,982 | ) | ||||
| Net increase in net assets resulting from capital transactions | 68,016,510 | 27,793,713 | ||||||
| Total Increase in Net Assets | 82,549,083 | 31,425,711 | ||||||
| Net Assets | ||||||||
| Beginning of period | $ | — | $ | — | ||||
| End of period | $ | 82,549,083 | $ | 31,425,711 | ||||
| Share Transactions | ||||||||
| Shares sold | 3,675,000 | 1,600,000 | ||||||
| Shares redeemed | (950,000 | ) | (475,000 | ) | ||||
| Net increase in shares outstanding | 2,725,000 | 1,125,000 | ||||||
| (a) | For the period September 14, 2022 (commencement of operations) to August 31, 2023. |
See accompanying notes which are an integral part of these financial statements.
33
| OneAscent Large Cap Core ETF |
| Financial Highlights |
| (For a share outstanding during each period) |
| For the | ||||||||
| For the | Period | |||||||
| Year Ended | Ended | |||||||
| August 31, | August 31, | |||||||
| 2023 | 2022(a) | |||||||
| Selected Per Share Data: | ||||||||
| Net asset value, beginning of period | $ | 20.31 | $ | 25.00 | ||||
| Investment operations: | ||||||||
| Net investment income | 0.12 | 0.04 | ||||||
| Net realized and unrealized gain (loss) on investments | 3.01 | (4.72 | ) | |||||
| Total from investment operations | 3.13 | (4.68 | ) | |||||
| Less distributions to shareholders from: | ||||||||
| Net investment income | (0.08 | ) | (0.01 | ) | ||||
| Total distributions | (0.08 | ) | (0.01 | ) | ||||
| Net asset value, end of period | $ | 23.36 | $ | 20.31 | ||||
| Market price, end of period | $ | 23.37 | $ | 20.35 | ||||
| Total Return(b) | 15.48 | % | (18.71 | %) (c) | ||||
| Ratios and Supplemental Data: | ||||||||
| Net assets, end of period (000 omitted) | $ | 37,383 | $ | 58,378 | ||||
| Ratio of net expenses to average net assets | 0.86 | % | 0.81 | % (d) | ||||
| Ratio of net investment income to average net assets | 0.60 | % | 0.28 | % (d) | ||||
| Portfolio turnover rate(e) | 105 | % | 52 | % (c) | ||||
| (a) | For the period November 15, 2021 (commencement of operations) to August 31, 2022. |
| (b) | Total return is calculated assuming a purchase of shares at net asset value on the first day and a sale at net asset value on the last day of the period. Distributions are assumed, for the purpose of this calculation, to be reinvested at the ex-dividend date net asset value per share on their respective payment dates. |
| (c) | Not annualized. |
| (d) | Annualized. |
| (e) | Portfolio turnover rate excludes securities received or delivered from in-kind processing of creations or redemptions. |
See accompanying notes which are an integral part of these financial statements.
34
| OneAscent Core Plus Bond ETF |
| Financial Highlights |
| (For a share outstanding during each period) |
| For the | ||||||||
| For the | Period | |||||||
| Year Ended | Ended | |||||||
| August 31, | August 31, | |||||||
| 2023 | 2022(a) | |||||||
| Selected Per Share Data: | ||||||||
| Net asset value, beginning of period | $ | 23.46 | $ | 25.00 | ||||
| Investment operations: | ||||||||
| Net investment income | 0.87 | 0.24 | ||||||
| Net realized and unrealized loss on investments | (1.12 | ) | (1.55 | ) | ||||
| Total from investment operations | (0.25 | ) | (1.31 | ) | ||||
| Less distributions to shareholders from: | ||||||||
| Net investment income | (0.87 | ) | (0.23 | ) | ||||
| Total distributions | (0.87 | ) | (0.23 | ) | ||||
| Net asset value, end of period | $ | 22.34 | $ | 23.46 | ||||
| Market price, end of period | $ | 22.33 | $ | 23.40 | ||||
| Total Return(b) | (1.05 | %) | (5.23 | %) (c) | ||||
| Ratios and Supplemental Data: | ||||||||
| Net assets, end of period (000 omitted) | $ | 109,483 | $ | 105,563 | ||||
| Ratio of net expenses to average net assets | 0.77 | % | 0.83 | % (d) | ||||
| Ratio of net investment income to average net assets | 3.83 | % | 2.51 | % (d) | ||||
| Portfolio turnover rate(e) | 128 | % | 122 | % (c) | ||||
| (a) | For the period March 30, 2022 (commencement of operations) to August 31, 2022. |
| (b) | Total return is calculated assuming a purchase of shares at net asset value on the first day and a sale at net asset value on the last day of the period. Distributions are assumed, for the purpose of this calculation, to be reinvested at the ex-dividend date net asset value per share on their respective payment dates. |
| (c) | Not annualized. |
| (d) | Annualized. |
| (e) | Portfolio turnover rate excludes securities received or delivered from in-kind processing of creations or redemptions. |
See accompanying notes which are an integral part of these financial statements.
35
| OneAscent International Equity ETF |
| Financial Highlights |
| (For a share outstanding during the period) |
| For the | ||||
| Period | ||||
| Ended | ||||
| August 31, | ||||
| 2023(a) | ||||
| Selected Per Share Data: | ||||
| Net asset value, beginning of period | $ | 25.00 | ||
| Investment operations: | ||||
| Net investment income | 0.58 | |||
| Net realized and unrealized gain on investments | 4.87 | |||
| Total from investment operations | 5.45 | |||
| Less distributions to shareholders from: | ||||
| Net investment income | (0.16 | ) | ||
| Total distributions | (0.16 | ) | ||
| Net asset value, end of period | $ | 30.29 | ||
| Market price, end of period | $ | 30.44 | ||
| Total Return(b) | 21.89 | % (c) | ||
| Ratios and Supplemental Data: | ||||
| Net assets, end of period (000 omitted) | $ | 82,549 | ||
| Ratio of net expenses to average net assets | 0.95 | % (d) | ||
| Ratio of gross expenses to average net assets before waiver | 1.11 | % (d) | ||
| Ratio of net investment income to average net assets | 2.04 | % (d) | ||
| Portfolio turnover rate(e) | 13 | % (c) | ||
| (a) | For the period September 14, 2022 (commencement of operations) to August 31, 2023. |
| (b) | Total return is calculated assuming a purchase of shares at net asset value on the first day and a sale at net asset value on the last day of the period. Distributions are assumed, for the purpose of this calculation, to be reinvested at the ex-dividend date net asset value per share on their respective payment dates. |
| (c) | Not annualized. |
| (d) | Annualized. |
| (e) | Portfolio turnover rate excludes securities received or delivered from in-kind processing of creations or redemptions. |
See accompanying notes which are an integral part of these financial statements.
36
| OneAscent Emerging Markets ETF |
| Financial Highlights |
| (For a share outstanding during the period) |
| For the | ||||
| Period | ||||
| Ended | ||||
| August 31, | ||||
| 2023(a) | ||||
| Selected Per Share Data: | ||||
| Net asset value, beginning of period | $ | 25.00 | ||
| Investment operations: | ||||
| Net investment income | 0.35 | |||
| Net realized and unrealized gain on investments | 2.59 | |||
| Total from investment operations | 2.94 | |||
| Less distributions to shareholders from: | ||||
| Net investment income | (0.01 | ) | ||
| Total distributions | (0.01 | ) | ||
| Net asset value, end of period | $ | 27.93 | ||
| Market price, end of period | $ | 27.85 | ||
| Total Return(b) | 11.77 | % (c) | ||
| Ratios and Supplemental Data: | ||||
| Net assets, end of period (000 omitted) | $ | 31,426 | ||
| Ratio of net expenses to average net assets | 1.25 | % (d) | ||
| Ratio of gross expenses to average net assets before waiver | 1.73 | % (d) | ||
| Ratio of net investment income to average net assets | 1.54 | % (d) | ||
| Portfolio turnover rate(e) | 45 | % (c) | ||
| (a) | For the period September 14, 2022 (commencement of operations) to August 31, 2023. |
| (b) | Total return is calculated assuming a purchase of shares at net asset value on the first day and a sale at net asset value on the last day of the period. Distributions are assumed, for the purpose of this calculation, to be reinvested at the ex-dividend date net asset value per share on their respective payment dates. |
| (c) | Not annualized. |
| (d) | Annualized. |
| (e) | Portfolio turnover rate excludes securities received or delivered from in-kind processing of creations or redemptions. |
See accompanying notes which are an integral part of these financial statements.
37
| OneAscent ETFs |
| Notes to the Financial Statements |
| August 31, 2023 |
NOTE 1. ORGANIZATION
OneAscent Large Cap Core ETF (the “Large Cap Core ETF”), OneAscent Core Plus Bond ETF (the “Core Plus Bond ETF”), OneAscent International Equity ETF (the “International Equity ETF”) and OneAscent Emerging Markets ETF (the “Emerging Markets ETF”) (each a “Fund” and collectively the “Funds”) are registered under the Investment Company Act of 1940, as amended (“1940 Act”), as diversified series of Unified Series Trust (the “Trust”). The Trust is an open-end investment company established under the laws of Ohio by an Agreement and Declaration of Trust dated October 14, 2002, as amended (the “Trust Agreement”). The Trust Agreement permits the Board of Trustees of the Trust (the “Board” or “Trustees”) to issue an unlimited number of shares of beneficial interest of separate series. Each Fund is one of a series of funds currently authorized by the Board. The Funds’ investment adviser is OneAscent Investment Solutions, LLC (the “Adviser”). The Adviser has retained Teachers Advisors, LLC (the “Sub-Adviser”) to serve as sub-adviser to the Core Plus Bond ETF. The investment objective of the Large Cap Core ETF is to seek capital appreciation. The investment objective of the Core Plus Bond ETF is to seek total return, with an emphasis on income as the source of that total return, while giving special consideration to certain values-based and impact criteria. The investment objective of the International Equity ETF and Emerging Markets ETF is to seek to achieve long-term capital appreciation.
NOTE 2. SIGNIFICANT ACCOUNTING POLICIES
The Funds are investment companies and follow accounting and reporting guidance under Financial Accounting Standards Board Accounting Standards Codification (“ASC”) Topic 946, “Financial Services-Investment Companies”, including Accounting Standards Update 2013-08. The following is a summary of significant accounting policies followed by the Funds in the preparation of their financial statements. These policies are in conformity with generally accepted accounting principles in the United States of America (“GAAP”).
New Accounting Pronouncements – In March 2020, FASB issued Accounting Standards Update 2020-04, Reference Rate Reform: Facilitation of the Effects of Reference Rate Reform on Financial Reporting (“ASU 2020-04”), in January 2021, the FASB issued Accounting Standards Update 2021-01, Reference Rate Reform (Topic 848): Scope (“ASU 2021-01”), and in December 2022, the FASB issued Accounting Standards Update ASU 2022-06, Reference Rate Reform (Topic 848): Deferral of the Sunset Date of Topic 848 (“ASU 2022-06”), which provides optional, temporary relief with respect to the financial reporting of contracts subject to certain types of modifications due to the planned discontinuation of the London Interbank Offered Rate (“LIBOR”) and other interbank offered rates as of the end of 2021. The temporary relief provided by ASU 2020-04, ASU 2021-01, and ASU 2022-06 are effective for certain reference rate-related contract
38
| OneAscent ETFs |
| Notes to the Financial Statements (continued) |
| August 31, 2023 |
modifications that occur during the period from March 12, 2020 through December 31, 2024.
Regulatory update – Tailored Shareholder Reports for Mutual Funds and Exchange-Traded Funds (“ETFs”) – Effective January 24, 2023, the SEC adopted rule and form amendments to require mutual funds and ETFs to transmit concise and visually engaging streamlined annual and semiannual reports to shareholders that highlight key information. Other information, including financial statements, will no longer appear in a streamlined shareholder report but must be available online, delivered free of charge upon request, and filed on a semiannual basis on Form N-CSR. The rule and form amendments have a compliance date of July 24, 2024. At this time, management is evaluating the impact of these amendments on the shareholder reports for the Funds.
Estimates – The preparation of financial statements in conformity with GAAP requires management to make estimates and assumptions that affect the reported amounts of assets and liabilities and disclosure of contingent assets and liabilities at the date of the financial statements and the reported amounts of increases and decreases in net assets from operations during the reporting period. Actual results could differ from those estimates.
Federal Income Taxes – The Funds make no provision for federal income or excise tax. Each Fund has qualified and intends to qualify each year as a regulated investment company (“RIC”) under subchapter M of the Internal Revenue Code of 1986, as amended, by complying with the requirements applicable to RICs and by distributing substantially all of its taxable income. Each Fund also intends to distribute sufficient net investment income and net capital gains, if any, so that it will not be subject to excise tax on undistributed income and gains. If the required amount of net investment income or gains is not distributed, the Funds could incur a tax expense.
As of and during the fiscal year ended August 31, 2023, the Funds did not have any liabilities for any unrecognized tax benefits. The Funds recognize interest and penalties, if any, related to unrecognized tax benefits as income tax expense in the Statements of Operations when incurred. During the year, the Funds did not incur any interest or penalties. Management of the Funds has reviewed tax positions taken in tax years that remain subject to examination by all major tax jurisdictions, including federal (i.e., the previous tax year end and the interim tax period since then, as applicable) and has concluded that no provision for unrecognized tax benefits or expenses is required in these financial statements and does not expect this to change over the next twelve months.
Expenses – Expenses incurred by the Trust that do not relate to a specific Fund are allocated to the individual funds of the Trust based on each Fund’s relative net assets or another appropriate basis (as determined by the Board).
39
| OneAscent ETFs |
| Notes to the Financial Statements (continued) |
| August 31, 2023 |
Security Transactions and Related Income – The Funds follow industry practice and record security transactions on the trade date for financial reporting purposes. The specific identification method is used for determining gains or losses for financial statements and income tax purposes. Dividend income is recorded on the ex-dividend date and interest income is recorded on an accrual basis. Distributions received from investments in real estate investment trusts (“REITs”) that represent a return of capital or capital gain are recorded as a reduction of the cost of investment or as a realized gain, respectively. The calendar year-end amounts of ordinary income, capital gains, and return of capital included in distributions received from the Funds’ investments in REITs are reported to the Funds after the end of the calendar year; accordingly, the Funds estimate these amounts for accounting purposes until the characterization of REIT distributions is reported. Estimates are based on the most recent REIT distributions information available. Withholding taxes on foreign dividends and related reclaims have been provided for in accordance with the Funds’ understanding of the applicable country’s tax rules and rates.
Dividends and Distributions – The Large Cap Core ETF intends to distribute its dividends from net investment income and net realized long-term and short-term capital gains, if any, at least annually. The Core Plus Bond ETF typically distributes dividends from net investment income monthly and any realized net capital gains, if any, annually. The International Equity ETF and Emerging Markets ETF ordinarily distribute dividends from net investment income, if any, annually and distribute net realized gains, if any, to shareholders annually. Dividends and distributions to shareholders, which are determined in accordance with income tax regulations, are recorded on the ex-dividend date. The treatment for financial reporting purposes of distributions made to shareholders during the period from net investment income or net realized capital gains may differ from their ultimate treatment for federal income tax purposes. These differences are caused primarily by differences in the timing of the recognition of certain components of income, expense or realized capital gain for federal income tax purposes. Where such differences are permanent in nature, they are reclassified among the components of net assets based on their ultimate characterization for federal income tax purposes. Any such reclassifications will have no effect on net assets, results of operations or net asset value (“NAV”) per share of the Funds.
Organization and Offering Costs – The Adviser advanced some of the Funds’ organization and initial offering costs and was subsequently reimbursed by the Funds. Costs of $9,166 incurred in connection with the offering and initial registration of each of the International Equity ETF and Emerging Markets ETF have been deferred and are being amortized on a straight-line basis over the first twelve months after commencement of operations. Costs of $17,193 incurred in connection with the organization of each of the International Equity ETF and Emerging Markets ETF were expensed as incurred. As of August 31, 2023, the
40
| OneAscent ETFs |
| Notes to the Financial Statements (continued) |
| August 31, 2023 |
amount of the offering costs remaining to amortize was $445 for the International Equity ETF and $445 for the Emerging Markets ETF.
For the fiscal year ended August 31, 2023, the Funds made the following reclassifications to increase (decrease) the components of net assets:
| Accumulated Earnings | ||||||||
| Paid-In Capital | (Deficit) | |||||||
| Large Cap Core ETF | $ | 143,793 | $ | (143,793 | ) | |||
| Core Plus Bond ETF | — | — | ||||||
| International Equity ETF | 4,649,412 | (4,649,412 | ) | |||||
| Emerging Markets ETF | 917,362 | (917,362 | ) | |||||
NOTE 3. SECURITIES VALUATION AND FAIR VALUE MEASUREMENTS
Each Fund values its portfolio securities at fair value as of the close of regular trading on the New York Stock Exchange (“NYSE”) (normally 4:00 p.m. Eastern time) on each business day the NYSE is open for business. Fair value is defined as the price that a Fund would receive upon selling an investment in a timely transaction to an independent buyer in the principal or most advantageous market of the investment. GAAP establishes a three-tier hierarchy to maximize the use of observable market data and minimize the use of unobservable inputs and to establish classification of fair value measurements for disclosure purposes.
Inputs refer broadly to the assumptions that market participants would use in pricing the asset or liability, including assumptions about risk (the risk inherent in a particular valuation technique used to measure fair value including a pricing model and/or the risk inherent in the inputs to the valuation technique). Inputs may be observable or unobservable. Observable inputs are inputs that reflect the assumptions market participants would use in pricing the asset or liability developed based on market data obtained and available from sources independent of the reporting entity. Unobservable inputs are inputs that reflect the reporting entity’s own assumptions about the assumptions market participants would use in pricing the asset or liability developed based on the best information available in the circumstances.
Various inputs are used in determining the value of each Fund’s investments. These inputs are summarized in the three broad levels listed below.
| ● | Level 1 – unadjusted quoted prices in active markets for identical investments and/or registered investment companies where the value per share is determined and published and is the basis for current transactions for identical assets or liabilities at the valuation date |
41
| OneAscent ETFs |
| Notes to the Financial Statements (continued) |
| August 31, 2023 |
| ● | Level 2 – other significant observable inputs (including, but not limited to, quoted prices for an identical security in an inactive market, quoted prices for similar securities, interest rates, prepayment speeds, credit risk, etc.) |
| ● | Level 3 – significant unobservable inputs (including the Funds’ own assumptions in determining fair value of investments based on the best information available) |
The inputs used to measure fair value may fall into different levels of the fair value hierarchy. In such cases, for disclosure purposes, the level in the fair value hierarchy which is reported is determined based on the lowest level input that is significant to the fair value measurement in its entirety.
Equity securities that are traded on any stock exchange are generally valued at the last quoted sale price on the security’s primary exchange. Lacking a last sale price, an exchange-traded security is generally valued at its last bid price. Securities traded in the Nasdaq over-the-counter market are generally valued at the Nasdaq Official Closing Price. When using market quotations and when the market is considered active, the security is classified as a Level 1 security. In the event that market quotations are not readily available or are considered unreliable due to market or other events, securities are valued in good faith by the Adviser, as Valuation Designee, under the oversight of the Board’s Pricing & Liquidity Committee. The Adviser has adopted written policies and procedures for valuing securities and other assets in circumstances where market quotes are not readily available in conformity with guidelines adopted by the Board. In the event that market quotes are not readily available, and the security or asset cannot be valued pursuant to one of the valuation methods, the value of the security or asset will be determined in good faith by the Valuation Designee pursuant to its policies and procedures. Any fair value provided by the Valuation Designee, is subject to the ultimate review of the pricing methodology by the Pricing & Liquidity Committee of the Board on a quarterly basis. Under these policies, the securities will be classified as Level 2 or 3 within the fair value hierarchy, depending on the inputs used.
Debt securities are valued by using the mean between the closing bid and ask prices provided by a pricing service. If the closing bid and ask prices are not readily available, the pricing service may provide a price determined by a matrix pricing method. Matrix pricing is a mathematical technique used to value fixed income securities without relying exclusively on quoted prices. Matrix pricing takes into consideration recent transactions, yield, liquidity, risk, credit quality, coupon, maturity, type of issue and any other factors or market data the pricing service deems relevant for the actual security being priced and for other securities with similar characteristics. These securities will generally be categorized as Level 2 securities. If the Adviser as Valuation Designee decides that a price provided by the pricing service does not accurately reflect the fair value of the securities or when
42
| OneAscent ETFs |
| Notes to the Financial Statements (continued) |
| August 31, 2023 |
prices are not readily available from a pricing service, securities are valued at fair value as determined by the Valuation Designee, in conformity with guidelines adopted by and subject to review of the Board. These securities will generally be categorized as Level 3 securities.
In accordance with the Trust’s valuation policies and fair value determinations pursuant to Rule 2a-5, as Valuation Designee is required to consider all appropriate factors relevant to the value of securities for which it has determined other pricing sources are not available or reliable as described above. No single method exists for determining fair value, because fair value depends upon the circumstances of each individual case. As a general principle, the current fair value of a security being valued by the Valuation Designee would be the amount that the Funds might reasonably expect to receive upon the current sale. Methods that are in accordance with this principle may, for example, be based on (i) a multiple of earnings; (ii) a discount from market prices of a similar freely traded security (including a derivative security or a basket of securities traded on other markets, exchanges or among dealers); or (iii) yield to maturity with respect to debt issues, or a combination of these and other methods. Fair-value pricing is permitted if, in the Valuation Designee’s opinion, the validity of market quotations appears to be questionable based on factors such as evidence of a thin market in the security based on a small number of quotations, a significant event occurs after the close of a market but before a Fund’s NAV calculation that may affect a security’s value, or the Valuation Designee is aware of any other data that calls into question the reliability of market quotations. The Valuation Designee may obtain assistance from others in fulfilling its duties. For example, it may seek assistance from pricing services, fund administrators, sub-advisers, accountants, or counsel; it may also consult the Trust’s Fair Value Committee. The Valuation Designee, however, remains responsible for the final fair value determination and may not designate or assign that responsibility to any third party.
43
| OneAscent ETFs |
| Notes to the Financial Statements (continued) |
| August 31, 2023 |
The following is a summary of the inputs used to value the Funds’ investments as of August 31, 2023:
| Valuation Inputs | ||||||||||||||||
| Assets | Level 1 | Level 2 | Level 3 | Total | ||||||||||||
| Large Cap Core ETF | ||||||||||||||||
| Common Stocks(a) | $ | 34,591,798 | $ | — | $ | — | $ | 34,591,798 | ||||||||
| Total | $ | 34,591,798 | $ | — | $ | — | $ | 34,591,798 | ||||||||
| Core Plus Bond ETF | ||||||||||||||||
| Asset Backed Securities | $ | — | $ | 15,100,532 | $ | — | $ | 15,100,532 | ||||||||
| Collateralized Mortgage Obligations | — | 842,379 | — | 842,379 | ||||||||||||
| Corporate Bonds | — | 43,508,844 | — | 43,508,844 | ||||||||||||
| Foreign Government Bonds | — | 1,062,409 | — | 1,062,409 | ||||||||||||
| Municipal Bonds | — | 7,405,214 | — | 7,405,214 | ||||||||||||
| Term Loans | — | 2,802,305 | — | 2,802,305 | ||||||||||||
| U.S. Government & Agencies | — | 37,147,309 | — | 37,147,309 | ||||||||||||
| Total | $ | — | $ | 107,868,992 | $ | — | $ | 107,868,992 | ||||||||
| International Equity ETF | ||||||||||||||||
| Common Stocks(a) | $ | 71,892,909 | $ | — | $ | — | $ | 71,892,909 | ||||||||
| Warrants | — | — | — | (b) | — | |||||||||||
| Rights | 484 | — | — | 484 | ||||||||||||
| Total | $ | 71,893,393 | $ | — | $ | — | $ | 71,893,393 | ||||||||
| Emerging Markets ETF | ||||||||||||||||
| Common Stocks(a) | $ | 27,183,342 | $ | — | $ | — | $ | 27,183,342 | ||||||||
| Total | $ | 27,183,342 | $ | — | $ | — | $ | 27,183,342 | ||||||||
| (a) | Refer to Schedule of Investments for sector classifications. |
| (b) | Constellation Software, Inc., is currently being fair valued according to the fair value procedures of the Adviser, as Valuation Designee, under oversight of the Board’s Pricing & Liquidity Committee. |
44
| OneAscent ETFs |
| Notes to the Financial Statements (continued) |
| August 31, 2023 |
NOTE 4. FEES AND OTHER TRANSACTIONS WITH AFFILIATES AND OTHER SERVICE PROVIDERS
The Adviser, under the terms of the management agreement with the Trust with respect to each Fund (each an “Agreement”), manages the Funds’ investments. As compensation for its management services, each Fund is obligated to pay the Adviser a management fee computed and accrued daily and paid monthly as follows:
| Large Cap | Core Plus | International | Emerging | |||||
| Core ETF | Bond ETF | Equity ETF | Markets ETF | |||||
| Management fee rate | 0.35% | 0.50% | 0.74% | 0.74% | ||||
| Management fees earned | $148,381 | $520,202 | $529,467 | $187,110 | ||||
| Management fees waived | $— | $— | $(115,720) | $(122,001) |
The Adviser has retained a sub-adviser to provide portfolio management and related services to the Core Plus Bond ETF. The Sub-Adviser receives a fee from the Adviser for these services.
The Adviser has contractually agreed to waive its management fee and/or reimburse expenses so that total annual operating expenses, excluding portfolio transaction and other investment-related costs (including brokerage fees and commissions); taxes; borrowing costs (such as interest and dividend expenses on securities sold short); acquired fund fees and expenses; fees and expenses associated with investments in other collective investment vehicles or derivative instruments (including for example option and swap fees and expenses); any administrative and/or shareholder servicing fees payable pursuant to a plan adopted by the Board; expenses incurred in connection with any merger or reorganization; extraordinary expenses (such as litigation expenses, indemnification of Trust officers and Trustees and contractual indemnification of Fund service providers); and other expenses that the Trustees agree have not been incurred in the ordinary course of the Funds’ business, do not exceed 1.00% of the Core Plus Bond ETF’s average daily net assets, 0.95% of the International Equity ETF’s average daily net assets and 1.25% of the Emerging Markets ETF’s average daily net assets. The contractual arrangements for the Funds are in place through December 31, 2023. These expense caps may not be terminated prior to this date except by the Board of Trustees upon sixty (60) days’ written notice to the Adviser and may not be terminated by the Adviser without the Board of Trustees’ consent. Prior to January 1, 2023, the Adviser had contractually agreed to waive its management fee and/or reimburse expenses so that total annual operating expenses did not exceed 1.00% of the Large Cap Core ETF’s average daily net assets.
Each fee waiver/expense payment by the Adviser is subject to recoupment by the Adviser from the applicable Fund in the three years following the date in which that particular waiver/expense payment occurred, but only if such recoupment can be achieved without exceeding the annual expense limitation in effect at the time of the waiver/expense payment and any expense limitation in effect at the time of the recoupment. The amounts subject to repayment by the Funds, pursuant to the aforementioned conditions are as follows:
| International | Emerging | |||
| Recoverable Through | Equity ETF | Markets ETF | ||
| August 31, 2026 | $115,720 | $122,001 |
45
| OneAscent ETFs |
| Notes to the Financial Statements (continued) |
| August 31, 2023 |
Ultimus Fund Solutions, LLC (“Ultimus”) provides administration, fund accounting and transfer agent services to the Funds. The Funds pay Ultimus fees in accordance with the agreements for such services.
Northern Lights Compliance Services, LLC (“NLCS”), an affiliate of Ultimus, provides a Chief Compliance Officer to the Trust, as well as related compliance services, pursuant to a consulting agreement between NLCS and the Trust. Under the terms of such agreement, NLCS receives fees from the Funds, which are approved annually by the Board.
Under the terms of a Distribution Agreement with the Trust, Northern Lights Distributors, LLC (the “Distributor”) serves as principal underwriter to the Funds. The Distributor is a wholly-owned subsidiary of Ultimus. The Distributor is compensated by the Adviser (not the Funds) for acting as principal underwriter.
Certain officers and a Trustee of the Trust are also employees of Ultimus and such persons are not paid by the Funds for serving in such capacities.
The Board supervises the business activities of the Trust. Each Trustee serves as a trustee until termination of the Trust unless the Trustee dies, resigns, retires, or is removed. The Chair of the Board and more than 75% of the Trustees are “Independent Trustees,” which means that they are not “interested persons” as defined in the 1940 Act. The Independent Trustees review and establish compensation at least annually. Each Independent Trustee of the Trust receives annual compensation, which is an established amount paid quarterly per fund in the Trust at the time of the regular quarterly Board meetings. The Chair of the Board receives the highest compensation, commensurate with his additional duties and each Chair of a committee receives additional compensation as well. Independent Trustees also receive $1,000 for attending any special meeting that requires an in-person approval of a contract and $250 for the first hour and $200 for each additional hour for attending other special meetings. In addition, the Trust reimburses Independent Trustees for out-of-pocket expenses incurred in conjunction with attendance at meetings.
NOTE 5. PURCHASES AND SALES OF SECURITIES
For the fiscal year ended August 31, 2023, purchases and sales of investment securities, other than short-term investments, were as follows:
| U.S. | U.S. | |||||||||||||||
| Government | Government | |||||||||||||||
| Purchases | Sales | Purchases | Sales | |||||||||||||
| Large Cap Core ETF | $ | 42,306,037 | $ | 41,626,984 | $ | — | $ | — | ||||||||
| Core Plus Bond ETF | 36,395,622 | 42,183,066 | 102,651,556 | 86,846,225 | ||||||||||||
| International Equity ETF(a) | 9,280,916 | 13,319,831 | — | — | ||||||||||||
46
| OneAscent ETFs |
| Notes to the Financial Statements (continued) |
| August 31, 2023 |
| U.S. | U.S. | |||||||||||||||
| Government | Government | |||||||||||||||
| Purchases | Sales | Purchases | Sales | |||||||||||||
| Emerging Markets ETF(a) | 24,462,875 | 11,247,578 | — | — | ||||||||||||
For the fiscal year ended August 31, 2023, purchases and sales for in-kind transactions were as follows:
| Purchases | Sales | |||||||
| Large Cap Core ETF | $ | 4,258,677 | $ | 29,018,361 | ||||
| Core Plus Bond ETF | — | — | ||||||
| International Equity ETF(a) | 86,947,889 | 24,420,971 | ||||||
| Emerging Markets ETF(a) | 16,395,075 | 5,744,843 | ||||||
For the fiscal year ended August 31, 2023, the Funds incurred net realized gains on in-kind redemptions as follows:
| In-Kind | ||||
| Realized Gains | ||||
| Large Cap Core ETF | $ | 778,640 | ||
| Core Plus Bond ETF | — | |||
| International Equity ETF(a) | 4,649,412 | |||
| Emerging Markets ETF(a) | 917,362 | |||
| (a) | For the period September 14, 2022 (commencement of operations) to August 31, 2023. |
NOTE 6. CAPITAL SHARE TRANSACTIONS
Shares are not individually redeemable and may be redeemed by each Fund at NAV only in large blocks known as “Creation Units.” Shares are created and redeemed by the Large Cap Core ETF, International Equity ETF and Emerging Markets ETF only in Creation Unit size aggregations of 25,000 shares. Shares are created and redeemed by the Core Plus Bond ETF only in Creation Unit size aggregations of 50,000 shares. Only Authorized Participants or transactions done through an Authorized Participant are permitted to purchase or redeem Creation Units from a Fund. An Authorized Participant is either (i) a broker-dealer or other participant in the clearing process through the Continuous Net Settlement System of the National Securities Clearing Corporation or (ii) a Depository Trust Company participant and, in each case, must have executed a Participant Agreement with the Distributor. Such transactions are generally permitted on an in-kind basis, with a balancing cash component to equate the transaction to the NAV per share of a Fund on the transaction date. Cash
47
| OneAscent ETFs |
| Notes to the Financial Statements (continued) |
| August 31, 2023 |
may be substituted equivalent to the value of certain securities generally when they are not available in sufficient quantity for delivery, not eligible for trading by the Authorized Participant or as a result of other market circumstances. In addition, a Fund may impose transaction fees on purchases and redemptions of Fund shares to cover the custodial and other costs incurred by the Fund in effecting trades. A fixed fee payable to the Custodian may be imposed on each creation and redemption transaction regardless of the number of Creation Units involved in the transaction (“Fixed Fee”). Purchases and redemptions of Creation Units for cash or involving cash-in-lieu are required to pay an additional variable charge to compensate a Fund and its ongoing shareholders for brokerage and market impact expenses relating to Creation Unit transactions (“Variable Charge,” and together with the Fixed Fee, the “Transaction Fees”). For the fiscal year ended August 31, 2023, the Large Cap Core ETF, the Core Plus Bond ETF, the International Equity ETF and the Emerging Markets ETF received $9,500, $4,000, $14,000 and $14,850 in fixed fees, respectively. For the fiscal period ended August 31, 2023, the International Equity ETF and Emerging Markets ETF had variable charges of $1,448 and $3,571, respectively. The Transaction Fees for each Fund are listed in the table below:
| Variable | ||||
| Fixed Fee | Charge | |||
| Large Cap Core ETF | $500 | 2.00%* | ||
| Core Plus Bond ETF | $200 | 2.00%* | ||
| International Equity ETF | $1,000 | 2.00%* | ||
| Emerging Markets ETF | $1,350 | 2.00%* |
| * | The maximum Transaction Fee may be up to 2.00% of the amount invested. |
NOTE 7. FEDERAL TAX INFORMATION
At August 31, 2023, the net unrealized appreciation (depreciation) and tax cost of investments for tax purposes was as follows:
| Large Cap Core | Core Plus Bond | International | Emerging | |||||||||||||
| ETF | ETF | Equity ETF | Markets ETF | |||||||||||||
| Gross unrealized appreciation | $ | 3,633,210 | $ | 310,031 | $ | 9,395,160 | $ | 2,944,070 | ||||||||
| Gross unrealized depreciation | (1,099,878 | ) | (6,746,480 | ) | (1,215,151 | ) | (1,113,572 | ) | ||||||||
| Net unrealized appreciation (depreciation) on investments | $ | 2,533,332 | $ | (6,436,449 | ) | $ | 8,180,009 | $ | 1,830,498 | |||||||
| Tax cost of investments | $ | 32,058,466 | $ | 114,305,441 | $ | 63,713,384 | $ | 25,352,844 | ||||||||
48
| OneAscent ETFs |
| Notes to the Financial Statements (continued) |
| August 31, 2023 |
The tax character of distributions paid for the fiscal years ended August 31, 2023 and August 31, 2022 were as follows:
| Large Cap Core ETF | Core Plus Bond ETF | |||||||||||||||
| 2023 | 2022 | 2023 | 2022 | |||||||||||||
| Distributions paid from: | ||||||||||||||||
| Ordinary income(a) | $ | 223,290 | $ | 33,250 | $ | 3,867,785 | $ | 817,625 | ||||||||
| Total distributions paid | $ | 223,290 | $ | 33,250 | $ | 3,867,785 | $ | 817,625 | ||||||||
| International | Emerging | |||||||
| Equity ETF | Markets ETF | |||||||
| 2023 | 2023 | |||||||
| Distributions paid from: | ||||||||
| Ordinary income(a) | $ | 330,755 | $ | 9,360 | ||||
| Total distributions paid | $ | 330,755 | $ | 9,360 | ||||
At August 31, 2023, the components of accumulated earnings (deficit) on a tax basis were as follows:
| Large Cap | Core Plus Bond | |||||||
| Core ETF | ETF | |||||||
| Undistributed ordinary income | $ | 101,392 | $ | 431,267 | ||||
| Distributions payable | — | (371,420 | ) | |||||
| Accumulated capital and other losses | (8,391,341 | ) | (4,957,047 | ) | ||||
| Unrealized appreciation (depreciation) on investments | 2,533,332 | (6,436,449 | ) | |||||
| Total accumulated deficits | $ | (5,756,617 | ) | $ | (11,333,649 | ) | ||
| International | Emerging | |||||||
| Equity ETF | Markets ETF | |||||||
| Undistributed ordinary income | $ | 1,702,472 | $ | 884,222 | ||||
| Distributions payable | — | — | ||||||
| Accumulated capital and other losses | — | — | ||||||
| Unrealized appreciation on investments | 8,180,689 | 1,830,414 | ||||||
| Total accumulated earnings | $ | 9,883,161 | $ | 2,714,636 | ||||
The differences between book-basis and tax-basis unrealized appreciation (depreciation) are attributable primarily to: tax deferral of losses on wash sales, differences related to passive foreign investment companies and the return of capital adjustments from underlying investments.
As of August 31, 2023, the Large Cap Core ETF and Core Plus Bond ETF had short-term and long-term capital loss carryforwards available to offset future gains and not
49
| OneAscent ETFs |
| Notes to the Financial Statements (continued) |
| August 31, 2023 |
subject to expiration in the amount of $5,114,815, $3,276,526, $4,317,030 and $640,017, respectively.
NOTE 8. SECTOR RISK
If a Fund has significant investments in the securities of issuers within a particular sector, any development affecting that sector will have a greater impact on the value of the net assets of the Fund than would be the case if the Fund did not have significant investments in that sector. In addition, this may increase the risk of loss in the Fund and increase the volatility of the Fund’s NAV per share. For instance, economic or market factors, regulatory changes or other developments may negatively impact all companies in a particular sector, and therefore the value of a Fund’s portfolio will be adversely affected. As of August 31, 2023, the Large Cap Core ETF and Emerging Markets ETF had 38.31% and 31.45% of the value of its net assets invested in securities within the Technology sector, respectively.
NOTE 9. COMMITMENTS AND CONTINGENCIES
The Trust indemnifies its officers and Trustees for certain liabilities that may arise from their performance of their duties to the Trust or the Funds. Additionally, in the normal course of business, the Trust enters into contracts that contain a variety of representations and warranties which provide general indemnifications. The Trust’s maximum exposure under these arrangements is unknown, as this would involve future claims that may be made against the Trust that have not yet occurred.
NOTE 10. SUBSEQUENT EVENTS
Management of the Funds has evaluated the need for disclosures and/or adjustments resulting from subsequent events through the date at which these financial statements were issued. Based upon this evaluation, management has determined there were no items requiring adjustment of the financial statements or additional disclosure.
50
| Report of Independent Registered Public Accounting Firm |
To
the Shareholders of OneAscent ETFs and
Board of Trustees of Unified Series Trust
Opinion on the Financial Statements
We have audited the accompanying statements of assets and liabilities, including the schedules of investments, of OneAscent ETFs comprising the funds listed below (the “Funds”) as of August 31, 2023, the related statements of operations, the statements of changes in net assets, the related notes, and the financial highlights for each of the periods indicated below (collectively referred to as the “financial statements”). In our opinion, the financial statements present fairly, in all material respects, the financial position of each of the Funds as of August 31, 2023, the results of their operations, the changes in net assets, and the financial highlights for each of the periods indicated below in conformity with accounting principles generally accepted in the United States of America.
| Fund Name | Statements
of Operations |
Statements
of Changes in Net Assets |
Financial Highlights |
| OneAscent Large Cap Core ETF | For the year ended August 31, 2023 | For the year ended August 31, 2023 and the period from November 15, 2021 (commencement of operations) through August 31, 2022 | For the year ended August 31, 2023 and the period from November 15, 2021 (commencement of operations) through August 31, 2022 |
| OneAscent Core Plus Bond ETF | For the year ended August 31, 2023 | For the year ended August 31, 2023 and the period from March 30, 2022 (commencement of operations) through August 31, 2022 | For the year ended August 31, 2023 and the period from March 30, 2022 (commencement of operations) through August 31, 2022 |
| OneAscent
International Equity ETF and OneAscent Emerging Markets ETF |
For the period from September 14, 2022 (commencement of operations) through August 31, 2023 | ||
Basis for Opinion
These financial statements are the responsibility of the Funds’ management. Our responsibility is to express an opinion on the Funds’ financial statements based on our audits. We are a public accounting firm registered with the Public Company Accounting Oversight Board (United States) (“PCAOB”) and are required to be independent with respect to the Funds in accordance with the U.S. federal securities laws and the applicable rules and regulations of the Securities and Exchange Commission and the PCAOB.
51
| Report of Independent Registered Public Accounting Firm (continued) |
We conducted our audits in accordance with the standards of the PCAOB. Those standards require that we plan and perform the audit to obtain reasonable assurance about whether the financial statements are free of material misstatement whether due to error or fraud.
Our audits included performing procedures to assess the risks of material misstatement of the financial statements, whether due to error or fraud, and performing procedures that respond to those risks. Such procedures included examining, on a test basis, evidence regarding the amounts and disclosures in the financial statements. Our procedures included confirmation of securities owned as of August 31, 2023, by correspondence with the custodian and brokers; when replies were not received from brokers, we performed other auditing procedures. Our audits also included evaluating the accounting principles used and significant estimates made by management, as well as evaluating the overall presentation of the financial statements. We believe that our audits provide a reasonable basis for our opinion.
We have served as the Funds’ auditor since 2022.
COHEN & COMPANY, LTD.
Chicago, Illinois
October 27, 2023
52
| Liquidity Risk Management Program (Unaudited) |
The Trust has adopted and implemented a written liquidity risk management program (the “Program”) as required by Rule 22e-4 (the “Liquidity Rule”) under the 1940 Act. The Program is reasonably designed to assess and manage the liquidity risk of each individual series of the Trust (each a “Fund” and collectively, the “Funds”), taking into consideration, among other factors, each Fund’s investment strategy and the liquidity of its portfolio investments during normal and reasonably foreseeable stressed conditions; its short and long- term cash flow projections; and its cash holdings and access to other funding sources. The Board approved the appointment of the Liquidity Administrator Committee, comprising certain Trust officers and employees of the Adviser. The Liquidity Administrator Committee maintains Program oversight and reports to the Board on at least an annual basis regarding the Program’s operational effectiveness through a written report (the “Report”). The Program’s most recent report, which was presented to the Board for consideration at its meeting held on August 14-15, 2023, outlined the operation of the Program and the adequacy and effectiveness of the Program’s implementation. During the review period, the Funds did not experience unusual stress or disruption to their operations related to purchase and redemption activity. Also, during the review period each Fund held adequate levels of cash and highly liquid investments to meet shareholder redemption activities in accordance with such Fund’s prospectus and within the requirements of the 1940 Act. The Report concluded that the Program is reasonably designed to prevent violation of the Liquidity Rule and has been effectively implemented.
53
| Summary of Fund Expenses (Unaudited) |
As a shareholder of a Fund, you incur two types of costs: (1) transaction costs and (2) ongoing costs, including management fees and other Fund expenses. These examples are intended to help you understand your ongoing costs (in dollars) of investing in each Fund and to compare these costs with the ongoing costs of investing in other mutual funds. You may pay brokerage commissions on purchases and sales of exchange-traded fund shares, which are not reflected in the example. Each Fund’s example is based on an investment of $1,000 invested at the beginning of the period and held for the entire period from March 1, 2023 through August 31, 2023.
Actual Expenses
The first line of the table below provides information about actual account values and actual expenses. You may use the information in this line, together with the amount you invested, to estimate the expenses that you paid over the period. Simply divide your account value by $1,000 (for example, an $8,600 account value divided by $1,000 = 8.6), then multiply the result by the number in the first line under the heading “Expenses Paid During Period” to estimate the expenses you paid on your account during this period.
Hypothetical Example for Comparison Purposes
The second line of the table below provides information about hypothetical account values and hypothetical expenses based on each Fund’s actual expense ratio and an assumed rate of return of 5% per year before expenses, which is not the Fund’s actual return. The hypothetical account values and expenses may not be used to estimate the actual ending account balance or expenses you paid for the period. You may use this information to compare the ongoing costs of investing in the Funds and other funds. To do so, compare this 5% hypothetical example with the 5% hypothetical examples that appear in the shareholder reports of other funds.
Expenses shown in the table are meant to highlight your ongoing costs only and do not reflect any transactional costs. Therefore, the second line of the table below is useful in comparing ongoing costs only and will not help you determine the relative total costs of owning different funds. In addition, if transaction costs were included, your costs would have been higher.
54
| Summary of Fund Expenses (Unaudited) (continued) |
| Beginning | Ending | ||||||||||
| Account | Account | Expenses | |||||||||
| Value | Value | Paid | Annualized | ||||||||
| March 1, | August 31, | During | Expense | ||||||||
| 2023 | 2023 | Period(a) | Ratio | ||||||||
| OneAscent Large Cap Core ETF | |||||||||||
| Actual | $1,000.00 | $1,079.50 | $ | 5.07 | 0.97% | ||||||
| Hypothetical(b) | $1,000.00 | $1,020.33 | $ | 4.92 | 0.97% | ||||||
| OneAscent Core Plus Bond ETF | |||||||||||
| Actual | $1,000.00 | $1,008.80 | $ | 3.86 | 0.76% | ||||||
| Hypothetical(b) | $1,000.00 | $1,021.36 | $ | 3.89 | 0.76% | ||||||
| OneAscent International Equity ETF | |||||||||||
| Actual | $1,000.00 | $1,063.20 | $ | 4.94 | 0.95% | ||||||
| Hypothetical(b) | $1,000.00 | $1,020.42 | $ | 4.84 | 0.95% | ||||||
| OneAscent Emerging Markets ETF | |||||||||||
| Actual | $1,000.00 | $1,032.20 | $ | 6.40 | 1.25% | ||||||
| Hypothetical(b) | $1,000.00 | $1,018.90 | $ | 6.36 | 1.25% | ||||||
| (a) | Expenses are equal to the Fund’s annualized expense ratios, multiplied by the average account value over the period, multiplied by 184/365 (to reflect the one-half year period). |
| (b) | Hypothetical assumes 5% annual return before expenses. |
55
| Additional Federal Income Tax Information (Unaudited) |
The Form 1099-DIV you receive in January 2024 will show the tax status of all distributions paid to your account in calendar year 2023. Shareholders are advised to consult their own tax adviser with respect to the tax consequences of their investment in the Funds. As required by the Internal Revenue Code and/or regulations, shareholders must be notified regarding the status of qualified dividend income for individuals and the dividends received deduction for corporations.
Qualified Dividend Income. The Funds designate the following percentage or up to the maximum amount of such dividends allowable pursuant to the Internal Revenue Code, as qualified dividend income eligible for the reduced tax rate.
| Large Cap Core | Core Plus Bond | International | Emerging Markets | |||||
| ETF | ETF | Equity ETF | ETF | |||||
| Qualified Dividend Income | 100% | 1% | 72% | 33% |
Qualified Business Income. The Funds designate the following percentage of ordinary income dividends, or up to the maximum amount of such dividends allowable pursuant to the Internal Revenue Code, as qualified business income.
| Large Cap Core | Core Plus Bond | International | Emerging Markets | |||||
| ETF | ETF | Equity ETF | ETF | |||||
| Qualified Business Income | —% | —% | —% | —% |
Dividends Received Deduction. Corporate shareholders are generally entitled to take the dividends received deduction on the portion of the Funds’ dividend distribution that qualifies under tax law. For the Funds’ calendar year 2023 ordinary income dividends, the following percentage qualifies for the corporate dividends received deduction.
| Large Cap Core | Core Plus Bond | International | Emerging Markets | |||||
| ETF | ETF | Equity ETF | ETF | |||||
| Dividends Received Deduction | 100% | 1% | —% | —% |
The Funds designate the following amounts as long-term capital gains distributions. The amounts designated may not agree with long-term capital gains in the tax character of distribution table due to utilization of earnings and profits distributed to shareholders on redemption of shares.
| Large Cap Core | Core Plus Bond | International | Emerging Markets | |||||
| ETF | ETF | Equity ETF | ETF | |||||
| Long-Term Capital Gains Distributions | $— | $— | $— | $— |
Foreign Tax Credit Pass Through. The Funds intend to elect to pass through to shareholders the income tax credit for taxes paid to foreign countries. The International Equity ETF and Emerging Market ETF foreign source income per share was $0.80 and $0.67 and the foreign tax expense per share was $0.08 and $0.10, respectfully.
56
| Trustees and Officers (Unaudited) |
GENERAL QUALIFICATIONS. The Board supervises the business activities of the Trust. Each Trustee serves as a trustee until termination of the Trust unless the Trustee dies, resigns, retires, or is removed. The Chair of the Board and more than 75% of the Trustees are “Independent Trustees”, which means that they are not “interested persons” (as defined in the 1940 Act) of the Trust or any adviser, sub-adviser or distributor of the Trust.
The following table provides information regarding the Independent Trustees.
| Name,
Address*, (Year of Birth), Position with Trust**, Term of Position with Trust |
Principal
Occupation During Past 5 Years and Other Directorships |
| Daniel
J. Condon (1950) Chair, May 2022 to present; Chair of the Audit Committee; Chair of the Governance & Nominating Committee, May 2020 to May 2022; Independent Trustee, December 2002 to present |
Current: Retired (2017 – present).
Previous: Peak Income Plus Fund (May 2022 – February 2023). |
| Kenneth
G.Y. Grant (1949) Chair of the Governance & Nominating Committee, May 2022 to present; Chair, January 2017 to May 2022; Independent Trustee, May 2008 to present |
Current: Director, Standpoint Multi-Asset (Cayman) Fund, Ltd. (2019 – present); Director, Advisors Charitable Gift Fund (2020 – present), a Donor Advised Fund; Trustee. Trustee, Peak Income Plus Fund (May 2022 – present).
Previous: EVP, Benefit Plans Administrative Services, Inc., provider of retirement benefit plans administration (2019 – 2020); Director, Northeast Retirement Services (NRS) LLC, a transfer agent and fund administrator; and Director, Global Trust Company (GTC), a non-depository trust company sponsoring private investment products (2003 – 2019); EVP, NRS (2003 – 2019); GTC, EVP (2008 – 2019); EVP, Savings Banks Retirement Association (2003 – 2019), provider of qualified retirement benefit plans. |
| Ronald
C. Tritschler (1952) Chair of the Audit Committee, May 2022 to present; Independent Trustee, January 2007 to present; Interested Trustee, December 2002 to December 2006 |
Current: Chief Executive Officer, Director and Legal Counsel of The Webb Companies, a national real estate company, (2001– present); Director, Standpoint Multi-Asset (Cayman) Fund, Ltd. (2020 – present); Director of First State Bank of the Southeast (2000 – present).
Previous: Trustee, Peak Income Plus Fund (May 2022 – February 2023). |
57
| Trustees and Officers (Unaudited) (continued) |
| Catharine
B. McGauley (1977) Chair of the Pricing & Liquidity Committee, November 2022 to present; Independent Trustee, September 2022 to present |
Current: Lead Portfolio Manager of Atlantic Charter Insurance, a workers’ compensation insurer, (2010 – present); Investment Advisor for a Family Office (2015 – present); Senior Analyst/Advisor for a Boston real estate company and related family (2010 – present).
Previous: Trustee, Peak Income Plus Fund (May 2022 – February 2023). |
| Freddie
Jacobs, Jr. (1970) Independent Trustee, September 2022 to present |
Current: Chief Operating Officer and Chief Risk Officer Northeast Retirement Services LLC (NRS), and its subsidiary, Global Trust Company (GTC). NRS is a transfer agent and fund administrator, GTC is a non- depository trust company sponsoring private investment products (2021 – present); Chair, Board of Crispus Attucks Fund (2020 – present); Board Member of Camp Harbor View (2020 – present); Director, Sportsmen’s Tennis and Education Center (2019 – present).
Previous: SVP, Senior Risk Officer NRS (2013 – 2021); Trustee, Peak Income Plus Fund (May 2022 – February 2023); Trustee of Buckingham Browne & Nichols (2017 - June 2023). |
| * | The address for each Trustee is 225 Pictoria Drive, Suite 450, Cincinnati, Ohio 45246. |
| ** | As of the date of this report, the Trust consists of 29 series. |
The following table provides information regarding the Interested Trustees and Officers of the Trust.
| Name,
Address*, (Year of Birth), Position with Trust, Term of Position with Trust |
Principal
Occupation During Past 5 Years and Other Directorships |
| David
R. Carson (1958) Interested Trustee, August 2020 to present; President, January 2016 to August 2021 |
Current: Retired (2023 – present); Interested Trustee, Mammoth Institutional Credit Access Fund and Mammoth Institutional Equity Access Fund (November 2022 – present); Interested Trustee, Peak Income Plus Fund (May 2022 – present).
Previous: Interested Trustee of Ultimus Managers Trust, (January 2021 – April 2023); Senior Vice President Client Strategies of Ultimus Fund Solutions, LLC, (2013 – April 2023). |
58
| Trustees and Officers (Unaudited) (continued) |
| Martin
R. Dean (1963) President, August 2021 to present; Vice President, November 2020 to August 2021; Chief Compliance Officer, April 2021 to August 2021; Assistant Chief Compliance Officer, January 2016 to April 2021 |
Current: President, Northern Lights Compliance Services (2023 – present).
Previous: Senior Vice President, Head of Fund Compliance of Ultimus Fund Solutions, LLC (2016 – January 2023). |
| Zachary
P. Richmond (1980) Treasurer and Chief Financial Officer, November 2014 to present |
Current: Vice President, Director of Financial Administration for Ultimus Fund Solutions, LLC, (2015 – present). |
| Gweneth
K. Gosselink (1955) Chief Compliance Officer, August 2021 to present |
Current: Assistant Vice President, Senior Compliance Officer of Ultimus Fund Solutions, LLC, since 2019.
Previous: Chief Operating Officer & CCO at Miles Capital, Inc. (2013 – 2019). |
| Elisabeth
Dahl (1962) Secretary, May 2017 to present; Assistant Secretary, March 2016 to May 2017 |
Current: Attorney, Ultimus Fund Solutions, LLC since March 2016. |
| Timothy
J. Shaloo (1970) AML Compliance Officer, August 2023 to present |
Current: Senior Compliance Analyst, Northern Lights Compliance Services, LLC (2021 - present).
Previous: Compliance Specialist, Ultimus Fund Solutions,LLC (2016 - 2020). |
| * | The address for each Officer is 225 Pictoria Drive, Suite 450, Cincinnati, Ohio 45246. |
| Other Information (Unaudited) |
The Funds’ Statement of Additional Information (“SAI”) includes additional information about the trustees and is available without charge, upon request. You may call toll-free at (800) 222-8274 to request a copy of the SAI or to make shareholder inquiries.
59
| Investment Advisory Agreement Approval (Unaudited) |
The OneAscent Core Plus Bond ETF (“OACP”) and the OneAscent Large Cap Core ETF (“OALC”) (each a “Fund” and together, the “Funds”) are series of Unified Series Trust (the “Trust”). The Trust’s Board of Trustees (the “Board” or “Trustees”) oversees the management of the Funds and, as required by law, has considered the renewal of each Fund’s management agreement with its investment adviser, OneAscent Investment Solutions, LLC (“OneAscent”) and OneAscent’s sub-advisory agreement with Teachers Advisors, LLC (“TAL”) on behalf of OACP. In connection with such approvals, the Board requested and evaluated all information that the Trustees deemed reasonably necessary under the circumstances.
The Trustees held a teleconference on May 10, 2023 to review and discuss materials compiled by Ultimus Fund Solutions, LLC, the Trust’s administrator, with regard to the management agreements between the Trust and OneAscent and the sub-advisory agreement between OneAscent and TAL. At the Trustees’ quarterly meeting held in May 2023, the Board interviewed certain executives of OneAscent, including OneAscent’s President, Director of Portfolio Strategy, Chief Equity Strategist & Senior Portfolio Manager, Director of Private Markets & Impact Advocacy, Portfolio Operations Specialist, and Chief Compliance Officer. The Board also interviewed certain executives of TAL. After discussion, the Trustees, including the Trustees who are not “interested persons” (as that term is defined in the Investment Company Act of 1940) of the Trust, OneAscent or TAL (the “Independent Trustees”), approved the renewal of the management agreements between the Trust and OneAscent and the sub-advisory agreement between OneAscent and TAL, each for an additional year. The Trustees’ renewal of each Fund’s management agreement and the sub-advisory agreement was based on a consideration of all the information provided to the Trustees and was not the result of any single factor. Some of the factors that figured particularly in the Trustees’ deliberations are described below, although individual Trustees may have evaluated this information differently, ascribing different weights to various factors.
(i) The Nature, Extent, and Quality of Services. The Trustees reviewed and considered information regarding the nature, extent, and quality of services that OneAscent provides to the Funds, as well as the services TAL provides to OACP, which include, but are not limited to, providing a continuous investment program, adhering to investment restrictions, complying with the Trust’s policies and procedures, and voting proxies. The Trustees considered the qualifications and experience of OneAscent’s portfolio manager who is responsible for the day-to-day management of OALC’s portfolio, as well as the qualifications and experience of TAL’s portfolio managers who are responsible for the day-to-day management of OACP’s portfolio. The Trustees considered the qualifications and experience of the other individuals at OneAscent and TAL who service the Funds. They reviewed additional information provided by TAL, including audited financial information, Fund metrics and the CCO’s compliance review, which they discussed with TAL representatives, the CCO and others from the Fund administrator. They discussed the Trust CCO’s compliance review of OneAscent’s compliance program. The Trustees concluded that they are satisfied with the nature, extent, and high quality of investment management services provided by each of OneAscent and TAL to the Funds.
(ii) Fund Performance. The Trustees next reviewed and discussed each Fund’s performance for periods ended February 28, 2023. The Trustees observed that OALC had outperformed the Morningstar Large Blend category, its peer group, and its benchmark, the Russell 1000 Index, for the one-year period but underperformed its Morningstar category and peer group for the since-inception
60
| Investment Advisory Agreement Approval (Unaudited) (continued) |
period. The Trustees noted that OALC outperformed its benchmark over the since-inception period. The Trustees acknowledged that OneAscent attributed the Fund’s early underperformance to the overall market conditions. The Trustees also noted that the Fund outperformed a separate account managed by OneAscent with a similar investment strategy over the one-year period, but that it underperformed for the since-inception period. It was the consensus of the Trustees that it was reasonable to conclude that OneAscent has the ability to manage the Fund successfully from a performance standpoint.
The Trustees next observed that OACP outperformed the Morningstar Intermediate Core Plus Bond category, its peer group, and its benchmark, the Bloomberg U.S. Aggregate Bond Index, for the since-inception period beginning March 30, 2022 and ended February 28, 2023. It was the consensus of the Trustees that it was reasonable to conclude that OneAscent and TAL have the ability to manage OACP successfully from a performance standpoint.
(iii) Fee Rate and Profitability. The Trustees noted that the OALC’s management fee is lower than the medians and averages of its Morningstar category and peer group. The Trustees noted that the OALC’s net expenses are higher than the medians and averages of its Morningstar category and peer group. The Trustees acknowledged that OneAscent attributed the higher fees to the additional resources required to implement the faith-based components of the Fund’s strategy. The Trustees noted that OALC’s management fee is lower than the management fee charged to OneAscent’s separate account, but that OALC’s net expenses are higher than the net expenses of the separate account. The Trustees noted that OACP’s management fee and net expenses are higher than the medians and averages of its Morningstar category and peer group. The Board considered that the faith-based component of OACP’s strategy was unique among the strategies of the funds in its Morningstar category and that more resources were generally required to execute such strategy. The Trustees considered profitability analyses prepared by OneAscent for its management of each Fund, which indicated that, before deduction of marketing expenses, OneAscent is not earning a profit as a result of managing either Fund.
The Trustees considered other potential benefits that OneAscent or TAL may receive in connection with management of each Fund. The Trustees determined that the services provided to OACP are not duplicative as between adviser and sub-adviser. After considering the above information, the Trustees concluded that the management fee for each Fund, and the sub-advisory fee for OACP, represent reasonable compensation in light of the nature and quality of services to each Fund.
(iv) Economies of Scale. In determining the reasonableness of the management fees, and sub-advisory fee for OACP, the Trustees also considered that OneAscent is not yet profitable and the extent to which OneAscent or TAL may realize economies of scale as each Fund grows larger. The Trustees noted that TAL’s fees already include breakpoints. The Trustees determined that, in light of the current size of each Fund and the brief period since launch, it is premature to reduce the management fees or introduce breakpoints in the management fees at this time.
61
| PROXY VOTING |
A description of the policies and procedures that each Fund uses to determine how to vote proxies relating to portfolio securities and information regarding how each Fund voted those proxies during the most recent twelve month period ended June 30, are available (1) without charge upon request by calling the Funds at (800) 222-8274 and (2) in Fund documents filed with the SEC on the SEC’s website at www.sec.gov.
| TRUSTEES
Daniel J. Condon, Chair David R. Carson Kenneth G.Y. Grant Freddie Jacobs, Jr. Catharine B. McGauley Ronald C. Tritschler |
INDEPENDENT
REGISTERED PUBLIC ACCOUNTING FIRM Cohen & Company, Ltd. 151 North Franklin Street, Suite 575 Chicago, IL 60606 |
| OFFICERS
Martin R. Dean, President Gweneth K. Gosselink, Chief Compliance Officer Zachary P. Richmond, Treasurer and Chief Financial Officer |
LEGAL
COUNSEL Thompson Hine LLP 312 Walnut Street, 20th Floor Cincinnati, OH 45202 |
| INVESTMENT
ADVISER OneAscent Investment Solutions, LLC 23 Inverness Center Parkway Birmingham, AL 35242 |
CUSTODIAN
AND TRANSFER AGENT Brown Brothers Harriman & Co. 50 Post Office Square Boston, MA 02110 |
| DISTRIBUTOR
Northern Lights Distributors, LLC 4221 North 203rd Street, Suite 100 Elkhorn, NE 68022 |
ADMINISTRATOR
AND FUND ACCOUNTANT Ultimus Fund Solutions, LLC 225 Pictoria Drive, Suite 450 Cincinnati, OH 45246 |
This report is intended only for the information of shareholders or those who have received the Funds’ prospectus which contains information about the Funds’ management fee and expenses. Please read the prospectus carefully before investing.
Distributed by Northern Lights Distributors, LLC, Member FINRA/SIPC
OneAscent-AR-23
| (b) | Not applicable. |
Item 2. Code of Ethics.
As of the end of the period covered by this report, the registrant has adopted a code of ethics that applies to the registrant’s principal executive officer, principal financial officer, principal accounting officer or controller, or persons performing similar functions, regardless of whether these individuals are employed by the registrant or a third party. Pursuant to Item 12(a)(1), a copy of registrant’s code of ethics is filed as an exhibit to this Form N-CSR. During the period covered by this report, the code of ethics has not been amended, and the registrant has not granted any waivers, including implicit waivers, from the provisions of the code of ethics.
Item 3. Audit Committee Financial Expert.
(a) The registrant’s board of trustees has determined that the registrant does not have an audit committee financial expert. The committee members and the full Board considered a possibility of adding a member that would qualify as an expert. The audit committee determined that, although none of its members meet the technical definition of an audit committee expert, the committee has sufficient financial expertise to adequately perform its duties under the Audit Committee Charter without the addition of a qualified expert.
Item 4. Principal Accountant Fees and Services.
| (a) | Audit Fees | ||
| Tactical Multi-Purpose Fund: | FY 2023 | $7,950 | |
| FY 2022 | $7,950 | ||
| FIIG Retirement Funds | FY 2023 | $60,600 | |
| FY 2022 | $60,600 | ||
| FIIG US Small Cap Equity Fund | FY 2023 | $14,600 | |
| FY 2022 | $14,600 | ||
| FIIG All Foreign Equity Environmental and Social Values Fund | FY 2023 | $15,150 | |
| FY 2022 | $15,150 | ||
| FIIG US Large Cap Equity Environmental and Social Values Fund | FY 2023 | $14,600 | |
| FY 2022 | $14,600 | ||
| OneAscent Large Cap Core ETF: | FY 2023 | $15,150 | |
| FY 2022 | $0 | ||
| OneAscent Core Plus Bond ETF: | FY 2023 | $15,700 | |
| FY 2022 | $0 | ||
| OneAscent Emerging Markets ETF: | FY 2023 | $16,150 | |
| OneAscent International Equity ETF: | FY 2023 | $16,150 |
| (b) | Audit-Related Fees | ||
| Tactical Multi-Purpose Fund: | FY 2023 | $0 | |
| FY 2022 | $0 | ||
| FIIG Retirement Funds | FY 2023 | $0 | |
| FY 2022 | $0 | ||
| FIIG US Small Cap Equity Fund | FY 2023 | $0 | |
| FY 2022 | $0 | ||
| FIIG All Foreign Equity Environmental and Social Values Fund | FY 2023 | $0 | |
| FY 2022 | $0 | ||
| FIIG US Large Cap Equity Environmental and Social Values Fund | FY 2023 | $0 | |
| FY 2022 | $0 | ||
| OneAscent Large Cap Core ETF: | FY 2023 | $0 | |
| OneAscent Core Plus Bond ETF: | FY 2023 | $0 | |
| OneAscent Emerging Markets ETF: | FY 2023 | $0 | |
| OneAscent International Equity ETF: | FY 2023 | $0 |
| (c) | Tax Fees | ||
| Tactical Multi-Purpose Fund: | FY 2023 | $3,300 | |
| FY 2022 | $3,300 | ||
| FIIG Retirement Funds | FY 2023 | $13,200 | |
| FY 2022 | $13,200 | ||
| FIIG US Small Cap Equity Fund | FY 2023 | $3,300 | |
| FY 2022 | $3,300 | ||
| FIIG All Foreign Equity Environmental and Social Values Fund | FY 2023 | $3,300 | |
| FY 2022 | $3,300 | ||
| FIIG US Large Cap Equity Environmental and Social Values Fund | FY 2023 | $3,300 | |
| FY 2022 | $3,300 | ||
| OneAscent Large Cap Core ETF: | FY 2023 | $3,300 | |
| OneAscent Core Plus Bond ETF: | FY 2023 | $3,300 | |
| OneAscent Emerging Markets ETF: | FY 2023 | $3,300 | |
| OneAscent International Equity ETF: | FY 2023 | $3,300 |
Nature of the fees: Preparation of the 1120 RIC and Excise review
| (d) | All Other Fees | ||
| Tactical Multi-Purpose Fund: | FY 2023 | $0 | |
| FY 2022 | $0 | ||
| FIIG Retirement Funds | FY 2023 | $0 | |
| FY 2022 | $0 | ||
| FIIG US Small Cap Equity Fund | FY 2023 | $0 | |
| FY 2022 | $0 | ||
| FIIG All Foreign Equity Environmental and Social Values Fund | FY 2023 | $0 | |
| FY 2022 | $0 | ||
| FIIG US Large Cap Equity Environmental and Social Values Fund | FY 2023 | $0 | |
| FY 2022 | $0 | ||
| OneAscent Large Cap Core ETF: | FY 2023 | $0 | |
| FY 2022 | $0 | ||
| OneAscent Core Plus Bond ETF: | FY 2023 | $0 | |
| FY 2022 | $0 | ||
| OneAscent Emerging Markets ETF: | FY 2023 | $0 | |
| OneAscent International Equity ETF: | FY 2023 | $0 |
| (e) | (1) | Audit Committee’s Pre-Approval Policies |
| The Audit Committee Charter requires the Audit Committee to be responsible for the selection, retention or termination of auditors and, in connection therewith, to (i) evaluate the proposed fees and other compensation, if any, to be paid to the auditors, (ii) evaluate the independence of the auditors, (iii) pre-approve all audit services and, when appropriate, any non-audit services provided by the independent auditors to the Trust, (iv) pre-approve, when appropriate, any non-audit services provided by the independent auditors to the Trust’s investment adviser, or any entity controlling, controlled by, or under common control with the investment adviser and that provides ongoing services to the Trust if the engagement relates directly to the operations and financial reporting of the Trust, and (v) receive the auditors’ specific representations as to their independence; | ||
| (2) | All of the services described in paragraphs (b) through (d) of Item 4 were pre-approved by the Audit Committee. |
(f) During audit of registrant’s financial statements for the most recent fiscal year, less than 50 percent of the hours expended on the principal accountant’s engagement were attributed to work performed by persons other than the principal accountant’s full-time, permanent employees.
(g) The aggregate non-audit fees billed by the registrant’s accountant for services rendered to the registrant, and rendered to the registrant’s investment adviser (not including any sub-adviser whose role is primarily portfolio management and is subcontracted with or overseen by another investment adviser), and any entity controlling, controlled by, or under common control with the adviser that provides ongoing services to the registrant:
| Registrant | Adviser | |
| FY 2023 | $0 | $0 |
| FY 2022 | $0 | $0 |
(h) Not applicable. The auditor performed no services for the registrant’s investment adviser or any entity controlling, controlled by, or under common control with the investment adviser that provides ongoing services to the registrant.
(i) Not applicable.
(j) Not applicable.
Item 5. Audit Committee of Listed Companies. NOT APPLICABLE – applies to listed companies only
Item 6. Schedule of Investments. Schedule filed with Item 1.
Item 7. Disclosure of Proxy Voting Policies and Procedures for Closed-End Management Investment Companies. NOT APPLICABLE – applies to closed-end funds only
Item 8. Portfolio Managers of Closed-End Investment Companies. NOT APPLICABLE – applies to closed-end funds only
Item 9. Purchases of Equity Securities by Closed-End Management Investment Company and Affiliated Purchasers. NOT APPLICABLE – applies to closed-end funds only
Item 10. Submission of Matters to a Vote of Security Holders.
The registrant has not adopted procedures by which shareholders may recommend nominees to the registrant’s board of trustees.
Item 11. Controls and Procedures.
(a) Based on their evaluation of the registrant’s disclosure controls and procedures (as defined in Rule 30a-3(c) under the Investment Company Act of 1940, as amended (the “Act”)) as of a date within 90 days of the filing date of this report, the registrant’s principal executive officer and principal financial officer have concluded that such disclosure controls and procedures are reasonably designed and are operating effectively to ensure that material information relating to the registrant is made known to them by others within those entities, particularly during the period in which this report is being prepared, and that the information required in filings on Form N-CSR is recorded, processed, summarized, and reported on a timely basis.
(b) There were no significant changes in the registrant’s internal control over financial reporting that occurred during the period covered by this report that have materially affected, or are reasonably likely to materially affect, the registrant’s internal control over financial reporting.
Item 12. Disclosure of Securities Lending Activities for Closed-End Investment Companies.
Not Applicable.
Item 13. Exhibits.
SIGNATURES
Pursuant to the requirements of the Securities Exchange Act of 1934 and the Investment Company Act of 1940, the registrant has duly caused this report to be signed on its behalf by the undersigned, thereunto duly authorized.
| (Registrant) | Unified Series Trust |
| By | /s/ Martin R. Dean |
| Martin R. Dean, President |
| Date | 11/2/2023 |
Pursuant to the requirements of the Securities Exchange Act of 1934 and the Investment Company Act of 1940, this report has been signed below by the following persons on behalf of the registrant and in the capacities and on the dates indicated.
| By | /s/ Martin R. Dean |
| Martin R. Dean, President |
| Date | 11/2/2023 |
| By | /s/ Zachary P. Richmond |
| Zachary P. Richmond, Treasurer |
| Date | 11/2/2023 |
ATTACHMENTS / EXHIBITS
Serious News for Serious Traders! Try StreetInsider.com Premium Free!
You May Also Be Interested In
- 2026 World Internet Conference Digital Silk Road Development Forum Opens in Xi'an, Shaanxi Province
- The 5 Best Luxury Villas in Split, Croatia
- Cardano Price Prediction: ADA Resistance Tests Divert Retail Attention to AlphaPepe’s $0.02202 Entry Window
Create E-mail Alert Related Categories
SEC FilingsSign up for StreetInsider Free!
Receive full access to all new and archived articles, unlimited portfolio tracking, e-mail alerts, custom newswires and RSS feeds - and more!