

Form N-CSR T. Rowe Price Intermedia For: Feb 28
 Tweet
Tweet Share
ShareUNITED STATES
SECURITIES AND EXCHANGE COMMISSION
Washington, D.C. 20549
FORM N-CSR
CERTIFIED SHAREHOLDER REPORT OF
REGISTERED
MANAGEMENT INVESTMENT COMPANIES
Investment Company Act File Number: 811-22968
| T. Rowe Price Intermediate Tax-Free High Yield Fund, Inc. |
|
|
| (Exact name of registrant as specified in charter) |
| 100 East Pratt Street, Baltimore, MD 21202 |
|
|
| (Address of principal executive offices) |
| David Oestreicher |
| 100 East Pratt Street, Baltimore, MD 21202 |
|
|
| (Name and address of agent for service) |
Registrant’s telephone number, including area
code: (410) 345-2000
Date of fiscal year end: February 28
Date of reporting period: February 28, 2018
 |
|
Intermediate Tax-Free High Yield Fund |
February 28, 2018 |
The views and opinions in this report were current as of February 28, 2018. They are not guarantees of performance or investment results and should not be taken as investment advice. Investment decisions reflect a variety of factors, and the managers reserve the right to change their views about individual stocks, sectors, and the markets at any time. As a result, the views expressed should not be relied upon as a forecast of the fund’s future investment intent. The report is certified under the Sarbanes-Oxley Act, which requires mutual funds and other public companies to affirm that, to the best of their knowledge, the information in their financial reports is fairly and accurately stated in all material respects.
REPORTS ON THE WEB
Sign up for our Email Program, and you can begin to receive updated fund reports and prospectuses online rather than through the mail. Log in to your account at troweprice.com for more information.
Manager’s Letter
Fellow Shareholders
Tax-free municipal bonds produced moderate gains but outperformed taxable bonds as Treasury yields increased in the 12-month period ended February 28, 2018. The Bloomberg Barclays Municipal Bond Index returned 2.50% versus 0.51% for the Bloomberg Barclays U.S. Aggregate Bond Index. Throughout most of our fiscal year, municipal securities were supported by strong demand and limited issuance. However, there was a surge of new supply in late 2017, as municipalities accelerated issuance amid uncertainty surrounding tax reform and its possible impact on municipal bonds. The T. Rowe Price Tax-Free Funds generally performed in line with their benchmarks over the last year, and their longer-term relative performance remains favorable.
ECONOMY AND INTEREST RATES
According to the most recent estimate, the U.S. economy expanded at a solid 2.5% annual rate in the fourth quarter of 2017, in line with the average over the first three quarters of the year. The U.S. labor market has been healthy, with the national unemployment rate holding at a 17-year low of 4.1% in the last few months. Inflation, while still low, is rising from its mid-2017 low and is likely to increase further in 2018 amid rising wages and expectations for stronger economic growth.
Citing the strengthening labor market and expectations that inflation would move higher over the medium term, the Federal Reserve raised short-term interest rates three times over the last year, lifting the federal funds target rate to a range of 1.25% to 1.50% by the end of February 2018. After our reporting period ended, the Fed raised rates again at its March 20–21 monetary policy meeting. At present, the central bank is expected to raise rates at least two more times in 2018. Additionally, in October 2017, the Fed began the process of slowly unwinding its $4.5 trillion balance sheet, a legacy of its massive purchases of Treasury bonds and mortgage-backed securities in the aftermath of the 2008 financial crisis, by slowing reinvestment of principal payments from its holdings.
In the closing months of our reporting period, the 10-year Treasury note yield climbed to a four-year high in anticipation of faster economic growth and higher inflation stemming from tax cuts, increased government spending, and stronger wage growth. Yields on short- and intermediate-term municipal securities also increased over the last year, as the Fed continued to gradually reverse its highly accommodative monetary policy. Long-term yields rose only slightly as the yields on 30-year municipal bonds rated AAA were virtually unchanged from 12 months ago. The result was a flatter municipal yield curve. At the end of February, high-quality 30-year muni yields were modestly lower than the 30-year Treasury yield but still offered relative value for many fixed income investors on an after-tax basis.
As an illustration of their relative attractiveness, on February 28, 2018, the 3.06% yield offered by a 30-year tax-free general obligation (GO) bond rated AAA was about 98% of the 3.13% pretax yield offered by a 30-year Treasury bond. Including the 3.8% net investment income tax that took effect in 2013 as part of the Affordable Care Act (ACA), the top marginal federal tax rate (after tax reform) stood at 40.8%. An investor in this tax bracket would need to invest in a taxable bond of similar credit quality and maturity yielding about 5.17% to receive the same after-tax income as that generated by the municipal bond. (To calculate a municipal bond’s taxable-equivalent yield, divide the yield by the quantity of 1.00 minus your federal tax bracket expressed as a decimal—in this case, 1.00–0.408, or 0.592.)


MUNICIPAL MARKET NEWS
According to The Bond Buyer, total municipal bond issuance in 2017 was approximately $436 billion, about 3% lower than 2016’s record total. Supply spiked in the fourth quarter as issuers rushed to bring new deals ahead of any potential tax law changes, but mostly positive fund flows helped absorb the new supply. The quarter was marked by concerns that the new tax law would no longer allow the tax-exempt issuance of private activity bonds (PABs), which can be used to fund projects such as hospitals and airports. Ultimately, the new tax law eliminated advance refundings, which had allowed issuers to refinance existing debt with new bonds, but PAB issuers retained their ability to issue tax-exempt debt. Issuance in the first two months of 2018 was meager because municipalities had accelerated a substantial amount of planned 2018 issuance into late 2017.
Generally, fundamentals for municipal issuers remain solid, and most issuers in the $3.8 trillion municipal bond market have been fiscally responsible. State and local governments, in general, have been cautious about adding to indebtedness since the 2008–2009 financial crisis, and a strengthening economy has helped tax revenues rebound. Over 60% of the market, as measured by the Bloomberg Barclays Municipal Bond Index, is AAA or AA rated.
Although the market is overwhelmingly high quality, many states and municipalities are grappling with underfunded pensions and other post-employment benefit (OPEB) obligations. New reporting rules from the Governmental Accounting Standards Board are bringing greater transparency to state and local governments’ pension funding gaps, long-term risks that investors often overlooked in the past.
Bonds from some troubled municipal issuers, such as Illinois and New Jersey, outperformed the broad municipal market over the last 12 months, as their higher yields attracted investors. In October, Illinois issued a total of $6 billion of new bonds to help pay a portion of the backlog of bills it ran up during its multiyear budget standoff that was finally resolved in July 2017. Illinois has the lowest credit rating of any state and was teetering on the verge of a downgrade to the below investment-grade category before passing a budget.
Puerto Rico’s debt remained under pressure, and its long path to recovery was derailed by the catastrophic damage caused by Hurricane Maria last September. Even before the storm, Puerto Rico was in bankruptcy as the financial oversight board had filed petitions with the U.S. District Court seeking help with what could amount to the largest restructuring of municipal debt in U.S. history.
Longer-term municipal bonds outperformed shorter-term securities over the last year, and lower-quality debt generally outpaced higher-quality issues as investors sought higher yields. Most major segments of the municipal market generated positive returns. Revenue bonds outperformed general obligation debt, but prerefunded bonds were flat as rising short-term yields offset income. All subsectors of investment-grade revenue bonds produced positive returns, led by industrial/ pollution control, hospital, and leasing revenue debt, while the special tax and power subsectors lagged the broader index return. High yield tobacco debt outperformed other municipal segments, returning more than 7% during our fiscal year.
PORTFOLIO STRATEGY
TAX-EXEMPT MONEY FUND
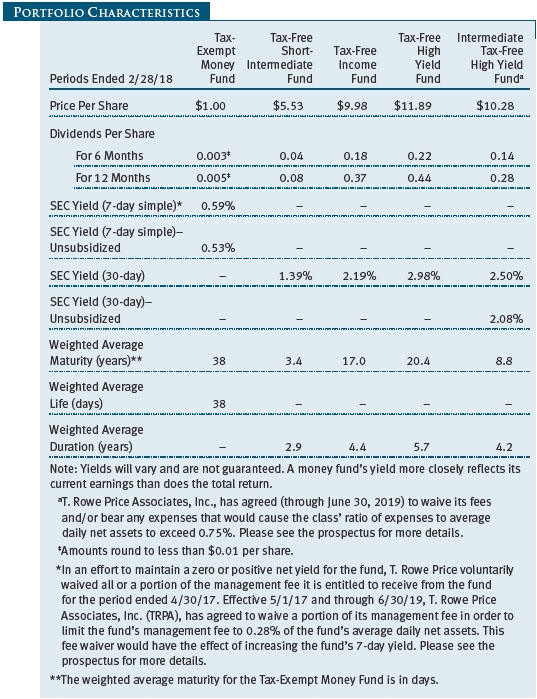
The fund returned 0.56% during the 12 months ended February 28, 2018, compared with 0.58% for the Lipper Tax-Exempt Money Market Funds Index. (Performance varies for the I Class shares, reflecting their different fee structure.)

After both tax reform and a debt ceiling resolution, the money market focused once again on interest rates, market volatility, the economy, and, of course, the intentions of the Fed. New leadership at the Federal Open Market Committee brings with it some uncertainties about the pace of expected rate increases as well as how far the Fed can tighten policy without bringing about an end of the current market cycle. Currently, the market is expecting three interest rate increases this year, including the rate hike in March. The municipal money market—heavily influenced by the technical forces of supply and demand—has yet to fully reflect this broader sentiment in its pricing.

Our focus in the management of the fund brings together these two themes—expectations for continued tightening by the Fed, and the changing supply/demand framework in the municipal money market, which often marches to the beat of a different drummer. Further complicating the near-term outlook is the question of what impact, if any, tax reform will have on the municipal money market. Lower marginal tax rates suggest that, going forward, the relationship of tax-exempt interest rates to taxable rates must change. Changes in markets and behaviors can take time to play out, however, and we have yet to see evidence of them.
After years of central bank-induced rate and volatility suppression, rates were on the move and market volatility returned. Overall levels of short-term municipal rates moved higher since our last report, though the impact of Fed rate increases and balance sheet normalization, along with increased Treasury debt issuance, have yet to be fully felt in the municipal money market. The factors limiting upside movement in municipal rates included lower supply, interest from nontraditional buyers of short-term municipal paper, and favorable tax relationships through much of 2017. We expect these various factors to slowly dissipate in importance as we move through 2018. Seven-day yields averaged 1.04% since our last report six months ago compared with an average of 0.81% for the prior six months. One-year yields ended the period at 1.37% compared with 0.91% at the end of August. Longer-maturity rates remained somewhat expensive compared with historical averages and did not fully reflect our expectations for multiple rate increases in 2018. We expect an uptick in longer-term supply to force a repricing to higher yields in the near future.
Given our expectation for increasing interest rates through 2018 and into 2019, we concentrated on building positions in the short-maturity end of the money market yield curve while awaiting price adjustments in longer maturities. We increased exposure to commercial paper with maturities of 60 to 90 days, allowing us to avoid what we deemed as overly expensive levels in longer maturities. This strategy has worked well thus far, giving us the opportunity to quickly adjust as the yield curve rights itself.
Credit quality continues to play a significant part in asset selection for the fund. As a policy, we favor securities in highly rated sectors, such as hospitals and education, as well as GO debt. Some prominent positions in the portfolio include Trinity Health, Harris County, Texas, and Charles County School District. (Please refer to the fund’s portfolio of investments for a complete list of holdings and the amount each represents in the portfolio.)

Going forward, we expect a continuation of recent Fed policy. Barring some exogenous shock, at least three rate increases of 25 basis points each are likely in 2018. Our investing strategy and fund positioning will reflect that rising rate outlook. Investors should expect rising yields on their money fund investments as the Fed gradually normalizes interest rates.
TAX-FREE SHORT-INTERMEDIATE FUND
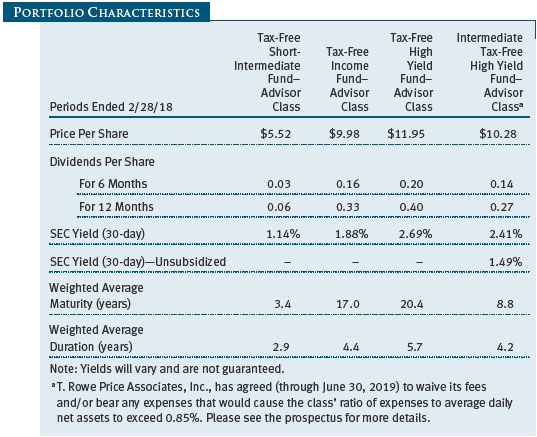
The fund returned 0.46% during the 12-month reporting period versus 0.52% for the Lipper Short-Intermediate Municipal Debt Funds Average, which measures the performance of competing funds. (Performance is also shown in the table for the Advisor and I Class shares, which have different fee structures.) Performance was muted on the shorter-maturity end of the yield curve as short-term rates remained under pressure, while yields on the longer-maturity end were virtually unchanged over the last six months. The fund’s modest out-of-benchmark exposure to longer maturities served as a performance tailwind in this environment. The fund’s net asset value was $5.53 at the end of February, down from $5.58 12 months earlier. Dividends per share contributed $0.08 to the fund’s total return during the 12-month period.

The fund’s interest rate risk was in line with its peer group and was mostly unchanged over the last 12 months, with a duration of 2.9 years at the end of the reporting period. The fund’s duration was modestly longer than the duration of the passive benchmark, the Bloomberg Barclays 1–5 Year Blend (1–6 Year Maturity) Index, which detracted from relative performance as shorter-maturity yields increased. As for yield curve positioning, most of our new purchases were designed to reduce the portfolio’s underweight to bonds maturing in three to five years. We believe that we are well positioned for a rising rate environment, as about one-third of the fund matures within two years, allowing us to reinvest the proceeds at higher yields fairly quickly.

While our preference for revenue bonds over GOs remains intact as a result of our concerns about the considerable unfunded pension and OPEB liabilities that many state and local government issuers face, it has become challenging to find opportunities in revenue debt over the past couple of years in the short- to intermediate-term municipal market. As a result, we are overweight GOs from high-quality states that do not have large near-term pension funding problems, including Washington, Florida, and Minnesota. Notable purchases over the reporting period included GO bonds issued out of Texas and Florida.
Within the revenue sector, health care and transportation remained the fund’s largest allocations and overweights relative to the index. The two sectors together accounted for about one-third of the fund’s net assets at the end of the reporting period. We continue to like the fundamental credit quality of both health care and transportation revenue bonds. However, credit spreads in these sectors have moved to narrow levels. While we do not anticipate reducing our exposure to health care or transportation, we have not been finding much value recently given their tight spread levels.
The portfolio’s underweight to the prerefunded debt sector contributed to relative performance over the last 12 months as the high-quality but lower-yielding sector underperformed the broad municipal market. While we maintained our underweight to the sector, we have been incrementally adding some prerefunded bonds that offer attractive relative value when compared with AAA and AA rated GO bonds, including refunding issues by the MD Health and Higher Education Authority for Doctors Community Hospital and Johns Hopkins Health System and by the Kentucky Economic Development Finance Authority for Owensboro Health. (Please refer to the fund’s portfolio of investments for a complete list of holdings and the amount each represents in the portfolio.)
We continued to overweight lower-quality investment-grade bonds, particularly those in the A and BBB credit quality categories. While spreads have narrowed generally, we believe bonds in these quality tiers for some sectors continue to offer greater value than their higher-quality counterparts and are an area where our dedicated municipal credit research team can find opportunities to build incremental risk-adjusted yield into the portfolio.
Overall, we believe our fundamental, research-driven investment process will continue to produce strong risk-adjusted returns for our shareholders over time.
TAX-FREE INCOME FUND
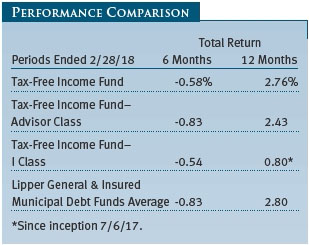
The fund returned 2.76% during the 12-month period ended February 28, 2018, versus 2.80% for the Lipper peer group average, which measures the performance of competing funds. (Returns for the Advisor and I Class will vary, reflecting their different fee structures.) While the fund’s performance was approximately in line with its peers, it outperformed the Bloomberg Barclays Municipal Bond Index, driven by strong security selection within the revenue-backed health care and transportation sectors. Our more conservative duration posture relative to the index also benefited the portfolio as rates rose over the second half of the reporting period. The fund’s net asset value was $9.98 at the end of February, down from $10.07 12 months earlier. Dividends per share contributed $0.37 to the fund’s total return during the 12-month period.
We remained cautious on interest rate risk over the past 12 months and left the fund’s duration mostly unchanged, ending the period at 4.4 years, which was shorter than both the Bloomberg Barclays Municipal Bond Index and the Lipper peer group average. Our conservative duration positioning contributed to relative performance as yields increased over the last six months.
As for yield curve positioning, we believe that longer-maturity revenue bonds represent the best long-term value in the municipal market. However, we maintained a “barbell” structure, with an allocation to shorter-maturity bonds that offer more liquidity. This allocation, which includes high-quality prerefunded bonds, was a drag on relative performance over the period as longer-maturity bonds outperformed.
We maintained our overweight in bonds with maturities of 15 years and longer, and our purchases over the reporting period were concentrated in securities with maturities of 20 years and longer. This extended the fund’s weighted average maturity to 17.0 years from 16.2 years at the beginning of the period. Overall, we seek the right balance between investing for higher yields and keeping interest rate risk in the low to moderate range.

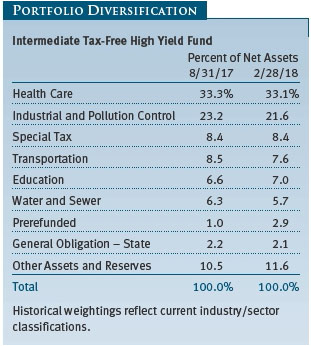
Our preference for revenue bonds over GOs remained intact as a result of our longer-term concern that many municipalities will face fiscal challenges related to unfunded pension and OPEB liabilities. Within the revenue sector, health care and transportation, which typically offer above-average yields, remained our largest allocations and together made up 47% of the fund’s net assets at the end of the reporting period. The fund’s allocation to health care increased by two percentage points over the reporting period as we purchased bonds issued by Medstar Health and by the City of South Miami Health Facilities Authority for Baptist Health. Significant additions to our transportation allocation included bonds issued for the North Texas Tollway Authority System and the Washington Metropolitan Area Transit Authority. The level of sales in the fund was rather muted during the period as we sought to stay fully invested and keep cash at minimal levels. (Please refer to the fund’s portfolio of investments for a complete list of holdings and the amount each represents in the portfolio.)
Low rates have enabled issuers to refinance older, high-cost debt at more favorable terms, creating a larger allocation to prerefunded bonds in the portfolio. Our newly refunded holdings typically see a rise in valuation due to their upgrade in credit quality, which can help cushion losses in rising rate environments. Prerefunded bonds are the highest-quality bonds in our market and typically have maturities of five years or less. While the fund’s exposure to this sector fell incrementally over the last six months, it still represented an overweight position relative to the index. This provided the fund with a modest upgrade in liquidity in addition to cash. We believe this is appropriate within the recent volatile rate environment, and it leaves us well positioned to take advantage of rising interest rates.

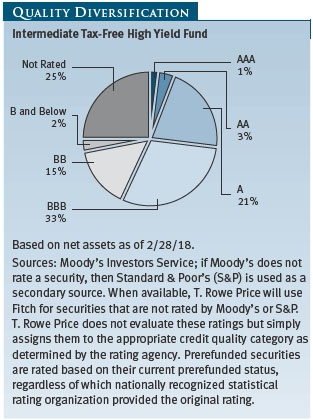
The fund’s credit-quality profile was largely unchanged during the reporting period. We maintained an overweight to A and BBB rated debt as we believe this is an area where our credit research team can find investment opportunities that offer incremental risk-adjusted yield. We also kept modest exposure to below investment-grade and unrated bonds, which provide further credit quality diversification.
Ultimately, we believe our fundamental, research-driven investment process will continue to produce strong risk-adjusted returns for our shareholders over time.
TAX-FREE HIGH YIELD FUND
The Tax-Free High Yield Fund posted a return of 4.79% for the 12-month period ended February 28, 2018, approximately in line with the 4.89% average return of our Lipper peer group. (The returns for the Advisor and I Class shares, which have different fee structures, are also shown in the table.) The fund’s net asset value per share was $11.89 at the end of February, up from $11.77 12 months earlier, and dividends per share contributed $0.44 to the fund’s total return during the 12-month period.

Medium- and lower-quality munis posted solid returns for the reporting period. This was a continuation of a general trend over the past few years, as the environment of persistently low interest rates and tight yield spreads between bonds with varying levels of credit quality encouraged many yield-seeking muni investors to reach into the most speculative sectors and issuers. Our avoidance of some of the riskiest parts of the muni high yield market resulted in returns near the median of our peers more recently, but this positioning has benefited the fund’s relative performance over the longer term. As fundamental investors, we remain firmly committed to our research-driven process, and we are confident that it will lead to strong risk-adjusted results over full market cycles.

We continued to favor revenue bonds related to health care borrowers, including both not-for-profit hospitals and continuing care retirement communities (CCRCs). Returns for our CCRC holdings were quite strong for the 12-month period. Economic expansion, improving demographics, and steady demand for well-conceived retirement communities provided excellent fundamental underpinnings for the sector, and quality spreads narrowed notably for the period. In addition, many life care borrowers proactively refinanced their higher-cost debt toward the end of 2017, as enacted changes in federal tax laws eliminated their ability to advance refund their debt in 2018. As a result, prices for many higher-coupon bonds in this sector appreciated sharply, including our holdings issued for Langford Senior Living in New Hope, Texas, and the Amsterdam at Harborside in Nassau County, New York. (Please refer to the fund’s portfolio of investments for a complete list of holdings and the amount each represents in the portfolio.)

Hospital revenue bonds also fared well in the reporting period. Credit quality improvement, balance sheet strength, and limited exposure to the pension challenges facing many state and local GO borrowers provided great incentive for market participants to invest in not-for-profit hospitals. The defeat of a legislative repeal of the ACA provided further reassurance for the sector. Our holdings of Presence Health Network, located in Illinois, rallied on news of a potential merger with higher-rated Ascension Health, and prices of our Catholic HealthCare Initiatives bonds bounced on improved financial performance and the system’s anticipated merger with Dignity Health.
We remain quite constructive on revenue bonds issued for transportation projects, including toll roads, airports, and other public-private partnerships. Our investments in these segments of the market benefited from limited competition, solid pricing power, and equity or other subordinated investments from the federal government, reducing leverage for senior investors such as bondholders. Several of our infrastructure holdings in Virginia performed well, including Dulles Toll Road, Chesapeake Toll Road, and I-95 Express Lanes.
We maintained significant exposure to corporate-backed industrial revenue and pollution control revenue bonds and continue to like the yield enhancement and diversification benefits these borrowers add to a tax-exempt bond portfolio. We believe that T. Rowe Price’s strong corporate credit research capabilities give us an advantage over municipal-only fund managers in selecting bonds backed by medium-and lower-rated corporations. Our expertise in this sector also enables us to further steer our holdings away from the pension issues faced by many lower-rated state and local borrowers. Our holdings of bonds backed by Celanese, United States Steel, and Alcoa performed well for the period.
We are cautious on, and notably underexposed to, state and local GO debt. We believe the municipal market is in the early stages of repricing risk premiums in this sector to more appropriately account for the large unfunded liabilities many of these borrowers face in the coming years. The fund has generally benefited from this underweight, including our avoidance of most Puerto Rico-related bonds. The portfolio’s relative performance did not, however, benefit from our avoidance of bonds issued by the Chicago Board of Education (CBOE) during the period. Prices of CBOE bonds improved markedly from distressed levels, as newly enacted state support staved off insolvency in the short term. We believe the long-term prospects for this borrower remain challenged.
As noted above, our conservative positioning in tobacco securitization bonds, which accounted for roughly 5% of the fund’s net assets at the end of the reporting period, detracted from our relative performance versus more aggressive peers. For almost two decades, we have witnessed significant declines in cigarette consumption that far outpaced the assumptions used to structure these asset-backed bonds, leading to significant credit downgrades over time. More recently, however, persistently low interest rates and tight credit spreads gave several of the weakest borrowers in this segment an opportunity to restructure and reissue their tobacco debt, averting potential defaults. Prices for many of these bonds with weaker structures and borrowers recovered sharply, so our underweight positioning and our preference for safer tobacco debt weighed on relative results.
INTERMEDIATE TAX-FREE HIGH YIELD FUND
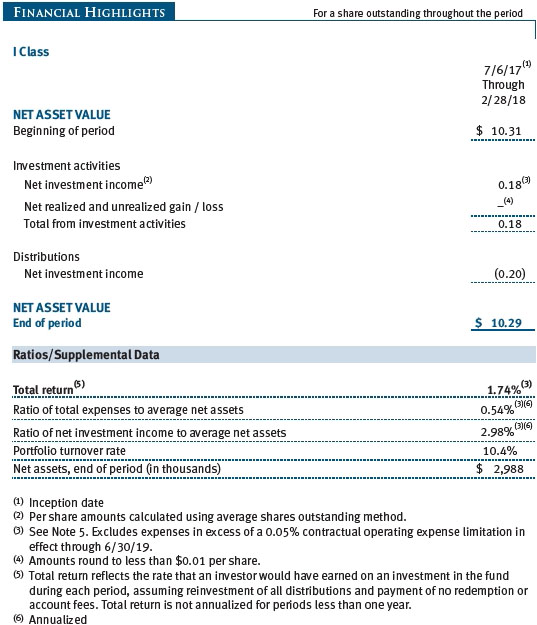
The Intermediate Tax-Free High Yield Fund generated a solid return of 4.08% for the 12-month period ended February 28, 2018, but lagged the 4.89% return of our Lipper peer group average. (The returns for the Advisor and I Class shares, which have different fee structures, are also shown in the table.) The portfolio’s objective mandates a focus on intermediate-maturity bonds, which weighed on relative returns as the longer-term debt that most of the peer group concentrates on outperformed. The fund’s net asset value per share was $10.28 at the end of February, up from $10.15 12 months ago, and dividends per share contributed $0.28 to the fund’s total return during the 12-month period.

Medium- and lower-quality munis posted solid returns for the reporting period. This was a continuation of a general trend over the past few years, as the environment of persistently low interest rates and tight quality spreads, or yield spreads between bonds with varying levels of credit quality, encouraged many yield-seeking muni investors to reach into the most speculative sectors and issuers. The fund intentionally avoids some of the riskiest parts of the muni high yield market and also focuses on intermediate-term bonds, which should perform better than long-maturity securities in a rising rate environment. We believe that the portfolio is well positioned in the event that interest rates increase meaningfully and credit spreads move wider. As fundamental investors, we remain firmly committed to our research-driven process, and we are confident that it will lead to strong risk-adjusted results over full market cycles.
Our conservative positioning in tobacco securitization bonds, which accounted for roughly 5% of the fund’s net assets at the end of the reporting period, also detracted from our relative performance versus more aggressive peers. For almost two decades, we have witnessed significant declines in cigarette consumption that far outpaced the assumptions used to structure these asset-backed bonds, leading to significant credit downgrades over time. More recently, however, persistently low interest rates and tight credit spreads gave several of the weakest borrowers in this segment an opportunity to restructure and reissue their tobacco debt, averting potential defaults. Over the last few years, the longest-maturity zero-coupon bonds in the segment have posted the most significant gains. These securities fall well outside of the fund’s maturity and duration parameters, but many of our longer-maturity Lipper high yield peers hold them.
We continued to favor revenue bonds related to health care borrowers, including both not-for-profit hospitals and CCRCs. Returns for our CCRC holdings were quite strong for the 12-month period. Economic expansion, improving demographics, and steady demand for well-conceived retirement communities provided excellent fundamental underpinnings for the sector, and quality spreads narrowed notably for the period. In addition, many life care borrowers proactively refinanced their higher-cost debt toward the end of 2017, as enacted changes in federal tax laws eliminated their ability to advance refund their debt in 2018. As a result, prices for many higher-coupon bonds in this sector appreciated sharply, including our holdings issued for Amsterdam at Harborside in Nassau County, New York, and Sunny Vista Living Center in Colorado. (Please refer to the fund’s portfolio of investments for a complete list of holdings and the amount each represents in the portfolio.)
Hospital revenue bonds also fared well in the reporting period. Credit quality improvement, balance sheet strength, and limited exposure to the pension challenges facing many state and local GO borrowers provided great incentive for market participants to invest in not-for-profit hospitals. The defeat of a legislative repeal of the ACA provided further reassurance for the sector. Our holdings of Owensboro Medical Center in Kentucky were advance refunded in the reporting period, providing a strong boost to their prices.
We maintained significant exposure to corporate-backed industrial revenue and pollution control revenue bonds and continue to like the yield enhancement and diversification benefits these borrowers add to a tax-exempt bond portfolio. We believe that T. Rowe Price’s strong corporate credit research capabilities give us an advantage over municipal-only fund managers in selecting bonds backed by medium-and lower-rated corporations. Our expertise in this sector also enables us to further steer our holdings away from the pension issues faced by many lower-rated state and local borrowers. Our holdings of bonds backed by Celanese, United States Steel, and National Gypsum performed well for the period.
The portfolio’s relative returns benefited from an overweight position in incremental tax bonds backed by community development districts. Our exposure to this debt from Florida and Colorado was particularly beneficial. Expanding population and strong employment growth in the years following the financial crisis of 2008–2009 have sparked renewed demand for housing in these states. Our holdings of bonds from Crossings at Flemings Island and Celebration Pointe, both in Florida, and Park Creek in Colorado posted strong returns for the reporting period.
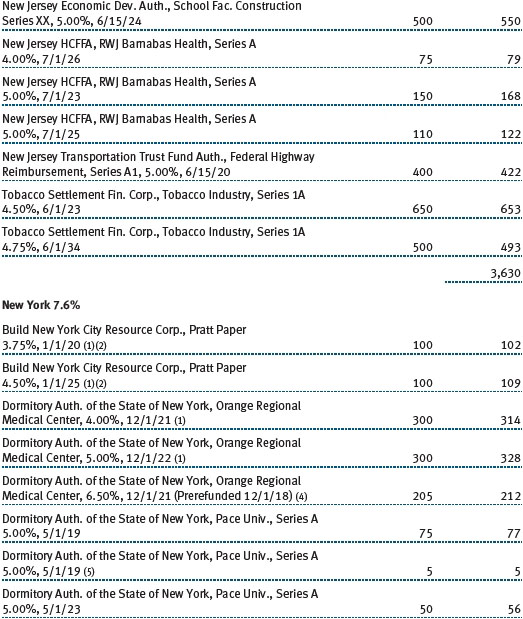
We are cautious on, and notably underexposed to, state and local GO debt. We believe the municipal market is in the early stages of repricing risk premiums in this sector to more appropriately account for the large unfunded liabilities many of these borrowers face in the coming years. This sector underweight positioning helped relative performance for the period. In addition, positions in “fallen angels” that recovered during the 12-month period, including Illinois and New Jersey School Facilities Construction, provided a boost to relative returns. (Fallen angels are bonds that were downgraded from investment-grade credit ratings into the high yield category.)
OUTLOOK
We believe that the municipal bond market remains a high-quality market that offers good opportunities for long-term investors seeking tax-free income. While the uncertainty around the long-term impacts of tax reform and the increased chance of rising yields represent near-term headwinds for broad muni market performance, we believe fundamentals are sound overall, and global economic uncertainties could spur demand for the asset class. As the Fed continues on the path to interest rate normalization, muni bond yields are likely to rise along with Treasury yields—although probably not to the same extent. While higher yields pressure bond prices, munis should be less susceptible to slowly rising rates than Treasuries given their attractive tax-equivalent yields and the steady demand for tax-exempt income. We expect any potential Fed rate increases to be gradual and believe that we could remain in a relatively low rate environment for some time.
While we believe that many states deserve high credit ratings and will be able to continue servicing their debts, we have longer-term concerns about significant funding shortfalls for pensions and OPEB obligations in some jurisdictions. These funding gaps stem from investment losses during the 2008–2009 financial crisis, insufficient plan contributions over time, and unrealistic return assumptions. Although few large plans are at risk of insolvency in the near term, the magnitude of unfunded liabilities is becoming more conspicuous in a few states.
Ultimately, we believe independent credit research is our greatest strength and will remain an asset for our investors as we navigate the current market environment. As always, we focus on finding attractively valued bonds issued by municipalities with good long-term fundamentals—an investment strategy that we believe will continue to serve our investors well.
Thank you for investing with T. Rowe Price.
Respectfully submitted,

Joseph K. Lynagh
Chairman of the Investment Advisory Committee
Tax-Exempt Money Fund

Charles B. Hill
Chairman of the Investment Advisory Committee
Tax-Free Short-Intermediate Fund

Konstantine B. Mallas
Chairman of the Investment Advisory Committee
Tax-Free Income Fund

James M. Murphy
Chairman of the Investment Advisory Committee
Tax-Free High Yield Fund and Intermediate Tax-Free High Yield Fund
March 22, 2018
The committee chairmen have day-to-day responsibility for managing the portfolios and work with committee members in developing and executing the funds’ investment programs.
RISKS OF INVESTING IN A RETAIL MONEY MARKET FUND
You could lose money by investing in the Fund. Although the Fund seeks to preserve the value of your investment at $1.00 per share, it cannot guarantee it will do so. The Fund may impose a fee upon the sale of your shares or may temporarily suspend your ability to sell shares if the Fund’s liquidity falls below required minimums because of market conditions or other factors. An investment in the Fund is not insured or guaranteed by the Federal Deposit Insurance Corporation or any other government agency. The Fund’s sponsor has no legal obligation to provide financial support to the Fund, and you should not expect that the sponsor will provide financial support to the Fund at any time.
RISKS OF FIXED INCOME INVESTING
Bonds are subject to interest rate risk (the decline in bond prices that usually accompanies a rise in interest rates) and credit risk (the chance that any fund holding could have its credit rating downgraded or that a bond issuer will default by failing to make timely payments of interest or principal), potentially reducing the fund’s income level and share price. High yield bonds could have greater price declines than funds that invest primarily in high-quality bonds. Municipalities issuing high yield bonds are not as strong financially as those with higher credit ratings, so the bonds are usually considered speculative investments. Some income may be subject to state and local taxes and the federal alternative minimum tax.
GLOSSARY
Basis point: One one-hundredth of one percentage point, or 0.01%.
Bloomberg Barclays Municipal Bond Index: An unmanaged index that tracks municipal debt instruments.
Bloomberg Barclays 1–5 Year Blend (1–6 Year Maturity) Index: A subindex of the Bloomberg Barclays Municipal Bond Index. It is a rules-based, market value-weighted index of short-term bonds engineered for the tax-exempt bond market.
Bloomberg Barclays 65% High-Grade/35% High-Yield Index: An index that tracks Bloomberg Barclays indexes of both investment-grade and below investment-grade municipal debt instruments.
Bloomberg Barclays U.S. Aggregate Bond Index: An unmanaged index that tracks domestic investment-grade bonds, including corporate, government, and mortgage-backed securities.
Credit spread: The additional yield that investors demand to hold a bond with credit risk compared with a Treasury security with a comparable maturity date.
Duration: A measure of a bond fund’s sensitivity to changes in interest rates. For example, a fund with a duration of five years would fall about 5% in price in response to a one-percentage-point rise in interest rates, and vice versa.
Federal funds rate: The interest rate charged on overnight loans of reserves by one financial institution to another in the United States. The Federal Reserve sets a target federal funds rate to affect the direction of interest rates.
General obligation (GO) debt: A government’s strongest pledge that obligates its full faith and credit, including, if necessary, its ability to raise taxes.
Investment grade: High-quality bonds as measured by one of the major credit rating agencies. For example, S&P designates the bonds in its top four categories (AAA to BBB) as investment grade.
Lipper averages: The averages of available mutual fund performance returns for specified time periods in categories defined by Lipper.
Lipper indexes: Fund benchmarks that consist of a small number (10 to 30) of the largest mutual funds in a particular category as tracked by Lipper Inc.
Other post-employment benefits (OPEB): Benefits paid to an employee after retirement, such as premiums for life and health insurance.
Prerefunded bond: A bond that originally may have been issued as a general obligation or revenue bond but that is now secured by an escrow fund consisting entirely of direct U.S. government obligations that are sufficient for paying the bondholders.
SEC yield (7-day simple): A method of calculating a money fund’s yield by annualizing the fund’s net investment income for the last seven days of each period divided by the fund’s net asset value at the end of the period. Yield will vary and is not guaranteed.
SEC yield (30-day): A method of calculating a fund’s yield that assumes all portfolio securities are held until maturity. Yield will vary and is not guaranteed.
Variable rate demand note (VRDN): Generally, a debt security that requires the issuer to redeem at the holder’s discretion on a specified date or dates prior to maturity. Upon redemption, the issuer pays par to the holder who loses future coupon payments that might otherwise be due. The VRDN might be especially attractive at times of rising rates to protect against interest rate risk by redeeming at par value and reinvesting proceeds in a new bond.
Weighted average life: A measure of a fund’s credit quality risk. In general, the longer the average life, the greater the fund’s credit quality risk. The average life is the dollar-weighted average maturity of a portfolio’s individual securities without taking into account interest rate readjustment dates. Money funds must maintain a weighted average life of less than 120 days.
Weighted average maturity: A measure of a fund’s interest rate sensitivity. In general, the longer the average maturity, the greater the fund’s sensitivity to interest rate changes. The weighted average maturity may take into account the interest rate readjustment dates for certain securities. Money funds must maintain a weighted average maturity of less than 60 days.
Yield curve: A graphic depiction of the relationship between yields and maturity dates for a set of similar securities such as Treasuries or municipal securities. Securities with longer maturities usually a have higher yield. If short-term securities offer a higher yield, then the curve is said to be “inverted.” If short- and long-term bonds are offering equivalent yields, then the curve is said to be “flat.”
Note: Bloomberg Index Services Ltd. Copyright 2018, Bloomberg Index Services Ltd. Used with permission.


Performance and Expenses
| Growth of $10,000 |
This chart shows the value of a hypothetical $10,000 investment in the fund over the past 10 fiscal year periods or since inception (for funds lacking 10-year records). The result is compared with benchmarks, which may include a broad-based market index and a peer group average or index. Market indexes do not include expenses, which are deducted from fund returns as well as mutual fund averages and indexes.


| Fund Expense Example |
As a mutual fund shareholder, you may incur two types of costs: (1) transaction costs, such as redemption fees or sales loads, and (2) ongoing costs, including management fees, distribution and service (12b-1) fees, and other fund expenses. The following example is intended to help you understand your ongoing costs (in dollars) of investing in the fund and to compare these costs with the ongoing costs of investing in other mutual funds. The example is based on an investment of $1,000 invested at the beginning of the most recent six-month period and held for the entire period.
Please note that the Intermediate Tax-Free High Yield Fund, Tax-Free High Yield Fund, Tax-Free Income Fund, and Tax-Free Short-Intermediate Fund and have three share classes: The original share class (Investor Class) charges no distribution and service (12b-1) fee, the Advisor Class shares are offered only through unaffiliated brokers and other financial intermediaries and charge a 0.25% 12b-1 fee, and the I Class shares are available to institutionally oriented clients and impose no 12b-1 or administrative fee payment. The Tax-Exempt Money Fund has two share classes: The original share class (Investor Class) charges no distribution and service (12b-1) fee, and the I Class shares are also available to institutionally oriented clients and impose no 12b-1 or administrative fee payment. Each share class is presented separately in the table.
Actual Expenses
The first line of the following table (Actual) provides information about actual account values and actual expenses. You may use the information on this line, together with your account balance, to estimate the expenses that you paid over the period. Simply divide your account value by $1,000 (for example, an $8,600 account value divided by $1,000 = 8.6), then multiply the result by the number on the first line under the heading “Expenses Paid During Period” to estimate the expenses you paid on your account during this period.
Hypothetical Example for Comparison Purposes
The information on the second line of the table (Hypothetical) is based on hypothetical account values and expenses derived from the fund’s actual expense ratio and an assumed 5% per year rate of return before expenses (not the fund’s actual return). You may compare the ongoing costs of investing in the fund with other funds by contrasting this 5% hypothetical example and the 5% hypothetical examples that appear in the shareholder reports of the other funds. The hypothetical account values and expenses may not be used to estimate the actual ending account balance or expenses you paid for the period.
Note: T. Rowe Price charges an annual account service fee of $20, generally for accounts with less than $10,000. The fee is waived for any investor whose T. Rowe Price mutual fund accounts total $50,000 or more; accounts electing to receive electronic delivery of account statements, transaction confirmations, prospectuses, and shareholder reports; or accounts of an investor who is a T. Rowe Price Personal Services or Enhanced Personal Services client (enrollment in these programs generally requires T. Rowe Price assets of at least $250,000). This fee is not included in the accompanying table. If you are subject to the fee, keep it in mind when you are estimating the ongoing expenses of investing in the fund and when comparing the expenses of this fund with other funds.
You should also be aware that the expenses shown in the table highlight only your ongoing costs and do not reflect any transaction costs, such as redemption fees or sales loads. Therefore, the second line of the table is useful in comparing ongoing costs only and will not help you determine the relative total costs of owning different funds. To the extent a fund charges transaction costs, however, the total cost of owning that fund is higher.


The accompanying notes are an integral part of these financial statements.

The accompanying notes are an integral part of these financial statements.
The accompanying notes are an integral part of these financial statements.


The accompanying notes are an integral part of these financial statements.

The accompanying notes are an integral part of these financial statements.

The accompanying notes are an integral part of these financial statements.

The accompanying notes are an integral part of these financial statements.
| Notes to Financial Statements |
T. Rowe Price Intermediate Tax-Free High Yield Fund, Inc. (the fund) is registered under the Investment Company Act of 1940 (the 1940 Act) as a diversified, open-end management investment company. The fund seeks to provide a high level of income exempt from federal income taxes. The fund has three classes of shares: the Intermediate Tax-Free High Yield Fund (Investor Class), the Intermediate Tax-Free High Yield Fund–Advisor Class (Advisor Class), and the Intermediate Tax-Free High Yield Fund–I Class (I Class). Advisor Class shares are sold only through unaffiliated brokers and other unaffiliated financial intermediaries. I Class shares generally are available only to investors meeting a $1,000,000 minimum investment or certain other criteria. The Advisor Class operates under a Board-approved Rule 12b-1 plan pursuant to which the class compensates financial intermediaries for distribution, shareholder servicing, and/or certain administrative services; the Investor and I Classes do not pay Rule 12b-1 fees. Each class has exclusive voting rights on matters related solely to that class; separate voting rights on matters that relate to all classes; and, in all other respects, the same rights and obligations as the other classes.
NOTE 1 - SIGNIFICANT ACCOUNTING POLICIES
Basis of Preparation The fund is an investment company and follows accounting and reporting guidance in the Financial Accounting Standards Board (FASB) Accounting Standards Codification Topic 946 (ASC 946). The accompanying financial statements were prepared in accordance with accounting principles generally accepted in the United States of America (GAAP), including, but not limited to, ASC 946. GAAP requires the use of estimates made by management. Management believes that estimates and valuations are appropriate; however, actual results may differ from those estimates, and the valuations reflected in the accompanying financial statements may differ from the value ultimately realized upon sale or maturity.
Investment Transactions, Investment Income, and Distributions Investment transactions are accounted for on the trade date basis. Income and expenses are recorded on the accrual basis. Realized gains and losses are reported on the identified cost basis. Premiums and discounts on debt securities are amortized for financial reporting purposes. Income tax-related interest and penalties, if incurred, are recorded as income tax expense. Income distributions are declared by each class daily and paid monthly. Distributions to shareholders are recorded on the ex-dividend date. A capital gain distribution may also be declared and paid by the fund annually.
Class Accounting Shareholder servicing, prospectus, and shareholder report expenses incurred by each class are charged directly to the class to which they relate. Expenses common to all classes and investment income are allocated to the classes based upon the relative daily net assets of each class’s settled shares; realized and unrealized gains and losses are allocated based upon the relative daily net assets of each class’s outstanding shares. To the extent any expenses are waived or reimbursed in accordance with an expense limitation (see Note 5), the waiver or reimbursement is charged to the applicable class or allocated across the classes in the same manner as the related expense. The Advisor Class pays Rule 12b-1 fees, in an amount not exceeding 0.25% of the class’s average daily net assets.
Redemption Fees A 2% fee is assessed on redemptions of fund shares held for 90 days or less to deter short-term trading and to protect the interests of long-term shareholders. Redemption fees are withheld from proceeds that shareholders receive from the sale or exchange of fund shares. The fees are paid to the fund and are recorded as an increase to paid-in capital. The fees may cause the redemption price per share to differ from the net asset value per share.
New Accounting Guidance In March 2017, the FASB issued amended guidance to shorten the amortization period for certain callable debt securities held at a premium. The guidance is effective for fiscal years and interim periods beginning after December 15, 2018. Adoption will have no effect on the fund’s net assets or results of operations.
On August 1, 2017, the fund implemented amendments to Regulation S-X, issued by the Securities and Exchange Commission, which require standardized, enhanced disclosures, particularly related to derivatives, in investment company financial statements. Adoption had no effect on the fund’s net assets or results of operations.
Indemnification In the normal course of business, the fund may provide indemnification in connection with its officers and directors, service providers, and/or private company investments. The fund’s maximum exposure under these arrangements is unknown; however, the risk of material loss is currently considered to be remote.
NOTE 2 - VALUATION
The fund’s financial instruments are valued and each class’s net asset value (NAV) per share is computed at the close of the New York Stock Exchange (NYSE), normally 4 p.m. ET, each day the NYSE is open for business. However, the NAV per share may be calculated at a time other than the normal close of the NYSE if trading on the NYSE is restricted, if the NYSE closes earlier, or as may be permitted by the SEC.
Fair Value The fund’s financial instruments are reported at fair value, which GAAP defines as the price that would be received to sell an asset or paid to transfer a liability in an orderly transaction between market participants at the measurement date. The T. Rowe Price Valuation Committee (the Valuation Committee) is an internal committee that has been delegated certain responsibilities by the fund’s Board of Directors (the Board) to ensure that financial instruments are appropriately priced at fair value in accordance with GAAP and the 1940 Act. Subject to oversight by the Board, the Valuation Committee develops and oversees pricing-related policies and procedures and approves all fair value determinations. Specifically, the Valuation Committee establishes procedures to value securities; determines pricing techniques, sources, and persons eligible to effect fair value pricing actions; oversees the selection, services, and performance of pricing vendors; oversees valuation-related business continuity practices; and provides guidance on internal controls and valuation-related matters. The Valuation Committee reports to the Board and has representation from legal, portfolio management and trading, operations, risk management, and the fund’s treasurer.
Various valuation techniques and inputs are used to determine the fair value of financial instruments. GAAP establishes the following fair value hierarchy that categorizes the inputs used to measure fair value:
Level 1 – quoted prices (unadjusted) in active markets for identical financial instruments that the fund can access at the reporting date
Level 2 – inputs other than Level 1 quoted prices that are observable, either directly or indirectly (including, but not limited to, quoted prices for similar financial instruments in active markets, quoted prices for identical or similar financial instruments in inactive markets, interest rates and yield curves, implied volatilities, and credit spreads)
Level 3 – unobservable inputs
Observable inputs are developed using market data, such as publicly available information about actual events or transactions, and reflect the assumptions that market participants would use to price the financial instrument. Unobservable inputs are those for which market data are not available and are developed using the best information available about the assumptions that market participants would use to price the financial instrument. GAAP requires valuation techniques to maximize the use of relevant observable inputs and minimize the use of unobservable inputs. When multiple inputs are used to derive fair value, the financial instrument is assigned to the level within the fair value hierarchy based on the lowest-level input that is significant to the fair value of the financial instrument. Input levels are not necessarily an indication of the risk or liquidity associated with financial instruments at that level but rather the degree of judgment used in determining those values.
Valuation Techniques Debt securities generally are traded in the over-the-counter (OTC) market. Securities with remaining maturities of one year or more at the time of acquisition are valued at prices furnished by dealers who make markets in such securities or by an independent pricing service, which considers the yield or price of bonds of comparable quality, coupon, maturity, and type, as well as prices quoted by dealers who make markets in such securities. Securities with remaining maturities of less than one year at the time of acquisition generally use amortized cost in local currency to approximate fair value. However, if amortized cost is deemed not to reflect fair value or the fund holds a significant amount of such securities with remaining maturities of more than 60 days, the securities are valued at prices furnished by dealers who make markets in such securities or by an independent pricing service. Generally, debt securities are categorized in Level 2 of the fair value hierarchy; however, to the extent the valuations include significant unobservable inputs, the securities would be categorized in Level 3.
Assets and liabilities other than financial instruments, including short-term receivables and payables, are carried at cost, or estimated realizable value, if less, which approximates fair value.
Thinly traded financial instruments and those for which the above valuation procedures are inappropriate or are deemed not to reflect fair value are stated at fair value as determined in good faith by the Valuation Committee. The objective of any fair value pricing determination is to arrive at a price that could reasonably be expected from a current sale. Financial instruments fair valued by the Valuation Committee are primarily private placements, restricted securities, warrants, rights, and other securities that are not publicly traded.
Subject to oversight by the Board, the Valuation Committee regularly makes good faith judgments to establish and adjust the fair valuations of certain securities as events occur and circumstances warrant. For instance, in determining the fair value of troubled or thinly traded debt instruments, the Valuation Committee considers a variety of factors, which may include, but are not limited to, the issuer’s business prospects, its financial standing and performance, recent investment transactions in the issuer, strategic events affecting the company, market liquidity for the issuer, and general economic conditions and events. In consultation with the investment and pricing teams, the Valuation Committee will determine an appropriate valuation technique based on available information, which may include both observable and unobservable inputs. The Valuation Committee typically will afford greatest weight to actual prices in arm’s length transactions, to the extent they represent orderly transactions between market participants, transaction information can be reliably obtained, and prices are deemed representative of fair value. However, the Valuation Committee may also consider other valuation methods such as a discount or premium from market value of a similar, freely traded security of the same issuer; discounted cash flows; yield to maturity; or some combination. Fair value determinations are reviewed on a regular basis and updated as information becomes available, including actual purchase and sale transactions of the issue. Because any fair value determination involves a significant amount of judgment, there is a degree of subjectivity inherent in such pricing decisions, and fair value prices determined by the Valuation Committee could differ from those of other market participants. Depending on the relative significance of unobservable inputs, including the valuation technique(s) used, fair valued securities may be categorized in Level 2 or 3 of the fair value hierarchy.
Valuation Inputs On February 28, 2018, all of the fund’s financial instruments were classified as Level 2, based on the inputs used to determine their fair values. There were no material transfers between Levels 1 and 2 during the year ended February 28, 2018.
NOTE 3 - OTHER INVESTMENT TRANSACTIONS
Consistent with its investment objective, the fund engages in the following practices to manage exposure to certain risks and/or to enhance performance. The investment objective, policies, program, and risk factors of the fund are described more fully in the fund’s prospectus and Statement of Additional Information.
Noninvestment-Grade Debt At February 28, 2018, approximately 52% of the fund’s net assets were invested, either directly or through its investment in T. Rowe Price institutional funds, in noninvestment-grade debt, including “high yield” or “junk” bonds or leveraged loans. The noninvestment-grade debt market may experience sudden and sharp price swings due to a variety of factors, including changes in economic forecasts, stock market activity, large sustained sales by major investors, a high-profile default, or a change in market sentiment. These events may decrease the ability of issuers to make principal and interest payments and adversely affect the liquidity or value, or both, of such securities. Investments in noninvestment-grade holdings may be considered speculative.
Restricted Securities The fund may invest in securities that are subject to legal or contractual restrictions on resale. Prompt sale of such securities at an acceptable price may be difficult and may involve substantial delays and additional costs.
Other Purchases and sales of portfolio securities other than short-term securities aggregated $11,141,000 and $5,399,000, respectively, for the year ended February 28, 2018.
NOTE 4 - FEDERAL INCOME TAXES
No provision for federal income taxes is required since the fund intends to continue to qualify as a regulated investment company under Subchapter M of the Internal Revenue Code and distribute to shareholders all of its income and gains. Distributions determined in accordance with federal income tax regulations may differ in amount or character from net investment income and realized gains for financial reporting purposes. Financial reporting records are adjusted for permanent book/tax differences to reflect tax character but are not adjusted for temporary differences.
The fund files U.S. federal, state, and local tax returns as required. The fund’s tax returns are subject to examination by the relevant tax authorities until expiration of the applicable statute of limitations, which is generally three years after the filing of the tax return but which can be extended to six years in certain circumstances. Tax returns for open years have incorporated no uncertain tax positions that require a provision for income taxes.
Reclassifications between income and gain relate primarily to the character of market discount at time of sale. For the year ended February 28, 2018, the following reclassifications were recorded to reflect tax character (there was no impact on results of operations or net assets):

Distributions during the years ended February 28, 2018 and February 28, 2017, were characterized for tax purposes as follows:

At February 28, 2018, the tax-basis cost of investments and components of net assets were as follows:

The fund intends to retain realized gains to the extent of available capital loss carryforwards. Net realized capital losses may be carried forward indefinitely to offset future realized capital gains. During the year ended February 28, 2018, the fund utilized $71,000 of capital loss carryforwards.
NOTE 5 - RELATED PARTY TRANSACTIONS
The fund is managed by T. Rowe Price Associates, Inc. (Price Associates), a wholly owned subsidiary of T. Rowe Price Group, Inc. (Price Group). The investment management agreement between the fund and Price Associates provides for an annual investment management fee, which is computed daily and paid monthly. The fee consists of an individual fund fee, equal to 0.20% of the fund’s average daily net assets, and a group fee. The group fee rate is calculated based on the combined net assets of certain mutual funds sponsored by Price Associates (the group) applied to a graduated fee schedule, with rates ranging from 0.48% for the first $1 billion of assets to 0.265% for assets in excess of $650 billion. The fund’s group fee is determined by applying the group fee rate to the fund’s average daily net assets. At February 28, 2018, the effective annual group fee rate was 0.29%.
The Investor Class and Advisor Class are each subject to a contractual expense limitation through the limitation dates indicated in the table below. During the limitation period, Price Associates is required to waive its management fee or pay any expenses (excluding interest, expenses related to borrowings, taxes, brokerage, and other non-recurring expenses permitted by the investment management agreement) that would otherwise cause the class’s ratio of annualized total expenses to average net assets (expense ratio) to exceed its expense limitation. Each class is required to repay Price Associates for expenses previously waived/paid to the extent the class’s net assets grow or expenses decline sufficiently to allow repayment without causing the class’s expense ratio (after the repayment is taken into account) to exceed both: (1) the expense limitation in place at the time such amounts were waived; and (2) the class’s current expense limitation. However, no repayment will be made more than three years after the date of a payment or waiver.

The I Class is also subject to an operating expense limitation (I Class limit) pursuant to which Price Associates is contractually required to pay all operating expenses of the I Class, excluding management fees, interest, expenses related to borrowings, taxes, brokerage, and other non-recurring expenses permitted by the investment management agreement, to the extent such operating expenses, on an annualized basis, exceed 0.05% of average net assets. This agreement will continue until June 30, 2019, and may be renewed, revised, or revoked only with approval of the fund’s Board. The I Class is required to repay Price Associates for expenses previously paid to the extent the class’s net assets grow or expenses decline sufficiently to allow repayment without causing the class’s operating expenses (after the repayment is taken into account) to exceed both: (1) the expense limitation in place at the time such amounts were paid; and (2) the class’s current expense limitation. However, no repayment will be made more than three years after the date of a payment or waiver.
Pursuant to these agreements, $217,000 of expenses were waived/paid by Price Associates during the year ended February 28, 2018. Including this amount, expenses previously waived/paid by Price Associates in the amount of $641,000 remain subject to repayment by the fund at February 28, 2018.
In addition, the fund has entered into service agreements with Price Associates and a wholly owned subsidiary of Price Associates, each an affiliate of the fund (collectively, Price). Price Associates provides certain accounting and administrative services to the fund. T. Rowe Price Services, Inc. provides shareholder and administrative services in its capacity as the fund’s transfer and dividend-disbursing agent. For the year ended February 28, 2018, expenses incurred pursuant to these service agreements were $86,000 for Price Associates and $13,000 for T. Rowe Price Services, Inc. The total amount payable at period-end pursuant to these service agreements is reflected as Due to Affiliates on the accompanying Statement of Assets and Liabilities.
As of February 28, 2018, T. Rowe Price Group, Inc., or its wholly owned subsidiaries owned 3,002,273 shares of the Investor Class, representing 59% of the Investor Class’s net assets, 25,000 shares of the Advisor Class, representing 44% of the Advisor Class’s net assets, and 24,248 shares of the I Class, representing 8% of the I Class’s net assets.
The fund may participate in securities purchase and sale transactions with other funds or accounts advised by Price Associates (cross trades), in accordance with procedures adopted by the fund’s Board and Securities and Exchange Commission rules, which require, among other things, that such purchase and sale cross trades be effected at the independent current market price of the security. During the year ended February 28, 2018, the fund had no purchases or sales cross trades with other funds or accounts advised by Price Associates.
| Report of Independent Registered Public Accounting Firm |
To the Board of Directors and Shareholders of T. Rowe Price Intermediate
Tax-Free High Yield Fund, Inc.
Opinion on the Financial Statements
We have audited the accompanying statement of assets and liabilities, including the portfolio of investments, of T. Rowe Price Intermediate Tax-Free High Yield Fund, Inc. (the “Fund”) as of February 28, 2018, the related statement of operations for the year ended February 28, 2018, the statement of changes in net assets for each of the two years in the period ended February 28, 2018, including the related notes, and the financial highlights for each of the periods indicated therein (collectively referred to as the “financial statements”). In our opinion, the financial statements present fairly, in all material respects, the financial position of the Fund as of February 28, 2018, the results of its operations for the year then ended, the changes in its net assets for each of the two years in the period ended February 28, 2018 and the financial highlights for each of the periods indicated therein, in conformity with accounting principles generally accepted in the United States of America.
Basis for Opinion
These financial statements are the responsibility of the Fund’s management. Our responsibility is to express an opinion on the Fund’s financial statements based on our audits. We are a public accounting firm registered with the Public Company Accounting Oversight Board (United States) (“PCAOB”) and are required to be independent with respect to the Fund in accordance with the U.S. federal securities laws and the applicable rules and regulations of the Securities and Exchange Commission and the PCAOB.
We conducted our audits of these financial statements in accordance with the standards of the PCAOB. Those standards require that we plan and perform the audit to obtain reasonable assurance about whether the financial statements are free of material misstatement, whether due to error or fraud.
Our audits included performing procedures to assess the risks of material misstatement of the financial statements, whether due to error or fraud, and performing procedures that respond to those risks. Such procedures included examining, on a test basis, evidence regarding the amounts and disclosures in the financial statements. Our audits also included evaluating the accounting principles used and significant estimates made by management, as well as evaluating the overall presentation of the financial statements. Our procedures included confirmation of securities owned as of February 28, 2018 by correspondence with the custodian. We believe that our audits provide a reasonable basis for our opinion.
PricewaterhouseCoopers LLP
Baltimore, Maryland
April 18, 2018
We have served as the auditor of one or more investment companies in the T. Rowe Price group of investment companies since 1973.
| Tax Information (Unaudited) for the Tax Year Ended 2/28/18 |
We are providing this information as required by the Internal Revenue Code. The amounts shown may differ from those elsewhere in this report because of differences between tax and financial reporting requirements.
The fund’s distributions to shareholders included $1,437,000 which qualified as exempt-interest dividends.
| Information on Proxy Voting Policies, Procedures, and Records |
A description of the policies and procedures used by T. Rowe Price funds and portfolios to determine how to vote proxies relating to portfolio securities is available in each fund’s Statement of Additional Information. You may request this document by calling 1-800-225-5132 or by accessing the SEC’s website, sec.gov.
The description of our proxy voting policies and procedures is also available on our corporate website. To access it, please visit the following Web page:
https://www3.troweprice.com/usis/corporate/en/utility/policies.html
Scroll down to the section near the bottom of the page that says, “Proxy Voting Policies.” Click on the Proxy Voting Policies link in the shaded box.
Each fund’s most recent annual proxy voting record is available on our website and through the SEC’s website. To access it through T. Rowe Price, visit the website location shown above, and scroll down to the section near the bottom of the page that says, “Proxy Voting Records.” Click on the Proxy Voting Records link in the shaded box.
| How to Obtain Quarterly Portfolio Holdings |
The fund files a complete schedule of portfolio holdings with the Securities and Exchange Commission for the first and third quarters of each fiscal year on Form N-Q. The fund’s Form N-Q is available electronically on the SEC’s website (sec.gov); hard copies may be reviewed and copied at the SEC’s Public Reference Room, 100 F St. N.E., Washington, DC 20549. For more information on the Public Reference Room, call 1-800-SEC-0330.
| About the Fund’s Directors and Officers |
Your fund is overseen by a Board of Directors (Board) that meets regularly to review a wide variety of matters affecting or potentially affecting the fund, including performance, investment programs, compliance matters, advisory fees and expenses, service providers, and business and regulatory affairs. The Board elects the fund’s officers, who are listed in the final table. At least 75% of the Board’s members are independent of T. Rowe Price Associates, Inc. (T. Rowe Price), and its affiliates; “inside” or “interested” directors are employees or officers of T. Rowe Price. The business address of each director and officer is 100 East Pratt Street, Baltimore, Maryland 21202. The Statement of Additional Information includes additional information about the fund directors and is available without charge by calling a T. Rowe Price representative at 1-800-638-5660.
Independent Directors(a)
| Name | ||
| (Year of Birth) | ||
| Year Elected | ||
| [Number of T. Rowe Price | Principal Occupation(s) and Directorships of Public Companies and | |
| Portfolios Overseen] | Other Investment Companies During the Past Five Years | |
| Teresa Bryce Bazemore* | President, Radian Guaranty (2008 to 2017); Member, Bazemore | |
| (1959) | Consulting LLC (2018 to present); Chimera Investment Corporation | |
| 2018 | (2017 to present); Federal Home Loan Bank of Pittsburgh (2017 | |
| [191] | to present) | |
| Ronald J. Daniels* | President, The Johns Hopkins University(b) and Professor, Political | |
| (1959) | Science Department, The Johns Hopkins University (2009 to | |
| 2018 | present); Director, Lyndhurst Holdings (2015 to present) | |
| [191] | ||
| Anthony W. Deering** | Chairman, Exeter Capital, LLC, a private investment firm (2004 | |
| (1945) | to 2017); Director and Advisory Board Member, Deutsche Bank | |
| 2014 | North America (2004 to 2017); Director, Vornado Real Estate | |
| [0] | Investment Trust (2004 to 2012); Director, Under Armour (2008 to | |
| 2017); Director, Brixmor Real Estate Investment Trust (2012 to 2017) | ||
| Bruce W. Duncan | Chief Executive Officer and Director (January 2009 to December | |
| (1951) | 2016), Chairman of the Board (January 2016 to present), and | |
| 2014 | President (January 2009 to September 2016), First Industrial Realty | |
| [191] | Trust, an owner and operator of industrial properties; Chairman | |
| of the Board (2005 to September 2016) and Director (1999 to | ||
| September 2016), Starwood Hotels & Resorts, a hotel and leisure | ||
| company; Director, Boston Properties (May 2016 to present); | ||
| Director, Marriott International, Inc. (September 2016 to present) | ||
| Robert J. Gerrard, Jr. | Advisory Board Member, Pipeline Crisis/Winning Strategies, a | |
| (1952) | collaborative working to improve opportunities for young African | |
| 2014 | Americans (1997 to January 2016) | |
| [191] | ||
| Paul F. McBride | Advisory Board Member, Vizzia Technologies (2015 to present) | |
| (1956) | ||
| 2014 | ||
| [191] | ||
| Cecilia E. Rouse, Ph.D. | Dean, Woodrow Wilson School (2012 to present); Professor and | |
| (1963) | Researcher, Princeton University (1992 to present); Member of | |
| 2014 | National Academy of Education (2010 to present); Director, MDRC, | |
| [191] | a nonprofit education and social policy research organization | |
| (2011 to present); Research Associate of Labor Studies Program | ||
| (2011 to 2015) and Board Member (2015 to present), National | ||
| Bureau of Economic Research (2011 to present); Chair of Committee | ||
| on the Status of Minority Groups in the Economic Profession | ||
| (2012 to present); Vice President, American Economic Association | ||
| (2015 to present) | ||
| John G. Schreiber | Owner/President, Centaur Capital Partners, Inc., a real estate | |
| (1946) | investment company (1991 to present); Cofounder, Partner, | |
| 2014 | and Cochairman of the Investment Committee, Blackstone Real | |
| [191] | Estate Advisors, L.P. (1992 to 2015); Director, General Growth | |
| Properties, Inc. (2010 to 2013); Director, Blackstone Mortgage | ||
| Trust, a real estate finance company (2012 to 2016); Director | ||
| and Chairman of the Board, Brixmor Property Group, Inc. (2013 to | ||
| present); Director, Hilton Worldwide (2013 to present); Director, | ||
| Hudson Pacific Properties (2014 to 2016); Director, Invitation | ||
| Homes (2014 to present) | ||
| Mark R. Tercek | President and Chief Executive Officer, The Nature Conservancy | |
| (1957) | (2008 to present) | |
| 2014 | ||
| [191] | ||
| *Effective January 1, 2018, Ms. Bazemore and Mr. Daniels were elected as independent directors of the Price Funds. | ||
| **Mr. Deering served as an independent director of the Price Funds until November 17, 2017. | ||
| (a)All information about the independent directors was current as of December 31, 2017, except for the information provided for Ms. Bazemore and Mr. Daniels, which is current as of January 1, 2018. | ||
| (b)William J. Stromberg, President and CEO of T. Rowe Price Group, Inc., which is the parent company of the Price Funds’ investment adviser, has served on the Board of Trustees of The Johns Hopkins University since 2014 and is a member of The Johns Hopkins University Board’s Compensation Committee. | ||
Inside Directors
| Name | ||
| (Year of Birth) | ||
| Year Elected* | ||
| [Number of T. Rowe Price | Principal Occupation(s) and Directorships of Public Companies and | |
| Portfolios Overseen] | Other Investment Companies During the Past Five Years | |
| Edward C. Bernard | Director and Vice President, T. Rowe Price; Vice Chairman of the | |
| (1956) | Board, Director, and Vice President, T. Rowe Price Group, Inc.; | |
| 2014 | Chairman of the Board, Director, and Vice President, T. Rowe Price | |
| [191] | Investment Services, Inc., and T. Rowe Price Services, Inc.; Chairman | |
| of the Board and Director, T. Rowe Price Retirement Plan Services, | ||
| Inc.; Chairman of the Board, Chief Executive Officer, Director, and | ||
| President, T. Rowe Price International and T. Rowe Price Trust | ||
| Company; Chairman of the Board, all funds | ||
| Edward A. Wiese, CFA | Vice President, T. Rowe Price, T. Rowe Price Group, Inc., T. Rowe | |
| (1959) | Price International, and T. Rowe Price Trust Company | |
| 2015 | ||
| [56] | ||
| *Each inside director serves until retirement, resignation, or election of a successor. | ||
Officers
| Name (Year of Birth) | ||
| Position Held With Intermediate Tax-Free High | ||
| Yield Fund | Principal Occupation(s) | |
| R. Lee Arnold, Jr., CFA, CPA (1970) | Vice President, T. Rowe Price and T. Rowe Price | |
| Executive Vice President | Group, Inc. | |
| Darrell N. Braman (1963) | Vice President, Price Hong Kong, Price | |
| Vice President and Secretary | Singapore, T. Rowe Price, T. Rowe Price Group, | |
| Inc., T. Rowe Price International, T. Rowe Price | ||
| Investment Services, Inc., and T. Rowe Price | ||
| Services, Inc. | ||
| M. Helena Condez (1962) | Vice President, T. Rowe Price and T. Rowe Price | |
| Vice President | Group, Inc. | |
| G. Richard Dent (1960) | Vice President, T. Rowe Price and T. Rowe Price | |
| Vice President | Group, Inc. | |
| Sarah J. Engle (1979) | Vice President, T. Rowe Price and T. Rowe Price | |
| Vice President | Group, Inc. | |
| John R. Gilner (1961) | Chief Compliance Officer and Vice President, | |
| Chief Compliance Officer | T. Rowe Price; Vice President, T. Rowe Price | |
| Group, Inc., and T. Rowe Price Investment | ||
| Services, Inc. | ||
| Charles B. Hill, CFA (1961) | Vice President, T. Rowe Price and T. Rowe Price | |
| Vice President | Group, Inc. | |
| Dylan Jones, CFA (1971) | Vice President, T. Rowe Price and T. Rowe Price | |
| Vice President | Group, Inc. | |
| Marianna Korpusova, CFA (1984) | Vice President, T. Rowe Price and T. Rowe Price | |
| Vice President | Group, Inc.; formerly, student, The University of | |
| Chicago (to 2014) | ||
| Paul J. Krug, CPA (1964) | Vice President, T. Rowe Price, T. Rowe Price | |
| Vice President | Group, Inc., and T. Rowe Price Trust Company | |
| Marcy M. Lash (1963) | Vice President, T. Rowe Price and T. Rowe Price | |
| Vice President | Group, Inc. | |
| Konstantine B. Mallas (1963) | Vice President, T. Rowe Price and T. Rowe Price | |
| Vice President | Group, Inc. | |
| Catherine D. Mathews (1963) | Vice President, T. Rowe Price, T. Rowe Price | |
| Treasurer and Vice President | Group, Inc., and T. Rowe Price Trust Company | |
| Hugh D. McGuirk, CFA (1960) | Vice President, T. Rowe Price and T. Rowe Price | |
| Vice President | Group, Inc. | |
| James M. Murphy, CFA (1967) | Vice President, T. Rowe Price and T. Rowe Price | |
| President | Group, Inc. | |
| Linda A. Murphy (1959) | Vice President, T. Rowe Price and T. Rowe Price | |
| Vice President | Group, Inc. | |
| David Oestreicher (1967) | Director and Vice President, T. Rowe Price | |
| Vice President | Investment Services, Inc., T. Rowe Price | |
| Retirement Plan Services, Inc., T. Rowe | ||
| Price Services, Inc., and T. Rowe Price Trust | ||
| Company; Chief Legal Officer and Vice | ||
| President, T. Rowe Price Group, Inc.; Vice | ||
| President, T. Rowe Price and T. Rowe Price | ||
| International; Vice President, Price Hong Kong | ||
| and Price Singapore | ||
| John W. Ratzesberger (1975) | Vice President, T. Rowe Price, T. Rowe Price | |
| Vice President | Group, Inc., and T. Rowe Price Trust Company; | |
| formerly, North American Head of Listed | ||
| Derivatives Operation, Morgan Stanley | ||
| (to 2013) | ||
| Shannon H. Rauser (1987) | Employee, T. Rowe Price | |
| Assistant Secretary | ||
| Chen Shao (1980) | Vice President, T. Rowe Price and T. Rowe Price | |
| Vice President | Group, Inc. | |
| Timothy G. Taylor, CFA (1975) | Vice President, T. Rowe Price and T. Rowe Price | |
| Vice President | Group, Inc. | |
| Megan Warren (1968) | Vice President, T. Rowe Price, T. Rowe Price | |
| Vice President | Group, Inc., T. Rowe Price Retirement Plan | |
| Services, Inc., T. Rowe Price Services, Inc., | ||
| and T. Rowe Price Trust Company; formerly, | ||
| Executive Director, JP Morgan Chase (to 2017) | ||
| Unless otherwise noted, officers have been employees of T. Rowe Price or T. Rowe Price International for at least 5 years. | ||
Item 2. Code of Ethics.
The registrant has adopted a code of ethics, as defined in Item 2 of Form N-CSR, applicable to its principal executive officer, principal financial officer, principal accounting officer or controller, or persons performing similar functions. A copy of this code of ethics is filed as an exhibit to this Form N-CSR. No substantive amendments were approved or waivers were granted to this code of ethics during the period covered by this report.
Item 3. Audit Committee Financial Expert.
The registrant’s Board of Directors/Trustees has determined that Mr. Bruce W. Duncan qualifies as an audit committee financial expert, as defined in Item 3 of Form N-CSR. Mr. Duncan is considered independent for purposes of Item 3 of Form N-CSR.
Item 4. Principal Accountant Fees and Services.
(a) – (d) Aggregate fees billed for the last two fiscal years for professional services rendered to, or on behalf of, the registrant by the registrant’s principal accountant were as follows:
Audit fees include amounts related to the audit of the registrant’s annual financial statements and services normally provided by the accountant in connection with statutory and regulatory filings. Audit-related fees include amounts reasonably related to the performance of the audit of the registrant’s financial statements and specifically include the issuance of a report on internal controls and, if applicable, agreed-upon procedures related to fund acquisitions. Tax fees include amounts related to services for tax compliance, tax planning, and tax advice. The nature of these services specifically includes the review of distribution calculations and the preparation of Federal, state, and excise tax returns. All other fees include the registrant’s pro-rata share of amounts for agreed-upon procedures in conjunction with service contract approvals by the registrant’s Board of Directors/Trustees.
(e)(1) The registrant’s audit committee has adopted a policy whereby audit and non-audit services performed by the registrant’s principal accountant for the registrant, its investment adviser, and any entity controlling, controlled by, or under common control with the investment adviser that provides ongoing services to the registrant require pre-approval in advance at regularly scheduled audit committee meetings. If such a service is required between regularly scheduled audit committee meetings, pre-approval may be authorized by one audit committee member with ratification at the next scheduled audit committee meeting. Waiver of pre-approval for audit or non-audit services requiring fees of a de minimis amount is not permitted.
(2) No services included in (b) – (d) above were approved pursuant to paragraph (c)(7)(i)(C) of Rule 2-01 of Regulation S-X.
(f) Less than 50 percent of the hours expended on the principal accountant’s engagement to audit the registrant’s financial statements for the most recent fiscal year were attributed to work performed by persons other than the principal accountant’s full-time, permanent employees.
(g) The aggregate fees billed for the most recent fiscal year and the preceding fiscal year by the registrant’s principal accountant for non-audit services rendered to the registrant, its investment adviser, and any entity controlling, controlled by, or under common control with the investment adviser that provides ongoing services to the registrant were $2,160,000 and $1,840,000, respectively.
(h) All non-audit services rendered in (g) above were pre-approved by the registrant’s audit committee. Accordingly, these services were considered by the registrant’s audit committee in maintaining the principal accountant’s independence.
Item 5. Audit Committee of Listed Registrants.
Not applicable.
Item 6. Investments.
(a) Not applicable. The complete schedule of investments is included in Item 1 of this Form N-CSR.
(b) Not applicable.
Item 7. Disclosure of Proxy Voting Policies and Procedures for Closed-End Management Investment Companies.
Not applicable.
Item 8. Portfolio Managers of Closed-End Management Investment Companies.
Not applicable.
Item 9. Purchases of Equity Securities by Closed-End Management Investment Company and Affiliated Purchasers.
Not applicable.
Item 10. Submission of Matters to a Vote of Security Holders.
Not applicable.
Item 11. Controls and Procedures.
(a) The registrant’s principal executive officer and principal financial officer have evaluated the registrant’s disclosure controls and procedures within 90 days of this filing and have concluded that the registrant’s disclosure controls and procedures were effective, as of that date, in ensuring that information required to be disclosed by the registrant in this Form N-CSR was recorded, processed, summarized, and reported timely.
(b) The registrant’s principal executive officer and principal financial officer are aware of no change in the registrant’s internal control over financial reporting that occurred during the registrant’s second fiscal quarter covered by this report that has materially affected, or is reasonably likely to materially affect, the registrant’s internal control over financial reporting.
Item 12. Exhibits.
(a)(1) The registrant’s code of ethics pursuant to Item 2 of Form N-CSR is attached.
(2) Separate certifications by the registrant's principal executive officer and principal financial officer, pursuant to Section 302 of the Sarbanes-Oxley Act of 2002 and required by Rule 30a-2(a) under the Investment Company Act of 1940, are attached.
(3) Written solicitation to repurchase securities issued by closed-end companies: not applicable.
(b) A certification by the registrant's principal executive officer and principal financial officer, pursuant to Section 906 of the Sarbanes-Oxley Act of 2002 and required by Rule 30a-2(b) under the Investment Company Act of 1940, is attached.
SIGNATURES
Pursuant to the requirements of the Securities Exchange Act of 1934 and the Investment Company Act of 1940, the registrant has duly caused this report to be signed on its behalf by the undersigned, thereunto duly authorized.
T. Rowe Price Intermediate Tax-Free High Yield Fund, Inc.
| By | /s/ Edward C. Bernard | |||||
| Edward C. Bernard | ||||||
| Principal Executive Officer | ||||||
| Date | April 18, 2018 | |||||
Pursuant to the requirements of the Securities Exchange Act of 1934 and the Investment Company Act of 1940, this report has been signed below by the following persons on behalf of the registrant and in the capacities and on the dates indicated.
| By | /s/ Edward C. Bernard | |||||
| Edward C. Bernard | ||||||
| Principal Executive Officer | ||||||
| Date | April 18, 2018 | |||||
| By | /s/ Catherine D. Mathews | |||||
| Catherine D. Mathews | ||||||
| Principal Financial Officer | ||||||
| Date | April 18, 2018 | |||||
Item 12(a)(2).
CERTIFICATIONS
I, Edward C. Bernard, certify that:
| 1. | I have reviewed this report on Form N-CSR of T. Rowe Price Intermediate Tax-Free High Yield Fund; | |||
| 2. | Based on my knowledge, this report does not contain any untrue statement of a material fact or omit to state a material fact necessary to make the statements made, in light of the circumstances under which such statements were made, not misleading with respect to the period covered by this report; | |||
| 3. | Based on my knowledge, the financial statements, and other financial information included in this report, fairly present in all material respects the financial condition, results of operations, changes in net assets, and cash flows (if the financial statements are required to include a statement of cash flows) of the registrant as of, and for, the periods presented in this report; | |||
| 4. | The registrant's other certifying officer(s) and I are responsible for establishing and maintaining disclosure controls and procedures (as defined in rule 30a-3(c) under the Investment Company Act of 1940) and internal control over financial reporting (as defined in Rule 30a-3(d) under the Investment Company Act of 1940) for the registrant and have: | |||
| (a) | Designed such disclosure controls and procedures, or caused such disclosure controls and procedures to be designed under our supervision, to ensure that material information relating to the registrant, including its consolidated subsidiaries, is made known to us by others within those entities, particularly during the period in which this report is being prepared; | |||
| (b) | Designed such internal control over financial reporting, or caused such internal control over financial reporting to be designed under our supervision, to provide reasonable assurance regarding the reliability of financial reporting and the preparation of financial statements for external purposes in accordance with generally accepted accounting principles; | |||
| (c) | Evaluated the effectiveness of the registrant's disclosure controls and procedures and presented in this report our conclusions about the effectiveness of the disclosure controls and procedures, as of a date within 90 days prior to the filing date of this report based on such evaluation; and | |||
| (d) | Disclosed in this report any change in the registrant’s internal control over financial reporting that occurred during the second fiscal quarter of the period covered by this report that has materially affected, or is reasonably likely to materially affect, the registrant’s internal control over financial reporting; and | |||
| 5. | The registrant's other certifying officer(s) and I have disclosed to the registrant's auditors and the audit committee of the registrant's board of directors (or persons performing the equivalent functions): | |||
| (a) | All significant deficiencies and material weaknesses in the design or operation of internal control over financial reporting which are reasonably likely to adversely affect the registrant's ability to record, process, summarize, and report financial information; and | |||
| (b) | Any fraud, whether or not material, that involves management or other employees who have a significant role in the registrant's internal control over financial reporting. | |||
| Date: April 18, 2018 | /s/ Edward C. Bernard |
| Edward C. Bernard | |
| Principal Executive Officer |
CERTIFICATIONS
I, Catherine D. Mathews, certify that:
| 1. | I have reviewed this report on Form N-CSR of T. Rowe Price Intermediate Tax-Free High Yield Fund; | |||
| 2. | Based on my knowledge, this report does not contain any untrue statement of a material fact or omit to state a material fact necessary to make the statements made, in light of the circumstances under which such statements were made, not misleading with respect to the period covered by this report; | |||
| 3. | Based on my knowledge, the financial statements, and other financial information included in this report, fairly present in all material respects the financial condition, results of operations, changes in net assets, and cash flows (if the financial statements are required to include a statement of cash flows) of the registrant as of, and for, the periods presented in this report; | |||
| 4. | The registrant's other certifying officer(s) and I are responsible for establishing and maintaining disclosure controls and procedures (as defined in rule 30a-3(c) under the Investment Company Act of 1940) and internal control over financial reporting (as defined in Rule 30a-3(d) under the Investment Company Act of 1940) for the registrant and have: | |||
| (a) | Designed such disclosure controls and procedures, or caused such disclosure controls and procedures to be designed under our supervision, to ensure that material information relating to the registrant, including its consolidated subsidiaries, is made known to us by others within those entities, particularly during the period in which this report is being prepared; | |||
| (b) | Designed such internal control over financial reporting, or caused such internal control over financial reporting to be designed under our supervision, to provide reasonable assurance regarding the reliability of financial reporting and the preparation of financial statements for external purposes in accordance with generally accepted accounting principles; | |||
| (c) | Evaluated the effectiveness of the registrant's disclosure controls and procedures and presented in this report our conclusions about the effectiveness of the disclosure controls and procedures, as of a date within 90 days prior to the filing date of this report based on such evaluation; and | |||
| (d) | Disclosed in this report any change in the registrant’s internal control over financial reporting that occurred during the second fiscal quarter of the period covered by this report that has materially affected, or is reasonably likely to materially affect, the registrant’s internal control over financial reporting; and | |||
| 5. | The registrant's other certifying officer(s) and I have disclosed to the registrant's auditors and the audit committee of the registrant's board of directors (or persons performing the equivalent functions): | |||
| (a) | All significant deficiencies and material weaknesses in the design or operation of internal control over financial reporting which are reasonably likely to adversely affect the registrant's ability to record, process, summarize, and report financial information; and | |||
| (b) | Any fraud, whether or not material, that involves management or other employees who have a significant role in the registrant's internal control over financial reporting. | |||
| Date: April 18, 2018 | /s/ Catherine D. Mathews |
| Catherine D. Mathews | |
| Principal Financial Officer |
Item 12(b).
| CERTIFICATION UNDER SECTION 906 OF SARBANES-OXLEY ACT OF 2002 | ||
| Name of Issuer: T. Rowe Price Intermediate Tax-Free High Yield Fund | ||
| In connection with the Report on Form N-CSR for the above named Issuer, the undersigned hereby certifies, to the best of his knowledge, that: | ||
| 1. | The Report fully complies with the requirements of Section 13(a) or 15(d) of the Securities Exchange Act of 1934; | |
| 2. | The information contained in the Report fairly presents, in all material respects, the financial condition and results of operations of the Issuer. | |
| Date: April 18, 2018 | /s/ Edward C. Bernard |
| Edward C. Bernard | |
| Principal Executive Officer | |
| Date: April 18, 2018 | /s/ Catherine D. Mathews |
| Catherine D. Mathews | |
| Principal Financial Officer | |
CODE OF ETHICS FOR PRINCIPAL EXECUTIVE AND
SENIOR FINANCIAL
OFFICERS OF THE PRICE FUNDS
UNDER THE SARBANES-OXLEY ACT OF 2002
I. General Statement. This Code of Ethics (the “Price Funds S-O Code”) has been designed to bring the Price Funds into compliance with the applicable requirements of the Sarbanes-Oxley Act of 2002 (the “Act”) rules promulgated by The Securities and Exchange Commission thereunder (“Regulations”). The Price Funds S-O Code applies solely to the Principal Executive Officer, Principal Financial Officer, Principal Accounting Officer or Controller of, or persons performing similar functions for, a Price Fund (whether such persons are employed by a Price Fund or third party) (“Covered Officers”). The “Price Funds” shall include each mutual fund that is managed, sponsored and distributed by affiliates of T. Rowe Price Group, Inc. (“Group”). The investment managers to the Price Funds will be referred to as the “Price Fund Advisers.” A list of Covered Officers is attached as Exhibit A.
The Price Fund Advisers have, along with their parent, T. Rowe Price Group, Inc. (“Group”) also maintained a comprehensive Code of Ethics and Conduct (the “Group Code”) since 1972, which applies to all officers, directors and employees of the Price Funds, Group and its affiliates.
As mandated by the Act, Group has adopted a Code (the “Group S-O Code”), similar to the Price Funds S-O Code, which applies solely to its principal executive and senior financial officers. The Group S-O Code and the Price Funds S-O Code will be referred to collectively as the “S-O Codes”.
The Price Funds S-O Code has been adopted by the Price Funds in accordance with the Act and Regulations thereunder and will be administered in conformity with the disclosure requirements of Item 2 of Form N-CSR. The S-O Codes are attachments to the Group Code. In many respects the S-O Codes are supplementary to the Group Code, but the Group Code is administered separately from the S-O Codes, as the S-O Codes are from each other.
II. Purpose of the Price Funds S-O Code. The purpose of the Price Funds S-O Code, as mandated by the Act and the Regulations, is to establish standards that are reasonably designed to deter wrongdoing and to promote:
Ethical Conduct. Honest and ethical conduct, including the ethical handling of actual or apparent conflicts of interest between personal and professional relationships.
Disclosure. Full, fair, accurate, timely and understandable disclosure in reports and documents that the Price Funds file with, or submit to, the SEC and in other public communications made by the Price Funds.
Compliance. Compliance with applicable governmental laws, rules and regulations.
Reporting of Violations. The prompt internal reporting of violations of the Price Funds S-O Code to an appropriate person or persons identified in the Price Funds S-O Code.
Accountability. Accountability for adherence to the Price Funds S-O Code.
III. Covered Officers Should Handle Ethically Actual and Apparent Conflicts of Interest.
Overview. Each Covered Officer owes a duty to the Price Funds to adhere to a high standard of honesty and business ethics and should be sensitive to situations that may give rise to actual as well as apparent conflicts of interest.
A “conflict of interest” occurs when a Covered Officer’s private interest interferes with the interests of, or his or her service to, the Price Funds. For example, a conflict of interest would arise if a Covered Officer, or a member of his or her family, receives improper personal benefits as a result of his or her position with a Price Fund.
Certain conflicts of interest covered by the Price Funds S-O Code arise out of the relationships between Covered Officers and the Price Funds and may already be subject to provisions regulating conflicts of interest in the Investment Company Act of 1940 (“Investment Company Act”), the Investment Advisers Act of 1940 (“Investment Advisers Act”) and the Group Code. For example, Covered Officers may not individually engage in certain transactions (such as the purchase or sale of securities or other property) with a Price Fund because of their status as “affiliated persons” of a Price Fund. The compliance programs and procedures of the Price Funds and Price Fund Advisers are designed to prevent, or identify and correct, violations of these provisions.
Although typically not presenting an opportunity for improper personal benefit, conflicts arise from, or as a result of, the contractual relationship between a Price Fund and its Price Fund Adviser (and its affiliates) of which the Covered Officers may also be officers or employees. As a result, the Price Funds S-O Code recognizes that the Covered Officers will, in the normal course of their duties (whether formally for the Price Funds or for the Price Fund Advisers, or for both), be involved in establishing policies and implementing decisions which will have different effects on these entities. The participation of the Covered Officers in such activities is inherent in the contractual relationship between each Price Fund and its respective Price Fund Adviser. Such participation is also consistent with the performance by the Covered Officers of their duties as officers of the Price Funds and, if consistent with the provisions of the Investment Company Act and the Investment Advisers Act, it will be deemed to have been handled ethically.
Other conflicts of interest are covered by the Price Funds S-O Code, even if these conflicts of interest are not addressed by or subject to provisions in the Investment Company Act and the Investment Advisers Act.
Whenever a Covered Officer is confronted with a conflict of interest situation where he or she is uncertain as to the appropriate action to be taken, he or she should discuss the matter with the Chairperson of Group’s Ethics Committee or another member of the Committee.
Handling of Specific Types of Conflicts. Each Covered Officer (and close family members) must not:
Entertainment. Accept entertainment from any company with which any Price Fund or any Price Fund Adviser has current or prospective business dealings, including portfolio companies, unless such entertainment is in full compliance with the policy on entertainment as set forth in the Group Code.
Gifts. Accept any gifts, except as permitted by the Group Code.
Improper Personal Influence. Use his or her personal influence or personal relationships improperly to influence investment decisions, brokerage allocations or financial reporting by the Price Funds to the detriment of any one or more of the Price Funds.
Taking Action at the Expense of a Price Fund. Cause a Price Fund to take action, or fail to take action, for the personal benefit of the Covered Officer rather than for the benefit of one or more of the Price Funds.
Misuse of Price Funds’ Transaction Information. Use knowledge of portfolio transactions made or contemplated for a Price Fund or any other clients of the Price Fund Advisers to trade personally or cause others to trade in order to take advantage of or avoid the market impact of such portfolio transactions.
Outside Business Activities. Engage in any outside business activity that detracts from a Covered Officer’s ability to devote appropriate time and attention to his or her responsibilities to a Price Fund.
Service Providers. Excluding Group and its affiliates, have any ownership interest in, or any consulting or employment relationship with, any of the Price Funds’ service providers, except that an ownership interest in public companies is permitted
Receipt of Payments. Have a direct or indirect financial interest in commissions, transaction charges, spreads or other payments paid by a Price Fund for effecting portfolio transactions or for selling or redeeming shares other than an interest (such as compensation or equity ownership) arising from the Covered Officer’s employment by Group or any of its affiliates.
Service as a Director or Trustee. Serve as a director, trustee or officer of any public or private company or a non-profit organization that issues securities eligible for purchase by any of the Price Funds, unless approval is obtained as required by the Group Code.
IV. Covered Officers’ Specific Obligations and Accountabilities.
A. Disclosure Requirements and Controls. Each Covered Officer must familiarize himself or herself with the disclosure requirements (Form N-1A registration statement, proxy (Schedule 14A), shareholder reports, Forms N-SAR, N-CSR, etc.) applicable to the Price Funds and the disclosure controls and procedures of the Price Fund and the Price Fund Advisers.
B. Compliance with Applicable Law. It is the responsibility of each Covered Officer to promote compliance with all laws, rules and regulations applicable to the Price Funds and the Price Fund Advisers. Each Covered Officer should, to the extent appropriate within his or her area of responsibility, consult with other officers and employees of the Price Funds and the Price Fund Advisers and take other appropriate steps with the goal of promoting full, fair, accurate, timely and understandable disclosure in the reports and documents the Price Funds file with, or submit to, the SEC, and in other public communications made by the Price Funds.
C. Fair Disclosure. Each Covered Officer must not knowingly misrepresent, or cause others to misrepresent, facts about a Price Fund to others, whether within or outside the Price organization, including to the Price Fund’s directors and auditors, and to governmental regulators and self-regulatory organizations.
D. Initial and Annual Affirmations. Each Covered Officer must:
1. Upon adoption of the Price Funds S-O Code (or thereafter, as applicable, upon becoming a Covered Officer), affirm in writing that he or she has received, read, and understands the Price Funds S-O Code.
2. Annually affirm that he or she has complied with the requirements of the Price Funds S-O Code.
E. Reporting of Material Violations of the Price Funds S-O Code. If a Covered Officer becomes aware of any material violation of the Price Funds S-O Code or laws and governmental rules and regulations applicable to the operations of the Price Funds, he or she must promptly report the violation (“Report”) to the Chief Legal Counsel of the Price Funds (“CLC”). Failure to report a material violation will be considered itself a violation of the Price Funds S-O Code. The CLC is identified in the attached Exhibit B.
It is the Price Funds policy that no retaliation or other adverse action will be taken against any Covered Officer or other employee of a Price Fund, a Price Fund Adviser or their affiliates based upon any lawful actions of the Covered Officer or employee with respect to a Report made in good faith.
F. Annual Disclosures. Each Covered Officer must report, at least annually, all affiliations or other relationships as called for in the “Annual Questionnaire for Executive Officers and/or Employee Directors/Trustees of Group and the Price Funds.”
V. Administration of the Price Funds S-O Code. The Ethics Committee is responsible for administering the Price Funds S-O Code and applying its provisions to specific situations in which questions are presented.
A. Waivers and Interpretations. The Chairperson of the Ethics Committee has the authority to interpret the Price Funds S-O Code in any particular situation and to grant waivers where justified, subject to the approval of the Joint Audit Committee of the Price Funds. All material interpretations concerning Covered Officers will be reported to the Joint Audit Committee of the Price Funds at its next meeting. Waivers, including implicit waivers, to Covered Officers will be publicly disclosed as required in the Instructions to N-CSR. Pursuant to the definition in the Regulations, an implicit waiver means a Price Fund’s failure to take action within a reasonable period of time regarding a material departure from a provision of the Price Funds S-O Code that has been made known to an “executive officer” (as defined in Rule 3b-7 under the Securities Exchange Act of 1934) of a Price Fund. An executive officer of a Price Fund includes its president and any vice-president in charge of a principal business unit, division or function.
B. Violations/Investigations. The following procedures will be followed in investigating and enforcing the Price Funds S-O Code:
1. The CLC will take or cause to be taken appropriate action to investigate any potential or actual violation reported to him or her.
2. The CLC, after consultation if deemed appropriate with Outside Counsel to the Price Funds, will make a recommendation to the appropriate Price Funds Board regarding the action to be taken with regard to each material violation. Such action could include any of the following: a letter of censure or suspension, a fine, a suspension of trading privileges or termination of officership or employment. In addition, the violator may be required to surrender any profit realized (or loss avoided) from any activity that is in violation of the Price Funds S-O Code.
VI. Amendments to the Price Funds S-O Code. Except as to the contents of Exhibit A and Exhibit B, the Price Funds S-O Code may not be materially amended except in written form, which is specifically approved or ratified by a majority vote of each Price Fund Board, including a majority of the independent directors on each Board.
VII. Confidentiality. All reports and records prepared or maintained pursuant to the Price Funds S-O Code will be considered confidential and shall be maintained and protected accordingly. Except as otherwise required by law, the Price Funds S-O Code or as necessary in connection with regulations under the Price Funds S-O Code, such matters shall not be disclosed to anyone other than the directors of the appropriate Price Fund Board, Outside Counsel to the Price Funds, members of the Ethics Committee and the CLC and authorized persons on his or her staff.
Preparation Date: 9/30/03
Adoption Date: 10/22/03
Exhibit A
Persons Covered by the Price Funds S-O Code of
Ethics
Edward C. Bernard, Chairman and Chief Executive Officer
Catherine
D. Mathews, Treasurer and Chief Financial Officer
Exhibit B
David Oestreicher, Chief Legal Counsel to the Price Funds
Serious News for Serious Traders! Try StreetInsider.com Premium Free!
You May Also Be Interested In
- ROSEN, A LEADING AND TOP RANKED LAW FIRM, Encourages Lifecore Biomedical Inc. f/k/a Landec Corporation Investors to Inquire About Securities Class Action Investigation – LFCR, LNDC
- ROSEN, A LEADING NATIONAL FIRM, Encourages Sharecare, Inc. Investors to Secure Counsel Before Important Deadline in Securities Class Action First Filed by the Firm – SHCR
- Galway Metals Announces Closing of Private Placement of Flow-Through Units
Create E-mail Alert Related Categories
SEC FilingsSign up for StreetInsider Free!
Receive full access to all new and archived articles, unlimited portfolio tracking, e-mail alerts, custom newswires and RSS feeds - and more!
