

Form N-CSR Starboard Investment For: Mar 31
 Tweet
Tweet Share
ShareUNITED STATES
SECURITIES AND EXCHANGE COMMISSION
Washington, D.C. 20549
SECURITIES AND EXCHANGE COMMISSION
Washington, D.C. 20549
FORM N-CSR
CERTIFIED SHAREHOLDER REPORT OF REGISTERED
MANAGEMENT INVESTMENT COMPANIES
Investment Company Act file number 811-22298
Starboard Investment Trust
(Exact name of registrant as specified in charter)
(Exact name of registrant as specified in charter)
116 South Franklin Street, Rocky Mount, North Carolina 27802
(Address of principal executive offices) (Zip code)
Paracorp Inc.
2140 South Dupont Hwy., Camden, DE 19934
(Name and address of agent for service)
Registrant's telephone number, including area code: 252-972-9922
Date of fiscal year end: March 31
Date of reporting period: March 31, 2021
Item 1. REPORTS TO STOCKHOLDERS.
Annual Report 2021
For the fiscal year ended March 31, 2021
Matisse Discounted Closed-End Fund
Strategy

Institutional Class Shares
This report and the financial statements contained herein are submitted for the general information of the shareholders of the Matisse Discounted Closed-End Fund Strategy (the “Fund”). The Fund’s shares are not
deposits or obligations of, or guaranteed by, any depository institution. The Fund’s shares are not insured by the FDIC, Federal Reserve Board or any other agency, and are subject to investment risks, including possible loss of principal amount
invested. Neither the Fund nor the Fund’s distributor is a bank.
The Matisse Discounted Closed-End Fund Strategy is distributed by Capital Investment Group, Inc., Member FINRA/SIPC, 100 E. Six Forks Road, Suite 200, Raleigh, NC, 27609. There is no affiliation between the Matisse
Discounted Closed-End Fund Strategy, including its principals, and Capital Investment Group, Inc.
|
Statements in this Annual Report that reflect projections or expectations of future financial or economic performance of the Matisse Discounted Closed-End Fund Strategy (“Fund”) and of the market in
general and statements of the Fund’s plans and objectives for future operations are forward-looking statements. No assurance can be given that actual results or events will not differ materially from those projected, estimated, assumed
or anticipated in any such forward-looking statements. Important factors that could result in such differences, in addition to the other factors noted with such forward-looking statements, include, without limitation, general economic
conditions such as inflation, recession and interest rates. Past performance is not a guarantee of future results.
An investor should consider the investment objectives, risks, charges and expenses of the Fund carefully
before investing. The prospectus contains this and other information about the Fund. A copy of the prospectus is available at https://docs.nottinghamco.com/Matisse or by calling Shareholder Services at 800-773-3863. The prospectus
should be read carefully before investing.
|
For More Information on the Matisse Discounted Closed-End Fund Strategy:
See Our Web sites @ matissefunds.com
or
Call Our Shareholder Services Group at 800-773-3863.
(Unaudited)
Dear MDCEX Shareholder:
Enclosed please find the Annual Report for the Matisse Discounted Closed-End Fund Strategy (MDCEX; hereafter the “Fund”) for the period ending March 31st, 2021. The Fund formally
launched on October 31st, 2012.
What a difference a year makes! As we wrote this annual letter one year ago, the global financial markets had just fallen sharply, and discounts on closed-end funds had widened dramatically, as
investors panicking about COVID-19 sold just about everything. At the widest point (March 18th, 2020), discounts in the Fund’s underlying portfolio averaged 31%, and the average closed-end fund was trading at a 21% discount. Oil prices
were in the tank. The Fund’s performance---both on an absolute and relative basis---was lagging its benchmarks.
Fast forward to today:
| • | Major stock markets have jumped 80+% from those March 2020 lows, with small caps, energy, and tech stocks leading the way. |
| • | Oil prices are near multi-year highs, over $60 a barrel, and many other commodities are at or near new records. |
|
•
|
The US economy is likely in its fourth straight quarter of strong recovery, with first quarter GDP clocking in at over 6%, and the unemployment rate back down to 6% (a level it took until late 2014 to move below coming out of the 2008/2009 recession) even with many retail establishments still at least partially closed due to COVID-19 restrictions. |
|
•
|
Democrats are now in control of both the executive and legislative branches, and the rate of government spending---already high coming into 2021---looks set to gap even higher, with tax cuts for the middle class, stimulus checks, and trillions in infrastructure spending. |
|
•
|
Though the Fund’s portfolio remains very attractively discounted---at 17.5% as of quarter end---the average closed-end fund is now slightly less discounted than its long-run average discount. |
In brief, we believe the reopening trade is alive and well, as pent-up demand from the American consumer---juiced by government largesse and perpetually low interest rates---is driving up
profits, prices, and asset values simultaneously.
As you can see from the nearby table, the Fund performed very well over the past 12 months, both absolutely and in relative terms. Digging into this further, we find that we benefitted from the
reversal of nearly all the factors that negatively impacted us from 3/31/19-3/31/20.
Specifically, from 3/31/20-3/31/21:
|
1.
|
Most closed-end fund discounts narrowed and NAVs increased. For the 12-month period, the average closed-end fund saw its discount narrow by 4.7%. Our trading and fund selection (which has led our
discount-movement-attributed performance to exceed the closed-end fund universe’s in 80% of rolling quarters since we launched the Fund) was a strong positive factor, as discount movement/capture within the Fund contributed 822 bps to our
total return.
|
|
2.
|
Offsetting the benefit from closed-end fund discounts and trading, our exposures to Foreign and Value were a negative, as the Russell 1000 Value lost to the Russell 1000 Growth by about
7 percentage points, and the MSCI EAFE index lost to the S&P 500 by about 12 percentage points for the period 3/31/20-3/31/21. Ballpark, our overweight to these areas cost us approximately 2 percentage points of relative performance.
It is worth noting that, for the second half of the period (9/30/20-3/31/21), Value beat Growth and the MSCI EAFE beat the S&P 500, as the reopening trade took firmer hold.
|
|
3.
|
Our exposure to the Energy sector, unlike 3/31/19-3/31/20, was a major positive factor. A strong rebound in oil prices helped lead to a 78% gain for large-cap energy names, and a 99%
gain for MLPs from 3/31/20-3/31/21. Discounts on our MLP CEFs narrowed considerably (though they remain extremely attractive at over a 20% discount), adding to the performance contribution. Our energy and commodity holdings as a group
contributed about 10 percentage points to our return for the 12 months.
|
Average Annual Total Returns
|
Period ended
March 31, 2021
|
One Year
|
Five Year Annualized
|
Annualized Since
Inception 10/31/2012
|
|
MDCEX
|
+64.68%
|
+9.73%
|
+7.17%
|
|
S&P 500 Index
|
+56.35%
|
+16.28%
|
+15.40%
|
|
S-Network Composite
Closed-End Fund Total
Return Index
|
+43.58%
|
+9.81%
|
+7.36%
|
|
S&P Target Risk
Moderate Index
|
+21.79%
|
+7.50%
|
+6.53%
|
|
MSCI EAFE Total Return
Index
|
+44.57%
|
+8.85%
|
+7.33%
|
|
Barclays US Aggregate
Bond Total Return Index
|
+0.71%
|
+3.10%
|
+2.72%
|
The performance information quoted represents past performance, which is not a guarantee of future results. Investment return and principal value of an investment will fluctuate so that an
investor’s shares, when redeemed, may be worth more or less than their original cost. Current performance may be lower or higher than the performance data quoted. An investor may obtain performance data current to the most recent month-end by
calling 1-800-773-3863. Total return measures net investment income and capital gain or loss from portfolio investments. All performance shown assumes reinvestment of dividends and capital gains distributions.
The Total Annual Fund Operating Expense for the Fund as disclosed in the prospectus is 3.48% dated August 1, 2020. The Total Annual Fund Operating Expense is required to
include expenses incurred indirectly by the Fund through its investments in closed-end funds and other investment companies. The Advisor has entered into an expense limitation agreement with the Fund under which it has agreed to waive or reduce its
fees and to assume other expenses of the Fund, if necessary, in an amount that limits the Fund’s annual operating expenses (exclusive of (i) any 12b-1 fees; (ii) any front-end or contingent deferred loads; (iii) brokerage fees and commissions, (iv)
acquired fund fees and expenses; (v) fees and expenses associated with investments in other collective investment vehicles or derivative instruments (including, for example, option and swap fees and expenses); (vi) borrowing costs (such as interest
and dividend expense on securities sold short); (vii) taxes; and (viii) extraordinary expenses, such as litigation expenses (which may include indemnification of Fund officers and Trustees and contractual indemnification of Fund service providers
(other than the Advisor)) to not more than 1.25% of the average daily net assets of the Fund. The Expense Limitation Agreement runs through July 31, 2021 and may be terminated by the Board of Trustees of the Fund at any time. “Acquired Fund Fees
and Expenses” include expenses incurred indirectly by the Fund through its investments in closed-end funds and other investment companies, do not affect a Fund’s actual operating costs, and therefore are not included in the Fund’s financial
statements, which provide a clearer picture of a Fund’s actual operating costs. The Advisor cannot recoup from the fund any amounts paid to the Advisor under the expense limitation agreement. However, net annual operating expenses for the Fund may
exceed those contemplated by the waiver due to expenses that are not waived under the Expense Limitation Agreement.
Management Outlook
Right now, we continue to maintain a highly diversified portfolio with 77 holdings as of quarter-end. We began tactically increasing the Fund’s energy exposure during the second half of 2020,
which now stands at 15% of the overall portfolio. Healthcare, financial services, and consumer cyclical are our next largest equity sectors, each at 9% to 10% of our portfolio. Overall, our equity exposure is right at 80%, with about one-third of
that foreign.
Although the underlying portfolio of the Fund is full of closed-end funds whose discounts are still large (both in absolute terms and compared to their long-term average discount levels), we are
slowly building some cash in the Fund given that discount opportunities are neither as large (nor as common) as they were throughout much of 2020. As we move forward with this process, we expect to eventually hold somewhat fewer names (perhaps
50-60 instead of 70-80), and we expect to potentially realize some long-term gains on holdings whose discounts have narrowed substantially.
To provide more color – going forward we intend to focus on reducing downside volatility by building some cash (and possibly hedging the Fund’s portfolio in various ways), so that we are prepared
with more cash to potentially take advantage of any compelling discount opportunities that may arise. We believe this more conservative and cautious approach is appropriate given that most of our shareholders place MDCEX into a tactical,
opportunistic bucket. After such a significant performance run-up over the last 12 months, we are now willing to give up some upside return at the expense of having more cash or for the cost of hedging. We believe that this adjusted approach may
help reduce stress for our shareholders, and potentially help them avoid making any poor decisions around investment timing.
Historically speaking, discount tops in the closed-end fund market have typically manifested as long periods of meandering, narrower-than-average discounts followed by a sharp discount blowout
which has tended to coincide with downside volatility across several other risk markets. Discount bottoms, on the other hand, have tended to be sharp and short-lived, and have typically been marked by major socio-economic events (the tech wreck of
the early 2000s, the mortgage crisis of 2008, and the more recent COVID-19 crisis). Our primary takeaway is that holding much more than 20% cash within the Fund is not usually a wise decision. We have explored other ways to hedge the Fund as well,
and may implement some of them, at low levels, at various points going forward (if or when we feel discounts are very unattractive).
But note this is not the situation we find ourselves in today. While the average discount in the entire CEF universe is 3.8% as of quarter-end (compared to a trailing 10-year average discount of
5.4%), we do not believe we are near a discount top. As a point of emphasis, the average closed-end fund discount in the entire universe has been narrower than 3.8% approximately one-third of the time. So, we believe there is still room for
discounts to run barring any significant market changes. Consider that the average discount to NAV in the underlying portfolio of the Fund is 17.5% as of quarter-end.
We have previously noted and continue to believe that one important advantage for closed-end funds, in general (as we consider the overall outlook for the Fund) is today’s low interest rates.
Back in 2008, the 10-year US treasury yield never fell below 2.00%. As of quarter-end, the 10-year US treasury yield was 1.74%. More importantly, the Fed has committed itself to zero rates for the foreseeable future, even stating explicitly that
they will allow inflation to run above two percent “for a time” (should that ever come to pass). In our view, the structural advantages of closed-end funds (easy and cheap borrowing paired with high and largely sustainable cash distributions) will
eventually be found by an increasing number of investors who ignore closed-end funds now. Investors desire yield, and closed-end funds may eventually become a mainstream and common option to satisfy investor’s income needs. If this trend is
realized, then discounts could ultimately narrow for secular reasons for years to come. In our opinion, it makes closed-end fund investing that much more exciting.
Despite COVID-19, the US stock market had a great year in 2020 and has continued to move higher in 2021 (as it anticipates the reopening of the economy). The forward PE of the S&P 500 now
stands at 24, well above its average of 18 over the past 30 years (and the trailing PE is an astonishing 33). The open question is whether the strong economic growth that could occur in the second half of 2021 (due to the anticipated reopening of
the economy, along with record-low interest rates that could persist for many years) is sufficient to support stock prices at current levels or potentially drive them higher.
Our largest position continues to be Pershing Square Holdings, an 8.7% position for the Fund at quarter-end. This closed-end fund’s shares trade overseas (London and Amsterdam), but it is managed
by US hedge fund manager Bill Ackman and contains mostly high-quality US stocks. Despite excellent underlying performance (a 110% at-NAV return over the past two years, helped by some timely March 2020 hedging), fund and manager share purchases,
and a regular quarterly dividend, the fund still traded at a very high 27% discount to NAV at quarter-end. We expect this discount will not persist for long.
There are other, similar deals across the Fund’s underlying portfolio, including one trading at less than half of its NAV.
A New Fund in the Matisse Funds Family
Effective April 30th, 2020, Matisse launched our second mutual fund, the Matisse Discounted Bond CEF Strategy (MDFIX). Within it, we apply our discount-focused strategy to Bond CEFs
specifically. See the new Fund’s prospectus for more information. We appreciate your interest in, and investment in, the Fund. We’ll continue to keep you updated on the important developments we see in the misunderstood, retail-dominated world of
closed-end funds. Check out https://matissefunds.com/ for updates, and feel free to contact us at 503-210-3005 to discuss the Matisse Discounted Closed-End Fund Strategy and our investment approach.
Sincerely,
 |
 |
|
Eric Boughton, CFA
Portfolio Manager
Matisse Funds
|
Bryn Torkelson
Founder & CIO
Matisse Funds
|
(RCMAT0321008)
|
Matisse Discounted Closed-End Fund Strategy
|
|||||||||||||||||
|
Institutional Class Shares
|
|||||||||||||||||
|
Performance Update (Unaudited)
|
|||||||||||||||||
|
For the period from October 31, 2012 (Date of Initial Public Investment) through March 31, 2021
|
|||||||||||||||||
|
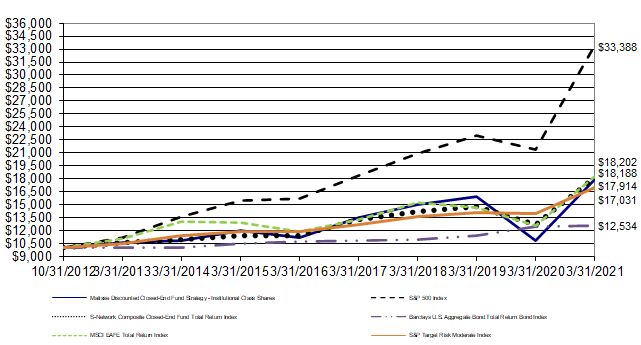
Comparison of the Change in Value of a $10,000 Investment
|
|||||||||||||||||
|
This graph assumes an initial investment of $10,000 at October 31, 2012 (Date of Initial Public Investment). All dividends and distributions are reinvested. This graph depicts the performance of the Matisse Discounted Closed-End Fund
Strategy versus the Fund's benchmark index, the S&P 500 Index. Other indices shown are the S-Network Composite Closed-End Fund Total Return Index, the Barclays U.S. Aggregate Total Return Bond Index, the S&P Target Risk Moderate
Index, and the MSCI EAFE Total Return Index. It is important to note that the Fund is a professionally managed mutual fund while the indices are not available for investment and are unmanaged. The comparison is shown for illustrative
purposes only.
|
||||||||||||||||||
|
Average Annual Total Returns
|
||||||||||||||||||
|
For the Fiscal Year Ended
|
One
|
Five
|
Since
|
|||||||||||||||
|
March 31, 2021
|
Year
|
Years
|
Inception*
|
|||||||||||||||
|
Institutional Class Shares
|
64.68%
|
9.73%
|
7.17%
|
|||||||||||||||
|
S&P 500 Index
|
56.35%
|
16.28%
|
15.40%
|
|||||||||||||||
|
S-Network Composite Closed-End Fund Total
|
||||||||||||||||||
|
Return Index
|
43.58%
|
9.81%
|
7.36%
|
|||||||||||||||
|
S&P Target Risk Moderate Index
|
21.79%
|
7.50%
|
6.53%
|
|||||||||||||||
|
MSCI EAFE Total Return Index
|
44.57%
|
8.85%
|
7.33%
|
|||||||||||||||
|
Barclays U.S. Aggregate Total Return Bond Index
|
0.71%
|
3.10%
|
2.72%
|
|||||||||||||||
|
*
|
The Inception Date of the Fund is October 31, 2012.
|
|||||||||||||||||
|
(Continued)
|
||||||||||||||||||
|
Matisse Discounted Closed-End Fund Strategy
|
|||||||||||||||||
|
Institutional Class Shares
|
|||||||||||||||||
|
Performance Update (Unaudited)
|
|||||||||||||||||
|
For the period from October 31, 2012 (Date of Initial Public Investment) through March 31, 2021
|
|||||||||||||||||
|
Performance quoted in the previous graph represents past performance, which is no guarantee of future results. Investment return and principal value will fluctuate so that shares, when redeemed, may be worth more or less than their
original cost. Current performance may be lower or higher than the performance data quoted. The Advisor has entered into an Expense Limitation Agreement with the Trust, on behalf of the Fund, under which it has agreed to waive or reduce
its fees and to assume other expenses of the Fund, if necessary, in amounts that limit the Fund’s total operating expenses (exclusive of (i) any front-end or contingent deferred loads; (ii) brokerage fees and commissions; (iii) acquired
fund fees and expenses; (iv) fees and expenses associated with investments in other collective investment vehicles or derivative instruments (including, for example, option and swap fees and expenses); (v) borrowing costs (such as interest
and dividend expense on securities sold short); (vi) taxes and (vii) extraordinary expenses, such as litigation expenses (which may include indemnification of Fund officers and Trustees and contractual indemnification of Fund service
providers (other than the Advisor)) to not more than 1.25% of the average daily net assets of the Fund for the current fiscal year. The Expense Limitation Agreement remains in effect through July 31, 2021. The Expense Limitation Agreement
may be terminated by the Board of Trustees of the Trust at any time. Without the waiver, the expenses would be 3.48% per the Fund’s most recent prospectus dated August 1, 2020. An investor may obtain performance data, current to the most
recent month-end, by visiting ncfunds.com.
|
|||||||||||||||||
|
The graph and table do not reflect the deduction of taxes that a shareholder would pay on Fund distributions or the redemption of Fund shares. Average annual total returns are historical in nature and measure
net investment income and capital gain or loss from portfolio investments assuming reinvestments of distributions.
|
|||||||||||||||||
|
Matisse Discounted Closed-End Fund Strategy
|
|||||||||
|
Schedule of Investments
|
|||||||||
|
As of March 31, 2021
|
|||||||||
|
Shares
|
Value (Note 1)
|
||||||||
|
CLOSED-END FUNDS - 101.00%
|
|||||||||
|
Aberdeen Asia-Pacific Income Fund, Inc.
|
725,213
|
$
|
2,966,121
|
||||||
|
Aberdeen Emerging Markets Equity Income Fund, Inc.
|
117,348
|
1,015,060
|
|||||||
|
Aberdeen Japan Equity Fund, Inc.
|
270,018
|
2,435,562
|
|||||||
|
Aberdeen Standard Global Infrastructure Income Fund
|
61,670
|
1,233,400
|
|||||||
|
(a)
|
Adams Diversified Equity Fund, Inc.
|
653,582
|
11,934,407
|
||||||
|
Apollo Senior Floating Rate Fund, Inc.
|
74,404
|
1,105,643
|
|||||||
|
ASA Gold and Precious Metals Ltd.
|
341,298
|
6,808,929
|
|||||||
|
Blackrock Health Sciences Trust II
|
125,000
|
3,287,500
|
|||||||
|
BlackRock Science & Technology Trust II
|
98,000
|
3,497,620
|
|||||||
|
(a)
|
Boulder Growth & Income Fund, Inc.
|
400,525
|
5,038,605
|
||||||
|
Calamos Long/Short Equity & Dynamic Income Trust
|
446,000
|
8,969,060
|
|||||||
|
CBRE Clarion Global Real Estate Income Fund
|
581,001
|
4,537,618
|
|||||||
|
Center Coast Brookfield MLP & Energy Infrastructure Fund
|
147,000
|
1,609,650
|
|||||||
|
(a)
|
Central and Eastern Europe Fund, Inc.
|
49,985
|
1,203,639
|
||||||
|
Central Securities Corp.
|
292,000
|
11,069,720
|
|||||||
|
(a)
|
ClearBridge Energy Midstream Opportunity Fund, Inc.
|
295,271
|
5,515,662
|
||||||
|
Clough Global Equity Fund
|
396,000
|
6,015,240
|
|||||||
|
Clough Global Opportunities Fund
|
53,146
|
651,039
|
|||||||
|
Dividend and Income Fund
|
370,000
|
4,754,500
|
|||||||
|
*
|
Duff & Phelps Select MLP and Midstream Energy Fund, Inc.
|
13,022
|
95,712
|
||||||
|
Eagle Capital Growth Fund, Inc.
|
86,401
|
721,448
|
|||||||
|
First Eagle Senior Loan Fund
|
222,000
|
3,183,480
|
|||||||
|
First Trust Dynamic Europe Equity Income Fund
|
73,522
|
933,729
|
|||||||
|
First Trust Energy Infrastructure Fund
|
30,000
|
371,400
|
|||||||
|
General American Investors Co., Inc.
|
152,128
|
6,060,780
|
|||||||
|
(a)
|
Goldman Sachs MLP Energy and Renaissance Fund
|
147,902
|
1,431,691
|
||||||
|
Highland Global Allocation Fund
|
681,000
|
5,250,510
|
|||||||
|
Highland Income Fund
|
1,377,000
|
15,270,930
|
|||||||
|
(a)
|
Japan Smaller Capitalization Fund, Inc.
|
392,925
|
3,654,203
|
||||||
|
Kayne Anderson Energy Infrastructure Fund
|
343,603
|
2,463,634
|
|||||||
|
Kayne Anderson NextGen Energy & Infrastructure, Inc.
|
1,227,602
|
8,175,829
|
|||||||
|
Macquarie Global Infrastructure Total Return Fund, Inc.
|
136,000
|
2,972,960
|
|||||||
|
Miller/Howard High Dividend Fund
|
560,000
|
5,376,000
|
|||||||
|
(a)
|
Morgan Stanley China A Share Fund, Inc.
|
551,000
|
12,425,050
|
||||||
|
(a)
|
Morgan Stanley Emerging Markets Domestic Debt Fund, Inc.
|
1,493,000
|
8,987,860
|
||||||
|
(a)
|
Morgan Stanley India Investment Fund, Inc.
|
275,901
|
6,431,915
|
||||||
|
Neuberger Berman MLP & Energy Income Fund, Inc.
|
1,223,585
|
5,139,057
|
|||||||
|
NexPoint Strategic Opportunities Fund
|
751,600
|
8,560,724
|
|||||||
|
Nuveen Diversified Dividend and Income Fund
|
93,813
|
889,347
|
|||||||
|
Pershing Square Holdings Ltd.
|
790,000
|
28,297,800
|
|||||||
|
PIMCO Energy & Tactical Credit Opportunities Fund
|
564,558
|
5,843,175
|
|||||||
|
Principal Real Estate Income Fund
|
148,877
|
2,010,584
|
|||||||
|
RiverNorth Specialty Finance Corp.
|
85,746
|
1,534,845
|
|||||||
|
RMR Mortgage Trust
|
297,923
|
3,575,076
|
|||||||
|
Royce Micro-Cap Trust, Inc.
|
413,000
|
4,666,900
|
|||||||
|
Royce Value Trust, Inc.
|
114,207
|
2,068,289
|
|||||||
|
(Continued)
|
|||||||||
|
Matisse Discounted Closed-End Fund Strategy
|
|||||||||
|
Schedule of Investments
|
|||||||||
|
As of March 31, 2020
|
|||||||||
|
Shares
|
Value (Note 1)
|
||||||||
|
CLOSED-END FUNDS - Continued
|
|||||||||
|
(a)
|
Salient Midstream & MLP Fund
|
531,000
|
$
|
2,708,100
|
|||||
|
Tekla Healthcare Investors
|
169,541
|
4,138,496
|
|||||||
|
Tekla Life Sciences Investors
|
319,311
|
6,293,620
|
|||||||
|
Templeton Emerging Markets Income Fund
|
140,531
|
1,035,714
|
|||||||
|
Tetragon Financial Group Ltd.
|
1,027,007
|
9,982,508
|
|||||||
|
(a)
|
The China Fund, Inc.
|
119,170
|
3,488,106
|
||||||
|
The Cushing MLP & Infrastructure Total Return Fund
|
66,000
|
1,643,400
|
|||||||
|
The Cushing NextGen Infrastructure Income Fund
|
11,226
|
453,306
|
|||||||
|
The Gabelli Dividend & Income Trust
|
165,002
|
3,953,448
|
|||||||
|
The Gabelli Global Small and Mid Cap Value Trust
|
222,047
|
3,239,666
|
|||||||
|
The Gabelli Healthcare & WellnessRx Trust
|
206,220
|
2,569,501
|
|||||||
|
The GDL Fund
|
205,769
|
1,837,517
|
|||||||
|
The Herzfeld Caribbean Basin Fund, Inc.
|
105,933
|
622,886
|
|||||||
|
The India Fund, Inc.
|
24,081
|
516,537
|
|||||||
|
(a)
|
The New Ireland Fund, Inc.
|
149,000
|
1,680,720
|
||||||
|
The Swiss Helvetia Fund, Inc.
|
303,803
|
2,670,428
|
|||||||
|
(a)
|
The Taiwan Fund, Inc.
|
93,000
|
2,627,250
|
||||||
|
*
|
Third Point Investors Ltd.
|
770,000
|
17,941,000
|
||||||
|
*
|
Tortoise Energy Independence Fund, Inc.
|
55,000
|
951,500
|
||||||
|
(a)
|
Tortoise Energy Infrastructure Corp.
|
284,517
|
6,953,595
|
||||||
|
Tortoise Essential Assets Income Term Fund
|
331,170
|
4,748,978
|
|||||||
|
(a)
|
Tortoise Midstream Energy Fund, Inc.
|
189,000
|
4,859,190
|
||||||
|
Tortoise Pipeline & Energy Fund, Inc.
|
11,721
|
240,046
|
|||||||
|
Tortoise Power and Energy Infrastructure Fund, Inc.
|
2,035
|
24,603
|
|||||||
|
Vertical Capital Income Fund
|
311,000
|
3,203,300
|
|||||||
|
Virtus AllianzGI Convertible & Income Fund II
|
170,010
|
846,650
|
|||||||
|
(a)
|
Voya Global Advantage and Premium Opportunity Fund
|
464,610
|
4,446,318
|
||||||
|
Voya Global Equity Dividend and Premium Opportunity Fund
|
783,000
|
4,463,100
|
|||||||
|
Total Closed-End Funds (Cost $235,468,875)
|
328,181,386
|
||||||||
|
EXCHANGE-TRADED PRODUCTS - 1.28%
|
|||||||||
|
Energy - 1.28%
|
|
||||||||
|
Alerian MLP ETF
|
100,000
|
$
|
3,050,000
|
||||||
|
Global X MLP & Energy Infrastructure ETF
|
35,000
|
1,106,000
|
|||||||
|
Total Exchange-Traded Products (Cost $3,928,414)
|
4,156,000
|
||||||||
|
PREFERRED STOCK - 1.72%
|
|||||||||
|
Financials - 1.72%
|
|
||||||||
|
NexPoint Strategic Opportunities Fund
|
262,656
|
5,576,187
|
|||||||
|
Total Preferred Stock (Cost $5,556,697)
|
5,576,187
|
||||||||
|
SHORT-TERM INVESTMENT - 0.23%
|
|||||||||
|
§
|
Fidelity Institutional Money Market Funds - Government Portfolio, 0.01%
|
751,805
|
|
751,805
|
|||||
|
Total Short-Term Investment (Cost $751,805)
|
751,805
|
||||||||
|
(Continued)
|
|||||||||
|
Matisse Discounted Closed-End Fund Strategy
|
|||||||||
|
Schedule of Investments
|
|||||||||
|
As of March 31, 2020
|
|||||||||
|
Value (Note 1)
|
|||||||||
|
Investments, at Value (Cost $245,705,791) - 104.23%
|
$
|
338,665,378
|
|||||||
|
Liabilities in Excess of Other Assets - (4.23)%
|
(13,744,379)
|
||||||||
|
Net Assets - 100.00%
|
$
|
324,920,999
|
|||||||
|
(a)
|
Securities pledged as collateral for margin/borrowings.
|
||||||||
|
*
|
Non-income producing investment
|
||||||||
|
§
|
Represents 7 day effective SEC yield
|
||||||||
|
The following acronyms or abbreviations are used in this Schedule:
|
|||||||||
|
MLP - Master Limited Partnership
|
|||||||||
|
ETF - Exchange-Traded Fund
|
|||||||||
|
Summary of Investments
|
|||||||||
|
% of Net
|
|||||||||
|
Assets
|
Value
|
||||||||
|
Closed-End Funds
|
101.00%
|
$
|
328,181,386
|
||||||
|
Exchange-Traded Products:
|
|||||||||
|
Energy
|
1.28%
|
4,156,000
|
|||||||
|
Preferred Stock:
|
|||||||||
|
Financials
|
1.72%
|
5,576,187
|
|||||||
|
Short-Term Investment
|
0.23%
|
751,805
|
|||||||
|
LIabilities in Excess of Other Assets
|
-4.23%
|
(13,744,379)
|
|||||||
|
Total Net Assets
|
100.00%
|
$
|
324,920,999
|
||||||
|
See Notes to Financial Statements
|
|||||||||
|
Matisse Discounted Closed-End Fund Strategy
|
|||
|
Statement of Assets and Liabilities
|
|||
|
As of March 31, 2021
|
|||
|
Assets:
|
|||
|
Investments, at value (cost $245,705,791)
|
$
|
338,665,378
|
|
|
Receivables:
|
|||
|
Investments sold
|
2,137,391
|
||
|
Fund shares sold
|
83,220
|
||
|
Dividends and interest
|
365,277
|
||
|
Prepaid Expenses:
|
|||
|
Registration and filing expenses
|
21,851
|
||
|
Fund accounting fees
|
2,392
|
||
|
Trustee fees and meeting expenses
|
959
|
||
|
Total assets
|
341,276,468
|
||
|
Liabilities:
|
|||
|
Due to broker
|
15,744,824
|
||
|
Payables:
|
|||
|
Fund shares repurchased
|
262,039
|
||
|
Accrued expenses:
|
|||
|
Advisory fees
|
287,255
|
||
|
Professional fees
|
33,019
|
||
|
Shareholder fulfillment expenses
|
11,077
|
||
|
Interest expense
|
7,371
|
||
|
Custody fees
|
6,525
|
||
|
Administration fees
|
1,276
|
||
|
Miscellaneous expenses
|
911
|
||
|
Security pricing fees
|
599
|
||
|
Insurance fees
|
518
|
||
|
Compliance fees
|
55
|
||
|
Total liabilities
|
16,355,469
|
||
|
Net Assets
|
$
|
324,920,999
|
|
|
Net Assets Consist of:
|
|||
|
Paid in Interest
|
$
|
239,568,306
|
|
|
Distributable earnings
|
85,352,693
|
||
|
Net Assets
|
$
|
324,920,999
|
|
|
Institutional Class shares outstanding, no par value (unlimited authorized shares)
|
35,742,092
|
||
|
Net Assets
|
$
|
324,920,999
|
|
|
Net Asset Value, Maximum Offering Price, and Redemption Price Per Share
|
$
|
9.09
|
|
|
See Notes to Financial Statements
|
|||
|
Matisse Discounted Closed-End Fund Strategy
|
|||
|
Statement of Operations
|
|||
|
For the fiscal year ended March 31, 2021
|
|||
|
Investment Income:
|
|||
|
Dividends
|
$
|
8,404,060
|
|
|
Total Investment Income
|
8,404,060
|
||
|
Expenses:
|
|||
|
Advisory fees (note 2)
|
2,556,521
|
||
|
Administration fees (note 2)
|
241,496
|
||
|
Professional fees
|
78,455
|
||
|
Interest expenses (note 8)
|
61,720
|
||
|
Custody fees (note 2)
|
60,254
|
||
|
Fund accounting fees (note 2)
|
52,750
|
||
|
Registration and filing expenses
|
39,722
|
||
|
Shareholder fulfillment expenses
|
24,960
|
||
|
Transfer agent fees (note 2)
|
20,999
|
||
|
Trustee fees and meeting expenses (note 3)
|
14,912
|
||
|
Compliance fees (note 2)
|
12,011
|
||
|
Security pricing fees
|
9,350
|
||
|
Insurance fees
|
5,243
|
||
|
Miscellaneous expenses (note 2)
|
4,668
|
||
|
Total Expenses
|
3,183,061
|
||
|
Advisor fees waived (note 2)
|
(9)
|
||
|
Net Expenses
|
3,183,052
|
||
|
Net Investment Income
|
5,221,008
|
||
|
Realized and Unrealized Gain on Investments:
|
|||
|
Net realized gain from:
|
|||
|
Investments
|
16,837,682
|
||
|
Capital gain distributions from underlying funds
|
3,975,077
|
||
|
Total net realized gain
|
20,812,759
|
||
|
Net change in unrealized appreciation on investments
|
98,792,615
|
||
|
Net Realized and Unrealized Gain on Investments
|
119,605,374
|
||
|
Net Increase in Net Assets Resulting from Operations
|
$
|
124,826,382
|
|
|
See Notes to Financial Statements
|
|||
|
Matisse Discounted Closed-End Fund Strategy
|
||||||||||||
|
Statements of Changes in Net Assets
|
||||||||||||
|
For the fiscal years ended March 31,
|
2021
|
2020
|
||||||||||
|
Operations:
|
||||||||||||
|
Net investment income
|
$
|
5,221,008
|
$
|
1,434,275
|
||||||||
|
Net realized gain (loss) from investment transactions
|
16,837,682
|
(206,926)
|
||||||||||
|
Capital gain distributions from underlying funds
|
3,975,077
|
234,857
|
||||||||||
|
Net change in unrealized appreciation (depreciation) on investments
|
98,792,615
|
(6,749,546)
|
||||||||||
|
Net Increase (Decrease) in Net Assets Resulting from Operations
|
124,826,382
|
(5,287,340)
|
||||||||||
|
Distributions to Shareholders:
|
||||||||||||
|
Institutional Class Shares
|
(29,796,628)
|
(7,325,465)
|
||||||||||
|
Decrease in Net Assets Resulting from Distributions
|
(29,796,628)
|
(7,325,465)
|
||||||||||
|
Beneficial Interest Transactions:
|
||||||||||||
|
Shares sold
|
51,612,347
|
148,694,852
|
||||||||||
|
Reinvested dividends and distributions
|
28,368,892
|
7,085,028
|
||||||||||
|
Shares repurchased
|
(25,496,026)
|
(16,995,487)
|
||||||||||
|
Increase from Beneficial Interest Transactions
|
54,485,213
|
138,784,393
|
||||||||||
|
Net Increase in Net Assets
|
149,514,967
|
126,171,588
|
||||||||||
|
Net Assets:
|
||||||||||||
|
Beginning of Year
|
175,406,032
|
49,234,444
|
||||||||||
|
End of Year
|
$
|
324,920,999
|
$
|
175,406,032
|
||||||||
|
March 31,
|
March 31,
|
|||||||||||
|
2021
|
2020
|
|||||||||||
|
Share Information:
|
||||||||||||
|
Institutional Class Shares
|
Shares
|
Amount
|
Shares
|
Amount
|
||||||||
|
Shares sold
|
7,037,331
|
$
|
51,612,347
|
24,497,198
|
$
|
148,694,852
|
||||||
|
Reinvested dividends and distributions
|
3,504,888
|
|
28,368,892
|
933,567
|
|
7,085,028
|
||||||
|
Shares repurchased
|
(3,296,988)
|
|
(25,496,026)
|
(1,814,014)
|
|
(16,995,487)
|
||||||
|
Net Increase in Shares of
|
||||||||||||
|
Beneficial Interest
|
7,245,231
|
$
|
54,485,213
|
23,616,751
|
$
|
138,784,393
|
||||||
|
See Notes to Financial Statements
|
||||||||||||
|
Matisse Discounted Closed-End Fund Strategy
|
|||||||||||||||
|
Financial Highlights
|
|||||||||||||||
|
For a share outstanding during each
|
Institutional Class Shares | ||||||||||||||
|
of the fiscal years ended March 31,
|
2021
|
2020
|
2019
|
2018
|
2017
|
||||||||||
|
Net Asset Value, Beginning of Year
|
$ 6.16
|
$ 10.09
|
$ 11.10
|
$ 10.36
|
$ 8.88
|
||||||||||
|
Income (Loss) from Investment Operations
|
|||||||||||||||
|
Net investment income (e)
|
0.16
|
0.28
|
0.20
|
0.13
|
0.29
|
||||||||||
|
Net realized and unrealized gain (loss)
|
|||||||||||||||
|
on investments
|
3.67
|
(3.19)
|
0.31
|
0.99
|
1.48
|
||||||||||
|
Total from Investment Operations
|
3.83
|
(2.91)
|
0.51
|
1.12
|
1.77
|
||||||||||
|
Less Distributions:
|
|||||||||||||||
|
Dividends (from net investment income)
|
(0.67)
|
(0.39)
|
(0.38)
|
(0.20)
|
(0.29)
|
||||||||||
|
Distributions (from capital gains)
|
(0.23)
|
(0.63)
|
(1.14)
|
(0.18)
|
-
|
||||||||||
|
Total Distributions
|
(0.90)
|
(1.02)
|
(1.52)
|
(0.38)
|
(0.29)
|
||||||||||
|
Net Asset Value, End of Year
|
$ 9.09
|
$ 6.16
|
$ 10.09
|
$ 11.10
|
$ 10.36
|
||||||||||
|
Total Return (a)
|
64.68%
|
(32.01)%
|
6.53%
|
10.89%
|
20.27%
|
||||||||||
|
Net Assets, End of Year (in thousands)
|
$324,921
|
$175,406
|
$ 49,234
|
$94,049
|
$104,448
|
||||||||||
|
Ratios of:
|
|||||||||||||||
|
Interest Expense to Average Net Assets
|
0.02%
|
0.13%
|
0.14%
|
-
|
0.00%
|
(d)
|
|||||||||
|
Gross Expenses to Average Net Assets (b)
|
1.23%
|
(c)
|
1.66%
|
(c)
|
1.55%
|
(c)
|
1.33%
|
1.50%
|
(c)
|
||||||
|
Net Expenses to Average Net Assets (b)
|
1.23%
|
(c)
|
1.37%
|
(c)
|
1.38%
|
(c)
|
1.25%
|
1.25%
|
(c)
|
||||||
|
Net Investment Income to Average
|
|||||||||||||||
|
Net Assets (b)
|
2.02%
|
3.04%
|
2.02%
|
1.19%
|
2.98%
|
||||||||||
|
Portfolio turnover rate
|
42.63%
|
101.38%
|
55.00%
|
71.82%
|
99.61%
|
||||||||||
|
(a)
|
Includes adjustments in accordance with accounting principles generally accepted in the United States, and, consequently, the net asset values for financial reporting purposes and the returns based upon those net asset values may differ
from the net asset values and returns from shareholder transactions.
|
||||||||||||||
|
(b)
|
Recognition of the Fund's net investment income is affected by the timing of dividend declarations of underlying funds. The expenses of the underlying funds are excluded from the Fund's expense ratio.
|
||||||||||||||
|
(c)
|
Includes interest expense.
|
||||||||||||||
|
(d)
|
Less than 0.01% per share.
|
||||||||||||||
|
(e)
|
Calculated using the average shares method.
|
||||||||||||||
|
See Notes to Financial Statements
|
|||||||||||||||
| Matisse Discounted Closed-End Fund Strategy |
| Notes to Financial Statements |
| As of March 31, 2021 |
1. Organization and Significant Accounting Policies
The Matisse Discounted Closed-End Fund Strategy (“Fund”) is a series of the Starboard Investment Trust (“Trust”). The Trust is organized as a Delaware statutory trust and is registered under the Investment Company
Act of 1940, as amended (the “1940 Act”), as an open-end management investment company. The Fund is a separate diversified series of the Trust.
The Fund’s investment advisor, Deschutes Portfolio Strategies, LLC, dba Matisse Capital, (the “Advisor”), seeks to achieve the Fund’s investment objective of long-term capital appreciation and income by investing in
unaffiliated closed-end funds that pay regular periodic cash distributions, the interests of which typically trade at substantial discounts relative to their underlying net asset values. The Fund will invest, under normal circumstances, at least
80% of net assets, plus borrowings, for investment purposes, in discounted closed-end funds.
The following is a summary of significant accounting policies consistently followed by the Fund. The policies are in conformity with accounting principles generally accepted in the United States of America
(“GAAP”). The Fund follows the accounting and reporting guidance in the Financial Accounting Standards Board (“FASB”) Accounting Standards Codification 946 “Financial Services – Investment Companies,” and
Financial Accounting Standards Update (“ASU”) 2013-08.
Investment Valuation
The Fund’s investments in securities are carried at fair value. Securities listed on an exchange or quoted on a national market system are valued at the last sales price as of 4:00 p.m. Eastern Time. Securities
traded in the NASDAQ over-the-counter market are generally valued at the NASDAQ Official Closing Price. Other securities traded in the over-the-counter market and listed securities for which no sale was reported on that date are valued at the mean
of the most recent bid and ask prices. Instruments with maturities of 60 days or less are valued at amortized cost, which approximates market value. Investments in open-end investment companies are valued at their respective net asset values as
reported by such investment companies. Securities and assets for which representative market quotations are not readily available (e.g., if the exchange on which the security is principally traded closes early or if trading of the particular
security is halted during the day and does not resume prior to the Fund’s net asset value calculation) or which cannot be accurately valued using the Fund’s normal pricing procedures are valued at fair value as determined in good faith under
policies approved by the Trustees. A security’s “fair value” price may differ from the price next available for that security using the Fund’s normal pricing procedures. The shares of many closed-end investment companies, after their initial
public offering, frequently trade at a price per share, which is different than the net asset value per share. The difference represents a market premium or market discount of such shares. There can be no assurances that the market discount or
market premium on shares of any closed-end investment company purchased by the Funds will not change.
Fair Value Measurement
Various inputs are used in determining the value of the Fund's investments. These inputs are summarized in the three broad levels listed below:
Level 1: Unadjusted quoted prices in active markets for identical securities
Level 2: Other significant observable inputs (including quoted prices for similar securities, interest rates, credit risk, etc.)
Level 3: Significant unobservable inputs (including the Fund’s own assumptions in determining fair value of investments)
The availability of observable inputs can vary from security to security and is affected by a wide variety of factors, including, for example, the type of security, whether the security is new and not yet established
in the marketplace, the liquidity of markets, and other characteristics particular to the security. To the extent that valuation is based on models or inputs that are less observable or unobservable in the market, the determination of fair value
requires more judgment. Accordingly, the degree of judgment exercised in determining fair value is greatest for instruments categorized in Level 3.
|
|
(Continued) |
| Matisse Discounted Closed-End Fund Strategy |
| Notes to Financial Statements |
| As of March 31, 2021 |
The inputs used to measure fair value may fall into different levels of the fair value hierarchy. In such cases, for disclosure purposes, the level in the fair value hierarchy within which the fair value measurement
falls in its entirety, is determined based on the lowest level input that is significant to the fair value measurement in its entirety.
The inputs or methodology used for valuing securities are not necessarily an indication of the risk associated with investing in those securities. The following table summarizes the inputs as of March 31, 2021 for
the Fund’s investments measured at fair value:
|
Investments in Securities (a)
|
Total
|
Level 1
|
Level 2
|
Level 3
|
||||
|
Closed-End Funds
|
$
|
328,181,386
|
$
|
328,181,386
|
$
|
-
|
$
|
-
|
|
Exchange-Traded Products
|
4,156,000
|
4,156,000
|
-
|
-
|
||||
|
Preferred Stock
|
5,576,187
|
5,576,187
|
-
|
-
|
||||
|
Short-Term Investment
|
751,805
|
751,805
|
-
|
-
|
||||
|
Total Assets
|
$
|
338,665,378
|
$
|
338,665,378
|
$
|
-
|
$
|
-
|
|
(a)
|
The Fund had no Level 3 securities as of the fiscal year ended March 31, 2021.
|
Investment Transactions and Investment Income
Investment transactions are accounted for as of the date purchased or sold (trade date). Dividend income is recorded on the ex-dividend date. Certain dividends from foreign securities will be recorded as soon as
the Fund is informed of the dividend if such information is obtained subsequent to the ex-dividend date. Gains and losses are determined on the identified cost basis, which is the same basis used for federal income tax purposes.
Distributions
The Fund may declare and distribute dividends from net investment income, if any, quarterly. Distributions from capital gains, if any, are generally declared and distributed annually. Dividends and distributions to
shareholders are recorded on ex-date.
Expenses
The Fund bears expenses incurred specifically on its behalf as well as a portion of general expenses, which are allocated according to methods reviewed annually by the Trustees.
Estimates
The preparation of financial statements in conformity with GAAP requires management to make estimates and assumptions that affect the reported amounts of assets and liabilities and disclosure of contingent assets and
liabilities at the date of the financial statements and the reported amounts of increases and decreases in the net assets from operations during the reporting period. Actual results could differ from those estimates.
Federal Income Taxes
No provision for income taxes is included in the accompanying financial statements, as the Fund intends to distribute to shareholders all taxable investment income and realized gains and otherwise comply with
Subchapter M of the Internal Revenue Code applicable to regulated investment companies.
Because the underlying funds have varied expense and fee levels and the Fund may own different proportions of underlying funds at different times, the amount of fees and expense incurred indirectly by the Fund will
vary.
Risk Considerations
Closed-End Fund Risk. Closed-end funds involve investment risks different from those associated with other investment companies. First, the shares of closed-end funds
frequently trade at a premium or discount relative to their net asset value. When the Fund purchases shares of a closed-end fund at a discount to its net asset value, there can be no assurance that the discount will decrease, and it is possible
that the discount may increase and affect whether the Fund will a realize gain or loss on the investment. Second, many closed-end funds use leverage, or borrowed money, to try to increase returns. Leverage is a speculative technique and its use by
a closed-end fund entails greater risk and leads to a more volatile share price. If a close-end fund uses leverage, increases and decreases in the value of its share price will be magnified. The closed-end fund will also have to pay interest or
dividends on its leverage, reducing the closed-end fund's return. Third, many closedend funds have a policy of distributing a fixed percentage of net assets regardless of the fund’s actual interest income and capital gains. Consequently,
distributions by a closed-end fund may include a return of capital, which would reduce the fund’s net asset value and its earnings capacity. Finally, closed-end funds are allowed to invest in a greater amount of illiquid securities than open-end
mutual funds. Investments in illiquid securities pose risks related to uncertainty in valuations, volatile market prices, and limitations on resale that may have an adverse effect on the ability of the fund to dispose of the securities promptly or
at reasonable prices. Fund of Funds Risk. The Fund is a “fund of funds.” The term “fund of funds” is typically used to describe investment companies, such as the Fund, whose principal investment strategy involves investing in other investment
companies, including closed-end funds and money market mutual funds. Investments in other funds subject the Fund to additional operating and management fees and expenses. For instance, investors in the Fund will indirectly bear fees and expenses
charged by the funds in which the Fund invests, in addition to the Fund’s direct fees and expenses. The Fund’s performance depends in part upon the performance of the funds’ investment advisor, the strategies and instruments used by the funds, and
the Advisor's ability to select funds and effectively allocate Fund assets among them.
|
|
(Continued) |
| Matisse Discounted Closed-End Fund Strategy |
| Notes to Financial Statements |
| As of March 31, 2021 |
Fund of Funds Risk. The Fund is a “fund of funds.” The term “fund of funds” is typically used to describe investment companies, such as the Fund, whose principal investment
strategy involves investing in other investment companies, including closed-end funds and money market mutual funds. Investments in other funds subject the Fund to additional operating and management fees and expenses. For instance, investors in
the Fund will indirectly bear fees and expenses charged by the funds in which the Fund invests, in addition to the Fund’s direct fees and expenses. The Fund’s performance depends in part upon the performance of the funds’ investment advisor, the
strategies and instruments used by the funds, and the Advisor's ability to select funds and effectively allocate Fund assets among them.
COVID-19 and Other Infectious Illnesses Risk. An outbreak of infectious respiratory illness caused by a novel coronavirus known as COVID-19 was first detected in China in
December 2019 and has now been detected globally. COVID-19 has resulted in travel restrictions, closed international borders, enhanced health screenings at ports of entry and elsewhere, disruption of and delays in healthcare service preparation and
delivery, prolonged quarantines, cancellations, supply chain disruptions, and lower consumer demand, as well as general concern and uncertainty. The impact of COVID-19, and other infectious illness outbreaks that may arise in the future, could
adversely affect the economies of many countries or the entire global economy, individual issuers and capital markets in ways that cannot necessarily be foreseen. In addition, the impact of infectious illnesses in emerging market countries may be
greater due to generally less established healthcare systems. Public health crises caused by the COVID-19 outbreak, or other infectious illness outbreaks that may arise in the future, may exacerbate other pre-existing political, social and economic
risks in certain countries or globally. As such, issuers of debt securities with operations, productions, offices, and/or personnel in (or other exposure to) areas affected with the virus may experience significant disruptions to their business
and/or holdings. The potential impact on the credit markets may include market illiquidity, defaults and bankruptcies, among other consequences, particularly on issuers in the airline, travel and leisure and retail sectors. The extent to which
COVID-19 or other infectious illnesses will affect the Fund, the Fund’s service providers’ and/or issuer’s operations and results will depend on future developments, which are highly uncertain and cannot be predicted, including new information that
may emerge concerning the severity of COVID19 or other infectious illnesses and the actions taken to contain COVID-19 or other infectious illnesses. Economies and financial markets throughout the world are becoming increasingly interconnected. As a
result, whether or not the Fund invests in securities of issuers located in or with significant exposure to countries experiencing economic, political and/or financial difficulties, the value and liquidity of the Fund’s investments may be
negatively affected by such events. If there is a significant decline in the value of the Fund’s portfolio, this may impact the Fund’s asset coverage levels for certain kinds of derivatives and other portfolio transactions. The duration of the
COVID-19 outbreak, or any other infectious illness outbreak that may arise in the future, and its impact on the global economy cannot be determined with certainty.
|
|
(Continued) |
| Matisse Discounted Closed-End Fund Strategy |
| Notes to Financial Statements |
| As of March 31, 2021 |
2. Transactions with Related Parties and Service Providers
Advisor
The Fund pays a monthly fee to the Advisor calculated at the annual rate of 0.99% of the Fund’s average daily net assets. For the fiscal year ended March 31, 2021, $2,556,521 in advisory fees were incurred, $9 of
which were waived by the Advisor.
The Advisor has entered into a contractual agreement (the “Expense Limitation Agreement”) with the Trust, on behalf of the Fund, under which it has agreed to waive or reduce its fees and to assume other expenses of
the Fund, if necessary, in amounts that limit the Fund’s total operating expenses (exclusive of (i) any front-end or contingent deferred loads; (ii) brokerage fees and commissions; (iii) acquired fund fees and expenses; (iv) fees and expenses
associated with investments in other collective investment vehicles or derivative instruments (including, for example, option and swap fees and expenses); (v) borrowing costs (such as interest and dividend expense on securities sold short); (vi)
taxes and (vii) extraordinary expenses, such as litigation expenses (which may include indemnification of Fund officers and Trustees and contractual indemnification of Fund service providers (other than the Advisor)) to not more than 1.25% of the
average daily net assets of the Fund. The current term of the Expense Limitation Agreement remains in effect until July 31, 2021. While there can be no assurance that the Expense Limitation Agreement will continue after that date, it is expected
to continue from year-to-year thereafter. The Advisor cannot recoup from the Fund any expenses paid by the Advisor under the Expense Limitation Agreement.
Administrator
The Fund pays a monthly fee to the Fund’s administrator, The Nottingham Company (“the Administrator”), based upon the average daily net assets of the Fund and calculated at the annual rates as shown in the schedule
below which is subject to a minimum of $2,000 per month. The Administrator also receives a fee to procure and pay the Fund’s custodian, additional compensation for fund accounting and recordkeeping services, and additional compensation for certain
costs involved with the daily valuation of securities and as reimbursement for out-of-pocket expenses. The Administrator also receives a miscellaneous compensation fee for peer group, comparative analysis, and compliance support totaling $350 per
month. As of March 31, 2021, the Administrator received $4,668 in miscellaneous expenses.
|
|
(Continued) |
| Matisse Discounted Closed-End Fund Strategy |
| Notes to Financial Statements |
| As of March 31, 2021 |
A breakdown of these fees is provided in the following table:
|
Administration Fees*
|
Custody Fees*
|
Fund
Accounting
Fees
|
Fund Accounting Fees
(asset-based fee)
|
Blue Sky
Administration
Fees (annual) |
|||||
|
Average Net
Assets
|
Annual
Rate
|
Average Net
Assets
|
Annual
Rate
|
(Average
monthly)
|
Net Assets
|
Annual
Rate
|
Per state
|
||
|
First $100 million
|
0.100%
|
First $200 million
|
0.020%
|
$2,250
|
First $50 million
|
0.02%
|
$150
|
||
|
Next $100 million
|
0.090%
|
Over $200 million
|
0.009%
|
$500/
additional
class
|
Next $50
million
|
0.015%
|
|||
|
Next $100 million
|
0.080%
|
Over $100
million
|
0.01%
|
||||||
|
Next $100 million
|
0.070%
|
*Minimum monthly fees of $2,000 and $417 for Administration and Custody, respectively.
|
|||||||
|
Next $100 million
|
0.060%
|
||||||||
|
Over $500 million
|
0.050%
|
||||||||
|
Over $750 million
|
0.040%
|
||||||||
|
Over $1 billion
|
0.030%
|
||||||||
The Fund incurred $241,496 in administration fees, $60,254 in custody fees, and $52,750 in fund accounting fees for the fiscal year ended March 31, 2021.
Compliance Services
The Nottingham Company, Inc. serves as the Trust’s compliance services provider including services as the Trust’s Chief Compliance Officer. The Nottingham Company, Inc. is entitled to receive customary fees from the
Fund for its services pursuant to the Compliance Services Agreement with the Fund.
Transfer Agent
Nottingham Shareholder Services, LLC (“Transfer Agent”) serves as transfer, dividend paying, and shareholder servicing agent for the Fund. For its services, the Transfer Agent is entitled to receive compensation
from the Fund pursuant to the Transfer Agent’s fee arrangements with the Fund.
Distributor
Capital Investment Group, Inc. (the “Distributor”) serves as the Fund’s principal underwriter and distributor. For its services, the Distributor is entitled to receive compensation from the Fund pursuant to the
Distributor’s fee arrangements with the Fund.
3. Trustees and Officers
The Trust is governed by the Board of Trustees, which is responsible for the management and supervision of the Fund. The Trustees meet periodically throughout the year to review contractual agreements with companies
that furnish services to the Fund; review performance of the Advisor and the Fund; and oversee activities of the Fund. Officers of the Trust and Trustees who are interested persons of the Trust or the Advisor will receive no salary or fees from
the Trust. Each Trustee who is not an “interested person” of the Trust or the Advisor within the meaning of the Investment Company Act of 1940, as amended (the “Independent Trustee”) receives $2,000 per series per year, $200 per meeting attended,
and $500 per series per special meeting related to contract renewal issues. The Trust reimburses each Trustee and officer of the Trust for his or her travel and other expenses related to attendance of Board meetings. The Trust reimbursed each
Trustee and officer of the Trust for his or her travel and other expenses related to attendance of Board meetings. Additional fees were incurred during the year as special meetings were necessary in addition to the regularly scheduled meetings of
the Board of Trustees. Certain officers of the Trust may also be officers of the Administrator.
|
|
(Continued) |
| Matisse Discounted Closed-End Fund Strategy |
| Notes to Financial Statements |
| As of March 31, 2021 |
4. Purchases and Sales of Investment Securities
For the fiscal year ended March 31, 2021, the aggregate cost of purchases and proceeds from sales of investment securities (excluding short-term securities) were as follows:
|
Purchases of Securities
|
Proceeds from
Sales of Securities
|
|
$172,199,268
|
$110,447,927
|
5. Federal Income Tax
Distributions are determined in accordance with Federal income tax regulations, which may differ from GAAP, and, therefore, may differ significantly in amount or character from net investment income and realized
gains for financial reporting purposes. The general ledger is adjusted for permanent book/tax differences to reflect tax character but is not adjusted for temporary differences.
Management has reviewed the Fund’s tax positions to be taken on the federal income tax returns during the open years ended March 31, 2018 through March 31, 2021 and determined that the Fund does not have a liability
for uncertain tax positions. The Fund recognizes interest and penalties, if any, related to unrecognized tax benefits as income tax expense in the Statement of Operations. During the fiscal year, the Fund did not incur any interest or penalties.
Distributions during the year or period ended were characterized for tax purposes as follows:
|
March 31, 2021
|
March 31, 2020 | |
|
Ordinary Income
|
$ 29,772,933 | $ 4,669,512 |
|
Tax-Exempt Income
|
23,695 | 10,812 |
|
Long-Term Capital Gain
|
- |
2,645,141 |
|
Total Distribution
|
$ 29,796,628 |
$ 7,325,465 |
At March 31, 2021, the tax-basis cost of investments and components of distributable earnings were as follows:
|
Cost of Investments
|
$
|
270,198,417
|
|
Unrealized Appreciation
|
69,344,891
|
|
|
Unrealized Depreciation
|
(877,930)
|
|
|
Net Unrealized Appreciation
|
$
|
68,466,961
|
|
Ordinary Income Spillback
|
14,069,491
|
|
|
Long-Term Capital Gain Spillback
|
2,816,241
|
|
|
Distributable Earnings
|
$
|
85,352,693
|
|
|
(Continued) |
| Matisse Discounted Closed-End Fund Strategy |
| Notes to Financial Statements |
| As of March 31, 2021 |
6. Beneficial Ownership
The beneficial ownership, either directly or indirectly, of 25% or more of the voting securities of a fund creates a presumption of control of a fund, under Section 2(a)(9) of the Investment Company Act of 1940. As
of March 31, 2021, Pershing LLC held 75.45% of the Fund. The Fund has no knowledge as to whether all or any portion of the shares of record owned by Pershing LLC are also owned beneficially.
7. Commitments and Contingencies
Under the Trust’s organizational documents, its officers and Trustees are indemnified against certain liabilities arising out of the performance of their duties to the Fund. In addition, in the normal course of
business, the Trust entered into contracts with its service providers, on behalf of the Fund, and others that provide for general indemnifications. The Fund’s maximum exposure under these arrangements is unknown, as this would involve future
claims that may be made against the Fund. The Fund expects risk of loss to be remote.
8. Borrowings
The Fund established a borrowing agreement with Interactive Brokers LLC for investment purposes subject to the limitations of the 1940 Act for borrowings by registered investment companies.
Interest is based on the Federal Funds rate plus 1.50% on the first $100,000, the Federal Funds rate plus 1.00% on the next $900,000, the Federal Funds rate plus 0.50% on balances between $1,000,000 and $3,000,000,
and the Federal Funds rate plus 0.30% on balances greater than $3,000,000. The average borrowing during the fiscal year ended March 31, 2021 was $3,089,125, and the average interest rate during the same period was 1.07%.
Interest expense is charged directly to the Fund based upon actual amounts borrowed by the Fund. The Fund had $15,744,824 in borrowings as of the fiscal year ended March 31, 2021. Total interest expense for the
fiscal year was $61,720 as reflected in the Statement of Operations.
9. Subsequent Events
In accordance with GAAP, management has evaluated the need for disclosures and/or adjustments resulting from subsequent events through the date of issuance of these financial statements. Management has concluded
there are no additional matters, other than those noted above, requiring recognition or disclosure.

REPORT OF INDEPENDENT REGISTERED PUBLIC ACCOUNTING FIRM
To the Board of Trustees of Starboard Investment Trust
and the Shareholders of Matisse Discounted Closed-End Fund Strategy
Opinion on the Financial Statements
We have audited the accompanying statement of assets and liabilities of Matisse Discounted Closed-End Fund Strategy, a series of shares of beneficial interest in Starboard Investment Trust (the “Fund”), including the schedule of investments, as of March 31, 2021, and the related statement of operations for the year then ended, the statements of changes in net assets for each of the
years in the two-year period then ended and the financial highlights for each of the years in the five-year period then ended, and the related notes (collectively referred to as the “financial
statements”). In our opinion, the financial statements present fairly, in all material respects, the financial position of the Fund as of March 31, 2021, and the results of its operations for the year then ended, the changes in its net
assets for each of the years in the two-year period then ended and its financial highlights for each of the years in the five-year period then ended, in conformity with accounting principles generally accepted in the United States of America.
Basis for Opinion
These financial statements are the responsibility of the Fund’s management. Our responsibility is to express an opinion on the Fund's financial statements based on our audits. We are a public accounting firm
registered with the Public Company Accounting Oversight Board (United States) (“PCAOB”) and are required to be independent with respect to the Fund in accordance with the U.S. federal
securities law and the applicable rules and regulations of the Securities and Exchange Commission and the PCAOB.
We conducted our audits in accordance with the standards of the PCAOB. Those standards require that we plan and perform the audits to obtain reasonable assurance about whether the financial statements are free of
material misstatement, whether due to error or fraud. The Fund is not required to have, nor were we engaged to perform, an audit of its internal control over financial reporting. As part of our audits we are required to obtain an understanding of
internal control over financial reporting but not for the purpose of expressing an opinion on the effectiveness of the Fund’s internal control over financial reporting. Accordingly, we express no such opinion.
Our audits included performing procedures to assess the risk of material misstatement of the financial statements, whether due to error or fraud, and performing procedures that respond to those risks. Such
procedures included examining, on a test basis, evidence regarding the amounts and disclosures in the financial statements. Our procedures included confirmation of securities owned as of March 31, 2021 by correspondence with the custodian. Our
audits also included evaluating the accounting principles used and significant estimates made by management, as well as evaluating the overall presentation of the financial statements. We believe that our audits provide a reasonable basis for
our opinion.

BBD, LLP
We have served as the auditor of one or more of the Funds in the Starboard Investment Trust since 2012.
Philadelphia, Pennsylvania
May 26, 2021
| Matisse Discounted Closed-End Fund Strategy |
|
Additional Information
(Unaudited)
|
| As of March 31, 2021 |
|
1.
|
Proxy Voting Policies and Voting Record
|
A copy of the Advisor’s Proxy Voting and Disclosure Policy is included as Appendix B to the Fund’s Statement of Additional Information and is available, without charge, upon request, by calling 800-773-3863, and
on the website of the Securities and Exchange Commission (“SEC”) at http://www.sec.gov. Information regarding how the Fund voted proxies relating to portfolio securities during the most recent 12-month period ended June 30 is available (1)
without charge, upon request, by calling the Fund at the number above and (2) on the SEC’s website at http://www.sec.gov.
|
2.
|
Quarterly Portfolio Holdings
|
The Fund files its complete schedule of portfolio holdings with the SEC for the first and third quarters of each fiscal year on Form N-PORT. The Fund’s Forms N-PORT are available on the SEC’s website at
http://www.sec.gov. You may also obtain copies without charge, upon request, by calling the Fund at 800-773-3863.
|
3.
|
Tax Information
|
We are required to advise you within 60 days of the Fund’s fiscal year-end regarding federal tax status of certain distributions received by shareholders during each fiscal year. The following information is
provided for the Fund’s fiscal year ended March 31, 2021.
During the fiscal year, the Fund paid $29,796,628 in income distributions but no long-term capital gain distributions.
Dividend and distributions received by retirement plans such as IRAs, Keogh-type plans, and 403(b) plans need not be reported as taxable income. However, many retirement plans may need this information for their
annual information meeting.
|
4.
|
Schedule of Shareholder Expenses
|
As a shareholder of the Fund, you incur ongoing costs, including management fees and other Fund expenses. This Example is intended to help you understand your ongoing costs (in dollars) of investing in the Fund
and to compare these costs with the ongoing costs of investing in other mutual funds.
The Example is based on an investment of $1,000 invested at the beginning of the period and held for the entire period from October 1, 2020 through March 31, 2020.
Actual Expenses – The first line of the table below provides information about actual account values and actual expenses. You may use the information in this line,
together with the amount you invested, to estimate the expenses that you paid over the period. Simply divide your account value by $1,000 (e.g., an $8,600 account value divided by $1,000 = 8.6), then multiply the result by the number in the
first line under the heading entitled “Expenses Paid During Period” to estimate the expenses you paid on your account during this period.
Hypothetical Example for Comparison Purposes – The second line of the table below provides information about hypothetical account values and hypothetical expenses based on
the Fund’s actual expense ratio and an assumed rate of return of 5% per year before expenses, which is not the Fund’s actual return. The hypothetical account values and expenses may not be used to estimate the actual ending account balance or
expenses you paid for the period. You may use this information to compare the ongoing costs of investing in the Fund and other funds. To do so, compare this 5% hypothetical example with the 5% hypothetical examples that appear in the
shareholder reports of the other funds.
Please note that the expenses shown in the table are meant to highlight your ongoing costs only and do not reflect any transactional costs, such as sales charges (loads), redemption fees, or
exchange fees. Therefore, the second line of the table is useful in comparing ongoing costs only and will not help you determine the relative total costs of owning different funds. In addition, if these transactional costs were included, your
costs would have been higher.
|
|
(Continued) |
| Matisse Discounted Closed-End Fund Strategy |
|
Additional Information
(Unaudited)
|
| As of March 31, 2021 |
|
Institutional Class Shares
|
Beginning
Account Value
October 1, 2020
|
Ending
Account Value
March 31, 2021
|
Expenses Paid
During Period*
|
|
Actual
Hypothetical (5% annual return before expenses)
|
|||
|
$1,000.00
|
$1,319.90
|
$7.11
|
|
|
$1,000.00
|
$1,018.80
|
$6.19
|
*Expenses are equal to the average account value over the period multiplied by the Fund’s annualized net expense ratio of 1.23%, multiplied by the number of days in the most recent period divided by the number of
days in the fiscal year (to reflect the six month period).
5. Information about Trustees and Officers
The business and affairs of the Fund and the Trust are managed under the direction of the Board of Trustees of the Trust. Information concerning the Trustees and officers of the Trust and Fund is set forth
below. Generally, each Trustee and officer serves an indefinite term or until certain circumstances such as their resignation, death, or otherwise as specified in the Trust’s organizational documents. Any Trustee may be removed at a meeting of
shareholders by a vote meeting the requirements of the Trust’s organizational documents. The Statement of Additional Information of the Fund includes additional information about the Trustees and officers and is available, without charge, upon
request by calling the Fund toll-free at 800-773-3863. The address of each Trustee and officer, unless otherwise indicated below, is 116 South Franklin Street, Rocky Mount, North Carolina 27804. The Independent Trustees each received aggregate
compensation of $3,533 during the fiscal year ended March 31, 2021 from the Fund for their services to the Fund and Trust.
|
|
(Continued) |
| Matisse Discounted Closed-End Fund Strategy |
|
Additional Information
(Unaudited)
|
| As of March 31, 2021 |
|
Name and
Date of Birth |
Position
held with Funds or Trust |
Length
of Time
Served
|
Principal Occupation
During Past 5 Years |
Number of
Portfolios
in Fund
Complex
Overseen
by Trustee
|
Other Directorships
Held by Trustee During Past 5 Years |
|
Independent Trustees
|
|||||
|
James H. Speed, Jr.
(06/1953) |
Independent Trustee, Chairman
|
Trustee since 7/09, Chair since 5/12
|
Retired Executive/Private Investor.
|
12
|
Independent Trustee of the Brown Capital Management Mutual Funds for all its series from 2011 to present, Hillman Capital Management Investment Trust for all its series from 2009 to
present, Centaur Mutual Funds Trust for all its series from 2013 to present, Chesapeake Investment Trust for all its series from 2016 to present, Leeward Investment Trust for all its series from 2018 to present, and WST Investment Trust
for all its series from 2013 to present, (all registered investment companies). Member of Board of Directors of Communities in Schools of N.C. from 2001 to present. Member of Board of Directors of Investors Title Company from 2010 to
present. Member of Board of Directors of AAA Carolinas from 2011 to present. Previously, member of Board of Directors of M&F Bancorp Mechanics & Farmers Bank from 2009 to 2019. Previously, member of Board of Visitors of North
Carolina Central University School of Business from 1990 to 2016. Previously, Board of Directors of NC Mutual Life Insurance Company from 2004 to 2016. Previously, President and CEO of North Carolina Mutual Life Insurance Company from
2003 to 2015.
|
|
Theo H. Pitt, Jr.
(04/1936) |
Independent Trustee
|
Since 9/10
|
Senior Partner, Community Financial Institutions Consulting (financial consulting) since 1999.
|
12
|
Independent Trustee of World Funds Trust for all its series from 2013 to present, Chesapeake Investment Trust for all its series from 2002 to present, Leeward Investment Trust for all its
series from 2011 to present, and Hillman Capital Management Investment Trust for all its series from 2000 to present (all registered investment companies). Senior Partner of Community Financial Institutions Consulting from 1997 to
present. Previously, Partner at Pikar Properties from 2001 to 2017.
|
|
Michael G. Mosley
(01/1953) |
Independent Trustee
|
Since 7/10
|
Owner of Commercial Realty Services (real estate) since 2004.
|
12
|
None.
|
|
J. Buckley Strandberg
(03/1960) |
Independent Trustee
|
Since 7/09
|
President of Standard Insurance and Realty since 1982.
|
12
|
None.
|
|
|
(Continued) |
| Matisse Discounted Closed-End Fund Strategy |
|
Additional Information
(Unaudited)
|
| As of March 31, 2021 |
|
Name and
Date of Birth |
Position held with
Funds or Trust |
Length
of Time Served |
Principal Occupation
During Past 5 Years |
|
Officers
|
|||
|
Katherine M. Honey
(09/1973) |
President and Principal Executive Officer
|
Since 05/15
|
President of The Nottingham Company since 2018. EVP of The Nottingham Company from 2008 to 2018.
|
|
Ashley H. Lanham
(03/1984)
|
Treasurer, Assistant Secretary, Principal Accounting Officer and Principal Financial Officer
|
Since 05/15
|
Director of Fund Administration, The Nottingham Company since 2008.
|
|
Tracie A. Coop
(12/1976) |
Secretary
|
Since 12/19
|
General Counsel, The Nottingham Company since 2019. Formerly, Vice President and Managing Counsel, State Street Bank and Trust Company from 2015 to 2019. Formerly, General Counsel for
Santander Asset Management USA, LLC from 2013 to 2015.
|
|
Matthew Baskir
(07/1979) |
Chief Compliance Officer
|
Since 04/20
|
Compliance Director, The Nottingham Company, Inc., since 2020. Formerly, Consultant at National Regulatory Services from 2019 to 2020. Formerly, Counsel at Financial Industry Regulatory
Authority (FINRA), Member Supervision from 2016-2019. Formerly Counsel at FINRA, Market Regulation Enforcement from 2014 – 2016.
|
Matisse Discounted Closed-End Fund Strategy
is a series of
The Starboard Investment Trust
| For Shareholder Service Inquiries: |
For Investment Advisor Inquiries:
|
| Nottingham Shareholder Services |
Deschutes Portfolio Strategies
|
| 116 South Franklin Street |
4949 Meadows Road
|
|
Post Office Box 69
Rocky Mount, North Carolina 27802-0069
|
Suite 200
Lake Oswego, Oregon 97035
|
|
Telephone:
800-773-3863
|
Telephone:
503-210-3001
|
|
World Wide Web @:
ncfunds.com
|
World Wide Web @:
matissefunds.com
|
Annual Report 2021
For the initial period from April 30, 2020 (Date of Initial
Public Investment) through March 31, 2021
Matisse Discounted Bond
CEF Strategy
Institutional Class Shares
This report and the financial statements contained herein are submitted for the general information of the shareholders of the Matisse Discounted Bond CEF Strategy (the “Fund”). The Fund’s shares are not deposits or
obligations of, or guaranteed by, any depository institution. The Fund’s shares are not insured by the FDIC, Federal Reserve Board or any other agency, and are subject to investment risks, including possible loss of principal amount invested. Neither
the Fund nor the Fund’s distributor is a bank.
The Matisse Discounted Bond CEF Strategy is distributed by Capital Investment Group, Inc., Member FINRA/SIPC, 100 E. Six Forks Road, Suite 200, Raleigh, NC, 27609. There is no affiliation between the Matisse Discounted
Bond CEF Strategy, including its principals, and Capital Investment Group, Inc.
|
Statements in this Annual Report that reflect projections or expectations of future financial or economic performance of the Matisse Discounted Bond CEF Strategy (“Fund”) and of the market in general and
statements of the Fund’s plans and objectives for future operations are forward-looking statements. No assurance can be given that actual results or events will not differ materially from those projected, estimated, assumed or anticipated
in any such forward-looking statements. Important factors that could result in such differences, in addition to the other factors noted with such forward-looking statements, include, without limitation, general economic conditions such as
inflation, recession and interest rates. Past performance is not a guarantee of future results.
An investor should consider the investment objectives, risks, charges and expenses of the Fund carefully before
investing. The prospectus contains this and other information about the Fund. A copy of the prospectus is available at https://docs.nottinghamco.com/Matisse or by calling Shareholder Services at 800-773-3863. The prospectus should be
read carefully before investing.
|
For More Information on the Matisse Discounted Bond CEF Strategy:
See Our Web sites @ matissefunds.com
or
Call Our Shareholder Services Group at 800-773-3863.
(Unaudited)
Dear MDFIX Shareholder:
Enclosed please find the inaugural Annual Report for the Matisse Discounted Bond CEF Strategy (MDFIX; hereafter the “Fund”) for the period ending March 31st, 2021. The Fund formally
launched on April 30th, 2020, and we welcome your investment with us in this exciting new strategy.
MDFIX falls into Morningstar’s Multisector Bond category. By definition, multisector bond portfolios seek income by diversifying their assets among several fixed-income sectors, usually U.S.
government obligations, U.S. corporate bonds, foreign bonds, and high-yield U.S. debt securities.
Compared to other mutual funds in the Multisector Bond category, we believe MDFIX is unique for three key reasons:
|
1.
|
To our knowledge, MDFIX is one of the only products in the market that strictly invests in fixed income closed-end funds. Its investment universe includes closed-end funds that specialize in high yield,
municipal bond, foreign bond, bank loan, investment grade and preferred securities.
|
|
2.
|
Because we purchase deeply discounted closed-end funds, we believe MDFIX should typically generate higher cash distributions than other fixed income and multisector bond funds.
|
|
3.
|
Possibly the most important difference is that MDFIX has a true, identifiable source of potential capital gains that aren’t available outside of the closed-end fund market. Our studies show that individual
closed-end fund discounts hover around a mean. When they are significantly lower or higher than normal, our research shows that they typically revert to their mean discount within 12-24 months. MDFIX invests in fixed income closed-end funds
that trade well below their average discounts, so that when any mean reversion occurs, we can potentially capture capital gains for our shareholders and generate extra return — in addition to the income we pay out.
|
This return source is unique to the closed-end fund market. Virtually all the larger fixed income funds do not access this return source because they choose not to invest in
closed-end funds. Larger fund managers typically avoid closed-end funds because (1) closed-end funds aren’t included in their funds’ strategies and (2) even if closed-end funds were included, most funds’ assets are too large to participate in our
niche market. For example, look at American Funds’ $71.4B Bond Fund of America (ABNDX), Vanguard’s $70.3B Total Bond Market Index Fund (VBTIX), and DoubleLine’s $50.9B Total Return Bond Fund (DBLTX). We believe it would be mathematically impossible
for these funds to trade enough capital into and out of the $259B total market cap in closed-end funds to even influence their funds’ returns at that asset size.
On the other hand, our team believes we can comfortably manage up to $1B in closed-end funds before we consider closing our Fund(s) to new investors.
MDFIX – The Potential Advantage of a Fund of Funds
MDFIX is considered a “fund of funds,” which means it does not invest directly into individual stocks and bonds. Instead, our team invests the Fund’s assets into discounted closed-ends managed by
firms like Nuveen, BlackRock, PIMCO, Legg Mason, Franklin Templeton and JP Morgan, to name a few. We believe this approach gives us an advantage and allows us to cheaply invest into some of the best fixed income fund managers in the world.
From a diversification viewpoint, there is a closed-end fund for virtually every investment style or box in the fixed income market. We can access fixed income closed-end funds specializing in high
yield, municipal bond, foreign bond, bank loan, investment grade and preferred securities. We could never be a specialist in all of these things, but our approach allows us to buy professionally managed closed-end funds in these areas, usually at
what we believe are tremendous bargains. The result for our shareholders is a highly diversified underlying bond portfolio that we actively manage, making trading decisions as closed-end fund discounts move organically.
MDFIX Strategy Overview:
|
•
|
We own and trade a diversified portfolio of highly discounted bond closed-end funds. Since each closed-end fund owns hundreds or thousands of bonds, we are highly diversified across issuers, regions, and bond types. |
|
•
|
We maintain meaningful exposure to each of the three major sectors of the marketplace: Taxable US Bonds, Foreign Bonds, and Municipal Bonds. |
|
•
|
Most of the closed-end funds we purchase pay the Fund regular (monthly or quarterly) cash distributions, and we pass those on to shareholders (through the first 11 months, the Fund has paid out 5.55% in distributions). |
| • | We strive to maintain a portfolio which, on a lookthrough basis, holds more investment-grade than non-investment-grade bonds. |
MDFIX may be Appropriate for Investors who:
| • | Do not wish to have Equity exposure for this portion of their portfolios. |
| • | Wish to receive a potentially structurally higher cash distribution income than bond alternatives. |
| • | Wish to take advantage of any alpha that we may be able to generate through discount mean reversion |
|
•
|
Can tolerate the occasional (and transitory) mark-to-market declines that have historically occurred in such portfolios of Bond closed-end funds during occasional periods of widespread discount widening. |
The Fund’s Management team has made significant personal investments in the Fund, and intends to continue these investments, aligning our interests with our investors’ interests. We have also
capped the total cash expense ratio at 0.99% through July 31, 2021.
What a difference a year makes! When we launched the Fund on April 30, 2020, the global financial markets had just fallen sharply, and discounts on closed-end funds had widened dramatically, as
investors panicking about COVID-19 sold just about everything. At the widest point (March 18th,2020), the average closed-end fund traded at a 21% discount. Although MDFIX had not yet launched as of March 18, 2020, the CEFs we initially
purchased within MDFIX from April 30, 2020 through May 31, 2020 were purchased at a very attractive weighted average 16% discount to NAV.
Fast forward to today:
| • | Major stock markets have jumped 80+% from those March 2020 lows, with small caps, Energy and tech stocks leading the way. |
|
•
|
The US economy is likely in its fourth straight quarter of strong recovery, with first quarter GDP clocking in at over 6%, and the unemployment rate back down to 6% (a level it took until late 2014 to move below coming out of the 2008/2009 recession) even with many retail establishments still at least partially closed due to COVID-19 restrictions. |
|
•
|
Democrats are now in control of both the executive and legislative branches, and the rate of government spending---already high coming into 2021---looks set to gap even higher, with tax cuts for the middle class, stimulus checks, and trillions in “infrastructure” spending. |
|
•
|
Though the Fund’s underlying portfolio remains attractively discounted---at 9-10% as of quarter end---the average Bond closed-end fund is now slightly less discounted than its long-run average discount. |
In brief, we believe the reopening trade is alive and well, as pent-up demand from the American consumer---juiced by government largesse and perpetually low interest rates---is driving up profits,
prices, and asset values simultaneously.
As you can see from the nearby table, the Fund performed very well over its first 11 months, both absolutely and in relative terms. Here are the major factors that contributed to the Fund’s
performance from 4/30/20-3/31/21:
|
1.
|
Most closed-end fund discounts narrowed, and most NAVs increased. For the 11-month period, the average Bond closed-end fund saw its discount narrow by 4.9%. Our trading and fund selection added further value, as discount movement/capture within the Fund contributed over 12 percentage points to our total return. |
|
2.
|
Our exposure to lower-rated bonds helped returns during the period, as the High Yield benchmark (see nearby table) advanced 16.53%, outpacing investment-grade bonds, where, for example, the Barclays US Aggregate Bond Index lost -1.05%. Note that, although we typically maintain a portfolio with more investment-grade bonds than non-investment-grade bonds (and did so throughout the period), non-investment-grade bonds played, and will continue to play, an important role in our results. |
|
3.
|
Breaking down our total return into the three main sectors of the Bond market, we had strong positive contributions from all three: Taxable US Bond closed-end funds contributed about 20 percentage points, Foreign Bonds contributed about 4 percentage points, and Muni Bonds contributed about 7 percentage points. |
|
4.
|
The cash collected by the Fund from underlying closed-end funds totaled about 6.2% during the 11-month period. This is an important, and steady, driver of alpha for the Fund, since we collect this cash effectively “at NAV” from closed-end funds purchased at substantial discounts to NAV. Even in the absence of discount movement, therefore, this factor adds can add alpha. |
Average Total Returns
|
Period ended
March 31, 2021
|
YTD
|
Six Months
|
Since Inception
4/30/2020
|
|
MDFIX
|
3.59%
|
15.42%
|
31.34%
|
|
Bloomberg Barclays US Aggregate Bond
Index
|
-3.37%
|
-2.73%
|
-1.05%
|
|
Bloomberg Barclays VLI High Yield Total
Return Index
|
0.57%
|
6.56%
|
16.53%
|
|
FT Taxable Fixed Income CEF Index
|
4.35%
|
15.85%
|
32.10%
|
The performance information quoted represents past performance, which is not a guarantee of future results. Investment return and principal value of an investment will fluctuate so that an
investor’s shares, when redeemed, may be worth more or less than their original cost. Current performance may be lower or higher than the performance data quoted. An investor may obtain performance data current to the most recent month-end by calling
1-800-773-3863. Total return measures net investment income and capital gain or loss from portfolio investments. All performance shown assumes reinvestment of dividends and capital gains distributions.
The Total Annual Fund Operating Expense for the Fund as disclosed in the prospectus is 3.24% dated April 3, 2020. The Net Operating Expense for the Fund is 2.61%.
The Total Annual Fund Operating Expense is required to include expenses incurred indirectly by the Fund through its investments in closed-end funds and other investment companies. The Advisor has entered into an expense limitation agreement with the
Fund under which it has agreed to waive or reduce its management fees and assume other expenses of the Fund in an amount that limits the Fund’s Total Annual Fund Operating Expenses (exclusive of (i) any front-end or contingent deferred loads; (ii)
brokerage fees and commissions, (iii) acquired fund fees and expenses; (iv) fees and expenses associated with investments in other collective investment vehicles or derivative instruments (including, for example, option and swap fees and expenses);
(v) borrowing costs (such as interest and dividend expense on securities sold short); (vi) taxes; and (vii) extraordinary expenses, such as litigation expenses (which may include indemnification of Fund officers and Trustees and contractual
indemnification of Fund service providers (other than the Advisor)) to not more than 0.99% of the average daily net assets of the Fund. This contractual arrangement is in effect through July 31, 2021, unless earlier terminated by the Board of
Trustees of the Fund (the “Board” or the “Trustees”) at any time. “Acquired Fund Fees and Expenses” include expenses incurred indirectly by the Fund through its investments in closed-end funds and other investment companies, do not affect a Fund’s
actual operating costs, and therefore are not included in the Fund’s financial statements, which provide a clearer picture of a Fund’s actual operating costs. The Advisor cannot recoup from the Fund any amounts paid by the Advisor under the Expense
Limitation Agreement.
Management Outlook
The Fund owns highly discounted closed-end funds across multiple Bond market sectors. On a lookthrough basis, our portfolio of 50 closed-end funds was approximately one-third Muni Bond, one-third
Taxable US Bond, and one-third Foreign Bond as of quarter-end. These exposures are in-line with the Fund’s longer-term ranges. Investors can expect each of these sectors to represent between 15% and 45% of our overall portfolio most of the time.
Although the underlying portfolio of the Fund is full of closed-end funds whose discounts are still large (both in absolute terms and compared to their long-term average discount levels), we are
opportunistically building approximately 20% cash in the Fund’s portfolio.
To provide more color – going forward, we intend to focus on reducing downside volatility by building some cash (and possibly hedging the Fund’s portfolio in various ways), so that we are prepared
with more cash to potentially take advantage of any compelling discount opportunities that may arise. This more conservative and cautious approach, we believe, is appropriate given that Bond closed-end fund discount movement can add downside
volatility at times. We believe that this adjusted approach may help reduce stress for our shareholders, and potentially help them avoid making any poor decisions around investment timing.
To be clear, we are not sounding any “top of the market” alarm bells. Far from it. True, Bond closed-end fund universe discounts are currently narrower than their long-run average, but they have
been even narrower more than 20% of the time historically. Our portfolio is 9-10% discounted as compared to the Bond closed-end fund universe at 1-2%, and features multiple “special situations” --- closed-end funds with extremely wide discounts which
don’t fit into a neat sector theme and, in many cases, possess powerful potential catalysts for future discount narrowing.
Just like the stock market, calling market tops is very difficult, if not impossible. In the closed-end fund markets, typically “discount tops” are marked by multiple years of meandering,
narrower-than-average discounts where our income and trading advantage can create excess returns. For example, from early 2010 through mid-2013, Bond closed-end fund universe discounts were nearly always narrower than 2% (in fact, the average
discount was 0% for that period). And yet, from January 1, 2010 to April 30, 2013, the Barclays US Agg returned only 21%, while the FT Muni CEF index returned 42%, and the FT Taxable Fixed Income CEF Index returned 54%. During this period, closed-end
funds’ structural advantages---low-cost leverage, high cash distributions, and ability to purchase at a discount---drove great absolute and relative performance. The future could certainly be different, and past performance does not guarantee future
results, but it is reasonable to assume that today’s low-rate environment could lead to a longer-term period of secular strength for Bond closed-end funds.
In contrast with “discount tops”, “discount bottoms” have been marked by major socio-economic events (the tech wreck of the early 2000’s, the mortgage crisis of 2008, and the recent covid crisis),
and have tended to be extremely sharp and short-lived. The “lesson”, if there is one, is that we believe that our own, more opportunistic, hedging and cash decisions within the Fund going forward may remove some of the negative volatility that we are
seeking to avoid.
We will continue to focus primarily on diligently capturing inefficiencies created by other participants in the niche, retail-dominated Bond closed-end fund space. As always, we will make our
primary decisions based on the attractiveness of the discounts we see, maintaining a balanced allocation across Bond market sectors and overweighting the best opportunities available. With that in mind, here are some of the factors we are keeping an
eye on to drive our exposures at the margins:
|
•
|
Offsetting the positives of “coiled spring” economic growth and still-low interest rates, the new reality of Democratic control of both the legislative and executive branches should lead
to higher taxes for the wealthy, resumed regulation, tighter quarantines, anti-monopoly actions against Big Tech, and, possibly, rising interest rates. This tug-of-war should play out throughout 2021. For example, in the first quarter, the
10-year Treasury rate rose sharply from 0.9% to over 1.7%. The stock market took it in stride, in part because the Fed continues to grow its balance sheet, and also in recognition of the fact that 1.7% is still below the 2.0% average rate
on the 10-year over the past 5 years.
|
|
•
|
Muni Bond closed-end funds could benefit as high net worth investors digest President Biden’s recent proposal to raise the cap gains rate and eliminate the step-up provision. At the same time, Muni Bond
closed-end funds carry more duration than other Bond closed-end funds, and therefore more risk in case the economic recovery is “too strong” or inflation spikes, putting more upward pressure on rates.
|
|
•
|
Most foreign bonds trade at more attractive yields than US bonds with equivalent risk, and we are therefore, not surprised that some of the most attractively discounted Bond closed-end funds are in the
unloved Foreign and EM space. Given our view that the US dollar is more likely to weaken than strengthen over the next few years (given purchasing power parity and other factors), we expect Foreign/EM Bond closed-end funds to continue to
feature prominently in our portfolio.
|
|
•
|
Short-term interest rates remain near record lows, and the Fed has committed to zero rates for the foreseeable future, even stating explicitly that they will allow inflation to run above 2% “for a time”
(should that ever come to pass). In our view, Bond closed-end funds’ structural advantages (easy and cheap borrowing, paired with high and largely sustainable cash distributions) mean they could be found by an increasing number of investors
who ignore them now. Discounts could therefore narrow for secular reasons for years to come.
|
We appreciate your interest in, and investment in, the Fund. We’ll continue to keep you updated on the important developments we see in the misunderstood, retail-dominated world of closed-end
funds. Check out https://matissefunds.com/ for updates, and feel free to contact us at 503-210-3005 to discuss the Matisse Discounted Bond CEF Strategy and our investment approach.
Sincerely,
|
|
|
Eric Boughton, CFA
Portfolio Manager
Matisse Funds
|
Bryn Torkelson
Founder & CIO
Matisse Funds
|
(RCMAT0321009)
|
Matisse Discounted Bond CEF Strategy
|
|||||||||||||||||
|
Institutional Class Shares
|
|||||||||||||||||
|
Performance Update (Unaudited)
|
|||||||||||||||||
|
For the period from April 30, 2020 (Date of Initial Public Investment) through March 31, 2021
|
|||||||||||||||||
|
Comparison of the Change in Value of a $10,000 Investment
|
|||||||||||||||||
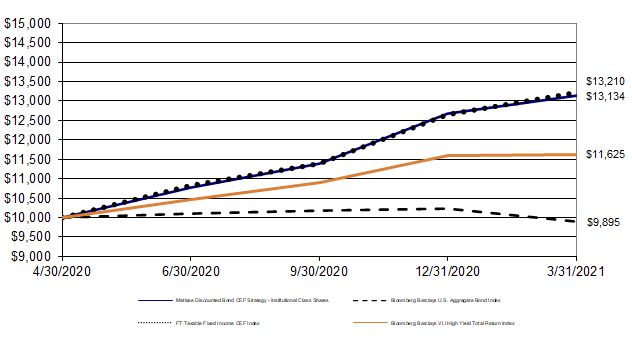
|
This graph assumes an initial investment of $10,000 at April 30, 2020 (Date of Initial Public Investment). All dividends and distributions are reinvested. This graph depicts the performance of the Matisse Discounted Bond CEF Strategy
versus the Fund's benchmark index, the Bloomberg Barclays VLI High Yield Total Return Index. Other indices shown are the Bloomberg Barclays U.S. Aggregate Total Return Bond Index and the FT Taxable Fixed Income CEF Index. It is important to
note that the Fund is a professionally managed mutual fund while the indices are not available for investment and are unmanaged. The comparison is shown for illustrative purposes only.
|
|||||||||||||||||
|
Average Total Returns
|
|||||||||||||||||
|
For the Fiscal Period Ended
|
Three
|
Six
|
Since
|
||||||||||||||
|
March 31, 2021
|
Months
|
Months
|
Inception*(a)
|
||||||||||||||
|
Institutional Class Shares
|
3.59%
|
15.42%
|
31.34%
|
||||||||||||||
|
Bloomberg Barclays U.S. Aggregate Bond Index
|
-3.37%
|
-2.73%
|
-1.05%
|
||||||||||||||
|
Bloomberg Barclays VLI High Yield Total Return Index
|
0.57%
|
6.56%
|
16.53%
|
||||||||||||||
|
FT Taxable Fixed Income CEF Index
|
4.35%
|
15.85%
|
32.10%
|
||||||||||||||
|
*
|
The Inception Date of the Fund is April 30, 2020.
|
||||||||||||||||
|
(a) Not annualized.
|
|||||||||||||||||
| (Continued) |
|||||||||||||||||
|
Matisse Discounted Bond CEF Strategy
|
|||||||||||||||||
|
Institutional Class Shares
|
|||||||||||||||||
|
Performance Update (Unaudited)
|
|||||||||||||||||
|
For the period from April 30, 2020 (Date of Initial Public Investment) through March 31, 2021
|
|||||||||||||||||
|
Performance quoted in the previous graph represents past performance, which is no guarantee of future results. Investment return and principal value will fluctuate so that shares, when redeemed, may be worth more or less than their
original cost. Current performance may be lower or higher than the performance data quoted. The Advisor has entered into an Expense Limitation Agreement with the Trust, on behalf of the Fund, under which it has agreed to waive or reduce its
fees and to assume other expenses of the Fund, if necessary, in amounts that limit the Fund’s total operating expenses (exclusive of (i) any front-end or contingent deferred loads; (ii) brokerage fees and commissions; (iii) acquired fund fees
and expenses; (iv) fees and expenses associated with investments in other collective investment vehicles or derivative instruments (including, for example, option and swap fees and expenses); (v) borrowing costs (such as interest and dividend
expense on securities sold short); (vi) taxes and (vii) extraordinary expenses, such as litigation expenses (which may include indemnification of Fund officers and Trustees and contractual indemnification of Fund service providers (other than
the Advisor)) to not more than 0.99% of the average daily net assets of the Fund for the current fiscal year. The Expense Limitation Agreement remains in effect through July 31, 2021. The Expense Limitation Agreement may be terminated by the
Board of Trustees of the Trust at any time. Without the waiver, the estimated expenses would be 3.24% per the Fund’s most recent prospectus dated April 3, 2020. An investor may obtain performance data, current to the most recent month-end,
by visiting ncfunds.com.
|
|||||||||||||||||
|
The graph and table do not reflect the deduction of taxes that a shareholder would pay on Fund distributions or the redemption of Fund shares. Average annual total returns are historical in nature and measure
net investment income and capital gain or loss from portfolio investments assuming reinvestments of distributions.
|
|||||||||||||||||
|
Matisse Discounted Bond CEF Strategy
|
|||||||||
|
Schedule of Investments
|
|||||||||
|
As of March 31, 2021
|
|||||||||
|
Shares
|
Value (Note 1)
|
||||||||
|
CLOSED-END FUNDS - 104.55%
|
|||||||||
|
Aberdeen Asia-Pacific Income Fund Inc
|
178,000
|
$
|
728,020
|
||||||
|
AllianceBernstein Global High Income Fund, Inc.
|
1,318
|
15,618
|
|||||||
|
Angel Oak Dynamic Financial Strategies Income Term Trust
|
47,000
|
885,950
|
|||||||
|
Angel Oak Financial Strategies Income Term Trust
|
45,000
|
783,900
|
|||||||
|
Apollo Senior Floating Rate Fund, Inc.
|
53,000
|
787,580
|
|||||||
|
Apollo Tactical Income Fund, Inc.
|
53,570
|
797,122
|
|||||||
|
(a)
|
Ares Dynamic Credit Allocation Fund, Inc.
|
54,000
|
811,620
|
||||||
|
Barings Global Short Duration High Yield Fund
|
18,888
|
303,719
|
|||||||
|
BlackRock California Municipal Income Trust
|
50,361
|
723,184
|
|||||||
|
BlackRock Floating Rate Income Trust
|
6,700
|
83,817
|
|||||||
|
BlackRock MuniYield New Jersey Fund, Inc.
|
49,545
|
718,898
|
|||||||
|
Blackstone Long-Short Credit Income Fund
|
34,700
|
490,658
|
|||||||
|
Blackstone Senior Floating Rate Term Fund
|
732
|
11,390
|
|||||||
|
Blackstone Strategic Credit Fund
|
39,000
|
519,870
|
|||||||
|
(a)
|
BrandywineGLOBAL Global Income Opportunities Fund, Inc.
|
68,000
|
820,080
|
||||||
|
Credit Suisse High Yield Bond Fund
|
70,000
|
168,700
|
|||||||
|
Delaware Investments Minnesota Municipal Income Fund II, Inc.
|
44,793
|
590,820
|
|||||||
|
Delaware Investments National Municipal Income Fund
|
4,459
|
58,502
|
|||||||
|
DTF Tax-Free Income, Inc.
|
48,000
|
688,800
|
|||||||
|
DWS Strategic Municipal Income Trust
|
40,029
|
473,543
|
|||||||
|
Eaton Vance California Municipal Income Trust
|
57,800
|
765,879
|
|||||||
|
First Eagle Senior Loan Fund
|
24,509
|
351,459
|
|||||||
|
First Trust High Yield Opportunities 2027 Term Fund
|
11,510
|
228,473
|
|||||||
|
(a)
|
Highland Income Fund
|
87,000
|
964,830
|
||||||
|
Invesco High Income Trust II
|
8,000
|
111,360
|
|||||||
|
Invesco Pennsylvania Value Municipal Income Trust
|
55,615
|
725,776
|
|||||||
|
Invesco Trust for Investment Grade New York Municipals
|
14,300
|
187,473
|
|||||||
|
Ivy High Income Opportunities Fund
|
41,193
|
561,872
|
|||||||
|
KKR Income Opportunities Fund
|
48,788
|
771,826
|
|||||||
|
(a)
|
Morgan Stanley Emerging Markets Debt Fund, Inc.
|
87,000
|
779,520
|
||||||
|
(a)
|
Morgan Stanley Emerging Markets Domestic Debt Fund, Inc.
|
120,000
|
722,400
|
||||||
|
(a)
|
Neuberger Berman California Municipal Fund, Inc.
|
63,000
|
851,130
|
||||||
|
Neuberger Berman New York Municipal Fund, Inc.
|
62,471
|
768,393
|
|||||||
|
Nuveen AMT-Free Municipal Value Fund
|
13,470
|
221,986
|
|||||||
|
Nuveen Credit Strategies Income Fund
|
31,249
|
203,118
|
|||||||
|
Nuveen Georgia Quality Municipal Income Fund
|
1,155
|
15,027
|
|||||||
|
Nuveen Global High Income Fund
|
38,103
|
589,453
|
|||||||
|
Nuveen Mortgage and Income Fund
|
41,000
|
850,750
|
|||||||
|
(a)
|
Nuveen New Jersey Quality Municipal Income Fund
|
54,000
|
781,920
|
||||||
|
Nuveen New York Municipal Value Fund 2
|
1,944
|
28,538
|
|||||||
|
Nuveen Ohio Quality Municipal Income Fund
|
20,608
|
321,485
|
|||||||
|
(a)
|
Nuveen Short Duration Credit Opportunities Fund
|
58,000
|
818,960
|
||||||
|
(a)
|
PGIM Global High Yield Fund, Inc.
|
52,000
|
775,840
|
||||||
|
RiverNorth Specialty Finance Corp.
|
44,109
|
789,547
|
|||||||
|
(a)
|
Templeton Emerging Markets Income Fund
|
95,000
|
700,150
|
||||||
|
The New America High Income Fund, Inc.
|
52,764
|
478,042
|
|||||||
|
(Continued)
|
|||||||||
|
Matisse Discounted Bond CEF Strategy
|
|||||||||
|
Schedule of Investments - Continued
|
|||||||||
|
As of March 31, 2021
|
|||||||||
|
Shares
|
Value (Note 1)
|
||||||||
|
CLOSED-END FUNDS - Continued
|
|||||||||
|
Vertical Capital Income Fund
|
41,700
|
$
|
429,510
|
||||||
|
Wells Fargo Income Opportunities Fund
|
329
|
2,777
|
|||||||
|
Western Asset Inflation-Linked Opportunities & Income Fund
|
38,300
|
465,728
|
|||||||
|
Western Asset Intermediate Muni Fund, Inc.
|
4,147
|
38,525
|
|||||||
|
Total Closed-End Funds (Cost $23,517,894)
|
25,763,538
|
||||||||
|
SHORT-TERM INVESTMENT - 0.79%
|
|||||||||
|
§
|
Fidelity Institutional Money Market Funds - Government Portfolio, 0.01%
|
195,279
|
|
195,279
|
|||||
|
Total Short-Term Investment (Cost $195,279)
|
195,279
|
||||||||
|
Investments, at Value (Cost $23,713,173) - 105.34%
|
$
|
25,958,817
|
|||||||
|
Liabilities in Excess of Other Assets - (5.34)%
|
(1,316,534)
|
||||||||
|
Net Assets - 100.00%
|
$
|
24,642,283
|
|||||||
|
(a)
|
Securities pledged as collateral for margin/borrowings.
|
||||||||
|
§
|
Represents 7 day effective SEC yield.
|
||||||||
|
Summary of Investments
|
|||||||||
|
% of Net
|
|||||||||
|
Assets
|
Value
|
||||||||
|
Closed-End Funds
|
104.55%
|
$
|
25,763,538
|
||||||
|
Short-Term Investment
|
0.79%
|
195,279
|
|||||||
|
Liabilities in Excess of Other Assets
|
-5.34%
|
(1,316,534)
|
|||||||
|
Total Net Assets
|
100.00%
|
$
|
24,642,283
|
||||||
|
See Notes to Financial Statements
|
|||||||||
|
Matisse Discounted Bond CEF Strategy
|
|||
|
Statement of Assets and Liabilities
|
|||
|
As of March 31, 2021
|
|||
|
Assets:
|
|||
|
Investments, at value (cost $23,713,173)
|
$
|
25,958,817
|
|
|
Cash (a)
|
25,101
|
||
|
Receivables:
|
|||
|
Fund shares sold
|
530
|
||
|
Dividends and interest
|
58,246
|
||
|
Prepaid Expenses:
|
|||
|
Registration and filing expenses
|
12,951
|
||
|
Fund accounting fees
|
2,219
|
||
|
Total assets
|
26,057,864
|
||
|
Liabilities:
|
|||
|
Due to broker
|
1,000,010
|
||
|
Payables:
|
|||
|
Investments purchased
|
374,838
|
||
|
Accrued expenses:
|
|||
|
Professional fees
|
24,945
|
||
|
Advisory fees
|
4,695
|
||
|
Shareholder fulfillment expenses
|
3,665
|
||
|
Custody fees
|
2,187
|
||
|
Transfer agent fees
|
1,848
|
||
|
Interest expense
|
1,285
|
||
|
Security pricing fees
|
694
|
||
|
Insurance fees
|
389
|
||
|
Trustee fees and meeting expenses
|
375
|
||
|
Administration fees
|
362
|
||
|
Miscellaneous expenses
|
186
|
||
|
Compliance fees
|
102
|
||
|
|
|||
|
Total liabilities
|
1,415,581
|
||
|
Net Assets
|
$
|
24,642,283
|
|
|
Net Assets Consist of:
|
|||
|
Paid in Interest
|
$
|
22,044,033
|
|
|
Distributable Earnings
|
2,598,250
|
||
|
Net Assets
|
$
|
24,642,283
|
|
|
Institutional Class shares outstanding, no par value (unlimited authorized shares)
|
1,982,269
|
||
|
Net Assets
|
$
|
24,642,283
|
|
|
Net Asset Value, Maximum Offering Price, and Redemption Price Per Share
|
$
|
12.43
|
|
|
(a)
|
Cash pledged as collateral for margin/borrowings at Broker.
|
||
|
See Notes to Financial Statements
|
|||
|
Matisse Discounted Bond CEF Strategy
|
|||
|
Statement of Operations
|
|||
|
For the initial period from April 30, 2020 (Date of Initial Public Investment) through March 31, 2021
|
|||
|
Investment Income:
|
|||
|
Dividends
|
$
|
795,737
|
|
|
Total Investment Income
|
795,737
|
||
|
Expenses:
|
|||
|
Advisory fees (note 2)
|
97,643
|
||
|
Professional fees
|
33,500
|
||
|
Fund accounting fees (note 2)
|
27,579
|
||
|
Administration fees (note 2)
|
26,609
|
||
|
Registration and filing expenses
|
24,403
|
||
|
Transfer agent fees (note 2)
|
19,348
|
||
|
Custody fees (note 2)
|
12,586
|
||
|
Shareholder fulfillment expenses
|
12,135
|
||
|
Trustee fees and meeting expenses (note 3)
|
8,375
|
||
|
Security pricing fees
|
5,565
|
||
|
Insurance fees
|
4,486
|
||
|
Compliance fees (note 2)
|
3,769
|
||
|
Miscellaneous expenses (note 2)
|
2,086
|
||
|
Interest expense (Note 8)
|
1,285
|
||
|
Total Expenses
|
279,369
|
||
|
Advisor fees waived (note 2)
|
(97,643)
|
||
|
Expenses reimbursed by Advisor (note 2)
|
(42,296)
|
||
|
Net Expenses
|
139,430
|
||
|
Net Investment Income
|
656,307
|
||
|
Realized and Unrealized Gain on Investments:
|
|||
|
Net realized gain from:
|
|||
|
Investments
|
634,706
|
||
|
Capital gain distributions from underlying funds
|
10,382
|
||
|
Total net realized gain
|
645,088
|
||
|
Net change in unrealized appreciation on investments
|
2,245,644
|
||
|
Net Realized and Unrealized Gain on Investments
|
2,890,732
|
||
|
Net Increase in Net Assets Resulting from Operations
|
$
|
3,547,039
|
|
|
See Notes to Financial Statements
|
|||
|
Matisse Discounted Bond CEF Strategy
|
||||||||||
|
Statement of Changes in Net Assets
|
||||||||||
|
For the initial period from April 30, 2020 (Date of Initial Public Investment) through March 31, 2021
|
||||||||||
|
Operations:
|
||||||||||
|
Net investment income
|
$
|
656,307
|
||||||||
|
Net realized gain from investment transactions
|
634,706
|
|||||||||
|
Capital gain distributions from underlying funds
|
10,382
|
|||||||||
|
Net change in unrealized appreciation on investments
|
2,245,644
|
|||||||||
|
Net Increase in Net Assets Resulting from Operations
|
3,547,039
|
|||||||||
|
Distributions to Shareholders:
|
||||||||||
|
Institutional Class Shares
|
(948,789)
|
|||||||||
|
Decrease in Net Assets Resulting from Distributions
|
(948,789)
|
|||||||||
|
Beneficial Interest Transactions:
|
||||||||||
|
Shares sold
|
23,024,843
|
|||||||||
|
Reinvested dividends and distributions
|
944,970
|
|||||||||
|
Shares repurchased
|
(1,925,780)
|
|||||||||
|
Increase from Beneficial Interest Transactions
|
22,044,033
|
|||||||||
|
Net Increase (Decrease) in Net Assets
|
24,642,283
|
|||||||||
|
Net Assets:
|
||||||||||
|
Beginning of Period
|
-
|
|||||||||
|
End of Period
|
$
|
24,642,283
|
||||||||
|
Share Information:
|
||||||||||
|
Institutional Class Shares
|
Shares
|
Amount
|
||||||||
|
Shares sold
|
2,063,413
|
$
|
23,024,843
|
|||||||
|
Reinvested dividends and distributions
|
80,114
|
|
944,970
|
|||||||
|
Shares repurchased
|
(161,258)
|
|
(1,925,780)
|
|||||||
|
Net Increase in Shares of Beneficial Interest
|
1,982,269
|
$
|
22,044,033
|
|||||||
|
See Notes to Financial Statements
|
||||||||||
|
Matisse Discounted Bond CEF Strategy
|
|||||||
|
Financial Highlights
|
|||||||
|
For a share outstanding during the initial period from April 30, 2020
|
|||||||
|
(Date of Initial Public Investment) through March 31, 2021
|
Institutional Class Shares | ||||||
|
Net Asset Value, Beginning of Period
|
$ 10.00
|
||||||
|
Income from Investment Operations
|
|||||||
|
Net investment income (e)
|
0.51
|
||||||
|
Net realized and unrealized gain
|
|||||||
|
on investments
|
2.56
|
||||||
|
Total from Investment Operations
|
3.07
|
||||||
|
Less Distributions:
|
|||||||
|
Dividends (from net investment income)
|
(0.64)
|
||||||
|
Total Distributions
|
(0.64)
|
||||||
|
Net Asset Value, End of Period
|
$ 12.43
|
||||||
|
Total Return
|
31.34%
|
(c)
|
|||||
|
Net Assets, End of Period (in thousands)
|
$ 24,642
|
||||||
|
Ratios of:
|
|||||||
|
Interest Expense to Average Net Assets
|
0.01%
|
(b)
|
|||||
|
Gross Expenses to Average Net Assets (a)
|
2.00%
|
(b)(d)
|
|||||
|
Net Expenses to Average Net Assets (a)
|
1.00%
|
(b)(d)
|
|||||
|
Net Investment Income to Average
|
|||||||
|
Net Assets (a)
|
4.71%
|
(a)(b)
|
|||||
|
Portfolio turnover rate
|
37.27%
|
(c)
|
|||||
|
(a)
|
Recognition of the Fund's net investment income is affected by the timing of dividend declarations of underlying funds. The expenses of the underlying funds are excluded from the Fund's expense ratio.
|
||||||
|
(b)
|
Annualized.
|
||||||
|
(c)
|
Not annualized.
|
||||||
|
(d)
|
Includes interest expense.
|
||||||
|
(e)
|
Calculated using the average shares method.
|
||||||
|
See Notes to Financial Statements
|
|||||||
| Matisse Discounted Bond CEF Strategy |
| Notes to Financial Statements |
| As of March 31, 2021 |
1. Organization and Significant Accounting Policies
The Matisse Discounted Bond CEF Strategy (“Fund”) is a series of the Starboard Investment Trust (“Trust”). The Trust is organized as a Delaware statutory trust and is registered under the Investment Company Act of
1940, as amended (the “1940 Act”), as an open-end management investment company. The Fund is a separate diversified series of the Trust.
The Fund’s investment advisor, Deschutes Portfolio Strategies, LLC, dba Matisse Capital, (the “Advisor”), seeks to achieve the Fund’s investment objective of total return with an emphasis on providing current income by
principally investing in unaffiliated closed-end funds that are registered under the Investment Company Act of 1940. The Fund will invest, under normal circumstances, at least 80% of its net assets, plus any borrowing for investment purposes, in
discounted closed-end funds that primarily invest in bonds.
The following is a summary of significant accounting policies consistently followed by the Fund. The policies are in conformity with accounting principles generally accepted in the United States of America (“GAAP”).
The Fund follows the accounting and reporting guidance in the Financial Accounting Standards Board (“FASB”) Accounting Standards Codification 946 “Financial Services – Investment Companies,” and Financial Accounting Standards Update (“ASU”) 2013-08.
Investment Valuation
The Fund’s investments in securities are carried at fair value. Securities listed on an exchange or quoted on a national market system are valued at the last sales price as of 4:00 p.m. Eastern Time. Securities traded
in the NASDAQ over-the-counter market are generally valued at the NASDAQ Official Closing Price. Other securities traded in the over-the-counter market and listed securities for which no sale was reported on that date are valued at the mean of the
most recent bid and ask prices. Instruments with maturities of 60 days or less are valued at amortized cost, which approximates market value. Investments in open-end investment companies are valued at their respective net asset values as reported by
such investment companies. Securities and assets for which representative market quotations are not readily available (e.g., if the exchange on which the security is principally traded closes early or if trading of the particular security is halted
during the day and does not resume prior to the Fund’s net asset value calculation) or which cannot be accurately valued using the Fund’s normal pricing procedures are valued at fair value as determined in good faith under policies approved by the
Trustees. A security’s “fair value” price may differ from the price next available for that security using the Fund’s normal pricing procedures. The shares of many closed-end investment companies, after their initial public offering, frequently
trade at a price per share, which is different than the net asset value per share. The difference represents a market premium or market discount of such shares. There can be no assurances that the market discount or market premium on shares of any
closed-end investment company purchased by the Funds will not change.
Fair Value Measurement
Various inputs are used in determining the value of the Fund's investments. These inputs are summarized in the three broad levels listed below:
Level 1: Unadjusted quoted prices in active markets for identical securities
Level 2: Other significant observable inputs (including quoted prices for similar securities, interest rates, credit risk, etc.)
Level 3: Significant unobservable inputs (including the Fund’s own assumptions in determining fair value of investments)
The availability of observable inputs can vary from security to security and is affected by a wide variety of factors, including, for example, the type of security, whether the security is new and not yet established
in the marketplace, the liquidity of markets, and other characteristics particular to the security. To the extent that valuation is based on models or inputs that are less observable or unobservable in the market, the determination of fair value
requires more judgment. Accordingly, the degree of judgment exercised in determining fair value is greatest for instruments categorized in Level 3.
The inputs used to measure fair value may fall into different levels of the fair value hierarchy. In such cases, for disclosure purposes, the level in the fair value hierarchy within which the fair value measurement
falls in its entirety, is determined based on the lowest level input that is significant to the fair value measurement in its entirety.
|
|
(Continued) |
| Matisse Discounted Bond CEF Strategy |
| Notes to Financial Statements |
| As of March 31, 2021 |
The inputs or methodology used for valuing securities are not necessarily an indication of the risk associated with investing in those securities. The following table summarizes the inputs as of March 31, 2021 for the
Fund’s investments measured at fair value:
|
Investments in Securities (a)
|
Total
|
Level 1
|
Level 2
|
Level 3
|
||||
|
Closed-End Funds
|
$
|
25,763,538
|
$
|
25,763,538
|
$
|
-
|
$
|
-
|
|
Short-Term Investment
|
195,279
|
195,279
|
-
|
-
|
||||
|
Total Assets
|
$
|
25,958,817
|
$
|
25,958,817
|
$
|
-
|
$
|
-
|
|
(a)
|
The Fund had no Level 3 securities as of the initial period ended March 31, 2021.
|
Investment Transactions and Investment Income
Investment transactions are accounted for as of the date purchased or sold (trade date). Dividend income is recorded on the ex-dividend date. Certain dividends from foreign securities will be recorded as soon as the
Fund is informed of the dividend if such information is obtained subsequent to the ex-dividend date. Gains and losses are determined on the identified cost basis, which is the same basis used for federal income tax purposes.
Distributions
The Fund may declare and distribute dividends from net investment income, if any, quarterly. Distributions from capital gains, if any, are generally declared and distributed annually. Dividends and distributions to
shareholders are recorded on ex-date.
Expenses
The Fund bears expenses incurred specifically on its behalf as well as a portion of general expenses, which are allocated according to methods reviewed annually by the Trustees.
Estimates
The preparation of financial statements in conformity with GAAP requires management to make estimates and assumptions that affect the reported amounts of assets and liabilities and disclosure of contingent assets and
liabilities at the date of the financial statements and the reported amounts of increases and decreases in the net assets from operations during the reporting period. Actual results could differ from those estimates.
Federal Income Taxes
No provision for income taxes is included in the accompanying financial statements, as the Fund intends to distribute to shareholders all taxable investment income and realized gains and otherwise comply with
Subchapter M of the Internal Revenue Code applicable to regulated investment companies.
Because the underlying funds have varied expense and fee levels and the Fund may own different proportions of underlying funds at different times, the amount of fees and expense incurred indirectly by the Fund will
vary.
Risk Considerations
Closed-End Fund Risk. Closed-end funds involve investment risks different from those associated with other investment companies. First, the shares of closed-end funds frequently
trade at a premium or discount relative to their NAV. When the Fund purchases shares of a closed-end fund at a discount to its NAV, there can be no assurance that the discount will decrease, and it is possible that the discount may increase and
affect whether the Fund will a realize gain or loss on the investment. Second, many closed-end funds use leverage, or borrowed money, to try to increase returns. Leverage is a speculative technique and its use by a closed-end fund entails greater
risk and leads to a more volatile share price. If a closed-end fund uses leverage, increases and decreases in the value of its share price will be magnified. The closed-end fund will also have to pay interest or dividends on its leverage, reducing
the closed-end fund's return. Third, many closed-end funds have a policy of distributing a fixed percentage of net assets regardless of the fund's actual interest income and capital gains. Consequently, distributions by a closed-end fund may include
a return of capital, which would reduce the fund's NAV and its earnings capacity. Finally, closed-end funds are allowed to invest in a greater amount of illiquid securities than open-end mutual funds. Investments in illiquid securities pose risks
related to uncertainty in valuations, volatile market prices, and limitations on resale that may have an adverse effect on the ability of the fund to dispose of the securities promptly or at reasonable prices.
|
|
(Continued) |
| Matisse Discounted Bond CEF Strategy |
| Notes to Financial Statements |
| As of March 31, 2021 |
Fund of Funds Risk. The Fund is a "fund of funds." The term "fund of funds" is typically used to describe investment companies, such as the Fund, whose principal investment
strategy involves investing in other investment companies, including closed-end funds and money market mutual funds. Investments in other funds subject the Fund to additional operating and management fees and expenses. For instance, investors in the
Fund will indirectly bear fees and expenses charged by the funds in which the Fund invests, in addition to the Fund's direct fees and expenses. The Fund's performance depends in part upon the performance of the funds' investment advisor, the
strategies and instruments used by the funds, and the Advisor's ability to select funds and effectively allocate Fund assets among them.
Fixed Income Securities Risk. When the Portfolio Funds invest in fixed income securities, the value of your investment in the Fund will fluctuate with changes in interest rates.
Typically, a rise in interest rates causes a decline in the value of fixed income 6 securities. In general, the market price of fixed income securities with longer maturities will increase or decrease more in response to changes in interest rates
than shorter-term securities. Other risk factors include credit risk (the debtor may default), extension risk (an issuer may exercise its right to repay principal on a fixed rate obligation later than expected), and prepayment risk (the debtor may
pay its obligation early, reducing the amount of interest payments). These risks could affect the value of a particular investment by the Fund, possibly causing the Fund's share price and total return to be reduced and fluctuate more than other types
of investments.
COVID-19 and Other Infectious Illnesses Risk. An outbreak of infectious respiratory illness caused by a novel coronavirus known as COVID-19 was first detected in China in 7
December 2019 and has now been detected globally. COVID-19 has resulted in travel restrictions, closed international borders, enhanced health screenings at ports of entry and elsewhere, disruption of and delays in healthcare service preparation and
delivery, prolonged quarantines, cancellations, supply chain disruptions, and lower consumer demand, as well as general concern and uncertainty. The impact of COVID-19, and other infectious illness outbreaks that may arise in the future, could
adversely affect the economies of many countries or the entire global economy, individual issuers and capital markets in ways that cannot necessarily be foreseen. In addition, the impact of infectious illnesses in emerging market countries may be
greater due to generally less established healthcare systems. Public health crises caused by the COVID-19 outbreak, or other infectious illness outbreaks that may arise in the future, may exacerbate other pre-existing political, social and economic
risks in certain countries or globally. As such, issuers of debt securities with operations, productions, offices, and/or personnel in (or other exposure to) areas affected with the virus may experience significant disruptions to their business
and/or holdings. The potential impact on the credit markets may include market illiquidity, defaults and bankruptcies, among other consequences, particularly on issuers in the airline, travel and leisure and retail sectors. The extent to which
COVID-19 or other infectious illnesses will affect the Fund, the Fund’s service providers’ and/or issuer’s operations and results will depend on future developments, which are highly uncertain and cannot be predicted, including new information that
may emerge concerning the severity of COVID19 or other infectious illnesses and the actions taken to contain COVID-19 or other infectious illnesses. Economies and financial markets throughout the world are becoming increasingly interconnected. As a
result, whether or not the Fund invests in securities of issuers located in or with significant exposure to countries experiencing economic, political and/or financial difficulties, the value and liquidity of the Fund’s investments may be negatively
affected by such events. If there is a significant decline in the value of the Fund’s portfolio, this may impact the Fund’s asset coverage levels for certain kinds of derivatives and other portfolio transactions. The duration of the COVID-19
outbreak, or any other infectious illness outbreak that may arise in the future, and its impact on the global economy cannot be determined with certainty.
2. Transactions with Related Parties and Service Providers
Advisor
The Fund pays a monthly fee to the Advisor calculated at the annual rate of 0.70% of the Fund’s average daily net assets. For the initial period from April 30, 2020 (Date of Initial Public Investment) through March
31, 2021, $97,643 in advisory fees were incurred, all of which were waived and $42,296 of other expenses were reimbursed by the Advisor.
The Advisor has entered into a contractual agreement (the “Expense Limitation Agreement”) with the Trust, on behalf of the Fund, under which it has agreed to waive or reduce its fees and to assume other expenses of the
Fund, if necessary, in amounts that limit the Fund’s total operating expenses (exclusive of (i) any front-end or contingent deferred loads; (ii) brokerage fees and commissions; (iii) acquired fund fees and expenses; (iv) fees and expenses associated
with investments in other collective investment vehicles or derivative instruments (including, for example, option and swap fees and expenses); (v) borrowing costs (such as interest and dividend expense on securities sold short); (vi) taxes and (vii)
extraordinary expenses, such as litigation expenses (which may include indemnification of Fund officers and Trustees and contractual indemnification of Fund service providers (other than the Advisor)) to not more than 0.99% of the average daily net
assets of the Fund. The current term of the Expense Limitation Agreement remains in effect until July 31, 2021. While there can be no assurance that the Expense Limitation Agreement will continue after that date, it is expected to continue from
year-to-year thereafter. The Advisor cannot recoup from the Fund any expenses paid by the Advisor under the Expense Limitation Agreement.
|
|
(Continued) |
| Matisse Discounted Bond CEF Strategy |
| Notes to Financial Statements |
| As of March 31, 2021 |
Administrator
The Fund pays a monthly fee to the Fund’s administrator, The Nottingham Company (“the Administrator”), based upon the average daily net assets of the Fund and calculated at the annual rates as shown in the schedule
below which is subject to a minimum of $2,000 per month. The Administrator also receives a fee to procure and pay the Fund’s custodian, additional compensation for fund accounting and recordkeeping services, and additional compensation for certain
costs involved with the daily valuation of securities and as reimbursement for out-of-pocket expenses. The Administrator also receives a miscellaneous compensation fee for peer group, comparative analysis, and compliance support totaling $350 per
month. For the period from April 30, 2020 (Date of Initial Public Investment) through March 31, 2021, the Administrator received $2,086 in miscellaneous expenses.
A breakdown of these fees is provided in the following table:
|
Administration Fees*
|
Custody Fees*
|
Fund
Accounting
Fees
|
Fund Accounting Fees
(asset-based fee)
|
Blue Sky
Administration
Fees (annual)
|
|||||
|
Average Net
Assets
|
Annual
Rate
|
Average Net
Assets
|
Annual
Rate
|
(Average
monthly)
|
Net Assets
|
Annual
Rate
|
Per state
|
||
|
First $100 million
|
0.100%
|
First $200 million
|
0.020%
|
$2,250
|
First $50
million
|
0.02%
|
$150
|
||
|
Next $100 million
|
0.090%
|
Over $200 million
|
0.009%
|
$500/
additional
class
|
Next $50
million
|
0.015%
|
|||
|
Next $100 million
|
0.080%
|
Over $100
million
|
0.01%
|
||||||
|
Next $100 million
|
0.070%
|
*Minimum monthly fees of $2,000 and $417 for Administration and Custody, respectively.
|
|||||||
|
Next $100 million
|
0.060%
|
||||||||
|
Over $500 million
|
0.050%
|
||||||||
|
Over $750 million
|
0.040%
|
||||||||
|
Over $1 billion
|
0.030%
|
||||||||
The Fund incurred $26,609 in administration fees, $12,586 in custody fees, and $27,579 in fund accounting fees for the initial period from April 30, 2020 (Date of Initial Public Investment) through March 31, 2021.
|
|
(Continued) |
| Matisse Discounted Bond CEF Strategy |
| Notes to Financial Statements |
| As of March 31, 2021 |
Compliance Services
The Nottingham Company, Inc. serves as the Trust’s compliance services provider including services as the Trust’s Chief Compliance Officer. The Nottingham Company, Inc. is entitled to receive customary fees from the
Fund for its services pursuant to the Compliance Services Agreement with the Fund.
Transfer Agent
Nottingham Shareholder Services, LLC (“Transfer Agent”) serves as transfer, dividend paying, and shareholder servicing agent for the Fund. For its services, the Transfer Agent is entitled to receive compensation
from the Fund pursuant to the Transfer Agent’s fee arrangements with the Fund.
Distributor
Capital Investment Group, Inc. (the “Distributor”) serves as the Fund’s principal underwriter and distributor. For its services, the Distributor is entitled to receive compensation from the Fund pursuant to the
Distributor’s fee arrangements with the Fund.
3. Trustees and Officers
The Trust is governed by the Board of Trustees, which is responsible for the management and supervision of the Fund. The Trustees meet periodically throughout the year to review contractual agreements with companies
that furnish services to the Fund; review performance of the Advisor and the Fund; and oversee activities of the Fund. Officers of the Trust and Trustees who are interested persons of the Trust or the Advisor will receive no salary or fees from
the Trust. Each Trustee who is not an “interested person” of the Trust or the Advisor within the meaning of the Investment Company Act of 1940, as amended (the “Independent Trustee”) receives $2,000 per series per year, $200 per meeting attended,
and $500 per series per special meeting related to contract renewal issues. The Trust reimburses each Trustee and officer of the Trust for his or her travel and other expenses related to attendance of Board meetings. Additional fees were incurred
during the year as special meetings were necessary in addition to the regularly scheduled meetings of the Board of Trustees.
Certain officers of the Trust may also be officers of the Administrator.
4. Purchases and Sales of Investment Securities
For the initial period ended March 31, 2021, the aggregate cost of purchases and proceeds from sales of investment securities (excluding short-term securities) were as follows:
|
Purchases of Securities
|
Proceeds from
Sales of Securities
|
|
$29,111,723
|
$6,060,970
|
5. Federal Income Tax
Distributions are determined in accordance with Federal income tax regulations, which may differ from GAAP, and, therefore, may differ significantly in amount or character from net investment income and realized
gains for financial reporting purposes. The general ledger is adjusted for permanent book/tax differences to reflect tax character but is not adjusted for temporary differences.
Management has reviewed the Fund’s tax positions during the initial period ended March 31, 2021 and determined that the Fund does not have a liability for uncertain tax positions. The Fund recognizes interest and
penalties, if any, related to unrecognized tax benefits as income tax expense in the Statement of Operations. During the initial period, the Fund did not incur any interest or penalties.
|
|
(Continued) |
| Matisse Discounted Bond CEF Strategy |
| Notes to Financial Statements |
| As of March 31, 2021 |
Distributions during the period ended were characterized for tax purposes as follows:
| March 31, 2021 | |||
|
Ordinary Income
|
$ 830,568 |
||
|
Tax Exempt Income
|
118,221 |
||
|
Total Income Distribution
|
$ 948,789 |
At March 31, 2021, the tax-basis cost of investments and components of distributable earnings were as follows:
|
Cost of Investments
|
$ 23,713,173
|
|
|
Unrealized Appreciation
|
2,267,414
|
|
|
Unrealized Depreciation
|
(21,770)
|
|
|
Net Unrealized Appreciation
|
$ 2,245,644
|
|
|
Ordinary Income Spillback
|
342,224
|
|
|
Long-Term Capital Gain Spillback
|
10,382
|
|
|
Distributable Earnings
|
$ 2,598,250
|
|
6. Beneficial Ownership
The beneficial ownership, either directly or indirectly, of 25% or more of the voting securities of a fund creates a presumption of control of a fund, under Section 2(a)(9) of the Investment Company Act of 1940. As
of March 31, 2021, Charles Schwab & Co., Inc. held 85.74% of the Fund. The Fund has no knowledge as to whether all or any portion of the shares of record owned by Charles Schwab & Co., Inc. are also owned beneficially.
7. Commitments and Contingencies
Under the Trust’s organizational documents, its officers and Trustees are indemnified against certain liabilities arising out of the performance of their duties to the Fund. In addition, in the normal course of
business, the Trust entered into contracts with its service providers, on behalf of the Fund, and others that provide for general indemnifications. The Fund’s maximum exposure under these arrangements is unknown, as this would involve future
claims that may be made against the Fund. The Fund expects risk of loss to be remote.
8. Borrowings
The Fund established a borrowing agreement with Interactive Brokers LLC for investment purposes subject to the limitations of the 1940 Act for borrowings by registered investment companies.
Interest is based on the Federal Funds rate plus 1.50% on the first $100,000, the Federal Funds rate plus 1.00% on the next $900,000, the Federal Funds rate plus 0.50% on balances between $1,000,000 and $3,000,000,
and the Federal Funds rate plus 0.30% on balances greater than $3,000,000. The average borrowing during the fiscal year ended March 31, 2021 was $289,192, and the average interest rate during the same period was 1.17%.
Interest expense is charged directly to the Fund based upon actual amounts borrowed by the Fund. The Fund had $1,000,010 in borrowings as of the fiscal period ended March 31, 2021. Total interest expense for the
fiscal period was $1,285 as reflected in the Statement of Operations.
|
|
(Continued) |
| Matisse Discounted Bond CEF Strategy |
| Notes to Financial Statements |
| As of March 31, 2021 |
9. Subsequent Events
In accordance with GAAP, management has evaluated the need for disclosures and/or adjustments resulting from subsequent events through the date of issuance of these financial statements. Management has concluded
there are no additional matters, other than those noted above, requiring recognition or disclosure.
REPORT OF INDEPENDENT REGISTERED PUBLIC ACCOUNTING FIRM
To the Board of Trustees of Starboard Investment Trust
and the Shareholders of Matisse Discounted Bond CEF Strategy
Opinion on the Financial Statements
We have audited the accompanying statement of assets and liabilities of Matisse Discounted Bond CEF Strategy, a series of shares of beneficial interest in Starboard Investment Trust (the “Fund”), including the schedule of investments, as of March 31, 2021, and the related statement of operations and changes in net assets and the financial highlights for the period April
30, 2020 (date of initial public investment) to March 31, 2021, and the related notes (collectively referred to as the “financial statements”). In our opinion, the financial
statements present fairly, in all material respects, the financial position of the Fund as of March 31, 2021, and the results of its operations, the changes in its net assets and its financial highlights for the period April 30, 2020 to March
31, 2021, in conformity with accounting principles generally accepted in the United States of America.
Basis for Opinion
These financial statements are the responsibility of the Fund’s management. Our responsibility is to express an opinion on the Fund's financial statements based on our audit. We are a public accounting firm
registered with the Public Company Accounting Oversight Board (United States) (“PCAOB”) and are required to be independent with respect to the Fund in accordance with the U.S. federal
securities law and the applicable rules and regulations of the Securities and Exchange Commission and the PCAOB.
We conducted our audit in accordance with the standards of the PCAOB. Those standards require that we plan and perform the audit to obtain reasonable assurance about whether the financial statements are free of
material misstatement, whether due to error or fraud. The Fund is not required to have, nor were we engaged to perform, an audit of its internal control over financial reporting. As part of our audit we are required to obtain an understanding
of internal control over financial reporting but not for the purpose of expressing an opinion on the effectiveness of the Fund’s internal control over financial reporting. Accordingly, we express no such opinion.
Our audit included performing procedures to assess the risk of material misstatement of the financial statements, whether due to error or fraud, and performing procedures that respond to those risks. Such
procedures included examining, on a test basis, evidence regarding the amounts and disclosures in the financial statements. Our procedures included confirmation of securities owned as of March 31, 2021 by correspondence with the custodian and
broker. Our audit also included evaluating the accounting principles used and significant estimates made by management, as well as evaluating the overall presentation of the financial statements. We believe that our audit provides a reasonable
basis for our opinion.
BBD, LLP
We have served as the auditor of one or more of the Funds in the Starboard Investment Trust since 2012.
Philadelphia, Pennsylvania
May 26, 2021
| Matisse Discounted Bond CEF Strategy |
|
Additional Information
(Unaudited)
|
| As of March 31, 2021 |
|
1.
|
Proxy Voting Policies and Voting Record
|
A copy of the Advisor’s Proxy Voting and Disclosure Policy is included as Appendix B to the Fund’s Statement of Additional Information and is available, without charge, upon request, by calling 800-773-3863, and on
the website of the Securities and Exchange Commission (“SEC”) at http://www.sec.gov. Information regarding how the Fund voted proxies relating to portfolio securities during the most recent 12-month period ended June 30 is available (1) without
charge, upon request, by calling the Fund at the number above and (2) on the SEC’s website at http://www.sec.gov.
|
2.
|
Quarterly Portfolio Holdings
|
The Fund files its complete schedule of portfolio holdings with the SEC for the first and third quarters of each fiscal year on Form N-PORT. The Fund’s Forms N-PORT are available on the SEC’s website at
http://www.sec.gov. You may also obtain copies without charge, upon request, by calling the Fund at 800-773-3863.
|
3.
|
Tax Information
|
We are required to advise you within 60 days of the Fund’s fiscal year-end regarding federal tax status of certain distributions received by shareholders during each fiscal period. The following information is
provided for the Fund’s initial period ended March 31, 2021.
During the initial period, the Fund paid $948,789 in income distributions but no long-term capital gain distributions.
Dividend and distributions received by retirement plans such as IRAs, Keogh-type plans, and 403(b) plans need not be reported as taxable income. However, many retirement plans may need this information for their
annual information meeting.
|
4.
|
Schedule of Shareholder Expenses
|
As a shareholder of the Fund, you incur ongoing costs, including management fees and other Fund expenses. This Example is intended to help you understand your ongoing costs (in dollars) of investing in the Fund and
to compare these costs with the ongoing costs of investing in other mutual funds.
The Example is based on an investment of $1,000 invested at the beginning of the period and held for the six month period from October 1, 2020 through March 31, 2021.
Actual Expenses – The first line of the table below provides information about actual account values and actual expenses. You may use the information in this line, together
with the amount you invested, to estimate the expenses that you paid over the period. Simply divide your account value by $1,000 (e.g., an $8,600 account value divided by $1,000 = 8.6), then multiply the result by the number in the first line under
the heading entitled “Expenses Paid During Period” to estimate the expenses you paid on your account during this period.
Hypothetical Example for Comparison Purposes – The second line of the table below provides information about hypothetical account values and hypothetical expenses based on the
Fund’s actual expense ratio and an assumed rate of return of 5% per year before expenses, which is not the Fund’s actual return. The hypothetical account values and expenses may not be used to estimate the actual ending account balance or expenses
you paid for the period. You may use this information to compare the ongoing costs of investing in the Fund and other funds. To do so, compare this 5% hypothetical example with the 5% hypothetical examples that appear in the shareholder reports of
the other funds.
Please note that the expenses shown in the table are meant to highlight your ongoing costs only and do not reflect any transactional costs, such as sales charges (loads), redemption fees, or
exchange fees. Therefore, the second line of the table is useful in comparing ongoing costs only and will not help you determine the relative total costs of owning different funds. In addition, if these transactional costs were included, your costs
would have been higher.
|
|
(Continued) |
| Matisse Discounted Bond CEF Strategy |
|
Additional Information
(Unaudited)
|
| As of March 31, 2021 |
|
Institutional Class Shares
|
Beginning
Account Value
October 1, 2020
|
Ending
Account Value
March 31, 2021
|
Expenses Paid
During Period*
|
|
Actual
Hypothetical (5% annual return before expenses)
|
|||
|
$1,000.00
|
$1,154.18
|
$5.32
|
|
|
$1,000.00
|
$1,020.00
|
$4.99
|
*Expenses are equal to the average account value over the period multiplied by the Fund’s annualized net expense ratio of 0.99%, multiplied by the number of days in the initial period divided by the number of days in
the fiscal year (to reflect the six month period).
5. Information about Trustees and Officers
The business and affairs of the Fund and the Trust are managed under the direction of the Board of Trustees of the Trust. Information concerning the Trustees and officers of the Trust and Fund is set forth below.
Generally, each Trustee and officer serves an indefinite term or until certain circumstances such as their resignation, death, or otherwise as specified in the Trust’s organizational documents. Any Trustee may be removed at a meeting of
shareholders by a vote meeting the requirements of the Trust’s organizational documents. The Statement of Additional Information of the Fund includes additional information about the Trustees and officers and is available, without charge, upon
request by calling the Fund toll-free at 800-773-3863. The address of each Trustee and officer, unless otherwise indicated below, is 116 South Franklin Street, Rocky Mount, North Carolina 27804. The Independent Trustees each received aggregate
compensation of $2,000 during the fiscal year ended March 31, 2021 from the Fund for their services to the Fund and Trust.
|
|
(Continued) |
| Matisse Discounted Bond CEF Strategy |
|
Additional Information
(Unaudited)
|
| As of March 31, 2021 |
|
Name and
Date of Birth |
Position
held with Funds or Trust |
Length
of Time
Served
|
Principal Occupation
During Past 5 Years |
Number of
Portfolios
in Fund
Complex
Overseen
by Trustee
|
Other Directorships
Held by Trustee During Past 5 Years |
|
Independent Trustees
|
|||||
|
James H. Speed, Jr.
(06/1953) |
Independent Trustee, Chairman
|
Trustee since 7/09, Chair since 5/12
|
Retired Executive/Private Investor.
|
12
|
Independent Trustee of the Brown Capital Management Mutual Funds for all its series from 2011 to present, Hillman Capital Management Investment Trust for all its series from 2009 to present,
Centaur Mutual Funds Trust for all its series from 2013 to present, Chesapeake Investment Trust for all its series from 2016 to present, Leeward Investment Trust for all its series from 2018 to present, and WST Investment Trust for all its
series from 2013 to present, (all registered investment companies). Member of Board of Directors of Communities in Schools of N.C. from 2001 to present. Member of Board of Directors of Investors Title Company from 2010 to present. Member of
Board of Directors of AAA Carolinas from 2011 to present. Previously, member of Board of Directors of M&F Bancorp Mechanics & Farmers Bank from 2009 to 2019. Previously, member of Board of Visitors of North Carolina Central
University School of Business from 1990 to 2016. Previously, Board of Directors of NC Mutual Life Insurance Company from 2004 to 2016. Previously, President and CEO of North Carolina Mutual Life Insurance Company from 2003 to 2015.
|
|
Theo H. Pitt, Jr.
(04/1936) |
Independent Trustee
|
Since 9/10
|
Senior Partner, Community Financial Institutions Consulting (financial consulting) since 1999.
|
12
|
Independent Trustee of World Funds Trust for all its series from 2013 to present, Chesapeake Investment Trust for all its series from 2002 to present, Leeward Investment Trust for all its
series from 2011 to present, and Hillman Capital Management Investment Trust for all its series from 2000 to present (all registered investment companies). Senior Partner of Community Financial Institutions Consulting from 1997 to present.
Previously, Partner at Pikar Properties from 2001 to 2017.
|
|
Michael G. Mosley
(01/1953) |
Independent Trustee
|
Since 7/10
|
Owner of Commercial Realty Services (real estate) since 2004.
|
12
|
None.
|
|
J. Buckley Strandberg
(03/1960) |
Independent Trustee
|
Since 7/09
|
President of Standard Insurance and Realty since 1982.
|
12
|
None.
|
|
|
(Continued) |
| Matisse Discounted Bond CEF Strategy |
|
Additional Information
(Unaudited)
|
| As of March 31, 2021 |
|
Name and
Date of Birth |
Position held with
Funds or Trust |
Length
of Time Served |
Principal Occupation
During Past 5 Years |
|
Officers
|
|||
|
Katherine M. Honey
(09/1973) |
President and Principal Executive Officer
|
Since 05/15
|
President of The Nottingham Company since 2018. EVP of The Nottingham Company from 2008 to 2018.
|
|
Ashley H. Lanham
(03/1984)
|
Treasurer, Assistant Secretary, Principal Accounting Officer and Principal Financial Officer
|
Since 05/15
|
Director of Fund Administration, The Nottingham Company since 2008.
|
|
Tracie A. Coop
(12/1976) |
Secretary
|
Since 12/19
|
General Counsel, The Nottingham Company since 2019. Formerly, Vice President and Managing Counsel, State Street Bank and Trust Company from 2015 to 2019. Formerly, General Counsel for
Santander Asset Management USA, LLC from 2013 to 2015.
|
|
Matthew Baskir
(07/1979) |
Chief Compliance Officer
|
Since 04/20
|
Compliance Director, The Nottingham Company, Inc., since 2020. Formerly, Consultant at National Regulatory Services from 2019 to 2020. Formerly, Counsel at Financial Industry Regulatory
Authority (FINRA), Member Supervision from 2016-2019. Formerly Counsel at FINRA, Market Regulation Enforcement from 2014 – 2016.
|
Matisse Discounted Bond CEF Strategy
is a series of
The Starboard Investment Trust
|
For Shareholder Service Inquiries:
|
For Investment Advisor Inquiries:
|
| Nottingham Shareholder Services |
Deschutes Portfolio Strategies
|
| 116 South Franklin Street |
4949 Meadows Road
|
|
Post Office Box 69
Rocky Mount, North Carolina 27802-0069
|
Suite 200
Lake Oswego, Oregon 97035
|
|
Telephone:
800-773-3863
|
Telephone:
503-210-3001
|
|
World Wide Web @:
ncfunds.com
|
World Wide Web @:
matissefunds.com
|
| Item 2. |
CODE OF ETHICS. |
| (a) |
The registrant, as of the end of the period covered by this report, has adopted a code of ethics that applies to the registrant’s principal executive officer, principal financial officer, and principal accounting officer or controller, or
persons performing similar functions, regardless of whether these individuals are employed by the registrant or a third party (the “Code of Ethics”).
|
| (c) |
During the period covered by this report, there have been no substantive amendments to the provisions of the Code of Ethics.
|
| (d) |
During the period covered by this report, the registrant did not grant any waivers to the provisions of the Code of Ethics.
|
| (f)(1) |
A copy of the Code of Ethics is filed with this Form N-CSR as Exhibit 13(a)(1).
|
| Item 3. |
AUDIT COMMITTEE FINANCIAL EXPERT. |
The registrant’s Board of Trustees has determined that there is at least one member who qualifies as an audit committee financial expert, as that term is defined under Item 3(b) of
Form N-CSR, serving on its audit committee.
As of the date of this report, the registrant’s audit committee financial expert is Mr. James H. Speed, Jr. Mr. Speed is “independent” for purposes of Item 3 of Form N-CSR.
| Item 4. |
PRINCIPAL ACCOUNTANT FEES AND SERVICES. |
|
(a)
|
Audit Fees – Audit fees billed for the Matisse Discounted Closed-End Fund Strategy and Matisse Discounted Bond CEF Strategy (the “Funds”), each a series of the Trust, for the last
two fiscal years are reflected in the table below. These amounts represent aggregate fees billed for each of the last two fiscal years for professional services rendered by the registrant’s independent accountant, BBD, LLP (“Accountant”),
for the audit of the Funds’ financial statements or services that are normally provided by the Accountant in connection with the registrant’s statutory and regulatory filings or engagements for those fiscal years.
|
|
Funds
|
March 31,
2020 |
March 31,
2021 |
|
Matisse Discounted Closed-End Fund Strategy
|
$12,250
|
$12,250
|
|
Matisse Discounted Bond CEF Strategy
|
$0
|
$12,250
|
|
(b)
|
Audit-Related Fees – There were no additional fees billed in the fiscal years ended March 31, 2020 and March 31, 2021 for assurance and related services by the Accountant that were reasonably related to
the performance of the audit of the Funds’ financial statements and that were not reported under paragraph (a) of this Item.
|
|
(c)
|
Tax Fees – The tax fees billed in each of the last two fiscal years ended for professional services rendered by the Accountant for tax compliance, tax advice, and tax planning are reflected in the table
below. These services were for the completion of the Funds’ federal and state income tax returns, excise tax returns, and assistance with distribution calculations.
|
|
Funds
|
March 31,
2020 |
March 31,
2021 |
|
Matisse Discounted Closed-End Fund Strategy
|
$2,000
|
$2,500
|
|
Matisse Discounted Bond CEF Strategy
|
$0
|
$2,000
|
|
(d)
|
All Other Fees – There were no other fees billed in each of the fiscal years ended March 31, 2020 and March 31, 2021 for products and services provided by the Accountant, other than the services reported
in paragraphs (a) through (c) of this item.
|
| (e)(1) |
The registrant’s Board of Trustees pre-approved the engagement of the Accountant for the last two fiscal years at an audit committee meeting of the Board of Trustees called for such purpose; and will pre-approve the Accountant for each
fiscal year thereafter at an audit committee meeting called for such purpose. The charter of the audit committee states that the audit committee should pre-approve any audit services and, when appropriate, evaluate and pre-approve any
non-audit services provided by the Accountant to the registrant and to pre-approve, when appropriate, any non-audit services provided by the Accountant to the registrant’s investment adviser, or any entity controlling, controlled by, or under
common control with the investment adviser that provides ongoing services to the registrant if the engagement relates directly to the operations and financial reporting of the registrant.
|
| (2) |
There were no services as described in each of paragraph (b) through (d) of this Item that were approved by the audit committee pursuant to paragraph (c)(7)(i)(C) of Rule 2-01 of Regulation S-X.
|
| (f) |
Not applicable.
|
| (g) |
Aggregate non-audit fees billed by the Accountant to the Matisse Discount Closed-End Fund Strategy for services rendered for the fiscal years ended March 31, 2020 and March 31, 2021 were $2,000 and $2,500, respectively. Aggregate non-audit
fees billed by the Accountant to the Matisse Discounted Bond CEF Strategy for the fiscal years ended March 31, 2020 and March 31, 2021 were $0 and $2,000, respectively. There were no fees billed by the Accountant for non-audit services rendered
to the Funds’ investment adviser, or any other entity controlling, controlled by, or under common control with the Funds’ investment adviser.
|
| (h) |
Not applicable.
|
| Item 5. |
AUDIT COMMITTEE OF LISTED REGISTRANTS. |
Not applicable.
| Item 6. |
SCHEDULE OF INVESTMENTS. |
A copy of the schedule of investments of unaffiliated issuers as of the close of the reporting period is included as part of the report to shareholders filed under Item 1 of this Form.
| Item 7. |
DISCLOSURE OF PROXY VOTING POLICIES AND PROCEDURES FOR CLOSED-END MANAGEMENT INVESTMENT COMPANIES. |
Not applicable.
| Item 8. |
PORTFOLIO MANAGERS OF CLOSED-END MANAGEMENT INVESTMENT COMPANIES. |
Not applicable.
| Item 9. |
PURCHASES OF EQUITY SECURITIES BY CLOSED-END MANAGEMENT INVESTMENT COMPANY AND AFFILIATED PURCHASERS. |
Not applicable.
| Item 10. |
SUBMISSION OF MATTERS TO A VOTE OF SECURITY HOLDERS. |
None.
| Item 11. |
CONTROLS AND PROCEDURES. |
| (a) |
The President and Principal Executive Officer and the Treasurer and Principal Financial Officer have concluded that the registrant’s disclosure controls and procedures (as defined in Rule 30a-3(c) under the Investment Company Act of 1940)
are effective based on their evaluation of the disclosure controls and procedures required by Rule 30a-3(b) under the Investment Company Act of 1940 and Rules 13a-15(b) or 15d-15(b) under the Securities Exchange Act of 1934, as of a date within
90 days of the filing of this report.
|
| (b) |
There were no changes in the registrant's internal control over financial reporting (as defined in Rule 30a-3(d) under the Investment Company Act of 1940) that occurred during the period covered by this report that have materially affected,
or are reasonably likely to materially affect, the registrant’s internal control over financial reporting.
|
| Item 12. |
DISCLOSURE OF SECURITIES LENDING ACTIVITIES FOR CLOSED-END MANAGEMENT INVESTMENT COMPANIES. |
Not applicable.
| Item 13. |
EXHIBITS. |
| (a)(1) |
Code of Ethics required by Item 2 of Form N-CSR is filed herewith.
|
| (a)(2) |
Certifications pursuant to Rule 30a-2(a) under the Investment Company Act of 1940 are filed herewith.
|
| (a)(3) |
Not applicable.
|
| (a)(4) |
Not applicable.
|
| (b) |
Certifications pursuant to Rule 30a-2(b) under the Investment Company Act of 1940 and Section 906 of the Sarbanes-Oxley Act of 2002 are filed
herewith.
|
SIGNATURES
Pursuant to the requirements of the Securities Exchange Act of 1934 and the Investment Company Act of 1940, the registrant has duly caused this report to be signed on its behalf by the undersigned, thereunto duly
authorized.
|
Starboard Investment Trust
|
||
|
By:
|
/s/ Katherine M. Honey | |
|
Katherine M. Honey
President and Principal Executive Officer
|
||
|
Date:
|
June 9, 2021
|
|
Pursuant to the requirements of the Securities Exchange Act of 1934 and the Investment Company Act of 1940, this report has been signed below by the following persons on behalf of the registrant and in the capacities and
on the dates indicated.
|
By:
|
/s/ Katherine M. Honey |
|
|
Katherine M. Honey
President and Principal Executive Officer
|
||
|
Date:
|
June 9, 2021
|
|
|
By:
|
/s/ Ashley H. Lanham |
|
|
Ashley H. Lanham
Treasurer, Principal Financial Officer, and Principal Accounting Officer
|
||
|
Date:
|
June 9, 2021
|
Exhibit 13(a)(1)
CODE OF ETHICS FOR PRINCIPAL OFFICERS
|
1.
|
Covered Officers/Purpose of the Supplemental Code
|
This Code of Ethics applies to the Trust’s Principal Executive Officer, Principal Financial Officer and Principal Accounting Officer(s). Such persons are
referred to in this Code of Ethics as the “Covered Officers.” The purpose of this Code of Ethics is to promote the following:
|
a.
|
Honest and ethical conduct, including the ethical handling of actual or apparent conflicts of interest between personal and professional
relationships;
|
|
b.
|
Full, fair, accurate, timely and understandable disclosure in reports and documents that registrant files with, or submits to, the SEC and in
other public communications made by the Trust;
|
|
c.
|
Compliance with applicable laws and governmental rules and regulations;
|
|
d.
|
The prompt internal reporting of violations of this Code of Ethics to an appropriate person or persons identified in the Code of Ethics; and
|
|
e.
|
Accountability for adherence to this Code of Ethics.
|
|
2.
|
Ethical Handling of Conflicts of Interest
|
A “conflict of interest” occurs when a Covered Officer’s private interest in any material respect interferes with the interests of, or his service to,
the Trust. For example, a conflict of interest would arise if a Covered Officer, or a member of his family, receives improper personal benefits as a result of his position with the Trust.
Certain conflicts of interest arise out of the relationships between Covered Officers and the Trust and already are subject to
conflict of interest provisions in the 1940 Act and the Advisers Act. For example, Covered Officers may not individually engage in certain transactions (such as the purchase or sale of securities or other property, other than shares of beneficial
interest of the Trust) with the Trust because of their status as “affiliated persons” of the Trust. The Trust’s, Advisor’s, and Sub-Advisor’s compliance programs and procedures are designed to prevent, or identify and correct, violations of these
provisions. This Code of Ethics does not, and is not intended to, repeat or replace these programs and procedures, and such conflicts fall outside of the parameters of this Code of Ethics.
Although typically not presenting an opportunity for improper personal benefit, conflicts arise from, or as a result of, the
contractual relationship between the Trust and the investment advisor or administrator, of which the Covered Officers are also officers or employees. As a result, this Code of Ethics recognizes that the Covered Officers will, in the normal course
of their duties (whether formally for the Trust or for the advisor or administrator, as appropriate, or for both), be involved in establishing policies and implementing decisions that may have different effects on the advisor and administrator and
the Trust. The participation of the Covered Officers in such activities is inherent in the contractual relationship between the Trust and the advisor or administrator, as appropriate, and is consistent with the performance by the Covered Officers
of their duties as officers of the Trust. Thus, if performed in conformity with the provisions of the 1940 Act and the Advisers Act, such activities will be deemed to have been handled ethically. In addition, it is recognized by the Board that
the Covered Officers may also be officers or employees of one or more investment companies covered by other codes.
Other conflicts of interest are covered by this Code of Ethics, even if such conflicts of interest are not subject to provisions in
the 1940 Act and the Advisers Act. The following list provides examples of conflicts of interest under this Code of Ethics, but Covered Officers should keep in mind that these examples are not exhaustive. The overarching principle is that the
personal interest of a Covered Officer should not be placed improperly before the interest of the Trust.
In order to ethically handle both actual and apparent conflicts of interest, each Covered Officer must:
|
a.
|
Not use his personal influence or personal relationships improperly to influence Investment decisions or financial reporting by the Trust
whereby the Covered Officer would benefit personally to the detriment of the Trust;
|
|
b.
|
Not cause the Trust to take action, or fail to take action, for the individual personal benefit of the Covered Officer to the detriment of the
Trust;
|
|
c.
|
Not use material non-public knowledge of portfolio transactions made or contemplated for the Trust to trade personally or cause others to trade
personally in contemplation of the market effect of such transactions;
|
|
d.
|
Report at least annually any affiliations or other relationships related to conflicts of interest that the Trustees and Officers Questionnaire
covers.
|
There are some conflict of interest situations that should always be discussed with the Audit Committee of the Trust if such
situations might have a material adverse effect on the Trust. Examples of these include:
|
a.
|
Service as a trustee on the board of any public company; The receipt of non-nominal gifts (currently gifts in excess of $200);
|
|
b.
|
The receipt of entertainment from any company with which the Trust has current or prospective business dealings, including investments in such
companies, unless such entertainment is business-related, reasonable in cost, appropriate as to time and place, and not so frequent as to raise any questions of impropriety;
|
|
c.
|
Any ownership interest in, or any consulting or employment relationship with, any of the Service Providers, other than its Advisor, principal
underwriter, Administrator or any affiliated person thereof;
|
|
d.
|
A direct or indirect financial interest in commissions, transaction charges or spreads paid by the Trust for effecting portfolio transactions
or for selling or redeeming shares other than an interest arising from the Covered Officer’s employment, such as compensation or equity ownership.
|
|
3.
|
Disclosure and Compliance
|
Each Covered Officer must act in accordance with the following provisions related to
disclosure and compliance requirements:
|
a.
|
Each Covered Officer should familiarize himself with the disclosure requirements generally applicable to the Trust;
|
|
b.
|
Each Covered Officer should not knowingly misrepresent, or cause others to misrepresent, facts about the Trust to others,
whether within or outside the Trust, including to the Trustees and auditors, and to governmental regulators and self-regulatory organizations;
|
|
c.
|
Each Covered Officer should, to the extent appropriate within his area of responsibility, consult with other officers and
employees of the Trust and the advisor or administrator, as appropriate, with the goal of promoting full, fair, accurate, timely and understandable disclosure in the reports and documents the Trust files with, or submits to, the SEC and
in other public communications made by the Trust; and
|
|
d.
|
It is the responsibility of each Covered Officer to promote compliance with the standards and restrictions imposed by
applicable laws, rules and regulations.
|
|
4.
|
Reporting and Accountability
|
Each Covered Officer must act in accordance with the following provisions related to reporting and accountability under this Code of
Ethics:
|
a.
|
Upon adoption of this Code of Ethics (or thereafter as applicable, upon becoming a Covered Officer), affirm in writing to the Board that he has
received, read, and understands the Code of Ethics;
|
|
b.
|
Annually thereafter affirm to the Board that he has complied with the requirements of this Code of Ethics;
|
|
c.
|
Not retaliate against any other Covered Officer or any employee of the Trust or their affiliated persons for reports of potential violations
that are made in good faith; and
|
|
d.
|
Promptly notify the Audit Committee if he knows of any material violation of this Code of Ethics.
|
|
e.
|
The compliance officer of the Advisor (or such other Trust officer or other investigator as the Audit Committee may from time to time
designate) (referred in this Code of Ethics as the “Investigator”) shall take appropriate action to investigate any potential violations that are reported:
|
The Audit Committee is responsible for applying this Code of Ethics to specific situations in which questions are presented under it
and has the authority to interpret this Code of Ethics in any particular situation. In addition, the Audit Committee will consider any approvals or waivers sought by a Covered Officer.
The Trust will follow these procedures in investigating and enforcing this Code of Ethics:
|
a.
|
The compliance officer of the Advisor (or such other Trust officer or other investigator as the Audit Committee may from time to time designate
(referred to in this Code of Ethics as the “Investigator”) shall take appropriate action to investigate any potential violations that are reported:
|
|
b.
|
If, after such investigation, the Investigator believes that no violation has occurred, the Investigator is not required to take any further
action;
|
|
c.
|
Any matter that the Investigator believes is a violation will be reported to the Audit Committee;
|
|
d.
|
If the Audit Committee concurs that a violation has occurred, it will inform and make a recommendation to the Board, which will consider
appropriate action, which may include review of, and appropriate modifications to, applicable policies and procedures; notification to appropriate personnel of the investment advisor, administrator, or their boards; or a recommendation to
dismiss the Covered Officer;
|
|
e.
|
The Board will be responsible for granting waivers, as appropriate; and
|
Any changes to or waivers of this Code of Ethics will, to the extent required, be disclosed as provided by rules of the SEC.
Any potential violation of this Code of Ethics by the Investigator shall be reported to the Audit Committee and the Audit Committee
shall appoint an alternative Trust officer or other investigator to investigate the matter.
|
5.
|
Other Policies and Procedures
|
This Code of Ethics shall be the sole code of ethics adopted by the Trust for purposes of Section 406 of the Sarbanes-Oxley Act of
2002 and the rules and forms applicable to registered investment companies thereunder. Insofar as other policies or procedures of the Trust, the Advisor, Principal Underwriter, or other service providers govern, or purport to govern, the behavior
or activities of the Covered Officers who are subject to this Code of Ethics, they are superseded by this Code of Ethics to the extent that they overlap or conflict with the provisions of this Code of Ethics. The Trust’s, Advisor’s, Sub-Advisor’s,
and Principal Underwriter’s code of ethics under Rule 17j-1 under the 1940 Act are separate requirements applying to the Covered Officers and others, and are not part of this Code of Ethics.
|
6.
|
Amendments
|
Any amendments to this Code of Ethics must be approved or ratified by a majority vote of the Board, including a majority of
Independent Trustees.
|
7.
|
Confidentiality
|
All reports and records prepared or maintained pursuant to this Code of Ethics will be considered confidential and shall be
maintained and protected accordingly. Except as otherwise required by law or regulation or this Code of Ethics, such matters shall not be disclosed to anyone other than the Board and the Audit Committee.
|
8.
|
Internal Use
|
The Code of Ethics is intended solely for the internal use by the Trust and does not constitute an admission, by or on behalf of the
Trust, as to any fact, circumstance, or legal conclusion.
Exhibit 13(a)(2)
CERTIFICATION PURSUANT TO RULE 30a-2(a) UNDER THE 1940 ACT AND
SECTION 302 OF THE SARBANES-OXLEY ACT OF 2002
I, Katherine M. Honey, certify that:
| 1. |
I have reviewed this report on Form N-CSR of the Matisse Discounted Closed-End Fund Strategy and the Matisse Discounted Bond CEF Strategy, each a series of the
Starboard Investment Trust;
|
| 2. |
Based on my knowledge, this report does not contain any untrue statement of a material fact or omit to state a material fact necessary to make the statements made, in
light of the circumstances under which such statements were made, not misleading with respect to the period covered by this report;
|
| 3. |
Based on my knowledge, the financial statements, and other financial information included in this report, fairly present in all material respects the financial
condition, results of operations, changes in net assets, and cash flows (if the financial statements are required to include a statement of cash flows) of the registrant as of, and for, the periods presented in this report;
|
| 4. |
The registrant’s other certifying officer(s) and I are responsible for establishing and maintaining disclosure controls and procedures (as defined in Rule 30a-3(c)
under the Investment Company Act of 1940) and internal controls over financial reporting (as defined in Rule 30a-3(d) under the Investment Company Act of 1940) for the registrant and have:
|
|
a.
|
Designed such disclosure controls and procedures, or caused such disclosure controls and procedures to be designed under our supervision, to
ensure that material information relating to the registrant, including its consolidated subsidiaries, is made known to us by others within those entities, particularly during the period in which this report is being prepared;
|
|
b.
|
Designed such internal control over financial reporting, or caused such internal control over financial reporting to be designed under our
supervision, to provide reasonable assurance regarding the reliability of financial reporting and the preparation of financial statements for external purposes in accordance with generally accepted accounting principles;
|
|
c.
|
Evaluated the effectiveness of the registrant’s disclosure controls and procedures and presented in this report our conclusions about the
effectiveness of the disclosure controls and procedures, as of a date within 90 days prior to the filing date of this report based on such evaluation; and
|
|
d.
|
Disclosed in this report any change in the registrant’s internal control over financial reporting that occurred during the second fiscal quarter
of the period covered by this report that has materially affected, or is reasonably likely to materially affect, the registrant’s internal control over financial reporting; and
|
| 5. |
The registrant’s other certifying officer(s) and I have disclosed to the registrant’s auditors and the audit committee of the registrant’s board of directors (or
persons performing the equivalent functions):
|
|
a.
|
All significant deficiencies and material weaknesses in the design or operation of internal control over financial reporting which are reasonably
likely to adversely affect the registrant’s ability to record, process, summarize, and report financial information; and
|
|
b.
|
Any fraud, whether or not material, that involves management or other employees who have a significant role in the registrant’s internal control
over financial reporting.
|
|
By:
|
/s/ Katherine M. Honey |
|
|
Katherine M. Honey
President and Principal Executive Officer
|
||
|
Date:
|
June 9, 2021
|
Exhibit 13(a)(2)
CERTIFICATION PURSUANT TO RULE 30a-2(a) UNDER THE 1940 ACT AND
SECTION 302 OF THE SARBANES-OXLEY ACT OF 2002
I, Ashley H. Lanham, certify that:
| 1. |
I have reviewed this report on Form N-CSR of the Matisse Discounted Closed-End Fund Strategy and the Matisse Discounted Bond CEF Strategy, each a series of the
Starboard Investment Trust;
|
| 2. |
Based on my knowledge, this report does not contain any untrue statement of a material fact or omit to state a material fact necessary to make the statements made, in
light of the circumstances under which such statements were made, not misleading with respect to the period covered by this report;
|
| 3. |
Based on my knowledge, the financial statements, and other financial information included in this report, fairly present in all material respects the financial
condition, results of operations, changes in net assets, and cash flows (if the financial statements are required to include a statement of cash flows) of the registrant as of, and for, the periods presented in this report;
|
| 4. |
The registrant’s other certifying officer(s) and I are responsible for establishing and maintaining disclosure controls and procedures (as defined in Rule 30a-3(c)
under the Investment Company Act of 1940) and internal control over financial reporting (as defined in Rule 30a-3(d) under the Investment Company Act of 1940) for the registrant and have:
|
|
a.
|
Designed such disclosure controls and procedures, or caused such disclosure controls and procedures to be designed under our supervision, to
ensure that material information relating to the registrant, including its consolidated subsidiaries, is made known to us by others within those entities, particularly during the period in which this report is being prepared;
|
|
b.
|
Designed such internal control over financial reporting, or caused such internal control over financial reporting to be designed under our
supervision, to provide reasonable assurance regarding the reliability of financial reporting and the preparation of financial statements for external purposes in accordance with generally accepted accounting principles;
|
|
c.
|
Evaluated the effectiveness of the registrant’s disclosure controls and procedures and presented in this report our conclusions about the
effectiveness of the disclosure controls and procedures, as of a date within 90 days prior to the filing date of this report based on such evaluation; and
|
|
d.
|
Disclosed in this report any change in the registrant’s internal control over financial reporting that occurred during the second fiscal quarter
of the period covered by this report that has materially affected, or is reasonably likely to materially affect, the registrant’s internal control over financial reporting; and
|
| 5. |
The registrant’s other certifying officer(s) and I have disclosed to the registrant’s auditors and the audit committee of the registrant’s board of directors (or
persons performing the equivalent functions):
|
|
a.
|
All significant deficiencies and material weaknesses in the design or operation of internal control over financial reporting which are reasonably
likely to adversely affect the registrant’s ability to record, process, summarize, and report financial information; and
|
|
b.
|
Any fraud, whether or not material, that involves management or other employees who have a significant role in the registrant’s internal control
over financial reporting.
|
|
By:
|
/s/ Ashley H. Lanham |
|
|
Ashley H. Lanham
Treasurer, Principal Financial Officer, and Principal Accounting Officer
|
||
|
Date:
|
June 9, 2021
|
Exhibit 13(b)
CERTIFICATION
PURSUANT TO RULE 30A-2(B) UNDER THE INVESTMENT COMPANY ACT OF 1940 AND SECTION 906 OF THE SARBANES-OXLEY ACT OF 2002
In connection with the annual report of the Matisse Discounted Closed-End Fund Strategy and the Matisse Discounted Bond CEF Strategy (the “Funds”), each a series of the Starboard Investment Trust on
Form N-CSR for the period ended March 31, 2021, as filed with the Securities and Exchange Commission (the “Report”), the undersigned, Katherine M. Honey, President and Principal Executive Officer of the Funds, does hereby certify, to her knowledge,
that:
| (1) |
The Report fully complies with the requirements of Section 13(a) or 15(d) of the Securities Exchange Act of 1934; and
|
| (2) |
The information contained in the Report fairly presents, in all material respects, the financial condition and results of operations of the Funds.
|
|
By:
|
/s/ Katherine M. Honey |
|
| Katherine M. Honey President and Principal Executive Officer
|
||
|
Date:
|
June 9, 2021
|
A signed original of this written statement required by Section 906 has been provided to the Starboard Investment Trust and will be retained by the Starboard Investment Trust and furnished to the
Securities and Exchange Commission or its staff upon request. This certification is being furnished to the Commission pursuant to 18 U.S.C. ss. 1350 and is not being filed as part of the Form N-CSR with the Commission.
Exhibit 13(b)
CERTIFICATION
PURSUANT TO RULE 30A-2(B) UNDER THE INVESTMENT COMPANY ACT OF 1940 AND SECTION 906 OF THE SARBANES-OXLEY ACT OF 2002
In connection with the annual report of the Matisse Discounted Closed-End Fund Strategy and the Matisse Discounted Bond CEF Strategy
(the “Funds”), each a series of the Starboard Investment Trust on Form N-CSR for the period ended March 31, 2021, as filed with the Securities and Exchange Commission (the “Report”), the undersigned, Ashley H. Lanham, Treasurer, Principal Financial
Officer, and Principal Accounting Officer of the Funds, does hereby certify, to her knowledge, that:
| (1) |
The Report fully complies with the requirements of Section 13(a) or 15(d) of the Securities Exchange Act of 1934; and
|
| (2) |
The information contained in the Report fairly presents, in all material respects, the financial condition and results of operations of the Funds.
|
|
By:
|
/s/ Ashley H. Lanham |
|
|
Ashley H. Lanham
Treasurer, Principal Financial Officer, and Principal Accounting Officer
|
||
|
Date:
|
June 9, 2021
|
A signed original of this written statement required by Section 906 has been provided to the Starboard Investment Trust and will be
retained by the Starboard Investment Trust and furnished to the Securities and Exchange Commission or its staff upon request. This certification is being furnished to the Commission pursuant to 18 U.S.C. ss. 1350 and is not being filed as part of
the Form N-CSR with the Commission.
Serious News for Serious Traders! Try StreetInsider.com Premium Free!
You May Also Be Interested In
- HashKey Global Partners with Solidus Labs to Elevate Real-Time Trade Surveillance
- Pursuit Church Announces Interfaith March for Israel at Columbia University
- Mirasol Resources Closes First Tranche of Private Placement
Create E-mail Alert Related Categories
SEC FilingsSign up for StreetInsider Free!
Receive full access to all new and archived articles, unlimited portfolio tracking, e-mail alerts, custom newswires and RSS feeds - and more!
