

Form N-CSR Nuveen Corporate Income For: Dec 31
 Tweet
Tweet Share
ShareUNITED STATES
SECURITIES AND EXCHANGE COMMISSION
Washington, D.C. 20549
FORM N-CSR
CERTIFIED SHAREHOLDER REPORT OF REGISTERED
MANAGEMENT INVESTMENT COMPANIES
| Investment Company Act file number |
811-23075 |
Nuveen Corporate Income November 2021 Target Term Fund
(Exact name of registrant as specified in charter)
Nuveen Investments
333 West Wacker Drive
Chicago, IL 60606
(Address of principal executive offices) (Zip code)
Mark L. Winget
Nuveen Investments
333 West Wacker Drive
Chicago, IL 60606
(Name and address of agent for service)
Registrant’s telephone number, including area code: (312) 917-7700
Date of fiscal year end: December 31
Date of reporting period: December 31, 2020
Form N-CSR is to be used by management investment companies to file reports with the Commission not later than 10 days after the transmission to stockholders of any report that is required to be transmitted to stockholders under Rule 30e-1 under the Investment Company Act of 1940 (17 CFR 270.30e-1). The Commission may use the information provided on Form N-CSR in its regulatory, disclosure review, inspection, and policymaking roles.
A registrant is required to disclose the information specified by Form N-CSR, and the Commission will make this information public. A registrant is not required to respond to the collection of information contained in Form N-CSR unless the Form displays a currently valid Office of Management and Budget (“OMB”) control number. Please direct comments concerning the accuracy of the information collection burden estimate and any suggestions for reducing the burden to Secretary, Securities and Exchange Commission, 450 Fifth Street, NW, Washington, DC 20549-0609. The OMB has reviewed this collection of information under the clearance requirements of 44 U.S.C. ss. 3507.
ITEM 1. REPORTS TO STOCKHOLDERS.

Closed-End Funds
31 December
2020
Nuveen Closed-End Funds
| JHB | Nuveen Corporate Income November 2021 Target Term Fund | |
| JHAA | Nuveen Corporate Income 2023 Target Term Fund |
As permitted by regulations adopted by the Securities and Exchange Commission, paper copies of the Funds’ annual and semi-annual shareholder reports will not be sent to you by mail unless you specifically request paper copies of the reports. Instead, the reports will be made available on the Funds’ website (www.nuveen.com), and you will be notified by mail each time a report is posted and provided with a website link to access the report.
You may elect to receive shareholder reports and other communications from the Funds electronically at any time by contacting the financial intermediary (such as a broker-dealer or bank) through which you hold your Fund shares or, if you are a direct investor, by enrolling at www.nuveen.com/e-reports.
You may elect to receive all future shareholder reports in paper free of charge at any time by contacting your financial intermediary or, if you are a direct investor, by calling 800-257-8787 and selecting option #2 or (ii) by logging into your Investor Center account at www.computershare.com/investor and clicking on “Communication Preferences”. Your election to receive reports in paper will apply to all funds held in your account with your financial intermediary or, if you are a direct investor, to all your directly held Nuveen Funds and any other directly held funds within the same group of related investment companies.
Annual Report
Life is Complex
Nuveen makes things e-simple.
It only takes a minute to sign up for e-Reports. Once enrolled, you’ll receive an e-mail as soon as your Nuveen Fund information is ready—no more waiting for delivery by regular mail. Just click on the link within the e-mail to see the report and save it on your computer if you wish.
Free e-Reports right to your email!
www.investordelivery.com
If you receive your Nuveen Fund dividends and statements from your financial professional or brokerage account.
or
www.nuveen.com/client-access
If you receive your Nuveen Fund dividends and statements directly from Nuveen.
NOT FDIC INSURED MAY LOSE VALUE NO BANK GUARANTEE
| 4 | ||||
| 5 | ||||
| 12 | ||||
| 14 | ||||
| 16 | ||||
| 20 | ||||
| 21 | ||||
| 33 | ||||
| 34 | ||||
| 35 | ||||
| 36 | ||||
| 38 | ||||
| 40 | ||||
| 50 | ||||
| 71 | ||||
| 72 | ||||
| 73 | ||||
3
Chair’s Letter to Shareholders


4
Nuveen Corporate Income November 2021 Target Term Fund (JHB)
Nuveen Corporate Income 2023 Target Term Fund (JHAA)
Nuveen Corporate Income November 2021 Target Term Fund (JHB) and Nuveen Corporate Income 2023 Target Term Fund (JHAA) are closed-end funds that feature portfolio management by Nuveen Asset Management, LLC (NAM), an affiliate of Nuveen Fund Advisors, LLC, the Funds’ investment adviser. The Funds’ portfolio managers are Kevin Lorenz, CFA, Jacob J. Fitzpatrick, CFA, and Christopher Williams.
Fund Name and Investment Policy Changes
Effective August 24, 2020, Nuveen Corporate Income November 2021 Target Term Fund changed from Nuveen High Income November 2021 Target Term Fund, and Nuveen Corporate Income 2023 Target Term Fund changed from Nuveen High Income 2023 Target Term Fund. Each Fund’s investment policy to invest at least 80% of its managed assets in securities that, at the time of investment, are rated below investment grade or are unrated but judged by the portfolio managers to be of comparable quality was also eliminated.
Here the Funds’ portfolio management team reviews U.S. economic and market conditions, key investment strategies and the performance of the Funds for the twelve-month reporting period ended December 31, 2020.
What factors affected the U.S. economy and financial markets during the twelve-month reporting period ended December 31, 2020?
The U.S. economy rebounded more quickly than expected from the deep downturn caused by the COVID-19 crisis and containment measures, but it was not fully recovered by the year’s end. U.S. gross domestic product (GDP) grew 4.0% on an annualized basis in the fourth quarter of 2020 and 33.1% (annualized) in the third quarter, but remained down 3.5% in 2020 overall (from the 2019 annual level to the 2020 annual level) as measured by the Bureau of Economic Analysis “advance” estimate. GDP measures the value of goods and services produced by the nation’s economy less the value of the goods and services used up in production, adjusted for price changes. The economy fell into a deep recession in February 2020 due to the restrictions on business and social activity to mitigate the COVID-19 spread. In the first and second quarters of 2020, annualized GDP shrank 5% and 31.4%, respectively. Government relief programs provided significant aid to individuals and businesses as the economy began reopening in May 2020, which helped the economy bounce back strongly over the second half of the year.
This material is not intended to be a recommendation or investment advice, does not constitute a solicitation to buy, sell or hold a security or an investment strategy and is not provided in a fiduciary capacity. The information provided does not take into account the specific objectives or circumstances of any particular investor, or suggest any specific course of action. Investment decisions should be made based on an investor’s objectives and circumstances and in consultation with his or her advisors.
Certain statements in this report are forward-looking statements. Discussions of specific investments are for illustration only and are not intended as recommendations of individual investments. The forward-looking statements and other views expressed herein are those of the portfolio managers as of the date of this report. Actual future results or occurrences may differ significantly from those anticipated in any forward-looking statements and the views expressed herein are subject to change at any time, due to numerous market and other factors. The Funds disclaim any obligation to update publicly or revise any forward-looking statements or views expressed herein.
For financial reporting purposes, the ratings disclosed are the highest rating given by one of the following national rating agencies: Standard & Poor’s (S&P), Moody’s Investors Service, Inc. (Moody’s) or Fitch, Inc. (Fitch). This treatment of split-rated securities may differ from that used for other purposes, such as for Fund investment policies. Credit ratings are subject to change. AAA, AA, A and BBB are investment grade ratings; BB, B, CCC, CC, C and D are below investment grade ratings. Holdings designated N/R are not rated by these national rating agencies.
Refer to the Glossary of Terms Used in this Report for further definition of the terms used within this section.
5
Portfolio Managers’ Comments (continued)
Consumer spending, the largest driver of the economy, remained resilient despite the disruption caused by the health and economic crisis. Consumer spending declined significantly and unemployment rose sharply starting in March 2020. These measures rebounded markedly in the second half of the year, although the momentum slowed toward year end amid a resurgence of coronavirus infections. The Bureau of Labor Statistics said the unemployment rate rose to 6.7% in December 2020 from 3.6% in December 2019. As of December 2020, slightly more than half of the 22 million jobs lost in March and April 2020 have been recovered. The average hourly earnings rate appeared to increase, growing at an annualized rate of 5.1% in December 2020, despite the spike in unemployment. Earnings data was skewed by the concentration of job losses in lower-wage work, which effectively eliminated most of the low-wage data, resulting in an average of mostly higher numbers. The overall trend of inflation remained muted, as decreases in gasoline, apparel and transportation prices offset an increase in food prices. The Bureau of Labor Statistics said the Consumer Price Index (CPI) increased 1.4% over the twelve-month reporting period ended December 31, 2020 before seasonal adjustment.
Prior to the COVID-19 crisis recession, the U.S. Federal Reserve (the Fed) had reduced its benchmark interest rate to support the economy’s slowing growth. The Fed also stopped shrinking its bond portfolio sooner than scheduled and began buying short-term Treasury bills to help money markets operate smoothly and maintain short-term borrowing rates at low levels. As the health and economic crisis deepened, the Fed enacted an array of emergency measures in March 2020 to stabilize the financial system and support the markets, including cutting its main interest rate to near zero, offering lending programs to aid small and large companies and allowing unlimited bond purchases, known as quantitative easing. In August 2020, the Fed announced a change in inflation policy to average inflation targeting. Under this regime, the Fed will tolerate the inflation rate temporarily overshooting the target rate to offset periods of below-target inflation, so that inflation averages a 2% rate over time. Fed officials remained cautious, acknowledging the economy’s improvement but concerned about near-term weakness, and left policy unchanged over the remainder of their meetings in 2020.
In March and April 2020, the U.S. government approved three aid packages. These included $2 trillion allocated across direct payments to Americans, an expansion of unemployment insurance, loans to large and small businesses, funding to hospitals and health agencies and support to state and local governments, and more than $100 billion in funding to health agencies and employers offering paid leave. In December 2020, the government enacted a $900 billion relief package extending some of these programs. With Joe Biden winning the U.S. presidential election in November 2020, more fiscal stimulus is anticipated in 2021.
The COVID-19 crisis rapidly dwarfed all other market concerns starting in late February 2020. Equity and commodity markets sold off and safe-haven assets rallied in March 2020 as China, other countries and then the United States initiated quarantines, restricted travel and shuttered factories and businesses. The potential economic shock was particularly difficult to assess, which amplified market volatility. An ill-timed oil price war between the Organization of the Petroleum Exporting Countries (OPEC) and non-OPEC member Russia, which caused oil prices to plunge in March 2020, exacerbated the market sell-off. At year end, the announcement of high efficacy rates in several COVID-19 vaccine trials, followed by regulatory authorizations and public vaccination drives across Western countries, improved the outlook for 2021 and led to risk-on sentiment in the markets.
Geopolitical uncertainty remained elevated during 2020 in anticipation of the U.S. presidential election in November 2020 and the Brexit transition period set to expire in December 2020. Political risks eased somewhat toward the end of the reporting period, as markets ultimately viewed a Biden administration positively and the European Union (EU) and United Kingdom (U.K.) finalized a trade deal in the final days of the transition period. Although China and the U.S. signed a “phase one” trade deal in January 2020, tensions continued to flare over other trade and technology/security issues, Hong Kong’s sovereignty and the management of the COVID-19 crisis.
6
Nuveen Corporate Income November 2021 Target Term Fund (JHB)
What key strategies were used to manage the Fund during the twelve-month reporting period ended December 31, 2020?
The Fund seeks to provide a high level of current income and to return the original $9.85 net asset value (NAV) per common share on or about November 1, 2021. The Fund will seek to achieve its investment objectives by investing primarily in shorter maturity, high yield (below investment grade) corporate debt securities. High yield bonds typically offer higher yields than investment grade bonds, in exchange for greater credit risk. Bonds with shorter maturities have lower duration (or interest rate sensitivity) than longer maturity bonds, which may help mitigate price declines if rates rise.
The Fund may invest in other types of securities including senior loans, convertible securities and other types of debt instruments and derivatives that provide comparable economic exposure to the corporate debt market. At least 80% of the Fund’s managed assets will be in corporate debt securities. No more than 15% will be in securities rated CCC+/Caa1 or lower at the time of investment. Up to 30% may be in securities of non-U.S. issuers, including up to 20% in emerging market issuers and up to 10% may be in non- U.S. dollar denominated securities.
The Fund seeks to identify securities across diverse sectors and industries that the portfolio managers believe are undervalued or mispriced. In seeking to return the original NAV on or about November 1, 2021, the Fund intends to utilize various portfolio and cash flow management techniques, including setting aside a portion of its net investment income, possibly retaining gains and limiting the longest maturity of any holding to no later than May 1, 2022. The Fund also uses leverage.
Recent market conditions have materially increased the risk associated with achieving the Fund’s objective to return original NAV. This objective is not a guarantee and is dependent on a number of factors including the extent of market recovery and the cumulative level of income retained in relation to cumulative portfolio gains net of losses.
How did the Fund perform during the twelve-month reporting period ended December 31, 2020?
The table in the Performance Overview and Holding Summaries section of this report provides total returns at net asset value (NAV) for the period ended December 31, 2020. The Fund’s total returns on NAV are compared with the performance of a corresponding market index.
For the twelve-month reporting period ended December 31, 2020, the Fund underperformed the Bloomberg Barclays U.S. High Yield 1-5 Year Cash Pay 2% Issuer Capped Index (Bloomberg Barclays U.S. High Yield 1-5 Year Index).
The high yield market started 2020 supported by dovish central banks and stable credit fundamentals, while capital from around the globe continued to flow into the asset class in the hunt for yield. However, the full-scale global pandemic led to a near complete shutdown of the capital markets in March 2020, which was exacerbated by the sharp drop in crude oil prices. Together these forces drove a spike in risk premiums and high yield outflows, with the spread of the Bloomberg Barclays U.S. High Yield 1-5 Year Index peaking at 1,387 basis points over Treasuries at the reporting period’s widest point in March 2020. However, the immediate response by policymakers to support healthy market and economic functioning helped stabilize the high yield market. Investors took courage from these steps resulting in sizable inflows back into the high yield market over the remainder of the reporting period. These inflows were met with the largest net new issuance on record as companies aimed to optimize their capital structure, although approximately two-thirds of 2020’s new issuance was related to refinancings. Over the remainder of the reporting period, the high yield market continued to be supported by accommodative policies, gradual re-openings and falling unemployment, helping default activity to ease substantially from the elevated levels seen earlier in 2020. After the segment’s significant underperformance in March 2020, high yield spreads retraced to 398 basis points over Treasuries by the end of the reporting period and the Bloomberg Barclays U.S. High Yield 1-5 Year Index ended the reporting period with a 4.49% annual return.
7
Portfolio Managers’ Comments (continued)
During the volatile market conditions, the Fund underperformed the benchmark on a total return basis mainly due to its more conservative positioning as it approaches the termination date. Also, because of these conditions, the Fund’s NAV fell quite significantly, hitting its lowest level during the March 2020 sell-off. Over the remainder of the reporting period, the Fund’s NAV recovered much of the reporting period’s earlier losses, ending the reporting period $0.50 per share lower at $9.47 per share.
The Fund’s much shorter duration than its benchmark detracted from relative results because the more pronounced price appreciation in longer duration assets produced a higher total return. Fund holdings are more anchored to par price as their near-term maturity dates approach so they had less room for appreciation versus the benchmark constituents.
Carrying a cash balance, which was in large part due to the heavy refinancing activity in the high yield segment, hindered the Fund’s performance given the strong rally in the high yield market and the pace of refinancings. Companies are refinancing their short-term debt into much longer maturity profiles than the termination date of this Fund allows. This weighed on the Fund’s total return, particularly in the highest quality BB rated issuers, the best performing rating category over the course of the reporting period.
Security selection in the transportation sector detracted from performance. As airlines and transportation service companies burned through cash at an unsustainable rate, the market was generally supportive of extending liquidity to select companies, many times in exchange for added collateral or on other favorable terms. However, foreign airlines received less support than U.S. carriers from local governments and markets, which forced their hand in restructuring or liquidating assets. The Fund had a modest position in Virgin Australia Holdings Ltd., which was among a sizeable group of foreign airlines that filed for bankruptcy during the COVID-19 crisis.
The Fund’s security selection in consumer cyclicals proved beneficial to performance. Over the course of the reporting period, credits in gaming, leisure, quick-service restaurants and autos steadily rallied due to the increasing potential for broad reopening of the economy. Also, companies in the sector took the opportunity to redress their balance sheets to improve their capital structures.
Performance was also aided by the Fund’s underweight and security selection among CCC rated issues, which was the worst performing benchmark ratings category. The Fund had overweights in several issuers including APX Group in the residential security service area, Realogy Group LLC in real estate brokerage, relocation and title services; and GFL Environmental in waste management. These positions all rallied based on improved fundamental outlooks while investors searched for yield, causing CCC valuations to compress later in the reporting period.
Another favorable factor in the Fund’s performance was its significant underweight to the energy sector. During the drop in commodity prices, companies found themselves searching for liquidity and redressing capital structures to withstand the sustained lockdowns. Although energy credits experienced a rally late in the reporting period after OPEC and other oil-producing nations agreed to adjustments to production, it was not enough to make up for the reporting period’s earlier weakness.
To reduce risk as the Fund approaches its 2021 termination, we have increased exposure to higher quality BB credits and reduced CCC rated exposure. In terms of other portfolio changes, we increased communications exposure by redeploying cash from refinancings into companies that still had outstanding debt that fit the Fund’s term and where we were constructive on fundamental outlooks. We believe the sector will continue to benefit from the high demand for connectivity. We also increased exposure to banking and other financials as the COVID-19 vaccine rollouts and further stimulus measures point toward reopening, higher economic growth expectations and continued demand for credit creation. The Fund’s consumer cyclical exposure decreased as bonds in the sector were called by issuers or matured in 2020. At the end of the reporting period, the Fund’s overweights included financial companies (loan servicing, business development companies, specialty lenders), banks and communications. The Fund remained underweight in the energy
8
and in non-cyclicals (health care, food and beverage, consumer products) sectors, given a lack of available bonds or loans that fit its approaching termination parameters.
We continue to position the portfolio in high income producing investments that we expect to make timely interest and principal payments as we attempt to meet the objective of returning the original NAV on the final term date of the Fund. However, the universe of available issues that fit the Fund’s term parameters has been materially reduced as companies have refinanced and extended their maturity walls while the low yield environment still persists. We continue to position in credits whose competitive positions and balance sheets are able to withstand a prolonged disruption in activity, or those that may be beneficiaries of supportive policy. We are decreasing exposures to companies that will likely run into additional challenges making it to the other side of the current health crisis in the event a return to normalcy takes longer than anticipated. We continue to manage calls, maturities and the cash flow profile of the Fund with the target of managing principal preservation and yield in light of the Fund’s termination date.
Nuveen Corporate Income 2023 Target Term Fund (JHAA)
What key strategies were used to manage the Fund during the twelve-month reporting period ended December 31, 2020?
The Fund seeks to provide a high level of current income and to return the original $9.875 net asset value (NAV) per common share on or about December 1, 2023. The Fund invests in a portfolio of primarily corporate debt securities, including bonds and senior loans. The Fund may invest in other types of securities including convertible securities and other types of debt instruments and derivatives that provide comparable economic exposure to the corporate debt market. Under normal circumstances, up to 30% of its managed assets may be in securities of non-U.S. issuers, including up to 20% of managed assets in emerging market issuers, and up to 10% of managed assets may be in non-U.S. dollar denominated securities. No more than 15% will be in securities rated CCC+/Caa1 or lower at the time of investment.
In seeking to return the original NAV on or about December 1, 2023, the Fund intends to utilize various portfolio and cash flow management techniques, including setting aside a portion of its net investment income, possibly retaining gains, and limiting the longest maturity of any holding to no later than June 1, 2024.
The Fund’s objective is not a guarantee and is dependent on a number of factors including the extent of market recovery and the cumulative level of income retained in relation to cumulative portfolio gains net of losses.
How did the Fund perform during the twelve-month reporting period ended December 31, 2020?
The table in the Performance Overview and Holding Summaries section of this report provides total returns at net asset value (NAV) for the period ended December 31, 2020. The Fund’s total returns on NAV are compared with the performance of a corresponding market index.
For the twelve-month reporting period ended December 31, 2020, the Fund underperformed the Bloomberg Barclays U.S. High Yield 1-5 Year Cash Pay 2% Issuer Capped Index (Bloomberg Barclays U.S. High Yield 1-5 Year Index).
The high yield market started 2020 supported by dovish central banks and stable credit fundamentals, while capital from around the globe continued to flow into the asset class in the hunt for yield. However, the full-scale global pandemic led to a near complete shutdown of the capital markets in March 2020, which was exacerbated by the sharp drop in crude oil prices. Together these forces drove a spike in risk premiums and high yield outflows, with the spread of the Bloomberg Barclays U.S. High Yield 1-5 Year Index peaking at 1,387 basis points over Treasuries at the reporting period’s widest point in March 2020. However, the immediate response by policymakers to support healthy market and economic functioning helped stabilize the high yield market. Investors took courage from these steps resulting in sizable inflows back into the high yield market over the remainder of the reporting period. These inflows were met with the largest net new issuance on record as companies aimed to optimize their capital structure, although approximately two-thirds of 2020’s new issuance was related to refinancings. Over the remainder of the reporting period, the high
9
Portfolio Managers’ Comments (continued)
yield market continued to be supported by accommodative policies, gradual re-openings and falling unemployment, helping default activity to ease substantially from the elevated levels seen earlier in 2020. After the segment’s significant underperformance in March 2020, high yield spreads retraced to 398 basis points over Treasuries by the end of the reporting period and the Bloomberg Barclays U.S. High Yield 1-5 Year Index ended the reporting period with a 4.49% annual return.
During the volatile market conditions during the reporting period, the Fund underperformed the benchmark on a total return basis. Also because of these conditions, the Fund’s NAV fell quite significantly, hitting its lowest level during the March 2020 sell-off. Over the remainder of the reporting period, the Fund’s NAV recovered much of the reporting period’s earlier losses, ending the reporting period $0.33 per share lower at $10.03 per share.
As it gets closer to termination, the Fund’s shorter duration than its benchmark detracted from relative results because the more pronounced price appreciation in longer duration assets produced a higher total return. Fund holdings are more anchored to par price as their maturity dates approach and issuers are in the market to refinance their outstanding shorter-dated debt maturities at or near par. Therefore, the Fund’s holdings have less room for appreciation versus the benchmark constituents.
Security selection within the consumer non-cyclicals sector detracted, specifically in the health care subsector. The Fund was underweight in some hospital and physician staffing credits that rallied. More broadly, consumer non-cyclicals benefited more from stay-at-home orders than other benchmark sectors.
The Fund was also hindered by an underweight stance in the technology sector. Over the course of the reporting period, technology credits benefited from increased IT spending at the enterprise and consumer level. At the same time, demand for remote connectivity and various methods of communication increased due to social distancing orders.
The Fund’s performance benefited from security selection among CCC rated issues, despite this being the worst performing benchmark ratings category. The Fund had overweights in several issuers including nThrive Inc., a company that offers advisory expertise, services, analytics, and education programs to health care organizations; SM Energy Co, oil and gas exploration and production; and Realogy Group LLC, real estate brokerage, relocation and title services. These positions all rallied based on improved fundamental outlooks while investors searched for yield, causing CCC valuations to compress later in the reporting period.
Another favorable factor in the Fund’s performance was its significant underweight to the energy sector, which was among the worst performing benchmark sectors in 2020. During the drop in commodity prices earlier, companies found themselves searching for liquidity and redressing capital structures to withstand the sustained lockdowns. Although energy credits experienced a rally later in the reporting period after OPEC and other oil-producing nations agreed to adjustments to production, it was not enough to make up for the earlier weakness. The sector is likely to remain volatile until commuter and commercial traffic returns to a more normal level.
Also, the Fund’s security selection in the transportation sector benefited performance. As airlines and transportation service companies burned through unsustainable amounts of cash, the market was supportive of extending liquidity to select companies, many times in exchange for added collateral or on other favorable terms. Hertz Corp, for example, sold vehicles from its fleet and is in the process of modifying its capital structure while the company continues to operate. The first lien debt owned by the Fund benefited from the favorable terms of the modification, which aided outperformance. The unsecured debt, which is not owned by the Fund, underperformed the benchmark as a result of the modification. Delta Air Lines Inc and United Airlines Holding Inc secured debt using mileage/customer loyalty programs, which helped their debt trade well throughout the remainder of the reporting period.
In terms of portfolio changes, the Fund increased its communications exposure by redeploying cash from refinancings into companies that still had outstanding debt that fit the Fund’s term and where we were constructive on fundamental outlooks. We believe the sector will continue to benefit from the high demand for connectivity. We also increased
10
health care exposure in the consumer non-cyclical area as elective procedures began increasing, while reducing consumer cyclicals. Because of attractive relative values in the CCC segment, we increased exposure there while still maintaining the Fund’s underweight in lower rated credits. At the same time, we reduced exposure to BB rated credits due to high valuations or refinancings. At the end of the reporting period, the Fund’s overweights included transportation (secured airline debt, rail, truck and travel services), consumer non-cyclicals and utilities sector exposure. The Fund remained underweight in the energy, consumer cyclicals and real estate investment trusts (REIT) sectors where valuations may be stretched relative to current fundamentals in those sectors.
We continue to position the portfolio in high income producing investments that we expect to make timely interest and principal payments as we attempt to meet the objective of returning the original NAV on the final term date of the Fund. However, the universe of available issues that fit the Fund’s term parameters has been materially reduced as companies have refinanced and extended their maturity walls while the low yield environment still persists. We continue to position in credits whose competitive positions and balance sheets are able to withstand a prolonged disruption in activity, or those that may be beneficiaries of supportive policy. We are decreasing exposures to companies that will likely run into additional challenges making it to the other side of the current health crisis in the event a return to normalcy takes longer than anticipated. We continue to manage calls, maturities and the cash flow profile of the Fund with the target of managing principal preservation and yield in light of the Fund’s termination date in 2023.
11
IMPACT OF THE FUNDS’ LEVERAGE STRATEGIES ON PERFORMANCE
One important factor impacting the returns of the Funds’ common shares relative to their comparative benchmarks was the Funds’ use of leverage through the use of bank borrowings as well as the use of reverse repurchase agreements for JHAA. As of the end of the reporting period, JHB is no longer using bank borrowings and JHAA is no longer using reverse repurchase agreements. The Funds use leverage because our research has shown that, over time, leveraging provides opportunities for additional income. The opportunity arises when short-term rates that the Fund pay on its leveraging instruments are lower than the interest the Fund earns on its portfolio securities that it has bought with the proceeds of that leverage. This has been particularly true in the recent market environment where short-term rates have been low by historical standards.
However, use of leverage can expose Fund common shares to additional price volatility. When a Fund uses leverage, the Fund’s common shares will experience a greater increase in their net asset value if the securities acquired through the use of leverage increase in value, but will also experience a correspondingly larger decline in their net asset value if the bonds acquired through leverage decline in value. All this will make the shares’ total return performance more variable, over time.
In addition, common share income in levered funds will typically decrease in comparison to unlevered funds when short-term interest rates increase and increase when short-term interest rates decrease. In recent quarters, fund leverage expenses have generally tracked the overall movement of short-term tax-exempt interest rates. While fund leverage expenses are somewhat higher than their recent lows, leverage nevertheless continues to provide the opportunity for incremental common share income, particularly over longer-term periods.
JHB’s use of leverage had a negative impact on total return performance during this reporting period. The negative impact of leverage during the brief but severe COVID-19 induced market downturn in March was greater than the positive impact of leverage during the remainder of the reporting period as the Fund continued to lower its leverage ratio driven by the limited options to reinvest shorter dated cash proceeds in securities that paid more than the cost of leverage amid the shrinking investable universe. The Fund fully de-levered subsequent to the reporting period.
JHAA’s use of leverage had a negligible impact on total return performance during this reporting period. The negative impact of leverage during the brief but severe COVID-19 induced market downturn in March was greater than the positive impact of leverage during the remainder of the reporting period. Management believes, however, that the potential benefits from leverage continue to outweigh the associated increase in risk and total return variability previously described.
As of December 31, 2020, the Funds’ percentages of leverage are shown in the accompanying table.
| JHB | JHAA | |||||||
| Effective Leverage* |
0.00 | % | 23.80 | % | ||||
| Regulatory Leverage* |
0.00 | % | 23.80 | % | ||||
| * | Effective Leverage is a Fund’s effective economic leverage, and includes both regulatory leverage and the leverage effects of reverse repurchase agreements, certain derivative and other investments in a Fund’s portfolio that increase the Fund’s investment exposure. Regulatory leverage consists of preferred shares issued or borrowings of a Fund. Both of these are part of a Fund’s capital structure. A Fund, however, may from time to time borrow on a typically transient basis in connection with its day-to-day operations, primarily in connection with the need to settle portfolio trades. Such incidental borrowings are excluded from the calculation of a Fund’s effective leverage ratio. Regulatory leverage is subject to asset coverage limits set forth in the Investment Company Act of 1940. |
12
THE FUNDS’ REGULATORY LEVERAGE
Bank Borrowings
As noted previously, the Funds employ leverage through the use of bank borrowings. The Funds’ bank borrowing activities are as shown in the accompanying table.
| Current Reporting Period | Subsequent to the Close of the Reporting Period |
|||||||||||||||||||||||||||||||||||
| Fund | Outstanding Balance as of January 1, 2020 |
Draws | Paydowns | Outstanding Balance as of December 31, 2020 |
Average Balance Outstanding |
Draws | Paydowns | Outstanding Balance as of February 25, 2021 |
||||||||||||||||||||||||||||
| JHB |
$ | 192,000,000 | $ | — | $ | (192,000,000 | ) | $ | — | $ | 98,862,245 | * | $ | — | $ | — | $ | — | ||||||||||||||||||
| JHAA |
$ | 27,025,000 | $ | — | $ | (2,500,000 | ) | $ | 24,525,000 | $ | 25,706,694 | $ | — | $ | — | $ | 24,525,000 | |||||||||||||||||||
| * | For the period January 1, 2020 through July 14, 2020. |
Refer to Notes to Financial Statements, Note 8 – Fund Leverage, for further details.
Reverse Repurchase Agreements
As noted previously, JHAA used reverse repurchase agreements, in which the Fund sells to a counterparty a security that it holds with a contemporaneous agreement to repurchase the same security at an agreed-upon price and date. The Fund’s transactions in reverse repurchase agreements are as shown in the accompanying table.
| Current Reporting Period | Subsequent to the Close of the Reporting Period |
|||||||||||||||||||||||||||||||||||
| Fund | Outstanding January 1, 2020 |
Sales | Purchases | Outstanding December 31, 2020 |
Average Balance Outstanding |
Sales | Purchases | Outstanding Balance as of February 25, 2021 |
||||||||||||||||||||||||||||
| JHAA |
$ | 490,000 | $ | — | $ | (490,000 | ) | $ | — | $ | 490,000 | ** | $ | — | $ | — | $ | — | ||||||||||||||||||
| ** | For the period January 1, 2020 through June 19, 2020. |
Refer to Notes to Financial Statements, Note 8 – Fund Leverage, for further details.
13
COMMON SHARE DISTRIBUTION INFORMATION
The following information regarding the Funds’ distributions is current as of December 31, 2020. Each Fund’s distribution levels may vary over time based on each Fund’s investment activity and portfolio investment value changes.
During the current reporting period, the Funds’ distributions to common shareholders were as shown in the accompanying table.
| Monthly Distributions (Ex-Dividend Date) | JHB | JHAA | ||||||
| January 2020 |
$ | 0.0415 | $ | 0.0520 | ||||
| February |
0.0415 | 0.0520 | ||||||
| March |
0.0370 | 0.0480 | ||||||
| April |
0.0370 | 0.0480 | ||||||
| May |
0.0370 | 0.0480 | ||||||
| June |
0.0315 | 0.0430 | ||||||
| July |
0.0315 | 0.0430 | ||||||
| August |
0.0315 | 0.0430 | ||||||
| September |
0.0245 | 0.0430 | ||||||
| October |
0.0245 | 0.0430 | ||||||
| November |
0.0245 | 0.0430 | ||||||
| December 2020 |
0.0205 | 0.0395 | ||||||
| Total Distributions from Net Investment Income |
$ | 0.3825 | $ | 0.5455 | ||||
| Current Distribution Rate* |
2.67 | % | 4.95 | % | ||||
| * | Current distribution rate is based on the Fund’s current annualized monthly distribution divided by the Fund’s current market price. The Fund’s monthly distributions to its shareholders may be comprised of ordinary income, net realized capital gains and, if at the end of the fiscal year the Fund’s cumulative net ordinary income and net realized gains are less than the Fund’s distributions, a return of capital for tax purposes. |
Each Fund seeks to pay regular monthly dividends out of its net investment income at a rate that reflects its past and projected net income performance. To permit each Fund to maintain a more stable monthly dividend, the Fund may pay dividends at a rate that may be more or less than the amount of net income actually earned by the Fund during the period. Distributions to common shareholders are determined on a tax basis, which may differ from amounts recorded in the accounting records. In instances where the monthly dividend exceeds the earned net investment income, the Fund would report a negative undistributed net ordinary income. Refer to Note 6 – Income Tax Information for additional information regarding the amounts of undistributed net ordinary income and undistributed net long-term capital gains and the character of the actual distributions paid by the Fund during the period.
All monthly dividends paid by each Fund during the current reporting period were paid from net investment income. If a portion of the Fund’s monthly distributions is sourced or comprised of elements other than net investment income, including capital gains and/or a return of capital, shareholders will be notified of those sources. For financial reporting purposes, the per share amounts of each Fund’s distributions for the reporting period are presented in this report’s Financial Highlights. For income tax purposes, distribution information for each Fund as of its most recent tax year end is presented in Note 6 – Income Tax Information within the Notes to Financial Statements of this report.
NUVEEN CLOSED-END FUND DISTRIBUTION AMOUNTS
The Nuveen Closed-End Funds’ monthly and quarterly periodic distributions to shareholders are posted on www.nuveen.com and can be found on Nuveen’s enhanced closed-end fund resource page, which is at https://www.nuveen.com/resource-center-closed-end-funds, along with other Nuveen closed-end fund product
14
updates. To ensure timely access to the latest information, shareholders may use a subscribe function, which can be activated at this web page (https://www.nuveen.com/subscriptions).
COMMON SHARE REPURCHASES
During August 2020, the Funds’ Board of Trustees reauthorized an open-market share repurchase program, allowing each Fund to repurchase an aggregate of up to approximately 10% of its outstanding shares.
As of December 31, 2020, and since the inception of the Funds’ repurchase programs, the Funds have cumulatively repurchased and retired their outstanding common shares as shown in the accompanying table.
| JHB | JHAA | |||||||
| Common shares cumulatively repurchased and retired |
0 | 0 | ||||||
| Common shares authorized for repurchase |
5,590,000 | 780,000 | ||||||
During the current reporting period, the Funds did not repurchase any of their outstanding common shares.
OTHER COMMON SHARE INFORMATION
As of December 31, 2020, and during the current reporting period, the Funds’ common share prices were trading at a premium/(discount) to their common share NAVs as shown in the accompanying table.
| JHB | JHAA | |||||||
| Common share NAV |
$ | 9.47 | $ | 10.03 | ||||
| Common share price |
$ | 9.20 | $ | 9.58 | ||||
| Premium/(Discount) to NAV |
(2.85 | )% | (4.49 | )% | ||||
| 12-month average premium/(discount) to NAV |
(2.62 | )% | 0.30 | % | ||||
JHB and JHAA each have an investment objective to return $9.85 and $9.875, respectively (the original net asset value following each Fund’s initial public offering (the “Original NAV”)) to shareholders on or about the end of the Fund’s term. There can be no assurance that the Funds will be able to return the Original NAV to shareholders, and such return is not backed or otherwise guaranteed by the Funds’ investment adviser, Nuveen Fund Advisors, LLC (the “Adviser”), or any other entity.
In connection with the objective of returning Original NAV, each Fund currently intends to set aside and retain in its net assets a portion of its net investment income and possibly all or a portion of its gains. This will reduce the amounts otherwise available for distribution prior to the liquidation of each Fund, and the Fund may incur taxes on such retained amount, which will reduce the overall amounts that the Fund would have otherwise been able to distribute. Such retained income or gains, net of any taxes, would constitute a portion of the liquidating distribution returned to investors at the end of each Fund’s term. In addition, each Fund’s investment in shorter term and lower yielding securities, especially as the Fund nears the end of its term, may reduce investment income and, therefore, the monthly dividends during the period prior to termination. Investors that purchase shares in the secondary market (particularly if their purchase price differs meaningfully from the Original NAV) may receive more or less than their original investment.
Each Fund’s ability to return Original NAV to common shareholders on or about the termination date will depend on market conditions and the success of various portfolio and cash flow management techniques.
Recent market conditions have materially increased the risk associated with achieving JHB’s objective to return Original NAV. This objective is not a guarantee and is dependent on a number of factors including the extent of market recovery and the cumulative level of income retained in relation to cumulative portfolio gains net of losses. JHAA’s objective is not a guarantee and is dependent on a number of factors including market conditions and the cumulative level of income retained in relation to cumulative portfolio gains net of losses.
15
15
| JHB | Nuveen Corporate Income November 2021 Target Term Fund Performance Overview and Holding Summaries as of December 31, 2020 |
Refer to the Glossary of Terms Used in this Report for further definition of the terms used within this section.
Average Annual Total Returns as of December 31, 2020
| Average Annual | ||||||||
| 1-Year | Since Inception |
|||||||
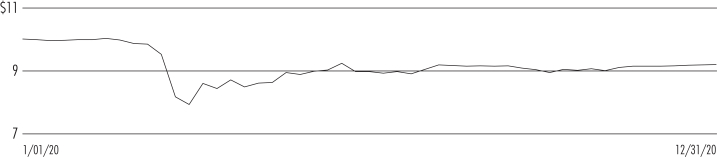
| JHB at Common Share NAV | (1.07)% | 4.35% | ||||||
| JHB at Common Share Price | (4.17)% | 3.40% | ||||||
| Bloomberg Barclays U.S. High Yield 1-5 Year Cash Pay 2% Issuer Capped Index | 4.49% | 5.57% | ||||||
Since inception returns are from 8/23/16. Past performance is not predictive of future results. Current performance may be higher or lower than the data shown. Returns do not reflect the deduction of taxes that shareholders may have to pay on Fund distributions or upon the sale of Fund shares. Returns at NAV are net of Fund expenses, and assume reinvestment of distributions. Comparative index return information is provided for the Fund’s shares at NAV only. Indexes are not available for direct investment.
Common Share Price Performance — Weekly Closing Price
16
This data relates to the securities held in the Fund’s portfolio of investments as of the end of the reporting period. It should not be construed as a measure of performance for the Fund itself. Holdings are subject to change.
For financial reporting purposes, the ratings disclosed are the highest rating given by one of the following national rating agencies: Standard & Poor’s Group, Moody’s Investors Service, Inc. or Fitch, Inc. This treatment of split-rated securities may differ from that used for other purposes, such as for Fund investment policies. Credit ratings are subject to change. AAA, AA, A and BBB are investment grade ratings; BB, B, CCC, CC, C and D are below-investment grade ratings. Holdings designated N/R are not rated by these national rating agencies.
| 1 | Includes 14.2% (as a percentage of total investments) in emerging markets countries. |
| 2 | See Portfolio of Investments for details on “other” Portfolio Composition. |
17
| JHAA | Nuveen Corporate Income 2023 Target Term Fund Performance Overview and Holding Summaries as of December 31, 2020 |
Refer to the Glossary of Terms Used in this Report for further definition of the terms used within this section.
Average Annual Total Returns as of December 31, 2020
| Average Annual | ||||||||
| 1-Year | Since Inception |
|||||||
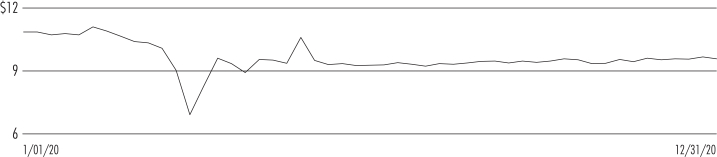
| JHAA at Common Share NAV | 2.51% | 6.48% | ||||||
| JHAA at Common Share Price | (6.43)% | 3.54% | ||||||
| Bloomberg Barclays U.S. High Yield 1-5 Year Cash Pay 2% Issuer Capped Index | 4.49% | 6.31% | ||||||
Since inception returns are from 12/18/18. Past performance is not predictive of future results. Current performance may be higher or lower than the data shown. Returns do not reflect the deduction of taxes that shareholders may have to pay on Fund distributions or upon the sale of Fund shares. Returns at NAV are net of Fund expenses, and assume reinvestment of distributions. Comparative index return information is provided for the Fund’s shares at NAV only. Indexes are not available for direct investment.
Common Share Price Performance — Weekly Closing Price
18
This data relates to the securities held in the Fund’s portfolio of investments as of the end of the reporting period. It should not be construed as a measure of performance for the Fund itself. Holdings are subject to change.
For financial reporting purposes, the ratings disclosed are the highest rating given by one of the following national rating agencies: Standard & Poor’s Group, Moody’s Investors Service, Inc. or Fitch, Inc. This treatment of split-rated securities may differ from that used for other purposes, such as for Fund investment policies. Credit ratings are subject to change. AAA, AA, A and BBB are investment grade ratings; BB, B, CCC, CC, C and D are below-investment grade ratings. Holdings designated N/R are not rated by these national rating agencies.
| 1 | Includes 9.1% (as a percentage of total investments) in emerging markets countries. |
| 2 | See Portfolio of Investments for details on “other” Portfolio Composition. |
19
Report of Independent Registered Public Accounting Firm
To the Shareholders and Board of Trustees
Nuveen Corporate Income November 2021 Target Term Fund
Nuveen Corporate Income 2023 Target Term Fund:
Opinion on the Financial Statements
We have audited the accompanying statements of assets and liabilities of Nuveen Corporate Income November 2021 Target Term Fund (formerly known as Nuveen High Income November 2021 Target Term Fund) and Nuveen Corporate Income 2023 Target Term Fund (formerly known as Nuveen High Income 2023 Target Term Fund) (the Funds), including the portfolios of investments, as of December 31, 2020, the related statements of operations and cash flows for the year then ended, the statements of changes in net assets for each of the years in the two-year period then ended, and the related notes (collectively, the financial statements) and the financial highlights for each of the years in the four-year period then ended and the period from August 23, 2016 (commencement of operations) to December 31, 2016 for Nuveen Corporate Income November 2021 Target Term Fund, and each of the years in the two-year period then ended and the period from December 18, 2018 (commencement of operations) to December 31, 2018 for Nuveen Corporate Income 2023 Target Term Fund. In our opinion, the financial statements and financial highlights present fairly, in all material respects, the financial position of the Funds as of December 31, 2020, the results of their operations and cash flows for the year then ended, the changes in their net assets for each of the years in the two-year period then ended, and the financial highlights for each of the years in the four-year period then ended and the period from August 23, 2016 to December 31, 2016 for Nuveen Corporate Income November 2021 Target Term Fund, and each of the years in the two-year period then ended and the period from December 18, 2018 to December 31, 2018 for Nuveen Corporate Income 2023 Target Term Fund, in conformity with U.S. generally accepted accounting principles.
Basis for Opinion
These financial statements and financial highlights are the responsibility of the Funds’ management. Our responsibility is to express an opinion on these financial statements and financial highlights based on our audits. We are a public accounting firm registered with the Public Company Accounting Oversight Board (United States) (PCAOB) and are required to be independent with respect to the Funds in accordance with the U.S. federal securities laws and the applicable rules and regulations of the Securities and Exchange Commission and the PCAOB.
We conducted our audits in accordance with the standards of the PCAOB. Those standards require that we plan and perform the audit to obtain reasonable assurance about whether the financial statements and financial highlights are free of material misstatement, whether due to error or fraud. Our audits included performing procedures to assess the risks of material misstatement of the financial statements and financial highlights, whether due to error or fraud, and performing procedures that respond to those risks. Such procedures included examining, on a test basis, evidence regarding the amounts and disclosures in the financial statements and financial highlights. Such procedures also included confirmation of securities owned as of December 31, 2020, by correspondence with custodians and brokers or other appropriate auditing procedures. Our audits also included evaluating the accounting principles used and significant estimates made by management, as well as evaluating the overall presentation of the financial statements and financial highlights. We believe that our audits provide a reasonable basis for our opinion.
/s/ KPMG LLP
We have served as the auditor of one or more Nuveen investment companies since 2014.
Chicago, Illinois
February 25, 2021
20
| JHB | Nuveen Corporate Income
Portfolio of Investments December 31, 2020 |
| Principal Amount (000) |
Description (1) | Coupon | Maturity | Ratings (2) | Value | |||||||||||||||||||
| LONG-TERM INVESTMENTS – 74.3% (100.0% of Total Investments) |
| |||||||||||||||||||||||
| CORPORATE BONDS – 68.8% (92.6% of Total Investments) |
| |||||||||||||||||||||||
| Aerospace & Defense – 0.5% | ||||||||||||||||||||||||
| $ | 2,750 | Bombardier Inc, 144A |
5.750% | 3/15/22 | B | $ | 2,805,742 | |||||||||||||||||
| Airlines – 2.2% | ||||||||||||||||||||||||
| 3,019 | Air Canada, 144A |
7.750% | 4/15/21 | B+ | 3,034,095 | |||||||||||||||||||
| 12 | Continental Airlines 2007-1 Class B Pass-Through Trust |
6.903% | 4/19/22 | Ba1 | 12,292 | |||||||||||||||||||
| 8,000 | Delta Air Lines Inc |
3.625% | 3/15/22 | Baa3 | 8,230,261 | |||||||||||||||||||
| 6,700 | Virgin Australia Holdings Ltd, 144A |
7.875% | 10/15/21 | N/R | 536,000 | |||||||||||||||||||
| 17,731 | Total Airlines |
11,812,648 | ||||||||||||||||||||||
| Auto Components – 2.1% | ||||||||||||||||||||||||
| 2,000 | Icahn Enterprises LP / Icahn Enterprises Finance Corp |
6.250% | 2/01/22 | BB | 2,005,000 | |||||||||||||||||||
| 8,650 | ZF North America Capital Inc, 144A |
4.500% | 4/29/22 | BB+ | 8,896,092 | |||||||||||||||||||
| 10,650 | Total Auto Components |
10,901,092 | ||||||||||||||||||||||
| Automobiles – 2.8% | ||||||||||||||||||||||||
| 5,000 | Ford Motor Credit Co LLC |
3.813% | 10/12/21 | BB+ | 5,056,250 | |||||||||||||||||||
| 5,055 | Ford Motor Credit Co LLC |
3.339% | 3/28/22 | BB+ | 5,105,550 | |||||||||||||||||||
| 4,945 | Ford Motor Credit Co LLC |
1.521% | 3/28/22 | BB+ | 4,860,707 | |||||||||||||||||||
| 15,000 | Total Automobiles |
15,022,507 | ||||||||||||||||||||||
| Banks – 2.3% | ||||||||||||||||||||||||
| 2,000 | Banco Nacional de Costa Rica, 144A |
5.875% | 4/25/21 | B2 | 2,007,500 | |||||||||||||||||||
| 7,410 | CIT Group Inc |
4.125% | 3/09/21 | BBB– | 7,432,230 | |||||||||||||||||||
| 825 | Ukreximbank Via Biz Finance PLC, 144A |
9.625% | 4/27/22 | B | 859,303 | |||||||||||||||||||
| 1,844 | UniCredit SpA, 144A |
3.750% | 4/12/22 | Baa1 | 1,910,915 | |||||||||||||||||||
| 12,079 | Total Banks |
12,209,948 | ||||||||||||||||||||||
| Chemicals – 0.3% | ||||||||||||||||||||||||
| 1,353 | CF Industries Inc, 144A |
3.400% | 12/01/21 | Baa2 | 1,384,710 | |||||||||||||||||||
| Consumer Finance – 5.6% | ||||||||||||||||||||||||
| 4,585 | Ally Financial Inc |
4.125% | 2/13/22 | BBB– | 4,761,355 | |||||||||||||||||||
| 14,100 | Navient Corp |
6.625% | 7/26/21 | Ba3 | 14,399,625 | |||||||||||||||||||
| 6,225 | Navient Corp |
7.250% | 1/25/22 | Ba3 | 6,505,125 | |||||||||||||||||||
| 3,000 | OneMain Finance Corp |
7.750% | 10/01/21 | BB– | 3,157,500 | |||||||||||||||||||
| 995 | SLM Corp |
5.125% | 4/05/22 | BB+ | 1,017,388 | |||||||||||||||||||
| 28,905 | Total Consumer Finance |
29,840,993 | ||||||||||||||||||||||
| Diversified Financial Services – 1.3% | ||||||||||||||||||||||||
| 2,798 | Park Aerospace Holdings Ltd, 144A |
3.625% | 3/15/21 | BBB– | 2,805,550 | |||||||||||||||||||
| 4,280 | PHH Corp |
6.375% | 8/15/21 | N/R | 4,215,800 | |||||||||||||||||||
| 7,078 | Total Diversified Financial Services |
7,021,350 | ||||||||||||||||||||||
| Diversified Telecommunication Services – 3.2% | ||||||||||||||||||||||||
| 11,195 | CenturyLink Inc |
5.800% | 3/15/22 | BB | 11,670,787 | |||||||||||||||||||
| 5,000 | Cogent Communications Group Inc, 144A |
5.375% | 3/01/22 | Ba3 | 5,143,750 | |||||||||||||||||||
| 16,195 | Total Diversified Telecommunication Services |
16,814,537 | ||||||||||||||||||||||
| Electric Utilities – 1.1% | ||||||||||||||||||||||||
| 3,625 | Eskom Holdings SOC Ltd, 144A |
5.750% | 1/26/21 | BBB+ | 3,610,500 | |||||||||||||||||||
| 2,000 | Instituto Costarricense de Electricidad, 144A |
6.950% | 11/10/21 | B1 | 1,992,500 | |||||||||||||||||||
| 5,625 | Total Electric Utilities |
5,603,000 | ||||||||||||||||||||||
21
| JHB | Nuveen Corporate Income November 2021 Target Term Fund (continued) | |
| Portfolio of Investments December 31, 2020 | ||
| Principal Amount (000) |
Description (1) | Coupon | Maturity | Ratings (2) | Value | |||||||||||||||||||
| Food & Staples Retailing – 0.2% | ||||||||||||||||||||||||
| $ | 1,010 | Smithfield Foods Inc, 144A |
3.350% | 2/01/22 | BBB | $ | 1,023,863 | |||||||||||||||||
| Health Care Providers & Services – 0.1% | ||||||||||||||||||||||||
| 310 | Fresenius Medical Care US Finance II Inc, 144A |
5.875% | 1/31/22 | BBB | 326,475 | |||||||||||||||||||
| Hotels, Restaurants & Leisure – 3.3% | ||||||||||||||||||||||||
| 9,112 | International Game Technology PLC, 144A |
6.250% | 2/15/22 | BB | 9,408,049 | |||||||||||||||||||
| 5,000 | MGM Resorts International |
7.750% | 3/15/22 | BB | 5,325,000 | |||||||||||||||||||
| 2,900 | Yum! Brands Inc |
3.750% | 11/01/21 | B+ | 2,929,000 | |||||||||||||||||||
| 17,012 | Total Hotels, Restaurants & Leisure |
17,662,049 | ||||||||||||||||||||||
| Household Durables – 4.6% | ||||||||||||||||||||||||
| 5,460 | KB Home |
7.000% | 12/15/21 | BB | 5,651,100 | |||||||||||||||||||
| 1,250 | Lennar Corp |
6.250% | 12/15/21 | Baa3 | 1,280,000 | |||||||||||||||||||
| 450 | Lennar Corp |
4.125% | 1/15/22 | Baa3 | 460,688 | |||||||||||||||||||
| 6,432 | Meritage Homes Corp |
7.000% | 4/01/22 | Ba1 | 6,834,000 | |||||||||||||||||||
| 5,000 | Newell Brands Inc |
3.650% | 4/01/21 | BB+ | 4,987,500 | |||||||||||||||||||
| 4,525 | PulteGroup Inc |
4.250% | 3/01/21 | Baa3 | 4,536,312 | |||||||||||||||||||
| 500 | Toll Brothers Finance Corp |
5.875% | 2/15/22 | BBB– | 520,000 | |||||||||||||||||||
| 23,617 | Total Household Durables |
24,269,600 | ||||||||||||||||||||||
| Insurance – 1.1% | ||||||||||||||||||||||||
| 5,897 | Genworth Holdings Inc |
7.625% | 9/24/21 | B– | 5,985,455 | |||||||||||||||||||
| Internet & Direct Marketing Retail – 1.3% | ||||||||||||||||||||||||
| 6,655 | Netflix Inc |
5.500% | 2/15/22 | BB | 6,962,794 | |||||||||||||||||||
| Machinery – 0.4% | ||||||||||||||||||||||||
| 1,850 | CNH Industrial Capital LLC |
3.875% | 10/15/21 | BBB | 1,893,413 | |||||||||||||||||||
| Media – 5.3% | ||||||||||||||||||||||||
| 10,770 | CSC Holdings LLC |
6.750% | 11/15/21 | B | 11,254,650 | |||||||||||||||||||
| 11,485 | DISH DBS Corp |
6.750% | 6/01/21 | B2 | 11,717,112 | |||||||||||||||||||
| 5,146 | Nielsen Finance LLC / Nielsen Finance Co, 144A |
5.000% | 4/15/22 | BB– | 5,159,534 | |||||||||||||||||||
| 27,401 | Total Media |
28,131,296 | ||||||||||||||||||||||
| Metals & Mining – 3.5% | ||||||||||||||||||||||||
| 748 | Anglo American Capital PLC, 144A |
4.125% | 4/15/21 | BBB | 753,964 | |||||||||||||||||||
| 5,534 | Freeport-McMoRan Inc |
3.550% | 3/01/22 | Ba1 | 5,630,845 | |||||||||||||||||||
| 1,500 | Glencore Finance Canada Ltd, 144A |
4.950% | 11/15/21 | BBB+ | 1,559,888 | |||||||||||||||||||
| 3,825 | Howmet Aerospace Inc |
5.870% | 2/23/22 | BBB– | 4,001,906 | |||||||||||||||||||
| 3,250 | Petra Diamonds US Treasury PLC, 144A, (3) |
7.250% | 5/01/22 | D | 1,267,500 | |||||||||||||||||||
| 5,324 | Teck Resources Ltd |
4.750% | 1/15/22 | BBB– | 5,435,884 | |||||||||||||||||||
| 20,181 | Total Metals & Mining |
18,649,987 | ||||||||||||||||||||||
| Mortgage Real Estate Investment Trust – 1.7% | ||||||||||||||||||||||||
| 9,000 | Starwood Property Trust Inc |
5.000% | 12/15/21 | Ba3 | 9,150,930 | |||||||||||||||||||
| Oil, Gas & Consumable Fuels – 10.0% | ||||||||||||||||||||||||
| 9,250 | Calumet Specialty Products Partners LP / Calumet Finance Corp |
7.625% | 1/15/22 | B– | 9,157,500 | |||||||||||||||||||
| 3,000 | Occidental Petroleum Corp |
2.600% | 8/13/21 | Ba2 | 3,026,250 | |||||||||||||||||||
| 10,000 | Occidental Petroleum Corp |
3.125% | 2/15/22 | Ba2 | 10,075,000 | |||||||||||||||||||
| 2,172 | Ovintiv Exploration Inc |
5.750% | 1/30/22 | BBB– | 2,255,903 | |||||||||||||||||||
| 3,000 | Petroleos Mexicanos |
4.875% | 1/24/22 | BBB | 3,084,900 | |||||||||||||||||||
| 4,000 | Petroleos Mexicanos |
5.375% | 3/13/22 | BBB | 4,132,040 | |||||||||||||||||||
| 2,059 | Sabine Pass Liquefaction LLC |
6.250% | 3/15/22 | BBB– | 2,166,941 | |||||||||||||||||||
| 4,000 | Southwestern Energy Co |
4.100% | 3/15/22 | BB | 4,020,000 | |||||||||||||||||||
| 9,920 | Western Midstream Operating LP |
5.375% | 6/01/21 | Baa3 | 9,969,600 | |||||||||||||||||||
| 5,000 | WPX Energy Inc |
6.000% | 1/15/22 | BBB– | 5,075,050 | |||||||||||||||||||
| 52,401 | Total Oil, Gas & Consumable Fuels |
52,963,184 | ||||||||||||||||||||||
22
| Principal Amount (000) |
Description (1) | Coupon | Maturity | Ratings (2) | Value | |||||||||||||||||||
| Pharmaceuticals – 1.9% | ||||||||||||||||||||||||
| $ | 3,750 | Teva Pharmaceutical Finance Co BV |
3.650% | 11/10/21 | Ba2 | $ | 3,796,875 | |||||||||||||||||
| 6,199 | Teva Pharmaceutical Finance IV BV |
3.650% | 11/10/21 | BBB | 6,276,487 | |||||||||||||||||||
| 9,949 | Total Pharmaceuticals |
10,073,362 | ||||||||||||||||||||||
| Real Estate Management & Development – 0.9% | ||||||||||||||||||||||||
| 2,900 | China Evergrande Group, Reg S |
8.250% | 3/23/22 | B2 | 2,718,685 | |||||||||||||||||||
| 2,000 | RKPF Overseas 2019 B Ltd |
7.750% | 4/18/21 | BB– | 2,027,500 | |||||||||||||||||||
| 4,900 | Total Real Estate Management & Development |
4,746,185 | ||||||||||||||||||||||
| Semiconductors & Semiconductor Equipment – 0.2% | ||||||||||||||||||||||||
| 850 | Microchip Technology Inc |
3.922% | 6/01/21 | Baa3 | 862,066 | |||||||||||||||||||
| Specialty Retail – 1.5% | ||||||||||||||||||||||||
| 7,000 | Foot Locker Inc |
8.500% | 1/15/22 | BB+ | 7,446,250 | |||||||||||||||||||
| 448 | L Brands Inc |
5.625% | 2/15/22 | B+ | 464,240 | |||||||||||||||||||
| 7,448 | Total Specialty Retail |
7,910,490 | ||||||||||||||||||||||
| Technology Hardware, Storage & Peripherals – 1.5% | ||||||||||||||||||||||||
| 7,938 | Dell International LLC / EMC Corp, 144A |
5.875% | 6/15/21 | BB+ | 7,952,288 | |||||||||||||||||||
| Thrifts & Mortgage Finance – 0.6% | ||||||||||||||||||||||||
| 3,280 | Ladder Capital Finance Holdings LLLP / Ladder Capital Finance Corp, 144A |
5.250% | 3/15/22 | Ba2 | 3,296,400 | |||||||||||||||||||
| Trading Companies & Distributors – 2.3% | ||||||||||||||||||||||||
| 2,000 | AerCap Ireland Capital DAC / AerCap Global Aviation Trust |
3.950% | 2/01/22 | BBB | 2,056,493 | |||||||||||||||||||
| 7,000 | Aircastle Ltd |
5.500% | 2/15/22 | BBB | 7,290,312 | |||||||||||||||||||
| 2,809 | Fortress Transportation and Infrastructure Investors LLC, 144A |
6.750% | 3/15/22 | Ba3 | 2,816,023 | |||||||||||||||||||
| 11,809 | Total Trading Companies & Distributors |
12,162,828 | ||||||||||||||||||||||
| Transportation Infrastructure – 0.6% | ||||||||||||||||||||||||
| 3,000 | Adani Ports & Special Economic Zone Ltd, Reg S |
3.950% | 1/19/22 | BBB– | 3,067,049 | |||||||||||||||||||
| Wireless Telecommunication Services – 6.4% | ||||||||||||||||||||||||
| 11,495 | Hughes Satellite Systems Corp |
7.625% | 6/15/21 | BB | 11,782,375 | |||||||||||||||||||
| 3,000 | MTN Mauritius Investments Ltd, 144A |
5.373% | 2/13/22 | Ba2 | 3,088,950 | |||||||||||||||||||
| 1,475 | Sprint Communications Inc |
9.250% | 4/15/22 | N/R | 1,612,736 | |||||||||||||||||||
| 11,375 | Sprint Corp |
7.250% | 9/15/21 | BB+ | 11,835,687 | |||||||||||||||||||
| 5,429 | T-Mobile USA Inc |
4.000% | 4/15/22 | BB+ | 5,598,656 | |||||||||||||||||||
| 32,774 | Total Wireless Telecommunication Services |
33,918,404 | ||||||||||||||||||||||
| $ | 364,648 | Total Corporate Bonds (cost $367,073,864) |
364,424,645 | |||||||||||||||||||||
| Principal Amount (000) |
Description (1) | Coupon | Maturity | Ratings (2) | Value | |||||||||||||||||||
| SOVEREIGN DEBT – 2.7% (3.6% of Total Investments) |
| |||||||||||||||||||||||
| Argentina – 0.1% | ||||||||||||||||||||||||
| $ | 35 | Argentine Republic Government International Bond |
1.000% | 7/09/29 | CCC+ | $ | 15,298 | |||||||||||||||||
| 582 | Argentine Republic Government International Bond |
0.125% | 7/09/30 | CCC+ | 235,710 | |||||||||||||||||||
| 617 | Total Argentina |
|
251,008 | |||||||||||||||||||||
| Egypt – 1.3% | ||||||||||||||||||||||||
| 6,750 | Egypt Government International Bond, 144A |
6.125% | 1/31/22 | B+ | 7,042,235 | |||||||||||||||||||
| Nigeria – 0.3% | ||||||||||||||||||||||||
| 1,750 | Nigeria Government International Bond, 144A |
6.750% | 1/28/21 | B | 1,753,549 | |||||||||||||||||||
| Sri Lanka – 0.3% | ||||||||||||||||||||||||
| 2,100 | Sri Lanka Government International Bond, 144A |
5.750% | 1/18/22 | CCC+ | 1,626,051 | |||||||||||||||||||
23
| JHB | Nuveen Corporate Income November 2021 Target Term Fund (continued) | |
| Portfolio of Investments December 31, 2020 | ||
| Principal Amount (000) |
Description (1) | Coupon | Maturity | Ratings (2) | Value | |||||||||||||||||||||||
| Turkey – 0.7% | ||||||||||||||||||||||||||||
| $ | 3,625 | Turkey Government International Bond |
|
5.125% | 3/25/22 | BB– | $ | 3,712,000 | ||||||||||||||||||||
| $ | 14,842 | Total Sovereign Debt (cost $14,675,927) |
|
14,384,843 | ||||||||||||||||||||||||
| Principal Amount (000) |
Description (1) | Coupon (4) | Reference Rate (4) |
Spread (4) | Maturity (5) | Ratings (2) | Value | |||||||||||||||||||||
| VARIABLE RATE SENIOR LOAN INTERESTS – 1.5% (2.1% of Total Investments) (4) |
| |||||||||||||||||||||||||||
| Specialty Retail – 1.5% | ||||||||||||||||||||||||||||
| $ | 8,102 | Petsmart Inc., Term Loan B, First Lien |
4.500% | 3-Month LIBOR | 3.500% | 3/11/22 | B1 | $ | 8,121,987 | |||||||||||||||||||
| $ | 8,102 | Total Variable Rate Senior Loan Interests (cost $8,025,206) |
|
8,121,987 | ||||||||||||||||||||||||
| Principal Amount (000) |
Description (1) | Coupon | Maturity | Ratings (2) | Value | |||||||||||||||||||||||
| CONVERTIBLE BONDS – 1.3% (1.7% of Total Investments) |
| |||||||||||||||||||||||||||
| Interactive Media & Services – 1.0% | ||||||||||||||||||||||||||||
| $ | 5,000 | Twitter Inc |
|
1.000% | 9/15/21 | N/R | $ | 5,090,085 | ||||||||||||||||||||
| Pharmaceuticals – 0.3% |
| |||||||||||||||||||||||||||
| 1,706 | Teva Pharmaceutical Finance Co LLC |
|
0.250% | 2/01/26 | Ba2 | 1,697,470 | ||||||||||||||||||||||
| $ | 6,706 | Total Convertible Bonds (cost $6,637,068) |
|
6,787,555 | ||||||||||||||||||||||||
| Total Long-Term Investments (cost $396,412,065) |
|
393,719,030 | ||||||||||||||||||||||||||
| Other Assets Less Liabilities – 25.7% |
|
135,863,664 | ||||||||||||||||||||||||||
| Net Assets Applicable to Common Shares – 100% |
|
$ | 529,582,694 | |||||||||||||||||||||||||
For Fund portfolio compliance purposes, the Fund’s industry classifications refer to any one or more of the industry sub-classifications used by one or more widely recognized market indexes or ratings group indexes, and/or as defined by Fund management. This definition may not apply for purposes of this report, which may combine industry sub-classifications into sectors for reporting ease.
| (1) | All percentages shown in the Portfolio of Investments are based on net assets applicable to common shares unless otherwise noted. |
| (2) | For financial reporting purposes, the ratings disclosed are the highest of Standard & Poor’s Group (“Standard & Poor’s”), Moody’s Investors Service, Inc. (“Moody’s”) or Fitch, Inc. (“Fitch”) rating. This treatment of split-rated securities may differ from that used for other purposes, such as for Fund investment policies. Ratings below BBB by Standard & Poor’s, Baa by Moody’s or BBB by Fitch are considered to be below investment grade. Holdings designated N/R are not rated by any of these national rating agencies. Ratings are not covered by the report of independent registered public accounting firm. |
| (3) | Defaulted security. A security whose issuer has failed to fully pay principal and/or interest when due, or is under the protection of bankruptcy. |
| (4) | Senior loans generally pay interest at rates which are periodically adjusted by reference to a base short-term, floating lending rate (Reference Rate) plus an assigned fixed rate (Spread). These floating lending rates are generally (i) the lending rate referenced by the London Inter-Bank Offered Rate (“LIBOR”), or (ii) the prime rate offered by one or more major United States banks. Senior loans may be considered restricted in that the Fund ordinarily is contractually obligated to receive approval from the agent bank and/or borrower prior to the disposition of a senior loan. The rate shown is the coupon as of the end of the reporting period. |
| (5) | Senior loans generally are subject to mandatory and/or optional prepayment. Because of these mandatory prepayment conditions and because there may be significant economic incentives for a borrower to prepay, prepayments of senior loans may occur. As a result, the actual remaining maturity of senior loans held may be substantially less than the stated maturities shown. |
| 144A | Investment is exempt from registration under Rule 144A of the Securities Act of 1933, as amended. These investments may only be resold in transactions exempt from registration, which are normally those transactions with qualified institutional buyers. |
| LIBOR | London Inter-Bank Offered Rate |
| Reg S | Regulation S allows U.S. companies to sell securities to persons or entities located outside of the United States without registering those securities with the Securities and Exchange Commission. Specifically, Regulation S provides a safe harbor from the registration requirements of the Securities Act for the offers and sales of securities by both foreign and domestic issuers that are made outside the United States. |
See accompanying notes to financial statements.
24
| JHAA | Nuveen Corporate Income 2023 Target
Portfolio of Investments December 31, 2020 |
| Principal Amount (000) |
Description (1) | Coupon | Maturity | Ratings (2) | Value | |||||||||||||||||||
| LONG-TERM INVESTMENTS – 122.3% (92.7% of Total Investments) |
||||||||||||||||||||||||
| CORPORATE BONDS – 79.4% (60.1% of Total Investments) |
||||||||||||||||||||||||
| Aerospace & Defense – 0.8% | ||||||||||||||||||||||||
| $ | 600 | Bombardier Inc, 144A |
6.125% | 1/15/23 | B | $ | 586,500 | |||||||||||||||||
| Air Freight & Logistics – 1.6% | ||||||||||||||||||||||||
| 1,200 | XPO Logistics Inc, 144A |
6.125% | 9/01/23 | BB– | 1,221,000 | |||||||||||||||||||
| Airlines – 1.3% | ||||||||||||||||||||||||
| 1,000 | United Airlines Holdings Inc |
5.000% | 2/01/24 | Ba3 | 992,500 | |||||||||||||||||||
| Auto Components – 1.6% | ||||||||||||||||||||||||
| 975 | Icahn Enterprises LP / Icahn Enterprises Finance Corp |
6.750% | 2/01/24 | BB | 991,555 | |||||||||||||||||||
| 250 | ZF North America Capital Inc, 144A |
4.500% | 4/29/22 | BB+ | 257,113 | |||||||||||||||||||
| 1,225 | Total Auto Components |
|
1,248,668 | |||||||||||||||||||||
| Automobiles – 4.2% | ||||||||||||||||||||||||
| 375 | Fiat Chrysler Automobiles NV |
5.250% | 4/15/23 | BBB– | 402,187 | |||||||||||||||||||
| 2,000 | Ford Motor Credit Co LLC |
3.370% | 11/17/23 | BB+ | 2,039,580 | |||||||||||||||||||
| 800 | Ford Motor Credit Co LLC |
5.584% | 3/18/24 | BB+ | 862,920 | |||||||||||||||||||
| 3,175 | Total Automobiles |
|
3,304,687 | |||||||||||||||||||||
| Chemicals – 2.0% | ||||||||||||||||||||||||
| 1,525 | NOVA Chemicals Corp, 144A |
4.875% | 6/01/24 | BB– | 1,587,906 | |||||||||||||||||||
| Commercial Services & Supplies – 2.5% | ||||||||||||||||||||||||
| 1,475 | ADT Security Corp |
4.125% | 6/15/23 | BB– | 1,572,571 | |||||||||||||||||||
| 400 | Pitney Bowes Inc |
5.950% | 4/01/23 | BB | 408,000 | |||||||||||||||||||
| 1,875 | Total Commercial Services & Supplies |
|
1,980,571 | |||||||||||||||||||||
| Communications Equipment – 1.0% | ||||||||||||||||||||||||
| 750 | CommScope Inc, 144A |
5.500% | 3/01/24 | Ba3 | 773,250 | |||||||||||||||||||
| Consumer Finance – 3.7% | ||||||||||||||||||||||||
| 500 | Navient Corp |
5.500% | 1/25/23 | Ba3 | 522,500 | |||||||||||||||||||
| 800 | Navient Corp |
7.250% | 9/25/23 | Ba3 | 876,784 | |||||||||||||||||||
| 1,300 | OneMain Finance Corp |
8.250% | 10/01/23 | BB– | 1,491,750 | |||||||||||||||||||
| 2,600 | Total Consumer Finance |
|
2,891,034 | |||||||||||||||||||||
| Containers & Packaging – 2.1% | ||||||||||||||||||||||||
| 237 | Berry Global Inc |
5.125% | 7/15/23 | BB+ | 239,963 | |||||||||||||||||||
| 500 | OI European Group BV, 144A |
4.000% | 3/15/23 | B+ | 510,000 | |||||||||||||||||||
| 28 | Reynolds Group Issuer Inc / Reynolds Group Issuer LLC / Reynolds Group Issuer Lu, 144A |
5.125% | 7/15/23 | B+ | 28,344 | |||||||||||||||||||
| 850 | Sealed Air Corp, 144A |
5.250% | 4/01/23 | BB+ | 903,125 | |||||||||||||||||||
| 1,615 | Total Containers & Packaging |
|
1,681,432 | |||||||||||||||||||||
| Diversified Financial Services – 2.0% | ||||||||||||||||||||||||
| 500 | Navient Corp |
6.125% | 3/25/24 | Ba3 | 533,750 | |||||||||||||||||||
| 300 | Park Aerospace Holdings Ltd, 144A |
4.500% | 3/15/23 | BBB– | 314,357 | |||||||||||||||||||
| 350 | Park Aerospace Holdings Ltd, 144A |
5.500% | 2/15/24 | BBB– | 381,671 | |||||||||||||||||||
| 300 | Sasol Financing International Ltd |
4.500% | 11/14/22 | BB | 305,910 | |||||||||||||||||||
| 1,450 | Total Diversified Financial Services |
|
1,535,688 | |||||||||||||||||||||
| Diversified Telecommunication Services – 2.1% | ||||||||||||||||||||||||
| 1,500 | CenturyLink Inc |
6.750% | 12/01/23 | BB | 1,670,625 | |||||||||||||||||||
25
| JHAA | Nuveen Corporate Income 2023 Target Term Fund (continued) | |
| Portfolio of Investments December 31, 2020 | ||
| Principal Amount (000) |
Description (1) | Coupon | Maturity | Ratings (2) | Value | |||||||||||||||||||
| Electric Utilities – 2.7% | ||||||||||||||||||||||||
| $ | 1,500 | Pacific Gas and Electric Co |
1.750% | 6/16/22 | BBB– | $ | 1,504,219 | |||||||||||||||||
| 600 | TerraForm Power Operating LLC, 144A |
4.250% | 1/31/23 | BB | 620,250 | |||||||||||||||||||
| 2,100 | Total Electric Utilities |
|
2,124,469 | |||||||||||||||||||||
| Entertainment – 0.9% | ||||||||||||||||||||||||
| 750 | Cinemark USA Inc |
5.125% | 12/15/22 | B | 735,000 | |||||||||||||||||||
| Equity Real Estate Investment Trust – 2.0% | ||||||||||||||||||||||||
| 250 | Clear Channel Worldwide Holdings Inc |
9.250% | 2/15/24 | CCC | 253,125 | |||||||||||||||||||
| 750 | GLP Capital LP / GLP Financing II Inc |
5.375% | 11/01/23 | BBB– | 819,360 | |||||||||||||||||||
| 500 | SBA Communications Corp |
4.000% | 10/01/22 | BB– | 505,000 | |||||||||||||||||||
| 1,500 | Total Equity Real Estate Investment Trust |
|
1,577,485 | |||||||||||||||||||||
| Food Products – 1.6% | ||||||||||||||||||||||||
| 1,250 | MARB BondCo PLC, 144A |
7.000% | 3/15/24 | BB | 1,281,263 | |||||||||||||||||||
| Gas Utilities – 2.3% | ||||||||||||||||||||||||
| 900 | AmeriGas Partners LP / AmeriGas Finance Corp |
5.625% | 5/20/24 | BB | 969,750 | |||||||||||||||||||
| 825 | Suburban Propane Partners LP/Suburban Energy Finance Corp |
5.500% | 6/01/24 | BB– | 842,531 | |||||||||||||||||||
| 1,725 | Total Gas Utilities |
|
1,812,281 | |||||||||||||||||||||
| Health Care Providers & Services – 3.2% | ||||||||||||||||||||||||
| 750 | CHS/Community Health Systems Inc, 144A |
8.625% | 1/15/24 | B– | 781,875 | |||||||||||||||||||
| 500 | HCA Inc |
5.875% | 5/01/23 | Ba2 | 549,375 | |||||||||||||||||||
| 500 | Molina Healthcare Inc |
5.375% | 11/15/22 | BB– | 529,375 | |||||||||||||||||||
| 600 | Tenet Healthcare Corp |
6.750% | 6/15/23 | B– | 645,480 | |||||||||||||||||||
| 2,350 | Total Health Care Providers & Services |
|
2,506,105 | |||||||||||||||||||||
| Hotels, Restaurants & Leisure – 4.0% | ||||||||||||||||||||||||
| 387 | 1011778 BC ULC / New Red Finance Inc, 144A |
4.250% | 5/15/24 | BB+ | 394,740 | |||||||||||||||||||
| 1,000 | International Game Technology PLC, 144A |
6.250% | 2/15/22 | BB | 1,032,490 | |||||||||||||||||||
| 1,000 | MGM Resorts International |
6.000% | 3/15/23 | BB | 1,073,750 | |||||||||||||||||||
| 600 | Wynn Las Vegas LLC / Wynn Las Vegas Capital Corp, 144A |
4.250% | 5/30/23 | BB– | 608,730 | |||||||||||||||||||
| 2,987 | Total Hotels, Restaurants & Leisure |
|
3,109,710 | |||||||||||||||||||||
| Household Durables – 4.1% | ||||||||||||||||||||||||
| 1,250 | KB Home |
7.625% | 5/15/23 | BB | 1,381,250 | |||||||||||||||||||
| 785 | Taylor Morrison Communities Inc / Taylor Morrison Holdings II Inc, 144A |
5.625% | 3/01/24 | BB | 842,894 | |||||||||||||||||||
| 900 | Toll Brothers Finance Corp |
5.625% | 1/15/24 | BBB– | 994,500 | |||||||||||||||||||
| 2,935 | Total Household Durables |
|
3,218,644 | |||||||||||||||||||||
| Insurance – 0.5% | ||||||||||||||||||||||||
| 400 | Acrisure LLC / Acrisure Finance Inc, 144A |
8.125% | 2/15/24 | B | 423,486 | |||||||||||||||||||
| Leisure Products – 0.7% | ||||||||||||||||||||||||
| 500 | Mattel Inc |
3.150% | 3/15/23 | B+ | 505,000 | |||||||||||||||||||
| Media – 4.4% | ||||||||||||||||||||||||
| 850 | AMC Networks Inc |
5.000% | 4/01/24 | BB | 863,813 | |||||||||||||||||||
| 375 | CCO Holdings LLC / CCO Holdings Capital Corp, 144A |
4.000% | 3/01/23 | BB+ | 377,344 | |||||||||||||||||||
| 1,100 | CSC Holdings LLC |
5.250% | 6/01/24 | B | 1,190,640 | |||||||||||||||||||
| 750 | DISH DBS Corp |
5.000% | 3/15/23 | B2 | 774,375 | |||||||||||||||||||
| 269 | Nielsen Finance LLC / Nielsen Finance Co, 144A |
5.000% | 4/15/22 | BB– | 269,707 | |||||||||||||||||||
| 3,344 | Total Media |
|
3,475,879 | |||||||||||||||||||||
| Metals & Mining – 5.8% | ||||||||||||||||||||||||
| 850 | Commercial Metals Co |
4.875% | 5/15/23 | BB+ | 894,625 | |||||||||||||||||||
| 650 | Constellium SE, 144A |
5.750% | 5/15/24 | B | 663,273 | |||||||||||||||||||
| 1,250 | First Quantum Minerals Ltd, 144A |
6.500% | 3/01/24 | B– | 1,284,375 | |||||||||||||||||||
| 1,125 | FMG Resources August 2006 Pty Ltd, 144A |
5.125% | 5/15/24 | BB+ | 1,220,625 | |||||||||||||||||||
26
| Principal Amount (000) |
Description (1) | Coupon | Maturity | Ratings (2) | Value | |||||||||||||||||||||||
| Metals & Mining (continued) | ||||||||||||||||||||||||||||
| $ | 500 | Freeport-McMoRan Inc |
|
3.875% | 3/15/23 | Ba1 | $ | 521,650 | ||||||||||||||||||||
| 4,375 | Total Metals & Mining |
|
4,584,548 | |||||||||||||||||||||||||
| Oil, Gas & Consumable Fuels – 13.2% | ||||||||||||||||||||||||||||
| 235 | Antero Resources Corp |
|
5.125% | 12/01/22 | B | 234,389 | ||||||||||||||||||||||
| 300 | Buckeye Partners LP |
|
4.150% | 7/01/23 | BB | 308,250 | ||||||||||||||||||||||
| 500 | Calumet Specialty Products Partners LP / Calumet Finance Corp |
|
7.750% | 4/15/23 | B– | 487,500 | ||||||||||||||||||||||
| 750 | Cenovus Energy Inc |
|
3.000% | 8/15/22 | BBB– | 766,343 | ||||||||||||||||||||||
| 225 | Continental Resources Inc/OK |
|
4.500% | 4/15/23 | BBB– | 231,998 | ||||||||||||||||||||||
| 250 | Energy Transfer Operating LP |
|
5.875% | 1/15/24 | BBB– | 280,942 | ||||||||||||||||||||||
| 500 | EnLink Midstream Partners LP |
|
4.400% | 4/01/24 | BB+ | 493,385 | ||||||||||||||||||||||
| 500 | EQM Midstream Partners LP |
|
4.750% | 7/15/23 | BB | 525,740 | ||||||||||||||||||||||
| 1,500 | Leviathan Bond Ltd, 144A |
|
5.750% | 6/30/23 | BB | 1,597,459 | ||||||||||||||||||||||
| 250 | MEG Energy Corp, 144A |
|
7.000% | 3/31/24 | B+ | 252,500 | ||||||||||||||||||||||
| 1,000 | NAK Naftogaz Ukraine via Kondor Finance PLC |
|
7.375% | 7/19/22 | B | 1,031,752 | ||||||||||||||||||||||
| 750 | Occidental Petroleum Corp |
|
2.700% | 2/15/23 | Ba2 | 749,288 | ||||||||||||||||||||||
| 1,000 | Petroleos Mexicanos |
|
4.875% | 1/18/24 | BBB | 1,050,360 | ||||||||||||||||||||||
| 500 | QEP Resources Inc |
|
5.250% | 5/01/23 | B+ | 526,250 | ||||||||||||||||||||||
| 1,000 | SM Energy Co |
|
5.000% | 1/15/24 | B– | 842,500 | ||||||||||||||||||||||
| 270 | Western Midstream Operating LP |
|
4.000% | 7/01/22 | BB | 277,425 | ||||||||||||||||||||||
| 750 | Western Midstream Operating LP |
|
2.074% | 1/13/23 | BB | 735,197 | ||||||||||||||||||||||
| 10,280 | Total Oil, Gas & Consumable Fuels |
|
10,391,278 | |||||||||||||||||||||||||
| Pharmaceuticals – 3.2% | ||||||||||||||||||||||||||||
| 1,125 | Bausch Health Cos Inc, 144A |
|
7.000% | 3/15/24 | BB | 1,157,344 | ||||||||||||||||||||||
| 1,300 | Teva Pharmaceutical Finance Netherlands III BV |
|
6.000% | 4/15/24 | Ba2 | 1,378,000 | ||||||||||||||||||||||
| 2,425 | Total Pharmaceuticals |
|
2,535,344 | |||||||||||||||||||||||||
| Real Estate Management & Development – 0.8% | ||||||||||||||||||||||||||||
| 600 | Realogy Group LLC / Realogy Co-Issuer Corp, 144A |
|
4.875% | 6/01/23 | B– | 612,000 | ||||||||||||||||||||||
| Specialty Retail – 1.4% | ||||||||||||||||||||||||||||
| 1,000 | L Brands Inc |
|
5.625% | 10/15/23 | B+ | 1,077,500 | ||||||||||||||||||||||
| Technology Hardware, Storage & Peripherals – 0.5% | ||||||||||||||||||||||||||||
| 375 | EMC Corp |
|
3.375% | 6/01/23 | BB | 392,981 | ||||||||||||||||||||||
| Trading Companies & Distributors – 1.1% | ||||||||||||||||||||||||||||
| 400 | AerCap Ireland Capital DAC / AerCap Global Aviation Trust |
|
4.500% | 9/15/23 | BBB | 433,660 | ||||||||||||||||||||||
| 400 | Aircastle Ltd |
|
4.400% | 9/25/23 | BBB | 423,836 | ||||||||||||||||||||||
| 800 | Total Trading Companies & Distributors |
|
857,496 | |||||||||||||||||||||||||
| Transportation Infrastructure – 1.3% | ||||||||||||||||||||||||||||
| 1,000 | Rumo Luxembourg Sarl, 144A |
|
7.375% | 2/09/24 | BB | 1,037,510 | ||||||||||||||||||||||
| Wireless Telecommunication Services – 0.8% | ||||||||||||||||||||||||||||
| 525 | Sprint Corp |
|
7.875% | 9/15/23 | BB+ | 607,845 | ||||||||||||||||||||||
| $ | 59,736 | Total Corporate Bonds (cost $59,211,514) |
|
62,339,685 | ||||||||||||||||||||||||
| Principal Amount (000) |
Description (1) | Coupon (3) | Reference Rate (3) |
Spread (3) | Maturity (4) | Ratings (2) | Value | |||||||||||||||||||||
| VARIABLE RATE SENIOR LOAN INTERESTS – 40.0% (30.4% of Total Investments) (3) |
|
|||||||||||||||||||||||||||
| Airlines – 1.3% | ||||||||||||||||||||||||||||
| $ | 998 | Delta Air Lines, Inc., Term Loan B (DD1) |
5.750% | 3-Month LIBOR | 4.750% | 4/29/23 | Baa2 | $ | 1,014,956 | |||||||||||||||||||
| Auto Components – 0.4% | ||||||||||||||||||||||||||||
| 221 | Adient Global Holdings, Initial Term Loan |
4.397% | 1-Month LIBOR | 4.250% | 5/06/24 | Ba3 | 221,502 | |||||||||||||||||||||
27
| JHAA | Nuveen Corporate Income 2023 Target Term Fund (continued) | |
| Portfolio of Investments December 31, 2020 | ||
| Principal Amount (000) |
Description (1) | Coupon (3) | Reference Rate (3) |
Spread (3) | Maturity (4) | Ratings (2) | Value | |||||||||||||||||||||
| Auto Components (continued) | ||||||||||||||||||||||||||||
| $ | 75 | Adient Global Holdings, Initial Term Loan |
4.463% | 3-Month LIBOR | 4.250% | 5/06/24 | Ba3 | $ | 75,170 | |||||||||||||||||||
| 296 | Total Auto Components |
|
296,672 | |||||||||||||||||||||||||
| Beverages – 0.7% | ||||||||||||||||||||||||||||
| 620 | Arctic Glacier U.S.A., Inc. Term Loan B |
4.500% | 3-Month LIBOR | 3.500% | 3/20/24 | CCC+ | 556,207 | |||||||||||||||||||||
| Building Products – 0.6% | ||||||||||||||||||||||||||||
| 500 | DiversiTech Holdings, Inc., Term Loan B1 (WI/DD) |
TBD | TBD | TBD | TBD | B+ | 496,773 | |||||||||||||||||||||
| Chemicals – 0.3% | ||||||||||||||||||||||||||||
| 248 | Ineos US Finance LLC, Term Loan |
2.147% | 1-Month LIBOR | 2.000% | 3/31/24 | BBB– | 245,205 | |||||||||||||||||||||
| Commercial Services & Supplies – 1.7% | ||||||||||||||||||||||||||||
| 637 | R.R. Donnelley & Sons Company, Term Loan B |
5.147% | 1-Month LIBOR | 5.000% | 1/15/24 | B+ | 622,986 | |||||||||||||||||||||
| 649 | Wash Multifamily Acquisition, Inc., Initial US Term Loan, First Lien |
4.250% | 1-Month LIBOR | 3.250% | 5/16/22 | B2 | 646,138 | |||||||||||||||||||||
| 101 | Wash Multifamily Acquisition, Inc., Initial Canadian Term Loan, First Lien |
4.250% | 1-Month LIBOR | 3.250% | 5/16/22 | B2 | 100,116 | |||||||||||||||||||||
| 1,387 | Total Commercial Services & Supplies |
|
1,369,240 | |||||||||||||||||||||||||
| Communications Equipment – 1.7% | ||||||||||||||||||||||||||||
| 500 | MultiPlan, Inc., Term Loan B (WI/DD) |
TBD | TBD | TBD | TBD | Ba3 | 498,635 | |||||||||||||||||||||
| 856 | Univision Communications, Inc., Term Loan C5 |
3.750% | 1-Month LIBOR | 2.750% | 3/15/24 | B | 852,139 | |||||||||||||||||||||
| 1,356 | Total Communications Equipment |
|
1,350,774 | |||||||||||||||||||||||||
| Containers & Packaging – 4.0% | ||||||||||||||||||||||||||||
| 739 | Berry Global, Inc., Term Loan X |
2.149% | 1-Month LIBOR | 2.000% | 1/19/24 | BBB– | 739,281 | |||||||||||||||||||||
| 520 | Flex Acquisition Company, Inc., Term Loan, First Lien |
4.000% | 3-Month LIBOR | 3.000% | 12/31/23 | B | 518,332 | |||||||||||||||||||||
| 36 | Flex Acquisition Company, Inc., Term Loan, First Lien |
4.000% | 1-Month LIBOR | 3.000% | 12/31/23 | B | 35,885 | |||||||||||||||||||||
| 1,248 | Kloeckner Pentaplast of America Inc., Dollar Term Loan (DD1) |
5.250% | 6-Month LIBOR | 4.250% | 6/30/22 | B– | 1,247,287 | |||||||||||||||||||||
| 2 | TricorBraun Holdings, Inc. Term Loan B |
6.000% | PRIME | 2.750% | 11/30/23 | B2 | 1,991 | |||||||||||||||||||||
| 627 | TricorBraun Holdings, Inc. Term Loan B |
4.750% | 1-Month LIBOR | 3.750% | 11/30/23 | B2 | 624,334 | |||||||||||||||||||||
| 3,172 | Total Containers & Packaging |
|
3,167,110 | |||||||||||||||||||||||||
| Distributors – 1.1% | ||||||||||||||||||||||||||||
| 246 | Atotech, Initial Term Loan B1 |
4.000% | 3-Month LIBOR | 3.000% | 1/31/24 | B2 | 245,986 | |||||||||||||||||||||
| 637 | Spin Holdco Inc., Term Loan B1, First Lien |
4.250% | 3-Month LIBOR | 3.250% | 11/14/22 | B2 | 634,516 | |||||||||||||||||||||
| 883 | Total Distributors |
|
880,502 | |||||||||||||||||||||||||
| Entertainment – 0.0% | ||||||||||||||||||||||||||||
| 24 | CDS U.S. Intermediate Holdings, Inc. Term Loan (WI/DD) |
TBD | TBD | TBD | TBD | N/R | 22,761 | |||||||||||||||||||||
| Health Care Equipment & Supplies – 1.2% | ||||||||||||||||||||||||||||
| 902 | Greatbatch Ltd., New Term Loan B |
3.500% | 1-Month LIBOR | 2.500% | 10/27/22 | B+ | 902,332 | |||||||||||||||||||||
28
| Principal Amount (000) |
Description (1) | Coupon (3) | Reference Rate (3) |
Spread (3) | Maturity (4) | Ratings (2) | Value | |||||||||||||||||||||
| Health Care Providers & Services – 4.6% | ||||||||||||||||||||||||||||
| $ | 400 | ATI Holdings Acquisition, Inc., Term Loan (WI/DD) |
TBD | TBD | TBD | TBD | B2 | $ | 393,752 | |||||||||||||||||||
| 493 | ExamWorks Group, Inc., Term Loan |
4.250% | 3-Month LIBOR | 3.250% | 7/27/23 | B1 | 493,781 | |||||||||||||||||||||
| 994 | Onex TSG Intermediate Corp, Term Loan, First Lien |
5.000% | 3-Month LIBOR | 4.000% | 7/29/22 | B1 | 983,355 | |||||||||||||||||||||
| 884 | Pharmaceutical Product Development, Inc., Term Loan B |
3.500% | 1-Month LIBOR | 2.500% | 8/18/22 | Ba2 | 884,631 | |||||||||||||||||||||
| 980 | Team Health, Inc., Initial Term Loan |
3.750% | 1-Month LIBOR | 2.750% | 2/06/24 | B | 877,310 | |||||||||||||||||||||
| 3,751 | Total Health Care Providers & Services |
|
3,632,829 | |||||||||||||||||||||||||
| Health Care Technology – 1.5% | ||||||||||||||||||||||||||||
| 645 | Emdeon, Inc., Term Loan |
3.500% | 3-Month LIBOR | 2.500% | 3/01/24 | B+ | 642,815 | |||||||||||||||||||||
| 21 | Emdeon, Inc., Term Loan |
3.500% | 1-Month LIBOR | 2.500% | 3/01/24 | B+ | 20,929 | |||||||||||||||||||||
| 500 | IQVIA Inc., Term Loan B1 |
1.897% | 1-Month LIBOR | 1.750% | 3/07/24 | BBB– | 498,312 | |||||||||||||||||||||
| 1,166 | Total Health Care Technology |
|
1,162,056 | |||||||||||||||||||||||||
| Hotels, Restaurants & Leisure – 2.0% | ||||||||||||||||||||||||||||
| 714 | Boyd Gaming Corporation, Refinancing Term Loan B |
2.352% | 1-Week LIBOR | 2.250% | 9/15/23 | BB– | 709,441 | |||||||||||||||||||||
| 83 | CDS U.S. Intermediate Holdings, Inc. Term Loan, Second Lien |
1.205% | 3-Month LIBOR | 1.000% | 11/24/27 | CCC | 69,712 | |||||||||||||||||||||
| 95 | CDS U.S. Intermediate Holdings, Inc. Term Loan, First Lien |
6.224% | 3-Month LIBOR | 6.000% | 11/24/25 | B | 90,866 | |||||||||||||||||||||
| 296 | CityCenter Holdings LLC, Term Loan B |
2.397% | 1-Month LIBOR | 2.250% | 4/18/24 | B+ | 292,771 | |||||||||||||||||||||
| 490 | Travel Leaders Group, LLC, Term Loan B |
4.147% | 1-Month LIBOR | 4.000% | 1/25/24 | CCC | 434,831 | |||||||||||||||||||||
| 1,678 | Total Hotels, Restaurants & Leisure |
|
1,597,621 | |||||||||||||||||||||||||
| Household Durables – 0.5% | ||||||||||||||||||||||||||||
| 387 | Wilsonart LLC, Term Loan B |
4.250% | 3-Month LIBOR | 3.250% | 12/19/23 | B+ | 389,606 | |||||||||||||||||||||
| Household Products – 0.2% | ||||||||||||||||||||||||||||
| 188 | Reynolds Group Holdings, Inc., Term Loan, First Lien |
2.897% | 1-Month LIBOR | 2.750% | 2/05/23 | B+ | 187,867 | |||||||||||||||||||||
| Independent Power & Renewable Electricity Producers – 0.3% | ||||||||||||||||||||||||||||
| 194 | Calpine Corporation, Term Loan B5 |
2.397% | 1-Month LIBOR | 2.250% | 1/15/24 | BB+ | 193,280 | |||||||||||||||||||||
| Insurance – 1.1% | ||||||||||||||||||||||||||||
| 266 | Asurion LLC, Term Loan B6 |
3.147% | 1-Month LIBOR | 3.000% | 11/03/23 | Ba3 | 264,027 | |||||||||||||||||||||
| 637 | USI Holdings Corporation, Initial Term Loan |
3.254% | 3-Month LIBOR | 3.000% | 5/16/24 | B | 628,808 | |||||||||||||||||||||
| 903 | Total Insurance |
|
892,835 | |||||||||||||||||||||||||
| Interactive Media & Services – 1.3% | ||||||||||||||||||||||||||||
| 996 | Rackspace Hosting, Inc., Refinancing Term Loan B, First Lien |
4.000% | 3-Month LIBOR | 3.000% | 11/03/23 | B+ | 996,255 | |||||||||||||||||||||
| IT Services – 1.4% | ||||||||||||||||||||||||||||
| 250 | Conduent, Inc., Term Loan B (WI/DD) |
TBD | TBD | TBD | TBD | BB– | 246,251 | |||||||||||||||||||||
| 250 | Syniverse Holdings, Inc., Term Loan C (WI/DD) |
TBD | TBD | TBD | TBD | CCC+ | 227,621 | |||||||||||||||||||||
| 638 | Tempo Acquisition LLC, Term Loan B |
2.896% | 1-Month LIBOR | 2.750% | 5/01/24 | B1 | 635,260 | |||||||||||||||||||||
| 1,138 | Total IT Services |
|
1,109,132 | |||||||||||||||||||||||||
29
| JHAA | Nuveen Corporate Income 2023 Target Term Fund (continued) | |
| Portfolio of Investments December 31, 2020 | ||
| Principal Amount (000) |
Description (1) | Coupon (3) | Reference Rate (3) |
Spread (3) | Maturity (4) | Ratings (2) | Value | |||||||||||||||||||||
| Machinery – 1.5% | ||||||||||||||||||||||||||||
| $ | 445 | Blount International, Inc., Term Loan B |
4.750% | 1-Month LIBOR | 3.750% | 4/12/23 | B1 | $ | 448,795 | |||||||||||||||||||
| 686 | Gates Global LLC, Term Loan B |
3.750% | 1-Month LIBOR | 2.750% | 4/01/24 | B1 | 685,044 | |||||||||||||||||||||
| 1,131 | Total Machinery |
|
1,133,839 | |||||||||||||||||||||||||
| Media – 2.5% | ||||||||||||||||||||||||||||
| 948 | Array Canada Inc., Term Loan |
6.000% | 3-Month LIBOR | 5.000% | 2/10/23 | Caa1 | 660,636 | |||||||||||||||||||||
| 750 | Gray Television, Inc., Term Loan B2 |
2.405% | 3-Month LIBOR | 2.250% | 2/07/24 | BB+ | 745,380 | |||||||||||||||||||||
| 564 | Nexstar Broadcasting, Inc., Term Loan B3 |
2.395% | 1-Month LIBOR | 2.250% | 1/17/24 | BB | 560,566 | |||||||||||||||||||||
| 2,262 | Total Media |
|
1,966,582 | |||||||||||||||||||||||||
| Pharmaceuticals – 0.8% | ||||||||||||||||||||||||||||
| 593 | Endo Health Solutions, Inc., Term Loan B |
5.000% | 3-Month LIBOR | 4.250% | 4/29/24 | B+ | 585,548 | |||||||||||||||||||||
| Professional Services – 1.4% | ||||||||||||||||||||||||||||
| 637 | AlixPartners, LLP, Term Loan B |
2.647% | 1-Month LIBOR | 2.500% | 4/04/24 | B+ | 631,149 | |||||||||||||||||||||
| 488 | CHG Healthcare Services Inc., Term Loan B, First Lien |
4.000% | 3-Month LIBOR | 3.000% | 6/07/23 | B | 485,816 | |||||||||||||||||||||
| 1,125 | Total Professional Services |
|
1,116,965 | |||||||||||||||||||||||||
| Road & Rail – 2.9% | ||||||||||||||||||||||||||||
| 1,227 | Hertz Corporation, Term Loan B1, (5) |
3.500% | 1-Month LIBOR | 2.750% | 6/30/23 | N/R | 1,209,826 | |||||||||||||||||||||
| 554 | Hertz Corporation, The DIP Term Loan (6) |
3.750% | N/A | 3.750% | 12/31/21 | N/R | 569,341 | |||||||||||||||||||||
| 99 | Hertz Corporation, The DIP Term Loan |
8.250% | 1-Month LIBOR | 7.250% | 12/31/21 | N/R | 101,741 | |||||||||||||||||||||
| 323 | Kenan Advantage Group Holdings Corp., Initial U.S. Term Loan (WI/DD) |
TBD | TBD | TBD | TBD | B– | 321,112 | |||||||||||||||||||||
| 77 | Kenan Advantage Group Holdings Corp., Initial Canadian Term Loan (WI/DD) |
TBD | TBD | TBD | TBD | B– | 76,361 | |||||||||||||||||||||
| 2,280 | Total Road & Rail |
|
2,278,381 | |||||||||||||||||||||||||
| Software – 1.1% | ||||||||||||||||||||||||||||
| 759 | nThrive, Inc., Term Loan, First Lien |
5.500% | 1-Month LIBOR | 4.500% | 10/20/22 | CCC+ | 756,017 | |||||||||||||||||||||
| 83 | Avast Software B.V., Term Loan B |
3.250% | 3-Month LIBOR | 2.250% | 9/30/23 | Ba2 | 83,024 | |||||||||||||||||||||
| 842 | Total Software |
|
839,041 | |||||||||||||||||||||||||
| Specialty Retail – 2.8% | ||||||||||||||||||||||||||||
| 250 | Jo-Ann Stores, Inc., Term Loan B (WI/DD) |
TBD | TBD | TBD | TBD | B– | 241,980 | |||||||||||||||||||||
| 500 | Petco Animal Supplies, Inc., Term Loan B1 (WI/DD) |
TBD | TBD | TBD | TBD | B3 | 480,140 | |||||||||||||||||||||
| 1,451 | Petsmart Inc., Term Loan B, First Lien |
4.500% | 3-Month LIBOR | 3.500% | 3/11/22 | B1 | 1,454,717 | |||||||||||||||||||||
| 2,201 | Total Specialty Retail |
|
2,176,837 | |||||||||||||||||||||||||
| Technology Hardware, Storage & Peripherals – 0.6% | ||||||||||||||||||||||||||||
| 497 | Diebold, Inc., Term Loan B |
2.938% | 1-Month LIBOR | 2.750% | 11/06/23 | B– | 487,388 | |||||||||||||||||||||
| 2 | Diebold, Inc., Term Loan B |
3.004% | 3-Month LIBOR | 2.750% | 11/06/23 | B– | 1,961 | |||||||||||||||||||||
| 499 | Total Technology Hardware, Storage & Peripherals |
|
489,349 | |||||||||||||||||||||||||
| Textiles, Apparel & Luxury Goods – 0.5% | ||||||||||||||||||||||||||||
| 396 | Strategic Partners Acquisition Corp., Term Loan |
6.000% | PRIME | 2.750% | 6/30/23 | B | 394,949 | |||||||||||||||||||||
| $ | 32,116 | Total Variable Rate Senior Loan Interests (cost $31,722,517) |
|
31,445,504 | ||||||||||||||||||||||||
30
| Principal Amount (000) |
Description (1) | Coupon | Maturity | Ratings (2) | Value | |||||||||||||||||||||||
| CONVERTIBLE BONDS – 2.8% (2.1% of Total Investments) |
| |||||||||||||||||||||||||||
| Media – 1.5% | ||||||||||||||||||||||||||||
| $ | 1,275 | DISH Network Corp |
2.375% | 3/15/24 | B1 | $ | 1,188,210 | |||||||||||||||||||||
| Mortgage Real Estate Investment Trust – 1.3% | ||||||||||||||||||||||||||||
| 500 | Blackstone Mortgage Trust Inc |
4.750% | 3/15/23 | N/R | 497,750 | |||||||||||||||||||||||
| 500 | Starwood Property Trust Inc |
|
4.375% | 4/01/23 | B+ | 495,387 | ||||||||||||||||||||||
| 1,000 | Total Mortgage Real Estate Investment Trust |
|
993,137 | |||||||||||||||||||||||||
| $ | 2,275 | Total Convertible Bonds (cost $2,124,610) |
|
2,181,347 | ||||||||||||||||||||||||
| Share | Description (1) | Value | ||||||||||||||||||||||||||
| COMMON STOCKS – 0.1% (0.1% of Total Investments) |
| |||||||||||||||||||||||||||
| Hotels, Restaurants & Leisure – 0.1% | ||||||||||||||||||||||||||||
| 31,400 | Cirque Du Soleil Holding USA Newco Inc, (7), (8) |
109,900 | ||||||||||||||||||||||||||
| Total Common Stocks (cost $160,347) |
|
109,900 | ||||||||||||||||||||||||||
| Total Long-Term Investments (cost $93,218,988) |
|
96,076,436 | ||||||||||||||||||||||||||
| Principal Amount (000) |
Description (1) | Coupon | Maturity | Value | ||||||||||||||||||||||||
| SHORT-TERM INVESTMENTS – 9.7% (7.3% of Total Investments) |
| |||||||||||||||||||||||||||
| REPURCHASE AGREEMENTS – 9.7% (7.3% of Total Investments) | ||||||||||||||||||||||||||||
| $ | 7,597 | Repurchase Agreement with Fixed Income Clearing Corporation, dated 12/31/20, repurchase price $7,596,722, collateralized by $7,751,400, U.S. Treasury Bill, 0.000%, due 5/11/21, value $7,748,718 |
|
0.000% | 1/04/21 | $ | 7,596,722 | |||||||||||||||||||||
| Total Short-Term Investments (cost $7,596,722) |
|
7,596,722 | ||||||||||||||||||||||||||
| Total Investments (cost $100,815,710) – 132.0% |
|
103,673,158 | ||||||||||||||||||||||||||
| Borrowings – (31.2)% (9), (10) |
|
(24,525,000 | ) | |||||||||||||||||||||||||
| Other Assets Less Liabilities – (0.8)% |
|
(624,573 | ) | |||||||||||||||||||||||||
| Net Assets Applicable to Common Shares – 100% |
|
$ | 78,523,585 | |||||||||||||||||||||||||
31
| JHAA | Nuveen Corporate Income 2023 Target Term Fund (continued) | |
| Portfolio of Investments December 31, 2020 | ||
For Fund portfolio compliance purposes, the Fund’s industry classifications refer to any one or more of the industry sub-classifications used by one or more widely recognized market indexes or ratings group indexes, and/or as defined by Fund management. This definition may not apply for purposes of this report, which may combine industry sub-classifications into sectors for reporting ease.
| (1) | All percentages shown in the Portfolio of Investments are based on net assets applicable to common shares unless otherwise noted. |
| (2) | For financial reporting purposes, the ratings disclosed are the highest of Standard & Poor’s Group (“Standard & Poor’s”), Moody’s Investors Service, Inc. (“Moody’s”) or Fitch, Inc. (“Fitch”) rating. This treatment of split-rated securities may differ from that used for other purposes, such as for Fund investment policies. Ratings below BBB by Standard & Poor’s, Baa by Moody’s or BBB by Fitch are considered to be below investment grade. Holdings designated N/R are not rated by any of these national rating agencies. Ratings are not covered by the report of independent registered public accounting firm. |
| (3) | Senior loans generally pay interest at rates which are periodically adjusted by reference to a base short-term, floating lending rate (Reference Rate) plus an assigned fixed rate (Spread). These floating lending rates are generally (i) the lending rate referenced by the London Inter-Bank Offered Rate (“LIBOR”), or (ii) the prime rate offered by one or more major United States banks. Senior loans may be considered restricted in that the Fund ordinarily is contractually obligated to receive approval from the agent bank and/or borrower prior to the disposition of a senior loan. The rate shown is the coupon as of the end of the reporting period. |
| (4) | Senior loans generally are subject to mandatory and/or optional prepayment. Because of these mandatory prepayment conditions and because there may be significant economic incentives for a borrower to prepay, prepayments of senior loans may occur. As a result, the actual remaining maturity of senior loans held may be substantially less than the stated maturities shown. |
| (5) | Defaulted security. A security whose issuer has failed to fully pay principal and/or interest when due, or is under the protection of bankruptcy. |
| (6) | Investment, or portion of investment, represents an outstanding unfunded senior loan commitment. See note to Financial Statements, Note 4 – Portfolio Securities and Investments in Derivatives for more information. |
| (7) | Non-income producing; issuer has not declared an ex-dividend date within the past twelve months. |
| (8) | For fair value measurement disclosure purposes, investment classified as Level 2. See Notes to Financial Statements, Note 3 – Investment Valuation and Fair Value Measurements for more information. |
| (9) | Borrowings as a percentage of Total Investments is 23.7%. |
| (10) | The Fund may pledge up to 100% of its eligible investments (excluding any investments separately pledged as collateral for specific investments in derivatives, when applicable) in the Portfolio of Investments as collateral for borrowings. |
| 144A | Investment is exempt from registration under Rule 144A of the Securities Act of 1933, as amended. These investments may only be resold in transactions exempt from registration, which are normally those transactions with qualified institutional buyers. |
| DD1 | Portion of investment purchased on a delayed delivery basis. |
| LIBOR | London Inter-Bank Offered Rate |
| N/A | Not Applicable |
| TBD | Senior Loan purchased on a when-issued or delayed-delivery basis. Certain details associated with this purchase are not known prior to the settlement date of the transaction. In addition, senior loans typically trade without accrued interest and therefore a coupon rate is not available prior to settlement. At settlement, if still unknown, the borrower or counterparty will provide the Fund with the final coupon rate and maturity date. |
| WI/DD | Purchased on a when-issued or delayed delivery basis. |
See accompanying notes to financial statements.
32
Statement of Assets and Liabilities
December 31, 2020
| JHB | JHAA | |||||||
| Assets |
||||||||
| Long-term investments, at value (cost $396,412,065 and $93,218,988, respectively) |
$ | 393,719,030 | $ | 96,076,436 | ||||
| Short-term investments, at value (cost approximates value) |
— | 7,596,722 | ||||||
| Cash |
115,858,777 | 121,472 | ||||||
| Receivable for: |
||||||||
| Interest |
5,606,343 | 1,027,531 | ||||||
| Investments sold |
14,848,124 | 2,925,162 | ||||||
| Reclaims |
3,945 | — | ||||||
| Other assets |
21,352 | 289 | ||||||
| Total assets |
530,057,571 | 107,747,612 | ||||||
| Liabilities |
||||||||
| Borrowings |
— | 24,525,000 | ||||||
| Payable for: |
||||||||
| Investments purchased – when-issued/delayed-delivery settlement |
— | 4,017,591 | ||||||
| Unfunded senior loans |
— | 554,048 | ||||||
| Accrued expenses: |
||||||||
| Custodian fees |
62,395 | 30,550 | ||||||
| Interest |
— | 2,209 | ||||||
| Management fees |
293,642 | 57,026 | ||||||
| Shareholder reporting expenses |
41,138 | 6,253 | ||||||
| Trustees fees |
24,672 | 633 | ||||||
| Other |
53,030 | 30,717 | ||||||
| Total liabilities |
474,877 | 29,224,027 | ||||||
| Net assets applicable to common shares outstanding |
$ | 529,582,694 | $ | 78,523,585 | ||||
| Common shares outstanding |
55,900,049 | 7,825,459 | ||||||
| Net asset value (“NAV”) per common share outstanding |
$ | 9.47 | $ | 10.03 | ||||
| Net assets applicable to common shares consist of: |
||||||||
| Common shares, $0.01 par value per share |
$ | 559,000 | $ | 78,255 | ||||
| Paid-in-surplus |
548,650,897 | 76,987,825 | ||||||
| Total distributable earnings |
(19,627,203 | ) | 1,457,505 | |||||
| Net assets applicable to common shares |
$ | 529,582,694 | $ | 78,523,585 | ||||
| Authorized common shares |
Unlimited | Unlimited | ||||||
See accompanying notes to financial statements.
33
Year Ended December 31, 2020
| JHB | JHAA | |||||||
| Investment Income |
$ | 24,384,303 | $ | 5,287,925 | ||||
| Expenses |
||||||||
| Management fees |
3,796,252 | 662,767 | ||||||
| Interest expense |
1,070,422 | 351,333 | ||||||
| Custodian fees |
86,488 | 61,363 | ||||||
| Trustees fees |
16,229 | 2,826 | ||||||
| Professional fees |
62,592 | 45,171 | ||||||
| Shareholder reporting expenses |
82,127 | 18,334 | ||||||
| Shareholder servicing agent fees |
159 | 181 | ||||||
| Stock exchange listing fees |
15,250 | 6,658 | ||||||
| Investor relations expenses |
31,866 | 5,243 | ||||||
| Other |
19,570 | 23,851 | ||||||
| Total expenses |
5,180,955 | 1,177,727 | ||||||
| Net investment income (loss) |
19,203,348 | 4,110,198 | ||||||
| Realized and Unrealized Gain (Loss) |
||||||||
| Net realized gain (loss) from investments and foreign currency |
(17,660,517 | ) | (2,192,600 | ) | ||||
| Change in net unrealized appreciation (depreciation) of investments and foreign currency |
(7,892,389 | ) | (224,577 | ) | ||||
| Net realized and unrealized gain (loss) |
(25,552,906 | ) | (2,417,177 | ) | ||||
| Net increase (decrease) in net assets applicable to common shares from operations |
$ | (6,349,558 | ) | $ | 1,693,021 | |||
See accompanying notes to financial statements.
34
Statement of Changes in Net Assets
| JHB | JHAA | |||||||||||||||
| Year Ended |
Year Ended 12/31/19 |
Year Ended |
Year Ended 12/31/19 |
|||||||||||||
| Operations |
||||||||||||||||
| Net investment income (loss) |
$ | 19,203,348 | $ | 27,472,182 | $ | 4,110,198 | $ | 4,846,976 | ||||||||
| Net realized gain (loss) from investments and foreign currency |
(17,660,517 | ) | (2,158,045 | ) | (2,192,600 | ) | 544,376 | |||||||||
| Change in net unrealized appreciation (depreciation) of investments and foreign currency |
(7,892,389 | ) | 29,409,255 | (224,577 | ) | 3,082,025 | ||||||||||
| Net increase (decrease) in net assets applicable to common shares from operations |
(6,349,558 | ) | 54,723,392 | 1,693,021 | 8,473,377 | |||||||||||
| Distributions to Common Shareholders |
||||||||||||||||
| Dividends |
(21,381,466 | ) | (28,383,686 | ) | (4,267,771 | ) | (4,469,676 | ) | ||||||||
| Decrease in net assets applicable to common shares from distributions to common shares |
(21,381,466 | ) | (28,383,686 | ) | (4,267,771 | ) | (4,469,676 | ) | ||||||||
| Capital Share Transactions |
||||||||||||||||
| Proceeds from common sale of shares, net of offering costs |
— | — | — | 7,917,202 | ||||||||||||
| Net proceeds from common shares issued to shareholders due to reinvestment of distributions |
141,156 | 141,179 | 70,204 | 65,058 | ||||||||||||
| Net increase (decrease) in net assets applicable to common shares from capital share transactions |
141,156 | 141,179 | 70,204 | 7,982,260 | ||||||||||||
| Net increase (decrease) in net assets applicable to common shares |
(27,589,868 | ) | 26,480,885 | (2,504,546 | ) | 11,985,961 | ||||||||||
| Net assets applicable to common shares at the beginning of period |
557,172,562 | 530,691,677 | 81,028,131 | 69,042,170 | ||||||||||||
| Net assets applicable to common shares at the end of period |
$ | 529,582,694 | $ | 557,172,562 | $ | 78,523,585 | $ | 81,028,131 | ||||||||
See accompanying notes to financial statements.
35
Year Ended December 31, 2020
| JHB | JHAA | |||||||
| Cash Flows from Operating Activities: |
||||||||
| Net Increase (Decrease) in Net Assets Applicable to Common Shares from Operations |
$ | (6,349,558 | ) | $ | 1,693,021 | |||
| Adjustments to reconcile the net increase (decrease) in net assets applicable to common shares from operations to net cash provided by (used in) operating activities: |
||||||||
| Purchases of investments |
(217,553,879 | ) | (43,054,249 | ) | ||||
| Proceeds from sales and maturities of investments |
429,323,075 | 46,286,794 | ||||||
| Proceeds from (Purchase of) short-term investments, net |
— | (47,157 | ) | |||||
| Taxes paid |
(246,423 | ) | (28,554 | ) | ||||
| Amortization (Accretion) of premiums and discounts, net |
3,190,518 | (349,526 | ) | |||||
| (Increase) Decrease in: |
||||||||
| Receivable for interest |
4,070,819 | 20,860 | ||||||
| Receivable for investments sold |
13,356,302 | (2,905,282 | ) | |||||
| Other assets |
(334 | ) | (253 | ) | ||||
| Increase (Decrease) in: |
||||||||
| Payable investments purchased – regular settlement |
(1,069,709 | ) | — | |||||
| Payable investments purchased – when-issued/delayed-delivery settlement |
— | 2,713,341 | ||||||
| Payable for unfunded senior loans |
— | 554,048 | ||||||
| Accrued custodian fees |
7,248 | 21,586 | ||||||
| Accrued interest |
(9,264 | ) | (2,645 | ) | ||||
| Accrued management fees |
(120,509 | ) | (3,197 | ) | ||||
| Accrued shareholder reporting expenses |
2,540 | (624 | ) | |||||
| Accrued Trustees fees |
(3,967 | ) | (658 | ) | ||||
| Accrued other expenses |
(10,436 | ) | (5,643 | ) | ||||
| Net realized (gain) loss from investments and foreign currency |
17,660,517 | 2,192,600 | ||||||
| Change in net unrealized appreciation (depreciation) of investments and foreign currency |
7,892,389 | 224,577 | ||||||
| Net cash provided by (used in) operating activities |
250,139,329 | 7,309,039 | ||||||
| Cash Flow from Financing Activities: |
||||||||
| (Repayments of) reverse repurchase agreements |
— | (490,000 | ) | |||||
| (Repayments of) borrowings |
(192,000,000 | ) | (2,500,000 | ) | ||||
| Cash distributions paid to common shareholders |
(21,240,310 | ) | (4,197,567 | ) | ||||
| Net cash provided by (used in) financing activities |
(213,240,310 | ) | (7,187,567 | ) | ||||
| Net Increase (Decrease) in Cash |
36,899,019 | 121,472 | ||||||
| Cash at the beginning of period |
78,959,758 | — | ||||||
| Cash at the end of period |
115,858,777 | 121,472 | ||||||
| Supplemental Disclosure of Cash Flow Information | JHB | JHAA | ||||||
| Cash paid for interest (excluding costs) |
$ | 1,079,686 | $ | 353,978 | ||||
| Non-cash financing activities not included herein consists of reinvestments of common share distributions |
141,156 | 70,204 | ||||||
See accompanying notes to financial statements.
36
THIS PAGE INTENTIONALLY LEFT BLANK
37
Selected data for a share outstanding throughout each period:
|
|
||||||||||||||||||||||||||||||||||||||||||||||||
| Investment Operations | Less Distributions to Common Shareholders |
Common Share | ||||||||||||||||||||||||||||||||||||||||||||||
| Beginning Common Share NAV |
Net Investment Income (Loss)(a) |
Net Realized/ Unrealized Gain (Loss) |
Total | From Net Investment Income |
From Accumulated Net Realized Gains |
Return of Capital |
Total | Offering Costs |
Premium from Sold Shelf Offering |
Ending NAV |
Ending Share Price |
|||||||||||||||||||||||||||||||||||||
| JHB |
|
|||||||||||||||||||||||||||||||||||||||||||||||
| Year Ended 12/31: |
|
|||||||||||||||||||||||||||||||||||||||||||||||
| 2020 |
$ | 9.97 | $ | 0.34 | $ | (0.46 | ) | $ | (0.12 | ) | $ | (0.38 | ) | $ | — | $ | — | $ | (0.38 | ) | $ | — | $ | — | $ | 9.47 | $ | 9.20 | ||||||||||||||||||||
| 2019 |
9.50 | 0.49 | 0.49 | 0.98 | (0.51 | ) | — | * | — | (0.51 | ) | — | — | 9.97 | 10.01 | |||||||||||||||||||||||||||||||||
| 2018 |
10.12 | 0.59 | (0.62 | ) | (0.03 | ) | (0.57 | ) | (0.02 | ) | — | (0.59 | ) | — | — | 9.50 | 8.90 | |||||||||||||||||||||||||||||||
| 2017 |
9.92 | 0.64 | 0.16 | 0.80 | (0.58 | ) | (0.02 | ) | — | (0.60 | ) | — | — | 10.12 | 9.96 | |||||||||||||||||||||||||||||||||
| 2016(b) |
9.85 | 0.17 | 0.06 | 0.23 | (0.14 | ) | (0.01 | ) | — | (0.15 | ) | (0.01 | ) | — | 9.92 | 9.88 | ||||||||||||||||||||||||||||||||
| JHAA |
|
|||||||||||||||||||||||||||||||||||||||||||||||
| Year Ended 12/31: |
|
|||||||||||||||||||||||||||||||||||||||||||||||
| 2020 |
10.36 | 0.53 | (0.31 | ) | 0.22 | (0.55 | ) | — | — | (0.55 | ) | — | — | 10.03 | 9.58 | |||||||||||||||||||||||||||||||||
| 2019 |
9.85 | 0.63 | 0.45 | 1.08 | (0.57 | ) | — | — | (0.57 | ) | — | — | 10.36 | 10.85 | ||||||||||||||||||||||||||||||||||
| 2018(f) |
9.88 | (0.01 | ) | — | (0.01 | ) | — | — | — | — | (0.02 | ) | — | 9.85 | 10.85 | |||||||||||||||||||||||||||||||||
| Borrowings at the End of Period | ||||||||
| Aggregate Amount Outstanding (000) |
Asset Coverage Per $1,000 |
|||||||
| JHB |
| |||||||
| Year Ended 12/31: |
| |||||||
| 2020 |
$ | — | $ | — | ||||
| 2019 |
192,000 | 3,902 | ||||||
| 2018 |
190,000 | 3,793 | ||||||
| 2017 |
190,000 | 3,976 | ||||||
| 2016(b) |
190,000 | 3,915 | ||||||
| JHAA |
| |||||||
| Year Ended 12/31: |
||||||||
| 2020 |
24,525 | 4,202 | ||||||
| 2019 |
27,025 | 3,998 | ||||||
38
| Common Share Supplemental Data/ Ratios Applicable to Common Shares |
||||||||||||||||||||||
| Common Shares Total Returns |
Ratios to Average Net Assets(d) | |||||||||||||||||||||
| Based |
Based on Share Price(c) |
Ending Net Assets (000) |
Expenses | Net |
Portfolio Turnover Rate(e) |
|||||||||||||||||
| (1.07 | )% | (4.17 | )% | $ | 529,583 | 0.99 | % | 3.65 | % | 45 | % | |||||||||||
| 10.44 | 18.39 | 557,173 | 1.98 | 4.96 | 41 | |||||||||||||||||
| (0.43 | ) | (4.99 | ) | 530,692 | 1.86 | 5.94 | 27 | |||||||||||||||
| 8.22 | 6.98 | 565,385 | 1.57 | 6.37 | 37 | |||||||||||||||||
| 2.26 | 0.32 | 553,912 | 1.17 | ** | 4.79 | ** | 6 | |||||||||||||||
| 2.51 | (6.43 | ) | 78,524 | 1.57 | 5.49 | 47 | ||||||||||||||||
| 11.20 | 5.71 | 81,028 | 2.03 | 6.13 | 34 | |||||||||||||||||
| (0.30 | ) | 8.50 | 69,042 | 1.74 | ** | (1.74 | )** | — | ||||||||||||||
| (a) | Per share Net Investment Income (Loss) is calculated using the average daily shares method. |
| (b) | For the period August 23, 2016 (commencement of operations) through December 31, 2016. |
| (c) | Total Return Based on Common Share NAV is the combination of changes in common share NAV, reinvested dividend income at NAV and reinvested capital gains distributions at NAV, if any. The last dividend declared in the period, which is typically paid on the first business day of the following month, is assumed to be reinvested at the ending NAV. The actual reinvest price for the last dividend declared in the period may often be based on the Fund’s market price (and not its NAV), and therefore may be different from the price used in the calculation. Total returns are not annualized. |
Total Return Based on Common Share Price is the combination of changes in the market price per share and the effect of reinvested dividend income and reinvested capital gains distributions, if any, at the average price paid per share at the time of reinvestment. The last dividend declared in the period, which is typically paid on the first business day of the following month, is assumed to be reinvested at the ending market price. The actual reinvestment for the last dividend declared in the period may take place over several days, and in some instances may not be based on the market price, so the actual reinvestment price may be different from the price used in the calculation. Total returns are not annualized.
| (d) | • | Net Investment Income (Loss) ratios reflect income earned and expenses incurred on assets attributable to borrowings and/or reverse repurchase agreements, where applicable, (as described in Note 8 – Fund Leverage), where applicable. | ||
| • | Each ratio includes the effect of all interest expense paid and other costs related to borrowings and/or reverse repurchase agreements, where applicable, as follows: |
| (e) | Portfolio Turnover Rate is calculated based on the lesser of long-term purchases or sales (as disclosed in Note 4 – Portfolio Securities and Investments in Derivatives) divided by the average long-term market value during the period. |
| (f) | For the period December 18, 2018 (commencement of operations) through December 31, 2018. |
| * | Rounds to less than $0.01 per share. |
| ** | Annualized. |
39
1. General Information
Fund Information
The funds covered in this report and their corresponding New York Stock Exchange (“NYSE”) symbols are as follows (each a “Fund” and collectively, the “Funds”):
| • | Nuveen Corporate Income November 2021 Target Term Fund (formerly Nuveen High Income November 2021 Target Term Fund) (JHB) |
| • | Nuveen Corporate Income 2023 Target Term Fund (formerly Nuveen High Income 2023 Target Term Fund) (JHAA) |
The Funds are registered under the Investment Company Act of 1940 (the “1940 Act”), as amended, as diversified, closed-end management investment companies. JHB and JHAA were organized as a Massachusetts business trust on July 13, 2015 and September 20, 2018, respectively.
Each Fund seeks to provide a high level of current income and return its original net asset value (“NAV”) per share on or about its termination date as noted in the following table.
| Original NAV Per Share |
Termination Date | |||||||
| JHB |
$ | 9.85 | November 1, 2021 | |||||
| JHAA |
$ | 9.88 | December 1, 2023 | |||||
The end of the reporting period for the Funds is December 31, 2020, and the period covered by these Notes to Financial Statements is the fiscal year ended December 31, 2020 (the “current fiscal period”).
Investment Adviser and Sub-Adviser
The Funds’ investment adviser is Nuveen Fund Advisors, LLC (the “Adviser”), a subsidiary of Nuveen, LLC (“Nuveen”). Nuveen is the investment management arm of Teachers Insurance and Annuity Association of America (TIAA). The Adviser has overall responsibility for management of the Funds, oversees the management of the Funds’ portfolios, manages the Funds’ business affairs and provides certain clerical, bookkeeping and other administrative services, and, if necessary, asset allocation decisions. The Adviser has entered into sub-advisory agreements with Nuveen Asset Management, LLC, (the “Sub-Adviser”), a subsidiary of the Adviser, under which the Sub-Adviser manages the investment portfolios of the Funds.
Other Matters
The outbreak of the novel coronavirus (“COVID-19”) and subsequent global pandemic began significantly impacting the U.S. and global financial markets and economies during the calendar quarter ended March 31, 2020. The worldwide spread of COVID-19 has created significant uncertainty in the global economy. The duration and extent of COVID-19 over the long term cannot be reasonably estimated at this time. The ultimate impact of COVID-19 and the extent to which COVID-19 impacts the Funds’ normal course of business, results of operations, investments, and cash flows will depend on future developments, which are highly uncertain and difficult to predict. Management continues to monitor and evaluate this situation.
2. Significant Accounting Policies
The accompanying financial statements were prepared in accordance with accounting principles generally accepted in the United States of America (“U.S. GAAP”), which may require the use of estimates made by management and the evaluation of subsequent events. Actual results may differ from those estimates. Each Fund is an investment company and follows the accounting guidance in the Financial Accounting Standards Board (“FASB”) Accounting Standards Codification 946, Financial Services – Investment Companies. The NAV for financial reporting purposes may differ from the NAV for processing security and common share transactions. The NAV for financial reporting purposes includes security and common share transactions through the date of the report. Total return is computed based on the NAV used for processing security and common share transactions. The following is a summary of the significant accounting policies consistently followed by the Funds.
Compensation
The Funds pay no compensation directly to those of its trustees who are affiliated with the Adviser or to its officers, all of whom receive remuneration for their services to the Funds from the Adviser or its affiliates. The Funds’ Board of Trustees (the “Board”) has adopted a deferred compensation plan for independent trustees that enables trustees to elect to defer receipt of all or a portion of the annual compensation they are entitled to receive from certain Nuveen-advised funds. Under the plan, deferred amounts are treated as though equal dollar amounts had been invested in shares of select Nuveen-advised funds.
40
Distributions to Common Shareholders
Distributions to common shareholders are recorded on the ex-dividend date. The amount, character and timing of distributions are determined in accordance with federal income tax regulations, which may differ from U.S. GAAP.
In seeking to achieve its investment objectives, each Fund currently intends to set aside and retain in its net assets (and therefore its NAV) a portion of its net investment income, and possibly all or a portion of its gains. This will reduce the amounts otherwise available for distribution prior to the liquidation of the Funds, and the Funds may incur taxes on such retained amounts. Such retained income or gains, net of any taxes, would constitute a portion of the liquidating distribution returned to investors on or about the termination date.
Foreign Currency Transactions and Translation
To the extent that the Funds invest in securities and/or contracts that are denominated in a currency other than U.S. dollars, the Funds will be subject to currency risk, which is the risk that an increase in the U.S. dollar relative to the foreign currency will reduce returns or portfolio value. Generally, when the U.S. dollar rises in value against a foreign currency, the Funds’ investments denominated in that currency will lose value because its currency is worth fewer U.S. dollars; the opposite effect occurs if the U.S. dollar falls in relative value. Investments and other assets and liabilities denominated in foreign currencies are converted into U.S. dollars on a spot (i.e. cash) basis at the spot rate prevailing in the foreign currency exchange market at the time of valuation. Purchases and sales of investments and income denominated in foreign currencies are translated into U.S. dollars on the respective dates of such transactions.
The books and records of the Funds are maintained in U.S. dollars. Assets, including investments, and liabilities denominated in foreign currencies are translated into U.S. dollars at the end of each day. Purchases and sales of securities, income and expenses are translated into U.S. dollars at the prevailing exchange rate on the respective dates of the transactions.
Net realized foreign currency gains and losses resulting from changes in exchange rates associated with (i) foreign currency, (ii) investments and (iii) derivatives include foreign currency gains and losses between trade date and settlement date of the transactions, foreign currency transactions, and the difference between the amounts of interest and dividends recorded on the books of the Fund and the amounts actually received are recognized as a component of “Net realized gain (loss) from investments and foreign currency” on the Statement of Operations, when applicable.
The unrealized gains and losses resulting from changes in foreign currency exchange rates and changes in foreign exchange rates associated with (i) investments and (ii) other assets and liabilities are recognized as a component of “Change in net unrealized appreciation (depreciation) of investments and foreign currency” on the Statement of Operations, when applicable. The unrealized gains and losses resulting from changes in foreign exchange rates associated with investments in derivatives are recognized as a component of the respective derivative’s related “Change in net unrealized appreciation (depreciation)” on the Statement of Operations, when applicable.
As of the end of the reporting period, the Funds’ investments in non-U.S. securities were as follows:
| JHB | Value | % of Total Investments |
||||||
| Country: |
||||||||
| Germany |
$ | 14,821,224 | 3.8 | % | ||||
| Japan |
13,448,423 | 3.4 | ||||||
| Israel |
11,770,832 | 3.0 | ||||||
| Italy |
11,318,964 | 2.9 | ||||||
| Canada |
11,275,721 | 2.9 | ||||||
| Luxembourg |
11,254,650 | 2.9 | ||||||
| South Africa |
7,966,950 | 2.0 | ||||||
| China |
7,551,734 | 1.9 | ||||||
| Mexico |
7,216,940 | 1.8 | ||||||
| Other |
30,134,816 | 7.6 | ||||||
| Total non-U.S. securities |
$ | 126,760,254 | 32.2 | % | ||||
| JHAA | ||||||||
| Country: |
||||||||
| Canada |
$ | 3,678,441 | 3.6 | % | ||||
| Israel |
2,975,459 | 2.9 | ||||||
| Brazil |
2,318,773 | 2.2 | ||||||
| United Kingdom |
1,616,500 | 1.6 | ||||||
| United Arab Emirates |
1,587,906 | 1.5 | ||||||
| Zambia |
1,284,375 | 1.2 | ||||||
| Australia |
1,220,625 | 1.2 | ||||||
| Luxembourg |
1,190,640 | 1.2 | ||||||
| Mexico |
1,050,360 | 1.0 | ||||||
| Other |
5,384,601 | 5.1 | ||||||
| Total non-U.S. securities |
$ | 22,307,680 | 21.5 | % | ||||
41
Notes to Financial Statements (continued)
Indemnifications
Under the Funds’ organizational documents, their officers and trustees are indemnified against certain liabilities arising out of the performance of their duties to the Funds. In addition, in the normal course of business, the Funds enter into contracts that provide general indemnifications to other parties. The Funds’ maximum exposure under these arrangements is unknown as this would involve future claims that may be made against the Funds that have not yet occurred. However, the Funds have not had prior claims or losses pursuant to these contracts and expect the risk of loss to be remote.
Investments and Investment Income
Securities transactions are accounted for as of the trade date for financial reporting purposes. Trade date for senior and subordinated loans purchased in the “primary market” is considered the date on which the loan allocations are determined. Trade date for senior and subordinated loans purchased in the “secondary market” is the date on which the transaction is entered into. Realized gains and losses on securities transactions are based upon the specific identification method. Investment income is comprised of interest income, which is recorded on an accrual basis and includes accretion of discounts and amortization of premiums for financial reporting purposes. Investment income also reflects payment-in-kind (“PIK”) interest, fee income and paydown gains and losses, if any. PIK interest represents income received in the form of securities in lieu of cash. Fee income consists primarily of amendment fees. Amendment fees are earned as compensation for evaluating and accepting changes to an original senior loan agreement and are recognized when received.
Netting Agreements
In the ordinary course of business, the Funds may enter into transactions subject to enforceable master repurchase agreements, International Swaps and Derivatives Association, Inc. (ISDA) master agreements or other similar arrangements (“netting agreements”). Generally, the right to offset in netting agreements allows each Fund to offset certain securities and derivatives with a specific counterparty, when applicable, as well as any collateral received or delivered to that counterparty based on the terms of the agreements. Generally, each Fund manages its cash collateral and securities collateral on a counterparty basis.
The Funds’ investments subject to netting agreements as of the end of the reporting period, if any, are further described in Note 4 – Portfolio Securities and Investments in Derivatives.
New Accounting Pronouncements and Rule Issuances
Reference Rate Reform
In March 2020, FASB issued Accounting Standards Update (“ASU”) 2020-04, Reference Rate Reform: Facilitation of the Effects of Reference Rate Reform on Financial Reporting. The main objective of the new guidance is to provide relief to companies that will be impacted by the expected change in benchmark interest rates at the end of 2021, when participating banks will no longer be required to submit London Interbank Offered Rate (LIBOR) quotes by the UK Financial Conduct Authority (FCA). The new guidance allows companies to, provided the only change to existing contracts are a change to an approved benchmark interest rate, account for modifications as a continuance of the existing contract without additional analysis. For new and existing contracts, the Funds may elect to apply the optional expedients as of March 12, 2020 through December 31, 2022. Management has not yet elected to apply the optional expedients, but is currently assessing the impact of the ASU’s adoption to the Funds’ financial statements and various filings.
Securities and Exchange Commission (“SEC”) Adopts New Rules to Modernize Fund Valuation Framework
In December 2020, the SEC voted to adopt a new rule governing fund valuation practices. New Rule 2a-5 under the 1940 Act establishes requirements for determining fair value in good faith for purposes of the 1940 Act. Rule 2a-5 will permit fund boards to designate certain parties to perform fair value determinations, subject to board oversight and certain other conditions. Rule 2a-5 also defines when market quotations are “readily available” for purposes of Section 2(a)(41) of the 1940 Act, which requires a fund to fair value a security when market quotation are not readily available. The SEC also adopted new Rule 31a-4 under the 1940 Act, which sets forth the recordkeeping requirements associated with fair value determinations. Finally, the SEC is rescinding previously issued guidance on related issues, including the role of a board in determining fair value and the accounting and auditing of fund investments. Rule 2a-5 and Rule 31a-4 will become effective on March 8, 2021, with a compliance date of September 8, 2022. A fund may voluntarily comply with the rules after the effective date, and in advance of the compliance date, under certain conditions. Management is currently assessing the impact of these provisions on the Funds’ financial statements.
3. Investment Valuation and Fair Value Measurements
The Funds’ investments in securities are recorded at their estimated fair value utilizing valuation methods approved by the Board. Fair value is defined as the price that would be received upon selling an investment or transferring a liability in an orderly transaction to an independent buyer in the principal or most advantageous market for the investment. U.S. GAAP establishes the three-tier hierarchy which is used to maximize the use of observable market data and minimize the use of unobservable inputs and to establish classification of fair value measurements for disclosure purposes. Observable inputs reflect the assumptions market participants would use in pricing the asset or liability. Observable inputs are based on market data obtained from sources independent of the reporting entity. Unobservable inputs reflect management’s assumptions about the assumptions market participants would use in
42
pricing the asset or liability. Unobservable inputs are based on the best information available in the circumstances. The following is a summary of the three-tiered hierarchy of valuation input levels.
| Level 1 – | Inputs are unadjusted and prices are determined using quoted prices in active markets for identical securities. | |
| Level 2 – | Prices are determined using other significant observable inputs (including quoted prices for similar securities, interest rates, credit spreads, etc.). | |
| Level 3 – | Prices are determined using significant unobservable inputs (including management’s assumptions in determining the fair value of investments). |
A description of the valuation techniques applied to the Funds’ major classifications of assets and liabilities measured at fair value follows:
Equity securities and exchange-traded funds listed or traded on a national market or exchange are valued based on their sale price at the official close of business of such market or exchange on the valuation date. Foreign equity securities are valued at the last sale price or official closing price reported on the exchange where traded and converted to U.S. dollars at the prevailing rates of exchange on the date of valuation. To the extent these securities are actively traded and that valuation adjustments are not applied, they are generally classified as Level 1. If there is no official close of business, then the latest available sale price is utilized. If no sales are reported, then the mean of the latest available bid and ask prices is utilized and are generally classified as Level 2.
Prices of fixed-income securities are generally provided by an independent pricing service (“pricing service”) approved by the Board. The pricing service establishes a security’s fair value using methods that may include consideration of the following: yields or prices of investments of comparable quality, type of issue, coupon, maturity and rating, market quotes or indications of value from security dealers, evaluations of anticipated cash flows or collateral, general market conditions and other information and analysis, including the obligor’s credit characteristics considered relevant. In pricing certain securities, particularly less liquid and lower quality securities, the pricing service may consider information about a security, its issuer or market activity, provided by the Adviser. These securities are generally classified as Level 2.
For events affecting the value of foreign securities between the time when the exchange on which they are traded closes and the time when the Funds’ net assets are calculated, such securities will be valued at fair value in accordance with procedures adopted by the Board. These foreign securities are generally classified as Level 2.
Repurchase agreements are valued at contract amount plus accrued interest, which approximates market value. These securities are generally classified as Level 2.
Any portfolio security or derivative for which market quotations are not readily available or for which the above valuation procedures are deemed not to reflect fair value are valued at fair value, as determined in good faith using procedures approved by the Board. As a general principle, the fair value of a security would appear to be the amount that the owner might reasonably expect to receive for it in a current sale. A variety of factors may be considered in determining the fair value of such securities, which may include consideration of the following: yields or prices of investments of comparable quality, type of issue, coupon, maturity and rating, market quotes or indications of value from security dealers, evaluations of anticipated cash flows or collateral, general market conditions and other information and analysis, including the obligor’s credit characteristics considered relevant. To the extent the inputs are observable and timely, the values would be classified as Level 2 of the fair value hierarchy; otherwise they would be classified as Level 3.
The following table summarizes the market value of the Funds’ investments as of the end of the reporting period, based on the inputs used to value them:
| JHB | Level 1 | Level 2 | Level 3 | Total | ||||||||||||
| Long-Term Investments*: |
||||||||||||||||
| Corporate Bonds |
$ | — | $ | 364,424,645 | $ | — | $ | 364,424,645 | ||||||||
| Sovereign Debt |
— | 14,384,843 | — | 14,384,843 | ||||||||||||
| Variable Rate Senior Loan Interests |
— | 8,121,987 | — | 8,121,987 | ||||||||||||
| Convertible Bonds |
— | 6,787,555 | — | 6,787,555 | ||||||||||||
| Total |
$ | — | $ | 393,719,030 | $ | — | $ | 393,719,030 | ||||||||
| JHAA | ||||||||||||||||
| Long-Term Investments*: |
||||||||||||||||
| Corporate Bonds |
$ | — | $ | 62,339,685 | $ | — | $ | 62,339,685 | ||||||||
| Variable Rate Senior Loan Interests |
— | 31,445,504 | — | 31,445,504 | ||||||||||||
| Convertible Bonds |
— | 2,181,347 | — | 2,181,347 | ||||||||||||
| Common Stocks |
— | 109,900 | ** | — | 109,900 | |||||||||||
| Short-Term Investments: |
||||||||||||||||
| Repurchase Agreements |
— | 7,596,722 | — | 7,596,722 | ||||||||||||
| Total |
$ | — | $ | 103,673,158 | $ | — | $ | 103,673,158 | ||||||||
| * | Refer to the Fund’s Portfolio of Investments for industry and country classifications, where applicable. |
| ** | Refer to the Fund’s Portfolio of Investments for securities classified as level 2. |
43
Notes to Financial Statements (continued)
4. Portfolio Securities and Investments in Derivatives
Portfolio Securities
Unfunded Commitments
Pursuant to the terms of certain of the variable rate senior loan agreements, the Funds may have unfunded senior loan commitments. Each Fund will maintain with its custodian, cash, liquid securities and/or liquid senior loans having an aggregate value at least equal to the amount of unfunded senior loan commitments. As of the end of the reporting period, the Fund’s outstanding unfunded senior loan commitments were as follows:
| JHAA | ||||
| Outstanding unfunded senior loan commitments |
$ | 554,048 | ||
Participation Commitments
With respect to the senior loans held in each Fund’s portfolio, the Funds may: 1) invest in assignments; 2) act as a participant in primary lending syndicates; or 3) invest in participations. If a Fund purchases a participation of a senior loan interest, the Fund would typically enter into a contractual agreement with the lender or other third party selling the participation, rather than directly with the borrower. As such, the Fund not only assumes the credit risk of the borrower, but also that of the selling participant or other persons interpositioned between the Fund and the borrower. As of the end of the reporting period, the Funds had no such outstanding participation commitments.
Repurchase Agreements
In connection with transactions in repurchase agreements, it is each Fund’s policy that its custodian take possession of the underlying collateral securities, the fair value of which exceeds the principal amount of the repurchase transaction, including accrued interest, at all times. If the counterparty defaults, and the fair value of the collateral declines, realization of the collateral may be delayed or limited.
The following table presents the repurchase agreements for the Funds that are subject to netting agreements as of the end of the reporting period, and the collateral delivered related to those repurchase agreements.
| Fund | Counterparty | Short-Term Investments, at Value |
Collateral Pledged (From) Counterparty* |
Net Exposure |
||||||||||
| JHAA | Fixed Income Clearing Corporation |
$ | 7,596,722 | $ | (7,596,722 | ) | $ | — | ||||||
| * | As of the end of the reporting period, the value of the collateral pledged from the counterparty exceeded the value of the repurchase agreements. Refer to the Fund’s Portfolio of Investments for details on the repurchase agreements. |
Zero Coupon Securities
A zero coupon security does not pay a regular interest coupon to its holders during the life of the security. Income to the holder of the security comes from accretion of the difference between the original purchase price of the security at issuance and the par value of the security at maturity and is effectively paid at maturity. The market prices of zero coupon securities generally are more volatile than the market prices of securities that pay interest periodically.
Investment Transactions
Long-term purchases and sales (including maturities) during the current fiscal period were as follows:
| JHB | JHAA | |||||||
| Purchases |
$ | 217,553,879 | $ | 43,054,249 | ||||
| Sales and maturities |
429,323,075 | 46,286,794 | ||||||
The Funds may purchase securities on a when-issued or delayed-delivery basis. Securities purchased on a when-issued or delayed-delivery basis may have extended settlement periods; interest income is not accrued until settlement date. Any securities so purchased are subject to market fluctuation during this period. The Funds have earmarked securities in their portfolios with a current value at least equal to the amount of the when-issued/delayed-delivery purchase commitments. If a Fund has outstanding when-issued/delayed-delivery purchases commitments as of the end of the reporting period, such amounts are recognized on the Statement of Assets and Liabilities.
Investments in Derivatives
Each Fund is authorized to invest in certain derivative instruments such as futures, options and swap contracts. Each Fund limits its investments in futures, options on futures and swap contracts to the extent necessary for the Adviser to claim the exclusion from registration by the Commodity Futures Trading Commission as a commodity pool operator with respect to the Fund. The Funds record derivative instruments at fair value, with changes in fair value recognized on the Statement of Operations, when applicable. Even though the Funds’ investments in derivatives may represent economic hedges, they are not considered to be hedge transactions for financial reporting purposes.
44
Although the Funds are authorized to invest in derivative instruments, and may do so in the future, they did not make any such investments during the current fiscal period.
Market and Counterparty Credit Risk
In the normal course of business each Fund may invest in financial instruments and enter into financial transactions where risk of potential loss exists due to changes in the market (market risk) or failure of the other party to the transaction to perform (counterparty credit risk). The potential loss could exceed the value of the financial assets recorded on the financial statements. Financial assets, which potentially expose each Fund to counterparty credit risk, consist principally of cash due from counterparties on forward, option and swap transactions, when applicable. The extent of each Fund’s exposure to counterparty credit risk in respect to these financial assets approximates their carrying value as recorded on the Statement of Assets and Liabilities.
Each Fund helps manage counterparty credit risk by entering into agreements only with counterparties the Adviser believes have the financial resources to honor their obligations and by having the Adviser monitor the financial stability of the counterparties. Additionally, counterparties may be required to pledge collateral daily (based on the daily valuation of the financial asset) on behalf of each Fund with a value approximately equal to the amount of any unrealized gain above a pre-determined threshold. Reciprocally, when each Fund has an unrealized loss, the Funds have instructed the custodian to pledge assets of the Funds as collateral with a value approximately equal to the amount of the unrealized loss above a pre-determined threshold. Collateral pledges are monitored and subsequently adjusted if and when the valuations fluctuate, either up or down, by at least the pre-determined threshold amount.
5. Fund Shares
Common Share Transactions
Transactions in common shares during the Funds’ current and prior fiscal period were as follows:
| JHB | JHAA* | |||||||||||||||
| Year Ended 12/31/20 |
Year Ended 12/31/19 |
Year Ended |
Year Ended 12/31/19 |
|||||||||||||
| Common shares: |
||||||||||||||||
| Sold |
— | — | — | 801,742 | ||||||||||||
| Issued to shareholders due to reinvestment of distributions |
14,165 | 14,238 | 7,226 | 6,363 | ||||||||||||
| Total |
14,165 | 14,238 | 7,226 | 808,105 | ||||||||||||
| * | Prior to the commencement of operations, the Adviser purchased 10,128 shares, which are still held as of the end of the reporting period. |
6. Income Tax Information
Each Fund is a separate taxpayer for federal income tax purposes. Each Fund intends to distribute substantially all of its net investment company taxable income to shareholders and to otherwise comply with the requirements of Subchapter M of the Internal Revenue Code applicable to regulated investment companies. In any year when the Funds realize net capital gains, the Funds may choose to distribute all or a portion of their net capital gains to shareholders, or alternatively, to retain all or a portion of their net capital gains and pay federal corporate income taxes on such retained gains.
For all open tax years and all major taxing jurisdictions, management of the Funds has concluded that there are no significant uncertain tax positions that would require recognition in the financial statements. Open tax years are those that are open for examination by taxing authorities (i.e., generally the last four tax year ends and the interim tax period since then). Furthermore, management of the Funds is also not aware of any tax positions for which it is reasonably possible that the total amounts of unrecognized tax benefits will significantly change in the next twelve months.
The following information is presented on an income tax basis. Differences between amounts for financial statement and federal income tax purposes are primarily due to timing differences in recognizing certain gains and losses on investment transactions. To the extent that differences arise that are permanent in nature, such amounts are reclassified within the capital accounts as detailed below. Temporary differences do not require reclassification. Temporary and permanent differences do not impact the NAVs of the Funds.
The table below presents the cost and unrealized appreciation (depreciation) of each Fund’s investment portfolio, as determined on a federal income tax basis, as of December 31, 2020.
| JHB | JHAA | |||||||
| Tax cost of investments |
$ | 396,661,271 | $ | 100,847,095 | ||||
| Gross unrealized: |
||||||||
| Appreciation |
$ | 6,193,262 | $ | 3,549,762 | ||||
| Depreciation |
(9,135,503 | ) | (723,699 | ) | ||||
| Net unrealized appreciation (depreciation) of investments |
$ | (2,942,241 | ) | $ | 2,826,063 | |||
45
Notes to Financial Statements (continued)
Permanent differences, primarily due to distribution reallocations, bond premium amortization adjustments and federal taxes paid, resulted in reclassifications among the Funds’ components of common share net assets as of December 31, 2020, the Funds’ tax year end.
The tax components of undistributed net ordinary income and net long-term capital gains as of December 31, 2020, the Funds’ tax year end, were as follows:
| JHB | JHAA | |||||||
| Undistributed net ordinary income1 |
$ | 4,241,506 | $ | 890,710 | ||||
| Undistributed net long-term capital gains |
— | — | ||||||
| 1 | Net ordinary income consists of net taxable income derived from dividends, interest, and net short-term capital gains, if any. |
The tax character of distributions paid during the Funds’ tax years ended December 31, 2020 and December 31, 2019 was designated for purposes of the dividends paid deduction as follows:
| 2020 | JHB | JHAA | ||||||
| Distributions from net ordinary income1 |
$ | 21,381,466 | $ | 4,267,771 | ||||
| Distributions from net long-term capital gains |
— | — | ||||||
| 2019 | JHB | JHAA | ||||||
| Distributions from net ordinary income1 |
$ | 28,252,445 | $ | 4,469,676 | ||||
| Distributions from net long-term capital gains |
131,241 | — | ||||||
| 1 | Net ordinary income consists of net taxable income derived from dividends, interest, and net short-term capital gains, if any. |
As of December 31, 2020, the Funds’ tax year end, the Funds had unused capital losses carrying forward available for federal income tax purposes to be applied against future capital gains, if any. The capital losses are not subject to expiration.
| JHB | JHAA | |||||||
| Not subject to expiration: |
||||||||
| Short-term |
$ | 1,037,621 | $ | 366,510 | ||||
| Long-term |
19,867,496 | 1,892,758 | ||||||
| Total |
$ | 20,905,117 | $ | 2,259,268 | ||||
7. Management Fees
Each Fund’s management fee compensates the Adviser for overall investment advisory and administrative services and general office facilities. The Sub-Adviser is compensated for its services to the Funds from the management fees paid to the Adviser.
Each Fund’s management fee consists of two components – a fund-level fee, based only on the amount of assets within each individual Fund, and a complex-level fee, based on the aggregate amount of all eligible fund assets managed by the Adviser. This pricing structure enables Fund shareholders to benefit from growth in the assets within their respective Fund as well as from growth in the amount of complex-wide assets managed by the Adviser.
The annual fund-level fee, payable monthly, for each Fund is calculated according to the following schedule:
| Average Daily Managed Assets* | Fund-Level Fee Rate | |||
| For the first $500 million |
0.5000 | % | ||
| For the next $250 million |
0.4875 | |||
| For managed assets over $750 million |
0.4750 | |||
46
The annual complex-level fee, payable monthly, for each Fund is calculated by multiplying the current complex-wide fee rate, determined according to the following schedule by the Funds’ daily managed assets:
| Complex-Level Eligible Asset Breakpoint Level* | Effective Complex-Level Fee Rate at Breakpoint Level |
|||
| $55 billion |
0.2000 | % | ||
| $56 billion |
0.1996 | |||
| $57 billion |
0.1989 | |||
| $60 billion |
0.1961 | |||
| $63 billion |
0.1931 | |||
| $66 billion |
0.1900 | |||
| $71 billion |
0.1851 | |||
| $76 billion |
0.1806 | |||
| $80 billion |
0.1773 | |||
| $91 billion |
0.1691 | |||
| $125 billion |
0.1599 | |||
| $200 billion |
0.1505 | |||
| $250 billion |
0.1469 | |||
| $300 billion |
0.1445 | |||
| * | For the complex-level fees, managed assets include closed-end fund assets managed by the Adviser that are attributable to certain types of leverage. For these purposes, leverage includes the funds’ use of preferred stock and borrowings and certain investments in the residual interest certificates (also called inverse floating rate securities) in tender option bond (TOB) trusts, including the portion of assets held by a TOB trust that has been effectively financed by the trust’s issuance of floating rate securities, subject to an agreement by the Adviser as to certain funds to limit the amount of such assets for determining managed assets in certain circumstances. The complex-level fee is calculated based upon the aggregate daily managed assets of all Nuveen open-end and closed-end Funds that constitute “eligible assets.” Eligible assets do not include assets attributable to investments in other Nuveen funds or assets in excess of a determined amount (originally $2 billion) added to the Nuveen fund complex in connection with the Adviser’s assumption of the management of the former First American Funds effective January 1, 2011, but do not include certain assets of certain Nuveen funds that were reorganized into funds advised by an affiliate of the Adviser during the 2019 calendar year. As of December 31, 2020, the complex-level fee for each Fund was 0.1557%. |
8. Fund Leverage
Borrowings
During the current fiscal period, the Funds entered into borrowing arrangements (“Borrowings”) as a means of leverage. As of the end of the reporting period, JHB no longer used Borrowings.
As of the end of the reporting period each Fund’s maximum commitment amount under its Borrowings is as follows:
| JHB | JHAA | |||||||
| Maximum commitment amount |
$ — | $27,500,000 | ||||||
JHB renewed its Borrowings in January 2020 through January 2021. In addition the interest charged on JHB’s Borrowings was changed from one-month LIBOR plus 0.45% to one-month LIBOR plus 0.60%. JHB paid off its Borrowings and closed its facility in July 2020. JHAA renewed its borrowings in January 2020 through July 2020 and again in July 2020 through July 2021 at which time the drawn spread increased from 1-month LIBOR plus 0.60% to the 1-Month LIBOR plus 0.775%. All other terms remained the same for each Fund.
As of the end of the reporting period, each Fund’s outstanding balance on its Borrowings was as follows:
| JHB | JHAA | |||||||
| Outstanding balance on Borrowings |
$ — | $24,525,000 | ||||||
Interest was charged on these Borrowings for JHB at the 1-Month LIBOR plus 0.60% (0.45% prior to January 9, 2020) per annum and a 0.25% per annum commitment fee on the undrawn portion of the Borrowings on any day that more than 20% (10% prior to January 9, 2020) of the maximum commitment amount is undrawn. JHAA is charged at the 1-Month LIBOR plus 0.775% (0.60% prior to July 8, 2020) per annum on the amounts borrowed and accrues a 0.125% per annum commitment fee on the undrawn portion of the Borrowings.
During the current fiscal period, the average daily balance outstanding and average annual interest rate on each Fund’s Borrowings were as follows:
| JHB | JHAA | |||||||
| Utilization period (days outstanding) |
196 | 366 | ||||||
| Average daily balance outstanding |
$ | 98,862,245 | * | $ | 25,706,694 | |||
| Average annual interest rate |
1.60 | % | 1.31 | % | ||||
| * | For the period January 1, 2020 through July 14, 2020 (final utilization date). |
47
Notes to Financial Statements (continued)
In order to maintain these Borrowings, the Funds must meet certain collateral, asset coverage and other requirements. Each Fund’s Borrowings outstanding are secured by assets in the Fund’s portfolio of investments.
Each Fund’s Borrowings outstanding are recognized as “Borrowings” on the Statement of Assets and Liabilities. Interest expense incurred on the borrowed amount and undrawn balance are recognized as components of “Interest expense” on the Statement of Operations.
Reverse Repurchase Agreements
During the current fiscal period, JHAA used reverse repurchase agreements as a means of leverage.
In a reverse repurchase agreement, the Fund sells to the counterparty a security that it holds with a contemporaneous agreement to repurchase the same security at an agreed-upon price and date, with the Fund retaining the risk of loss that is associated with that security. The Fund segregates or identifies on its books and records cash or other unencumbered liquid assets that have a market value at least equal to the amount of its future repurchase obligations, which enables the Fund to exclude the reverse repurchase agreements from being treated as a senior security under the 1940 Act. Securities sold under reverse repurchase agreements are recorded as a liability and recognized as “Reverse repurchase agreements” on the Statement of Assets and Liabilities.
Payments made on reverse repurchase agreements are recognized as a component of “Interest expense” on the Statement of Operations.
As of the end of the reporting period, JHAA no longer used reverse repurchase agreements.
During the current fiscal period, the average daily balance outstanding and weighted average interest rate on the Fund’s reverse repurchase agreements were as follows:
| Utilization period (days outstanding) |
173 | |||
| Average daily balance outstanding |
$490,000 | * | ||
| Weighted average interest rate |
1.19 | % |
| * | For the period January 1, 2020 through June 19, 2020 (final utilization date). |
Rehypothecation
JHB had entered into a Rehypothecation Side Letter (“Side Letter”) with its credit agreement lender, allowing it to re-register a portion of its collateral in its own name or in a name other than the Fund’s to pledge, repledge, hypothecate, rehyphothecate, sell, lend or otherwise transfer or use the collateral (the “Hypothecated Securities”) with all rights of ownership as described in the Side Letter. Subject to certain conditions, the total value of the outstanding Hypothecated Securities should not exceed 98% of the outstanding balance on the Borrowings. The Fund could designate any collateral as ineligible for rehypothecation. The Fund could also recall Hypothecated Securities on demand.
The Fund also had the right to apply and set-off an amount equal to one-hundred percent (100%) of the then-current fair market value of such Hypothecated Securities against the current Borrowings under the Side Letter in the event that the lender failed to timely return the Hypothecated Securities and in certain other circumstances. In such circumstances, however, the Fund may not have been able to obtain replacement financing required to purchase replacement securities and, consequently, the Fund’s income generating potential could have decreased. Even if the Fund was able to obtain replacement financing, it might not have been able to purchase replacement securities at favorable prices.
The Fund terminated its rehypothecation program in July 2020.
9. Inter-Fund Lending
Inter-Fund Borrowing and Lending
The Securities and Exchange Commission (“SEC”) has granted an exemptive order permitting registered open-end and closed-end Nuveen funds to participate in an inter-fund lending facility whereby the Nuveen funds may directly lend to and borrow money from each other for temporary purposes (e.g., to satisfy redemption requests or when a sale of securities “fails,” resulting in an unanticipated cash shortfall) (the “Inter-Fund Program”). The closed-end Nuveen funds, including the Funds covered by this shareholder report, will participate only as lenders, and not as borrowers, in the Inter-Fund Program because such closed-end funds rarely, if ever, need to borrow cash to meet redemptions. The Inter-Fund Program is subject to a number of conditions, including, among other things, the requirements that (1) no fund may borrow or lend money through the Inter-Fund Program unless it receives a more favorable interest rate than is typically available from a bank or other financial institution for a comparable transaction; (2) no fund may borrow on an unsecured basis through the Inter-Fund Program unless the fund’s outstanding borrowings from all sources immediately after the inter-fund borrowing total 10% or less of its total assets; provided that if the borrowing fund has a secured borrowing outstanding from any other lender, including but not limited to another fund, the inter-fund loan must be secured on at least an equal priority basis with at least an equivalent percentage of collateral to loan value; (3) if a fund’s total outstanding borrowings immediately after an inter-fund borrowing would be greater than 10% of its total assets, the fund may borrow through the inter-fund loan on a secured basis only; (4) no fund may lend money if the loan would cause its aggregate outstanding loans through
48
the Inter-Fund Program to exceed 15% of its net assets at the time of the loan; (5) a fund’s inter-fund loans to any one fund shall not exceed 5% of the lending fund’s net assets; (6) the duration of inter-fund loans will be limited to the time required to receive payment for securities sold, but in no event more than seven days; and (7) each inter-fund loan may be called on one business day’s notice by a lending fund and may be repaid on any day by a borrowing fund. In addition, a Nuveen fund may participate in the Inter-Fund Program only if and to the extent that such participation is consistent with the fund’s investment objective and investment policies. The Board is responsible for overseeing the Inter-Fund Program.
The limitations detailed above and the other conditions of the SEC exemptive order permitting the Inter-Fund Program are designed to minimize the risks associated with Inter-Fund Program for both the lending fund and the borrowing fund. However, no borrowing or lending activity is without risk. When a fund borrows money from another fund, there is a risk that the loan could be called on one day’s notice or not renewed, in which case the fund may have to borrow from a bank at a higher rate or take other actions to payoff such loan if an inter-fund loan is not available from another fund. Any delay in repayment to a lending fund could result in a lost investment opportunity or additional borrowing costs.
During the current reporting period, none of the Funds covered by this shareholder report have entered into any inter-fund loan activity.
49
(Unaudited)
CURRENT INVESTMENT OBJECTIVES, INVESTMENT POLICIES AND PRINCIPAL RISKS OF THE FUNDS
NUVEEN CORPORATE INCOME NOVEMBER 2021 TARGET TERM FUND (JHB)
Investment Objectives
The Fund’s investment objectives are to provide a high level of current income and to return $9.85 per share (the original net asset value (“NAV”) per common share before deducting offering costs of $0.02 per share) to holders of common shares on or about November 1, 2021 (“Termination Date”).
The Fund will attempt to strike a balance between the two objectives, seeking to provide as high a level of current income as is consistent with the Fund’s overall credit performance, the declining average maturity of its portfolio strategy and its objective of returning the original NAV on or about the Termination Date. Recent market conditions have materially increased the risk associated with achieving the Fund’s objective to return Original NAV. This objective is not a guarantee and is dependent on a number of factors including the extent of market recovery and the cumulative level of income retained in relation to cumulative portfolio gains net of losses. The objective to return the Fund’s Original NAV is not an express or implied guarantee obligation of the Fund or any other entity.
Investment Policies
The Fund seeks to achieve its investment objectives by investing, under normal circumstances, at least 80% of its Managed Assets (as defined below) in corporate debt securities.
“Managed Assets” mean the total assets of the Fund, minus the sum of its accrued liabilities (other than Fund liabilities incurred for the express purpose of creating leverage). Total assets for this purpose shall include assets attributable to the Fund’s use of leverage (whether or not those assets are reflected in the Fund’s financial statements for purposes of generally accepted accounting principles), and derivatives will be valued at their market value.
Under normal market conditions:
| • | The Fund will invest no more than 15% of its Managed Assets in securities that, at the time of investment, either are rated CCC+/Caa1 or lower, or are unrated but judged by the Fund’s subadviser to be of comparable quality. |
| • | The Fund will not invest in defaulted securities or in the securities of an issuer that is in bankruptcy or insolvency proceedings. |
| • | The Fund will invest no more than 30% of its Managed Assets in securities of non-U.S. issuers, including no more than 20% of its Managed Assets in securities of emerging markets issuers. |
| • | The Fund may invest up to 10% of its Managed Assets in non-U.S. dollar denominated securities. The Fund expects to use derivative instruments in an effort to hedge substantially all of the currency risk associated with non-U.S. dollar denominated investments. |
| • | The Fund will not invest in securities with an effective maturity date (or mandatory redemption date for preferred stock) extending beyond May 1, 2022. “Effective maturity” takes into consideration corporate debt securities and other types of debt instruments with mandatory call dates, or other features obligating the issuer or another party to repurchase or redeem the security at dates that are earlier than the securities’ respective stated maturity dates. |
| • | The Fund will not invest in common equity securities. This policy does not apply to shares of other investment companies. |
The foregoing policies apply only at the time of any new investment.
Approving Changes in Investment Policies
The Board of Trustees of the Fund may change the policies described above without a shareholder vote.
Portfolio Contents
The Fund generally invests in a portfolio of corporate debt securities. Corporate debt securities are bonds, notes and preferred securities issued by corporations or other business entities.
Corporate debt securities are fully taxable debt obligations that fund capital improvements, expansions, debt refinancing or acquisitions that require more capital than would ordinarily be available from a single lender. Investors in corporate debt securities lend money to the issuing corporation in exchange for interest payments and repayment of the principal at a set maturity date. Rates on corporate debt securities are set according to prevailing interest rates at the time of the issue, the credit rating of the issuer, the length of the maturity and other terms of the security, such as a call feature. Corporate debt securities are subject to the risk of an issuer’s inability to meet principal and interest payments on the obligations and may also be subject to price
50
volatility due to such factors as market interest rates, market perception of the creditworthiness of the issuer and general market liquidity. In addition, corporate restructurings, such as mergers, leveraged buyouts, takeovers or similar corporate transactions are often financed by an increase in a corporate issuer’s debt securities. As a result of the added debt burden, the credit quality and market value of an issuer’s existing debt securities may decline significantly.
The Fund may invest in a wide variety of bonds of varying maturities issued by U.S. and foreign corporations and other business entities, governments and municipalities and other issuers. Bonds are fixed or variable-rate debt obligations, including bills, notes, debentures, money market instruments and similar instruments and securities. Bonds generally are used by corporations as well as governments and other issuers to borrow money from investors. The issuer pays the investor a fixed or variable rate of interest and normally must repay the amount borrowed on or before maturity. Corporate bonds come in many varieties and may differ in the way that interest is calculated, the amount and frequency of payments, the type of collateral, if any, and the presence of special features (e.g., conversion rights).
The Fund may invest in securities of non-U.S. issuers and securities of emerging markets issuers. The Fund will classify an issuer of a security as being a U.S. or non-U.S. issuer based on the determination of an unaffiliated, recognized financial data provider. Such determinations are based on a number of criteria, such as the issuer’s country of domicile, the primary exchange on which the security predominately trades, the location from which the majority of the issuer’s revenue comes, and the issuer’s reporting currency. The Fund will classify an issuer of a security as being a U.S. or non-U.S. issuer based on the determination of an unaffiliated, recognized financial data provider. Such determinations are based on a number of criteria, such as the issuer’s country of domicile, the primary exchange on which the security predominately trades, the location from which the majority of the issuer’s revenue comes, and the issuer’s reporting currency. Furthermore, a country is considered to be an “emerging market” if it has a relatively low gross national product per capita compared to the world’s major economies and the potential for rapid economic growth. The Fund considers a country an emerging market country based on the determination of an international organization, such as the IMF, or an unaffiliated, recognized financial data provider.
The Fund may invest in preferred securities, including preferred stock. Preferred stock has a preference over common stock in liquidation (and generally as to dividends as well) but is subordinated to the liabilities of the issuer in all respects. As a general rule, the market value of preferred stock with a fixed dividend rate and no conversion element varies inversely with interest rates and perceived credit risk, while the market price of convertible preferred stock generally also reflects some element of conversion value. Because preferred stock is junior to debt securities and other obligations of the issuer, deterioration in the credit quality of the issuer will cause greater changes in the value of a preferred stock than in a more senior debt security with similarly stated yield characteristics. The market value of preferred stock will also generally reflect whether (and if so when) the issuer may force holders to sell their preferred shares back to the issuer and whether (and if so when) the holders may force the issuer to buy back their preferred shares.
Generally, the right of the issuer to repurchase the preferred stock tends to reduce any premium that the preferred stock might otherwise trade at due to interest rate or credit factors, while the right of the holders to require the issuer to repurchase the preferred stock tends to reduce any discount that the preferred stock might otherwise trade at due to interest rate or credit factors. In addition, some preferred stocks are non-cumulative, meaning that the dividends do not accumulate and need not ever be paid. A portion of the Fund’s portfolio may include investments in non-cumulative preferred securities, whereby the issuer does not have an obligation to make up any arrearages to its shareholders. There is no assurance that dividends or distributions on non-cumulative preferred stocks in which the Fund invests will be declared or otherwise paid. Preferred stock of certain companies offers the opportunity for capital appreciation as well as periodic income. This may be particularly true in the case of companies that have performed below expectations. If a company’s performance has been poor enough, its preferred stock may trade more like common stock than like other fixed-income securities, which may result in above average appreciation if the company’s performance improves.
The Fund may invest in senior loans. Senior loans typically hold the most senior position in the capital structure of a business entity, are typically secured with specific collateral and have a claim on the assets and/or stock of the issuer that is senior to that held by subordinated debt holders and stockholders of the issuer.
Senior loans generally include: (i) senior loans made by banks or other financial institutions to U.S. and non-U.S. corporations, partnerships and other business entities (each a “Borrower” and, collectively, “Borrowers”), (ii) assignments of such interests in senior loans, or (iii) participation interests in senior loans. Generally, an assignment is the actual sale of the loan, in whole or in part. A participation, on the other hand, means that the original lender maintains ownership over the loan and the participant has only a contract right against the original lender, not a credit relationship with the Borrower. Senior loans typically hold the most senior position in the capital structure of a Borrower, are typically secured with specific collateral and have a claim on the assets and/or stock of the Borrower that is senior to that held by subordinated debt holders and stockholders of the Borrower. The capital structure of a Borrower may include senior loans, senior and junior subordinated debt, preferred stock and common stock issued by the Borrower, typically in descending order of seniority with respect to claims on the Borrower’s assets. The proceeds of senior loans primarily are used by Borrowers to finance leveraged buyouts, recapitalizations, mergers, acquisitions, stock repurchases, refinancings, internal growth and for other corporate purposes. A senior loan is typically originated, negotiated and structured by a U.S. or non-U.S. commercial bank, insurance company, finance company or other financial institution (“Agent”) for a lending syndicate of financial institutions which typically includes the Agent (“Lenders”). The Agent typically administers and enforces the senior loan on behalf of the other Lenders in the syndicate. In addition, an institution, typically but not always the Agent, holds any collateral
51
Shareholder Update (continued)
(Unaudited)
on behalf of the Lenders. The Fund normally will rely primarily on the Agent to collect principal of and interest on a senior loan. Also, the Fund usually will rely on the Agent to monitor compliance by the Borrower with the restrictive covenants in a loan agreement.
Senior loans typically have rates of interest that are redetermined either daily, monthly, quarterly or semi-annually by reference to a base lending rate plus a premium or credit spread. These base lending rates are primarily the London Inter-Bank Offered Rate (“LIBOR”), and secondarily the prime rate offered by one or more major U.S. banks and the certificate of deposit rate or other base lending rates used by commercial lenders. The base rate for senior loans after 2021 has not yet been determined with the discontinuation of LIBOR. As adjustable rate loans, the frequency of how often a senior loan resets its interest rate will impact how closely such senior loans track current market interest rates.
The Fund may purchase participation interests in the original syndicate making senior loans. Loan participation interests typically represent direct participations in a loan to a corporate Borrower, and generally are offered by banks or other financial institutions or lending syndicates. The Fund may participate in such syndications, or can buy part of a senior loan, becoming a Lender. When purchasing a participation interest, the Fund assumes the credit risk associated with the corporate Borrower and may assume the credit risk associated with an interposed bank or other financial intermediary. The participation interests in which the Fund may invest may not be rated by any nationally recognized statistical rating organization (“NRSRO”).
The Fund may invest in second lien loans and unsecured loans. Such loans are made by public and private corporations and other non-governmental Borrowers for a variety of purposes. As in the case of senior loans, the Fund may purchase interests in second lien loans and unsecured loans through assignments or participations. Second lien loans have similar characteristics as senior loans except that such interests are junior in priority to debt secured with a first lien. Second lien loans are second in priority of payment to one or more senior loans of the related Borrower and are typically secured by a second priority security interest or lien to or on specified collateral securing the Borrower’s obligation under the indebtedness. They typically have similar protections and rights as senior loans. Second lien loans are not (and by their terms cannot become) subordinate in priority of payment to any obligation of the related Borrower other than senior loans of such Borrower. Second lien loans may feature fixed or floating rate interest payments. Because second lien loans are junior to senior loans, they present a greater degree of investment risk but often pay interest at higher rates reflecting this additional risk. In addition, second lien loans of below investment grade quality share many of the risk characteristics of other below investment grade debt instruments.
Unsecured loans generally have lower priority in right of payment compared to holders of secured interests of the Borrower. Unsecured loans are not secured by a security interest or lien to or on specified collateral securing the Borrower’s obligation under the indebtedness. Unsecured loans by their terms may be or may become subordinate in right of payment to other obligations of the Borrower, including senior loans, second lien loans and other interests. Unsecured loans may have fixed or adjustable floating rate interest payments. Because unsecured loans are subordinate to senior loans and other secured debt of the Borrower, they present a greater degree of investment risk but often pay interest at higher rates reflecting this additional risk. Such investments generally are of below investment grade quality. Unsecured loans of below investment grade quality share many of the same risks of other below investment grade debt instruments.
The Fund may invest in subordinated loans that are primarily unsecured and that provide for relatively high, adjustable rates of interest, providing the Fund with significant current interest income. The subordinated loans in which the Fund may invest may have interest-only payments in the early years, with amortization of principal deferred to the later years of the subordinated loans. In some cases, the Fund may acquire subordinated loans that, by their terms, convert into equity or additional debt instruments or defer payments of interest for the first few years after issuance. Also, in some cases the subordinated loans in which the Fund may invest will be collateralized by a subordinated lien on some or all of the assets of the Borrower.
The Fund may invest in convertible securities, which includes convertible debt, convertible preferred stock, synthetic convertible securities and may also include secured and unsecured debt, based upon the judgment of the sub-adviser. Convertible securities may pay interest or dividends that are based on a fixed or floating rate. A convertible security is a preferred stock, warrant or other security that may be converted into or exchanged for a prescribed amount of common stock or other security of the same or a different issuer or into cash within a particular period of time at a specified price or formula.
The Fund may invest in zero coupon bonds. A zero coupon bond is a bond that typically does not pay interest for the entire life of the obligation or for an initial period after the issuance of the obligation.
The Fund’s investments may include investment grade and below investment grade securities. Below investment grade securities are generally securities rated BB+/Ba1 or lower at the time of investment or are unrated but judged by the Fund’s sub-adviser to be of comparable quality. Below investment grade securities are commonly referred to as “high yield” or “junk.” High yield securities or “junk bonds” that are below investment grade involve a greater degree of risk (in particular, a greater risk of default) than, and special risks in addition to the risks associated with investment grade securities.
The Fund may invest in illiquid securities (i.e., securities that are not readily marketable), including, but not limited to, restricted securities (securities the disposition of which is restricted under the federal securities laws), securities that may be resold only pursuant to Rule 144A under the Securities Act of 1933, as amended (the “1933 Act”), and repurchase agreements with maturities in excess of seven days.
The Fund may enter into certain derivative instruments in pursuit of its investment objectives, including to seek to enhance return, to hedge certain risks of its investments in fixed-income securities or as a substitute for a position in the underlying asset. Such instruments include financial futures contracts
52
and options thereon, swaps (with varying terms, including interest rate swaps, credit default swaps, total return swaps, currency swaps and credit default swap indices), options on interest rates, options on indices, options on swaps, options on currencies and other fixed-income derivative instruments that may have the economic effect of leverage.
The Fund may also invest in securities of other open- or closed-end investment companies (including exchange-traded funds (“ETFs”)) that invest primarily in securities of the types in which the Fund may invest directly, to the extent permitted by the Investment Company Act of 1940, as amended (the “1940 Act”), the rules and regulations issued thereunder and applicable exemptive orders issued by the Securities and Exchange Commission (“SEC”).
Use of Leverage
While the Fund may use leverage to pursue its investment objectives to the extent permitted by the 1940 Act, The Fund currently is not leveraged, in anticipation of its scheduled termination and liquidation effective on or about November 1, 2021.
Temporary Defensive Periods
During temporary defensive periods the Fund may deviate from its investment objectives and policies, and in order to keep the Fund’s cash fully invested, the Fund may invest up to 100% of its Managed Assets in short-term investments, including high quality, short-term securities, or may invest in short-, intermediate-, or long-term U.S. Treasury securities. The Fund may not achieve its investment objectives during such periods.
53
Shareholder Update (continued)
(Unaudited)
NUVEEN CORPORATE INCOME 2023 TARGET TERM FUND (JHAA)
Investment Objectives
The Fund’s investment objectives are to provide a high level of current income and to return $9.875 per share (the original NAV per common share before deducting offering costs of $0.02 per share) to holders of common shares on or about December 1, 2023 (“Termination Date”).
The Fund will attempt to strike a balance between the two objectives, seeking to provide as high a level of current income as is consistent with the Fund’s overall credit performance and the declining average maturity of its portfolio, on the one hand, and its objective of returning the Original NAV on or about the Termination Date, on the other. However, as the Fund approaches the Termination Date, its monthly distributions are likely to decline, and there can be no assurance that the Fund will achieve either of its investment objectives or that the Fund’s investment strategies will be successful. The objective to return the Fund’s Original NAV is not an express or implied guarantee obligation of the Fund or any other entity.
Investment Policies
The Fund seeks to achieve its investment objectives by investing, under normal circumstances, at least 80% of its Managed Assets (as defined below) in corporate debt securities (including bonds and senior loans).
“Managed Assets” mean the total assets of the Fund, minus the sum of its accrued liabilities (other than Fund liabilities incurred for the express purpose of creating leverage). Total assets for this purpose shall include assets attributable to the Fund’s use of leverage (whether or not those assets are reflected in the Fund’s financial statements for purposes of generally accepted accounting principles), and derivatives will be valued at their market value.
Under normal market conditions:
| • | The Fund will invest no more than 15% of its Managed Assets in securities that, at the time of investment, either are rated CCC+/Caa1 or lower, or are unrated but judged by the Fund’s subadviser to be of comparable quality. |
| • | The Fund will not invest in defaulted securities or in the securities of an issuer that is in bankruptcy or insolvency proceedings, other than in connection with a workout of an issuer of a debt security that the Fund already owns. |
| • | The Fund will invest no more than 30% of its Managed Assets in securities of non-U.S. issuers, including no more than 20% of its Managed Assets in securities of emerging markets issuers. |
| • | The Fund may invest up to 10% of its Managed Assets in non-U.S. dollar denominated securities. The Fund expects to use derivative instruments in an effort to hedge substantially all of the currency risk associated with non-U.S. dollar denominated investments. |
| • | The Fund will not invest in securities with an effective maturity date (or mandatory redemption date for preferred stock) extending beyond June 1, 2024. “Effective maturity” takes into consideration corporate debt securities and other types of debt instruments with mandatory call dates, or other features obligating the issuer or another party to repurchase or redeem the security at dates that are earlier than the securities’ respective stated maturity dates. |
| • | The Fund will not invest in common equity securities. This policy does not apply to shares of other investment companies or to common equity securities acquired in connection with a workout of an issuer of a debt security that the Fund already owns. |
The foregoing policies apply only at the time of any new investment.
Approving Changes in Investment Policies
The Board of Trustees of the Fund may change the policies described above without a shareholder vote.
Portfolio Contents
The Fund generally invests in a portfolio of corporate debt securities. Corporate debt securities are bonds, senior loans and notes issued by corporations or other business entities.
Corporate debt securities are fully taxable debt obligations that fund capital improvements, expansions, debt refinancing or acquisitions that require more capital than would ordinarily be available from a single lender. Investors in corporate debt securities lend money to the issuing corporation in exchange for interest payments and repayment of the principal at a set maturity date. Rates on corporate debt securities are set according to prevailing interest rates at the time of the issue, the credit rating of the issuer, the length of the maturity and other terms of the security, such as a call feature. Corporate debt securities are subject to the risk of an issuer’s inability to meet principal and interest payments on the obligations and may also be subject to price volatility due to such factors as market interest rates, market perception of the creditworthiness of the issuer and general market liquidity. In addition, corporate restructurings, such as mergers, leveraged buyouts, takeovers or similar corporate transactions are often financed by an increase in a corporate issuer’s debt securities. As a result of the added debt burden, the credit quality and market value of an issuer’s existing debt securities may decline significantly.
54
The Fund may invest in a wide variety of bonds of varying maturities issued by U.S. and foreign corporations and other business entities, governments and municipalities and other issuers. Bonds are fixed or variable-rate debt obligations, including bills, notes, debentures, money market instruments and similar instruments and securities. Bonds generally are used by corporations as well as governments and other issuers to borrow money from investors. The issuer pays the investor a fixed or variable rate of interest and normally must repay the amount borrowed on or before maturity. Corporate bonds come in many varieties and may differ in the way that interest is calculated, the amount and frequency of payments, the type of collateral, if any, and the presence of special features (e.g., conversion rights).
The Fund may invest in securities of non-U.S. issuers and securities of emerging markets issuers. The Fund will classify an issuer of a security as being a U.S. or non-U.S. issuer based on the determination of an unaffiliated, recognized financial data provider. Such determinations are based on a number of criteria, such as the issuer’s country of domicile, the primary exchange on which the security predominately trades, the location from which the majority of the issuer’s revenue comes, and the issuer’s reporting currency. The Fund will classify an issuer of a security as being a U.S. or non-U.S. issuer based on the determination of an unaffiliated, recognized financial data provider. Such determinations are based on a number of criteria, such as the issuer’s country of domicile, the primary exchange on which the security predominately trades, the location from which the majority of the issuer’s revenue comes, and the issuer’s reporting currency. Furthermore, a country is considered to be an “emerging market” if it has a relatively low gross national product per capita compared to the world’s major economies and the potential for rapid economic growth. The Fund considers a country an emerging market country based on the determination of an international organization, such as the IMF, or an unaffiliated, recognized financial data provider.
The Fund may invest in senior loans. Senior loans typically hold the most senior position in the capital structure of a business entity, are typically secured with specific collateral and have a claim on the assets and/or stock of the issuer that is senior to that held by subordinated debt holders and stockholders of the issuer.
Senior loans generally include: (i) senior loans made by banks or other financial institutions to U.S. and non-U.S. corporations, partnerships and other business entities (each a “Borrower” and, collectively, “Borrowers”), (ii) assignments of such interests in senior loans, or (iii) participation interests in senior loans. Generally, an assignment is the actual sale of the loan, in whole or in part. A participation, on the other hand, means that the original lender maintains ownership over the loan and the participant has only a contract right against the original lender, not a credit relationship with the Borrower. Senior loans typically hold the most senior position in the capital structure of a Borrower, are typically secured with specific collateral and have a claim on the assets and/or stock of the Borrower that is senior to that held by subordinated debt holders and stockholders of the Borrower. The capital structure of a Borrower may include senior loans, senior and junior subordinated debt, preferred stock and common stock issued by the Borrower, typically in descending order of seniority with respect to claims on the Borrower’s assets. The proceeds of senior loans primarily are used by Borrowers to finance leveraged buyouts, recapitalizations, mergers, acquisitions, stock repurchases, refinancings, internal growth and for other corporate purposes. A senior loan is typically originated, negotiated and structured by a U.S. or non-U.S. commercial bank, insurance company, finance company or other financial institution (“Agent”) for a lending syndicate of financial institutions which typically includes the Agent (“Lenders”). The Agent typically administers and enforces the senior loan on behalf of the other Lenders in the syndicate. In addition, an institution, typically but not always the Agent, holds any collateral on behalf of the Lenders. The Fund normally will rely primarily on the Agent to collect principal of and interest on a senior loan. Also, the Fund usually will rely on the Agent to monitor compliance by the Borrower with the restrictive covenants in a loan agreement.
Senior loans typically have rates of interest that are redetermined either daily, monthly, quarterly or semi-annually by reference to a base lending rate plus a premium or credit spread. These base lending rates are primarily LIBOR, and secondarily the prime rate offered by one or more major U.S. banks and the certificate of deposit rate or other base lending rates used by commercial lenders. The base rate for senior loans after 2021 has not yet been determined with the discontinuation of LIBOR. As adjustable rate loans, the frequency of how often a senior loan resets its interest rate will impact how closely such senior loans track current market interest rates.
The Fund may purchase participation interests in the original syndicate making senior loans. Loan participation interests typically represent direct participations in a loan to a corporate Borrower, and generally are offered by banks or other financial institutions or lending syndicates. The Fund may participate in such syndications, or can buy part of a senior loan, becoming a Lender. When purchasing a participation interest, the Fund assumes the credit risk associated with the corporate Borrower and may assume the credit risk associated with an interposed bank or other financial intermediary. The participation interests in which the Fund may invest may not be rated by any NRSRO.
The Fund may invest in second lien loans and unsecured loans. Such loans are made by public and private corporations and other non-governmental Borrowers for a variety of purposes. As in the case of senior loans, the Fund may purchase interests in second lien loans and unsecured loans through assignments or participations. Second lien loans have similar characteristics as senior loans except that such interests are junior in priority to debt secured with a first lien. Second lien loans are second in priority of payment to one or more senior loans of the related Borrower and are typically secured by a second priority security interest or lien to or on specified collateral securing the Borrower’s obligation under the indebtedness. They typically have similar protections and rights as senior loans. Second lien loans are not (and by their terms cannot become) subordinate in priority of payment to any obligation of the related Borrower other than senior loans of such Borrower. Second lien loans may feature fixed or floating rate interest payments. Because second
55
Shareholder Update (continued)
(Unaudited)
lien loans are junior to senior loans, they present a greater degree of investment risk but often pay interest at higher rates reflecting this additional risk. In addition, second lien loans of below investment grade quality share many of the risk characteristics of other below investment grade debt instruments.
Unsecured loans generally have lower priority in right of payment compared to holders of secured interests of the Borrower. Unsecured loans are not secured by a security interest or lien to or on specified collateral securing the Borrower’s obligation under the indebtedness. Unsecured loans by their terms may be or may become subordinate in right of payment to other obligations of the Borrower, including senior loans, second lien loans and other interests. Unsecured loans may have fixed or adjustable floating rate interest payments. Because unsecured loans are subordinate to senior loans and other secured debt of the Borrower, they present a greater degree of investment risk but often pay interest at higher rates reflecting this additional risk. Such investments generally are of below investment grade quality. Unsecured loans of below investment grade quality share many of the same risks of other below investment grade debt instruments.
The Fund may invest in subordinated loans that are primarily unsecured and that provide for relatively high, adjustable rates of interest, providing the Fund with significant current interest income. The subordinated loans in which the Fund may invest may have interest-only payments in the early years, with amortization of principal deferred to the later years of the subordinated loans. In some cases, the Fund may acquire subordinated loans that, by their terms, convert into equity or additional debt instruments or defer payments of interest for the first few years after issuance. Also, in some cases the subordinated loans in which the Fund may invest will be collateralized by a subordinated lien on some or all of the assets of the Borrower.
The Fund may invest in convertible securities, which includes convertible debt, convertible preferred stock, synthetic convertible securities and may also include secured and unsecured debt, based upon the judgment of the sub-adviser. Convertible securities may pay interest or dividends that are based on a fixed or floating rate. A convertible security is a preferred stock, warrant or other security that may be converted into or exchanged for a prescribed amount of common stock or other security of the same or a different issuer or into cash within a particular period of time at a specified price or formula.
The Fund may invest in zero coupon bonds. A zero coupon bond is a bond that typically does not pay interest for the entire life of the obligation or for an initial period after the issuance of the obligation.
The Fund’s investments may include investment grade and below investment grade securities. Below investment grade securities are generally securities rated BB+/Ba1 or lower at the time of investment or are unrated but judged by the Fund’s sub-adviser to be of comparable quality. Below investment grade securities are commonly referred to as “high yield” or “junk.”
High yield securities or “junk bonds” that are below investment grade involve a greater degree of risk (in particular, a greater risk of default) than, and special risks in addition to the risks associated with investment grade securities. Under rating agency guidelines, medium- and lower-rated securities and comparable unrated securities will likely have some quality and protective characteristics that are outweighed by large uncertainties or major risk exposures to adverse conditions. Medium- and lower-rated securities may have poor prospects of ever attaining any real investment standing, may have a current identifiable vulnerability to default or be in default, may be unlikely to have the capacity to pay interest or dividends and repay liquidation preference or principal when due in the event of adverse business, financial or economic conditions, and/or may be likely to be in default or not current in the payment of interest, dividends, liquidation preference or principal. Such securities are considered speculative with respect to the issuer’s capacity to pay interest or dividends and repay liquidation preference or principal in accordance with the terms of the obligations. Accordingly, it is possible that these types of factors could reduce the value of securities held by the Fund with a commensurate effect on the value of the Fund’s shares. High yield securities involve substantial risk of loss and are susceptible to default or decline in market value due to real or perceived adverse economic and business developments or competitive industry conditions, as compared to higher-rated instruments. These securities generally provide higher income than investment grade securities in an effort to compensate investors for their higher risk of default, which is the issuer’s failure to make required interest, dividends, liquidation preference or principal payments on the securities. High yield securities issuers include small or relatively new companies lacking the history or capital to merit investment-grade status, former blue chip companies downgraded because of financial problems, companies electing to borrow heavily to finance or avoid a takeover or buyout, and firms with heavy debt loads.
The secondary markets for these securities are generally not as liquid as the secondary markets for higher rated securities. The secondary markets for high yield securities are concentrated in relatively few market makers and the participants in the market are mostly institutional investors, including insurance companies, banks, other financial institutions and mutual funds. In addition, the trading volume for high yield securities is generally lower than that for higher-rated securities, and the secondary markets could contract under adverse market or economic conditions independent of any specific adverse changes in the condition of a particular issuer. These factors may have an adverse effect on the ability of the Fund to dispose of particular portfolio investments, may adversely affect the Fund’s NAV per share and may limit the ability of the Fund to obtain accurate market quotations for purposes of valuing securities and calculating NAV. If the Fund is not able to obtain precise or accurate market quotations for a particular security, it will become more difficult to value the Fund’s portfolio securities, and a greater degree of judgment may be necessary in making such valuations. Less liquid secondary markets may also affect the ability of the Fund to sell securities at their fair value. If the secondary markets for high yield securities contract due to adverse economic conditions or for other reasons, certain liquid securities in the Fund’s portfolio may become illiquid and the proportion of the Fund’s assets invested in illiquid securities may significantly increase.
56
The Fund may invest in illiquid securities (i.e., securities that are not readily marketable), including, but not limited to, restricted securities (securities the disposition of which is restricted under the federal securities laws), securities that may be resold only pursuant to Rule 144A under the 1933 Act, and repurchase agreements with maturities in excess of seven days.
The Fund may enter into certain derivative instruments in pursuit of its investment objectives, including to seek to enhance return, to hedge certain risks of its investments in fixed-income securities or as a substitute for a position in the underlying asset. Such instruments include financial futures contracts and options thereon, swaps (with varying terms, including interest rate swaps, credit default swaps, total return swaps, currency swaps and credit default swap indices), options on interest rates, options on indices, options on swaps, options on currencies and other fixed-income derivative instruments that may have the economic effect of leverage.
The Fund may also invest in securities of other open- or closed-end investment companies (including ETFs) that invest primarily in securities of the types in which the Fund may invest directly, to the extent permitted by the 1940 Act, the rules and regulations issued thereunder and applicable exemptive orders issued by the SEC.
Use of Leverage
The Fund uses leverage to pursue its investment objectives. The Fund may use leverage to the extent permitted by the 1940 Act. The Fund may source leverage through a number of methods including through borrowings, reverse repurchase agreements (effectively a borrowing), issuing preferred shares of beneficial interests and the issuance of debt securities. In addition, the Fund may also use certain derivatives that have the economic effect of leverage by creating additional investment exposure. The amount and sources of leverage will vary depending on market conditions.
Temporary Defensive Periods
During temporary defensive periods the Fund may deviate from its investment objectives and policies, and in order to keep the Fund’s cash fully invested, the Fund may invest up to 100% of its Managed Assets in short-term investments, including high quality, short-term securities, or may invest in short-, intermediate-, or long-term U.S. Treasury securities. The Fund may not achieve its investment objectives during such periods.
57
Shareholder Update (continued)
(Unaudited)
PRINCIPAL RISKS OF THE FUNDS
The factors that are most likely to have a material effect on a particular Fund’s portfolio as a whole are called “principal risks.” Each Fund is subject to the principal risks indicated below, whether through direct investment or derivative positions. Each Fund may be subject to additional risks other than those identified and described below because the types of investments made by a Fund can change over time.
| Risk | Nuveen Corporate Income November 2021 Target Term Fund (JHB) |
Nuveen Corporate Income 2023 Target Term Fund (JHAA) |
||||||
| Portfolio Level Risks | ||||||||
| Below Investment Grade Risk |
X | X | ||||||
| Bond Market Liquidity Risk |
X | X | ||||||
| Call Risk |
X | X | ||||||
| Convertible Securities Risk |
X | X | ||||||
| Credit Risk |
X | X | ||||||
| Credit Spread Risk |
X | X | ||||||
| Debt Securities Risk |
X | X | ||||||
| Defaulted and Distressed Securities Risk |
X | X | ||||||
| Deflation Risk |
X | X | ||||||
| Derivatives Risk |
X | X | ||||||
| Duration Risk |
X | X | ||||||
| Emerging Markets Risk |
X | X | ||||||
| Financial Futures and Options Transactions Risk |
X | X | ||||||
| Foreign Currency Risk |
X | X | ||||||
| Hedging Risk |
X | X | ||||||
| Illiquid Investments Risk |
X | X | ||||||
| Income Risk |
X | X | ||||||
| Inflation Risk |
X | X | ||||||
| Interest Rate Risk |
X | X | ||||||
| Loan Participation Risk |
X | X | ||||||
| Loan Risk |
X | X | ||||||
| Non-U.S. Securities Risk |
X | X | ||||||
| Other Investment Companies Risk |
X | X | ||||||
| Preferred Securities Risk |
X | X | ||||||
| Reinvestment Risk |
X | X | ||||||
| Second Lien Loans and Unsecured Loans Risk |
X | X | ||||||
| Senior Loan Agent Risk |
X | X | ||||||
| Senior Loan Risk |
X | X | ||||||
| Subordinated Loans and Other Subordinated Debt Instruments |
X | X | ||||||
| Swap Transactions Risk |
X | X | ||||||
| Unrated Securities Risk |
X | X | ||||||
| Valuation Risk |
X | X | ||||||
| Zero Coupon Bonds Risk |
X | X | ||||||
58
| Risk | Nuveen Corporate Income November 2021 Target Term Fund (JHB) |
Nuveen Corporate Income 2023 Target Term Fund (JHAA) | ||
| Fund Level and Other Risks | ||||
| Anti-Takeover Provisions |
X | X | ||
| Borrowing Risk |
X | X | ||
| Cybersecurity Risk |
X | X | ||
| Global Economic Risk |
X | X | ||
| Investment and Market Risk |
X | X | ||
| Legislation and Regulatory Risk |
X | X | ||
| Leverage Risk |
— | X | ||
| Limited Term Risk |
X | X | ||
| Market Discount from Net Asset Value |
X | X | ||
| Recent Market Conditions |
X | X | ||
| Reverse Repurchase Agreement Risk |
— | X | ||
| Tax Risk |
X | X | ||
Portfolio Level Risks:
Below Investment Grade Risk. Securities of below investment grade quality are regarded as having speculative characteristics with respect to the issuer’s capacity to pay interest and repay principal, and may be subject to higher price volatility and default risk than investment grade securities of comparable terms and duration. Issuers of lower grade securities may be highly leveraged and may not have available to them more traditional methods of financing. The prices of these lower grade securities are typically more sensitive to negative developments, such as a decline in the issuer’s revenues or a general economic downturn. The secondary market for lower rated securities may not be as liquid as the secondary market for more highly rated securities, a factor which may have an adverse effect on the Fund’s ability to dispose of a particular security. If a below investment grade security goes into default, or its issuer enters bankruptcy, it might be difficult to sell that security in a timely manner at a reasonable price.
Bond Market Liquidity Risk. Dealer inventories of bonds, which provide an indication of the ability of financial intermediaries to “make markets” in those bonds, are at or near historic lows in relation to market size. This reduction in market making capacity has the potential to decrease liquidity and increase price volatility in the fixed income markets in which the Fund invests, particularly during periods of economic or market stress. In addition, recent federal banking regulations may cause certain dealers to reduce their inventories of bonds, which may further decrease the Fund’s ability to buy or sell bonds. As a result of this decreased liquidity, the Fund may have to accept a lower price to sell a security, sell other securities to raise cash, or give up an investment opportunity, any of which could have a negative effect on performance. If the Fund needed to sell large blocks of bonds to raise cash, those sales could further reduce the bonds’ prices and hurt performance.
Call Risk. The Fund may invest in securities that are subject to call risk. Such securities may be redeemed at the option of the issuer, or “called,” before their stated maturity or redemption date. In general, an issuer will call its instruments if they can be refinanced by issuing new instruments that bear a lower interest rate. The Fund is subject to the possibility that during periods of falling interest rates, an issuer will call its high yielding securities. The Fund would then be forced to invest the unanticipated proceeds at lower interest rates, resulting in a decline in the Fund’s income.
Convertible Securities Risk. Convertible securities have characteristics of both equity and debt securities and, as a result, are exposed to certain additional risks that are typically associated with debt, including but not limited to Interest Rate Risk, Credit Risk, Below Investment Grade Risk and Unrated Securities Risk. The value of a convertible security is influenced by both the yield of non-convertible securities of comparable issuers and by the value of the underlying common stock. Convertible securities generally offer lower interest or dividend yields than non-convertible securities of similar credit quality. The market values of convertible securities tend to decline as interest rates increase and, conversely, to increase as interest rates decline. However, the convertible security’s market value tends to reflect the market price of the common stock of the issuing company when that stock price is greater than the convertible security’s “conversion price.” The conversion price is defined as the predetermined price at which the convertible security could be exchanged for the associated common stock. As the market price of the underlying common stock declines, the price of the convertible security tends to be influenced more by the yield of the convertible security. Thus, the convertible security may not decline in price to the same extent as the underlying common stock. Convertible securities fall below debt obligations of the same issuer in order of preference or priority in the event of a liquidation and are typically unrated or rated lower than such debt obligations.
59
Shareholder Update (continued)
(Unaudited)
Credit Risk. Issuers of securities in which the Fund may invest may default on their obligations to pay principal or interest when due. This non-payment would result in a reduction of income to the Fund, a reduction in the value of a security experiencing non-payment and potentially a decrease in the net asset value (“NAV”) of the Fund. To the extent that the credit rating assigned to a security in the Fund’s portfolio is downgraded, the market price and liquidity of such security may be adversely affected.
Credit Spread Risk. Credit spread risk is the risk that credit spreads (i.e., the difference in yield between securities that is due to differences in their credit quality) may increase when the market believes that securities generally have a greater risk of default. Increasing credit spreads may reduce the market values of the Fund’s securities. Credit spreads often increase more for lower rated and unrated securities than for investment grade securities. In addition, when credit spreads increase, reductions in market value will generally be greater for longer-maturity securities.
Debt Securities Risk. Issuers of debt instruments in which the Fund may invest may default on their obligations to pay principal or interest when due. This non-payment would result in a reduction of income to the Fund, a reduction in the value of a debt instrument experiencing non-payment and, potentially, a decrease in the NAV of the Fund. There can be no assurance that liquidation of collateral would satisfy the issuer’s obligation in the event of non-payment of scheduled interest or principal or that such collateral could be readily liquidated. In the event of bankruptcy of an issuer, the Fund could experience delays or limitations with respect to its ability to realize the benefits of any collateral securing a security. To the extent that the credit rating assigned to a security in the Fund’s portfolio is downgraded, the market price and liquidity of such security may be adversely affected.
Defaulted and Distressed Securities Risk. The Fund may hold investments that at the time of purchase are not in default or involved in bankruptcy or insolvency proceedings, but may later become so. Moreover, the Fund may invest in low-rated securities that, although not in default, may be “distressed,” meaning that the issuer is experiencing financial difficulties or distress at the time of acquisition. Such securities would present a substantial risk of future default which may cause the Fund to incur losses, including additional expenses, to the extent it is required to seek recovery upon a default in the payment of principal or interest on those securities. In any reorganization or liquidation proceeding relating to a portfolio security, the Fund may lose its entire investment or may be required to accept cash or securities with a value less than its original investment. Defaulted or distressed securities may be subject to restrictions on resale.
Deflation Risk. Deflation risk is the risk that prices throughout the economy decline over time. Deflation may have an adverse effect on the creditworthiness of issuers and may make issuer default more likely, which may result in a decline in the value of the Fund’s portfolio.
Derivatives Risk. The use of derivatives involves additional risks and transaction costs which could leave the Fund in a worse position than if it had not used these instruments. Derivative instruments can be used to acquire or to transfer the risk and returns of a security or other asset without buying or selling the security or asset. These instruments may entail investment exposures that are greater than their cost would suggest. As a result, a small investment in derivatives can result in losses that greatly exceed the original investment. Derivatives can be highly volatile, illiquid and difficult to value. An over-the-counter derivative transaction between the Fund and a counterparty that is not cleared through a central counterparty also involves the risk that a loss may be sustained as a result of the failure of the counterparty to the contract to make required payments. The payment obligation for a cleared derivative transaction is guaranteed by a central counterparty, which exposes the Fund to the creditworthiness of the central counterparty.
It is possible that developments in the derivatives market, including changes in government regulation, could adversely impact the Fund’s ability to invest in certain derivatives.
Duration Risk. Duration is the sensitivity, expressed in years, of the price of a fixed-income security to changes in the general level of interest rates (or yields). Securities with longer durations tend to be more sensitive to interest rate (or yield) changes, which typically corresponds to increased volatility and risk, than securities with shorter durations. For example, if a security or portfolio has a duration of three years and interest rates increase by 1%, then the security or portfolio would decline in value by approximately 3%. Duration differs from maturity in that it considers potential changes to interest rates, and a security’s coupon payments, yield, price and par value and call features, in addition to the amount of time until the security matures. The duration of a security will be expected to change over time with changes in market factors and time to maturity.
Emerging Markets Risk. Risks of investing in securities of emerging markets issuers include: smaller market capitalization of securities markets, which may suffer periods of relative illiquidity; significant price volatility; restrictions on foreign investment; and possible restrictions on repatriation of investment income and capital. In addition, foreign investors may be required to register the proceeds of sales; and future economic or political crises could lead to price controls, forced mergers, expropriation or confiscatory taxation, seizure, nationalization, or creation of government monopolies. Certain emerging markets also may face other significant internal or external risks, including a heightened risk of war, and ethnic, religious and racial conflicts. In addition, governments in many emerging market countries participate to a significant degree in their economies and securities markets, which may impair investment and economic growth, and which may in turn diminish the value of the securities in those markets. The considerations noted below in “Non-U.S. Securities Risk” are generally intensified for investments in emerging market countries.
Financial Futures and Options Transactions Risk. The Fund may use certain transactions for hedging the portfolio’s exposure to credit risk and the risk of increases in interest rates, which could result in poorer overall performance for the Fund. There may be an imperfect correlation between price movements of the futures and options and price movements of the portfolio securities being hedged.
60
If the Fund engages in futures transactions or in the writing of options on futures, it will be required to maintain initial margin and maintenance margin and may be required to make daily variation margin payments in accordance with applicable rules of the exchanges and the Commodity Futures Trading Commission (“CFTC”). If the Fund purchases a financial futures contract or a call option or writes a put option in order to hedge the anticipated purchase of securities, and if the Fund fails to complete the anticipated purchase transaction, the Fund may have a loss or a gain on the futures or options transaction that will not be offset by price movements in the securities that were the subject of the anticipatory hedge. There can be no assurance that a liquid market will exist at a time when the Fund seeks to close out a derivatives or futures or a futures option position, and the Fund would remain obligated to meet margin requirements until the position is closed.
Foreign Currency Risk. Because the Fund may invest in securities denominated or quoted in currencies other than the U.S. dollar, changes in foreign currency exchange rates may affect the value of securities held by the Fund and the unrealized appreciation or depreciation of investments. Currencies of certain countries may be volatile and therefore may affect the value of securities denominated in such currencies, which means that the Fund’s NAV could decline as a result of changes in the exchange rates between foreign currencies and the U.S. dollar. In addition, certain countries, particularly emerging market countries, may impose foreign currency exchange controls or other restrictions on the transferability, repatriation or convertibility of currency.
Hedging Risk. The Fund’s use of derivatives or other transactions to reduce risk involves costs and will be subject to the investment adviser’s and/or the sub-adviser’s ability to predict correctly changes in the relationships of such hedge instruments to the Fund’s portfolio holdings or other factors. No assurance can be given that the investment adviser’s and/or the sub-adviser’s judgment in this respect will be correct, and no assurance can be given that the Fund will enter into hedging or other transactions at times or under circumstances in which it may be advisable to do so. Hedging activities may reduce the Fund’s opportunities for gain by offsetting the positive effects of favorable price movements and may result in net losses.
Illiquid Investments Risk. Illiquid investments are investments that are not readily marketable and may include restricted securities, which are securities that may not be resold unless they have been registered under the 1933 Act or that can be sold in a private transaction pursuant to an available exemption from such registration. Illiquid investments involve the risk that the investments will not be able to be sold at the time desired by the Fund or at prices approximating the value at which the Fund is carrying the investments on its books from time to time.
Income Risk. The Fund’s income could decline due to falling market interest rates. This is because, in a falling interest rate environment, the Fund generally will have to invest the proceeds from maturing portfolio securities in lower-yielding securities.
Inflation Risk. Inflation risk is the risk that the value of assets or income from investments will be worth less in the future as inflation decreases the value of money. As inflation increases, the real value of the common shares and distributions can decline.
Interest Rate Risk. Interest rate risk is the risk that securities in the Fund’s portfolio will decline in value because of changes in market interest rates. Generally, when market interest rates rise, the market value of such securities will fall, and vice versa. As interest rates decline, issuers of securities may prepay principal earlier than scheduled, forcing the Fund to reinvest in lower-yielding securities and potentially reducing the Fund’s income. As interest rates increase, slower than expected principal payments may extend the average life of securities, potentially locking in a below-market interest rate and reducing the Fund’s value. In typical market interest rate environments, the prices of longer-term securities generally fluctuate more than prices of shorter-term securities as interest rates change.
Loan Participation Risk. The Fund may purchase a participation interest in a loan and by doing so acquire some or all of the interest of a bank or other lending institution in a loan to a borrower. A participation typically will result in the Fund having a contractual relationship only with the lender, not the borrower. As a result, the Fund assumes the credit risk of the lender selling the participation in addition to the credit risk of the borrower. By purchasing a participation, the Fund will have the right to receive payments of principal, interest and any fees to which it is entitled only from the lender selling the participation and only upon receipt by the lender of the payments from the borrower. In the event of insolvency or bankruptcy of the lender selling the participation, the Fund may be treated as a general creditor of the lender and may not have a senior claim to the lender’s interest in the loan. If the Fund only acquires a participation in the loan made by a third party, the Fund may not be able to control the exercise of any remedies that the lender would have under the loan. Such third party participation arrangements are designed to give loan investors preferential treatment over high yield investors in the event of a deterioration in the credit quality of the borrower. Even when these arrangements exist, however, there can be no assurance that the principal and interest owed on the loan will be repaid in full.
Loan Risk. The lack of an active trading market for certain loans may impair the ability of the Fund to realize full value in the event of the need to sell a loan and may make it difficult to value such loans. Portfolio transactions in loans may settle in as short as seven days but typically can take up to two or three weeks, and in some cases much longer. As a result of these extended settlement periods, the Fund may incur losses if it is required to sell other investments or temporarily borrow to meet its cash needs, including satisfying redemption requests. The risks associated with unsecured loans, which are not backed by a security interest in any specific collateral, are higher than those for comparable loans that are secured by specific collateral. For secured loans, there is a risk that the value of any collateral securing a loan in which the Fund has an interest may decline and that the collateral may not be sufficient to cover the amount owed on the loan. Interests in loans made to finance highly leveraged companies or transactions such as corporate acquisitions may be especially vulnerable to adverse changes in economic or market conditions. Loans may have restrictive covenants limiting the ability
61
Shareholder Update (continued)
(Unaudited)
of a borrower to further encumber its assets. However, in periods of high demand by lenders like the Fund for loan investments, borrowers may limit these covenants and weaken a lender’s ability to access collateral securing the loan; reprice the credit risk associated with the borrower; and mitigate potential loss. The Fund may experience relatively greater realized or unrealized losses or delays and expenses in enforcing its rights with respect to loans with fewer restrictive covenants. Additionally, loans may not be considered “securities” and, as a result, the Fund may not be entitled to rely on the anti-fraud protections of the securities laws. Because junior loans have a lower place in an issuer’s capital structure and may be unsecured, junior loans involve a higher degree of overall risk than senior loans of the issuer.
Non-U.S. Securities Risk. Investments in securities of non-U.S. issuers involve special risks, including: less publicly available information about non-U.S. issuers or markets due to less rigorous disclosure or accounting standards or regulatory practices; many non-U.S. markets are smaller, less liquid and more volatile; the economies of non-U.S. countries may grow at slower rates than expected or may experience a downturn or recession; the impact of economic, political, social or diplomatic events; and withholding and other non-U.S. taxes may decrease the Fund’s return. These risks are more pronounced to the extent that the Fund invests a significant amount of its assets in issuers located in one region.
Other Investment Companies Risk. The Fund may invest in the securities of other investment companies, including ETFs. Investing in an investment company exposes the Fund to all of the risks of that investment company’s investments. The Fund, as a holder of the securities of other investment companies, will bear its pro rata portion of the other investment companies’ expenses, including advisory fees. These expenses are in addition to the direct expenses of the Fund’s own operations. As a result, the cost of investing in investment company shares may exceed the costs of investing directly in its underlying investments. In addition, securities of other investment companies may be leveraged. As a result, the Fund may be indirectly exposed to leverage through an investment in such securities and therefore magnify the Fund’s leverage risk.
With respect to ETF’s, an ETF that is based on a specific index may not be able to replicate and maintain exactly the composition and relative weighting of securities in the index. The value of an ETF based on a specific index is subject to change as the values of its respective component assets fluctuate according to market volatility. ETFs typically rely on a limited pool of authorized participants to create and redeem shares, and an active trading market for ETF shares may not develop or be maintained. The market value of shares of ETFs and closed-end funds may differ from their NAV.
Preferred Securities Risk. Preferred securities are subordinated to bonds and other debt instruments in a company’s capital structure, and therefore are subject to greater credit risk. In addition, preferred stockholders (such as the Fund, to the extent it invests in preferred stocks of other issuers) generally have no voting rights with respect to the issuing company unless preferred dividends have been in arrears for a specified number of periods, at which time the preferred stockholders may elect a number of directors to the issuer’s board. Generally, once all the arrearages have been paid, the preferred stockholders no longer have voting rights. In the case of certain taxable preferred stocks, holders generally have no voting rights, except (i) if the issuer fails to pay dividends for a specified period of time or (ii) if a declaration of default occurs and is continuing. In such an event, rights of preferred stockholders generally would include the right to appoint and authorize a trustee to enforce the trust or special purpose entity’s rights as a creditor under the agreement with its operating company. In certain varying circumstances, an issuer of preferred stock may redeem the securities prior to a specified date. For instance, for certain types of preferred stock, a redemption may be triggered by a change in U.S. federal income tax or securities laws. As with call provisions, a redemption by the issuer may negatively impact the return of the security held by the Fund.
Reinvestment Risk. Reinvestment risk is the risk that income from the Fund’s portfolio will decline if and when the Fund invests the proceeds from matured, traded or called securities at market interest rates that are below the portfolio’s current earnings rate. A decline in income could affect the common shares’ market price, NAV and/or a common shareholder’s overall returns.
Second Lien Loans and Unsecured Loans Risk. Second lien loans and unsecured loans generally are subject to the same risks associated with investments in senior loans, as discussed below. Because second lien loans and unsecured loans are lower in priority of payment to senior loans, they are subject to the additional risk that the cash flow of the borrower and property securing the loan, if any, may be insufficient to meet scheduled payments after giving effect to the senior secured obligations of the borrower. This risk is generally higher for unsecured loans, which are not backed by a security interest in any specific collateral. Second lien loans and unsecured loans are expected to have greater price volatility than senior loans and may be less liquid. Second lien loans and unsecured loans of below investment grade quality also share the same risks of other below investment grade debt instruments.
Senior Loan Agent Risk. A financial institution’s employment as an agent under a senior loan might be terminated in the event that it fails to observe a requisite standard of care or becomes insolvent. A successor agent would generally be appointed to replace the terminated agent, and assets held by the agent under the loan agreement would likely remain available to holders of such indebtedness. However, if assets held by the terminated agent for the benefit of the Fund were determined to be subject to the claims of the agent’s general creditors, the Fund might incur certain costs and delays in realizing payment on a senior loan or loan participation and could suffer a loss of principal and/or interest. In situations involving other interposed financial institutions (e.g., an insurance company or government agency) similar risks may arise.
Senior Loan Risk. Senior loans typically hold the most senior position in the capital structure of a business entity, are typically secured with specific collateral and have a claim on the assets and/or stock of the issuer that is senior to that held by subordinated debt holders and stockholders of the issuer. Senior loans are usually rated below investment grade, and share the same risks of other below investment grade debt instruments.
62
Although the Fund may invest in senior loans that are secured by specific collateral, there can be no assurance that the liquidation of such collateral would satisfy an issuer’s obligation to the Fund in the event of issuer default or that such collateral could be readily liquidated under such circumstances. If the terms of a senior loan do not require the issuer to pledge additional collateral in the event of a decline in the value of the already pledged collateral, the Fund will be exposed to the risk that the value of the collateral will not at all times equal or exceed the amount of the issuer’s obligations under the senior loan.
In the event of bankruptcy of an issuer, the Fund could also experience delays or limitations with respect to its ability to realize the benefits of any collateral securing a senior loan. Some senior loans are subject to the risk that a court, pursuant to fraudulent conveyance or other similar laws, could subordinate the senior loans to presently existing or future indebtedness of the issuer or take other action detrimental to lenders, including the Fund. Such court action could under certain circumstances include invalidation of senior loans.
Subordinated Loans and Other Subordinated Debt Instruments Risk. Issuers of subordinated loans and other subordinated debt instruments in which the Fund may invest usually will have, or may be permitted to incur, other debt that ranks equally with, or senior to, the subordinated loans or other subordinated debt instruments. By their terms, such debt instruments may provide that the holders are entitled to receive payment of interest or principal on or before the dates on which the Fund is entitled to receive payments in respect of subordinated loans or other subordinated debt instruments in which it invests. Also, in the event of insolvency, liquidation, dissolution, reorganization or bankruptcy of an issuer, holders of debt instruments ranking senior to the subordinated loan or other debt instrument in which the Fund invests would typically be entitled to receive payment in full before the Fund receives any distribution in respect of its investment. After repaying such senior creditors, such issuer may not have any remaining assets to use for repaying its obligation to the Fund. In the case of debt ranking equally with subordinated loans or other subordinated debt instruments in which the Fund invests, the Fund would have to share on an equal basis any distributions with other creditors holding such debt in the event of an insolvency, liquidation, dissolution, reorganization or bankruptcy of the relevant issuer. In addition, the Fund will likely not be in a position to control any issuer by investing in its debt instruments. As a result, the Fund will be subject to the risk that an issuer in which it invests may make business decisions with which the Fund disagrees and the management of such issuer, as representatives of the holders of their common equity, may take risks or otherwise act in ways that do not serve the Fund’s interests as a debt investor.
Swap Transactions Risk. The Fund may enter into derivative instruments such as credit default swap contracts and interest rate swaps. Like most derivative instruments, the use of swaps is a highly specialized activity that involves investment techniques and risks different from those associated with ordinary portfolio securities transactions. In addition, the use of swaps requires an understanding by the adviser and/or the sub-adviser of not only the referenced asset, rate or index, but also of the swap itself. If the investment adviser and/or the sub-adviser is incorrect in its forecasts of default risks, market spreads or other applicable factors or events, the investment performance of the Fund would diminish compared with what it would have been if these techniques were not used.
Unrated Securities Risk. The Fund may purchase securities that are not rated by any rating organization. The investment adviser may, after assessing such securities’ credit quality, internally assign ratings to certain of those securities in categories similar to those of rating organizations. Some unrated securities may not have an active trading market or may be difficult to value, which means the Fund might have difficulty selling them promptly at an acceptable price. To the extent that the Fund invests in unrated securities, the Fund’s ability to achieve its investment objectives will be more dependent on the investment adviser’s credit analysis than would be the case when the Fund invests in rated securities.
Valuation Risk. The securities in which the Fund invests typically are valued by a pricing service utilizing a range of market-based inputs and assumptions, including readily available market quotations obtained from broker-dealers making markets in such instruments, cash flows and transactions for comparable instruments. There is no assurance that the Fund will be able to sell a portfolio security at the price established by the pricing service, which could result in a loss to the Fund. Pricing services generally price securities assuming orderly transactions of an institutional “round lot” size, but some trades may occur in smaller, “odd lot” sizes, often at lower prices than institutional round lot trades. Different pricing services may incorporate different assumptions and inputs into their valuation methodologies, potentially resulting in different values for the same securities. As a result, if the Fund were to change pricing services, or if the Fund’s pricing service were to change its valuation methodology, there could be a material impact, either positive or negative, on the Fund’s NAV.
Zero Coupon Bonds Risk. Because interest on zero coupon bonds is not paid on a current basis, the values of zero coupon bonds will be more volatile in response to interest rate changes than the values of bonds that distribute income regularly. Although zero coupon bonds generate income for accounting purposes, they do not produce cash flow, and thus the Fund could be forced to liquidate securities at an inopportune time in order to generate cash to distribute to shareholders as required by tax laws.
Fund Level and Other Risks:
Anti-Takeover Provisions. The Fund’s organizational documents include provisions that could limit the ability of other entities or persons to acquire control of the Fund or convert the Fund to open-end status. These provisions could have the effect of depriving the common shareholders of opportunities to sell their common shares at a premium over the then-current market price of the common shares.
63
Shareholder Update (continued)
(Unaudited)
Counterparty Risk. Changes in the credit quality of the companies that serve as the Fund’s counterparties with respect to derivatives or other transactions supported by another party’s credit will affect the value of those instruments. Certain entities that have served as counterparties in the markets for these transactions have incurred or may incur in the future significant financial hardships including bankruptcy and losses as a result of exposure to sub-prime mortgages and other lower-quality credit investments. As a result, such hardships have reduced these entities’ capital and called into question their continued ability to perform their obligations under such transactions. By using such derivatives or other transactions, the Fund assumes the risk that its counterparties could experience similar financial hardships. In the event of the insolvency of a counterparty, the Fund may sustain losses or be unable to liquidate a derivatives position.
Cybersecurity Risk. The Fund and its service providers are susceptible to operational and information security risk resulting from cyber incidents. Cyber incidents refer to both intentional attacks and unintentional events including: processing errors, human errors, technical errors including computer glitches and system malfunctions, inadequate or failed internal or external processes, market-wide technical-related disruptions, unauthorized access to digital systems (through “hacking” or malicious software coding), computer viruses, and cyber-attacks which shut down, disable, slow or otherwise disrupt operations, business processes or website access or functionality (including denial of service attacks). Cyber incidents could adversely impact the Fund and cause the Fund to incur financial loss and expense, as well as face exposure to regulatory penalties, reputational damage, and additional compliance costs associated with corrective measures. In addition, substantial costs may be incurred in order to prevent any cyber incidents in the future. Furthermore, the Fund cannot control the cybersecurity plans and systems put in place by its service providers or any other third parties whose operations may affect the Fund.
Global Economic Risk. National and regional economies and financial markets are becoming increasingly interconnected, which increases the possibilities that conditions in one country, region or market might adversely impact issuers in a different country, region or market. Changes in legal, political, regulatory, tax and economic conditions may cause fluctuations in markets and securities prices around the world, which could negatively impact the value of the Fund’s investments. Major economic or political disruptions, particularly in large economies like China’s, may have global negative economic and market repercussions. Additionally, events such as war, terrorism, natural and environmental disasters and the spread of infectious illnesses or other public health emergencies may adversely affect the global economy and the markets and issuers in which the Fund invests. Recent examples of such events include the outbreak of a novel coronavirus known as COVID-19 that was first detected in China in December 2019 and heightened concerns regarding North Korea’s nuclear weapons and long-range ballistic missile programs. These events could reduce consumer demand or economic output, result in market closure, travel restrictions or quarantines, and generally have a significant impact on the economy. These events could also impair the information technology and other operational systems upon which the Fund’s service providers, including the investment adviser and sub-adviser, rely, and could otherwise disrupt the ability of employees of the Fund’s service providers to perform essential tasks on behalf of the Fund. Governmental and quasi-governmental authorities and regulators throughout the world have in the past responded to major economic disruptions with a variety of significant fiscal and monetary policy changes, including but not limited to, direct capital infusions into companies, new monetary programs and dramatically lower interest rates. An unexpected or quick reversal of these policies, or the ineffectiveness of these policies, could increase volatility in securities markets, which could adversely affect the Fund’s investments.
Investment and Market Risk. An investment in common shares is subject to investment risk, including the possible loss of the entire principal amount that you invest. Common shares frequently trade at a discount to their NAV. An investment in common shares represents an indirect investment in the securities owned by the Fund. Common shares at any point in time may be worth less than your original investment, even after taking into account the reinvestment of Fund dividends and distributions.
Legislation and Regulatory Risk. At any time after the date of this report, legislation or additional regulations may be enacted that could negatively affect the assets of the Fund, securities held by the Fund or the issuers of such securities. Fund shareholders may incur increased costs resulting from such legislation or additional regulation. There can be no assurance that future legislation, regulation or deregulation will not have a material adverse effect on the Fund or will not impair the ability of the Fund to achieve its investment objectives.
The SEC recently adopted rules governing the use of derivatives by registered investment companies, which could affect the nature and extent of derivatives used by the Fund. The full impact of such rules is uncertain at this time. It is possible that such rules, as interpreted, applied and enforced by the SEC, could limit the implementation of the Fund’s use of derivatives, which could have an adverse impact on the Fund.
Leverage Risk. The use of leverage creates special risks for common shareholders, including potential interest rate risks and the likelihood of greater volatility of NAV and market price of, and distributions on, the common shares. The use of leverage in a declining market will likely cause a greater decline in the Fund’s NAV, which may result at a greater decline of the common share price, than if the Fund were not to have used leverage.
The Fund will pay (and common shareholders will bear) any costs and expenses relating to the Fund’s use of leverage, which will result in a reduction in the Fund’s NAV. The investment adviser may, based on its assessment of market conditions and composition of the Fund’s holdings, increase or decrease the amount of leverage. Such changes may impact the Fund’s distributions and the price of the common shares in the secondary market.
64
The Fund may seek to refinance its leverage over time, in the ordinary course, as current forms of leverage mature or it is otherwise desirable to refinance; however, the form that such leverage will take cannot be predicted at this time. If the Fund is unable to replace existing leverage on comparable terms, its costs of leverage will increase. Accordingly, there is no assurance that the use of leverage may result in a higher yield or return to common shareholders.
The amount of fees paid to the investment adviser and the sub-advisor for investment advisory services will be higher if the Fund uses leverage because the fees will be calculated based on the Fund’s Managed Assets — this may create an incentive for the investment adviser and the sub-advisor to leverage the Fund or increase the Fund’s leverage.
Limited Term Risk. Because the assets of the Fund will be liquidated in connection with its termination, the Fund may be required to sell portfolio securities when it otherwise would not, including at times when market conditions are not favorable, or at a time when a particular security is in default or bankruptcy, or otherwise in severe distress, which may cause the Fund to lose money. Although the Fund has an investment objective of returning Original NAV to shareholders on or about the Termination Date, the Fund may not be successful in achieving this objective. The return of Original NAV is not an express or implied guarantee obligation of the Fund. There can be no assurance that the Fund will be able to return Original NAV to shareholders, and such return is not backed or otherwise guaranteed by Nuveen or any other entity.
The Fund’s ability to return Original NAV to Common Shareholders on or about the Termination Date will depend on market conditions, the presence or absence of defaulted or distressed securities in the Fund’s portfolio that may prevent those securities from being sold in a timely manner at a reasonable price, and various portfolio and cash flow management techniques. The Fund currently intends to set aside and retain in its net assets (and therefore its NAV) a portion of its net investment income, and possibly all or a portion of its gains, in pursuit of its objective to return Original NAV to Common Shareholders upon termination. This will reduce the amounts otherwise available for distribution prior to the liquidation of the Fund. In addition, the Fund’s investment in shorter term and lower yielding securities, especially as the Fund nears its Termination Date, may reduce investment income and, therefore, the monthly dividends during the period closely prior to termination. To the extent that lower distribution rates may negatively impact Common Share price, such reduced yield and monthly dividends may cause a reduction of Common Share price. The Fund’s final distribution to Common Shareholders will be based upon the Fund’s NAV at the Termination Date. Any investors who purchase Common Shares (particularly if their purchase price differs meaningfully from the original offering price) may receive less than their original investment. Rather than reinvesting the proceeds of its securities, the Fund may also distribute the proceeds in one or more distributions prior to the final liquidation, which may cause the Fund’s fixed expenses to increase when expressed as a percentage of net assets attributable to Common Shares. Depending upon a variety of factors, including the performance of the Fund’s portfolio over the life of the Fund, the amount distributed to Common Shareholders may be significantly less than Original NAV, or their original investment.
Because the Fund will invest in below investment grade securities, it may be exposed to the greater potential for an issuer of its securities to default, as compared to a fund that invests solely in investment grade securities. As a result, should a Fund portfolio holding default, this may significantly reduce net investment income and, therefore, Common Share dividends; may prevent or inhibit the Fund from fully being able to liquidate its portfolio at or prior to the Termination Date; and may severely impact the Fund’s ability to return Original NAV to Common Shareholders on or about the Termination Date.
Market Discount from Net Asset Value. Shares of closed-end investment companies like the Fund frequently trade at prices lower than their NAV. This characteristic is a risk separate and distinct from the risk that the Fund’s NAV could decrease as a result of investment activities. Whether investors will realize gains or losses upon the sale of the common shares will depend not upon the Fund’s NAV but entirely upon whether the market price of the common shares at the time of sale is above or below the investor’s purchase price for the common shares. Furthermore, management may have difficulty meeting the Fund’s investment objectives and managing its portfolio when the underlying securities are redeemed or sold during periods of market turmoil and as investors’ perceptions regarding closed-end funds or their underlying investments change. Because the market price of the common shares will be determined by factors such as relative supply of and demand for the common shares in the market, general market and economic circumstances, and other factors beyond the control of the Fund, the Fund cannot predict whether the common shares will trade at, below or above NAV. The common shares are designed primarily for long-term investors, and you should not view the Fund as a vehicle for short-term trading purposes.
Recent Market Conditions. In response to the financial crisis and recent market events, policy and legislative changes by the United States government and the Federal Reserve to assist in the ongoing support of financial markets, both domestically and in other countries, are changing many aspects of financial regulation. The impact of these changes on the markets, and the practical implications for market participants, may not be fully known for some time. Withdrawal of government support, failure of efforts in response to the crisis, or investor perception that such efforts are not succeeding, could adversely impact the value and liquidity of certain securities. The severity or duration of adverse economic conditions may also be affected by policy changes made by governments or quasi-governmental organizations, including changes in tax laws and the imposition of trade barriers. The impact of new financial regulation legislation on the markets and the practical implications for market participants may not be fully known for some time. Changes to the Federal Reserve policy may affect the value, volatility and liquidity of dividend and interest paying securities. In addition, the contentious domestic political environment, as well as political and diplomatic events within the United States and abroad, such as the U.S. government’s inability at times to agree on a long-term budget and deficit reduction plan, the threat of a federal government shutdown and threats not to increase the federal government’s debt
65
Shareholder Update (continued)
(Unaudited)
limit, may affect investor and consumer confidence and may adversely impact financial markets and the broader economy, perhaps suddenly and to a significant degree.
Interest rates have been unusually low in recent years in the United States and abroad but there is consensus that interest rates will increase during the life of the Fund, which could negatively impact the price of debt securities. Because there is little precedent for this situation, it is difficult to predict the impact of a significant rate increase on various markets.
The current political climate has intensified concerns about a potential trade war between China and the United States, as each country has recently imposed tariffs on the other country’s products. These actions may trigger a significant reduction in international trade, the oversupply of certain manufactured goods, substantial price reductions of goods and possible failure of individual companies and/or large segments of China’s export industry, which could have a negative impact on the Fund’s performance.
The impact of these developments in the near- and long-term is unknown and could have additional adverse effects on economies, financial markets and asset valuations around the world.
Reverse Repurchase Agreement Risk. A reverse repurchase agreement, in economic essence, constitutes a securitized borrowing by the Fund from the security purchaser. The Fund may enter into reverse repurchase agreements for the purpose of creating a leveraged investment exposure and, as such, their usage involves essentially the same risks associated with a leveraging strategy generally since the proceeds from these agreements may be invested in additional portfolio securities. Reverse repurchase agreements tend to be short-term in tenor, and there can be no assurances that the purchaser (lender) will commit to extend or “roll” a given agreement upon its agreed-upon repurchase date or an alternative purchaser can be identified on similar terms. Reverse repurchase agreements also involve the risk that the purchaser fails to return the securities as agreed upon, files for bankruptcy or becomes insolvent. The Fund may be restricted from taking normal portfolio actions during such time, could be subject to loss to the extent that the proceeds of the agreement are less than the value of securities subject to the agreement and may experience adverse tax consequences.
Tax Risk. The Fund has elected to be treated and intends to qualify each year as a Regulated Investment Company (“RIC”) under the Internal Revenue Code of 1986, as amended (the “Code”). As a RIC, the Fund is not expected to be subject to U.S. federal income tax to the extent that it distributes its investment company taxable income and net capital gains. To qualify for the special tax treatment available to a RIC, the Fund must comply with certain investment, distribution, and diversification requirements. Under certain circumstances, the Fund may be forced to sell certain assets when it is not advantageous in order to meet these requirements, which may reduce the Fund’s overall return. If the Fund fails to meet any of these requirements, subject to the opportunity to cure such failures under applicable provisions of the Code, the Fund’s income would be subject to a double level of U.S. federal income tax. The Fund’s income, including its net capital gain, would first be subject to U.S. federal income tax at regular corporate rates, even if such income were distributed to shareholders and, second, all distributions by the Fund from earnings and profits, including distributions of net capital gain (if any), would be taxable to shareholders as dividends. Although the Fund intends to distribute sufficient amounts to qualify for treatment as a RIC, it will be subject to U.S. federal excise taxes and U.S. federal corporate income taxes to the extent it sets aside and retains in its net assets (and therefore its NAV) a portion of its net investment income in pursuit of its objective of returning Original NAV.
66
EFFECTS OF LEVERAGE
The following table is furnished in response to requirements of the SEC. It is designed to illustrate the effects of leverage through the use of senior securities, as that term is defined under Section 18 of the 1940 Act, as well as certain other forms of leverage, such as bank borrowings, on common share total return, assuming investment portfolio total returns (consisting of income and changes in the value of investments held in a Fund’s portfolio) of -10%, -5%, 0%, 5% and 10%. The table below reflects each Fund’s (i) continued use of leverage as of December 31, 2020 as a percentage of Managed Assets (including assets attributable to such leverage), (ii) the estimated annual effective interest expense rate payable by the Fund on such instruments (based on actual leverage costs incurred during the fiscal year ended December 31, 2020) as set forth in the table, and (iii) the annual return that the Fund’s portfolio must experience (net of expenses) in order to cover such costs of leverage based on such estimated annual effective interest expense rate. The information below does not reflect any Fund’s use of certain other forms of economic leverage achieved through the use of other instruments or transactions not considered to be senior securities under the 1940 Act, such as certain derivative instruments.
The numbers are merely estimates, used for illustration. The costs of leverage may vary frequently and may be significantly higher or lower than the estimated rate. The assumed investment portfolio returns in the table below are hypothetical figures and are not necessarily indicative of the investment portfolio returns experienced or expected to be experienced by the Fund. Your actual returns may be greater or less than those appearing below.
| Nuveen Corporate Income 2023 Target Term Fund (JHAA) | ||
| Estimated Leverage as a Percentage of Managed Assets (Including Assets Attributable to Leverage) |
23.80% | |
| Estimated Annual Effective Leverage Expense Rate Payable by Fund on Leverage |
1.35% | |
| Annual Return Fund Portfolio Must Experience (net of expenses) to Cover Estimated Annual Effective Interest Expense Rate on Leverage |
0.32% | |
| Common Share Total Return for (10.00)% Assumed Portfolio Total Return |
-13.55% | |
| Common Share Total Return for (5.00)% Assumed Portfolio Total Return |
-6.98% | |
| Common Share Total Return for 0.00% Assumed Portfolio Total Return |
-0.42% | |
| Common Share Total Return for 5.00% Assumed Portfolio Total Return |
6.14% | |
| Common Share Total Return for 10.00% Assumed Portfolio Total Return |
12.70% | |
Common Share total return is composed of two elements — the distributions paid by a Fund to holders of common shares (the amount of which is largely determined by the net investment income of the Fund after paying dividend payments on any preferred shares issued by the Fund and expenses on any forms of leverage outstanding) and gains or losses on the value of the securities and other instruments the Fund owns. As required by SEC rules, the table assumes that a Fund is more likely to suffer capital losses than to enjoy capital appreciation. For example, to assume a total return of 0%, a Fund must assume that the income it receives on its investments is entirely offset by losses in the value of those investments. This table reflects hypothetical performance of a Fund’s portfolio and not the actual performance of the Fund’s common shares, the value of which is determined by market forces and other factors. Should a Fund elect to add additional leverage to its portfolio, any benefits of such additional leverage cannot be fully achieved until the proceeds resulting from the use of such leverage have been received by the Fund and invested in accordance with the Fund’s investment objectives and policies. As noted above, a Fund’s willingness to use additional leverage, and the extent to which leverage is used at any time, will depend on many factors.
67
Shareholder Update (continued)
(Unaudited)
DIVIDEND REINVESTMENT PLAN
Nuveen Closed-End Funds Automatic Reinvestment Plan
Your Nuveen Closed-End Fund allows you to conveniently reinvest distributions in additional Fund shares. By choosing to reinvest, you’ll be able to invest money regularly and automatically, and watch your investment grow through the power of compounding. Just like distributions in cash, there may be times when income or capital gains taxes may be payable on distributions that are reinvested. It is important to note that an automatic reinvestment plan does not ensure a profit, nor does it protect you against loss in a declining market.
Easy and convenient
To make recordkeeping easy and convenient, each quarter you’ll receive a statement showing your total distributions, the date of investment, the shares acquired and the price per share, and the total number of shares you own.
How shares are purchased
The shares you acquire by reinvesting will either be purchased on the open market or newly issued by the Fund. If the shares are trading at or above NAV at the time of valuation, the Fund will issue new shares at the greater of the NAV or 95% of the then-current market price. If the shares are trading at less than NAV, shares for your account will be purchased on the open market. If Computershare Trust Company, N.A. (the “Plan Agent”) begins purchasing Fund shares on the open market while shares are trading below NAV, but the Fund’s shares subsequently trade at or above their NAV before the Plan Agent is able to complete its purchases, the Plan Agent may cease open-market purchases and may invest the uninvested portion of the distribution in newly-issued Fund shares at a price equal to the greater of the shares’ NAV or 95% of the shares’ market value on the last business day immediately prior to the purchase date. Distributions received to purchase shares in the open market will normally be invested shortly after the distribution payment date. No interest will be paid on distributions awaiting reinvestment. Because the market price of the shares may increase before purchases are completed, the average purchase price per share may exceed the market price at the time of valuation, resulting in the acquisition of fewer shares than if the distribution had been paid in shares issued by the Fund. A pro rata portion of any applicable brokerage commissions on open market purchases will be paid by Dividend Reinvestment Plan (the “Plan”) participants. These commissions usually will be lower than those charged on individual transactions.
Flexible
You may change your distribution option or withdraw from the Plan at any time, should your needs or situation change. You can reinvest whether your shares are registered in your name, or in the name of a brokerage firm, bank, or other nominee. Ask your investment advisor if his or her firm will participate on your behalf. Participants whose shares are registered in the name of one firm may not be able to transfer the shares to another firm and continue to participate in the Plan. The Fund reserves the right to amend or terminate the Plan at any time. Although the Fund reserves the right to amend the Plan to include a service charge payable by the participants, there is no direct service charge to participants in the Plan at this time.
Call today to start reinvesting distributions
For more information on the Nuveen Automatic Reinvestment Plan or to enroll in or withdraw from the Plan, speak with your financial professional or call us at (800) 257-8787.
68
CHANGES OCCURRING DURING THE PRIOR FISCAL YEAR
The following information in this annual report is a summary of certain changes during the most recent fiscal year. This information may not reflect all of the changes that have occurred since you purchased shares of a Fund.
During the most recent fiscal year, there have been no changes to: (i) the Funds’ investment objectives and principal investment policies that have not been approved by shareholders, (ii) the principal risks of the Fund, (iii) the portfolio managers of the Funds; (iv) a Fund’s charter or by-laws that would delay or prevent a change of control of the Fund that have not been approved by shareholders except as follows:
Principal Investment Policies
Effective August 24, 2020, each Fund’s investment policy to invest at least 80% of its Managed Assets in securities that, at the time of investment, are rated below investment grade or are unrated but judged by the Fund’s sub-adviser to be of comparable quality was eliminated. However, each Fund continues to invest at least 80% of its Managed Assets in corporate debt securities.
In connection with the above change, the Board of Trustees of the Nuveen High Income 2023 Target Term Fund (JHAA) and Nuveen High Income November 2021 Target Term Fund (JHB) approved changes to each Fund’s name to the “Nuveen Corporate Income 2023 Target Term Fund” and the “Nuveen Corporate Income November 2021 Target Term Fund”, respectively, effective August 24, 2020.
Changes to Portfolio Managers
Effective August 17, 2020, Jake J. Fitzpatrick and Christopher Williams were named as portfolio managers of the Funds. Their bios are as follows:
Mr. Fitzpatrick is an associate portfolio manager for Nuveen’s global fixed income team and a member of the leveraged finance sector team. He began working in the investment industry in 2006 and joined Nuveen in 2015. Previously, he worked as a co-manager of structured product portfolios at Allianz Investment Management. In that role, he was responsible for the investment strategy and allocation of insurance product premiums within the core capital markets. He began his career at U.S. Bancorp Asset Management, where he was a corporate and municipal bond trader for the firm’s mutual funds and wealth management group. He graduated with a B.S. in Finance from the University of Minnesota’s Carlson School of Management and holds the CFA designation.
Mr. Williams is Head of Leveraged Finance Trading and responsible for overseeing trading high yield bonds, credit default swaps, and loans across Nuveen’s platform in the primary and secondary markets. Mr. Williams also Co-Heads Credit Macro Trading, focused on trading cash, synthetics, and ETFs in the Fixed Income Markets. In addition, he serves as the co-portfolio manager for the CLO strategies. Prior to joining the firm in 2011, he traded leveraged loans and high yield bonds at Gulf Stream Asset Management. He graduated with a B.S. in Business Administration with an emphasis in Finance from Winthrop University.
Effective August 17, 2020, Michael Ainge, CFA, no longer served as portfolio manager of the Funds.
Effective October 1, 2020, Anders Persson, CFA, no longer served as a portfolio manager of the Funds.
Amended and Restated By-Laws
On October 5, 2020, after a rigorous and deliberative review, and consistent with the interests of the Nuveen Corporate Income November 2021 Target Term Fund and the Nuveen Corporate Income 2023 Target Term Fund (each a “Fund” and collectively the “Funds”) long-term shareholders, the Board of Trustees of each Fund adopted Amended and Restated By-Laws.
Among other changes, the Amended and Restated By-Laws require compliance with certain amended deadlines and procedural and informational requirements in connection with advance notice of shareholder proposals or nominations, including certain information about the proponent and the proposal, or in the case of a nomination, the nominee. Any shareholder considering making a nomination or other proposal should carefully review and comply with those provisions of the Amended and Restated By-Laws.
The Amended and Restated By-Laws also include provisions (the “Control Share By-Law”) pursuant to which, in summary, a shareholder who obtains beneficial ownership of common shares of a Fund in a “Control Share Acquisition” may exercise voting rights with respect to such shares only to the extent the authorization of such voting rights is approved by other shareholders of the Fund. The Control Share By-Law is primarily intended to protect the interests of the Fund and its long-term shareholders by limiting the risk that the Fund will become subject to undue influence by opportunistic traders pursuing short-term agendas adverse to the best interests of the Fund and its long-term shareholders. The Control Share By-Law does not eliminate voting rights for common shares acquired in Control Share Acquisitions, but rather entrusts the Fund’s other “non-interested” shareholders with determining whether to approve the authorization of the voting rights of the person acquiring such shares.
69
Shareholder Update (continued)
(Unaudited)
Subject to various conditions and exceptions, the Control Share By-Law defines a “Control Share Acquisition” to include an acquisition of common shares that, but for the Control Share By-Law, would give the beneficial owner, upon the acquisition of such shares, the ability to exercise voting power in the election of Trustees of a Fund in any of the following ranges:
| (i) | one-tenth or more, but less than one-fifth of all voting power; |
| (ii) | one-fifth or more, but less than one-third of all voting power; |
| (iii) | one-third or more, but less than a majority of all voting power; or |
| (iv) | a majority or more of all voting power. |
The Control Share By-Law generally excludes certain acquisitions of common shares from the definition of a Control Share Acquisition, including acquisitions of common shares that occurred prior to October 5, 2020, though such shares are included in assessing whether any subsequent share acquisition exceeds one of the enumerated thresholds.
Subject to certain conditions and procedural requirements set forth in the Control Share By-Law, including the delivery of a “Control Share Acquisition Statement” to the Funds’ Secretary setting forth certain required information, a shareholder who obtains or proposes to obtain beneficial ownership of common shares in a Control Share Acquisition generally may demand a special meeting of shareholders for the purpose of considering whether the voting rights of such acquiring person with respect to such shares shall be authorized.
This discussion is only a high-level summary of certain aspects of the Amended and Restated By-Laws, and is qualified in its entirety by reference to the Amended and Restated By-Laws. Shareholders should refer to the Amended and Restated By-Laws for more information. A copy of the Amended and Restated By-Laws can be found in the Current Report on Form 8-K filed by the Funds with the Securities and Exchange Commission on October 6, 2020, which is available at www.sec.gov, and may also be obtained by writing to the Secretary of the Funds at 333 West Wacker Drive, Chicago, Illinois 60606.
70
Additional Fund Information (Unaudited)
| Board of Trustees | ||||||||
| Jack B. Evans | William C. Hunter | Albin F. Moschner | John K. Nelson | Judith M. Stockdale | ||||
| Carole E. Stone | Matthew Thornton III | Terence J. Toth |
Margaret L. Wolff |
Robert L. Young |
| Investment Adviser Nuveen Fund Advisors, LLC 333 West Wacker Drive Chicago, IL 60606 |
Custodian State Street
Bank One Lincoln Street Boston, MA 02111 |
Legal Counsel Chapman and Cutler LLP Chicago, IL 60603 |
Independent Registered KPMG LLP 200 East Randolph Street Chicago, IL 60601 |
Transfer Agent and Computershare Trust Company, N.A. 150 Royall Street Canton, MA 02021 (800) 257-8787 | ||||
Distribution Information
The Funds hereby designate their percentages of dividends paid for net ordinary income as dividends qualifying as Interest-Related Dividends and/or short-term capital gain dividends as defined in Internal Revenue Code Section 87(K) for the taxable year ended December 31, 2020:
| JHB | JHAA | |||||||||||
| % of Interest-Related Dividends |
74.5% | 76.7% | ||||||||||
The Funds had the following percentages, or maximum amount allowable, of ordinary dividends treated as Section 163(j) interest dividends pursuant to Section 163(j) of the Internal Revenue Code for the taxable year ended December 31, 2020:
| JHB | JHAA | |||||||||||
| % of Section 163(j) Interest Dividends |
99.9% | 99.3% | ||||||||||
Portfolio of Investments Information
Each Fund is required to file its complete schedule of portfolio holdings with the Securities and Exchange Commission (SEC) for the first and third quarters of each fiscal year as an exhibit to its report on Form N-PORT. You may obtain this information on the SEC’s website at http://www.sec.gov.
Nuveen Funds’ Proxy Voting Information
You may obtain (i) information regarding how each fund voted proxies relating to portfolio securities held during the most recent twelve-month period ended June 30, without charge, upon request, by calling Nuveen toll-free at (800) 257-8787 or on Nuveen’s website at www.nuveen.com and (ii) a description of the policies and procedures that each fund used to determine how to vote proxies relating to portfolio securities without charge, upon request, by calling Nuveen toll free at (800) 257-8787. You may also obtain this information directly from the SEC. Visit the SEC on-line at http://www.sec.gov.
CEO Certification Disclosure
The Fund’s Chief Executive Officer (CEO) has submitted to the New York Stock Exchange (NYSE) the annual CEO certification as required by Section 303A.12(a) of the NYSE Listed Company Manual. The Fund has filed with the SEC the certification of its CEO and Chief Financial Officer required by Section 302 of the Sarbanes-Oxley Act.
Common Share Repurchases
The Funds intend to repurchase, through their open-market share repurchase program, shares of their own common stock at such times and in such amounts as is deemed advisable. During the period covered by this report, each Fund repurchased shares of its common stock, as shown in the accompanying table. Any future repurchases will be reported to shareholders in the next annual or semi-annual report.
| JHB | JHAA | |||||||
| Common shares repurchased |
0 | 0 | ||||||
FINRA BrokerCheck
The Financial Industry Regulatory Authority (FINRA) provides information regarding the disciplinary history of FINRA member firms and associated investment professionals. This information as well as an investor brochure describing FINRA BrokerCheck is available to the public by calling the FINRA BrokerCheck Hotline number at (800) 289-9999 or by visiting www.FINRA.org.
71
Glossary of Terms Used in this Report
(Unaudited)
| ∎ | Average Annual Total Return: This is a commonly used method to express an investment’s performance over a particular, usually multi-year time period. It expresses the return that would have been necessary each year to equal the investment’s actual cumulative performance (including change in NAV or market price and reinvested dividends and capital gains distributions, if any) over the time period being considered. |
| ∎ | Bloomberg Barclays U.S. High Yield 1-5 Year Cash Pay 2% Issuer Capped Index: An index that tracks the performance of U.S. non-investment grade bonds with maturities of one to 4.99 years and limits each issue to 2% of the index. Benchmark returns assume reinvestment of distributions, but do not reflect any applicable sales charges or management fees. |
| ∎ | Duration: Duration is a measure of the expected period over which a bond’s principal and interest will be paid, and consequently is a measure of the sensitivity of a bond’s or bond fund’s value to changes when market interest rates change. Generally, the longer a bond’s or fund’s duration, the more the price of the bond or fund will change as interest rates change. |
| ∎ | Effective Leverage: Effective leverage is a fund’s effective economic leverage, and includes both regulatory leverage (see below) and the leverage effects of certain derivative investments in the fund’s portfolio. |
| ∎ | Gross Domestic Product (GDP): The total market value of all final goods and services produced in a country/region in a given year, equal to total consumer, investment and government spending, plus the value of exports, minus the value of imports. |
| ∎ | Leverage: Leverage is created whenever a fund has investment exposure (both reward and/or risk) equivalent to more than 100% of the investment capital. |
| ∎ | Net Asset Value (NAV) Per Share: A fund’s Net Assets is equal to its total assets (securities, cash, accrued earnings and receivables) less its total liabilities. NAV per share is equal to the fund’s Net Assets divided by its number of shares outstanding. |
| ∎ | Regulatory Leverage: Regulatory leverage consists of preferred shares issued by or borrowings of a fund. Both of these are part of a fund’s capital structure. Regulatory leverage is subject to asset coverage limits set in the Investment Company Act of 1940. |
72
(Unaudited)
The management of the Funds, including general supervision of the duties performed for the Funds by the Adviser, is the responsibility of the Board of Trustees of the Funds. None of the trustees who are not “interested” persons of the Funds (referred to herein as “independent board members”) has ever been a director or employee of, or consultant to, Nuveen or its affiliates. The names and business addresses of the trustees and officers of the Funds, their principal occupations and other affiliations during the past five years, the number of portfolios each Trustee oversees and other directorships they hold are set forth below.
| Name, Year of Birth & Address |
Position(s) Held with the Funds |
Year First Elected or and Term(1) |
Principal Occupation(s) Including other Directorships During Past 5 Years |
Number of Portfolios | ||||
| Independent Board Members: | ||||||||
| ∎ TERENCE J. TOTH |
Formerly, a Co-Founding Partner, Promus Capital (investment advisory firm) (2008-2017); Director, Quality Control Corporation (manufacturing) (since 2012); member: Catalyst Schools of Chicago Board (since 2008) and Mather Foundation Board (philanthropy) (since 2012), and chair of its Investment Committee; formerly, Director, Fulcrum IT Services LLC (information technology services firm to government entities) (2010-2019); formerly, Director, Legal & General Investment Management America, Inc. (asset management) (2008-2013); formerly, CEO and President, Northern Trust Global Investments (financial services) (2004-2007): Executive Vice President, Quantitative Management & Securities Lending (2000-2004); prior thereto, various positions with Northern Trust Company (financial services) (since 1994); formerly, Member, Northern Trust Mutual Funds Board (2005-2007), Northern Trust Global Investments Board (2004-2007), Northern Trust Japan Board (2004-2007), Northern Trust Securities Inc. Board (2003-2007) and Northern Trust Hong Kong Board (1997-2004). | |||||||
| 1959 333 W. Wacker Drive Chicago, IL 6o6o6 |
Chairman and Board Member | 2008 Class II |
149 | |||||
| ∎ JACK B. EVANS |
Chairman (since 2019), formerly, President (1996-2019), The Hall-Perrine Foundation, (private philanthropic corporation); Director and Chairman (since 2009), United Fire Group, a publicly held company; formerly, Director, Public Member, American Board of Orthopaedic Surgery (2015-2020); Life Trustee of Coe College and the Iowa College Foundation; formerly, President Pro-Tem of the Board of Regents for the State of Iowa University System (2000-2004); formerly, Director (2000-2004), Alliant Energy; formerly, Director (1996-2015), The Gazette Company (media and publishing); formerly, Director (1998-2003), Federal Reserve Bank of Chicago; formerly, President and Chief Operating Officer (1972-1995), SCI Financial Group, Inc., (regional financial services firm). | |||||||
| 1948 333 W. Wacker Drive Chicago, IL 6o6o6 |
Board Member |
1999 Class III |
149 | |||||
| ∎ WILLIAM C. HUNTER |
Dean Emeritus, formerly, Dean, Tippie College of Business, University of Iowa (2006-2012); Director of Wellmark, Inc. (since 2009); past Director (2005-2015), and past President (2010-2014) Beta Gamma Sigma, Inc., The International Business Honor Society; formerly, Director (2004-2018) of Xerox Corporation; Dean and Distinguished Professor of Finance, School of Business at the University of Connecticut (2003-2006); previously, Senior Vice President and Director of Research at the Federal Reserve Bank of Chicago (1995-2003); formerly, Director (1997-2007), Credit Research Center at Georgetown University. | |||||||
| 1948 333 W. Wacker Drive Chicago, IL 6o6o6 |
Board Member |
2003 Class I |
149 | |||||
73
Board Members & Officers (continued)
(Unaudited)
| Name, Year of Birth & Address |
Position(s) Held with the Funds |
Year First Elected or and Term(1) |
Principal Occupation(s) Including other Directorships During Past 5 Years |
Number of Portfolios | ||||
| Independent Board Members (continued): | ||||||||
| ∎ ALBIN F. MOSCHNER |
Founder and Chief Executive Officer, Northcroft Partners, LLC, (management consulting) (since 2012); formerly, Chairman (2019), and Director (2012-2019), USA Technologies, Inc., (provider of solutions and services to facilitate electronic payment transactions); formerly, Director, Wintrust Financial Corporation (1996-2016); previously, held positions at Leap Wireless International, Inc., (consumer wireless services) including Consultant (2011-2012), Chief Operating Officer (2008-2011), and Chief Marketing Officer (2004-2008); formerly, President, Verizon Card Services division of Verizon Communications, Inc. (2000-2003); formerly, President, One Point Services at One Point Communications (telecommunication services) (1999-2000); formerly, Vice Chairman of the Board, Diba, Incorporated (internet technology provider) (1996-1997); formerly, various executive positions (1991-1996) and Chief Executive Officer (1995-1996) of Zenith Electronics Corporation (consumer electronics). |
|||||||
| 1952 333 W. Wacker Drive Chicago, IL 6o6o6 |
Board Member |
2016 Class III |
149 | |||||
| ∎ JOHN K. NELSON |
Member of Board of Directors of Core12 LLC. (private firm which develops branding, marketing and communications strategies for clients) (since 2008); served on The President’s Council of Fordham University (2010-2019) and previously a Director of the Curran Center for Catholic American Studies (2009-2018); formerly, senior external advisor to the Financial Services practice of Deloitte Consulting LLP. (2012-2014); former Chair of the Board of Trustees of Marian University (2010-2014 as trustee, 2011-2014 as Chair); formerly Chief Executive Officer of ABN AMRO Bank N.V., North America, and Global Head of the Financial Markets Division (2007-2008), with various executive leadership roles in ABN AMRO Bank N.V. between 1996 and 2007. |
|||||||
| 1962 333 W. Wacker Drive Chicago, IL 6o6o6 |
Board Member |
2013 Class II |
149 | |||||
| ∎ JUDITH M. STOCKDALE |
Board Member, Land Trust Alliance (national public charity addressing natural land and water conservation in the U.S.) (since 2013); formerly, Board Member, U.S. Endowment for Forestry and Communities (national endowment addressing forest health, sustainable forest production and markets, and economic health of forest-reliant communities in the U.S.) (2013-2019); formerly, Executive Director (1994-2012), Gaylord and Dorothy Donnelley Foundation (private foundation endowed to support both natural land conservation and artistic vitality); prior thereto, Executive Director, Great Lakes Protection Fund (1990-1994). |
|||||||
| 1947 333 W. Wacker Drive Chicago, IL 6o6o6 |
Board Member |
1997 Class I |
149 | |||||
| ∎ CAROLE E. STONE |
Former Director, Chicago Board Options Exchange, Inc. (2006-2017); and C2 Options Exchange, Incorporated (2009-2017); former Director, Cboe, Global Markets, Inc., formerly, CBOE Holdings, Inc. (2010-May 2020); formerly, Commissioner, New York State Commission on Public Authority Reform (2005-2010). |
|||||||
| 1947 333 W. Wacker Drive Chicago, IL 6o6o6 |
Board Member |
2007 Class I |
149 | |||||
| ∎ MATTHEW THORNTON III |
Formerly, Executive Vice President and Chief Operating Officer (2018-2019), FedEx Freight Corporation, a subsidiary of FedEx Corporation (“FedEx”) (provider of transportation, e-commerce and business services through its portfolio of companies); formerly, Senior Vice President, U.S. Operations (2006-2018), Federal Express Corporation, a subsidiary of FedEx; formerly, Member of the Board of Directors (2012-2018), Safe Kids Worldwide® (a non-profit organization dedicated to preventing childhood injuries). Member of the Board of Directors (since 2014), The Sherwin-Williams Company (develops, manufactures, distributes and sells paints, coatings and related products); Director (since November 2020), Crown Castle International (provider of communications infrastructure) | |||||||
| 1958 333 West Wacker Drive Chicago, IL 60606 |
Board Member |
2020 Class III |
149 | |||||
74
| Name, Year of Birth & Address |
Position(s) Held with the Funds |
Year First Elected or and Term(1) |
Principal Occupation(s) Including other Directorships During Past 5 Years |
Number of Portfolios | ||||
| Independent Board Members (continued): | ||||||||
| ∎ MARGARET L. WOLFF |
Formerly, member of the Board of Directors (2013-2017) of Travelers Insurance Company of Canada and The Dominion of Canada General Insurance Company (each, a part of Travelers Canada, the Canadian operation of The Travelers Companies, Inc.); formerly, Of Counsel, Skadden, Arps, Slate, Meagher & Flom LLP (legal services, Mergers & Acquisitions Group) (2005-2014); Member of the Board of Trustees of New York-Presbyterian Hospital (since 2005); Member (since 2004) and Chair (since 2015) of the Board of Trustees of The John A. Hartford Foundation (philanthropy dedicated to improving the care of older adults); formerly, Member (2005-2015) and Vice Chair (2011-2015) of the Board of Trustees of Mt. Holyoke College. | |||||||
| 1955 333 W. Wacker Drive Chicago, IL 6o6o6 |
Board Member |
2016 Class I |
149 | |||||
| ∎ ROBERT L. YOUNG |
Formerly, Chief Operating Officer and Director, J.P.Morgan Investment Management Inc. (financial services) (2010-2016); formerly, President and Principal Executive Officer (2013-2016), and Senior Vice President and Chief Operating Officer (2005-2010), of J.P.Morgan Funds; formerly, Director and various officer positions for J.P.Morgan Investment Management Inc. (formerly, JPMorgan Funds Management, Inc. and formerly, One Group Administrative Services) and JPMorgan Distribution Services, Inc. (financial services) (formerly, One Group Dealer Services, Inc.) (1999-2017). | |||||||
| 1963 333 W. Wacker Drive Chicago, IL 6o6o6 |
Board Member |
2017 Class II |
149 | |||||
75
Board Members & Officers (continued)
(Unaudited)
| Name, Year of Birth & Address |
Position(s) Held with the Funds |
Year First Elected or Appointed(2) |
Principal Occupation(s) During Past 5 Years | |||
| Officers of the Funds: | ||||||
| ∎ DAVID J. LAMB |
Managing Director of Nuveen Fund Advisors, LLC (since 2020); Managing Director (since 2017), formerly, Senior Vice President of Nuveen, LLC (since 2006), Vice President prior to 2006. | |||||
| 1963 333 W. Wacker Drive Chicago, IL 6o6o6 |
Chief Administrative Officer | 2015 | ||||
| ∎ MARK J. CZARNIECKI |
Vice President and Assistant Secretary of Nuveen Securities, LLC (since 2016) and Nuveen Fund Advisors (since 2017); Vice President and Associate General Counsel of Nuveen, LLC (since 2013) and Vice President, Assistant Secretary and Associate General Counsel of Nuveen Asset Management (since 2018). | |||||
| 1979 901 Marquette Avenue Minneapolis, MN 55402 |
Vice President and Assistant Secretary | 2013 | ||||
| ∎ DIANA R. GONZALEZ |
Vice President and Assistant Secretary of Nuveen Fund Advisors, LLC (since 2017); Vice President and Associate General Counsel of Nuveen, LLC (since 2017); Associate General Counsel of Jackson National Asset Management, LLC (2012-2017). | |||||
| 1978 333 W. Wacker Drive Chicago, IL 6o6o6 |
Vice President and Assistant Secretary | 2017 | ||||
| ∎ NATHANIEL T. JONES |
Managing Director (since 2017), formerly, Senior Vice President (2016-2017), formerly, Vice President (2011-2016) of Nuveen, LLC; Managing Director (since 2015) of Nuveen Fund Advisors, LLC; Chartered Financial Analyst. | |||||
| 1979 333 W. Wacker Drive Chicago, IL 6o6o6 |
Vice President and Treasurer | 2016 | ||||
| ∎ TINA M. LAZAR |
Managing Director (since 2017), formerly, Senior Vice President (2014-2017) of Nuveen Securities, LLC. | |||||
| 1961 333 W. Wacker Drive Chicago, IL 6o6o6 |
Vice President |
2002 | ||||
| ∎ BRIAN J. LOCKHART |
Managing Director (since 2019) of Nuveen Fund Advisors, LLC; Managing Director (since 2017), formerly, Vice President (2010-2017) of Nuveen, LLC; Head of Investment Oversight (since 2017), formerly, Team Leader of Manager Oversight (2015-2017); Chartered Financial Analyst and Certified Financial Risk Manager. | |||||
| 1974 333 W. Wacker Drive Chicago, IL 6o6o6 |
Vice President |
2019 | ||||
| ∎ JACQUES M. LONGERSTAEY |
Senior Managing Director, Chief Risk Officer, Nuveen, LLC (since May 2019); Senior Managing Director (since May 2019) of Nuveen Fund Advisors, LLC; formerly, Chief Investment and Model Risk Officer, Wealth & Investment Management Division, Wells Fargo Bank (NA) (2013-2019). | |||||
| 1963 8500 Andrew Carnegie Blvd. Charlotte, NC 28262 |
Vice President |
2019 | ||||
| ∎ KEVIN J. MCCARTHY |
Senior Managing Director (since 2017) and Secretary and General Counsel (since 2016) of Nuveen Investments, Inc., formerly, Executive Vice President (2016-2017) and Managing Director and Assistant Secretary (2008-2016); Senior Managing Director (since 2017) and Assistant Secretary (since 2008) of Nuveen Securities, LLC, formerly Executive Vice President (2016-2017) and Managing Director (2008-2016); Senior Managing Director (since 2017), and Secretary (since 2016) of Nuveen Fund Advisors, LLC, formerly, Co-General Counsel (2011-2020), Executive Vice President (2016-2017), Managing Director (2008-2016) and Assistant Secretary (2007-2016); Senior Managing Director (since 2017), Secretary (since 2016) of Nuveen Asset Management, LLC, formerly, Associate General Counsel (2011-2020), Executive Vice President (2016-2017) and Managing Director and Assistant Secretary (2011- 2016); Vice President (since 2007) and Secretary (since 2016), formerly, Assistant Secretary, of NWQ Investment Management Company, LLC, Santa Barbara Asset Management, LLC and Winslow Capital Management, LLC (since 2010). Senior Managing Director (since 2017) and Secretary (since 2016) of Nuveen Alternative Investments, LLC. | |||||
| 1966 333 W. Wacker Drive Chicago, IL 6o6o6 |
Vice President and Assistant Secretary | 2007 | ||||
76
| Name, Year of Birth & Address |
Position(s) Held with the Funds |
Year First Elected or Appointed(2) |
Principal Occupation(s) During Past 5 Years | |||
| Officers of the Funds (continued): | ||||||
| ∎ JON SCOTT MEISSNER |
Managing Director of Mutual Fund Tax and Financial Reporting groups at Nuveen (since 2017); Managing Director of Nuveen Fund Advisors, LLC (since 2019); Senior Director of Teachers Advisors, LLC and TIAA-CREF Investment Management, LLC (since 2016); Senior Director (since 2015) Mutual Fund Taxation to the TIAA-CREF Funds, the TIAA-CREF Life Funds, the TIAA Separate Account VA-1 and the CREF Accounts; has held various positions with TIAA since 2004. | |||||
| 1973 8500 Andrew Carnegie Blvd. Charlotte, NC 28262 |
Vice President |
2019 | ||||
| ∎ DEANN D. MORGAN |
President, Nuveen Fund Advisors, LLC (since November 2020); Executive Vice President, Global Head of Product at Nuveen, LLC (since 2019); Co-Chief Executive Officer of Nuveen Securities, LLC since March 2020); Managing Member of MDR Collaboratory LLC (since 2018); Managing Director, (Head of Wealth Management Product Structuring & COO Multi Asset Investing. The Blackstone Group (2013-2017) | |||||
| 1969 730 Third Avenue New York, NY 10017 |
Vice President |
2020 | ||||
|
∎ CHRISTOPHER M. ROHRBACHER |
Managing Director (since 2017) and Assistant Secretary of Nuveen Securities, LLC; Managing Director (since 2017) General Counsel (since 2020), | |||||
| 1971 333 W. Wacker Drive Chicago, IL 6o6o6 |
Vice President and Assistant Secretary |
2008 | ||||
| ∎ WILLIAM A. SIFFERMANN |
Managing Director (since 2017), formerly Senior Vice President (2016-2017) and Vice President (2011-2016) of Nuveen, LLC. | |||||
| 1975 333 W. Wacker Drive Chicago, IL 6o6o6 |
Vice President |
2017 | ||||
| ∎ E. SCOTT WICKERHAM |
Senior Managing Director, Head of Fund Administration at Nuveen, LLC (since 2019), formerly, Managing Director; Senior Managing Director (since 2019) of Nuveen Fund Advisers, LLC; Principal Financial Officer, Principal Accounting Officer and Treasurer (since 2017) of the TIAA-CREF Funds, the TIAA-CREF Life Funds, the TIAA Separate Account VA-1 and the Treasurer (since 2017) to the CREF Accounts; Senior Director, TIAA-CREF Fund Administration (2014-2015); has held various positions with TIAA since 2006. | |||||
| 1973 8500 Andrew Carnegie Blvd. Charlotte, NC 28262 |
Vice President and Controller | 2019 | ||||
| ∎ MARK L. WINGET |
Vice President and Assistant Secretary of Nuveen Securities, LLC (since 2008), and Nuveen Fund Advisors, LLC (since 2019); Vice President, Associate General Counsel and Assistant Secretary of Nuveen Asset Management, LLC (since 2020); Vice President (since 2010) and Associate General Counsel (since 2019), formerly, Assistant General Counsel (2008-2016) of Nuveen, LLC. | |||||
| 1968 333 W. Wacker Drive Chicago, IL 60606 |
Vice President and Secretary | 2008 | ||||
| ∎ GIFFORD R. ZIMMERMAN |
Formerly: Managing Director (2002-2020) and Assistant Secretary (2002-2020) of Nuveen Securities, LLC; Managing Director (2002-2020), Assistant Secretary (1997-2020) and Co-General
Counsel (2011- 2020) of Nuveen Fund Advisors, LLC; Managing Director (2004-2020) and Assistant Secretary (1994-2020) of Nuveen Investments, Inc.; Managing Director, Assistant Secretary and Associate General
Counsel of Nuveen Asset Management, LLC (2011-2020); | |||||
| 1956 333 W. Wacker Drive Chicago, IL 60606 |
Vice President and Chief Compliance Officer |
1988 | ||||
| (1) | The Board of Trustees is divided into three classes, Class I, Class II, and Class III, with each being elected to serve until the third succeeding annual shareholders’ meeting subsequent to its election or thereafter in each case when its respective successors are duly elected or appointed, except two board members are elected by the holders of Preferred Shares, when applicable, to serve until the next annual shareholders’ meeting subsequent to its election or thereafter in each case when its respective successors are duly elected or appointed. The year first elected or appointed represents the year in which the board member was first elected or appointed to any fund in the Nuveen complex. |
| (2) | Officers serve one year terms through August of each year. The year first elected or appointed represents the year in which the Officer was first elected or appointed to any fund in the Nuveen complex. |
77
Notes
78
Notes
79
Nuveen:
Serving Investors for Generations
Since 1898, financial professionals and their clients have relied on Nuveen to provide
dependable investment solutions through continued adherence to
proven, long-term investing
principles. Today, we offer a range of high quality solutions designed to
be integral components of a well-diversified core portfolio.
Focused on meeting investor needs.
Nuveen is the investment manager of TIAA. We have grown into one of the world’s premier global asset managers, with specialist knowledge across all major asset classes and particular strength in solutions that provide income for investors and that draw on our expertise in alternatives and responsible investing. Nuveen is driven not only by the independent investment processes across the firm, but also the insights, risk management, analytics and other tools and resources that a truly world-class platform provides. As a global asset manager, our mission is to work in partnership with our clients to create solutions which help them secure their financial future.
Find
out how we can help you.
To learn more about how the products and services of Nuveen may be able to help you meet your financial goals, talk to your financial professional, or call us at (800) 257-8787. Please read the information provided carefully before you invest. Investors should consider the investment objective and policies, risk considerations, charges and expenses of any investment carefully. Where applicable, be sure to obtain a prospectus, which contains this and other relevant information. To obtain a prospectus, please contact your securities representative or Nuveen, 333 W. Wacker Dr., Chicago, IL 60606. Please read the prospectus carefully before you invest or send money.
Learn more about Nuveen Funds at:
www.nuveen.com/closed-end-funds
| Nuveen Securities, LLC, member FINRA and SIPC | 333 West Wacker Drive Chicago, IL 60606 | www.nuveen.com | EAN-J-1220D 1509760-INV-Y-02/22 |
ITEM 2. CODE OF ETHICS.
As of the end of the period covered by this report, the registrant has adopted a code of ethics that applies to the registrant’s principal executive officer, principal financial officer, principal accounting officer or controller, or persons performing similar functions. There were no amendments to or waivers from the Code during the period covered by this report. The registrant has posted the code of ethics on its website at www.nuveen.com/fund-governance. (To view the code, click on Code of Conduct.)
ITEM 3. AUDIT COMMITTEE FINANCIAL EXPERT.
As of the end of the period covered by this report, the registrant’s Board of Directors or Trustees (“Board”) determined that the registrant has at least one “audit committee financial expert” (as defined in Item 3 of Form N-CSR) serving on its Audit Committee. The registrant’s audit committee financial experts are Carole E. Stone, Jack B. Evans and William C. Hunter who are “independent” for purposes of Item 3 of Form N-CSR.
Ms. Stone served for five years as Director of the New York State Division of the Budget. As part of her role as Director, Ms. Stone was actively involved in overseeing the development of the State’s operating, local assistance and capital budgets, its financial plan and related documents; overseeing the development of the State’s bond-related disclosure documents and certifying that they fairly presented the State’s financial position; reviewing audits of various State and local agencies and programs; and coordinating the State’s system of internal audit and control. Prior to serving as Director, Ms. Stone worked as a budget analyst/examiner with increasing levels of responsibility over a 30 year period, including approximately five years as Deputy Budget Director. Ms. Stone has also served as Chair of the New York State Racing Association Oversight Board, as Chair of the Public Authorities Control Board, as a Commissioner on the New York State Commission on Public Authority Reform and as a member of the Boards of Directors of several New York State public authorities. These positions have involved overseeing operations and finances of certain entities and assessing the adequacy of project/entity financing and financial reporting. Currently, Ms. Stone is on the Board of Directors of CBOE Holdings, Inc., of the Chicago Board Options Exchange, and of C2 Options Exchange. Ms. Stone’s position on the boards of these entities and as a member of both CBOE Holdings’ Audit Committee and its Finance Committee has involved, among other things, the oversight of audits, audit plans and preparation of financial statements.
Mr. Evans was formerly President and Chief Operating Officer of SCI Financial Group, Inc., a full service registered broker-dealer and registered investment adviser (“SCI”). As part of his role as President and Chief Operating Officer, Mr. Evans actively supervised the Chief Financial Officer (the “CFO”) and actively supervised the CFO’s preparation of financial statements and other filings with various regulatory authorities. In such capacity, Mr. Evans was actively involved in the preparation of SCI’s financial statements and the resolution of issues raised in connection therewith. Mr. Evans has also served on the audit committee of various reporting companies. At such companies, Mr. Evans was involved in the oversight of audits, audit plans, and the preparation of financial statements. Mr. Evans also formerly chaired the audit committee of the Federal Reserve Bank of Chicago.
Mr. Hunter was formerly a Senior Vice President at the Federal Reserve Bank of Chicago. As part of his role as Senior Vice President, Mr. Hunter was the senior officer responsible for all operations of each of the Economic Research, Statistics, and Community and Consumer Affairs units at the Federal Reserve Bank of Chicago. In such capacity, Mr. Hunter oversaw the subunits of the Statistics and Community and Consumer Affairs divisions responsible for the analysis and evaluation of bank and bank holding company financial statements and financial filings. Prior to serving as Senior Vice President at the Federal Reserve Bank of Chicago, Mr. Hunter was the Vice President of the Financial Markets unit at the Federal Reserve Bank of Atlanta where he supervised financial staff and bank holding company analysts who analyzed and evaluated bank and bank holding company financial statements. Mr. Hunter also currently serves on the Boards of Directors of Xerox Corporation and Wellmark, Inc. as well as on the Audit Committees of such Boards. As an Audit Committee member, Mr. Hunter’s responsibilities include, among other things, reviewing financial statements, internal audits and internal controls over financial reporting. Mr. Hunter also formerly was a Professor of Finance at the University of Connecticut School of Business and has authored numerous scholarly articles on the topics of finance, accounting and economics.
ITEM 4. PRINCIPAL ACCOUNTANT FEES AND SERVICES.
The following tables show the amount of fees that KPMG LLP, the Fund’s auditor, billed to the Funds’ during the Funds’ last two full fiscal years. The Audit Committee approved in advance all audit services and non-audit services that KPMG LLP provided to the Funds, except for those non-audit services that were subject to the pre-approval exception under Rule 2.01 of Regulation S-X (the “pre-approval exception”). The preapproval exception for services provided directly to the Funds waives the pre-approval requirement for services other than audit, review or attest services if: (A) the aggregate amount of all such services provided constitutes no more than 5% of the total amount of revenues paid by the Funds during the fiscal year in which the services are provided; (B) the Funds did not recognize the services as non-audit services at the time of the engagement; and (C) the services are promptly brought to the Audit Committee’s attention, and the Committee (or its delegate) approves the services before the audit is completed.
The Audit Committee has delegated certain pre-approval responsibilities to its Chair (or, in her absence, any other member of the Audit Committee).
SERVICES THAT THE FUND’S AUDITOR BILLED TO THE FUND
| Fiscal Year Ended |
Audit Fees Billed to Fund 1 |
Audit-Related Fees Billed to Fund 2 |
Tax Fees Billed to Fund 3 |
All Other Fees Billed to Fund 4 |
||||||||||||
| December 31, 2020 |
$ | 32,910 | $ | 0 | $ | 0 | $ | 0 | ||||||||
|
|
|
|
|
|
|
|
|
|||||||||
|
|
||||||||||||||||
| Percentage approved pursuant to pre-approval exception |
0 | % | 0 | % | 0 | % | 0 | % | ||||||||
|
|
|
|
|
|
|
|
|
|||||||||
|
|
||||||||||||||||
| December 31, 2019 |
$ | 32,270 | $ | 0 | $ | 0 | $ | 0 | ||||||||
|
|
|
|
|
|
|
|
|
|||||||||
|
|
||||||||||||||||
| Percentage approved pursuant to pre-approval exception |
0 | % | 0 | % | 0 | % | 0 | % | ||||||||
|
|
|
|
|
|
|
|
|
|||||||||
1 “Audit Fees” are the aggregate fees billed for professional services for the audit of the Fund’s annual financial statements and services provided in connection with statutory and regulatory filings or engagements.
2 “Audit Related Fees” are the aggregate fees billed for assurance and related services reasonably related to the performance of the audit or review of financial statements that are not reported under “Audit Fees”. These fees include offerings related to the Fund’s common shares and leverage.
3 “Tax Fees” are the aggregate fees billed for professional services for tax advice, tax compliance, and tax planning. These fees include: all global withholding tax services; excise and state tax reviews; capital gain, tax equalization and taxable basis calculation performed by the principal accountant.
4 “All Other Fees” are the aggregate fees billed for products and services other than “Audit Fees”, “Audit-Related Fees” and “Tax Fees”. These fees represent all “Agreed-Upon Procedures” engagements pertaining to the Fund’s use of leverage.
SERVICES THAT THE FUND’S AUDITOR BILLED TO THE
ADVISER AND AFFILIATED FUND SERVICE PROVIDERS
The following tables show the amount of fees billed by KPMG LLP to Nuveen Fund Advisors, LLC (formerly Nuveen Fund Advisors, Inc.) (the “Adviser”), and any entity controlling, controlled by or under common control with the Adviser that provides ongoing services to the Fund (“Affiliated Fund Service Provider”), for engagements directly related to the Fund’s operations and financial reporting, during the Fund’s last two full fiscal years.
The tables also show the percentage of fees subject to the pre-approval exception. The pre-approval exception for services provided to the Adviser and any Affiliated Fund Service Provider (other than audit, review or attest services) waives the pre-approval requirement if: (A) the aggregate amount of all such services provided constitutes no more than 5% of the total amount of revenues paid to KPMG LLP by the Fund, the Adviser and Affiliated Fund Service Providers during the fiscal year in which the services are provided that would have to be pre-approved by the Audit Committee; (B) the Fund did not recognize the services as non-audit services at the time of the engagement; and (C) the services are promptly brought to the Audit Committee’s attention, and the Committee (or its delegate) approves the services before the Fund’s audit is completed.
| Fiscal Year Ended |
Audit-Related Fees Billed to Adviser and Affiliated Fund Service Providers |
Tax Fees Billed to Adviser and Affiliated Fund Service Providers |
All Other Fees Billed to Adviser and Affiliated Fund Service Providers |
|||||||||
| December 31, 2020 |
$ | 0 | $ | 0 | $ | 0 | ||||||
|
|
|
|
|
|
|
|||||||
|
|
||||||||||||
| Percentage approved pursuant to |
0 | % | 0 | % | 0 | % | ||||||
|
|
|
|
|
|
|
|||||||
|
|
||||||||||||
| December 31, 2019 |
$ | 0 | $ | 0 | $ | 0 | ||||||
|
|
|
|
|
|
|
|||||||
|
|
||||||||||||
| Percentage approved pursuant to |
0 | % | 0 | % | 0 | % | ||||||
|
|
|
|
|
|
|
|||||||
NON-AUDIT SERVICES
The following table shows the amount of fees that KPMG LLP billed during the Fund’s last two full fiscal years for non-audit services. The Audit Committee is required to pre-approve non-audit services that KPMG LLP provides to the Adviser and any Affiliated Fund Services Provider, if the engagement related directly to the Fund’s operations and financial reporting (except for those subject to the pre-approval exception described above). The Audit Committee requested and received information from KPMG LLP about any non-audit services that KPMG LLP rendered during the Fund’s last fiscal year to the Adviser and any Affiliated Fund Service Provider. The Committee considered this information in evaluating KPMG LLP’s independence.
| Fiscal Year Ended |
Total Non-Audit Fees Billed to Fund |
Total Non-Audit Fees billed to Adviser and Affiliated Fund Service Providers (engagements related directly to the operations and financial reporting of the Fund) |
Total Non-Audit Fees billed to Adviser and Affiliated Fund Service Providers (all other engagements) |
Total | ||||||||||||
| December 31, 2020 |
$ | 0 | $ | 0 | $ | 0 | $ | 0 | ||||||||
| December 31, 2019 |
$ | 0 | $ | 0 | $ | 0 | $ | 0 | ||||||||
“Non-Audit Fees billed to Fund” for both fiscal year ends represent “Tax Fees” and “All Other Fees” billed to Fund in their respective amounts from the previous table.
Less than 50 percent of the hours expended on the principal accountant’s engagement to audit the registrant’s financial statements for the most recent fiscal year were attributed to work performed by persons other than the principal accountant’s full-time, permanent employees.
Audit Committee Pre-Approval Policies and Procedures. Generally, the Audit Committee must approve (i) all non-audit services to be performed for the Fund by the Fund’s independent accountants and (ii) all audit and non-audit services to be performed by the Fund’s independent accountants for the Affiliated Fund Service Providers with respect to operations and financial reporting of the Fund. Regarding tax and research projects conducted by the independent accountants for the Fund and Affiliated Fund Service Providers (with respect to operations and financial reports of the Fund) such engagements will be (i) pre-approved by the Audit Committee if they are expected to be for amounts greater than $10,000; (ii) reported to the Audit Committee chair for her verbal approval prior to engagement if they are expected to be for amounts under $10,000 but greater than $5,000; and (iii) reported to the Audit Committee at the next Audit Committee meeting if they are expected to be for an amount under $5,000.
ITEM 5. AUDIT COMMITTEE OF LISTED REGISTRANTS.
The registrant’s Board has a separately designated Audit Committee established in accordance with Section 3(a)(58)(A) of the Securities Exchange Act of 1934, as amended (15 U.S.C. 78c(a)(58)(A)). As of the end of the period covered by this report, the members of the audit committee are Jack B. Evans, William C. Hunter, John K. Nelson, Judith M. Stockdale and Carole E. Stone, Chair.
ITEM 6. SCHEDULE OF INVESTMENTS.
(a) See Portfolio of Investments in Item 1.
(b) Not applicable.
ITEM 7. DISCLOSURE OF PROXY VOTING POLICIES AND PROCEDURES FOR CLOSED-END MANAGEMENT INVESTMENT COMPANIES.
ITEM 8. PORTFOLIO MANAGERS OF CLOSED-END MANAGEMENT INVESTMENT COMPANIES.
Nuveen Fund Advisors (“NFALLC”) is the registrant’s investment adviser (NFALLC is also referred to as the “Adviser”.) NFALLC is responsible for the selection and on-going monitoring of the Fund’s investment portfolio, managing the Fund’s business affairs and providing certain clerical, bookkeeping and administrative services. The Adviser has engaged Nuveen Asset Management, LLC (“Nuveen Asset Management” or “Sub-Adviser”), as Sub-Adviser to provide discretionary investment advisory services. The following section provides information on the portfolio managers at the Sub-Adviser:
NUVEEN ASSET MANAGEMENT
Item 8(a)(1). PORTFOLIO MANAGER BIOGRAPHIES
As of the date of filing this report, the following individuals at the Sub-Adviser have primary responsibility for the day-to-day implementation of the Fund’s investment strategy:
Kevin Lorenz, CFA, is a managing director and is a portfolio manager for Nuveen’s global fixed income team. He heads the leveraged finance sector team, which selects high yield and leveraged loan securities for all portfolios. He is also the lead portfolio manager for the High Yield strategies, co-manager of the Multi-Sector Bond strategy and a member of the Investment Committee, which establishes investment policy for all global fixed income products. Kevin has served in a variety of roles since joining the firm in 1987.
Christopher Williams, is Head of Leveraged Finance Christopher is Head of Leveraged Finance Trading and responsible for overseeing trading high yield bonds, credit default swaps, and loans across Nuveen’s platform in the primary and secondary markets. Christopher also co-heads Credit Macro Trading, focused on trading cash, synthetics, and ETFs in the Fixed Income Markets. In addition, he serves as a co-portfolio manager for certain CLO strategies. Prior to joining the firm in 2011, Christopher traded leveraged loans and high yield bonds at Gulf Stream Asset Management.
Jacob Fitzpatrick, CFA, is an associate portfolio manager for Nuveen’s global fixed income team and a member of the leveraged finance section team. Prior to joining the firm in 2015, he worked as a co-manager of structured product portfolios at Allianz Investment Management, where he was responsible for the investment strategy and allocation of insurance product premiums within the core capital markets. He began his career at U.S. Bancorp Asset Management, where he was a corporate and municipal bond trader for the firm’s mutual funds and wealth management group.
Item 8(a)(2). OTHER ACCOUNTS MANAGED BY PORTFOLIO MANAGERS
In addition to the Fund, as of December 31, 2020, the portfolio managers are also primarily responsible for the day-to-day portfolio management of the following accounts:
| (ii) Number of Other Accounts Managed and Assets by Account Type* |
(iii) Number of Other Accounts and Assets for Which Advisory Fee is Performance-Based |
|||||||||||||||||||||||||||||||||||||||||||||||
| (i) Name of Portfolio Manager |
Other Registered Investment Companies |
Other Pooled Investment Vehicles |
Other Accounts |
Other Registered Investment Companies |
Other Pooled Investment Vehicles |
Other Accounts |
||||||||||||||||||||||||||||||||||||||||||
| Kevin Lorenz |
12 | $ | 15.83 billion | 0 | $ | 0 | 0 | $ | 0 | 0 | 0 | 0 | 0 | 0 | 0 | |||||||||||||||||||||||||||||||||
| Christopher Williams |
1 | $ | 108 million | 0 | $ | 0 | 0 | $ | 0 | 0 | 0 | 0 | 0 | 0 | 0 | |||||||||||||||||||||||||||||||||
| Jacob Fitzpatrick |
3 | $ | 964 million | 0 | $ | 0 | 0 | $ | 0 | 0 | 0 | 0 | 0 | 0 | 0 | |||||||||||||||||||||||||||||||||
| * | Assets are as of December 31, 2020. |
POTENTIAL MATERIAL CONFLICTS OF INTEREST
Actual or apparent conflicts of interest may arise when a portfolio manager has day-to-day management responsibilities with respect to more than one account. More specifically, portfolio managers who manage multiple accounts are presented a number of potential conflicts, including, among others, those discussed below.
The management of multiple accounts may result in a portfolio manager devoting unequal time and attention to the management of each account. Nuveen Asset Management seeks to manage such competing interests for the time and attention of portfolio managers by having portfolio managers focus on a particular investment discipline. Most accounts managed by a portfolio manager in a particular investment strategy are managed using the same investment models.
If a portfolio manager identifies a limited investment opportunity which may be suitable for more than one account, an account may not be able to take full advantage of that opportunity due to an allocation of filled purchase or sale orders across all eligible accounts. To deal with these situations, Nuveen Asset Management has adopted procedures for allocating limited opportunities across multiple accounts.
With respect to many of its clients’ accounts, Nuveen Asset Management determines which broker to use to execute transaction orders, consistent with its duty to seek best execution of the transaction. However, with respect to certain other accounts, Nuveen Asset Management may be limited by the client with respect to the selection of brokers or may be instructed to direct trades through a particular broker. In these cases, Nuveen Asset Management may place separate, non-simultaneous, transactions for a Fund and other accounts which may temporarily affect the market price of the security or the execution of the transaction, or both, to the detriment of the Fund or the other accounts.
Some clients are subject to different regulations. As a consequence of this difference in regulatory requirements, some clients may not be permitted to engage in all the investment techniques or transactions or to engage in these transactions to the same extent as the other accounts managed by the portfolio manager. Finally, the appearance of a conflict of interest may arise where Nuveen Asset Management has an incentive, such as a performance-based management fee, which relates to the management of some accounts, with respect to which a portfolio manager has day-to-day management responsibilities.
Conflicts of interest may also arise when the Sub-Adviser invests one or more of its client accounts in different or multiple parts of the same issuer’s capital structure, including investments in public versus private securities, debt versus equity, or senior versus junior/subordinated debt, or otherwise where there are different or inconsistent rights or benefits. Decisions or actions such as investing, trading, proxy voting, exercising, waiving or amending rights or covenants, workout activity, or serving on a board, committee or other involvement in governance may result in conflicts of interest between clients holding different securities or investments. Generally, individual portfolio managers will seek to act in a manner that they believe serves the best interest of the accounts they manage. In cases where a portfolio manager or team faces a conflict among its client accounts, it will seek to act in a manner that it believes best reflects its overall fiduciary duty, which may result in relative advantages or disadvantages for particular accounts.
Nuveen Asset Management has adopted certain compliance procedures which are designed to address these types of conflicts common among investment managers. However, there is no guarantee that such procedures will detect each and every situation in which a conflict arises.
Item 8(a)(3). FUND MANAGER COMPENSATION
As of the most recently completed fiscal year end, the primary portfolio managers compensation is as follows:
Portfolio manager compensation consists primarily of base salary and variable components consisting of (i) a cash bonus; (ii) a long-term performance award; and (iii) participation in a profits interest plan.
Base salary. A portfolio manager’s base salary is determined based upon an analysis of the portfolio manager’s general performance, experience and market levels of base pay for such position.
Cash bonus. A portfolio manager is eligible to receive an annual cash bonus that is based on three variables: risk-adjusted investment performance relative to benchmark generally measured over the most recent one, three and five year periods (unless the portfolio manager’s tenure is shorter), ranking versus Morningstar peer funds generally measured over the most recent one, three and five year periods (unless the portfolio manager’s tenure is shorter), and management and peer reviews.
Long-term performance award. A portfolio manager is eligible to receive a long-term performance award that vests after three years. The amount of the award when granted is based on the same factors used in determining the cash bonus. The value of the award at the completion of the three-year vesting period is adjusted based on the risk-adjusted investment performance of Fund(s) managed by the portfolio manager during the vesting period and the performance of the TIAA organization as a whole.
Profits interest plan. Portfolio managers are eligible to receive profits interests in Nuveen Asset Management and its affiliate, Teachers Advisors, LLC, which vest over time and entitle their holders to a percentage of the firms’ annual profits. Profits interests are allocated to each portfolio manager based on such person’s overall contribution to the firms.
There are generally no differences between the methods used to determine compensation with respect to the Fund and the Other Accounts shown in the table above.
| Item 8(a)(4). | OWNERSHIP OF JHB SECURITIES AS OF DECEMBER 31, 2020 |
| Name of Portfolio Manager |
None | $1 - $10,000 |
$10,001-
$50,000 |
$50,001-
$100,000 |
$100,001- $500,000 |
$500,001- $1,000,000 |
Over $1,000,000 |
|||||||||||||||||||
| Kevin Lorenz |
X | |||||||||||||||||||||||||
| Christopher Williams |
X | |||||||||||||||||||||||||
| Jacob Fitzpatrick |
X | |||||||||||||||||||||||||
ITEM 9. PURCHASES OF EQUITY SECURITIES BY CLOSED-END MANAGEMENT INVESTMENT COMPANY AND AFFILIATED PURCHASERS.
Not applicable.
ITEM 10. SUBMISSION OF MATTERS TO A VOTE OF SECURITY HOLDERS.
There have been no material changes to the procedures by which shareholders may recommend nominees to the registrant’s Board implemented after the registrant last provided disclosure in response to this Item.
ITEM 11. CONTROLS AND PROCEDURES.
| (a) | The registrant’s principal executive and principal financial officers, or persons performing similar functions, have concluded that the registrant’s disclosure controls and procedures (as defined in Rule 30a-3(c) under the Investment Company Act of 1940, as amended (the “1940 Act”) (17 CFR 270.30a-3(c))) are effective, as of a date within 90 days of the filing date of this report that includes the disclosure required by this paragraph, based on their evaluation of the controls and procedures required by Rule 30a-3(b) under the 1940 Act (17 CFR 270.30a-3(b)) and Rules 13a-15(b) or 15d-15 (b) under the Securities Exchange Act of 1934, as amended (the “Exchange Act”) (17 CFR 240.13a-15(b) or 240.15d-15 (b)). |
| (b) | There were no changes in the registrant’s internal control over financial reporting (as defined in Rule 30a-3(d) under the 1940 Act (17 CFR 270.30a-3(d)) that occurred during the period covered by this report that has materially affected, or is reasonably likely to materially affect, the registrant’s internal control over financial reporting. |
ITEM 12. DISCLOSURE OF SECURITIES LENDING ACTIVITIES FOR CLOSED-END MANAGEMENT INVESTMENT COMPANIES.
Not applicable.
ITEM 13. EXHIBITS.
File the exhibits listed below as part of this Form.
(a)(1) Any code of ethics, or amendment thereto, that is the subject of the disclosure required by Item 2, to the extent that the registrant intends to satisfy the Item 2 requirements through filing of an exhibit: Not applicable because the code is posted on registrant’s website at www.nuveen.com/fund-governance and there were no amendments during the period covered by this report. (To view the code, click on Code of Conduct.)
(a)(3) Any written solicitation to purchase securities under Rule 23c-1 under the 1940 Act (17 CFR 270.23c-1) sent or given during the period covered by the report by or on behalf of the registrant to 10 or more persons. Not applicable.
(a)(4) Change in registrant’s independent public accountant. Not applicable.
SIGNATURES
Pursuant to the requirements of the Securities Exchange Act of 1934 and the Investment Company Act of 1940, the registrant has duly caused this report to be signed on its behalf by the undersigned, thereunto duly authorized.
(Registrant) Nuveen Corporate Income November 2021 Target Term Fund
| By (Signature and Title) | /s/ Mark L. Winget |
|||
| Mark L. Winget | ||||
| Vice President and Secretary | ||||
| Date: March 5, 2021 | ||||
Pursuant to the requirements of the Securities Exchange Act of 1934 and the Investment Company Act of 1940, this report has been signed below by the following persons on behalf of the registrant and in the capacities and on the dates indicated.
| By (Signature and Title) | /s/ David J. Lamb |
|||
| David J. Lamb | ||||
| Chief Administrative Officer | ||||
| (principal executive officer) | ||||
| Date: March 5, 2021 | ||||
| By (Signature and Title) | /s/ E. Scott Wickerham |
|||
| E. Scott Wickerham | ||||
| Vice President and Controller | ||||
| (principal financial officer) | ||||
| Date: March 5, 2021 | ||||
Exhibit 99.CERT
CERTIFICATION
I, David J. Lamb, certify that:
1. I have reviewed this report on Form N-CSR of Nuveen Corporate Income November 2021 Target Term Fund;
2. Based on my knowledge, this report does not contain any untrue statement of a material fact or omit to state a material fact necessary to make the statements made, in light of the circumstances under which such statements were made, not misleading with respect to the period covered by this report;
3. Based on my knowledge, the financial statements, and other financial information included in this report, fairly present in all material respects the financial condition, results of operations, changes in net assets, and cash flows (if the financial statements are required to include a statement of cash flows) of the registrant as of, and for, the periods presented in this report;
4. The registrant’s other certifying officer and I are responsible for establishing and maintaining disclosure controls and procedures (as defined in Rule 30a-3(c) under the Investment Company Act of 1940) and internal control over financial reporting (as defined in Rule 30a-3(d) under the Investment Company Act of 1940) for the registrant and have:
| (a) | designed such disclosure controls and procedures, or caused such disclosure controls and procedures to be designed under our supervision, to ensure that material information relating to the registrant, including its consolidated subsidiaries, is made known to us by others within those entities, particularly during the period in which this report is being prepared; |
| (b) | designed such internal control over financial reporting, or caused such internal control over financial reporting to be designed under our supervision, to provide reasonable assurance regarding the reliability of financial reporting and the preparation of financial statements for external purposes in accordance with generally accepted accounting principles; |
| (c) | evaluated the effectiveness of the registrant’s disclosure controls and procedures and presented in this report our conclusions about the effectiveness of the disclosure controls and procedures, as of a date within 90 days prior to the filing date of this report based on such evaluation; and |
| (d) | disclosed in this report any change in the registrant’s internal control over financial reporting that occurred during the period covered by this report that has materially affected, or is reasonably likely to materially affect, the registrant’s internal control over financial reporting; and |
5. The registrant’s other certifying officer and I have disclosed to the registrant’s auditors and the audit committee of the registrant’s board of directors (or persons performing the equivalent functions):
| (a) | all significant deficiencies and material weaknesses in the design or operation of internal control over financial reporting which are reasonably likely to adversely affect the registrant’s ability to record, process, summarize, and report financial information; and |
| (b) | any fraud, whether or not material, that involves management or other employees who have a significant role in the registrant’s internal control over financial reporting. |
| Date: March 5, 2021 | /s/ David J. Lamb | |||||
| David J. Lamb | ||||||
| Chief Administrative Officer | ||||||
| (principal executive officer) |
CERTIFICATION
I, E. Scott Wickerham, certify that:
1. I have reviewed this report on Form N-CSR of Nuveen Corporate Income November 2021 Target Term Fund;
2. Based on my knowledge, this report does not contain any untrue statement of a material fact or omit to state a material fact necessary to make the statements made, in light of the circumstances under which such statements were made, not misleading with respect to the period covered by this report;
3. Based on my knowledge, the financial statements, and other financial information included in this report, fairly present in all material respects the financial condition, results of operations, changes in net assets, and cash flows (if the financial statements are required to include a statement of cash flows) of the registrant as of, and for, the periods presented in this report;
4. The registrant’s other certifying officer and I are responsible for establishing and maintaining disclosure controls and procedures (as defined in Rule 30a-3(c) under the Investment Company Act of 1940) and internal control over financial reporting (as defined in Rule 30a-3(d) under the Investment Company Act of 1940) for the registrant and have:
| (a) | designed such disclosure controls and procedures, or caused such disclosure controls and procedures to be designed under our supervision, to ensure that material information relating to the registrant, including its consolidated subsidiaries, is made known to us by others within those entities, particularly during the period in which this report is being prepared; |
| (b) | designed such internal control over financial reporting, or caused such internal control over financial reporting to be designed under our supervision, to provide reasonable assurance regarding the reliability of financial reporting and the preparation of financial statements for external purposes in accordance with generally accepted accounting principles; |
| (c) | evaluated the effectiveness of the registrant’s disclosure controls and procedures and presented in this report our conclusions about the effectiveness of the disclosure controls and procedures, as of a date within 90 days prior to the filing date of this report based on such evaluation; and |
| (d) | disclosed in this report any change in the registrant’s internal control over financial reporting that occurred during the period covered by this report that has materially affected, or is reasonably likely to materially affect, the registrant’s internal control over financial reporting; and |
5. The registrant’s other certifying officer and I have disclosed to the registrant’s auditors and the audit committee of the registrant’s board of directors (or persons performing the equivalent functions):
| (a) | all significant deficiencies and material weaknesses in the design or operation of internal control over financial reporting which are reasonably likely to adversely affect the registrant’s ability to record, process, summarize, and report financial information; and |
| (b) | any fraud, whether or not material, that involves management or other employees who have a significant role in the registrant’s internal control over financial reporting. |
| Date: March 5, 2021 | /s/ E. Scott Wickerham | |||||
| E. Scott Wickerham | ||||||
| Vice President and Controller | ||||||
| (principal financial officer) |
Exhibit 99.906CERT
Certification Pursuant to 18 U.S.C. 1350, as adopted pursuant to Section 906 of the Sarbanes-Oxley Act of 2002; provided by the Chief Executive Officer and Chief Financial Officer, based on each such officer’s knowledge and belief.
The undersigned officers of Nuveen Corporate Income November 2021 Target Term Fund (the “Fund”) certify that, to the best of each such officer’s knowledge and belief:
| 1. | The Form N-CSR of the Fund for the period ended December 31, 2020 (the “Report”) fully complies with the requirements of Section 13(a) or 15(d) of the Securities Exchange Act of 1934; and |
| 2. | The information contained in the Report fairly presents, in all material respects, the financial condition and results of operations of the Fund. |
| Date: March 5, 2021 | ||||||
| /s/ David J. Lamb | ||||||
| David J. Lamb | ||||||
| Chief Administrative Officer | ||||||
| (principal executive officer) | ||||||
| /s/ E. Scott Wickerham | ||||||
| E. Scott Wickerham | ||||||
| Vice President, Controller | ||||||
| (principal financial officer) | ||||||
NUVEEN ASSET MANAGEMENT PROXY VOTING POLICIES
Nuveen Asset Management, LLC
Proxy Voting Policies and Procedures
Effective Date: January 1, 2011, as last amended March 05, 2020
I. General Principles
A. Nuveen Asset Management, LLC (“NAM”) is an investment sub-adviser for certain of the Nuveen Funds (the “Funds”) and investment adviser for institutional and other separately managed accounts (collectively, with the Funds, “Accounts”). As such, Accounts may confer upon NAM complete discretion to vote proxies.1
B. When NAM has proxy voting authority, it is NAM’s duty to vote proxies in the best interests of its clients (which may involve affirmatively deciding that voting the proxies may not be in the best interests of certain clients on certain matters). In voting proxies, NAM also seeks to enhance total investment return for its clients.
C. If NAM contracts with another investment adviser to act as a sub-adviser for an Account, NAM may delegate proxy voting responsibility to the sub-adviser. Where NAM has delegated proxy voting responsibility, the sub-adviser will be responsible for developing and adhering to its own proxy voting policies, subject to oversight by NAM.
D. NAM’s Proxy Voting Committee (“PVC”) provides oversight of NAM’s proxy voting policies and procedures, including (1) providing an administrative framework to facilitate and monitor the exercise of such proxy voting and to fulfill the obligations of reporting and recordkeeping under the federal securities laws; and (2) approving the proxy voting policies and procedures.
II. Policies
The PVC after reviewing and concluding that such policies are reasonably designed to vote proxies in the best interests of clients, has approved and adopted the proxy voting policies (“Policies”) of Institutional Shareholder Services, Inc. (“ISS”), a leading national provider of proxy voting administrative and research services.i As a result, such Policies set forth NAM’s positions on recurring proxy issues and criteria for addressing non-recurring issues. These Policies are reviewed periodically by ISS, and therefore are subject to change. Even though it has adopted the Policies as drafted by ISS, NAM maintains the fiduciary responsibility for all proxy voting decisions.
III. Procedures
A. Supervision of Proxy Voting. Day-to-day administration of proxy voting may be provided internally or by a third-party service provider, depending on client type, subject to the ultimate oversight of the PVC. The PVC shall supervise the relationships with NAM’s proxy voting services, ISS. ISS apprises Nuveen Global Operations (“NGO”) of shareholder meeting dates, and casts the actual proxy votes. ISS also provides research on proxy proposals and voting recommendations. ISS serves as NAM’s proxy voting record keepers and generate reports on how proxies were voted. NGO periodically reviews communications from ISS to determine whether ISS voted the correct amount of proxies, whether the votes were cast in a timely manner, and whether the vote was in accordance with the Policies or NAM’s specific instructions
| 1 | NAM does not vote proxies where a client withholds proxy voting authority, and in certain non- discretionary and model programs NAM votes proxies in accordance with its Policies in effect from time to time. Clients may opt to vote proxies themselves, or to have proxies voted by an independent third party or other named fiduciary or agent, at the client’s cost. i ISS has separate polices for Taft Hartley plans and it is NAM’s policy to apply the Taft Hartley polices to accounts that are Taft Hartley plans and have requested the application of such policies. |
B. General Avoidance of Conflicts of Interest.
1. NAM believe that most conflicts of interest faced by NAM in voting proxies can be avoided by voting in accordance with the Policies. Examples of such conflicts of interest are as follows:2
a. The issuer or proxy proponent (e.g., a special interest group) is TIAA- CREF, the ultimate principal owner of NAM, or any of its affiliates.
b. The issuer is an entity in which an executive officer of NAM or a spouse or domestic partner of any such executive officer is or was (within the past three years of the proxy vote) an executive officer or director.
c. The issuer is a registered or unregistered fund or other client for which NAM or another affiliated adviser has a material relationship as investment adviser or sub-adviser (e.g., Nuveen Funds and TIAA Funds) or an institutional separate account.
d. Any other circumstances that NAM is aware of where NAM’s duty to serve its clients’ interests, typically referred to as its “duty of loyalty,” could be materially compromised.
2. To further minimize this risk, Compliance will review ISS’ conflict avoidance policy at least annually to ensure that it adequately addresses both the actual and perceived conflicts of interest ISS may face.
3. In the event that ISS faces a material conflict of interest with respect to a specific vote, the PVC shall direct ISS how to vote. The PVC shall receive voting direction from appropriate investment personnel. Before doing so, the PVC will consult with Legal to confirm that NAM faces no material conflicts of its own with respect to the specific proxy vote.
4. Where ISS is determined to have a conflict of interest, or NAM determines to override the Policies and is determined to have a conflict, the PVC will recommend to NAM’s Compliance Committee or designee a course of action designed to address the conflict. Such actions could include, but are not limited to:
a. Obtaining instructions from the affected client(s) on how to vote the proxy;
b. Disclosing the conflict to the affected client(s) and seeking their consent to permit NAM to vote the proxy;
c. Voting in proportion to the other shareholders;
d. Recusing the individual with the actual or potential conflict of interest from all discussion or consideration of the matter, if the material conflict is due to such person’s actual or potential conflict of interest; or
e. Following the recommendation of a different independent third party.
5. In addition to all of the above-mentioned and other conflicts, the Head of Equity Research, NGO and any member of the PVC must notify NAM’s Chief Compliance Officer (“CCO”) of any direct, indirect or perceived improper influence exerted by any employee, officer or director of TIAA or its subsidiaries with regard to how NAM should vote proxies. NAM Compliance will investigate any such allegations and will report the findings to the PVC and, if deemed appropriate, to NAM’s Compliance Committee. If it is determined that improper influence was attempted, appropriate action shall be taken. Such appropriate action may include disciplinary action, notification of the appropriate senior managers, or notification of the appropriate regulatory authorities. In all cases, NAM will not consider any improper influence in determining how to vote proxies, and will vote in the best interests of clients.
| 2 | A conflict of interest shall not be considered material for the purposes of these Policies and Procedures with respect to a specific vote or circumstance if the matter to be voted on relates to a restructuring of the terms of existing securities or the issuance of new securities or a similar matter arising out of the holding of securities, other than common equity, in the context of a bankruptcy or threatened bankruptcy of the issuer. |
C. Proxy Vote Override. From time to time, a portfolio manager of an account (a “Portfolio Manager”) may initiate action to override the Policies’ recommendation for a particular vote. Any such override by a NAM Portfolio Manager (but not a sub-adviser Portfolio Manager) shall be reviewed by NAM’s Legal Department for material conflicts. If the Legal Department determines that no material conflicts exist, the approval of one member of the PVC shall authorize the override. If a material conflict exists, the conflict and, ultimately, the override recommendation will be rejected and will revert to the original Policies recommendation or will be addressed pursuant to the procedures described above under “Conflicts of Interest.”
In addition, the PVC may determine from time to time that a particular recommendation in the Policies should be overridden based on a determination that the recommendation is inappropriate and not in the best interests of shareholders. Any such determination shall be reflected in the minutes of a meeting of the PVC at which such decision is made.
D. Securities Lending.
1. In order to generate incremental revenue, some clients may participate in a securities lending program. If a client has elected to participate in the lending program then it will not have the right to vote the proxies of any securities that are on loan as of the shareholder meeting record date. A client, or a Portfolio Manager, may place restrictions on loaning securities and/or recall a security on loan at any time. Such actions must be affected prior to the record date for a meeting if the purpose for the restriction or recall is to secure the vote.
2. Portfolio Managers and/or analysts who become aware of upcoming proxy issues relating to any securities in portfolios they manage, or issuers they follow, will consider the desirability of recalling the affected securities that are on loan or restricting the affected securities prior to the record date for the matter. If the proxy issue is determined to be material, and the determination is made prior to the shareholder meeting record date the Portfolio Manager(s) will contact the Securities Lending Agent to recall securities on loan or restrict the loaning of any security held in any portfolio they manage, if they determine that it is in the best interest of shareholders to do so.
E. Proxy Voting Records. As required by Rule 204-2 of the Investment Advisers Act of 1940, NAM shall make and retain five types of records relating to proxy voting; (1) NAM’s Policies; (2) proxy statements received for securities in client accounts; (3) records of proxy votes cast by NAM on behalf of clients accounts; (4) records of written requests from clients about how NAM voted their proxies, and written responses from NAM to either a written or oral request by clients; and (5) any documents prepared by the adviser that were material to making a proxy voting decision or that memorialized the basis for the decision. NAM relies on ISS to make and retain on NAM’s behalf certain records pertaining to Rule 204-2.
F. Fund of Funds Provision. In instances where NAM provides investment advice to a fund of funds that acquires shares of affiliated funds or three percent or more of the outstanding voting securities of an unaffiliated fund, the acquiring fund shall vote the shares in the same proportion as the vote of all other shareholders of the acquired fund. If compliance with this procedure results in a vote of any shares in a manner different than the Policies’ recommendation, such vote will not require compliance with the Proxy Vote Override procedures set forth above.
G. Legacy Securities. To the extent that NAM receives proxies for securities that are transferred into an account’s portfolio that were not recommended or selected by it and are sold or expected to be sold promptly in an orderly manner (“legacy securities”), NAM will generally refrain from voting such proxies. In such circumstances, since legacy securities are expected to be sold promptly, voting proxies on such securities would not further NAM’s interest in maximizing the value of client investments. NAM may agree to an account’s special request to vote a legacy security proxy, and would vote such proxy in accordance with the Policies.
H. Terminated Accounts. Proxies received after the termination date of an account generally will not be voted. An exception will be made if the record date is for a period in which an account was under NAM’s discretionary management or if a separately managed account (“SMA”) custodian failed to remove the account’s holdings from its aggregated voting list.
I. Non-votes. NGO shall be responsible for obtaining reasonable assurance from ISS that it voted proxies on NAM’s behalf, and that any special instructions from NAM about a given proxy or proxies are submitted to ISS in a timely manner. It should not be considered a breach of this responsibility if NGO or NAM does not receive a proxy from ISS or a custodian with adequate time to analyze and direct to vote or vote a proxy by the required voting deadline.
NAM may determine not to vote proxies associated with the securities of any issuer if as a result of voting such proxies, subsequent purchases or sales of such securities would be blocked. However, NAM may decide, on an individual security basis that it is in the best interests of its clients to vote the proxy associated with such a security, taking into account the loss of liquidity. In addition, NAM may determine not to vote proxies where the voting would in NAM’s judgment result in some other financial, legal, regulatory disability or burden to the client (such as imputing control with respect to the issuer) or to NAM or its affiliates.
NAM may determine not to vote securities held by SMAs where voting would require the transfer of the security to another custodian designated by the issuer. Such transfer is generally outside the scope of NAM’s authority and may result in significant operational limitations on NAM’s ability to conduct transactions relating to the securities during the period of transfer. From time to time, situations may arise (operational or otherwise) that prevent NAM from voting proxies after reasonable attempts have been made.
J. Review and Reports.
1. The PVC shall maintain a review schedule. The schedule shall include reviews of the Policies and the policies of any Sub-adviser engaged by NAM, the proxy voting record, account maintenance, and other reviews as deemed appropriate by the PVC. The PVC shall review the schedule at least annually.
2. The PVC will report to NAM’s Compliance Committee with respect to all identified conflicts and how they were addressed. These reports will include all accounts, including those that are sub-advised. NAM also shall provide the Funds that it sub-advises with information necessary for preparing Form N-PX.
K. Vote Disclosure to Clients. NAM’s institutional and SMA clients can contact their relationship manager for more information on NAM’s Policies and the proxy voting record for their account. The information available includes name of issuer, ticker/CUSIP, shareholder meeting date, description of item and NAM’s vote.
IV. Responsible Parties
PVC
NGO
NAM Compliance
Legal Department
Serious News for Serious Traders! Try StreetInsider.com Premium Free!
You May Also Be Interested In
- Company announcement no 9/2024 Annual account 2023
- PMD Device Solutions Publishes 2023 Annual Report
- Company announcement no 7/2024 Annual account 2023
Create E-mail Alert Related Categories
SEC FilingsSign up for StreetInsider Free!
Receive full access to all new and archived articles, unlimited portfolio tracking, e-mail alerts, custom newswires and RSS feeds - and more!
