

Form N-CSR Lattice Strategies Trust For: Sep 30
 Tweet
Tweet Share
ShareUNITED STATES
SECURITIES AND EXCHANGE COMMISSION
Washington, D.C. 20549
FORM N-CSR
CERTIFIED SHAREHOLDER REPORT OF REGISTERED MANAGEMENT
INVESTMENT COMPANIES
Investment Company Act file number: 811-23002
LATTICE STRATEGIES TRUST
(Exact name of registrant as specified in charter)
690 Lee Road, Wayne, Pennsylvania 19087
(Address of Principal Executive Offices) (Zip Code)
Thomas R. Phillips, Esquire
Hartford Funds Management Company, LLC
690 Lee Road
Wayne, Pennsylvania 19087
(Name and Address of Agent for Service)
Copy to:
John V. O’Hanlon, Esq.
Dechert LLP
One International Place, 40th Floor
100 Oliver Street
Boston, MA 02110-2605
Registrant’s telephone number, including area code: (610) 386-4068
Date of fiscal year end: September 30
Date of reporting period: September 30, 2019
Form N-CSR is to be used by management investment companies to file reports with the Commission not later than 10 days after the transmission to stockholders of any report that is required to be transmitted to stockholders under Rule 30e-1 under the Investment Company Act of 1940 (17 CFR 270.30e-1). The Commission may use the information provided on Form N-CSR in its regulatory, disclosure review, inspection, and policymaking roles.
A registrant is required to disclose the information specified by Form N-CSR, and the Commission will make this information public. A registrant is not required to respond to the collection of information contained in Form N-CSR unless the Form displays a currently valid Office of Management and Budget (“OMB”) control number. Please direct comments concerning the accuracy of the information collection burden estimate and any suggestions for reducing the burden to Secretary, Securities and Exchange Commission, 450 Fifth Street, NW, Washington, DC 20549-0609. The OMB has reviewed this collection of information under the clearance requirements of 44 U.S.C. § 3507.
Item 1. Reports to Stockholders.
Hartford Multifactor ETFs
Annual Report
September 30, 2019
Hartford Multifactor Developed Markets (ex-US) ETF
Hartford Multifactor Emerging Markets ETF
Hartford Multifactor Global Small Cap ETF1
Hartford Multifactor Low Volatility International Equity ETF2
Hartford Multifactor Low Volatility US Equity ETF
Hartford Multifactor REIT ETF
Hartford Multifactor US Equity ETF
1 Effective November 6, 2019, Hartford Multifactor Global Small Cap ETF’s name changed to Hartford Multifactor Small Cap ETF
2 Effective November 6, 2019, Hartford Multifactor Low Volatility International Equity ETF’s name changed to Hartford Multifactor Diversified International ETF
Beginning on January 1, 2021, as permitted by regulations adopted by the Securities and Exchange Commission, paper copies of the Funds’ shareholder reports like this one will no longer
be sent by mail, unless you specifically request paper copies of the reports from the Funds or from your financial intermediary, such as a broker-dealer or bank. Instead, the reports will be made available on the Funds’ website
(www.hartfordfunds.com). You will be notified by mail each time a report is posted and provided with a website link to access the report. You may at any time elect to receive paper copies of all shareholder reports free of charge by contacting your
financial intermediary. Your election to receive reports in paper will apply to all Hartford Funds held in your account.
HARTFORDFUNDS
OUR BENCHMARK IS THE INVESTORS.®

Political uncertainty remained a core driver of increased market volatility throughout the period. Escalating trade tensions between the U.S. and China, continued debate over how the UK will handle its departure from the European Union, and the September announcement of an impeachment inquiry against President Trump all weighed on markets.
Against this backdrop, however, July 1, 2019 marked a significant milestone: The U.S. entered the longest period of economic expansion on record, according to The National Bureau of Economic Research. Strong consumer spending in the U.S. has continued to buoy the domestic economy, helped by an unemployment rate that stayed at or below 4% throughout the 12-month period ended September 30, 2019.
However, signs of a slowing global economy prompted central banks around the world to shift to more accommodating monetary policy. The U.S. Federal Reserve cut interest rates in July and September 2019, to 1.75-2%, while the European Central Bank, which already had established negative interest rates, further cut its rate to -0.5% as of September 18, 2019.
Politics, both at home and abroad, are likely to continue to play a key role in market movements this year. For this reason, we encourage you to maintain a strong relationship with your financial advisor, who can help guide you through shifting markets confidently. He or she can help you proactively build a portfolio that takes market uncertainty into account, along with your unique investment goals and risk tolerances. Your advisor can help you find a fit within our family of funds as you work toward those goals.
Thank you again for investing in Hartford Multifactor ETFs. For the most up-to-date information on our funds, please take advantage of all the resources available at hartfordfunds.com.

James Davey
President
Hartford Funds
| 1 | S&P 500 Index is a market capitalization-weighted price index composed of 500 widely held common stocks. |
Hartford Multifactor ETFs
| 2 | ||||
| 16 | ||||
| 17 | ||||
| Financial Statements: |
||||
| Schedules of Investments: |
||||
| 18 | ||||
| 24 | ||||
| 29 | ||||
| Hartford Multifactor Low Volatility International Equity ETF** |
35 | |||
| 39 | ||||
| 43 | ||||
| 45 | ||||
| 50 | ||||
| 51 | ||||
| 53 | ||||
| 55 | ||||
| 58 | ||||
| 60 | ||||
| 74 | ||||
| 75 | ||||
| How to Obtain a Copy of each Fund’s Proxy Voting Policies and Voting Records (Unaudited) |
79 | |||
| 79 | ||||
| Approval of Investment Advisory and Investment Sub-Advisory Agreements (Unaudited) |
80 | |||
| * | Effective November 6, 2019, the Fund’s name changed to the Hartford Multifactor Small Cap ETF. |
| ** | Effective November 6, 2019, the Fund’s name changed to the Hartford Multifactor Diversified International ETF. |
The views expressed in each Fund’s Manager Discussion contained in the Fund Overview section are views of that Fund’s sub-adviser and portfolio management team through the end of the period and are subject to change based on market and other conditions. Each Fund’s Manager Discussion is for informational purposes only and does not represent an offer, recommendation or solicitation to buy, hold or sell any security. The specific securities identified and described, if any, do not represent all of the securities purchased or sold and you should not assume that investments in the securities identified and discussed will be profitable.
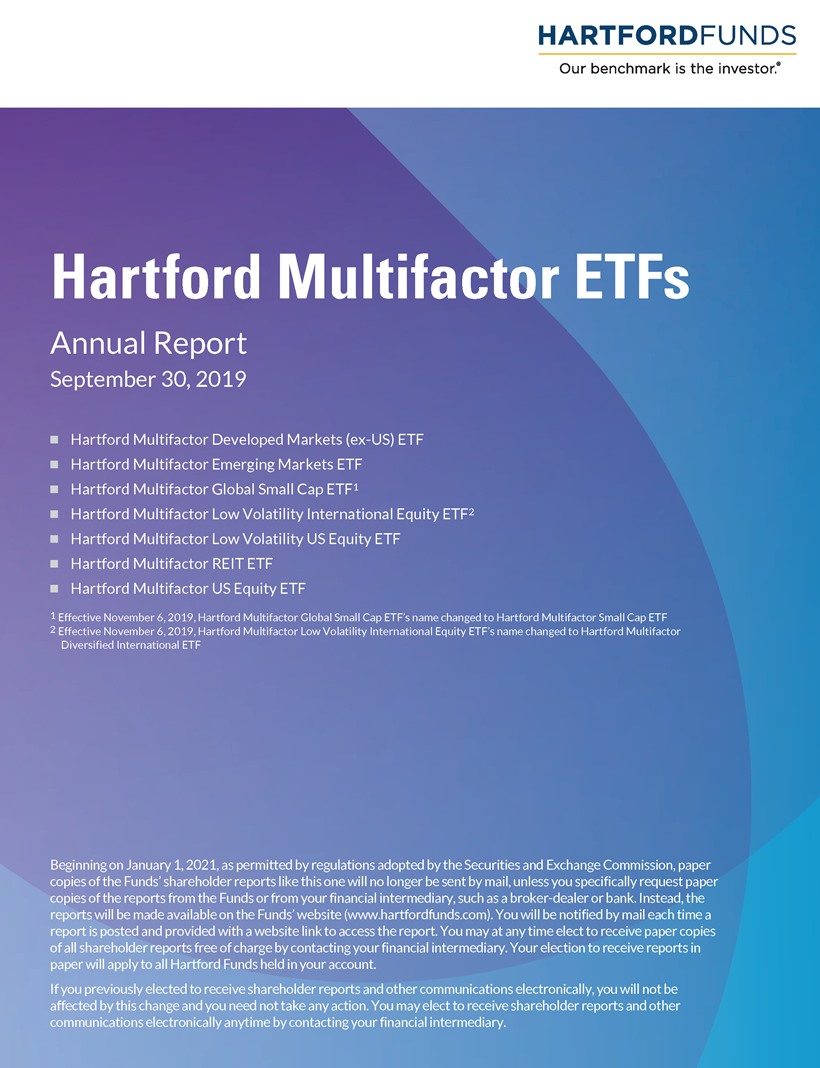
| Hartford Multifactor Developed Markets (ex-US) ETF |
Fund Overview
September 30, 2019 (Unaudited)
| Inception 2/25/2015 (sub-advised by Mellon Investments Corporation) |
Investment objective – The Fund seeks to provide investment results that, before fees and expenses, correspond to the total return performance of an index that tracks the performance of companies located in major developed markets of Europe, Canada and the Pacific Region. |
The chart above represents the hypothetical growth of a $10,000 investment in the Fund. The difference in returns between the Fund and the Index was primarily the result of the Fund’s operating expenses, including transaction costs, that are not reflected in the Index’s results.
|
|
2 |
|
| Hartford Multifactor Developed Markets (ex-US) ETF |
Fund Overview – (continued)
September 30, 2019 (Unaudited)
|
|
3 |
|
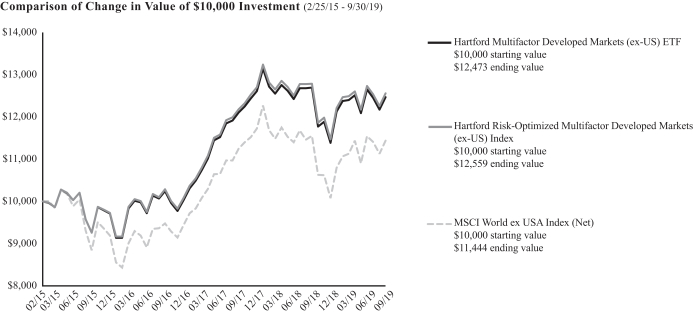
| Hartford Multifactor Emerging Markets ETF |
Fund Overview
September 30, 2019 (Unaudited)
| Inception 2/25/2015 (sub-advised by Mellon Investments Corporation) |
Investment objective – The Fund seeks to provide investment results that, before fees and expenses, correspond to the total return performance of an index based upon the emerging markets of the world. |
The chart above represents the hypothetical growth of a $10,000 investment in the Fund. The difference in returns between the Fund and the Index was primarily the result of the Fund’s operating expenses, including transaction costs, that are not reflected in the Index’s results.
|
|
4 |
|
| Hartford Multifactor Emerging Markets ETF |
Fund Overview – (continued)
September 30, 2019 (Unaudited)
|
|
5 |
|
| Hartford Multifactor Global Small Cap ETF* |
Fund Overview
September 30, 2019 (Unaudited)
| Inception 3/23/2015 (sub-advised by Mellon Investments Corporation) |
Investment objective – The Fund seeks to provide investment results that, before fees and expenses, correspond to the total return performance of an index that tracks the performance of small capitalization exchange traded equity securities. |
| * | Effective November 6, 2019, the Fund changed its strategy and proprietary custom benchmark. The information in this report is as of the fiscal year ended September 30, 2019 and reflects the Fund’s prior strategy and benchmark. |

The chart above represents the hypothetical growth of a $10,000 investment in the Fund. The difference in returns between the Fund and the Index was primarily the result of the Fund’s operating expenses, including transaction costs, that are not reflected in the Index’s results.
|
|
6 |
|
| Hartford Multifactor Global Small Cap ETF |
Fund Overview – (continued)
September 30, 2019 (Unaudited)
|
|
7 |
|
| Hartford Multifactor Low Volatility International Equity ETF* |
Fund Overview
September 30, 2019 (Unaudited)
| Inception 5/10/2017 (sub-advised by Mellon Investments Corporation) |
Investment objective – The Fund seeks to provide investment results that, before fees and expenses, correspond to the total return performance of an index that tracks the performance of companies located in both developed and emerging markets. |
| * | Effective November 6, 2019, the Fund changed its strategy and proprietary custom benchmark. The information in this report is as of the fiscal year ended September 30, 2019 and reflects the Fund’s prior strategy and benchmark. |

The chart above represents the hypothetical growth of a $10,000 investment in the Fund. The difference in returns between the Fund and the Index was primarily the result of the Fund’s operating expenses, including transaction costs, that are not reflected in the Index’s results.
|
|
8 |
|
| Hartford Multifactor Low Volatility International Equity ETF |
Fund Overview – (continued)
September 30, 2019 (Unaudited)
|
|
9 |
|
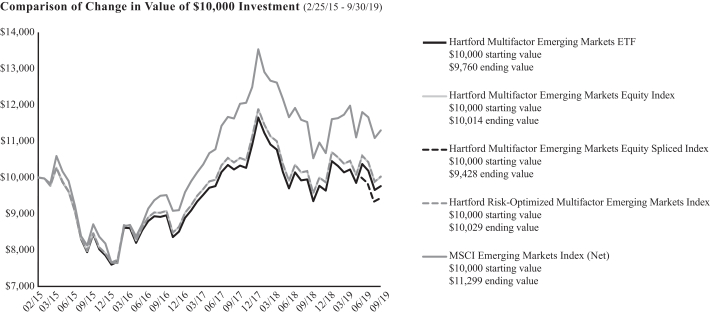
| Hartford Multifactor Low Volatility US Equity ETF |
Fund Overview
September 30, 2019 (Unaudited)
| Inception 5/10/2017 (sub-advised by Mellon Investments Corporation) |
Investment objective – The Fund seeks to provide investment results that, before fees and expenses, correspond to the total return performance of an index that tracks the performance of exchange traded U.S. equity securities. |
The chart above represents the hypothetical growth of a $10,000 investment in the Fund. The difference in returns between the Fund and the Index was primarily the result of the Fund’s operating expenses, including transaction costs, that are not reflected in the Index’s results.
|
|
10 |
|
| Hartford Multifactor Low Volatility US Equity ETF |
Fund Overview – (continued)
September 30, 2019 (Unaudited)
|
|
11 |
|
| Hartford Multifactor REIT ETF |
Fund Overview
September 30, 2019 (Unaudited)
| Inception 10/03/2016 (sub-advised by Mellon Investments Corporation) |
Investment objective – The Fund seeks to provide investment results that, before fees and expenses, correspond to the total return performance of an index that tracks the performance of publicly traded real estate investment trusts. |
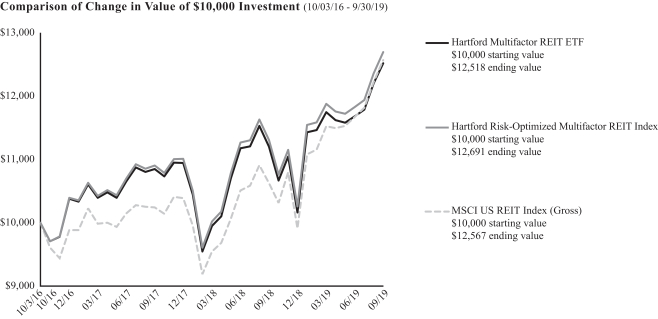
The chart above represents the hypothetical growth of a $10,000 investment in the Fund. The difference in returns between the Fund and the Index was primarily the result of the Fund’s operating expenses, including transaction costs, that are not reflected in the Index’s results.
|
|
12 |
|
| Hartford Multifactor REIT ETF |
Fund Overview – (continued)
September 30, 2019 (Unaudited)
|
|
13 |
|
| Hartford Multifactor US Equity ETF |
Fund Overview
September 30, 2019 (Unaudited)
| Inception 2/25/2015 (sub-advised by Mellon Investments Corporation) |
Investment objective – The Fund seeks to provide investment results that, before fees and expenses, correspond to the total return performance of an index that tracks the performance of exchange traded U.S. equity securities. |

The chart above represents the hypothetical growth of a $10,000 investment in the Fund. The difference in returns between the Fund and the Index was primarily the result of the Fund’s operating expenses, including transaction costs, that are not reflected in the Index’s results.
|
|
14 |
|
| Hartford Multifactor US Equity ETF |
Fund Overview – (continued)
September 30, 2019 (Unaudited)
|
|
15 |
|
| Hartford Multifactor ETFs |
Benchmark Glossary (Unaudited)
|
|
16 |
|
| Hartford Multifactor ETFs |
Your Fund’s Expenses
As a shareholder of a Fund, you incur two types of costs: (1) transaction costs, including brokerage commissions paid on purchases and sales of Fund shares and (2) ongoing costs, including investment management fees and certain other fund expenses. This example is intended to help you understand your ongoing costs (in dollars) of investing in a Fund and to compare these costs with the ongoing costs of investing in other exchange-traded funds. The example is based on an investment of $1,000 invested at the beginning of the period and held for the entire period of April 1, 2019 through September 30, 2019. To the extent a Fund was subject to acquired fund fees and expenses during the period, acquired fund fees and expenses are not included in the annualized expense ratio below.
Actual Expenses
The first set of columns of the table below provides information about actual account values and actual expenses. You may use this information, together with the amount you invested, to estimate the expenses that you paid over the period. Simply divide your account value by $1,000 (for example, an $8,600 account value divided by $1,000 = 8.6), then multiply the result by the number in the line under the heading entitled “Expenses Paid During the Period” to estimate the expenses you paid on your account during this period.
Hypothetical Example for Comparison Purposes
The second set of columns of the table below provides information about hypothetical account values and hypothetical expenses based on a Fund’s actual expense ratio and an assumed rate of return of 5% per year before expenses, which is not the Fund’s actual return. The hypothetical account values and expenses may not be used to estimate the actual ending account balance or expenses you paid for the period. You may use this information to compare the ongoing costs of investing in a Fund and other funds. To do so, compare this 5% hypothetical example with the 5% hypothetical examples that appear in the shareholder reports of the other funds.
Please note that the expenses shown in the table are meant to highlight your ongoing costs only and do not reflect any transactional costs, such as brokerage commissions paid on purchases and sales of shares of the Funds. Therefore, the second set of columns of the table is useful in comparing ongoing costs only, and will not help you determine the relative total costs of owning different exchange-traded funds. In addition, if these transactional costs were included, your costs would be higher. Expense ratios may vary period to period because of various factors, such as an increase in expenses not covered by the management fee (including extraordinary expenses and interest expense). Expenses are equal to a Fund’s annualized expense ratio multiplied by average account value over the period, multiplied by 183/365 (to reflect the one-half year period).
| Actual Return | Hypothetical (5% return before expenses) | |||||||||||||||||||||||||||
| Beginning Account Value April 1, 2019 |
Ending Account Value September 30, 2019 |
Expenses paid during the period April 1, 2019 through September 30, 2019 |
Beginning Account Value April 1, 2019 |
Ending Account Value September 30, 2019 |
Expenses paid during the period April 1, 2019 through September 30, 2019 |
Annualized expense ratio |
||||||||||||||||||||||
| Hartford Multifactor Developed Markets (ex-US) ETF |
| |||||||||||||||||||||||||||
| $ | 1,000.00 | $ | 1,005.40 | $ | 1.46 | $ | 1,000.00 | $ | 1,023.62 | $ | 1.47 | 0.29 | % | |||||||||||||||
| Hartford Multifactor Emerging Markets ETF |
| |||||||||||||||||||||||||||
| $ | 1,000.00 | $ | 962.20 | $ | 2.41 | $ | 1,000.00 | $ | 1,022.61 | $ | 2.48 | 0.49 | % | |||||||||||||||
| Hartford Multifactor Global Small Cap ETF |
| |||||||||||||||||||||||||||
| $ | 1,000.00 | $ | 978.30 | $ | 1.93 | $ | 1,000.00 | $ | 1,023.11 | $ | 1.98 | 0.39 | % | |||||||||||||||
| Hartford Multifactor Low Volatility International Equity ETF |
| |||||||||||||||||||||||||||
| $ | 1,000.00 | $ | 1,023.60 | $ | 1.47 | $ | 1,000.00 | $ | 1,023.62 | $ | 1.47 | 0.29 | % | |||||||||||||||
| Hartford Multifactor Low Volatility US Equity ETF |
| |||||||||||||||||||||||||||
| $ | 1,000.00 | $ | 1,086.10 | $ | 0.99 | $ | 1,000.00 | $ | 1,024.12 | $ | 0.96 | 0.19 | % | |||||||||||||||
| Hartford Multifactor REIT ETF |
| |||||||||||||||||||||||||||
| $ | 1,000.00 | $ | 1,065.80 | $ | 2.33 | $ | 1,000.00 | $ | 1,022.81 | $ | 2.28 | 0.45 | % | |||||||||||||||
| Hartford Multifactor US Equity ETF |
| |||||||||||||||||||||||||||
| $ | 1,000.00 | $ | 1,053.40 | $ | 0.98 | $ | 1,000.00 | $ | 1,024.12 | $ | 0.96 | 0.19 | % | |||||||||||||||
|
|
17 |
|
| Hartford Multifactor Developed Markets (ex-US) ETF |
Schedule of Investments
September 30, 2019
The accompanying notes are an integral part of these financial statements.
|
|
18 |
|
| Hartford Multifactor Developed Markets (ex-US) ETF |
Schedule of Investments – (continued)
September 30, 2019
The accompanying notes are an integral part of these financial statements.
|
|
19 |
|
| Hartford Multifactor Developed Markets (ex-US) ETF |
Schedule of Investments – (continued)
September 30, 2019
The accompanying notes are an integral part of these financial statements.
|
|
20 |
|
| Hartford Multifactor Developed Markets (ex-US) ETF |
Schedule of Investments – (continued)
September 30, 2019
The accompanying notes are an integral part of these financial statements.
|
|
21 |
|
| Hartford Multifactor Developed Markets (ex-US) ETF |
Schedule of Investments – (continued)
September 30, 2019
| Futures Contracts Outstanding at September 30, 2019 | ||||||||||||||||
| Description |
Number of Contracts |
Expiration Date |
Current Notional Amount |
Value and Unrealized Appreciation/ (Depreciation) |
||||||||||||
| Long position contracts: | ||||||||||||||||
| MSCI EAFE Index Future |
78 | 12/20/2019 | $ | 7,403,760 | $ | (43,047 | ) | |||||||||
|
|
|
|||||||||||||||
| Total futures contracts |
|
$ | (43,047 | ) | ||||||||||||
|
|
|
|||||||||||||||
| † | See Significant Accounting Policies of accompanying Notes to Financial Statements regarding valuation of investments. |
The accompanying notes are an integral part of these financial statements.
|
|
22 |
|
| Hartford Multifactor Developed Markets (ex-US) ETF |
Schedule of Investments – (continued)
September 30, 2019
Fair Valuation Summary
The following is a summary of the fair valuations according to the inputs used as of September 30, 2019 in valuing the Fund’s investments.
| Description |
Total | Level 1 | Level 2 | Level 3(1) | ||||||||||||
| Assets |
||||||||||||||||
| Common Stocks |
||||||||||||||||
| Australia |
$ | 196,198,996 | $ | 196,198,996 | $ | — | $ | — | ||||||||
| Austria |
6,863,055 | 6,863,055 | — | — | ||||||||||||
| Belgium |
45,594,634 | 45,594,634 | — | — | ||||||||||||
| Canada |
265,603,392 | 265,603,392 | — | — | ||||||||||||
| China |
5,486,074 | 5,486,074 | — | — | ||||||||||||
| Denmark |
44,505,051 | 44,505,051 | — | — | ||||||||||||
| Finland |
14,996,444 | 14,996,444 | — | — | ||||||||||||
| France |
139,713,577 | 139,713,577 | — | — | ||||||||||||
| Germany |
141,128,568 | 141,128,568 | — | — | ||||||||||||
| Hong Kong |
94,965,260 | 94,965,260 | — | — | ||||||||||||
| Ireland |
15,738,693 | 15,738,693 | — | — | ||||||||||||
| Israel |
41,115,598 | 41,115,598 | — | — | ||||||||||||
| Italy |
66,886,702 | 66,886,702 | — | — | ||||||||||||
| Japan |
499,236,030 | 499,236,030 | — | — | ||||||||||||
| Luxembourg |
5,257,943 | 5,257,943 | — | — | ||||||||||||
| Netherlands |
81,794,406 | 81,794,406 | — | — | ||||||||||||
| New Zealand |
12,436,580 | 12,436,580 | — | — | ||||||||||||
| Norway |
33,062,423 | 33,062,423 | — | — | ||||||||||||
| Portugal |
12,314,380 | 12,314,380 | — | — | ||||||||||||
| Russia |
27,466,673 | 27,466,673 | — | — | ||||||||||||
| Singapore |
47,475,878 | 47,475,878 | — | — | ||||||||||||
| Spain |
55,081,600 | 55,081,600 | — | — | ||||||||||||
| Sweden |
59,315,466 | 59,315,466 | — | — | ||||||||||||
| Switzerland |
144,581,971 | 144,581,971 | — | — | ||||||||||||
| United Kingdom |
262,466,567 | 262,466,567 | — | — | ||||||||||||
| United States |
1,998,563 | 1,998,563 | — | — | ||||||||||||
| Short-Term Investments |
418,508 | — | 418,508 | — | ||||||||||||
|
|
|
|
|
|
|
|
|
|||||||||
| Total |
$ | 2,321,703,032 | $ | 2,321,284,524 | $ | 418,508 | $ | — | ||||||||
|
|
|
|
|
|
|
|
|
|||||||||
| Liabilities |
||||||||||||||||
| Futures Contracts(2) |
$ | (43,047 | ) | $ | (43,047 | ) | $ | — | $ | — | ||||||
|
|
|
|
|
|
|
|
|
|||||||||
| Total |
$ | (43,047 | ) | $ | (43,047 | ) | $ | — | $ | — | ||||||
|
|
|
|
|
|
|
|
|
|||||||||
| (1) | For the year ended September 30, 2019, there were no transfers in and out of Level 3. |
| (2) | Derivative instruments (excluding purchased and written options, if applicable) are valued at the unrealized appreciation/(depreciation) on the investments. |
The accompanying notes are an integral part of these financial statements.
|
|
23 |
|
| Hartford Multifactor Emerging Markets ETF |
Schedule of Investments
September 30, 2019
The accompanying notes are an integral part of these financial statements.
|
|
24 |
|
| Hartford Multifactor Emerging Markets ETF |
Schedule of Investments – (continued)
September 30, 2019
The accompanying notes are an integral part of these financial statements.
|
|
25 |
|
| Hartford Multifactor Emerging Markets ETF |
Schedule of Investments – (continued)
September 30, 2019
The accompanying notes are an integral part of these financial statements.
|
|
26 |
|
| Hartford Multifactor Emerging Markets ETF |
Schedule of Investments – (continued)
September 30, 2019
| Futures Contracts Outstanding at September 30, 2019 | ||||||||||||||||||
| Description |
Number of Contracts |
Expiration Date |
Current Notional Amount |
Value and Unrealized Appreciation/ (Depreciation) |
||||||||||||||
| Long position contracts: | ||||||||||||||||||
| MSCI Emerging Market Index Future |
7 | 12/20/2019 | $ | 350,665 | $ | (7,768 | ) | |||||||||||
|
|
|
|||||||||||||||||
| Total futures contracts |
|
$ | (7,768 | ) | ||||||||||||||
|
|
|
|||||||||||||||||
| † | See Significant Accounting Policies of accompanying Notes to Financial Statements regarding valuation of investments. |
The accompanying notes are an integral part of these financial statements.
|
|
27 |
|
| Hartford Multifactor Emerging Markets ETF |
Schedule of Investments – (continued)
September 30, 2019
Fair Valuation Summary
The following is a summary of the fair valuations according to the inputs used as of September 30, 2019 in valuing the Fund’s investments.
| Description |
Total | Level 1 | Level 2 | Level 3(1) | ||||||||||||
| Assets |
||||||||||||||||
| Common Stocks |
||||||||||||||||
| Brazil |
$ | 3,145,848 | $ | 3,145,848 | $ | — | $ | — | ||||||||
| Chile |
2,118,068 | 2,118,068 | — | — | ||||||||||||
| China |
13,941,631 | 13,770,012 | — | 171,619 | ||||||||||||
| Colombia |
228,474 | 228,474 | — | — | ||||||||||||
| Hong Kong |
1,825,573 | 1,825,573 | — | — | ||||||||||||
| India |
2,537,377 | 2,537,377 | — | — | ||||||||||||
| Indonesia |
3,279,671 | 3,279,671 | — | — | ||||||||||||
| Malaysia |
3,004,259 | 3,004,259 | — | — | ||||||||||||
| Mexico |
2,478,366 | 2,478,366 | — | — | ||||||||||||
| Philippines |
2,431,359 | 2,431,359 | — | — | ||||||||||||
| Poland |
1,867,494 | 1,867,494 | — | — | ||||||||||||
| Russia |
2,034,684 | 2,034,684 | — | — | ||||||||||||
| South Africa |
2,546,384 | 2,546,384 | — | — | ||||||||||||
| South Korea |
9,209,060 | 9,209,060 | — | — | ||||||||||||
| Taiwan |
8,856,285 | 8,856,285 | — | — | ||||||||||||
| Thailand |
4,179,511 | 4,179,511 | — | — | ||||||||||||
| Turkey |
2,260,587 | 2,260,587 | — | — | ||||||||||||
| Preferred Stocks |
2,579,058 | 2,579,058 | — | — | ||||||||||||
| Short-Term Investments |
49,822 | — | 49,822 | — | ||||||||||||
|
|
|
|
|
|
|
|
|
|||||||||
| Total |
$ | 68,573,511 | $ | 68,352,070 | $ | 49,822 | $ | 171,619 | ||||||||
|
|
|
|
|
|
|
|
|
|||||||||
| Liabilities |
||||||||||||||||
| Futures Contracts(2) |
$ | (7,768 | ) | $ | (7,768 | ) | $ | — | $ | — | ||||||
|
|
|
|
|
|
|
|
|
|||||||||
| Total |
$ | (7,768 | ) | $ | (7,768 | ) | $ | — | $ | — | ||||||
|
|
|
|
|
|
|
|
|
|||||||||
| (1) | For the year ended September 30, 2019, there were no transfers in and out of Level 3. |
| (2) | Derivative instruments (excluding purchased and written options, if applicable) are valued at the unrealized appreciation/(depreciation) on the investments. |
Level 3 investments at the beginning and/or end of the period in relation to net assets were not significant and accordingly, a reconciliation of Level 3 assets for the year ended September 30, 2019 is not presented.
The accompanying notes are an integral part of these financial statements.
|
|
28 |
|
| Hartford Multifactor Global Small Cap ETF |
Schedule of Investments
September 30, 2019
The accompanying notes are an integral part of these financial statements.
|
|
29 |
|
| Hartford Multifactor Global Small Cap ETF |
Schedule of Investments – (continued)
September 30, 2019
The accompanying notes are an integral part of these financial statements.
|
|
30 |
|
| Hartford Multifactor Global Small Cap ETF |
Schedule of Investments – (continued)
September 30, 2019
The accompanying notes are an integral part of these financial statements.
|
|
31 |
|
| Hartford Multifactor Global Small Cap ETF |
Schedule of Investments – (continued)
September 30, 2019
The accompanying notes are an integral part of these financial statements.
|
|
32 |
|
| Hartford Multifactor Global Small Cap ETF |
Schedule of Investments – (continued)
September 30, 2019
| Futures Contracts Outstanding at September 30, 2019 | ||||||||||||||||
| Description |
Number of Contracts |
Expiration Date |
Current Notional Amount |
Value and Unrealized Appreciation/ (Depreciation) |
||||||||||||
| Long position contracts: | ||||||||||||||||
| E-Mini Russell 2000 |
1 | 12/20/2019 | $ | 76,250 | $ | (3,132 | ) | |||||||||
| MSCI EAFE Index Future |
1 | 12/20/2019 | 94,920 | (552 | ) | |||||||||||
|
|
|
|||||||||||||||
| Total |
|
$ | (3,684 | ) | ||||||||||||
|
|
|
|||||||||||||||
| Total futures contracts |
|
$ | (3,684 | ) | ||||||||||||
|
|
|
|||||||||||||||
| † | See Significant Accounting Policies of accompanying Notes to Financial Statements regarding valuation of investments. |
The accompanying notes are an integral part of these financial statements.
|
|
33 |
|
| Hartford Multifactor Global Small Cap ETF |
Schedule of Investments – (continued)
September 30, 2019
Fair Valuation Summary
The following is a summary of the fair valuations according to the inputs used as of September 30, 2019 in valuing the Fund’s investments.
| Description |
Total | Level 1 | Level 2 | Level 3(1) | ||||||||||||
| Assets |
| |||||||||||||||
| Common Stocks |
| |||||||||||||||
| Australia |
$ | 992,695 | $ | 992,695 | $ | — | $ | — | ||||||||
| Belgium |
34,176 | 34,176 | — | — | ||||||||||||
| Bermuda |
67,430 | 67,430 | — | — | ||||||||||||
| Brazil |
262,452 | 262,452 | — | — | ||||||||||||
| Canada |
787,517 | 787,517 | — | — | ||||||||||||
| China |
1,160,716 | 1,160,716 | — | — | ||||||||||||
| Denmark |
73,636 | 73,636 | — | — | ||||||||||||
| Finland |
7,231 | 7,231 | — | — | ||||||||||||
| France |
295,771 | 295,771 | — | — | ||||||||||||
| Georgia |
30,589 | 30,589 | — | — | ||||||||||||
| Germany |
179,291 | 179,291 | — | — | ||||||||||||
| Hong Kong |
519,125 | 519,125 | — | — | ||||||||||||
| Ireland |
20,576 | 20,576 | — | — | ||||||||||||
| Israel |
266,021 | 266,021 | — | — | ||||||||||||
| Italy |
174,273 | 174,273 | — | — | ||||||||||||
| Japan |
2,764,652 | 2,764,652 | — | — | ||||||||||||
| Liechtenstein |
33,922 | 33,922 | — | — | ||||||||||||
| Luxembourg |
42,294 | 42,294 | — | — | ||||||||||||
| Netherlands |
67,172 | 67,172 | — | — | ||||||||||||
| New Zealand |
151,958 | 151,958 | — | — | ||||||||||||
| Norway |
131,123 | 131,123 | — | — | ||||||||||||
| Poland |
78,594 | 78,594 | — | — | ||||||||||||
| Singapore |
139,431 | 139,431 | — | — | ||||||||||||
| South Africa |
139,432 | 139,432 | — | — | ||||||||||||
| South Korea |
814,725 | 814,725 | — | — | ||||||||||||
| Spain |
36,284 | 36,284 | — | — | ||||||||||||
| Sweden |
353,113 | 353,113 | — | — | ||||||||||||
| Switzerland |
194,655 | 194,655 | — | — | ||||||||||||
| Taiwan |
729,625 | 729,625 | — | — | ||||||||||||
| Thailand |
59,413 | 59,413 | — | — | ||||||||||||
| United Kingdom |
699,796 | 699,796 | — | — | ||||||||||||
| United States |
5,608,534 | 5,608,534 | — | — | ||||||||||||
| Preferred Stocks |
42,098 | 42,098 | — | — | ||||||||||||
| Short-Term Investments |
19,929 | — | 19,929 | — | ||||||||||||
|
|
|
|
|
|
|
|
|
|||||||||
| Total |
$ | 16,978,249 | $ | 16,958,320 | $ | 19,929 | $ | — | ||||||||
|
|
|
|
|
|
|
|
|
|||||||||
| Liabilities |
| |||||||||||||||
| Futures Contracts(2) |
$ | (3,684 | ) | $ | (3,684 | ) | $ | — | $ | — | ||||||
|
|
|
|
|
|
|
|
|
|||||||||
| Total |
$ | (3,684 | ) | $ | (3,684 | ) | $ | — | $ | — | ||||||
|
|
|
|
|
|
|
|
|
|||||||||
| (1) | For the year ended September 30, 2019, there were no transfers in and out of Level 3. |
| (2) | Derivative instruments (excluding purchased and written options, if applicable) are valued at the unrealized appreciation/(depreciation) on the investments. |
The accompanying notes are an integral part of these financial statements.
|
|
34 |
|
| Hartford Multifactor Low Volatility International Equity ETF |
Schedule of Investments
September 30, 2019
The accompanying notes are an integral part of these financial statements.
|
|
35 |
|
| Hartford Multifactor Low Volatility International Equity ETF |
Schedule of Investments – (continued)
September 30, 2019
The accompanying notes are an integral part of these financial statements.
|
|
36 |
|
| Hartford Multifactor Low Volatility International Equity ETF |
Schedule of Investments – (continued)
September 30, 2019
The accompanying notes are an integral part of these financial statements.
|
|
37 |
|
| Hartford Multifactor Low Volatility International Equity ETF |
Schedule of Investments – (continued)
September 30, 2019
Fair Valuation Summary
The following is a summary of the fair valuations according to the inputs used as of September 30, 2019 in valuing the Fund’s investments.
| Description |
Total | Level 1 | Level 2 | Level 3(1) | ||||||||||||
| Assets |
| |||||||||||||||
| Common Stocks |
| |||||||||||||||
| Australia |
$ | 361,531 | $ | 361,531 | $ | — | $ | — | ||||||||
| Belgium |
4,648 | 4,648 | — | — | ||||||||||||
| Brazil |
23,149 | 23,149 | — | — | ||||||||||||
| Canada |
555,392 | 555,392 | — | — | ||||||||||||
| China |
123,184 | 123,184 | — | — | ||||||||||||
| Denmark |
113,585 | 113,585 | — | — | ||||||||||||
| Finland |
7,802 | 7,802 | — | — | ||||||||||||
| France |
215,654 | 215,654 | — | — | ||||||||||||
| Germany |
179,677 | 179,677 | — | — | ||||||||||||
| Hong Kong |
293,117 | 293,117 | — | — | ||||||||||||
| India |
128,548 | 128,548 | — | — | ||||||||||||
| Indonesia |
157,853 | 157,853 | — | — | ||||||||||||
| Ireland |
59,915 | 59,915 | — | — | ||||||||||||
| Israel |
133,182 | 133,182 | — | — | ||||||||||||
| Italy |
76,872 | 76,872 | — | — | ||||||||||||
| Japan |
861,554 | 861,554 | — | — | ||||||||||||
| Malaysia |
115,342 | 115,342 | — | — | ||||||||||||
| Mexico |
12,860 | 12,860 | — | — | ||||||||||||
| Netherlands |
62,203 | 62,203 | — | — | ||||||||||||
| Norway |
90,188 | 90,188 | — | — | ||||||||||||
| Philippines |
39,632 | 39,632 | — | — | ||||||||||||
| Portugal |
2,894 | 2,894 | — | — | ||||||||||||
| Russia |
7,270 | 7,270 | — | — | ||||||||||||
| Singapore |
43,668 | 43,668 | — | — | ||||||||||||
| South Africa |
25,963 | 25,963 | — | — | ||||||||||||
| South Korea |
276,841 | 276,841 | — | — | ||||||||||||
| Spain |
49,809 | 49,809 | — | — | ||||||||||||
| Sweden |
68,104 | 68,104 | — | — | ||||||||||||
| Switzerland |
152,325 | 152,325 | — | — | ||||||||||||
| Taiwan |
280,878 | 280,878 | — | — | ||||||||||||
| Thailand |
153,231 | 153,231 | — | — | ||||||||||||
| Turkey |
86,720 | 86,720 | — | — | ||||||||||||
| United Kingdom |
576,135 | 576,135 | — | — | ||||||||||||
| United States |
3,654 | 3,654 | — | — | ||||||||||||
| Preferred Stocks |
2,517 | 2,517 | — | — | ||||||||||||
|
|
|
|
|
|
|
|
|
|||||||||
| Total |
$ | 5,345,897 | $ | 5,345,897 | $ | — | $ | — | ||||||||
|
|
|
|
|
|
|
|
|
|||||||||
| (1) | For the year ended September 30, 2019, there were no transfers in and out of Level 3. |
The accompanying notes are an integral part of these financial statements.
|
|
38 |
|
| Hartford Multifactor Low Volatility US Equity ETF |
Schedule of Investments
September 30, 2019
The accompanying notes are an integral part of these financial statements.
|
|
39 |
|
| Hartford Multifactor Low Volatility US Equity ETF |
Schedule of Investments – (continued)
September 30, 2019
The accompanying notes are an integral part of these financial statements.
|
|
40 |
|
| Hartford Multifactor Low Volatility US Equity ETF |
Schedule of Investments – (continued)
September 30, 2019
The accompanying notes are an integral part of these financial statements.
|
|
41 |
|
| Hartford Multifactor Low Volatility US Equity ETF |
Schedule of Investments – (continued)
September 30, 2019
Fair Valuation Summary
The following is a summary of the fair valuations according to the inputs used as of September 30, 2019 in valuing the Fund’s investments.
| Description |
Total | Level 1 | Level 2 | Level 3(1) | ||||||||||||
| Assets |
||||||||||||||||
| Common Stocks |
||||||||||||||||
| Automobiles & Components |
$ | 38,604 | $ | 38,604 | $ | — | $ | — | ||||||||
| Banks |
73,612 | 73,612 | — | — | ||||||||||||
| Capital Goods |
741,337 | 741,337 | — | — | ||||||||||||
| Commercial & Professional Services |
302,010 | 302,010 | — | — | ||||||||||||
| Consumer Durables & Apparel |
32,748 | 32,748 | — | — | ||||||||||||
| Consumer Services |
747,028 | 747,028 | — | — | ||||||||||||
| Diversified Financials |
285,871 | 285,871 | — | — | ||||||||||||
| Energy |
405,682 | 405,682 | — | — | ||||||||||||
| Food & Staples Retailing |
141,550 | 141,550 | — | — | ||||||||||||
| Food, Beverage & Tobacco |
363,027 | 363,027 | — | — | ||||||||||||
| Health Care Equipment & Services |
354,164 | 354,164 | — | — | ||||||||||||
| Household & Personal Products |
190,542 | 190,542 | — | — | ||||||||||||
| Insurance |
231,160 | 231,160 | — | — | ||||||||||||
| Materials |
690,245 | 690,245 | — | — | ||||||||||||
| Media & Entertainment |
310,802 | 310,802 | — | — | ||||||||||||
| Pharmaceuticals, Biotechnology & Life Sciences |
327,577 | 327,577 | — | — | ||||||||||||
| Real Estate |
459,303 | 459,303 | — | — | ||||||||||||
| Retailing |
406,124 | 406,124 | — | — | ||||||||||||
| Semiconductors & Semiconductor Equipment |
20,148 | 20,148 | — | — | ||||||||||||
| Software & Services |
758,851 | 758,851 | — | — | ||||||||||||
| Technology Hardware & Equipment |
94,107 | 94,107 | — | — | ||||||||||||
| Telecommunication Services |
329,519 | 329,519 | — | — | ||||||||||||
| Transportation |
154,522 | 154,522 | — | — | ||||||||||||
| Utilities |
234,033 | 234,033 | — | — | ||||||||||||
|
|
|
|
|
|
|
|
|
|||||||||
| Total |
$ | 7,692,566 | $ | 7,692,566 | $ | — | $ | — | ||||||||
|
|
|
|
|
|
|
|
|
|||||||||
| (1) | For the year ended September 30, 2019, there were no transfers in and out of Level 3. |
The accompanying notes are an integral part of these financial statements.
|
|
42 |
|
| Hartford Multifactor REIT ETF |
Schedule of Investments
September 30, 2019
The accompanying notes are an integral part of these financial statements.
|
|
43 |
|
| Hartford Multifactor REIT ETF |
Schedule of Investments – (continued)
September 30, 2019
| Futures Contracts Outstanding at September 30, 2019 | ||||||||||||||||
| Description |
Number of Contracts |
Expiration Date |
Current Notional Amount |
Value and Unrealized Appreciation/ (Depreciation) |
||||||||||||
| Long position contracts: | ||||||||||||||||
| S&P Real Estate Sector (E-Mini) Future |
2 | 12/20/2019 | $ | 95,250 | $ | 809 | ||||||||||
|
|
|
|||||||||||||||
| Total futures contracts |
|
$ | 809 | |||||||||||||
|
|
|
|||||||||||||||
| † | See Significant Accounting Policies of accompanying Notes to Financial Statements regarding valuation of investments. |
Fair Valuation Summary
The following is a summary of the fair valuations according to the inputs used as of September 30, 2019 in valuing the Fund’s investments.
| Description |
Total | Level 1 | Level 2 | Level 3(1) | ||||||||||||
| Assets |
||||||||||||||||
| Common Stocks |
||||||||||||||||
| Diversified REITs |
$ | 1,748,005 | $ | 1,748,005 | $ | — | $ | — | ||||||||
| Health Care REITs |
1,749,139 | 1,749,139 | — | — | ||||||||||||
| Hotel & Resort REITs |
1,525,994 | 1,525,994 | — | — | ||||||||||||
| Industrial REITs |
1,257,139 | 1,257,139 | — | — | ||||||||||||
| Office REITs |
1,374,446 | 1,374,446 | — | — | ||||||||||||
| Residential REITs |
2,272,808 | 2,272,808 | — | — | ||||||||||||
| Retail REITs |
4,542,899 | 4,542,899 | — | — | ||||||||||||
| Specialized REITs |
3,435,703 | 3,435,703 | — | — | ||||||||||||
| Short-Term Investments |
9,964 | — | 9,964 | — | ||||||||||||
| Futures Contracts(2) |
809 | 809 | — | — | ||||||||||||
|
|
|
|
|
|
|
|
|
|||||||||
| Total |
$ | 17,916,906 | $ | 17,906,942 | $ | 9,964 | $ | — | ||||||||
|
|
|
|
|
|
|
|
|
|||||||||
| (1) | For the year ended September 30, 2019, there were no transfers in and out of Level 3. |
| (2) | Derivative instruments (excluding purchased and written options, if applicable) are valued at the unrealized appreciation/(depreciation) on the investments. |
The accompanying notes are an integral part of these financial statements.
|
|
44 |
|
| Hartford Multifactor US Equity ETF |
Schedule of Investments
September 30, 2019
The accompanying notes are an integral part of these financial statements.
|
|
45 |
|
| Hartford Multifactor US Equity ETF |
Schedule of Investments – (continued)
September 30, 2019
The accompanying notes are an integral part of these financial statements.
|
|
46 |
|
| Hartford Multifactor US Equity ETF |
Schedule of Investments – (continued)
September 30, 2019
The accompanying notes are an integral part of these financial statements.
|
|
47 |
|
| Hartford Multifactor US Equity ETF |
Schedule of Investments – (continued)
September 30, 2019
| Futures Contracts Outstanding at September 30, 2019 | ||||||||||||||||
| Description |
Number of Contracts |
Expiration Date |
Current Notional Amount |
Value and Unrealized Appreciation/ (Depreciation) |
||||||||||||
| Long position contracts: | ||||||||||||||||
| S&P 500 (E-Mini) Future |
23 | 12/20/2019 | $ | 3,425,275 | $ | (25,340 | ) | |||||||||
|
|
|
|||||||||||||||
| Total futures contracts |
|
$ | (25,340 | ) | ||||||||||||
|
|
|
|||||||||||||||
The accompanying notes are an integral part of these financial statements.
|
|
48 |
|
| Hartford Multifactor US Equity ETF |
Schedule of Investments – (continued)
September 30, 2019
Fair Valuation Summary
The following is a summary of the fair valuations according to the inputs used as of September 30, 2019 in valuing the Fund’s investments.
| Description |
Total | Level 1 | Level 2 | Level 3(1) | ||||||||||||
| Assets |
||||||||||||||||
| Common Stocks |
||||||||||||||||
| Automobiles & Components |
$ | 569,931 | $ | 569,931 | $ | — | $ | — | ||||||||
| Banks |
5,972,426 | 5,972,426 | — | — | ||||||||||||
| Capital Goods |
15,574,007 | 15,574,007 | — | — | ||||||||||||
| Commercial & Professional Services |
4,019,943 | 4,019,943 | — | — | ||||||||||||
| Consumer Durables & Apparel |
4,736,051 | 4,736,051 | — | — | ||||||||||||
| Consumer Services |
7,244,375 | 7,244,375 | — | — | ||||||||||||
| Diversified Financials |
9,427,189 | 9,427,189 | — | — | ||||||||||||
| Energy |
7,389,109 | 7,389,109 | — | — | ||||||||||||
| Food & Staples Retailing |
9,335,088 | 9,335,088 | — | — | ||||||||||||
| Food, Beverage & Tobacco |
11,004,291 | 11,004,291 | — | — | ||||||||||||
| Health Care Equipment & Services |
26,690,390 | 26,690,390 | — | — | ||||||||||||
| Household & Personal Products |
6,043,002 | 6,043,002 | — | — | ||||||||||||
| Insurance |
32,535,355 | 32,535,355 | — | — | ||||||||||||
| Materials |
9,513,986 | 9,513,986 | — | — | ||||||||||||
| Media & Entertainment |
12,435,167 | 12,435,167 | — | — | ||||||||||||
| Pharmaceuticals, Biotechnology & Life Sciences |
19,625,339 | 19,625,339 | — | — | ||||||||||||
| Real Estate |
17,209,204 | 17,209,204 | — | — | ||||||||||||
| Retailing |
13,269,052 | 13,269,052 | — | — | ||||||||||||
| Semiconductors & Semiconductor Equipment |
7,988,018 | 7,988,018 | — | — | ||||||||||||
| Software & Services |
34,884,131 | 34,884,131 | — | — | ||||||||||||
| Technology Hardware & Equipment |
18,483,878 | 18,483,878 | — | — | ||||||||||||
| Telecommunication Services |
10,360,696 | 10,360,696 | — | — | ||||||||||||
| Transportation |
3,585,026 | 3,585,026 | — | — | ||||||||||||
| Utilities |
16,099,055 | 16,099,055 | — | — | ||||||||||||
| Short-Term Investments |
184,343 | — | 184,343 | — | ||||||||||||
|
|
|
|
|
|
|
|
|
|||||||||
| Total |
$ | 304,179,052 | $ | 303,994,709 | $ | 184,343 | $ | — | ||||||||
|
|
|
|
|
|
|
|
|
|||||||||
| Liabilities |
||||||||||||||||
| Futures Contracts(2) |
$ | (25,340 | ) | $ | (25,340 | ) | $ | — | $ | — | ||||||
|
|
|
|
|
|
|
|
|
|||||||||
| Total |
$ | (25,340 | ) | $ | (25,340 | ) | $ | — | $ | — | ||||||
|
|
|
|
|
|
|
|
|
|||||||||
| (1) | For the year ended September 30, 2019, there were no transfers in and out of Level 3. |
| (2) | Derivative instruments (excluding purchased and written options, if applicable) are valued at the unrealized appreciation/(depreciation) on the investments. |
The accompanying notes are an integral part of these financial statements.
|
|
49 |
|
| Hartford Multifactor ETFs |
Glossary (abbreviations used in the preceding Schedules of Investments)
| Index Abbreviations: | ||
| MSCI |
Morgan Stanley Capital International | |
| S&P |
Standard & Poors | |
| Other Abbreviations: | ||
| ADR |
American Depositary Receipt | |
| GDR |
Global Depositary Receipt | |
| NVDR |
Non-Voting Depositary Receipt | |
| PJSC |
Private Joint Stock Company | |
| PT |
Perseroan Terbatas | |
| REIT |
Real Estate Investment Trust | |
|
|
50 |
|
| Hartford Multifactor ETFs |
Statements of Assets and Liabilities
September 30, 2019
| Hartford Multifactor Developed Markets (ex-US) ETF |
Hartford Multifactor Emerging Markets ETF |
Hartford Multifactor Global Small Cap ETF |
Hartford Multifactor Low Volatility International Equity ETF |
|||||||||||||
| Assets: |
||||||||||||||||
| Investments in securities, at market value |
$ | 2,321,703,032 | $ | 68,573,511 | $ | 16,978,249 | $ | 5,345,897 | ||||||||
| Cash |
992,733 | 119,810 | 101,565 | 413 | ||||||||||||
| Foreign currency |
4,500,400 | 25,388 | 36,070 | 10,270 | ||||||||||||
| Receivables: |
||||||||||||||||
| Investment securities sold |
6,035,908 | — | 2,849,405 | — | ||||||||||||
| Dividends and interest |
9,087,137 | 123,913 | 62,797 | 16,186 | ||||||||||||
| Securities lending income |
3,169 | 6 | 11 | — | ||||||||||||
| Variation margin on futures contracts |
25,760 | 1,715 | 399 | — | ||||||||||||
| Tax reclaims |
1,306,304 | 5,316 | 3,251 | 2,353 | ||||||||||||
|
|
|
|
|
|
|
|
|
|||||||||
| Total assets |
2,343,654,443 | 68,849,659 | 20,031,747 | 5,375,119 | ||||||||||||
|
|
|
|
|
|
|
|
|
|||||||||
| Liabilities: |
||||||||||||||||
| Payables: |
||||||||||||||||
| Investment securities purchased |
5,590,230 | — | 38,270 | 5,475 | ||||||||||||
| Fund shares redeemed |
1,823,094 | — | 2,854,123 | — | ||||||||||||
| Investment management fees |
552,965 | 26,362 | 6,426 | 1,279 | ||||||||||||
|
|
|
|
|
|
|
|
|
|||||||||
| Total liabilities |
7,966,289 | 26,362 | 2,898,819 | 6,754 | ||||||||||||
|
|
|
|
|
|
|
|
|
|||||||||
| Net assets |
$ | 2,335,688,154 | $ | 68,823,297 | $ | 17,132,928 | $ | 5,368,365 | ||||||||
|
|
|
|
|
|
|
|
|
|||||||||
| Summary of Net Assets: |
||||||||||||||||
| Paid-in-capital |
$ | 2,400,229,144 | $ | 79,570,037 | $ | 19,061,415 | $ | 5,136,723 | ||||||||
| Distributable earnings |
(64,540,990 | ) | (10,746,740 | ) | (1,928,487 | ) | 231,642 | |||||||||
|
|
|
|
|
|
|
|
|
|||||||||
| Net assets |
$ | 2,335,688,154 | $ | 68,823,297 | $ | 17,132,928 | $ | 5,368,365 | ||||||||
|
|
|
|
|
|
|
|
|
|||||||||
| Net asset value per share |
$ | 27.76 | $ | 22.20 | $ | 28.55 | $ | 26.84 | ||||||||
|
|
|
|
|
|
|
|
|
|||||||||
| Shares issued and outstanding |
84,150,000 | 3,100,000 | 600,000 | 200,000 | ||||||||||||
|
|
|
|
|
|
|
|
|
|||||||||
| Cost of investments |
$ | 2,268,924,442 | $ | 68,005,211 | $ | 17,200,861 | $ | 5,021,683 | ||||||||
| Cost of foreign currency |
$ | 4,520,165 | $ | 25,389 | $ | 36,295 | $ | 10,305 | ||||||||
The accompanying notes are an integral part of these financial statements.
|
|
51 |
|
| Hartford Multifactor ETFs |
Statements of Assets and Liabilities – (continued)
September 30, 2019
| Hartford Multifactor Low Volatility US Equity ETF |
Hartford Multifactor REIT ETF |
Hartford Multifactor US Equity ETF |
||||||||||
| Assets: |
||||||||||||
| Investments in securities, at market value |
$ | 7,692,566 | $ | 17,916,097 | $ | 304,179,052 | ||||||
| Cash |
3,554 | 18,499 | 2,858,983 | |||||||||
| Receivables: |
||||||||||||
| Dividends and interest |
12,915 | 88,547 | 483,153 | |||||||||
| Variation margin on futures contracts |
— | 199 | 16,920 | |||||||||
|
|
|
|
|
|
|
|||||||
| Total assets |
7,709,035 | 18,023,342 | 307,538,108 | |||||||||
|
|
|
|
|
|
|
|||||||
| Liabilities: |
||||||||||||
| Payables: |
||||||||||||
| Investment securities purchased |
— | 16,636 | — | |||||||||
| Investment management fees |
1,216 | 6,607 | 46,839 | |||||||||
|
|
|
|
|
|
|
|||||||
| Total liabilities |
1,216 | 23,243 | 46,839 | |||||||||
|
|
|
|
|
|
|
|||||||
| Net assets |
$ | 7,707,819 | $ | 18,000,099 | $ | 307,491,269 | ||||||
|
|
|
|
|
|
|
|||||||
| Summary of Net Assets: |
||||||||||||
| Paid-in-capital |
$ | 6,916,381 | $ | 18,127,780 | $ | 307,769,384 | ||||||
| Distributable earnings |
791,438 | (127,681 | ) | (278,115 | ) | |||||||
|
|
|
|
|
|
|
|||||||
| Net assets |
$ | 7,707,819 | $ | 18,000,099 | $ | 307,491,269 | ||||||
|
|
|
|
|
|
|
|||||||
| Net asset value per share |
$ | 30.83 | $ | 16.36 | $ | 32.20 | ||||||
|
|
|
|
|
|
|
|||||||
| Shares issued and outstanding |
250,000 | 1,100,000 | 9,550,000 | |||||||||
|
|
|
|
|
|
|
|||||||
| Cost of investments |
$ | 6,668,913 | $ | 17,047,018 | $ | 291,090,539 | ||||||
The accompanying notes are an integral part of these financial statements.
|
|
52 |
|
| Hartford Multifactor ETFs |
For the Year Ended September 30, 2019
| Hartford Multifactor Developed Markets (ex-US) ETF |
Hartford Multifactor Emerging Markets ETF |
Hartford Multifactor Global Small Cap ETF |
Hartford Multifactor Low Volatility International Equity ETF |
|||||||||||||
| Investment Income: |
||||||||||||||||
| Dividends |
$ | 74,835,782 | $ | 2,965,064 | $ | 737,772 | $ | 172,009 | ||||||||
| Interest |
9,395 | 841 | 652 | — | ||||||||||||
| Securities lending |
771,697 | 6,450 | 17,318 | 980 | ||||||||||||
| Less: Foreign tax withheld |
(7,148,104 | ) | (384,760 | ) | (66,186 | ) | (19,189 | ) | ||||||||
|
|
|
|
|
|
|
|
|
|||||||||
| Total investment income, net |
68,468,770 | 2,587,595 | 689,556 | 153,800 | ||||||||||||
|
|
|
|
|
|
|
|
|
|||||||||
| Expenses: |
||||||||||||||||
| Investment management fees |
5,150,796 | 373,633 | 84,416 | 15,212 | ||||||||||||
|
|
|
|
|
|
|
|
|
|||||||||
| Total expenses, net |
5,150,796 | 373,633 | 84,416 | 15,212 | ||||||||||||
|
|
|
|
|
|
|
|
|
|||||||||
| Net Investment Income (Loss) |
63,317,974 | 2,213,962 | 605,140 | 138,588 | ||||||||||||
|
|
|
|
|
|
|
|
|
|||||||||
| Net Realized Gain (Loss) on Investments, Other Financial Instruments and Foreign Currency Transactions: |
||||||||||||||||
| Net realized gain (loss) on investments |
(62,941,170 | )(1) | (4,364,513 | )(1) | 546,346 | (1) | (28,311 | ) | ||||||||
| Net realized gain (loss) on futures contracts |
480,602 | (28,947 | ) | (3,383 | ) | — | ||||||||||
| Net realized gain (loss) on other foreign currency transactions |
7,673 | (36,117 | ) | (5,160 | ) | (197 | ) | |||||||||
|
|
|
|
|
|
|
|
|
|||||||||
| Net Realized Gain (Loss) on Investments, Other Financial Instruments and Foreign Currency Transactions |
(62,452,895 | ) | (4,429,577 | ) | 537,803 | (28,508 | ) | |||||||||
|
|
|
|
|
|
|
|
|
|||||||||
| Net Changes in Unrealized Appreciation (Depreciation) of Investments, Other Financial Instruments and Foreign Currency Transactions: |
||||||||||||||||
| Net unrealized appreciation (depreciation) of investments |
38,849,047 | (920,519 | ) | (2,715,397 | ) | (73,953 | ) | |||||||||
| Net unrealized appreciation (depreciation) of futures contracts |
(48,179 | ) | (9,144 | ) | (2,830 | ) | — | |||||||||
| Net unrealized appreciation (depreciation) of translation of other assets and liabilities in foreign currencies |
(50,271 | ) | (6,235 | ) | (676 | ) | (39 | ) | ||||||||
|
|
|
|
|
|
|
|
|
|||||||||
| Net Changes in Unrealized Appreciation (Depreciation) of Investments, Other Financial Instruments and Foreign Currency Transactions |
38,750,597 | (935,898 | ) | (2,718,903 | ) | (73,992 | ) | |||||||||
|
|
|
|
|
|
|
|
|
|||||||||
| Net Gain (Loss) on Investments, Other Financial Instruments and Foreign Currency Transactions |
(23,702,298 | ) | (5,365,475 | ) | (2,181,100 | ) | (102,500 | ) | ||||||||
|
|
|
|
|
|
|
|
|
|||||||||
| Net Increase (Decrease) in Net Assets Resulting from Operations |
$ | 39,615,676 | $ | (3,151,513 | ) | $ | (1,575,960 | ) | $ | 36,088 | ||||||
|
|
|
|
|
|
|
|
|
|||||||||
| (1) | Includes realized gains/(losses) as a result of in-kind redemptions (See Note 10 in Notes to Financial Statements). |
The accompanying notes are an integral part of these financial statements.
|
|
53 |
|
| Hartford Multifactor ETFs |
Statements of Operations – (continued)
For the Year Ended September 30, 2019
| Hartford Multifactor Low Volatility US Equity ETF |
Hartford Multifactor REIT ETF |
Hartford Multifactor US Equity ETF |
||||||||||
| Investment Income: |
||||||||||||
| Dividends |
$ | 160,750 | $ | 902,883 | $ | 6,032,293 | ||||||
| Interest |
— | 241 | 1,276 | |||||||||
| Securities lending |
524 | 4,329 | 16,581 | |||||||||
| Less: Foreign tax withheld |
— | — | (903 | ) | ||||||||
|
|
|
|
|
|
|
|||||||
| Total investment income, net |
161,274 | 907,453 | 6,049,247 | |||||||||
|
|
|
|
|
|
|
|||||||
| Expenses: |
||||||||||||
| Investment management fees |
12,817 | 110,655 | 452,420 | |||||||||
|
|
|
|
|
|
|
|||||||
| Total expenses, net |
12,817 | 110,655 | 452,420 | |||||||||
|
|
|
|
|
|
|
|||||||
| Net Investment Income (Loss) |
148,457 | 796,798 | 5,596,827 | |||||||||
|
|
|
|
|
|
|
|||||||
| Net Realized Gain (Loss) on Investments and Other Financial Instruments |
||||||||||||
| Net realized gain (loss) on investments |
369,522 | (1) | 1,146,098 | (1) | (702,658 | )(1) | ||||||
| Net realized gain (loss) on futures contracts |
— | 18,383 | 129,198 | |||||||||
|
|
|
|
|
|
|
|||||||
| Net Realized Gain (Loss) on Investments and Other Financial Instruments |
369,522 | 1,164,481 | (573,460 | ) | ||||||||
|
|
|
|
|
|
|
|||||||
| Net Changes in Unrealized Appreciation (Depreciation) of Investments and Other Financial Instruments: |
||||||||||||
| Net unrealized appreciation (depreciation) of investments |
283,389 | 414,280 | 858,041 | |||||||||
| Net unrealized appreciation (depreciation) of futures contracts |
— | 1,218 | (26,065 | ) | ||||||||
|
|
|
|
|
|
|
|||||||
| Net Changes in Unrealized Appreciation (Depreciation) of Investments and Other Financial Instruments |
283,389 | 415,498 | 831,976 | |||||||||
|
|
|
|
|
|
|
|||||||
| Net Gain (Loss) on Investments and Other Financial Instruments |
652,911 | 1,579,979 | 258,516 | |||||||||
|
|
|
|
|
|
|
|||||||
| Net Increase (Decrease) in Net Assets Resulting from Operations |
$ | 801,368 | $ | 2,376,777 | $ | 5,855,343 | ||||||
|
|
|
|
|
|
|
|||||||
| (1) | Includes realized gains/(losses) as a result of in-kind redemptions (See Note 10 in Notes to Financial Statements). |
The accompanying notes are an integral part of these financial statements.
|
|
54 |
|
| Hartford Multifactor ETFs |
Statements of Changes in Net Assets
| Hartford Multifactor Developed Markets (ex-US) ETF |
Hartford Multifactor Emerging Markets ETF |
Hartford Multifactor Global Small Cap ETF |
||||||||||||||||||||||
| For the Year Ended September 30, 2019 |
For the Year Ended September 30, 2018 |
For the Year Ended September 30, 2019 |
For the Year Ended September 30, 2018 |
For the Year Ended September 30, 2019 |
For the Year Ended September 30, 2018 |
|||||||||||||||||||
| Operations: |
||||||||||||||||||||||||
| Net investment income (loss) |
$ | 63,317,974 | $ | 12,080,162 | $ | 2,213,962 | $ | 1,483,870 | $ | 605,140 | $ | 476,213 | ||||||||||||
| Net realized gain (loss) on investments, other financial instruments and foreign currency transactions |
(62,452,895 | ) | (5,987,452 | ) | (4,429,577 | ) | (859,431 | ) | 537,803 | 858,346 | ||||||||||||||
| Net changes in unrealized appreciation (depreciation) of investments, other financial instruments and foreign currency transactions |
38,750,597 | 2,113,375 | (935,898 | ) | (3,878,089 | ) | (2,718,903 | ) | 82,255 | |||||||||||||||
|
|
|
|
|
|
|
|
|
|
|
|
|
|||||||||||||
| Net Increase (Decrease) in Net Assets Resulting from Operations |
39,615,676 | 8,206,085 | (3,151,513 | ) | (3,253,650 | ) | (1,575,960 | ) | 1,416,814 | |||||||||||||||
|
|
|
|
|
|
|
|
|
|
|
|
|
|||||||||||||
| Distributions to Shareholders |
(48,161,644 | ) | (8,013,824 | ) | (2,004,488 | ) | (1,141,715 | ) | (601,511 | ) | (470,072 | ) | ||||||||||||
|
|
|
|
|
|
|
|
|
|
|
|
|
|||||||||||||
| Fund Share Transactions: |
||||||||||||||||||||||||
| Sold |
1,846,730,495 | 738,684,038 | 33,068,894 | 25,448,866 | 5,860,452 | 6,275,566 | ||||||||||||||||||
| Redeemed |
(313,561,980 | ) | (59,138,041 | ) | (24,270,963 | ) | (2,229,949 | ) | (8,794,812 | ) | (3,128,922 | ) | ||||||||||||
| Other Capital |
— | 321 | 101,198 | 17,212 | 1,652 | 1,646 | ||||||||||||||||||
|
|
|
|
|
|
|
|
|
|
|
|
|
|||||||||||||
| Net increase from capital share transactions |
1,533,168,515 | 679,546,318 | 8,899,129 | 23,236,129 | (2,932,708 | ) | 3,148,290 | |||||||||||||||||
|
|
|
|
|
|
|
|
|
|
|
|
|
|||||||||||||
| Net Increase (Decrease) in Net Assets |
1,524,622,547 | 679,738,579 | 3,743,128 | 18,840,764 | (5,110,179 | ) | 4,095,032 | |||||||||||||||||
|
|
|
|
|
|
|
|
|
|
|
|
|
|||||||||||||
| Net Assets: |
||||||||||||||||||||||||
| Beginning of period |
811,065,607 | 131,327,028 | 65,080,169 | 46,239,405 | 22,243,107 | 18,148,075 | ||||||||||||||||||
|
|
|
|
|
|
|
|
|
|
|
|
|
|||||||||||||
| End of period |
$ | 2,335,688,154 | $ | 811,065,607 | $ | 68,823,297 | $ | 65,080,169 | $ | 17,132,928 | $ | 22,243,107 | ||||||||||||
|
|
|
|
|
|
|
|
|
|
|
|
|
|||||||||||||
The accompanying notes are an integral part of these financial statements.
|
|
55 |
|
| Hartford Multifactor ETFs |
Statements of Changes in Net Assets – (continued)
| Hartford Multifactor Low Volatility International Equity ETF |
Hartford Multifactor Low Volatility US Equity ETF |
|||||||||||||||
| For the Year Ended September 30, 2019 |
For the Year Ended September 30, 2018 |
For the Year Ended September 30, 2019 |
For the Year Ended September 30, 2018 |
|||||||||||||
| Operations: |
||||||||||||||||
| Net investment income (loss) |
$ | 138,588 | $ | 130,277 | $ | 148,457 | $ | 95,116 | ||||||||
| Net realized gain (loss) on investments, other financial instruments and foreign currency transactions |
(28,508 | ) | (42,526 | ) | 369,522 | (50,947 | ) | |||||||||
| Net changes in unrealized appreciation (depreciation) of investments, other financial instruments and foreign currency transactions |
(73,992 | ) | 184,054 | 283,389 | 604,114 | |||||||||||
|
|
|
|
|
|
|
|
|
|||||||||
| Net Increase (Decrease) in Net Assets Resulting from Operations |
36,088 | 271,805 | 801,368 | 648,283 | ||||||||||||
|
|
|
|
|
|
|
|
|
|||||||||
| Distributions to Shareholders |
(137,798 | ) | (118,511 | ) | (140,380 | ) | (96,129 | ) | ||||||||
|
|
|
|
|
|
|
|
|
|||||||||
| Fund Share Transactions: |
||||||||||||||||
| Sold |
— | — | 4,275,263 | 1,329,697 | ||||||||||||
| Redeemed |
— | — | (2,971,711 | ) | — | |||||||||||
| Other Capital |
— | — | — | — | ||||||||||||
|
|
|
|
|
|
|
|
|
|||||||||
| Net increase (decrease) from capital share transactions |
— | — | 1,303,552 | 1,329,697 | ||||||||||||
|
|
|
|
|
|
|
|
|
|||||||||
| Net Increase (Decrease) in Net Assets |
(101,710 | ) | 153,294 | 1,964,540 | 1,881,851 | |||||||||||
|
|
|
|
|
|
|
|
|
|||||||||
| Net Assets: |
||||||||||||||||
| Beginning of period |
5,470,075 | 5,316,781 | 5,743,279 | 3,861,428 | ||||||||||||
|
|
|
|
|
|
|
|
|
|||||||||
| End of period |
$ | 5,368,365 | $ | 5,470,075 | $ | 7,707,819 | $ | 5,743,279 | ||||||||
|
|
|
|
|
|
|
|
|
|||||||||
The accompanying notes are an integral part of these financial statements.
|
|
56 |
|
| Hartford Multifactor ETFs |
Statements of Changes in Net Assets – (continued)
| Hartford Multifactor REIT ETF | Hartford Multifactor US Equity ETF |
|||||||||||||||
| For the Year Ended September 30, 2019 |
For the Year Ended September 30, 2018 |
For the Year Ended September 30, 2019 |
For the Year Ended September 30, 2018 |
|||||||||||||
| Operations: |
| |||||||||||||||
| Net investment income (loss) |
$ | 796,798 | $ | 649,569 | $ | 5,596,827 | $ | 1,515,229 | ||||||||
| Net realized gain (loss) on investments and other financial instruments |
1,164,481 | 828,354 | (573,460 | ) | 1,330,846 | |||||||||||
| Net changes in unrealized appreciation (depreciation) of investments and other financial instruments |
415,498 | 257,144 | 831,976 | 8,292,564 | ||||||||||||
|
|
|
|
|
|
|
|
|
|||||||||
| Net Increase (Decrease) in Net Assets Resulting from Operations |
2,376,777 | 1,735,067 | 5,855,343 | 11,138,639 | ||||||||||||
|
|
|
|
|
|
|
|
|
|||||||||
| Distributions to Shareholders: |
| |||||||||||||||
| From distributable earnings |
(833,172 | ) | (677,992 | ) | (5,407,729 | ) | (1,496,009 | ) | ||||||||
| From tax return of capital |
(402,584 | ) | (41,564 | ) | — | — | ||||||||||
|
|
|
|
|
|
|
|
|
|||||||||
| Total distributions |
(1,235,756 | ) | (719,556 | ) | (5,407,729 | ) | (1,496,009 | ) | ||||||||
|
|
|
|
|
|
|
|
|
|||||||||
| Fund Share Transactions: |
| |||||||||||||||
| Sold |
7,709,666 | 26,773,879 | 182,696,968 | 142,311,556 | ||||||||||||
| Redeemed |
(18,538,614 | ) | (9,438,842 | ) | (48,956,914 | ) | (13,174,555 | ) | ||||||||
|
|
|
|
|
|
|
|
|
|||||||||
| Net increase (decrease) from capital share transactions |
(10,828,948 | ) | 17,335,037 | 133,740,054 | 129,137,001 | |||||||||||
|
|
|
|
|
|
|
|
|
|||||||||
| Net Increase (Decrease) in Net Assets |
(9,687,927 | ) | 18,350,548 | 134,187,668 | 138,779,631 | |||||||||||
|
|
|
|
|
|
|
|
|
|||||||||
| Net Assets: |
| |||||||||||||||
| Beginning of period |
27,688,026 | 9,337,478 | 173,303,601 | 34,523,970 | ||||||||||||
|
|
|
|
|
|
|
|
|
|||||||||
| End of period |
$ | 18,000,099 | $ | 27,688,026 | $ | 307,491,269 | $ | 173,303,601 | ||||||||
|
|
|
|
|
|
|
|
|
|||||||||
The accompanying notes are an integral part of these financial statements.
|
|
57 |
|
| Hartford Multifactor ETFs |
| — Selected Per-Share Data(1) — | — Ratios and Supplemental Data — | |||||||||||||||||||||||||||||||||||||||||||||||||||||||||||||||
| Net Asset |
Net Investment Income (Loss) |
Net Realized and Unrealized Gain (Loss) on Investments |
Total from Investment Operations |
Other Capital |
Dividends from Net Investment Income |
Distributions from Capital Gains |
Returns of Capital |
Total Dividends and Distributions |
Net Asset Value at End of Period |
Total Return(2) |
Net Assets at End of Period (000s) |
Ratio of Expenses to Average Net Assets Before Adjust- ments(3) |
Ratio of Expenses to Average Net Assets After Adjust- ments |
Ratio of Net Investment Income (Loss) to Average Net Assets |
Portfolio Turnover(4) |
|||||||||||||||||||||||||||||||||||||||||||||||||
| Hartford Multifactor Developed Markets (ex-US) ETF | ||||||||||||||||||||||||||||||||||||||||||||||||||||||||||||||||
| For the Year Ended September 30, 2019 |
| |||||||||||||||||||||||||||||||||||||||||||||||||||||||||||||||
|
|
$ | 28.97 | $ | 0.98 | $ | (1.51 | ) | $ | (0.53 | ) | $ | — | $ | (0.68 | ) | $ | — | $ | — | $ | (0.68 | ) | $ | 27.76 | (1.78 | )% | $ | 2,335,688 | 0.29 | % | 0.29 | % | 3.56 | % | 63 | % | ||||||||||||||||||||||||||||
| For the Year Ended September 30, 2018 |
| |||||||||||||||||||||||||||||||||||||||||||||||||||||||||||||||
| $ | 28.24 | $ | 0.91 | $ | 0.45 | (5) | $ | 1.36 | $ | — | (6) | $ | (0.63 | ) | $ | — | $ | — | $ | (0.63 | ) | $ | 28.97 | 4.85 | % | $ | 811,066 | 0.31 | % | 0.31 | % | 3.17 | % | 47 | % | |||||||||||||||||||||||||||||
| For the Year Ended September 30, 2017 |
| |||||||||||||||||||||||||||||||||||||||||||||||||||||||||||||||
| $ | 24.60 | $ | 0.82 | $ | 3.55 | $ | 4.37 | $ | — | $ | (0.73 | ) | $ | — | $ | — | $ | (0.73 | ) | $ | 28.24 | 18.18 | % | $ | 131,327 | 0.42 | % | 0.40 | % | 3.13 | % | 46 | % | |||||||||||||||||||||||||||||||
| For the Year Ended September 30, 2016 |
| |||||||||||||||||||||||||||||||||||||||||||||||||||||||||||||||
| $ | 22.84 | $ | 0.70 | $ | 1.70 | $ | 2.40 | $ | — | $ | (0.64 | ) | $ | — | $ | — | $ | (0.64 | ) | $ | 24.60 | 10.62 | % | $ | 34,440 | 0.58 | % | 0.50 | % | 2.97 | % | 54 | % | |||||||||||||||||||||||||||||||
| For the Period Ended September 30, 2015(7) |
| |||||||||||||||||||||||||||||||||||||||||||||||||||||||||||||||
| $ | 25.00 | $ | 0.55 | $ | (2.35 | ) | $ | (1.80 | ) | $ | — | $ | (0.36 | ) | $ | — | $ | — | $ | (0.36 | ) | $ | 22.84 | (7.36 | )%(11) | $ | 27,406 | 0.50 | %(8) | 0.50 | %(8) | 3.75 | %(8) | 42 | % | |||||||||||||||||||||||||||||
| Hartford Multifactor Emerging Markets ETF | ||||||||||||||||||||||||||||||||||||||||||||||||||||||||||||||||
| For the Year Ended September 30, 2019 |
| |||||||||||||||||||||||||||||||||||||||||||||||||||||||||||||||
| $ | 23.24 | $ | 0.66 | $ | (1.12 | ) | $ | (0.46 | ) | $ | 0.03 | $ | (0.61 | ) | $ | — | $ | — | $ | (0.61 | ) | $ | 22.20 | (1.90 | )% | $ | 68,823 | 0.49 | % | 0.49 | % | 2.89 | % | 78 | % | |||||||||||||||||||||||||||||
| For the Year Ended September 30, 2018 |
| |||||||||||||||||||||||||||||||||||||||||||||||||||||||||||||||
| $ | 24.34 | $ | 0.60 | $ | (1.24 | ) | $ | (0.64 | ) | $ | 0.01 | $ | (0.47 | ) | $ | — | $ | — | $ | (0.47 | ) | $ | 23.24 | (2.64 | )% | $ | 65,080 | 0.52 | % | 0.52 | % | 2.42 | % | 25 | % | |||||||||||||||||||||||||||||
| For the Year Ended September 30, 2017 |
| |||||||||||||||||||||||||||||||||||||||||||||||||||||||||||||||
| $ | 21.62 | $ | 0.49 | $ | 2.63 | $ | 3.12 | $ | — | $ | (0.40 | ) | $ | — | $ | — | $ | (0.40 | ) | $ | 24.34 | 14.63 | % | $ | 46,239 | 0.62 | % | 0.60 | % | 2.17 | % | 30 | % | |||||||||||||||||||||||||||||||
| For the Year Ended September 30, 2016 |
| |||||||||||||||||||||||||||||||||||||||||||||||||||||||||||||||
| $ | 19.68 | $ | 0.45 | $ | 1.91 | $ | 2.36 | $ | — | $ | (0.42 | ) | $ | — | $ | — | $ | (0.42 | ) | $ | 21.62 | 12.20 | % | $ | 23,786 | 0.76 | % | 0.65 | % | 2.22 | % | 49 | % | |||||||||||||||||||||||||||||||
| For the Period Ended September 30, 2015(7) |
| |||||||||||||||||||||||||||||||||||||||||||||||||||||||||||||||
| $ | 25.00 | $ | 0.44 | $ | (5.55 | ) | $ | (5.11 | ) | $ | — | $ | (0.21 | ) | $ | — | $ | — | $ | (0.21 | ) | $ | 19.68 | (20.59 | )%(11) | $ | 19,685 | 0.65 | %(8) | 0.65 | %(8) | 3.23 | %(8) | 17 | % | |||||||||||||||||||||||||||||
| Hartford Multifactor Global Small Cap ETF | ||||||||||||||||||||||||||||||||||||||||||||||||||||||||||||||||
| For the Year Ended September 30, 2019 |
| |||||||||||||||||||||||||||||||||||||||||||||||||||||||||||||||
| $ | 31.78 | $ | 0.81 | $ | (3.23 | ) | $ | (2.42 | ) | $ | — | (6) | $ | (0.81 | ) | $ | — | $ | — | $ | (0.81 | ) | $ | 28.55 | (7.46 | )% | $ | 17,133 | 0.39 | % | 0.39 | % | 2.80 | % | 50 | % | ||||||||||||||||||||||||||||
| For the Year Ended September 30, 2018 |
| |||||||||||||||||||||||||||||||||||||||||||||||||||||||||||||||
| $ | 30.25 | $ | 0.72 | $ | 1.54 | $ | 2.26 | $ | — | (6) | $ | (0.73 | ) | $ | — | $ | — | $ | (0.73 | ) | $ | 31.78 | 7.52 | % | $ | 22,243 | 0.44 | % | 0.44 | % | 2.26 | % | 41 | % | ||||||||||||||||||||||||||||||
| For the Year Ended September 30, 2017 |
| |||||||||||||||||||||||||||||||||||||||||||||||||||||||||||||||
| $ | 25.46 | $ | 0.57 | $ | 4.79 | $ | 5.36 | $ | — | $ | (0.57 | ) | $ | — | $ | — | $ | (0.57 | ) | $ | 30.25 | 21.37 | % | $ | 18,148 | 0.60 | % | 0.56 | % | 2.08 | % | 48 | % | |||||||||||||||||||||||||||||||
| For the Year Ended September 30, 2016 |
| |||||||||||||||||||||||||||||||||||||||||||||||||||||||||||||||
| $ | 22.69 | $ | 0.60 | $ | 2.76 | $ | 3.36 | $ | — | $ | (0.59 | ) | $ | — | $ | — | $ | (0.59 | ) | $ | 25.46 | 15.05 | % | $ | 10,185 | 0.83 | % | 0.60 | % | 2.54 | % | 62 | % | |||||||||||||||||||||||||||||||
| For the Period Ended September 30, 2015(9) |
| |||||||||||||||||||||||||||||||||||||||||||||||||||||||||||||||
| $ | 25.00 | $ | 0.44 | $ | (2.54 | ) | $ | (2.10 | ) | $ | — | $ | (0.21 | ) | $ | — | $ | — | $ | (0.21 | ) | $ | 22.69 | (8.50 | )%(11) | $ | 6,807 | 0.60 | %(8) | 0.60 | %(8) | 3.44 | %(8) | 44 | % | |||||||||||||||||||||||||||||
| Hartford Multifactor Low Volatility International Equity ETF | ||||||||||||||||||||||||||||||||||||||||||||||||||||||||||||||||
| For the Year Ended September 30, 2019 |
| |||||||||||||||||||||||||||||||||||||||||||||||||||||||||||||||
| $ | 27.35 | $ | 0.69 | $ | (0.51 | ) | $ | 0.18 | $ | — | $ | (0.69 | ) | $ | — | $ | — | $ | (0.69 | ) | $ | 26.84 | 0.81 | % | $ | 5,368 | 0.29 | % | 0.29 | % | 2.64 | % | 38 | % | ||||||||||||||||||||||||||||||
| For the Year Ended September 30, 2018 |
| |||||||||||||||||||||||||||||||||||||||||||||||||||||||||||||||
| $ | 26.58 | $ | 0.65 | $ | 0.71 | $ | 1.36 | $ | — | $ | (0.59 | ) | $ | — | $ | — | $ | (0.59 | ) | $ | 27.35 | 5.16 | % | $ | 5,470 | 0.33 | % | 0.33 | % | 2.37 | % | 35 | % | |||||||||||||||||||||||||||||||
| For the Period Ended September 30, 2017(10) |
| |||||||||||||||||||||||||||||||||||||||||||||||||||||||||||||||
| $ | 25.02 | $ | 0.30 | $ | 1.40 | $ | 1.70 | $ | — | $ | (0.14 | ) | $ | — | $ | — | $ | (0.14 | ) | $ | 26.58 | 6.84 | %(11) | $ | 5,317 | 0.39 | %(8) | 0.39 | %(8) | 3.01 | %(8) | 48 | % | |||||||||||||||||||||||||||||||
The accompanying notes are an integral part of these financial statements.
|
|
58 |
|
| Hartford Multifactor ETFs |
Financial Highlights – (continued)
| — Selected Per-Share Data(1) — | — Ratios and Supplemental Data — | |||||||||||||||||||||||||||||||||||||||||||||||||||||||||||||||
| Net Asset |
Net Investment Income (Loss) |
Net Realized and Unrealized Gain (Loss) on Investments |
Total from Investment Operations |
Other Capital |
Dividends from Net Investment Income |
Distributions from Capital Gains |
Returns of Capital |
Total Dividends and Distributions |
Net Asset Value at End of Period |
Total Return(2) |
Net Assets at End of Period (000s) |
Ratio of Expenses to Average Net Assets Before Adjust- ments(3) |
Ratio of Expenses to Average Net Assets After Adjust- ments |
Ratio of Net Investment Income (Loss) to Average Net Assets |
Portfolio Turnover(4) |
|||||||||||||||||||||||||||||||||||||||||||||||||
| Hartford Multifactor Low Volatility US Equity ETF | ||||||||||||||||||||||||||||||||||||||||||||||||||||||||||||||||
| For the Year Ended September 30, 2019 |
| |||||||||||||||||||||||||||||||||||||||||||||||||||||||||||||||
|
|
$ | 28.72 | $ | 0.63 | $ | 2.07 | $ | 2.70 | $ | — | $ | (0.59 | ) | $ | — | $ | — | $ | (0.59 | ) | $ | 30.83 | 9.62 | % | $ | 7,708 | 0.19 | % | 0.19 | % | 2.20 | % | 53 | % | ||||||||||||||||||||||||||||||
| For the Year Ended September 30, 2018 |
| |||||||||||||||||||||||||||||||||||||||||||||||||||||||||||||||
| $ | 25.74 | $ | 0.54 | $ | 2.96 | $ | 3.50 | $ | — | $ | (0.52 | ) | $ | — | $ | — | $ | (0.52 | ) | $ | 28.72 | 13.73 | % | $ | 5,743 | 0.22 | % | 0.22 | % | 2.00 | % | 26 | % | |||||||||||||||||||||||||||||||
| For the Period Ended September 30, 2017(10) |
| |||||||||||||||||||||||||||||||||||||||||||||||||||||||||||||||
| $ | 25.03 | $ | 0.20 | $ | 0.68 | $ | 0.88 | $ | — | $ | (0.17 | ) | $ | — | $ | — | $ | (0.17 | ) | $ | 25.74 | 3.53 | %(11) | $ | 3,861 | 0.29 | %(8) | 0.29 | %(8) | 2.05 | %(8) | 16 | % | |||||||||||||||||||||||||||||||
| Hartford Multifactor REIT ETF | ||||||||||||||||||||||||||||||||||||||||||||||||||||||||||||||||
| For the Year Ended September 30, 2019 |
| |||||||||||||||||||||||||||||||||||||||||||||||||||||||||||||||
| $ | 15.38 | $ | 0.50 | $ | 1.23 | $ | 1.73 | $ | — | $ | (0.51 | ) | $ | — | $ | (0.24 | ) | $ | (0.75 | ) | $ | 16.36 | 11.75 | % | $ | 18,000 | 0.45 | % | 0.45 | % | 3.24 | % | 50 | % | ||||||||||||||||||||||||||||||
| For the Year Ended September 30, 2018 |
| |||||||||||||||||||||||||||||||||||||||||||||||||||||||||||||||
| $ | 15.56 | $ | 0.59 | $ | (0.12 | )(5) | $ | 0.47 | $ | — | $ | (0.61 | ) | $ | — | $ | (0.04 | ) | $ | (0.65 | ) | $ | 15.38 | 3.27 | % | $ | 27,688 | 0.45 | % | 0.45 | % | 3.89 | % | 35 | % | |||||||||||||||||||||||||||||
| For the Period Ended September 30, 2017(12) |
| |||||||||||||||||||||||||||||||||||||||||||||||||||||||||||||||
| $ | 14.79 | $ | 0.50 | $ | 0.74 | $ | 1.24 | $ | — | $ | (0.45 | ) | $ | (0.02 | ) | $ | — | $ | (0.47 | ) | $ | 15.56 | 8.47 | %(11) | $ | 9,337 | 0.50 | %(8) | 0.45 | %(8) | 3.29 | %(8) | 43 | % | ||||||||||||||||||||||||||||||
| Hartford Multifactor US Equity ETF | ||||||||||||||||||||||||||||||||||||||||||||||||||||||||||||||||
| For the Year Ended September 30, 2019 |
| |||||||||||||||||||||||||||||||||||||||||||||||||||||||||||||||
| $ | 33.01 | $ | 0.73 | $ | (0.89 | )(5) | $ | (0.16 | ) | $ | — | $ | (0.65 | ) | $ | — | $ | — | $ | (0.65 | ) | $ | 32.20 | (0.31 | )% | $ | 307,491 | 0.19 | % | 0.19 | % | 2.35 | % | 81 | % | |||||||||||||||||||||||||||||
| For the Year Ended September 30, 2018 |
| |||||||||||||||||||||||||||||||||||||||||||||||||||||||||||||||
| $ | 28.77 | $ | 0.57 | $ | 4.15 | $ | 4.72 | $ | — | $ | (0.48 | ) | $ | — | $ | — | $ | (0.48 | ) | $ | 33.01 | 16.47 | % | $ | 173,304 | 0.21 | % | 0.21 | % | 1.80 | % | 36 | % | |||||||||||||||||||||||||||||||
| For the Year Ended September 30, 2017 |
| |||||||||||||||||||||||||||||||||||||||||||||||||||||||||||||||
| $ | 24.44 | $ | 0.51 | $ | 4.30 | $ | 4.81 | $ | — | $ | (0.48 | ) | $ | — | $ | — | $ | (0.48 | ) | $ | 28.77 | 19.84 | % | $ | 34,524 | 0.34 | % | 0.31 | % | 1.92 | % | 36 | % | |||||||||||||||||||||||||||||||
| For the Year Ended September 30, 2016 |
| |||||||||||||||||||||||||||||||||||||||||||||||||||||||||||||||
| $ | 22.90 | $ | 0.52 | $ | 1.53 | $ | 2.05 | $ | — | $ | (0.51 | ) | $ | — | $ | — | $ | (0.51 | ) | $ | 24.44 | 9.01 | % | $ | 28,111 | 0.44 | % | 0.35 | % | 2.22 | % | 51 | % | |||||||||||||||||||||||||||||||
| For the Period Ended September 30, 2015(7) |
| |||||||||||||||||||||||||||||||||||||||||||||||||||||||||||||||
| $ | 25.00 | $ | 0.26 | $ | (2.11 | ) | $ | (1.85 | ) | $ | — | $ | (0.25 | ) | $ | — | $ | — | $ | (0.25 | ) | $ | 22.90 | (7.46 | )%(11) | $ | 22,900 | 0.35 | %(8) | 0.35 | %(8) | 1.82 | %(8) | 38 | % | |||||||||||||||||||||||||||||
| (1) | Information presented relates to a share outstanding throughout the indicated period. Net investment income (loss) per share amounts are calculated based on average shares outstanding unless otherwise noted. |
| (2) | Total return is calculated assuming a hypothetical purchase of beneficial shares on the opening of the first day at the net asset value and a sale on the closing of the last day at the net asset value of each period reported. Dividends and distributions, if any, are assumed for purposes of this calculation, to be reinvested at market price at the end of the distribution day. |
| (3) | Adjustments include waivers and reimbursements, if applicable. |
| (4) | Portfolio turnover rate excludes securities received or delivered from in-kind processing of creations or redemptions. |
| (5) | Per share amount was not in accord with the net realized and unrealized gain (loss) for the period because of the timing of transactions in shares of the Fund and the amount and timing of per-share net realized and unrealized gain (loss) on such shares. |
| (6) | Per share amount is less than $0.005. |
| (7) | Commenced operations on February 25, 2015. |
| (8) | Annualized. |
| (9) | Commenced operations on March 23, 2015. |
| (10) | Commenced operations on May 10, 2017. |
| (11) | Not annualized. |
| (12) | Commenced operations on October 3, 2016. |
The accompanying notes are an integral part of these financial statements.
|
|
59 |
|
| Hartford Multifactor ETFs |
September 30, 2019
| 1. | Organization: |
Lattice Strategies Trust (the “Trust”) is an open-end registered management investment company comprised of seven series as of September 30, 2019. Financial statements for the series of the Trust listed below (each, a “Fund” and collectively, the “Funds”) are included in this report.
Lattice Strategies Trust:
Hartford Multifactor Developed Markets (ex-US) ETF (the “Multifactor Developed Markets (ex-US) ETF”)
Hartford Multifactor Emerging Markets ETF (the “Multifactor Emerging Markets ETF”)
Hartford Multifactor Global Small Cap ETF (the “Multifactor Global Small Cap ETF”)
Hartford Multifactor Low Volatility International Equity ETF (the “Multifactor Low Volatility International Equity ETF”)
Hartford Multifactor Low Volatility US Equity ETF (the “Multifactor Low Volatility US Equity ETF”)
Hartford Multifactor REIT ETF (the “Multifactor REIT ETF”)
Hartford Multifactor US Equity ETF (the “Multifactor US Equity ETF”)
Each Fund is an exchange-traded fund (‘‘ETF’’). ETFs are funds that trade on an exchange like other publicly traded securities. Each Fund is designed to track an index. Shares of Multifactor Developed Markets (ex-US) ETF, Multifactor Emerging Markets ETF, Multifactor Global Small Cap ETF, Multifactor REIT ETF and Multifactor US Equity ETF are listed and traded on NYSE Arca, Inc. (“NYSE Arca”). Shares of Multifactor Low Volatility International Equity ETF and Multifactor Low Volatility US Equity ETF are listed and traded on Cboe BZX Exchange, Inc. (“Cboe BZX”). Each share of a Fund represents a partial ownership in the Fund’s assets and liabilities, including securities held by the Fund. Shares of a Fund may be purchased or redeemed directly from the Fund only in Creation Units at net asset value (“NAV”) by certain large institutional investors (‘‘Authorized Participants’’) who have entered into agreements with ALPS Distributors, Inc. (‘‘ALPS’’ or the ‘‘Distributor’’), the Funds’ Distributor.
The assets of each Fund are separate, and a shareholder’s interest is limited to the Fund in which shares are held. The Trust was organized as a Delaware statutory trust on April 15, 2014 and is registered with the Securities and Exchange Commission (the “SEC”) under the Investment Company Act of 1940, as amended (the “1940 Act”). The shares of the Funds are registered under the Securities Act of 1933, as amended (the ‘‘Securities Act’’). Each Fund, except Multifactor REIT ETF, is a diversified open-end management investment company. Multifactor REIT ETF is a non-diversified open-end management investment company. Each Fund applies specialized accounting and reporting standards under Financial Accounting Standards Board (“FASB”) Accounting Standards Codification Topic 946 “Financial Services – Investment Companies.”
Multifactor Low Volatility International Equity ETF and Multifactor Low Volatility US Equity ETF commenced operations on May 10, 2017. Multifactor REIT ETF commenced operations on October 3, 2016. Multifactor Global Small Cap ETF commenced operations on March 23, 2015. Each of the other Funds commenced operations on February 25, 2015.
| 2. | Significant Accounting Policies: |
The following is a summary of significant accounting policies of each Fund used in the preparation of its financial statements, which are in accordance with United States Generally Accepted Accounting Principles (“U.S. GAAP”). The preparation of financial statements in accordance with U.S. GAAP may require management to make estimates and assumptions that affect the reported amounts of assets and liabilities and disclosure of contingent assets and liabilities at the date of the financial statements and the reported amounts of increases and decreases in net assets from operations during the reporting period. Actual results could differ from those estimates.
| a) | Determination of Net Asset Value – The NAV is determined as of the close of regular trading on the New York Stock Exchange (the “Exchange”) (normally 4:00 p.m. Eastern Time) (the “NYSE Close”) on each day that the Exchange is open (“Valuation Date”). If the Exchange is closed due to weather or other extraordinary circumstances on a day it would typically be open for business, each Fund may treat such day as a typical business day and accept creation and redemption orders and calculate each Fund’s NAV in accordance with applicable law. The net asset value for the shares is determined by dividing the value of the Fund’s net assets attributable to the shares by the number of shares outstanding. Information that becomes known to a Fund after the NAV has been calculated on a particular day will not generally be used to retroactively adjust the NAV determined earlier that day. |
| b) | Investment Valuation and Fair Value Measurements – For purposes of calculating the NAV, portfolio securities and other assets held in a Fund’s portfolio for which market prices are readily available are valued at market value. Market value is generally determined on the basis of official close price or last reported trade price. If no trades were reported, market value is based on prices obtained from a quotation reporting system, established market makers (including evaluated prices), or independent pricing services. Pricing vendors may use matrix pricing or valuation models that utilize certain inputs and assumptions to derive values, including transaction data, credit quality information, general market conditions, news, and other factors and assumptions. |
If market prices are not readily available or are deemed unreliable, a Fund will use the fair value of the security or other instrument as determined in good faith under policies and procedures established by and under the supervision of the Board of Trustees of the Trust (“Valuation Procedures”). Market prices are considered not readily available where there is an absence of current or reliable market-based data (e.g., trade information or broker quotes), including where events occur after the close of the relevant market, but prior to the NYSE
|
|
60 |
|
| Hartford Multifactor ETFs |
Notes to Financial Statements – (continued)
September 30, 2019
Close, that materially affect the values of a Fund’s portfolio holdings or assets. In addition, market prices are considered not readily available when, due to extraordinary circumstances, the exchanges or markets on which the securities or other instruments trade, do not open for trading for the entire day and no other market prices are available. Fair value pricing is subjective in nature and the use of fair value pricing by a Fund may cause the NAV of its shares to differ significantly from the NAV that would have been calculated using market prices at the close of the exchange on which a portfolio holding is primarily traded. There can be no assurance that a Fund could obtain the fair value assigned to an investment if the Fund were to sell the investment at approximately the time at which the Fund determines its NAV.
Securities and other instruments that are primarily traded on foreign markets may trade on days that are not business days of the Funds. The value of the foreign securities or other instruments in which a Fund invests may change on days when a shareholder will not be able to purchase, sell or redeem shares of the Fund.
Fixed income investments (other than short-term obligations) held by a Fund are normally valued at prices supplied by independent pricing services in accordance with the Valuation Procedures. Short-term investments maturing in 60 days or less are generally valued at amortized cost if their original term to maturity was 60 days or less, or by amortizing their value on the 61st day prior to maturity, if the original term exceeded 60 days.
Exchange-traded derivatives, such as options, futures and options on futures, are valued at the last sale price determined by the exchange where such instruments principally trade as of the close of such exchange (“Exchange Close”). If a last sale price is not available, the value will be the mean of the most recently quoted bid and ask prices as of the Exchange Close. If a mean of the bid and ask prices cannot be calculated for the day, the value will be the most recently quoted bid price as of the Exchange Close. Over-the-counter derivatives are normally valued based on prices supplied by independent pricing services in accordance with the Valuation Procedures.
Investments valued in currencies other than U.S. dollars are converted to U.S. dollars using the prevailing spot currency exchange rates obtained from independent pricing services for calculation of the NAV. As a result, the NAV of a Fund’s shares may be affected by changes in the value of currencies in relation to the U.S. dollar. The value of securities or other instruments traded in markets outside the United States or denominated in currencies other than the U.S. dollar may be affected significantly on a day that the Exchange is closed and the market value may change on days when an investor is not able to purchase, redeem or sell shares of a Fund.
Foreign currency contracts represent agreements to exchange currencies on specific future dates at predetermined rates. Foreign currency contracts are valued using foreign currency exchange rates and forward rates as provided by an independent pricing service on the Valuation Date.
Investments in open-end mutual funds, if any, are valued at the respective NAV of each open-end mutual fund on the Valuation Date. Shares of investment companies listed and traded on an exchange are valued in the same manner as any exchange-listed equity security. Such open-end mutual funds and listed investment companies may use fair value pricing as disclosed in their prospectuses.
Financial instruments for which prices are not available from an independent pricing service may be valued using market quotations obtained from one or more dealers that make markets in the respective financial instrument in accordance with the Valuation Procedures.
U.S. GAAP defines fair value as the price that a Fund would receive to sell an asset or pay to transfer a liability in an orderly transaction between market participants. The U.S. GAAP fair value measurement standards require disclosure of a fair value hierarchy for each major category of assets and liabilities. Various inputs are used in determining the fair value of each Fund’s investments. These inputs are summarized into three broad hierarchy levels. This hierarchy is based on whether the valuation inputs are observable or unobservable. These levels are:
| • | Level 1 – Quoted prices in active markets for identical investments. Level 1 may include exchange-traded instruments, such as domestic equities, some foreign equities, options, futures, mutual funds, exchange-traded funds, rights and warrants. |
| • | Level 2 – Observable inputs other than Level 1 prices, such as quoted prices for similar investments; quoted prices in markets that are not active; or other inputs that are observable or can be corroborated by observable market data. Level 2 may include debt investments that are traded less frequently than exchange-traded instruments and which are valued using independent pricing services; senior floating rate interests, which are valued using an aggregate of dealer bids; short-term investments, which are valued at amortized cost; and swaps, which are valued based upon the terms of each swap contract. |
| • | Level 3 – Significant unobservable inputs that are supported by limited or no market activity. Level 3 may include financial instruments whose values are determined using indicative market quotes or require significant management judgment or estimation. These unobservable valuation inputs may include estimates for current yields, maturity/duration, prepayment speed, and indicative market quotes for comparable investments along with other assumptions relating to credit quality, collateral value, complexity of the investment structure, general market conditions and liquidity. This category may include investments where trading has been halted or there are certain restrictions on trading. While these investments are priced using unobservable inputs, the valuation of these investments reflects the best available data and management believes the prices are a reasonable representation of exit price. |
|
|
61 |
|
| Hartford Multifactor ETFs |
Notes to Financial Statements – (continued)
September 30, 2019
The Board of Trustees (the “Board”) has delegated the day-to-day responsibility for implementing the valuation procedures to the Valuation Committee. The Valuation Committee will consider all relevant factors in determining an investment’s fair value, and may seek the advice of such Fund’s sub-adviser, as applicable, knowledgeable brokers, and legal counsel in making such determination. The Valuation Committee reports to the Audit Committee of the Board.
Valuation levels are not necessarily indicative of the risk associated with investing in such investments. Individual investments within any of the above mentioned asset classes may be assigned a different hierarchical level than those presented above, as individual circumstances dictate.
For additional information, refer to the Fair Valuation Summary and the Level 3 roll-forward reconciliation, if applicable, which follows each Fund’s Schedule of Investments.
| c) | Investment Transactions and Investment Income – Investment transactions are recorded as of the trade date (the date the order to buy or sell is executed) for financial reporting purposes. Investments purchased or sold on a when-issued or delayed-delivery basis may be settled a month or more after the trade date. Realized gains and losses are determined on the basis of identified cost. |
Dividend income from domestic securities is accrued on the ex-dividend date. The Multifactor REIT ETF dividend income and capital gain loss amounts include estimates based on prior year REIT allocations. In general, dividend income from foreign securities is recorded on the ex-date; however, dividend notifications in certain foreign jurisdictions may not be available in a timely manner and as a result, a Fund will record the dividend as soon as the relevant details (i.e., rate per share, payment date, shareholders of record, etc.) are publicly available. Non-cash dividends received in the form of stock are recorded as dividend income at market value. Interest income, including amortization of premium, accretion of discounts, inflation adjustments and additional principal received in-kind in lieu of cash, is accrued on a daily basis. Please refer to Note 8 for Securities Lending Information.
| d) | Taxes – A Fund may be subject to taxes imposed on realized gains on securities of certain foreign countries in which such Fund invests. A Fund may also be subject to taxes withheld on foreign dividends from securities in which the Fund invests. The amount of any foreign taxes withheld and foreign tax expense is included on the accompanying Statements of Operations as a reduction to net investment income or net realized gain on investments in these securities, if applicable. |
| e) | Foreign Currency Transactions – Assets and liabilities denominated in currencies other than U.S. dollars are translated into U.S. dollars at the exchange rates in effect on the Valuation Date. Purchases and sales of investments, income and expenses are translated into U.S. dollars at the exchange rates on the dates of such transactions. |
A Fund does not isolate that portion of portfolio investment valuation resulting from fluctuations in the foreign currency exchange rates from the fluctuations arising from changes in the market prices of investments held. Exchange rate fluctuations are included with the net realized and unrealized gain or loss on investments in the accompanying financial statements.
Net realized foreign exchange gains or losses arise from sales of foreign currencies and the difference between asset and liability amounts initially stated in foreign currencies and the U.S. dollar value of the amounts actually received or paid. Net unrealized foreign exchange gains or losses arise from changes in the value of other assets and liabilities at the end of the reporting period, resulting from changes in the exchange rates.
| f) | Dividend Distributions to Shareholders – Dividends are declared pursuant to a policy adopted by the Board. Dividends and/or distributions to shareholders are recorded on ex-date. The policy of Multifactor Developed Markets (ex-US) ETF, Multifactor Emerging Markets ETF, Multifactor Global Small Cap ETF and Multifactor Low Volatility International Equity ETF is to pay dividends from net investment income and realized gains, if any, semi-annually. The policy of Multifactor Low Volatility US Equity ETF, Multifactor REIT ETF and Multifactor US Equity ETF is to pay dividends from net investment income, if any, quarterly. Amounts may vary significantly from period to period and realized gains, if any, are paid at least once a year. Dividends may be declared and paid more frequently or at any other times to comply with the distribution requirements of the Internal Revenue Code. |
Income dividends and capital gains distributions are determined in accordance with federal income tax regulations, which may differ from U.S. GAAP with respect to character and timing (see Federal Income Taxes: Distributions and Components of Distributable Earnings and Reclassification of Capital Accounts notes).
| 3. | Securities and Other Investments: |
Restricted Securities – Each Fund may invest in securities that are subject to legal or contractual restrictions on resale. These securities generally may be resold in transactions exempt from registration or to the public if the securities are registered. Disposal of these securities may involve time-consuming negotiations and expense, and prompt sale at an acceptable price may be difficult. Information regarding restricted securities, if applicable, is included at the end of each Fund’s Schedule of Investments.
|
|
62 |
|
| Hartford Multifactor ETFs |
Notes to Financial Statements – (continued)
September 30, 2019
| 4. | Financial Derivative Instruments: |
| a) | Foreign Currency Contracts – A Fund may enter into foreign currency contracts that obligate the Fund to purchase or sell currencies at specified future dates. Foreign currency contracts may be used in connection with settling purchases or sales of securities to hedge the currency exposure associated with some or all of a Fund’s investments and/or as part of an investment strategy. Foreign currency contracts are marked to market daily and the change in value is recorded by a Fund as an unrealized gain or loss. A Fund will record a realized gain or loss when the foreign currency contract is settled. |
Foreign currency contracts involve elements of market risk in excess of the amounts reflected in the Statements of Assets and Liabilities. In addition, risks may arise upon entering into these contracts from the potential inability of the counterparties to meet the terms of the contracts and from unanticipated movements in the value of the foreign currencies relative to the U.S. dollar. Upon entering into a foreign currency contract, a Fund may be required to post margin equal to its outstanding exposure thereunder.
During the year ended September 30, 2019, the Funds had not used Foreign Currency Contracts. There were no open contracts at September 30, 2019.
| b) | Futures Contracts – A Fund may enter into futures contracts. A futures contract is an agreement between two parties to buy or sell an asset at a set price on a future date. A Fund may use futures contracts to manage risk or obtain exposure to the investment markets, commodities, or movements in interest rates and currency values. The primary risks associated with the use of futures contracts are the imperfect correlation between the change in market value of the investments held by a Fund and the prices of futures contracts and the possibility of an illiquid market. Upon entering into a futures contract, a Fund is required to deposit with a futures commission merchant (“FCM”) an amount of cash or U.S. Government or Agency Obligations in accordance with the initial margin requirements of the broker or exchange. Futures contracts are marked to market daily and an appropriate amount equal to the change in value (“variation margin”) is paid or received by a Fund. Gains or losses are recognized but not considered realized until the contracts expire or are closed. Futures contracts involve, to varying degrees, risk of loss in excess of the variation margin disclosed on the Statements of Assets and Liabilities. |
During the year ended September 30, 2019, Multifactor Developed Markets (ex-US) ETF, Multifactor Emerging Markets ETF, Multifactor Global Small Cap ETF, Multifactor REIT ETF and Multifactor US Equity ETF had used Futures Contracts.
| c) | Additional Derivative Instrument Information: |
Multifactor Developed Markets (ex-US) ETF
The Effect of Derivative Instruments on the Statement of Assets and Liabilities as of September 30, 2019:
| Risk Exposure Category | ||||||||||||||||||||||||||||
| Interest Rate Contracts |
Foreign Exchange Contracts |
Credit Contracts |
Equity Contracts |
Commodity Contracts |
Other Contracts |
Total | ||||||||||||||||||||||
| Liabilities: |
| |||||||||||||||||||||||||||
| Unrealized depreciation on futures contracts(1) |
$ | — | $ | — | $ | — | $ | 43,047 | $ | — | $ | — | $ | 43,047 | ||||||||||||||
|
|
|
|
|
|
|
|
|
|
|
|
|
|
|
|||||||||||||||
| Total |
$ | — | $ | — | $ | — | $ | 43,047 | $ | — | $ | — | $ | 43,047 | ||||||||||||||
|
|
|
|
|
|
|
|
|
|
|
|
|
|
|
|||||||||||||||
| (1) | Amount represents the cumulative depreciation on futures contracts as disclosed within the Schedule of Investments under the open “Futures Contracts” section. Only current day’s variation margin, if any, is reported within the Statement of Assets and Liabilities. |
The Effect of Derivative Instruments on the Statement of Operations for the year ended September 30, 2019:
| Risk Exposure Category | ||||||||||||||||||||||||||||
| Interest Rate Contracts |
Foreign Exchange Contracts |
Credit Contracts |
Equity Contracts |
Commodity Contracts |
Other Contracts |
Total | ||||||||||||||||||||||
| Realized Gain (Loss) on Derivatives Recognized as a Result of Operations: |
||||||||||||||||||||||||||||
| Net realized gain (loss) on futures contracts |
$ | — | $ | — | $ | — | $ | 480,602 | $ | — | $ | — | $ | 480,602 | ||||||||||||||
|
|
|
|
|
|
|
|
|
|
|
|
|
|
|
|||||||||||||||
| Total |
$ | — | $ | — | $ | — | $ | 480,602 | $ | — | $ | — | $ | 480,602 | ||||||||||||||
|
|
|
|
|
|
|
|
|
|
|
|
|
|
|
|||||||||||||||
| Net Change in Unrealized Appreciation (Depreciation) on Derivatives Recognized as a Result of Operations: |
||||||||||||||||||||||||||||
| Net change in unrealized appreciation (depreciation) of futures contracts |
$ | — | $ | — | $ | — | $ | (48,179 | ) | $ | — | $ | — | $ | (48,179 | ) | ||||||||||||
|
|
|
|
|
|
|
|
|
|
|
|
|
|
|
|||||||||||||||
| Total |
$ | — | $ | — | $ | — | $ | (48,179 | ) | $ | — | $ | — | $ | (48,179 | ) | ||||||||||||
|
|
|
|
|
|
|
|
|
|
|
|
|
|
|
|||||||||||||||
For the year ended September 30, 2019, the average amount or number per contract outstanding for each derivative type was as follows:
| Derivative Description |
Average Notional Par, Contracts or Face Amount | |||||||||||||||||
| Futures Contracts Long at Number of Contracts |
72 | |||||||||||||||||
|
|
63 |
|
| Hartford Multifactor ETFs |
Notes to Financial Statements – (continued)
September 30, 2019
Multifactor Emerging Markets ETF
The Effect of Derivative Instruments on the Statement of Assets and Liabilities as of September 30, 2019:
| Risk Exposure Category | ||||||||||||||||||||||||||||
| Interest Rate Contracts |
Foreign Exchange Contracts |
Credit Contracts |
Equity Contracts |
Commodity Contracts |
Other Contracts |
Total | ||||||||||||||||||||||
| Liabilities: |
| |||||||||||||||||||||||||||
| Unrealized depreciation on futures contracts(1) |
$ | — | $ | — | $ | — | $ | 7,768 | $ | — | $ | — | $ | 7,768 | ||||||||||||||
|
|
|
|
|
|
|
|
|
|
|
|
|
|
|
|||||||||||||||
| Total |
$ | — | $ | — | $ | — | $ | 7,768 | $ | — | $ | — | $ | 7,768 | ||||||||||||||
|
|
|
|
|
|
|
|
|
|
|
|
|
|
|
|||||||||||||||
| (1) | Amount represents the cumulative depreciation on futures contracts as disclosed within the Schedule of Investments under the open “Futures Contracts” section. Only current day’s variation margin, if any, is reported within the Statement of Assets and Liabilities. |
The Effect of Derivative Instruments on the Statement of Operations for the year ended September 30, 2019:
| Risk Exposure Category | ||||||||||||||||||||||||||||
| Interest Rate Contracts |
Foreign Exchange Contracts |
Credit Contracts |
Equity Contracts |
Commodity Contracts |
Other Contracts |
Total | ||||||||||||||||||||||
| Realized Gain (Loss) on Derivatives Recognized as a Result of Operations: |
||||||||||||||||||||||||||||
| Net realized gain (loss) on futures contracts |
$ | — | $ | — | $ | — | $ | (28,947 | ) | $ | — | $ | — | $ | (28,947 | ) | ||||||||||||
|
|
|
|
|
|
|
|
|
|
|
|
|
|
|
|||||||||||||||
| Total |
$ | — | $ | — | $ | — | $ | (28,947 | ) | $ | — | $ | — | $ | (28,947 | ) | ||||||||||||
|
|
|
|
|
|
|
|
|
|
|
|
|
|
|
|||||||||||||||
| Net Change in Unrealized Appreciation (Depreciation) on Derivatives Recognized as a Result of Operations: |
||||||||||||||||||||||||||||
| Net change in unrealized appreciation (depreciation) of futures contracts |
$ | — | $ | — | $ | — | $ | (9,144 | ) | $ | — | $ | — | $ | (9,144 | ) | ||||||||||||
|
|
|
|
|
|
|
|
|
|
|
|
|
|
|
|||||||||||||||
| Total |
$ | — | $ | — | $ | — | $ | (9,144 | ) | $ | — | $ | — | $ | (9,144 | ) | ||||||||||||
|
|
|
|
|
|
|
|
|
|
|
|
|
|
|
|||||||||||||||
For the year ended September 30, 2019, the average amount or number per contract outstanding for each derivative type was as follows:
| Derivative Description |
Average Notional Par, Contracts or Face Amount | |
| Futures Contracts Long at Number of Contracts |
8 |
Multifactor Global Small Cap ETF
The Effect of Derivative Instruments on the Statement of Assets and Liabilities as of September 30, 2019:
| Risk Exposure Category | ||||||||||||||||||||||||||||
| Interest Rate Contracts |
Foreign Exchange Contracts |
Credit Contracts |
Equity Contracts |
Commodity Contracts |
Other Contracts |
Total | ||||||||||||||||||||||
| Liabilities: |
| |||||||||||||||||||||||||||
| Unrealized depreciation on futures contracts(1) |
$ | — | $ | — | $ | — | $ | 3,684 | $ | — | $ | — | $ | 3,684 | ||||||||||||||
|
|
|
|
|
|
|
|
|
|
|
|
|
|
|
|||||||||||||||
| Total |
$ | — | $ | — | $ | — | $ | 3,684 | $ | — | $ | — | $ | 3,684 | ||||||||||||||
|
|
|
|
|
|
|
|
|
|
|
|
|
|
|
|||||||||||||||
| (1) | Amount represents the cumulative depreciation on futures contracts as disclosed within the Schedule of Investments under the open “Futures Contracts” section. Only current day’s variation margin, if any, is reported within the Statement of Assets and Liabilities. |
The Effect of Derivative Instruments on the Statement of Operations for the year ended September 30, 2019:
| Risk Exposure Category | ||||||||||||||||||||||||||||
| Interest Rate Contracts |
Foreign Exchange Contracts |
Credit Contracts |
Equity Contracts |
Commodity Contracts |
Other Contracts |
Total | ||||||||||||||||||||||
| Realized Gain (Loss) on Derivatives Recognized as a Result of Operations: |
||||||||||||||||||||||||||||
| Net realized gain (loss) on futures contracts |
$ | — | $ | — | $ | — | $ | (3,383 | ) | $ | — | $ | — | $ | (3,383 | ) | ||||||||||||
|
|
|
|
|
|
|
|
|
|
|
|
|
|
|
|||||||||||||||
| Total |
$ | — | $ | — | $ | — | $ | (3,383 | ) | $ | — | $ | — | $ | (3,383 | ) | ||||||||||||
|
|
|
|
|
|
|
|
|
|
|
|
|
|
|
|||||||||||||||
| Net Change in Unrealized Appreciation (Depreciation) on Derivatives Recognized as a Result of Operations: |
||||||||||||||||||||||||||||
| Net change in unrealized appreciation (depreciation) of futures contracts |
$ | — | $ | — | $ | — | $ | (2,830 | ) | $ | — | $ | — | $ | (2,830 | ) | ||||||||||||
|
|
|
|
|
|
|
|
|
|
|
|
|
|
|
|||||||||||||||
| Total |
$ | — | $ | — | $ | — | $ | (2,830 | ) | $ | — | $ | — | $ | (2,830 | ) | ||||||||||||
|
|
|
|
|
|
|
|
|
|
|
|
|
|
|
|||||||||||||||
|
|
64 |
|
| Hartford Multifactor ETFs |
Notes to Financial Statements – (continued)
September 30, 2019
Multifactor Global Small Cap ETF – (continued)
For the year ended September 30, 2019, the average amount or number per contract outstanding for each derivative type was as follows:
| Derivative Description |
Average Notional Par, Contracts or Face Amount | |||||||||||||
| Futures Contracts Long at Number of Contracts |
2 | |||||||||||||
Multifactor REIT ETF
The Effect of Derivative Instruments on the Statement of Assets and Liabilities as of September 30, 2019:
| Risk Exposure Category | ||||||||||||||||||||||||||||
| Interest Rate Contracts |
Foreign Exchange Contracts |
Credit Contracts |
Equity Contracts |
Commodity Contracts |
Other Contracts |
Total | ||||||||||||||||||||||
| Assets: |
| |||||||||||||||||||||||||||
| Unrealized appreciation on futures contracts(1) |
$ | — | $ | — | $ | — | $ | 809 | $ | — | $ | — | $ | 809 | ||||||||||||||
|
|
|
|
|
|
|
|
|
|
|
|
|
|
|
|||||||||||||||
| Total |
$ | — | $ | — | $ | — | $ | 809 | $ | — | $ | — | $ | 809 | ||||||||||||||
|
|
|
|
|
|
|
|
|
|
|
|
|
|
|
|||||||||||||||
| (1) | Amount represents the cumulative appreciation on futures contracts as disclosed within the Schedule of Investments under the open “Futures Contracts” section. Only current day’s variation margin, if any, is reported within the Statement of Assets and Liabilities. |
The Effect of Derivative Instruments on the Statement of Operations for the year ended September 30, 2019:
| Risk Exposure Category | ||||||||||||||||||||||||||||
| Interest Rate Contracts |
Foreign Exchange Contracts |
Credit Contracts |
Equity Contracts |
Commodity Contracts |
Other Contracts |
Total | ||||||||||||||||||||||
| Realized Gain (Loss) on Derivatives Recognized as a Result of Operations: |
||||||||||||||||||||||||||||
| Net realized gain (loss) on futures contracts |
$ | — | $ | — | $ | — | $ | 18,383 | $ | — | $ | — | $ | 18,383 | ||||||||||||||
|
|
|
|
|
|
|
|
|
|
|
|
|
|
|
|||||||||||||||
| Total |
$ | — | $ | — | $ | — | $ | 18,383 | $ | — | $ | — | $ | 18,383 | ||||||||||||||
|
|
|
|
|
|
|
|
|
|
|
|
|
|
|
|||||||||||||||
| Net Change in Unrealized Appreciation (Depreciation) on Derivatives Recognized as a Result of Operations: |
||||||||||||||||||||||||||||
| Net change in unrealized appreciation (depreciation) of futures contracts |
$ | — | $ | — | $ | — | $ | 1,218 | $ | — | $ | — | $ | 1,218 | ||||||||||||||
|
|
|
|
|
|
|
|
|
|
|
|
|
|
|
|||||||||||||||
| Total |
$ | — | $ | — | $ | — | $ | 1,218 | $ | — | $ | — | $ | 1,218 | ||||||||||||||
|
|
|
|
|
|
|
|
|
|
|
|
|
|
|
|||||||||||||||
For the year ended September 30, 2019, the average amount or number per contract outstanding for each derivative type was as follows:
| Derivative Description |
Average Notional Par, Contracts or Face Amount | |||||||||||||||||
| Futures Contracts Long at Number of Contracts |
3 | |||||||||||||||||
Multifactor US Equity ETF
The Effect of Derivative Instruments on the Statement of Assets and Liabilities as of September 30, 2019:
| Risk Exposure Category | ||||||||||||||||||||||||||||
| Interest Rate Contracts |
Foreign Exchange Contracts |
Credit Contracts |
Equity Contracts |
Commodity Contracts |
Other Contracts |
Total | ||||||||||||||||||||||
| Liabilities: |
| |||||||||||||||||||||||||||
| Unrealized depreciation on futures contracts(1) |
$ | — | $ | — | $ | — | $ | 25,340 | $ | — | $ | — | $ | 25,340 | ||||||||||||||
|
|
|
|
|
|
|
|
|
|
|
|
|
|
|
|||||||||||||||
| Total |
$ | — | $ | — | $ | — | $ | 25,340 | $ | — | $ | — | $ | 25,340 | ||||||||||||||
|
|
|
|
|
|
|
|
|
|
|
|
|
|
|
|||||||||||||||
| (1) | Amount represents the cumulative depreciation on futures contracts as disclosed within the Schedule of Investments under the open “Futures Contracts” section. Only current day’s variation margin, if any, is reported within the Statement of Assets and Liabilities. |
|
|
65 |
|
| Hartford Multifactor ETFs |
Notes to Financial Statements – (continued)
September 30, 2019
Multifactor US Equity ETF – (continued)
The Effect of Derivative Instruments on the Statement of Operations for the year ended September 30, 2019:
| Risk Exposure Category | ||||||||||||||||||||||||||||
| Interest Rate Contracts |
Foreign Exchange Contracts |
Credit Contracts |
Equity Contracts |
Commodity Contracts |
Other Contracts |
Total | ||||||||||||||||||||||
| Realized Gain (Loss) on Derivatives Recognized as a Result of Operations: |
||||||||||||||||||||||||||||
| Net realized gain (loss) on futures contracts |
$ | — | $ | — | $ | — | $ | 129,198 | $ | — | $ | — | $ | 129,198 | ||||||||||||||
|
|
|
|
|
|
|
|
|
|
|
|
|
|
|
|||||||||||||||
| Total |
$ | — | $ | — | $ | — | $ | 129,198 | $ | — | $ | — | $ | 129,198 | ||||||||||||||
|
|
|
|
|
|
|
|
|
|
|
|
|
|
|
|||||||||||||||
| Net Change in Unrealized Appreciation (Depreciation) on Derivatives Recognized as a Result of Operations: |
||||||||||||||||||||||||||||
| Net change in unrealized appreciation (depreciation) of futures contracts |
$ | — | $ | — | $ | — | $ | (26,065 | ) | $ | — | $ | — | $ | (26,065 | ) | ||||||||||||
|
|
|
|
|
|
|
|
|
|
|
|
|
|
|
|||||||||||||||
| Total |
$ | — | $ | — | $ | — | $ | (26,065 | ) | $ | — | $ | — | $ | (26,065 | ) | ||||||||||||
|
|
|
|
|
|
|
|
|
|
|
|
|
|
|
|||||||||||||||
For the year ended September 30, 2019, the average amount or number per contract outstanding for each derivative type was as follows:
| Derivative Description |
Average Notional Par, Contracts or Face Amount | |||||||||||||||||
| Futures Contracts Long at Number of Contracts |
6 | |||||||||||||||||
| d) | Balance Sheet Offsetting Information – Set forth below are tables which disclose both gross information and net information about instruments and transactions eligible for offset in the financial statements, and instruments and transactions that are subject to a master netting arrangement, as well as amounts related to margin, reflected as financial collateral (including cash collateral), held at clearing brokers, counterparties and a Fund’s custodian. The master netting arrangements allow the clearing brokers to net any collateral held in or on behalf of a Fund, or liabilities or payment obligations of the clearing brokers to a Fund, against any liabilities or payment obligations of a Fund to the clearing brokers. A Fund is required to deposit financial collateral (including cash collateral) at the Fund’s custodian on behalf of clearing brokers and counterparties to continually meet the original and maintenance requirements established by the clearing brokers and counterparties. Such requirements are specific to the respective clearing broker or counterparty. Certain master netting arrangements may not be enforceable in a bankruptcy. |
The following tables present a Fund’s derivative assets and liabilities, presented on a gross basis as no amounts are netted within the Statements of Assets and Liabilities, by counterparty net of amounts available for offset under a master netting agreement or similar agreement (“MNA”) and net of the related collateral received/pledged by a Fund as of September 30, 2019:
Multifactor Developed Markets (ex-US) ETF
| Derivative Financial Instruments: |
Assets | Liabilities | ||||||
| Futures contracts |
$ | — | $ | (43,047 | ) | |||
|
|
|
|
|
|||||
| Total gross amount of derivative assets and liabilities in the Statement of Assets and Liabilities |
— | (43,047 | ) | |||||
|
|
|
|
|
|||||
| Derivatives not subject to a MNA |
— | 43,047 | ||||||
|
|
|
|
|
|||||
| Total gross amount of assets and liabilities subject to MNA or similar agreements |
— | — | ||||||
|
|
|
|
|
|||||
Multifactor Emerging Markets ETF
| Derivative Financial Instruments: |
Assets | Liabilities | ||||||
| Futures contracts |
$ | — | $ | (7,768 | ) | |||
|
|
|
|
|
|||||
| Total gross amount of derivative assets and liabilities in the Statement of Assets and Liabilities |
— | (7,768 | ) | |||||
|
|
|
|
|
|||||
| Derivatives not subject to a MNA |
— | 7,768 | ||||||
|
|
|
|
|
|||||
| Total gross amount of assets and liabilities subject to MNA or similar agreements |
— | — | ||||||
|
|
|
|
|
|||||
Multifactor Global Small Cap ETF
| Derivative Financial Instruments: |
Assets | Liabilities | ||||||
| Futures contracts |
$ | — | $ | (3,684 | ) | |||
|
|
|
|
|
|||||
| Total gross amount of derivative assets and liabilities in the Statement of Assets and Liabilities |
— | (3,684 | ) | |||||
|
|
|
|
|
|||||
| Derivatives not subject to a MNA |
— | 3,684 | ||||||
|
|
|
|
|
|||||
| Total gross amount of assets and liabilities subject to MNA or similar agreements |
— | — | ||||||
|
|
|
|
|
|||||
|
|
66 |
|
| Hartford Multifactor ETFs |
Notes to Financial Statements – (continued)
September 30, 2019
Multifactor REIT ETF
| Derivative Financial Instruments: |
Assets | Liabilities | ||||||
| Futures contracts |
$ | 809 | $ | — | ||||
|
|
|
|
|
|||||
| Total gross amount of derivative assets and liabilities in the Statement of Assets and Liabilities |
809 | — | ||||||
|
|
|
|
|
|||||
| Derivatives not subject to a MNA |
(809 | ) | — | |||||
|
|
|
|
|
|||||
| Total gross amount of assets and liabilities subject to MNA or similar agreements |
— | — | ||||||
|
|
|
|
|
|||||
Multifactor US Equity ETF
| Derivative Financial Instruments: |
Assets | Liabilities | ||||||
| Futures contracts |
$ | — | $ | (25,340 | ) | |||
|
|
|
|
|
|||||
| Total gross amount of derivative assets and liabilities in the Statement of Assets and Liabilities |
— | (25,340 | ) | |||||
|
|
|
|
|
|||||
| Derivatives not subject to a MNA |
— | 25,340 | ||||||
|
|
|
|
|
|||||
| Total gross amount of assets and liabilities subject to MNA or similar agreements |
— | — | ||||||
|
|
|
|
|
|||||
| 5. | Principal Risks: |
A Fund’s investments expose it to various types of risks associated with financial instruments and the markets. A Fund may be exposed to the risks described below. Each Fund’s prospectus provides details of its principal risks.
The market values of equity securities, such as common stocks and preferred stocks, or equity related derivative investments, such as futures and options, may decline due to general market conditions that are not specifically related to a particular company, such as real or perceived adverse economic conditions, changes in the general outlook for corporate earnings, changes in interest or currency rates or adverse investor sentiment generally. The market value of equity securities may also decline due to factors that affect a particular industry or industries, such as labor shortages or increased production costs and competitive conditions within an industry. Equity securities and equity related investments generally have greater market price volatility than fixed income securities. The extent of each Fund’s exposure to market risk is the market value of the investments held as shown in the Fund’s Schedule of Investments.
Investing in the securities of non-U.S. issuers, whether directly or indirectly, involves certain considerations and risks not typically associated with securities of U.S. issuers. Such risks include, but are not limited to: generally less liquid and less efficient securities markets; generally greater price volatility; exchange rate fluctuations; imposition of restrictions on the expatriation of funds or other protectionist measures; less publicly available information about issuers; the imposition of withholding or other taxes; higher transaction and custody costs; settlement delays and risk of loss attendant in settlement procedures; difficulties in enforcing contractual obligations; less regulation of securities markets; different accounting, disclosure and reporting requirements; more substantial governmental involvement in the economy; higher inflation rates; and greater social, economic and political uncertainties. These risks are heightened for investments in issuers from countries with less developed markets.
Securities lending involves the risk that a Fund may lose money because the borrower of the loaned securities fails to return the securities in a timely manner or at all. A Fund could also lose money in the event of a decline in the value of the collateral provided for the loaned securities or a decline in the value of any investments made with cash collateral. These events could also trigger adverse tax consequences for a Fund that lends its holdings.
| 6. | Federal Income Taxes: |
| a) | Each Fund intends to continue to qualify as a Regulated Investment Company (“RIC”) under Subchapter M of the Internal Revenue Code (“IRC”) by distributing substantially all of its taxable net investment income and net realized capital gains to its shareholders each year. Each Fund has distributed substantially all of its income and capital gains in prior years, if applicable, and intends to distribute substantially all of its income and capital gains during the calendar year ending December 31, 2019. Accordingly, no provision for federal income or excise taxes has been made in the accompanying financial statements. Distributions from short-term capital gains are treated as ordinary income distributions for federal income tax purposes. |
| b) | Net Investment Income (Loss), Net Realized Gains (Losses) and Distributions – Net investment income (loss) and net realized gains (losses) may differ for financial statement and tax purposes primarily because of losses deferred due to wash sale adjustments, adjustments due to foreign currency gains and losses, adjustments related to Passive Foreign Investment Companies (“PFICs”), Real Estate Investment Trusts (“REITs”), RICs, certain derivatives and partnerships. The character of distributions made during the year from net investment income or net realized gains may differ from their ultimate characterization for federal income tax purposes. Also, due to the timing of dividend distributions, the fiscal year in which amounts are distributed may differ from the year that the income or realized gains (losses) were recorded by each Fund. |
|
|
67 |
|
| Hartford Multifactor ETFs |
Notes to Financial Statements – (continued)
September 30, 2019
| c) | Distributions and Components of Distributable Earnings – The tax character of distributions paid by each Fund for the years ended September 30, 2019 and September 30, 2018 are as follows (as adjusted for dividends payable, if applicable): |
| For the Year Ended September 30, 2019 |
For the Year Ended September 30, 2018 |
|||||||||||||||
| Fund |
Ordinary Income |
Tax Return of Capital |
Ordinary Income |
Tax Return of Capital |
||||||||||||
| Multifactor Developed Markets (ex-US) ETF |
$ | 48,161,644 | $ | — | $ | 8,013,824 | $ | — | ||||||||
| Multifactor Emerging Markets ETF |
2,004,488 | — | 1,141,715 | — | ||||||||||||
| Multifactor Global Small Cap ETF |
601,511 | — | 470,072 | — | ||||||||||||
| Multifactor Low Volatility International Equity ETF |
137,798 | — | 118,511 | — | ||||||||||||
| Multifactor Low Volatility US Equity ETF |
140,380 | — | 96,129 | — | ||||||||||||
| Multifactor REIT ETF |
833,172 | 402,584 | 677,992 | 41,564 | ||||||||||||
| Multifactor US Equity ETF |
5,407,729 | — | 1,496,009 | — | ||||||||||||
As of September 30, 2019, the components of distributable earnings (deficit) for each Fund on a tax basis are as follows:
| Fund |
Undistributed Ordinary Income |
Accumulated Capital and Other Losses |
Unrealized Appreciation (Depreciation) on Investments |
Total Accumulated Earnings (Deficit) |
||||||||||||
| Multifactor Developed Markets (ex-US) ETF |
$ | 24,483,653 | $ | (129,891,346 | ) | $ | 40,866,703 | $ | (64,540,990 | ) | ||||||
| Multifactor Emerging Markets ETF |
1,245,568 | (11,878,067 | ) | (114,241 | ) | (10,746,740 | ) | |||||||||
| Multifactor Global Small Cap ETF |
278,445 | (1,901,678 | ) | (305,254 | ) | (1,928,487 | ) | |||||||||
| Multifactor Low Volatility International Equity ETF |
64,636 | (123,557 | ) | 290,563 | 231,642 | |||||||||||
| Multifactor Low Volatility US Equity ETF |
8,532 | (220,957 | ) | 1,003,863 | 791,438 | |||||||||||
| Multifactor REIT ETF |
— | (738,950 | ) | 611,269 | (127,681 | ) | ||||||||||
| Multifactor US Equity ETF |
479,089 | (13,486,456 | ) | 12,729,252 | (278,115 | ) | ||||||||||
| d) | Reclassification of Capital Accounts – The Funds may record reclassifications in their capital accounts. These reclassifications have no impact on the total net assets of the Funds. The reclassifications are a result of permanent differences between U.S. GAAP and tax accounting for such items as treatment of the tax gains/losses on in-kind redemptions. Adjustments are made to reflect the impact these items have on current and future distributions to shareholders. Therefore, the source of the Funds’ distributions may be shown in the accompanying Statements of Changes in Net Assets as from distributable earnings or from capital depending on the type of book and tax differences that exist. For the year ended September 30, 2019, the Funds recorded reclassifications to increase (decrease) the accounts listed below: |
| Fund |
Paid-in-Capital | Distributable earnings (Loss) |
||||||
| Multifactor Developed Markets (ex-US) ETF |
$ | 53,206,275 | $ | (53,206,275 | ) | |||
| Multifactor Emerging Markets ETF |
2,200,571 | (2,200,571 | ) | |||||
| Multifactor Global Small Cap ETF |
1,524,189 | (1,524,189 | ) | |||||
| Multifactor Low Volatility International Equity ETF |
— | — | ||||||
| Multifactor Low Volatility US Equity ETF |
499,849 | (499,849 | ) | |||||
| Multifactor REIT ETF |
1,134,791 | (1,134,791 | ) | |||||
| Multifactor US Equity ETF |
9,259,565 | (9,259,565 | ) | |||||
| e) | Tax Basis of Investments – The aggregate cost of investments for federal income tax purposes at September 30, 2019 is different from book purposes primarily due to wash sale loss deferrals and passive foreign investment company (PFIC) mark-to-market adjustments. The net unrealized appreciation/(depreciation) on investments for tax purposes, which consists of gross unrealized appreciation and depreciation, was also different from book purposes primarily due to wash sale loss deferrals and mark-to-market adjustments on futures and PFICs. Both the cost and unrealized appreciation and depreciation for federal income tax purposes are disclosed below: |
| Fund |
Tax Cost | Gross Unrealized Appreciation |
Gross Unrealized Depreciation |
Net Unrealized Appreciation (Depreciation) |
||||||||||||
| Multifactor Developed Markets (ex-US) ETF |
$ | 2,280,785,162 | $ | 127,855,669 | $ | (86,937,326 | ) | $ | 40,918,343 | |||||||
| Multifactor Emerging Markets ETF |
68,683,457 | 3,092,193 | (3,202,139 | ) | (109,946 | ) | ||||||||||
| Multifactor Global Small Cap ETF |
17,282,722 | 1,754,346 | (2,059,408 | ) | (305,062 | ) | ||||||||||
| Multifactor Low Volatility International Equity ETF |
5,055,260 | 528,629 | (237,992 | ) | 290,637 | |||||||||||
| Multifactor Low Volatility US Equity ETF |
6,688,703 | 1,073,056 | (69,193 | ) | 1,003,863 | |||||||||||
| Multifactor REIT ETF |
17,304,828 | 1,437,515 | (826,247 | ) | 611,268 | |||||||||||
| Multifactor US Equity ETF |
291,449,800 | 16,368,193 | (3,638,941 | ) | 12,729,252 | |||||||||||
|
|
68 |
|
| Hartford Multifactor ETFs |
Notes to Financial Statements – (continued)
September 30, 2019
| f) | Capital Loss Carryforward – Under the Regulated Investment Company Modernization Act of 2010, funds are permitted to carry forward capital losses for an unlimited period. |
At September 30, 2019 (tax year end), each Fund’s capital loss carryforwards for U.S. federal income tax purposes were as follows:
| Short-Term Capital Loss Carryforward with No Expiration |
Long-Term Capital Loss Carryforward with No Expiration |
|||||||
| Fund | ||||||||
| Multifactor Developed Markets (ex-US) ETF |
$ | 107,334,369 | $ | 22,556,977 | ||||
| Multifactor Emerging Markets ETF |
6,704,506 | 5,173,561 | ||||||
| Multifactor Global Small Cap ETF |
1,200,254 | 701,424 | ||||||
| Multifactor Low Volatility International Equity ETF |
123,557 | — | ||||||
| Multifactor Low Volatility US Equity ETF |
148,022 | 72,935 | ||||||
| Multifactor REIT ETF |
598,680 | 140,270 | ||||||
| Multifactor US Equity ETF |
9,907,946 | 3,578,510 | ||||||
| g) | Accounting for Uncertainty in Income Taxes – Pursuant to provisions set forth by U.S. GAAP, Hartford Funds Management Company, LLC (“HFMC”) reviews each Fund’s tax positions for all open tax years. As of September 30, 2019, HFMC had reviewed the open tax years and concluded that there was no reason to record a liability for net unrecognized tax obligations relating to uncertain income tax positions. Each Fund files U.S. tax returns. Although the statute of limitations for examining a Fund’s U.S. tax returns remains open for 3 years, no examination is currently in progress. HFMC is not aware of any tax positions for which it is reasonably possible that the total amounts of unrecognized tax obligations will significantly change in the next twelve months. The Funds recognize interest and penalties, if any, related to unrecognized tax benefits as income tax expense on the Statements of Operations. During the year ended September 30, 2019, the Funds did not incur any interest or penalties. |
| 7. | Expenses: |
| a) | Investment Advisory Agreement – Lattice Strategies LLC (the “Adviser” or “Lattice”) serves as each Fund’s investment adviser pursuant to an Investment Advisory Agreement with the Trust. Lattice is a wholly owned subsidiary of Hartford Funds Management Company, LLC (“HFMC”), which is an indirect subsidiary of The Hartford Financial Services Group, Inc. (“The Hartford”). Lattice has overall investment supervisory responsibility for each Fund. In addition, Lattice provides administrative personnel, services, equipment, facilities and office space for proper operation of each Fund. Lattice has contracted with Mellon Investments Corporation (“Mellon”) under a sub-advisory agreement pursuant to which Mellon performs the daily investment of the assets of each Fund in accordance with each Fund’s investment objective and policies. Each Fund pays a fee to Lattice, a portion of which may be used to compensate Mellon. |
The schedule below reflects the rates of compensation paid to Lattice for investment advisory services rendered as of September 30, 2019; the rates are accrued daily and paid monthly based on each Fund’s average daily net assets, at the following annual rates:
| Fund |
Management Fee Rates | |
| Multifactor Developed Markets (ex-US) ETF |
0.29% | |
| Multifactor Emerging Markets ETF |
0.44% | |
| Multifactor Global Small Cap ETF |
0.39% | |
| Multifactor Low Volatility International Equity ETF |
0.29% | |
| Multifactor Low Volatility US Equity ETF |
0.19% | |
| Multifactor REIT ETF |
0.45% | |
| Multifactor US Equity ETF |
0.19% |
Prior to September 11, 2019, Multifactor Emerging Markets ETF paid the rate of 0.49% to Lattice for investment advisory services rendered. The rate was accrued daily and paid monthly based on the Fund’s average daily net assets.
Under the Investment Advisory Agreement, the Adviser agrees to pay all expenses of the Trust, except (i) brokerage expenses and other expenses (such as stamp taxes) connected with the execution of portfolio transactions or in connection with creation and redemption transactions; (ii) legal fees or expenses in connection with any arbitration, litigation or pending or threatened arbitration or litigation, including any settlements in connection therewith; (iii) extraordinary expenses; (iv) distribution fees and expenses paid by the Trust under any distribution plan adopted pursuant to Rule 12b-1 under the 1940 Act; and (v) the advisory fee payable to the Adviser under the Investment Advisory Agreement. The Adviser also does not pay any acquired fund fees and expenses. The payment or assumption by the Adviser of any expense of the Trust that the Adviser is not required by the Investment Advisory Agreement to pay or assume shall not obligate the Adviser to pay or assume the same or any similar expense of the Trust on any subsequent occasion.
| b) | Distribution Plans – Each Fund has adopted a Rule 12b-1 Distribution and Service Plan in accordance with Rule 12b-1 under the 1940 Act pursuant to which payments of up to 0.25% of each Fund’s average daily net assets may be made for the sale and distribution of its Shares. The Board has determined that the Funds may not make payments under the Rule 12b-1 Distribution and Service Plan until authorized to do |
|
|
69 |
|
| Hartford Multifactor ETFs |
Notes to Financial Statements – (continued)
September 30, 2019
| so by affirmative action of the Board. No Rule 12b-1 fees are currently paid by the Funds and there are no plans to impose these fees. However, in the event Rule 12b-1 fees are charged in the future, they will be paid out of the respective Fund’s assets. |
For the year ended September 30, 2019, the Funds did not pay any Rule 12b-1 fees.
| c) | Other Related Party Transactions – Certain officers of the Trust are trustees and/or officers of HFMC and/or The Hartford or its subsidiaries. For the year ended September 30, 2019, the Trust’s Chief Compliance Officer’s (“CCO”) compensation was paid by HFMC. As part of the Trust’s Chief Compliance Officer Services Agreement, HFMC also pays any CCO compensation on behalf of the Funds. |
| 8. | Securities Lending: |
Each Fund may lend Fund securities to certain creditworthy borrowers in U.S. and non-U.S. markets in an amount not to exceed one third (33 1/3 %) of the value of its total assets. The borrowers provide collateral that is marked to market daily, in an amount at least equal to the current market value of the securities loaned. A Fund may terminate a loan at any time and recall the securities loaned. A Fund receives the value of any interest or cash or non-cash distributions paid on the loaned securities. A Fund cannot vote proxies for securities on loan, but may recall loans to vote proxies if a material issue affecting the Fund’s economic interest in the investment is to be voted upon. Interest earned on securities out on loan is not eligible for qualified interest income for federal tax purposes. Should the borrower of the securities fail financially, a Fund may experience delays in recovering the securities or exercising its rights in the collateral. Loans are made only to borrowers that are deemed by the securities lending agent to be of good financial standing. In a loan transaction, a Fund will also bear the risk of any decline in value of securities acquired with cash collateral received by the Fund. Each Fund will seek to minimize this risk by limiting the investment of cash collateral to high quality instruments of short maturity. This strategy is not used to leverage a Fund.
With respect to loans that are collateralized by cash, the borrower will be entitled to receive a fee based on the amount of cash collateral. A Fund is compensated by the difference between the amount earned on the reinvestment of cash collateral and the fee paid to the borrower. In the case of collateral other than cash, a Fund is compensated by a fee paid by the borrower equal to a percentage of the market value of the loaned securities. Any cash collateral may be reinvested in certain short-term instruments either directly on behalf of the lending Fund or through one or more joint accounts or money market funds, which may include those managed by the Adviser. Any non-cash collateral received cannot be sold, re-invested or pledged by the Fund, except in the event of borrower default.
A Fund may pay a portion of the interest or fees earned from securities lending to a borrower as described above, and to one or more securities lending agents approved by the Board who administer the lending program for the Funds in accordance with guidelines approved by the Board. In such capacity, the lending agent causes the delivery of loaned securities from a Fund to borrowers, arranges for the return of loaned securities to the Fund at the termination of a loan, requests deposit of collateral, monitors the daily value of the loaned securities and collateral, requests that borrowers add to the collateral when required by the loan agreements, and provides recordkeeping and accounting services necessary for the operation of the program. State Street Bank and Trust Company (“State Street”) has been approved by the Board to serve as securities lending agent for the Funds and the Trust has entered into an agreement with State Street for such services. Among other matters, the Trust has agreed to indemnify State Street for certain liabilities. Any securities lending income earned by a Fund appears on the Statements of Operations net of any fees paid to State Street for serving as the securities lending agent.
Effective September 9, 2019, the agreement with State Street has been terminated.
Securities lending involves exposure to certain risks, including operational risk (i.e., the risk of losses resulting from problems in the settlement and accounting process – especially in certain international markets such as Taiwan), ‘‘gap’’ risk (i.e., the risk of a mismatch between the return on cash collateral reinvestments and the fees a Fund has agreed to pay a borrower), risk of loss of collateral, credit, legal, counterparty and market risk. Although State Street has agreed to provide a Fund with indemnification in the event of a borrower default, a Fund is still exposed to the risk of losses in the event a borrower does not return a Fund’s securities as agreed. For example, delays in recovery of securities loaned may cause a Fund to lose the opportunity to sell the securities at a desirable price.
At September 30, 2019, the Funds had no securities on loan or held any cash or non-cash collateral.
| 9. | Custodian and Transfer Agent: |
State Street serves as Custodian for the Funds pursuant to a custodian agreement (“Custodian Agreement”) dated December 31, 2014, as amended November 21, 2017. As Custodian, State Street holds each Fund’s assets, calculates the net asset value of the Shares and calculates net income and realized capital gains or losses. State Street serves as Transfer Agent of each Fund pursuant to a transfer agency agreement (“Transfer Agency Agreement”) dated February 13, 2018. As Transfer Agent, State Street maintains the records of each Authorized Participant’s ownership of each Fund and processes the purchases and redemptions of Creation Units.
For the services provided under the Custodian Agreement and Transfer Agency Agreement, Lattice, and not the Funds, compensates State Street pursuant to the Funds’ unitary management fee structure.
|
|
70 |
|
| Hartford Multifactor ETFs |
Notes to Financial Statements – (continued)
September 30, 2019
| 10. | Investment Transactions: |
For the year ended September 30, 2019, the cost of purchases and proceeds from sales of investment securities (excluding short-term investments) were as follows:
| Fund |
Total Cost of Purchases |
Total Sales Proceeds |
||||||
| Multifactor Developed Markets (ex-US) ETF |
$ | 1,171,823,217 | $ | 1,107,050,082 | ||||
| Multifactor Emerging Markets ETF |
63,156,108 | 59,459,787 | ||||||
| Multifactor Global Small Cap ETF |
13,329,207 | 10,730,627 | ||||||
| Multifactor Low Volatility International Equity ETF |
2,001,803 | 1,997,044 | ||||||
| Multifactor Low Volatility US Equity ETF |
3,592,713 | 4,252,413 | ||||||
| Multifactor REIT ETF |
12,158,394 | 12,024,567 | ||||||
| Multifactor US Equity ETF |
193,019,910 | 193,195,713 | ||||||
For the year ended September 30, 2019, in-kind transactions, which are not included in the table above, associated with purchase or redemption of Creation Units were as follows:
| Fund |
Cost of Purchases | Sales Proceeds | Realized Gain/(Loss) |
|||||||||
| Multifactor Developed Markets (ex-US) ETF |
$ | 1,784,074,274 | $ | 311,823,424 | $ | 54,851,642 | ||||||
| Multifactor Emerging Markets ETF |
19,927,344 | 14,642,979 | 2,242,445 | |||||||||
| Multifactor Global Small Cap ETF |
2,571,747 | 8,150,504 | 1,600,615 | |||||||||
| Multifactor Low Volatility US Equity ETF |
4,277,898 | 2,236,601 | 502,412 | |||||||||
| Multifactor REIT ETF |
7,707,448 | 18,499,077 | 1,722,458 | |||||||||
| Multifactor US Equity ETF |
178,158,469 | 43,689,149 | 9,373,101 | |||||||||
| 11. | Share Transactions: |
Each Fund will issue and redeem Shares at NAV only with certain Authorized Participants in large increments known as ‘‘Creation Units.” Purchases of Creation Units are made by tendering a basket of designated securities to a Fund and redemption proceeds are paid with a basket of securities from the Fund with a balancing cash component to equate the market value of the basket securities delivered or redeemed to the NAV per Creation Unit on the transaction date. Cash may be substituted in an amount equivalent to the value of certain securities generally when they are not available in sufficient quantity for delivery. Each Fund’s Shares are available in smaller increments to individual investors in the secondary market at market prices and may be subject to commissions. Authorized Participants may be required to pay a transaction fee when purchasing and redeeming Creation Units of the Fund. The transaction fee is used to defray the costs associated with the issuance and redemption of Creation Units
Purchase or redemption of Creation Units is only available to an Authorized Participant. An Authorized Participant is either (1) a ‘‘Participating Party,’’ (i.e., a broker-dealer or other participant in the clearing process of the Continuous Net Settlement System of the NSCC) (‘‘Clearing Process’’), or (2) a participant of DTC (‘‘DTC Participant’’), and, in each case, must have executed an agreement (‘‘Participation Agreement’’) with the Distributor with respect to creations and redemptions of Creation Units.
If a Creation Unit is purchased or redeemed for cash or outside of the Clearing Process, a higher transaction fee may be charged. The following table discloses Creation Unit breakdown for each Fund:
| Fund |
Standard Creation Unit Shares |
Standard In-Kind Creation Fee |
Value at September 30, 2019 |
Standard In-Kind Redemption Fee |
||||||||||||
| Multifactor Developed Markets (ex-US) ETF |
50,000 | $ | 3,000 | $ | 1,388,000 | $ | 3,000 | |||||||||
| Multifactor Emerging Markets ETF |
100,000 | $ | 2,000 | 2,220,000 | $ | 2,000 | ||||||||||
| Multifactor Global Small Cap ETF |
100,000 | $ | 2,000 | 2,855,000 | $ | 2,000 | ||||||||||
| Multifactor Low Volatility International Equity ETF |
100,000 | $ | 2,200 | 2,684,000 | $ | 2,200 | ||||||||||
| Multifactor Low Volatility US Equity ETF |
50,000 | $ | 650 | 1,541,500 | $ | 650 | ||||||||||
| Multifactor REIT ETF |
100,000 | $ | 250 | 1,636,000 | $ | 250 | ||||||||||
| Multifactor US Equity ETF |
50,000 | $ | 800 | 1,610,000 | $ | 800 | ||||||||||
Shares of Multifactor Developed Markets (ex-US) ETF, Multifactor Emerging Markets ETF, Multifactor Global Small Cap ETF, Multifactor REIT ETF and Multifactor US Equity ETF are listed on the NYSE Arca and shares of Multifactor Low Volatility International Equity ETF and Multifactor Low Volatility US Equity ETF are listed on the Cboe BZX. Shares of each Fund are publicly traded. Retail investors may purchase or sell shares in the secondary market (not from the Fund) through a broker or dealer. Investors purchasing or selling shares in the secondary market may pay a commission, market premium or discount or other transaction charge, to a broker or dealer, as well as some or all of the spread between the bid and the offered price for each purchase or sale transaction. Unless imposed by a broker or dealer, there is no minimum dollar amount upon purchase and no minimum number of shares that must be purchased in the secondary market. Because transactions in the secondary market occur at market prices, an investor may pay more than NAV upon purchase of shares and may receive less than a Fund’s NAV upon sale of shares.
|
|
71 |
|
| Hartford Multifactor ETFs |
Notes to Financial Statements – (continued)
September 30, 2019
Because each Fund is structured as an ETF, individual Shares may only be purchased and sold on a listing exchange through a broker-dealer. The price of Shares is based on market price, and because ETF shares trade at market prices rather than at NAV, Shares may trade at a price greater than NAV (a premium) or less than NAV (a discount). Multifactor Developed Markets (ex-US) ETF, Multifactor Low Volatility US Equity ETF and Multifactor US Equity ETF will only issue or redeem Creation Units of 50,000 shares to Authorized Participants who have entered into agreements with the Distributor. Multifactor Emerging Markets ETF, Multifactor Low Volatility International Equity ETF, Multifactor Global Small Cap ETF and Multifactor REIT ETF will only issue or redeem Creation Units of 100,000 shares to Authorized Participants who have entered into agreements with the Distributor. The Funds generally will issue or redeem Creation Units in return for a designated basket of securities (and an amount of cash) that the Fund specifies each day. The Funds do not impose any restrictions on the frequency of purchases and redemptions; however, the Funds reserve the right to reject or limit purchases at any time.
The following information is for the year ended September 30, 2019, and the year ended September 30, 2018:
| For the Year Ended September 30, 2019 |
For the Year Ended September 30, 2018 |
|||||||||||||||
| Shares | Amount | Shares | Amount | |||||||||||||
| Multifactor Developed Markets (ex-US) ETF | ||||||||||||||||
| Shares Sold |
67,400,000 | $ | 1,846,730,495 | 25,400,000 | $ | 738,684,038 | ||||||||||
| Shares Redeemed |
(11,250,000 | ) | (313,561,980 | ) | (2,050,000 | ) | (59,138,041 | ) | ||||||||
| Other Capital |
— | — | — | 321 | ||||||||||||
|
|
|
|
|
|
|
|
|
|||||||||
| Net Increase (Decrease) |
56,150,000 | 1,533,168,515 | 23,350,000 | 679,546,318 | ||||||||||||
|
|
|
|
|
|
|
|
|
|||||||||
| Multifactor Emerging Markets ETF | ||||||||||||||||
| Shares Sold |
1,400,000 | $ | 33,068,894 | 1,000,000 | $ | 25,448,866 | ||||||||||
| Shares Redeemed |
(1,100,000 | ) | (24,270,963 | ) | (100,000 | ) | (2,229,949 | ) | ||||||||
| Other Capital |
— | 101,198 | — | 17,212 | ||||||||||||
|
|
|
|
|
|
|
|
|
|||||||||
| Net Increase (Decrease) |
300,000 | 8,899,129 | 900,000 | 23,236,129 | ||||||||||||
|
|
|
|
|
|
|
|
|
|||||||||
| Multifactor Global Small Cap ETF | ||||||||||||||||
| Shares Sold |
200,000 | $ | 5,860,452 | 200,000 | $ | 6,275,566 | ||||||||||
| Shares Redeemed |
(300,000 | ) | (8,794,812 | ) | (100,000 | ) | (3,128,922 | ) | ||||||||
| Other Capital |
— | 1,652 | — | 1,646 | ||||||||||||
|
|
|
|
|
|
|
|
|
|||||||||
| Net Increase (Decrease) |
(100,000 | ) | (2,932,708 | ) | 100,000 | 3,148,290 | ||||||||||
|
|
|
|
|
|
|
|
|
|||||||||
| Multifactor Low Volatility International Equity ETF | ||||||||||||||||
| Shares Sold |
— | $ | — | — | $ | — | ||||||||||
| Shares Redeemed |
— | — | — | — | ||||||||||||
| Other Capital |
— | — | — | — | ||||||||||||
|
|
|
|
|
|
|
|
|
|||||||||
| Net Increase (Decrease) |
— | — | — | — | ||||||||||||
|
|
|
|
|
|
|
|
|
|||||||||
| Multifactor Low Volatility US Equity ETF | ||||||||||||||||
| Shares Sold |
150,000 | $ | 4,275,263 | 50,000 | $ | 1,329,697 | ||||||||||
| Shares Redeemed |
(100,000 | ) | (2,971,711 | ) | — | — | ||||||||||
|
|
|
|
|
|
|
|
|
|||||||||
| Net Increase (Decrease) |
50,000 | 1,303,552 | 50,000 | 1,329,697 | ||||||||||||
|
|
|
|
|
|
|
|
|
|||||||||
| Multifactor REIT ETF | ||||||||||||||||
| Shares Sold |
500,000 | $ | 7,709,666 | 1,800,000 | $ | 26,773,879 | ||||||||||
| Shares Redeemed |
(1,200,000 | ) | (18,538,614 | ) | (600,000 | ) | (9,438,842 | ) | ||||||||
|
|
|
|
|
|
|
|
|
|||||||||
| Net Increase (Decrease) |
(700,000 | ) | (10,828,948 | ) | 1,200,000 | 17,335,037 | ||||||||||
|
|
|
|
|
|
|
|
|
|||||||||
| Multifactor US Equity ETF | ||||||||||||||||
| Shares Sold |
5,900,000 | $ | 182,696,968 | 4,450,000 | $ | 142,311,556 | ||||||||||
| Shares Redeemed |
(1,600,000 | ) | (48,956,914 | ) | (400,000 | ) | (13,174,555 | ) | ||||||||
|
|
|
|
|
|
|
|
|
|||||||||
| Net Increase (Decrease) |
4,300,000 | 133,740,054 | 4,050,000 | 129,137,001 | ||||||||||||
|
|
|
|
|
|
|
|
|
|||||||||
| 12. | Affiliate Holdings: |
As of September 30, 2019, affiliates of The Hartford had ownership of shares in certain Funds as follows:
| Fund |
Percentage of Fund |
|||
| Multifactor Low Volatility International Equity ETF |
40 | % | ||
| Multifactor Low Volatility US Equity ETF |
56 | % | ||
| Multifactor REIT ETF |
41 | % | ||
|
|
72 |
|
| Hartford Multifactor ETFs |
Notes to Financial Statements – (continued)
September 30, 2019
As of September 30, 2019, affiliated funds of funds in the aggregate owned a portion of the Funds identified below. Therefore, these Funds may experience relatively large purchases or redemptions of their shares as a result of purchase and sale activity from these affiliated funds of funds. Affiliated funds of funds owned shares in the Fund listed below as follows:
| Fund |
Percentage of Fund |
|||
| Multifactor Developed Markets (ex-US) ETF |
3 | % | ||
| Multifactor Emerging Markets ETF |
5 | % | ||
| Multifactor US Equity ETF |
31 | % | ||
| 13. | Indemnifications: |
Under the Trust’s organizational documents, the Trust shall indemnify its officers and trustees to the full extent required or permitted under the applicable laws of the State of Delaware and federal securities laws. In addition, the Trust, on behalf of the Funds, may enter into contracts that contain a variety of indemnifications. The Trust’s maximum exposure under these arrangements is unknown. However, as of the date of these financial statements, the Trust has not had prior claims or losses pursuant to these contracts and expects the risk of loss to be remote.
| 14. | Recent Accounting Pronouncement: |
The FASB recently issued ASU 2017-08 (the “ASU” or “Update”) to amend the amortization period to the earliest call date for purchased callable debt securities held at a premium. The ASU is effective for public entities for fiscal years beginning after December 15, 2018, and will become effective for private entities one year later. Management is currently evaluating the implication, if any, of additional disclosure and its impact on the Funds’ financial statements.
In August 2018, the FASB issued Accounting Standards Update 2018-13, Fair Value Measurement (Topic 820): Disclosure Framework – Changes to the Disclosure Requirements for Fair Value Measurement (“ASU 2018-13”). The update introduces new fair value disclosure requirements, eliminates some prior fair value disclosure requirements, and modifies certain existing fair value disclosure requirements.
ASU 2018-13 is effective for fiscal years beginning after December 15, 2019 and for interim periods within those fiscal years, however, an entity is permitted to early adopt either the entire standard or only the provisions that eliminate or modify requirements. Management has elected to early adopt the provisions of ASU 2018-13 that eliminate disclosure requirements effective with the current reporting period. The impact of each Fund’s early adoption of these provisions was limited to changes in the Fund’s financial statement disclosures regarding fair value, primarily those disclosures related to transfers between Level 1 and Level 2 of the fair value hierarchy and the timing of transfers between levels of the fair value hierarchy. Management is currently evaluating the potential impact of adopting the additional provisions of ASU 2018-13.
| 15. | Subsequent Events: |
In connection with the preparation of the financial statements of the Funds as of and for the period ended September 30, 2019, events and transactions subsequent to September 30, 2019, through the date the financial statements were issued have been evaluated by the Funds’ management for possible adjustment and/or disclosure.
Effective November 6, 2019, Hartford Multifactor Global Small Cap ETF changed its name (now known as Hartford Multifactor Small Cap ETF), principal investment strategy and benchmark. Also effective November 6, 2019, the management fee rate for Multifactor Global Small Cap ETF was reduced from 0.39% to 0.34%. The information in this report is as of September 30, 2019 and therefore, does not reflect any of these changes. For more information, please see the Fund’s most recent prospectus.
Effective November 6, 2019, Hartford Multifactor Low Volatility International Equity ETF changed its name (now known as Hartford Multifactor Diversified International ETF), principal investment strategy and benchmark. The information in this report is as of September 30, 2019 and therefore, does not reflect any of these changes. For more information, please see the Fund’s most recent prospectus.
Effective on or about October 1, 2019, Citibank, N.A. has been approved by the Board to serve as securities lending agent for the Funds and the Trust has entered into an agreement with Citibank, N.A. for such services.
|
|
73 |
|
| Report of Independent Registered Public Accounting Firm |
To the Shareholders and the Board of Trustees of
Lattice Strategies Trust
Opinion on the Financial Statements
We have audited the accompanying statements of assets and liabilities of Lattice Strategies Trust (the “Trust”) (comprising Hartford Multifactor Developed Markets (ex-US) ETF, Hartford Multifactor Emerging Markets ETF, Hartford Multifactor Global Small Cap ETF, Hartford Multifactor Low Volatility International Equity ETF, Hartford Multifactor Low Volatility US Equity ETF, Hartford Multifactor REIT ETF and Hartford Multifactor US Equity ETF) (collectively referred to as the “Funds”), including the schedules of investments, as of September 30, 2019, and the related statements of operations, changes in net assets, and the financial highlights for each of the periods indicated in the table below and the related notes (collectively referred to as the “financial statements”). In our opinion, the financial statements present fairly, in all material respects, the financial position of each of the Funds comprising Lattice Strategies Trust at September 30, 2019, the results of their operations, changes in net assets and financial highlights for each of the periods indicated in the table below, in conformity with U.S. generally accepted accounting principles.
| Funds comprising Lattice Strategies Trust |
Statement of operations | Statements of changes in net assets |
Financial highlights | |||
| Hartford Multifactor Developed Markets (ex-US) ETF Hartford Multifactor Emerging Markets ETF Hartford Multifactor Global Small Cap ETF Hartford Multifactor US Equity ETF |
For the year ended September 30, 2019 | For each of the two years in the period ended September 30, 2019 | For each of the four years in the period ended September 30, 2019 | |||
| Hartford Multifactor REIT ETF | For the year ended September 30, 2019 | For each of the two years in the period ended September 30, 2019 | For each of the two years in the period ended September 30, 2019 and the period from October 3, 2016 (commencement of operations) through September 30, 2017 | |||
| Hartford Multifactor Low Volatility International Equity ETF Hartford Multifactor Low Volatility US Equity ETF |
For the year ended September 30, 2019 | For each of the two years in the period ended September 30, 2019 | For each of the two years in the period ended September 30, 2019 and the period from May 10, 2017 (commencement of operations) through September 30, 2017 |
The financial highlights of the Hartford Multifactor Developed Markets (ex-US) ETF, Hartford Multifactor Emerging Markets ETF, Hartford Multifactor Global Small Cap ETF and Hartford Multifactor US Equity ETF, for the period presented through September 30, 2015, were audited by other auditors whose report dated November 24, 2015, expressed an unqualified opinion on those financial highlights.
Basis for Opinion
These financial statements are the responsibility of the Trust’s management. Our responsibility is to express an opinion on each of the Funds’ financial statements based on our audits. We are a public accounting firm registered with the Public Company Accounting Oversight Board (United States) (“PCAOB”) and are required to be independent with respect to the Trust in accordance with the U.S. federal securities laws and the applicable rules and regulations of the Securities and Exchange Commission and the PCAOB.
We conducted our audits in accordance with the standards of the PCAOB. Those standards require that we plan and perform the audits to obtain reasonable assurance about whether the financial statements are free of material misstatement, whether due to error or fraud. The Trust is not required to have, nor were we engaged to perform, an audit of the Trust’s internal control over financial reporting. As part of our audits we are required to obtain an understanding of internal control over financial reporting but not for the purpose of expressing an opinion on the effectiveness of the Trust’s internal control over financial reporting. Accordingly, we express no such opinion.
Our audits included performing procedures to assess the risks of material misstatement of the financial statements, whether due to error or fraud, and performing procedures that respond to those risks. Such procedures included examining, on a test basis, evidence regarding the amounts and disclosures in the financial statements. Our procedures included confirmation of securities owned as of September 30, 2019, by correspondence with the custodian and others or by other appropriate auditing procedures where replies from others were not received. Our audits also included evaluating the accounting principles used and significant estimates made by management, as well as evaluating the overall presentation of the financial statements. We believe that our audits provide a reasonable basis for our opinion.

We have served as the auditor of one or more Hartford investment companies since 2002.
Philadelphia, Pennsylvania
November 26, 2019
|
|
74 |
|
| Hartford Multifactor ETFs |
Trustees and Officers of the Trust
Lattice Strategies Trust (the “Trust”) is governed by a Board of Trustees (the “Trustees”). The following tables present certain information regarding the Trustees and officers of the Trust as of September 30, 2019. For more information regarding the Trustees and officers, please refer to the Statement of Additional Information, which is available, without charge, upon request by calling 1-800-456-7526.
| NAME, YEAR OF BIRTH |
POSITION |
TERM
OF |
PRINCIPAL OCCUPATION(S) |
NUMBER OF PORTFOLIOS IN FUND COMPLEX(3) OVERSEEN BY TRUSTEE |
OTHER DIRECTORSHIPS | |||||
| NON-INTERESTED TRUSTEES | ||||||||||
| HILARY E. ACKERMANN (1956) |
Trustee | Since 2017 | Ms. Ackermann served as Chief Risk Officer at Goldman Sachs Bank USA from October 2008 to November 2011. Ms. Ackermann has served as a Director of Vistra Energy Corporation, formerly known as Dynegy, Inc. (an independent power company) since October 2012 and as a Director of Credit Suisse Holdings (USA), Inc. since January 2017. | 81 | Ms. Ackermann serves as a Director of Vistra Energy Corporation (October 2012 to present) and as a Director of Credit Suisse Holdings (USA), Inc. from January 2017 to present. | |||||
| ROBIN C. BEERY (1967) |
Trustee | Since 2014 | Ms. Beery has served as a consultant to ArrowMark Partners (an alternative asset manager) since March of 2015 and since November 2018 has been employed by ArrowMark Partners as a Senior Advisor. Previously, she was Executive Vice President, Head of Distribution, for Janus Capital Group, and Chief Executive Officer and President of the Janus Mutual Funds (a global asset manager) from September 2009 to August 2014. | 81 | Ms. Beery serves as a Director of UMB Financial Corporation (January 2015 to present). | |||||
| LYNN S. BIRDSONG(4) (1946) |
Trustee and Chairman of the Board | Trustee since 2017; Chairman of the Board since August 2019 | Mr. Birdsong currently serves as a Director of Aberdeen Global and Aberdeen Global II (investment funds) (since September 2014), Aberdeen Islamic SICAV and Aberdeen Liquidity Fund (investment funds) (since 2016), and Aberdeen Alpha Fund (since December 2017). Mr. Birdsong served as an Independent Director of Nomura Partners Funds, Inc. (formerly, The Japan Fund) (April 2003 to February 2015) and as a Director of the Sovereign High Yield Investment Company (April 2010 to June 2014). From 2003 to March 2005, Mr. Birdsong was an Independent Director of the Atlantic Whitehall Funds. From 1979 to 2002, Mr. Birdsong was a Managing Director of Zurich Scudder Investments, an investment management firm. During his employment with Scudder, Mr. Birdsong was an Interested Director of The Japan Fund. From January 1981 through December 2013, Mr. Birdsong was a partner in Birdsong Company, an advertising specialty firm. | 81 | None | |||||
| CHRISTINE R. DETRICK (1958) |
Trustee | Since 2017 |
Ms. Detrick has served as a Director of Reinsurance Group of America since January 2014. Previously, she was a director of Forest City Realty Trust (a real estate company) from November 2014 to March 2018, a Director of Forethought Financial Group, Inc. (a financial services company) from January 2012 to January 2014 and a Senior Partner/Advisor at Bain & Company (a management consulting firm) from September 2002 to December 2012. | 81 | Ms. Detrick serves as a Director of Reinsurance Group of America (January 2014 to present). | |||||
| DUANE E. HILL (1945) |
Trustee | Since 2017 | Mr. Hill is a Partner of TSG Ventures L.P., a private equity investment company. Mr. Hill is a former partner of TSG Capital Group, a private equity investment firm that served as sponsor and lead investor in leveraged buyouts of middle market companies. | 81 | None | |||||
|
|
75 |
|
| Hartford Multifactor ETFs |
Trustees and Officers of the Trust – (continued)
| NAME, YEAR OF BIRTH |
POSITION |
TERM
OF |
PRINCIPAL OCCUPATION(S) |
NUMBER OF PORTFOLIOS IN FUND COMPLEX(3) OVERSEEN BY TRUSTEE |
OTHER DIRECTORSHIPS | |||||
| PHILLIP O. PETERSON(5) (1944) |
Trustee | Since 2017 |
Mr. Peterson is a mutual fund industry consultant. He was a partner of KPMG LLP (an accounting firm) until July 1999. From February 2007 to February 2018, Mr. Peterson served as a member of the Board of Trustees of the William Blair Funds. From February 2012 to February 2014, Mr. Peterson served as a Trustee of Symetra Variable Mutual Funds. From January 2004 to April 2005, Mr. Peterson served as Independent President of the Strong Mutual Funds. | 81 | None | |||||
| LEMMA W. SENBET (1946) |
Trustee | Since 2017 | Dr. Senbet currently serves as the William E. Mayer Chair Professor of Finance, and previously was the Founding Director, Center for Financial Policy, in the Robert H. Smith School of Business at the University of Maryland. He was chair of the Finance Department Robert H. Smith School of Business at the University of Maryland from 1998 to 2006. In June 2013, he began a sabbatical from the University to serve as Executive Director of the African Economic Research Consortium which focuses on economic policy research and training, which he completed in 2018. Previously, he was a chaired professor of finance at the University of Wisconsin-Madison. Also, he was a Director of the Fortis Funds from March 2000 to July 2002. Dr. Senbet served as Director of the American Finance Association and President of the Western Finance Association. In 2006, Dr. Senbet was inducted Fellow of Financial Management Association International for his career-long distinguished scholarship and professional service. | 81 | None | |||||
| DAVID SUNG (1953) |
Trustee | Since 2014 | Mr. Sung has served as a Director of Nippon Wealth Bank since April 2015 and CITIC-Prudential Fund Management Company, Inc. since January 2016. Mr. Sung is an Independent Director of seven investment funds, including two closed-end registered investment companies, sponsored by Ironwood Capital Management. Previously, he was a Partner at Ernst & Young LLP from October 1995 to July 2014. | 81 | Mr. Sung serves as a Trustee of Ironwood Institutional Multi-Strategy Fund, LLC and Ironwood Multi-Strategy Fund, LLC (October 2015 to present) (2 portfolios). | |||||
| OFFICERS AND INTERESTED TRUSTEES | ||||||||||
| JAMES E. DAVEY(6) (1964) |
Trustee, President and Chief Executive Officer | Trustee since 2017; President and Chief Executive Officer since 2017 | Mr. Davey serves as Executive Vice President of The Hartford Financial Services Group, Inc. Additionally, Mr. Davey serves as Chairman of the Board, Manager, and Senior Managing Director of Hartford Funds Distributors, LLC (“HFD”). He also currently serves as Director, Chairman of the Board, President and Senior Managing Director of Hartford Administrative Services Company (“HASCO”). Mr. Davey also serves as President, Manager, Chairman of the Board, and Senior Managing Director for Hartford Funds Management Company, LLC (“HFMC”), and Director, Chairman, President, and Senior Managing Director for Hartford Funds Management Group, Inc. (“HFMG”). Mr. Davey also serves as Manager, Chairman of the Board, and President of Lattice Strategies LLC (since July 2016). Mr. Davey has served in various positions within The Hartford and its subsidiaries in connection with the operation of the Hartford Funds. Mr. Davey joined The Hartford in 2002. | 81 | None | |||||
|
|
76 |
|
| Hartford Multifactor ETFs |
Trustees and Officers of the Trust – (continued)
| NAME, YEAR OF BIRTH |
POSITION |
TERM
OF |
PRINCIPAL OCCUPATION(S) |
NUMBER OF PORTFOLIOS IN FUND COMPLEX(3) OVERSEEN BY TRUSTEE |
OTHER DIRECTORSHIPS | |||||
| ANDREW S. DECKER (1963) |
AML Compliance Officer | Since 2016 | Mr. Decker serves as Chief Compliance Officer and AML Compliance Officer of HASCO (since April 2015) and Vice President of HASCO (since April 2018). Mr. Decker serves as AML Officer of HFD (since May 2015). Mr. Decker also serves as Vice President of HFMG (since April 2018). Prior to joining The Hartford, Mr. Decker served as Vice President and AML Officer at Janney Montgomery Scott (a broker dealer) from April 2011 to January 2015. Mr. Decker served as AML Compliance and Sanctions Enforcement Officer at SEI Investments from December 2007 to April 2011. | N/A | N/A | |||||
| AMY N. FURLONG (1979) |
Vice President and Treasurer | Since 2018 | Ms. Furlong serves as Vice President and Assistant Treasurer of HFMC (since September 2019). Ms. Furlong has served in various positions within The Hartford and its subsidiaries in connection with the operation of the Hartford Funds. Ms. Furlong joined The Hartford in 2004. Prior to joining The Hartford, Ms. Furlong worked at KPMG LLP in audit services. | N/A | N/A | |||||
| WALTER F. GARGER (1965) |
Vice President and Chief Legal Officer | Since 2016 | Mr. Garger serves as Secretary, Managing Director and General Counsel of HFD, HASCO, HFMC and HFMG (since 2013). Mr. Garger also serves as Secretary and General Counsel of Lattice Strategies LLC (since July 2016). Mr. Garger has served in various positions within The Hartford and its subsidiaries in connection with the operation of the Hartford Funds. Mr. Garger joined The Hartford in 1995. | N/A | N/A | |||||
| ALBERT Y. LEE (1979) |
Vice President and Assistant Treasurer | Since 2016 | Mr. Lee serves as Head of Systemic Strategies and ETF Operations and Senior Vice President of HFMG (since July 2016). Mr. Lee also serves as Senior Vice President of Lattice Strategies LLC (since June 2017). Previously, Mr. Lee served as Managing Director and Chief Operating Officer, Lattice Strategies LLC (2009-2016); Chief Operating Officer at Avicenna Capital Management (2007-2009); and Chief Financial Officer at Steeple Capital LP (2005-2007). | N/A | N/A | |||||
| THEODORE J. LUCAS (1966) |
Vice President | Since 2017 | Mr. Lucas serves as Executive Vice President of HFMG (since July 2016) and as Executive Vice President of Lattice Strategies LLC (since June 2017). Previously, Mr. Lucas served as Managing Partner of Lattice Strategies LLC (2003 to 2016). | N/A | N/A | |||||
| JOSEPH G. MELCHER (1973) |
Chief Compliance Officer and Vice President | Since 2017 | Mr. Melcher serves as Executive Vice President of HFD (since December 2013) and has served as President (from April 2018 to June 2019) and Chief Executive Officer (from April 2018 to June 2019) of HFD. He also serves as Executive Vice President of HFMG and HASCO (since December 2013). Mr. Melcher also serves as Executive Vice President (since December 2013) and Chief Compliance Officer (since December 2012) of HFMC. Mr. Melcher also serves as Executive Vice President and Chief Compliance Officer of Lattice Strategies, LLC (since July 2016). Mr. Melcher has served in various positions within The Hartford and its subsidiaries in connection with the operation of the Hartford Funds since joining The Hartford in 2012. Prior to joining The Hartford, Mr. Melcher worked at Touchstone Investments, a member of the Western & Southern Financial Group, where he held the position of Vice President and Chief Compliance Officer from 2010 through 2012 and Assistant Vice President, Compliance from 2005 to 2010. | N/A | N/A | |||||
|
|
77 |
|
| Hartford Multifactor ETFs |
Trustees and Officers of the Trust – (continued)
| NAME, YEAR OF BIRTH |
POSITION |
TERM
OF |
PRINCIPAL OCCUPATION(S) |
NUMBER OF PORTFOLIOS IN FUND COMPLEX(3) OVERSEEN BY TRUSTEE |
OTHER DIRECTORSHIPS | |||||
| VERNON J. MEYER (1964) |
Vice President | Since 2016 | Mr. Meyer serves as Managing Director and Chief Investment Officer of HFMC and Managing Director of HFMG (since 2013). Mr. Meyer has served in various positions within The Hartford and its subsidiaries in connection with the operation of the Hartford Funds. Mr. Meyer joined The Hartford in 2004. | N/A | N/A | |||||
| ALICE A. PELLEGRINO (1960) |
Vice President and Assistant Secretary | Since 2016 | Ms. Pellegrino serves as Vice President of HFMG (since December 2013). Ms. Pellegrino also serves as Vice President and Assistant Secretary of Lattice Strategies LLC (since June 2017). Ms. Pellegrino is a Senior Counsel and has served in various positions within The Hartford and its subsidiaries in connection with the operation of the Hartford Funds. Ms. Pellegrino joined The Hartford in 2007. | N/A | N/A | |||||
| THOMAS R. PHILLIPS (1960) |
Vice President and Secretary | Since 2017 | Mr. Phillips currently serves as Vice President (since February 207) and Assistant Secretary (since June 2017) for HFMG. Mr. Phillips is Deputy General Counsel for HFMG. Prior to joining HFMG in 2017, Mr. Phillips was a Director and Chief Legal Officer of Saturna Capital Corporation from 2014–2016. Prior to that, Mr. Phillips was a Partner and Deputy General Counsel of Lord, Abbett & Co. LLC. | N/A | N/A | |||||
| (1) | The address for each officer and Trustee is c/o Hartford Funds 690 Lee Road, Wayne, PA 19087. |
| (2) | Each Trustee holds an indefinite term until the earlier of (i) the election and qualification of his or her successor or (ii) when the Trustee turns 75 years of age. Each officer shall serve until his or her successor is elected and qualifies. |
| (3) | The portfolios of the “Fund Complex” are series of The Hartford Mutual Funds, Inc., The Hartford Mutual Funds II, Inc., Hartford Series Fund, Inc., Hartford HLS Series Fund II, Inc., Hartford Funds Master Fund, Lattice Strategies Trust, Hartford Funds Exchange-Traded Trust, Hartford Funds NextShares Trust, and Hartford Schroders Opportunistic Income Fund. |
| (4) | Effective August 7, 2019, Mr. Birdsong has been appointed as Chairman of the Board. |
| (5) | Effective December 5, 2019, Mr. Peterson will retire from the Board of Trustees. |
| (6) | “Interested person,” as defined in the 1940 Act, of the Trust because of the person’s affiliation with, or equity ownership of HFMC or affiliated companies. |
|
|
78 |
|
| Hartford Multifactor ETFs |
HOW TO OBTAIN A COPY OF EACH FUND’S PROXY VOTING POLICIES AND VOTING RECORDS (UNAUDITED)
A description of the policies and procedures that each Fund uses to determine how to vote proxies relating to portfolio securities and information about how each Fund voted proxies relating to portfolio securities during the most recent twelve-month period ended June 30, are available (1) without charge, upon request, by calling 800-456-7526 and (2) on the SEC’s website at http://www.sec.gov.
QUARTERLY PORTFOLIO HOLDINGS INFORMATION (UNAUDITED)
Each Fund will file its complete schedule of portfolio holdings with the SEC for the first and third quarters of each fiscal year as an exhibit to its reports on Form N-PORT. Each Fund’s Form N-PORT reports once filed will be available (1) without charge, upon request, by calling 800-456-7526 and (2) on the SEC’s website at http://www.sec.gov.
|
|
79 |
|
| Hartford Multifactor ETFs |
Approval of Investment Advisory and Investment Sub-Advisory Agreements (Unaudited)
Lattice Strategies Trust
Hartford Multifactor Developed Markets (ex-US) ETF
Hartford Multifactor Emerging Markets ETF
Hartford Multifactor Global Small Cap ETF
Hartford Multifactor Low Volatility International Equity ETF
Hartford Multifactor Low Volatility US Equity ETF
Hartford Multifactor REIT ETF
Hartford Multifactor US Equity ETF
Section 15(c) of the Investment Company Act of 1940, as amended (the “1940 Act”), requires that each investment company’s board of trustees, including a majority of those trustees who are not “interested persons” of the investment company, as defined in the 1940 Act (the “Independent Trustees”), annually review and consider the continuation of the investment company’s investment advisory and sub-advisory agreements. At its meeting held on August 6-7, 2019, the Board of Trustees (the “Board”) of Lattice Strategies Trust (the “Trust”), including each of the Independent Trustees, unanimously voted to approve (i) the continuation of an investment advisory agreement (the “Investment Advisory Agreement”) by and between the Trust, on behalf of each of its funds listed above (each a “Fund” and collectively, the “Funds”) and Lattice Strategies LLC (“Lattice Strategies”), a wholly owned subsidiary of Hartford Funds Management Company, LLC; and (ii) a separate investment sub-advisory agreement (the “Sub-Advisory Agreement” and collectively with the Investment Advisory Agreement, the “Agreements”) between Lattice Strategies and the Funds’ sub-adviser, Mellon Investments Corporation (the “Sub-adviser,” and together with Lattice Strategies, the “Advisers”).
In the months preceding the August 6-7, 2019 meeting, the Board requested and reviewed written responses from the Advisers to questions posed to the Advisers on behalf of the Independent Trustees and supporting materials relating to those questions and responses. In addition, the Board considered such additional information as it deemed reasonably necessary to evaluate the Agreements, as applicable, with respect to each Fund, which included information furnished to the Board at its meetings throughout the year, as well as information specifically prepared in connection with the approval of the Agreements that was presented at the Board’s meetings held on June 18, 2019 and August 6-7, 2019. Information provided to the Board at its meetings throughout the year included, among other things, reports on Fund performance, including tracking difference, legal, compliance and risk management matters, sales and marketing activity, and the other services provided to each Fund by the Advisers and their affiliates. The Board also considered the materials and in-person presentations by Fund officers and representatives of Lattice Strategies received at the Board’s meetings on June 18, 2019 and August 6-7, 2019 concerning the Agreements.
The Independent Trustees, advised by independent legal counsel throughout the evaluation process, engaged service providers to assist them with evaluating the Agreements with respect to each Fund, as applicable. Broadridge Financial Solutions, Inc. (“Broadridge”), an independent provider of investment company data, was retained to provide the Board with reports on how each Fund’s contractual advisory fees and overall expense ratio compared to those of comparable investment companies with similar investment objectives. The Independent Trustees also engaged an independent financial services consultant (the “Consultant”) to assist them in evaluating the Funds’ respective advisory fees, overall expense ratios and investment performance. In addition, the Consultant reviewed the profitability methodologies used by Lattice Strategies in connection with the continuation of the Investment Advisory Agreement.
In determining whether to continue the Agreements for a Fund, the members of the Board reviewed and evaluated information and factors they believed to be relevant and appropriate through the exercise of their reasonable business judgment. While individual members of the Board may have weighed certain factors differently, the Board’s determination to continue the Agreements was based on a comprehensive consideration of all information provided to the Board throughout the year and specifically with respect to the continuation of the Agreements. The Board was also furnished with an analysis of its fiduciary obligations in connection with its evaluation of the Agreements and, throughout the evaluation process, the Board was assisted by counsel for the Funds. The Independent Trustees were also separately assisted by independent legal counsel. A more detailed summary of the important, but not necessarily all, factors the Board considered with respect to its approval of the Agreements is provided below.
Nature, Extent and Quality of Services Provided by the Advisers
The Board requested and considered information concerning the nature, extent and quality of the services provided to each Fund by the Advisers. The Board considered, among other things, the terms of the Agreements and the range of services provided by the Advisers. The Board considered the Advisers’ professional personnel who provide services to the Funds, including each Adviser’s ability and experience in attracting and retaining qualified personnel to service the Funds. The Board considered each Adviser’s reputation and overall financial strength, as well as its willingness to consider and implement organizational and operational changes designed to enhance services to the Funds. In addition, the Board considered the quality of each Adviser’s communications with the Board and responsiveness to Board inquiries and requests made from time to time with respect to the Funds.
The Board also requested and evaluated information concerning each Adviser’s regulatory and compliance environment. In this regard, the Board requested and reviewed information about each Adviser’s compliance policies and procedures, compliance history, and a report from the Funds’ Chief Compliance Officer about each Adviser’s compliance with applicable laws and regulations, including responses to regulatory developments and any compliance issues raised by regulators. The Board also noted the Advisers’ support of the Funds’ compliance control structure, as applicable, and, in particular, the resources devoted by the Advisers in support of the Funds’ obligations pursuant to Rule 38a-1 under the 1940 Act and the Funds’ liquidity risk management program, as well as the efforts of the Advisers to combat cybersecurity risks and invest in business continuity planning.
|
|
80 |
|
| Hartford Multifactor ETFs |
Approval of Investment Advisory and Investment Sub-Advisory Agreements (Unaudited) – (continued)
With respect to Lattice Strategies, the Board noted that, under the Investment Advisory Agreement, Lattice Strategies is responsible for the management of the Funds, including oversight of fund operations and service providers, and the provision of administrative and investment advisory services in connection with selecting, monitoring and supervising the Sub-adviser. In this regard, the Board evaluated information about the nature and extent of responsibilities retained and risks assumed by Lattice Strategies that were not delegated to or assumed by the Sub-adviser. The Board considered that Lattice Strategies is responsible for the creation, maintenance and ongoing monitoring of each Fund’s custom proprietary benchmark index. The Board considered Lattice Strategies’ ongoing monitoring of people, process and performance and oversight of the Funds’ portfolio managers. The Board considered Lattice Strategies’ periodic due diligence reviews of the Sub-adviser and ongoing oversight of the Sub-adviser’s investment approach and results, process for monitoring best execution of portfolio trades and other trading operations by the Sub-adviser, and approach to risk management with respect to the Funds and the service providers to the Funds. The Board considered Lattice Strategies’ oversight of the Funds’ securities lending program and noted the income earned by the Funds in connection with their participation in the program. The Board also considered Lattice Strategies’ day-to-day oversight of each Fund’s compliance with its investment objective and policies as well as with applicable laws and regulations.
The Board considered that Lattice Strategies or its affiliates are responsible for providing the Funds’ officers. The Board also considered the entrepreneurial and other risks assumed by Lattice Strategies in connection with sponsoring and providing ongoing services to each Fund.
With respect to the Sub-adviser, which is responsible for the daily investment of the Funds’ assets, subject to oversight by Lattice Strategies, the Board considered, among other things, the quality of each Fund’s portfolio managers, the Sub-adviser’s other investment personnel, its investment process, its investment research capabilities and resources, its performance record, its trade execution capabilities and its experience. The Board considered the experience of each Fund’s portfolio managers, the number of accounts managed by the portfolio managers, and the Sub-adviser’s method for compensating the portfolio managers.
Based on these considerations, the Board concluded that it was satisfied with the nature, extent and quality of the services provided to each Fund by Lattice Strategies and the Sub-adviser.
Performance of each Fund and the Advisers
The Board considered the investment performance of each Fund. In this regard, the Board reviewed the performance of each Fund over different time periods presented in the materials and evaluated Lattice Strategies’ analysis of the Fund’s performance for these time periods. The Board considered information and materials provided to the Board by the Advisers concerning Fund performance, including information comparing each Fund’s investment performance to the performance of its custom proprietary benchmark index. For details regarding each Fund’s performance, see the Fund-by-Fund synopsis below.
The Board considered the detailed investment analytics reports provided by each Adviser throughout the year, including in connection with the approval of the Agreements. These reports include, among other things, information on each Fund’s gross returns and net returns, each Fund’s tracking difference as it relates to tracking the performance of its custom proprietary benchmark index, various statistics concerning the Fund’s portfolio, and a narrative summary of various factors affecting Fund performance. In reviewing the tracking difference reports, the Board considered Lattice Strategies’ assessment of each Fund’s tracking difference, including information comparing each Fund’s tracking difference to a general tracking difference range established for the Fund over various periods, Lattice Strategies’ views regarding the appropriateness of the general tracking difference ranges and explanations of the factors contributing to any tracking difference. For details regarding each Fund’s tracking difference, see the Fund-by-Fund synopsis below. The Board considered the Advisers’ work with the Investment Committee, which assists the Board in evaluating the performance of each Fund at periodic meetings throughout the year and specifically with respect to the approval of the Agreements. The Board also considered the analysis provided by the Consultant relating to each Fund’s performance track record.
While the Board primarily evaluated each Fund’s performance by reviewing the Fund’s tracking difference relative to its custom proprietary benchmark index, the Board also considered Lattice Strategies’ assessment of the quality of each Fund’s custom proprietary benchmark index and whether each such index was continuing to function as intended. The Board reviewed the performance of each Fund and its custom proprietary benchmark index relative to an unaffiliated broad-based securities market index and found such comparisons to be useful in evaluating the quality of the Fund’s custom proprietary benchmark index. The Board also considered that Lattice Strategies believes that each Fund’s custom proprietary benchmark index was continuing to function as intended.
In light of all the considerations noted above, the Board concluded that it had continued confidence in Lattice Strategies’ and the Sub-adviser’s overall capabilities to manage the Funds.
Costs of the Services and Profitability of the Advisers
The Board reviewed information regarding Lattice Strategies’ cost to provide investment management and related services to each Fund and Lattice Strategies’ estimated profitability, both overall and for each Fund, on a pre-tax basis without regard to distribution expenses. The Board also requested and received information relating to the operations and profitability of the Sub-adviser. The Board considered representations from Lattice Strategies and the Sub-adviser that the Sub-adviser’s fees were negotiated at arm’s length and that the sub-advisory fees are paid by Lattice Strategies and not the Funds. Accordingly, the Board concluded that the profitability of the Sub-adviser is a less relevant factor with respect to the Board’s consideration of the Sub-Advisory Agreement.
|
|
81 |
|
| Hartford Multifactor ETFs |
Approval of Investment Advisory and Investment Sub-Advisory Agreements (Unaudited) – (continued)
The Board considered the Consultant’s review of the methodologies and estimates used by Lattice Strategies in calculating profitability in connection with the continuation of the Investment Advisory Agreement, including a description of the methodology used to allocate certain expenses. The Board noted the Consultant’s view that Lattice Strategies’ process for calculating and reporting Fund profitability is reasonable and consistent with the process previously reviewed by the Consultant. In this regard, the Board noted that the Consultant had previously performed a full review of this process and reported that such process is sound and consistent with common industry practice.
Based on these considerations, the Board concluded that the profits anticipated to be realized by the Advisers from their relationships with the Funds would not be excessive.
Comparison of Fees and Services Provided by the Advisers
The Board considered the comparative information that had been provided at meetings on June 18, 2019 and August 6-7, 2019 with respect to the services rendered to and the management fees to be paid by each Fund to Lattice Strategies and the total expense ratio of the Fund. The Board considered that Lattice Strategies would pay all expenses of the Trust, except for (i) brokerage expenses and other expenses (such as stamp taxes) connected with the execution of portfolio transactions or in connection with creation and redemption transactions; (ii) legal fees or expenses in connection with any arbitration, litigation or pending or threatened arbitration or litigation, including any settlements in connection therewith; (iii) extraordinary expenses; (iv) any distribution fees and expenses paid by the Trust under any distribution plan adopted pursuant to Rule 12b-1 under the 1940 Act; and (v) the advisory fee payable to Lattice Strategies. The Board also considered comparative information with respect to the sub-advisory fees to be paid by Lattice Strategies to the Sub-adviser with respect to each Fund. In this regard, the Board requested and reviewed information from Lattice Strategies and the Sub-adviser relating to the management and sub-advisory fees, including the sub-advisory fee schedule, and total operating expenses for each Fund. The Board also reviewed information from Broadridge comparing each Fund’s contractual management fees and overall expense ratio relative to an appropriate group of funds selected by Broadridge (“Peer Group”). For details regarding each Fund’s expenses, see the Fund-by-Fund synopsis below.
The Board considered the methodology used by Broadridge to select the applicable Peer Groups. While the Board recognized that comparisons between a Fund and its Peer Group may be imprecise given the different service levels and characteristics of the investment companies and the different business models and cost structures of the Advisers, the comparative information provided by Broadridge assisted the Board in evaluating the reasonableness of each Fund’s fees and total operating expenses. In addition, the Board considered the analysis and recommendations of the Consultant relating to each Fund’s fees and total operating expenses.
The Board received information regarding fees charged by Lattice Strategies to other clients that are mutual funds with investment strategies similar to those of Hartford Multifactor Developed Markets (ex-US) ETF and Hartford Multifactor US Equity ETF. The Board reviewed information about structural, operational and other differences between the Hartford Multifactor Developed Markets (ex-US) ETF and Hartford Multifactor US Equity ETF and the other mutual fund clients, including differences in the services provided by Lattice Strategies to each type of product and differences in the marketplace in which each type of product must compete.
Based on these considerations, the Board concluded that each Fund’s fees and total operating expenses, in conjunction with the information about quality of services, profitability, economies of scale, and other matters discussed, were reasonable in light of the services provided.
Economies of Scale
The Board considered information regarding the extent to which economies of scale may be realized as a Fund grows and whether fee levels reflect these economies of scale for the benefit of shareholders of the Fund. The Board also considered that any economies of scale in respect of the management of a Fund would benefit Lattice Strategies due to the unitary fee structure of the Fund. The Board considered that each Fund could share in the benefits from economies of scale as assets in the Fund grow. The Board noted that the Funds do not have management fee breakpoints. However, the Board considered that Lattice Strategies shares potential economies of scale with shareholders in a variety of ways, including through initially setting competitive fee rates and pricing each Fund to scale at inception, as well as additional investments in Lattice Strategies’ business and the provision of improved or additional infrastructure and services to the Funds and their shareholders. The Board also noted that, for each of the Hartford Multifactor Global Small Cap ETF, Hartford Multifactor Emerging Markets ETF and Hartford Multifactor REIT ETF, the Fund’s current low asset levels means that the Fund has achieved limited, if any, economies of scale.
The Board also considered how any benefits from economies of scale would be realized by the various parties. Based on these considerations, the Board concluded that it was satisfied with the extent to which economies of scale would be shared for the benefit of each Fund’s shareholders. The Board noted, however, that it would review future growth in each Fund’s assets and the appropriateness of any potential future management fee breakpoints as part of its future annual review of the Agreements.
Other Benefits
The Board considered other benefits to the Advisers and their affiliates from their relationships with the Funds.
|
|
82 |
|
| Hartford Multifactor ETFs |
Approval of Investment Advisory and Investment Sub-Advisory Agreements (Unaudited) – (continued)
Fund-by-Fund factors
Solely for purposes of the Fund-by-Fund discussion below, the Board noted that Fund performance is referred to as “in line with” a Fund’s custom proprietary benchmark index where the Fund’s tracking difference relative to its custom proprietary benchmark index was within a range previously established by the Board.
Hartford Multifactor Developed Markets (ex-US) ETF
| • | The Board noted that the Fund exceeded its tracking difference threshold for the 1-year period but was in line with its custom proprietary benchmark index for the 3-year period. The Board noted that the Fund seeks to provide investment results that, before fees and expenses, correspond to the total return performance of its custom proprietary benchmark index. The Board considered the causes of the tracking difference for the Fund, noting that the Fund outperformed its custom proprietary index on a gross of fees basis. |
| • | The Board noted that the Fund’s contractual management fee, actual management fee and total expenses were in the 1st quintile of its expense group. |
Hartford Multifactor Emerging Markets ETF
| • | The Board noted that the Fund’s performance was in line with its custom proprietary benchmark index for the 1- and 3-year periods, noting that the Fund seeks to provide investment results that, before fees and expenses, correspond to the total return performance of its custom proprietary benchmark index. The Board also noted that the Fund will replace its custom proprietary benchmark index with a new custom proprietary benchmark index and considered that certain changes will be made to the Fund’s principal investment strategy. |
| • | The Board noted that the Fund’s contractual management fee was in the 2nd quintile of its expense group, while its actual management fee was in the 4th quintile and its total expenses were in the 3rd quintile. In considering the Fund’s expenses, the Board noted the shareholder savings expected to result from a permanent fee reduction, which will be implemented on September 11, 2019. |
Hartford Multifactor Global Small Cap ETF
| • | The Board noted that the Fund’s performance was in line with its custom proprietary benchmark index for the 1- and 3-year periods, noting that the Fund seeks to provide investment results that, before fees and expenses, correspond to the total return performance of its custom proprietary benchmark index. The Board also noted that the Fund will replace its custom proprietary benchmark index with a new custom proprietary benchmark index and considered that certain changes will be made to the Fund’s principal investment strategy. |
| • | The Board noted that the Fund’s contractual management fee and total expenses were in the 2nd quintile of its expense group, while its actual management fee was in the 3rd quintile. In considering the Fund’s expenses, the Board noted the shareholder savings expected to result from a permanent fee reduction, which will be implemented on November 6, 2019. The Board considered that the Fund’s expense group would change as a result of the upcoming changes to the Fund’s principal investment strategy and noted that the Fund’s revised contractual management fee and its expected total expenses and actual management fee are expected to be in the 2nd quintile of its new expense group. |
Hartford Multifactor Low Volatility International Equity ETF
| • | The Board noted that the Fund exceeded its tracking difference threshold for the 1-year period but was in line with its custom proprietary benchmark index since the Fund’s inception. The Board noted that the Fund seeks to provide investment results that, before fees and expenses, correspond to the total return performance of its custom proprietary benchmark index. The Board considered the causes of the tracking difference for the Fund, noting that the Fund outperformed its custom proprietary index on a gross of fees basis. The Board also noted that the Fund will replace its custom proprietary benchmark index with a new custom proprietary benchmark index and considered that certain changes will be made to the Fund’s principal investment strategy. |
| • | The Board noted that the Fund’s contractual management fee and total expenses were in the 1st quintile of its expense group, while its actual management fee was in the 2nd quintile. |
Hartford Multifactor Low Volatility US Equity ETF
| • | The Board noted that the Fund’s performance was in line with its custom proprietary benchmark index for the 1-year period, noting that the Fund seeks to provide investment results that, before fees and expenses, correspond to the total return performance of its custom proprietary benchmark index. |
| • | The Board noted that the Fund’s contractual management fee, actual management fee and total expenses were in the 2nd quintile of its expense group. |
|
|
83 |
|
| Hartford Multifactor ETFs |
Approval of Investment Advisory and Investment Sub-Advisory Agreements (Unaudited) – (continued)
Hartford Multifactor REIT ETF
| • | The Board noted that the Fund’s performance was in line with its custom proprietary benchmark index for the 1-year period, noting that the Fund seeks to provide investment results that, before fees and expenses, correspond to the total return performance of its custom proprietary benchmark index. |
| • | The Board noted that the Fund’s contractual management fee and total expenses were ranked 2nd out of four in its expense group, while its actual management fee was ranked 3rd out of four in its expense group. |
Hartford Multifactor US Equity ETF
| • | The Board noted that the Fund’s performance was in line with its custom proprietary benchmark index for the 1- and 3-year periods, noting that the Fund seeks to provide investment results that, before fees and expenses, correspond to the total return performance of its custom proprietary benchmark index. The Board also noted that the Fund will replace its custom proprietary benchmark index with a new custom proprietary benchmark index and considered that certain changes will be made to the Fund’s principal investment strategy. |
| • | The Board noted that the Fund’s contractual management fee, actual management fee and total expenses were in the 1st quintile of its expense group. |
* * * *
Based upon its review of these various factors, among others, the Board concluded that it is in the best interests of each Fund for the Board to continue the Agreements for an additional year. In reaching this decision, the Board did not assign relative weights to the factors discussed above or deem any one or group of them to be controlling in and of themselves. In connection with their deliberations, the Independent Trustees met separately in executive session on several occasions, with independent legal counsel and the Consultant, to review the relevant materials and consider their responsibilities under relevant laws and regulations.
|
|
84 |
|
THIS PRIVACY POLICY IS NOT PART OF THIS REPORT
CUSTOMER PRIVACY NOTICE
The Hartford Financial Services Group, Inc. and Affiliates*
(herein called “we, our, and us”)
This Privacy Policy applies to our United States Operations
If you have any questions or comments about this privacy notice, please feel free to contact us at The Hartford – Law Department, Privacy Law, One Hartford Plaza, Hartford, CT 06155, or at [email protected].
This Customer Privacy Notice is being provided on behalf of The Hartford Financial Services Group, Inc. and its affiliates (including the following as of March 2019), to the extent required by the Gramm-Leach-Bliley Act and implementing regulations.
1stAGChoice, Inc.; Access CoverageCorp, Inc.; Access CoverageCorp Technologies, Inc.; Business Management Group, Inc.; Cervus Claim Solutions, LLC; First State Insurance Company; FTC Resolution Company LLC; Hart Re Group L.L.C.; Hartford Accident and Indemnity Company; Hartford Administrative Services Company; Hartford Casualty General Agency, Inc.; Hartford Casualty Insurance Company; Hartford Fire General Agency, Inc.; Hartford Fire Insurance Company; Hartford Funds Distributors, LLC; Hartford Funds Management Company, LLC; Hartford Funds Management Group, Inc.; Hartford Group Benefits Holding Company; Hartford Holdings, Inc.; Hartford Insurance Company of Illinois; Hartford Insurance Company of the Midwest; Hartford Insurance Company of the Southeast; Hartford Insurance, Ltd.; Hartford Integrated Technologies, Inc.; Hartford Investment Management Company; Hartford Life and Accident Insurance Company; Hartford Life, Ltd.; Hartford Lloyd’s Corporation; Hartford Lloyd’s Insurance Company; Hartford Management, Ltd.; Hartford of Texas General Agency, Inc.; Hartford Residual Market, L.C.C.; Hartford Specialty Insurance Services of Texas, LLC; Hartford STAG Ventures LLC; Hartford Strategic Investments, LLC; Hartford Underwriters General Agency, Inc.; Hartford Underwriters Insurance Company; Heritage Holdings, Inc.; Heritage Reinsurance Company, Ltd.; HIMCO Distribution Services Company; HLA LLC; HL Investment Advisors, LLC; Horizon Management Group, LLC; HRA Brokerage Services, Inc.; Lattice Strategies LLC; Maxum Casualty Insurance Company; Maxum Indemnity Company; Maxum Specialty Services Corporation; MPC Resolution Company LLC; New England Insurance Company; New England Reinsurance Corporation; New Ocean Insurance Co., Ltd.; Nutmeg Insurance Agency, Inc.; Nutmeg Insurance Company; Pacific Insurance Company, Limited; Property and Casualty Insurance Company of Hartford; Renato Acquisition Co.; Sentinel Insurance Company, Ltd; Trumbull Flood Management, L.L.C.; Trumbull Insurance Company; Twin City Fire Insurance Company; Y-Risk, LLC.
Revised March 2019
This report is submitted for the general information of the shareholders of the Funds referenced in this report. It is not authorized for distribution to persons who are not shareholders of one or more Funds referenced in this report unless preceded or accompanied by a current prospectus for the relevant Funds. Nothing herein contained is to be considered an offer of sale or a solicitation of an offer to buy shares of any Fund listed in this report. Such offering is only made by prospectus, which includes details as to the offering price and other material information.
The information cannot be used or relied upon for the purpose of avoiding IRS penalties. These materials are not intended to provide tax, accounting or legal advice. As with all matters of a tax or legal nature, you should consult your own tax or legal counsel for advice.
Investors should carefully consider a fund’s investment objectives, risks, charges and expenses. This and other important information is contained in the fund’s prospectus and summary prospectus, which can be obtained by visiting hartfordfunds.com. Please read it carefully before investing.
Exchange-traded products are distributed by ALPS Distributors, Inc. (ALPS). Advisory services are provided by Lattice Strategies, LLC (Lattice) and Mellon Investments Corporation. Hartford Funds refers to Hartford Funds Distributors, LLC, Member FINRA, Hartford Funds Management Company, LLC, and Lattice, which are not affiliated with ALPS.
ETFAR-MLT19 11/19 213583 LAT001595_11/2020 Printed in U.S.A.

Item 2. Code of Ethics.
| (a) | The registrant, as of the end of the period covered by this report, has adopted a code of ethics that applies to the registrant’s principal executive officer, principal financial officer, principal accounting officer or controller, or persons performing similar functions, regardless of whether these individuals are employed by the registrant or a third party. |
| (b) | Not applicable. |
| (c) | There have been no amendments to the Registrant’s Code of Ethics during the reporting period for this Form N-CSR. |
| (d) | The registrant has not granted any waivers, including an implicit waiver, from a provision of the code of ethics that applies to the registrant’s principal executive officer, principal financial officer, principal accounting officer or controller, or persons performing similar functions, regardless of whether these individuals are employed by the registrant or a third party, that relates to one or more of the items set forth in paragraph (b) of this item’s instructions. |
| (e) | Not applicable |
| (f) | A copy of the code of ethics is filed herewith. |
Item 3. Audit Committee Financial Expert.
The Board of Trustees of the Registrant (the “Board”) has designated David Sung as an Audit Committee Financial Expert. Mr. Sung is considered by the Board to be an independent trustee.
Item 4. Principal Accountant Fees and Services.
| (a) | Audit Fees: The aggregate fees billed in each of the last two fiscal years for professional services rendered by the principal accountant for the audit of the registrant’s annual financial statements or services that are normally provided by the accountant in connection with statutory and regulatory filings or engagements for those fiscal years were: |
$112,000 for the fiscal year ended September 30, 2018; $112,000 for the fiscal year ended September 30, 2019.
| (b) | Audit Related Fees: The aggregate fees billed in each of the last two fiscal years for assurance and related services by the principal accountant that are reasonably |
| related to the performance of the audit of the registrant’s financial statements and are not reported under paragraph (a) of this Item were: |
$0 for the fiscal year ended September 30, 2018; $0 for the fiscal year ended September 30, 2019. Audit-related services principally in connection with Rule 17Ad-13 under the Securities Exchange Act of 1934.
| (c) | Tax Fees: The aggregate fees billed in each of the last two fiscal years for professional services rendered by the principal accountant for tax compliance, tax advice, and tax planning were: |
$69,713 for the fiscal year ended September 30, 2018; $85,817 for the fiscal year ended September 30, 2019. Tax-related services are principally in connection with, but not limited to, general tax services, excise tax and Passive Foreign Investment Company (PFIC) analysis.
| (d) | All Other Fees: The aggregate fees billed in each of the last two fiscal years for products and services provided by the principal accountant, other than the services reported in paragraphs (a) through (c) of this Item were: |
$0 for the fiscal year ended September 30, 2018; $0 for the fiscal year ended September 30, 2019.
| (e) | Pre-Approval Policies and Procedures |
(1) The Pre-Approval Policies and Procedures (the “Policy”) adopted by the Audit Committee of the Registrant (also, the “Fund”) sets forth the procedures pursuant to which services performed by the independent registered public accounting firm for the Registrant may be pre-approved. The following are some main provisions from the Policy.
| 1. | The Audit Committee must pre-approve all audit services and non-audit services that the independent registered public accounting firm provides to the Fund. |
| 2. | The Audit Committee must pre-approve any engagement of the independent registered public accounting firm to provide non-audit services to any Service Affiliate (which is defined to include any entity controlling, controlled by, or under common control with the investment adviser that provides ongoing services to the Fund) during the period of the independent registered public accounting firm’s engagement to provide audit services to the Fund, if the non-audit services to the Service Affiliate directly impact the Fund’s operations and financial reporting. |
| 3. | The Audit Committee shall pre-approve certain non-audit services to the Fund and its Service Affiliates pursuant to procedures set forth in the Policy. |
| 4. | The Audit Committee, from time to time, may designate one or more of its members who are Independent Trustees (each a “Designated Member”) to consider, on the Audit Committee’s behalf, any non-audit services, whether to the Fund or to any Service Affiliate, that have not been pre-approved by the Audit Committee. The Designated Member also shall review, on the |
| Audit Committee’s behalf, any proposed material change in the nature or extent of any non-audit services previously approved. In considering any requested non-audit services or proposed material change in such services, the Designated Member shall not authorize services which would exceed $50,000 in fees for such services. |
| 5. | The independent registered public accounting firm may not provide specified prohibited non-audit services set forth in the Policy to the Fund, the Fund’s investment adviser, the Service Affiliates or any other member of the investment company complex. |
(2) There were no pre-approval requirements waived for the services provided to the Registrant described in paragraphs (b)-(d) of Item 4 by the Audit Committee pursuant to paragraph (c)(7)(i)(C) of Rule 2-01 of Regulation S-X (the “De Minimis Rule”). There were no fees billed for services provided to the Adviser described in paragraphs (b)-(d) of Item 4 that were required to be pre-approved by the Audit Committee as described in paragraph (e)(1) of Item 4.
| (f) | None of the hours expended on the principal accountant’s engagement to audit the registrant’s financial statements for the year ended September 30, 2019, were attributed to work performed by persons other than the principal accountant’s full-time, permanent employees. |
| (g) | For the fiscal year ended September 30, 2019, the aggregate non-audit fees billed by the Registrant’s accountant for services rendered to the Registrant, and rendered to the Registrant’s Adviser (not including any sub-adviser whose role is primarily portfolio management and is subcontracted with or overseen by another investment adviser), and any entity controlling, controlled by, or under common control with the Adviser that provided ongoing services to the Registrant for each of the last two fiscal years of the Registrant were: |
Non-Audit fees: $69,713 for the fiscal year ended September 30, 2018; $85,817 for the fiscal year ended September 30, 2019.
| (h) | The registrant’s audit committee of the board of trustees has considered whether the provision of non-audit services that were rendered to the Registrant’s investment adviser (not including any sub-adviser whose role is primarily portfolio management and is subcontracted with or overseen by another investment adviser), and any entity controlling, controlled by, or under common control with the investment adviser that provides ongoing services to the registrant that were not pre-approved pursuant to paragraph (c)(7)(ii) of Rule 2-01 of Regulation S-X is compatible with maintaining the principal accountant’s independence. |
Item 5. Audit Committee of Listed Registrants.
| (a) | The Registrant has an audit committee that was established by the Board of Trustees of the Registrant in accordance with Section 3(a)(58)(A) of the Securities Exchange Act of 1934, as amended. The members of the Registrant’s Audit Committee are Hilary E. Ackermann, Lynn S. Birdsong and David Sung. |
| (b) | Not applicable. |
Item 6. Investments.
| (a) | The Schedule of Investments in securities of unaffiliated issuers as of the close of the reporting period is included as part of the annual report to shareholders filed under Item 1 of this Form. |
| (b) | Not applicable. |
Item 7. Disclosure of Proxy Voting Policies and Procedures for Closed-End Management Investment Companies.
Not applicable.
Item 8. Portfolio Managers of Closed-End Management Investment Companies.
Not applicable.
Item 9. Purchases of Equity Securities by Closed-End Management Investment Company and Affiliated Purchasers.
Not applicable.
Item 10. Submission of Matters to a Vote of Security Holders.
There have been no material changes to the procedures by which shareholders may recommend nominees to the registrant’s board of trustees during the period covered by this report.
Item 11. Controls and Procedures.
| (a) | The registrant’s principal executive and principal financial officers, or persons performing similar functions, have concluded that the registrant’s disclosure controls and procedures (as defined in Rule 30a-3(c) under the Investment Company Act of 1940, as amended (the “1940 Act”) (17 CFR 270.30a-3(c))) are generally effective to provide reasonable assurance, as of a date within 90 days of the filing date of the report that includes the disclosure required by this paragraph, based on their evaluation of these controls and procedures required by Rule 30a-3(b) under the 1940 Act (17 CFR 270.30a-3(b)) and Rules 13a-15(b) or 15d-15(b) under the Securities Exchange Act of 1934, as amended (17 CFR 240.13a-15(b) or 240.15d-15(b)). |
| (b) | There were no changes in the registrant’s internal control over financial reporting (as defined in Rule 30a-3(d) under the 1940 Act (17 CFR 270.30a-3(d)) that occurred during the period covered by this report that have materially affected, or are reasonably likely to materially affect, the registrant’s internal control over financial reporting. |
Item 12. Disclosure of Securities Lending Activities for Closed-End Management Investment Companies
Not applicable.
Item 13. Exhibits.
| (a)(1) | Code of Ethics referred to in Item 2 is attached. | |
| (a)(2) | Separate certifications for each principal executive officer and principal financial officer of the registrant as required by Rule 30a-2(a) under the 1940 Act (17 CFR 270.30a-2(a)) and Section 302 of the Sarbanes-Oxley Act of 2002 are attached hereto. | |
| (a)(3) | Not applicable. | |
| (a)(4) | Change in Registrant’s Independent Public Accountant | |
| (b) | Certifications pursuant to Rule 30a-2(b) under the 1940 Act and Section 906 of the Sarbanes-Oxley Act of 2002 are attached hereto. |
SIGNATURES
Pursuant to the requirements of the Securities Exchange Act of 1934 and the Investment Company Act of 1940, the registrant has duly caused this report to be signed on its behalf by the undersigned, thereunto duly authorized.
| LATTICE STRATEGIES TRUST | ||||
| Date: December 6, 2019 | By: | /s/ James E. Davey | ||
| James E. Davey | ||||
| President and | ||||
| Chief Executive Officer | ||||
Pursuant to the requirements of the Securities Exchange Act of 1934 and the Investment Company Act of 1940, this report has been signed below by the following persons on behalf of the registrant and in the capacities and on the dates indicated.
| Date: December 6, 2019 | By: | /s/ James E. Davey | ||
| James E. Davey | ||||
| President and | ||||
| Chief Executive Officer | ||||
| Date: December 6, 2019 | By: | /s/ Amy N. Furlong | ||
| Amy N. Furlong | ||||
| Treasurer (Principal Financial Officer and | ||||
| Principal Accounting Officer) | ||||
THE HARTFORD MUTUAL FUNDS, INC.
THE HARTFORD MUTUAL FUNDS II, INC.
HARTFORD SERIES FUND, INC.
HARTFORD HLS SERIES FUND II, INC.
HARTFORD FUNDS MASTER FUND
HARTFORD FUNDS NEXTSHARES TRUST
HARTFORD FUNDS EXCHANGE-TRADED TRUST
LATTICE STRATEGIES TRUST
SARBANES-OXLEY CODE OF ETHICS FOR SENIOR OFFICERS
| I. | Introduction |
The Boards of Directors of The Hartford Mutual Funds, Inc., The Hartford Mutual Funds II, Inc., Hartford Series Fund, Inc., Hartford HLS Series Fund II, Inc., Hartford Funds Master Fund, Hartford Funds Exchange-Traded Trust, Hartford Funds NextShares Trust and Lattice Strategies Trust (each, a “Fund”) have established this Code of Ethics (“Code”) in accordance with Section 406 of the Sarbanes-Oxley Act of 2002. This Code does not supersede or otherwise affect the separate code of ethics that the Fund has adopted pursuant to Rule 17j-1 under the Investment Company Act of 1940, as amended (the “Investment Company Act”).
| II. | Covered Officers/Purpose of Code |
This Code applies to each Fund’s Chief Executive Officer and Treasurer (collectively, the “Covered Officers”) for the purpose of promoting:
| • | honest and ethical conduct, including the ethical handling of actual or apparent conflicts of interest between personal and professional relationships; |
| • | full, fair, accurate, timely and understandable disclosure in reports and documents that the Fund files with, or submits to, the Securities and Exchange Commission (“SEC”) and in other public communications made by the Fund; |
| • | compliance with applicable laws and governmental rules and regulations; |
| • | the prompt internal reporting of violations of this Code to an appropriate person or persons identified herein; and |
| • | accountability for adherence to this Code. |
Each Covered Officer owes a duty to the Funds to adhere to a high standard of business ethics, and should be sensitive to situations that may give rise to actual as well as apparent conflicts of interest. Each Covered Officer should encourage his or her colleagues who provide services to the Funds, whether directly or indirectly, to do the same.
For purposes of this Code, the Compliance Officer is the Fund’s Chief Compliance Officer or his or her delegate.
| III. | Covered Officers Should Handle Ethically Actual and Apparent Conflicts of Interest |
A “conflict of interest” occurs when a Covered Officer’s private interest interferes with the interests of, or his or her service to, a Fund. For example, a conflict of interest would arise if a Covered Officer, or a member of his or her family, receives improper personal benefits as a result of his or her position with the Fund.
Certain conflicts of interest covered by this Code arise out of the relationships between Covered Officers and a Fund and already are subject to conflict of interest provisions in the Investment Company Act and the Investment Advisers Act of 1940, as amended (the “Investment Advisers Act”). For example, Covered Officers may not individually engage in certain transactions (such as the purchase or sale of securities or other property) with the Fund. The compliance programs and procedures of the Funds and their investment adviser and distributor are designed to prevent, or identify and correct, violations of these provisions. This Code does not, and is not intended to, repeat or replace these programs and procedures.
Although typically not presenting an opportunity for improper personal benefit, conflicts arise from, or as a result of, the contractual relationship between the Funds and their investment adviser and distributor, or affiliates of the investment adviser and distributor (together, the “Service Providers”), of which the Covered Officers are also officers or employees. As a result, this Code recognizes that the Covered Officers will, in the normal course of their duties, be involved in establishing policies and implementing decisions which will have different effects on the investment adviser, the distributor, Service Providers and the Funds. The participation of the Covered Officers in such activities is inherent in these contractual relationships and is consistent with the performance by the Covered Officers of their duties as officers of the Funds and, if addressed in conformity with the provisions of the Investment Company Act and the Investment Advisers Act, will be deemed to have been handled ethically.
Other conflicts of interest are covered by this Code, even if such conflicts of interest are not subject to provisions in the Investment Company Act and the Investment Advisers Act. Covered Officers should keep in mind that the following list of prohibitions does not cover every possible situation. The overarching principle – that the personal interest of a Covered Officer should not be placed improperly before the interest of the Funds– should be the guiding principle in all circumstances.
Each Covered Officer must:
| • | not use his or her personal influence or personal relationships improperly to influence investment decisions or financial reporting by the Funds whereby the Covered Officer would benefit personally to the detriment of the Funds; |
| • | not cause the Funds to take action, or fail to take action, for the individual personal benefit of the Covered Officer rather than the benefit of the Funds; and |
| • | not use material non-public knowledge of portfolio transactions made or contemplated for the Funds to profit personally or cause others to profit, by the market effect of such transactions. |
There are some conflict of interest situations that should be discussed with the Compliance Officer of a Fund if material. Examples of these include:
| • | any outside business activity that detracts from the ability of a Covered Officer to devote appropriate time and attention to his or her responsibilities as a Covered Officer of the Fund; |
| • | the receipt of any non-nominal gifts related to the business of the Fund that may be inconsistent with any policy on gifts established by the Fund’s investment adviser and distributor from time to time; and |
| • | a direct or indirect personal financial interest in commissions, transaction charges or spreads paid by the Fund for effecting portfolio transactions or for selling or redeeming shares other than an interest arising from the Covered Officer’s employment, such as compensation or equity ownership. |
| IV. | Disclosure and Compliance |
Each Covered Officer:
| • | must familiarize himself or herself with the disclosure requirements applicable to a Fund and its disclosure controls and procedures; |
2
| • | must not knowingly misrepresent, or cause others to misrepresent, facts about the Fund to others, whether within or outside the Fund, including to the Fund’s directors and independent accountants, and to governmental regulators and self-regulatory organizations; |
| • | should, to the extent appropriate within his or her area of responsibility, consult with other officers and employees of the Fund and its investment adviser and distributor and take other appropriate steps with the goal of promoting full, fair, accurate and timely disclosure in the reports and documents the Fund files with, or submits to, the SEC and that are signed or certified by him or her; |
| • | must cooperate with the Fund’s independent accountants, regulatory agencies and internal auditors in their review or inspection of the Fund and its operations; and |
| • | comply with all laws, rules, and regulations applicable to the Fund’s operations and business. |
| V. | Confidentiality |
Covered Officers must maintain the confidentiality of information entrusted to them by the Fund, except when disclosure is authorized by Fund counsel or required by laws or regulations. Whenever possible, Covered Officers should consult with Fund counsel if they believe they have a legal obligation to disclose confidential information. Confidential information includes all non-public information that might be of use to competitors, or harmful to the Fund or its shareholders, if disclosed. The obligation to preserve confidential information continues even after employment as a Covered Officer ends.
| VI. | Reporting and Accountability |
Each Covered Officer must:
| • | upon adoption of this Code (or upon becoming a Covered Officer), affirm in writing that he or she has received and read this Code, and understands it (Appendix A); |
| • | annually thereafter affirm that he or she has complied with the requirements of this Code (Appendix A); |
| • | not retaliate against any person for reports of potential violations that are made in good faith; and |
| • | notify the Compliance Officer promptly if he or she knows of any violation of this Code. Failure to do so is itself a violation of this Code. |
The Compliance Officer is responsible for applying this Code to specific situations in which questions are presented under it and has the authority to interpret this Code in any particular situation.
| VII. | Investigations, Enforcements and Waivers |
The Funds will follow these procedures in investigating and enforcing this Code:
| • | the Compliance Officer will take all appropriate action to investigate any violations and potential violations reported to him or her; |
| • | if, after such investigation, the Compliance Officer believes that no violation has occurred, the Compliance Officer is not required to take any further action; |
| • | any matter that the Compliance Officer believes is a violation will be reported to the Board of Directors of the Fund, or, if applicable Compliance Committee after such investigation; |
| • | if the Board determines that a violation has occurred, it will consider appropriate action, which may, without limitation, include review of, and appropriate modifications to, applicable policies and procedures; or notification to appropriate personnel of the investment adviser, distributor or their respective boards; |
| • | the Board will be responsible for granting waivers, as appropriate; and |
3
| • | any changes to or waivers of this Code will, to the extent required, be disclosed as provided by SEC rules. |
| VIII. | Recordkeeping |
General. The Fund requires accurate recording and reporting of information in order to make responsible business decisions. All of the Fund’s books, records, accounts and financial statements must be maintained in reasonable detail, must appropriately reflect the Fund’s transactions and must conform both to applicable legal requirements and to the Fund’s system of internal controls.
Code Records. A copy of this Code, any amendments hereto, and any reports or other records created in relation to waivers of or amendments to provisions of this Code shall be kept as records of the Fund for six years from the end of the fiscal year in which such document was created. Such records shall be furnished to the SEC or its staff upon request.
| IX. | Amendments to the Code |
The Covered Officers and the Compliance Officer are encouraged to recommend improvements to this Code to the Board, and the Board may amend the Code in its discretion. In connection with any amendment to the Code, the Compliance Officer shall prepare a brief description of the amendment to the Board.
| X. | Confidentiality |
All reports and records prepared or maintained pursuant to this Code will be considered confidential and will be maintained and protected accordingly. Except as otherwise required by law or this Code, such matters will not be disclosed to anyone other than the Board, the Funds’ investment adviser and distributor, and their respective counsel.
| XI. | Internal Use |
This Code is intended solely for the internal use by the Funds. This Code is a statement of certain fundamental principles, policies and procedures that govern the Covered Officers in the conduct of the Funds’ business. It is not intended to and does not create any rights in any employee, investor, supplier, competitor, shareholder or any other person.
Adopted: May 13, 2003
Revision History
May 3, 2016
November 7, 2017
4
Appendix A
Sarbanes-Oxley Code of Ethics for Senior Officers
Initial and Annual Certification of Compliance
Name (please print)
This is to certify that I have received a copy the Sarbanes-Oxley Code of Ethics for Senior Officers for The Hartford Mutual Funds, Inc., Hartford Mutual Funds II, Inc., Hartford Series Fund, Inc., Hartford HLS Series Fund II, Inc., Hartford Funds Master Fund, Hartford Funds Exchange-Traded Trust, Hartford Funds NextShares Trust and Lattice Strategies Trust.
I have read and understand the Code. Moreover, I agree to promptly report to the Chief Compliance Officer any violation or possible violation of this Code of which I become aware.
Check one:
Initial
[ ] I further certify that I am subject to the Code and will comply with each of the Code’s provisions to which I am subject.
Annual
[ ] I further certify that I have complied with and will continue to comply with each of the provisions of the Code to which I am subject.
Signature
Date
5
CERTIFICATION
I, James E. Davey, certify that:
| 1. | I have reviewed this report on Form N-CSR of the Lattice Strategies Trust (File Number 811-23002, CIK Number 0001605803); |
| 2. | Based on my knowledge, this report does not contain any untrue statement of a material fact or omit to state a material fact necessary to make the statements made, in light of the circumstances under which such statements were made, not misleading with respect to the period covered by this report; |
| 3. | Based on my knowledge, the financial statements, and other financial information included in this report, fairly present in all material respects the financial condition, results of operations, changes in net assets, and cash flows (if the financial statements are required to include a statement of cash flows) of the registrant as of, and for, the periods presented in this report; |
| 4. | The registrant’s other certifying officer(s) and I are responsible for establishing and maintaining disclosure controls and procedures (as defined in Rule 30a-3(c) under the Investment Company Act of 1940) and internal control over financial reporting (as defined in Rule 30a-3(d) under the Investment Company Act of 1940) for the registrant and have: |
| (a) | Designed such disclosure controls and procedures, or caused such disclosure controls and procedures to be designed under our supervision, to ensure that material information relating to the registrant, including its consolidated subsidiaries, is made known to us by others within those entities, particularly during the period in which this report is being prepared; |
| (b) | Designed such internal control over financial reporting, or caused such internal control over financial reporting to be designed under our supervision, to provide reasonable assurance regarding the reliability of financial reporting and the preparation of financial statements for external purposes in accordance with generally accepted accounting principles; |
| (c) | Evaluated the effectiveness of the registrant’s disclosure controls and procedures and presented in this report our conclusions about the effectiveness of the disclosure controls and procedures, as of a date within 90 days prior to the filing date of this report based on such evaluation; and |
| (d) | Disclosed in this report any change in the registrant’s internal control over financial reporting that occurred during the period covered by this report that has materially affected, or is reasonably likely to materially affect, the registrant’s internal control over financial reporting; and |
| 5. | The registrant’s other certifying officer(s) and I have disclosed to the registrant’s auditors and the audit committee of the registrant’s board of trustees (or persons performing the equivalent functions): |
| (a) | All significant deficiencies and material weaknesses in the design or operation of internal control over financial reporting which are reasonably likely to adversely affect the registrant’s ability to record, process, summarize, and report financial information; and |
| (b) | Any fraud, whether or not material, that involves management or other employees who have a significant role in the registrant’s internal control over financial reporting. |
Date: December 6, 2019
| /s/ James E. Davey |
| James E. Davey |
| President and |
| Chief Executive Officer |
CERTIFICATION
I, Amy N. Furlong, certify that:
| 1. | I have reviewed this report on Form N-CSR of the Lattice Strategies Trust (File Number 811-23002, CIK Number 0001605803); |
| 2. | Based on my knowledge, this report does not contain any untrue statement of a material fact or omit to state a material fact necessary to make the statements made, in light of the circumstances under which such statements were made, not misleading with respect to the period covered by this report; |
| 3. | Based on my knowledge, the financial statements, and other financial information included in this report, fairly present in all material respects the financial condition, results of operations, changes in net assets, and cash flows (if the financial statements are required to include a statement of cash flows) of the registrant as of, and for, the periods presented in this report; |
| 4. | The registrant’s other certifying officer(s) and I are responsible for establishing and maintaining disclosure controls and procedures (as defined in Rule 30a-3(c) under the Investment Company Act of 1940) and internal control over financial reporting (as defined in Rule 30a-3(d) under the Investment Company Act of 1940) for the registrant and have: |
| (a) | Designed such disclosure controls and procedures, or caused such disclosure controls and procedures to be designed under our supervision, to ensure that material information relating to the registrant, including its consolidated subsidiaries, is made known to us by others within those entities, particularly during the period in which this report is being prepared; |
| (b) | Designed such internal control over financial reporting, or caused such internal control over financial reporting to be designed under our supervision, to provide reasonable assurance regarding the reliability of financial reporting and the preparation of financial statements for external purposes in accordance with generally accepted accounting principles; |
| (c) | Evaluated the effectiveness of the registrant’s disclosure controls and procedures and presented in this report our conclusions about the effectiveness of the disclosure controls and procedures, as of a date within 90 days prior to the filing date of this report based on such evaluation; and |
| (d) | Disclosed in this report any change in the registrant’s internal control over financial reporting that occurred during the period covered by this report that has materially affected, or is reasonably likely to materially affect, the registrant’s internal control over financial reporting; and |
| 5. | The registrant’s other certifying officer(s) and I have disclosed to the registrant’s auditors and the audit committee of the registrant’s board of trustees (or persons performing the equivalent functions): |
| (a) | All significant deficiencies and material weaknesses in the design or operation of internal control over financial reporting which are reasonably likely to adversely affect the registrant’s ability to record, process, summarize, and report financial information; and |
| (b) | Any fraud, whether or not material, that involves management or other employees who have a significant role in the registrant’s internal control over financial reporting. |
Date: December 6, 2019
| /s/ Amy N. Furlong |
| Amy N. Furlong |
| Treasurer (Principal Financial Officer and Principal Accounting Officer) |
Exhibit 13(a)(4)(i) to Form N-CSR
Change in Registrant’s Independent Public Accountant
On November 6, 2019, Lattice Strategies Trust (the “Funds”) dismissed Ernst and Young LLP (“EY”) as the Funds’ independent registered public accounting firm effective upon the issuance of EY’s report on the Funds’ financial statements as of and for the fiscal year ended September 30, 2019. EY’s report on the Funds’ financial statements for the fiscal period ended September 30, 2019 contained no adverse opinion or disclaimer of opinion nor was EY’s report qualified or modified as to uncertainty, audit scope or accounting principles. During the Funds’ fiscal period ended on September 30, 2019, and through November 26, 2019 (the “Covered Period”), (i) there were no disagreements with EY on any matter of accounting principles or practices, financial statement disclosure or auditing scope or procedure, which disagreements, if not resolved to the satisfaction of EY, would have caused them to make reference to the subject matter of the disagreements in connection with their reports on the Funds’ financial statements for the Covered Period, and (ii) there were no “reportable events” of the kind described in Item 304(a)(1)(v) of Regulation S-K under the Securities Exchange Act of 1934, as amended.
The Audit Committee of the Trust’s Board of Trustees participated in and approved the decision to engage PricewaterhouseCoopers LLP (“PwC”) as the independent registered public accounting firm for the fiscal year ended September 30, 2020. The selection of PwC does not reflect any disagreements with or dissatisfaction by the Trust or the Board of Trustees with the performance of the Funds’ prior independent registered public accounting firm, EY. During the Funds’ fiscal period ended September 30, 2019, neither the Funds, nor anyone on their behalf, consulted with PwC on items which: (i) concerned the application of accounting principles to a specified transaction, either completed or proposed, or the type of audit opinion that might be rendered on the Funds’ financial statements; or (ii) concerned the subject of a disagreement (as defined in paragraph (a)(1)(iv) of Item 304 of Regulation S-K) or reportable events (as described in paragraph (a)(1)(v) of Item 304 of Regulation S-K).
The Trust requested EY to furnish it with a letter address to the Securities and Exchange Commission stating whether EY agrees with the statements contained above. A copy of that letter is attached hereto as Exhibit 13(a)(4)(ii).
December 6, 2019
Securities and Exchange Commission
100 F Street, N.E.
Washington, DC 20549
Ladies and Gentlemen:
We have read Exhibit 13(a)(4)(i) of Form N-CSR, dated December 6, 2019, of Lattice Strategies Trust and are in agreement with the statements contained in the first three sentences of the first paragraph in Exhibit 13(a)(4)(i) therein. We have no basis to agree or disagree with other statements of the registrant contained therein.
/s/ Ernst & Young LLP
CERTIFICATION
Pursuant to Section 906 of the Sarbanes-Oxley Act of 2002
Pursuant to Section 906 of the Sarbanes-Oxley Act of 2002 (subsections (a) and (b) of section 1350, chapter 63 of title 18, United States Code), each of the undersigned officers of the Lattice Strategies Trust (the “Registrant”) does hereby certify, to such officer’s knowledge, that:
The annual report on Form N-CSR of the Registrant for the period ended September 30, 2019 (the “Form N-CSR”) fully complies with the requirements of Section 13(a) or 15(d) of the Securities Exchange Act of 1934 and information contained in the Form N-CSR fairly presents, in all material respects, the financial condition and results of operations of the Registrant.
| Date: December 6, 2019 | By: | /s/ James E. Davey | ||
| James E. Davey | ||||
| President and | ||||
| Chief Executive Officer | ||||
| Date: December 6, 2019 | By: | /s/ Amy N. Furlong | ||
| Amy N. Furlong | ||||
| Treasurer (Principal Financial Officer and | ||||
| Principal Accounting Officer) | ||||
This certification is being furnished to the Securities and Exchange Commission pursuant to Rule 30a-2(b) under the Investment Company Act of 1940, as amended, and 18 U.S.C. Section 1350 and is not being filed as part of the Report with the Securities and Exchange Commission.
Serious News for Serious Traders! Try StreetInsider.com Premium Free!
You May Also Be Interested In
- Activision Blizzard, Inc. Notice of June 30, 2026 Application Deadline for Class Action Lawsuit - Contact Lewis Kahn, Esq. at Kahn Swick & Foti, LLC, Before Application Deadline
- Navigator Announces Shares for Debt Transaction
- 2026 Ningbo City Image Exhibition·France Screening Concludes Successfully in Paris
Create E-mail Alert Related Categories
SEC FilingsSign up for StreetInsider Free!
Receive full access to all new and archived articles, unlimited portfolio tracking, e-mail alerts, custom newswires and RSS feeds - and more!