Form N-CSR John Hancock Funds II For: Jul 31

September 26, 2024 2:26 PM EDT
UNITED STATES
SECURITIES AND EXCHANGE COMMISSION
Washington, D.C. 20549

FORM N-CSR

CERTIFIED SHAREHOLDER REPORT OF REGISTERED MANAGEMENT INVESTMENT COMPANIES
Investment Company Act file number
811-21779
JOHN HANCOCK FUNDS II
(Exact name of registrant as specified in charter)

200 BERKELEY STREET, BOSTON, MA 02116
(Address of principal executive offices) (Zip code)
SALVATORE SCHIAVONE
TREASURER
200 BERKELEY STREET
BOSTON, MA 02116
(Name and address of agent for service)
Registrant's telephone number, including area code:
(617) 543-9634
Date of fiscal year end:
July 31
Date of reporting period:
July 31, 2024
ITEM 1. REPORTS TO STOCKHOLDERS
The Registrant prepared the following annual reports to shareholders for the period ended July 31, 2024:
John Hancock Funds II
  • John Hancock Fundamental All Cap Core Fund
  • John Hancock Multi-Asset Absolute Return Fund
TSR JHIM logo
John Hancock Multi-Asset Absolute Return Fund
Class A/JHAAX
Annual SHAREHOLDER REPORT | July 31, 2024
This annual shareholder report contains important information about the John Hancock Multi-Asset Absolute Return Fund (the fund) for the period of August 1, 2023 to July 31, 2024. You can find additional information about the fund at jhinvestments.com/documents. You can also request this information by contacting us at 800-225-5291.
What were the fund costs during the last year?
(Based on a hypothetical $10,000 investment)
Fund (Class) Costs of a $10,000 investment Costs paid as a percentage
of a $10,000 investment
Multi-Asset Absolute Return Fund
(Class A/JHAAX)
$164 1.61%
Management’s Discussion of Fund Performance

SUMMARY OF RESULTS
Multi-Asset Absolute Return Fund (Class A/JHAAX) returned 3.18% (excluding sales charges) for the year ended July 31, 2024. The most significant factors affecting fund performance during the period included a meaningful rally in global equity markets, led primarily by growth-oriented stocks in developed markets, and a shift from interest-rate increases to easier monetary policy by many of the world’s central banks—with notable exceptions in the U.S. and Japan.

TOP PERFORMANCE CONTRIBUTORS
Developed market stocks | Equities in developed countries were among the best performers, adding to the fund's performance.
Cash | A small cash and cash-equivalents position provided a noteworthy level of interest income.
Credit-related bonds | Selected, tactical positions in credit contributed modestly to performance.


TOP PERFORMANCE DETRACTORS
Defensive equity strategy | This strategy, which includes long positions in lower-risk stocks and short positions in broad equity indexes, detracted from performance as lower-risk stocks underperformed the broader market.
Foreign currency exposure | The fund’s defensive long/short positions in high-quality foreign currencies were a drag on performance, due in large part to the Japanese yen’s depreciation against most major currencies.
The views expressed in this report are exclusively those of the portfolio management team at Nordea Investment Management North America, Inc., and are subject to change. They are not meant as investment advice.
Fund Performance
The following graph compares the initial and subsequent account values at the end of each of the most recently completed 10 fiscal years of the fund (or for the life of the fund, if shorter). It assumes a $10,000 initial investment in the fund and in an appropriate, broad-based securities market index for the same period.
GROWTH OF $10,000
Fund Performance - Growth of 10K
AVERAGE ANNUAL TOTAL RETURN 1 Year 5 Years 10 Years
Multi-Asset Absolute Return Fund (Class A/JHAAX) (1.95)% 2.01% 1.47%
Multi-Asset Absolute Return Fund (Class A/JHAAX)—excluding sales charge 3.18%) 3.05% 1.99%
Bloomberg U.S. Aggregate Bond Index 5.10%) 0.19% 1.61%
ICE BofA 0-3 Month U.S. Treasury Bill Index 5.50%) 2.22% 1.54%
70% Bloomberg Global Aggregate Bond USD Hedged Index / 30% MSCI All Country World Index 9.43%) 3.79% 4.32%
 
The Fund has designated Bloomberg U.S. Aggregate Bond Index as its broad-based securities market index in accordance with the revised definition for such an index.
Performance figures assume all distributions have been reinvested and reflect the beneficial effect of any expense reductions. Figures reflect maximum sales charge on Class A shares of 5.00%. Past performance does not guarantee future results. The return and principal value of an investment will fluctuate so that shares, when redeemed, may be worth more or less than their original cost. Due to market volatility and other factors, the fund’s current performance may be higher or lower than the performance shown and can be found at jhinvestments.com/investments or by calling 800-225-5291. The graph and table do not reflect the deduction of taxes that a shareholder would pay on fund distributions or redemption of fund shares. It is not possible to invest directly in an index.
Fund Statistics
Fund net assets $332,854,409%
Total number of portfolio holdings $341%
Total advisory fees paid (net) $3,836,333%
Portfolio turnover rate $47%
Graphical Representation of Holdings
The tables below show the investment makeup of the fund, representing percentage of the total net assets of the fund.
Portfolio Composition
Common stocks 88.5%
Information technology 16.6%
Consumer staples 14.5%
Health care 14.2%
Consumer discretionary 12.4%
Financials 11.2%
Communication services 9.4%
Industrials 6.8%
Utilities 2.7%
Materials 0.6%
Real estate 0.1%
Corporate bonds 3.4%
U.S. Government 2.9%
Other assets and liabilities, net 5.2%
Country Composition
United States 76.0%
Denmark 4.5%
United Kingdom 2.9%
France 2.5%
Ireland 1.9%
Taiwan 1.7%
China 1.7%
Germany 1.5%
South Korea 1.4%
Japan 1.3%
Other countries 4.6%
Holdings may not have been held by the fund for the entire period and are subject to change without notice. Portfolio composition is subject to review in accordance with the fund’s investment strategy and may vary in the future. Current and future portfolio holdings are subject to risk and may change at any time.
The fund is subject to various risks as described in the fund's prospectuses. For more information, please refer to the "Principal risks" section of the prospectuses.
Availability of Additional Information
TSR QR Code
At jhinvestments.com/documents, you can find additional information about the fund, including the fund’s:
  • Prospectus
  • Financial information
  • Fund holdings
  • Proxy voting information
You can also request this information by contacting us at 800-225-5291.
This report is for the information of the shareholders in this fund. It is not authorized for distribution to prospective investors unless preceded or accompanied by the fund's prospectus.
John Hancock Investment Management Distributors LLC, Member FINRA, SIPC 200 Berkeley Street, Boston, MA 02116-5010, 800-225-5291, jhinvestments.com
Manulife, Manulife Investment Management, Stylized M Design, and Manulife Investment Management & Stylized M Design are trademarks of The Manufacturers Life Insurance Company and are used by it, and by its affiliates under license.
NOT FDIC INSURED. MAY LOSE VALUE. NO BANK GUARANTEE. NOT INSURED BY ANY GOVERNMENT AGENCY.
TSR MIM Logo
MF3743813
395A-A
7/24
9/24
TSR JHIM logo
John Hancock Multi-Asset Absolute Return Fund
Class C/JHACX
Annual SHAREHOLDER REPORT | July 31, 2024
This annual shareholder report contains important information about the John Hancock Multi-Asset Absolute Return Fund (the fund) for the period of August 1, 2023 to July 31, 2024. You can find additional information about the fund at jhinvestments.com/documents. You can also request this information by contacting us at 800-225-5291.
What were the fund costs during the last year?
(Based on a hypothetical $10,000 investment)
Fund (Class) Costs of a $10,000 investment Costs paid as a percentage
of a $10,000 investment
Multi-Asset Absolute Return Fund
(Class C/JHACX)
$234 2.31%
Management’s Discussion of Fund Performance

SUMMARY OF RESULTS
Multi-Asset Absolute Return Fund (Class C/JHACX) returned 2.45% (excluding sales charges) for the year ended July 31, 2024. The most significant factors affecting fund performance during the period included a meaningful rally in global equity markets, led primarily by growth-oriented stocks in developed markets, and a shift from interest-rate increases to easier monetary policy by many of the world’s central banks—with notable exceptions in the U.S. and Japan.

TOP PERFORMANCE CONTRIBUTORS
Developed market stocks | Equities in developed countries were among the best performers, adding to the fund's performance.
Cash | A small cash and cash-equivalents position provided a noteworthy level of interest income.
Credit-related bonds | Selected, tactical positions in credit contributed modestly to performance.


TOP PERFORMANCE DETRACTORS
Defensive equity strategy | This strategy, which includes long positions in lower-risk stocks and short positions in broad equity indexes, detracted from performance as lower-risk stocks underperformed the broader market.
Foreign currency exposure | The fund’s defensive long/short positions in high-quality foreign currencies were a drag on performance, due in large part to the Japanese yen’s depreciation against most major currencies.
The views expressed in this report are exclusively those of the portfolio management team at Nordea Investment Management North America, Inc., and are subject to change. They are not meant as investment advice.
Fund Performance
The following graph compares the initial and subsequent account values at the end of each of the most recently completed 10 fiscal years of the fund (or for the life of the fund, if shorter). It assumes a $10,000 initial investment in the fund and in an appropriate, broad-based securities market index for the same period.
GROWTH OF $10,000
Fund Performance - Growth of 10K
AVERAGE ANNUAL TOTAL RETURN 1 Year 5 Years 10 Years
Multi-Asset Absolute Return Fund (Class C/JHACX) 1.45% 2.33% 1.29%
Multi-Asset Absolute Return Fund (Class C/JHACX)—excluding sales charge 2.45% 2.33% 1.29%
Bloomberg U.S. Aggregate Bond Index 5.10% 0.19% 1.61%
ICE BofA 0-3 Month U.S. Treasury Bill Index 5.50% 2.22% 1.54%
70% Bloomberg Global Aggregate Bond USD Hedged Index / 30% MSCI All Country World Index 9.43% 3.79% 4.32%
 
The Fund has designated Bloomberg U.S. Aggregate Bond Index as its broad-based securities market index in accordance with the revised definition for such an index.
Performance figures assume all distributions have been reinvested and reflect the beneficial effect of any expense reductions. Class C shares sold within one year of purchase are subject to a 1.00% contingent deferred sales charge. Past performance does not guarantee future results. The return and principal value of an investment will fluctuate so that shares, when redeemed, may be worth more or less than their original cost. Due to market volatility and other factors, the fund’s current performance may be higher or lower than the performance shown and can be found at jhinvestments.com/investments or by calling 800-225-5291. The graph and table do not reflect the deduction of taxes that a shareholder would pay on fund distributions or redemption of fund shares. It is not possible to invest directly in an index.
Fund Statistics
Fund net assets $332,854,409%
Total number of portfolio holdings $341%
Total advisory fees paid (net) $3,836,333%
Portfolio turnover rate $47%
Graphical Representation of Holdings
The tables below show the investment makeup of the fund, representing percentage of the total net assets of the fund.
Portfolio Composition
Common stocks 88.5%
Information technology 16.6%
Consumer staples 14.5%
Health care 14.2%
Consumer discretionary 12.4%
Financials 11.2%
Communication services 9.4%
Industrials 6.8%
Utilities 2.7%
Materials 0.6%
Real estate 0.1%
Corporate bonds 3.4%
U.S. Government 2.9%
Other assets and liabilities, net 5.2%
Country Composition
United States 76.0%
Denmark 4.5%
United Kingdom 2.9%
France 2.5%
Ireland 1.9%
Taiwan 1.7%
China 1.7%
Germany 1.5%
South Korea 1.4%
Japan 1.3%
Other countries 4.6%
Holdings may not have been held by the fund for the entire period and are subject to change without notice. Portfolio composition is subject to review in accordance with the fund’s investment strategy and may vary in the future. Current and future portfolio holdings are subject to risk and may change at any time.
The fund is subject to various risks as described in the fund's prospectuses. For more information, please refer to the "Principal risks" section of the prospectuses.
Availability of Additional Information
TSR QR Code
At jhinvestments.com/documents, you can find additional information about the fund, including the fund’s:
  • Prospectus
  • Financial information
  • Fund holdings
  • Proxy voting information
You can also request this information by contacting us at 800-225-5291.
This report is for the information of the shareholders in this fund. It is not authorized for distribution to prospective investors unless preceded or accompanied by the fund's prospectus.
John Hancock Investment Management Distributors LLC, Member FINRA, SIPC 200 Berkeley Street, Boston, MA 02116-5010, 800-225-5291, jhinvestments.com
Manulife, Manulife Investment Management, Stylized M Design, and Manulife Investment Management & Stylized M Design are trademarks of The Manufacturers Life Insurance Company and are used by it, and by its affiliates under license.
NOT FDIC INSURED. MAY LOSE VALUE. NO BANK GUARANTEE. NOT INSURED BY ANY GOVERNMENT AGENCY.
TSR MIM Logo
MF3743813
395A-C
7/24
9/24
TSR JHIM logo
John Hancock Multi-Asset Absolute Return Fund
Class I/JHAIX
Annual SHAREHOLDER REPORT | July 31, 2024
This annual shareholder report contains important information about the John Hancock Multi-Asset Absolute Return Fund (the fund) for the period of August 1, 2023 to July 31, 2024. You can find additional information about the fund at jhinvestments.com/documents. You can also request this information by contacting us at 800-225-5291.
What were the fund costs during the last year?
(Based on a hypothetical $10,000 investment)
Fund (Class) Costs of a $10,000 investment Costs paid as a percentage
of a $10,000 investment
Multi-Asset Absolute Return Fund
(Class I/JHAIX)
$133 1.31%
Management’s Discussion of Fund Performance

SUMMARY OF RESULTS
Multi-Asset Absolute Return Fund (Class I/JHAIX) returned 3.42% for the year ended July 31, 2024. The most significant factors affecting fund performance during the period included a meaningful rally in global equity markets, led primarily by growth-oriented stocks in developed markets, and a shift from interest-rate increases to easier monetary policy by many of the world’s central banks—with notable exceptions in the U.S. and Japan.

TOP PERFORMANCE CONTRIBUTORS
Developed market stocks | Equities in developed countries were among the best performers, adding to the fund's performance.
Cash | A small cash and cash-equivalents position provided a noteworthy level of interest income.
Credit-related bonds | Selected, tactical positions in credit contributed modestly to performance.


TOP PERFORMANCE DETRACTORS
Defensive equity strategy | This strategy, which includes long positions in lower-risk stocks and short positions in broad equity indexes, detracted from performance as lower-risk stocks underperformed the broader market.
Foreign currency exposure | The fund’s defensive long/short positions in high-quality foreign currencies were a drag on performance, due in large part to the Japanese yen’s depreciation against most major currencies.
The views expressed in this report are exclusively those of the portfolio management team at Nordea Investment Management North America, Inc., and are subject to change. They are not meant as investment advice.
Fund Performance
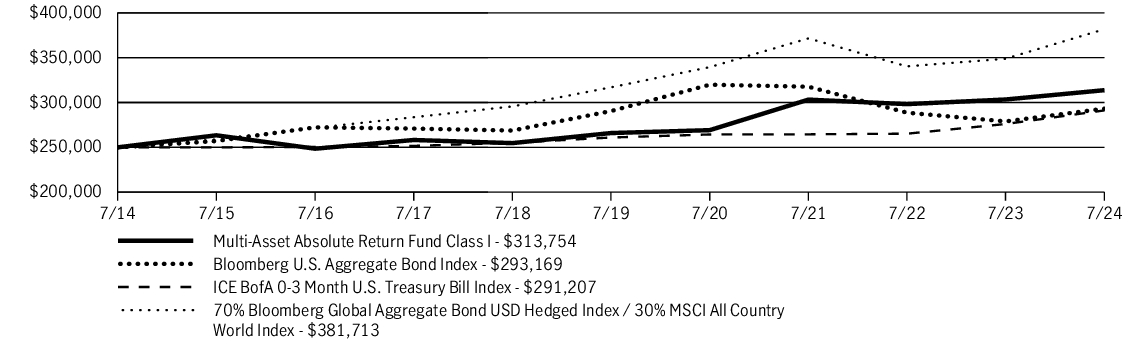
The following graph compares the initial and subsequent account values at the end of each of the most recently completed 10 fiscal years of the fund (or for the life of the fund, if shorter). It assumes a $250,000 initial investment in the fund and in an appropriate, broad-based securities market index for the same period.
GROWTH OF $250,000
Fund Performance - Growth of 10K
AVERAGE ANNUAL TOTAL RETURN 1 Year 5 Years 10 Years
Multi-Asset Absolute Return Fund (Class I/JHAIX) 3.42% 3.36% 2.30%
Bloomberg U.S. Aggregate Bond Index 5.10% 0.19% 1.61%
ICE BofA 0-3 Month U.S. Treasury Bill Index 5.50% 2.22% 1.54%
70% Bloomberg Global Aggregate Bond USD Hedged Index / 30% MSCI All Country World Index 9.43% 3.79% 4.32%
 
The Fund has designated Bloomberg U.S. Aggregate Bond Index as its broad-based securities market index in accordance with the revised definition for such an index.
Performance figures assume all distributions have been reinvested and reflect the beneficial effect of any expense reductions. Past performance does not guarantee future results. The return and principal value of an investment will fluctuate so that shares, when redeemed, may be worth more or less than their original cost. Due to market volatility and other factors, the fund’s current performance may be higher or lower than the performance shown and can be found at jhinvestments.com/investments or by calling 800-225-5291. The graph and table do not reflect the deduction of taxes that a shareholder would pay on fund distributions or redemption of fund shares. It is not possible to invest directly in an index.
Fund Statistics
Fund net assets $332,854,409%
Total number of portfolio holdings $341%
Total advisory fees paid (net) $3,836,333%
Portfolio turnover rate $47%
Graphical Representation of Holdings
The tables below show the investment makeup of the fund, representing percentage of the total net assets of the fund.
Portfolio Composition
Common stocks 88.5%
Information technology 16.6%
Consumer staples 14.5%
Health care 14.2%
Consumer discretionary 12.4%
Financials 11.2%
Communication services 9.4%
Industrials 6.8%
Utilities 2.7%
Materials 0.6%
Real estate 0.1%
Corporate bonds 3.4%
U.S. Government 2.9%
Other assets and liabilities, net 5.2%
Country Composition
United States 76.0%
Denmark 4.5%
United Kingdom 2.9%
France 2.5%
Ireland 1.9%
Taiwan 1.7%
China 1.7%
Germany 1.5%
South Korea 1.4%
Japan 1.3%
Other countries 4.6%
Holdings may not have been held by the fund for the entire period and are subject to change without notice. Portfolio composition is subject to review in accordance with the fund’s investment strategy and may vary in the future. Current and future portfolio holdings are subject to risk and may change at any time.
The fund is subject to various risks as described in the fund's prospectuses. For more information, please refer to the "Principal risks" section of the prospectuses.
Availability of Additional Information
TSR QR Code
At jhinvestments.com/documents, you can find additional information about the fund, including the fund’s:
  • Prospectus
  • Financial information
  • Fund holdings
  • Proxy voting information
You can also request this information by contacting us at 800-225-5291.
This report is for the information of the shareholders in this fund. It is not authorized for distribution to prospective investors unless preceded or accompanied by the fund's prospectus.
John Hancock Investment Management Distributors LLC, Member FINRA, SIPC 200 Berkeley Street, Boston, MA 02116-5010, 800-225-5291, jhinvestments.com
Manulife, Manulife Investment Management, Stylized M Design, and Manulife Investment Management & Stylized M Design are trademarks of The Manufacturers Life Insurance Company and are used by it, and by its affiliates under license.
NOT FDIC INSURED. MAY LOSE VALUE. NO BANK GUARANTEE. NOT INSURED BY ANY GOVERNMENT AGENCY.
TSR MIM Logo
MF3743813
395A-I
7/24
9/24
TSR JHIM logo
John Hancock Multi-Asset Absolute Return Fund
Class NAV
Annual SHAREHOLDER REPORT | July 31, 2024
This annual shareholder report contains important information about the John Hancock Multi-Asset Absolute Return Fund (the fund) for the period of August 1, 2023 to July 31, 2024. You can find additional information about the fund at jhinvestments.com/underlying-funds. You can also request this information by contacting us at 800-344-1029.
What were the fund costs during the last year?
(Based on a hypothetical $10,000 investment)
Fund (Class) Costs of a $10,000 investment Costs paid as a percentage
of a $10,000 investment
Multi-Asset Absolute Return Fund
(Class NAV)
$122 1.20%
Management’s Discussion of Fund Performance

SUMMARY OF RESULTS
Multi-Asset Absolute Return Fund (Class NAV) returned 3.61% for the year ended July 31, 2024. The most significant factors affecting fund performance during the period included a meaningful rally in global equity markets, led primarily by growth-oriented stocks in developed markets, and a shift from interest-rate increases to easier monetary policy by many of the world’s central banks—with notable exceptions in the U.S. and Japan.

TOP PERFORMANCE CONTRIBUTORS
Developed market stocks | Equities in developed countries were among the best performers, adding to the fund's performance.
Cash | A small cash and cash-equivalents position provided a noteworthy level of interest income.
Credit-related bonds | Selected, tactical positions in credit contributed modestly to performance.


TOP PERFORMANCE DETRACTORS
Defensive equity strategy | This strategy, which includes long positions in lower-risk stocks and short positions in broad equity indexes, detracted from performance as lower-risk stocks underperformed the broader market.
Foreign currency exposure | The fund’s defensive long/short positions in high-quality foreign currencies were a drag on performance, due in large part to the Japanese yen’s depreciation against most major currencies.
The views expressed in this report are exclusively those of the portfolio management team at Nordea Investment Management North America, Inc., and are subject to change. They are not meant as investment advice.
Fund Performance
The following graph compares the initial and subsequent account values at the end of each of the most recently completed 10 fiscal years of the fund (or for the life of the fund, if shorter). It assumes a $10,000 initial investment in the fund and in an appropriate, broad-based securities market index for the same period.
GROWTH OF $10,000
Fund Performance - Growth of 10K
AVERAGE ANNUAL TOTAL RETURN 1 Year 5 Years 10 Years
Multi-Asset Absolute Return Fund (Class NAV) 3.61% 3.48% 2.42%
Bloomberg U.S. Aggregate Bond Index 5.10% 0.19% 1.61%
ICE BofA 0-3 Month U.S. Treasury Bill Index 5.50% 2.22% 1.54%
70% Bloomberg Global Aggregate Bond USD Hedged Index / 30% MSCI All Country World Index 9.43% 3.79% 4.32%
 
The Fund has designated Bloomberg U.S. Aggregate Bond Index as its broad-based securities market index in accordance with the revised definition for such an index.
Performance figures assume all distributions have been reinvested and reflect the beneficial effect of any expense reductions. Past performance does not guarantee future results. The return and principal value of an investment will fluctuate so that shares, when redeemed, may be worth more or less than their original cost. Due to market volatility and other factors, the fund’s current performance may be higher or lower than the performance shown. The graph and table do not reflect the deduction of taxes that a shareholder would pay on fund distributions or redemption of fund shares. It is not possible to invest directly in an index.
Fund Statistics
Fund net assets $332,854,409%
Total number of portfolio holdings $341%
Total advisory fees paid (net) $3,836,333%
Portfolio turnover rate $47%
Graphical Representation of Holdings
The tables below show the investment makeup of the fund, representing percentage of the total net assets of the fund.
Portfolio Composition
Common stocks 88.5%
Information technology 16.6%
Consumer staples 14.5%
Health care 14.2%
Consumer discretionary 12.4%
Financials 11.2%
Communication services 9.4%
Industrials 6.8%
Utilities 2.7%
Materials 0.6%
Real estate 0.1%
Corporate bonds 3.4%
U.S. Government 2.9%
Other assets and liabilities, net 5.2%
Country Composition
United States 76.0%
Denmark 4.5%
United Kingdom 2.9%
France 2.5%
Ireland 1.9%
Taiwan 1.7%
China 1.7%
Germany 1.5%
South Korea 1.4%
Japan 1.3%
Other countries 4.6%
Holdings may not have been held by the fund for the entire period and are subject to change without notice. Portfolio composition is subject to review in accordance with the fund’s investment strategy and may vary in the future. Current and future portfolio holdings are subject to risk and may change at any time.
The fund is subject to various risks as described in the fund's prospectuses. For more information, please refer to the "Principal risks" section of the prospectuses.
Availability of Additional Information
Underlying site QR code
At jhinvestments.com/underlying-funds, you can find additional information about the fund, including the fund’s:
  • Prospectus
  • Financial information
  • Fund holdings
  • Proxy voting information 
This report is for the information of the shareholders in this fund. It is not authorized for distribution to prospective investors unless preceded or accompanied by the fund's prospectus.
John Hancock Investment Management Distributors LLC, Member FINRA, SIPC 200 Berkeley Street, Boston, MA 02116-5010, 800-225-5291, jhinvestments.com
Manulife, Manulife Investment Management, Stylized M Design, and Manulife Investment Management & Stylized M Design are trademarks of The Manufacturers Life Insurance Company and are used by it, and by its affiliates under license.
NOT FDIC INSURED. MAY LOSE VALUE. NO BANK GUARANTEE. NOT INSURED BY ANY GOVERNMENT AGENCY.
TSR MIM Logo
MF3743813
395A-A
7/24
9/24
TSR JHIM logo
John Hancock Multi-Asset Absolute Return Fund
Class R2/JHARX
Annual SHAREHOLDER REPORT | July 31, 2024
This annual shareholder report contains important information about the John Hancock Multi-Asset Absolute Return Fund (the fund) for the period of August 1, 2023 to July 31, 2024. You can find additional information about the fund at jhinvestments.com/documents. You can also request this information by contacting us at 800-225-5291.
What were the fund costs during the last year?
(Based on a hypothetical $10,000 investment)
Fund (Class) Costs of a $10,000 investment Costs paid as a percentage
of a $10,000 investment
Multi-Asset Absolute Return Fund
(Class R2/JHARX)
$166 1.63%
Management’s Discussion of Fund Performance

SUMMARY OF RESULTS
Multi-Asset Absolute Return Fund (Class R2/JHARX) returned 3.20% for the year ended July 31, 2024. The most significant factors affecting fund performance during the period included a meaningful rally in global equity markets, led primarily by growth-oriented stocks in developed markets, and a shift from interest-rate increases to easier monetary policy by many of the world’s central banks—with notable exceptions in the U.S. and Japan.

TOP PERFORMANCE CONTRIBUTORS
Developed market stocks | Equities in developed countries were among the best performers, adding to the fund's performance.
Cash | A small cash and cash-equivalents position provided a noteworthy level of interest income.
Credit-related bonds | Selected, tactical positions in credit contributed modestly to performance.


TOP PERFORMANCE DETRACTORS
Defensive equity strategy | This strategy, which includes long positions in lower-risk stocks and short positions in broad equity indexes, detracted from performance as lower-risk stocks underperformed the broader market.
Foreign currency exposure | The fund’s defensive long/short positions in high-quality foreign currencies were a drag on performance, due in large part to the Japanese yen’s depreciation against most major currencies.
The views expressed in this report are exclusively those of the portfolio management team at Nordea Investment Management North America, Inc., and are subject to change. They are not meant as investment advice.
Fund Performance
The following graph compares the initial and subsequent account values at the end of each of the most recently completed 10 fiscal years of the fund (or for the life of the fund, if shorter). It assumes a $10,000 initial investment in the fund and in an appropriate, broad-based securities market index for the same period.
GROWTH OF $10,000
Fund Performance - Growth of 10K
AVERAGE ANNUAL TOTAL RETURN 1 Year 5 Years 10 Years
Multi-Asset Absolute Return Fund (Class R2/JHARX) 3.20% 3.02% 1.90%
Bloomberg U.S. Aggregate Bond Index 5.10% 0.19% 1.61%
ICE BofA 0-3 Month U.S. Treasury Bill Index 5.50% 2.22% 1.54%
70% Bloomberg Global Aggregate Bond USD Hedged Index / 30% MSCI All Country World Index 9.43% 3.79% 4.32%
 
The Fund has designated Bloomberg U.S. Aggregate Bond Index as its broad-based securities market index in accordance with the revised definition for such an index.
Performance figures assume all distributions have been reinvested and reflect the beneficial effect of any expense reductions. Past performance does not guarantee future results. The return and principal value of an investment will fluctuate so that shares, when redeemed, may be worth more or less than their original cost. Due to market volatility and other factors, the fund’s current performance may be higher or lower than the performance shown and can be found at jhinvestments.com/investments or by calling 800-225-5291. The graph and table do not reflect the deduction of taxes that a shareholder would pay on fund distributions or redemption of fund shares. It is not possible to invest directly in an index.
Fund Statistics
Fund net assets $332,854,409%
Total number of portfolio holdings $341%
Total advisory fees paid (net) $3,836,333%
Portfolio turnover rate $47%
Graphical Representation of Holdings
The tables below show the investment makeup of the fund, representing percentage of the total net assets of the fund.
Portfolio Composition
Common stocks 88.5%
Information technology 16.6%
Consumer staples 14.5%
Health care 14.2%
Consumer discretionary 12.4%
Financials 11.2%
Communication services 9.4%
Industrials 6.8%
Utilities 2.7%
Materials 0.6%
Real estate 0.1%
Corporate bonds 3.4%
U.S. Government 2.9%
Other assets and liabilities, net 5.2%
Country Composition
United States 76.0%
Denmark 4.5%
United Kingdom 2.9%
France 2.5%
Ireland 1.9%
Taiwan 1.7%
China 1.7%
Germany 1.5%
South Korea 1.4%
Japan 1.3%
Other countries 4.6%
Holdings may not have been held by the fund for the entire period and are subject to change without notice. Portfolio composition is subject to review in accordance with the fund’s investment strategy and may vary in the future. Current and future portfolio holdings are subject to risk and may change at any time.
The fund is subject to various risks as described in the fund's prospectuses. For more information, please refer to the "Principal risks" section of the prospectuses.
Availability of Additional Information
TSR QR Code
At jhinvestments.com/documents, you can find additional information about the fund, including the fund’s:
  • Prospectus
  • Financial information
  • Fund holdings
  • Proxy voting information
You can also request this information by contacting us at 800-225-5291.
This report is for the information of the shareholders in this fund. It is not authorized for distribution to prospective investors unless preceded or accompanied by the fund's prospectus.
John Hancock Investment Management Distributors LLC, Member FINRA, SIPC 200 Berkeley Street, Boston, MA 02116-5010, 800-225-5291, jhinvestments.com
Manulife, Manulife Investment Management, Stylized M Design, and Manulife Investment Management & Stylized M Design are trademarks of The Manufacturers Life Insurance Company and are used by it, and by its affiliates under license.
NOT FDIC INSURED. MAY LOSE VALUE. NO BANK GUARANTEE. NOT INSURED BY ANY GOVERNMENT AGENCY.
TSR MIM Logo
MF3743813
395A-R2
7/24
9/24
TSR JHIM logo
John Hancock Multi-Asset Absolute Return Fund
Class R6/JHASX
Annual SHAREHOLDER REPORT | July 31, 2024
This annual shareholder report contains important information about the John Hancock Multi-Asset Absolute Return Fund (the fund) for the period of August 1, 2023 to July 31, 2024. You can find additional information about the fund at jhinvestments.com/documents. You can also request this information by contacting us at 800-225-5291.
What were the fund costs during the last year?
(Based on a hypothetical $10,000 investment)
Fund (Class) Costs of a $10,000 investment Costs paid as a percentage
of a $10,000 investment
Multi-Asset Absolute Return Fund
(Class R6/JHASX)
$122 1.20%
Management’s Discussion of Fund Performance

SUMMARY OF RESULTS
Multi-Asset Absolute Return Fund (Class R6/JHASX) returned 3.51% for the year ended July 31, 2024. The most significant factors affecting fund performance during the period included a meaningful rally in global equity markets, led primarily by growth-oriented stocks in developed markets, and a shift from interest-rate increases to easier monetary policy by many of the world’s central banks—with notable exceptions in the U.S. and Japan.

TOP PERFORMANCE CONTRIBUTORS
Developed market stocks | Equities in developed countries were among the best performers, adding to the fund's performance.
Cash | A small cash and cash-equivalents position provided a noteworthy level of interest income.
Credit-related bonds | Selected, tactical positions in credit contributed modestly to performance.


TOP PERFORMANCE DETRACTORS
Defensive equity strategy | This strategy, which includes long positions in lower-risk stocks and short positions in broad equity indexes, detracted from performance as lower-risk stocks underperformed the broader market.
Foreign currency exposure | The fund’s defensive long/short positions in high-quality foreign currencies were a drag on performance, due in large part to the Japanese yen’s depreciation against most major currencies.
The views expressed in this report are exclusively those of the portfolio management team at Nordea Investment Management North America, Inc., and are subject to change. They are not meant as investment advice.
Fund Performance
The following graph compares the initial and subsequent account values at the end of each of the most recently completed 10 fiscal years of the fund (or for the life of the fund, if shorter). It assumes a $1,000,000 initial investment in the fund and in an appropriate, broad-based securities market index for the same period.
GROWTH OF $1,000,000
Fund Performance - Growth of 10K
AVERAGE ANNUAL TOTAL RETURN 1 Year 5 Years 10 Years
Multi-Asset Absolute Return Fund (Class R6/JHASX) 3.51% 3.44% 2.40%
Bloomberg U.S. Aggregate Bond Index 5.10% 0.19% 1.61%
ICE BofA 0-3 Month U.S. Treasury Bill Index 5.50% 2.22% 1.54%
70% Bloomberg Global Aggregate Bond USD Hedged Index / 30% MSCI All Country World Index 9.43% 3.79% 4.32%
 
The Fund has designated Bloomberg U.S. Aggregate Bond Index as its broad-based securities market index in accordance with the revised definition for such an index.
Performance figures assume all distributions have been reinvested and reflect the beneficial effect of any expense reductions. Past performance does not guarantee future results. The return and principal value of an investment will fluctuate so that shares, when redeemed, may be worth more or less than their original cost. Due to market volatility and other factors, the fund’s current performance may be higher or lower than the performance shown and can be found at jhinvestments.com/investments or by calling 800-225-5291. The graph and table do not reflect the deduction of taxes that a shareholder would pay on fund distributions or redemption of fund shares. It is not possible to invest directly in an index.
Fund Statistics
Fund net assets $332,854,409%
Total number of portfolio holdings $341%
Total advisory fees paid (net) $3,836,333%
Portfolio turnover rate $47%
Graphical Representation of Holdings
The tables below show the investment makeup of the fund, representing percentage of the total net assets of the fund.
Portfolio Composition
Common stocks 88.5%
Information technology 16.6%
Consumer staples 14.5%
Health care 14.2%
Consumer discretionary 12.4%
Financials 11.2%
Communication services 9.4%
Industrials 6.8%
Utilities 2.7%
Materials 0.6%
Real estate 0.1%
Corporate bonds 3.4%
U.S. Government 2.9%
Other assets and liabilities, net 5.2%
Country Composition
United States 76.0%
Denmark 4.5%
United Kingdom 2.9%
France 2.5%
Ireland 1.9%
Taiwan 1.7%
China 1.7%
Germany 1.5%
South Korea 1.4%
Japan 1.3%
Other countries 4.6%
Holdings may not have been held by the fund for the entire period and are subject to change without notice. Portfolio composition is subject to review in accordance with the fund’s investment strategy and may vary in the future. Current and future portfolio holdings are subject to risk and may change at any time.
The fund is subject to various risks as described in the fund's prospectuses. For more information, please refer to the "Principal risks" section of the prospectuses.
Availability of Additional Information
TSR QR Code
At jhinvestments.com/documents, you can find additional information about the fund, including the fund’s:
  • Prospectus
  • Financial information
  • Fund holdings
  • Proxy voting information
You can also request this information by contacting us at 800-225-5291.
This report is for the information of the shareholders in this fund. It is not authorized for distribution to prospective investors unless preceded or accompanied by the fund's prospectus.
John Hancock Investment Management Distributors LLC, Member FINRA, SIPC 200 Berkeley Street, Boston, MA 02116-5010, 800-225-5291, jhinvestments.com
Manulife, Manulife Investment Management, Stylized M Design, and Manulife Investment Management & Stylized M Design are trademarks of The Manufacturers Life Insurance Company and are used by it, and by its affiliates under license.
NOT FDIC INSURED. MAY LOSE VALUE. NO BANK GUARANTEE. NOT INSURED BY ANY GOVERNMENT AGENCY.
TSR MIM Logo
MF3743813
395A-R6
7/24
9/24
TSR JHIM logo
John Hancock Fundamental All Cap Core Fund
Class A/JFCAX
Annual SHAREHOLDER REPORT | July 31, 2024
This annual shareholder report contains important information about the John Hancock Fundamental All Cap Core Fund (the fund) for the period of August 1, 2023 to July 31, 2024. You can find additional information about the fund at jhinvestments.com/documents. You can also request this information by contacting us at 800-225-5291.
What were the fund costs during the last year?
(Based on a hypothetical $10,000 investment)
Fund (Class) Costs of a $10,000 investment Costs paid as a percentage
of a $10,000 investment
Fundamental All Cap Core Fund
(Class A/JFCAX)
$127 1.13%
Management’s Discussion of Fund Performance

SUMMARY OF RESULTS
Fundamental All Cap Core Fund (Class A/JFCAX) returned 24.58% (excluding sales charges) for the year ended July 31, 2024. The U.S. economy’s resilience, stabilized and potentially lower interest rates, plus investor enthusiasm for artificial intelligence (AI) helped fuel the market and fund’s gain.

TOP PERFORMANCE CONTRIBUTORS
The information technology sector was among the strongest performers in the portfolio in the annual period | A sizable stake in semiconductor company NVIDIA Corp., a leader in AI, surged, boosting the fund’s result.
The financials sector also stood out to the upside | An allocation to private equity company KKR & Co., Inc., which rallied sharply, notably aided fund performance.
The consumer discretionary sector further boosted the fund’s result | A sizable position in e-commerce leader Amazon.com, Inc. posted a steep gain.


TOP PERFORMANCE DETRACTORS
Consumer staples stocks generated a weak return in the fund | Of note was a position in natural foods and organic personal products company Hain Celestial Group, Inc., which plunged during the period.
Certain consumer discretionary stocks notably detracted from performance | They included recreational vehicle company Polaris, Inc. and luxury winter clothing company Canada Goose Holdings, Inc., each of which fell sharply.
The views expressed in this report are exclusively those of the portfolio management team at Manulife Investment Management (US) LLC, and are subject to change. They are not meant as investment advice.
Fund Performance
The following graph compares the initial and subsequent account values at the end of each of the most recently completed 10 fiscal years of the fund (or for the life of the fund, if shorter). It assumes a $10,000 initial investment in the fund and in an appropriate, broad-based securities market index for the same period.
GROWTH OF $10,000
Fund Performance - Growth of 10K
AVERAGE ANNUAL TOTAL RETURN 1 Year 5 Years 10 Years
Fundamental All Cap Core Fund (Class A/JFCAX) 18.33% 15.32% 12.77%
Fundamental All Cap Core Fund (Class A/JFCAX)—excluding sales charge 24.58% 16.50% 13.34%
Russell 3000 Index 21.07% 14.23% 12.58%
 
The Fund has designated Russell 3000 Index as its broad-based securities market index in accordance with the revised definition for such an index.
Performance figures assume all distributions have been reinvested and reflect the beneficial effect of any expense reductions. Figures reflect maximum sales charge on Class A shares of 5.00%. Past performance does not guarantee future results. The return and principal value of an investment will fluctuate so that shares, when redeemed, may be worth more or less than their original cost. Due to market volatility and other factors, the fund’s current performance may be higher or lower than the performance shown and can be found at jhinvestments.com/investments or by calling 800-225-5291. The graph and table do not reflect the deduction of taxes that a shareholder would pay on fund distributions or redemption of fund shares. It is not possible to invest directly in an index.
Fund Statistics
Fund net assets $540,770,122%
Total number of portfolio holdings $49%
Total advisory fees paid (net) $2,425,688%
Portfolio turnover rate $12%
Graphical Representation of Holdings
The tables below show the investment makeup of the fund, representing percentage of the total net assets of the fund.
Top Ten Holdings
Amazon.com, Inc. 7.3%
NVIDIA Corp. 6.8%
Alphabet, Inc., Class A 5.7%
Lennar Corp., Class A 4.5%
KKR & Company, Inc. 4.3%
Apple, Inc. 4.1%
Morgan Stanley 3.8%
Cheniere Energy, Inc. 3.4%
First Hawaiian, Inc. 3.4%
Analog Devices, Inc. 3.1%
Sector Composition
Information technology 26.2%
Consumer discretionary 22.3%
Financials 15.9%
Communication services 9.7%
Health care 7.1%
Industrials 6.1%
Energy 4.9%
Real estate 3.5%
Consumer staples 1.4%
Materials 1.0%
Short-term investments and other 1.9%
Holdings may not have been held by the fund for the entire period and are subject to change without notice. Portfolio composition is subject to review in accordance with the fund’s investment strategy and may vary in the future. Current and future portfolio holdings are subject to risk and may change at any time.
The fund is subject to various risks as described in the fund's prospectus. For more information, please refer to the "Principal risks" section of the prospectus.
Availability of Additional Information
TSR QR Code
At jhinvestments.com/documents, you can find additional information about the fund, including the fund’s:
  • Prospectus
  • Financial information
  • Fund holdings
  • Proxy voting information
You can also request this information by contacting us at 800-225-5291.
This report is for the information of the shareholders in this fund. It is not authorized for distribution to prospective investors unless preceded or accompanied by the fund's prospectus.
John Hancock Investment Management Distributors LLC, Member FINRA, SIPC 200 Berkeley Street, Boston, MA 02116-5010, 800-225-5291, jhinvestments.com
Manulife, Manulife Investment Management, Stylized M Design, and Manulife Investment Management & Stylized M Design are trademarks of The Manufacturers Life Insurance Company and are used by it, and by its affiliates under license.
NOT FDIC INSURED. MAY LOSE VALUE. NO BANK GUARANTEE. NOT INSURED BY ANY GOVERNMENT AGENCY.
TSR MIM Logo
MF3743804
376A-A
7/24
9/24
TSR JHIM logo
John Hancock Fundamental All Cap Core Fund
Class C/JFCCX
Annual SHAREHOLDER REPORT | July 31, 2024
This annual shareholder report contains important information about the John Hancock Fundamental All Cap Core Fund (the fund) for the period of August 1, 2023 to July 31, 2024. You can find additional information about the fund at jhinvestments.com/documents. You can also request this information by contacting us at 800-225-5291.
What were the fund costs during the last year?
(Based on a hypothetical $10,000 investment)
Fund (Class) Costs of a $10,000 investment Costs paid as a percentage
of a $10,000 investment
Fundamental All Cap Core Fund
(Class C/JFCCX)
$205 1.83%
Management’s Discussion of Fund Performance

SUMMARY OF RESULTS
Fundamental All Cap Core Fund (Class C/JFCCX) returned 23.70% (excluding sales charges) for the year ended July 31, 2024. The U.S. economy’s resilience, stabilized and potentially lower interest rates, plus investor enthusiasm for artificial intelligence (AI) helped fuel the market and fund’s gain.

TOP PERFORMANCE CONTRIBUTORS
The information technology sector was among the strongest performers in the portfolio in the annual period | A sizable stake in semiconductor company NVIDIA Corp., a leader in AI, surged, boosting the fund’s result.
The financials sector also stood out to the upside | An allocation to private equity company KKR & Co., Inc., which rallied sharply, notably aided fund performance.
The consumer discretionary sector further boosted the fund’s result | A sizable position in e-commerce leader Amazon.com, Inc. posted a steep gain.


TOP PERFORMANCE DETRACTORS
Consumer staples stocks generated a weak return in the fund | Of note was a position in natural foods and organic personal products company Hain Celestial Group, Inc., which plunged during the period.
Certain consumer discretionary stocks notably detracted from performance | They included recreational vehicle company Polaris, Inc. and luxury winter clothing company Canada Goose Holdings, Inc., each of which fell sharply.
The views expressed in this report are exclusively those of the portfolio management team at Manulife Investment Management (US) LLC, and are subject to change. They are not meant as investment advice.
Fund Performance
The following graph compares the initial and subsequent account values at the end of each of the most recently completed 10 fiscal years of the fund (or for the life of the fund, if shorter). It assumes a $10,000 initial investment in the fund and in an appropriate, broad-based securities market index for the same period.
GROWTH OF $10,000
Fund Performance - Growth of 10K
AVERAGE ANNUAL TOTAL RETURN 1 Year 5 Years 10 Years
Fundamental All Cap Core Fund (Class C/JFCCX) 22.70% 15.69% 12.56%
Fundamental All Cap Core Fund (Class C/JFCCX)—excluding sales charge 23.70% 15.69% 12.56%
Russell 3000 Index 21.07% 14.23% 12.58%
 
The Fund has designated Russell 3000 Index as its broad-based securities market index in accordance with the revised definition for such an index.
Performance figures assume all distributions have been reinvested and reflect the beneficial effect of any expense reductions. Class C shares sold within one year of purchase are subject to a 1.00% contingent deferred sales charge. Past performance does not guarantee future results. The return and principal value of an investment will fluctuate so that shares, when redeemed, may be worth more or less than their original cost. Due to market volatility and other factors, the fund’s current performance may be higher or lower than the performance shown and can be found at jhinvestments.com/investments or by calling 800-225-5291. The graph and table do not reflect the deduction of taxes that a shareholder would pay on fund distributions or redemption of fund shares. It is not possible to invest directly in an index.
Fund Statistics
Fund net assets $540,770,122%
Total number of portfolio holdings $49%
Total advisory fees paid (net) $2,425,688%
Portfolio turnover rate $12%
Graphical Representation of Holdings
The tables below show the investment makeup of the fund, representing percentage of the total net assets of the fund.
Top Ten Holdings
Amazon.com, Inc. 7.3%
NVIDIA Corp. 6.8%
Alphabet, Inc., Class A 5.7%
Lennar Corp., Class A 4.5%
KKR & Company, Inc. 4.3%
Apple, Inc. 4.1%
Morgan Stanley 3.8%
Cheniere Energy, Inc. 3.4%
First Hawaiian, Inc. 3.4%
Analog Devices, Inc. 3.1%
Sector Composition
Information technology 26.2%
Consumer discretionary 22.3%
Financials 15.9%
Communication services 9.7%
Health care 7.1%
Industrials 6.1%
Energy 4.9%
Real estate 3.5%
Consumer staples 1.4%
Materials 1.0%
Short-term investments and other 1.9%
Holdings may not have been held by the fund for the entire period and are subject to change without notice. Portfolio composition is subject to review in accordance with the fund’s investment strategy and may vary in the future. Current and future portfolio holdings are subject to risk and may change at any time.
The fund is subject to various risks as described in the fund's prospectus. For more information, please refer to the "Principal risks" section of the prospectus.
Availability of Additional Information
TSR QR Code
At jhinvestments.com/documents, you can find additional information about the fund, including the fund’s:
  • Prospectus
  • Financial information
  • Fund holdings
  • Proxy voting information
You can also request this information by contacting us at 800-225-5291.
This report is for the information of the shareholders in this fund. It is not authorized for distribution to prospective investors unless preceded or accompanied by the fund's prospectus.
John Hancock Investment Management Distributors LLC, Member FINRA, SIPC 200 Berkeley Street, Boston, MA 02116-5010, 800-225-5291, jhinvestments.com
Manulife, Manulife Investment Management, Stylized M Design, and Manulife Investment Management & Stylized M Design are trademarks of The Manufacturers Life Insurance Company and are used by it, and by its affiliates under license.
NOT FDIC INSURED. MAY LOSE VALUE. NO BANK GUARANTEE. NOT INSURED BY ANY GOVERNMENT AGENCY.
TSR MIM Logo
MF3743804
376A-C
7/24
9/24
TSR JHIM logo
John Hancock Fundamental All Cap Core Fund
Class I/JFCIX
Annual SHAREHOLDER REPORT | July 31, 2024
This annual shareholder report contains important information about the John Hancock Fundamental All Cap Core Fund (the fund) for the period of August 1, 2023 to July 31, 2024. You can find additional information about the fund at jhinvestments.com/documents. You can also request this information by contacting us at 800-225-5291.
What were the fund costs during the last year?
(Based on a hypothetical $10,000 investment)
Fund (Class) Costs of a $10,000 investment Costs paid as a percentage
of a $10,000 investment
Fundamental All Cap Core Fund
(Class I/JFCIX)
$93 0.83%
Management’s Discussion of Fund Performance

SUMMARY OF RESULTS
Fundamental All Cap Core Fund (Class I/JFCIX) returned 24.95% for the year ended July 31, 2024. The U.S. economy’s resilience, stabilized and potentially lower interest rates, plus investor enthusiasm for artificial intelligence (AI) helped fuel the market and fund’s gain.

TOP PERFORMANCE CONTRIBUTORS
The information technology sector was among the strongest performers in the portfolio in the annual period | A sizable stake in semiconductor company NVIDIA Corp., a leader in AI, surged, boosting the fund’s result.
The financials sector also stood out to the upside | An allocation to private equity company KKR & Co., Inc., which rallied sharply, notably aided fund performance.
The consumer discretionary sector further boosted the fund’s result | A sizable position in e-commerce leader Amazon.com, Inc. posted a steep gain.


TOP PERFORMANCE DETRACTORS
Consumer staples stocks generated a weak return in the fund | Of note was a position in natural foods and organic personal products company Hain Celestial Group, Inc., which plunged during the period.
Certain consumer discretionary stocks notably detracted from performance | They included recreational vehicle company Polaris, Inc. and luxury winter clothing company Canada Goose Holdings, Inc., each of which fell sharply.
The views expressed in this report are exclusively those of the portfolio management team at Manulife Investment Management (US) LLC, and are subject to change. They are not meant as investment advice.
Fund Performance
The following graph compares the initial and subsequent account values at the end of each of the most recently completed 10 fiscal years of the fund (or for the life of the fund, if shorter). It assumes a $250,000 initial investment in the fund and in an appropriate, broad-based securities market index for the same period.
GROWTH OF $250,000
Fund Performance - Growth of 10K
AVERAGE ANNUAL TOTAL RETURN 1 Year 5 Years 10 Years
Fundamental All Cap Core Fund (Class I/JFCIX) 24.95% 16.84% 13.69%
Russell 3000 Index 21.07% 14.23% 12.58%
 
The Fund has designated Russell 3000 Index as its broad-based securities market index in accordance with the revised definition for such an index.
Performance figures assume all distributions have been reinvested and reflect the beneficial effect of any expense reductions. Past performance does not guarantee future results. The return and principal value of an investment will fluctuate so that shares, when redeemed, may be worth more or less than their original cost. Due to market volatility and other factors, the fund’s current performance may be higher or lower than the performance shown and can be found at jhinvestments.com/investments or by calling 800-225-5291. The graph and table do not reflect the deduction of taxes that a shareholder would pay on fund distributions or redemption of fund shares. It is not possible to invest directly in an index.
Fund Statistics
Fund net assets $540,770,122%
Total number of portfolio holdings $49%
Total advisory fees paid (net) $2,425,688%
Portfolio turnover rate $12%
Graphical Representation of Holdings
The tables below show the investment makeup of the fund, representing percentage of the total net assets of the fund.
Top Ten Holdings
Amazon.com, Inc. 7.3%
NVIDIA Corp. 6.8%
Alphabet, Inc., Class A 5.7%
Lennar Corp., Class A 4.5%
KKR & Company, Inc. 4.3%
Apple, Inc. 4.1%
Morgan Stanley 3.8%
Cheniere Energy, Inc. 3.4%
First Hawaiian, Inc. 3.4%
Analog Devices, Inc. 3.1%
Sector Composition
Information technology 26.2%
Consumer discretionary 22.3%
Financials 15.9%
Communication services 9.7%
Health care 7.1%
Industrials 6.1%
Energy 4.9%
Real estate 3.5%
Consumer staples 1.4%
Materials 1.0%
Short-term investments and other 1.9%
Holdings may not have been held by the fund for the entire period and are subject to change without notice. Portfolio composition is subject to review in accordance with the fund’s investment strategy and may vary in the future. Current and future portfolio holdings are subject to risk and may change at any time.
The fund is subject to various risks as described in the fund's prospectus. For more information, please refer to the "Principal risks" section of the prospectus.
Availability of Additional Information
TSR QR Code
At jhinvestments.com/documents, you can find additional information about the fund, including the fund’s:
  • Prospectus
  • Financial information
  • Fund holdings
  • Proxy voting information
You can also request this information by contacting us at 800-225-5291.
This report is for the information of the shareholders in this fund. It is not authorized for distribution to prospective investors unless preceded or accompanied by the fund's prospectus.
John Hancock Investment Management Distributors LLC, Member FINRA, SIPC 200 Berkeley Street, Boston, MA 02116-5010, 800-225-5291, jhinvestments.com
Manulife, Manulife Investment Management, Stylized M Design, and Manulife Investment Management & Stylized M Design are trademarks of The Manufacturers Life Insurance Company and are used by it, and by its affiliates under license.
NOT FDIC INSURED. MAY LOSE VALUE. NO BANK GUARANTEE. NOT INSURED BY ANY GOVERNMENT AGENCY.
TSR MIM Logo
MF3743804
376A-I
7/24
9/24
TSR JHIM logo
John Hancock Fundamental All Cap Core Fund
Class R2/JFACX
Annual SHAREHOLDER REPORT | July 31, 2024
This annual shareholder report contains important information about the John Hancock Fundamental All Cap Core Fund (the fund) for the period of August 1, 2023 to July 31, 2024. You can find additional information about the fund at jhinvestments.com/documents. You can also request this information by contacting us at 800-225-5291.
What were the fund costs during the last year?
(Based on a hypothetical $10,000 investment)
Fund (Class) Costs of a $10,000 investment Costs paid as a percentage
of a $10,000 investment
Fundamental All Cap Core Fund
(Class R2/JFACX)
$136 1.21%
Management’s Discussion of Fund Performance

SUMMARY OF RESULTS
Fundamental All Cap Core Fund (Class R2/JFACX) returned 24.49% for the year ended July 31, 2024. The U.S. economy’s resilience, stabilized and potentially lower interest rates, plus investor enthusiasm for artificial intelligence (AI) helped fuel the market and fund’s gain.

TOP PERFORMANCE CONTRIBUTORS
The information technology sector was among the strongest performers in the portfolio in the annual period | A sizable stake in semiconductor company NVIDIA Corp., a leader in AI, surged, boosting the fund’s result.
The financials sector also stood out to the upside | An allocation to private equity company KKR & Co., Inc., which rallied sharply, notably aided fund performance.
The consumer discretionary sector further boosted the fund’s result | A sizable position in e-commerce leader Amazon.com, Inc. posted a steep gain.


TOP PERFORMANCE DETRACTORS
Consumer staples stocks generated a weak return in the fund | Of note was a position in natural foods and organic personal products company Hain Celestial Group, Inc., which plunged during the period.
Certain consumer discretionary stocks notably detracted from performance | They included recreational vehicle company Polaris, Inc. and luxury winter clothing company Canada Goose Holdings, Inc., each of which fell sharply.
The views expressed in this report are exclusively those of the portfolio management team at Manulife Investment Management (US) LLC, and are subject to change. They are not meant as investment advice.
Fund Performance
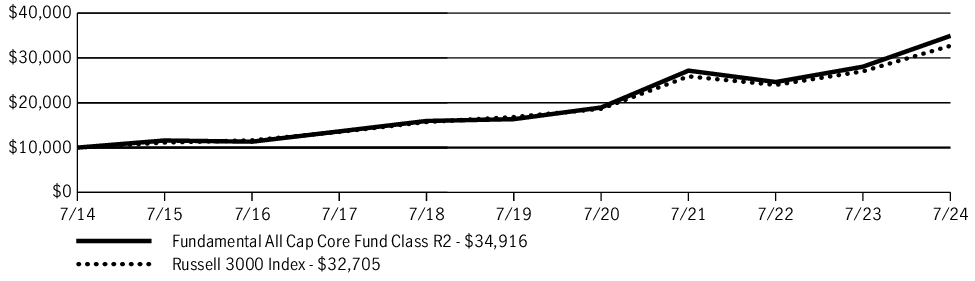
The following graph compares the initial and subsequent account values at the end of each of the most recently completed 10 fiscal years of the fund (or for the life of the fund, if shorter). It assumes a $10,000 initial investment in the fund and in an appropriate, broad-based securities market index for the same period.
GROWTH OF $10,000
Fund Performance - Growth of 10K
AVERAGE ANNUAL TOTAL RETURN 1 Year 5 Years 10 Years
Fundamental All Cap Core Fund (Class R2/JFACX) 24.49% 16.39% 13.32%
Russell 3000 Index 21.07% 14.23% 12.58%
 
The Fund has designated Russell 3000 Index as its broad-based securities market index in accordance with the revised definition for such an index.
 
Class R2 shares were first offered on 3-27-15. Returns prior to this date are those of Class A shares that have not been adjusted for class-specific expenses; otherwise, returns would vary.
Performance figures assume all distributions have been reinvested and reflect the beneficial effect of any expense reductions. Past performance does not guarantee future results. The return and principal value of an investment will fluctuate so that shares, when redeemed, may be worth more or less than their original cost. Due to market volatility and other factors, the fund’s current performance may be higher or lower than the performance shown and can be found at jhinvestments.com/investments or by calling 800-225-5291. The graph and table do not reflect the deduction of taxes that a shareholder would pay on fund distributions or redemption of fund shares. It is not possible to invest directly in an index.
Fund Statistics
Fund net assets $540,770,122%
Total number of portfolio holdings $49%
Total advisory fees paid (net) $2,425,688%
Portfolio turnover rate $12%
Graphical Representation of Holdings
The tables below show the investment makeup of the fund, representing percentage of the total net assets of the fund.
Top Ten Holdings
Amazon.com, Inc. 7.3%
NVIDIA Corp. 6.8%
Alphabet, Inc., Class A 5.7%
Lennar Corp., Class A 4.5%
KKR & Company, Inc. 4.3%
Apple, Inc. 4.1%
Morgan Stanley 3.8%
Cheniere Energy, Inc. 3.4%
First Hawaiian, Inc. 3.4%
Analog Devices, Inc. 3.1%
Sector Composition
Information technology 26.2%
Consumer discretionary 22.3%
Financials 15.9%
Communication services 9.7%
Health care 7.1%
Industrials 6.1%
Energy 4.9%
Real estate 3.5%
Consumer staples 1.4%
Materials 1.0%
Short-term investments and other 1.9%
Holdings may not have been held by the fund for the entire period and are subject to change without notice. Portfolio composition is subject to review in accordance with the fund’s investment strategy and may vary in the future. Current and future portfolio holdings are subject to risk and may change at any time.
The fund is subject to various risks as described in the fund's prospectus. For more information, please refer to the "Principal risks" section of the prospectus.
Availability of Additional Information
TSR QR Code
At jhinvestments.com/documents, you can find additional information about the fund, including the fund’s:
  • Prospectus
  • Financial information
  • Fund holdings
  • Proxy voting information
You can also request this information by contacting us at 800-225-5291.
This report is for the information of the shareholders in this fund. It is not authorized for distribution to prospective investors unless preceded or accompanied by the fund's prospectus.
John Hancock Investment Management Distributors LLC, Member FINRA, SIPC 200 Berkeley Street, Boston, MA 02116-5010, 800-225-5291, jhinvestments.com
Manulife, Manulife Investment Management, Stylized M Design, and Manulife Investment Management & Stylized M Design are trademarks of The Manufacturers Life Insurance Company and are used by it, and by its affiliates under license.
NOT FDIC INSURED. MAY LOSE VALUE. NO BANK GUARANTEE. NOT INSURED BY ANY GOVERNMENT AGENCY.
TSR MIM Logo
MF3743804
376A-R2
7/24
9/24
TSR JHIM logo
John Hancock Fundamental All Cap Core Fund
Class R4/JFARX
Annual SHAREHOLDER REPORT | July 31, 2024
This annual shareholder report contains important information about the John Hancock Fundamental All Cap Core Fund (the fund) for the period of August 1, 2023 to July 31, 2024. You can find additional information about the fund at jhinvestments.com/documents. You can also request this information by contacting us at 800-225-5291.
What were the fund costs during the last year?
(Based on a hypothetical $10,000 investment)
Fund (Class) Costs of a $10,000 investment Costs paid as a percentage
of a $10,000 investment
Fundamental All Cap Core Fund
(Class R4/JFARX)
$100 0.89%
Management’s Discussion of Fund Performance

SUMMARY OF RESULTS
Fundamental All Cap Core Fund (Class R4/JFARX) returned 24.85% for the year ended July 31, 2024. The U.S. economy’s resilience, stabilized and potentially lower interest rates, plus investor enthusiasm for artificial intelligence (AI) helped fuel the market and fund’s gain.

TOP PERFORMANCE CONTRIBUTORS
The information technology sector was among the strongest performers in the portfolio in the annual period | A sizable stake in semiconductor company NVIDIA Corp., a leader in AI, surged, boosting the fund’s result.
The financials sector also stood out to the upside | An allocation to private equity company KKR & Co., Inc., which rallied sharply, notably aided fund performance.
The consumer discretionary sector further boosted the fund’s result | A sizable position in e-commerce leader Amazon.com, Inc. posted a steep gain.


TOP PERFORMANCE DETRACTORS
Consumer staples stocks generated a weak return in the fund | Of note was a position in natural foods and organic personal products company Hain Celestial Group, Inc., which plunged during the period.
Certain consumer discretionary stocks notably detracted from performance | They included recreational vehicle company Polaris, Inc. and luxury winter clothing company Canada Goose Holdings, Inc., each of which fell sharply.
The views expressed in this report are exclusively those of the portfolio management team at Manulife Investment Management (US) LLC, and are subject to change. They are not meant as investment advice.
Fund Performance
The following graph compares the initial and subsequent account values at the end of each of the most recently completed 10 fiscal years of the fund (or for the life of the fund, if shorter). It assumes a $10,000 initial investment in the fund and in an appropriate, broad-based securities market index for the same period.
GROWTH OF $10,000
Fund Performance - Growth of 10K
AVERAGE ANNUAL TOTAL RETURN 1 Year 5 Years 10 Years
Fundamental All Cap Core Fund (Class R4/JFARX) 24.85% 16.78% 13.59%
Russell 3000 Index 21.07% 14.23% 12.58%
 
The Fund has designated Russell 3000 Index as its broad-based securities market index in accordance with the revised definition for such an index.
 
Class R4 shares were first offered on 3-27-15. Returns prior to this date are those of Class A shares that have not been adjusted for class-specific expenses; otherwise, returns would vary.
Performance figures assume all distributions have been reinvested and reflect the beneficial effect of any expense reductions. Past performance does not guarantee future results. The return and principal value of an investment will fluctuate so that shares, when redeemed, may be worth more or less than their original cost. Due to market volatility and other factors, the fund’s current performance may be higher or lower than the performance shown and can be found at jhinvestments.com/investments or by calling 800-225-5291. The graph and table do not reflect the deduction of taxes that a shareholder would pay on fund distributions or redemption of fund shares. It is not possible to invest directly in an index.
Fund Statistics
Fund net assets $540,770,122%
Total number of portfolio holdings $49%
Total advisory fees paid (net) $2,425,688%
Portfolio turnover rate $12%
Graphical Representation of Holdings
The tables below show the investment makeup of the fund, representing percentage of the total net assets of the fund.
Top Ten Holdings
Amazon.com, Inc. 7.3%
NVIDIA Corp. 6.8%
Alphabet, Inc., Class A 5.7%
Lennar Corp., Class A 4.5%
KKR & Company, Inc. 4.3%
Apple, Inc. 4.1%
Morgan Stanley 3.8%
Cheniere Energy, Inc. 3.4%
First Hawaiian, Inc. 3.4%
Analog Devices, Inc. 3.1%
Sector Composition
Information technology 26.2%
Consumer discretionary 22.3%
Financials 15.9%
Communication services 9.7%
Health care 7.1%
Industrials 6.1%
Energy 4.9%
Real estate 3.5%
Consumer staples 1.4%
Materials 1.0%
Short-term investments and other 1.9%
Holdings may not have been held by the fund for the entire period and are subject to change without notice. Portfolio composition is subject to review in accordance with the fund’s investment strategy and may vary in the future. Current and future portfolio holdings are subject to risk and may change at any time.
The fund is subject to various risks as described in the fund's prospectus. For more information, please refer to the "Principal risks" section of the prospectus.
Availability of Additional Information
TSR QR Code
At jhinvestments.com/documents, you can find additional information about the fund, including the fund’s:
  • Prospectus
  • Financial information
  • Fund holdings
  • Proxy voting information
You can also request this information by contacting us at 800-225-5291.
This report is for the information of the shareholders in this fund. It is not authorized for distribution to prospective investors unless preceded or accompanied by the fund's prospectus.
John Hancock Investment Management Distributors LLC, Member FINRA, SIPC 200 Berkeley Street, Boston, MA 02116-5010, 800-225-5291, jhinvestments.com
Manulife, Manulife Investment Management, Stylized M Design, and Manulife Investment Management & Stylized M Design are trademarks of The Manufacturers Life Insurance Company and are used by it, and by its affiliates under license.
NOT FDIC INSURED. MAY LOSE VALUE. NO BANK GUARANTEE. NOT INSURED BY ANY GOVERNMENT AGENCY.
TSR MIM Logo
MF3743804
376A-R4
7/24
9/24
TSR JHIM logo
John Hancock Fundamental All Cap Core Fund
Class R6/JFAIX
Annual SHAREHOLDER REPORT | July 31, 2024
This annual shareholder report contains important information about the John Hancock Fundamental All Cap Core Fund (the fund) for the period of August 1, 2023 to July 31, 2024. You can find additional information about the fund at jhinvestments.com/documents. You can also request this information by contacting us at 800-225-5291.
What were the fund costs during the last year?
(Based on a hypothetical $10,000 investment)
Fund (Class) Costs of a $10,000 investment Costs paid as a percentage
of a $10,000 investment
Fundamental All Cap Core Fund
(Class R6/JFAIX)
$81 0.72%
Management’s Discussion of Fund Performance

SUMMARY OF RESULTS
Fundamental All Cap Core Fund (Class R6/JFAIX) returned 25.10% for the year ended July 31, 2024. The U.S. economy’s resilience, stabilized and potentially lower interest rates, plus investor enthusiasm for artificial intelligence (AI) helped fuel the market and fund’s gain.

TOP PERFORMANCE CONTRIBUTORS
The information technology sector was among the strongest performers in the portfolio in the annual period | A sizable stake in semiconductor company NVIDIA Corp., a leader in AI, surged, boosting the fund’s result.
The financials sector also stood out to the upside | An allocation to private equity company KKR & Co., Inc., which rallied sharply, notably aided fund performance.
The consumer discretionary sector further boosted the fund’s result | A sizable position in e-commerce leader Amazon.com, Inc. posted a steep gain.


TOP PERFORMANCE DETRACTORS
Consumer staples stocks generated a weak return in the fund | Of note was a position in natural foods and organic personal products company Hain Celestial Group, Inc., which plunged during the period.
Certain consumer discretionary stocks notably detracted from performance | They included recreational vehicle company Polaris, Inc. and luxury winter clothing company Canada Goose Holdings, Inc., each of which fell sharply.
The views expressed in this report are exclusively those of the portfolio management team at Manulife Investment Management (US) LLC, and are subject to change. They are not meant as investment advice.
Fund Performance
The following graph compares the initial and subsequent account values at the end of each of the most recently completed 10 fiscal years of the fund (or for the life of the fund, if shorter). It assumes a $1,000,000 initial investment in the fund and in an appropriate, broad-based securities market index for the same period.
GROWTH OF $1,000,000
Fund Performance - Growth of 10K
AVERAGE ANNUAL TOTAL RETURN 1 Year 5 Years 10 Years
Fundamental All Cap Core Fund (Class R6/JFAIX) 25.10% 16.97% 13.78%
Russell 3000 Index 21.07% 14.23% 12.58%
 
The Fund has designated Russell 3000 Index as its broad-based securities market index in accordance with the revised definition for such an index.
 
Class R6 shares were first offered on 3-27-15. Returns prior to this date are those of Class A shares that have not been adjusted for class-specific expenses; otherwise, returns would vary.
Performance figures assume all distributions have been reinvested and reflect the beneficial effect of any expense reductions. Past performance does not guarantee future results. The return and principal value of an investment will fluctuate so that shares, when redeemed, may be worth more or less than their original cost. Due to market volatility and other factors, the fund’s current performance may be higher or lower than the performance shown and can be found at jhinvestments.com/investments or by calling 800-225-5291. The graph and table do not reflect the deduction of taxes that a shareholder would pay on fund distributions or redemption of fund shares. It is not possible to invest directly in an index.
Fund Statistics
Fund net assets $540,770,122%
Total number of portfolio holdings $49%
Total advisory fees paid (net) $2,425,688%
Portfolio turnover rate $12%
Graphical Representation of Holdings
The tables below show the investment makeup of the fund, representing percentage of the total net assets of the fund.
Top Ten Holdings
Amazon.com, Inc. 7.3%
NVIDIA Corp. 6.8%
Alphabet, Inc., Class A 5.7%
Lennar Corp., Class A 4.5%
KKR & Company, Inc. 4.3%
Apple, Inc. 4.1%
Morgan Stanley 3.8%
Cheniere Energy, Inc. 3.4%
First Hawaiian, Inc. 3.4%
Analog Devices, Inc. 3.1%
Sector Composition
Information technology 26.2%
Consumer discretionary 22.3%
Financials 15.9%
Communication services 9.7%
Health care 7.1%
Industrials 6.1%
Energy 4.9%
Real estate 3.5%
Consumer staples 1.4%
Materials 1.0%
Short-term investments and other 1.9%
Holdings may not have been held by the fund for the entire period and are subject to change without notice. Portfolio composition is subject to review in accordance with the fund’s investment strategy and may vary in the future. Current and future portfolio holdings are subject to risk and may change at any time.
The fund is subject to various risks as described in the fund's prospectus. For more information, please refer to the "Principal risks" section of the prospectus.
Availability of Additional Information
TSR QR Code
At jhinvestments.com/documents, you can find additional information about the fund, including the fund’s:
  • Prospectus
  • Financial information
  • Fund holdings
  • Proxy voting information
You can also request this information by contacting us at 800-225-5291.
This report is for the information of the shareholders in this fund. It is not authorized for distribution to prospective investors unless preceded or accompanied by the fund's prospectus.
John Hancock Investment Management Distributors LLC, Member FINRA, SIPC 200 Berkeley Street, Boston, MA 02116-5010, 800-225-5291, jhinvestments.com
Manulife, Manulife Investment Management, Stylized M Design, and Manulife Investment Management & Stylized M Design are trademarks of The Manufacturers Life Insurance Company and are used by it, and by its affiliates under license.
NOT FDIC INSURED. MAY LOSE VALUE. NO BANK GUARANTEE. NOT INSURED BY ANY GOVERNMENT AGENCY.
TSR MIM Logo
MF3743804
376A-R6
7/24
9/24

ITEM 2. CODE OF ETHICS.

As of the end of the year, July 31, 2024, the registrant has adopted a code of ethics, as defined in Item 2 of Form N-CSR, that applies to its Chief Executive Officer, Chief Financial Officer and Treasurer (respectively, the principal executive officer, the principal financial officer and the principal accounting officer, the "Covered Officers"). A copy of the code of ethics is filed as an exhibit to this Form N-CSR.


ITEM 3. AUDIT COMMITTEE FINANCIAL EXPERT.

Frances G. Rathke is the audit committee financial expert and is "independent", pursuant to general instructions on Form N-CSR Item 3.


ITEM 4. PRINCIPAL ACCOUNTANT FEES AND SERVICES.

(a) Audit Fees

The aggregate fees billed for professional services rendered by the principal accountant for the audits of the registrant's annual financial statements or services that are normally provided by the accountant in connection with statutory and regulatory filings or engagements amounted to $153,409 and $156,293 for the fiscal years ended July 31, 2024 and July 31, 2023, respectively. These fees were billed to the registrant and were approved by the registrant's audit committee.

(b) Audit-Related Services

Audit-related fees for assurance and related services by the principal accountant are billed to the registrant or to the registrant's investment adviser (not including any sub-adviser whose role is primarily portfolio management and is subcontracted with or overseen by another investment adviser), and any entity controlling, controlled by, or under common control with the adviser ("control affiliates") that provides ongoing services to the registrant. The nature of the services provided was affiliated service provider internal controls reviews and a software licensing fee. Amounts billed to the registrant were $1,526 and $1,224 for fiscal years ended July 31, 2024 and July 31, 2023, respectively.

Amounts billed to control affiliates were $145,263 and $127,376 for the fiscal years ended July 31, 2024 and July 31, 2023, respectively.

(c) Tax Fees

The aggregate fees billed for professional services rendered by the principal accountant for tax compliance, tax advice and tax planning ("tax fees") amounted to $8,881 and $16,613 for the fiscal years ended July 31, 2024 and July 31, 2023, respectively. The nature of the services comprising the tax fees was the review of the registrant's tax returns and tax distribution requirements. These fees were billed to the registrant and were approved by the registrant's audit committee.

(d) All Other Fees

Other fees amounted to $739 and $0 for the fiscal years ended July 31, 2024 and July 31, 2023, respectively. The nature of the services comprising all other fees is advisory services provided to the investment manager. These fees were approved by the registrant's audit committee.

(e)(1) Audit Committee Pre-Approval Policies and Procedures

The registrant's Audit Committee must pre-approve all audit and non-audit services provided by the independent registered public accounting firm (the "Auditor") relating to the operations or financial reporting of the funds. Prior to the commencement of any audit or non-audit services to a fund, the Audit Committee reviews the services to determine whether they are appropriate and permissible under applicable law.

The registrant's Audit Committee has adopted policies and procedures to, among other purposes, provide a framework for the Committee's consideration of audit-related and non-audit services by the Auditor. The policies and procedures require that any audit-related and non-audit service provided by the Auditor and any non-audit service provided by the Auditor to a fund service provider that relates directly to the operations and financial reporting of a fund are subject to approval by the Audit Committee before such service is provided. Audit-related services provided by the Auditor that are expected to exceed $25,000 per year/per fund are subject to specific pre-approval by the Audit Committee. Tax services provided by the Auditor that are expected to exceed $30,000 per year/per fund are subject to specific pre-approval by the Audit Committee.

All audit services, as well as the audit-related and non-audit services that are expected to exceed the amounts stated above, must be approved in advance of provision of the service by formal resolution of the Audit Committee. At the regularly scheduled Audit Committee meetings, the Committee reviews a report summarizing the services, including fees, provided by the Auditor.

(e)(2) Services approved pursuant to paragraph (c)(7)(i)(C) of Rule 2-01 of Regulation S-X

Audit-Related Fees, Tax Fees and All Other Fees

There were no amounts that were approved by the Audit Committee pursuant to the de minimis exception under Rule 2-01 of Regulation S-X.

(f) According to the registrant's principal accountant for the fiscal year ended July 31, 2024, the percentage of hours spent on the audit of the registrant's financial statements for the most recent fiscal year that were attributed to work performed by persons who were not full-time, permanent employees of principal accountant was less than 50%.

(g) The aggregate non-audit fees billed by the registrant's principal accountant for non-audit services rendered to the registrant and rendered to the registrant's control affiliates were $1,091,664 for the fiscal year ended July 31, 2024 and $1,272,994 for the fiscal year ended July 31, 2023.

(h) The audit committee of the registrant has considered the non-audit services provided by the registrant's principal accountant to the control affiliates and has determined that the services that were not pre-approved are compatible with maintaining the principal accountant's independence.

(i) Not applicable.

(j) Not applicable.


ITEM 5. AUDIT COMMITTEE OF LISTED REGISTRANTS.

The registrant has a separately-designated standing audit committee comprised of independent trustees. The members of the audit committee are as follows:

Frances G. Rathke – Chairperson

William H. Cunningham

Hassell H. McClellan


ITEM 6. SCHEDULE OF INVESTMENTS.

(a) Refer to information included in Item 7.

(b) Not applicable.


ITEM 7. FINANCIAL STATEMENTS AND FINANCIAL HIGHLIGHTS FOR OPEN-END MANAGEMENT INVESTMENT COMPANIES.

The Registrant prepared financial statements and financial highlights for the year ended July 31, 2024 for the following funds:

John Hancock Funds II

  • John Hancock Fundamental All Cap Core Fund

  • John Hancock Multi-Asset Absolute Return Fund


ITEM 8. CHANGES IN AND DISAGREEMENTS WITH ACCOUNTANTS FOR OPEN-END MANAGEMENT INVESTMENT COMPANIES.

Not applicable.


ITEM 9. PROXY DISCLOSURE FOR OPEN-END MANAGEMENT INVESTMENT COMPANIES.

Information included in Item 7, if applicable.


ITEM 10. REMUNERATION PAID TO DIRECTORS, OFFICERS, AND OTHERS OF OPEN-END MANAGEMENT INVESTMENT COMPANIES.

Refer to information included in Item 7.


ITEM 11. STATEMENT REGARDING BASIS FOR APPROVAL OF INVESTMENT ADVISORY CONTRACT.

Information included in Item 7, if applicable.


ITEM 12. DISCLOSURE OF PROXY VOTING POLICIES AND PROCEDURES FOR CLOSED-END MANAGEMENT INVESTMENT COMPANIES.

Not applicable.


ITEM 13. PORTFOLIO MANAGERS OF CLOSED-END MANAGEMENT INVESTMENT COMPANIES.

Not applicable.


ITEM 14. PURCHASES OF EQUITY SECURITIES BY CLOSED-END MANAGEMENT INVESTMENT COMPANY AND AFFILIATE PURCHASERS.

Not applicable.


ITEM 15. SUBMISSION OF MATTERS TO A VOTE OF SECURITY HOLDERS.

The registrant has adopted procedures by which shareholders may recommend nominees to the registrant's Board of Trustees. A copy of the procedures is filed as an exhibit to this Form N-CSR. See attached "John Hancock Funds – Nominating, Governance and Administration Committee Charter".


ITEM 16. CONTROLS AND PROCEDURES.

(a) Based upon their evaluation of the registrant's disclosure controls and procedures as conducted within 90 days of the filing date of this Form N-CSR, the registrant's principal executive officer and principal financial officer have concluded that those disclosure controls and procedures provide reasonable assurance that the material information required to be disclosed by the registrant on this report is recorded, processed, summarized and reported within the time periods specified in the Securities and Exchange Commission's rules and forms.

(b) There were no changes in the registrant's internal control over financial reporting that occurred during the period covered by this report that have materially affected, or are reasonably likely to materially affect, the registrant's internal control over financial reporting.


ITEM 17. DISCLOSURE OF SECURITIES LENDING ACTIVITIES FOR CLOSED-END MANAGEMENT INVESTMENT COMPANIES.

Not applicable.


ITEM 18. RECOVERY OF ERRONEOUSLY AWARDED COMPENSATION.

Not applicable.


ITEM 19. EXHIBITS.

(a)(1) Code of Ethics for Covered Officers is attached.

(a)(2) Separate certifications for the registrant's principal executive officer and principal financial officer, as required by Section 302 of the Sarbanes-Oxley Act of 2002 and Rule 30a-2(a) under the Investment Company Act of 1940, are attached.

(b) Separate certifications for the registrant's principal executive officer and principal financial officer, as required by 18 U.S.C. Section 1350, as adopted pursuant to Section 906 of the Sarbanes-Oxley Act of 2002, and Rule 30a-2(b) under the Investment Company Act of 1940, are attached. The certifications furnished pursuant to this paragraph are not deemed to be "filed" for purposes of Section 18 of the Securities Exchange Act of 1934, or otherwise subject to the liability of that section. Such certifications are not deemed to be incorporated by reference into any filing under the Securities Act of 1933 or the Securities Exchange Act of 1934, except to the extent that the Registrant specifically incorporates them by reference.

(c)(1) Submission of Matters to a Vote of Security Holders is attached. See attached "John Hancock Funds – Nominating, Governance and Administration Committee Charter”.


                                                                        SIGNATURES

Pursuant to the requirements of the Securities Exchange Act of 1934 and the Investment Company Act of 1940, the registrant has duly caused this report to be signed on its behalf by the undersigned, thereunto duly authorized.

John Hancock Funds II

By: /s/ Kristie M. Feinberg
------------------------------
Kristie M. Feinberg
President
Date: September 12, 2024

Pursuant to the requirements of the Securities Exchange Act of 1934 and the Investment Company Act of 1940, this report has been signed below by the following persons on behalf of the registrant and in the capacities and on the dates indicated.

By: /s/ Kristie M. Feinberg
------------------------------
Kristie M. Feinberg
President
Date: September 12, 2024
By: /s/ Fernando A. Silva
---------------------------
Fernando A. Silva
Chief Financial Officer
Date: September 12, 2024


ITEM 2. CODE OF ETHICS.

As of the end of the year, July 31, 2024, the registrant has adopted a code of ethics, as defined in Item 2 of Form N-CSR, that applies to its Chief Executive Officer, Chief Financial Officer and Treasurer (respectively, the principal executive officer, the principal financial officer and the principal accounting officer, the "Covered Officers"). A copy of the code of ethics is filed as an exhibit to this Form N-CSR.


ITEM 3. AUDIT COMMITTEE FINANCIAL EXPERT.

Frances G. Rathke is the audit committee financial expert and is "independent", pursuant to general instructions on Form N-CSR Item 3.


ITEM 4. PRINCIPAL ACCOUNTANT FEES AND SERVICES.

(a) Audit Fees

The aggregate fees billed for professional services rendered by the principal accountant for the audits of the registrant's annual financial statements or services that are normally provided by the accountant in connection with statutory and regulatory filings or engagements amounted to $153,409 and $156,293 for the fiscal years ended July 31, 2024 and July 31, 2023, respectively. These fees were billed to the registrant and were approved by the registrant's audit committee.

(b) Audit-Related Services

Audit-related fees for assurance and related services by the principal accountant are billed to the registrant or to the registrant's investment adviser (not including any sub-adviser whose role is primarily portfolio management and is subcontracted with or overseen by another investment adviser), and any entity controlling, controlled by, or under common control with the adviser ("control affiliates") that provides ongoing services to the registrant. The nature of the services provided was affiliated service provider internal controls reviews and a software licensing fee. Amounts billed to the registrant were $1,526 and $1,224 for fiscal years ended July 31, 2024 and July 31, 2023, respectively.

Amounts billed to control affiliates were $145,263 and $127,376 for the fiscal years ended July 31, 2024 and July 31, 2023, respectively.

(c) Tax Fees

The aggregate fees billed for professional services rendered by the principal accountant for tax compliance, tax advice and tax planning ("tax fees") amounted to $8,881 and $16,613 for the fiscal years ended July 31, 2024 and July 31, 2023, respectively. The nature of the services comprising the tax fees was the review of the registrant's tax returns and tax distribution requirements. These fees were billed to the registrant and were approved by the registrant's audit committee.

(d) All Other Fees

Other fees amounted to $739 and $0 for the fiscal years ended July 31, 2024 and July 31, 2023, respectively. The nature of the services comprising all other fees is advisory services provided to the investment manager. These fees were approved by the registrant's audit committee.

(e)(1) Audit Committee Pre-Approval Policies and Procedures

The registrant's Audit Committee must pre-approve all audit and non-audit services provided by the independent registered public accounting firm (the "Auditor") relating to the operations or financial reporting of the funds. Prior to the commencement of any audit or non-audit services to a fund, the Audit Committee reviews the services to determine whether they are appropriate and permissible under applicable law.

The registrant's Audit Committee has adopted policies and procedures to, among other purposes, provide a framework for the Committee's consideration of audit-related and non-audit services by the Auditor. The policies and procedures require that any audit-related and non-audit service provided by the Auditor and any non-audit service provided by the Auditor to a fund service provider that relates directly to the operations and financial reporting of a fund are subject to approval by the Audit Committee before such service is provided. Audit-related services provided by the Auditor that are expected to exceed $25,000 per year/per fund are subject to specific pre-approval by the Audit Committee. Tax services provided by the Auditor that are expected to exceed $30,000 per year/per fund are subject to specific pre-approval by the Audit Committee.

All audit services, as well as the audit-related and non-audit services that are expected to exceed the amounts stated above, must be approved in advance of provision of the service by formal resolution of the Audit Committee. At the regularly scheduled Audit Committee meetings, the Committee reviews a report summarizing the services, including fees, provided by the Auditor.

(e)(2) Services approved pursuant to paragraph (c)(7)(i)(C) of Rule 2-01 of Regulation S-X

Audit-Related Fees, Tax Fees and All Other Fees

There were no amounts that were approved by the Audit Committee pursuant to the de minimis exception under Rule 2-01 of Regulation S-X.

(f) According to the registrant's principal accountant for the fiscal year ended July 31, 2024, the percentage of hours spent on the audit of the registrant's financial statements for the most recent fiscal year that were attributed to work performed by persons who were not full-time, permanent employees of principal accountant was less than 50%.

(g) The aggregate non-audit fees billed by the registrant's principal accountant for non-audit services rendered to the registrant and rendered to the registrant's control affiliates were $1,091,664 for the fiscal year ended July 31, 2024 and $1,272,994 for the fiscal year ended July 31, 2023.

(h) The audit committee of the registrant has considered the non-audit services provided by the registrant's principal accountant to the control affiliates and has determined that the services that were not pre-approved are compatible with maintaining the principal accountant's independence.

(i) Not applicable.

(j) Not applicable.


ITEM 5. AUDIT COMMITTEE OF LISTED REGISTRANTS.

The registrant has a separately-designated standing audit committee comprised of independent trustees. The members of the audit committee are as follows:

Frances G. Rathke – Chairperson

William H. Cunningham

Hassell H. McClellan


ITEM 6. SCHEDULE OF INVESTMENTS.

(a) Refer to information included in Item 7.

(b) Not applicable.


ITEM 7. FINANCIAL STATEMENTS AND FINANCIAL HIGHLIGHTS FOR OPEN-END MANAGEMENT INVESTMENT COMPANIES.

The Registrant prepared financial statements and financial highlights for the year ended July 31, 2024 for the following funds:

John Hancock Funds II

  • John Hancock Fundamental All Cap Core Fund

  • John Hancock Multi-Asset Absolute Return Fund


Annual Financial Statements & Other N-CSR Items
John Hancock
Fundamental All Cap Core Fund
U.S. equity
July 31, 2024


Fund’s investments
AS OF 7-31-24
        Shares Value
Common stocks 98.1%         $530,371,669
(Cost $378,282,972)          
Communication services 9.7%     52,471,777
Entertainment 3.3%      
Liberty Media Corp.-Liberty Formula One, Series C (A)     159,600 12,906,852
Warner Brothers Discovery, Inc. (A)     543,252 4,699,130
Interactive media and services 6.4%      
Alphabet, Inc., Class A     179,731 30,831,056
CarGurus, Inc. (A)     162,560 4,034,739
Consumer discretionary 22.3%     120,600,521
Automobile components 1.2%      
Mobileye Global, Inc., Class A (A)     307,879 6,465,459
Broadline retail 7.3%      
Amazon.com, Inc. (A)     212,585 39,749,140
Hotels, restaurants and leisure 2.1%      
Las Vegas Sands Corp.     144,013 5,712,996
Vail Resorts, Inc.     30,091 5,476,863
Household durables 5.9%      
Lennar Corp., Class A     137,645 24,353,530
NVR, Inc. (A)     890 7,660,657
Leisure products 1.2%      
Polaris, Inc.     80,831 6,731,606
Specialty retail 3.6%      
Avolta AG (A)     131,472 4,960,626
Group 1 Automotive, Inc.     39,066 14,287,218
Textiles, apparel and luxury goods 1.0%      
Canada Goose Holdings, Inc. (A)     315,279 3,641,472
Salvatore Ferragamo SpA     179,012 1,560,954
Consumer staples 1.4%     7,621,117
Beverages 1.4%      
Anheuser-Busch InBev SA/NV, ADR     128,086 7,621,117
Energy 4.9%     26,303,589
Oil, gas and consumable fuels 4.9%      
Cheniere Energy, Inc.     101,098 18,464,539
Suncor Energy, Inc.     196,369 7,839,050
Financials 15.9%     85,948,274
Banks 3.4%      
First Hawaiian, Inc.     734,913 18,402,222
SEE NOTES TO FINANCIAL STATEMENTS  | JOHN HANCOCK FUNDAMENTAL ALL CAP CORE FUND 2

        Shares Value
Financials (continued)      
Capital markets 12.5%      
KKR & Company, Inc.     188,157 $23,227,982
Morgan Stanley     201,260 20,772,045
S&P Global, Inc.     21,332 10,340,260
The Goldman Sachs Group, Inc.     25,943 13,205,765
Health care 7.1%     38,127,879
Biotechnology 1.3%      
Alnylam Pharmaceuticals, Inc. (A)     11,254 2,672,375
Moderna, Inc. (A)     34,759 4,143,968
Health care equipment and supplies 1.9%      
Hologic, Inc. (A)     127,301 10,389,035
Health care providers and services 1.6%      
Elevance Health, Inc.     15,771 8,390,645
Life sciences tools and services 1.9%      
Avantor, Inc. (A)     250,634 6,704,460
Thermo Fisher Scientific, Inc.     5,733 3,516,278
Pharmaceuticals 0.4%      
Elanco Animal Health, Inc. (A)     177,233 2,311,118
Industrials 6.1%     33,054,151
Electrical equipment 2.0%      
Regal Rexnord Corp.     56,001 8,998,241
Sensata Technologies Holding PLC     44,310 1,727,647
Machinery 1.6%      
Parker-Hannifin Corp.     15,951 8,951,063
Trading companies and distributors 2.5%      
United Rentals, Inc.     17,669 13,377,200
Information technology 26.2%     141,913,227
Semiconductors and semiconductor equipment 11.6%      
Analog Devices, Inc.     72,997 16,890,046
NVIDIA Corp.     314,860 36,844,917
Texas Instruments, Inc.     44,235 9,015,535
Software 10.5%      
Autodesk, Inc. (A)     25,661 6,351,611
Microsoft Corp.     14,997 6,273,995
Oracle Corp.     64,621 9,011,398
Roper Technologies, Inc.     13,420 7,310,545
Salesforce, Inc.     55,677 14,409,208
Workday, Inc., Class A (A)     60,634 13,771,194
Technology hardware, storage and peripherals 4.1%      
Apple, Inc.     99,220 22,034,778
3 JOHN HANCOCK FUNDAMENTAL ALL CAP CORE FUND |  SEE NOTES TO FINANCIAL STATEMENTS

        Shares Value
Materials 1.0%     $5,555,874
Chemicals 1.0%      
Axalta Coating Systems, Ltd. (A)     155,845 5,555,874
Real estate 3.5%     18,775,260
Real estate management and development 0.2%      
Five Point Holdings LLC, Class A (A)     275,797 923,920
Specialized REITs 3.3%      
American Tower Corp.     5,948 1,310,939
Crown Castle, Inc.     150,258 16,540,401
    
    Yield (%)   Shares Value
Short-term investments 1.8%         $9,662,611
(Cost $9,659,634)          
Short-term funds 1.8%         9,662,611
John Hancock Collateral Trust (B) 5.4652(C)   966,271 9,662,611
    
Total investments (Cost $387,942,606) 99.9%     $540,034,280
Other assets and liabilities, net 0.1%       735,842
Total net assets 100.0%         $540,770,122
    
The percentage shown for each investment category is the total value of the category as a percentage of the net assets of the fund.
Security Abbreviations and Legend
ADR American Depositary Receipt
(A) Non-income producing security.
(B) Investment is an affiliate of the fund, the advisor and/or subadvisor.
(C) The rate shown is the annualized seven-day yield as of 7-31-24.
At 7-31-24, the aggregate cost of investments for federal income tax purposes was $390,331,570. Net unrealized appreciation aggregated to $149,702,710, of which $163,910,701 related to gross unrealized appreciation and $14,207,991 related to gross unrealized depreciation.
SEE NOTES TO FINANCIAL STATEMENTS  | JOHN HANCOCK FUNDAMENTAL ALL CAP CORE FUND 4

Financial statements
STATEMENT OF ASSETS AND LIABILITIES 7-31-24

Assets  
Unaffiliated investments, at value (Cost $378,282,972) $530,371,669
Affiliated investments, at value (Cost $9,659,634) 9,662,611
Total investments, at value (Cost $387,942,606) 540,034,280
Foreign currency, at value (Cost $52) 52
Dividends and interest receivable 294,745
Receivable for fund shares sold 1,183,607
Receivable from affiliates 10,579
Other assets 77,079
Total assets 541,600,342
Liabilities  
Payable for fund shares repurchased 659,880
Payable to affiliates  
Accounting and legal services fees 15,204
Transfer agent fees 39,812
Distribution and service fees 40
Trustees’ fees 650
Other liabilities and accrued expenses 114,634
Total liabilities 830,220
Net assets $540,770,122
Net assets consist of  
Paid-in capital $393,740,258
Total distributable earnings (loss) 147,029,864
Net assets $540,770,122
 
Net asset value per share  
Based on net asset value and shares outstanding - the fund has an unlimited number of shares authorized with no par value  
Class A ($164,887,076 ÷ 4,663,340 shares)1 $35.36
Class C ($20,636,935 ÷ 628,634 shares)1 $32.83
Class I ($252,146,007 ÷ 6,921,224 shares) $36.43
Class R2 ($191,909 ÷ 5,408 shares) $35.49
Class R4 ($118,080 ÷ 3,259 shares) $36.23
Class R6 ($102,790,115 ÷ 2,802,563 shares) $36.68
Maximum offering price per share  
Class A (net asset value per share ÷ 95%)2 $37.22
    
1 Redemption price per share is equal to net asset value less any applicable contingent deferred sales charge.
2 On single retail sales of less than $50,000. On sales of $50,000 or more and on group sales the offering price is reduced.
5 JOHN HANCOCK FUNDAMENTAL ALL CAP CORE FUND |  SEE NOTES TO FINANCIAL STATEMENTS

STATEMENT OF OPERATIONS For the year ended 7-31-24

Investment income  
Dividends $4,722,515
Dividends from affiliated investments 571,607
Less foreign taxes withheld (59,999)
Total investment income 5,234,123
Expenses  
Investment management fees 2,742,531
Distribution and service fees 543,429
Accounting and legal services fees 78,356
Transfer agent fees 381,740
Trustees’ fees 9,309
Custodian fees 59,057
State registration fees 141,196
Printing and postage 44,526
Professional fees 110,169
Other 26,464
Total expenses 4,136,777
Less expense reductions (316,943)
Net expenses 3,819,834
Net investment income 1,414,289
Realized and unrealized gain (loss)  
Net realized gain (loss) on  
Unaffiliated investments and foreign currency transactions 10,922,770
Affiliated investments 1,571
  10,924,341
Change in net unrealized appreciation (depreciation) of  
Unaffiliated investments 88,225,697
Affiliated investments 2,834
  88,228,531
Net realized and unrealized gain 99,152,872
Increase in net assets from operations $100,567,161
SEE NOTES TO FINANCIAL STATEMENTS  | JOHN HANCOCK FUNDAMENTAL ALL CAP CORE FUND 6

STATEMENTS OF CHANGES IN NET ASSETS  

  Year ended
7-31-24
Year ended
7-31-23
Increase (decrease) in net assets    
From operations    
Net investment income $1,414,289 $480,486
Net realized gain (loss) 10,924,341 (16,022,090)
Change in net unrealized appreciation (depreciation) 88,228,531 49,847,498
Increase in net assets resulting from operations 100,567,161 34,305,894
Distributions to shareholders    
From earnings    
Class A (156,556) (4,240,407)
Class C (479,220)
Class I (599,500) (3,616,165)
Class R2 (68) (5,547)
Class R4 (314) (3,639)
Class R6 (345,150) (2,682,185)
Total distributions (1,101,588) (11,027,163)
From fund share transactions 122,430,237 14,058,030
Total increase 221,895,810 37,336,761
Net assets    
Beginning of year 318,874,312 281,537,551
End of year $540,770,122 $318,874,312
7 JOHN HANCOCK FUNDAMENTAL ALL CAP CORE FUND |  SEE NOTES TO FINANCIAL STATEMENTS

Financial highlights
CLASS A SHARES Period ended 7-31-24 7-31-23 7-31-22 7-31-21 7-31-20
Per share operating performance          
Net asset value, beginning of period $28.42 $26.23 $29.93 $21.48 $18.51
Net investment income (loss)1 0.05 2 (0.06) (0.10) (0.02)
Net realized and unrealized gain (loss) on investments 6.93 3.36 (2.58) 9.29 2.99
Total from investment operations 6.98 3.36 (2.64) 9.19 2.97
Less distributions          
From net investment income (0.04) 2
From net realized gain (1.17) (1.06) (0.74)
Total distributions (0.04) (1.17) (1.06) (0.74) 2
Net asset value, end of period $35.36 $28.42 $26.23 $29.93 $21.48
Total return (%)3,4 24.58 14.00 (9.29) 43.58 16.05
Ratios and supplemental data          
Net assets, end of period (in millions) $165 $112 $91 $74 $53
Ratios (as a percentage of average net assets):          
Expenses before reductions 1.20 1.24 1.23 1.31 1.40
Expenses including reductions 1.13 1.13 1.12 1.24 1.27
Net investment income (loss) 0.16 5 (0.21) (0.39) (0.11)
Portfolio turnover (%) 12 36 25 18 22
    
1 Based on average daily shares outstanding.
2 Less than $0.005 per share.
3 Total returns would have been lower had certain expenses not been reduced during the applicable periods.
4 Does not reflect the effect of sales charges, if any.
5 Less than 0.005%.
SEE NOTES TO FINANCIAL STATEMENTS  | JOHN HANCOCK FUNDAMENTAL ALL CAP CORE FUND 8

CLASS C SHARES Period ended 7-31-24 7-31-23 7-31-22 7-31-21 7-31-20
Per share operating performance          
Net asset value, beginning of period $26.54 $24.75 $28.48 $20.62 $17.89
Net investment loss1 (0.14) (0.17) (0.24) (0.27) (0.15)
Net realized and unrealized gain (loss) on investments 6.43 3.13 (2.43) 8.87 2.88
Total from investment operations 6.29 2.96 (2.67) 8.60 2.73
Less distributions          
From net realized gain (1.17) (1.06) (0.74)
Net asset value, end of period $32.83 $26.54 $24.75 $28.48 $20.62
Total return (%)2,3 23.70 13.19 (9.88) 42.51 15.26
Ratios and supplemental data          
Net assets, end of period (in millions) $21 $12 $10 $8 $6
Ratios (as a percentage of average net assets):          
Expenses before reductions 1.90 1.94 1.93 2.01 2.10
Expenses including reductions 1.83 1.83 1.82 1.94 1.97
Net investment loss (0.54) (0.71) (0.91) (1.09) (0.81)
Portfolio turnover (%) 12 36 25 18 22
    
1 Based on average daily shares outstanding.
2 Total returns would have been lower had certain expenses not been reduced during the applicable periods.
3 Does not reflect the effect of sales charges, if any.
9 JOHN HANCOCK FUNDAMENTAL ALL CAP CORE FUND |  SEE NOTES TO FINANCIAL STATEMENTS

CLASS I SHARES Period ended 7-31-24 7-31-23 7-31-22 7-31-21 7-31-20
Per share operating performance          
Net asset value, beginning of period $29.26 $26.89 $30.56 $21.86 $18.82
Net investment income (loss)1 0.13 0.08 0.03 (0.03) 0.04
Net realized and unrealized gain (loss) on investments 7.15 3.46 (2.64) 9.47 3.03
Total from investment operations 7.28 3.54 (2.61) 9.44 3.07
Less distributions          
From net investment income (0.11) (0.03)
From net realized gain (1.17) (1.06) (0.74)
Total distributions (0.11) (1.17) (1.06) (0.74) (0.03)
Net asset value, end of period $36.43 $29.26 $26.89 $30.56 $21.86
Total return (%)2 24.95 14.33 (9.00) 43.97 16.34
Ratios and supplemental data          
Net assets, end of period (in millions) $252 $123 $120 $38 $18
Ratios (as a percentage of average net assets):          
Expenses before reductions 0.90 0.94 0.93 1.01 1.10
Expenses including reductions 0.83 0.83 0.83 0.94 0.97
Net investment income (loss) 0.45 0.31 0.10 (0.10) 0.19
Portfolio turnover (%) 12 36 25 18 22
    
1 Based on average daily shares outstanding.
2 Total returns would have been lower had certain expenses not been reduced during the applicable periods.
SEE NOTES TO FINANCIAL STATEMENTS  | JOHN HANCOCK FUNDAMENTAL ALL CAP CORE FUND 10

CLASS R2 SHARES Period ended 7-31-24 7-31-23 7-31-22 7-31-21 7-31-20
Per share operating performance          
Net asset value, beginning of period $28.52 $26.34 $30.07 $21.61 $18.64
Net investment income (loss)1 0.02 (0.02) (0.09) (0.13) (0.04)
Net realized and unrealized gain (loss) on investments 6.96 3.37 (2.58) 9.33 3.01
Total from investment operations 6.98 3.35 (2.67) 9.20 2.97
Less distributions          
From net investment income (0.01)
From net realized gain (1.17) (1.06) (0.74)
Total distributions (0.01) (1.17) (1.06) (0.74)
Net asset value, end of period $35.49 $28.52 $26.34 $30.07 $21.61
Total return (%)2 24.49 13.89 (9.35) 43.35 15.93
Ratios and supplemental data          
Net assets, end of period (in millions) $—3 $—3 $—3 $—3 $—3
Ratios (as a percentage of average net assets):          
Expenses before reductions 1.29 1.33 1.32 1.40 1.49
Expenses including reductions 1.21 1.21 1.21 1.34 1.36
Net investment income (loss) 0.07 (0.09) (0.30) (0.49) (0.21)
Portfolio turnover (%) 12 36 25 18 22
    
1 Based on average daily shares outstanding.
2 Total returns would have been lower had certain expenses not been reduced during the applicable periods.
3 Less than $500,000.
11 JOHN HANCOCK FUNDAMENTAL ALL CAP CORE FUND |  SEE NOTES TO FINANCIAL STATEMENTS

CLASS R4 SHARES Period ended 7-31-24 7-31-23 7-31-22 7-31-21 7-31-20
Per share operating performance          
Net asset value, beginning of period $29.11 $26.77 $30.45 $21.79 $18.75
Net investment income (loss)1 0.13 0.06 0.01 (0.03) 0.01
Net realized and unrealized gain (loss) on investments 7.09 3.45 (2.63) 9.43 3.05
Total from investment operations 7.22 3.51 (2.62) 9.40 3.06
Less distributions          
From net investment income (0.10) (0.02)
From net realized gain (1.17) (1.06) (0.74)
Total distributions (0.10) (1.17) (1.06) (0.74) (0.02)
Net asset value, end of period $36.23 $29.11 $26.77 $30.45 $21.79
Total return (%)2 24.85 14.28 (9.06) 43.92 16.32
Ratios and supplemental data          
Net assets, end of period (in millions) $—3 $—3 $—3 $—3 $—3
Ratios (as a percentage of average net assets):          
Expenses before reductions 1.06 1.11 1.08 1.15 1.24
Expenses including reductions 0.89 0.89 0.87 0.99 1.00
Net investment income (loss) 0.40 0.23 0.04 (0.13) 0.06
Portfolio turnover (%) 12 36 25 18 22
    
1 Based on average daily shares outstanding.
2 Total returns would have been lower had certain expenses not been reduced during the applicable periods.
3 Less than $500,000.
SEE NOTES TO FINANCIAL STATEMENTS  | JOHN HANCOCK FUNDAMENTAL ALL CAP CORE FUND 12

CLASS R6 SHARES Period ended 7-31-24 7-31-23 7-31-22 7-31-21 7-31-20
Per share operating performance          
Net asset value, beginning of period $29.45 $27.03 $30.68 $21.92 $18.86
Net investment income1 0.17 0.10 0.06 2 0.06
Net realized and unrealized gain (loss) on investments 7.20 3.49 (2.65) 9.50 3.05
Total from investment operations 7.37 3.59 (2.59) 9.50 3.11
Less distributions          
From net investment income (0.14) (0.05)
From net realized gain (1.17) (1.06) (0.74)
Total distributions (0.14) (1.17) (1.06) (0.74) (0.05)
Net asset value, end of period $36.68 $29.45 $27.03 $30.68 $21.92
Total return (%)3 25.10 14.44 (8.90) 44.12 16.49
Ratios and supplemental data          
Net assets, end of period (in millions) $103 $72 $61 $24 $16
Ratios (as a percentage of average net assets):          
Expenses before reductions 0.79 0.83 0.82 0.90 0.99
Expenses including reductions 0.72 0.72 0.72 0.84 0.85
Net investment income 0.57 0.40 0.20 0.01 0.30
Portfolio turnover (%) 12 36 25 18 22
    
1 Based on average daily shares outstanding.
2 Less than $0.005 per share.
3 Total returns would have been lower had certain expenses not been reduced during the applicable periods.
13 JOHN HANCOCK FUNDAMENTAL ALL CAP CORE FUND |  SEE NOTES TO FINANCIAL STATEMENTS

Notes to financial statements
Note 1Organization
John Hancock Fundamental All Cap Core Fund (the fund) is a series of John Hancock Funds II (the Trust), an open-end management investment company organized as a Massachusetts business trust and registered under the Investment Company Act of 1940, as amended (the 1940 Act). The investment objective of the fund is to seek long-term capital appreciation.
The fund may offer multiple classes of shares. The shares currently outstanding are detailed in the Statement of assets and liabilities. Class A and Class C shares are offered to all investors. Class I shares are offered to institutions and certain investors. Class R2 and Class R4 shares are available only to certain retirement and 529 plans. Class R6 shares are only available to certain retirement plans, institutions and other investors. Class C shares convert to Class A shares eight years after purchase (certain exclusions may apply). Shareholders of each class have exclusive voting rights to matters that affect that class. The distribution and service fees, if any, and transfer agent fees for each class may differ.
Note 2Significant accounting policies
The financial statements have been prepared in conformity with accounting principles generally accepted in the United States of America (US GAAP), which require management to make certain estimates and assumptions as of the date of the financial statements. Actual results could differ from those estimates and those differences could be significant. The fund qualifies as an investment company under Topic 946 of Accounting Standards Codification of US GAAP.
Events or transactions occurring after the end of the fiscal period through the date that the financial statements were issued have been evaluated in the preparation of the financial statements. The following summarizes the significant accounting policies of the fund:
Security valuation. Investments are stated at value as of the scheduled close of regular trading on the New York Stock Exchange (NYSE), normally at 4:00 P.M., Eastern Time. In case of emergency or other disruption resulting in the NYSE not opening for trading or the NYSE closing at a time other than the regularly scheduled close, the net asset value (NAV) may be determined as of the regularly scheduled close of the NYSE pursuant to the Valuation Policies and Procedures of the Advisor, John Hancock Investment Management LLC.
In order to value the securities, the fund uses the following valuation techniques: Equity securities, including exchange-traded or closed-end funds, are typically valued at the last sale price or official closing price on the exchange or principal market where the security trades. In the event there were no sales during the day or closing prices are not available, the securities are valued using the last available bid price. Investments by the fund in open-end mutual funds, including John Hancock Collateral Trust (JHCT), are valued at their respective NAVs each business day. Foreign securities and currencies are valued in U.S. dollars based on foreign currency exchange rates supplied by an independent pricing vendor.
In certain instances, the Pricing Committee of the Advisor may determine to value equity securities using prices obtained from another exchange or market if trading on the exchange or market on which prices are typically obtained did not open for trading as scheduled, or if trading closed earlier than scheduled, and trading occurred as normal on another exchange or market.
Other portfolio securities and assets, for which reliable market quotations are not readily available, are valued at fair value as determined in good faith by the Pricing Committee following procedures established by the Advisor and adopted by the Board of Trustees. The frequency with which these fair valuation procedures are used cannot be predicted and fair value of securities may differ significantly from the value that would have been used had a ready market for such securities existed. Trading in foreign securities may be completed before the scheduled daily close of trading on the NYSE. Significant events at the issuer or market level may affect the values of securities between the time when the valuation of the securities is generally determined and the close of the NYSE. If a significant event occurs, these securities may be fair valued, as determined in good faith by the Pricing Committee,
   | JOHN HANCOCK Fundamental All Cap Core Fund 14

following procedures established by the Advisor and adopted by the Board of Trustees. The Advisor uses fair value adjustment factors provided by an independent pricing vendor to value certain foreign securities in order to adjust for events that may occur between the close of foreign exchanges or markets and the close of the NYSE.
The fund uses a three tier hierarchy to prioritize the pricing assumptions, referred to as inputs, used in valuation techniques to measure fair value. Level 1 includes securities valued using quoted prices in active markets for identical securities, including registered investment companies. Level 2 includes securities valued using other significant observable inputs. Observable inputs may include quoted prices for similar securities, interest rates, prepayment speeds and credit risk. Prices for securities valued using these inputs are received from independent pricing vendors and brokers and are based on an evaluation of the inputs described. Level 3 includes securities valued using significant unobservable inputs when market prices are not readily available or reliable, including the Advisor’s assumptions in determining the fair value of investments. Factors used in determining value may include market or issuer specific events or trends, changes in interest rates and credit quality. The inputs or methodology used for valuing securities are not necessarily an indication of the risks associated with investing in those securities. Changes in valuation techniques and related inputs may result in transfers into or out of an assigned level within the disclosure hierarchy.
The following is a summary of the values by input classification of the fund’s investments as of July 31, 2024, by major security category or type:
  Total
value at
7-31-24
Level 1
quoted
price
Level 2
significant
observable
inputs
Level 3
significant
unobservable
inputs
Investments in securities:        
Assets        
Common stocks        
Communication services $52,471,777 $52,471,777
Consumer discretionary 120,600,521 114,078,941 $6,521,580
Consumer staples 7,621,117 7,621,117
Energy 26,303,589 26,303,589
Financials 85,948,274 85,948,274
Health care 38,127,879 38,127,879
Industrials 33,054,151 33,054,151
Information technology 141,913,227 141,913,227
Materials 5,555,874 5,555,874
Real estate 18,775,260 18,775,260
Short-term investments 9,662,611 9,662,611
Total investments in securities $540,034,280 $533,512,700 $6,521,580
Real estate investment trusts. The fund may invest in real estate investment trusts (REITs). Distributions from REITs may be recorded as income and subsequently characterized by the REIT at the end of their fiscal year as a reduction of cost of investments and/or as a realized gain. As a result, the fund will estimate the components of distributions from these securities. Such estimates are revised when the actual components of the distributions are known.
Security transactions and related investment income. Investment security transactions are accounted for on a trade date plus one basis for daily NAV calculations. However, for financial reporting purposes, investment transactions are reported on trade date. Dividend income is recorded on ex-date, except for dividends of certain foreign securities where the dividend may not be known until after the ex-date. In those cases, dividend income,
15 JOHN HANCOCK Fundamental All Cap Core Fund |   

net of withholding taxes, is recorded when the fund becomes aware of the dividends. Non-cash dividends, if any, are recorded at the fair market value of the securities received. Gains and losses on securities sold are determined on the basis of identified cost and may include proceeds from litigation.
Foreign investing. Assets, including investments, and liabilities denominated in foreign currencies are translated into U.S. dollar values each day at the prevailing exchange rate. Purchases and sales of securities, income and expenses are translated into U.S. dollars at the prevailing exchange rate on the date of the transaction. The effect of changes in foreign currency exchange rates on the value of securities is reflected as a component of the realized and unrealized gains (losses) on investments. Foreign investments are subject to a decline in the value of a foreign currency versus the U.S. dollar, which reduces the dollar value of securities denominated in that currency.
Funds that invest internationally generally carry more risk than funds that invest strictly in U.S. securities. Risks can result from differences in economic and political conditions, regulations, market practices (including higher transaction costs), accounting standards and other factors.
Foreign taxes. The fund may be subject to withholding tax on income, capital gains or repatriations imposed by certain countries, a portion of which may be recoverable. Foreign taxes are accrued based upon the fund’s understanding of the tax rules and rates that exist in the foreign markets in which it invests. Taxes are accrued based on gains realized by the fund as a result of certain foreign security sales. In certain circumstances, estimated taxes are accrued based on unrealized appreciation of such securities. Investment income is recorded net of foreign withholding taxes.
Overdraft. The fund may have the ability to borrow from banks for temporary or emergency purposes, including meeting redemption requests that otherwise might require the untimely sale of securities. Pursuant to the fund’s custodian agreement, the custodian may loan money to the fund to make properly authorized payments. The fund is obligated to repay the custodian for any overdraft, including any related costs or expenses. The custodian may have a lien, security interest or security entitlement in any fund property that is not otherwise segregated or pledged, to the extent of any overdraft, and to the maximum extent permitted by law.
Line of credit. The fund and other affiliated funds have entered into a syndicated line of credit agreement with Citibank, N.A. as the administrative agent that enables them to participate in a $1 billion unsecured committed line of credit. Excluding commitments designated for a certain fund and subject to the needs of all other affiliated funds, the fund can borrow up to an aggregate commitment amount of $750 million, subject to asset coverage and other limitations as specified in the agreement. A commitment fee payable at the end of each calendar quarter, based on the average daily unused portion of the line of credit, is charged to each participating fund based on a combination of fixed and asset-based allocations and is reflected in Other expenses on the Statement of operations. For the year ended July 31, 2024, the fund had no borrowings under the line of credit. Commitment fees for the year ended July 31, 2024 were $4,797.
Expenses. Within the John Hancock group of funds complex, expenses that are directly attributable to an individual fund are allocated to such fund. Expenses that are not readily attributable to a specific fund are allocated among all funds in an equitable manner, taking into consideration, among other things, the nature and type of expense and the fund’s relative net assets. Expense estimates are accrued in the period to which they relate and adjustments are made when actual amounts are known.
Class allocations. Income, common expenses and realized and unrealized gains (losses) are determined at the fund level and allocated daily to each class of shares based on the net assets of the class. Class-specific expenses, such as distribution and service fees, if any, and transfer agent fees, for all classes, are charged daily at the class level based on the net assets of each class and the specific expense rates applicable to each class.
Federal income taxes. The fund intends to continue to qualify as a regulated investment company by complying with the applicable provisions of the Internal Revenue Code and will not be subject to federal income tax on taxable income that is distributed to shareholders. Therefore, no federal income tax provision is required.
   | JOHN HANCOCK Fundamental All Cap Core Fund 16

For federal income tax purposes, as of July 31, 2024, the fund has a short-term capital loss carryforward of $3,471,104 available to offset future net realized capital gains. This carryforward does not expire.
As of July 31, 2024, the fund had no uncertain tax positions that would require financial statement recognition, derecognition or disclosure. The fund’s federal tax returns are subject to examination by the Internal Revenue Service for a period of three years.
Distribution of income and gains. Distributions to shareholders from net investment income and net realized gains, if any, are recorded on the ex-date. The fund generally declares and pays dividends annually. Capital gain distributions, if any, are typically distributed annually.
The tax character of distributions for the years ended July 31, 2024 and 2023 was as follows:
  July 31, 2024 July 31, 2023
Ordinary income $1,101,588
Long-term capital gains $11,027,163
Total $1,101,588 $11,027,163
Distributions paid by the fund with respect to each class of shares are calculated in the same manner, at the same time and in the same amount, except for the effect of class level expenses that may be applied differently to each class. As of July 31, 2024, the components of distributable earnings on a tax basis consisted of $798,258 of undistributed ordinary income.
Such distributions and distributable earnings, on a tax basis, if any, are determined in conformity with income tax regulations, which may differ from US GAAP. Distributions in excess of tax basis earnings and profits, if any, are reported in the fund’s financial statements as a return of capital. 
Capital accounts within the financial statements are adjusted for permanent book-tax differences at fiscal year end. These adjustments have no impact on net assets or the results of operations. Temporary book-tax differences, if any, will reverse in a subsequent period. Book-tax differences are primarily attributable to wash sale loss deferrals.
Note 3Guarantees and indemnifications
Under the Trust’s organizational documents, its Officers and Trustees are indemnified against certain liabilities arising out of the performance of their duties to the Trust, including the fund. Additionally, in the normal course of business, the fund enters into contracts with service providers that contain general indemnification clauses. The fund’s maximum exposure under these arrangements is unknown, as this would involve future claims that may be made against the fund that have not yet occurred. The risk of material loss from such claims is considered remote.
Note 4Fees and transactions with affiliates
John Hancock Investment Management LLC (the Advisor) serves as investment advisor for the fund. John Hancock Investment Management Distributors LLC (the Distributor), an affiliate of the Advisor, serves as principal underwriter of the fund. The Advisor and the Distributor are indirect, principally owned subsidiaries of John Hancock Life Insurance Company (U.S.A.), which in turn is a subsidiary of Manulife Financial Corporation.
Management fee.  The fund has an investment management agreement with the Advisor under which the fund pays a daily management fee to the Advisor equivalent, on an annual basis, to the sum of: a) 0.675% of the first $2.5 billion of the fund’s aggregate net assets; and b) 0.650% of the aggregate net assets in excess of $2.5 billion. Aggregate net assets are the net assets of the fund, Fundamental All Cap Core Trust, a series of John Hancock Variable Insurance Trust; and, effective November 2, 2023, the net assets of Fundamental All Cap Core
17 JOHN HANCOCK Fundamental All Cap Core Fund |   

ETF, a series of John Hancock Exchange-Traded Fund Trust. The Advisor has a subadvisory agreement with Manulife Investment Management (US) LLC, an indirectly owned subsidiary of Manulife Financial Corporation and an affiliate of the Advisor. The fund is not responsible for payment of the subadvisory fees.
The Advisor has contractually agreed to waive a portion of its management fee and/or reimburse expenses for certain funds of the John Hancock group of funds complex, including the fund (the participating portfolios). This waiver is based upon aggregate net assets of all the participating portfolios. The amount of the reimbursement is calculated daily and allocated among all the participating portfolios in proportion to the daily net assets of each fund. During the year ended July 31, 2024, this waiver amounted to 0.01% of the fund’s average daily net assets. This agreement expires on July 31, 2026, unless renewed by mutual agreement of the fund and the Advisor based upon a determination that this is appropriate under the circumstances at that time.
The Advisor has contractually agreed to reduce its management fee or, if necessary, make payment to the fund in an amount equal to the amount by which expenses of the fund exceed 0.71% of average daily net assets of the fund. For purposes of this agreement, “expenses of the fund” means all fund expenses, excluding taxes, brokerage commissions, interest expense, litigation and indemnification expenses and other extraordinary expenses not incurred in the ordinary course of the fund’s business, class-specific expenses, borrowing costs, prime brokerage fees, acquired fund fees and expenses paid indirectly, and short dividend expense. This agreement expires on December 31, 2024, unless renewed by mutual agreement of the fund and the advisor based upon a determination that this is appropriate under the circumstances at that time.
For the year ended July 31, 2024, the expense reductions described above amounted to the following:
Class Expense reduction
Class A $100,927
Class C 11,890
Class I 140,150
Class R2 123
Class Expense reduction
Class R4 $80
Class R6 63,673
Total $316,843
 
Expenses waived or reimbursed in the current fiscal period are not subject to recapture in future fiscal periods.
The investment management fees, including the impact of the waivers and reimbursements as described above, incurred for the year ended July 31, 2024, were equivalent to a net annual effective rate of 0.60% of the fund’s average daily net assets.
Accounting and legal services. Pursuant to a service agreement, the fund reimburses the Advisor for all expenses associated with providing the administrative, financial, legal, compliance, accounting and recordkeeping services to the fund, including the preparation of all tax returns, periodic reports to shareholders and regulatory reports, among other services. These expenses are allocated to each share class based on its relative net assets at the time the expense was incurred. These accounting and legal services fees incurred, for the year ended July 31, 2024, amounted to an annual rate of 0.02% of the fund’s average daily net assets.
Distribution and service plans. The fund has a distribution agreement with the Distributor. The fund has adopted distribution and service plans for certain classes as detailed below pursuant to Rule 12b-1 under the 1940 Act, to pay the Distributor for services provided as the distributor of shares of the fund. In addition, under a service plan for certain classes as detailed below, the fund pays for certain other services. The fund may pay up to the following contractual rates of distribution and service fees under these arrangements, expressed as an annual percentage of average daily net assets for each class of the fund’s shares:
   | JOHN HANCOCK Fundamental All Cap Core Fund 18

Class Rule 12b-1 Fee Service fee
Class A 0.30%
Class C 1.00%
Class R2 0.25% 0.25%
Class R4 0.25% 0.10%
The fund’s Distributor has contractually agreed to waive 0.10% of Rule12b-1 fees for Class R4 shares. The current waiver agreement expires on December 31, 2024, unless renewed by mutual agreement of the fund and the Distributor based upon a determination that this is appropriate under the circumstances at the time. This contractual waiver amounted to $100 for Class R4 shares for the year ended July 31, 2024.
Sales charges. Class A shares are assessed up-front sales charges, which resulted in payments to the Distributor amounting to $359,590 for the year ended July 31, 2024. Of this amount, $60,365 was retained and used for printing prospectuses, advertising, sales literature and other purposes and $299,225 was paid as sales commissions to broker-dealers.
Class A and Class C shares may be subject to contingent deferred sales charges (CDSCs). Certain Class A shares purchased, including those that are acquired through purchases of $1 million or more, and redeemed within one year of purchase are subject to a 1.00% sales charge. Class C shares that are redeemed within one year of purchase are subject to a 1.00% CDSC. CDSCs are applied to the lesser of the current market value at the time of redemption or the original purchase cost of the shares being redeemed. Proceeds from CDSCs are used to compensate the Distributor for providing distribution-related services in connection with the sale of these shares. During the year ended July 31, 2024, CDSCs received by the Distributor amounted to $1,889 and $3,126 for Class A and Class C shares, respectively.
Transfer agent fees. The John Hancock group of funds has a complex-wide transfer agent agreement with John Hancock Signature Services, Inc. (Signature Services), an affiliate of the Advisor. The transfer agent fees paid to Signature Services are determined based on the cost to Signature Services (Signature Services Cost) of providing recordkeeping services. It also includes out-of-pocket expenses, including payments made to third-parties for recordkeeping services provided to their clients who invest in one or more John Hancock funds. In addition, Signature Services Cost may be reduced by certain fees that Signature Services receives in connection with retirement and small accounts. Signature Services Cost is calculated monthly and allocated, as applicable, to five categories of share classes: Retail Share and Institutional Share Classes of Non-Municipal Bond Funds, Class R6 Shares, Retirement Share Classes and Municipal Bond Share Classes. Within each of these categories, the applicable costs are allocated to the affected John Hancock affiliated funds and/or classes, based on the relative average daily net assets.
Class level expenses. Class level expenses for the year ended July 31, 2024 were as follows:
Class Distribution and service fees Transfer agent fees
Class A $389,058 $150,290
Class C 153,321 17,762
Class I 209,481
Class R2 779 8
Class R4 271 5
Class R6 4,194
Total $543,429 $381,740
Trustee expenses. The fund compensates each Trustee who is not an employee of the Advisor or its affiliates. The costs of paying Trustee compensation and expenses are allocated to the fund based on its net assets relative to other funds within the John Hancock group of funds complex.
19 JOHN HANCOCK Fundamental All Cap Core Fund |   

Note 5Fund share transactions
Transactions in fund shares for the years ended July 31, 2024 and 2023 were as follows:
  Year Ended 7-31-24 Year Ended 7-31-23
  Shares Amount Shares Amount
Class A shares        
Sold 1,691,821 $51,770,724 1,315,971 $33,452,680
Distributions reinvested 5,175 156,037 189,351 4,239,568
Repurchased (958,971) (29,335,635) (1,056,848) (26,356,825)
Net increase 738,025 $22,591,126 448,474 $11,335,423
Class C shares        
Sold 297,908 $8,409,014 153,627 $3,617,670
Distributions reinvested 22,820 479,220
Repurchased (114,548) (3,316,464) (124,677) (2,922,791)
Net increase 183,360 $5,092,550 51,770 $1,174,099
Class I shares        
Sold 5,206,102 $160,417,166 3,396,943 $87,900,603
Distributions reinvested 19,328 599,346 157,054 3,615,390
Repurchased (2,517,835) (77,793,656) (3,788,873) (94,974,774)
Net increase (decrease) 2,707,595 $83,222,856 (234,876) $(3,458,781)
Class R2 shares        
Sold 645 $20,898 231 $5,604
Distributions reinvested 2 53 191 4,303
Repurchased (319) (10,136) (48) (1,200)
Net increase 328 $10,815 374 $8,707
Class R4 shares        
Sold 108 $3,305 114 $2,910
Distributions reinvested 2 64 29 659
Repurchased (55) (1,739) (21) (572)
Net increase 55 $1,630 122 $2,997
Class R6 shares        
Sold 1,073,114 $33,951,792 894,840 $23,215,674
Distributions reinvested 11,062 345,123 115,861 2,682,185
Repurchased (725,757) (22,785,655) (814,879) (20,902,274)
Net increase 358,419 $11,511,260 195,822 $4,995,585
Total net increase 3,987,782 $122,430,237 461,686 $14,058,030
Affiliates of the fund owned 78% and 15% of shares of Class R4 and Class R6, respectively, on July 31, 2024. Such concentration of shareholders’ capital could have a material effect on the fund if such shareholders redeem from the fund.
   | JOHN HANCOCK Fundamental All Cap Core Fund 20

Note 6Purchase and sale of securities
Purchases and sales of securities, other than short-term investments, amounted to $165,637,275 and $48,261,350, respectively, for the year ended July 31, 2024.
Note 7Industry or sector risk
The fund may invest a large percentage of its assets in one or more particular industries or sectors of the economy. If a large percentage of the fund’s assets are economically tied to a single or small number of industries or sectors of the economy, the fund will be less diversified than a more broadly diversified fund, and it may cause the fund to underperform if that industry or sector underperforms. In addition, focusing on a particular industry or sector may make the fund’s NAV more volatile. Further, a fund that invests in particular industries or sectors is particularly susceptible to the impact of market, economic, regulatory and other factors affecting those industries or sectors.
Note 8Investment in affiliated underlying funds
The fund may invest in affiliated underlying funds that are managed by the Advisor and its affiliates. Information regarding the fund’s fiscal year to date purchases and sales of the affiliated underlying funds as well as income and capital gains earned by the fund, if any, is as follows:
              Dividends and distributions
Affiliate Ending
share
amount
Beginning
value
Cost of
purchases
Proceeds
from shares
sold
Realized
gain
(loss)
Change in
unrealized
appreciation
(depreciation)
Income
distributions
received
Capital gain
distributions
received
Ending
value
John Hancock Collateral Trust 966,271 $4,811,553 $168,355,446 $(163,508,793) $1,571 $2,834 $571,607 $9,662,611
21 JOHN HANCOCK Fundamental All Cap Core Fund |   

Report of Independent Registered Public Accounting Firm

To the Board of Trustees of John Hancock Funds II and Shareholders of John Hancock Fundamental All Cap Core Fund
Opinion on the Financial Statements
We have audited the accompanying statement of assets and liabilities, including the fund’s investments, of John Hancock Fundamental All Cap Core Fund (the "Fund") as of July 31, 2024, the related statement of operations for the year ended July 31, 2024, the statements of changes in net assets for each of the two years in the period ended July 31, 2024, including the related notes, and the financial highlights for each of the five years in the period ended July 31, 2024 (collectively referred to as the “financial statements”). In our opinion, the financial statements present fairly, in all material respects, the financial position of the Fund as of July 31, 2024, the results of its operations for the year then ended, the changes in its net assets for each of the two years in the period ended July 31, 2024 and the financial highlights for each of the five years in the period ended July 31, 2024 in conformity with accounting principles generally accepted in the United States of America. 
Basis for Opinion
These financial statements are the responsibility of the Fund’s management. Our responsibility is to express an opinion on the Fund’s financial statements based on our audits. We are a public accounting firm registered with the Public Company Accounting Oversight Board (United States) (PCAOB) and are required to be independent with respect to the Fund in accordance with the U.S. federal securities laws and the applicable rules and regulations of the Securities and Exchange Commission and the PCAOB.
We conducted our audits of these financial statements in accordance with the standards of the PCAOB. Those standards require that we plan and perform the audit to obtain reasonable assurance about whether the financial statements are free of material misstatement, whether due to error or fraud.
Our audits included performing procedures to assess the risks of material misstatement of the financial statements, whether due to error or fraud, and performing procedures that respond to those risks. Such procedures included examining, on a test basis, evidence regarding the amounts and disclosures in the financial statements. Our audits also included evaluating the accounting principles used and significant estimates made by management, as well as evaluating the overall presentation of the financial statements. Our procedures included confirmation of securities owned as of July 31, 2024 by correspondence with the custodian and transfer agent. We believe that our audits provide a reasonable basis for our opinion.
PricewaterhouseCoopers LLP
Boston, Massachusetts
September 12, 2024
We have served as the auditor of one or more investment companies in the John Hancock group of funds since 1988.
   | JOHN HANCOCK FUNDAMENTAL ALL CAP CORE FUND 22

Tax information
(Unaudited)
For federal income tax purposes, the following information is furnished with respect to the distributions of the fund, if any, paid during its taxable year ended July 31, 2024.
The fund reports the maximum amount allowable of its net taxable income as eligible for the corporate dividends-received deduction.
The fund reports the maximum amount allowable of its net taxable income as qualified dividend income as provided in the Jobs and Growth Tax Relief Reconciliation Act of 2003.
The fund reports the maximum amount allowable as Section 163(j) Interest Dividends.
The fund reports the maximum amount allowable of its Section 199A dividends as defined in Proposed Treasury Regulation §1.199A-3(d).
Eligible shareholders will be mailed a 2024 Form 1099-DIV in early 2025. This will reflect the tax character of all distributions paid in calendar year 2024.
Please consult a tax advisor regarding the tax consequences of your investment in the fund.
23 JOHN HANCOCK FUNDAMENTAL ALL CAP CORE FUND |   

EVALUATION OF ADVISORY AND SUBADVISORY AGREEMENTS BY THE BOARD OF TRUSTEES

This section describes the evaluation by the Board of Trustees (the Board) of John Hancock Funds II (the Trust) of the Advisory Agreement (the Advisory Agreement) with John Hancock Investment Management LLC (the Advisor) and the Subadvisory Agreement (the Subadvisory Agreement) with Manulife Investment Management (US) LLC (the Subadvisor) for John Hancock Fundamental All Cap Core Fund (the fund). The Advisory Agreement and Subadvisory Agreement are collectively referred to as the Agreements. Prior to the June 24-27, 2024 meeting at which the Agreements were approved, the Board also discussed and considered information regarding the proposed continuation of the Agreements at the meeting held on May 28 – May 30, 2024. The Trustees who are not “interested persons” of the Trust as defined by the Investment Company Act of 1940, as amended (the 1940 Act) (the Independent Trustees) also met separately to evaluate and discuss the information presented, including with counsel to the Independent Trustees and a third-party consulting firm.
Approval of Advisory and Subadvisory Agreements
At meetings held on June 24-27, 2024, the Board, including the Trustees who are not parties to any Agreement or considered to be interested persons of the Trust under the 1940 Act, reapproved for an annual period the continuation of the Advisory Agreement between the Trust and the Advisor and the Subadvisory Agreement between the Advisor and the Subadvisor with respect to the fund.
In considering the Advisory Agreement and the Subadvisory Agreement, the Board received in advance of the meetings a variety of materials relating to the fund, the Advisor and the Subadvisor, including comparative performance, fee and expense information for a peer group of similar funds prepared by an independent third-party provider of fund data, performance information for an applicable benchmark index; and, with respect to the Subadvisor, comparative performance information for comparably managed accounts, as applicable, and other information provided by the Advisor and the Subadvisor regarding the nature, extent and quality of services provided by the Advisor and the Subadvisor under their respective Agreements, as well as information regarding the Advisor’s revenues and costs of providing services to the fund and any compensation paid to affiliates of the Advisor. At the meetings at which the renewal of the Advisory Agreement and Subadvisory Agreement are considered, particular focus is given to information concerning fund performance, comparability of fees and total expenses, and profitability. However, the Board noted that the evaluation process with respect to the Advisor and the Subadvisor is an ongoing one. In this regard, the Board also took into account discussions with management and information provided to the Board (including its various committees) at prior meetings with respect to the services provided by the Advisor and the Subadvisor to the fund, including quarterly performance reports prepared by management containing reviews of investment results and prior presentations from the Subadvisor with respect to the fund. The information received and considered by the Board in connection with the May and June meetings and throughout the year was both written and oral. The Board noted the affiliation of the Subadvisor with the Advisor, noting any potential conflicts of interest. The Board also considered the nature, quality, and extent of non-advisory services, if any, to be provided to the fund by the Advisor’s affiliates, including distribution services. The Board considered the Advisory Agreement and the Subadvisory Agreement separately in the course of its review. In doing so, the Board noted the respective roles of the Advisor and Subadvisor in providing services to the fund.
Throughout the process, the Board asked questions of and requested additional information from management. The Board is assisted by counsel for the Trust and the Independent Trustees are also separately assisted by independent legal counsel throughout the process. The Independent Trustees also received a memorandum from their independent legal counsel discussing the legal standards for their consideration of the proposed continuation of the Agreements and discussed the proposed continuation of the Agreements in private sessions with their independent legal counsel at which no representatives of management were present.
   | JOHN HANCOCK FUNDAMENTAL ALL CAP CORE FUND 24

Approval of Advisory Agreement
In approving the Advisory Agreement with respect to the fund, the Board, including the Independent Trustees, considered a variety of factors, including those discussed below. The Board also considered other factors (including conditions and trends prevailing generally in the economy, the securities markets, and the industry) and did not treat any single factor as determinative, and each Trustee may have attributed different weights to different factors. The Board’s conclusions may be based in part on its consideration of the advisory and subadvisory arrangements in prior years and on the Board’s ongoing regular review of fund performance and operations throughout the year.
Nature, extent, and quality of services. Among the information received by the Board from the Advisor relating to the nature, extent, and quality of services provided to the fund, the Board reviewed information provided by the Advisor relating to its operations and personnel, descriptions of its organizational and management structure, and information regarding the Advisor’s compliance and regulatory history, including its Form ADV. The Board also noted that on a regular basis it receives and reviews information from the Trust’s Chief Compliance Officer (CCO) regarding the fund’s compliance policies and procedures established pursuant to Rule 38a-1 under the 1940 Act. The Board observed that the scope of services provided by the Advisor, and of the undertakings required of the Advisor in connection with those services, including maintaining and monitoring its own and the fund’s compliance programs, risk management programs, liquidity risk management programs, derivatives risk management programs, and cybersecurity programs, had expanded over time as a result of regulatory, market and other developments. The Board considered that the Advisor is responsible for the management of the day-to-day operations of the fund, including, but not limited to, general supervision of and coordination of the services provided by the Subadvisor, and is also responsible for monitoring and reviewing the activities of the Subadvisor and third-party service providers. The Board also considered the significant risks assumed by the Advisor in connection with the services provided to the fund including entrepreneurial risk in sponsoring new funds and ongoing risks including investment, operational, enterprise, litigation, regulatory and compliance risks with respect to all funds.
In considering the nature, extent, and quality of the services provided by the Advisor, the Trustees also took into account their knowledge of the Advisor’s management and the quality of the performance of the Advisor’s duties, through Board meetings, discussions and reports during the preceding year and through each Trustee’s experience as a Trustee of the Trust and of the other trusts in the John Hancock group of funds complex (the John Hancock Fund Complex).
In the course of their deliberations regarding the Advisory Agreement, the Board considered, among other things:
(a) the skills and competency with which the Advisor has in the past managed the Trust’s affairs and its subadvisory relationship, the Advisor’s oversight and monitoring of the Subadvisor’s investment performance and compliance programs, such as the Subadvisor’s compliance with fund policies and objectives, review of brokerage matters, including with respect to trade allocation and best execution and the Advisor’s timeliness in responding to performance issues;
(b) the background, qualifications and skills of the Advisor’s personnel;
(c) the Advisor’s compliance policies and procedures and its responsiveness to regulatory changes and fund industry developments;
(d) the Advisor’s administrative capabilities, including its ability to supervise the other service providers for the fund, as well as the Advisor’s oversight of any securities lending activity, its monitoring of class action litigation and collection of class action settlements on behalf of the fund, and bringing loss recovery actions on behalf of the fund;
(e) the financial condition of the Advisor and whether it has the financial wherewithal to provide a high level and quality of services to the fund;
25 JOHN HANCOCK FUNDAMENTAL ALL CAP CORE FUND  |   

(f) the Advisor’s initiatives intended to improve various aspects of the Trust’s operations and investor experience with the fund; and
(g) the Advisor’s reputation and experience in serving as an investment advisor to the Trust and the benefit to shareholders of investing in funds that are part of a family of funds offering a variety of investments.
The Board concluded that the Advisor may reasonably be expected to continue to provide a high quality of services under the Advisory Agreement with respect to the fund.
Investment performance. In considering the fund’s performance, the Board noted that it reviews at its regularly scheduled meetings information about the fund’s performance results. In connection with the consideration of the Advisory Agreement, the Board:
(a) reviewed information prepared by management regarding the fund’s performance;
(b) considered the comparative performance of an applicable benchmark index;
(c) considered the performance of comparable funds, if any, as included in the report prepared by an independent third-party provider of fund data; and
(d) took into account the Advisor’s analysis of the fund’s performance and its plans and recommendations regarding the Trust’s subadvisory arrangements generally.
The Board noted that while it found the data provided by the independent third-party generally useful it recognized its limitations, including in particular that the data may vary depending on the end date selected and the results of the performance comparisons may vary depending on the selection of the peer group. The Board noted that the fund outperformed its benchmark index for the one-, three-, five-and ten-year periods ended December 31, 2023. The Board also noted that the fund outperformed its peer group median for the one-, three-, five- and ten-year periods ended December 31, 2023. The Board took into account management’s discussion of the fund’s performance, including the favorable performance relative to the benchmark index and peer group median for the one-,three-, five- and ten-year periods. The Board concluded that the fund’s performance has generally been in line with or outperformed the historical performance of comparable funds and the fund’s benchmark index.
Fees and expenses.  The Board reviewed comparative information prepared by an independent third-party provider of fund data, including, among other data, the fund’s contractual and net management fees (and subadvisory fees, to the extent available) and total expenses as compared to similarly situated investment companies deemed to be comparable to the fund in light of the nature, extent and quality of the management and advisory and subadvisory services provided by the Advisor and the Subadvisor. The Board considered the fund’s ranking within a smaller group of peer funds chosen by the independent third-party provider, as well as the fund’s ranking within a broader group of funds. In comparing the fund’s contractual and net management fees to those of comparable funds, the Board noted that such fees include both advisory and administrative costs. The Board noted that net management fees and net total expenses for the fund are lower than the peer group median.
The Board also took into account management’s discussion with respect to the overall management fee and the fees of the Subadvisor, including the amount of the advisory fee retained by the Advisor after payment of the subadvisory fee, in each case in light of the services rendered for those amounts and the risks undertaken by the Advisor. The Board also noted that the Advisor pays the subadvisory fee. In addition, the Board took into account that management had agreed to implement an overall fee waiver across the complex, including the fund, which is discussed further below. The Board also noted actions taken over the past several years to reduce the fund’s operating expenses. The Board also noted that, in addition, the Advisor is currently waiving fees and/or reimbursing expenses with respect to the fund and that the fund has breakpoints in its contractual management fee schedule that reduces management fees as assets increase. The Board reviewed information provided by the Advisor concerning the investment advisory fee charged by the Advisor or one of its advisory affiliates to other
   | JOHN HANCOCK FUNDAMENTAL ALL CAP CORE FUND 26

clients (including other funds in the John Hancock Fund Complex) having similar investment mandates, if any. The Board considered any differences between the Advisor’s and Subadvisor’s services to the fund and the services they provide to other comparable clients or funds. The Board concluded that the advisory fee paid with respect to the fund is reasonable in light of the nature, extent and quality of the services provided to the fund under the Advisory Agreement.
Profitability/Fall out benefits. In considering the costs of the services to be provided and the profits to be realized by the Advisor and its affiliates (including the Subadvisor) from the Advisor’s relationship with the Trust, the Board:
(a) reviewed financial information of the Advisor;
(b) reviewed and considered information presented by the Advisor regarding the net profitability to the Advisor and its affiliates with respect to the fund;
(c) received and reviewed profitability information with respect to the John Hancock Fund Complex as a whole and with respect to the fund;
(d) received information with respect to the Advisor’s allocation methodologies used in preparing the profitability data and considered that the Advisor hired an independent third-party consultant to provide an analysis of the Advisor’s allocation methodologies;
(e) considered that the John Hancock insurance companies that are affiliates of the Advisor, as shareholders of the Trust directly or through their separate accounts, receive certain tax credits or deductions relating to foreign taxes paid and dividends received by certain funds of the Trust and noted that these tax benefits, which are not available to participants in qualified retirement plans under applicable income tax law, are reflected in the profitability information reviewed by the Board;
(f) considered that the Advisor also provides administrative services to the fund on a cost basis pursuant to an administrative services agreement;
(g) noted that affiliates of the Advisor provide transfer agency services and distribution services to the fund, and that the fund’s distributor also receives Rule 12b-1 payments to support distribution of the fund;
(h) noted that the fund’s Subadvisor is an affiliate of the Advisor;
(i) noted that the Advisor also derives reputational and other indirect benefits from providing advisory services to the fund;
(j) noted that the subadvisory fee for the fund is paid by the Advisor;
(k) considered the Advisor’s ongoing costs and expenditures necessary to improve services, meet new regulatory and compliance requirements, and adapt to other challenges impacting the fund industry; and
(l) considered that the Advisor should be entitled to earn a reasonable level of profits in exchange for the level of services it provides to the fund and the risks that it assumes as Advisor, including entrepreneurial, operational, reputational, litigation and regulatory risk.
Based upon its review, the Board concluded that the level of profitability, if any, of the Advisor and its affiliates (including the Subadvisor) from their relationship with the fund was reasonable and not excessive.
Economies of scale. In considering the extent to which economies of scale would be realized as the fund grows and whether fee levels reflect these economies of scale for the benefit of fund shareholders, the Board:
(a) considered that the Advisor has contractually agreed to waive a portion of its management fee for certain funds of the John Hancock Fund Complex, including the fund (the participating portfolios) or
27 JOHN HANCOCK FUNDAMENTAL ALL CAP CORE FUND  |   

  otherwise reimburse the expenses of the participating portfolios (the reimbursement). This waiver is based upon aggregate net assets of all the participating portfolios. The amount of the reimbursement is calculated daily and allocated among all the participating portfolios in proportion to the daily net assets of each fund;
(b) reviewed the fund’s advisory fee structure and concluded that: (i) the fund’s fee structure contains breakpoints at the subadvisory fee level and that such breakpoints are reflected as breakpoints in the advisory fees for the fund; and (ii) although economies of scale cannot be measured with precision, these arrangements permit shareholders of the fund to benefit from economies of scale if the fund grows. The Board also took into account management’s discussion of the fund’s advisory fee structure; and
(c) the Board also considered the effect of the fund’s growth in size on its performance and fees. The Board also noted that if the fund’s assets increase over time, the fund may realize other economies of scale.
Approval of Subadvisory Agreement
In making its determination with respect to approval of the Subadvisory Agreement, the Board reviewed:
(1) information relating to the Subadvisor’s business, including current subadvisory services to the fund (and other funds in the John Hancock Fund Complex);
(2) the historical and current performance of the fund and comparative performance information relating to an applicable benchmark index and comparable funds; and
(3) the subadvisory fee for the fund, including any breakpoints, and to the extent available, comparable fee information prepared by an independent third party provider of fund data.
Nature, extent, and quality of services.
With respect to the services provided by the Subadvisor, the Board received information provided to the Board by the Subadvisor, including the Subadvisor’s Form ADV, as well as took into account information presented throughout the past year. The Board considered the Subadvisor’s current level of staffing and its overall resources, as well as received information relating to the Subadvisor’s compensation program. The Board reviewed the Subadvisor’s history and investment experience, as well as information regarding the qualifications, background, and responsibilities of the Subadvisor’s investment and compliance personnel who provide services to the fund. The Board also considered, among other things, the Subadvisor’s compliance program and any disciplinary history. The Board also considered the Subadvisor’s risk assessment and monitoring process. The Board reviewed the Subadvisor’s regulatory history, including whether it was involved in any regulatory actions or investigations as well as material litigation, and any settlements and amelioratory actions undertaken, as appropriate. The Board noted that the Advisor conducts regular, periodic reviews of the Subadvisor and its operations, including regarding investment processes and organizational and staffing matters. The Board also noted that the Trust’s CCO and his staff conduct regular, periodic compliance reviews with the Subadvisor and present reports to the Independent Trustees regarding the same, which includes evaluating the regulatory compliance systems of the Subadvisor and procedures reasonably designed to assure compliance with the federal securities laws. The Board also took into account the financial condition of the Subadvisor.
The Board considered the Subadvisor’s investment process and philosophy. The Board took into account that the Subadvisor’s responsibilities include the development and maintenance of an investment program for the fund that is consistent with the fund’s investment objective, the selection of investment securities and the placement of orders for the purchase and sale of such securities, as well as the implementation of compliance controls related to performance of these services. The Board also received information with respect to the Subadvisor’s brokerage policies and practices, including with respect to best execution and soft dollars.
   | JOHN HANCOCK FUNDAMENTAL ALL CAP CORE FUND 28

Subadvisor compensation. In considering the cost of services to be provided by the Subadvisor and the profitability to the Subadvisor of its relationship with the fund, the Board noted that the fees under the Subadvisory Agreement are paid by the Advisor and not the fund. The Board also received information and took into account any other potential conflicts of interest the Advisor might have in connection with the Subadvisory Agreement.
In addition, the Board considered other potential indirect benefits that the Subadvisor and its affiliates may receive from the Subadvisor’s relationship with the fund, such as the opportunity to provide advisory services to additional funds in the John Hancock Fund Complex and reputational benefits.
Subadvisory fees. The Board considered that the fund pays an advisory fee to the Advisor and that, in turn, the Advisor pays a subadvisory fee to the Subadvisor. As noted above, the Board also considered the fund’s subadvisory fees as compared to similarly situated investment companies deemed to be comparable to the fund as included in the report prepared by the independent third party provider of fund data, to the extent available. The Board noted that the limited size of the Lipper peer group was not sufficient for comparative purposes. The Board also took into account the subadvisory fees paid by the Advisor to the Subadvisor with respect to the fund and compared them to fees charged by the Subadvisor to manage other subadvised portfolios and portfolios not subject to regulation under the 1940 Act, as applicable.
Subadvisor performance.
As noted above, the Board considered the fund’s performance as compared to the fund’s peer group and the benchmark index and noted that the Board reviews information about the fund’s performance results at its regularly scheduled meetings. The Board noted the Advisor’s expertise and resources in monitoring the performance, investment style and risk-adjusted performance of the Subadvisor. The Board was mindful of the Advisor’s focus on the Subadvisor’s performance. The Board also noted the Subadvisor’s long-term performance record for similar accounts, as applicable.
The Board’s decision to approve the Subadvisory Agreement was based on a number of determinations, including the following:
(1) the Subadvisor has extensive experience and demonstrated skills as a manager;
(2) the fund’s performance has generally been in line with or outperformed the historical performance of comparable funds and the fund’s benchmark index;
(3) the subadvisory fee is reasonable in relation to the level and quality of services being provided under the Subadvisory agreement; and
(4) noted that the subadvisory fees are paid by the Advisor not the fund and that the subadvisory fee breakpoints are reflected as breakpoints in the advisory fees for the fund in order to permit shareholders to benefit from economies of scale if the fund grows.
***
Based on the Board’s evaluation of all factors that the Board deemed to be material, including those factors described above, the Board, including the Independent Trustees, concluded that renewal of the Advisory Agreement and the Subadvisory Agreement would be in the best interest of the fund and its shareholders. Accordingly, the Board, and the Independent Trustees voting separately, approved the Advisory Agreement and Subadvisory Agreement for an additional one-year period.
29 JOHN HANCOCK FUNDAMENTAL ALL CAP CORE FUND  |   

A better way to invest
We serve investors globally through a unique multimanager approach:
We search the world to find proven portfolio teams with specialized
expertise for every strategy we offer, then we apply robust investment
oversight to ensure they continue to meet our uncompromising
standards and serve the best interests of our shareholders.
Results for investors
Our unique approach to asset management enables us to provide
a diverse set of investments backed by some of the world’s best
managers, along with strong risk-adjusted returns across asset classes.
John Hancock Investment Management Distributors LLC, Member FINRA, SIPC
200 Berkeley Street, Boston, MA 02116, 800-225-5291, jhinvestments.com
Manulife Investment Management, the Stylized M Design, and Manulife Investment Management & Stylized M Design are trademarks of The Manufacturers Life Insurance Company and are used by its affiliates under license.
NOT FDIC INSURED. MAY LOSE VALUE. NO BANK GUARANTEE. NOT INSURED BY ANY GOVERNMENT AGENCY.
This report is for the information of the shareholders of John Hancock Fundamental All Cap Core Fund. It is not authorized for distribution to prospective investors unless preceded or accompanied by a prospectus.
MF3743804 376A 7/24
9/24


Annual Financial Statements & Other N-CSR Items
John Hancock
Multi-Asset Absolute Return Fund
Alternative
July 31, 2024


Fund’s investments
AS OF 7-31-24
        Shares Value
Common stocks 88.5%         $294,609,949
(Cost $217,438,748)          
Brazil 0.4%         1,405,615
Ambev SA   250,100 512,037
Cia de Saneamento Basico do Estado de Sao Paulo   6,200 96,724
Cia de Saneamento Basico do Estado de Sao Paulo, ADR   4,480 70,022
CPFL Energia SA   24,800 142,412
Hypera SA   59,400 302,453
M Dias Branco SA   59,200 281,967
Canada 0.2%         702,718
The Toronto-Dominion Bank   11,900 702,718
China 1.7%         5,535,406
Alibaba Group Holding, Ltd., ADR   8,111 639,552
Baidu, Inc., ADR (A)   2,603 230,548
China Construction Bank Corp., H Shares   759,000 529,999
China Longyuan Power Group Corp., Ltd., H Shares   459,000 411,566
China Railway Group, Ltd., H Shares   64,000 31,210
China Resources Sanjiu Medical & Pharmaceutical Company, Ltd., Class A   13,362 76,335
Chinasoft International, Ltd. (A)   190,000 92,588
Hengan International Group Company, Ltd.   13,500 42,172
Industrial & Commercial Bank of China, Ltd., H Shares   602,000 333,497
Inner Mongolia Yili Industrial Group Company, Ltd., Class A   131,900 458,199
Meituan, Class B (A)(B)   550 7,616
Midea Group Company, Ltd., Class A   26,900 237,244
Ming Yang Smart Energy Group, Ltd., Class A   195,725 269,870
NetEase, Inc., ADR   3,387 311,977
PICC Property & Casualty Company, Ltd., H Shares   84,000 110,151
Ping An Insurance Group Company of China, Ltd., H Shares   108,000 469,003
Shandong Weigao Group Medical Polymer Company, Ltd., H Shares   81,600 41,406
Sinopharm Group Company, Ltd., H Shares   206,400 484,120
Tencent Holdings, Ltd.   8,300 383,016
Tianhe Chemicals Group, Ltd. (A)(B)(C)   4,848,409 0
Titan Wind Energy Suzhou Company, Ltd., Class A   41,697 49,210
Vipshop Holdings, Ltd., ADR   7,524 102,627
Wuliangye Yibin Company, Ltd., Class A   6,900 121,228
Yum China Holdings, Inc.   3,382 102,272
Denmark 2.0%         6,846,438
Novo Nordisk A/S, Class B   51,674 6,846,438
France 1.9%         6,487,443
LVMH Moet Hennessy Louis Vuitton SE   1,567 1,105,304
Sanofi   21,499 2,216,389
SEE NOTES TO FINANCIAL STATEMENTS  | JOHN HANCOCK MULTI-ASSET ABSOLUTE RETURN FUND 2

        Shares Value
France (continued)          
Vinci SA   27,741 $3,165,750
Germany 1.5%         4,950,409
Allianz SE   8,085 2,277,267
Deutsche Telekom AG   102,194 2,673,142
Hong Kong 0.1%         203,258
China Metal Recycling Holdings, Ltd. (A)(C)   1,799,400 0
China Resources Land, Ltd.   68,000 203,258
Hungary 0.0%         5,788
Richter Gedeon NYRT   203 5,788
Indonesia 0.2%         551,071
Telkom Indonesia Persero Tbk PT   3,102,800 551,071
Ireland 1.9%         6,421,472
Accenture PLC, Class A   16,482 5,449,279
Medtronic PLC   12,104 972,193
Israel 0.6%         1,980,526
Check Point Software Technologies, Ltd. (A)   10,796 1,980,526
Japan 1.3%         4,502,518
Hoya Corp.   12,100 1,516,140
KDDI Corp.   46,600 1,402,195
Nippon Telegraph & Telephone Corp.   1,486,500 1,584,183
Mexico 0.4%         1,190,312
Arca Continental SAB de CV   23,200 228,588
Coca-Cola Femsa SAB de CV   14,345 129,614
Fomento Economico Mexicano SAB de CV   10,300 113,626
Grupo Financiero Banorte SAB de CV, Series O   40,600 304,887
Kimberly-Clark de Mexico SAB de CV, Class A   232,100 413,597
Netherlands 0.2%         604,354
Prosus NV (A)   17,325 604,354
Philippines 0.0%         35,703
PLDT, Inc.   1,375 35,703
South Africa 0.2%         752,064
Naspers, Ltd., N Shares   2,267 438,656
Nedbank Group, Ltd.   6,055 92,730
Standard Bank Group, Ltd.   18,106 220,678
South Korea 1.4%         4,536,675
Cheil Worldwide, Inc.   8,375 108,440
DB Insurance Company, Ltd.   516 41,691
Hyundai Glovis Company, Ltd.   3,988 354,963
3 JOHN HANCOCK MULTI-ASSET ABSOLUTE RETURN FUND |  SEE NOTES TO FINANCIAL STATEMENTS

        Shares Value
South Korea (continued)          
Hyundai Mobis Company, Ltd.   1,314 $212,592
LG Corp.   786 50,125
NongShim Company, Ltd.   615 216,387
Samsung Electronics Company, Ltd.   19,711 1,215,425
Samsung Fire & Marine Insurance Company, Ltd.   2,954 803,279
Samsung SDS Company, Ltd.   4,070 440,419
SK Square Company, Ltd. (A)   2,378 150,835
SK Telecom Company, Ltd.   21,877 865,651
SK Telecom Company, Ltd., ADR   3,427 76,868
Spain 1.1%         3,577,815
Iberdrola SA   270,878 3,577,815
Switzerland 0.9%         2,937,440
Chubb, Ltd.   3,559 981,074
Nestle SA   19,314 1,956,366
Taiwan 1.7%         5,549,869
Hon Hai Precision Industry Company, Ltd.   39,000 239,262
Sinbon Electronics Company, Ltd.   12,000 120,609
Taiwan Semiconductor Manufacturing Company, Ltd.   74,000 2,158,677
Taiwan Semiconductor Manufacturing Company, Ltd., ADR   18,283 3,031,321
Thailand 0.1%         454,430
Advanced Info Service PCL   8,700 57,180
Bangkok Bank PCL   12,300 47,290
Thai Beverage PCL   248,900 93,992
Thai Union Group PCL   628,400 255,968
United Kingdom 2.8%         9,375,316
Diageo PLC   108,032 3,361,402
Reckitt Benckiser Group PLC   42,429 2,282,402
Rightmove PLC   67,441 501,075
St. James’s Place PLC   198,218 1,746,050
Unilever PLC   24,229 1,484,387
United States 67.9%         226,003,309
Adobe, Inc. (A)   9,013 4,972,021
Advanced Micro Devices, Inc. (A)   10,440 1,508,371
Air Products & Chemicals, Inc.   7,299 1,925,841
Akamai Technologies, Inc. (A)   22,451 2,206,484
Alphabet, Inc., Class A   82,841 14,210,542
American Electric Power Company, Inc.   15,426 1,513,599
Automatic Data Processing, Inc.   33,180 8,713,732
AutoZone, Inc. (A)   1,823 5,712,717
Baxter International, Inc.   18,876 676,138
Becton, Dickinson and Company   17,333 4,178,293
SEE NOTES TO FINANCIAL STATEMENTS  | JOHN HANCOCK MULTI-ASSET ABSOLUTE RETURN FUND 4

        Shares Value
United States (continued)          
Booking Holdings, Inc.   698 $2,593,077
Bristol-Myers Squibb Company   20,491 974,552
Cadence Design Systems, Inc. (A)   12,822 3,431,937
Centene Corp. (A)   19,858 1,527,477
Cisco Systems, Inc.   96,321 4,666,752
Colgate-Palmolive Company   37,777 3,747,101
Comcast Corp., Class A   86,089 3,552,893
Conagra Brands, Inc.   50,487 1,530,766
CVS Health Corp.   46,968 2,833,579
Duke Energy Corp.   4,399 480,679
eBay, Inc.   80,311 4,466,095
Elevance Health, Inc.   9,700 5,160,691
Emerson Electric Company   9,928 1,162,668
Eversource Energy   14,097 915,036
Fiserv, Inc. (A)   12,697 2,076,848
Fortinet, Inc. (A)   94,866 5,506,023
General Mills, Inc.   8,734 586,401
Global Payments, Inc.   25,068 2,547,912
Globe Life, Inc.   5,568 516,376
Intuit, Inc.   708 458,324
Johnson & Johnson   39,671 6,262,067
Kenvue, Inc.   65,132 1,204,291
Labcorp Holdings, Inc.   11,991 2,583,341
Marsh & McLennan Companies, Inc.   17,839 3,970,426
Mastercard, Inc., Class A   11,436 5,302,988
McDonald’s Corp.   13,910 3,691,714
Merck & Company, Inc.   9,636 1,090,121
Meta Platforms, Inc., Class A   5,507 2,614,889
Microsoft Corp.   29,883 12,501,553
Mondelez International, Inc., Class A   48,617 3,322,972
Monster Beverage Corp. (A)   96,505 4,965,182
MSCI, Inc.   11,059 5,980,265
NextEra Energy, Inc.   22,109 1,688,907
NIKE, Inc., Class B   60,450 4,525,287
NVIDIA Corp.   7,848 918,373
Oracle Corp.   18,464 2,574,805
O’Reilly Automotive, Inc. (A)   929 1,046,370
Paychex, Inc.   17,547 2,246,367
PayPal Holdings, Inc. (A)   17,369 1,142,533
PepsiCo, Inc.   36,508 6,303,836
Pfizer, Inc.   23,386 714,208
Ross Stores, Inc.   17,974 2,574,416
Sempra   10,271 822,296
Starbucks Corp.   69,579 5,423,683
5 JOHN HANCOCK MULTI-ASSET ABSOLUTE RETURN FUND |  SEE NOTES TO FINANCIAL STATEMENTS

        Shares Value
United States (continued)          
Stryker Corp.   6,632 $2,171,648
Synopsys, Inc. (A)   3,360 1,875,955
Sysco Corp.   16,078 1,232,379
Texas Roadhouse, Inc.   26,720 4,665,579
The Cigna Group   13,341 4,651,606
The Coca-Cola Company   105,348 7,030,926
The Hershey Company   8,416 1,661,992
The J.M. Smucker Company   2,828 333,563
The Procter & Gamble Company   22,136 3,558,583
The TJX Companies, Inc.   30,090 3,400,772
The Toro Company   22,375 2,141,959
UnitedHealth Group, Inc.   4,013 2,312,130
Verizon Communications, Inc.   38,407 1,556,252
Visa, Inc., Class A   26,634 7,075,855
W.W. Grainger, Inc.   2,280 2,227,127
Waste Management, Inc.   11,266 2,283,168
    
  Rate (%) Maturity date   Par value^ Value
U.S. Government and Agency obligations 2.9% $9,508,787
(Cost $9,196,880)          
U.S. Government 2.9%       9,508,787
U.S. Treasury          
Note 0.625 05-15-30   359,200 297,799
Note 0.625 08-15-30   681,400 560,478
Note (D) 0.875 11-15-30   716,100 594,671
Note 1.250 08-15-31   650,800 542,681
Note 1.625 05-15-31   780,800 672,861
Note 1.750 11-15-29   336,700 302,215
Note (D) 1.875 02-15-32   1,272,600 1,097,816
Note 2.875 05-15-32   903,900 835,966
Note 3.375 05-15-33   633,200 602,282
Note 3.500 02-15-33   285,600 274,600
Note 4.000 02-15-34   1,527,000 1,520,558
Note (D) 4.125 11-15-32   970,900 978,333
Note 4.500 11-15-33   1,187,700 1,228,527
Foreign government obligations 0.0%       $154,562
(Cost $149,629)          
France 0.0%         154,562
Caisse Francaise de Financement Local          
Bond 0.010 10-19-35 EUR 200,000 154,562
SEE NOTES TO FINANCIAL STATEMENTS  | JOHN HANCOCK MULTI-ASSET ABSOLUTE RETURN FUND 6

  Rate (%) Maturity date   Par value^ Value
Corporate bonds 3.4%         $11,169,689
(Cost $11,364,786)          
Australia 0.0%         110,202
Bendigo & Adelaide Bank, Ltd. 4.020 10-04-26 EUR 100,000 110,202
Austria 0.1%         186,528
Erste Group Bank AG 0.010 09-11-29 EUR 200,000 186,528
Canada 0.0%         98,398
Federation des Caisses Desjardins du Quebec 0.050 11-26-27 EUR 100,000 98,398
Denmark 2.5%         8,244,150
Nykredit Realkredit A/S 1.000 07-01-25 DKK 3,900,000 555,261
Nykredit Realkredit A/S 2.500 10-01-53 DKK 1,509,453 196,664
Nykredit Realkredit A/S 4.000 10-01-53 DKK 15,492,334 2,233,368
Nykredit Realkredit A/S 5.000 10-01-53 DKK 2,362,351 347,235
Nykredit Realkredit A/S 5.000 10-01-53 DKK 12,310,421 1,813,219
Realkredit Danmark A/S 1.000 04-01-26 DKK 7,300,000 1,027,930
Realkredit Danmark A/S 1.500 10-01-53 DKK 17,605,826 2,070,473
France 0.6%         1,830,639
AXA Home Loan SFH SA 0.010 10-16-29 EUR 900,000 839,043
BPCE SFH SA 0.010 01-21-27 EUR 800,000 806,049
BPCE SFH SA 0.625 05-29-31 EUR 200,000 185,547
Japan 0.0%         93,683
Sumitomo Mitsui Banking Corp. 0.409 11-07-29 EUR 100,000 93,683
New Zealand 0.1%         178,855
ASB Bank, Ltd. 0.250 05-21-31 EUR 200,000 178,855
United Kingdom 0.1%         427,234
Santander UK PLC 0.500 01-10-25 EUR 400,000 427,234
    
Total investments (Cost $238,150,043) 94.8%     $315,442,987
Other assets and liabilities, net 5.2%     17,411,422
Total net assets 100.0%         $332,854,409
    
The percentage shown for each investment category is the total value of the category as a percentage of the net assets of the fund.
^All par values are denominated in U.S. dollars unless otherwise indicated.
Currency Abbreviations
DKK Danish Krone
EUR Euro
    
Security Abbreviations and Legend
ADR American Depositary Receipt
(A) Non-income producing security.
7 JOHN HANCOCK MULTI-ASSET ABSOLUTE RETURN FUND |  SEE NOTES TO FINANCIAL STATEMENTS

(B) This security is exempt from registration under Rule 144A of the Securities Act of 1933. Such securities may be resold, normally to qualified institutional buyers, in transactions exempt from registration.
(C) Security is valued using significant unobservable inputs and is classified as Level 3 in the fair value hierarchy. Refer to Note 2 to the financial statements.
(D) All or a portion of this security is segregated at the custodian as collateral for certain derivatives.
The fund had the following portfolio composition as a percentage of net assets on 7-31-24:
Common stocks 88.5%
Information technology 16.6%
Consumer staples 14.5%
Health care 14.2%
Consumer discretionary 12.4%
Financials 11.2%
Communication services 9.4%
Industrials 6.8%
Utilities 2.7%
Materials 0.6%
Real estate 0.1%
Corporate bonds 3.4%
U.S. Government and Agency obligations 2.9%
Other assets and liabilities, net 5.2%
TOTAL 100.0%
SEE NOTES TO FINANCIAL STATEMENTS  | JOHN HANCOCK MULTI-ASSET ABSOLUTE RETURN FUND 8

DERIVATIVES
FUTURES
Open contracts Number of
contracts
Position Expiration
date
Notional
basis^
Notional
value^
Unrealized
appreciation
(depreciation)
10-Year U.S. Treasury Note Futures 352 Long Sep 2024 $38,536,167 $39,501,000 $964,833
2-Year U.S. Treasury Note Futures 151 Long Oct 2024 30,788,293 31,054,094 265,801
5-Year U.S. Treasury Note Futures 820 Long Oct 2024 87,023,537 88,739,375 1,715,838
ASX SPI 200 Index Futures 34 Short Sep 2024 (4,288,706) (4,486,323) (197,617)
Euro STOXX 50 Index Futures 201 Short Sep 2024 (10,746,553) (10,663,442) 83,111
Euro-Bund Futures 92 Short Sep 2024 (12,929,685) (13,344,978) (415,293)
FTSE 100 Index Futures 66 Short Sep 2024 (6,979,690) (7,103,306) (123,616)
Mini MSCI Emerging Markets Index Futures 184 Short Sep 2024 (10,011,247) (10,084,120) (72,873)
Nikkei 225 Mini Index Futures 494 Short Sep 2024 (12,845,579) (12,748,600) 96,979
S&P 500 E-Mini Index Futures 169 Short Sep 2024 (46,502,092) (46,965,100) (463,008)
S&P Mid 400 E-Mini Index Futures 46 Short Sep 2024 (13,644,858) (14,352,460) (707,602)
            $1,146,553
^ Notional basis refers to the contractual amount agreed upon at inception of open contracts; notional value represents the current value of the open contract.
FORWARD FOREIGN CURRENCY CONTRACTS
Contract to buy Contract to sell Counterparty (OTC) Contractual
settlement
date
Unrealized
appreciation
Unrealized
depreciation
AUD 644,000 CAD 585,390 BARC 8/15/2024 $(2,868)
AUD 507,000 JPY 53,423,741 BARC 8/15/2024 (25,683)
AUD 2,566,000 JPY 276,329,346 GSI 8/15/2024 (169,748)
AUD 88,000 JPY 9,556,442 JPM 8/15/2024 (6,355)
AUD 270,000 NOK 1,895,183 GSI 8/15/2024 $2,870
AUD 1,869,000 SEK 13,291,928 BOA 8/15/2024 (19,365)
AUD 322,849 USD 213,121 BARC 8/15/2024 (1,917)
AUD 1,667,238 USD 1,101,491 BNP 8/15/2024 (10,802)
AUD 605,935 USD 404,894 BOA 8/15/2024 (8,498)
AUD 697,991 USD 466,971 GSI 8/15/2024 (10,353)
AUD 246,746 USD 165,113 JPM 8/15/2024 (3,694)
CAD 2,075,000 CHF 1,365,831 BOA 8/15/2024 (55,044)
CAD 2,438,313 EUR 1,655,000 GSI 8/15/2024 (25,510)
CAD 561,000 GBP 321,000 BARC 8/15/2024 (6,225)
CAD 1,125,929 GBP 650,000 GSI 8/15/2024 (19,888)
CAD 38,000 JPY 4,330,026 GSI 8/14/2024 (1,426)
CAD 741,789 NZD 893,000 BNP 8/15/2024 6,006
CAD 3,887,161 USD 2,833,500 BARC 8/14/2024 (17,003)
CAD 3,013,341 USD 2,205,000 BNP 8/14/2024 (21,642)
CAD 2,289,221 USD 1,680,000 BOA 8/14/2024 (21,313)
CAD 3,319,346 USD 2,428,500 GSI 8/14/2024 (23,421)
CAD 174,912 USD 127,825 BARC 8/15/2024 (1,087)
9 JOHN HANCOCK MULTI-ASSET ABSOLUTE RETURN FUND |  SEE NOTES TO FINANCIAL STATEMENTS

FORWARD FOREIGN CURRENCY CONTRACTS (continued)
Contract to buy Contract to sell Counterparty (OTC) Contractual
settlement
date
Unrealized
appreciation
Unrealized
depreciation
CAD 1,320 USD 968 BNP 8/15/2024 $(11)
CAD 9,920 USD 7,289 BOA 8/15/2024 (101)
CAD 136,792 USD 99,810 GSI 8/15/2024 (692)
CHF 664,037 EUR 688,500 BARC 8/15/2024 $12,128
CHF 660,863 EUR 688,500 BNP 8/15/2024 8,506
CHF 587,438 USD 658,766 BARC 8/15/2024 11,564
CHF 4,673,678 USD 5,209,472 BNP 8/15/2024 123,696
CHF 506,907 USD 572,794 BOA 8/15/2024 5,641
CHF 292,081 USD 329,983 GSI 8/15/2024 3,313
CHF 86,402 USD 98,493 JPM 8/15/2024 101
DKK 3,091,921 USD 447,464 BARC 8/15/2024 1,292
DKK 2,436,582 USD 352,433 BNP 8/15/2024 1,208
DKK 14,704,983 USD 2,142,834 BOA 8/15/2024 (8,580)
DKK 6,578,370 USD 946,277 GSI 8/15/2024 8,496
DKK 1,097,960 USD 158,095 JPM 8/15/2024 1,261
EUR 61,000 CHF 59,460 BARC 8/15/2024 (1,790)
EUR 42,000 CHF 41,247 BOA 8/15/2024 (1,584)
EUR 66,000 CHF 64,082 JPM 8/15/2024 (1,650)
EUR 216,000 GBP 182,985 GSI 8/15/2024 (1,352)
EUR 80,000 JPY 13,368,591 BARC 8/15/2024 (2,788)
EUR 194,000 JPY 33,294,536 BOA 8/15/2024 (12,619)
EUR 419,000 JPY 70,362,469 GSI 8/15/2024 (16,907)
EUR 89,000 NZD 160,235 BARC 8/15/2024 1,016
EUR 1,415,274 USD 1,520,161 BARC 8/15/2024 12,507
EUR 11,237,265 USD 12,166,252 BNP 8/15/2024 3,116
EUR 4,458,752 USD 4,836,222 BOA 8/15/2024 (7,627)
EUR 642,000 USD 698,527 GSI 8/15/2024 (3,275)
EUR 1,550,000 USD 1,667,890 JPM 8/15/2024 10,679
GBP 301,000 CAD 521,722 JPM 8/15/2024 8,970
GBP 728,243 EUR 862,500 BARC 8/15/2024 2,278
GBP 188,407 EUR 223,000 BOA 8/15/2024 742
GBP 731,142 EUR 862,500 GSI 8/15/2024 6,006
GBP 305,226 EUR 360,000 JPM 8/15/2024 2,575
GBP 42,000 JPY 8,099,172 BARC 8/15/2024 (176)
GBP 109,000 JPY 21,312,703 GSI 8/15/2024 (2,419)
GBP 775,000 SEK 10,368,689 GSI 8/15/2024 27,550
GBP 706,175 USD 901,064 BARC 8/15/2024 6,882
GBP 342,964 USD 435,206 BNP 8/15/2024 5,751
GBP 690,252 USD 878,371 BOA 8/15/2024 9,103
GBP 120,694 USD 153,342 GSI 8/15/2024 1,838
GBP 359,356 USD 456,765 JPM 8/15/2024 5,268
JPY 49,112,783 AUD 489,000 BARC 8/15/2024 8,622
SEE NOTES TO FINANCIAL STATEMENTS  | JOHN HANCOCK MULTI-ASSET ABSOLUTE RETURN FUND 10

FORWARD FOREIGN CURRENCY CONTRACTS (continued)
Contract to buy Contract to sell Counterparty (OTC) Contractual
settlement
date
Unrealized
appreciation
Unrealized
depreciation
JPY 18,002,283 AUD 176,000 BOA 8/15/2024 $5,282
JPY 16,516,488 EUR 97,000 BARC 8/15/2024 5,435
JPY 26,321,136 EUR 157,000 BNP 8/15/2024 6,042
JPY 31,879,273 EUR 191,000 GSI 8/15/2024 6,401
JPY 35,428,672 EUR 209,000 JPM 8/15/2024 10,650
JPY 4,256,859 GBP 22,000 BARC 8/15/2024 189
JPY 31,887,358 NOK 2,228,000 BOA 8/15/2024 9,022
JPY 17,070,247 NOK 1,222,000 GSI 8/15/2024 2,145
JPY 16,923,989 NZD 175,000 JPM 8/15/2024 9,052
JPY 278,415,617 USD 1,793,591 BARC 8/15/2024 68,762
JPY 8,840,277,679 USD 57,496,570 BNP 8/15/2024 1,636,984
JPY 334,489,459 USD 2,167,101 BOA 8/15/2024 70,335
JPY 212,767,136 USD 1,363,778 GSI 8/15/2024 59,444
JPY 214,741,945 USD 1,345,320 JPM 8/15/2024 91,112
NOK 675,008 EUR 59,000 BOA 8/15/2024 $(2,005)
NOK 11,009,068 NZD 1,682,000 BARC 8/15/2024 8,303
NOK 2,890,000 SEK 2,836,570 BARC 8/15/2024 (88)
NOK 9,124,212 USD 861,500 BARC 8/15/2024 (24,941)
NOK 9,047,015 USD 861,500 BOA 8/15/2024 (32,019)
NOK 18,640,260 USD 1,726,000 GSI 8/15/2024 (16,957)
NZD 787,000 CAD 639,994 BARC 8/15/2024 4,665
NZD 3,542 EUR 2,000 BARC 8/15/2024 (58)
NZD 1,478,000 JPY 144,657,934 BARC 8/15/2024 (87,976)
NZD 42,000 NOK 273,158 BARC 8/15/2024 (48)
NZD 216,000 NOK 1,394,985 BOA 8/15/2024 656
NZD 131,000 NOK 846,997 GSI 8/15/2024 309
NZD 494,000 SEK 3,174,174 BOA 8/15/2024 (2,594)
NZD 2,086,000 SEK 13,419,632 JPM 8/15/2024 (12,460)
NZD 559,000 USD 342,294 BARC 8/15/2024 (9,596)
NZD 290,000 USD 177,476 GSI 8/15/2024 (4,878)
SEK 11,838,943 AUD 1,707,000 BARC 8/15/2024 (10,428)
SEK 6,819,663 AUD 952,000 BNP 8/15/2024 14,465
SEK 5,588,053 AUD 787,000 GSI 8/15/2024 7,321
SEK 731,888 EUR 65,000 BARC 8/15/2024 (2,001)
SEK 959,171 GBP 72,000 BARC 8/15/2024 (2,944)
SEK 459,000 JPY 6,707,683 BARC 8/14/2024 (1,973)
SEK 716,000 JPY 10,386,523 BNP 8/14/2024 (2,564)
SEK 2,673,944 NOK 2,686,000 BNP 8/15/2024 3,595
SEK 8,361,773 NZD 1,305,000 GSI 8/15/2024 4,661
SEK 3,980,731 USD 379,000 BOA 8/15/2024 (7,027)
SEK 4,731,412 USD 438,000 GSI 8/15/2024 4,120
USD 336,606 AUD 508,693 BARC 8/15/2024 3,824
11 JOHN HANCOCK MULTI-ASSET ABSOLUTE RETURN FUND |  SEE NOTES TO FINANCIAL STATEMENTS

FORWARD FOREIGN CURRENCY CONTRACTS (continued)
Contract to buy Contract to sell Counterparty (OTC) Contractual
settlement
date
Unrealized
appreciation
Unrealized
depreciation
USD 21,419,348 AUD 32,350,669 BNP 8/15/2024 $255,904
USD 86,794 AUD 129,100 BOA 8/15/2024 2,338
USD 753,343 AUD 1,133,384 GSI 8/15/2024 11,895
USD 52,257 AUD 77,350 JPM 8/15/2024 1,655
USD 17,727,417 CAD 24,196,489 BOA 8/14/2024 195,515
USD 4,278,311 CAD 5,842,545 GSI 8/14/2024 45,014
USD 61,243 CAD 83,860 BARC 8/15/2024 479
USD 889 CAD 1,215 BNP 8/15/2024 9
USD 879,868 CAD 1,201,496 GSI 8/15/2024 9,281
USD 14,373 CAD 19,635 JPM 8/15/2024 146
USD 104,215 CHF 92,638 BARC 8/15/2024 $(1,495)
USD 2,836,400 CHF 2,544,447 BNP 8/15/2024 (67,087)
USD 213,810 CHF 191,432 BOA 8/15/2024 (4,635)
USD 403,372 CHF 359,215 GSI 8/15/2024 (6,531)
USD 405,349 DKK 2,767,352 BNP 8/15/2024 3,700
USD 17,543,560 DKK 120,825,678 BOA 8/15/2024 7,147
USD 597,541 DKK 4,095,665 GSI 8/15/2024 3,104
USD 496,495 DKK 3,450,392 JPM 8/15/2024 (4,288)
USD 1,828,013 EUR 1,700,086 BARC 8/15/2024 (13,091)
USD 130,204,206 EUR 120,289,451 BNP 8/15/2024 (62,949)
USD 1,028,058 EUR 945,040 BOA 8/15/2024 4,629
USD 1,180,054 EUR 1,087,420 JPM 8/15/2024 2,435
USD 1,311,326 GBP 1,028,354 BARC 8/15/2024 (10,854)
USD 16,066,362 GBP 12,820,053 BNP 8/15/2024 (416,694)
USD 125,642 GBP 98,624 BOA 8/15/2024 (1,162)
USD 431,512 GBP 336,759 GSI 8/15/2024 (1,467)
USD 386,544 GBP 301,285 JPM 8/15/2024 (826)
USD 291,787 JPY 44,808,265 BNP 8/14/2024 (7,893)
USD 2,192,182 JPY 337,790,160 BARC 8/15/2024 (67,333)
USD 6,222,658 JPY 958,274,099 BNP 8/15/2024 (187,339)
USD 858,122 JPY 135,277,052 BOA 8/15/2024 (46,761)
USD 858,401 JPY 133,856,563 GSI 8/15/2024 (36,980)
USD 2,162,293 JPY 333,874,746 JPM 8/15/2024 (71,031)
USD 3,554,449 NOK 38,795,641 BARC 8/15/2024 (2,553)
USD 280,000 NOK 2,974,289 BNP 8/15/2024 7,301
USD 1,663,000 NOK 17,780,069 BOA 8/15/2024 32,824
USD 9,998,716 NZD 16,639,492 GSI 8/15/2024 95,449
USD 267,955 SEK 2,894,531 GSI 8/14/2024 (2,506)
USD 7,239,161 SEK 78,282,632 BOA 8/15/2024 (75,841)
            $3,010,584 $(1,823,286)
    
Derivatives Currency Abbreviations
AUD Australian Dollar
SEE NOTES TO FINANCIAL STATEMENTS  | JOHN HANCOCK MULTI-ASSET ABSOLUTE RETURN FUND 12

CAD Canadian Dollar
CHF Swiss Franc
DKK Danish Krone
EUR Euro
GBP Pound Sterling
JPY Japanese Yen
NOK Norwegian Krone
NZD New Zealand Dollar
SEK Swedish Krona
USD U.S. Dollar
    
Derivatives Abbreviations
BARC Barclays Bank PLC
BNP BNP Paribas
BOA Bank of America, N.A.
GSI Goldman Sachs International
JPM JPMorgan Chase Bank, N.A.
OTC Over-the-counter
At 7-31-24, the aggregate cost of investments for federal income tax purposes was $248,615,431. Net unrealized appreciation aggregated to $69,161,407, of which $78,780,406 related to gross unrealized appreciation and $9,618,999 related to gross unrealized depreciation.
See Notes to financial statements regarding investment transactions and other derivatives information.
13 JOHN HANCOCK MULTI-ASSET ABSOLUTE RETURN FUND |  SEE NOTES TO FINANCIAL STATEMENTS

Financial statements
STATEMENT OF ASSETS AND LIABILITIES 7-31-24

Assets  
Unaffiliated investments, at value (Cost $238,150,043) $315,442,987
Unrealized appreciation on forward foreign currency contracts 3,010,584
Cash 5,173,769
Foreign currency, at value (Cost $256,474) 254,515
Collateral held at broker for futures contracts 7,666,763
Dividends and interest receivable 1,071,030
Receivable for fund shares sold 49,719
Receivable for investments sold 3,176,562
Other assets 44,019
Total assets 335,889,948
Liabilities  
Unrealized depreciation on forward foreign currency contracts 1,823,286
Payable for futures variation margin 799,164
Payable for investments purchased 40,829
Payable for fund shares repurchased 165,884
Payable to affiliates  
Accounting and legal services fees 9,818
Transfer agent fees 18,365
Distribution and service fees 138
Trustees’ fees 666
Other liabilities and accrued expenses 177,389
Total liabilities 3,035,539
Net assets $332,854,409
Net assets consist of  
Paid-in capital $830,278,722
Total distributable earnings (loss) (497,424,313)
Net assets $332,854,409
 
SEE NOTES TO FINANCIAL STATEMENTS  | JOHN HANCOCK Multi-Asset Absolute Return Fund 14

STATEMENT OF ASSETS AND LIABILITIES  (continued)

Net asset value per share  
Based on net asset value and shares outstanding - the fund has an unlimited number of shares authorized with no par value  
Class A ($36,650,254 ÷ 3,645,177 shares)1 $10.05
Class C ($1,871,591 ÷ 195,636 shares)1 $9.57
Class I ($158,905,787 ÷ 15,478,018 shares) $10.27
Class R2 ($842,807 ÷ 84,301 shares) $10.00
Class R6 ($31,361,407 ÷ 3,032,411 shares) $10.34
Class NAV ($103,222,563 ÷ 9,989,577 shares) $10.33
Maximum offering price per share  
Class A (net asset value per share ÷ 95%)2 $10.58
    
1 Redemption price per share is equal to net asset value less any applicable contingent deferred sales charge.
2 On single retail sales of less than $50,000. On sales of $50,000 or more and on group sales the offering price is reduced.
15 JOHN HANCOCK Multi-Asset Absolute Return Fund |  SEE NOTES TO FINANCIAL STATEMENTS

STATEMENT OF OPERATIONS For the year ended 7-31-24

Investment income  
Dividends $6,467,412
Interest 1,591,028
Less foreign taxes withheld (254,179)
Total investment income 7,804,261
Expenses  
Investment management fees 3,865,200
Distribution and service fees 157,569
Accounting and legal services fees 74,339
Transfer agent fees 267,861
Trustees’ fees 9,739
Custodian fees 126,809
State registration fees 90,979
Printing and postage 24,970
Professional fees 202,809
Other 138,132
Total expenses 4,958,407
Less expense reductions (28,867)
Net expenses 4,929,540
Net investment income 2,874,721
Realized and unrealized gain (loss)  
Net realized gain (loss) on  
Unaffiliated investments and foreign currency transactions 45,112,583
Futures contracts (28,925,952)
Forward foreign currency contracts (8,719,692)
Swap contracts (33,486)
  7,433,453
Change in net unrealized appreciation (depreciation) of  
Unaffiliated investments and translation of assets and liabilities in foreign currencies (19,706,489)
Futures contracts 13,418,440
Forward foreign currency contracts 7,473,318
  1,185,269
Net realized and unrealized gain 8,618,722
Increase in net assets from operations $11,493,443
SEE NOTES TO FINANCIAL STATEMENTS  | JOHN HANCOCK Multi-Asset Absolute Return Fund 16

STATEMENTS OF CHANGES IN NET ASSETS  

  Year ended
7-31-24
Year ended
7-31-23
Increase (decrease) in net assets    
From operations    
Net investment income $2,874,721 $4,063,284
Net realized gain (loss) 7,433,453 (32,340,674)
Change in net unrealized appreciation (depreciation) 1,185,269 35,833,618
Increase in net assets resulting from operations 11,493,443 7,556,228
Distributions to shareholders    
From earnings    
Class A (1,282,614)
Class C (237,194)
Class I (6,362,692)
Class R2 (30,090)
Class R6 (7,576,544)
Class NAV (3,272,596)
Total distributions (18,761,730)
From fund share transactions (160,914,483) (87,852,566)
Total decrease (149,421,040) (99,058,068)
Net assets    
Beginning of year 482,275,449 581,333,517
End of year $332,854,409 $482,275,449
17 JOHN HANCOCK Multi-Asset Absolute Return Fund |  SEE NOTES TO FINANCIAL STATEMENTS

Financial highlights
CLASS A SHARES Period ended 7-31-24 7-31-23 7-31-22 7-31-21 7-31-20
Per share operating performance          
Net asset value, beginning of period $9.75 $9.93 $10.12 $9.06 $10.54
Net investment income1 0.05 0.05 0.06 0.02 0.06
Net realized and unrealized gain (loss) on investments 0.25 0.07 (0.25) 1.09 0.02
Total from investment operations 0.30 0.12 (0.19) 1.11 0.08
Less distributions          
From net investment income (0.30) (0.05) (1.56)
Net asset value, end of period $10.05 $9.75 $9.93 $10.12 $9.06
Total return (%)2,3 3.18 1.34 (1.88) 12.27 0.89
Ratios and supplemental data          
Net assets, end of period (in millions) $37 $41 $44 $45 $41
Ratios (as a percentage of average net assets):          
Expenses before reductions 1.62 1.55 1.57 1.59 1.53
Expenses including reductions 1.61 1.54 1.56 1.58 1.52
Net investment income 0.47 0.49 0.65 0.24 0.65
Portfolio turnover (%) 47 59 59 57 2174
    
1 Based on average daily shares outstanding.
2 Total returns would have been lower had certain expenses not been reduced during the applicable periods.
3 Does not reflect the effect of sales charges, if any.
4 Increase in portfolio turnover rate resulted from repositioning of the portfolio during the period in accordance with investment policy changes approved by the Board of Trustees.
SEE NOTES TO FINANCIAL STATEMENTS  | JOHN HANCOCK Multi-Asset Absolute Return Fund 18

CLASS C SHARES Period ended 7-31-24 7-31-23 7-31-22 7-31-21 7-31-20
Per share operating performance          
Net asset value, beginning of period $9.38 $9.57 $9.82 $8.81 $10.29
Net investment loss1 (0.03) (0.03) (0.01) (0.05) (0.01)
Net realized and unrealized gain (loss) on investments 0.22 0.07 (0.24) 1.06 0.01
Total from investment operations 0.19 0.04 (0.25) 1.01
Less distributions          
From net investment income (0.23) (1.48)
Net asset value, end of period $9.57 $9.38 $9.57 $9.82 $8.81
Total return (%)2,3 2.45 0.63 (2.54) 11.45 0.23
Ratios and supplemental data          
Net assets, end of period (in millions) $2 $6 $12 $20 $34
Ratios (as a percentage of average net assets):          
Expenses before reductions 2.32 2.25 2.27 2.29 2.23
Expenses including reductions 2.31 2.24 2.26 2.28 2.22
Net investment loss (0.29) (0.29) (0.12) (0.52) (0.07)
Portfolio turnover (%) 47 59 59 57 2174
    
1 Based on average daily shares outstanding.
2 Total returns would have been lower had certain expenses not been reduced during the applicable periods.
3 Does not reflect the effect of sales charges, if any.
4 Increase in portfolio turnover rate resulted from repositioning of the portfolio during the period in accordance with investment policy changes approved by the Board of Trustees.
19 JOHN HANCOCK Multi-Asset Absolute Return Fund |  SEE NOTES TO FINANCIAL STATEMENTS

CLASS I SHARES Period ended 7-31-24 7-31-23 7-31-22 7-31-21 7-31-20
Per share operating performance          
Net asset value, beginning of period $9.92 $10.10 $10.27 $9.19 $10.67
Net investment income1 0.08 0.08 0.10 0.05 0.09
Net realized and unrealized gain (loss) on investments 0.27 0.07 (0.27) 1.10 0.02
Total from investment operations 0.35 0.15 (0.17) 1.15 0.11
Less distributions          
From net investment income (0.33) (0.07) (1.59)
Net asset value, end of period $10.27 $9.92 $10.10 $10.27 $9.19
Total return (%)2 3.42 1.73 (1.66) 12.64 1.22
Ratios and supplemental data          
Net assets, end of period (in millions) $159 $201 $215 $215 $274
Ratios (as a percentage of average net assets):          
Expenses before reductions 1.32 1.25 1.27 1.29 1.23
Expenses including reductions 1.31 1.24 1.26 1.28 1.22
Net investment income 0.76 0.79 0.94 0.52 0.95
Portfolio turnover (%) 47 59 59 57 2173
    
1 Based on average daily shares outstanding.
2 Total returns would have been lower had certain expenses not been reduced during the applicable periods.
3 Increase in portfolio turnover rate resulted from repositioning of the portfolio during the period in accordance with investment policy changes approved by the Board of Trustees.
SEE NOTES TO FINANCIAL STATEMENTS  | JOHN HANCOCK Multi-Asset Absolute Return Fund 20

CLASS R2 SHARES Period ended 7-31-24 7-31-23 7-31-22 7-31-21 7-31-20
Per share operating performance          
Net asset value, beginning of period $9.69 $9.87 $10.07 $9.01 $10.49
Net investment income1 0.04 0.05 0.06 0.02 0.06
Net realized and unrealized gain (loss) on investments 0.27 0.07 (0.26) 1.08 0.01
Total from investment operations 0.31 0.12 (0.20) 1.10 0.07
Less distributions          
From net investment income (0.30) (0.04) (1.55)
Net asset value, end of period $10.00 $9.69 $9.87 $10.07 $9.01
Total return (%)2 3.20 1.34 (1.99) 12.31 0.82
Ratios and supplemental data          
Net assets, end of period (in millions) $1 $1 $1 $1 $1
Ratios (as a percentage of average net assets):          
Expenses before reductions 1.63 1.55 1.60 1.62 1.58
Expenses including reductions 1.63 1.54 1.59 1.62 1.57
Net investment income 0.45 0.47 0.58 0.21 0.62
Portfolio turnover (%) 47 59 59 57 2173
    
1 Based on average daily shares outstanding.
2 Total returns would have been lower had certain expenses not been reduced during the applicable periods.
3 Increase in portfolio turnover rate resulted from repositioning of the portfolio during the period in accordance with investment policy changes approved by the Board of Trustees.
21 JOHN HANCOCK Multi-Asset Absolute Return Fund |  SEE NOTES TO FINANCIAL STATEMENTS

CLASS R6 SHARES Period ended 7-31-24 7-31-23 7-31-22 7-31-21 7-31-20
Per share operating performance          
Net asset value, beginning of period $9.98 $10.15 $10.31 $9.23 $10.71
Net investment income1 0.09 0.08 0.12 0.06 0.10
Net realized and unrealized gain (loss) on investments 0.27 0.09 (0.28) 1.10 0.02
Total from investment operations 0.36 0.17 (0.16) 1.16 0.12
Less distributions          
From net investment income (0.34) (0.08) (1.60)
Net asset value, end of period $10.34 $9.98 $10.15 $10.31 $9.23
Total return (%)2 3.51 1.74 (1.55) 12.70 1.34
Ratios and supplemental data          
Net assets, end of period (in millions) $31 $134 $227 $130 $106
Ratios (as a percentage of average net assets):          
Expenses before reductions 1.21 1.14 1.16 1.19 1.12
Expenses including reductions 1.20 1.13 1.15 1.18 1.11
Net investment income 0.85 0.81 1.15 0.64 1.05
Portfolio turnover (%) 47 59 59 57 2173
    
1 Based on average daily shares outstanding.
2 Total returns would have been lower had certain expenses not been reduced during the applicable periods.
3 Increase in portfolio turnover rate resulted from repositioning of the portfolio during the period in accordance with investment policy changes approved by the Board of Trustees.
SEE NOTES TO FINANCIAL STATEMENTS  | JOHN HANCOCK Multi-Asset Absolute Return Fund 22

CLASS NAV SHARES Period ended 7-31-24 7-31-23 7-31-22 7-31-21 7-31-20
Per share operating performance          
Net asset value, beginning of period $9.97 $10.15 $10.31 $9.23 $10.71
Net investment income1 0.09 0.09 0.11 0.06 0.10
Net realized and unrealized gain (loss) on investments 0.27 0.07 (0.27) 1.11 0.02
Total from investment operations 0.36 0.16 (0.16) 1.17 0.12
Less distributions          
From net investment income (0.34) (0.09) (1.60)
Net asset value, end of period $10.33 $9.97 $10.15 $10.31 $9.23
Total return (%)2 3.61 1.74 (1.46) 12.73 1.34
Ratios and supplemental data          
Net assets, end of period (in millions) $103 $100 $82 $59 $53
Ratios (as a percentage of average net assets):          
Expenses before reductions 1.20 1.13 1.15 1.17 1.11
Expenses including reductions 1.20 1.12 1.14 1.17 1.10
Net investment income 0.89 0.93 1.13 0.65 1.10
Portfolio turnover (%) 47 59 59 57 2173
    
1 Based on average daily shares outstanding.
2 Total returns would have been lower had certain expenses not been reduced during the applicable periods.
3 Increase in portfolio turnover rate resulted from repositioning of the portfolio during the period in accordance with investment policy changes approved by the Board of Trustees.
23 JOHN HANCOCK Multi-Asset Absolute Return Fund |  SEE NOTES TO FINANCIAL STATEMENTS

Notes to financial statements
Note 1Organization
John Hancock Multi-Asset Absolute Return Fund (the fund) is a series of John Hancock Funds II (the Trust), an open-end management investment company organized as a Massachusetts business trust and registered under the Investment Company Act of 1940, as amended (the 1940 Act). The investment objective of the fund is to seek long-term total return.
The fund may offer multiple classes of shares. The shares currently outstanding are detailed in the Statement of assets and liabilities. Class A and Class C shares are offered to all investors. Class I shares are offered to institutions and certain investors. Class R2 shares are available only to certain retirement and 529 plans. Class R6 shares are only available to certain retirement plans, institutions and other investors. Class NAV shares are offered to John Hancock affiliated funds of funds, retirement plans for employees of John Hancock and/or Manulife Financial Corporation, and certain 529 plans. Class C shares convert to Class A shares eight years after purchase (certain exclusions may apply). Shareholders of each class have exclusive voting rights to matters that affect that class. The distribution and service fees, if any, and transfer agent fees for each class may differ.
Note 2Significant accounting policies
The financial statements have been prepared in conformity with accounting principles generally accepted in the United States of America (US GAAP), which require management to make certain estimates and assumptions as of the date of the financial statements. Actual results could differ from those estimates and those differences could be significant. The fund qualifies as an investment company under Topic 946 of Accounting Standards Codification of US GAAP.
Events or transactions occurring after the end of the fiscal period through the date that the financial statements were issued have been evaluated in the preparation of the financial statements. The following summarizes the significant accounting policies of the fund:
Security valuation. Investments are stated at value as of the scheduled close of regular trading on the New York Stock Exchange (NYSE), normally at 4:00 P.M., Eastern Time. In case of emergency or other disruption resulting in the NYSE not opening for trading or the NYSE closing at a time other than the regularly scheduled close, the net asset value (NAV) may be determined as of the regularly scheduled close of the NYSE pursuant to the Valuation Policies and Procedures of the Advisor, John Hancock Investment Management LLC.
In order to value the securities, the fund uses the following valuation techniques: Equity securities, including exchange-traded or closed-end funds, are typically valued at the last sale price or official closing price on the exchange or principal market where the security trades. In the event there were no sales during the day or closing prices are not available, the securities are valued using the last available bid price. Debt obligations are typically valued based on evaluated prices provided by an independent pricing vendor. Independent pricing vendors utilize matrix pricing, which takes into account factors such as institutional-size trading in similar groups of securities, yield, quality, coupon rate, maturity, type of issue, trading characteristics and other market data, as well as broker supplied prices. Futures contracts whose settlement prices are determined as of the close of the NYSE are typically valued based on the settlement price while other futures contracts are typically valued at the last traded price on the exchange on which they trade. Foreign equity index futures that trade in the electronic trading market subsequent to the close of regular trading may be valued at the last traded price in the electronic trading market as of 4:00 P.M. ET, or may be fair valued based on fair value adjustment factors provided by an independent pricing vendor in order to adjust for events that may occur between the close of foreign exchanges or markets and the close of the NYSE. Swaps are generally valued using evaluated prices obtained from an independent pricing vendor. Forward foreign currency contracts are valued at the prevailing forward rates which are based on foreign currency exchange spot rates and forward points supplied by an independent pricing vendor.  Foreign securities and currencies are valued in U.S. dollars based on foreign currency exchange rates supplied by an independent pricing vendor.
   | JOHN HANCOCK Multi-Asset Absolute Return Fund 24

In certain instances, the Pricing Committee of the Advisor may determine to value equity securities using prices obtained from another exchange or market if trading on the exchange or market on which prices are typically obtained did not open for trading as scheduled, or if trading closed earlier than scheduled, and trading occurred as normal on another exchange or market.
Other portfolio securities and assets, for which reliable market quotations are not readily available, are valued at fair value as determined in good faith by the Pricing Committee following procedures established by the Advisor and adopted by the Board of Trustees. The frequency with which these fair valuation procedures are used cannot be predicted and fair value of securities may differ significantly from the value that would have been used had a ready market for such securities existed. Trading in foreign securities may be completed before the scheduled daily close of trading on the NYSE. Significant events at the issuer or market level may affect the values of securities between the time when the valuation of the securities is generally determined and the close of the NYSE. If a significant event occurs, these securities may be fair valued, as determined in good faith by the Pricing Committee, following procedures established by the Advisor and adopted by the Board of Trustees. The Advisor uses fair value adjustment factors provided by an independent pricing vendor to value certain foreign securities in order to adjust for events that may occur between the close of foreign exchanges or markets and the close of the NYSE.
The fund uses a three tier hierarchy to prioritize the pricing assumptions, referred to as inputs, used in valuation techniques to measure fair value. Level 1 includes securities valued using quoted prices in active markets for identical securities, including registered investment companies. Level 2 includes securities valued using other significant observable inputs. Observable inputs may include quoted prices for similar securities, interest rates, prepayment speeds and credit risk. Prices for securities valued using these inputs are received from independent pricing vendors and brokers and are based on an evaluation of the inputs described. Level 3 includes securities valued using significant unobservable inputs when market prices are not readily available or reliable, including the Advisor’s assumptions in determining the fair value of investments. Factors used in determining value may include market or issuer specific events or trends, changes in interest rates and credit quality. The inputs or methodology used for valuing securities are not necessarily an indication of the risks associated with investing in those securities. Changes in valuation techniques and related inputs may result in transfers into or out of an assigned level within the disclosure hierarchy.
The following is a summary of the values by input classification of the fund’s investments as of July 31, 2024, by major security category or type:
  Total
value at
7-31-24
Level 1
quoted
price
Level 2
significant
observable
inputs
Level 3
significant
unobservable
inputs
Investments in securities:        
Assets        
Common stocks        
Brazil $1,405,615 $1,405,615
Canada 702,718 702,718
China 5,535,406 1,386,976 $4,148,430
Denmark 6,846,438 6,846,438
France 6,487,443 6,487,443
Germany 4,950,409 4,950,409
Hong Kong 203,258 203,258
Hungary 5,788 5,788
Indonesia 551,071 551,071
Ireland 6,421,472 6,421,472
Israel 1,980,526 1,980,526
25 JOHN HANCOCK Multi-Asset Absolute Return Fund |   

  Total
value at
7-31-24
Level 1
quoted
price
Level 2
significant
observable
inputs
Level 3
significant
unobservable
inputs
Japan $4,502,518 $4,502,518
Mexico 1,190,312 $1,190,312
Netherlands 604,354 604,354
Philippines 35,703 35,703
South Africa 752,064 752,064
South Korea 4,536,675 76,868 4,459,807
Spain 3,577,815 3,577,815
Switzerland 2,937,440 981,074 1,956,366
Taiwan 5,549,869 3,031,321 2,518,548
Thailand 454,430 454,430
United Kingdom 9,375,316 9,375,316
United States 226,003,309 226,003,309
U.S. Government and Agency obligations 9,508,787 9,508,787
Foreign government obligations 154,562 154,562
Corporate bonds 11,169,689 11,169,689
Total investments in securities $315,442,987 $243,180,191 $72,262,796
Derivatives:        
Assets        
Futures $3,126,562 $3,126,562
Forward foreign currency contracts 3,010,584 $3,010,584
Liabilities        
Futures (1,980,009) (1,980,009)
Forward foreign currency contracts (1,823,286) (1,823,286)
Level 3 includes securities valued at $0. Refer to Fund’s investments.
Security transactions and related investment income. Investment security transactions are accounted for on a trade date plus one basis for daily NAV calculations. However, for financial reporting purposes, investment transactions are reported on trade date. Interest income is accrued as earned. Interest income includes coupon interest and amortization/accretion of premiums/discounts on debt securities. Debt obligations may be placed in a non-accrual status and related interest income may be reduced by stopping current accruals and writing off interest receivable when the collection of all or a portion of interest has become doubtful. Dividend income is recorded on ex-date, except for dividends of certain foreign securities where the dividend may not be known until after the ex-date. In those cases, dividend income, net of withholding taxes, is recorded when the fund becomes aware of the dividends. Non-cash dividends, if any, are recorded at the fair market value of the securities received. Gains and losses on securities sold are determined on the basis of identified cost and may include proceeds from litigation.
Foreign investing. Assets, including investments, and liabilities denominated in foreign currencies are translated into U.S. dollar values each day at the prevailing exchange rate. Purchases and sales of securities, income and expenses are translated into U.S. dollars at the prevailing exchange rate on the date of the transaction. The effect of changes in foreign currency exchange rates on the value of securities is reflected as a component of the realized and unrealized gains (losses) on investments. Foreign investments are subject to a decline in the value of a foreign currency versus the U.S. dollar, which reduces the dollar value of securities denominated in that currency.
   | JOHN HANCOCK Multi-Asset Absolute Return Fund 26

Funds that invest internationally generally carry more risk than funds that invest strictly in U.S. securities. These risks are heightened for investments in emerging markets. Risks can result from differences in economic and political conditions, regulations, market practices (including higher transaction costs), accounting standards and other factors.
Foreign taxes. The fund may be subject to withholding tax on income, capital gains or repatriations imposed by certain countries, a portion of which may be recoverable. Foreign taxes are accrued based upon the fund’s understanding of the tax rules and rates that exist in the foreign markets in which it invests. Taxes are accrued based on gains realized by the fund as a result of certain foreign security sales. In certain circumstances, estimated taxes are accrued based on unrealized appreciation of such securities. Investment income is recorded net of foreign withholding taxes.
Overdraft. The fund may have the ability to borrow from banks for temporary or emergency purposes, including meeting redemption requests that otherwise might require the untimely sale of securities. Pursuant to the fund’s custodian agreement, the custodian may loan money to the fund to make properly authorized payments. The fund is obligated to repay the custodian for any overdraft, including any related costs or expenses. The custodian may have a lien, security interest or security entitlement in any fund property that is not otherwise segregated or pledged, to the extent of any overdraft, and to the maximum extent permitted by law.
Line of credit. The fund and other affiliated funds have entered into a syndicated line of credit agreement with Citibank, N.A. as the administrative agent that enables them to participate in a $1 billion unsecured committed line of credit. Excluding commitments designated for a certain fund and subject to the needs of all other affiliated funds, the fund can borrow up to an aggregate commitment amount of $750 million, subject to asset coverage and other limitations as specified in the agreement. A commitment fee payable at the end of each calendar quarter, based on the average daily unused portion of the line of credit, is charged to each participating fund based on a combination of fixed and asset-based allocations and is reflected in Other expenses on the Statement of operations. During the year ended July 31, 2024, the average daily loan balance for which loans were outstanding amounted to $81,500,000 and the weighted average interest rate was 6.33%. Interest expense, paid under the line of credit, amounted to approximately $56,500 and is included in Other expenses on the Statement of operations. Commitment fees for the year ended July 31, 2024 were $4,715.
Expenses. Within the John Hancock group of funds complex, expenses that are directly attributable to an individual fund are allocated to such fund. Expenses that are not readily attributable to a specific fund are allocated among all funds in an equitable manner, taking into consideration, among other things, the nature and type of expense and the fund’s relative net assets. Expense estimates are accrued in the period to which they relate and adjustments are made when actual amounts are known.
Class allocations. Income, common expenses and realized and unrealized gains (losses) are determined at the fund level and allocated daily to each class of shares based on the net assets of the class. Class-specific expenses, such as distribution and service fees, if any, and transfer agent fees, for all classes, are charged daily at the class level based on the net assets of each class and the specific expense rates applicable to each class.
Federal income taxes. The fund intends to continue to qualify as a regulated investment company by complying with the applicable provisions of the Internal Revenue Code and will not be subject to federal income tax on taxable income that is distributed to shareholders. Therefore, no federal income tax provision is required.
For federal income tax purposes, as of July 31, 2024, the fund has a short-term capital loss carryforward of $572,113,987 available to offset future net realized capital gains. This carryforward does not expire.
As of July 31, 2024, the fund had no uncertain tax positions that would require financial statement recognition, derecognition or disclosure. The fund’s federal tax returns are subject to examination by the Internal Revenue Service for a period of three years.
27 JOHN HANCOCK Multi-Asset Absolute Return Fund |   

Distribution of income and gains. Distributions to shareholders from net investment income and net realized gains, if any, are recorded on the ex-date. The fund generally declares and pays dividends annually. Capital gain distributions, if any, are typically distributed annually.
The tax character of distributions for the years ended July 31, 2024 and 2023 was as follows:
  July 31, 2024 July 31, 2023
Ordinary income $18,761,730
Distributions paid by the fund with respect to each class of shares are calculated in the same manner, at the same time and in the same amount, except for the effect of class level expenses that may be applied differently to each class. As of July 31, 2024, the components of distributable earnings on a tax basis consisted of $5,542,321 of undistributed ordinary income.
Such distributions and distributable earnings, on a tax basis, if any, are determined in conformity with income tax regulations, which may differ from US GAAP. Distributions in excess of tax basis earnings and profits, if any, are reported in the fund’s financial statements as a return of capital. 
Capital accounts within the financial statements are adjusted for permanent book-tax differences at fiscal year end. These adjustments have no impact on net assets or the results of operations. Temporary book-tax differences, if any, will reverse in a subsequent period. Book-tax differences are primarily attributable to foreign currency transactions, wash sale loss deferrals, derivative transactions and investments in passive foreign investment companies.
Note 3Derivative instruments
The fund may invest in derivatives in order to meet its investment objective. Derivatives include a variety of different instruments that may be traded in the over-the-counter (OTC) market, on a regulated exchange or through a clearing facility. The risks in using derivatives vary depending upon the structure of the instruments, including the use of leverage, optionality, the liquidity or lack of liquidity of the contract, the creditworthiness of the counterparty or clearing organization and the volatility of the position. Some derivatives involve risks that are potentially greater than the risks associated with investing directly in the referenced securities or other referenced underlying instrument. Specifically, the fund is exposed to the risk that the counterparty to an OTC derivatives contract will be unable or unwilling to make timely settlement payments or otherwise honor its obligations. OTC derivatives transactions typically can only be closed out with the other party to the transaction.
Derivatives which are typically traded through the OTC market are regulated by the Commodity Futures Trading Commission (the CFTC). Derivative counterparty risk is managed through an ongoing evaluation of the creditworthiness of all potential counterparties and, if applicable, designated clearing organizations. The fund attempts to reduce its exposure to counterparty risk for derivatives traded in the OTC market, whenever possible, by entering into an International Swaps and Derivatives Association (ISDA) Master Agreement with each of its OTC counterparties. The ISDA gives each party to the agreement the right to terminate all transactions traded under the agreement if there is certain deterioration in the credit quality or contractual default of the other party, as defined in the ISDA. Upon an event of default or a termination of the ISDA, the non-defaulting party has the right to close out all transactions and to net amounts owed.
As defined by the ISDA, the fund may have collateral agreements with certain counterparties to mitigate counterparty risk on OTC derivatives. Subject to established minimum levels, collateral for OTC transactions is generally determined based on the net aggregate unrealized gain or loss on contracts with a particular counterparty. Collateral pledged to the fund, if any, is held in a segregated account by a third-party agent or held by the custodian bank for the benefit of the fund and can be in the form of cash or debt securities issued by the U.S. government or related agencies; collateral posted by the fund, if any, for OTC transactions is held in a
   | JOHN HANCOCK Multi-Asset Absolute Return Fund 28

segregated account at the fund’s custodian and is noted in the accompanying Fund’s investments, or if cash is posted, on the Statement of assets and liabilities. The fund’s risk of loss due to counterparty risk is equal to the asset value of outstanding contracts offset by collateral received.
Certain derivatives are traded or cleared on an exchange or central clearinghouse. Exchange-traded or centrally-cleared transactions generally present less counterparty risk to a fund than OTC transactions. The exchange or clearinghouse stands between the fund and the broker to the contract and therefore, credit risk is generally limited to the failure of the exchange or clearinghouse and the clearing member.
Futures. A futures contract is a contractual agreement to buy or sell a particular currency or financial instrument at a pre-determined price in the future. Futures are traded on an exchange and cleared through a central clearinghouse. Risks related to the use of futures contracts include possible illiquidity of the futures markets and contract prices that can be highly volatile and imperfectly correlated to movements in the underlying financial instrument and potential losses in excess of the amounts recognized on the Statement of assets and liabilities. Use of long futures contracts subjects the fund to the risk of loss up to the notional value of the futures contracts. Use of short futures contracts subjects the fund to unlimited risk of loss.
Upon entering into a futures contract, the fund is required to deposit initial margin with the broker in the form of cash or securities. The amount of required margin is set by the broker and is generally based on a percentage of the contract value. The margin deposit must then be maintained at the established level over the life of the contract. Cash that has been pledged by the fund, if any, is detailed in the Statement of assets and liabilities as Collateral held at broker for futures contracts. Securities pledged by the fund, if any, are identified in the Fund’s investments. Subsequent payments, referred to as variation margin, are made or received by the fund periodically and are based on changes in the market value of open futures contracts. Futures contracts are marked-to-market daily and unrealized gain or loss is recorded by the fund. Payable for futures variation margin is included on the Statement of assets and liabilities. When the contract is closed, the fund records a realized gain or loss equal to the difference between the value of the contract at the time it was opened and the value at the time it was closed.
During the year ended July 31, 2024, the fund used futures contracts to manage against changes in certain securities markets and interest rates, gain exposure to certain securities markets and manage duration of the fund. The fund held futures contracts with USD notional values ranging from $279.0 million to $445.3 million, as measured at each quarter end.  
Forward foreign currency contracts. A forward foreign currency contract is an agreement between two parties to buy and sell specific currencies at a price that is set on the date of the contract. The forward contract calls for delivery of the currencies on a future date that is specified in the contract. Forwards are typically traded OTC. Risks related to the use of forwards include the possible failure of counterparties to meet the terms of the forward agreement, the failure of the counterparties to timely post collateral if applicable, and the risk that currency movements will not favor the fund thereby reducing the fund’s total return, and the potential for losses in excess of the amounts recognized on the Statement of assets and liabilities.
The market value of a forward foreign currency contract fluctuates with changes in foreign currency exchange rates. Forward foreign currency contracts are marked-to-market daily and the change in value is recorded by the fund as an unrealized gain or loss. Realized gains or losses, equal to the difference between the value of the contract at the time it was opened and the value at the time it was closed, are recorded upon delivery or receipt of the currency or settlement with the counterparty.
During the year ended July 31, 2024, the fund used forward foreign currency contracts to manage against changes in foreign currency exchange rates and gain exposure to foreign currencies. The fund held forward foreign currency contracts with USD notional values ranging from $388.8 million to $564.6 million, as measured at each quarter end.
29 JOHN HANCOCK Multi-Asset Absolute Return Fund |   

Swaps. Swap agreements are agreements between the fund and a counterparty to exchange cash flows, assets, foreign currencies or market-linked returns at specified intervals. Swap agreements are privately negotiated in the OTC market (OTC swaps) or may be executed on a registered commodities exchange (centrally cleared swaps). Swaps are marked-to-market daily and the change in value is recorded as a component of unrealized appreciation/depreciation of swap contracts. The value of the swap will typically impose collateral posting obligations on the party that is considered out-of-the-money on the swap.
Upfront payments made/received by the fund, if any, are amortized/accreted for financial reporting purposes, with the unamortized/unaccreted portion included in the Statement of assets and liabilities. A termination payment by the counterparty or the fund is recorded as realized gain or loss, as well as the net periodic payments received or paid by the fund.
Entering into swap agreements involves, to varying degrees, elements of credit, market and documentation risk that may provide outcomes that produce losses in excess of the amounts recognized on the Statement of assets and liabilities. Such risks involve the possibility that there will be no liquid market for the swap, or that a counterparty may default on its obligation or delay payment under the swap terms. The counterparty may disagree or contest the terms of the swap. In addition to interest rate risk, market risks may also impact the swap. The fund may also suffer losses if it is unable to terminate or assign outstanding swaps or reduce its exposure through offsetting transactions.
Credit default swaps. Credit default swaps (CDS) involve the exchange of a fixed rate premium (paid by the Buyer), for protection against the loss in value of an underlying debt instrument, referenced entity or index, in the event of a defined credit event (such as payment default or bankruptcy). Under the terms of the swap, one party acts as a “guarantor” (the Seller), receiving the premium and agreeing to contingent payments that are specified within the credit default agreement. The fund may enter into CDS in which it may act as either Buyer or Seller. By acting as the Seller, the fund may incur economic leverage since it would be obligated to pay the Buyer the notional amount of the contract in the event of a default. The amount of loss in such case could be significant, but would typically be reduced by any recovery value on the underlying credit.
Credit default swaps — Buyer
During the year ended July 31, 2024, the fund used credit default swap contracts as the buyer to manage against potential credit events. The fund held credit default swaps with total USD notional amounts ranging up to $2.0 million,as measured at each quarter end. There were no open CDS contracts where the fund acted as buyer as of July 31, 2024.
Fair value of derivative instruments by risk category
The table below summarizes the fair value of derivatives held by the fund at July 31, 2024 by risk category:
Risk Statement of assets
and liabilities
location
Financial
instruments
location
Assets
derivatives
fair value
Liabilities
derivatives
fair value
Interest rate Receivable/payable for futures variation margin1 Futures $2,946,472 $(415,293)
Equity Receivable/payable for futures variation margin1 Futures 180,090 (1,564,716)
Currency Unrealized appreciation (depreciation) on forward foreign currency contracts Forward foreign currency contracts 3,010,584 (1,823,286)
      $6,137,146 $(3,803,295)
    
1 Reflects cumulative appreciation/depreciation on open futures as disclosed in the Derivatives section of Fund’s investments. Only the year end variation margin receivable/payable is separately reported on the Statement of assets and liabilities.
   | JOHN HANCOCK Multi-Asset Absolute Return Fund 30

For financial reporting purposes, the fund does not offset OTC derivative assets or liabilities that are subject to master netting arrangements, as defined by the ISDAs, in the Statement of assets and liabilities. In the event of default by the counterparty or a termination of the agreement, the ISDA allows an offset of amounts across the various transactions between the fund and the applicable counterparty. 
Effect of derivative instruments on the Statement of operations
The table below summarizes the net realized gain (loss) included in the net increase (decrease) in net assets from operations, classified by derivative instrument and risk category, for the year ended July 31, 2024:
  Statement of operations location - Net realized gain (loss) on:
Risk Futures contracts Forward foreign
currency contracts
Swap contracts Total
Interest rate $(9,562,633) $(9,562,633)
Currency $(8,719,692) (8,719,692)
Credit $(33,486) (33,486)
Equity (19,363,319) (19,363,319)
Total $(28,925,952) $(8,719,692) $(33,486) $(37,679,130)
The table below summarizes the net change in unrealized appreciation (depreciation) included in the net increase (decrease) in net assets from operations, classified by derivative instrument and risk category, for the year ended July 31, 2024:
  Statement of operations location - Change in net unrealized appreciation (depreciation) of:
Risk Futures contracts Forward foreign
currency contracts
Total
Interest rate $7,290,133 $7,290,133
Currency $7,473,318 7,473,318
Equity 6,128,307 6,128,307
Total $13,418,440 $7,473,318 $20,891,758
Note 4Guarantees and indemnifications
Under the Trust’s organizational documents, its Officers and Trustees are indemnified against certain liabilities arising out of the performance of their duties to the Trust, including the fund. Additionally, in the normal course of business, the fund enters into contracts with service providers that contain general indemnification clauses. The fund’s maximum exposure under these arrangements is unknown, as this would involve future claims that may be made against the fund that have not yet occurred. The risk of material loss from such claims is considered remote.
Note 5Fees and transactions with affiliates
John Hancock Investment Management LLC (the Advisor) serves as investment advisor for the fund. John Hancock Investment Management Distributors LLC (the Distributor), an affiliate of the Advisor, serves as principal underwriter of the fund. The Advisor and the Distributor are indirect, principally owned subsidiaries of John Hancock Life Insurance Company (U.S.A.), which in turn is a subsidiary of Manulife Financial Corporation.
Management fee.  The fund has an investment management agreement with the Advisor under which the fund pays a daily management fee to the Advisor equivalent on an annual basis to the sum of: (a) 1.050% of the first $200 million of the fund’s average daily net assets; and (b) 1.000% of the next $300 million of the fund’s average daily net assets provided that net assets are less than or equal to $500 million. If net assets exceed $500 million, the following rates apply: (a) 0.950% of the first $2.0 billion of the fund’s average daily net assets; (b) 0.920% of
31 JOHN HANCOCK Multi-Asset Absolute Return Fund |   

the next $2.0 billion of the fund’s average daily net assets; and (c) 0.900% of the fund’s average daily net assets in excess of $4.0 billion. The Advisor has a subadvisory agreement with Nordea Investment Management North America, Inc. The fund is not responsible for payment of the subadvisory fees.
The Advisor has contractually agreed to waive a portion of its management fee and/or reimburse expenses for certain funds of the John Hancock group of funds complex, including the fund (the participating portfolios). This waiver is based upon aggregate net assets of all the participating portfolios. The amount of the reimbursement is calculated daily and allocated among all the participating portfolios in proportion to the daily net assets of each fund. During the year ended July 31, 2024, this waiver amounted to 0.01% of the fund’s average daily net assets. This agreement expires on July 31, 2026, unless renewed by mutual agreement of the fund and the Advisor based upon a determination that this is appropriate under the circumstances at that time.
For the year ended July 31, 2024, the expense reductions described above amounted to the following:
Class Expense reduction
Class A $3,047
Class C 263
Class I 14,219
Class R2 68
Class Expense reduction
Class R6 $3,548
Class NAV 7,722
Total $28,867
 
Expenses waived or reimbursed in the current fiscal period are not subject to recapture in future fiscal periods.
The investment management fees, including the impact of the waivers and reimbursements as described above, incurred for the year ended July 31, 2024, were equivalent to a net annual effective rate of 1.02% of the fund’s average daily net assets.
Accounting and legal services. Pursuant to a service agreement, the fund reimburses the Advisor for all expenses associated with providing the administrative, financial, legal, compliance, accounting and recordkeeping services to the fund, including the preparation of all tax returns, periodic reports to shareholders and regulatory reports, among other services. These expenses are allocated to each share class based on its relative net assets at the time the expense was incurred. These accounting and legal services fees incurred, for the year ended July 31, 2024, amounted to an annual rate of 0.02% of the fund’s average daily net assets.
Distribution and service plans. The fund has a distribution agreement with the Distributor. The fund has adopted distribution and service plans for certain classes as detailed below pursuant to Rule 12b-1 under the 1940 Act, to pay the Distributor for services provided as the distributor of shares of the fund. In addition, under a service plan for certain classes as detailed below, the fund pays for certain other services. The fund may pay up to the following contractual rates of distribution and service fees under these arrangements, expressed as an annual percentage of average daily net assets for each class of the fund’s shares:
Class Rule 12b-1 Fee Service fee
Class A 0.30%
Class C 1.00%
Class R2 0.25% 0.25%
Sales charges. Class A shares are assessed up-front sales charges, which resulted in payments to the Distributor amounting to $8,154 for the year ended July 31, 2024. Of this amount, $1,489 was retained and used for printing prospectuses, advertising, sales literature and other purposes and $6,665 was paid as sales commissions to broker-dealers.
Class A and Class C shares may be subject to contingent deferred sales charges (CDSCs). Certain Class A shares purchased, including those that are acquired through purchases of $1 million or more, and redeemed within one year of purchase are subject to a 1.00% sales charge. Class C shares that are redeemed within one year of
   | JOHN HANCOCK Multi-Asset Absolute Return Fund 32

purchase are subject to a 1.00% CDSC. CDSCs are applied to the lesser of the current market value at the time of redemption or the original purchase cost of the shares being redeemed. Proceeds from CDSCs are used to compensate the Distributor for providing distribution-related services in connection with the sale of these shares. During the year ended July 31, 2024, CDSCs received by the Distributor amounted to $1,294 for Class C shares. There were no CDSCs received by the Distributor for Class A shares.
Transfer agent fees. The John Hancock group of funds has a complex-wide transfer agent agreement with John Hancock Signature Services, Inc. (Signature Services), an affiliate of the Advisor. The transfer agent fees paid to Signature Services are determined based on the cost to Signature Services (Signature Services Cost) of providing recordkeeping services. It also includes out-of-pocket expenses, including payments made to third-parties for recordkeeping services provided to their clients who invest in one or more John Hancock funds. In addition, Signature Services Cost may be reduced by certain fees that Signature Services receives in connection with retirement and small accounts. Signature Services Cost is calculated monthly and allocated, as applicable, to five categories of share classes: Retail Share and Institutional Share Classes of Non-Municipal Bond Funds, Class R6 Shares, Retirement Share Classes and Municipal Bond Share Classes. Within each of these categories, the applicable costs are allocated to the affected John Hancock affiliated funds and/or classes, based on the relative average daily net assets.
Class level expenses. Class level expenses for the year ended July 31, 2024 were as follows:
Class Distribution and service fees Transfer agent fees
Class A $118,841 $46,013
Class C 34,977 4,070
Class I 215,479
Class R2 3,751 45
Class R6 2,254
Total $157,569 $267,861
Trustee expenses. The fund compensates each Trustee who is not an employee of the Advisor or its affiliates. The costs of paying Trustee compensation and expenses are allocated to the fund based on its net assets relative to other funds within the John Hancock group of funds complex.
Note 6Fund share transactions
Transactions in fund shares for the years ended July 31, 2024 and 2023 were as follows:
  Year Ended 7-31-24 Year Ended 7-31-23
  Shares Amount Shares Amount
Class A shares        
Sold 575,752 $5,672,468 772,654 $7,493,368
Distributions reinvested 132,149 1,243,521
Repurchased (1,150,402) (11,313,455) (1,119,204) (10,780,843)
Net decrease (574,650) $(5,640,987) (214,401) $(2,043,954)
33 JOHN HANCOCK Multi-Asset Absolute Return Fund |   

  Year Ended 7-31-24 Year Ended 7-31-23
  Shares Amount Shares Amount
Class C shares        
Sold 28,793 $269,556 70,374 $650,520
Distributions reinvested 25,990 236,767
Repurchased (471,019) (4,452,273) (759,644) (7,093,782)
Net decrease (442,226) $(4,182,717) (663,280) $(6,206,495)
Class I shares        
Sold 2,474,519 $24,723,505 5,829,430 $57,021,651
Distributions reinvested 646,711 6,182,558
Repurchased (7,235,560) (72,686,629) (7,551,040) (74,086,872)
Net decrease (4,761,041) $(47,963,124) (1,074,899) $(10,882,663)
Class R2 shares        
Sold 8,743 $85,105 3,188 $30,589
Distributions reinvested 2,861 26,780
Repurchased (18,946) (186,909) (23,249) (220,992)
Net decrease (10,203) $(101,804) (17,200) $(163,623)
Class R6 shares        
Sold 535,692 $5,375,960 3,160,079 $31,166,141
Distributions reinvested 718,413 6,896,761
Repurchased (10,885,555) (108,242,867) (12,828,830) (125,956,351)
Net decrease (10,349,863) $(102,866,907) (8,950,338) $(87,893,449)
Class NAV shares        
Sold 994,438 $10,147,360 2,881,850 $28,434,493
Distributions reinvested 340,895 3,272,596
Repurchased (1,020,001) (10,306,304) (1,254,349) (12,369,471)
Net increase (decrease) (25,563) $(158,944) 1,968,396 $19,337,618
Total net decrease (16,163,546) $(160,914,483) (8,951,722) $(87,852,566)
Affiliates of the fund owned 100% of shares of Class NAV on July 31, 2024. Such concentration of shareholders’ capital could have a material effect on the fund if such shareholders redeem from the fund.
Note 7Purchase and sale of securities
Purchases and sales of securities, other than short-term investments and U.S. Treasury obligations, amounted to $123,488,431 and $277,839,382, respectively, for the year ended July 31, 2024. Purchases and sales of U.S. Treasury obligations aggregated $44,262,016 and $54,083,672, respectively, for the year ended July 31, 2024.
   | JOHN HANCOCK Multi-Asset Absolute Return Fund 34

Note 8Investment by affiliated funds
Certain investors in the fund are affiliated funds that are managed by the Advisor and its affiliates. The affiliated funds do not invest in the fund for the purpose of exercising management or control; however, this investment may represent a significant portion of the fund’s net assets. At July 31, 2024, funds within the John Hancock group of funds complex held 31.0% of the fund’s net assets. The following fund(s) had an affiliate ownership of 5% or more of the fund’s net assets:
Fund Affiliated Concentration
John Hancock Funds II Alternative Asset Allocation Fund 31.0%
35 JOHN HANCOCK Multi-Asset Absolute Return Fund |   

Report of Independent Registered Public Accounting Firm

To the Board of Trustees of John Hancock Funds II and Shareholders of John Hancock Multi-Asset Absolute Return Fund
Opinion on the Financial Statements
We have audited the accompanying statement of assets and liabilities, including the fund’s investments, of John Hancock Multi-Asset Absolute Return Fund (the "Fund") as of July 31, 2024, the related statement of operations for the year ended July 31, 2024, the statements of changes in net assets for each of the two years in the period ended July 31, 2024, including the related notes, and the financial highlights for each of the five years in the period ended July 31, 2024 (collectively referred to as the “financial statements”). In our opinion, the financial statements present fairly, in all material respects, the financial position of the Fund as of July 31, 2024, the results of its operations for the year then ended, the changes in its net assets for each of the two years in the period ended July 31, 2024 and the financial highlights for each of the five years in the period ended July 31, 2024 in conformity with accounting principles generally accepted in the United States of America. 
Basis for Opinion
These financial statements are the responsibility of the Fund’s management. Our responsibility is to express an opinion on the Fund’s financial statements based on our audits. We are a public accounting firm registered with the Public Company Accounting Oversight Board (United States) (PCAOB) and are required to be independent with respect to the Fund in accordance with the U.S. federal securities laws and the applicable rules and regulations of the Securities and Exchange Commission and the PCAOB.
We conducted our audits of these financial statements in accordance with the standards of the PCAOB. Those standards require that we plan and perform the audit to obtain reasonable assurance about whether the financial statements are free of material misstatement, whether due to error or fraud.
Our audits included performing procedures to assess the risks of material misstatement of the financial statements, whether due to error or fraud, and performing procedures that respond to those risks. Such procedures included examining, on a test basis, evidence regarding the amounts and disclosures in the financial statements. Our audits also included evaluating the accounting principles used and significant estimates made by management, as well as evaluating the overall presentation of the financial statements. Our procedures included confirmation of securities owned as of July 31, 2024 by correspondence with the custodian and brokers; when replies were not received from brokers, we performed other auditing procedures. We believe that our audits provide a reasonable basis for our opinion.
PricewaterhouseCoopers LLP
Boston, Massachusetts
September 12, 2024
We have served as the auditor of one or more investment companies in the John Hancock group of funds since 1988.
   | JOHN HANCOCK MULTI-ASSET ABSOLUTE RETURN FUND 36

Tax information
(Unaudited)
For federal income tax purposes, the following information is furnished with respect to the distributions of the fund, if any, paid during its taxable year ended July 31, 2024.
The fund reports the maximum amount allowable of its net taxable income as eligible for the corporate dividends-received deduction.
The fund reports the maximum amount allowable of its net taxable income as qualified dividend income as provided in the Jobs and Growth Tax Relief Reconciliation Act of 2003.
The fund reports the maximum amount allowable as Section 163(j) Interest Dividends.
The fund reports the maximum amount allowable of its Section 199A dividends as defined in Proposed Treasury Regulation §1.199A-3(d).
Eligible shareholders will be mailed a 2024 Form 1099-DIV in early 2025. This will reflect the tax character of all distributions paid in calendar year 2024.
Please consult a tax advisor regarding the tax consequences of your investment in the fund.
37 JOHN HANCOCK MULTI-ASSET ABSOLUTE RETURN FUND |   

EVALUATION OF ADVISORY AND SUBADVISORY AGREEMENTS BY THE BOARD OF TRUSTEES

This section describes the evaluation by the Board of Trustees (the Board) of John Hancock Funds II (the Trust) of the Advisory Agreement (the Advisory Agreement) with John Hancock Investment Management LLC (the Advisor) and the Subadvisory Agreement (the Subadvisory Agreement) with Nordea Investment Management North America, Inc. (the Subadvisor) for John Hancock Multi-Asset Absolute Return Fund (the fund). The Advisory Agreement and Subadvisory Agreement are collectively referred to as the Agreements. Prior to the June 24-27, 2024 meeting at which the Agreements were approved, the Board also discussed and considered information regarding the proposed continuation of the Agreements at the meeting held on May 28 – May 30, 2024. The Trustees who are not “interested persons” of the Trust as defined by the Investment Company Act of 1940, as amended (the 1940 Act) (the Independent Trustees) also met separately to evaluate and discuss the information presented, including with counsel to the Independent Trustees and a third-party consulting firm.
Approval of Advisory and Subadvisory Agreements
At meetings held on June 24-27, 2024, the Board, including the Independent Trustees, reapproved for an annual period the continuation of the Advisory Agreement between the Trust and the Advisor and the Subadvisory Agreement between the Advisor and the Subadvisor with respect to the fund.
In considering the Advisory Agreement and the Subadvisory Agreement, the Board received in advance of the meetings a variety of materials relating to the fund, the Advisor and the Subadvisor, including comparative performance, fee and expense information for a peer group of similar funds prepared by an independent third-party provider of fund data, performance information for an applicable benchmark index; and, with respect to the Subadvisor, comparative performance information for comparably managed accounts, as applicable, and other information provided by the Advisor and the Subadvisor regarding the nature, extent and quality of services provided by the Advisor and the Subadvisor under their respective Agreements, as well as information regarding the Advisor’s revenues and costs of providing services to the fund and any compensation paid to affiliates of the Advisor. At the meetings at which the renewal of the Advisory Agreement and Subadvisory Agreement are considered, particular focus is given to information concerning fund performance, comparability of fees and total expenses, and profitability. However, the Board noted that the evaluation process with respect to the Advisor and the Subadvisor is an ongoing one. In this regard, the Board also took into account discussions with management and information provided to the Board (including its various committees) at prior meetings with respect to the services provided by the Advisor and the Subadvisor to the fund, including quarterly performance reports prepared by management containing reviews of investment results and prior presentations from the Subadvisor with respect to the fund. The information received and considered by the Board in connection with the May and June meetings and throughout the year was both written and oral. The Board also considered the nature, quality, and extent of non-advisory services, if any, to be provided to the fund by the Advisor’s affiliates, including distribution services. The Board considered the Advisory Agreement and the Subadvisory Agreement separately in the course of its review. In doing so, the Board noted the respective roles of the Advisor and Subadvisor in providing services to the fund.
Throughout the process, the Board asked questions of and requested additional information from management. The Board is assisted by counsel for the Trust and the Independent Trustees are also separately assisted by independent legal counsel throughout the process. The Independent Trustees also received a memorandum from their independent legal counsel discussing the legal standards for their consideration of the proposed continuation of the Agreements and discussed the proposed continuation of the Agreements in private sessions with their independent legal counsel at which no representatives of management were present.
   | JOHN HANCOCK MULTI-ASSET ABSOLUTE RETURN FUND 38

Approval of Advisory Agreement
In approving the Advisory Agreement with respect to the fund, the Board, including the Independent Trustees, considered a variety of factors, including those discussed below. The Board also considered other factors (including conditions and trends prevailing generally in the economy, the securities markets, and the industry) and did not treat any single factor as determinative, and each Trustee may have attributed different weights to different factors. The Board’s conclusions may be based in part on its consideration of the advisory and subadvisory arrangements in prior years and on the Board’s ongoing regular review of fund performance and operations throughout the year.
Nature, extent, and quality of services. Among the information received by the Board from the Advisor relating to the nature, extent, and quality of services provided to the fund, the Board reviewed information provided by the Advisor relating to its operations and personnel, descriptions of its organizational and management structure, and information regarding the Advisor’s compliance and regulatory history, including its Form ADV. The Board also noted that on a regular basis it receives and reviews information from the Trust’s Chief Compliance Officer (CCO) regarding the fund’s compliance policies and procedures established pursuant to Rule 38a-1 under the 1940 Act. The Board observed that the scope of services provided by the Advisor, and of the undertakings required of the Advisor in connection with those services, including maintaining and monitoring its own and the fund’s compliance programs, risk management programs, liquidity risk management programs, derivatives risk management programs, and cybersecurity programs, had expanded over time as a result of regulatory, market and other developments. The Board considered that the Advisor is responsible for the management of the day-to-day operations of the fund, including, but not limited to, general supervision of and coordination of the services provided by the Subadvisor, and is also responsible for monitoring and reviewing the activities of the Subadvisor and other third-party service providers. The Board also considered the significant risks assumed by the Advisor in connection with the services provided to the fund including entrepreneurial risk in sponsoring new funds and ongoing risks including investment, operational, enterprise, litigation, regulatory and compliance risks with respect to all funds.
In considering the nature, extent, and quality of the services provided by the Advisor, the Trustees also took into account their knowledge of the Advisor’s management and the quality of the performance of the Advisor’s duties, through Board meetings, discussions and reports during the preceding year and through each Trustee’s experience as a Trustee of the Trust and of the other trusts in the John Hancock group of funds complex (the John Hancock Fund Complex).
In the course of their deliberations regarding the Advisory Agreement, the Board considered, among other things:
(a) the skills and competency with which the Advisor has in the past managed the Trust’s affairs and its subadvisory relationship, the Advisor’s oversight and monitoring of the Subadvisor’s investment performance and compliance programs, such as the Subadvisor’s compliance with fund policies and objectives, review of brokerage matters, including with respect to trade allocation and best execution and the Advisor’s timeliness in responding to performance issues;
(b) the background, qualifications and skills of the Advisor’s personnel;
(c) the Advisor’s compliance policies and procedures and its responsiveness to regulatory changes and fund industry developments;
(d) the Advisor’s administrative capabilities, including its ability to supervise the other service providers for the fund, as well as the Advisor’s oversight of any securities lending activity, its monitoring of class action litigation and collection of class action settlements on behalf of the fund, and bringing loss recovery actions on behalf of the fund;
(e) the financial condition of the Advisor and whether it has the financial wherewithal to provide a high level and quality of services to the fund;
39 JOHN HANCOCK MULTI-ASSET ABSOLUTE RETURN FUND  |   

(f) the Advisor’s initiatives intended to improve various aspects of the Trust’s operations and investor experience with the fund; and
(g) the Advisor’s reputation and experience in serving as an investment advisor to the Trust and the benefit to shareholders of investing in funds that are part of a family of funds offering a variety of investments.
The Board concluded that the Advisor may reasonably be expected to continue to provide a high quality of services under the Advisory Agreement with respect to the fund.
Investment performance. In considering the fund’s performance, the Board noted that it reviews at its regularly scheduled meetings information about the fund’s performance results. In connection with the consideration of the Advisory Agreement, the Board:
(a) reviewed information prepared by management regarding the fund’s performance;
(b) considered the comparative performance of an applicable benchmark index;
(c) considered the performance of comparable funds, if any, as included in the report prepared by an independent third-party provider of fund data; and
(d) took into account the Advisor’s analysis of the fund’s performance and its plans and recommendations regarding the Trust’s subadvisory arrangements generally.
The Board noted that while it found the data provided by the independent third-party generally useful it recognized its limitations, including in particular that the data may vary depending on the end date selected and the results of the performance comparisons may vary depending on the selection of the peer group. The Board noted that the fund outperformed its benchmark index for the three-, five- and ten-year periods and underperformed for the one-year period ended December 31, 2023. The Board also noted that the fund outperformed its peer group median for the three-year period and underperformed for the one-, five- and ten-year periods ended December 31, 2023. The Board took into account management’s discussion of the fund’s performance, including the favorable performance relative to the benchmark index for the three-, five- and ten-year periods and relative to its peer group median for the three-year period. The Board concluded that the fund’s performance has generally been in line with or outperformed the historical performance of comparable funds and the fund’s benchmark index. The Board noted that the fund’s previous subadvisor was replaced in August 2019 and, as a result, the fund’s longer term performance in part reflects that of the previous subadvisor.
Fees and expenses. The Board reviewed comparative information prepared by an independent third-party provider of fund data, including, among other data, the fund’s contractual and net management fees (and subadvisory fees, to the extent available) and total expenses as compared to similarly situated investment companies deemed to be comparable to the fund in light of the nature, extent and quality of the management and advisory and subadvisory services provided by the Advisor and the Subadvisor. The Board considered the fund’s ranking within a smaller group of peer funds chosen by the independent third-party provider, as well as the fund’s ranking within a broader group of funds. In comparing the fund’s contractual and net management fees to those of comparable funds, the Board noted that such fees include both advisory and administrative costs. The Board noted that net management fees and net total expenses for the fund are lower than the peer group median.
The Board took into account management’s discussion with respect to the overall management fee and the fees of the Subadvisor, including the amount of the advisory fee retained by the Advisor after payment of the subadvisory fee, in each case in light of the services rendered for those amounts and the risks undertaken by the Advisor. The Board also noted that the Advisor pays the subadvisory fee, and that such fees are negotiated at arm’s length with respect to the Subadvisor. In addition, the Board took into account that management had agreed to implement an overall fee waiver across the complex, including the fund, which is discussed further below. The Board also noted actions taken over the past several years to reduce the fund’s operating expenses. The Board also noted that, in addition, the Advisor is currently waiving fees and/or reimbursing expenses with respect to the fund and that the
   | JOHN HANCOCK MULTI-ASSET ABSOLUTE RETURN FUND 40

fund has breakpoints in its contractual management fee schedule that reduces management fees as assets increase. The Board reviewed information provided by the Advisor concerning the investment advisory fee charged by the Advisor or one of its advisory affiliates to other clients (including other funds in the John Hancock Fund Complex) having similar investment mandates, if any. The Board considered any differences between the Advisor’s and Subadvisor’s services to the fund and the services they provide to other comparable clients or funds. The Board concluded that the advisory fee paid with respect to the fund is reasonable in light of the nature, extent and quality of the services provided to the fund under the Advisory Agreement.
Profitability/Fall out benefits. In considering the costs of the services to be provided and the profits to be realized by the Advisor and its affiliates from the Advisor’s relationship with the Trust, the Board:
(a) reviewed financial information of the Advisor;
(b) reviewed and considered information presented by the Advisor regarding the net profitability to the Advisor and its affiliates with respect to the fund;
(c) received and reviewed profitability information with respect to the John Hancock Fund Complex as a whole and with respect to the fund;
(d) received information with respect to the Advisor’s allocation methodologies used in preparing the profitability data and considered that the Advisor hired an independent third-party consultant to provide an analysis of the Advisor’s allocation methodologies;
(e) considered that the John Hancock insurance companies that are affiliates of the Advisor, as shareholders of the Trust directly or through their separate accounts, receive certain tax credits or deductions relating to foreign taxes paid and dividends received by certain funds of the Trust and noted that these tax benefits, which are not available to participants in qualified retirement plans under applicable income tax law, are reflected in the profitability information reviewed by the Board;
(f) considered that the Advisor also provides administrative services to the fund on a cost basis pursuant to an administrative services agreement;
(g) noted that affiliates of the Advisor provide transfer agency services and distribution services to the fund, and that the fund’s distributor also receives Rule 12b-1 payments to support distribution of the fund;
(h) noted that the Advisor also derives reputational and other indirect benefits from providing advisory services to the fund;
(i) noted that the subadvisory fee for the fund is paid by the Advisor and is negotiated at arm’s length;
(j) considered the Advisor’s ongoing costs and expenditures necessary to improve services, meet new regulatory and compliance requirements, and adapt to other challenges impacting the fund industry; and
(k) considered that the Advisor should be entitled to earn a reasonable level of profits in exchange for the level of services it provides to the fund and the risks that it assumes as Advisor, including entrepreneurial, operational, reputational, litigation and regulatory risk.
Based upon its review, the Board concluded that the level of profitability, if any, of the Advisor and its affiliates from their relationship with the fund was reasonable and not excessive.
Economies of scale. In considering the extent to which economies of scale would be realized as the fund grows and whether fee levels reflect these economies of scale for the benefit of fund shareholders, the Board:
(a) considered that the Advisor has contractually agreed to waive a portion of its management fee for certain funds of the John Hancock Fund Complex, including the fund (the participating portfolios) or
41 JOHN HANCOCK MULTI-ASSET ABSOLUTE RETURN FUND  |   

  otherwise reimburse the expenses of the participating portfolios (the reimbursement). This waiver is based upon aggregate net assets of all the participating portfolios. The amount of the reimbursement is calculated daily and allocated among all the participating portfolios in proportion to the daily net assets of each fund;
(b) reviewed the fund’s advisory fee structure and concluded that: (i) the fund’s fee structure contains breakpoints at the subadvisory fee level and that such breakpoints are reflected as breakpoints in the advisory fees for the fund; and (ii) although economies of scale cannot be measured with precision, these arrangements permit shareholders of the fund to benefit from economies of scale if the fund grows. The Board also took into account management’s discussion of the fund’s advisory fee structure; and
(c) the Board also considered the effect of the fund’s growth in size on its performance and fees. The Board also noted that if the fund’s assets increase over time, the fund may realize other economies of scale
Approval of Subadvisory Agreement
In making its determination with respect to approval of the Subadvisory Agreement, the Board reviewed:
(1) information relating to the Subadvisor’s business, including current subadvisory services to the fund (and other funds in the John Hancock Fund Complex);
(2) the historical and current performance of the fund and comparative performance information relating to an applicable benchmark index and comparable funds;
(3) the subadvisory fee for the fund, including any breakpoints, and to the extent available, comparable fee information prepared by an independent third party provider of fund data; and
(4) information relating to the nature and scope of any material relationships and their significance to the fund’s Advisor and Subadvisor.
Nature, extent, and quality of services. With respect to the services provided by the Subadvisor, the Board received information provided to the Board by the Subadvisor, including the Subadvisor’s Form ADV, as well as took into account information presented throughout the past year. The Board considered the Subadvisor’s current level of staffing and its overall resources, as well as received information relating to the Subadvisor’s compensation program. The Board reviewed the Subadvisor’s history and investment experience, as well as information regarding the qualifications, background, and responsibilities of the Subadvisor’s investment and compliance personnel who provide services to the fund. The Board also considered, among other things, the Subadvisor’s compliance program and any disciplinary history. The Board also considered the Subadvisor’s risk assessment and monitoring process. The Board reviewed the Subadvisor’s regulatory history, including whether it was involved in any regulatory actions or investigations as well as material litigation, and any settlements and amelioratory actions undertaken, as appropriate. The Board noted that the Advisor conducts regular, periodic reviews of the Subadvisor and its operations, including regarding investment processes and organizational and staffing matters. The Board also noted that the Trust’s CCO and his staff conduct regular, periodic compliance reviews with the Subadvisor and present reports to the Independent Trustees regarding the same, which includes evaluating the regulatory compliance systems of the Subadvisor and procedures reasonably designed to assure compliance with the federal securities laws. The Board also took into account the financial condition of the Subadvisor.
The Board considered the Subadvisor’s investment process and philosophy. The Board took into account that the Subadvisor’s responsibilities include the development and maintenance of an investment program for the fund that is consistent with the fund’s investment objective, the selection of investment securities and the placement of
   | JOHN HANCOCK MULTI-ASSET ABSOLUTE RETURN FUND 42

orders for the purchase and sale of such securities, as well as the implementation of compliance controls related to performance of these services. The Board also received information with respect to the Subadvisor’s brokerage policies and practices, including with respect to best execution and soft dollars.
Subadvisor compensation. In considering the cost of services to be provided by the Subadvisor and the profitability to the Subadvisor of its relationship with the fund, the Board noted that the fees under the Subadvisory Agreement are paid by the Advisor and not the fund.
The Board also relied on the ability of the Advisor to negotiate the Subadvisory Agreement with the Subadvisor, which is not affiliated with the Advisor, and the fees thereunder at arm’s length. As a result, the costs of the services to be provided and the profits to be realized by the Subadvisor from its relationship with the fund were not a material factor in the Board’s consideration of the Subadvisory Agreement.
The Board also received information regarding the nature and scope (including their significance to the Advisor and its affiliates and to the Subadvisor) of any material relationships with respect to the Subadvisor, which include arrangements in which the Subadvisor or its affiliates provide advisory, distribution, or management services in connection with financial products sponsored by the Advisor or its affiliates, and may include other registered investment companies, a 529 education savings plan, managed separate accounts and exempt group annuity contracts sold to qualified plans. The Board also received information and took into account any other potential conflicts of interest the Advisor might have in connection with the Subadvisory Agreement.
In addition, the Board considered other potential indirect benefits that the Subadvisor and its affiliates may receive from the Subadvisor’s relationship with the fund, such as the opportunity to provide advisory services to additional funds in the John Hancock Fund Complex and reputational benefits.
Subadvisory fees. The Board considered that the fund pays an advisory fee to the Advisor and that, in turn, the Advisor pays a subadvisory fee to the Subadvisor. As noted above, the Board also considered the fund’s subadvisory fees as compared to similarly situated investment companies deemed to be comparable to the fund as included in the report prepared by the independent third party provider of fund data, to the extent available. The Board noted that the limited size of the Lipper peer group was not sufficient for comparative purposes. The Board also took into account the subadvisory fees paid by the Advisor to the Subadvisor with respect to the fund and compared them to fees charged by the Subadvisor to manage other subadvised portfolios and portfolios not subject to regulation under the 1940 Act, as applicable.
Subadvisor performance. As noted above, the Board considered the fund’s performance as compared to the fund’s peer group and the benchmark index and noted that the Board reviews information about the fund’s performance results at its regularly scheduled meetings. The Board noted the Advisor’s expertise and resources in monitoring the performance, investment style and risk-adjusted performance of the Subadvisor. The Board was mindful of the Advisor’s focus on the Subadvisor’s performance. The Board also noted the Subadvisor’s long-term performance record for similar accounts, as applicable.
The Board’s decision to approve the Subadvisory Agreement was based on a number of determinations, including the following:
(1) the Subadvisor has extensive experience and demonstrated skills as a manager;
(2) the performance of the fund has generally been in line with or outperformed the historical performance of comparable funds and the fund’s benchmark index;
(3) the subadvisory fee is reasonable in relation to the level and quality of services being provided under the Subadvisory Agreement; and
43 JOHN HANCOCK MULTI-ASSET ABSOLUTE RETURN FUND  |   

(4) noted that the subadvisory fees are paid by the Advisor not the fund and that the subadvisory fee breakpoints are reflected as breakpoints in the advisory fees for the fund in order to permit shareholders to benefit from economies of scale if the fund grows.
***
Based on the Board’s evaluation of all factors that the Board deemed to be material, including those factors described above, the Board, including the Independent Trustees, concluded that renewal of the Advisory Agreement and the Subadvisory Agreement would be in the best interest of the fund and its shareholders. Accordingly, the Board, and the Independent Trustees voting separately, approved the Advisory Agreement and Subadvisory Agreement for an additional one-year period.
   | JOHN HANCOCK MULTI-ASSET ABSOLUTE RETURN FUND 44

A better way to invest
We serve investors globally through a unique multimanager approach:
We search the world to find proven portfolio teams with specialized
expertise for every strategy we offer, then we apply robust investment
oversight to ensure they continue to meet our uncompromising
standards and serve the best interests of our shareholders.
Results for investors
Our unique approach to asset management enables us to provide
a diverse set of investments backed by some of the world’s best
managers, along with strong risk-adjusted returns across asset classes.
John Hancock Investment Management Distributors LLC, Member FINRA, SIPC
200 Berkeley Street, Boston, MA 02116, 800-225-5291, jhinvestments.com
Manulife Investment Management, the Stylized M Design, and Manulife Investment Management & Stylized M Design are trademarks of The Manufacturers Life Insurance Company and are used by its affiliates under license.
NOT FDIC INSURED. MAY LOSE VALUE. NO BANK GUARANTEE. NOT INSURED BY ANY GOVERNMENT AGENCY.
This report is for the information of the shareholders of John Hancock Multi-Asset Absolute Return Fund. It is not authorized for distribution to prospective investors unless preceded or accompanied by a prospectus.
MF3743813 395A 7/24
9/24


ITEM 8. CHANGES IN AND DISAGREEMENTS WITH ACCOUNTANTS FOR OPEN-END MANAGEMENT INVESTMENT COMPANIES.

Not applicable.


ITEM 9. PROXY DISCLOSURE FOR OPEN-END MANAGEMENT INVESTMENT COMPANIES.

Information included in Item 7, if applicable.


ITEM 10. REMUNERATION PAID TO DIRECTORS, OFFICERS, AND OTHERS OF OPEN-END MANAGEMENT INVESTMENT COMPANIES.

Refer to information included in Item 7.


ITEM 11. STATEMENT REGARDING BASIS FOR APPROVAL OF INVESTMENT ADVISORY CONTRACT.

Information included in Item 7, if applicable.


ITEM 12. DISCLOSURE OF PROXY VOTING POLICIES AND PROCEDURES FOR CLOSED-END MANAGEMENT INVESTMENT COMPANIES.

Not applicable.


ITEM 13. PORTFOLIO MANAGERS OF CLOSED-END MANAGEMENT INVESTMENT COMPANIES.

Not applicable.


ITEM 14. PURCHASES OF EQUITY SECURITIES BY CLOSED-END MANAGEMENT INVESTMENT COMPANY AND AFFILIATE PURCHASERS.

Not applicable.


ITEM 15. SUBMISSION OF MATTERS TO A VOTE OF SECURITY HOLDERS.

The registrant has adopted procedures by which shareholders may recommend nominees to the registrant's Board of Trustees. A copy of the procedures is filed as an exhibit to this Form N-CSR. See attached "John Hancock Funds – Nominating, Governance and Administration Committee Charter".


ITEM 16. CONTROLS AND PROCEDURES.

(a) Based upon their evaluation of the registrant's disclosure controls and procedures as conducted within 90 days of the filing date of this Form N-CSR, the registrant's principal executive officer and principal financial officer have concluded that those disclosure controls and procedures provide reasonable assurance that the material information required to be disclosed by the registrant on this report is recorded, processed, summarized and reported within the time periods specified in the Securities and Exchange Commission's rules and forms.

(b) There were no changes in the registrant's internal control over financial reporting that occurred during the period covered by this report that have materially affected, or are reasonably likely to materially affect, the registrant's internal control over financial reporting.


ITEM 17. DISCLOSURE OF SECURITIES LENDING ACTIVITIES FOR CLOSED-END MANAGEMENT INVESTMENT COMPANIES.

Not applicable.


ITEM 18. RECOVERY OF ERRONEOUSLY AWARDED COMPENSATION.

Not applicable.


ITEM 19. EXHIBITS.

(a)(1) Code of Ethics for Covered Officers is attached.

(a)(2) Separate certifications for the registrant's principal executive officer and principal financial officer, as required by Section 302 of the Sarbanes-Oxley Act of 2002 and Rule 30a-2(a) under the Investment Company Act of 1940, are attached.

(b) Separate certifications for the registrant's principal executive officer and principal financial officer, as required by 18 U.S.C. Section 1350, as adopted pursuant to Section 906 of the Sarbanes-Oxley Act of 2002, and Rule 30a-2(b) under the Investment Company Act of 1940, are attached. The certifications furnished pursuant to this paragraph are not deemed to be "filed" for purposes of Section 18 of the Securities Exchange Act of 1934, or otherwise subject to the liability of that section. Such certifications are not deemed to be incorporated by reference into any filing under the Securities Act of 1933 or the Securities Exchange Act of 1934, except to the extent that the Registrant specifically incorporates them by reference.

(c)(1) Submission of Matters to a Vote of Security Holders is attached. See attached "John Hancock Funds – Nominating, Governance and Administration Committee Charter”.


                                                                        SIGNATURES

Pursuant to the requirements of the Securities Exchange Act of 1934 and the Investment Company Act of 1940, the registrant has duly caused this report to be signed on its behalf by the undersigned, thereunto duly authorized.

John Hancock Funds II

By: /s/ Kristie M. Feinberg
------------------------------
Kristie M. Feinberg
President
Date: September 12, 2024

Pursuant to the requirements of the Securities Exchange Act of 1934 and the Investment Company Act of 1940, this report has been signed below by the following persons on behalf of the registrant and in the capacities and on the dates indicated.

By: /s/ Kristie M. Feinberg
------------------------------
Kristie M. Feinberg
President
Date: September 12, 2024
By: /s/ Fernando A. Silva
---------------------------
Fernando A. Silva
Chief Financial Officer
Date: September 12, 2024


ATTACHMENTS / EXHIBITS

E

E

E

E

EX-101.SCH

IDEA: R1.htm

IDEA: R2.htm

IDEA: R3.htm

IDEA: R4.htm

IDEA: Financial_Report.xlsx

IDEA: FilingSummary.xml

IDEA: MetaLinks.json

IDEA: 8dcdda4a7b38711_htm.xml


Serious News for Serious Traders! Try StreetInsider.com Premium Free!

You May Also Be Interested In


Related Categories

SEC Filings