

Form N-CSR Investment Managers Seri For: Oct 31
 Tweet
Tweet Share
ShareUNITED STATES
SECURITIES AND EXCHANGE COMMISSION
Washington, D.C. 20549
FORM N-CSR
CERTIFIED SHAREHOLDER REPORT OF REGISTERED
MANAGEMENT INVESTMENT COMPANIES
Investment Company Act file number 811-21719
INVESTMENT MANAGERS SERIES TRUST
(Exact name of registrant as specified in charter)
235 W. Galena Street
Milwaukee, WI 53212
(Address of principal executive offices) (Zip code)
Constance Dye Shannon
UMB Fund Services, Inc.
235 W. Galena Street
Milwaukee, WI 53212
(Name and address of agent for service)
(414) 299-2295
Registrant's telephone number, including area code
Date of fiscal year end: October 31
Date of reporting period: October 31, 2018
Item 1. Report to Stockholders.
The registrant’s annual report transmitted to shareholders pursuant to Rule 30e-1 under the Investment Company Act of 1940, as amended (the “Investment Company Act”), is as follows:

EuroPac International Value Fund
Class A (EPIVX)
Class I (EPVIX)
EuroPac International Bond Fund
Class A (EPIBX)
Class I (EPBIX)
EuroPac International Dividend Income Fund
Class A (EPDPX)
Class I (EPDIX)
EP Emerging Markets Small Companies Fund
Class A (EPASX)
Class I (EPEIX)
EuroPac Gold Fund
Class A (EPGFX)
ANNUAL REPORT
October 31, 2018
Euro Pacific Funds
Each a series of Investment Managers Series Trust
Table of Contents
| Shareholder Letter | 1 |
| Fund Performance | 5 |
| Schedules of Investments | 15 |
| Statements of Assets and Liabilities | 34 |
| Statements of Operations | 36 |
| Statements of Changes in Net Assets | 38 |
| Financial Highlights | 43 |
| Notes to Financial Statements | 52 |
| Report of Independent Registered Public Accounting Firm | 69 |
| Supplemental Information | 70 |
| Expense Examples | 81 |
This report and the financial statements contained herein are provided for the general information of the shareholders of the Euro Pacific Funds. This report is not authorized for distribution to prospective investors in the Funds unless preceded or accompanied by an effective prospectus.
www.europacificfunds.com

Dear Shareholder,
We are pleased to present the Annual Report for the EuroPac International Value Fund, EuroPac International Dividend Income Fund, EuroPac International Bond Fund, EuroPac Gold Fund and EP Emerging Markets Small Companies Fund with respect to the period November 1, 2017 through October 31, 2018.
Entering 2018, our view on the United States economy was mixed. We expected fiscal stimulus to support growth while monetary tightening would act as a headwind. Through the first three quarters of 2018, the former (a budget deficit that increased over $300B year-over-year) sufficiently offset the latter (an increase in the Federal Funds Rate of +100 basis points year-over-year) and GDP growth outperformed consensus forecasts. As a result, expectations for continued Federal Reserve tightening were lifted, causing the U.S. 2-year yield to increase by over +150 basis points year-over-year and the U.S. Dollar to strengthen (Dollar Index was up over 7% year-over-year).1 Despite seemingly solid momentum, we believe U.S. growth peaked in 3Q18 and expect rate hike expectations and the Dollar to move lower in 2019.
Regardless of the U.S. Dollar’s near-term moves, we believe widening budget deficits will weigh on the Dollar for the foreseeable future. In 2019, the budget deficit could exceed $1.0 trillion (4.6% of GDP), which is double the 2015 deficit and the largest non-recession expansion of the deficit since WWII.2
Largely due to mandatory entitlement spending, the deficit is expected to grow even further over the next decade. Assuming stable economic growth, the Congressional Budget Office (CBO) projects the deficit will average over 5% of GDP through 2028.3 We believe the current trajectory of the budget deficit will push the Dollar lower, and a potential recession could exacerbate this weakness. For example, in the last four recessions the budget balance declined an average of 500 basis points.4 If this average were to hold, the next recession could drive the deficit well over 10% of GDP.
The Euro Pacific family of funds are all international products designed to provide our U.S. investors additional diversification outside of the U.S. Dollar.5 After facing the challenge of a stronger U.S. Dollar over the past few years, we believe this trend is reversing and shifting into our favor. We remain focused on providing our shareholders the advantage of the distinct diversification that the Euro Pacific Funds offer.
| 1 | Bloomberg, 11/30/18. |
| 2 | ibid. |
| 3 | “The Budget and Economic Outlook: 2018-2028.” Congressional Budget Office (CBO), 4/9/18. |
| 4 | Bloomberg, 11/30/18. |
| 5 | Diversification does not ensure a profit or protect against loss in a declining market. |
| 1 |
Overview of the Results of the Funds
EuroPac International Value Fund
The EuroPac International Value Fund attempts to generate income and capital appreciation over a long-term investment horizon by selectively choosing undervalued foreign companies, primarily located within Europe and the Pacific Rim, and with minimal exposure to the US Dollar. The EuroPac International Value Fund uses a top-down allocation approach to select what it views as the most fundamentally sound countries to invest and a bottom-up approach to select high-quality, undervalued companies. The Fund will also tend to be overweight commodities versus financials, given an outlook for a weaker US Dollar. The strategy seeks to diversify currency risk and takes a long-term investment view with low portfolio turnover.
In fiscal year 2018, the International Value Fund A-share returned -10.00% without the maximum sales load and -14.04% with the maximum sales load while the I-share returned -9.75%, which compares unfavorably to the Morgan Stanley Capital International All Country World Ex USA Value Index return of -7.73%. In 2018, the fund underperformed as gold stocks fell on rising U.S. growth and Federal Reserve rate hike expectations. We believe gold stocks remain substantially undervalued and, though near-term volatility is expected, we are very optimistic on their long-term potential.
EuroPac International Bond Fund
The EuroPac International Bond Fund attempts to preserve capital and provide income over a long-term investment horizon by selectively choosing foreign bonds of issuers in Europe and the Pacific Rim with exposure to a balanced basket of currencies that the Fund believes have the greatest potential for long-term appreciation versus the US Dollar. The EuroPac International Bond Fund uses a top-down allocation approach to select what it views as the most fundamentally sound countries and currencies to invest and a bottom-up approach to select undervalued government and corporate bonds.
In fiscal year 2018, the International Bond Fund A-share returned -3.80% without the maximum sales load and -8.15% with the maximum sales load, while the I-share returned -3.53%, which compared unfavorably to the JP Morgan Government Bond Index Global ex-US Unhedged Index at -2.22%. The Fund finished unfavorably versus its benchmark due to its lack of exposure to the Euro and Yen currencies. Looking forward, we believe the fund is well positioned as the U.S. Dollar reverses its ascent, and other less liquid currencies that have been out of favor rise in value relative to the traditional hard currencies.
EuroPac International Dividend Income Fund
The EuroPac International Dividend Income Fund attempts to maximize expected dividend income outside of the United States, using a top-down analysis to select the best currencies and sectors, and a bottom-up analysis to select the securities with the most potential to pay out high and sustainable dividends that grow. The strategy seeks to diversify currency risk and takes a long-term investment view with low portfolio turnover.
In fiscal year 2018, the EuroPac International Dividend Income Fund A-share returned -7.54% without the maximum sales load and -11.69% with the maximum sales load while the I-share returned -7.17%, which compares closely to the S&P International Dividend Opportunities Index at -7.03%. The Fund underperformed in the first half of the FY18 due to its defensive positioning. However, in the latter part of FY18, the Fund outperformed as markets began pricing slowing global growth. We continue to maintain a defensive posture, as we expect consensus growth and FED tightening expectations to continue moving lower in 2019.
| 2 |
EP Emerging Markets Small Companies Fund
The EP Emerging Markets Small Companies Fund seeks to invest at least 80% of its net assets in equity securities of small capitalization companies. The Sub-advisor defines small companies as those companies with market capitalizations, at the time of investment, of below $3 billion. The Sub-advisor will focus the Fund’s investments on what the Sub-advisor believes are financially sound, stable but growing, small cap companies. The Sub-advisor uses an active management investment approach to researching, identifying and selecting portfolio companies. The research process is driven by bottom-up fundamental analysis that aims to identify growing but stable companies trading at attractive valuations relative to anticipated growth in revenue and earnings. Prior to making an investment, the Sub-advisor considers factors including, but not limited to, financial statement analysis; quality of management; insider ownership; perceived soundness of the business strategies; ability to sustain a competitive advantage; liquidity; and valuation relative to expected growth.
In fiscal year 2018, the EP Emerging Markets Small Companies Fund returned -17.93% without the maximum sales load and -21.61% with the maximum sales load while the I-share returned -17.71%, which compares similarly to the Morgan Stanley Capital International Emerging Markets Small Cap Index’s -17.21%. The fund’s slight underperformance in the period was largely driven by an underweight allocation to South Korea.
EuroPac Gold Fund
The EuroPac Gold Fund seeks long-term capital appreciation. Under normal market conditions, the Fund invests at least 80% of its net assets (plus any borrowings for investment purposes) in the securities of gold companies located in Europe and the Pacific Rim. The Fund's sub-advisor defines securities of gold companies as equity securities of companies that derive at least 50% of gross revenue or profit from mining, processing, or dealing and investing in gold, as well as companies whose primary business is exploring for gold or that provide services to the gold industry.
In fiscal year 2018, the EuroPac Gold Fund returned -14.37% without the maximum sales load and -18.24% with the maximum sales load, which compared favorably versus the Philadelphia Gold and Silver Index at -20.24%. The Fund outperformed its benchmark during the period largely because of stock selection as well as its oversized weighting toward mid and smaller-tier companies.
We would like to extend our sincere thanks for investing with Euro Pacific Funds. We welcome your questions and comments and look forward to serving your investment needs in the years ahead.
Sincerely,

Jim Nelson, CFA
Portfolio Manager
Euro Pacific Asset Management, LLC
Past performance is not a guarantee of future results. One cannot invest directly in an Index.
| 3 |
The views in this letter were as of December 13, 2018 and may not necessarily reflect the same views on the date this letter is first published or any time thereafter. These views are intended to help shareholders in understanding the fund's investment methodology and do not constitute investment advice.
Foreign investments present additional risk due to economic and political factors, government regulations, differences in accounting standards and other factors. In addition, the value of securities can change significantly when foreign currencies strengthen or weaken relative to the U.S. dollar, or in the case of hedging positions that the U.S. dollar will decline relative to the currency being hedged. Currency rates may fluctuate significantly over short periods of time due to controls or political developments and may result in reduced returns.
Investments in emerging markets involve even greater risks. The Funds will be more susceptible to the economic, market, political, regulatory, local risks and potential natural disasters of the European and Pacific Rim regions than a fund that is more geographically diversified. The economies of Latin American countries are particularly sensitive to fluctuations in commodity prices, currencies and global demand for commodities. Investments closely tied to the Latin American region are generally characterized by high interest, inflation, and unemployment rates and may be more volatile. Small, and mid cap stocks are subject to substantial risks such as market, business, size, volatility, management experience, product diversification, financial resource, competitive strength, liquidity, and unpredictably. The prices of fixed income securities respond to economic developments, particularly interest rate changes, as well as to perceptions about the creditworthiness of individual issuers, including governments. Generally, fixed income securities decrease in value if interest rates rise and increase in value if interest rates fall, with lower rated securities more volatile than higher rated securities. The Fund may be susceptible to government regulation, impacting hard asset sectors (such as the Precious metals, natural resources, and real estate sectors). Precious metals and natural resources securities are at times volatile and there may be sharp fluctuations in prices, even during periods of rising prices. To the extent the Funds use futures, swaps, and other derivatives, it is exposed to additional volatility and potential losses resulting from leverage. The use of derivatives involves risks different from, and possibly greater then, the risks associated with investing directly in the underlying assets. Derivatives can be highly volatile, illiquid, and difficult to value. The Funds may be subject to greater risks than a fund whose portfolio has exposure to a broader range of sectors.
| 4 |
EuroPac International Value Fund
FUND PERFORMANCE at October 31, 2018 (Unaudited)

This graph compares a hypothetical $10,000 investment in the Fund’s Class A shares (assumes the maximum sales load charged by the Fund), made at its inception, with a similar investment in the MSCI AC World Ex USA Value Index. The performance graph above is shown for the Fund’s Class A shares, Class I shares performance may vary. Results include the reinvestment of all dividends and capital gains.
The MSCI AC World Ex USA Value Index provides a broad measure of stock performance throughout the world, with the exception of U.S. based companies. This index does not reflect expenses, fees or sales charge, which would lower performance. The index is unmanaged and it is not available for investment.
| Average Annual Total Returns as of October 31, 2018 | 1 Year | 5 Years | Since Inception |
Inception Date |
| Before deducting maximum sales charge | ||||
| Class A¹ | -10.00% | -5.36% | -2.11% | 04/07/10 |
| Class I² | -9.75% | -5.13% | -1.87% | 07/16/13 |
| After deducting maximum sales charge | ||||
| Class A¹ | -14.04% | -6.22% | -2.63% | 04/07/10 |
| MSCI AC World Ex USA Value Index | -7.73% | 0.61% | 2.68% | 04/07/10 |
| 1 | Maximum sales charge for Class A shares is 4.50%. No deferred sales charge will be imposed on any purchases. |
| 2 | The performance figures for Class I shares include the performance of the Class A shares for the periods prior to the inception date of Class I shares. Class A shares impose higher expenses than that of Class I shares. Class I shares do not have any initial or deferred sales charge. |
The performance data quoted here represents past performance and past performance is not a guarantee of future results. Investment return and principal value will fluctuate so that an investor’s shares, when redeemed, may be worth more or less than their original cost. Current performance may be lower or higher than the performance information quoted. The most recent month end performance may be obtained by calling (888) 558-5851.
| 5 |
EuroPac International Value Fund
FUND PERFORMANCE at October 31, 2018 (Unaudited) - Continued
Gross and net expense ratios for Class A shares were 1.92% and 1.75%, respectively, and for Class I shares were 1.67% and 1.50%, respectively, which were the amounts stated in the current prospectus dated March 1, 2018, as amended October 12, 2018. For the Fund’s current one-year expense ratios, please refer to the Financial Highlights section of this report. The Fund’s Advisor has contractually agreed to waive its fees and/or pay for operating expenses of the Fund to ensure that total annual fund operating expenses do not exceed 1.75% and 1.50% of the average daily net assets of Class A and Class I shares of the Fund, respectively. This agreement is in effect until February 28, 2019, and it may be terminated before that date only by the Trust’s Board of Trustees. In the absence of such waivers, the Fund’s returns would have been lower.
Returns reflect the reinvestment of distributions made by the Fund, if any. The graph and the performance table above do not reflect the deduction of taxes that a shareholder would pay on Fund distributions or the redemption of Fund shares. Shares redeemed within 30 days of purchase will be charged a redemption fee of 2.00%.
| 6 |
EuroPac International Bond Fund
FUND PERFORMANCE at October 31, 2018 (Unaudited)

This graph compares a hypothetical $10,000 investment in the Fund’s Class A shares, (assumes the maximum sales load charged by the Fund), made at its inception, with a similar investment in the JP Morgan GBI Global ex-US FX NY Index Unhedged in USD. The performance graph above is shown for the Fund’s Class A shares, Class I shares performance may vary. Results include the reinvestment of all dividends and capital gains.
The JP Morgan GBI Global ex-US FX NY Index Unhedged in USD is an unmanaged index market representative of the total return performance in U.S. dollars on an unhedged basis of major non-U.S. bond markets. This index does not reflect expenses, fees or sales charge, which would lower performance. The index is unmanaged and it is not available for investment.
| Average Annual Total Returns as of October 31, 2018 | 1 Year | 5 Years | Since Inception |
Inception Date |
| Before deducting maximum sales charge | ||||
| Class A¹ | -3.80% | -3.06% | -1.19% | 11/15/10 |
| Class I² | -3.53% | -2.81% | -0.95% | 07/16/13 |
| After deducting maximum sales charge | ||||
| Class A¹ | -8.15% | -3.96% | -1.76% | 11/15/10 |
| JP Morgan GBI Global ex-US FX NY Index Unhedged in USD | -2.22% | -0.64% | 0.04% | 11/15/10 |
| 1 | Maximum sales charge for Class A shares is 4.50%. No deferred sales charge will be imposed on any purchases. |
| 2 | The performance figures for Class I shares include the performance of the Class A shares for the periods prior to the inception date of Class I shares. Class A shares impose higher expenses than that of Class I shares. Class I shares do not have any initial or deferred sales charge. |
The performance data quoted here represents past performance and past performance is not a guarantee of future results. Investment return and principal value will fluctuate so that an investor’s shares, when redeemed, may be worth more or less than their original cost. Current performance may be lower or higher than the performance information quoted. The most recent month end performance may be obtained by calling (888) 558-5851.
| 7 |
EuroPac International Bond Fund
FUND PERFORMANCE at October 31, 2018 (Unaudited) - Continued
Gross and net expense ratios for Class A shares were 1.55% and 1.15%, respectively, and for Class I shares were 1.30% and 0.90%, respectively, which were the amounts stated in the current prospectus dated March 1, 2018, as amended October 12, 2018. For the Fund’s current one-year expense ratios, please refer to the Financial Highlights section of this report. The Fund’s Advisor has contractually agreed to waive its fees and/or pay for operating expenses of the Fund to ensure that total annual fund operating expenses do not exceed 1.15% and 0.90% of the average daily nets assets of Class A and Class I shares of the Fund, respectively. This agreement is in effect until February 28, 2019, and it may be terminated before that date only by the Trust’s Board of Trustees. In the absence of such waivers, the Fund’s returns would have been lower.
Returns reflect the reinvestment of distributions made by the Fund, if any. The graph and the performance table above do not reflect the deduction of taxes that a shareholder would pay on Fund distributions or the redemption of Fund shares. Shares redeemed within 30 days of purchase will be charged a redemption fee of 2.00%.
| 8 |
EuroPac International Dividend Income Fund
FUND PERFORMANCE at October 31, 2018 (Unaudited)
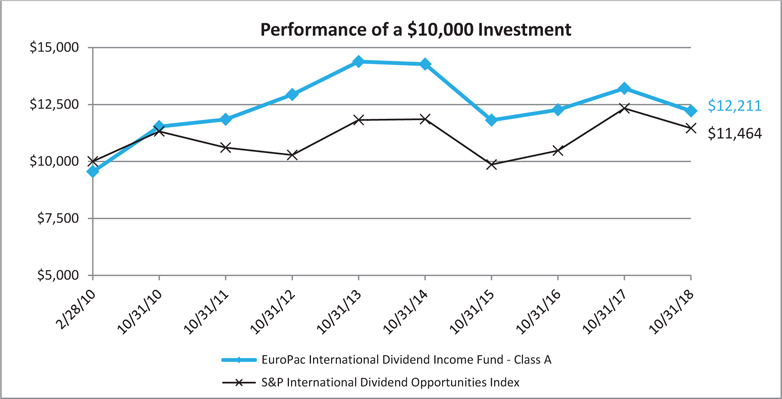
The Fund commenced operations on January 10, 2014, after the conversion of a limited liability company account, Spongebob Ventures II LLC, which commenced operations February 28, 2010 (the “Predecessor Account”), into Class I shares of the Fund. The Fund’s objectives, policies, guidelines and restrictions are, in all material respects, equivalent to those of the Predecessor Account.
This graph compares a hypothetical $10,000 investment in the Fund’s Class A shares, (assumes the maximum sales load charged by the Fund), made at its inception, with a similar investment in the S&P International Dividend Opportunities Index. The performance graph above is shown for the Fund’s Class A shares, Class I shares performance may vary. Results include the reinvestment of all dividends and capital gains.
The S&P International Dividend Opportunities Index serves as a benchmark for global income seeking investors. The index seeks to provide exposure to 100 high yielding common stocks from around the world while meeting diversification, stability and tradability requirements. This index does not reflect expenses, fees or sales charge, which would lower performance. The index is unmanaged and it is not available for investment.
| Average Annual Total Returns as of October 31, 2018 | 1 Year | 5 Years | Since Inception |
Inception Date |
| Before deducting maximum sales charge | ||||
| Class A¹ | -7.54% | -3.22% | 2.87% | 02/28/10 |
| Class I² | -7.17% | -2.97% | 3.14% | 02/28/10 |
| After deducting maximum sales charge | ||||
| Class A¹ | -11.69% | -4.11% | 2.33% | 02/28/10 |
| S&P International Dividend Opportunities Index | -7.03% | -0.61% | 1.59% | 02/28/10 |
| 1 | Maximum sales charge for Class A shares is 4.50%. No deferred sales charge will be imposed on any purchases. |
| 2 | Class A shares impose higher expenses than that of Class I shares. Class I shares do not have any initial or deferred sales charge. |
The performance table above includes the information for the Predecessor Account prior to January 10, 2014.
| 9 |
EuroPac International Dividend Income Fund
FUND PERFORMANCE at October 31, 2018 (Unaudited) - Continued
The performance data quoted here represents past performance and past performance is not a guarantee of future results. Investment return and principal value will fluctuate so that an investor’s shares, when redeemed, may be worth more or less than their original cost. Current performance may be lower or higher than the performance information quoted. The most recent month end performance may be obtained by calling (888) 558-5851.
Gross and net expense ratios for Class A shares were 1.68% and 1.50%, respectively, and for Class I shares were 1.43% and 1.25%, respectively, which were the amounts stated in the current prospectus dated March 1, 2018, as amended October 12, 2018. For the Fund’s current one-year expense ratios, please refer to the Financial Highlights section of this report. The Fund’s Advisor has contractually agreed to waive its fees and/or pay for operating expense of the Fund to ensure that total annual fund operating expenses do not exceed 1.50% and 1.25% of the average daily net assets of Class A and Class I shares of the Fund, respectively. This agreement is in effect until February 28, 2019, and it may be terminated before that date only by the Trust’s Board of Trustees. In the absence of such waivers, the Fund’s returns would have been lower.
Returns reflect the reinvestment of distributions made by the Fund, if any. The graph and the performance table above do not reflect the deduction of taxes that a shareholder would pay on Fund distributions or the redemption of Fund shares. Shares redeemed within 30 days of purchase will be charged a redemption fee of 2.00%.
| 10 |
EP Emerging Markets Small Companies Fund
FUND PERFORMANCE at October 31, 2018 (Unaudited)

This graph compares a hypothetical $10,000 investment in the Fund’s Class A shares (assumes the maximum sales load charged by the Fund), made at its inception, with a similar investment in the Morgan Stanley Capital International (MSCI) Emerging Markets Small Cap Index. The performance graph above is shown for the Fund’s Class A shares, Class I shares performance may vary. Results include the reinvestment of all dividends and capital gains.
The MSCI Emerging Markets Small Cap Index is a free float adjusted market capitalization index that is designed to measure equity market performance of small companies from emerging markets. It offers an exhaustive representation of this size segment by targeting companies that are in the Investable Market Index but not in the Standard Index in the MSCI Emerging Markets Index.
This index does not reflect expenses, fees or sales charge, which would lower performance. The index is unmanaged and it is not available for investment.
| Average Annual Total Returns as of October 31, 2018 | 1 Year | 5 Years | Since Inception |
Inception Date |
| Before deducting maximum sales charge | ||||
| Class A¹ | -17.93% | -0.88% | 2.32% | 12/01/10 |
| Class I² | -17.71% | -0.64% | 2.59% | 07/16/13 |
| After deducting maximum sales charge | ||||
| Class A¹ | -21.61% | -1.79% | 1.73% | 12/01/10 |
| MSCI Emerging Markets Small Cap Index | -17.21% | -0.25% | -0.67% | 12/01/10 |
| 1 | Maximum sales charge for Class A shares is 4.50%. No deferred sales charge will be imposed on any purchases. |
| 2 | The performance figures for Class I shares include the performance of the Class A shares for the periods prior to the inception date of Class I shares. Class A shares impose higher expenses than that of Class I shares. Class I shares do not have any initial or deferred sales charge. |
| 11 |
EP Emerging Markets Small Companies Fund
FUND PERFORMANCE at October 31, 2018 (Unaudited) - Continued
The performance data quoted here represents past performance and past performance is not a guarantee of future results. Investment return and principal value will fluctuate so that an investor’s shares, when redeemed, may be worth more or less than their original cost. Current performance may be lower or higher than the performance information quoted. The most recent month end performance may be obtained by calling (888) 558-5851.
Gross and net expense ratios for Class A shares were 2.18% and 1.75%, respectively, and for Class I shares were 1.93% and 1.50%, respectively, which were the amounts stated in the current prospectus dated March 1, 2018, as amended October 12, 2018. For the Fund’s current one-year expense ratios, please refer to the Financial Highlights section of this report. The Fund’s Advisor has contractually agreed to waive its fees and/or pay for operating expenses of the Fund to ensure that total annual fund operating expenses do not exceed 1.75% and 1.50% of the average daily net assets of Class A and Class I shares of the Fund, respectively. This agreement is in effect until February 28, 2019, and it may be terminated before that date only by the Trust’s Board of Trustees. In the absence of such wavers, the Fund’s returns would have been lower.
Returns reflect the reinvestment of distributions made by the Fund, if any. The graph and the performance table above do not reflect the deduction of taxes that a shareholder would pay on Fund distributions or the redemption of Fund shares. Shares redeemed within 30 days of purchase will be charged a redemption fee of 2.00%.
| 12 |
EuroPac Gold Fund
FUND PERFORMANCE at October 31, 2018 (Unaudited)

This graph compares a hypothetical $10,000 investment in the Fund’s Class A shares (assumes the maximum sales load charged by the Fund), made at its inception, with a similar investment in the Philadelphia Gold & Silver Index. Results include the reinvestment of all dividends and capital gains.
The Philadelphia Gold & Silver Index is designed to track the performance of a set of companies involved in the gold or silver mining industry. This index does not reflect expenses, fees or sales charge, which would lower performance. The index is unmanaged and it is not available for investment.
| Average Annual Total Returns as of October 31, 2018 | 1 Year | 5 Years | Since Inception |
Inception Date |
| Before deducting maximum sales charge | ||||
| Class A¹ | -14.37% | -0.95% | -1.76% | 07/19/13 |
| After deducting maximum sales charge | ||||
| Class A¹ | -18.24% | -1.86% | -2.61% | 07/19/13 |
| Philadelphia Gold & Silver Index | -20.24% | -6.74% | -6.31% | 07/19/13 |
| 1 | Maximum sales charge for Class A shares is 4.50%. No deferred sales charge will be imposed on any purchases. |
The performance data quoted here represents past performance and past performance is not a guarantee of future results. Investment return and principal value will fluctuate so that an investor’s shares, when redeemed, may be worth more or less than their original cost. Current performance may be lower or higher than the performance information quoted. The most recent month end performance may be obtained by calling (888) 558-5851.
Gross and net expense ratios for Class A shares were 1.57% and 1.50%, respectively, which were the amounts stated in the current prospectus dated March 1, 2018, as amended October 12, 2018. For the Fund’s current one-year expense ratios, please refer to the Financial Highlights section of this report. The Fund’s advisor has contractually agreed to waive its fees and/or pay for operating expenses of the Fund to ensure that total annual fund operating expenses do not exceed 1.50% of average daily net assets of the Fund. This agreement is in effect until February 28, 2019, and it may be terminated before that date only by the Trust’s Board of Trustees. In the absence of such waivers, the Fund’s returns would have been lower.
| 13 |
EuroPac Gold Fund
FUND PERFORMANCE at October 31, 2018 (Unaudited) - Continued
Returns reflect the reinvestment of distributions made by the Fund, if any. The graph and the performance table above do not reflect the deduction of taxes that a shareholder would pay on Fund distributions or the redemption of Fund shares. Shares redeemed within 30 days of purchase will be charged a redemption fee of 2.00%.
| 14 |
EuroPac International Value Fund
SCHEDULE OF INVESTMENTS
As of October 31, 2018
| Number of Shares | Value | |||||||
| COMMON STOCKS — 93.9% | ||||||||
| AUSTRALIA — 7.2% | ||||||||
| 120,000 | Newcrest Mining Ltd. | $ | 1,751,434 | |||||
| 995,000 | Telstra Corp. Ltd. | 2,170,243 | ||||||
| 3,921,677 | ||||||||
| BRAZIL — 8.6% | ||||||||
| 450,656 | Ambev S.A. - ADR | 1,951,341 | ||||||
| 939,687 | Cia Energetica de Minas Gerais - ADR | 2,725,092 | ||||||
| 4,676,433 | ||||||||
| CANADA — 16.8% | ||||||||
| 168,800 | Barrick Gold Corp. | 2,118,440 | ||||||
| 162,500 | Goldcorp, Inc. | 1,465,750 | ||||||
| 509,900 | Kinross Gold Corp.* | 1,320,641 | ||||||
| 33,400 | Nutrien Ltd. | 1,767,862 | ||||||
| 1,066,708 | Yamana Gold, Inc. | 2,421,427 | ||||||
| 9,094,120 | ||||||||
| CHINA — 4.9% | ||||||||
| 7,100 | Baidu, Inc. - ADR* | 1,349,426 | ||||||
| 38,000 | Tencent Holdings Ltd. - ADR | 1,304,540 | ||||||
| 2,653,966 | ||||||||
| DENMARK — 3.5% | ||||||||
| 43,750 | Novo Nordisk A/S - ADR | 1,889,125 | ||||||
| GERMANY — 2.8% | ||||||||
| 19,500 | Bayer A.G. | 1,497,010 | ||||||
| HONG KONG — 3.9% | ||||||||
| 223,500 | China Mobile Ltd. | 2,089,078 | ||||||
| NETHERLANDS — 3.4% | ||||||||
| 58,332 | Royal Dutch Shell PLC - A Shares | 1,860,493 | ||||||
| NEW ZEALAND — 0.8% | ||||||||
| 304,920 | SKY Network Television Ltd. | 445,690 | ||||||
| NORWAY — 3.4% | ||||||||
| 69,870 | Equinor A.S.A. | 1,817,658 | ||||||
| SINGAPORE — 3.6% | ||||||||
| 842,700 | Singapore Telecommunications Ltd. | 1,922,417 | ||||||
| SWEDEN — 9.9% | ||||||||
| 353,800 | Betsson A.B. | 3,073,597 | ||||||
| 15 |
EuroPac International Value Fund
SCHEDULE OF INVESTMENTS - Continued
As of October 31, 2018
| Number of Shares | Value | |||||||
| COMMON STOCKS (Continued) | ||||||||
| SWEDEN (Continued) | ||||||||
| 450,000 | NetEnt A.B. | $ | 2,311,172 | |||||
| 5,384,769 | ||||||||
| SWITZERLAND — 5.2% | ||||||||
| 23,480 | Novartis A.G. - ADR | 2,053,561 | ||||||
| 25,500 | Roche Holding A.G. - ADR | 774,180 | ||||||
| 2,827,741 | ||||||||
| UNITED KINGDOM — 12.5% | ||||||||
| 36,314 | British American Tobacco PLC - ADR | 1,576,028 | ||||||
| 49,700 | GlaxoSmithKline PLC - ADR | 1,941,282 | ||||||
| 33,003 | Unilever N.V. | 1,774,901 | ||||||
| 783,470 | Vodafone Group PLC | 1,480,221 | ||||||
| 6,772,432 | ||||||||
| UNITED STATES — 7.4% | ||||||||
| 53,750 | Newmont Mining Corp. | 1,661,950 | ||||||
| 26,645 | Philip Morris International, Inc. | 2,346,625 | ||||||
| 4,008,575 | ||||||||
| TOTAL COMMON STOCKS (Cost $55,767,089) | 50,861,184 | |||||||
| Principal Amount | ||||||||
| SHORT-TERM INVESTMENTS — 5.8% | ||||||||
| $ | 3,121,914 | UMB Money Market Fiduciary, 0.247%1 | 3,121,914 | |||||
| TOTAL SHORT-TERM INVESTMENTS (Cost $3,121,914) | 3,121,914 | |||||||
| TOTAL INVESTMENTS — 99.7% (Cost $58,889,003) | 53,983,098 | |||||||
| Other Assets in Excess of Liabilities — 0.3% | 162,499 | |||||||
| TOTAL NET ASSETS — 100.0% | $ | 54,145,597 | ||||||
ADR – American Depository Receipt
PLC – Public Limited Company
| * | Non-income producing security. |
| 1 | The rate is the annualized seven-day yield at period end. |
See accompanying Notes to Financial Statements.
| 16 |
Europac International Value Fund
SUMMARY OF INVESTMENTS
As of October 31, 2018
| Security Type/Sector | Percent of Total Net Assets |
| Common Stocks | |
| Consumer, Non-cyclical | 29.2% |
| Basic Materials | 23.1% |
| Communications | 19.9% |
| Energy | 6.8% |
| Consumer, Cyclical | 5.7% |
| Utilities | 5.0% |
| Technology | 4.2% |
| Total Common Stocks | 93.9% |
| Short-Term Investments | 5.8% |
| Total Investments | 99.7% |
| Other Assets in Excess of Liabilities | 0.3% |
| Total Net Assets | 100.0% |
See accompanying Notes to Financial Statements.
| 17 |
Europac International Bond Fund
SCHEDULE OF INVESTMENTS
As of October 31, 2018
| Number of Shares | Value | |||||||
| COMMON STOCKS — 0.0% | ||||||||
| UNITED STATES — 0.0% | ||||||||
| 9,835 | Hycroft Mining Corp.*1,2 | $ | — | |||||
| TOTAL COMMON STOCKS (Cost $1,585,230) | — | |||||||
Principal | ||||||||
| FIXED INCOME SECURITIES — 95.4% | ||||||||
| ARGENTINA — 2.5% | ||||||||
| $ | 40,000,000 | Argentine Bonos del Tesoro 18.200%, 10/3/2021 | 941,504 | |||||
| AUSTRALIA — 12.3% | ||||||||
| 1,200,000 | Australia Government Bond 3.250%, 6/21/2039 | 879,961 | ||||||
| 1,000,000 | Coca-Cola Amatil Ltd. 4.625%, 5/21/2021 | 740,902 | ||||||
| 1,000,000 | Newcrest Finance Pty Ltd. 5.750%, 11/15/20413 | 998,408 | ||||||
| Queensland Treasury Corp. | ||||||||
| 1,000,000 | 6.000%, 6/14/2021 | 777,972 | ||||||
| 1,500,000 | 5.750%, 7/22/2024 | 1,237,788 | ||||||
| 4,635,031 | ||||||||
| BRAZIL — 4.4% | ||||||||
| Brazilian Government International Bond | ||||||||
| 4,500,000 | 12.500%, 1/5/2022 | 1,358,404 | ||||||
| 1,000,000 | 10.250%, 1/10/2028 | 297,254 | ||||||
| 1,655,658 | ||||||||
| CANADA — 4.9% | ||||||||
| 2,000,000 | Canadian Government Bond 2.500%, 6/1/2024 | 1,523,145 | ||||||
| 350,000 | Ontario Electricity Financial Corp. 8.900%, 8/18/2022 | 323,225 | ||||||
| 1,846,370 | ||||||||
| CHILE — 4.5% | ||||||||
| Bonos del Banco Central de Chile en Pesos | ||||||||
| 400,000,000 | 6.000%, 2/1/2021 | 608,645 | ||||||
| 700,000,000 | 6.000%, 3/1/2022 | 1,076,795 | ||||||
| 1,685,440 | ||||||||
| 18 |
EuroPac International Bond Fund
SCHEDULE OF INVESTMENTS - Continued
As of October 31, 2018
| Principal Amount | Value | |||||||
| FIXED INCOME SECURITIES (Continued) | ||||||||
| COLOMBIA — 1.2% | ||||||||
| $ | 1,150,000,000 | Colombia Government International Bond 9.850%, 6/28/2027 | $ | 441,618 | ||||
| GERMANY — 4.7% | ||||||||
| 14,500,000 | Kreditanstalt fuer Wiederaufbau 5.000%, 5/22/2019 | 1,757,254 | ||||||
| LUXEMBOURG — 1.1% | ||||||||
| 6,000,000,000 | European Investment Bank 7.200%, 7/9/2019 | 391,278 | ||||||
| MALAYSIA — 6.4% | ||||||||
| 10,000,000 | Malaysia Government Bond 4.160%, 7/15/2021 | 2,420,743 | ||||||
| MEXICO — 8.3% | ||||||||
| 25,000,000 | America Movil S.A.B. de C.V. 6.000%, 6/9/2019 | 1,213,060 | ||||||
| 40,500,000 | Mexican Bonos 5.000%, 12/11/2019 | 1,920,417 | ||||||
| 3,133,477 | ||||||||
| NEW ZEALAND — 10.5% | ||||||||
| 2,000,000 | Fonterra Co-operative Group Ltd. 5.520%, 2/25/2020 | 1,352,953 | ||||||
| 1,000,000 | New Zealand Government Bond 3.500%, 4/14/2033 | 713,811 | ||||||
| 2,100,000 | New Zealand Government Inflation Linked Bond 3.000%, 9/20/2030 | 1,721,431 | ||||||
| 240,000 | New Zealand Local Government Funding Agency Bond 4.500%, 4/15/2027 | 171,114 | ||||||
| 3,959,309 | ||||||||
| PERU — 5.6% | ||||||||
| 6,500,000 | Peruvian Government International Bond 7.840%, 8/12/2020 | 2,110,500 | ||||||
| PHILIPPINES — 5.8% | ||||||||
| 75,000,000 | Asian Development Bank 6.200%, 10/6/2026 | 929,221 | ||||||
| 67,000,000 | Philippine Government International Bond 4.950%, 1/15/2021 | 1,237,909 | ||||||
| 2,167,130 | ||||||||
| 19 |
EuroPac International Bond Fund
SCHEDULE OF INVESTMENTS - Continued
As of October 31, 2018
| Principal Amount | Value | |||||||
| FIXED INCOME SECURITIES (Continued) | ||||||||
| POLAND — 2.1% | ||||||||
| $ | 3,000,000 | Republic of Poland Government Bond 2.500%, 1/25/2023 | $ | 786,120 | ||||
| SINGAPORE — 5.7% | ||||||||
| 1,000,000 | Keppel Corp. Ltd. 3.800%, 4/23/20274,5 | 726,134 | ||||||
| 2,000,000 | Singapore Government Bond 1.750%, 4/1/2022 | 1,423,332 | ||||||
| 2,149,466 | ||||||||
| SWEDEN — 1.0% | ||||||||
| 3,500,000 | Telia Co. A.B. 3.250%, 10/4/20774,6 | 387,935 | ||||||
| UNITED KINGDOM — 4.8% | ||||||||
| 28,000,000,000 | European Bank for Reconstruction & Development 7.375%, 4/15/2019 | 1,819,765 | ||||||
| UNITED STATES — 9.6% | ||||||||
| 16,400,000,000 | Inter-American Development Bank 7.875%, 3/14/2023 | 1,054,319 | ||||||
| International Finance Corp. | ||||||||
| 54,000,000 | 8.250%, 6/10/2021 | 741,833 | ||||||
| 56,000,000 | 5.850%, 11/25/2022 | 713,302 | ||||||
| 1,000,000 | Newmont Mining Corp. 6.250%, 10/1/2039 | 1,103,208 | ||||||
| 3,612,662 | ||||||||
| TOTAL FIXED INCOME SECURITIES (Cost $42,796,468) | 35,901,260 | |||||||
| SHORT-TERM INVESTMENTS — 2.8% | ||||||||
| 1,056,031 | UMB Money Market Fiduciary, 0.247%7 | 1,056,031 | ||||||
| Total Short-Term Investments (Cost $1,056,031) | 1,056,031 | |||||||
| TOTAL INVESTMENTS — 98.2% (Cost $45,437,729) | 36,957,291 | |||||||
| Other Assets in Excess of Liabilities — 1.8% | 668,655 | |||||||
| TOTAL NET ASSETS — 100.0% | $ | 37,625,946 | ||||||
| 20 |
EuroPac International Bond Fund
SCHEDULE OF INVESTMENTS - Continued
As of October 31, 2018
| * | Non-income producing security. |
| 1 | Illiquid security. The total illiquid securities represent 0% of Net Assets. The total value of these securities is $0. |
| 2 | Level 3 securities fair valued under procedures established by the Board of Trustees, represents 0.00% of Net Assets. The total value of these securities is $0. |
| 3 | Security exempt from registration under Rule 144A of the Securities Act of 1933. These securities are restricted and may be resold in transactions exempt from registration normally to qualified institutional buyers. The total value of these securities is $998,408, which represents 2.65% of Net Assets. |
| 4 | Callable. |
| 5 | Step rate security. |
| 6 | Variable rate security. |
| 7 | The rate is the annualized seven-day yield at period end. |
See accompanying Notes to Financial Statements.
| 21 |
EuroPac International Bond Fund
SUMMARY OF INVESTMENTS
As of October 31, 2018
| Security Type/Sector | Percent of Total Net Assets |
| Common Stocks | |
| Basic Materials | 0.0% |
| Total Common Stocks | 0.0% |
| Fixed Income Securities | |
| Government | 68.1% |
| Financial | 9.1% |
| Basic Materials | 5.6% |
| Consumer, Non-cyclical | 5.6% |
| Communications | 4.2% |
| Diversified | 1.9% |
| Utilities | 0.9% |
| Total Fixed Income Securities | 95.4 |
| Short-Term Investments | 2.8% |
| Total Investments | 98.2% |
| Other Assets in Excess of Liabilities | 1.8% |
| Total Net Assets | 100.0% |
See accompanying Notes to Financial Statements.
| 22 |
EuroPac International Dividend Income Fund
SCHEDULE OF INVESTMENTS
As of October 31, 2018
| Number of Shares | Value | |||||||
| Common Stocks – 97.4% | ||||||||
| Australia – 4.2% | ||||||||
| 1,025,000 | Telstra Corp. Ltd. | $ | 2,235,677 | |||||
| Brazil – 7.8% | ||||||||
| 350,651 | Ambev S.A. - ADR | 1,518,319 | ||||||
| 927,894 | Cia Energetica de Minas Gerais - ADR | 2,690,892 | ||||||
| 4,209,211 | ||||||||
| Canada – 10.4% | ||||||||
| 151,000 | Barrick Gold Corp. | 1,895,050 | ||||||
| 43,650 | BCE, Inc. | 1,689,303 | ||||||
| 91,047 | Freehold Royalties Ltd. | 668,762 | ||||||
| 150,000 | Goldcorp, Inc. | 1,353,000 | ||||||
| 5,606,115 | ||||||||
| Denmark – 3.4% | ||||||||
| 42,600 | Novo Nordisk A/S - ADR | 1,839,468 | ||||||
| France – 9.0% | ||||||||
| 22,700 | Danone S.A. | 1,608,977 | ||||||
| 130,000 | Engie S.A. | 1,733,775 | ||||||
| 25,650 | TOTAL S.A. - ADR | 1,503,090 | ||||||
| 4,845,842 | ||||||||
| Germany – 2.5% | ||||||||
| 17,870 | Bayer A.G. | 1,371,875 | ||||||
| Hong Kong – 3.9% | ||||||||
| 227,000 | China Mobile Ltd. | 2,121,793 | ||||||
| Netherlands – 3.4% | ||||||||
| 29,380 | Royal Dutch Shell PLC - Class A - ADR | 1,856,522 | ||||||
| New Zealand – 6.6% | ||||||||
| 1,849,000 | Kiwi Property Group Ltd. | 1,586,581 | ||||||
| 424,922 | SKY Network Television Ltd. | 621,093 | ||||||
| 517,000 | Spark New Zealand Ltd. | 1,332,561 | ||||||
| 3,540,235 | ||||||||
| Norway – 6.4% | ||||||||
| 58,950 | Equinor A.S.A. - ADR | 1,515,015 | ||||||
| 104,900 | Telenor A.S.A. | 1,924,457 | ||||||
| 3,439,472 | ||||||||
| Singapore – 4.9% | ||||||||
| 570,000 | Singapore Telecommunications Ltd. | 1,300,318 | ||||||
| 2,709,861 | Starhill Global REIT - REIT | 1,310,718 | ||||||
| 2,611,036 | ||||||||
| Sweden – 9.5% | ||||||||
| 316,000 | Betsson A.B. | 2,745,214 | ||||||
| 23 |
EuroPac International Dividend Income Fund
SCHEDULE OF INVESTMENTS - Continued
As of October 31, 2018
| Number of Shares | Value | |||||||
| COMMON STOCKS (Continued) | ||||||||
| Sweden (Continued) | ||||||||
| 460,000 | NetEnt A.B. | $ | 2,362,532 | |||||
| 5,107,746 | ||||||||
| Switzerland – 7.0% | ||||||||
| 24,296 | Novartis A.G. - ADR | 2,124,928 | ||||||
| 53,331 | Roche Holding A.G. - ADR | 1,619,129 | ||||||
| 3,744,057 | ||||||||
| United Kingdom – 11.5% | ||||||||
| 36,100 | British American Tobacco PLC - ADR | 1,566,740 | ||||||
| 41,240 | GlaxoSmithKline PLC - ADR | 1,610,835 | ||||||
| 35,450 | Unilever N.V. | 1,906,501 | ||||||
| 584,109 | Vodafone Group PLC | 1,103,566 | ||||||
| 6,187,642 | ||||||||
| United States – 6.9% | ||||||||
| 51,950 | Newmont Mining Corp. | 1,606,294 | ||||||
| 23,700 | Philip Morris International, Inc. | 2,087,259 | ||||||
| 3,693,553 | ||||||||
| Total Common Stocks (Cost $57,930,069) | 52,410,244 | |||||||
| Principal Amount | ||||||||
| Short-Term Investments – 2.1% | ||||||||
| $ | 1,146,896 | UMB Money Market Fiduciary, 0.247%1 | 1,146,896 | |||||
| Total Short-Term Investments (Cost $1,146,896) | 1,146,896 | |||||||
| Total Investments – 99.5% (Cost $59,076,965) | 53,557,140 | |||||||
| Other Assets in Excess of Liabilities – 0.5% | 290,355 | |||||||
| Total Net Assets – 100.0% | $ | 53,847,495 | ||||||
ADR – American Depositary Receipt
PLC – Public Limited Company
REIT – Real Estate Investment Trust
| 1 | The rate is the annualized seven-day yield at period end. |
See accompanying Notes to Financial Statements.
| 24 |
EuroPac International Dividend Income Fund
SUMMARY OF INVESTMENTS
As of October 31, 2018
| Security Type/Sector | Percent of Total Net Assets |
| Common Stocks | |
| Consumer, Non-cyclical | 32.1% |
| Communications | 22.9% |
| Energy | 10.3% |
| Basic Materials | 9.0% |
| Utilities | 8.2% |
| Financial | 5.4% |
| Consumer, Cyclical | 5.1% |
| Technology | 4.4% |
| Total Common Stocks | 97.4% |
| Short-Term Investments | 2.1% |
| Total Investments | 99.5% |
| Other Assets in Excess of Liabilities | 0.5% |
| Total Net Assets | 100.0% |
See accompanying Notes to Financial Statements.
| 25 |
EP Emerging Markets Small Companies Fund
SCHEDULE OF INVESTMENTS
As of October 31, 2018
| Number of Shares | Value | |||||||
| COMMON STOCKS — 99.6% | ||||||||
| ARGENTINA — 1.2% | ||||||||
| 41,400 | Despegar.com Corp.* | $ | 665,298 | |||||
| BRAZIL — 1.3% | ||||||||
| 173,100 | Instituto Hermes Pardini S.A. | 708,401 | ||||||
| CHINA — 19.4% | ||||||||
| 2,032,300 | AK Medical Holdings Ltd.1 | 1,234,618 | ||||||
| 2,700,000 | China Forestry Holdings Co., Ltd.*2,3 | — | ||||||
| 1,311,655 | China Maple Leaf Educational Systems Ltd. | 569,254 | ||||||
| 1,181,660 | Crystal International Group Ltd.1 | 646,869 | ||||||
| 492,925 | Haitian International Holdings Ltd. | 968,068 | ||||||
| 81,500 | LexinFintech Holdings Ltd. - ADR* | 797,070 | ||||||
| 3,903,515 | Lifetech Scientific Corp.* | 847,504 | ||||||
| 846,010 | Nexteer Automotive Group Ltd. | 1,192,937 | ||||||
| 13,700 | Noah Holdings Ltd. - ADR* | 516,627 | ||||||
| 906,430 | Precision Tsugami China Corp. Ltd.2 | 828,698 | ||||||
| 584,500 | Vitasoy International Holdings Ltd. | 1,863,319 | ||||||
| 1,018,115 | Xiabuxiabu Catering Management China Holdings Co., Ltd.1 | 1,278,317 | ||||||
| 10,743,281 | ||||||||
| INDIA — 15.2% | ||||||||
| 40,200 | AIA Engineering Ltd. | 931,954 | ||||||
| 164,935 | Caplin Point Laboratories Ltd.2 | 937,379 | ||||||
| 36,800 | Care Ratings Ltd. | 535,166 | ||||||
| 481,910 | City Union Bank Ltd. | 1,109,376 | ||||||
| 62,544 | Eris Lifesciences Ltd.*1 | 575,537 | ||||||
| 426,300 | Jyothy Laboratories Ltd. | 1,093,042 | ||||||
| 330,000 | Sterlite Technologies Ltd. | 1,704,494 | ||||||
| 195,748 | Syngene International Ltd. 1,2 | 1,529,974 | ||||||
| 8,416,922 | ||||||||
| LUXEMBOURG — 1.5% | ||||||||
| 450,000 | L'Occitane International S.A. | 843,535 | ||||||
| MALAYSIA — 1.7% | ||||||||
| 530,100 | ViTrox Corp. Bhd | 927,425 | ||||||
| MEXICO — 9.4% | ||||||||
| 753,100 | Banco del Bajio S.A.1 | 1,480,374 | ||||||
| 443,800 | Bolsa Mexicana de Valores S.A.B. de C.V. | 668,760 | ||||||
| 106,500 | Gruma S.A.B. de C.V. - Class B | 1,111,488 | ||||||
| 420,400 | Qualitas Controladora S.A.B. de C.V. | 847,079 | ||||||
| 26 |
EP Emerging Markets Small Companies Fund
SCHEDULE OF INVESTMENTS - Continued
As of October 31, 2018
| Number of Shares | Value | |||||||
| COMMON STOCKS (Continued) | ||||||||
| MEXICO (Continued) | ||||||||
| 225,000 | Regional S.A.B. de C.V. | $ | 1,095,797 | |||||
| 5,203,498 | ||||||||
| PHILIPPINES — 3.5% | ||||||||
| 5,971,695 | D&L Industries, Inc.2 | 1,272,355 | ||||||
| 266,700 | Universal Robina Corp. | 648,751 | ||||||
| 1,921,106 | ||||||||
| ROMANIA — 1.6% | ||||||||
| 1,601,171 | Banca Transilvania S.A. | 902,156 | ||||||
| SOUTH AFRICA — 6.1% | ||||||||
| 130,000 | AVI Ltd. | 881,207 | ||||||
| 148,000 | Clicks Group Ltd. | 1,886,053 | ||||||
| 303,900 | Dis-Chem Pharmacies Ltd.1 | 595,543 | ||||||
| 3,362,803 | ||||||||
| SOUTH KOREA — 7.4% | ||||||||
| 8,825 | Kakao Corp. | 713,361 | ||||||
| 23,900 | Koh Young Technology, Inc. | 1,893,783 | ||||||
| 19,470 | LEENO Industrial, Inc. | 1,023,433 | ||||||
| 26,880 | Seegene, Inc.* | 435,382 | ||||||
| 4,065,959 | ||||||||
| SPAIN — 2.1% | ||||||||
| 110,220 | AmRest Holdings S.E.* | 1,138,309 | ||||||
| SWEDEN — 2.0% | ||||||||
| 75,000 | Vitrolife A.B. | 1,110,908 | ||||||
| TAIWAN — 15.7% | ||||||||
| 54,600 | ASPEED Technology, Inc. | 804,575 | ||||||
| 401,700 | Chroma ATE, Inc. | 1,415,111 | ||||||
| 133,739 | Cub Elecparts, Inc. | 809,348 | ||||||
| 111,475 | eMemory Technology, Inc. | 827,165 | ||||||
| 209,870 | Gourmet Master Co., Ltd. | 1,272,894 | ||||||
| 105,105 | Hiwin Technologies Corp. | 682,143 | ||||||
| 95,100 | Parade Technologies Ltd. | 1,265,734 | ||||||
| 99,100 | Voltronic Power Technology Corp. | 1,604,083 | ||||||
| 8,681,053 | ||||||||
| THAILAND — 6.0% | ||||||||
| 927,200 | Mega Lifesciences PCL | 1,053,554 | ||||||
| 2,000,000 | Taokaenoi Food & Marketing PCL | 781,737 | ||||||
| 27 |
EP Emerging Markets Small Companies Fund
SCHEDULE OF INVESTMENTS - Continued
As of October 31, 2018
| Number of Shares | Value | |||||||
| COMMON STOCKS (Continued) | ||||||||
| THAILAND (Continued) | ||||||||
| 1,447,590 | TOA Paint Thailand PCL | $ | 1,476,974 | |||||
| 3,312,265 | ||||||||
| URUGUAY — 1.6% | ||||||||
| 354,945 | Biotoscana Investments S.A.* | 914,664 | ||||||
| VIETNAM — 3.9% | ||||||||
| 441,974 | Mobile World Investment Corp. | 2,139,455 | ||||||
| TOTAL COMMON STOCKS (Cost $56,073,008) | 55,057,038 | |||||||
Principal | ||||||||
| SHORT-TERM INVESTMENTS — 0.6% | ||||||||
| $ | 342,747 | UMB Money Market Fiduciary, 0.247%4 | 342,747 | |||||
| Total Short-Term Investments (Cost $342,747) | 342,747 | |||||||
| TOTAL INVESTMENTS — 100.2% (Cost $56,415,755) | 55,399,785 | |||||||
| Liabilities in Excess of Other Assets — (0.2)% | (124,167 | ) | ||||||
| TOTAL NET ASSETS — 100.0% | $ | 55,275,618 | ||||||
ADR – American Depository Receipt
PCL – Public Company Limited
| * | Non-income producing security. |
| 1 | Security exempt from registration under Rule 144A of the Securities Act of 1933. These securities are restricted and may be resold in transactions exempt from registration normally to qualified institutional buyers. The total value of these securities is $7,341,232, which represents 13.28% of Net Assets. |
| 2 | Illiquid security. The total illiquid securities represent 1.61% of Net Assets. The total value of these securities is $890,220. |
| 3 | Level 3 securities fair valued under procedures established by the Board of Trustees, represents 0.00% of Net Assets. The total value of these securities is $0. |
| 4 | The rate is the annualized seven-day yield at period end. |
See accompanying Notes to Financial Statements.
| 28 |
EP Emerging Markets Small Companies Fund
SUMMARY OF INVESTMENTS
As of October 31, 2018
| Security Type/Sector | Percent of Total Net Assets |
| Common Stocks | |
| Consumer, Non-cyclical | 32.7% |
| Consumer, Cyclical | 19.8% |
| Industrial | 18.6% |
| Financial | 13.4% |
| Communications | 5.6% |
| Technology | 5.2% |
| Basic Materials | 2.7% |
| Diversified | 1.6% |
| Total Common Stocks | 99.6% |
| Short-Term Investments | 0.6% |
| Total Investments | 100.2% |
| Liabilities in Excess of Other Assets | (0.2)% |
| Total Net Assets | 100.0% |
See accompanying Notes to Financial Statements.
| 29 |
EuroPac Gold Fund
SCHEDULE OF INVESTMENTS
As of October 31, 2018
| Number of Shares | Value | |||||||
| Common Stocks – 99.2% | ||||||||
| Gold Mining – 37.2% | ||||||||
| 98,240 | Agnico Eagle Mines Ltd. | $ | 3,473,766 | |||||
| 250,208 | Asanko Gold, Inc.*1 | 189,883 | ||||||
| 450,000 | Atlantic Gold Corp.*1 | 550,323 | ||||||
| 150,000 | B2Gold Corp.*1 | 370,300 | ||||||
| 1,308,600 | B2Gold Corp.* | 3,219,156 | ||||||
| 1,000,000 | GoGold Resources, Inc.*1 | 178,504 | ||||||
| 1,269,000 | Gold Fields Ltd. - ADR | 3,375,540 | ||||||
| 139,980 | Goldcorp, Inc. | 1,262,620 | ||||||
| 270,000 | Guyana Goldfields, Inc.*1 | 363,008 | ||||||
| 350,250 | Kinross Gold Corp.* | 907,147 | ||||||
| 19,600 | Leagold Mining Corp.*1 | 21,736 | ||||||
| 30,000 | Newmont Mining Corp. | 927,600 | ||||||
| 740,000 | OceanaGold Corp.1 | 2,130,346 | ||||||
| 700,000 | Premier Gold Mines Ltd.* | 914,546 | ||||||
| 320,000 | Pretium Resources, Inc.* | 2,550,400 | ||||||
| 40,000 | Pretium Resources, Inc.*1 | 320,851 | ||||||
| 47,600 | Randgold Resources Ltd. - ADR | 3,738,504 | ||||||
| 550,000 | Resolute Mining Ltd.1 | 405,070 | ||||||
| 24,899,300 | ||||||||
| Royalty Companies – 24.6% | ||||||||
| 80,096 | Franco-Nevada Corp.1 | 5,000,393 | ||||||
| 5,035,000 | Metalla Royalty & Streaming Ltd.1,5 | 2,753,665 | ||||||
| 123,900 | Osisko Gold Royalties Ltd. | 947,835 | ||||||
| 323,120 | Osisko Gold Royalties Ltd.1 | 2,474,022 | ||||||
| 56,200 | Royal Gold, Inc. | 4,306,606 | ||||||
| 35,000 | Wheaton Precious Metals Corp. | 575,050 | ||||||
| 25,000 | Wheaton Precious Metals Corp.1 | 410,938 | ||||||
| 16,468,509 | ||||||||
| Precious Metals Developmental – 8.6% | ||||||||
| 3,832,803 | Almaden Minerals Ltd. - Class B* | 1,993,441 | ||||||
| 1,098,017 | Almaden Minerals Ltd. - Class B*1 | 558,809 | ||||||
| 215,500 | Almaden Minerals Ltd. - Class B*1,2,3 | 109,673 | ||||||
| 300,000 | Equinox Gold Corp.* | 230,155 | ||||||
| 5,118,424 | Vista Gold Corp.*5 | 2,816,669 | ||||||
| 8,200 | Vista Gold Corp.*1,5 | 4,360 | ||||||
| 5,713,107 | ||||||||
| Precious Metals Exploration – 20.7% | ||||||||
| 1,611,182 | Almadex Minerals Ltd.*1 | 373,271 | ||||||
| 6,680,000 | Altus Strategies PLC*1,2,3 | 279,073 | ||||||
| 1,711,182 | Azucar Minerals Ltd.*1 | 688,892 | ||||||
| 3,351,151 | Evrim Resources Corp.*1 | 3,309,150 | ||||||
| 750,000 | Evrim Resources Corp.*1,2,3 | 740,600 | ||||||
| 924,100 | Irving Resources, Inc.*1 | 926,557 | ||||||
| 30 |
EuroPac Gold Fund
SCHEDULE OF INVESTMENTS - Continued
As of October 31, 2018
| Number of Shares | Value | |||||||
| Common Stocks (Continued) | ||||||||
| Precious Metals Exploration (Continued) | ||||||||
| 600,000 | Irving Resources, Inc.*1,2,3 | $ | 601,595 | |||||
| 8,880,000 | Medgold Resources Corp.*1,5 | 1,618,838 | ||||||
| 736,000 | Medgold Resources Corp.*1,2,3,5 | 134,174 | ||||||
| 5,173,900 | Midland Exploration, Inc.*1,5 | 4,165,844 | ||||||
| 890,000 | Millrock Resources, Inc.*1 | 81,124 | ||||||
| 219,030 | Millrock Resources, Inc.*1,2,3 | 19,965 | ||||||
| 909,685 | Mirasol Resources Ltd.*1 | 711,717 | ||||||
| 5,016,400 | Revelo Resources Corp.*1 | 76,208 | ||||||
| 525,865 | Skeena Resources Ltd.*1,2,3 | 143,799 | ||||||
| 13,870,807 | ||||||||
| Silver: Exploration and Mining – 6.0% | ||||||||
| 903,344 | Fortuna Silver Mines, Inc.* | 3,423,674 | ||||||
| 15,000 | MAG Silver Corp.* | 107,250 | ||||||
| 10,000 | MAG Silver Corp.*1 | 71,857 | ||||||
| 26,500 | Pan American Silver Corp. | 389,020 | ||||||
| 3,991,801 | ||||||||
| Diversified Exploration and Mining – 2.1% | ||||||||
| 307,000 | Nevsun Resources Ltd.1 | 1,364,186 | ||||||
| 20,000 | Solaris Copper, Inc.*1,2,3 | 8,659 | ||||||
| 1,372,845 | ||||||||
| TOTAL COMMON STOCKS (Cost $63,930,448) | 66,316,369 | |||||||
| Warrants – 0.8% | ||||||||
| Silver: Exploration and Mining – 0.0% | ||||||||
| 325,000 | Golden Arrow Resources Corp., Expiration Date: January 28, 2019*1,2,3 | — | ||||||
| Precious Metals Developmental – 0.0% | ||||||||
| 68,008 | Almaden Minerals Ltd., Expiration Date: June 1, 2020*1,2,3 | — | ||||||
| 107,750 | Almaden Minerals Ltd., Expiration Date: June 7, 2022*1,2,3 | — | ||||||
| — | ||||||||
| Precious Metals Exploration – 0.8% | ||||||||
| 6,680,000 | Altus Strategies PLC, Expiration Date: April 18, 2023*1,2,3 | — | ||||||
| 100,739 | Callinex Mines, Inc., Expiration Date: November 22, 2019*1,2,3 | — | ||||||
| 925,575 | Evrim Resources Corp., Expiration Date: May 19, 2020*1,2,3 | 555,415 | ||||||
| 1,227,900 | Revelo Resources Corp., Expiration Date: April 17, 2019*1,2,3 | — | ||||||
| 736,000 | Medgold Resources Corp., Expiration Date: October 16, 2020*1,2,3 | — | ||||||
| 219,030 | Millrock Resources, Inc., Expiration Date: December 15, 2020*1,2,3 | — | ||||||
| 1,080,000 | Millrock Resources, Inc., Expiration Date: May 25, 2019*1,2,3 | — | ||||||
| 4,970,000 | Miranda Gold Corp., Expiration Date: June 23, 2021*1,2,3 | — | ||||||
| 312,500 | Skeena Resources, Inc., Expiration Date: July 8, 2019*1,2,3 | — | ||||||
| 500,000 | Thunderstruck Resources Ltd., Expiration Date: November 29, 2019*1,2,3 | — | ||||||
| 555,415 | ||||||||
| TOTAL WARRANTS (Cost $—) | 555,415 | |||||||
| 31 |
EuroPac Gold Fund
SCHEDULE OF INVESTMENTS - Continued
As of October 31, 2018
| Number of Shares | Value | |||||||
| Short-Term Investments – 0.1% | ||||||||
| $ | 100,288 | UMB Money Market Fiduciary, 0.247%4 | $ | 100,288 | ||||
| TOTAL SHORT-TERM INVESTMENTS (Cost $100,288) | 100,288 | |||||||
| Total Investments – 100.1% (Cost $64,030,736) | 66,972,072 | |||||||
| Liabilities in Excess of Other Assets – (0.1)% | (85,896 | ) | ||||||
| Total Net Assets – 100.0% | $ | 66,886,176 | ||||||
ADR – American Depositary Receipt
PLC – Public Limited Company
| * | Non-income producing security. |
| 1 | Foreign security denominated in U.S. dollars. |
| 2 | Illiquid Security. Security exempt from registration under Rule 144A of the Securities Act of 1933, as amended, or otherwise restricted. These securities may be resold in transactions exempt from registration, normally to qualified institutional buyers. Security fair valued under direction of the Fund’s advisor, subject to review and approval by the Valuation Committee, subsequently reviewed by Board of Trustees. The aggregate value of such investments is 3.88% of net assets. The total value of these securities is $2,592,953. |
| 3 | Level 3 securities fair valued under procedures established by the Board of Trustees, represents 3.88% of Net Assets. The total value of these securities is $2,592,953. |
| 4 | The rate is the annualized seven-day yield at period end. |
| 5 | Affiliated company. |
See accompanying Notes to Financial Statements.
| 32 |
EuroPac Gold Fund
SUMMARY OF INVESTMENTS
As of October 31, 2018
| Security Type/Sector | Percent of Total Net Assets |
| Common Stocks | |
| Gold Mining | 37.2% |
| Royalty Companies | 24.6% |
| Precious Metals Exploration | 20.7% |
| Precious Metals Developmental | 8.6% |
| Silver: Exploration and Mining | 6.0% |
| Diversified Exploration and Mining | 2.1% |
| Total Common Stocks | 99.2% |
| Warrants | 0.8% |
| Short-Term Investments | 0.1% |
| Total Investments | 100.1% |
| Liabilities in Excess of Other Assets | (0.1)% |
| Total Net Assets | 100.0% |
See accompanying Notes to Financial Statements.
| 33 |
STATEMENTS OF ASSETS AND LIABILITIES
As of October 31, 2018
| EuroPac International Value Fund | EuroPac International Bond Fund | EuroPac International Dividend Income Fund | ||||||||||
| Assets: | ||||||||||||
| Investments in unaffiliated issuers, at cost | $ | 58,889,003 | $ | 45,437,729 | $ | 59,076,965 | ||||||
| Investments in affiliated issuers, at cost | - | - | - | |||||||||
| Foreign currency, at cost | - | 164,832 | 51,124 | |||||||||
| Investments in unaffiliated issuers, at value | $ | 53,983,098 | $ | 36,957,291 | $ | 53,557,140 | ||||||
| Investments in affiliated issuers, at value | - | - | - | |||||||||
| Foreign currency, at value | - | 164,499 | 51,729 | |||||||||
| Cash | - | - | - | |||||||||
| Segregated cash at Broker | - | - | - | |||||||||
| Receivables: | ||||||||||||
| Fund shares sold | - | 2,500 | 30,015 | |||||||||
| Dividends and interest | 309,894 | 593,451 | 352,016 | |||||||||
| Prepaid expenses | 9,377 | 17,819 | 17,745 | |||||||||
| Total assets | 54,302,369 | 37,735,560 | 54,008,645 | |||||||||
| Liabilities: | ||||||||||||
| Payables: | ||||||||||||
| Investment securities purchased | - | - | - | |||||||||
| Fund shares redeemed | 30,560 | 31,569 | 52,704 | |||||||||
| Advisory fees | 47,776 | 10,682 | 34,232 | |||||||||
| Distribution fees (Note 8) | 10,484 | 7,427 | 11,221 | |||||||||
| Shareholder servicing fees (Note 7) | 5,128 | 3,424 | 3,467 | |||||||||
| Auditing fees | 15,534 | 15,536 | 15,511 | |||||||||
| Transfer agent fees and expenses | 12,889 | 9,609 | 10,541 | |||||||||
| Fund administration fees | 10,947 | 9,237 | 9,577 | |||||||||
| Custody fees | 5,481 | 4,335 | 4,959 | |||||||||
| Fund accounting fees | 5,444 | 4,875 | 5,479 | |||||||||
| Trustees' deferred compensation (Note 3) | 1,467 | 1,448 | 1,468 | |||||||||
| Chief Compliance Officer fees | 900 | 776 | 500 | |||||||||
| Trustees' fees and expenses | 357 | 980 | 625 | |||||||||
| Accrued other expenses | 9,805 | 9,716 | 10,866 | |||||||||
| Total liabilities | 156,772 | 109,614 | 161,150 | |||||||||
| Net Assets | $ | 54,145,597 | $ | 37,625,946 | $ | 53,847,495 | ||||||
| Components of Net Assets: | ||||||||||||
| Paid-in Capital (par value of $0.01 per share with an unlimited number of shares authorized) | $ | 79,179,928 | $ | 47,591,069 | $ | 72,344,861 | ||||||
| Total distributable earnings (loss) | (25,034,331 | ) | (9,965,123 | ) | (18,497,366 | ) | ||||||
| Net Assets | $ | 54,145,597 | $ | 37,625,946 | $ | 53,847,495 | ||||||
| Maximum Offering Price per Share: | ||||||||||||
| Class A Shares: | ||||||||||||
| Net assets applicable to shares outstanding | $ | 53,780,710 | $ | 37,253,691 | $ | 53,160,975 | ||||||
| Shares of beneficial interest issued and outstanding | 7,939,787 | 4,591,249 | 7,117,080 | |||||||||
| Redemption price per share | $ | 6.77 | $ | 8.11 | $ | 7.47 | ||||||
| Maximum sales charge (4.50% of offering price)* | 0.32 | 0.38 | 0.35 | |||||||||
| Maximum offering price to public | $ | 7.09 | $ | 8.49 | $ | 7.82 | ||||||
| Class I Shares: | ||||||||||||
| Net assets applicable to shares outstanding | $ | 364,887 | $ | 372,255 | $ | 686,520 | ||||||
| Shares of beneficial interest issued and outstanding | 53,800 | 45,444 | 91,826 | |||||||||
| Offering and redemption price per share | $ | 6.78 | $ | 8.19 | $ | 7.48 | ||||||
| * | On sales of $50,000 or more, the sales charge will be reduced. |
See accompanying Notes to Financial Statements.
| 34 |
STATEMENTS OF ASSETS AND LIABILITIES
As of October 31, 2018
| EP Emerging Markets Small Companies Fund | EuroPac Gold Fund | |||||||
| Assets: | ||||||||
| Investments in unaffiliated issuers, at cost | $ | 56,415,755 | $ | 55,135,477 | ||||
| Investments in affiliated issuers, at cost | - | 8,895,259 | ||||||
| Foreign currency, at cost | - | 20,865 | ||||||
| Investments in unaffiliated issuers, at value | $ | 55,399,785 | $ | 55,478,522 | ||||
| Investments in affiliated issuers, at value | - | 11,493,550 | ||||||
| Foreign currency, at value | - | 20,739 | ||||||
| Cash | - | 8,160 | ||||||
| Segregated cash at Broker | - | 2,098 | ||||||
| Receivables: | ||||||||
| Fund shares sold | 2,500 | 126,377 | ||||||
| Dividends and interest | 9,160 | 5,845 | ||||||
| Prepaid expenses | 21,645 | 7,762 | ||||||
| Total assets | 55,433,090 | 67,143,053 | ||||||
| Liabilities: | ||||||||
| Payables: | ||||||||
| Investment securities purchased | - | 16,641 | ||||||
| Fund shares redeemed | 16,165 | 106,585 | ||||||
| Advisory fees | 39,684 | 45,798 | ||||||
| Distribution fees (Note 8) | 11,354 | 14,595 | ||||||
| Shareholder servicing fees (Note 7) | 5,922 | 8,246 | ||||||
| Auditing fees | 15,478 | 15,494 | ||||||
| Transfer agent fees and expenses | 13,252 | 11,912 | ||||||
| Fund administration fees | 13,376 | 11,333 | ||||||
| Custody fees | 20,615 | 4,269 | ||||||
| Fund accounting fees | 7,432 | 5,010 | ||||||
| Trustees' deferred compensation (Note 3) | 1,599 | 1,599 | ||||||
| Chief Compliance Officer fees | 2,209 | 1,781 | ||||||
| Trustees' fees and expenses | 473 | 370 | ||||||
| Accrued other expenses | 9,913 | 13,244 | ||||||
| Total liabilities | 157,472 | 256,877 | ||||||
| Net Assets | $ | 55,275,618 | $ | 66,886,176 | ||||
| Components of Net Assets: | ||||||||
| Paid-in Capital (par value of $0.01 per share with an unlimited number of shares authorized) | $ | 55,001,493 | $ | 81,930,792 | ||||
| Total distributable earnings (loss) | 274,125 | (15,044,616 | ) | |||||
| Net Assets | $ | 55,275,618 | $ | 66,886,176 | ||||
| Maximum Offering Price per Share: | ||||||||
| Class A Shares: | ||||||||
| Net assets applicable to shares outstanding | $ | 54,685,851 | $ | 66,886,176 | ||||
| Shares of beneficial interest issued and outstanding | 5,099,508 | 9,036,504 | ||||||
| Redemption price per share | $ | 10.72 | $ | 7.40 | ||||
| Maximum sales charge (4.50% of offering price)* | 0.51 | 0.35 | ||||||
| Maximum offering price to public | $ | 11.23 | $ | 7.75 | ||||
| Class I Shares: | ||||||||
| Net assets applicable to shares outstanding | $ | 589,767 | ||||||
| Shares of beneficial interest issued and outstanding | 54,211 | |||||||
| Offering and redemption price per share | $ | 10.88 | ||||||
| * | On sales of $50,000 or more, the sales charge will be reduced. |
See accompanying Notes to Financial Statements.
| 35 |
STATEMENTS OF OPERATIONS
For the Year Ended October 31, 2018
| EuroPac International Value Fund | EuroPac International Bond Fund | EuroPac International Dividend Income Fund | ||||||||||
| Investment Income: | ||||||||||||
| Dividend income from unaffiliated issuers (net of foreign withholding taxes of $229,472, $0 and $346,289, respectively) | $ | 2,086,775 | $ | - | $ | 2,592,520 | ||||||
| Dividends from affiliated investments (net of foreign withholding taxes of $0, $0 and $0, respectively) | - | - | - | |||||||||
| Interest income from unaffiliated issuers (net of foreign withholding taxes of $0, $16,433 and $0, respectively) | 3,743 | 1,721,625 | 2,639 | |||||||||
| Total investment income | 2,090,518 | 1,721,625 | 2,595,159 | |||||||||
| Expenses: | ||||||||||||
| Advisory fees | 672,043 | 256,052 | 533,121 | |||||||||
| Distribution fees (Note 8) | 153,579 | 104,546 | 151,522 | |||||||||
| Fund administration fees | 73,892 | 60,899 | 72,095 | |||||||||
| Transfer agent fees and expenses | 67,613 | 45,700 | 61,678 | |||||||||
| Fund accounting fees | 54,041 | 47,118 | 53,915 | |||||||||
| Shareholder servicing fees (Note 7) | 51,795 | 32,652 | 50,192 | |||||||||
| Registration fees | 33,000 | 32,000 | 38,829 | |||||||||
| Custody fees | 17,470 | 16,354 | 18,871 | |||||||||
| Auditing fees | 15,638 | 15,640 | 15,725 | |||||||||
| Shareholder reporting fees | 8,676 | 7,879 | 10,067 | |||||||||
| Trustees' fees and expenses | 7,250 | 6,898 | 7,001 | |||||||||
| Legal fees | 7,165 | 7,315 | 9,271 | |||||||||
| Chief Compliance Officer fees | 5,339 | 4,076 | 4,661 | |||||||||
| Miscellaneous | 4,869 | 4,480 | 5,300 | |||||||||
| Insurance fees | 1,296 | 1,049 | 949 | |||||||||
| Total expenses | 1,173,666 | 642,658 | 1,033,197 | |||||||||
| Advisory fees waived | (86,694 | ) | (154,037 | ) | (97,675 | ) | ||||||
| Net expenses | 1,086,972 | 488,621 | 935,522 | |||||||||
| Net investment income (loss) | 1,003,546 | 1,233,004 | 1,659,637 | |||||||||
| Realized and Unrealized Gain (Loss): | ||||||||||||
| Net realized gain (loss) on: | ||||||||||||
| Investments in unaffiliated issuers | (3,050,520 | ) | (388,882 | ) | (3,417,119 | ) | ||||||
| Investments in affiliated issuers | - | - | - | |||||||||
| Foreign currency transactions | (7,675 | ) | (131,283 | ) | (5,715 | ) | ||||||
| Net realized gain (loss) | (3,058,195 | ) | (520,165 | ) | (3,422,834 | ) | ||||||
| Net change in unrealized appreciation/depreciation on: | ||||||||||||
| Investments in unaffiliated issuers | (4,358,965 | ) | (2,227,453 | ) | (3,213,643 | ) | ||||||
| Investments in affiliated issuers | - | - | - | |||||||||
| Foreign currency translations | (656 | ) | 815 | (3,545 | ) | |||||||
| Net change in unrealized appreciation/depreciation | (4,359,621 | ) | (2,226,638 | ) | (3,217,188 | ) | ||||||
| Net increase from payments by affiliates (Note 3) | - | - | - | |||||||||
| Net realized and unrealized loss | (7,417,816 | ) | (2,746,803 | ) | (6,640,022 | ) | ||||||
| Net Decrease in Net Assets from Operations | $ | (6,414,270 | ) | $ | (1,513,799 | ) | $ | (4,980,385 | ) | |||
See accompanying Notes to Financial Statements.
| 36 |
STATEMENTS OF OPERATIONS
For the Year Ended October 31, 2018
| EP Emerging Markets Small Companies Fund | EuroPac Gold Fund | |||||||
| Investment Income: | ||||||||
| Dividend income from unaffiliated issuers (net of foreign withholding taxes of $116,382 and $49,206, respectively) | $ | 1,054,459 | $ | 442,514 | ||||
| Dividends from affiliated investments (net of foreign withholding taxes of $0 and $8,386, respectively) | - | 45,929 | ||||||
| Interest income from unaffiliated issuers (net of foreign withholding taxes of $0 and $0, respectively) | 2,350 | 1,013 | ||||||
| Total investment income | 1,056,809 | 489,456 | ||||||
| Expenses: | ||||||||
| Advisory fees | 767,997 | 593,058 | ||||||
| Distribution fees (Note 8) | 176,140 | 185,332 | ||||||
| Fund administration fees | 84,856 | 77,963 | ||||||
| Transfer agent fees and expenses | 77,203 | 64,070 | ||||||
| Fund accounting fees | 70,182 | 48,948 | ||||||
| Shareholder servicing fees (Note 7) | 58,915 | 68,687 | ||||||
| Registration fees | 29,098 | 27,499 | ||||||
| Custody fees | 119,022 | 19,768 | ||||||
| Auditing fees | 15,837 | 15,779 | ||||||
| Shareholder reporting fees | 11,411 | 15,904 | ||||||
| Trustees' fees and expenses | 8,950 | 8,579 | ||||||
| Legal fees | 12,998 | 14,264 | ||||||
| Chief Compliance Officer fees | 15,584 | 15,480 | ||||||
| Miscellaneous | 3,548 | 7,559 | ||||||
| Insurance fees | 1,300 | 1,314 | ||||||
| Total expenses | 1,453,041 | 1,164,204 | ||||||
| Advisory fees waived | (210,235 | ) | (52,220 | ) | ||||
| Net expenses | 1,242,806 | 1,111,984 | ||||||
| Net investment income (loss) | (185,997 | ) | (622,528 | ) | ||||
| Realized and Unrealized Gain (Loss): | ||||||||
| Net realized gain (loss) on: | ||||||||
| Investments in unaffiliated issuers | 6,747,430 | (4,801,573 | ) | |||||
| Investments in affiliated issuers | - | (672,979 | ) | |||||
| Foreign currency transactions | (117,126 | ) | (35,161 | ) | ||||
| Net realized gain (loss) | 6,630,304 | (5,509,713 | ) | |||||
| Net change in unrealized appreciation/depreciation on: | ||||||||
| Investments in unaffiliated issuers | (18,999,276 | ) | (6,439,708 | ) | ||||
| Investments in affiliated issuers | - | 1,306,180 | ||||||
| Foreign currency translations | 161 | 537 | ||||||
| Net change in unrealized appreciation/depreciation | (18,999,115 | ) | (5,132,991 | ) | ||||
| Net increase from payments by affiliates (Note 3) | 27,336 | - | ||||||
| Net realized and unrealized loss | (12,341,475 | ) | (10,642,704 | ) | ||||
| Net Decrease in Net Assets from Operations | $ | (12,527,472 | ) | $ | (11,265,232 | ) | ||
See accompanying Notes to Financial Statements.
| 37 |
EuroPac International Value Fund
STATEMENTS OF CHANGES IN NET ASSETS
| For the Year Ended October 31, 2018 | For the Year Ended October 31, 2017 | |||||||
| Increase (Decrease) in Net Assets From: | ||||||||
| Operations: | ||||||||
| Net investment income | $ | 1,003,546 | $ | 739,890 | ||||
| Net realized gain (loss) on investments and foreign currency transactions | (3,058,195 | ) | 284,555 | |||||
| Net change in unrealized appreciation/depreciation on investments and foreign currency translations | (4,359,621 | ) | 2,420,519 | |||||
| Net increase (decrease) in net assets resulting from operations | (6,414,270 | ) | 3,444,964 | |||||
| Distributions to Shareholders: | ||||||||
| Distributions1: | ||||||||
| Class A | (1,002,656 | ) | ||||||
| Class I | (15,955 | ) | ||||||
| Total | (1,018,611 | ) | ||||||
| From net investment income: | ||||||||
| Class A | (749,338 | ) | ||||||
| Class I | (7,898 | ) | ||||||
| From return of capital: | ||||||||
| Class A | (111,966 | ) | ||||||
| Class I | (1,165 | ) | ||||||
| Total distributions to shareholders | (870,367 | ) | ||||||
| Capital Transactions: | ||||||||
| Net proceeds from shares sold: | ||||||||
| Class A | 8,630,872 | 10,256,497 | ||||||
| Class I | 341,725 | 175,400 | ||||||
| Reinvestment of distributions: | ||||||||
| Class A | 646,806 | 550,548 | ||||||
| Class I | 15,955 | 8,928 | ||||||
| Cost of shares redeemed: | ||||||||
| Class A2 | (12,979,958 | ) | (8,245,361 | ) | ||||
| Class I3 | (577,851 | ) | (31,044 | ) | ||||
| Net increase (decrease) in net assets from capital transactions | (3,922,451 | ) | 2,714,968 | |||||
| Total increase (decrease) in net assets | (11,355,332 | ) | 5,289,565 | |||||
| Net Assets: | ||||||||
| Beginning of period | 65,500,929 | 60,211,364 | ||||||
| End of period 4 | $ | 54,145,597 | $ | 65,500,929 | ||||
| Capital Share Transactions: | ||||||||
| Shares sold: | ||||||||
| Class A | 1,140,789 | 1,369,831 | ||||||
| Class I | 45,017 | 22,587 | ||||||
| Shares reinvested: | ||||||||
| Class A | 90,090 | 72,558 | ||||||
| Class I | 2,233 | 1,176 | ||||||
| Shares redeemed: | ||||||||
| Class A | (1,761,980 | ) | (1,107,948 | ) | ||||
| Class I | (84,698 | ) | (4,300 | ) | ||||
| Net increase (decrease) in capital share transactions | (568,549 | ) | 353,904 | |||||
| 1 | The SEC eliminated the requirement to disclose components of distributions paid to shareholders in September 2018. |
| 2 | Net of redemption fees of $494 and $752, respectively. |
| 3 | Net of redemption fees of $3 and $0, respectively. |
| 4 | End of year net assets includes accumulated undistributed net investment loss of $0 for the year ended October 31, 2017. The SEC eliminated the requirement to disclose undistributed net investment income in September 2018. |
See accompanying Notes to Financial Statements.
| 38 |
EuroPac International Bond Fund
STATEMENTS OF CHANGES IN NET ASSETS
| For the Year Ended October 31, 2018 | For the Year Ended October 31, 2017 | |||||||
| Increase (Decrease) in Net Assets From: | ||||||||
| Operations: | ||||||||
| Net investment income | $ | 1,233,004 | $ | 1,137,292 | ||||
| Net realized loss on investments and foreign currency transactions | (520,165 | ) | (3,675,800 | ) | ||||
| Net change in unrealized appreciation/depreciation on investments and foreign currency translations | (2,226,638 | ) | 3,691,399 | |||||
| Net increase (decrease) in net assets resulting from operations | (1,513,799 | ) | 1,152,891 | |||||
| Capital Transactions: | ||||||||
| Net proceeds from shares sold: | ||||||||
| Class A | 4,423,956 | 4,051,792 | ||||||
| Class I | 210,791 | 201,424 | ||||||
| Cost of shares redeemed: | ||||||||
| Class A 1 | (8,879,030 | ) | (7,868,718 | ) | ||||
| Class I | (565,808 | ) | (58,966 | ) | ||||
| Net decrease in net assets from capital transactions | (4,810,091 | ) | (3,674,468 | ) | ||||
| Total decrease in net assets | (6,323,890 | ) | (2,521,577 | ) | ||||
| Net Assets: | ||||||||
| Beginning of period | 43,949,836 | 46,471,413 | ||||||
| End of period 2 | $ | 37,625,946 | $ | 43,949,836 | ||||
| Capital Share Transactions: | ||||||||
| Shares sold: | ||||||||
| Class A | 515,809 | 487,895 | ||||||
| Class I | 24,344 | 24,309 | ||||||
| Shares redeemed: | ||||||||
| Class A | (1,048,865 | ) | (961,989 | ) | ||||
| Class I | (68,422 | ) | (7,150 | ) | ||||
| Net decrease in capital share transactions | (577,134 | ) | (456,935 | ) | ||||
| 1 | Net of redemption fees of $305 and $462, respectively. |
| 2 | End of year net assets includes accumulated undistributed net investment loss of $2,338,619 for the year ended October 31, 2017. The SEC eliminated the requirement to disclose undistributed net investment income in September 2018. |
See accompanying Notes to Financial Statements.
| 39 |
EuroPac International Dividend Income Fund
STATEMENTS OF CHANGES IN NET ASSETS
| For the Year Ended October 31, 2018 | For the Year Ended October 31, 2017 | |||||||
| Increase (Decrease) in Net Assets From: | ||||||||
| Operations: | ||||||||
| Net investment income | $ | 1,659,637 | $ | 1,592,876 | ||||
| Net realized gain (loss) on investments and foreign currency transactions | (3,422,834 | ) | 21,490 | |||||
| Net change in unrealized appreciation/depreciation on investments, foreign currency contracts and foreign currency translations | (3,217,188 | ) | 2,975,053 | |||||
| Net increase (decrease) in net assets resulting from operations | (4,980,385 | ) | 4,589,419 | |||||
| Distributions to Shareholders: | ||||||||
| Distributions:1 | ||||||||
| Class A | (1,581,865 | ) | ||||||
| Class I | (56,541 | ) | ||||||
| Total | (1,638,406 | ) | ||||||
| From net investment income: | ||||||||
| Class A | (1,572,946 | ) | ||||||
| Class I | (62,116 | ) | ||||||
| Total | (1,635,062 | ) | ||||||
| Capital Transactions: | ||||||||
| Net proceeds from shares sold: | ||||||||
| Class A | 8,858,988 | 8,137,522 | ||||||
| Class I | 205,846 | 302,902 | ||||||
| Reinvestment of distributions: | ||||||||
| Class A | 887,185 | 844,226 | ||||||
| Class I | 55,985 | 61,582 | ||||||
| Cost of shares redeemed: | ||||||||
| Class A2 | (13,425,458 | ) | (8,985,769 | ) | ||||
| Class I | (1,639,231 | ) | (142,687 | ) | ||||
| Net increase (decrease) in net assets from capital transactions | (5,056,685 | ) | 217,776 | |||||
| Total increase (decrease) in net assets | (11,675,476 | ) | 3,172,133 | |||||
| Net Assets: | ||||||||
| Beginning of period | 65,522,971 | 62,350,838 | ||||||
| End of period3 | $ | 53,847,495 | $ | 65,522,971 | ||||
| Capital Share Transactions: | ||||||||
| Shares sold: | ||||||||
| Class A | 1,082,082 | 1,001,639 | ||||||
| Class I | 25,714 | 37,838 | ||||||
| Shares reinvested: | ||||||||
| Class A | 114,305 | 104,005 | ||||||
| Class I | 7,160 | 7,583 | ||||||
| Shares redeemed: | ||||||||
| Class A | (1,692,626 | ) | (1,121,845 | ) | ||||
| Class I | (218,759 | ) | (17,476 | ) | ||||
| Net increase (decrease) in capital share transactions | (682,124 | ) | 11,744 | |||||
| 1 | The SEC eliminated the requirement to disclose components of distributions paid to shareholders in September 2018. |
| 2 | Net of redemption fee proceeds of $126 and $234, respectively. |
| 3 | End of year net assets includes accumulated undistributed investment income of $8,175 for the year ended October 31, 2017. The SEC eliminated the requirement to disclose undistributed net investment income in September 2018. |
See accompanying Notes to the Financial Statements.
| 40 |
EP Emerging Markets Small Companies Fund
STATEMENTS OF CHANGES IN NET ASSETS
| For the Year Ended October 31, 2018 | For the Year Ended October 31, 2017 | |||||||
| Increase (Decrease) in Net Assets From: | ||||||||
| Operations: | ||||||||
| Net investment loss | $ | (185,997 | ) | $ | (160,748 | ) | ||
| Net realized gain on investments and foreign currency transactions | 6,630,304 | 3,840,439 | ||||||
| Net change in unrealized appreciation/depreciation on investments and foreign currency | (18,999,115 | ) | 6,507,193 | |||||
| Net increase from payments by affiliates (Note 3) | 27,336 | 4 | - | |||||
| Net increase (decrease) in net assets resulting from operations | (12,527,472 | ) | 10,186,884 | |||||
| Distributions to shareholders: | ||||||||
| Distributions1: | ||||||||
| Class A | (3,073,331 | ) | ||||||
| Class I | (24,668 | ) | ||||||
| Total | (3,097,999 | ) | ||||||
| From net realized gain: | ||||||||
| Class A | (826,410 | ) | ||||||
| Class I | (6,538 | ) | ||||||
| Total | (832,948 | ) | ||||||
| Capital Transactions: | ||||||||
| Net proceeds from shares sold: | ||||||||
| Class A | 11,503,756 | 9,386,681 | ||||||
| Class I | 230,445 | 127,938 | ||||||
| Reinvestment of distributions: | ||||||||
| Class A | 1,942,493 | 532,576 | ||||||
| Class I | 14,874 | 3,829 | ||||||
| Cost of shares redeemed: | ||||||||
| Class A2 | (14,059,805 | ) | (9,276,113 | ) | ||||
| Class I | (63,634 | ) | (111,480 | ) | ||||
| Net increase (decrease) in net assets from capital transactions | (431,871 | ) | 663,431 | |||||
| Total increase (decrease) in net assets | (16,057,342 | ) | 10,017,367 | |||||
| Net Assets: | ||||||||
| Beginning of period | 71,332,960 | 61,315,593 | ||||||
| End of period3 | $ | 55,275,618 | $ | 71,332,960 | ||||
| Capital Share Transactions: | ||||||||
| Shares sold: | ||||||||
| Class A | 849,242 | 749,573 | ||||||
| Class I | 16,922 | 9,825 | ||||||
| Shares reinvested: | ||||||||
| Class A | 141,478 | 48,110 | ||||||
| Class I | 1,070 | 342 | ||||||
| Shares redeemed: | ||||||||
| Class A | (1,085,388 | ) | (758,969 | ) | ||||
| Class I | (4,771 | ) | (9,563 | ) | ||||
| Net increase (decrease) in capital share transactions | (81,447 | ) | 39,318 | |||||
| 1 | The SEC eliminated the requirement to disclose components of distributions paid to shareholders in September 2018. |
| 2 | Net of redemption fees of $6,431 and $245, respectively. |
| 3 | End of year net assets includes accumulated undistributed net investment loss of $445,544 for the year ended October 31, 2017. The SEC eliminated the requirement to disclose undistributed net investment income in September 2018. |
| 4 | Reimbursement had no impact to the Fund's performance (Note 3). |
See accompanying Notes to Financial Statements.
| 41 |
EuroPac Gold Fund
STATEMENTS OF CHANGES IN NET ASSETS
| For the Year Ended October 31, 2018 | For the Year Ended October 31, 2017 | |||||||
| Increase (Decrease) in Net Assets From: | ||||||||
| Operations: | ||||||||
| Net investment loss | $ | (622,528 | ) | $ | (708,620 | ) | ||
| Net realized gain (loss) on investments and foreign currency transactions | (5,509,713 | ) | 2,546,146 | |||||
| Net change in unrealized appreciation/depreciation on investments, and foreign currency translations | (5,132,991 | ) | (3,748,527 | ) | ||||
| Net increase from payments by affiliates (Note 3) | - | 21,861 | ||||||
| Net decrease in net assets resulting from operations | (11,265,232 | ) | (1,889,140 | ) | ||||
| Distributions to Shareholders: | ||||||||
| Distributions1: | ||||||||
| Class A | (1,913,546 | ) | ||||||
| From net investment income: | ||||||||
| Class A | (9,369,279 | ) | ||||||
| From return of capital: | ||||||||
| Class A | (1,492,543 | ) | ||||||
| Total distributions to shareholders | (1,913,546 | ) | (10,861,822 | ) | ||||
| Capital Transactions: | ||||||||
| Net proceeds from shares sold: | ||||||||
| Class A | 16,254,339 | 18,092,543 | ||||||
| Reinvestment of distributions: | ||||||||
| Class A | 980,725 | 5,133,909 | ||||||
| Cost of shares redeemed: | ||||||||
| Class A2 | (12,176,571 | ) | (10,748,454 | ) | ||||
| Net increase in net assets from capital transactions | 5,058,493 | 12,477,998 | ||||||
| Total decrease in net assets | (8,120,285 | ) | (272,964 | ) | ||||
| Net Assets: | ||||||||
| Beginning of period | 75,006,461 | 75,279,425 | ||||||
| End of period3 | $ | 66,886,176 | $ | 75,006,461 | ||||
| Capital Share Transactions: | ||||||||
| Shares sold: | ||||||||
| Class A | 1,926,050 | 2,106,241 | ||||||
| Shares reinvested: | ||||||||
| Class A | 114,170 | 621,539 | ||||||
| Shares redeemed: | ||||||||
| Class A | (1,459,973 | ) | (1,197,689 | ) | ||||
| Net increase in capital share transactions | 580,247 | 1,530,091 | ||||||
| 1 | The SEC eliminated the requirement to disclose components of distributions paid to shareholders in September 2018. |
| 2 | Net of redemption fees of $8,171 and $4,249, respectively. |
| 3 | End of year net assets includes accumulated undistributed net investment loss of $464,395 for the year ended October 31, 2017. The SEC eliminated the requirement to disclose undistributed net investment income in September 2018. |
See accompanying Notes to Financial Statements.
| 42 |
EuroPac International Value Fund
FINANCIAL HIGHLIGHTS
Class A
Per share operating performance.
For a capital share outstanding throughout each period.
| For the Year Ended October 31, | ||||||||||||||||||||
| 2018 | 2017 | 2016 | 2015 | 2014 | ||||||||||||||||
| Net asset value, beginning of period | $ | 7.65 | $ | 7.34 | $ | 6.51 | $ | 9.35 | $ | 10.26 | ||||||||||
| Income from Investment Operations: | ||||||||||||||||||||
| Net investment income1 | 0.12 | 0.09 | 0.05 | 0.13 | 0.18 | |||||||||||||||
| Net realized and unrealized gain (loss) | (0.88 | ) | 0.32 | 0.88 | (2.38 | ) | (0.86 | )6 | ||||||||||||
| Total from investment operations | (0.76 | ) | 0.41 | 0.93 | (2.25 | ) | (0.68 | ) | ||||||||||||
| Less Distributions: | ||||||||||||||||||||
| From net investment income | (0.12 | ) | (0.09 | ) | (0.10 | ) | (0.12 | ) | (0.23 | ) | ||||||||||
| From net realized gain | - | - | - | (0.47 | ) | - | ||||||||||||||
| From return of capital | - | (0.01 | ) | - | - | - | ||||||||||||||
| Total distributions | (0.12 | ) | (0.10 | ) | (0.10 | ) | (0.59 | ) | (0.23 | ) | ||||||||||
| Redemption fee proceeds1 | - | 2 | - | 2 | - | 2 | - | 2 | - | 2 | ||||||||||
| Net asset value, end of period | $ | 6.77 | $ | 7.65 | $ | 7.34 | $ | 6.51 | $ | 9.35 | ||||||||||
| Total return3 | (10.00 | )% | 5.66 | % | 14.53 | % | (25.18 | )% | (6.84 | )% | ||||||||||
| Ratios and Supplemental Data: | ||||||||||||||||||||
| Net assets, end of period (in thousands) | $ | 53,781 | $ | 64,802 | $ | 59,684 | $ | 44,882 | $ | 65,688 | ||||||||||
| Ratio of expenses to average net assets: | ||||||||||||||||||||
| Before fees waived and expenses absorbed | 1.89 | % | 1.92 | %4 | 1.97 | % | 2.00 | % | 1.90 | % | ||||||||||
| After fees waived and expenses absorbed | 1.75 | % | 1.75 | %4 | 1.75 | % | 1.75 | % | 1.75 | % | ||||||||||
| Ratio of net investment income to average net assets: | ||||||||||||||||||||
| Before fees waived and expenses absorbed | 1.47 | % | 1.02 | %5 | 0.47 | % | 1.42 | % | 1.66 | % | ||||||||||
| After fees waived and expenses absorbed | 1.61 | % | 1.19 | %5 | 0.69 | % | 1.67 | % | 1.81 | % | ||||||||||
| Portfolio turnover rate | 23 | % | 10 | % | 40 | % | 41 | % | 29 | % | ||||||||||
| 1 | Based on average shares outstanding for the period. |
| 2 | Amount represents less than $0.01 per share. |
| 3 | Total returns would have been lower had expenses not been waived or absorbed by the Advisor. Returns shown do not reflect the deduction of taxes that a shareholder would pay on Fund distributions or the redemption of Fund shares. Returns shown do not include payment of sales load of 4.50% of offering price which is reduced on sales of $50,000 or more. If the sales charge was included total returns would be lower. |
| 4 | Includes excise tax expense. If this expense was excluded, the ratio of expenses to average net assets before fees waived would have been 1.92%; the ratio of expenses to average net assets after fees waived would have been 1.75%. |
| 5 | Includes excise tax expense. If this expense was excluded, the ratio of net investment income to average net assets before fees waived would have been 1.02%; the ratio of net investment income to average net assets after fees waived would have been 1.19%. |
| 6 | The Affiliate reimbursed the Fund $24,512 for losses on a transaction not meeting the investment guidelines of the Fund. As of October 31, 2014, the reimbursement amount represents $0.003 per share. This reimbursement had no impact to the Fund's total return. |
See accompanying Notes to Financial Statements.
| 43 |
EuroPac International Value Fund
FINANCIAL HIGHLIGHTS
Class I
Per share operating performance.
For a capital share outstanding throughout each period.
| For the Year Ended October 31, | ||||||||||||||||||||
| 2018 | 2017 | 2016 | 2015 | 2014 | ||||||||||||||||
| Net asset value, beginning of period | $ | 7.66 | $ | 7.34 | $ | 6.51 | $ | 9.35 | $ | 10.26 | ||||||||||
| Income from Investment Operations: | ||||||||||||||||||||
| Net investment income1 | 0.14 | 0.11 | 0.07 | 0.14 | 0.21 | |||||||||||||||
| Net realized and unrealized gain (loss) | (0.88 | ) | 0.33 | 0.87 | (2.37 | ) | (0.87 | ) | ||||||||||||
| Total from investment operations | (0.74 | ) | 0.44 | 0.94 | (2.23 | ) | (0.66 | ) | ||||||||||||
| Less Distributions: | ||||||||||||||||||||
| From net investment income | (0.14 | ) | (0.11 | ) | (0.11 | ) | (0.14 | ) | (0.25 | ) | ||||||||||
| From net realized gain | - | - | - | (0.47 | ) | - | ||||||||||||||
| From return of capital | - | (0.01 | ) | - | - | - | ||||||||||||||
| Total distributions | (0.14 | ) | (0.12 | ) | (0.11 | ) | (0.61 | ) | (0.25 | ) | ||||||||||
| Redemption fee proceeds1 | - | 2 | - | - | 2 | - | - | |||||||||||||
| Net asset value, end of period | $ | 6.78 | $ | 7.66 | $ | 7.34 | $ | 6.51 | $ | 9.35 | ||||||||||
| Total return3 | (9.75 | )% | 6.03 | % | 14.73 | % | (25.02 | )% | (6.66 | )% | ||||||||||
| Ratios and Supplemental Data: | ||||||||||||||||||||
| Net assets, end of period (in thousands) | $ | 365 | $ | 699 | $ | 527 | $ | 86 | $ | 23 | ||||||||||
| Ratio of expenses to average net assets: | ||||||||||||||||||||
| Before fees waived and expenses absorbed | 1.64 | % | 1.67 | %4 | 1.72 | % | 1.75 | % | 1.65 | % | ||||||||||
| After fees waived and expenses absorbed | 1.50 | % | 1.50 | %4 | 1.50 | % | 1.50 | % | 1.50 | % | ||||||||||
| Ratio of net investment income to average net assets: | ||||||||||||||||||||
| Before fees waived and expenses absorbed | 1.72 | % | 1.27 | %5 | 0.72 | % | 1.67 | % | 1.91 | % | ||||||||||
| After fees waived and expenses absorbed | 1.86 | % | 1.44 | %5 | 0.94 | % | 1.92 | % | 2.06 | % | ||||||||||
| Portfolio turnover rate | 23 | % | 10 | % | 40 | % | 41 | % | 29 | % | ||||||||||
| 1 | Based on average shares outstanding for the period. |
| 2 | Amount represents less than $0.01 per share. |
| 3 | Total returns would have been lower had fees not been waived or absorbed by the Advisor. These returns do not reflect the deduction of taxes that a shareholder would pay on the Fund distributions or redemption of Fund shares. |
| 4 | Includes excise tax expense. If this expense was excluded, the ratio of expenses to average net assets before fees waived would have been 1.67%; the ratio of expenses to average net assets after fees waived would have been 1.50%. |
| 5 | Includes excise tax expense. If this expense was excluded, the ratio of net investment income to average net assets before fees waived would have been 1.27%; the ratio of net investment income to average net assets after fees waived would have been 1.44%. |
See accompanying Notes to Financial Statements.
| 44 |
EuroPac International Bond Fund
FINANCIAL HIGHLIGHTS
Class A
Per share operating performance.
For a capital share outstanding throughout each Period.
| For the Year Ended October 31, | ||||||||||||||||||||
| 2018 | 2017 | 2016 | 2015 | 2014 | ||||||||||||||||
| Net asset value, beginning of period | $ | 8.43 | $ | 8.19 | $ | 7.93 | $ | 9.49 | $ | 9.89 | ||||||||||
| Income from Investment Operations: | ||||||||||||||||||||
| Net investment income 1 | 0.24 | 0.21 | 0.18 | 0.24 | 0.30 | |||||||||||||||
| Net realized and unrealized gain (loss) | (0.56 | ) | 0.03 | 0.12 | (1.65 | ) | (0.51 | ) | ||||||||||||
| Total from investment operations | (0.32 | ) | 0.24 | 0.30 | (1.41 | ) | (0.21 | ) | ||||||||||||
| Less Distributions: | ||||||||||||||||||||
| From net investment income | - | - | (0.04 | ) | (0.15 | ) | (0.17 | ) | ||||||||||||
| From net realized gain | - | - | - | - | (0.02 | ) | ||||||||||||||
| Total distributions | - | - | (0.04 | ) | (0.15 | ) | (0.19 | ) | ||||||||||||
| Redemption fee proceeds 1 | - | 2 | - | 2 | - | - | 2 | - | 2 | |||||||||||
| Net asset value, end of period | $ | 8.11 | $ | 8.43 | $ | 8.19 | $ | 7.93 | $ | 9.49 | ||||||||||
| Total return 3 | (3.80 | )% | 2.93 | % | 3.83 | % | (14.96 | )% | (2.09 | )% | ||||||||||
| Ratios and Supplemental Data: | ||||||||||||||||||||
| Net assets, end of period (in thousands) | $ | 37,254 | $ | 43,190 | $ | 45,875 | $ | 46,612 | $ | 64,492 | ||||||||||
| Ratio of expenses to average net assets: | ||||||||||||||||||||
| Before fees waived and expenses absorbed | 1.51 | % | 1.55 | % | 1.57 | % | 1.48 | % | 1.39 | % | ||||||||||
| After fees waived and expenses absorbed | 1.15 | % | 1.15 | % | 1.15 | % | 1.15 | % | 1.15 | % | ||||||||||
| Ratio of net investment income to average net assets: | ||||||||||||||||||||
| Before fees waived and expenses absorbed | 2.52 | % | 2.18 | % | 1.88 | % | 2.50 | % | 2.81 | % | ||||||||||
| After fees waived and expenses absorbed | 2.88 | % | 2.58 | % | 2.30 | % | 2.83 | % | 3.05 | % | ||||||||||
| Portfolio turnover rate | 20 | % | 22 | % | 26 | % | 4 | % | 33 | % | ||||||||||
| 1 | Based on average shares outstanding for the period. |
| 2 | Amount represents less than $0.01 per share. |
| 3 | Total returns would have been lower had expenses not been waived or absorbed by the Advisor. Returns shown do not reflect the deduction of taxes that a shareholder would pay on Fund distributions or the redemption of Fund shares. Returns shown do not include payment of sales load of 4.50% of offering price which is reduced on sales of $50,000 or more. If the sales charge was included total returns would be lower. |
See accompanying Notes to Financial Statements.
| 45 |
EuroPac International Bond Fund
FINANCIAL HIGHLIGHTS
Class I
Per share operating performance.
For a capital share outstanding throughout each Period.
| For the Year Ended October 31, | ||||||||||||||||||||
| 2018 | 2017 | 2016 | 2015 | 2014 | ||||||||||||||||
| Net asset value, beginning of period | $ | 8.49 | $ | 8.24 | $ | 7.96 | $ | 9.51 | $ | 9.91 | ||||||||||
| Income from Investment Operations: | ||||||||||||||||||||
| Net investment income 1 | 0.27 | 0.24 | 0.21 | 0.26 | 0.32 | |||||||||||||||
| Net realized and unrealized gain (loss) | (0.57 | ) | 0.01 | 0.12 | (1.64 | ) | (0.51 | ) | ||||||||||||
| Total from investment operations | (0.30 | ) | 0.25 | 0.33 | (1.38 | ) | (0.19 | ) | ||||||||||||
| Less Distributions: | ||||||||||||||||||||
| From net investment income | - | - | (0.05 | ) | (0.17 | ) | (0.19 | ) | ||||||||||||
| From net realized gain | - | - | - | - | (0.02 | ) | ||||||||||||||
| Total distributions | - | - | (0.05 | ) | (0.17 | ) | (0.21 | ) | ||||||||||||
| Net asset value, end of period | $ | 8.19 | $ | 8.49 | $ | 8.24 | $ | 7.96 | $ | 9.51 | ||||||||||
| Total return 2 | (3.53 | )% | 3.03 | % | 4.16 | % | (14.64 | )% | (1.90 | )% | ||||||||||
| Ratios and Supplemental Data: | ||||||||||||||||||||
| Net assets, end of period (in thousands) | $ | 372 | $ | 760 | $ | 596 | $ | 320 | $ | 257 | ||||||||||
| Ratio of expenses to average net assets: | ||||||||||||||||||||
| Before fees waived and expenses absorbed | 1.26 | % | 1.30 | % | 1.32 | % | 1.23 | % | 1.14 | % | ||||||||||
| After fees waived and expenses absorbed | 0.90 | % | 0.90 | % | 0.90 | % | 0.90 | % | 0.90 | % | ||||||||||
| Ratio of net investment income to average net assets: | ||||||||||||||||||||
| Before fees waived and expenses absorbed | 2.77 | % | 2.43 | % | 2.13 | % | 2.75 | % | 3.06 | % | ||||||||||
| After fees waived and expenses absorbed | 3.13 | % | 2.83 | % | 2.55 | % | 3.08 | % | 3.30 | % | ||||||||||
| Portfolio turnover rate | 20 | % | 22 | % | 26 | % | 4 | % | 33 | % | ||||||||||
| 1 | Based on average shares outstanding for the period. |
| 2 | Total returns would have been lower had fees not been waived or absored by the Advisor. These returns do not reflect the deduction of taxes that a shareholder would pay on the Fund distributions or redemption of Fund shares. |
See accompanying Notes to Financial Statements.
| 46 |
Europac International Dividend Income Fund
FINANCIAL HIGHLIGHTS
Class A
Per share operating performance.
For a capital share outstanding throughout each period.
| For the Year Ended October 31, | For the Period January 10, 2014* through October 31, | |||||||||||||||||||
| 2018 | 2017 | 2016 | 2015 | 2014 | ||||||||||||||||
| Net asset value, beginning of period | $ | 8.30 | $ | 7.91 | $ | 7.84 | $ | 9.89 | $ | 10.00 | ||||||||||
| Income from Investment Operations: | ||||||||||||||||||||
| Net investment income1 | 0.21 | 0.20 | 0.17 | 0.28 | 0.33 | |||||||||||||||
| Net realized and unrealized gain (loss) | (0.83 | ) | 0.40 | 0.12 | (1.95 | ) | (0.18 | ) | ||||||||||||
| Total from investment operations | (0.62 | ) | 0.60 | 0.29 | (1.67 | ) | 0.15 | |||||||||||||
| Less Distributions: | ||||||||||||||||||||
| From net investment income | (0.21 | ) | (0.21 | ) | (0.22 | ) | (0.28 | ) | (0.26 | ) | ||||||||||
| From net realized gain | - | - | - | (0.10 | ) | - | ||||||||||||||
| Total distributions | (0.21 | ) | (0.21 | ) | (0.22 | ) | (0.38 | ) | (0.26 | ) | ||||||||||
| Redemption fee proceeds1 | - | 2 | - | 2 | - | 2 | - | 2 | - | 2 | ||||||||||
| Net asset value, end of period | $ | 7.47 | $ | 8.30 | $ | 7.91 | $ | 7.84 | $ | 9.89 | ||||||||||
| Total return3 | (7.54 | )% | 7.68 | % | 3.84 | % | (17.24 | )% | 1.36 | %4 | ||||||||||
| Ratios and Supplemental Data: | ||||||||||||||||||||
| Net assets, end of period (in thousands) | $ | 53,161 | $ | 63,217 | $ | 60,375 | $ | 52,628 | $ | 49,156 | ||||||||||
| Ratio of expenses to average net assets: | ||||||||||||||||||||
| Before fees waived and expenses absorbed | 1.66 | % | 1.68 | % | 1.78 | % | 1.73 | % | 2.06 | %5 | ||||||||||
| After fees waived and expenses absorbed | 1.50 | % | 1.50 | % | 1.50 | % | 1.50 | % | 1.50 | %5 | ||||||||||
| Ratio of net investment income to average net assets: | ||||||||||||||||||||
| Before fees waived and expenses absorbed | 2.48 | % | 2.36 | % | 1.92 | % | 2.92 | % | 3.41 | %5 | ||||||||||
| After fees waived and expenses absorbed | 2.64 | % | 2.54 | % | 2.20 | % | 3.16 | % | 3.97 | %5 | ||||||||||
| Portfolio turnover rate | 15 | % | 6 | % | 25 | % | 49 | % | 28 | %4 | ||||||||||
| * | Commencement of operations. |
| 1 | Based on average shares outstanding for the period. |
| 2 | Amount represents less than $0.01 per share. |
| 3 | Total returns would have been lower had expenses not been waived or absorbed by the Advisor. Returns shown do not reflect the deduction of taxes that a shareholder would pay on Fund distributions or the redemption of Fund Shares. Returns shown do not include payment of sales load of 4.50% of offering price which is reduced on sales of $50,000 or more. If the sales charge was included total returns would be lower. |
| 4 | Not annualized. |
| 5 | Annualized. |
See accompanying Notes to Financial Statements.
| 47 |
Europac International Dividend Income Fund
FINANCIAL HIGHLIGHTS
Class I
Per share operating performance.
For a capital share outstanding throughout each period.
| For the Year Ended October 31, | For the Period January 10, 2014* through October 31, | |||||||||||||||||||
| 2018 | 2017 | 2016 | 2015 | 2014 | ||||||||||||||||
| Net asset value, beginning of period | $ | 8.30 | $ | 7.91 | $ | 7.84 | $ | 9.89 | $ | 10.00 | ||||||||||
| Income from Investment Operations: | ||||||||||||||||||||
| Net investment income1 | 0.23 | 0.22 | 0.19 | 0.31 | 0.35 | |||||||||||||||
| Net realized and unrealized gain (loss) | (0.82 | ) | 0.40 | 0.12 | (1.95 | ) | (0.19 | ) | ||||||||||||
| Total from investment operations | (0.59 | ) | 0.62 | 0.31 | (1.64 | ) | 0.16 | |||||||||||||
| Less Distributions: | ||||||||||||||||||||
| From net investment income | (0.23 | ) | (0.23 | ) | (0.24 | ) | (0.31 | ) | (0.27 | ) | ||||||||||
| From net realized gain | - | - | - | (0.10 | ) | - | ||||||||||||||
| Total distributions | (0.23 | ) | (0.23 | ) | (0.24 | ) | (0.41 | ) | (0.27 | ) | ||||||||||
| Net asset value, end of period | $ | 7.48 | $ | 8.30 | $ | 7.91 | $ | 7.84 | $ | 9.89 | ||||||||||
| Total return2 | (7.17 | )% | 7.92 | % | 4.09 | % | (17.03 | )% | 1.50 | %3 | ||||||||||
| Ratios and Supplemental Data: | ||||||||||||||||||||
| Net assets, end of period (in thousands) | $ | 686 | $ | 2,306 | $ | 1,976 | $ | 1,849 | $ | 1,934 | ||||||||||
| Ratio of expenses to average net assets: | ||||||||||||||||||||
| Before fees waived and expenses absorbed | 1.41 | % | 1.43 | % | 1.53 | % | 1.48 | % | 1.81 | %4 | ||||||||||
| After fees waived and expenses absorbed | 1.25 | % | 1.25 | % | 1.25 | % | 1.25 | % | 1.25 | %4 | ||||||||||
| Ratio of net investment income to average net assets: | ||||||||||||||||||||
| Before fees waived and expenses absorbed | 2.73 | % | 2.61 | % | 2.17 | % | 3.17 | % | 3.66 | %4 | ||||||||||
| After fees waived and expenses absorbed | 2.89 | % | 2.79 | % | 2.45 | % | 3.41 | % | 4.22 | %4 | ||||||||||
| Portfolio turnover rate | 15 | % | 6 | % | 25 | % | 49 | % | 28 | %3 | ||||||||||
| * | Commencement of operations. |
| 1 | Based on average shares outstanding for the period. |
| 2 | Total returns would of been lower had fees not been waived or absorbed by the Advisor. These returns do not reflect the deduction of taxes that a shareholder would pay on the Fund distributions or redemption of Fund shares. |
| 3 | Not annualized. |
| 4 | Annualized. |
See accompanying Notes to Financial Statements.
| 48 |
EP Emerging Markets Small Companies Fund
FINANCIAL HIGHLIGHTS
Class A
Per share operating performance.
For a capital share outstanding throughout each period.
| For the Year Ended October 31, | ||||||||||||||||||||
| 2018 | 2017 | 2016 | 2015 | 2014 | ||||||||||||||||
| Net asset value, beginning of period | $ | 13.62 | $ | 11.80 | $ | 10.78 | $ | 13.06 | $ | 12.30 | ||||||||||
| Income from Investment Operations: | ||||||||||||||||||||
| Net investment loss1 | (0.03 | ) | (0.03 | ) | (0.02 | ) | (0.09 | ) | (0.06 | ) | ||||||||||
| Net realized and unrealized gain (loss) | (2.28 | ) | 2.01 | 1.18 | (1.91 | ) | 0.82 | |||||||||||||
| Total from investment operations | (2.31 | ) | 1.98 | 1.16 | (2.00 | ) | 0.76 | |||||||||||||
| Less Distributions: | ||||||||||||||||||||
| From net realized gain | (0.59 | ) | (0.16 | ) | (0.14 | ) | (0.28 | ) | - | |||||||||||
| Total distributions | (0.59 | ) | (0.16 | ) | (0.14 | ) | (0.28 | ) | - | |||||||||||
| Redemption fee proceeds1 | - | 2 | - | 2 | - | 2 | - | 2 | - | 2 | ||||||||||
| Net asset value, end of period | $ | 10.72 | $ | 13.62 | $ | 11.80 | $ | 10.78 | $ | 13.06 | ||||||||||
| Total return3 | (17.93 | )% | 17.12 | % | 10.93 | % | (15.50 | )% | 6.18 | % | ||||||||||
| Ratios and Supplemental Data: | ||||||||||||||||||||
| Net assets, end of period (in thousands) | $ | 54,686 | $ | 70,768 | $ | 60,835 | $ | 21,643 | $ | 31,933 | ||||||||||
| Ratio of expenses to average net assets: | ||||||||||||||||||||
| Before fees waived and expenses absorbed | 2.05 | % | 2.18 | % | 2.25 | % | 2.71 | % | 2.48 | % | ||||||||||
| After fees waived and expenses absorbed | 1.75 | % | 1.75 | % | 1.75 | % | 1.75 | % | 1.75 | % | ||||||||||
| Ratio of net investment loss to average net assets: | ||||||||||||||||||||
| Before fees waived and expenses absorbed | (0.56 | )% | (0.69 | )% | (0.67 | )% | (1.69 | )% | (1.23 | )% | ||||||||||
| After fees waived and expenses absorbed | (0.26 | )% | (0.26 | )% | (0.17 | )% | (0.73 | )% | (0.50 | )% | ||||||||||
| Portfolio turnover rate | 43 | % | 34 | % | 79 | % | 52 | % | 82 | % | ||||||||||
| 1 | Based on average shares outstanding for the period. |
| 2 | Amount represents less than $0.01 per share. |
| 3 | Total returns would have been lower had expenses not been waived or absorbed by the Advisor. Returns shown do not reflect the deduction of taxes that a shareholder would pay on Fund distributions or the redemption of Fund shares. Returns shown do not include payment of sales load of 4.50% of offering price which is reduced on sales of $50,000 or more. If the sales charge was included, total returns would be lower. |
See accompanying Notes to Financial Statements.
| 49 |
EP Emerging Markets Small Companies Fund
FINANCIAL HIGHLIGHTS
Class I
Per share operating performance.
For a capital share outstanding throughout each period.
| For the Year Ended October 31, | ||||||||||||||||||||
| 2018 | 2017 | 2016 | 2015 | 2014 | ||||||||||||||||
| Net asset value, beginning of period | $ | 13.78 | $ | 11.91 | $ | 10.84 | $ | 13.11 | $ | 12.32 | ||||||||||
| Income from Investment Operations: | ||||||||||||||||||||
| Net investment income (loss)1 | - | 2 | - | 2 | 0.01 | (0.06 | ) | (0.03 | ) | |||||||||||
| Net realized and unrealized gain (loss) | (2.31 | ) | 2.03 | 1.20 | (1.93 | ) | 0.82 | |||||||||||||
| Total from investment operations | (2.31 | ) | 2.03 | 1.21 | (1.99 | ) | 0.79 | |||||||||||||
| Less Distributions: | ||||||||||||||||||||
| From net realized gain | (0.59 | ) | (0.16 | ) | (0.14 | ) | (0.28 | ) | - | |||||||||||
| Total distributions | (0.59 | ) | (0.16 | ) | (0.14 | ) | (0.28 | ) | - | |||||||||||
| Net asset value, end of period | $ | 10.88 | $ | 13.78 | $ | 11.91 | $ | 10.84 | $ | 13.11 | ||||||||||
| Total return3 | (17.71 | )% | 17.38 | % | 11.33 | % | (15.36 | )% | 6.41 | % | ||||||||||
| Ratios and Supplemental Data: | ||||||||||||||||||||
| Net assets, end of period (in thousands) | $ | 590 | $ | 565 | $ | 481 | $ | 532 | $ | 647 | ||||||||||
| Ratio of expenses to average net assets: | ||||||||||||||||||||
| Before fees waived and expenses absorbed | 1.80 | % | 1.93 | % | 2.00 | % | 2.46 | % | 2.23 | % | ||||||||||
| After fees waived and expenses absorbed | 1.50 | % | 1.50 | % | 1.50 | % | 1.50 | % | 1.50 | % | ||||||||||
| Ratio of net investment income (loss) to average net assets: | ||||||||||||||||||||
| Before fees waived and expenses absorbed | (0.31 | )% | (0.44 | )% | (0.42 | )% | (1.44 | )% | (0.98 | )% | ||||||||||
| After fees waived and expenses absorbed | (0.01 | )% | (0.01 | )% | 0.08 | % | (0.48 | )% | (0.25 | )% | ||||||||||
| Portfolio turnover rate | 43 | % | 34 | % | 79 | % | 52 | % | 82 | % | ||||||||||
| 1 | Based on average shares outstanding for the period. |
| 2 | Amount represents less than $0.01 per share. |
| 3 | Total returns would have been lower had fees not been waived or absorbed by the Advisor. These returns do not reflect the deduction of taxes that a shareholder would pay on the Fund distributions or redemption of Fund shares. |
See accompanying Notes to Financial Statements.
| 50 |
EuroPac Gold Fund
FINANCIAL HIGHLIGHTS
Class A
Per share operating performance.
For a capital share outstanding throughout each period.
| For the Year Ended October 31, | ||||||||||||||||||||
| 2018 | 2017 | 2016 | 2015 | 2014 | ||||||||||||||||
| Net asset value, beginning of period | $ | 8.87 | $ | 10.87 | $ | 6.11 | $ | 7.25 | $ | 9.55 | ||||||||||
| Income from Investment Operations: | ||||||||||||||||||||
| Net investment loss1 | (0.07 | ) | (0.09 | ) | (0.03 | ) | (0.06 | ) | (0.09 | ) | ||||||||||
| Net realized and unrealized gain (loss) on investments | (1.17 | ) | (0.35 | )5 | 4.79 | (1.08 | ) | (2.15 | ) | |||||||||||
| Total from investment operations | (1.24 | ) | (0.44 | ) | 4.76 | (1.14 | ) | (2.24 | ) | |||||||||||
| Less Distributions: | ||||||||||||||||||||
| From net investment income | (0.23 | ) | (1.35 | ) | - | - | (0.06 | ) | ||||||||||||
| From return of capital | - | (0.21 | ) | - | - | - | ||||||||||||||
| Total distributions | (0.23 | ) | (1.56 | ) | - | - | (0.06 | ) | ||||||||||||
| Redemption fee proceeds1 | - | 2 | - | 2 | - | 2 | - | 2 | - | 2 | ||||||||||
| Net asset value, end of period | $ | 7.40 | $ | 8.87 | $ | 10.87 | $ | 6.11 | $ | 7.25 | ||||||||||
| Total return3 | (14.37 | )% | (2.97 | )% | 77.91 | % | (15.72 | )% | (23.49 | )% | ||||||||||
| Ratios and Supplemental Data: | ||||||||||||||||||||
| Net assets, end of period (in thousands) | $ | 66,886 | $ | 75,006 | $ | 75,279 | $ | 39,294 | $ | 33,320 | ||||||||||
| Ratio of expenses to average net assets | ||||||||||||||||||||
| (including interest expense and dividends on securities sold short): | ||||||||||||||||||||
| Before fees waived and expenses absorbed | 1.57 | % | 1.57 | %4 | 1.64 | %4 | 1.77 | %4 | 1.98 | %4 | ||||||||||
| After fees waived and expenses absorbed | 1.50 | % | 1.50 | %4 | 1.50 | %4 | 1.50 | %4 | 1.50 | %4 | ||||||||||
| Ratio of net investment loss to average net assets | ||||||||||||||||||||
| (including interest expense and dividends on securities sold short): | ||||||||||||||||||||
| Before fees waived and expenses absorbed | (0.91 | )% | (1.03 | )% | (0.49 | )% | (1.11 | )% | (1.39 | )% | ||||||||||
| After fees waived and expenses absorbed | (0.84 | )% | (0.96 | )% | (0.35 | )% | (0.84 | )% | (0.91 | )% | ||||||||||
| Portfolio turnover rate | 21 | % | 39 | % | 21 | % | 20 | % | 14 | % | ||||||||||
| 1 | Based on average shares outstanding for the period. |
| 2 | Amount represents less than $0.01 per share. |
| 3 | Total returns would have been lower had expenses not been waived or absorbed by the Advisor. Returns shown do not reflect the deduction of taxes that a shareholder would pay on Fund distributions or the redemption of Fund shares. Returns shown do not include payment of sales load of 4.50% of offering price which is reduced on sales of $50,000 or more. If the sales charge was included total returns would be lower. |
| 4 | If interest expense and dividends on securities sold short had been excluded, the expense ratios would have been lowered by 0.00% for the year ended October 31, 2018. For the prior periods, the ratios would have been lowered by 0.00%, 0.00%, 0.00% and 0.00%, respectively. |
| 5 | The Affiliates reimbursed the Fund $21,861 for losses on private placement security transactions. As of October 31, 2017, the reimbursement amount represents $0.003 per share. The reimbursement had no impact to the Fund's total return. |
See accompanying Notes to Financial Statements.
| 51 |
Euro Pacific Funds
NOTES TO FINANCIAL STATEMENTS
October 31, 2018
Note 1 – Organization
EuroPac International Value Fund (the ‘‘International Value Fund’’), EuroPac International Bond Fund (the “International Bond Fund”), EuroPac International Dividend Income Fund (the “International Dividend Income Fund”), EP Emerging Markets Small Companies Fund (the “Emerging Markets Small Companies Fund”) and EuroPac Gold Fund (the “Gold Fund”) (each a “Fund” and collectively the ‘‘Funds’’) are organized as a diversified series of Investment Managers Series Trust, a Delaware statutory trust (the “Trust”) which is registered as an open-end management investment company under the Investment Company Act of 1940, as amended (the “1940 Act”). The International Value Fund commenced operations on April 7, 2010, and its primary investment objective is to provide income and long-term capital appreciation. The International Bond Fund commenced operations on November 15, 2010, and its primary investment objective is to provide current income and capital appreciation. The International Dividend Income Fund commenced operations on January 10, 2014, and its primary investment objective is to seek income and maximize growth of income. The Emerging Markets Small Companies Fund commenced operations on December 1, 2010, and its primary investment objective is to provide long-term capital appreciation. The Gold Fund commenced operations on July 19, 2013, and its primary investment objective is to provide long-term capital appreciation. The Gold Fund is authorized to issue Class A shares. The International Value Fund, International Bond Fund, International Dividend Income Fund and Emerging Markets Small Companies Fund are authorized to issue two classes of shares: Class A shares and Class I shares. The Class I shares commenced operations on July 16, 2013 in the International Value Fund, International Bond Fund and Emerging Markets Small Companies Fund.
The shares of each class represent an interest in the same portfolio of investments of the Fund and have equal rights as to voting, redemptions, dividends and liquidation, subject to the approval of the Trustees. Income, expenses (other than expenses attributable to a specific class) and realized and unrealized gains and losses on investments are allocated to each class of shares in proportion to their relative shares outstanding. Shareholders of a class that bears distribution and service expenses under the terms of a distribution plan have exclusive voting rights to that distribution plan.
Each Fund is an investment company and accordingly follows the investment company accounting and reporting guidance of the Financial Accounting Standards Board (FASB) Accounting Standard Codification Topic 946 “Financial Services—Investment Companies.”
Note 2 – Accounting Policies
The following is a summary of the significant accounting policies consistently followed by the Funds in the preparation of their financial statements. The preparation of financial statements in conformity with accounting principles generally accepted in the United States of America (“GAAP”) requires management to make estimates and assumptions that affect the reported amounts and disclosures in the financial statements. Actual results could differ from these estimates.
(a) Valuation of Investments
Each Fund value equity securities at the last reported sale price on the principal exchange or in the principal over the counter (“OTC”) market in which such securities are traded, as of the close of regular trading on the NYSE on the day the securities are being valued or, if the last-quoted sales price is not readily available, the securities will be valued at the last bid or the mean between the last available bid and ask price. Securities traded on the NASDAQ are valued at the NASDAQ Official Closing Price (“NOCP”). Investments in open-end investment companies are valued at the daily closing net asset value of the respective investment company. Debt securities are valued by utilizing a price supplied by independent pricing service providers. The independent pricing service providers may use various valuation methodologies including matrix pricing and other analytical pricing models as well as market transactions and dealer quotations. These models generally consider such factors as yields or prices of bonds of comparable quality, type of issue, coupon, maturity, ratings and general market conditions. If a price is not readily available for a portfolio security, the security will be valued at fair value (the amount which the Fund might reasonably expect to receive for the security upon its current sale) as determined in good faith by the Fund’s advisor, subject to review and approval by the Valuation Committee, pursuant to procedures adopted by the Board of Trustees. The actions of the Valuation Committee are subsequently reviewed by the Board at its next regularly scheduled board meeting. The Valuation Committee meets as needed. The Valuation Committee is comprised of all the Trustees, but action may be taken by any one of the Trustees.
| 52 |
Euro Pacific Funds
NOTES TO FINANCIAL STATEMENTS – Continued
October 31, 2018
Fair value pricing may be applied to foreign securities held by the Funds upon the occurrence of an event after the close of trading on non-U.S. markets, but before the close of trading on the NYSE when each Fund’s NAV is determined. If the event may result in a material adjustment to the price of the Fund’s foreign securities once non-U.S. markets open on the following business day (such as, for example, a significant surge or decline in the U.S. market), the Fund may value such foreign securities at fair value, taking into account the effect of such event, in order to calculate the Fund’s NAV. Other types of portfolio securities that the Fund may fair value include, but are not limited to: (1) investments that are illiquid or traded infrequently, including “restricted” securities and private placements for which there is no public market; (2) investments for which, in the judgment of the Advisor, the market price is stale; (3) securities of an issuer that has entered into a restructuring; (4) securities for which trading has been halted or suspended; and (5) fixed income securities for which there is not a current market value quotation.
Foreign securities traded in countries outside the U.S. are fair valued by utilizing the quotations of an independent pricing service or from a brokerage firm. The pricing service will use a statistical analyses and quantitative models to adjust local prices using factors such as subsequent movement and changes in the prices of indexes, securities and exchange rates in other markets in determining fair value as of the time the Fund calculates the NAVs. The Board reviews the independent third party fair valuation analysis report quarterly.
(b) Investment Transactions, Investment Income and Expenses
Investment transactions are accounted for on the trade date. Realized gains and losses on investments are determined on the identified cost basis. Dividend income is recorded net of applicable withholding taxes on the ex-dividend date and interest income is recorded on an accrual basis. Withholding taxes on foreign dividends, if applicable, are paid (a portion of which may be reclaimable) or provided for in accordance with the applicable country’s tax rules and rates and are disclosed in the Statement of Operations. Withholding tax reclaims are filed in certain countries to recover a portion of the amounts previously withheld. The Funds record a reclaim receivable based on a number of factors, including a jurisdiction’s legal obligation to pay reclaims as well as payment history and market convention. Discounts or premiums on debt securities are accreted or amortized to interest income over the lives of the respective securities using the effective interest method. Income and Expenses of the Funds are allocated on a pro rata basis to each class of shares, except for distribution and service fees which are unique to each class of shares. Expenses incurred by the Trust with respect to more than one fund are allocated in proportion to the net assets of each fund except where allocation of direct expenses to each Fund or an alternative allocation method can be more appropriately made.
(c) Foreign Currency Translation
The Funds’ records are maintained in U.S. dollars. The value of securities, currencies and other assets and liabilities denominated in currencies other than U.S. dollars are translated into U.S. dollars based upon foreign exchange rates prevailing at the end of the reporting period. The currencies are translated into U.S. dollars by using the exchange rates quoted at the close of the London Stock Exchange prior to when the Funds’ NAV is next determined. Purchases and sales of investment securities, income and expenses are translated on the respective dates of such transactions.
| 53 |
Euro Pacific Funds
NOTES TO FINANCIAL STATEMENTS – Continued
October 31, 2018
The Funds do not isolate that portion of their net realized and unrealized gains and losses on investments resulting from changes in foreign exchange rates from the impact arising from changes in market prices. Such fluctuations are included with net realized and unrealized gain or loss from investments and foreign currency.
Net realized foreign currency transaction gains and losses arise from sales of foreign currencies, currency gains or losses realized between the trade and settlement dates on securities transactions, and the differences between the amounts of dividends, interest, and foreign withholding taxes recorded on the Funds’ books and the U.S. dollar equivalent of the amounts actually received or paid. Net unrealized foreign currency translation gains and losses arise from changes in the value of assets and liabilities, other than investments in securities, resulting from changes in the exchange rates.
(d) Federal Income Taxes
The Funds intend to comply with the requirements of Subchapter M of the Internal Revenue Code applicable to regulated investment companies and to distribute substantially all of its net investment income and any net realized gains to its shareholders. Therefore, no provision is made for federal income or excise taxes. Due to the timing of dividend distributions and the differences in accounting for income and realized gains and losses for financial statement and federal income tax purposes, the fiscal year in which amounts are distributed may differ from the year in which the income and realized gains and losses are recorded by the Funds.
Accounting for Uncertainty in Income Taxes (the “Income Tax Statement”) requires an evaluation of tax positions taken (or expected to be taken) in the course of preparing a Fund’s tax returns to determine whether these positions meet a “more-likely-than-not” standard that, based on the technical merits, have a more than fifty percent likelihood of being sustained by a taxing authority upon examination. A tax position that meets the “more-likely-than-not” recognition threshold is measured to determine the amount of benefit to recognize in the financial statements. The Funds recognize interest and penalties, if any, related to unrecognized tax benefits as income tax expense in the Statements of Operations.
The Income Tax Statement requires management of the Funds to analyze tax positions taken in the prior three open tax years, if any, and tax positions expected to be taken in the Funds’ current tax year, as defined by the IRS statute of limitations for all major jurisdictions, including federal tax authorities and certain state tax authorities. As of and during the open years ended October 31, 2015 – 2018, the Funds did not have a liability for any unrecognized tax benefits. The Funds have no examination in progress and are not aware of any tax positions for which it is reasonably possible that the total amounts of unrecognized tax benefits will significantly change in the next twelve months.
| 54 |
Euro Pacific Funds
NOTES TO FINANCIAL STATEMENTS – Continued
October 31, 2018
(e) Distributions to Shareholders
The International Value Fund, International Bond Fund, International Dividend Income Fund, Emerging Markets Small Companies Fund, and Gold Fund, will make distributions of net investment income, per the table below and capital gains, if any, at least annually. Distributions to shareholders are recorded on the ex-dividend date. The amount and timing of distributions are determined in accordance with federal income tax regulations, which may differ from GAAP.
| Distribution Frequency of Net Investment Income | |
| International Value Fund | Quarterly |
| International Bond Fund | Monthly |
| International Dividend Income Fund | Quarterly |
| Emerging Markets Small Companies Fund | Annually |
| Gold Fund | Annually |
The character of distributions made during the year from net investment income or net realized gains may differ from the characterization for federal income tax purposes due to differences in the recognition of income, expense and gain (loss) items for financial statement and tax purposes.
(f) Options
The Funds may write or purchase options contracts primarily to enhance each Fund’s returns and reduce volatility. In addition, the Funds may utilize options in an attempt to generate gains from option premiums or to reduce overall portfolio risk. When a Fund writes or purchases an option, an amount equal to the premium received or paid by the Fund is recorded as a liability or an asset and is subsequently adjusted to the current market value of the option written or purchased. Premiums received or paid from writing or purchasing options which expire unexercised are treated by the Fund on the expiration date as realized gains or losses. The difference between the premium and the amount paid or received on effecting a closing purchase or sale transaction, including brokerage commissions, is also treated as a realized gain or loss. If an option is exercised, the premium paid or received is added to the cost of the purchase or proceeds from the sale in determining whether the Fund has realized a gain or a loss on investment transactions. The Fund, as a writer of an option, may have no control over whether the underlying securities may be sold (call) or purchased (put) and as a result bears the market risk of an unfavorable change in the price of the security underlying the written option.
(g) Short Sales
Short sales are transactions under which the Fund sells a security it does not own in anticipation of a decline in the value of that security. To complete such a transaction, the Fund must borrow the security to make delivery to the buyer. The Fund then is obligated to replace the security borrowed by purchasing the security at market price at the time of replacement. The price at such time may be more or less than the price at which the security was sold by the Fund. When a security is sold short a decrease in the value of the security will be recognized as a gain and an increase in the value of the security will be recognized as a loss, which is potentially limitless. Until the security is replaced, the Fund is required to pay the lender amounts equal to dividend or interest that accrues during the period of the loan which is recorded as an expense. To borrow the security, the Fund also may be required to pay a premium or an interest fee, which are recorded as interest expense. Cash or securities are segregated for the broker to meet the necessary margin requirements. The Fund is subject to the risk that it may not always be able to close out a short position at a particular time or at an acceptable price.
| 55 |
Euro Pacific Funds
NOTES TO FINANCIAL STATEMENTS – Continued
October 31, 2018
Note 3 – Investment Advisory and Other Agreements
The Trust, on behalf of the Funds, entered into an Investment Advisory Agreement (the “Agreement”) with Euro Pacific Asset Management, LLC (the “Advisor”). Under the terms of the Agreement, the Funds pay a monthly investment advisory fee to the Advisor. The annual rates are listed by Fund in the table below. The Advisor has contractually agreed to waive its fees and/or pay for operating expenses (excluding any taxes, leverage interest, brokerage commissions, dividend and interest expenses on short sales, acquired fund fees and expenses (as determined in accordance with SEC Form N-1A), expenses incurred in connection with any merger or reorganization, and extraordinary expenses such as litigation expenses) in order to limit total annual operating expenses of each fund. This agreement is in effect until February 28, 2019, and it may be terminated before that date only by the Trust's Board of Trustees. The table below contains the expense cap by Fund and by Class.
| Investment Advisory Fees |
Total Limit on Annual Operating Expenses Class A Shares† |
Total Limit on Annual Operating Expenses Class I Shares† | |
| International Value Fund | 1.08% | 1.75% | 1.50% |
| International Bond Fund | 0.60% | 1.15% | 0.90% |
| International Dividend Income Fund | 0.85% | 1.50% | 1.25% |
| Emerging Markets Small Companies Fund | 1.08% | 1.75% | 1.50% |
| Gold Fund | 0.80% | 1.50% | - |
| † | The total limit on annual operating expenses is calculated based on each Fund’s average daily net assets. |
The Emerging Markets Small Companies Fund is sub-advised by Champlain Investment Partners (the “Sub-advisor”). Pursuant to a sub-advisory agreement the Advisor pays a portion of the annual advisory fee of 1.08% of average net assets of the Fund to the Sub-advisor. Prior to June 30, 2015, the Fund’s Sub-advisor was New Sheridan Advisors, Inc.
The Gold Fund is sub-advised by Global Strategic Management, d/b/a Adrian Day Asset Management (the “Sub-advisor”). Pursuant to a sub-advisory agreement the Advisor pays a portion of the annual advisory fee of 0.80% of average net assets of the Fund to the Sub-advisor.
For the year ended October 31, 2018, the Advisor waived fees as follows:
| Advisory fees | ||||
| International Value Fund | $ | 86,694 | ||
| International Bond Fund | 154,037 | |||
| International Dividend Income Fund | 97,675 | |||
| Emerging Markets Small Companies Fund | 210,235 | |||
| Gold Fund | 52,220 | |||
Each Fund’s advisor is permitted to seek reimbursement from the Fund, subject to certain limitations, of fees waived or payments made to the Fund for a period ending three full fiscal years after the date of the waiver or payment. This reimbursement may be requested from the Fund if the reimbursement will not cause the Fund’s annual expense ratio to exceed the lesser of (a) the expense limitation amount in effect at the time such fees were waived or payments made, or (b) the expense limitation amount in effect at the time of the reimbursement. The Advisor may recapture all or a portion of the amounts no later than October 31st of the years stated below:
| 56 |
Euro Pacific Funds
NOTES TO FINANCIAL STATEMENTS – Continued
October 31, 2018
| International Value Fund | International Bond Fund | International Dividend Income Fund | Emerging Markets Small Companies Fund | Gold Fund | ||||||||||||||||
| 2019 | $ | 117,102 | $ | 189,833 | $ | 158,484 | $ | 275,723 | $ | 81,073 | ||||||||||
| 2020 | 107,366 | 174,466 | 107,841 | 270,793 | 51,173 | |||||||||||||||
| 2021 | 86,694 | 154,037 | 97,675 | 210,235 | 52,220 | |||||||||||||||
| Total | $ | 311,162 | $ | 518,336 | $ | 364,000 | $ | 756,751 | $ | 184,466 | ||||||||||
UMB Fund Services, Inc. (“UMBFS”) serves as the Funds’ fund accountant, transfer agent and co-administrator; and Mutual Fund Administration, LLC (“MFAC”) serves as the Funds’ other co-administrator. UMB Bank, N.A., an affiliate of UMBFS, serves as the Funds’ custodian. The Funds’ allocated fees incurred for fund accounting, fund administration, transfer agency and custody services for the year ended October 31, 2018 are reported on the Statements of Operations.
IMST Distributors, LLC serves as the Funds’ distributor (the “Distributor”). The Distributor does not receive compensation from the Funds for its distribution services; the Advisor pays the Distributor a fee for its distribution-related services.
Certain trustees and officers of the Trust are employees of UMBFS or MFAC. The Funds do not compensate trustees and officers affiliated with the Funds’ co-administrators. For the year ended October 31, 2018, the Funds’ allocated fees incurred for Trustees who are not affiliated with the Funds’ co-administrators are reported on the Statements of Operations.
The Funds’ Board of Trustees has adopted a Deferred Compensation Plan (the “Plan”) for the Independent Trustees that enables Trustees to elect to receive payment in cash or the option to select various fund(s) in the Trust in which their deferred accounts shall be deemed to be invested. If a trustee elects to defer payment, the Plan provides for the creation of a deferred payment account. The Funds’ liability for these amounts is adjusted for market value changes in the invested fund(s) and remains a liability to the Funds until distributed in accordance with the Plan. The Trustees Deferred compensation liability under the Plan constitutes a general unsecured obligation of each Fund and is disclosed in the Statements of Assets and Liabilities. Contributions made under the plan and the change in unrealized appreciation/depreciation and income are included in the Trustees’ fees and expenses in the Statements of Operations.
Dziura Compliance Consulting, LLC provides Chief Compliance Officer (“CCO”) services to the Trust. The Funds’ allocated fees incurred for CCO services for the year ended October 31, 2018 are reported on the Statements of Operations.
Affiliates reimbursed the Gold Fund $21,861 or $0.003 per share for losses on private placement security transactions during the fiscal year ended October 31, 2017. Affiliates reimbursed the Emerging Markets Small Companies Fund $27,336 for losses on trading error by the Adviser during the fiscal year ended October 31, 2018. These amounts are reported on the Funds’ SOC. These reimbursements had no impact to the Funds’ net asset value per share or total return.
| 57 |
Euro Pacific Funds
NOTES TO FINANCIAL STATEMENTS – Continued
October 31, 2018
Note 4 – Federal Income Taxes
At October 31, 2018, gross unrealized appreciation and depreciation of investments owned by the Funds, based on cost for federal income tax purposes were as follows:
| International Value Fund | International Bond Fund | International Dividend Income Fund | Emerging Markets Small Companies Fund | Gold Fund | ||||||||||||||||
| Cost of investments | $ | 58,889,003 | $ | 45,437,729 | $ | 59,087,573 | $ | 56,415,755 | $ | 67,515,943 | ||||||||||
| Gross unrealized appreciation | $ | 5,155,375 | $ | 217,402 | $ | 3,454,394 | $ | 9,000,252 | $ | 11,763,100 | ||||||||||
| Gross unrealized depreciation | (10,061,280 | ) | (8,697,840 | ) | (8,984,827 | ) | (10,016,222 | ) | (12,306,971 | ) | ||||||||||
| Net unrealized depreciation on investments | $ | (4,905,905 | ) | $ | (8,480,438 | ) | $ | (5,530,433 | ) | $ | (1,015,970 | ) | $ | (543,871 | ) | |||||
The difference between cost amounts for financial statement and federal income tax purposes is due primarily to wash sale loss deferrals and passive foreign investment companies (“PFICs”).
Accounting principles generally accepted in the United States require that certain components of net assets be reclassified between financial and tax reporting. These reclassifications have no effect on net assets or net asset value per share. For the year ended October 31, 2018, permanent differences in book and tax accounting have been reclassified to paid-in capital and total distributable earnings (loss) as follows:
| Increase (Decrease) | ||||||||
| Funds | Paid-in Capital | Total Distributable Earnings (Loss) | ||||||
| International Value Fund | $ | (22,740 | ) | $ | 22,740 | |||
| International Bond Fund | (1,820,104 | ) | 1,820,104 | |||||
| International Dividend Income Fund | 883 | (883 | ) | |||||
| Emerging Markets Small Companies Fund | (617,100 | ) | 617,100 | |||||
| Gold Fund | (42,325 | ) | 42,325 | |||||
| 58 |
Euro Pacific Funds
NOTES TO FINANCIAL STATEMENTS – Continued
October 31, 2018
As of October 31, 2018, the components of accumulated earnings (deficit) on a tax basis were as follows:
| International Value Fund | International Bond Fund | International Dividend Income Fund | Emerging Markets Small Companies Fund | Gold Fund | ||||||||||||||||
| Undistributed ordinary income | $ | - | $ | - | $ | 22,809 | $ | - | $ | - | ||||||||||
| Undistributed long-term gains | - | - | - | 5,702,320 | - | |||||||||||||||
| Tax accumulated earnings | - | - | 22,809 | 5,702,320 | - | |||||||||||||||
| Accumulated capital and other losses | $ | (20,128,663 | ) | $ | (1,467,190 | ) | $ | (12,989,238 | ) | $ | (4,412,416 | ) | $ | (14,500,602 | ) | |||||
| Unrealized depreciation on investments | (4,905,905 | ) | (8,480,438 | ) | (5,530,433 | ) | (1,015,970 | ) | (543,871 | ) | ||||||||||
| Unrealized appreciation (depreciation) on foreign currency translations | 237 | (17,495 | ) | (504 | ) | 191 | (143 | ) | ||||||||||||
| Total accumulated earnings (deficit) | $ | (25,034,331 | ) | $ | (9,965,123 | ) | $ | (18,497,366 | ) | $ | 274,125 | $ | (15,044,616 | ) | ||||||
Differences between income and/or capital gains as determined on a book basis and a tax basis are primarily due to differing treatments of passive foreign investment company shares and wash sale loss deferrals.
The tax character of distributions paid during the fiscal years ended October 31, 2018 and 2017 were as follows:
| International Value Fund | International Bond Fund | International Dividend Income Fund | ||||||||||||||||||||||
| 2018 | 2017 | 2018 | 2017 | 2018 | 2017 | |||||||||||||||||||
| Distributions paid from: | ||||||||||||||||||||||||
| Ordinary Income | $ | 1,018,611 | $ | 757,236 | $ | - | $ | - | $ | 1,638,406 | $ | 1,635,062 | ||||||||||||
| Net long-term capital gains | - | - | - | - | - | - | ||||||||||||||||||
| Total taxable distributions | 1,018,611 | 757,236 | - | - | 1,638,406 | 1,635,062 | ||||||||||||||||||
| Return of Capital | - | 113,131 | - | - | - | - | ||||||||||||||||||
| Total distributions paid | $ | 1,018,611 | $ | 870,367 | $ | - | $ | - | $ | 1,638,406 | $ | 1,635,062 | ||||||||||||
| Emerging Markets Small Companies Fund | Gold Fund | |||||||||||||||
| 2018 | 2017 | 2018 | 2017 | |||||||||||||
| Distributions paid from: | ||||||||||||||||
| Ordinary Income | $ | - | $ | - | $ | 1,913,546 | $ | 9,369,279 | ||||||||
| Net long-term capital gains | 3,097,999 | 832,948 | - | - | ||||||||||||
| Total taxable distributions | 3,097,999 | 832,948 | 1,913,546 | 9,369,279 | ||||||||||||
| Return of Capital | - | - | - | 1,492,543 | ||||||||||||
| Total distributions paid | $ | 3,097,999 | $ | 832,948 | $ | 1,913,546 | $ | 10,861,822 | ||||||||
| 59 |
Euro Pacific Funds
NOTES TO FINANCIAL STATEMENTS – Continued
October 31, 2018
At October 31, 2018, the Funds had accumulated capital loss carry forwards as follows:
| Capital Loss Carryforward Not Subject to Expiration | ||||||||||||
| Fund | Short-Term | Long-Term | Total | |||||||||
| International Value Fund | $ | 3,311,321 | $ | 16,817,342 | $ | 20,128,663 | ||||||
| International Bond Fund | 103,516 | 1,363,674 | 1,467,190 | |||||||||
| International Dividend Income Fund | 3,537,571 | 9,451,667 | 12,989,238 | |||||||||
| Emerging Markets Small Companies Fund* | 3,328,219 | 952,630 | 4,280,849 | |||||||||
| Gold Fund | 1,389,344 | 13,111,258 | 14,500,602 | |||||||||
| * | Capital loss carryovers subject to certain limitations upon availability to offset future gains, if any, as the successor of a merger. |
To the extent that a fund may realize future net capital gains, those gains will be offset by any of its unused capital loss carryforward. Future capital loss carryover utilization in any given year may be subject to Internal Revenue Code limitations. During the year ended October 31, 2018, the International Bond Fund and Emerging Markets Small Companies Fund utilized $194,324 and $1,045,046 of their capital loss carryovers, respectively.
As of October 31, 2018, Emerging Markets Small Companies Fund had qualified Late-Year Losses of $131,567, which are deferred until fiscal year 2019 for tax purposes. Net late-year losses that are deferred, are deemed to arise on the first day of the Fund's next taxable year.
Under the Regulated Investment Company Modernization Act of 2010 (the "Act"), the Funds are permitted to carryforward capital losses incurred in taxable years beginning after December 22, 2010, for an unlimited period. However, any losses incurred during those future taxable years will be required to be utilized prior to the losses incurred in pre-enactment taxable years. As a result of this ordering rule, pre-enactment capital loss carryforwards may be more likely to expire unused. Additionally, post-enactment capital losses that are carried forward will retain their character as either short-term or long-term capital losses rather than being considered all short-term as under previous law.
Note 5 – Redemption Fee
The Funds may impose a redemption fee of 2.00% of the total redemption amount on all shares redeemed within 30 days of purchase. For the years ended October 31, 2018 and 2017, redemption fees were as follows:
| Year Ended October 31, 2018 | Year Ended October 31, 2017 | |||||||
| International Value Fund | $ | 497 | $ | 752 | ||||
| International Bond Fund | 305 | 462 | ||||||
| International Dividend Income Fund | 126 | 234 | ||||||
| Emerging Markets Small Companies Fund | 6,431 | 245 | ||||||
| Gold Fund | 8,171 | 4,249 | ||||||
| 60 |
Euro Pacific Funds
NOTES TO FINANCIAL STATEMENTS – Continued
October 31, 2018
Note 6 – Investment Transactions
For the year ended October 31, 2018, purchases and sales of investments, excluding short-term investments, were as follows:
| Purchases | Sales | |||||||
| International Value Fund | $ | 13,497,578 | $ | 16,327,533 | ||||
| International Bond Fund | 7,754,297 | 9,137,996 | ||||||
| International Dividend Income Fund | 9,137,089 | 10,295,591 | ||||||
| Emerging Markets Small Companies Fund | 29,100,050 | 30,772,851 | ||||||
| Gold Fund | 21,305,201 | 15,166,871 | ||||||
Note 7 – Shareholder Servicing Plan
The Trust, on behalf of each Fund, has adopted a Shareholder Servicing Plan to pay a fee at an annual rate of up to 0.15% of each Fund’s average daily net assets of shares serviced by shareholder servicing agents who provide administrative and support services to their customers.
For the year ended October 31, 2018, for the International Value Fund, International Bond Fund, International Dividend Income Fund, Emerging Markets Small Companies Fund and Gold Fund, shareholder servicing fees incurred are disclosed on the Statements of Operations.
Note 8 – Distribution Plan
The Trust, on behalf of the Funds, has adopted a Distribution Plan (the “Plan”) pursuant to Rule 12b-1 under the 1940 Act which allows each Fund to pay distribution fees for the sale and distribution of its Class A shares. The Plan provides for the payment of distribution fees at the annual rate of up to 0.25% of each Fund’s average daily net assets attributable to Class A shares, payable to IMST Distributors, LLC. Class I shares are not subject to any distribution or administrative service fees under the plan.
For the year ended October 31, 2018, for the International Value Fund, International Bond Fund, International Dividend Income Fund, Emerging Markets Small Companies Fund and Gold Fund, distribution fees incurred by each Fund’s Class A shares are disclosed on the Statements of Operations.
Note 9 – Indemnifications
In the normal course of business, the Funds enter into contracts that contain a variety of representations which provide general indemnifications. The Funds’ maximum exposure under these arrangements is unknown, as this would involve future claims that may be made against the Funds that have not yet occurred. However, the Funds expect the risk of loss to be remote.
Note 10 – Fair Value Measurements and Disclosure
Fair Value Measurements and Disclosures defines fair value, establishes a framework for measuring fair value in accordance with GAAP, and expands disclosure about fair value measurements. It also provides guidance on determining when there has been a significant decrease in the volume and level of activity for an asset or a liability, when a transaction is not orderly, and how that information must be incorporated into a fair value measurement.
Under Fair Value Measurements and Disclosures, various inputs are used in determining the value of each Fund’s investments. These inputs are summarized into three broad Levels as described below:
| 61 |
Euro Pacific Funds
NOTES TO FINANCIAL STATEMENTS – Continued
October 31, 2018
| • | Level 1 – Unadjusted quoted prices in active markets for identical assets or liabilities that the Fund has the ability to access. | |
| • | Level 2 – Observable inputs other than quoted prices included in Level 1 that are observable for the asset or liability, either directly or indirectly. These inputs may include quoted prices for the identical instrument on an inactive market, prices for similar instruments, interest rates, prepayment speeds, credit risk, yield curves, default rates and similar data. | |
| • | Level 3 – Unobservable inputs for the asset or liability, to the extent relevant observable inputs are not available, representing the Fund’s own assumptions about the assumptions a market participant would use in valuing the asset or liability, and would be based on the best information available. |
The availability of observable inputs can vary from security to security and is affected by a wide variety of factors, including, for example, the type of security, whether the security is new and not yet established in the marketplace, the liquidity of markets, and other characteristics particular to the security. To the extent that valuation is based on models or inputs that are less observable or unobservable in the market, the determination of fair value requires more judgment. Accordingly, the degree of judgment exercised in determining fair value is greatest for instruments categorized in Level 3.
The inputs used to measure fair value may fall into different Levels of the fair value hierarchy. In such cases, for disclosure purposes, the Level in the fair value hierarchy within which the fair value measurement falls in its entirety, is determined based on the lowest Level input that is significant to the fair value measurement in its entirety.
The inputs or methodology used for valuing investments are not an indication of the risk associated with investing in those securities. The following is a summary of the inputs used, as of October 31, 2018, in valuing the Funds’ assets carried at fair value:
| International Value Fund | Level 1 | Level 2* | Level 3** | Total | ||||||||||||
| Investments | ||||||||||||||||
| Common Stocks | ||||||||||||||||
| Basic Materials | $ | 12,507,504 | $ | - | $ | - | $ | 12,507,504 | ||||||||
| Communications | 10,761,616 | - | - | 10,761,616 | ||||||||||||
| Consumer, Cyclical | 3,073,597 | - | - | 3,073,597 | ||||||||||||
| Consumer, Non-cyclical | 15,804,053 | - | - | 15,804,053 | ||||||||||||
| Energy | 3,678,151 | - | - | 3,678,151 | ||||||||||||
| Technology | 2,311,172 | - | - | 2,311,172 | ||||||||||||
| Utilities | 2,725,092 | - | - | 2,725,092 | ||||||||||||
| Short-Term Investments | 3,121,913 | - | - | 3,121,913 | ||||||||||||
| Total Investments | $ | 53,983,098 | $ | - | $ | - | $ | 53,983,098 | ||||||||
| 62 |
Euro Pacific Funds
NOTES TO FINANCIAL STATEMENTS – Continued
October 31, 2018
| International Bond Fund | Level 1 | Level 2 | Level 3 | Total | ||||||||||||
| Investments | ||||||||||||||||
| Common Stocks | ||||||||||||||||
| Basic Materials | $ | - | $ | - | $ | - | $ | - | ||||||||
| Bonds | ||||||||||||||||
| Basic Materials | - | 2,101,616 | - | 2,101,616 | ||||||||||||
| Communications | - | 1,600,995 | - | 1,600,995 | ||||||||||||
| Consumer, Non-cyclical | - | 2,093,855 | - | 2,093,855 | ||||||||||||
| Diversified | - | 726,134 | - | 726,134 | ||||||||||||
| Financial | - | 3,442,694 | - | 3,442,694 | ||||||||||||
| Government | - | 25,612,741 | - | 25,612,741 | ||||||||||||
| Utilities | - | 323,225 | - | 323,225 | ||||||||||||
| Short-Term Investments | 1,056,031 | - | - | 1,056,031 | ||||||||||||
| Total Investments | $ | 1,056,031 | $ | 35,901,260 | $ | - | $ | 36,957,291 | ||||||||
| International Dividend Income Fund | Level 1 | Level 2* | Level 3** | Total | ||||||||||||
| Investments | ||||||||||||||||
| Common Stocks | ||||||||||||||||
| Basic Materials | $ | 4,854,344 | $ | - | $ | - | $ | 4,854,344 | ||||||||
| Communications | 12,328,768 | - | - | 12,328,768 | ||||||||||||
| Consumer, Cyclical | 2,745,214 | - | - | 2,745,214 | ||||||||||||
| Consumer, Non-cyclical | 17,254,031 | - | - | 17,254,031 | ||||||||||||
| Energy | 5,543,389 | - | - | 5,543,389 | ||||||||||||
| Financial | 2,897,299 | - | - | 2,897,299 | ||||||||||||
| Technology | 2,362,532 | - | - | 2,362,532 | ||||||||||||
| Utilities | 4,424,667 | - | - | 4,424,667 | ||||||||||||
| Short-Term Investments | 1,146,896 | - | - | 1,146,896 | ||||||||||||
| Total Investments | $ | 53,557,140 | $ | - | $ | - | $ | 53,557,140 | ||||||||
| Emerging Markets Small Companies Fund | Level 1 | Level 2 | Level 3 | Total | ||||||||||||
| Investments | ||||||||||||||||
| Common Stocks | ||||||||||||||||
| Basic Materials | $ | - | $ | 1,476,974 | $ | - | $ | 1,476,974 | ||||||||
| Communications | 665,298 | 2,417,855 | - | 3,083,153 | ||||||||||||
| Consumer, Cyclical | 2,481,596 | 8,478,129 | - | 10,959,725 | ||||||||||||
| Consumer, Non-cyclical | 5,425,980 | 12,640,588 | - | 18,066,568 | ||||||||||||
| Diversified | 881,207 | - | - | 881,207 | ||||||||||||
| Financial | 5,405,707 | 2,011,532 | - | 7,417,239 | ||||||||||||
| Industrial | 1,023,433 | 9,251,265 | - | 10,274,698 | ||||||||||||
| Technology | - | 2,897,474 | - | 2,897,474 | ||||||||||||
| Short-Term Investments | 342,747 | - | - | 342,747 | ||||||||||||
| Total Investments | $ | 16,225,968 | $ | 39,173,817 | $ | - | $ | 55,399,785 | ||||||||
| 63 |
Euro Pacific Funds
NOTES TO FINANCIAL STATEMENTS – Continued
October 31, 2018
| Gold Fund | Level 1 | Level 2* | Level 3 | Total | ||||||||||||
| Investments | ||||||||||||||||
| Common Stocks | ||||||||||||||||
| Gold Mining | $ | 24,899,300 | $ | - | $ | - | $ | 24,899,300 | ||||||||
| Royalty Companies | 16,468,509 | - | - | 16,468,509 | ||||||||||||
| Precious Metals Developmental | 5,603,434 | - | 109,673 | 5,713,107 | ||||||||||||
| Precious Metals Exploration | 11,951,601 | - | 1,919,206 | 13,870,807 | ||||||||||||
| Silver: Exploration and Mining | 3,991,801 | - | - | 3,991,801 | ||||||||||||
| Diversified Exploration and Mining | 1,364,186 | - | 8,659 | 1,372,845 | ||||||||||||
| Warrants | ||||||||||||||||
| Diversified Exploration and Mining | - | - | - | - | ||||||||||||
| Silver: Exploration and Mining | - | - | - | - | ||||||||||||
| Precious Metals Developmental | - | - | - | - | ||||||||||||
| Precious Metals Exploration | - | - | 555,415 | 555,415 | ||||||||||||
| Short-Term Investments | 100,288 | - | - | 100,288 | ||||||||||||
| Total Investments | $ | 64,379,119 | $ | - | $ | 2,592,953 | $ | 66,972,072 | ||||||||
| * | The Fund did not hold any Level 2 securities at period end. |
| ** | The Fund did not hold any Level 3 securities at period end. |
The following is a reconciliation of assets in which significant unobservable inputs (Level 3) were used in determining value:
| International Bond Fund | Emerging Markets Small Companies Fund | Gold Fund – Common Stocks | Gold Fund – Warrants | |||||||||||||
| Beginning balance October 31, 2017 | $ | - | $ | - | $ | 26,286 | $ | 935,265 | ||||||||
| Transfers into Level 3 during the period | - | - | 1,749,806 | - | ||||||||||||
| Transfers out of Level 3 during the period | - | - | - | (935,265 | ) | |||||||||||
| Total realized gain/(loss) | - | - | (242,891 | ) | - | |||||||||||
| Total unrealized appreciation/(depreciation) | - | - | (281,052 | ) | 555,415 | |||||||||||
| Net purchases | - | - | 785,389 | - | ||||||||||||
| Net sales | - | - | - | - | ||||||||||||
| Balance as of October 31, 2018 | $ | - | $ | - | $ | 2,037,538 | $ | 555,415 | ||||||||
| 64 |
Euro Pacific Funds
NOTES TO FINANCIAL STATEMENTS – Continued
October 31, 2018
The following table presents additional information about valuation methodologies and inputs used for investments that are measured at fair value and categorized within Level 3 as of October 31, 2018:
| Fair Value October 31, 2018 | Valuation Methodologies | Unobservable Input(1) | Input Range/Value | Impact to Valuation from an increase in Input(2) | ||||||||
| International Bond Fund - Common Stocks | $ | - | Fair Value Pricing | Adjusted by management to reflect current conditions | - | Decrease | ||||||
| Emerging Markets Small Companies Fund - Common Stocks | $ | - | Fair Value Pricing | Adjusted by management to reflect current conditions | - | Decrease | ||||||
| Gold Fund - Warrants | $ | 555,415 | Fair Value Pricing | Discount for lack of marketability | 10% | Decrease | ||||||
| Common Stocks | $ | 2,037,538 | Fair Value Pricing | Discount for lack of marketability | 10% | Decrease | ||||||
| (1) | The investment advisor considers relevant indications of value that are reasonably and timely available to it in determining the fair value to be assigned to a particular security, such as the type and cost of the security; contractual or legal restrictions on resale of the security; relevant financial or business developments of the issuer; actively traded related securities; conversion or exchange rights on the security; related corporate actions; significant events occurring after the close of trading in the security; and changes in overall market conditions. The Fund’s use of fair value pricing may cause the net asset value of Fund shares to differ from the net asset value that would be calculated using market quotations. Fair value pricing involves subjective judgments and it is possible that the fair value determined for a security may be materially different than the value that could be realized upon the sale of that security. |
| (2) | This column represents the directional change in the fair value of the Level 3 investments that would result from an increase to the corresponding unobservable input. A decrease to the unobservable input would have the opposite effect. |
Note 11 – Derivatives and Hedging Disclosures
Derivatives and Hedging requires enhanced disclosures about the Gold Fund derivative and hedging activities, including how such activities are accounted for and their effects on the Gold Fund financial position, performance and cash flows. The Gold Fund invested in purchased options contracts and warrants during the year ended October 31, 2018.
| 65 |
Euro Pacific Funds
NOTES TO FINANCIAL STATEMENTS – Continued
October 31, 2018
The effects of these derivative instruments on the Funds’ financial position and financial performance as reflected in the Statement of Assets and Liabilities and Statement of Operations are presented in the tables below. The fair values of derivative instruments as of October31, 2018 by risk category are as follows:
| Gold Fund | ||||||
| Asset Derivatives | ||||||
| Derivatives not designated as hedging instruments | Statement of Assets and Liabilities Location | Value | ||||
| Warrants, at value | $ | 555,415 | ||||
| Total | $ | 555,415 | ||||
The effects of derivative instruments on the Statement of Operations for the year ended October 31, 2018 are as follows:
| Gold Fund | ||||||||
| Change in Unrealized Appreciation/Depreciation on Derivatives Recognized in Income | ||||||||
| Derivatives not designated as hedging instruments | Warrants | Total | ||||||
| Warrants | $ | (379,850 | ) | $ | (379,850 | ) | ||
| Total | $ | (379,850 | ) | $ | (379,850 | ) | ||
The number of contracts is included on the Schedule of Investments. The quarterly average volumes of derivative instruments as of October 31, 2018 are as follows:
| Gold Fund | ||||||||
| Derivatives not designated as hedging instruments | ||||||||
| Equity contracts | Warrants | Average Market Value | $ | 882,806 | ||||
| 66 |
Euro Pacific Funds
NOTES TO FINANCIAL STATEMENTS – Continued
October 31, 2018
Note 12 – Investments in Affiliated Issuers
An affiliated issuer is an entity in which the Fund has ownership of a least 5% of the voting securities or any investment in a EuroPac Fund. Issuers that are affiliates of the Fund at period-end are noted in the Fund’s Schedule of Investments. Additional security purchases and the reduction of certain securities shares outstanding of existing portfolio holdings that were not considered affiliated in prior years may result in the Fund owning in excess of 5% of the outstanding shares at period-end. The table below reflects transactions during the period with entities that are affiliates as of October 31, 2018 and may include acquisitions of new investments, prior year holdings that became affiliated during the period and prior period affiliated holdings that are no longer affiliated as of period-end:
| Fund/Security Description | Value Beginning of Period | Purchases | Sales Proceeds | Net Realized Gain (Loss) | Transfer Prior Year Unrealized Appreciation (Depreciation) | Change in Unrealized Appreciation (Depreciation) | Value End of Period | Dividend Income | ||||||||||||||||||||||||
| Gold Fund | ||||||||||||||||||||||||||||||||
| Medgold Resources Corp. | $ | 1,152,934 | $ | 170,528 | $ | - | $ | - | $ | - | $ | 429,550 | $ | 1,753,012 | $ | - | ||||||||||||||||
| Metalla Royalty & Streaming Ltd. | 2,247,888 | 19,301 | - | - | - | 486,476 | 2,753,665 | 45,929 | ||||||||||||||||||||||||
| Midland Exploration, Inc. | 3,754,825 | 223,342 | - | - | - | 187,677 | 4,165,844 | - | ||||||||||||||||||||||||
| Miranda Gold Corp.(1) | 355,135 | - | (90,831 | ) | (589,959 | ) | - | 325,655 | - | - | ||||||||||||||||||||||
| Tri Origin Exploration Ltd.(1) | 100,729 | - | (122,024 | ) | (83,020 | ) | - | 104,315 | - | - | ||||||||||||||||||||||
| Total | $ | 7,611,511 | ||||||||||||||||||||||||||||||
| Vista Gold Corp.(2) | 2,049,226 | 1,465,444 | - | - | (466,148 | ) | (227,493 | ) | 2,821,029 | - | ||||||||||||||||||||||
| Total | $ | (672,979 | ) | $ | 1,306,180 | $ | 11,493,550 | $ | 45,929 | |||||||||||||||||||||||
| Fund/Security Description | Shares Beginning of Period | Purchases | Sales | Shares End of Period | ||||||||||||
| Gold Fund | ||||||||||||||||
| Medgold Resources Corp. | 8,880,000 | 736,000 | - | 9.616,000 | ||||||||||||
| Metalla Royalty & Streaming Ltd. | 5,000,000 | 35,000 | - | 5,035,000 | ||||||||||||
| Midland Exploration, Inc. | 4,844,100 | 329,800 | - | 5,173,900 | ||||||||||||
| Miranda Gold Corp.(1) | 7,636,000 | - | (7,636,000 | ) | - | |||||||||||
| Tri Origin Exploration Ltd.(1) | 5,198,000 | - | (5,198,000 | ) | - | |||||||||||
| Total | 31,558,100 | |||||||||||||||
| Vista Gold Corp.(2) | 3,013,567 | 2,113,057 | - | 5,126,624 | ||||||||||||
| Total | 24,951,524 | |||||||||||||||
| (1) | Not an affiliate at the end of the period. |
| (2) | Not an affiliate at the beginning of the period. |
| 67 |
Euro Pacific Funds
NOTES TO FINANCIAL STATEMENTS – Continued
October 31, 2018
Note 13 – Events Subsequent to the Fiscal Period End
The Funds have adopted financial reporting rules regarding subsequent events which require an entity to recognize in the financial statements the effects of all subsequent events that provide additional evidence about conditions that existed at the date of the balance sheet. Management has evaluated the Funds’ related events and transactions that occurred through the date of issuance of the Funds’ financial statements.
Gold Fund Class I Shares commenced operations on November 20, 2018.
Effective December 4, 2018, the investment minimums for the Class I shares of the International Value Fund, the International Bond Fund, the International Dividend Income Fund, and the Emerging Markets Small Companies Fund are lowered from $15,000 to $5,000 for initial purchases and from $2,500 ($2,000 for the International Dividend Income Fund) to $250 for subsequent purchases.
The Funds declared the payment of a distribution to be paid, on December 10, 2018, to shareholders of record on December 7, 2018 as follows:
| Long Term Capital Gain | Short Term Capital Gain | Income | ||||||||||||
| International Value Fund | Class A Shares | $ | None | $ | None | $ | .01153 | |||||||
| International Value Fund | Class I Shares | None | None | .01575 | ||||||||||
| International Bond Fund | Class A Shares | None | None | .09625 | ||||||||||
| International Bond Fund | Class I Shares | None | None | .09801 | ||||||||||
| Gold Fund | Class A Shares | None | None | None | ||||||||||
| Gold Fund | Class I Shares | None | None | None | ||||||||||
| International Dividend Income Fund | Class A Shares | None | None | .02768 | ||||||||||
| International Dividend Income Fund | Class I Shares | None | None | .03249 | ||||||||||
| Emerging Markets Small Companies Fund | Class A Shares | 1.10258 | None | None | ||||||||||
| Emerging Markets Small Companies Fund | Class I Shares | 1.10258 | None | None | ||||||||||
There were no other events or transactions that occurred during this period that materially impacted the amounts or disclosures in the Funds’ financial statements.
| 68 |
REPORT OF INDEPENDENT REGISTERED PUBLIC ACCOUNTING FIRM
To the Board of Trustees of
Investment Managers Series Trust
and the Shareholders of the Euro Pacific Funds
Opinion on the Financial Statements
We have audited the accompanying statement of assets and liabilities of the EuroPac International Value Fund, EuroPac International Bond Fund, EuroPac International Dividend Income Fund, EP Emerging Markets Small Companies Fund and EuroPac Gold Fund (the “Funds”), each a series of Investment Managers Series Trust, including the schedules of investments, as of October 31, 2018, the related statements of operations for the year then ended, the statements of changes in net assets for each of the two years in the period then ended, the financial highlights for the periods indicated thereon, and the related notes (collectively referred to as the “financial statements”). In our opinion, the financial statements present fairly, in all material respects, the financial position of the Funds as of October 31, 2018, the results of their operations for the year then ended, the changes in their net assets for each of the two years in the period then ended and their financial highlights for the periods indicated thereon, in conformity with accounting principles generally accepted in the United States of America.
Basis for Opinion
These financial statements are the responsibility of the Funds’ management. Our responsibility is to express an opinion on the Funds’ financial statements based on our audits. We are a public accounting firm registered with the Public Company Accounting Oversight Board (United States) (“PCAOB”) and are required to be independent with respect to the Funds in accordance with the U.S. federal securities laws and the applicable rules and regulations of the Securities and Exchange Commission and the PCAOB. We have served as the auditor of one or more of the funds in the Trust since 2007.
We conducted our audits in accordance with the standards of the PCAOB. Those standards require that we plan and perform the audits to obtain reasonable assurance about whether the financial statements are free of material misstatement, whether due to error or fraud. The Funds are not required to have, nor were we engaged to perform, an audit of their internal control over financial reporting. As part of our audits we are required to obtain an understanding of internal control over financial reporting, but not for the purpose of expressing an opinion on the effectiveness of the Funds internal control over financial reporting. Accordingly, we express no such opinion.
Our audits included performing procedures to assess the risks of material misstatement of the financial statements, whether due to error or fraud, and performing procedures that respond to those risks. Such procedures included examining, on a test basis, evidence regarding the amounts and disclosures in the financial statements. Our audits also included evaluating the accounting principles used and significant estimates made by management, as well as evaluating the overall presentation of the financial statements. Our procedures included confirmation of securities owned as of October 31, 2018 by correspondence with the custodian and brokers. We believe that our audits provide a reasonable basis for our opinion.
| TAIT, WELLER & BAKER LLP |
Philadelphia, Pennsylvania
December 31, 2018
| 69 |
Euro Pacific Funds
SUPPLEMENTAL INFORMATION (Unaudited)
Qualified Dividend Income
Pursuant to Section 854 of the Internal Revenue Code of 1986, International Value Fund, International Bond Fund, International Dividend Income Fund, Emerging Markets Small Companies Fund and Gold Fund, designates income dividends of 100%, 0%, 100%, 0%, and 0%, respectively, as qualified dividend income paid during the fiscal year ended October 31, 2018.
Corporate Dividends Received Deduction
For the fiscal year ended October 31, 2018, 12.28%, 0%, 6.63%, 0%, and 0% of the dividends paid from net investment income qualifies for the dividends received deduction available to corporate shareholders of the International Value Fund, International Bond Fund, International Dividend Income Fund, Emerging Markets Small Companies Fund and Gold Fund, respectively.
Foreign Taxes Paid
Pursuant to Section 853 of the Internal Revenue Code of 1986, as amended, the International Value Fund and the International Dividend Income Fund, designates $1,109,204 and $1,179,012, respectively, of income derived from foreign sources and $181,387 and $209,101, respectively, of foreign taxes paid for the fiscal year ended October 31, 2018.
Of the ordinary income (including short-term capital gain) distributions made (or to be made) for the fiscal year ended October 31, 2018, the proportionate share of income derived from foreign sources and foreign taxes paid attributable to one share of stock are:
| Foreign Source Income | Foreign Taxes Paid | |||||||
| International Value Fund | $ | 0.1388 | $ | 0.0227 | ||||
| International Dividend Income Fund | $ | 0.2489 | $ | 0.0290 | ||||
Long-term Capital Gain
The EuroPac Merging Markets Small Companies Fund designates $3,097,999 as a 20% rate gain distribution for purposes of the dividends paid deduction.
| 70 |
Euro Pacific Funds
SUPPLEMENTAL INFORMATION (Unaudited) - Continued
Trustees and Officers Information
Additional information about the Trustees is included in the Funds’ Statement of Additional Information which is available, without charge, upon request by calling (888) 558-5851. The Trustees and officers of the Funds and their principal occupations during the past five years are as follows:
| Name, Address, Year of Birth and Position(s) held with Trust | Term of Officec and Length of Time Served | Principal Occupation During the Past Five Years and Other Affiliations |
Number of Portfolios in the Fund Complex Overseen by Trusteed | Other Directorships Held During the Past Five Years by Trustee |
| Independent Trustees: | ||||
|
Charles H. Miller a (born 1947) Trustee |
Since November 2007 | Retired (2013 – present). Executive Vice President, Client Management and Development, Access Data, a Broadridge company, a provider of technology and services to asset management firms (1997-2012). | 5 | None. |
|
Ashley Toomey Rabun a (born 1952) Trustee and Chairperson of the Board |
Since November 2007 | Retired (2016 – present). President and Founder, InvestorReach, Inc., a financial services consulting firm (1996 – 2015). | 5 | Select Sector SPDR Trust, a registered investment company (includes 11 portfolios). |
|
William H. Young a (born 1950) Trustee |
Since November 2007 | Retired (2014 - present). Independent financial services consultant (1996 – 2014). Interim CEO, Unified Fund Services Inc. (now Huntington Fund Services), a mutual fund service provider (2003 – 2006). Senior Vice President, Oppenheimer Management Company (1983 – 1996). Chairman, NICSA, an investment management trade association (1993 – 1996). | 5 | None. |
|
John P. Zader ᵃ (born 1961) Trustee |
Since November 2007 | Retired (June 2014 - present). CEO, UMB Fund Services, Inc., a mutual fund and hedge fund service provider, and the transfer agent, fund accountant, and co-administrator for the Fund (December 2006 - June 2014). President, Investment Managers Series Trust (December 2007 - June 2014). | 5 | Investment Managers Series Trust II, a registered investment company (includes 13 portfolios). |
| 71 |
Euro Pacific Funds
SUPPLEMENTAL INFORMATION (Unaudited) - Continued
| Name, Address, Year of Birth and Position(s) held with Trust | Term of Officec and Length of Time Served | Principal Occupation During the Past Five Years and Other Affiliations |
Number of Portfolios in the Fund Complex Overseen by Trusteed | Other Directorships Held During the Past Five Years by Trustee |
| Interested Trustee: | ||||
|
Eric M. Banhazl b† (born 1957) Trustee |
Since January 2008 | Chairman (2016 – present), and President (2006 – 2015), Mutual Fund Administration, LLC, the co-administrator for the Fund. Trustee and Vice President, Investment Managers Series Trust (December 2007 – March 2016). | 5 | Investment Managers Series Trust II, a registered investment company (includes 13 portfolios). |
| Officers of the Trust: | ||||
|
Maureen Quill ᵃ (born 1963) President |
Since June 2014 | President (January 2018 – present), UMB Fund Services, Inc. Chief Operating Officer (June 2014 – January 2018), and Executive Vice President (January 2007 – June 2014), UMB Fund Services, Inc. Vice President, Investment Managers Series Trust (December 2013 - June 2014). | N/A | N/A |
|
Rita Dam b (born 1966) Treasurer and Assistant Secretary |
Since December 2007 | Co-Chief Executive Officer (2016 – present), and Vice President (2006 – 2015), Mutual Fund Administration, LLC. | N/A | N/A |
|
Joy Ausili b (born 1966) Vice President, Assistant Secretary and Assistant Treasurer |
Since March 2016 | Co-Chief Executive Officer (2016 – present), and Vice President (2006 – 2015), Mutual Fund Administration, LLC. Secretary and Assistant Treasurer, Investment Managers Series Trust (December 2007 – March 2016). | N/A | N/A |
|
Diane Drakeb (born 1967) Secretary |
Since March 2016 | Senior Counsel, Mutual Fund Administration, LLC (October 2015 – present). Managing Director and Senior Counsel, BNY Mellon Investment Servicing (US) Inc. (2010 – 2015). | N/A | N/A |
|
Martin Dziura b (born 1959) Chief Compliance Officer |
Since June 2014 | Principal, Dziura Compliance Consulting, LLC (October 2014 – present). Managing Director, Cipperman Compliance Services (2010 – September 2014). Chief Compliance Officer, Hanlon Investment Management (2009 – 2010). Vice President − Compliance, Morgan Stanley Investment Management (2000 − 2009). | N/A | N/A |
| 72 |
Euro Pacific Funds
SUPPLEMENTAL INFORMATION (Unaudited) - Continued
| a | Address for certain Trustees and certain officers: 235 West Galena Street, Milwaukee, Wisconsin 53212. |
| b | Address for Mr. Banhazl, Ms. Ausili, Ms. Dam and Ms. Drake: 2220 E. Route 66, Suite 226, Glendora, California 91740. |
| Address for Mr. Dziura: 309 Woodridge Lane, Media, Pennsylvania 19063. | |
| c | Trustees and officers serve until their successors have been duly elected. |
| d | The Trust is comprised of numerous series managed by unaffiliated investment advisors. The term “Fund Complex” applies only to the Funds managed by the same investment advisor. The Funds do not hold itself out as related to any other series within the Trust, for purposes of investment and investor services, nor do they share the same investment advisor with any other series. |
| † | Mr. Banhazl is an “interested person” of the Trust by virtue of his position with Mutual Fund Administration, LLC. |
| 73 |
Euro Pacific Funds
SUPPLEMENTAL INFORMATION (Unaudited) - Continued
Board Consideration of Investment Advisory and Sub Advisory Agreements
At an in-person meeting held on March 14-15, 2018, the Board of Trustees (the “Board”) of Investment Managers Series Trust (the “Trust”), including the trustees who are not “interested persons” of the Trust (the “Independent Trustees”) as defined in the Investment Company Act of 1940, as amended (the “1940 Act”), reviewed and unanimously approved the renewal of the Investment Advisory Agreement (the “Advisory Agreement”) between the Trust and Euro Pacific Asset Management, LLC (the “Investment Advisor”) for an additional one-year term from when it otherwise would expire, with respect to the following series of the Trust (each a “Fund” and together, the “Funds”):
| • | the EP Emerging Markets Small Companies Fund (the “Emerging Markets Fund”), |
| • | the EuroPac Gold Fund (the “Gold Fund”), |
| • | the EuroPac International Bond Fund (the “International Bond Fund”), |
| • | the EuroPac International Dividend Income Fund (the “International Dividend Fund”), and |
| • | the EuroPac International Value Fund (the “International Value Fund”). |
The Board and the Independent Trustees also approved renewal of the following sub-advisory agreements (together, the “Sub-Advisory Agreements”), each for additional one-year terms from when they otherwise would expire:
| • | the sub-advisory agreement between the Investment Advisor and Champlain Investment Partners (“Champlain”) with respect to the Emerging Markets Fund (the “Champlain Sub-Advisory Agreement”), and |
| • | the sub-advisory agreement between the Investment Advisor and Adrian Day Asset Management (“ADAM” and together with Champlain, the “Sub-Advisors”) with respect to the Gold Fund (the “ADAM Sub-Advisory Agreement”). |
The Advisory Agreement and the Sub-Advisory Agreements are collectively referred to below as the “Fund Advisory Agreements.” In renewing each Fund Advisory Agreement, the Board, including the Independent Trustees, determined that such renewal was in the best interests of each Fund and its shareholders.
Background
In advance of the meeting, the Board received information about the Funds and the Fund Advisory Agreements from the Investment Advisor, the Sub-Advisors, and from Mutual Fund Administration, LLC and UMB Fund Services, Inc., the Trust’s co-administrators, certain portions of which are discussed below. The materials, among other things, included information about the organization and financial condition of the Investment Advisor and the Sub-Advisors; information regarding the background, experience, and compensation structure of relevant personnel providing services to the Funds; information about the Investment Advisor’s and the Sub-Advisors’ compliance policies and procedures, disaster recovery and contingency planning, and policies with respect to portfolio execution and trading; information regarding the profitability of the Investment Advisor’s relationship with each Fund; reports comparing the performance of each Fund with returns of its benchmark index and a group of comparable funds (each a “Peer Group”) selected by Broadridge Financial Solutions, Inc. (“Broadridge”) from Morningstar, Inc.’s relevant fund universe (each a “Fund Universe”) for various periods ended December 31, 2017; and reports comparing the investment advisory fee and total expenses of each Fund with those of its Peer Group and Fund Universe. The Board also received a memorandum from legal counsel to the Trust discussing the legal standards under the 1940 Act and other applicable law for their consideration of the proposed renewal of the Fund Advisory Agreements. In addition, the Board considered information reviewed by the Board during the year at other Board and Board committee meetings. No representatives of the Investment Advisor or the Sub-Advisors were present during the Board’s consideration of the Fund Advisory Agreements, and the Independent Trustees were represented by their legal counsel with respect to the matters considered.
| 74 |
Euro Pacific Funds
SUPPLEMENTAL INFORMATION (Unaudited) - Continued
In renewing each Fund Advisory Agreement, the Board and the Independent Trustees considered a variety of factors, including those discussed below. In their deliberations, the Board and the Independent Trustees did not identify any particular factor that was controlling, and each Trustee may have attributed different weights to the various factors.
Euro Pacific Asset Management, LLC
Nature, Extent and Quality of Services
The Board considered information included in the meeting materials regarding the performance of each Fund. The materials they reviewed indicated the following:
| • | The Emerging Markets Fund’s annualized total return for the five-year period was above the Peer Group and Diversified Emerging Markets Fund Universe median returns and the MSCI Emerging Markets Small Cap Index return. The Fund’s total return for the one-year period was above the Index return and the Peer Group median return, but below the Fund Universe median return by 0.93%. The Fund’s annualized total return for the three-year period was below the Peer Group and Fund Universe median returns and the Index return by 0.66%, 0.92%, and 1.07%, respectively. The Trustees noted the Investment Advisor’s explanation that the Fund’s underperformance compared to the Peer Group and benchmark during the three-year period is attributable to the Fund’s overweight positioning in Mexico and the Philippines and its lack of exposure to Russia, which was the top performing market during that period. |
| • | The Gold Fund’s annualized total returns for the one- and three-year periods were above the Peer Group and Equity Precious Metals Fund Universe median returns, the Philadelphia Gold & Silver Index returns, and the NYSE Arca Gold Miners Index returns. |
| • | The International Bond Fund’s total return for the one-year period was above the World Bond Fund Universe median return and the JP Morgan Global ex-U.S. Government Bond Index return, but below the Citigroup Non-USD World Government Bond Index return and the Peer Group median return by 0.37% and 0.48%, respectively. The Fund’s annualized total return for the three-year period was below the Peer Group and Fund Universe median returns, the Citigroup Index return, and the JP Morgan Index return by 1.86%, 2.74%, 2.76%, and 2.90%, respectively. The Fund’s annualized total return for the five-year period was below both the JP Morgan Index return and the Citigroup Index return by 2.19%, and below the Peer Group and Fund Universe median returns by 2.51% and 3.61%, respectively. The Trustees considered the Investment Advisor’s belief that the Fund’s underperformance relative to the Peer Group for the three- and five-year periods was not relevant because the Peer Group does not provide an appropriate basis of comparison for the Fund, as many funds in the Peer Group invest in the U.S. Dollar, engage in hedging, or invest in longer duration portfolios, all of which differ from the Fund’s strategy. The Trustees also noted the Investment Advisor’s belief that the Fund underperformed relative to the JP Morgan Index over the three-year and five-year periods due to the dramatic decline of interest rates over those periods and the Fund’s relatively short duration. |
| • | The International Dividend Fund’s total return for the one-year period was below the S&P International Dividend Opportunities Index return and the Peer Group and Foreign Large Value Fund Universe median returns by 4.89%, 6.80%, and 6.92%, respectively. The Fund’s annualized total return for the three-year period was below the Index return by 6.06%, the Peer Group median return by 6.42%, and the Fund Universe median return by 7.54%. The Fund’s annualized total return for the five-year period was below the Index return and the Peer Group and Fund Universe median returns by 3.72%, 4.80%, and 5.95%, respectively. In 2011, 2014 and 2016, the Fund’s performance was in the top quartile of the Fund Universe, and in 2011 and 2012 the Fund outperformed the Index. The Trustees noted the Investment Advisor’s assertion that a significant portion of the Fund’s underperformance occurred in the last quarter of 2017, and that the Fund’s performance was improving in 2018. |
| • | The International Value Fund’s total return for the one-year period was above the PHLX Gold & Silver Index and the Morningstar U.S. Energy Capped Index, but below the MSCI World Ex USA Value Index return, the Peer Group and Foreign Large Value Fund Universe median returns, and the MSCI All Country World Ex USA Value Index return by 5.95%, 7.30%, 7.43%, and 7.57%, respectively. The Fund’s annualized total return for the three-year period was above the Morningstar Index but below the MSCI World Ex USA Value Index return by 6.24%, the MSCI All Country World Ex USA Value Index return by 6.29%, the Fund Universe median return by 6.85%, the Peer Group median return by 7.01%, and the PHLX Index return by 8.21%. The Fund’s annualized total return for the five-year period was above the PHLX Index return but below the Morningstar Index return by 5.03%, the MSCI All Country World Ex USA Value Index return by 8.14%, the Fund Universe median return by 9.03%, the Peer Group median return by 9.06%, and the MSCI World Ex USA Value Index return by 9.20%. In 2016, the Fund’s performance was in the top percentile of funds in the Fund Universe. The Trustees noted the Investment Advisor’s assertion that the Fund’s investment style is unique; that the Peer Group provides a poor basis of comparison for the Fund’s performance because the Fund is designed to generate dividend income and capital gains and to perform well in a weak U.S. Dollar environment, which is distinct from ordinary foreign funds, the objectives of which are generally to outperform a broad group of foreign stocks; and that the Fund’s investment strategies have been communicated to the Fund’s shareholders. The Trustees also noted the Investment Advisor’s assertion that the Fund had performed as anticipated, given the strength of the U.S. Dollar over recent periods. |
| 75 |
Euro Pacific Funds
SUPPLEMENTAL INFORMATION (Unaudited) - Continued
The Board noted its familiarity with the Investment Advisor and considered the overall quality of services provided by the Investment Advisor to the Funds. In doing so, the Board considered the Investment Advisor’s specific responsibilities in day-to-day management and oversight of the Funds, as well as the qualifications, experience, and responsibilities of the personnel involved in the activities of the Funds. The Board also considered the overall quality of the organization and operations of the Investment Advisor, as well as its compliance structure. In addition, the Board considered the respective roles of the Investment Advisor and the Sub-Advisors with respect to the Emerging Markets Fund and the Gold Fund, noting that the Investment Advisor provides overall supervision of the general investment management and investment operations of each Fund and oversees the Sub-Advisors with respect to each Fund’s operations, including monitoring the investment and trading activities of the Sub-Advisors, and monitoring each Fund’s compliance with its investment policies; and that the Sub-Advisors’ responsibilities include day-to-day portfolio management. The Board and the Independent Trustees concluded that based on the various factors they had reviewed, the nature, overall quality, and extent of the management and oversight services provided by the Investment Advisor to each Fund were sufficient for renewal of the Fund’s Advisory Agreement.
Advisory Fees and Expense Ratios
With respect to the advisory fees and expenses paid by the Funds, the meeting materials indicated the following:
| • | The Emerging Markets Fund’s annual investment advisory fee (gross of fee waivers) was lower than the Peer Group median, but higher than the Diversified Emerging Markets Fund Universe median by 0.08%. The Trustees noted that the Fund’s advisory fee was higher than the standard fee that the Investment Advisor charges to sub-advise separate accounts for institutional clients of its affiliate, Euro Pacific Capital. The Trustees observed, however, that management of mutual fund assets requires compliance with certain requirements under the 1940 Act that do not apply to Euro Pacific Capital’s institutional clients, and that the Investment Advisor provides more services to the Fund than it does to the separately managed accounts for which it serves as sub-advisor. The Trustees also considered that the Fund’s advisory fee was within the range of advisory fees paid by other series of the Trust managed by the Investment Advisor. |
The annual total expenses paid by the Fund (net of fee waivers) for the Fund’s most recent fiscal year were lower than the Peer Group median, but higher than the Fund Universe median by 0.19%. The Trustees noted, however, that the average net assets of the Fund’s class considered by Broadridge were lower than the average net assets of corresponding classes of funds in the Fund Universe, and that certain of those other funds also had significant assets in other classes.
| 76 |
Euro Pacific Funds
SUPPLEMENTAL INFORMATION (Unaudited) - Continued
| • | The Gold Fund’s annual investment advisory fee (gross of fee waivers) was higher than the Peer Group and Equity Precious Metals Fund Universe medians by 0.05%. The Trustees considered the Investment Advisor’s belief that the Fund is distinct from many funds included in the Peer Group because of its greater diversification in types of investments, its focus on royalty and exploration companies, and its investment in derivatives, which requires more oversight and work than investing in stocks. The Trustees noted that the Fund’s advisory fee was higher than the standard fee that the Investment Advisor charges to sub-advise separate accounts for institutional clients of its affiliate, Euro Pacific Capital. The Trustees observed, however, that management of mutual fund assets requires compliance with certain requirements under the 1940 Act that do not apply to Euro Pacific Capital’s institutional clients, and that the Investment Advisor provides more services to the Fund than it does to the separately managed accounts for which it serves as sub-advisor. The Trustees also considered that the Fund’s advisory fee was within the range of advisory fees paid by other series of the Trust managed by the Investment Advisor. |
The annual total expenses paid by the Fund (net of fee waivers) for the Fund’s most recent fiscal year were higher than both the Peer Group and Fund Universe medians by 0.24%. The Trustees noted, however, that the average net assets of the Fund’s class considered by Broadridge were significantly lower than the average net assets of corresponding classes of funds in the Peer Group and Fund Universe, and that certain of those other funds also had significant assets in other classes.
| • | The International Bond Fund’s annual investment advisory fee (gross of fee waivers) was the same as the Peer Group median and slightly higher than the World Bond Fund Universe median by 0.03%. The Trustees noted that the Fund’s advisory fee was the same as the standard fee that the Investment Advisor charges to sub-advise separate accounts for institutional clients of its affiliate, Euro Pacific Capital. The Trustees observed, however, that management of mutual fund assets requires compliance with certain requirements under the 1940 Act that do not apply to Euro Pacific Capital’s institutional clients, and that the Investment Advisor provides more services to the Fund than it does to the separately managed accounts for which it serves as sub-advisor. The Trustees also considered that the Fund’s advisory fee was lower than the advisory fees paid by other series of the Trust managed by the Investment Advisor. |
The annual total expenses paid by the Fund (net of fee waivers) for the Fund’s most recent fiscal year were higher than the Peer Group median by 0.10% and the Fund Universe median by 0.15%. The Trustees noted, however, that the average net assets of the Fund’s class considered by Broadridge were significantly lower than the average net assets of corresponding classes of funds in the Peer Group and Fund Universe, and that certain of those other funds also had significant assets in other classes.
| • | The International Dividend Fund’s annual investment advisory fee (gross of fee waivers) was higher than the Peer Group median by 0.05% and the Foreign Large Value Fund Universe median by 0.065%. The Trustees considered the Investment Advisor’s belief that the Fund’s advisory fee is reasonable because the Fund’s unique strategy, which focuses on generating income while also benefitting from U.S. Dollar declines, requires more work than managing other funds. The Trustees noted that the Fund’s advisory fee was higher than the standard fee that the Investment Advisor charges to sub-advise separate accounts for institutional clients of its affiliate, Euro Pacific Capital. The Trustees observed, however, that management of mutual fund assets requires compliance with certain requirements under the 1940 Act that do not apply to Euro Pacific Capital’s institutional clients, and that the Investment Advisor provides more services to the Fund than it does to the separately managed accounts for which it serves as sub-advisor. The Trustees also considered that the Fund’s advisory fee was within the range of advisory fees paid by other series of the Trust managed by the Investment Advisor. |
The annual total expenses paid by the Fund (net of fee waivers) for the Fund’s most recent fiscal year were higher than both the Peer Group and Fund Universe medians by 0.16%. The Trustees noted, however, that the average net assets of the Fund’s class considered by Broadridge were significantly lower than the average net assets of corresponding classes of funds in the Peer Group and Fund Universe, and that certain of those other funds also had significant assets in other classes.
| 77 |
Euro Pacific Funds
SUPPLEMENTAL INFORMATION (Unaudited) - Continued
| • | The International Value Fund’s annual investment advisory fee (gross of fee waivers) was higher than the Peer Group median by 0.28% and the Foreign Large Value Fund Universe median by 0.31%. The Trustees considered the Investment Advisor’s belief that the Fund warrants a higher advisory fee than the Peer Group funds generally because the Fund uses a distinct strategy involving investment in markets that are not typically covered and therefore require more research and specialized trading in certain cases. The Trustees noted that the Fund’s advisory fee was higher than the standard fee that the Investment Advisor charges to sub-advise separate accounts for institutional clients of its affiliate, Euro Pacific Capital. The Trustees observed, however, that management of mutual fund assets requires compliance with certain requirements under the 1940 Act that do not apply to Euro Pacific Capital’s institutional clients, and that the Investment Advisor provides more services to the Fund than it does to the separately managed accounts for which it serves as sub-advisor. The Trustees also considered that the Fund’s advisory fee was within the range of advisory fees paid by other series of the Trust managed by the Investment Advisor. |
The annual total expenses paid by the Fund (net of fee waivers) for the Fund’s most recent fiscal year were higher than the Fund Universe and Peer Group medians by 0.42% and 0.43%, respectively. The Trustees noted, however, that the average net assets of the Fund’s class considered by Broadridge were significantly lower than the average net assets of corresponding classes of funds in the Peer Group and Fund Universe, and that certain of those other funds also had significant assets in other classes. The Trustees also considered the Investment Advisor’s belief that management of the Fund warranted a higher advisory fee, as discussed above.
In considering the Funds’ fees and total expenses, the Board considered the Investment Advisor’s longstanding view that each Fund is distinct from its Peer Group in some significant way, as the Investment Advisor focuses on unhedged exposure to various countries, currencies, and commodities in a way that is not replicated by any other fund family’s products, and this makes it difficult for Broadridge to appropriately categorize the Funds’ strategies and construct peer groups for the Funds. The Board also considered that most investors in the Funds, the majority of whom purchase shares through the Investment Advisor’s affiliated broker-dealer, Euro Pacific Capital, invest in the Funds specifically for this unique investment process and philosophy and with a long-term focus.
The Board and the Independent Trustees concluded that based on the factors they had reviewed, the compensation payable to the Investment Advisor under the Advisory Agreement was fair and reasonable in light of the nature and quality of the services the Investment Advisor provides to the Funds.
Profitability and Economies of Scale
The Board next considered information prepared by the Investment Advisor relating to its costs and profits with respect to each Fund for the year ended December 31, 2017, noting that the Investment Advisor had waived significant portions of its advisory fees for the Emerging Markets Fund and International Bond Fund, and had waived portions of its advisory fees for the International Value Fund, International Dividend Fund, and Gold Fund. Recognizing the difficulty in evaluating an investment advisor’s profitability with respect to the funds it manages in the context of an advisor with multiple lines of business, and noting that other profitability methodologies might also be reasonable, the Board and the Independent Trustees concluded that the profits of the Investment Advisor from its relationship with the Funds were reasonable.
The Board also considered the benefits received by the Investment Advisor as a result of the Investment Advisor’s relationship with the Funds, other than its receipt of investment advisory fees, including any research received from broker-dealers providing execution services to the Funds, the beneficial effects from the review by the Trust’s Chief Compliance Officer of the Investment Advisor’s compliance program, and the intangible benefits of the Investment Advisor’s association with the Funds generally and any favorable publicity arising in connection with the Funds’ performance. The Trustees noted that although there were no advisory fee breakpoints, the asset levels of the Funds were not currently likely to lead to significant economies of scale, and that any such economies would be considered in the future as the assets of the Funds grow.
| 78 |
Euro Pacific Funds
SUPPLEMENTAL INFORMATION (Unaudited) - Continued
Champlain Investment Partners
Nature, Extent and Quality of Services
The Board considered the overall quality of services provided by Champlain to the Emerging Markets Fund. In doing so, the Board considered Champlain’s specific responsibilities in day-to-day portfolio management of the Fund, as well as the qualifications, experience, and responsibilities of the personnel involved in the activities of the Fund. The Board also considered the overall quality of the organization and operations of Champlain, as well as its compliance structure. The Board’s observations regarding the performance of the Fund are described above. The Board and the Independent Trustees concluded that based on the various factors they had reviewed, the nature, overall quality, and extent of the management services provided by Champlain to the Emerging Markets Fund were satisfactory.
Sub-Advisory Fee
The Board reviewed information regarding the sub-advisory fee charged by Champlain with respect to the Emerging Markets Fund and noted that it was lower than the fee that Champlain charges to manage a private fund using the same strategy as the Emerging Markets Fund. The Board also noted that the Investment Advisor pays Champlain’s sub-advisory fee out of the Investment Advisor’s advisory fee.
The Board and the Independent Trustees concluded that based on the factors they had reviewed, the compensation payable to Champlain under the Champlain Sub-Advisory Agreement was fair and reasonable in light of the nature and quality of the services Champlain provides to the Emerging Markets Fund.
Benefits to the Sub-Advisor
The Board also considered the benefits received by Champlain as a result of its relationship with the Emerging Markets Fund, other than the receipt of its sub-advisory fee, including any research received from broker-dealers providing execution services to the Fund, the beneficial effects from the review by the Trust’s Chief Compliance Officer of Champlain’s compliance program, and the intangible benefits of Champlain’s association with the Fund generally and any favorable publicity arising in connection with the Fund’s performance.
Adrian Day Asset Management
Nature, Extent and Quality of Services
The Board considered the overall quality of services provided by ADAM to the Gold Fund. In doing so, the Board considered ADAM’s specific responsibilities in day-to-day portfolio management of the Fund, as well as the qualifications, experience, and responsibilities of the personnel involved in the activities of the Fund. The Board also considered the overall quality of the organization and operations of ADAM, as well as its compliance structure. The Board’s observations regarding the performance of the Fund are described above. The Board and the Independent Trustees concluded that based on the various factors they had reviewed, the nature, overall quality, and extent of the management services provided by ADAM to the Gold Fund were satisfactory.
Sub-Advisory Fee
The Board reviewed information regarding the sub-advisory fee charged by ADAM with respect to the Gold Fund, which they noted was lower than the advisory fee ADAM charges an insurance company to manage separate accounts with similar objectives as the Fund, but higher than ADAM’s advisory fees for managing two private funds with similar objectives as the Fund. The Trustees observed, however, that management of mutual fund assets requires compliance with certain requirements under the 1940 Act that do not apply to private funds. The Board also noted that the Investment Advisor pays ADAM’s sub-advisory fee out of the Investment Advisor’s advisory fee.
The Board and the Independent Trustees concluded that based on the factors they had reviewed, the compensation payable to ADAM under the ADAM Sub-Advisory Agreement was fair and reasonable in light of the nature and quality of the services ADAM provides to the Gold Fund.
| 79 |
Euro Pacific Funds
SUPPLEMENTAL INFORMATION (Unaudited) - Continued
Benefits to the Sub-Advisor
The Board also considered the benefits received by ADAM as a result of its relationship with the Gold Fund, other than the receipt of its sub-advisory fee, including any research received from broker-dealers providing execution services to the Fund, the beneficial effects from the review by the Trust’s Chief Compliance Officer of ADAM’s compliance program, and the intangible benefits of ADAM’s association with the Fund generally and any favorable publicity arising in connection with the Fund’s performance.
Conclusions
Based on these and other factors, the Board and the Independent Trustees concluded that renewal of each Fund Advisory Agreement was in the best interests of each Fund and its shareholders and, accordingly, renewed each Fund Advisory Agreement with respect to the Funds, as applicable.
| 80 |
Euro Pacific Funds
EXPENSE EXAMPLES
For the Six Months Ended October 31, 2018 (Unaudited)
Expense Examples
As a shareholder of the Funds, you incur two types of costs: (1) transaction costs, including sales charges (loads) on purchase payments (Class A shares only), and redemption fees and (2) ongoing costs, including management fees; distribution fees and/or service (12b-1) fees (Class A shares only); and other Fund expenses. The examples below are intended to help you understand your ongoing costs (in dollars) of investing in the Funds and to compare these costs with the ongoing costs of investing in other mutual funds.
These examples are based on an investment of $1,000 invested at the beginning of the period and held for the entire period from May 1, 2018 to October 31, 2018.
Actual Expenses
The information in the row titled “Actual Performance” of the table below provides actual account values and actual expenses. You may use the information in these columns, together with the amount you invested, to estimate the expenses that you paid over the period. Simply divide your account value by $1,000 (for example, an $8,600 account value divided by $1,000 = 8.6), then multiply the result by the number in the appropriate row under the column titled “Expenses Paid During Period” to estimate the expenses you paid on your account during this period.
Hypothetical Example for Comparison Purposes
The information in the row titled “Hypothetical (5% annual return before expenses)” of the table below provides hypothetical account values and hypothetical expenses based on the Funds’ actual expense ratios and an assumed rate of return of 5% per year before expenses, which is not the Funds’ actual return. The hypothetical account values and expenses may not be used to estimate the actual ending account balance or expenses you paid for the period. You may use this information to compare the ongoing costs of investing in the Funds and other funds. To do so, compare these 5% hypothetical examples with the 5% hypothetical examples that appear in the shareholder reports of the other funds.
Please note that the expenses shown in the table are meant to highlight your ongoing costs only and do not reflect any transaction costs, such as sales charges (load) or contingent deferred sales charges. Therefore, the information in the row titled “Hypothetical (5% annual return before expenses)” is useful in comparing ongoing costs only, and will not help you determine the relative total costs of owning different funds. In addition, if these transactional costs were included, your costs would have been higher.
| EuroPac International Value Fund | Beginning Account Value |
Ending Account Value |
Expenses Paid During Period* |
| Actual Performance | 5/1/18 | 10/31/18 | 5/1/18 – 10/31/18 |
| Class A | $1,000.00 | $914.30 | $8.44 |
| Class I | 1,000.00 | 915.70 | 7.24 |
| Hypothetical (5% annual return before expenses) | 5/1/18 | 10/31/18 | 5/1/18 – 10/31/18 |
| Class A | 1,000.00 | 1,016.39 | 8.89 |
| Class I | 1,000.00 | 1,017.65 | 7.62 |
| * | Expenses are equal to the Fund’s annualized expense ratios of 1.75% and 1.50% for Class A and Class I shares, respectively, multiplied by the average account values over the period, multiplied by 184/365 (to reflect the six month period). The expense ratios reflect an expense waiver. Assumes all dividends and distributions were reinvested. |
| 81 |
Euro Pacific Funds
EXPENSE EXAMPLES - Continued
For the Six Months Ended October 31, 2018 (Unaudited)
| EuroPac International Bond Fund | Beginning Account Value |
Ending Account Value |
Expenses Paid During Period* |
| Actual Performance | 5/1/18 | 10/31/18 | 5/1/18 – 10/31/18 |
| Class A | $1,000.00 | $946.30 | $5.64 |
| Class I | 1,000.00 | 947.90 | 4.42 |
| Hypothetical (5% annual return before expenses) | 5/1/18 | 10/31/18 | 5/1/18 – 10/31/18 |
| Class A | 1,000.00 | 1,019.41 | 5.85 |
| Class I | 1,000.00 | 1,020.67 | 4.59 |
| * | Expenses are equal to the Fund’s annualized expense ratios of 1.15% and 0.90% for Class A and Class I shares, respectively, multiplied by the average account values over the period, multiplied by 184/365 (to reflect the six month period). The expense ratios reflect an expense waiver. Assumes all dividends and distributions were reinvested. |
| EuroPac International Dividend Income Fund | Beginning Account Value |
Ending Account Value |
Expenses Paid During Period* |
| Actual Performance | 5/1/18 | 10/31/18 | 5/1/18 – 10/31/18 |
| Class A | $1,000.00 | $928.00 | $7.29 |
| Class I | 1,000.00 | 929.30 | 6.07 |
| Hypothetical (5% annual return before expenses) | 5/1/18 | 10/31/18 | 5/1/18 – 10/31/18 |
| Class A | 1,000.00 | 1,017.65 | 7.62 |
| Class I | 1,000.00 | 1,018.91 | 6.36 |
| * | Expenses are equal to the Fund’s annualized expense ratios of 1.50% and 1.25% for Class A and Class I shares, respectively, multiplied by the average account value over the period, multiplied by 184/365 (to reflect the six month period). The expense ratios reflect an expense waiver. Assumes all dividends and distributions were reinvested. |
| EP Emerging Markets Small Companies Fund | Beginning Account Value |
Ending Account Value |
Expenses Paid During Period* |
| Actual Performance | 5/1/18 | 10/31/18 | 5/1/18 – 10/31/18 |
| Class A | $1,000.00 | $804.80 | $7.96 |
| Class I | 1,000.00 | 805.90 | 6.83 |
| Hypothetical (5% annual return before expenses) | 5/1/18 | 10/31/18 | 5/1/18 – 10/31/18 |
| Class A | 1,000.00 | 1,016.39 | 8.89 |
| Class I | 1,000.00 | 1,017.65 | 7.63 |
| * | Expenses are equal to the Fund’s annualized expense ratios of 1.75% and 1.50% for Class A and Class I shares, respectively, multiplied by the average account values over the period, multiplied by 184/365 (to reflect the six month period). The expense ratios reflect an expense waiver. Assumes all dividends and distributions were reinvested. |
| 82 |
Euro Pacific Funds
EXPENSE EXAMPLES - Continued
For the Six Months Ended October 31, 2018 (Unaudited)
| EuroPac Gold Fund - Class A | Beginning Account Value |
Ending Account Value |
Expenses Paid During Period* |
| 5/1/18 | 10/31/18 | 5/1/18 – 10/31/18 | |
| Actual Performance | $1,000.00 | $834.30 | $6.94 |
| Hypothetical (5% annual return before expenses) | 1,000.00 | 1,017.64 | 7.64 |
| * | Expenses are equal to the Fund’s annualized expense ratio of 1.50%, multiplied by the average account value over the period, multiplied by 184/365 (to reflect the six month period). The expense ratios reflect an expense waiver. Assumes all dividends and distributions were reinvested. |
| 83 |
This page is intentionally left blank
Euro Pacific Funds
Each a series of Investment Managers Series Trust
Investment Advisor
Euro Pacific Asset Management, LLC
Suite 204, Lots 81-82
Street C
Dorado, Puerto Rico 00646
Sub-Advisor
Champlain Investment Partners
180 Battery Street, Suite 400
Burlington, Vermont 05401
Sub-Advisor
Global Strategic Management
dba Adrian Day Asset Management
801 Compass Way, Suite 207
P.O. Box 6643
Annapolis, Maryland 21401
Independent Registered Public Accounting Firm
Tait, Weller & Baker LLP
50 South 16th Street, Suite 2900
Philadelphia, Pennsylvania 19102
Custodian
UMB Bank, n.a.
928 Grand Boulevard, 5th Floor
Kansas City, Missouri 64106
Fund Co-Administrator
Mutual Fund Administration, LLC
2220 E. Route 66, Suite 226
Glendora, California 91740
Fund Co-Administrator, Transfer Agent and Fund Accountant
UMB Fund Services, Inc.
235 W. Galena Street
Milwaukee, Wisconsin 53212
Distributor
IMST Distributors, LLC
Three Canal Plaza, Suite 100
Portland, Maine 04101
www.foreside.com
FUND INFORMATION
| TICKER | CUSIP | |
| EuroPac International Value Fund – Class A | EPIVX | 461 418 766 |
| EuroPac International Value Fund – Class I | EPVIX | 461 41P 669 |
| EuroPac International Bond Fund – Class A | EPIBX | 461 418 618 |
| EuroPac International Bond Fund – Class I | EPBIX | 461 41P 651 |
| EuroPac International Dividend Income Fund – Class A | EPDPX | 461 41P 487 |
| EuroPac International Dividend Income Fund – Class I | EPDIX | 461 41P 479 |
| EP Emerging Markets Small Companies Fund – Class A | EPASX | 461 418 550 |
| EP Emerging Markets Small Companies Fund – Class I | EPEIX | 461 41P 636 |
| EuroPac Gold Fund – Class A | EPGFX | 461 41P 677 |
| EuroPac Gold Fund – Class I | EPGIX | 461 41Q 196 |
Privacy Principles of the Euro Pacific Funds for Shareholders
The Funds are committed to maintaining the privacy of their shareholders and to safeguarding their non-public personal information. The following information is provided to help you understand what personal information the Funds collect, how we protect that information and why, in certain cases, we may share information with select other parties.
Generally, the Funds do not receive any non-public personal information relating to their shareholders, although certain non-public personal information of their shareholders may become available to the Funds. The Funds do not disclose any non-public personal information about their shareholders or former shareholders to anyone, except as permitted by law or as is necessary in order to service shareholder accounts (for example, to a transfer agent or third party administrator).
This report is sent to shareholders of the Euro Pacific Funds for their information. It is not a Prospectus, circular or representation intended for use in the purchase or sale of shares of the Funds or of any securities mentioned in this report.
Proxy Voting Policies and Procedures
A description of the Funds’ proxy voting policies and procedures related to portfolio securities are available without charge, upon request, by calling the Funds at (888) 558-5851, on the Funds’ website at www.europacificfunds.com or on the U.S. Securities and Exchange Commission’s (“SEC”) website at www.sec.gov.
Proxy Voting Record
Information regarding how the Funds voted proxies for portfolio securities, if applicable, during the most recent 12-month period ended June 30, is also available, without charge and upon request by calling the Funds at (888) 558-5851, or by accessing the Funds’ Form N-PX on the SEC’s website at www.sec.gov.
Form N-Q Disclosure
The Funds file their complete schedules of portfolio holdings with the SEC for the first and third quarters of each fiscal year on Form N-Q. The Funds’ Form N-Q is available on the SEC website at www.sec.gov or by calling the Funds at (888) 558-5851. The Funds’ Form N-Q may also be viewed and copied at the SEC’s Public Reference Room in Washington, DC. Information on the operation of the Public Reference Room may be obtained by calling (800) SEC-0330.
Householding
The Funds will mail only one copy of shareholder documents, including prospectuses, annual and semi-annual reports and proxy statements, to shareholders with multiple accounts at the same address. This practice is commonly called “householding” and is intended to reduce expenses and eliminate duplicate mailings of shareholder documents. Mailings of your shareholder documents may be householded indefinitely unless you instruct us otherwise. If you do not want the mailing of these documents to be combined with those for other members of your household, please call the Funds at (888) 558-5851.
Euro Pacific Funds
P. O. Box 2175
Milwaukee, WI 53201
Toll Free: (888) 558-5851
Item 2. Code of Ethics.
The registrant has adopted a code of ethics that applies to the registrant's principal executive officer and principal financial officer. The registrant has not made any amendments to its code of ethics during the period covered by this report. The registrant has not granted any waivers from any provisions of the code of ethics during the period covered by this report.
The registrant undertakes to provide to any person without charge, upon request, a copy of its code of ethics by mail when they call the registrant at 1-888-558-5851.
Item 3. Audit Committee Financial Expert.
The registrant’s board of trustees has determined that there is at least one audit committee financial expert serving on its audit committee. John P. Zader is the “audit committee financial expert” and is considered to be “independent” as each term is defined in Item 3 of Form N-CSR.
Item 4. Principal Accountant Fees and Services.
The registrant has engaged its principal accountant to perform audit services, audit-related services, tax services and other services during the past two fiscal years. "Audit services" refer to performing an audit of the registrant's annual financial statements or services that are normally provided by the accountant in connection with statutory and regulatory filings or engagements for those fiscal years. "Audit-related services" refer to the assurance and related services by the principal accountant that are reasonably related to the performance of the audit. "Tax services" refer to professional services rendered by the principal accountant for tax compliance, tax advice, and tax planning. There were no "other services" provided by the principal accountant. The following table details the aggregate fees billed or expected to be billed for each of the last two fiscal years for audit fees, audit-related fees, tax fees and other fees by the principal accountant.
| FYE 10/31/2018 | FYE 10/31/2017 | |
| Audit Fees | $77,250 | $74,750 |
| Audit-Related Fees | N/A | N/A |
| Tax Fees | $14,000 | $14,000 |
| All Other Fees | N/A | N/A |
The audit committee has adopted pre-approval policies and procedures that require the audit committee to pre-approve all audit and non-audit services of the registrant, including services provided to any entity affiliated with the registrant.
The percentage of fees billed by Tait, Weller, & Weller LLP applicable to non-audit services pursuant to waiver of pre-approval requirement were as follows:
| FYE 10/31/2018 | FYE 10/31/2017 | |
| Audit-Related Fees | 0% | 0% |
| Tax Fees | 0% | 0% |
| All Other Fees | 0% | 0% |
All of the principal accountant's hours spent on auditing the registrant's financial statements were attributed to work performed by full-time permanent employees of the principal accountant.
The following table indicates the non-audit fees billed or expected to be billed by the registrant's accountant for services to the registrant and to the registrant's investment adviser (and any other controlling entity, etc.—not sub-adviser) for the last two years. The audit committee of the Board of Trustees has considered whether the provision of non-audit services that were rendered to the registrant's investment adviser is compatible with maintaining the principal accountant's independence and has concluded that the provision of such non-audit services by the accountant has not compromised the accountant's independence.
| Non-Audit Related Fees | FYE 10/31/2018 | FYE 10/31/2017 |
| Registrant | N/A | N/A |
| Registrant’s Investment Advisor | N/A | N/A |
Item 5. Audit Committee of Listed Registrants.
| (a) | Not applicable to registrants who are not listed issuers (as defined in Rule 10A-3 under the Securities Exchange Act of 1934). |
| (b) | Not applicable. |
Item 6. Investments.
| (a) | Schedule of Investments is included as part of the report to shareholders filed under Item 1 of this Form. |
| (b) | Not Applicable. |
Item 7. Disclosure of Proxy Voting Policies and Procedures for Closed-End Management Investment Companies.
Not applicable to open-end investment companies.
Item 8. Portfolio Managers of Closed-End Management Investment Companies.
Not applicable to open-end investment companies.
Item 9. Purchases of Equity Securities by Closed-End Management Investment Company and Affiliated Purchasers.
Not applicable.
Item 10. Submission of Matters to a Vote of Security Holders.
The registrant has not made any material changes to the procedures by which shareholders may recommend nominees to the registrant’s Board of Trustees.
Item 11. Controls and Procedures.
| (a) | The Registrant’s President/Chief Executive Officer and Treasurer/Chief Financial Officer have reviewed the Registrant's disclosure controls and procedures (as defined in Rule 30a-3(c) under the Investment Company Act of 1940 (the “Act”)) as of a date within 90 days of the filing of this report, as required by Rule 30a-3(b) under the Act and Rules 13a-15(b) or 15d-15(b) under the Securities Exchange Act of 1934. Based on their review, such officers have concluded that the disclosure controls and procedures are effective in ensuring that information required to be disclosed in this report is appropriately recorded, processed, summarized and reported and made known to them by others within the Registrant and by the Registrant’s service provider. |
| (b) | There were no changes in the Registrant's internal control over financial reporting (as defined in Rule 30a-3(d) under the Act) that occurred during the period covered by this report that has materially affected, or is reasonably likely to materially affect, the Registrant's internal control over financial reporting. |
Item 12. Disclosure of Securities Lending Activities for Closed-End Management Investment Companies.
Not applicable to open-end investment companies.
Item 13. Exhibits.
| (a) | (1) Any code of ethics or amendment thereto, that is subject of the disclosure required by Item 2, to the extent that the registrant intends to satisfy Item 2 requirements through filing an exhibit. Incorporated by reference to the Registrant’s Form N-CSR filed June 8, 2018. |
(2) Certifications pursuant to Section 302 of the Sarbanes-Oxley Act of 2002. Filed herewith.
(3) Any written solicitation to purchase securities under Rule 23c-1 under the Act sent or given during the period covered by the report by or on behalf of the registrant to 10 or more persons. Not applicable to open-end investment companies.
(4) Change in the registrant’s independent public accountant. There was no change in the registrant’s independent public accountant for the period covered by this report.
| (b) | Certification pursuant to Section 906 of the Sarbanes-Oxley Act of 2002. Furnished herewith. |
SIGNATURES
Pursuant to the requirements of the Securities Exchange Act of 1934 and the Investment Company Act of 1940, the registrant has duly caused this report to be signed on its behalf by the undersigned, thereunto duly authorized.
| (Registrant) | Investment Managers Series Trust | |
| By (Signature and Title) | /s/ Maureen Quill | |
| Maureen Quill, President/Chief Executive Officer | ||
| Date | 1/9/2019 |
Pursuant to the requirements of the Securities Exchange Act of 1934 and the Investment Company Act of 1940, this report has been signed below by the following persons on behalf of the registrant and in the capacities and on the dates indicated.
| By (Signature and Title) | /s/ Maureen Quill | |
| Maureen Quill, President/Chief Executive Officer | ||
| Date | 1/9/2019 | |
| By (Signature and Title) | /s/ Rita Dam | |
| Rita Dam, Treasurer/Chief Financial Officer | ||
| Date | 1/9/2019 |
EX.99.CERT302
CERTIFICATIONS
I, Maureen Quill, certify that:
| 1. | I have reviewed this report on Form N-CSR of EuroPac International Value Fund, EuroPac International Bond Fund, EuroPac International Dividend Income Fund, EP Emerging Markets Small Companies Fund, and EuroPac Gold Fund each a series of Investment Managers Series Trust (the “Trust”); |
| 2. | Based on my knowledge, this report does not contain any untrue statement of a material fact or omit to state a material fact necessary to make the statements made, in light of the circumstances under which such statements were made, not misleading with respect to the period covered by this report; |
| 3. | Based on my knowledge, the financial statements, and other financial information included in this report, fairly present in all material respects the financial condition, results of operations, changes in net assets, and cash flows (if the financial statements are required to include a statement of cash flows) of the registrant as of, and for, the periods presented in this report; |
| 4. | The registrant's other certifying officer(s) and I are responsible for establishing and maintaining disclosure controls and procedures (as defined in Rule 30a-3(c) under the Investment Company Act of 1940) and internal control over financial reporting (as defined in Rule 30a-3(d) under the Investment Company Act of 1940) for the registrant and have: |
| (a) | Designed such disclosure controls and procedures, or caused such disclosure controls and procedures to be designed under our supervision, to ensure that material information relating to the registrant, including its consolidated subsidiaries, is made known to us by others within those entities, particularly during the period in which this report is being prepared; |
| (b) | Designed such internal control over financial reporting, or caused such internal control over financial reporting to be designed under our supervision, to provide reasonable assurance regarding the reliability of financial reporting and the preparation of financial statements for external purposes in accordance with generally accepted accounting principles; |
| (c) | Evaluated the effectiveness of the registrant's disclosure controls and procedures and presented in this report our conclusions about the effectiveness of the disclosure controls and procedures, as of a date within 90 days prior to the filing date of this report based on such evaluation; and |
| (d) | Disclosed in this report any change in the registrant’s internal control over financial reporting that occurred during the second fiscal quarter of the period covered by this report that has materially affected, or is reasonably likely to materially affect, the registrant’s internal control over financial reporting; and |
| 5. | The registrant's other certifying officer(s) and I have disclosed to the registrant's auditors and the audit committee of the registrant's board of directors (or persons performing the equivalent functions): |
| (a) | All significant deficiencies and material weaknesses in the design or operation of internal control over financial reporting which are reasonably likely to adversely affect the registrant's ability to record, process, summarize, and report financial information; and |
| (b) | Any fraud, whether or not material, that involves management or other employees who have a significant role in the registrant's internal control over financial reporting. |
| Date: | 1/9/2019 | /s/ Maureen Quill | ||
| Maureen Quill | ||||
| President/Chief Executive Officer |
CERTIFICATIONS
I, Rita Dam, certify that:
| 1. | I have reviewed this report on Form N-CSR of EuroPac International Value Fund, EuroPac International Bond Fund, EuroPac International Dividend Income Fund, EP Emerging Markets Small Companies Fund, and EuroPac Gold Fund each a series of Investment Managers Series Trust (the “Trust”); |
| 2. | Based on my knowledge, this report does not contain any untrue statement of a material fact or omit to state a material fact necessary to make the statements made, in light of the circumstances under which such statements were made, not misleading with respect to the period covered by this report; |
| 3. | Based on my knowledge, the financial statements, and other financial information included in this report, fairly present in all material respects the financial condition, results of operations, changes in net assets, and cash flows (if the financial statements are required to include a statement of cash flows) of the registrant as of, and for, the periods presented in this report; |
| 4. | The registrant's other certifying officer(s) and I are responsible for establishing and maintaining disclosure controls and procedures (as defined in Rule 30a-3(c) under the Investment Company Act of 1940) and internal control over financial reporting (as defined in Rule 30a-3(d) under the Investment Company Act of 1940) for the registrant and have: |
| (a) | Designed such disclosure controls and procedures, or caused such disclosure controls and procedures to be designed under our supervision, to ensure that material information relating to the registrant, including its consolidated subsidiaries, is made known to us by others within those entities, particularly during the period in which this report is being prepared; |
| (b) | Designed such internal control over financial reporting, or caused such internal control over financial reporting to be designed under our supervision, to provide reasonable assurance regarding the reliability of financial reporting and the preparation of financial statements for external purposes in accordance with generally accepted accounting principles; |
| (c) | Evaluated the effectiveness of the registrant's disclosure controls and procedures and presented in this report our conclusions about the effectiveness of the disclosure controls and procedures, as of a date within 90 days prior to the filing date of this report based on such evaluation; and |
| (d) | Disclosed in this report any change in the registrant’s internal control over financial reporting that occurred during the second fiscal quarter of the period covered by this report that has materially affected, or is reasonably likely to materially affect, the registrant’s internal control over financial reporting; and |
| 5. | The registrant's other certifying officer(s) and I have disclosed to the registrant's auditors and the audit committee of the registrant's board of directors (or persons performing the equivalent functions): |
| (a) | All significant deficiencies and material weaknesses in the design or operation of internal control over financial reporting which are reasonably likely to adversely affect the registrant's ability to record, process, summarize, and report financial information; and |
| (b) | Any fraud, whether or not material, that involves management or other employees who have a significant role in the registrant's internal control over financial reporting. |
| Date: | 1/9/2019 | /s/ Rita Dam | ||
| Rita Dam | ||||
| Treasurer/Chief Financial Officer |
EX.99.906CERT
Certification of CEO and CFO Pursuant to
18 U.S.C. Section 1350,
as Adopted Pursuant to
Section 906 of the Sarbanes-Oxley Act of 2002
In connection with the report on Form N-CSR of EuroPac International Value Fund, EuroPac International Bond Fund, EuroPac International Dividend Income Fund, EP Emerging Markets Small Companies Fund, and EuroPac Gold Fund each a series of Investment Managers Series Trust (the “Trust”), for the fiscal year ended October 31, 2018 (the “Report”), Maureen Quill, as President/Chief Executive Officer of the Trust, and Rita Dam, as Treasurer/Chief Financial Officer of the Trust, each hereby certifies, pursuant to 18 U.S.C. Section 1350, as adopted pursuant to Section 906 of the Sarbanes-Oxley Act of 2002, that, to the best of his or her knowledge:
| (1) | the Report fully complies with the requirements of Section 13 (a) or 15 (d) of the Securities Exchange Act of 1934; and |
| (2) | the information contained in the Report fairly presents, in all material respects, the financial condition and results of operations of the Company. |
| Date | 1/9/2019 |
| /s/ Maureen Quill | |
| Maureen Quill | |
| President/Chief Executive Officer | |
| /s/ Rita Dam | |
| Rita Dam | |
| Treasurer/Chief Financial Officer |
This statement accompanies this report on Form N-CSR pursuant to Section 906 of the Sarbanes-Oxley Act of 2002 and shall not be deemed as filed by Investment Managers Series Trust for purposes of Section 18 of the Securities Exchange Act of 1934.
Serious News for Serious Traders! Try StreetInsider.com Premium Free!
You May Also Be Interested In
- Director/PDMR Shareholding
- Maalexi Closes $2.8 Million Round Led by Tawuniya to Accelerate the World's First Regulated Agricultural Exchange
- Americas Cardroom Sponsors High Times' Kicking Back World Cup Docuseries
Create E-mail Alert Related Categories
SEC FilingsSign up for StreetInsider Free!
Receive full access to all new and archived articles, unlimited portfolio tracking, e-mail alerts, custom newswires and RSS feeds - and more!