

Form N-CSR Fidelity Rutland Square For: May 31
 Tweet
Tweet Share
ShareUNITED STATES
SECURITIES AND EXCHANGE COMMISSION
Washington, D.C. 20549
FORM N-CSR
CERTIFIED SHAREHOLDER REPORT OF REGISTERED
MANAGEMENT INVESTMENT COMPANIES
Investment Company Act file number 811-21991
Fidelity Rutland Square Trust II
(Exact name of registrant as specified in charter)
245 Summer St., Boston, Massachusetts 02210
(Address of principal executive offices) (Zip code)
John Hitt, Secretary
245 Summer St.
Boston, Massachusetts 02210
(Name and address of agent for service)
Registrant's telephone number, including area code:
617-563-7000
Date of fiscal year end: | May 31 |
|
|
Date of reporting period: | May 31, 2019 |
Item 1.
Reports to Stockholders
|
Strategic Advisers® Value Fund Offered exclusively to certain clients of Strategic Advisers LLC - not available for sale to the general public Annual Report May 31, 2019 |
 |
Beginning on January 1, 2021, as permitted by regulations adopted by the Securities and Exchange Commission, paper copies of a fund’s shareholder reports will no longer be sent by mail, unless you specifically request paper copies of the reports from the fund or from your financial intermediary, such as a financial advisor, broker-dealer or bank. Instead, the reports will be made available on a website, and you will be notified by mail each time a report is posted and provided with a website link to access the report.
If you already elected to receive shareholder reports electronically, you will not be affected by this change and you need not take any action. You may elect to receive shareholder reports and other communications from a fund electronically, by contacting your financial intermediary. For Fidelity customers, visit Fidelity's web site or call Fidelity using the contact information listed below.
You may elect to receive all future reports in paper free of charge. If you wish to continue receiving paper copies of your shareholder reports, you may contact your financial intermediary or, if you are a Fidelity customer, visit Fidelity’s website, or call Fidelity at the applicable toll-free number listed below. Your election to receive reports in paper will apply to all funds held with the fund complex/your financial intermediary.
| Account Type | Website | Phone Number |
| Brokerage, Mutual Fund, or Annuity Contracts: | fidelity.com/mailpreferences | 1-800-343-3548 |
| Employer Provided Retirement Accounts: | netbenefits.fidelity.com/preferences (choose 'no' under Required Disclosures to continue to print) | 1-800-343-0860 |
| Advisor Sold Accounts Serviced Through Your Financial Intermediary: | Contact Your Financial Intermediary | Your Financial Intermediary's phone number |
| Advisor Sold Accounts Serviced by Fidelity: | institutional.fidelity.com | 1-877-208-0098 |
Contents
To view a fund's proxy voting record for the 12-month period ended June 30, visit http://www.fidelity.com/proxyvotingresults or visit the Securities and Exchange Commission's (SEC) web site at http://www.sec.gov.
You may also call 1-800-544-3455 to request a free copy of the proxy voting guidelines.
Standard & Poor's, S&P and S&P 500 are registered service marks of The McGraw-Hill Companies, Inc. and have been licensed for use by Fidelity Distributors Corporation.
Other third-party marks appearing herein are the property of their respective owners.
All other marks appearing herein are registered or unregistered trademarks or service marks of FMR LLC or an affiliated company. © 2019 FMR LLC. All rights reserved.
This report and the financial statements contained herein are submitted for the general information of the shareholders of the Fund. This report is not authorized for distribution to prospective investors in the Fund unless preceded or accompanied by an effective prospectus.
A fund files its complete schedule of portfolio holdings with the SEC for the first and third quarters of each fiscal year on Form N-PORT. Forms N-PORT are available on the SEC’s web site at http://www.sec.gov. A fund's Forms N-PORT may be reviewed and copied at the SEC’s Public Reference Room in Washington, DC. Information regarding the operation of the SEC's Public Reference Room may be obtained by calling 1-800-SEC-0330.
For a complete list of a fund's portfolio holdings, view the most recent holdings listing, semiannual report, or annual report on Fidelity's web site at http://www.fidelity.com, http://www.institutional.fidelity.com, or http://www.401k.com, as applicable.
NOT FDIC INSURED •MAY LOSE VALUE •NO BANK GUARANTEE
Neither the Fund nor Fidelity Distributors Corporation is a bank.
Performance: The Bottom Line
Average annual total return reflects the change in the value of an investment, assuming reinvestment of distributions from dividend income and capital gains (the profits earned upon the sale of securities that have grown in value, if any) and assuming a constant rate of performance each year. The hypothetical investment and the average annual total returns do not reflect the deduction of taxes that a shareholder would pay on fund distributions or the redemption of fund shares. During periods of reimbursement by Fidelity, a fund’s total return will be greater than it would be had the reimbursement not occurred. How a fund did yesterday is no guarantee of how it will do tomorrow.
Average Annual Total Returns
| For the periods ended May 31, 2019 | Past 1 year | Past 5 years | Past 10 years |
| Strategic Advisers® Value Fund | (2.53)% | 6.65% | 11.55% |
$10,000 Over Life of Fund
Let's say hypothetically that $10,000 was invested in Strategic Advisers® Value Fund on December 30, 2008, when the fund started.
The chart shows how the value of your investment would have changed, and also shows how the Russell 1000® Value Index performed over the same period.
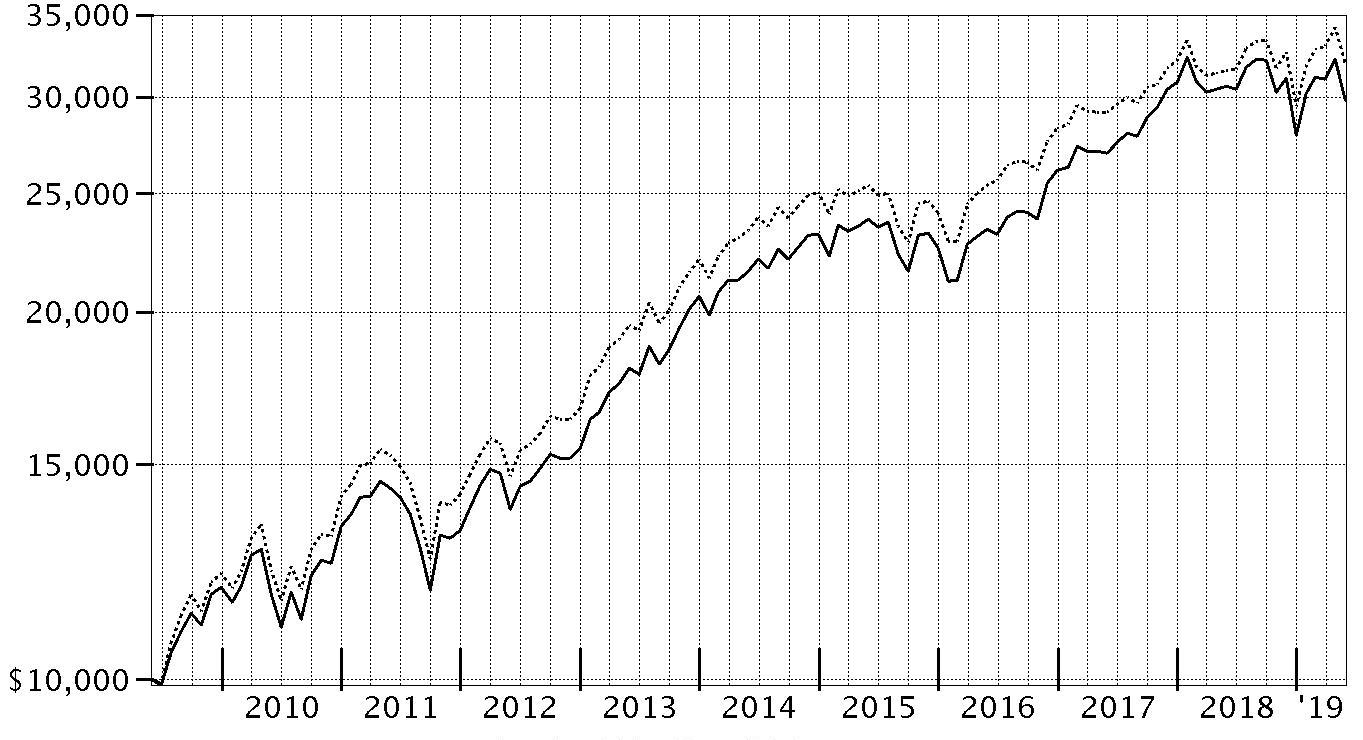
| Period Ending Values | ||
|
| $29,825 | Strategic Advisers® Value Fund |
|
| $31,979 | Russell 1000® Value Index |
Management's Discussion of Fund Performance
Market Recap: The U.S. equity bellwether S&P 500® index gained 0.74% for the six months ending May 31, 2019, as U.S. stocks began the year on a high note after a volatile final month of 2018. Upbeat company earnings/outlooks and signs the U.S. Federal Reserve may pause on rates boosted the index to an all-time high on April 30. In May, volatility spiked and stocks returned -6.35% for the month amid the Fed’s decision to hold interest rates steady and signal that it had little appetite to adjust them any time soon, as well as retaliatory tariffs imposed on the U.S. by China. The downtrend was similar to December 2018, when the index returned -9.03% because many investors fled from risk assets as they were still dealing with economic jitters, lingering uncertainty related to global trade and another rate hike. For the full six months, growth stocks had a comfortable lead over value, while large-caps soundly bested small-caps. By sector, seven of 11 categories registered a gain. Real estate rose roughly 10% to lead the way, followed by information technology and utilities (each +7%). Communication services – a newly reconstituted mix of telecommunications stocks and higher-growth media names – gained 6% and consumer discretionary advanced about 4%. Industrials and consumer staples each finished at roughly breakeven. In contrast, the energy (-10%) and health care (-7%) sectors stood out as notable laggards, while financials (-3%) and materials (-2%) also lost ground and trailed the broader market. Comments from Lead Portfolio Manager John Stone: For the year, the Fund returned -2.53%, trailing the 1.45% gain of the benchmark Russell 1000® Value Index. At the total Fund level, the portfolio had underweighted exposure to market sectors considered to be more defensive, due to the elevated valuations of these groups. This positioning worked against relative performance because investors flocked to the lower comparative volatility of these stocks amid market turbulence in October and November. Substantial exposure to quantitative strategies, which struggled during periods of market volatility, also weighed on performance versus the benchmark. Sub-adviser LSV Asset Management was the biggest relative detractor, as its quantitative deep-value approach emphasizing cyclical stocks trading at relatively cheap valuations materially underperformed the Fund's benchmark. Sub-adviser Brandywine Global Investment Management also hampered relative performance, partly due to underweighted exposure to more-defensive industry groups. On the plus side, Invesco Diversified Dividend Fund added the most value among active managers, as its defensive, income-oriented strategy was generally in the market’s sweet spot this period. As of May 31, we continued to reduce economically sensitive risk in the portfolio – a process we began in the prior reporting period.The views expressed above reflect those of the portfolio manager(s) only through the end of the period as stated on the cover of this report and do not necessarily represent the views of Fidelity or any other person in the Fidelity organization. Any such views are subject to change at any time based upon market or other conditions and Fidelity disclaims any responsibility to update such views. These views may not be relied on as investment advice and, because investment decisions for a Fidelity fund are based on numerous factors, may not be relied on as an indication of trading intent on behalf of any Fidelity fund.
Investment Summary (Unaudited)
The information in the following tables is based on the direct investments of the Fund.Top Ten Holdings as of May 31, 2019
(excluding cash equivalents)
| % of fund's net assets | |
| Invesco Diversified Dividend Fund - Class A | 5.1 |
| Fidelity SAI U.S. Low Volatility Index Fund | 3.9 |
| JPMorgan Chase & Co. | 2.6 |
| Pfizer, Inc. | 2.3 |
| Bank of America Corp. | 2.3 |
| Johnson & Johnson | 2.3 |
| Verizon Communications, Inc. | 2.0 |
| Fidelity SAI U.S. Large Cap Index Fund | 1.8 |
| Cisco Systems, Inc. | 1.8 |
| Citigroup, Inc. | 1.8 |
| 25.9 |
Top Five Market Sectors as of May 31, 2019
(stocks only)
| % of fund's net assets | |
| Financials | 24.4 |
| Health Care | 12.1 |
| Information Technology | 11.7 |
| Industrials | 9.2 |
| Energy | 6.9 |
Asset Allocation (% of fund's net assets)
| As of May 31, 2019* | ||
| Common Stocks | 87.5% | |
| Large Blend Funds | 5.7% | |
| Large Value Funds | 5.5% | |
| Short-Term Investments and Net Other Assets (Liabilities) | 1.3% | |

* Assets allocations of funds in the pie chart reflect the categorizations of assets as defined by Morningstar as of the reporting date indicated above.
Schedule of Investments May 31, 2019
Showing Percentage of Net Assets
| Common Stocks - 87.5% | |||
| Shares | Value | ||
| COMMUNICATION SERVICES - 4.8% | |||
| Diversified Telecommunication Services - 2.5% | |||
| AT&T, Inc. | 1,658,000 | $50,701,640 | |
| Verizon Communications, Inc. | 3,476,650 | 188,955,928 | |
| 239,657,568 | |||
| Entertainment - 0.1% | |||
| Cinemark Holdings, Inc. | 27,849 | 1,057,984 | |
| Viacom, Inc. Class B (non-vtg.) | 427,096 | 12,398,597 | |
| 13,456,581 | |||
| Interactive Media & Services - 0.3% | |||
| Alphabet, Inc. Class A (a) | 12,828 | 14,194,182 | |
| Twitter, Inc. (a) | 290,000 | 10,567,600 | |
| 24,761,782 | |||
| Media - 1.9% | |||
| Altice U.S.A., Inc. Class A | 112,627 | 2,645,608 | |
| CBS Corp. Class B | 215,136 | 10,386,766 | |
| Charter Communications, Inc. Class A (a) | 26,446 | 9,964,853 | |
| Comcast Corp. Class A | 2,226,934 | 91,304,294 | |
| DISH Network Corp. Class A (a) | 713,052 | 25,748,308 | |
| Entercom Communications Corp. Class A | 508,121 | 2,942,021 | |
| Fox Corp. Class A | 158,829 | 5,595,546 | |
| Gannett Co., Inc. | 247,600 | 1,946,136 | |
| Interpublic Group of Companies, Inc. | 153,170 | 3,250,267 | |
| Liberty Global PLC Class C (a) | 230,283 | 5,582,060 | |
| Nexstar Broadcasting Group, Inc. Class A | 49,112 | 4,918,567 | |
| Omnicom Group, Inc. | 83,019 | 6,422,350 | |
| Tegna, Inc. | 402,400 | 6,092,336 | |
| 176,799,112 | |||
| TOTAL COMMUNICATION SERVICES | 454,675,043 | ||
| CONSUMER DISCRETIONARY - 6.3% | |||
| Auto Components - 0.6% | |||
| Aptiv PLC | 100,329 | 6,425,069 | |
| BorgWarner, Inc. | 390,216 | 13,844,864 | |
| Cooper Tire & Rubber Co. | 265,127 | 7,312,203 | |
| Gentex Corp. | 109,367 | 2,336,079 | |
| Lear Corp. | 179,600 | 21,377,788 | |
| The Goodyear Tire & Rubber Co. | 685,300 | 9,189,873 | |
| 60,485,876 | |||
| Automobiles - 1.0% | |||
| Ford Motor Co. | 3,514,036 | 33,453,623 | |
| General Motors Co. | 1,344,824 | 44,836,432 | |
| Harley-Davidson, Inc. | 459,062 | 15,020,509 | |
| Thor Industries, Inc. | 82,400 | 4,255,136 | |
| 97,565,700 | |||
| Distributors - 0.1% | |||
| Genuine Parts Co. | 73,699 | 7,288,831 | |
| Diversified Consumer Services - 0.0% | |||
| H&R Block, Inc. | 76,609 | 2,010,986 | |
| Hotels, Restaurants & Leisure - 1.0% | |||
| Brinker International, Inc. (b) | 306,859 | 11,528,693 | |
| Carnival Corp. | 212,740 | 10,890,161 | |
| Hilton Worldwide Holdings, Inc. | 48,403 | 4,329,164 | |
| Hyatt Hotels Corp. Class A | 14,479 | 1,045,963 | |
| Las Vegas Sands Corp. | 226,816 | 12,474,880 | |
| Norwegian Cruise Line Holdings Ltd. (a) | 85,391 | 4,671,742 | |
| Royal Caribbean Cruises Ltd. | 248,304 | 30,233,495 | |
| U.S. Foods Holding Corp. (a) | 37,439 | 1,293,892 | |
| Wyndham Destinations, Inc. | 317,577 | 12,633,213 | |
| Wyndham Hotels & Resorts, Inc. | 103,244 | 5,507,035 | |
| 94,608,238 | |||
| Household Durables - 0.9% | |||
| D.R. Horton, Inc. | 140,679 | 6,015,434 | |
| Leggett & Platt, Inc. | 48,747 | 1,731,006 | |
| Lennar Corp.: | |||
| Class A | 332,544 | 16,514,135 | |
| Class B | 6,200 | 244,962 | |
| NVR, Inc. (a) | 1,392 | 4,456,585 | |
| PulteGroup, Inc. | 612,607 | 18,990,817 | |
| Sony Corp. sponsored ADR | 243,000 | 11,664,000 | |
| Toll Brothers, Inc. | 113,820 | 3,957,521 | |
| Whirlpool Corp. | 190,422 | 21,875,679 | |
| 85,450,139 | |||
| Internet & Direct Marketing Retail - 0.2% | |||
| eBay, Inc. | 67,217 | 2,415,107 | |
| Expedia, Inc. | 36,757 | 4,227,055 | |
| The Booking Holdings, Inc. (a) | 5,041 | 8,349,005 | |
| 14,991,167 | |||
| Leisure Products - 0.0% | |||
| Polaris Industries, Inc. | 23,000 | 1,837,240 | |
| Multiline Retail - 1.0% | |||
| Big Lots, Inc. | 160,800 | 4,438,080 | |
| Dillard's, Inc. Class A (b) | 109,300 | 6,192,938 | |
| Kohl's Corp. | 484,068 | 23,874,234 | |
| Macy's, Inc. | 348,100 | 7,160,417 | |
| Nordstrom, Inc. (b) | 162,230 | 5,077,799 | |
| Target Corp. | 609,020 | 48,995,659 | |
| 95,739,127 | |||
| Specialty Retail - 1.4% | |||
| American Eagle Outfitters, Inc. | 477,400 | 8,306,760 | |
| AutoZone, Inc. (a) | 29,117 | 29,906,362 | |
| Best Buy Co., Inc. | 477,610 | 29,931,819 | |
| CarMax, Inc. (a) | 72,111 | 5,644,849 | |
| Dick's Sporting Goods, Inc. | 233,200 | 8,047,732 | |
| Foot Locker, Inc. | 40,497 | 1,593,557 | |
| Gap, Inc. | 154,921 | 2,893,924 | |
| L Brands, Inc. | 103,700 | 2,329,102 | |
| Lowe's Companies, Inc. | 80,794 | 7,536,464 | |
| Murphy U.S.A., Inc. (a) | 36,694 | 2,945,060 | |
| Office Depot, Inc. | 579,800 | 1,136,408 | |
| Penske Automotive Group, Inc. | 203,300 | 8,684,976 | |
| The Home Depot, Inc. | 89,923 | 17,071,882 | |
| Tiffany & Co., Inc. | 48,413 | 4,314,082 | |
| 130,342,977 | |||
| Textiles, Apparel & Luxury Goods - 0.1% | |||
| Columbia Sportswear Co. | 32,732 | 3,069,607 | |
| Hanesbrands, Inc. | 118,311 | 1,756,918 | |
| Ralph Lauren Corp. | 19,708 | 2,071,902 | |
| 6,898,427 | |||
| TOTAL CONSUMER DISCRETIONARY | 597,218,708 | ||
| CONSUMER STAPLES - 4.5% | |||
| Beverages - 0.5% | |||
| Coca-Cola European Partners PLC | 82,223 | 4,555,154 | |
| Keurig Dr. Pepper, Inc. | 110,819 | 3,123,988 | |
| Molson Coors Brewing Co. Class B | 421,471 | 23,172,476 | |
| The Coca-Cola Co. | 290,000 | 14,247,700 | |
| 45,099,318 | |||
| Food & Staples Retailing - 1.1% | |||
| Kroger Co. | 1,565,992 | 35,720,278 | |
| Walgreens Boots Alliance, Inc. | 1,350,763 | 66,646,646 | |
| 102,366,924 | |||
| Food Products - 1.6% | |||
| Archer Daniels Midland Co. | 222,700 | 8,533,864 | |
| Campbell Soup Co. | 111,840 | 4,060,910 | |
| Ingredion, Inc. | 199,055 | 15,160,029 | |
| Kellogg Co. | 127,759 | 6,715,013 | |
| Mondelez International, Inc. | 228,162 | 11,602,038 | |
| Pilgrim's Pride Corp. (a) | 423,300 | 10,823,781 | |
| Post Holdings, Inc. (a) | 57,895 | 6,084,765 | |
| The J.M. Smucker Co. | 286,745 | 34,856,722 | |
| Tyson Foods, Inc. Class A | 667,923 | 50,688,676 | |
| 148,525,798 | |||
| Household Products - 0.4% | |||
| Clorox Co. | 13,858 | 2,062,209 | |
| Energizer Holdings, Inc. | 98,965 | 4,049,648 | |
| Procter & Gamble Co. | 278,000 | 28,608,980 | |
| 34,720,837 | |||
| Personal Products - 0.1% | |||
| Coty, Inc. Class A | 188,611 | 2,327,460 | |
| Unilever NV (NY Reg.) | 207,000 | 12,444,840 | |
| 14,772,300 | |||
| Tobacco - 0.8% | |||
| Altria Group, Inc. | 705,222 | 34,598,191 | |
| Philip Morris International, Inc. | 586,449 | 45,232,811 | |
| 79,831,002 | |||
| TOTAL CONSUMER STAPLES | 425,316,179 | ||
| ENERGY - 6.9% | |||
| Energy Equipment & Services - 0.1% | |||
| Halliburton Co. | 310,000 | 6,599,900 | |
| Helmerich & Payne, Inc. | 43,340 | 2,119,759 | |
| 8,719,659 | |||
| Oil, Gas & Consumable Fuels - 6.8% | |||
| Cabot Oil & Gas Corp. | 159,500 | 3,990,690 | |
| Canadian Natural Resources Ltd. | 206,947 | 5,590,141 | |
| Chevron Corp. | 1,461,716 | 166,416,367 | |
| Cimarex Energy Co. | 80,644 | 4,612,030 | |
| ConocoPhillips Co. | 1,143,408 | 67,415,336 | |
| Diamondback Energy, Inc. | 40,569 | 3,978,196 | |
| Encana Corp. | 7,647 | 40,300 | |
| EQT Corp. | 128,008 | 2,342,546 | |
| Equitrans Midstream Corp. | 111,251 | 2,209,445 | |
| Exxon Mobil Corp. | 2,246,552 | 158,988,485 | |
| Gulfport Energy Corp. (a) | 1,106,553 | 6,052,845 | |
| Hess Corp. | 125,597 | 7,015,848 | |
| Kinder Morgan, Inc. | 1,145,645 | 22,855,618 | |
| Marathon Petroleum Corp. | 404,356 | 18,596,332 | |
| Murphy Oil Corp. | 55,791 | 1,386,406 | |
| Noble Energy, Inc. | 408,758 | 8,747,421 | |
| Occidental Petroleum Corp. | 72,738 | 3,620,170 | |
| PBF Energy, Inc. Class A | 460,944 | 12,168,922 | |
| Phillips 66 Co. | 717,545 | 57,977,636 | |
| Pioneer Natural Resources Co. | 98,066 | 13,921,449 | |
| Royal Dutch Shell PLC Class A sponsored ADR | 264,583 | 16,353,875 | |
| The Williams Companies, Inc. | 249,805 | 6,589,856 | |
| Valero Energy Corp. | 664,755 | 46,798,752 | |
| 637,668,666 | |||
| TOTAL ENERGY | 646,388,325 | ||
| FINANCIALS - 24.4% | |||
| Banks - 12.2% | |||
| Banco Bilbao Vizcaya Argentaria SA sponsored ADR (b) | 1,627,000 | 8,834,610 | |
| Bank of America Corp. | 8,224,151 | 218,762,417 | |
| BB&T Corp. | 780,576 | 36,491,928 | |
| BOK Financial Corp. | 94,000 | 7,043,420 | |
| CIT Group, Inc. | 303,208 | 14,414,508 | |
| Citigroup, Inc. | 2,691,915 | 167,302,517 | |
| Citizens Financial Group, Inc. | 407,302 | 13,269,899 | |
| Comerica, Inc. | 58,741 | 4,042,556 | |
| Commerce Bancshares, Inc. | 154,924 | 8,881,793 | |
| Cullen/Frost Bankers, Inc. | 105,268 | 9,607,810 | |
| East West Bancorp, Inc. | 189,000 | 8,074,080 | |
| Fifth Third Bancorp | 855,662 | 22,675,043 | |
| First Republic Bank | 36,519 | 3,543,073 | |
| Huntington Bancshares, Inc. | 427,045 | 5,402,119 | |
| JPMorgan Chase & Co. | 2,291,614 | 242,819,419 | |
| KeyCorp | 1,180,326 | 18,849,806 | |
| M&T Bank Corp. | 127,731 | 20,385,868 | |
| Mitsubishi UFJ Financial Group, Inc. sponsored ADR | 1,340,000 | 6,150,600 | |
| PNC Financial Services Group, Inc. | 427,322 | 54,380,998 | |
| Popular, Inc. | 36,455 | 1,903,316 | |
| Prosperity Bancshares, Inc. | 27,755 | 1,798,802 | |
| Regions Financial Corp. | 2,625,560 | 36,311,495 | |
| Signature Bank | 18,165 | 2,080,801 | |
| SunTrust Banks, Inc. | 982,932 | 58,985,749 | |
| U.S. Bancorp | 802,877 | 40,304,425 | |
| Webster Financial Corp. | 36,700 | 1,625,076 | |
| Wells Fargo & Co. | 3,030,299 | 134,454,367 | |
| Zions Bancorp NA | 78,661 | 3,387,929 | |
| 1,151,784,424 | |||
| Capital Markets - 3.3% | |||
| Ameriprise Financial, Inc. | 453,573 | 62,697,396 | |
| Bank of New York Mellon Corp. | 403,625 | 17,230,751 | |
| BlackRock, Inc. Class A | 58,277 | 24,217,590 | |
| Charles Schwab Corp. | 657,293 | 27,349,962 | |
| E*TRADE Financial Corp. | 102,910 | 4,610,368 | |
| Franklin Resources, Inc. | 191,315 | 6,087,643 | |
| Goldman Sachs Group, Inc. | 206,825 | 37,743,494 | |
| Invesco Ltd. | 149,366 | 2,918,612 | |
| LPL Financial | 31,335 | 2,513,694 | |
| Morgan Stanley | 1,510,632 | 61,467,616 | |
| Northern Trust Corp. | 131,951 | 11,284,450 | |
| Raymond James Financial, Inc. | 52,922 | 4,370,299 | |
| SEI Investments Co. | 57,452 | 2,886,963 | |
| State Street Corp. | 148,200 | 8,188,050 | |
| T. Rowe Price Group, Inc. | 179,261 | 18,130,458 | |
| TD Ameritrade Holding Corp. | 208,744 | 10,385,014 | |
| The NASDAQ OMX Group, Inc. | 51,548 | 4,672,311 | |
| 306,754,671 | |||
| Consumer Finance - 2.1% | |||
| Ally Financial, Inc. | 172,903 | 4,991,710 | |
| American Express Co. | 456,258 | 52,337,355 | |
| Capital One Financial Corp. | 773,751 | 66,441,998 | |
| Credit Acceptance Corp. (a) | 7,087 | 3,234,436 | |
| Discover Financial Services | 630,606 | 47,011,677 | |
| Navient Corp. | 530,400 | 6,916,416 | |
| Nelnet, Inc. Class A | 56,400 | 3,341,700 | |
| Santander Consumer U.S.A. Holdings, Inc. | 143,393 | 3,210,569 | |
| Synchrony Financial | 259,794 | 8,736,872 | |
| 196,222,733 | |||
| Diversified Financial Services - 0.4% | |||
| Berkshire Hathaway, Inc. Class B (a) | 173,683 | 34,288,498 | |
| Jefferies Financial Group, Inc. | 141,918 | 2,507,691 | |
| Voya Financial, Inc. | 69,807 | 3,555,271 | |
| 40,351,460 | |||
| Insurance - 6.1% | |||
| AFLAC, Inc. | 659,295 | 33,821,834 | |
| Alleghany Corp. (a) | 10,420 | 6,911,586 | |
| Allstate Corp. | 647,741 | 61,865,743 | |
| American Financial Group, Inc. | 166,408 | 16,341,266 | |
| American International Group, Inc. | 836,343 | 42,712,037 | |
| Aon PLC | 50,662 | 9,122,706 | |
| Arch Capital Group Ltd. (a) | 60,050 | 2,067,522 | |
| Athene Holding Ltd. (a) | 60,977 | 2,478,715 | |
| Chubb Ltd. | 403,432 | 58,929,312 | |
| Cincinnati Financial Corp. | 65,288 | 6,413,893 | |
| Everest Re Group Ltd. | 90,655 | 22,451,617 | |
| Fairfax Financial Holdings Ltd. | 7,214 | 3,302,784 | |
| FNF Group | 93,137 | 3,590,431 | |
| Genworth Financial, Inc. Class A | 341,100 | 992,601 | |
| Hartford Financial Services Group, Inc. | 620,408 | 32,670,685 | |
| Lincoln National Corp. | 618,949 | 36,796,518 | |
| Loews Corp. | 394,755 | 20,274,617 | |
| Markel Corp. (a) | 5,562 | 5,889,435 | |
| Marsh & McLennan Companies, Inc. | 64,272 | 6,144,403 | |
| MetLife, Inc. | 937,716 | 43,331,856 | |
| Principal Financial Group, Inc. | 104,960 | 5,412,787 | |
| Progressive Corp. | 191,255 | 15,162,696 | |
| Prudential Financial, Inc. | 516,591 | 47,722,677 | |
| Reinsurance Group of America, Inc. | 26,187 | 3,877,247 | |
| The Travelers Companies, Inc. | 371,607 | 54,094,831 | |
| Torchmark Corp. | 111,582 | 9,541,377 | |
| Unum Group | 462,870 | 14,575,776 | |
| W.R. Berkley Corp. | 72,615 | 4,516,653 | |
| 571,013,605 | |||
| Mortgage Real Estate Investment Trusts - 0.1% | |||
| Annaly Capital Management, Inc. | 1,622,800 | 14,296,868 | |
| Thrifts & Mortgage Finance - 0.2% | |||
| New York Community Bancorp, Inc. | 131,498 | 1,305,775 | |
| Radian Group, Inc. | 745,800 | 16,743,210 | |
| 18,048,985 | |||
| TOTAL FINANCIALS | 2,298,472,746 | ||
| HEALTH CARE - 12.1% | |||
| Biotechnology - 2.8% | |||
| AbbVie, Inc. | 961,152 | 73,729,970 | |
| Amgen, Inc. | 615,256 | 102,563,175 | |
| Biogen, Inc. (a) | 86,828 | 19,040,512 | |
| Celgene Corp. (a) | 166,723 | 15,636,950 | |
| Gilead Sciences, Inc. | 823,768 | 51,279,558 | |
| 262,250,165 | |||
| Health Care Equipment & Supplies - 0.7% | |||
| Alcon, Inc. (a)(b) | 178,000 | 10,356,040 | |
| Danaher Corp. | 142,000 | 18,745,420 | |
| Medtronic PLC | 370,055 | 34,259,692 | |
| Zimmer Biomet Holdings, Inc. | 50,013 | 5,697,981 | |
| 69,059,133 | |||
| Health Care Providers & Services - 2.2% | |||
| Acadia Healthcare Co., Inc. (a) | 215,000 | 6,927,300 | |
| AmerisourceBergen Corp. | 123,749 | 9,635,097 | |
| Anthem, Inc. | 30,317 | 8,427,520 | |
| Cardinal Health, Inc. | 230,400 | 9,692,928 | |
| Cigna Corp. | 100,585 | 14,888,592 | |
| CVS Health Corp. | 226,759 | 11,875,369 | |
| DaVita HealthCare Partners, Inc. (a) | 15,377 | 667,669 | |
| HCA Holdings, Inc. | 433,254 | 52,406,404 | |
| Henry Schein, Inc. (a) | 56,164 | 3,620,331 | |
| Laboratory Corp. of America Holdings (a) | 40,576 | 6,598,063 | |
| McKesson Corp. | 259,283 | 31,668,826 | |
| Quest Diagnostics, Inc. | 151,454 | 14,525,953 | |
| UnitedHealth Group, Inc. | 80,924 | 19,567,423 | |
| Universal Health Services, Inc. Class B | 98,600 | 11,787,630 | |
| 202,289,105 | |||
| Life Sciences Tools & Services - 0.0% | |||
| Bio-Rad Laboratories, Inc. Class A (a) | 9,300 | 2,668,449 | |
| Pharmaceuticals - 6.4% | |||
| Allergan PLC | 41,778 | 5,093,156 | |
| Bristol-Myers Squibb Co. | 500,818 | 22,722,113 | |
| Johnson & Johnson | 1,629,042 | 213,648,858 | |
| Mallinckrodt PLC (a) | 89,508 | 777,825 | |
| Merck & Co., Inc. | 1,511,231 | 119,704,608 | |
| Novartis AG sponsored ADR | 189,749 | 16,250,104 | |
| Novo Nordisk A/S Series B sponsored ADR | 61,638 | 2,909,314 | |
| Pfizer, Inc. | 5,317,331 | 220,775,583 | |
| 601,881,561 | |||
| TOTAL HEALTH CARE | 1,138,148,413 | ||
| INDUSTRIALS - 9.2% | |||
| Aerospace & Defense - 2.3% | |||
| General Dynamics Corp. | 181,887 | 29,251,067 | |
| Huntington Ingalls Industries, Inc. | 119,959 | 24,605,990 | |
| Lockheed Martin Corp. | 105,266 | 35,636,752 | |
| Moog, Inc. Class A | 80,600 | 6,643,052 | |
| Northrop Grumman Corp. | 63,952 | 19,393,444 | |
| Raytheon Co. | 255,100 | 44,514,950 | |
| Spirit AeroSystems Holdings, Inc. Class A | 290,785 | 23,565,216 | |
| Textron, Inc. | 79,673 | 3,609,187 | |
| The Boeing Co. | 22,716 | 7,760,013 | |
| United Technologies Corp. | 194,111 | 24,516,219 | |
| Vectrus, Inc. (a) | 37,733 | 1,331,598 | |
| 220,827,488 | |||
| Air Freight & Logistics - 0.6% | |||
| C.H. Robinson Worldwide, Inc. | 51,500 | 4,100,945 | |
| FedEx Corp. | 115,800 | 17,865,624 | |
| United Parcel Service, Inc. Class B | 336,479 | 31,265,629 | |
| 53,232,198 | |||
| Airlines - 1.3% | |||
| Alaska Air Group, Inc. | 46,566 | 2,710,141 | |
| American Airlines Group, Inc. | 151,049 | 4,113,064 | |
| Delta Air Lines, Inc. | 1,092,716 | 56,274,874 | |
| JetBlue Airways Corp. (a) | 114,345 | 1,970,164 | |
| Southwest Airlines Co. | 436,576 | 20,781,018 | |
| United Continental Holdings, Inc. (a) | 474,934 | 36,878,625 | |
| 122,727,886 | |||
| Building Products - 0.5% | |||
| Allegion PLC | 135,400 | 13,140,570 | |
| Fortune Brands Home & Security, Inc. | 52,760 | 2,535,646 | |
| Johnson Controls International PLC | 560,416 | 21,587,224 | |
| Masco Corp. | 110,636 | 3,863,409 | |
| Owens Corning | 131,392 | 6,368,570 | |
| 47,495,419 | |||
| Commercial Services & Supplies - 0.1% | |||
| Deluxe Corp. | 166,100 | 6,178,920 | |
| LSC Communications, Inc. | 80,075 | 388,364 | |
| R.R. Donnelley & Sons Co. | 213,533 | 474,043 | |
| 7,041,327 | |||
| Construction & Engineering - 0.0% | |||
| AECOM (a) | 44,079 | 1,406,120 | |
| Quanta Services, Inc. | 53,602 | 1,863,206 | |
| 3,269,326 | |||
| Electrical Equipment - 0.8% | |||
| Acuity Brands, Inc. | 15,042 | 1,860,244 | |
| Eaton Corp. PLC | 728,968 | 54,300,826 | |
| Emerson Electric Co. | 231,700 | 13,957,608 | |
| Hubbell, Inc. Class B | 20,592 | 2,358,608 | |
| Sensata Technologies, Inc. PLC (a) | 60,993 | 2,603,791 | |
| 75,081,077 | |||
| Industrial Conglomerates - 0.2% | |||
| Carlisle Companies, Inc. | 42,565 | 5,674,340 | |
| Honeywell International, Inc. | 53,136 | 8,730,776 | |
| 14,405,116 | |||
| Machinery - 2.6% | |||
| AGCO Corp. | 202,138 | 13,454,305 | |
| Allison Transmission Holdings, Inc. | 241,891 | 10,011,868 | |
| Apergy Corp. (a) | 68,677 | 2,129,674 | |
| Caterpillar, Inc. | 335,435 | 40,188,467 | |
| Crane Co. | 16,783 | 1,283,228 | |
| Cummins, Inc. | 313,044 | 47,194,513 | |
| Deere & Co. | 120,021 | 16,823,344 | |
| Dover Corp. | 194,313 | 17,373,525 | |
| Illinois Tool Works, Inc. | 44,137 | 6,163,291 | |
| Middleby Corp. (a) | 18,360 | 2,395,429 | |
| Oshkosh Corp. | 433,423 | 30,855,383 | |
| PACCAR, Inc. | 140,349 | 9,237,771 | |
| Parker Hannifin Corp. | 126,370 | 19,248,678 | |
| Pentair PLC | 64,819 | 2,256,998 | |
| Snap-On, Inc. | 22,594 | 3,522,856 | |
| Stanley Black & Decker, Inc. | 57,153 | 7,271,005 | |
| Timken Co. | 169,200 | 7,446,492 | |
| Trinity Industries, Inc. | 382,700 | 7,378,456 | |
| WABCO Holdings, Inc. (a) | 17,153 | 2,245,499 | |
| 246,480,782 | |||
| Professional Services - 0.1% | |||
| Manpower, Inc. | 22,500 | 1,924,200 | |
| Nielsen Holdings PLC | 134,000 | 3,045,820 | |
| Robert Half International, Inc. | 42,704 | 2,291,497 | |
| 7,261,517 | |||
| Road & Rail - 0.5% | |||
| AMERCO | 7,839 | 2,886,477 | |
| J.B. Hunt Transport Services, Inc. | 39,011 | 3,321,397 | |
| Kansas City Southern | 111,152 | 12,591,299 | |
| Knight-Swift Transportation Holdings, Inc. Class A | 65,220 | 1,802,681 | |
| Ryder System, Inc. | 184,000 | 9,292,000 | |
| Union Pacific Corp. | 84,388 | 14,074,231 | |
| 43,968,085 | |||
| Trading Companies & Distributors - 0.2% | |||
| Aircastle Ltd. | 570,900 | 11,086,878 | |
| HD Supply Holdings, Inc. (a) | 64,400 | 2,671,956 | |
| United Rentals, Inc. (a) | 29,400 | 3,236,940 | |
| W.W. Grainger, Inc. | 19,979 | 5,228,305 | |
| 22,224,079 | |||
| TOTAL INDUSTRIALS | 864,014,300 | ||
| INFORMATION TECHNOLOGY - 11.7% | |||
| Communications Equipment - 1.9% | |||
| Cisco Systems, Inc. | 3,218,296 | 167,447,941 | |
| CommScope Holding Co., Inc. (a) | 186,365 | 3,009,795 | |
| Juniper Networks, Inc. | 539,019 | 13,265,258 | |
| 183,722,994 | |||
| Electronic Equipment & Components - 0.9% | |||
| Arrow Electronics, Inc. (a) | 303,308 | 19,005,279 | |
| CDW Corp. | 59,294 | 5,836,901 | |
| Corning, Inc. | 1,156,080 | 33,341,347 | |
| Flextronics International Ltd. (a) | 371,969 | 3,325,403 | |
| Tech Data Corp. (a) | 166,200 | 15,066,030 | |
| Vishay Intertechnology, Inc. | 590,800 | 9,003,792 | |
| 85,578,752 | |||
| IT Services - 1.4% | |||
| Cognizant Technology Solutions Corp. Class A | 204,870 | 12,687,599 | |
| CSG Systems International, Inc. | 185,800 | 8,333,130 | |
| DXC Technology Co. | 257,767 | 12,254,243 | |
| IBM Corp. | 585,551 | 74,359,121 | |
| Leidos Holdings, Inc. | 54,307 | 4,090,946 | |
| PayPal Holdings, Inc. (a) | 153,000 | 16,791,750 | |
| The Western Union Co. | 183,046 | 3,551,092 | |
| 132,067,881 | |||
| Semiconductors & Semiconductor Equipment - 3.4% | |||
| Analog Devices, Inc. | 54,002 | 5,217,673 | |
| Applied Materials, Inc. | 615,180 | 23,801,314 | |
| Cirrus Logic, Inc. (a) | 198,579 | 7,420,897 | |
| Intel Corp. | 3,638,011 | 160,218,004 | |
| Lam Research Corp. | 259,927 | 45,385,853 | |
| Microchip Technology, Inc. (b) | 175,000 | 14,005,250 | |
| NXP Semiconductors NV | 93,207 | 8,217,129 | |
| ON Semiconductor Corp. (a) | 155,444 | 2,760,685 | |
| Qorvo, Inc. (a) | 47,582 | 2,911,067 | |
| Qualcomm, Inc. | 19,737 | 1,318,826 | |
| Skyworks Solutions, Inc. | 239,896 | 15,984,270 | |
| Teradyne, Inc. | 78,198 | 3,295,264 | |
| Texas Instruments, Inc. | 271,903 | 28,362,202 | |
| 318,898,434 | |||
| Software - 1.8% | |||
| Adobe, Inc. (a) | 93,000 | 25,193,700 | |
| ANSYS, Inc. (a) | 80,000 | 14,360,000 | |
| CDK Global, Inc. | 45,811 | 2,217,252 | |
| Microsoft Corp. | 278,263 | 34,415,568 | |
| Oracle Corp. | 1,767,590 | 89,440,054 | |
| 165,626,574 | |||
| Technology Hardware, Storage & Peripherals - 2.3% | |||
| Apple, Inc. | 596,352 | 104,403,345 | |
| Hewlett Packard Enterprise Co. | 1,847,911 | 25,353,339 | |
| HP, Inc. | 1,995,670 | 37,279,116 | |
| NCR Corp. (a) | 395,900 | 12,114,540 | |
| NetApp, Inc. | 88,587 | 5,244,350 | |
| Seagate Technology LLC | 343,000 | 14,354,550 | |
| Western Digital Corp. | 177,300 | 6,599,106 | |
| Xerox Corp. | 431,873 | 13,219,633 | |
| 218,567,979 | |||
| TOTAL INFORMATION TECHNOLOGY | 1,104,462,614 | ||
| MATERIALS - 3.4% | |||
| Chemicals - 1.9% | |||
| AdvanSix, Inc. (a) | 60,711 | 1,480,134 | |
| Albemarle Corp. U.S. (b) | 37,937 | 2,401,412 | |
| Cabot Corp. | 215,400 | 8,603,076 | |
| Celanese Corp. Class A | 247,039 | 23,451,412 | |
| Dow, Inc. (a) | 110,941 | 5,187,601 | |
| DowDuPont, Inc. | 332,824 | 10,157,788 | |
| Eastman Chemical Co. | 400,767 | 26,017,794 | |
| FMC Corp. | 96,127 | 7,060,528 | |
| Huntsman Corp. | 639,400 | 11,106,378 | |
| LyondellBasell Industries NV Class A | 561,231 | 41,671,402 | |
| Nutrien Ltd. | 155,930 | 7,604,991 | |
| PPG Industries, Inc. | 217,594 | 22,771,212 | |
| The Chemours Co. LLC | 279,700 | 5,898,873 | |
| The Mosaic Co. | 159,338 | 3,420,987 | |
| 176,833,588 | |||
| Construction Materials - 0.3% | |||
| CEMEX S.A.B. de CV sponsored ADR (a) | 569,368 | 2,345,796 | |
| CRH PLC sponsored ADR | 144,959 | 4,544,465 | |
| Martin Marietta Materials, Inc. | 104,742 | 22,048,191 | |
| 28,938,452 | |||
| Containers & Packaging - 0.8% | |||
| Avery Dennison Corp. | 31,356 | 3,262,905 | |
| Ball Corp. | 143,627 | 8,817,262 | |
| Berry Global Group, Inc. (a) | 46,753 | 2,198,326 | |
| Graphic Packaging Holding Co. | 339,074 | 4,407,962 | |
| International Paper Co. | 459,135 | 19,040,328 | |
| Packaging Corp. of America | 238,511 | 21,246,560 | |
| Sealed Air Corp. | 58,662 | 2,457,938 | |
| Sonoco Products Co. | 37,256 | 2,303,538 | |
| WestRock Co. | 469,920 | 15,319,392 | |
| 79,054,211 | |||
| Metals & Mining - 0.2% | |||
| Barrick Gold Corp. (Canada) | 586,049 | 7,288,757 | |
| Nucor Corp. | 126,703 | 6,081,744 | |
| Reliance Steel & Aluminum Co. | 28,864 | 2,403,505 | |
| 15,774,006 | |||
| Paper & Forest Products - 0.2% | |||
| Domtar Corp. | 211,100 | 8,876,755 | |
| Schweitzer-Mauduit International, Inc. | 199,000 | 6,226,710 | |
| 15,103,465 | |||
| TOTAL MATERIALS | 315,703,722 | ||
| REAL ESTATE - 2.0% | |||
| Equity Real Estate Investment Trusts (REITs) - 1.9% | |||
| American Homes 4 Rent Class A | 165,450 | 4,038,635 | |
| Brixmor Property Group, Inc. | 306,215 | 5,251,587 | |
| EastGroup Properties, Inc. | 29,742 | 3,301,362 | |
| Equity Lifestyle Properties, Inc. | 70,000 | 8,516,200 | |
| Equity Residential (SBI) | 71,222 | 5,453,469 | |
| Essex Property Trust, Inc. | 16,034 | 4,677,759 | |
| Federal Realty Investment Trust (SBI) | 32,776 | 4,284,806 | |
| Hospitality Properties Trust (SBI) | 600,100 | 14,924,487 | |
| Kimco Realty Corp. | 259,841 | 4,521,233 | |
| Lexington Corporate Properties Trust | 1,090,900 | 10,003,553 | |
| Medical Properties Trust, Inc. | 759,300 | 13,500,354 | |
| Mid-America Apartment Communities, Inc. | 68,255 | 7,793,356 | |
| Omega Healthcare Investors, Inc. | 414,600 | 14,768,052 | |
| Outfront Media, Inc. | 201,288 | 4,961,749 | |
| Park Hotels & Resorts, Inc. | 332,200 | 9,175,364 | |
| Piedmont Office Realty Trust, Inc. Class A | 655,900 | 13,334,447 | |
| Public Storage | 32,238 | 7,668,775 | |
| Rayonier, Inc. | 143,004 | 4,025,563 | |
| SL Green Realty Corp. | 90,779 | 7,806,994 | |
| Sun Communities, Inc. | 66,000 | 8,333,820 | |
| VEREIT, Inc. | 2,035,200 | 18,072,576 | |
| Weyerhaeuser Co. | 66,907 | 1,525,480 | |
| 175,939,621 | |||
| Real Estate Management & Development - 0.1% | |||
| CBRE Group, Inc. (a) | 275,469 | 12,588,933 | |
| Howard Hughes Corp. (a) | 5,072 | 521,604 | |
| Jones Lang LaSalle, Inc. | 18,165 | 2,260,634 | |
| 15,371,171 | |||
| TOTAL REAL ESTATE | 191,310,792 | ||
| UTILITIES - 2.2% | |||
| Electric Utilities - 1.6% | |||
| American Electric Power Co., Inc. | 298,958 | 25,746,263 | |
| Duke Energy Corp. | 46,576 | 3,987,371 | |
| Edison International | 128,202 | 7,611,353 | |
| Entergy Corp. | 174,200 | 16,909,594 | |
| Eversource Energy | 176,641 | 13,043,171 | |
| Exelon Corp. | 867,400 | 41,704,592 | |
| FirstEnergy Corp. | 439,500 | 18,124,980 | |
| NextEra Energy, Inc. | 42,592 | 8,442,160 | |
| OGE Energy Corp. | 63,536 | 2,640,556 | |
| Pinnacle West Capital Corp. | 41,775 | 3,923,090 | |
| Xcel Energy, Inc. | 172,408 | 9,885,875 | |
| 152,019,005 | |||
| Gas Utilities - 0.1% | |||
| National Fuel Gas Co. | 121,454 | 6,474,713 | |
| Independent Power and Renewable Electricity Producers - 0.1% | |||
| The AES Corp. | 213,569 | 3,374,390 | |
| Multi-Utilities - 0.4% | |||
| Ameren Corp. | 96,733 | 7,094,398 | |
| DTE Energy Co. | 67,133 | 8,423,178 | |
| NiSource, Inc. | 93,620 | 2,607,317 | |
| Public Service Enterprise Group, Inc. | 201,028 | 11,812,405 | |
| WEC Energy Group, Inc. | 125,781 | 10,131,660 | |
| 40,068,958 | |||
| TOTAL UTILITIES | 201,937,066 | ||
| TOTAL COMMON STOCKS | |||
| (Cost $6,312,652,477) | 8,237,647,908 | ||
| Equity Funds - 11.2% | |||
| Large Blend Funds - 5.7% | |||
| Fidelity SAI U.S. Large Cap Index Fund (c) | 11,464,362 | 169,787,209 | |
| Fidelity SAI U.S. Low Volatility Index Fund (c) | 26,372,676 | 362,888,020 | |
| TOTAL LARGE BLEND FUNDS | 532,675,229 | ||
| Large Value Funds - 5.5% | |||
| Fidelity SAI U.S. Value Index Fund (c) | 3,932,219 | 35,586,584 | |
| Invesco Diversified Dividend Fund - Class A | 25,691,954 | 486,862,536 | |
| TOTAL LARGE VALUE FUNDS | 522,449,120 | ||
| TOTAL EQUITY FUNDS | |||
| (Cost $834,300,010) | 1,055,124,349 | ||
| Money Market Funds - 1.6% | |||
| Fidelity Securities Lending Cash Central Fund 2.42% (d)(e) | 45,989,375 | 45,993,974 | |
| State Street Institutional U.S. Government Money Market Fund Premier Class 2.32% (f) | 106,971,316 | 106,971,316 | |
| TOTAL MONEY MARKET FUNDS | |||
| (Cost $152,965,290) | 152,965,290 | ||
| TOTAL INVESTMENT IN SECURITIES - 100.3% | |||
| (Cost $7,299,917,777) | 9,445,737,547 | ||
| NET OTHER ASSETS (LIABILITIES) - (0.3)% | (30,748,760) | ||
| NET ASSETS - 100% | $9,414,988,787 |
Legend
(a) Non-income producing
(b) Security or a portion of the security is on loan at period end.
(c) Affiliated Fund
(d) Affiliated fund that is generally available only to investment companies and other accounts managed by Fidelity Investments. The rate quoted is the annualized seven-day yield of the fund at period end. A complete unaudited listing of the fund's holdings as of its most recent quarter end is available upon request. In addition, each Fidelity Central Fund's financial statements, which are not covered by the Fund's Report of Independent Registered Public Accounting Firm, are available on the SEC's website or upon request.
(e) Includes investment made with cash collateral received from securities on loan.
(f) The rate quoted is the annualized seven-day yield of the fund at period end.
Affiliated Central Funds
Information regarding fiscal year to date income earned by the Fund from investments in Fidelity Central Funds is as follows:
| Fund | Income earned |
| Fidelity Securities Lending Cash Central Fund | $193,256 |
| Total | $193,256 |
Amounts in the income column in the above table include any capital gain distributions from underlying funds, which are presented in the corresponding line-item in the Statement of Operations, if applicable.
Affiliated Underlying Funds
Fiscal year to date information regarding the Fund's investments in affiliated Underlying Funds, excluding any Money Market Central Funds, is presented below. Exchanges between classes of the same affiliated Underlying Funds may occur.
| Affiliate | Value, beginning of period | Purchases | Sales Proceeds | Dividend Income | Realized Gain (loss) | Change in Unrealized appreciation (depreciation) | Value, end of period |
| Fidelity Energy Portfolio | $217,755,545 | $-- | $192,262,196 | $-- | $47,807,196 | $(73,300,545) | $-- |
| Fidelity Low-Priced Stock Fund | 283,631,373 | 17,367,403 | 256,492,767 | 24,443,445 | 54,870,636 | (99,376,645) | -- |
| Fidelity SAI U.S. Large Cap Index Fund | -- | 500,000,001 | 304,207,175 | -- | (15,993,783) | (10,011,834) | 169,787,209 |
| Fidelity SAI U.S. Low Volatility Index Fund | 154,255,175 | 372,561,406 | 197,047,135 | 4,426,849 | 9,532,883 | 23,585,691 | 362,888,020 |
| Fidelity SAI U.S. Value Index Fund | 10,055,602 | 431,730,043 | 415,325,557 | 1,298,321 | 11,958,319 | (2,831,823) | 35,586,584 |
| Total | $665,697,695 | $1,321,658,853 | $1,365,334,830 | $30,168,615 | $108,175,251 | $(161,935,156) | $568,261,813 |
Amounts in the income column in the above table include any capital gain distributions from underlying funds, which are presented in the corresponding line-item in the Statement of Operations, if applicable.
Investment Valuation
All investments are categorized as Level 1 under the Fair Value Hierarchy. The inputs or methodology used for valuing securities may not be an indication of the risk associated with investing in those securities. For more information on valuation inputs please refer to the Investment Valuation section in the accompanying Notes to Financial Statements.
See accompanying notes which are an integral part of the financial statements.
Financial Statements
Statement of Assets and Liabilities
| May 31, 2019 | ||
| Assets | ||
| Investment in securities, at value (including securities loaned of $43,594,030) — See accompanying schedule: Unaffiliated issuers (cost $6,713,655,990) | $8,831,481,760 | |
| Fidelity Central Funds (cost $45,993,974) | 45,993,974 | |
| Other affiliated issuers (cost $540,267,813) | 568,261,813 | |
| Total Investment in Securities (cost $7,299,917,777) | $9,445,737,547 | |
| Receivable for investments sold | 67,207,707 | |
| Receivable for fund shares sold | 2,508,380 | |
| Dividends receivable | 26,847,018 | |
| Interest receivable | 210,865 | |
| Distributions receivable from Fidelity Central Funds | 7,955 | |
| Prepaid expenses | 37,885 | |
| Other receivables | 173,320 | |
| Total assets | 9,542,730,677 | |
| Liabilities | ||
| Payable for investments purchased | $73,710,417 | |
| Payable for fund shares redeemed | 6,071,542 | |
| Accrued management fee | 1,584,542 | |
| Other affiliated payables | 107,760 | |
| Other payables and accrued expenses | 268,674 | |
| Collateral on securities loaned | 45,998,955 | |
| Total liabilities | 127,741,890 | |
| Net Assets | $9,414,988,787 | |
| Net Assets consist of: | ||
| Paid in capital | $6,696,101,289 | |
| Total distributable earnings (loss) | 2,718,887,498 | |
| Net Assets, for 520,288,600 shares outstanding | $9,414,988,787 | |
| Net Asset Value, offering price and redemption price per share ($9,414,988,787 ÷ 520,288,600 shares) | $18.10 |
See accompanying notes which are an integral part of the financial statements.
Statement of Operations
| Year ended May 31, 2019 | ||
| Investment Income | ||
| Dividends: | ||
| Unaffiliated issuers | $266,938,657 | |
| Affiliated issuers | 6,748,983 | |
| Interest | 2,505,746 | |
| Income from Fidelity Central Funds | 193,256 | |
| Total income | 276,386,642 | |
| Expenses | ||
| Management fee | $47,819,767 | |
| Transfer agent fees | 1,337,391 | |
| Accounting and security lending fees | 1,328,649 | |
| Custodian fees and expenses | 130,226 | |
| Independent trustees' fees and expenses | 126,300 | |
| Registration fees | 94,364 | |
| Audit | 77,802 | |
| Legal | 42,052 | |
| Miscellaneous | 112,036 | |
| Total expenses before reductions | 51,068,587 | |
| Expense reductions | (26,905,857) | |
| Total expenses after reductions | 24,162,730 | |
| Net investment income (loss) | 252,223,912 | |
| Realized and Unrealized Gain (Loss) | ||
| Net realized gain (loss) on: | ||
| Investment securities: | ||
| Unaffiliated issuers | 765,966,711 | |
| Fidelity Central Funds | 2,070 | |
| Other affiliated issuers | 108,175,251 | |
| Foreign currency transactions | 168 | |
| Futures contracts | (2,332,425) | |
| Capital gain distributions from underlying funds: | ||
| Unaffiliated issuers | 22,849,868 | |
| Affiliated issuers | 23,419,632 | |
| Total net realized gain (loss) | 918,081,275 | |
| Change in net unrealized appreciation (depreciation) on: | ||
| Investment securities: | ||
| Unaffiliated issuers | (1,228,480,680) | |
| Affiliated issuers | (161,935,156) | |
| Total change in net unrealized appreciation (depreciation) | (1,390,415,836) | |
| Net gain (loss) | (472,334,561) | |
| Net increase (decrease) in net assets resulting from operations | $(220,110,649) |
See accompanying notes which are an integral part of the financial statements.
Statement of Changes in Net Assets
| Year ended May 31, 2019 | Year ended May 31, 2018 | |
| Increase (Decrease) in Net Assets | ||
| Operations | ||
| Net investment income (loss) | $252,223,912 | $213,597,850 |
| Net realized gain (loss) | 918,081,275 | 577,965,924 |
| Change in net unrealized appreciation (depreciation) | (1,390,415,836) | 626,540,775 |
| Net increase (decrease) in net assets resulting from operations | (220,110,649) | 1,418,104,549 |
| Distributions to shareholders | (881,905,021) | – |
| Distributions to shareholders from net investment income | – | (201,991,822) |
| Distributions to shareholders from net realized gain | – | (632,443,426) |
| Total distributions | (881,905,021) | (834,435,248) |
| Share transactions | ||
| Proceeds from sales of shares | 1,225,576,742 | 1,419,869,361 |
| Reinvestment of distributions | 878,317,765 | 831,430,096 |
| Cost of shares redeemed | (2,832,648,067) | (2,342,706,572) |
| Net increase (decrease) in net assets resulting from share transactions | (728,753,560) | (91,407,115) |
| Total increase (decrease) in net assets | (1,830,769,230) | 492,262,186 |
| Net Assets | ||
| Beginning of period | 11,245,758,017 | 10,753,495,831 |
| End of period | $9,414,988,787 | $11,245,758,017 |
| Other Information | ||
| Undistributed net investment income end of period | $86,890,423 | |
| Shares | ||
| Sold | 63,933,831 | 70,663,944 |
| Issued in reinvestment of distributions | 48,812,720 | 42,632,296 |
| Redeemed | (147,882,523) | (116,231,716) |
| Net increase (decrease) | (35,135,972) | (2,935,476) |
See accompanying notes which are an integral part of the financial statements.
Financial Highlights
Strategic Advisers Value Fund
| Years ended May 31, | 2019 | 2018 | 2017 | 2016 | 2015 |
| Selected Per–Share Data | |||||
| Net asset value, beginning of period | $20.25 | $19.26 | $17.66 | $19.26 | $19.14 |
| Income from Investment Operations | |||||
| Net investment income (loss)A | .45 | .38 | .37 | .34 | .31 |
| Net realized and unrealized gain (loss) | (1.01) | 2.11 | 2.29 | (.73) | 1.59 |
| Total from investment operations | (.56) | 2.49 | 2.66 | (.39) | 1.90 |
| Distributions from net investment income | (.42) | (.36) | (.34) | (.31) | (.27) |
| Distributions from net realized gain | (1.18) | (1.14) | (.72) | (.90) | (1.51) |
| Total distributions | (1.59)B | (1.50) | (1.06) | (1.21) | (1.78) |
| Net asset value, end of period | $18.10 | $20.25 | $19.26 | $17.66 | $19.26 |
| Total ReturnC | (2.53)% | 13.38% | 15.56% | (1.97)% | 10.23% |
| Ratios to Average Net AssetsD,E | |||||
| Expenses before reductions | .47% | .60% | .60% | .58% | .56% |
| Expenses net of fee waivers, if any | .22% | .35% | .35% | .33% | .31% |
| Expenses net of all reductions | .22% | .35% | .35% | .33% | .31% |
| Net investment income (loss) | 2.34% | 1.88% | 1.99% | 1.94% | 1.63% |
| Supplemental Data | |||||
| Net assets, end of period (000 omitted) | $9,414,989 | $11,245,758 | $10,753,496 | $11,060,619 | $13,270,015 |
| Portfolio turnover rateF | 38% | 23% | 32% | 39% | 31% |
A Calculated based on average shares outstanding during the period.
B Total distributions of $1.59 per share is comprised of distributions from net investment income of $.415 and distributions from net realized gain of $1.179 per share.
C Total returns would have been lower if certain expenses had not been reduced during the applicable periods shown.
D Fees and expenses of any underlying Fidelity Central Funds are not included in the Fund's expense ratio. The Fund indirectly bears its proportionate share of the expenses of any underlying Fidelity Central Funds.
E Expense ratios reflect operating expenses of the Fund. Expenses before reductions do not reflect amounts reimbursed by the investment adviser or reductions from expense offset arrangements and do not represent the amount paid by the Fund during periods when reimbursements or reductions occur. Expenses net of fee waivers reflect expenses after reimbursement by the investment adviser but prior to reductions from expense offset arrangements. Expenses net of all reductions represent the net expenses paid by the Fund. Fees and expenses of the Underlying Funds are not included in the Fund's annualized ratios. The Fund indirectly bears its proportionate share of the expenses of the Underlying Funds.
F Amount does not include the portfolio activity of any Underlying Funds.
See accompanying notes which are an integral part of the financial statements.
Notes to Financial Statements
For the period ended May 31, 2019
1. Organization.
Strategic Advisers Value Fund (the Fund) is a fund of Fidelity Rutland Square Trust II (the Trust), and is authorized to issue an unlimited number of shares. The Trust is registered under the Investment Company Act of 1940, as amended (the 1940 Act), as an open-end management investment company organized as a Delaware statutory trust. The Fund is offered exclusively to certain clients of Strategic Advisers LLC. (Strategic Advisers), an affiliate of Fidelity Management & Research Company (FMR).
2. Significant Accounting Policies.
The Fund is an investment company and applies the accounting and reporting guidance of the Financial Accounting Standards Board (FASB) Accounting Standards Codification Topic 946 Financial Services – Investments Companies. The financial statements have been prepared in conformity with accounting principles generally accepted in the United States of America (GAAP), which require management to make certain estimates and assumptions at the date of the financial statements. Actual results could differ from those estimates. Subsequent events, if any, through the date that the financial statements were issued have been evaluated in the preparation of the financial statements. The following summarizes the significant accounting policies of the Fund:
Investment Valuation. Investments are valued as of 4:00 p.m. Eastern time on the last calendar day of the period. The Board of Trustees (the Board) has delegated the day to day responsibility for the valuation of the Fund's investments to the Fair Value Committee (the Committee) established by the Fund's investment adviser. In accordance with valuation policies and procedures approved by the Board, the Fund attempts to obtain prices from one or more third party pricing vendors or brokers to value its investments. When current market prices, quotations or currency exchange rates are not readily available or reliable, investments will be fair valued in good faith by the Committee, in accordance with procedures adopted by the Board. Factors used in determining fair value vary by investment type and may include market or investment specific events. The frequency with which these procedures are used cannot be predicted and they may be utilized to a significant extent. The Committee oversees the Fund's valuation policies and procedures and reports to the Board on the Committee's activities and fair value determinations. The Board monitors the appropriateness of the procedures used in valuing the Fund's investments and ratifies the fair value determinations of the Committee.
The Fund categorizes the inputs to valuation techniques used to value its investments into a disclosure hierarchy consisting of three levels as shown below:
- Level 1 – quoted prices in active markets for identical investments
- Level 2 – other significant observable inputs (including quoted prices for similar investments, interest rates, prepayment speeds, etc.)
- Level 3 – unobservable inputs (including the Fund's own assumptions based on the best information available)
Valuation techniques used to value the Fund's investments by major category are as follows:
Equity securities, including restricted securities, for which market quotations are readily available, are valued at the last reported sale price or official closing price as reported by a third party pricing vendor on the primary market or exchange on which they are traded and are categorized as Level 1 in the hierarchy. In the event there were no sales during the day or closing prices are not available, securities are valued at the last quoted bid price or may be valued using the last available price and are generally categorized as Level 2 in the hierarchy. For foreign equity securities, when market or security specific events arise, comparisons to the valuation of American Depositary Receipts (ADRs), futures contracts, Exchange-Traded Funds (ETFs) and certain indexes as well as quoted prices for similar securities may be used and would be categorized as Level 2 in the hierarchy. For equity securities, including restricted securities, where observable inputs are limited, assumptions about market activity and risk are used and these securities may be categorized as Level 3 in the hierarchy.
Investments in open-end mutual funds, including the Fidelity Central Funds, are valued at their closing net asset value (NAV) each business day and are categorized as Level 1 in the hierarchy. If an unaffiliated open-end mutual fund's NAV is unavailable, shares of that fund may be valued by another method that the Board believes reflects fair value in accordance with the Board's fair value pricing policies and is categorized as Level 2 in the hierarchy.
Changes in valuation techniques may result in transfers in or out of an assigned level within the disclosure hierarchy.
Foreign Currency. The Fund may use foreign currency contracts to facilitate transactions in foreign-denominated securities. Gains and losses from these transactions may arise from changes in the value of the foreign currency or if the counterparties do not perform under the contracts' terms.
Foreign-denominated assets, including investment securities, and liabilities are translated into U.S. dollars at the exchange rates at period end. Purchases and sales of investment securities, income and dividends received and expenses denominated in foreign currencies are translated into U.S. dollars at the exchange rate in effect on the transaction date.
The effects of exchange rate fluctuations on investments are included with the net realized and unrealized gain (loss) on investment securities. Other foreign currency transactions resulting in realized and unrealized gain (loss) are disclosed separately.
Investment Transactions and Income. For financial reporting purposes, the Fund's investment holdings and NAV include trades executed through the end of the last business day of the period. The NAV per share for processing shareholder transactions is calculated as of the close of business of the New York Stock Exchange (NYSE), normally 4:00 p.m. Eastern time and includes trades executed through the end of the prior business day. Gains and losses on securities sold are determined on the basis of identified cost and include proceeds received from litigation. Dividend income is recorded on the ex-dividend date, except for certain dividends from foreign securities where the ex-dividend date may have passed, which are recorded as soon as the Fund is informed of the ex-dividend date. Non-cash dividends included in dividend income, if any, are recorded at the fair market value of the securities received. Income and capital gain distributions from Fidelity Central Funds, if any, are recorded on the ex-dividend date. Income and capital gain distributions from Underlying Funds, if any, are recorded on the ex-dividend date. Certain distributions received by the Fund represent a return of capital or capital gain. The Fund determines the components of these distributions subsequent to the ex-dividend date, based upon receipt of tax filings or other correspondence relating to the underlying investment. These distributions are recorded as a reduction of cost of investments and/or as a realized gain. Interest income is accrued as earned and includes coupon interest and amortization of premium and accretion of discount on debt securities as applicable. Investment income is recorded net of foreign taxes withheld where recovery of such taxes is uncertain.
Expenses. Expenses directly attributable to a fund are charged to that fund. Expenses attributable to more than one fund are allocated among the respective funds on the basis of relative net assets or other appropriate methods. Expense estimates are accrued in the period to which they relate and adjustments are made when actual amounts are known.
Deferred Trustee Compensation. Under a Deferred Compensation Plan (the Plan), certain independent Trustees have elected to defer receipt of a portion of their annual compensation. Deferred amounts are invested in a cross-section of Strategic Advisers funds, are marked-to-market and remain in the Fund until distributed in accordance with the Plan. The investment of deferred amounts and the offsetting payable to the Trustees of $173,320 are included in the accompanying Statement of Assets and Liabilities in other receivables and other payables and accrued expenses, respectively.
Income Tax Information and Distributions to Shareholders. Each year, the Fund intends to qualify as a regulated investment company under Subchapter M of the Internal Revenue Code, including distributing substantially all of its taxable income and realized gains. As a result, no provision for U.S. Federal income taxes is required. As of May 31, 2019, the Fund did not have any unrecognized tax benefits in the financial statements; nor is the Fund aware of any tax positions for which it is reasonably possible that the total amounts of unrecognized tax benefits will significantly change in the next twelve months. The Fund files a U.S. federal tax return, in addition to state and local tax returns as required. The Fund's federal income tax returns are subject to examination by the Internal Revenue Service (IRS) for a period of three fiscal years after they are filed. State and local tax returns may be subject to examination for an additional fiscal year depending on the jurisdiction. Foreign taxes are provided for based on the Fund's understanding of the tax rules and rates that exist in the foreign markets in which it invests.
Distributions are declared and recorded on the ex-dividend date. Income and capital gain distributions are determined in accordance with income tax regulations, which may differ from GAAP. In addition, the Fund claimed a portion of the payment made to redeeming shareholders as a distribution for income tax purposes.
Capital accounts within the financial statements are adjusted for permanent book-tax differences. These adjustments have no impact on net assets or the results of operations. Capital accounts are not adjusted for temporary book-tax differences which will reverse in a subsequent period.
Book-tax differences are primarily due to the short-term gain distributions from the Underlying Funds, futures contracts, foreign currency transactions, passive foreign investment companies (PFIC), partnerships, market discount, deferred trustees compensation and losses deferred due to wash sales.
As of period end, the cost and unrealized appreciation (depreciation) in securities, and derivatives if applicable, for federal income tax purposes were as follows:
| Gross unrealized appreciation | $2,548,329,640 |
| Gross unrealized depreciation | (445,371,080) |
| Net unrealized appreciation (depreciation) | $2,102,958,560 |
| Tax Cost | $7,342,778,987 |
The tax-based components of distributable earnings as of period end were as follows:
| Undistributed ordinary income | $94,410,407 |
| Undistributed long-term capital gain | $521,691,851 |
| Net unrealized appreciation (depreciation) on securities and other investments | $2,102,958,560 |
The tax character of distributions paid was as follows:
| May 31, 2019 | May 31, 2018 | |
| Ordinary Income | $229,552,987 | $ 201,991,822 |
| Long-term Capital Gains | 652,352,034 | 632,443,426 |
| Total | $881,905,021 | $ 834,435,248 |
New Rule Issuance. During August 2018, the U.S. Securities and Exchange Commission issued Final Rule Release No. 33-10532, Disclosure Update and Simplification. This Final Rule includes amendments specific to registered investment companies that are intended to eliminate overlap in disclosure requirements between Regulation S-X and GAAP. In accordance with these amendments, certain line-items in the Fund's financial statements have been combined or removed for the current period as outlined in the table below.
| Financial Statement | Current Line-Item Presentation (As Applicable) | Prior Line-Item Presentation (As Applicable) |
| Statement of Assets and Liabilities | Total distributable earnings (loss) | Undistributed/Distributions in excess of/Accumulated net investment income (loss) Accumulated/Undistributed net realized gain (loss) Net unrealized appreciation (depreciation) |
| Statement of Changes in Net Assets | N/A - removed | Undistributed/Distributions in excess of/Accumulated net investment income (loss) end of period |
| Statement of Changes in Net Assets | Distributions to shareholders | Distributions to shareholders from net investment income Distributions to shareholders from net realized gain |
3. Derivative Instruments.
Risk Exposures and the Use of Derivative Instruments. The Fund's investment objective allows the Fund to enter into various types of derivative contracts, including futures contracts. Derivatives are investments whose value is primarily derived from underlying assets, indices or reference rates and may be transacted on an exchange or over-the-counter (OTC). Derivatives may involve a future commitment to buy or sell a specified asset based on specified terms, to exchange future cash flows at periodic intervals based on a notional principal amount, or for one party to make one or more payments upon the occurrence of specified events in exchange for periodic payments from the other party.
The Fund used derivatives to increase returns and to manage exposure to certain risks as defined below. The success of any strategy involving derivatives depends on analysis of numerous economic factors, and if the strategies for investment do not work as intended, the Fund may not achieve its objectives.
The Fund's use of derivatives increased or decreased its exposure to the following risk:
| Equity Risk | Equity risk relates to the fluctuations in the value of financial instruments as a result of changes in market prices (other than those arising from interest rate risk or foreign exchange risk), whether caused by factors specific to an individual investment, its issuer, or all factors affecting all instruments traded in a market or market segment. |
The Fund is also exposed to additional risks from investing in derivatives, such as liquidity risk and counterparty credit risk. Liquidity risk is the risk that the Fund will be unable to close out the derivative in the open market in a timely manner. Counterparty credit risk is the risk that the counterparty will not be able to fulfill its obligation to the Fund. Counterparty credit risk related to exchange-traded futures contracts may be mitigated by the protection provided by the exchange on which they trade.
Investing in derivatives may involve greater risks than investing in the underlying assets directly and, to varying degrees, may involve risk of loss in excess of any initial investment and collateral received and amounts recognized in the Statement of Assets and Liabilities. In addition, there may be the risk that the change in value of the derivative contract does not correspond to the change in value of the underlying instrument.
Futures Contracts. A futures contract is an agreement between two parties to buy or sell a specified underlying instrument for a fixed price at a specified future date. The Fund used futures contracts to manage its exposure to the stock market.
Upon entering into a futures contract, a fund is required to deposit either cash or securities (initial margin) with a clearing broker in an amount equal to a certain percentage of the face value of the contract. Futures contracts are marked-to-market daily and subsequent daily payments (variation margin) are made or received by a fund depending on the daily fluctuations in the value of the futures contracts and are recorded as unrealized appreciation or (depreciation). This receivable and/or payable, if any, is included in daily variation margin on futures contracts in the Statement of Assets and Liabilities. Realized gain or (loss) is recorded upon the expiration or closing of a futures contract. The net realized gain (loss) and change in net unrealized appreciation (depreciation) on futures contracts during the period is presented in the Statement of Operations.
Any open futures contracts at period end are presented in the Schedule of Investments under the caption "Futures Contracts". The notional amount at value reflects each contract's exposure to the underlying instrument or index at period end.
4. Purchases and Sales of Investments.
Purchases and sales of securities (including the Underlying Fund shares), other than short-term securities, aggregated $4,069,306,630 and $5,380,480,896, respectively.
5. Fees and Other Transactions with Affiliates.
Management Fee. Strategic Advisers (the investment adviser) provides the Fund with investment management related services. For these services, the Fund pays a monthly management fee to the investment adviser. The management fee is calculated by adding the annual management fee rate of .25% of the Fund's average net assets throughout the month payable to the investment adviser to the aggregate of the fee rates, payable monthly, to the Fund's sub-advisers. The Fund's maximum aggregate management fee will not exceed .70% of the Fund's average net assets. For the reporting period, the total annual management fee rate was .44% of the Fund's average net assets.
During the period, the investment adviser waived its management fee as described in the Expense Reductions note.
Sub-Advisers. Aristotle Capital Management, LLC, Brandywine Global Investment Management, LLC, J.P. Morgan Investment Management, Inc., LSV Asset Management and Boston Partners Global Investors, Inc. each served as a sub-adviser for the Fund during the period. Sub-advisers provide discretionary investment advisory services for their allocated portion of the Fund's assets and are paid by the investment adviser and not the Fund for providing these services.
FIAM LLC (an affiliate of the investment adviser) and Geode Capital Management, LLC have been retained to serve as a sub-adviser for the Fund. As of the date of the report, however, these sub-advisers have not been allocated any portion of the Fund's assets. These sub-advisers in the future may provide discretionary investment advisory services for an allocated portion of the Fund's assets and will be paid by the investment adviser for providing these services.
Transfer Agent Fees. Fidelity Investments Institutional Operations Company, Inc. (FIIOC), an affiliate of the investment adviser, is the Fund's transfer, dividend disbursing and shareholder servicing agent. Effective July 1, 2018 transfer agent fees are not paid by the Fund and are instead paid by the investment adviser or an affiliate. Prior to July 1, 2018 FIIOC received account fees and asset-based fees that varied according to account size and type of account. The Fund did not directly pay transfer agent fees with respect to the portion of its assets invested in Underlying Funds. FIIOC paid for typesetting, printing and mailing of shareholder reports, except proxy statements. For the period, the transfer agent fees were equivalent to an annual rate of .01% of average net assets.
Accounting and Security Lending Fees. Fidelity Service Company, Inc. (FSC), an affiliate of the investment adviser, maintains the Fund's accounting records. The accounting fee is based on the level of average net assets for each month. Prior to April 1, 2019, FSC had a separate agreement with the Fund for administration of the security lending program, based on the number and duration of lending transactions. For the period, the total fees paid for accounting and administration of securities lending were equivalent to an annual rate of .01%.
During June 2019, the Board approved that effective July 1, 2019 accounting fees will not be paid by the Fund and will instead be paid by the investment adviser or an affiliate.
Brokerage Commissions. The Fund placed a portion of its portfolio transactions with brokerage firms which are affiliates of the investment adviser. Brokerage commissions are included in net realized gain (loss) and change in net unrealized appreciation (depreciation) in the Statement of Operations. The commissions paid to these affiliated firms were $1,938,129 for the period.
Interfund Trades. The Fund may purchase from or sell securities to other funds affiliated with each sub-adviser under procedures adopted by the Board. The procedures have been designed to ensure these interfund trades are executed in accordance with Rule 17a-7 of the 1940 Act. Interfund trades are included within the respective purchases and sales amounts shown in the Purchases and Sales of Investments note.
6. Investments in Fidelity Central Funds.
The Fund invests in Fidelity Central Funds, which are open-end investment companies available only to other investment companies and accounts managed by the investment adviser and its affiliates. The Fund's Schedule of Investments lists each of the Fidelity Central Funds held as of period end, if any, as an investment of the Fund, but does not include the underlying holdings of each Fidelity Central Fund. As an Investing Fund, the Fund indirectly bears its proportionate share of the expenses of the underlying Fidelity Central Funds.
The Fidelity Money Market Central Funds are managed by Fidelity Investments Money Management, Inc. (FIMM), an affiliate of the investment adviser. Annualized expenses of the Money Market Central Funds as of their most recent shareholder report date ranged from less than .005% to .01%.
A complete unaudited list of holdings for each Fidelity Central Fund is available upon request or at the Securities and Exchange Commission (the SEC) website at www.sec.gov. In addition, the financial statements of the Fidelity Central Funds, which are not covered by the Fund's Report of Independent Registered Public Accounting Firm, are available on the SEC website or upon request.
7. Committed Line of Credit.
The Fund participates with other funds managed by the investment adviser or an affiliate in a $4.25 billion credit facility (the "line of credit") to be utilized for temporary or emergency purposes to fund shareholder redemptions or for other short-term liquidity purposes. The Fund has agreed to pay commitment fees on its pro-rata portion of the line of credit, which amounted to $29,827 and is reflected in Miscellaneous expenses on the Statement of Operations. During the period, the Fund did not borrow on this line of credit.
8. Security Lending.
The Fund lends portfolio securities through a lending agent from time to time in order to earn additional income. On the settlement date of the loan, the Fund receives collateral (in the form of U.S. Treasury obligations, letters of credit and/or cash) against the loaned securities and maintains collateral in an amount not less than 100% of the market value of the loaned securities during the period of the loan. The market value of the loaned securities is determined at the close of business of the Fund and any additional required collateral is delivered to the Fund on the next business day. The Fund or borrower may terminate the loan at any time, and if the borrower defaults on its obligation to return the securities loaned because of insolvency or other reasons, the Fund may apply collateral received from the borrower against the obligation. The Fund may experience delays and costs in recovering the securities loaned. Any cash collateral received is invested in the Fidelity Securities Lending Cash Central Fund. The value of loaned securities and cash collateral at period end are disclosed on the Fund's Statement of Assets and Liabilities. Security lending income represents the income earned on investing cash collateral, less rebates paid to borrowers and any lending agent fees associated with the loan, plus any premium payments received for lending certain types of securities. Security lending income is presented in the Statement of Operations as a component of income from Fidelity Central Funds. Total security lending income during the period amounted to $193,256.
9. Expense Reductions.
The investment adviser has contractually agreed to waive the Fund's management fee in an amount equal to .25% of the Fund's average net assets until September 30, 2022. During the period, this waiver reduced the Fund's management fee by $26,905,857.
10. Other.
The Fund's organizational documents provide former and current trustees and officers with a limited indemnification against liabilities arising in connection with the performance of their duties to the Fund. In the normal course of business, the Fund may also enter into contracts that provide general indemnifications. The Fund's maximum exposure under these arrangements is unknown as this would be dependent on future claims that may be made against the Fund. The risk of material loss from such claims is considered remote.
The Fund does not invest in the Underlying Funds for the purpose of exercising management or control; however, investments by the Fund within its principal investment strategies may represent a significant portion of an Underlying Fund's net assets. At the end of the period, the Fund was the owner of record of approximately 12% of the total outstanding shares of Fidelity SAI U.S. Low Volatility Index Fund.
Report of Independent Registered Public Accounting Firm
To the Board of Trustees of Fidelity Rutland Square Trust II and Shareholders of Strategic Advisers Value Fund:
Opinion on the Financial Statements
We have audited the accompanying statement of assets and liabilities, including the schedule of investments, of Strategic Advisers Value Fund (one of the funds constituting Fidelity Rutland Square Trust II, referred to hereafter as the “Fund”) as of May 31, 2019, the related statement of operations for the year ended May 31, 2019, the statement of changes in net assets for each of the two years in the period ended May 31, 2019, including the related notes, and the financial highlights for each of the five years in the period ended May 31, 2019 (collectively referred to as the “financial statements”). In our opinion, the financial statements present fairly, in all material respects, the financial position of the Fund as of May 31, 2019, the results of its operations for the year then ended, the changes in its net assets for each of the two years in the period ended May 31, 2019 and the financial highlights for each of the five years in the period ended May 31, 2019 in conformity with accounting principles generally accepted in the United States of America.
Basis for Opinion
These financial statements are the responsibility of the Fund’s management. Our responsibility is to express an opinion on the Fund’s financial statements based on our audits. We are a public accounting firm registered with the Public Company Accounting Oversight Board (United States) (PCAOB) and are required to be independent with respect to the Fund in accordance with the U.S. federal securities laws and the applicable rules and regulations of the Securities and Exchange Commission and the PCAOB.
We conducted our audits of these financial statements in accordance with the standards of the PCAOB. Those standards require that we plan and perform the audit to obtain reasonable assurance about whether the financial statements are free of material misstatement, whether due to error or fraud.
Our audits included performing procedures to assess the risks of material misstatement of the financial statements, whether due to error or fraud, and performing procedures that respond to those risks. Such procedures included examining, on a test basis, evidence regarding the amounts and disclosures in the financial statements. Our audits also included evaluating the accounting principles used and significant estimates made by management, as well as evaluating the overall presentation of the financial statements. Our procedures included confirmation of securities owned as of May 31, 2019 by correspondence with the custodian and brokers; when replies were not received from brokers, we performed other auditing procedures. We believe that our audits provide a reasonable basis for our opinion.
PricewaterhouseCoopers LLP
Boston, Massachusetts
July 15, 2019
We have served as the auditor of one or more investment companies in the Fidelity group of funds since 1932.
Trustees and Officers
The Trustees, Members of the Advisory Board (if any), and officers of the trust and fund, as applicable, are listed below. The Board of Trustees governs the fund and is responsible for protecting the interests of shareholders. The Trustees are experienced executives who meet periodically throughout the year to oversee the fund's activities, review contractual arrangements with companies that provide services to the fund, oversee management of the risks associated with such activities and contractual arrangements, and review the fund's performance. If the interests of the fund and an underlying Fidelity® fund were to diverge, a conflict of interest could arise and affect how the Trustees and Members of the Advisory Board fulfill their fiduciary duties to the affected funds. Strategic Advisers has structured the fund to avoid these potential conflicts, although there may be situations where a conflict of interest is unavoidable. In such instances, Strategic Advisers, the Trustees, and Members of the Advisory Board would take reasonable steps to minimize and, if possible, eliminate the conflict. Each of the Trustees oversees 14 funds.
The Trustees hold office without limit in time except that (a) any Trustee may resign; (b) any Trustee may be removed by written instrument, signed by at least two-thirds of the number of Trustees prior to such removal; (c) any Trustee who requests to be retired or who has become incapacitated by illness or injury may be retired by written instrument signed by a majority of the other Trustees; and (d) any Trustee may be removed at any special meeting of shareholders by a two-thirds vote of the outstanding voting securities of the trust. Officers and Advisory Board Members hold office without limit in time, except that any officer or Advisory Board Member may resign or may be removed by a vote of a majority of the Trustees at any regular meeting or any special meeting of the Trustees. Except as indicated, each individual has held the office shown or other offices in the same company for the past five years.
Each Trustee who is not an interested person (as defined in the 1940 Act) of the trust and the fund is referred to herein as an Independent Trustee.
The fund’s Statement of Additional Information (SAI) includes more information about the Trustees. To request a free copy, call Fidelity at 1-800-544-3455.
Experience, Skills, Attributes, and Qualifications of the Trustees. The Governance and Nominating Committee has adopted a statement of policy that describes the experience, qualifications, attributes, and skills that are necessary and desirable for potential Independent Trustee candidates (Statement of Policy). The Board believes that each Trustee satisfied at the time he or she was initially elected or appointed a Trustee, and continues to satisfy, the standards contemplated by the Statement of Policy. The Governance and Nominating Committee may also engage professional search firms to help identify potential Independent Trustee candidates with experience, qualifications, attributes, and skills consistent with the Statement of Policy. Additional criteria based on the composition and skills of the current Independent Trustees, as well as experience or skills that may be appropriate in light of future changes to board composition, business conditions, and regulatory or other developments, may be considered by the professional search firms and the Governance and Nominating Committee. In addition, the Board takes into account the Trustees' commitment and participation in Board and committee meetings, as well as their leadership of standing and ad hoc committees throughout their tenure.
In determining that a particular Trustee was and continues to be qualified to serve as a Trustee, the Board has considered a variety of criteria, none of which, in isolation, was controlling. The Board believes that, collectively, the Trustees have balanced and diverse experience, qualifications, attributes, and skills, which allow the Board to operate effectively in governing the fund and protecting the interests of shareholders. Information about the specific experience, skills, attributes, and qualifications of each Trustee, which in each case led to the Board's conclusion that the Trustee should serve (or continue to serve) as a trustee of the fund, is provided below.
Board Structure and Oversight Function. Robert A. Lawrence is an interested person and currently serves as Chairman. The Trustees have determined that an interested Chairman is appropriate and benefits shareholders because an interested Chairman has a personal and professional stake in the quality and continuity of services provided to the fund. Independent Trustees exercise their informed business judgment to appoint an individual of their choosing to serve as Chairman, regardless of whether the Trustee happens to be independent or a member of management. The Independent Trustees have determined that they can act independently and effectively without having an Independent Trustee serve as Chairman and that a key structural component for assuring that they are in a position to do so is for the Independent Trustees to constitute a substantial majority for the Board. The Independent Trustees also regularly meet in executive session. Mary C. Farrell serves as the lead Independent Trustee and as such (i) acts as a liaison between the Independent Trustees and management with respect to matters important to the Independent Trustees and (ii) with management prepares agendas for Board meetings.
Fidelity® funds are overseen by different Boards of Trustees. The fund's Board oversees asset allocation funds. Other Boards oversee Fidelity's investment-grade bond, money market, and asset allocation funds, and Fidelity's equity and high income funds. The fund may invest in Fidelity® funds overseen by such other Boards. The use of separate Boards, each with its own committee structure, allows the Trustees of each group of Fidelity® funds to focus on the unique issues of the funds they oversee, including common research, investment, and operational issues.
The Trustees primarily operate as a full Board, but also operate in committees, to facilitate the timely and efficient consideration of all matters of importance to the Trustees, the fund, and fund shareholders and to facilitate compliance with legal and regulatory requirements and oversight of the fund's activities and associated risks. The Board has charged Strategic Advisers and its affiliates with (i) identifying events or circumstances the occurrence of which could have demonstrably adverse effects on the fund's business and/or reputation; (ii) implementing processes and controls to lessen the possibility that such events or circumstances occur or to mitigate the effects of such events or circumstances if they do occur; and (iii) creating and maintaining a system designed to evaluate continuously business and market conditions in order to facilitate the identification and implementation processes described in (i) and (ii) above. Because the day-to-day operations and activities of the fund are carried out by or through Strategic Advisers, its affiliates and other service providers, the fund's exposure to risks is mitigated but not eliminated by the processes overseen by the Trustees. Board oversight of different aspects of the fund's activities is exercised primarily through the full Board, but also through the Audit and Compliance Committee. Appropriate personnel, including but not limited to the fund's Chief Compliance Officer (CCO), FMR's internal auditor, the independent accountants, the fund's Treasurer and portfolio management personnel, make periodic reports to the Board's committees, as appropriate. The responsibilities of each standing committee, including their oversight responsibilities, are described further under "Standing Committees of the Trustees."
Interested Trustees*:
Correspondence intended for a Trustee who is an interested person may be sent to Fidelity Investments, 245 Summer Street, Boston, Massachusetts 02210.
Name, Year of Birth; Principal Occupations and Other Relevant Experience+
Brian B. Hogan (1964)
Year of Election or Appointment: 2018
Trustee
Mr. Hogan also serves as Trustee of other funds. Mr. Hogan serves as Head of Fidelity Investments’ Investment Solutions and Innovation organization (2018-present), a Director of Strategic Advisers LLC (2018-present), and a Director of Fidelity SelectCo, LLC (investment adviser firm, 2014-present). Previously, Mr. Hogan served as President of FMR Co., Inc. (2009-2018), a Vice President of Fidelity's Equity and High Income funds (2009-2018), a Director of FMR Investment Management (UK) Limited (investment adviser firm, 2015-2018), Trustee of certain Fidelity® funds (2014-2018), President of the Equity Division of FMR (investment adviser firm, 2009-2018), Senior Vice President, Equity Research of FMR (2006-2009), and as a portfolio manager. Mr. Brian B. Hogan is not related to Mr. Colm A. Hogan.
Robert A. Lawrence (1952)
Year of Election or Appointment: 2016
Trustee
Chairman of the Board of Trustees
Mr. Lawrence also serves as Trustee of other funds. Previously, Mr. Lawrence served as a Member of the Advisory Board of certain funds. Prior to his retirement in 2008, Mr. Lawrence served as Vice President of certain Fidelity® funds (2006-2008), Senior Vice President, Head of High Income Division of Fidelity Management & Research Company (investment adviser firm, 2006-2008), and President of Fidelity Strategic Investments (investment adviser firm, 2002-2005).
* Determined to be an "Interested Trustee" by virtue of, among other things, his or her affiliation with the trust or various entities under common control with Strategic Advisers.
+ The information includes the Trustee's principal occupation during the last five years and other information relating to the experience, attributes, and skills relevant to the Trustee's qualifications to serve as a Trustee, which led to the conclusion that the Trustee should serve as a Trustee for the fund.
Independent Trustees:
Correspondence intended for an Independent Trustee may be sent to Fidelity Investments, P.O. Box 55235, Boston, Massachusetts 02205-5235.
Name, Year of Birth; Principal Occupations and Other Relevant Experience+
Peter C. Aldrich (1944)
Year of Election or Appointment: 2006
Trustee
Mr. Aldrich also serves as Trustee of other funds. Mr. Aldrich is a Director of the National Bureau of Economic Research, a Director of the funds of BlackRock Realty Group (2006-present), and a Director of LivelyHood, Inc. (private corporation, 2013-present). Previously, Mr. Aldrich served as a Trustee for the Fidelity Rutland Square Trust (2005-2010), a Managing Member of Poseidon, LLC (foreign private investment, 1998-2004), and Chairman and Managing Member of AEGIS, LLC (foreign private investment, 1997-2004). Mr. Aldrich previously was a founder, Chief Executive Officer, and Chairman of AEW Capital Management, L.P. (then “Aldrich, Eastman and Waltch, L.P.”). Mr. Aldrich also served as a Director of Zipcar, Inc. (car sharing services, 2001-2009) and as Faculty Chairman of The Research Council on Global Investment of The Conference Board (business and professional education non-profit, 1999-2004). Mr. Aldrich is a Member Emeritus of the Board of Trustees of the Museum of Fine Arts Boston and an Overseer of the Massachusetts Eye and Ear Infirmary.
Ralph F. Cox (1932)
Year of Election or Appointment: 2006
Trustee
Mr. Cox also serves as Trustee of other funds. Mr. Cox is President of RABAR Enterprises (management consulting for the petroleum industry). Mr. Cox is a Director of Abraxas Petroleum (exploration and production, 1999-present). Mr. Cox is a member of the Advisory Boards of the Business and Engineering Schools of Texas A&M University and the Engineering School of University of Texas at Austin. Previously, Mr. Cox served as a Trustee for the Fidelity Rutland Square Trust (2005-2010) and as an Advisory Director of CH2M Hill Companies (engineering, 1981-2011). Mr. Ralph F. Cox and Mr. Howard E. Cox, Jr. are not related.
Mary C. Farrell (1949)
Year of Election or Appointment: 2013
Trustee
Ms. Farrell also serves as Trustee of other funds. Ms. Farrell is a Director of the W.R. Berkley Corporation (insurance provider) and President (2009-present) and Director (2006-present) of the Howard Gilman Foundation (charitable organization). Previously, Ms. Farrell was Managing Director and Chief Investment Strategist at UBS Wealth Management USA and Co-Head of UBS Wealth Management Investment Strategy & Research Group (2003-2005). Ms. Farrell also served as Investment Strategist at PaineWebber (1982-2000) and UBS PaineWebber (2000-2002). Ms. Farrell serves as Chairman of the Board of Trustees of Yale-New Haven Hospital and on the Yale New Haven Health System Board and previously served as Trustee on the Board of Overseers of the New York University Stern School of Business.
Karen Kaplan (1960)
Year of Election or Appointment: 2006
Trustee
Ms. Kaplan also serves as Trustee of other funds. Ms. Kaplan is Chairman (2014-present) and Chief Executive Officer (2013-present) of Hill Holliday (advertising and specialized marketing). Ms. Kaplan is a Director of The Michaels Companies, Inc. (specialty retailer, 2015-present), Member of the Board of Governors of the Chief Executives’ Club of Boston (2010-present), Member of the Executive Committee of the Greater Boston Chamber of Commerce (2006-present), Advisory Board Member of the National Association of Corporate Directors Chapter (2012-present), Member of the Board of Trustees of the Post Office Square Trust (2012-present), Trustee of the Brigham and Women’s Hospital (2016-present), Overseer of the Boston Symphony Orchestra (2014-present), Member of the Board of Directors of The Advertising Council, Inc. (2016-present), and Member of the Ron Burton Training Village Executive Board of Advisors (2018-present). Previously, Ms. Kaplan served as an Advisory Board Member of Fidelity Rutland Square Trust (2006-2010), a member of the Clinton Global Initiative (2010-2015), Director of DSM (dba Delta Dental and DentaQuest) (2004-2014), Formal Appointee of the 2015 Baker-Polito Economic Development Council, Director of Vera Bradley Inc. (designer of women’s accessories, 2012-2015), Member of the Board of Directors of the Massachusetts Conference for Women (2008-2015), Member of the Board of Directors of Jobs for Massachusetts (2012-2015), President of the Massachusetts Women’s Forum (2008-2010), Treasurer of the Massachusetts Women’s Forum (2002-2006), and Vice Chair of the Board of the Massachusetts Society for the Prevention of Cruelty to Children (2003-2010).
Heidi L. Steiger (1953)
Year of Election or Appointment: 2017
Trustee
Ms. Steiger also serves as Trustee of other funds. Ms. Steiger serves as a member of the Global Advisory Board and Of Counsel to Signum Global Advisors (international policy and strategy, 2018-present), a guest lecturer in the joint degree program in Global Luxury Management at North Carolina State University (Raleigh, NC) and Skema (Paris) (2018-present), Managing Partner of Topridge Associates, LLC (consulting, 2005-present), a Non-Executive Director of CrowdBureau Corporation (financial technology company and index provider, 2018-present), and a member of the Board of Directors (2013-present) and Chair of the Audit Committee and member of the Membership and Executive Committees (2017-present) of Business Executives for National Security (nonprofit). Previously, Ms. Steiger served as Eastern Region President of The Private Client Reserve of U.S. Bancorp (banking and financial services, 2010-2015), Advisory Director of Berkshire Capital Securities, LLC (financial services, 2009-2010), President and Senior Advisor of Lowenhaupt Global Advisors, LLC (financial services, 2005-2007), and President and Contributing Editor of Worth Magazine (2004-2005) and held a variety of positions at Neuberger Berman Group, LLC (financial services, 1986-2004), including Partner and Executive Vice President and Global Head of Private Asset Management at Neuberger Berman (1999-2004). Ms. Steiger also served as a member of the Board of Directors of Nuclear Electric Insurance Ltd (insurer of nuclear utilities, 2006-2017), a member of the Board of Trustees and Audit Committee of the Eaton Vance Funds (2007-2010), a member of the Board of Directors of Aviva USA (formerly AmerUs) (insurance, 2004-2014), and a member of the Board of Trustees and Audit Committee and Chair of the Investment Committee of CIFG (financial guaranty insurance, 2009-2012), and a member of the Board of Directors of Kin Group Plc (formerly, Fitbug Holdings) (health and technology, 2016-2017).
+ The information includes the Trustee's principal occupation during the last five years and other information relating to the experience, attributes, and skills relevant to the Trustee's qualifications to serve as a Trustee, which led to the conclusion that the Trustee should serve as a Trustee for the fund.
Advisory Board Members and Officers:
Correspondence intended for an officer or Howard E. Cox, Jr. may be sent to Fidelity Investments, 245 Summer Street, Boston, Massachusetts 02210. Officers appear below in alphabetical order.
Name, Year of Birth; Principal Occupation
Howard E. Cox, Jr. (1944)
Year of Election or Appointment: 2009
Member of the Advisory Board
Mr. Cox also serves as Member of the Advisory Board of other funds. Mr. Cox is a Partner of Greylock (venture capital, 1971-present) and a Director of Stryker Corporation (medical products and services, 1974-present). Previously, Mr. Cox served as an Advisory Board Member of Fidelity Rutland Square Trust (2006-2010). Mr. Cox also serves as a Member of the Secretary of Defense's Business Board of Directors (2008-present), a Director of Business Executives for National Security (1997-present), a Director of the Brookings Institution (2010-present), a Director of the World Economic Forum’s Young Global Leaders Foundation (2009-present), and is a Member of the Harvard Medical School Board of Fellows (2002-present). Mr. Howard E. Cox, Jr. and Mr. Ralph F. Cox are not related.
Elizabeth Paige Baumann (1968)
Year of Election or Appointment: 2017
Anti-Money Laundering (AML) Officer
Ms. Baumann also serves as AML Officer of other funds. She is Chief AML Officer (2012-present) and Senior Vice President (2014-present) of FMR LLC (diversified financial services company) and is an employee of Fidelity Investments. Previously, Ms. Baumann served as AML Officer of the funds (2012-2016), and Vice President (2007-2014) and Deputy Anti-Money Laundering Officer (2007-2012) of FMR LLC.
Craig S. Brown (1977)
Year of Election or Appointment: 2019
Assistant Treasurer
Mr. Brown also serves as Assistant Treasurer of other funds. Mr. Brown is an employee of Fidelity Investments (2013-present).
John J. Burke III (1964)
Year of Election or Appointment: 2018
Chief Financial Officer
Mr. Burke also serves as Chief Financial Officer of other funds. Mr. Burke serves as Head of Investment Operations for Fidelity Fund and Investment Operations (2018-present) and is an employee of Fidelity Investments (1998-present). Previously Mr. Burke served as head of Asset Management Investment Operations (2012-2018).
Jonathan Davis (1968)
Year of Election or Appointment: 2010
Assistant Treasurer
Mr. Davis also serves as Assistant Treasurer of other funds. Mr. Davis serves as Assistant Treasurer of FMR Capital, Inc. (2017-present) and is an employee of Fidelity Investments. Previously, Mr. Davis served as Vice President and Associate General Counsel of FMR LLC (diversified financial services company, 2003-2010).
Adrien E. Deberghes (1967)
Year of Election or Appointment: 2016
President and Treasurer
Mr. Deberghes also serves as an officer of other funds. He serves as Assistant Treasurer of FMR Capital, Inc. (2017-present), Executive Vice President of Fidelity Investments Money Management, Inc. (FIMM) (investment adviser firm, 2016-present), and is an employee of Fidelity Investments (2008-present). Previously, Mr. Deberghes served as President and Treasurer of certain Fidelity® funds (2013-2018). Prior to joining Fidelity Investments, Mr. Deberghes was Senior Vice President of Mutual Fund Administration at State Street Corporation (2007-2008), Senior Director of Mutual Fund Administration at Investors Bank & Trust (2005-2007), and Director of Finance for Dunkin' Brands (2000-2005). Previously, Mr. Deberghes served in other fund officer roles.
Laura M. Del Prato (1964)
Year of Election or Appointment: 2018
Assistant Treasurer
Ms. Del Prato also serves as an officer of other funds. Ms. Del Prato is an employee of Fidelity Investments (2017-present). Prior to joining Fidelity Investments, Ms. Del Prato served as a Managing Director and Treasurer of the JPMorgan Mutual Funds (2014-2017). Prior to JPMorgan, Ms. Del Prato served as a partner at Cohen Fund Audit Services (accounting firm, 2012-2013) and KPMG LLP (accounting firm, 2004-2012).
James D. Gryglewicz (1972)
Year of Election or Appointment: 2015
Chief Compliance Officer
Mr. Gryglewicz also serves as Chief Compliance Officer of other funds. Mr. Gryglewicz serves as Compliance Officer of Strategic Advisers LLC (investment adviser firm, 2015-present) and Fidelity SelectCo, LLC (investment adviser firm, 2014-present), Senior Vice President of Asset Management Compliance (2009-present), and is an employee of Fidelity Investments (2004-present). Previously, Mr. Gryglewicz served as Chief Compliance Officer of certain Fidelity® funds (2014-2018).
John Hitt (1967)
Year of Election or Appointment: 2014
Secretary and Chief Legal Officer
Mr. Hitt also serves as an officer of other funds. Mr. Hitt serves as Senior Vice President and Deputy General Counsel in Fidelity's Asset Management Group (2010-present) and is an employee of Fidelity Investments.
Colm A. Hogan (1973)
Year of Election or Appointment: 2016
Assistant Treasurer
Mr. Hogan also serves as an officer of other funds. Mr. Hogan serves as Assistant Treasurer of FMR Capital, Inc. (2017-present) and is an employee of Fidelity Investments (2005-present). Previously, Mr. Hogan served as Assistant Treasurer of certain Fidelity® funds (2016-2018). Mr. Colm A. Hogan is not related to Mr. Brian B. Hogan.
Christina H. Lee (1975)
Year of Election or Appointment: 2018
Assistant Secretary
Ms. Lee also serves as Assistant Secretary of other funds. Ms. Lee serves as Vice President, Associate General Counsel (2014-present) and is an employee of Fidelity Investments (2007-present).
Chris Maher (1972)
Year of Election or Appointment: 2016
Assistant Treasurer
Mr. Maher serves as Assistant Treasurer of other funds. Mr. Maher is Vice President of Valuation Oversight, serves as Assistant Treasurer of FMR Capital, Inc. (2017-present), and is an employee of Fidelity Investments. Previously, Mr. Maher served as Vice President of Asset Management Compliance (2013), Vice President of the Program Management Group of FMR (investment adviser firm, 2010-2013), and Vice President of Valuation Oversight (2008-2010).
Stacie M. Smith (1974)
Year of Election or Appointment: 2016
Assistant Treasurer
Ms. Smith also serves as an officer of other funds. Ms. Smith serves as Assistant Treasurer of FMR Capital, Inc. (2017-present), is an employee of Fidelity Investments (2009-present), and has served in other fund officer roles. Prior to joining Fidelity Investments, Ms. Smith served as Senior Audit Manager of Ernst & Young LLP (accounting firm, 1996-2009). Previously, Ms. Smith served as Assistant Treasurer (2013-2018) and Deputy Treasurer (2013-2016) of certain Fidelity® funds.
Marc L. Spector (1972)
Year of Election or Appointment: 2016
Assistant Treasurer
Mr. Spector also serves as an officer of other funds. Mr. Spector serves as Assistant Treasurer of FMR Capital, Inc. (2017-present) and is an employee of Fidelity Investments (2016-present). Prior to joining Fidelity Investments, Mr. Spector served as Director at the Siegfried Group (accounting firm, 2013-2016), and prior to Siegfried Group as audit senior manager at Deloitte & Touche (accounting firm, 2005-2013).
Jim Wegmann (1979)
Year of Election or Appointment: 2019
Assistant Treasurer
Mr. Wegmann also serves as Assistant Treasurer of other funds. Mr. Wegmann is an employee of Fidelity Investments (2011-present).
Shareholder Expense Example
As a shareholder of the Fund, you incur two types of costs: (1) transaction costs and (2) ongoing costs, including management fees and other Fund expenses. This Example is intended to help you understand your ongoing costs (in dollars) of investing in the Fund and to compare these costs with the ongoing costs of investing in other mutual funds.
The Example is based on an investment of $1,000 invested at the beginning of the period and held for the entire period (December 1, 2018 to May 31, 2019).
Actual Expenses
The first line of the accompanying table provides information about actual account values and actual expenses. You may use the information in this line, together with the amount you invested, to estimate the expenses that you paid over the period. Simply divide your account value by $1,000.00 (for example, an $8,600 account value divided by $1,000.00 = 8.6), then multiply the result by the number in the first line under the heading entitled "Expenses Paid During Period" to estimate the expenses you paid on your account during this period. In addition to the direct expenses incurred by the Fund presented in the table, as a shareholder of the underlying mutual funds (the Underlying Funds), the Fund also indirectly bears its proportionate share of the expenses of the Underlying Funds. In addition, the Fund, as a shareholder in the underlying Fidelity Central Funds, will indirectly bear its pro-rata share of the fees and expenses incurred by the underlying Fidelity Central Funds.
Hypothetical Example for Comparison Purposes
The second line of the accompanying table provides information about hypothetical account values and hypothetical expenses based on the Fund's actual expense ratio and an assumed rate of return of 5% per year before expenses, which is not the Fund's actual return. The hypothetical account values and expenses may not be used to estimate the actual ending account balance or expenses you paid for the period. You may use this information to compare the ongoing costs of investing in the Fund and other funds. To do so, compare this 5% hypothetical example with the 5% hypothetical examples that appear in the shareholder reports of the other funds. In addition to the direct expenses incurred by the Fund presented in the table, as a shareholder of the Underlying Funds, the Fund also indirectly bears its proportionate share of the expenses of the Underlying Funds. In addition, the Fund, as a shareholder in the underlying Fidelity Central Funds, will indirectly bear its pro-rata share of the fees and expenses incurred by the underlying Fidelity Central Funds.
Please note that the expenses shown in the table are meant to highlight your ongoing costs only and do not reflect any transaction costs. Therefore, the second line of the table is useful in comparing ongoing costs only, and will not help you determine the relative total costs of owning different funds.
| Annualized Expense Ratio-A | Beginning Account Value December 1, 2018 | Ending Account Value May 31, 2019 | Expenses Paid During Period-B December 1, 2018 to May 31, 2019 |
|
| Actual | .21% | $1,000.00 | $960.40 | $1.03 |
| Hypothetical-C | $1,000.00 | $1,023.88 | $1.06 |
A Annualized expense ratio reflects expenses net of applicable fee waivers.
B Expenses are equal to the Fund's annualized expense ratio, multiplied by the average account value over the period, multiplied by 182/365 (to reflect the one-half year period). The fees and expenses of the Underlying Funds in which the Fund invests are not included in the Funds's annualized expense ratio.
C 5% return per year before expenses
Distributions (Unaudited)
The Board of Trustees of Strategic Advisers Value Fund voted to pay on July 15, 2019, to shareholders of record at the opening of business on July 12, 2019, a distribution of $1.019 per share derived from capital gains realized from sales of portfolio securities and a dividend of $0.185 per share from net investment income.
The fund hereby designates as a capital gain dividend with respect to the taxable year ended May 31, 2019, $941,250,636, or, if subsequently determined to be different, the net capital gain of such year.
The fund designates 100% and 99% of the dividends distributed in July and December, respectively during the fiscal year as qualifying for the dividends–received deduction for corporate shareholders.
The fund designates 100% of the dividends distributed in July and December, during the fiscal year as amounts which may be taken into account as a dividend for the purposes of the maximum rate under section 1(h)(11) of the Internal Revenue Code.
The fund will notify shareholders in January 2020 of amounts for use in preparing 2019 income tax returns.
Board Approval of Investment Advisory Contracts and Management Fees
Strategic Advisers Value Fund
On December 5, 2018, the Board of Trustees, including the Independent Trustees (together, the Board), voted at an in-person meeting to approve an amendment to the fee schedule in the existing sub-advisory agreement with Boston Partners Global Investors, Inc. (Boston Partners) for the fund (the Amended Sub-Advisory Agreement), which has the potential to lower the amount of fees paid by Strategic Advisers LLC (Strategic Advisers) to Boston Partners, on behalf of the fund. The Board also approved amendments to the termination provision and the most favored nations provision of the Amended Sub-Advisory Agreement to recognize an exception for three legacy institutional accounts. The terms of the Amended Sub-Advisory Agreement are not materially different from those of the existing sub-advisory agreement, except with respect to the date of execution, the fee schedule, the termination and most favored nations provisions, and the updated reference to the legal entity name change for Strategic Advisers.
The Board, assisted by the advice of fund counsel and Independent Trustees' counsel, considered a broad range of information it believed relevant to the approval of the Amended Sub-Advisory Agreement.
In considering whether to approve the Amended Sub-Advisory Agreement, the Board reached a determination, with the assistance of fund counsel and Independent Trustees' counsel and through the exercise of its business judgment, that the approval of the Amended Sub-Advisory Agreement is in the best interests of the fund and its shareholders and that the approval of such agreement does not involve a conflict of interest from which Strategic Advisers or its affiliates derive an inappropriate advantage. Also, the Board found that the advisory fees to be charged under the Amended Sub-Advisory Agreement bear a reasonable relationship to the services to be rendered and will be based upon services provided that will be in addition to, rather than duplicative of services provided under the advisory contract of any underlying fund in which the fund may invest. The Board's decision to approve the Amended Sub-Advisory Agreement was not based on any single factor, but rather was based on a comprehensive consideration of all the information provided to the Board. In addition, individual Trustees did not necessarily attribute the same weight or importance to each factor.
Nature, Extent, and Quality of Services Provided. The Board considered that it reviewed information regarding Boston Partners, including the backgrounds of its investment personnel, and also took into consideration the fund's investment objective, strategies and related investment philosophy, in connection with the annual renewal of the current sub-advisory agreement at its September 2018 Board meeting.The Board considered that the Amended Sub-Advisory Agreement will not result in any changes to the nature, extent and quality of the services provided to the fund. The Board also considered that the Amended Sub-Advisory Agreement would not result in any changes to (i) the investment process or strategies employed in the management of the fund's assets, or (ii) the day-to-day management of the fund or the persons primarily responsible for such management. Investment Performance. The Board considered that it received information regarding the sub-adviser's historical investment performance in managing fund assets at its June 2018 Board meeting and throughout the year. The Board noted that the Amended Sub-Advisory Agreement would not result in any changes to the fund's investment processes or strategies or in the persons primarily responsible for the day-to-day management of the fund, and considered Boston Partners' contribution to the fund's overall performance since being allocated assets to manage.Based on its review, the Board concluded that the nature, extent, and quality of services that will be provided to the fund under the Amended Sub-Advisory Agreement will continue to benefit the fund's shareholders.Competitiveness of Management Fee and Total Fund Expenses.
The Board considered that the new fee schedule is expected to lower the amount of fees paid by Strategic Advisers to Boston Partners under the Amended Sub-Advisory Agreement, on behalf of the fund. The Board also considered that the Amended Sub-Advisory Agreement would not result in any changes to the fund's maximum aggregate annual management fee rate, Strategic Advisers' portion of the fund's management fee or Strategic Advisers' contractual management fee waiver for the fund. The Board also considered that the Amended Sub-Advisory Agreement has the potential to reduce total net fund expenses by the same amount as any resulting decrease in the fund's management fee. Based on its review, the Board concluded that the fund's management fee structure and total expenses continue to bear a reasonable relationship to the services that the fund and its shareholders will receive under the Amended Sub-Advisory Agreement and the other factors considered.In considering the lower fee schedule and the modifications to the most favored nations provision in the Amended Sub-Advisory Agreement, the Board took into account fees paid by certain legacy accounts managed by Boston Partners. The Board considered that Strategic Advisers had discussed with the Board that obtaining a lower rate than the fee schedule in the Amended Sub-Advisory Agreement from a comparable sub-adviser was unlikely. The Board also considered the reasonableness of the lower fee schedule in light of the differentiated and desirable exposure that the mandate provides to the Fund.The Board considered that the amended termination provision in the Amended Sub-Advisory Agreement would serve to extend the period during which the Fund would potentially benefit from the new fee schedule, and noted that this amendment does not modify the ability of Strategic Advisers and the fund (by action of the Board or the fund's shareholders) to terminate the Amended Sub-Advisory Agreement without penalty on 60 days' notice.Because the Amended Sub-Advisory Agreement was negotiated at arm's length and will have no impact on the maximum management fees payable by the fund, the Board did not consider the costs of services and profitability of the relationship with the fund to Strategic Advisers to be significant factors in its decision to approve the Amended Sub-Advisory Agreement. Potential Fall-Out Benefits. The Board considered that it reviews information regarding the potential of direct and indirect benefits to Strategic Advisers and its affiliates from their relationships with the fund, including non-advisory fee compensation paid to affiliates of Strategic Advisers, if any, as well as information regarding potential fall-out benefits accruing to the sub-adviser, if any, as a result of its relationship with the fund, during its annual renewal of the fund's advisory agreements at its September Board meeting. Possible Economies of Scale. The Board considered that the Amended Sub-Advisory Agreement, like the current sub-advisory agreement, provides for breakpoints that have the potential to further reduce sub-advisory fees paid to Boston Partners as assets allocated to the sub-adviser grow. The Board also considered that it reviewed whether there have been economies of scale in connection with the management of the fund during its annual renewal of the fund's advisory agreement with Strategic Advisers at its September 2018 Board meeting. Conclusion. Based on its evaluation of all of the conclusions noted above, and after considering all factors it believed relevant, the Board ultimately concluded that the Amended Sub-Advisory Agreement's fee structure continues to bear a reasonable relationship to the services rendered to the fund and that the Amended Sub-Advisory Agreement should be approved because the agreement is in the best interests of the fund and its shareholders. The Board also concluded that the sub-advisory fees to be charged thereunder will be based on services provided that will be in addition to, rather than duplicative of services provided under the advisory contract of any underlying fund in which the fund may invest. In addition, the Board concluded that the approval of the Amended Sub-Advisory Agreement does not involve a conflict of interest from which Strategic Advisers or its affiliates derive an inappropriate advantage.
![]()
SUF-ANN-0719
1.912897.110
|
Strategic Advisers® Core Fund Offered exclusively to certain clients of Strategic Advisers LLC - not available for sale to the general public Annual Report May 31, 2019 |
|
|
Beginning on January 1, 2021, as permitted by regulations adopted by the Securities and Exchange Commission, paper copies of a fund’s shareholder reports will no longer be sent by mail, unless you specifically request paper copies of the reports from the fund or from your financial intermediary, such as a financial advisor, broker-dealer or bank. Instead, the reports will be made available on a website, and you will be notified by mail each time a report is posted and provided with a website link to access the report.
If you already elected to receive shareholder reports electronically, you will not be affected by this change and you need not take any action. You may elect to receive shareholder reports and other communications from a fund electronically, by contacting your financial intermediary. For Fidelity customers, visit Fidelity's web site or call Fidelity using the contact information listed below.
You may elect to receive all future reports in paper free of charge. If you wish to continue receiving paper copies of your shareholder reports, you may contact your financial intermediary or, if you are a Fidelity customer, visit Fidelity’s website, or call Fidelity at the applicable toll-free number listed below. Your election to receive reports in paper will apply to all funds held with the fund complex/your financial intermediary.
| Account Type | Website | Phone Number |
| Brokerage, Mutual Fund, or Annuity Contracts: | fidelity.com/mailpreferences | 1-800-343-3548 |
| Employer Provided Retirement Accounts: | netbenefits.fidelity.com/preferences (choose 'no' under Required Disclosures to continue to print) | 1-800-343-0860 |
| Advisor Sold Accounts Serviced Through Your Financial Intermediary: | Contact Your Financial Intermediary | Your Financial Intermediary's phone number |
| Advisor Sold Accounts Serviced by Fidelity: | institutional.fidelity.com | 1-877-208-0098 |
Contents
To view a fund's proxy voting record for the 12-month period ended June 30, visit http://www.fidelity.com/proxyvotingresults or visit the Securities and Exchange Commission's (SEC) web site at http://www.sec.gov.
You may also call 1-800-544-3455 to request a free copy of the proxy voting guidelines.
Standard & Poor's, S&P and S&P 500 are registered service marks of The McGraw-Hill Companies, Inc. and have been licensed for use by Fidelity Distributors Corporation.
Other third-party marks appearing herein are the property of their respective owners.
All other marks appearing herein are registered or unregistered trademarks or service marks of FMR LLC or an affiliated company. © 2019 FMR LLC. All rights reserved.
This report and the financial statements contained herein are submitted for the general information of the shareholders of the Fund. This report is not authorized for distribution to prospective investors in the Fund unless preceded or accompanied by an effective prospectus.
A fund files its complete schedule of portfolio holdings with the SEC for the first and third quarters of each fiscal year on Form N-PORT. Forms N-PORT are available on the SEC’s web site at http://www.sec.gov. A fund's Forms N-PORT may be reviewed and copied at the SEC’s Public Reference Room in Washington, DC. Information regarding the operation of the SEC's Public Reference Room may be obtained by calling 1-800-SEC-0330.
For a complete list of a fund's portfolio holdings, view the most recent holdings listing, semiannual report, or annual report on Fidelity's web site at http://www.fidelity.com, http://www.institutional.fidelity.com, or http://www.401k.com, as applicable.
NOT FDIC INSURED •MAY LOSE VALUE •NO BANK GUARANTEE
Neither the Fund nor Fidelity Distributors Corporation is a bank.
Performance: The Bottom Line
Average annual total return reflects the change in the value of an investment, assuming reinvestment of distributions from dividend income and capital gains (the profits earned upon the sale of securities that have grown in value, if any) and assuming a constant rate of performance each year. The hypothetical investment and the average annual total returns do not reflect the deduction of taxes that a shareholder would pay on fund distributions or the redemption of fund shares. During periods of reimbursement by Fidelity, a fund’s total return will be greater than it would be had the reimbursement not occurred. How a fund did yesterday is no guarantee of how it will do tomorrow.
Average Annual Total Returns
| For the periods ended May 31, 2019 | Past 1 year | Past 5 years | Life of fundA |
| Strategic Advisers® Core Fund | 2.41% | 8.85% | 11.34% |
A From December 30, 2009
$10,000 Over Life of Fund
Let's say hypothetically that $10,000 was invested in Strategic Advisers® Core Fund on December 30, 2009, when the fund started.
The chart shows how the value of your investment would have changed, and also shows how the S&P 500® Index performed over the same period.
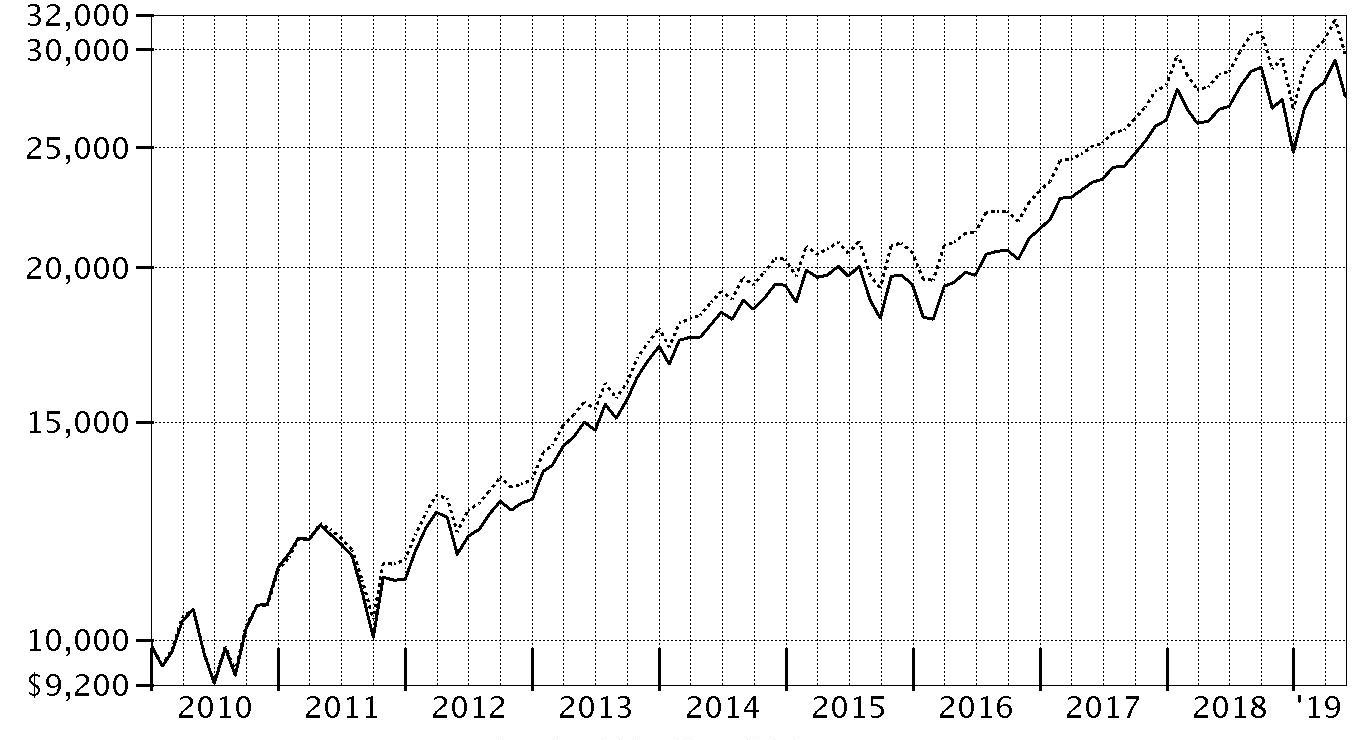
| Period Ending Values | ||
|
| $27,514 | Strategic Advisers® Core Fund |
|
| $29,735 | S&P 500® Index |
Management's Discussion of Fund Performance
Market Recap: The S&P 500® index gained 3.78% for the 12 months ending May 31, 2019, as U.S. equities began the new year on a high note after enduring a historically volatile final quarter of 2018. Upbeat company earnings/outlooks and signs the U.S. Federal Reserve may pause on rates boosted the index to an all-time high on April 30. In May, however, volatility spiked and stocks returned -6.35% for the month amid the Fed’s decision to hold interest rates steady and signal that it had little appetite to adjust them any time soon, as well as retaliatory tariffs imposed on the U.S. by China. The downtrend was similar to late 2018, when many investors fled from risk assets as they were still dealing with lingering uncertainty related to global trade and the Fed picking up the pace of rate hikes. The index returned -6.84% in October, at the time its largest monthly drop in seven years. But conditions worsened through Christmas, as jitters about the economy and another hike in rates led to a spike in market volatility and a -9.03% result for December. For the full period, three defensive sectors stood out: real estate (+20%), utilities (+18%) and consumer staples (+16%). Information technology was up 7% and health care stocks rose about 8%. Communication services – a newly reconstituted mix of telecommunications stocks and higher-growth media names – gained 5%, as did consumer discretionary. In contrast, energy (-20%) fared worst, while materials (-7%), financials (-2%) and industrials (-1%) also lagged. Comments from Lead Portfolio Manager John Stone: For the fiscal year, the Fund gained 2.41%, trailing the benchmark S&P 500®. Underlying managers that were aggressively positioned or that had more of a value orientation performed poorly versus the benchmark. In contrast, strategies emphasizing company quality and low volatility aided the Fund’s relative performance. The Sector Managed strategy from sub-adviser FIAM℠ was the biggest relative detractor, hampered by its smaller-cap and higher-growth bias, as well as broadly negative stock selection. Value-focused sub-advisers LSV Asset Management and Brandywine Global Investment Management also worked against the Fund’s relative result. These managers struggled due to a combination of out-of-favor investment styles, weak stock selection in several market sectors and underweighted exposure to more-defensive industry groups. On the plus side, sub-adviser T. Rowe Price aided relative performance, partly because this manager’s benchmark-like, sector-neutral core strategy provided beneficial exposure to defensive market sectors. Sub-adviser OppenheimerFunds – which was acquired by Invesco Advisors during the period – outpaced the Fund’s benchmark and also contributed. As of May 31, we continued to reduce economically sensitive risk in the portfolio – a process we began in the prior reporting period.The views expressed above reflect those of the portfolio manager(s) only through the end of the period as stated on the cover of this report and do not necessarily represent the views of Fidelity or any other person in the Fidelity organization. Any such views are subject to change at any time based upon market or other conditions and Fidelity disclaims any responsibility to update such views. These views may not be relied on as investment advice and, because investment decisions for a Fidelity fund are based on numerous factors, may not be relied on as an indication of trading intent on behalf of any Fidelity fund.
Investment Summary (Unaudited)
The information in the following tables is based on the direct investments of the Fund.Top Ten Holdings as of May 31, 2019
| (excluding cash equivalents) | % of fund's net assets |
| Fidelity SAI U.S. Quality Index Fund | 8.7 |
| JPMorgan U.S. Large Cap Core Plus Fund Select Class(a) | 6.1 |
| Fidelity SAI U.S. Large Cap Index Fund | 4.9 |
| Microsoft Corp.(b) | 3.6 |
| Amazon.com, Inc. | 2.2 |
| Apple, Inc. | 1.9 |
| JPMorgan Chase & Co. | 1.6 |
| Alphabet, Inc. Class C | 1.6 |
| PIMCO StocksPLUS Absolute Return Fund Institutional Class | 1.5 |
| Facebook, Inc. Class A | 1.4 |
| 33.5 |
(a) The JPMorgan U.S. Large Cap Core Plus Fund seeks to provide a high total return from a portfolio of selected equity securities which includes both long and short positions.
(b) Security or a portion of the security is pledged as collateral for call options written.
Top Five Market Sectors as of May 31, 2019
| (stocks only) | % of fund's net assets |
| Information Technology | 15.0 |
| Financials | 11.8 |
| Health Care | 10.9 |
| Communication Services | 8.5 |
| Industrials | 8.1 |
Asset Allocation (% of fund's net assets)
| As of May 31, 2019 | ||
| Common Stocks | 75.8% | |
| Large Blend Funds | 12.5% | |
| Large Growth Funds | 10.2% | |
| Short-Term Investments and Net Other Assets (Liabilities) | 1.5% | |

Asset allocations of funds in the pie chart reflect the categorizations of assets as defined by Morningstar as of the reporting date indicated above.
Schedule of Investments May 31, 2019
Showing Percentage of Net Assets
| Common Stocks - 75.8% | |||
| Shares | Value | ||
| COMMUNICATION SERVICES - 8.5% | |||
| Diversified Telecommunication Services - 0.9% | |||
| AT&T, Inc. | 3,316,478 | $101,417,897 | |
| Verizon Communications, Inc. | 2,131,274 | 115,834,742 | |
| 217,252,639 | |||
| Entertainment - 1.8% | |||
| Activision Blizzard, Inc. | 696,250 | 30,196,363 | |
| Cinemark Holdings, Inc. | 8,061 | 306,237 | |
| Electronic Arts, Inc. (a) | 762,578 | 70,980,760 | |
| Netflix, Inc. (a) | 299,146 | 102,690,839 | |
| Take-Two Interactive Software, Inc. (a) | 31,100 | 3,363,465 | |
| The Walt Disney Co. | 1,229,428 | 162,333,673 | |
| Viacom, Inc. Class B (non-vtg.) | 118,831 | 3,449,664 | |
| Vivendi SA (b) | 3,070,304 | 82,672,252 | |
| 455,993,253 | |||
| Interactive Media & Services - 3.6% | |||
| Alphabet, Inc.: | |||
| Class A (a) | 131,598 | 145,613,187 | |
| Class C (a) | 350,854 | 387,213,000 | |
| Facebook, Inc. Class A (a) | 1,977,477 | 350,942,843 | |
| Momo, Inc. ADR | 109,700 | 3,024,429 | |
| Twitter, Inc. (a) | 161,903 | 5,899,745 | |
| 892,693,204 | |||
| Media - 2.1% | |||
| Altice U.S.A., Inc. Class A | 1,149,716 | 27,006,829 | |
| CBS Corp. Class B | 38,388 | 1,853,373 | |
| Charter Communications, Inc. Class A (a) | 191,081 | 71,999,321 | |
| Comcast Corp. Class A | 7,745,393 | 317,561,113 | |
| Discovery Communications, Inc. Class C (non-vtg.) (a) | 754,270 | 19,339,483 | |
| DISH Network Corp. Class A (a) | 1,018,454 | 36,776,374 | |
| Fox Corp. Class A | 360,200 | 12,689,846 | |
| Gannett Co., Inc. | 184,400 | 1,449,384 | |
| Interpublic Group of Companies, Inc. | 44,336 | 940,810 | |
| Liberty Broadband Corp. Class C (a) | 275,976 | 27,087,044 | |
| Omnicom Group, Inc. | 24,020 | 1,858,187 | |
| Tegna, Inc. | 64,900 | 982,586 | |
| 519,544,350 | |||
| Wireless Telecommunication Services - 0.1% | |||
| T-Mobile U.S., Inc. (a) | 337,101 | 24,756,697 | |
| TOTAL COMMUNICATION SERVICES | 2,110,240,143 | ||
| CONSUMER DISCRETIONARY - 7.5% | |||
| Auto Components - 0.2% | |||
| Aptiv PLC | 330,341 | 21,155,038 | |
| BorgWarner, Inc. | 387,334 | 13,742,610 | |
| Cooper Tire & Rubber Co. | 55,800 | 1,538,964 | |
| Garrett Motion, Inc. (a)(b) | 25,861 | 397,742 | |
| Gentex Corp. | 31,657 | 676,194 | |
| Lear Corp. | 49,500 | 5,891,985 | |
| Magna International, Inc. Class A (sub. vtg.) | 105,900 | 4,535,773 | |
| The Goodyear Tire & Rubber Co. | 186,300 | 2,498,283 | |
| 50,436,589 | |||
| Automobiles - 0.2% | |||
| Ferrari NV | 112,200 | 16,046,844 | |
| Ford Motor Co. | 981,231 | 9,341,319 | |
| General Motors Co. | 559,633 | 18,658,164 | |
| Harley-Davidson, Inc. | 117,454 | 3,843,095 | |
| Tesla, Inc. (a)(b) | 11,000 | 2,036,760 | |
| Thor Industries, Inc. | 14,440 | 745,682 | |
| 50,671,864 | |||
| Distributors - 0.0% | |||
| Genuine Parts Co. | 13,533 | 1,338,414 | |
| Diversified Consumer Services - 0.0% | |||
| Arco Platform Ltd. Class A | 65,100 | 2,499,840 | |
| Grand Canyon Education, Inc. (a) | 6,100 | 731,146 | |
| H&R Block, Inc. | 22,212 | 583,065 | |
| 3,814,051 | |||
| Hotels, Restaurants & Leisure - 1.5% | |||
| Brinker International, Inc. (b) | 44,600 | 1,675,622 | |
| Carnival Corp. | 266,020 | 13,617,564 | |
| Darden Restaurants, Inc. | 108,400 | 12,609,088 | |
| Domino's Pizza, Inc. | 76,904 | 21,494,668 | |
| Hilton Worldwide Holdings, Inc. | 157,161 | 14,056,480 | |
| Hyatt Hotels Corp. Class A | 4,191 | 302,758 | |
| Las Vegas Sands Corp. | 27,226 | 1,497,430 | |
| Marriott International, Inc. Class A | 106,500 | 13,295,460 | |
| McDonald's Corp. | 525,000 | 104,091,750 | |
| MGM Mirage, Inc. | 353,000 | 8,761,460 | |
| Norwegian Cruise Line Holdings Ltd. (a) | 24,717 | 1,352,267 | |
| Restaurant Brands International, Inc. | 416,260 | 27,397,521 | |
| Royal Caribbean Cruises Ltd. | 418,540 | 50,961,430 | |
| Starbucks Corp. | 693,751 | 52,766,701 | |
| The Stars Group, Inc. (a)(b) | 130,200 | 2,156,112 | |
| U.S. Foods Holding Corp. (a) | 10,837 | 374,527 | |
| Wyndham Destinations, Inc. | 74,821 | 2,976,379 | |
| Wyndham Hotels & Resorts, Inc. | 27,321 | 1,457,302 | |
| Yum! Brands, Inc. | 348,586 | 35,677,777 | |
| 366,522,296 | |||
| Household Durables - 0.3% | |||
| D.R. Horton, Inc. | 176,021 | 7,526,658 | |
| Leggett & Platt, Inc. | 14,118 | 501,330 | |
| Lennar Corp. Class A | 612,158 | 30,399,766 | |
| Mohawk Industries, Inc. (a) | 18,400 | 2,494,120 | |
| NVR, Inc. (a) | 4,674 | 14,964,138 | |
| PulteGroup, Inc. | 255,508 | 7,920,748 | |
| Toll Brothers, Inc. | 15,944 | 554,373 | |
| Whirlpool Corp. | 44,906 | 5,158,801 | |
| 69,519,934 | |||
| Internet & Direct Marketing Retail - 2.8% | |||
| Amazon.com, Inc. (a) | 305,903 | 542,999,238 | |
| Meituan Dianping Class B (b) | 1,683,700 | 13,004,322 | |
| The Booking Holdings, Inc.(a) | 70,428 | 116,644,262 | |
| Yahoo!, Inc. (a) | 362,788 | 21,477,050 | |
| 694,124,872 | |||
| Leisure Products - 0.0% | |||
| Brunswick Corp. | 130,300 | 5,404,844 | |
| Mattel, Inc. (a)(b) | 328,730 | 3,237,991 | |
| Polaris Industries, Inc. | 6,700 | 535,196 | |
| 9,178,031 | |||
| Multiline Retail - 0.2% | |||
| Big Lots, Inc. | 13,500 | 372,600 | |
| Dillard's, Inc. Class A (b) | 19,700 | 1,116,202 | |
| Dollar General Corp. | 137,286 | 17,473,762 | |
| Dollar Tree, Inc. (a) | 154,000 | 15,644,860 | |
| Kohl's Corp. | 121,110 | 5,973,145 | |
| Macy's, Inc. | 103,200 | 2,122,824 | |
| Target Corp. | 201,458 | 16,207,296 | |
| 58,910,689 | |||
| Specialty Retail - 2.0% | |||
| Advance Auto Parts, Inc. | 13,177 | 2,042,435 | |
| AutoZone, Inc. (a) | 18,940 | 19,453,463 | |
| Best Buy Co., Inc. | 529,998 | 33,214,975 | |
| Burlington Stores, Inc. (a) | 100,600 | 15,751,948 | |
| CarMax, Inc. (a) | 20,873 | 1,633,938 | |
| Foot Locker, Inc. | 39,722 | 1,563,061 | |
| Gap, Inc. | 146,443 | 2,735,555 | |
| L Brands, Inc. | 30,000 | 673,800 | |
| Lowe's Companies, Inc. | 413,403 | 38,562,232 | |
| O'Reilly Automotive, Inc. (a) | 186,768 | 69,360,032 | |
| Office Depot, Inc. | 40,900 | 80,164 | |
| Penske Automotive Group, Inc. | 60,300 | 2,576,016 | |
| Ross Stores, Inc. | 597,490 | 55,560,595 | |
| The Home Depot, Inc. | 873,173 | 165,771,894 | |
| TJX Companies, Inc. | 1,127,608 | 56,707,406 | |
| Ulta Beauty, Inc. (a) | 56,390 | 18,799,298 | |
| 484,486,812 | |||
| Textiles, Apparel & Luxury Goods - 0.3% | |||
| Capri Holdings Ltd. (a) | 28,921 | 939,354 | |
| Hanesbrands, Inc. | 34,246 | 508,553 | |
| Kontoor Brands, Inc. (a) | 14,551 | 426,344 | |
| NIKE, Inc. Class B | 548,000 | 42,272,720 | |
| PVH Corp. | 154,316 | 13,146,180 | |
| Ralph Lauren Corp. | 5,731 | 602,500 | |
| Tapestry, Inc. | 243,600 | 6,957,216 | |
| VF Corp. | 146,700 | 12,011,796 | |
| 76,864,663 | |||
| TOTAL CONSUMER DISCRETIONARY | 1,865,868,215 | ||
| CONSUMER STAPLES - 4.9% | |||
| Beverages - 0.8% | |||
| Constellation Brands, Inc. Class A (sub. vtg.) | 190,501 | 33,613,901 | |
| Keurig Dr. Pepper, Inc. (b) | 497,387 | 14,021,340 | |
| Molson Coors Brewing Co. Class B | 54,278 | 2,984,204 | |
| PepsiCo, Inc. | 467,739 | 59,870,592 | |
| The Coca-Cola Co. | 1,539,179 | 75,619,864 | |
| 186,109,901 | |||
| Food & Staples Retailing - 0.8% | |||
| Costco Wholesale Corp. | 118,300 | 28,342,314 | |
| Kroger Co. | 709,361 | 16,180,524 | |
| Sysco Corp. | 185,200 | 12,745,464 | |
| Walgreens Boots Alliance, Inc. | 251,065 | 12,387,547 | |
| Walmart, Inc. | 1,217,495 | 123,502,693 | |
| 193,158,542 | |||
| Food Products - 0.9% | |||
| Archer Daniels Midland Co. | 134,762 | 5,164,080 | |
| Bunge Ltd. | 114,000 | 5,961,060 | |
| Campbell Soup Co. (b) | 32,373 | 1,175,464 | |
| Conagra Brands, Inc. | 1,870,046 | 50,061,131 | |
| General Mills, Inc. | 569,465 | 28,154,350 | |
| Ingredion, Inc. | 42,234 | 3,216,541 | |
| Kellogg Co. | 36,978 | 1,943,564 | |
| Mondelez International, Inc. | 1,370,902 | 69,710,367 | |
| Nestle SA sponsored ADR | 252,000 | 24,988,320 | |
| Pilgrim's Pride Corp. (a) | 148,000 | 3,784,360 | |
| Post Holdings, Inc. (a) | 96,600 | 10,152,660 | |
| The J.M. Smucker Co. | 63,449 | 7,712,860 | |
| Tyson Foods, Inc. Class A | 303,020 | 22,996,188 | |
| 235,020,945 | |||
| Household Products - 1.2% | |||
| Church & Dwight Co., Inc. | 204,250 | 15,198,243 | |
| Kimberly-Clark Corp. | 200,100 | 25,590,789 | |
| Procter & Gamble Co. (c) | 2,373,199 | 244,225,909 | |
| 285,014,941 | |||
| Personal Products - 0.2% | |||
| Estee Lauder Companies, Inc. Class A | 246,691 | 39,724,652 | |
| Herbalife Nutrition Ltd. (a) | 234,400 | 9,793,232 | |
| 49,517,884 | |||
| Tobacco - 1.0% | |||
| Altria Group, Inc. | 2,189,108 | 107,397,638 | |
| British American Tobacco PLC sponsored ADR | 376,000 | 13,035,920 | |
| Philip Morris International, Inc. | 1,716,560 | 132,398,273 | |
| 252,831,831 | |||
| TOTAL CONSUMER STAPLES | 1,201,654,044 | ||
| ENERGY - 4.0% | |||
| Energy Equipment & Services - 0.2% | |||
| AKITA Drilling Ltd. Class A (non-vtg.) | 24,301 | 50,522 | |
| Baker Hughes, a GE Co. Class A | 307,200 | 6,577,152 | |
| Dmc Global, Inc. | 1,400 | 94,696 | |
| Forum Energy Technologies, Inc. (a) | 112,800 | 430,896 | |
| Halliburton Co. | 590,800 | 12,578,132 | |
| Helix Energy Solutions Group, Inc. (a) | 13,800 | 93,288 | |
| Helmerich & Payne, Inc. | 12,545 | 613,576 | |
| Hunting PLC | 33,300 | 213,866 | |
| Liberty Oilfield Services, Inc. Class A | 51,600 | 657,900 | |
| Nabors Industries Ltd. | 243,052 | 573,603 | |
| Odfjell Drilling Ltd. (a) | 74,000 | 219,167 | |
| Patterson-UTI Energy, Inc. | 19,300 | 205,159 | |
| Precision Drilling Corp. (a) | 115,000 | 210,158 | |
| RigNet, Inc. (a) | 53,600 | 447,024 | |
| Schlumberger Ltd. | 225,900 | 7,836,471 | |
| Shelf Drilling Ltd. (a)(d) | 124,400 | 517,403 | |
| Solaris Oilfield Infrastructure, Inc. Class A | 49,200 | 700,116 | |
| Tenaris SA sponsored ADR | 4,500 | 104,895 | |
| 32,124,024 | |||
| Oil, Gas & Consumable Fuels - 3.8% | |||
| Anadarko Petroleum Corp. | 26,800 | 1,885,916 | |
| Berry Petroleum Corp. | 60,000 | 645,000 | |
| BP PLC sponsored ADR | 880,528 | 35,855,100 | |
| Brigham Minerals, Inc. Class A | 25,600 | 525,568 | |
| Cabot Oil & Gas Corp. | 332,000 | 8,306,640 | |
| Canadian Natural Resources Ltd. | 3,800 | 102,562 | |
| Cenovus Energy, Inc. (Canada) | 2,167,200 | 17,766,037 | |
| Cheniere Energy, Inc. (a) | 54,900 | 3,468,582 | |
| Chevron Corp. | 1,400,744 | 159,474,704 | |
| Concho Resources, Inc. | 234,516 | 22,984,913 | |
| ConocoPhillips Co. | 278,775 | 16,436,574 | |
| Continental Resources, Inc. (a) | 45,100 | 1,578,500 | |
| Delek U.S. Holdings, Inc. | 41,829 | 1,280,386 | |
| Devon Energy Corp. | 86,000 | 2,163,760 | |
| Diamondback Energy, Inc. | 261,333 | 25,626,314 | |
| Encana Corp. (Toronto) | 368,300 | 1,942,867 | |
| Enterprise Products Partners LP | 25,200 | 702,828 | |
| EOG Resources, Inc. | 767,714 | 62,860,422 | |
| Equinor ASA sponsored ADR | 870,200 | 16,664,330 | |
| Euronav NV (b) | 56,321 | 473,096 | |
| Exxon Mobil Corp. | 3,872,077 | 274,026,889 | |
| Galp Energia SGPS SA Class B | 330,600 | 4,978,566 | |
| GasLog Partners LP (b) | 8,300 | 175,379 | |
| Golar LNG Ltd. | 19,400 | 352,886 | |
| Hess Corp. | 538,455 | 30,078,096 | |
| Kinder Morgan, Inc. | 209,534 | 4,180,203 | |
| Kosmos Energy Ltd. | 155,400 | 957,264 | |
| Lundin Petroleum AB | 28,900 | 788,426 | |
| Magellan Midstream Partners LP | 158,029 | 9,718,784 | |
| Magnolia Oil & Gas Corp. Class A (a)(b) | 79,000 | 871,370 | |
| Marathon Petroleum Corp. | 879,567 | 40,451,286 | |
| Murphy Oil Corp. | 16,149 | 401,303 | |
| National Energy Services Reunited Corp. (a) | 1,500 | 13,545 | |
| Noble Energy, Inc. | 107,700 | 2,304,780 | |
| Northern Oil & Gas, Inc. (a) | 337,600 | 671,824 | |
| Occidental Petroleum Corp. | 466,700 | 23,227,659 | |
| Par Pacific Holdings, Inc. (a) | 34,300 | 672,280 | |
| Parex Resources, Inc. (a) | 103,900 | 1,572,029 | |
| Parsley Energy, Inc. Class A (a) | 511,996 | 9,128,889 | |
| PBF Energy, Inc. Class A | 124,900 | 3,297,360 | |
| PDC Energy, Inc. (a) | 17,300 | 527,996 | |
| Peabody Energy Corp. | 11,500 | 270,480 | |
| Phillips 66 Co. | 164,524 | 13,293,539 | |
| Pioneer Natural Resources Co. | 254,363 | 36,109,371 | |
| Reliance Industries Ltd. | 30,733 | 587,020 | |
| Suncor Energy, Inc. | 845,635 | 26,045,558 | |
| Suncor Energy, Inc. | 52,800 | 1,627,049 | |
| Talos Energy, Inc. (a) | 14,600 | 340,764 | |
| Targa Resources Corp. | 99,700 | 3,834,462 | |
| Teekay LNG Partners LP | 6,500 | 85,345 | |
| Texas Pacific Land Trust | 100 | 73,701 | |
| The Williams Companies, Inc. | 24,538 | 647,312 | |
| Total SA sponsored ADR | 411,900 | 21,212,850 | |
| TransCanada Corp. | 422,450 | 20,594,281 | |
| Valero Energy Corp. | 389,588 | 27,426,995 | |
| Viper Energy Partners LP | 72,700 | 2,035,600 | |
| W&T Offshore, Inc. (a) | 27,500 | 115,500 | |
| Whiting Petroleum Corp. (a) | 22,700 | 417,226 | |
| 943,857,966 | |||
| TOTAL ENERGY | 975,981,990 | ||
| FINANCIALS - 11.8% | |||
| Banks - 6.0% | |||
| Bank of America Corp. | 8,673,427 | 230,713,158 | |
| BB&T Corp. | 167,312 | 7,821,836 | |
| CIT Group, Inc. | 89,554 | 4,257,397 | |
| Citigroup, Inc. | 4,691,005 | 291,545,961 | |
| Citizens Financial Group, Inc. | 299,487 | 9,757,286 | |
| Comerica, Inc. | 17,003 | 1,170,146 | |
| Commerce Bancshares, Inc. | 12,104 | 693,922 | |
| Cullen/Frost Bankers, Inc. | 7,314 | 667,549 | |
| Danske Bank A/S | 331,274 | 5,451,275 | |
| EFG Eurobank Ergasias SA (a) | 781,100 | 763,530 | |
| Fifth Third Bancorp | 1,417,300 | 37,558,450 | |
| First Horizon National Corp. | 376,100 | 5,043,501 | |
| First Republic Bank | 186,102 | 18,055,616 | |
| Huntington Bancshares, Inc. | 1,280,611 | 16,199,729 | |
| JPMorgan Chase & Co. | 3,682,963 | 390,246,759 | |
| KeyCorp | 2,213,728 | 35,353,236 | |
| M&T Bank Corp. | 40,297 | 6,431,401 | |
| PNC Financial Services Group, Inc. | 458,433 | 58,340,184 | |
| Popular, Inc. | 10,534 | 549,980 | |
| Prosperity Bancshares, Inc. | 8,034 | 520,684 | |
| Regions Financial Corp. | 618,965 | 8,560,286 | |
| Sberbank of Russia sponsored ADR | 130,600 | 1,887,170 | |
| Signature Bank | 38,658 | 4,428,274 | |
| SunTrust Banks, Inc. | 434,306 | 26,062,703 | |
| SVB Financial Group (a) | 96,312 | 19,397,237 | |
| U.S. Bancorp | 1,824,509 | 91,590,352 | |
| Webster Financial Corp. | 10,623 | 470,386 | |
| Wells Fargo & Co. | 4,477,408 | 198,662,593 | |
| Zions Bancorp NA | 22,769 | 980,661 | |
| 1,473,181,262 | |||
| Capital Markets - 1.8% | |||
| Ameriprise Financial, Inc. | 265,704 | 36,728,264 | |
| Bank of New York Mellon Corp. | 194,532 | 8,304,571 | |
| BlackRock, Inc. Class A | 31,648 | 13,151,643 | |
| Brookfield Asset Management, Inc. Class A | 64,900 | 2,977,064 | |
| Cboe Global Markets, Inc. | 240,394 | 26,092,365 | |
| Charles Schwab Corp. | 1,399,536 | 58,234,693 | |
| E*TRADE Financial Corp. | 299,988 | 13,439,462 | |
| Franklin Resources, Inc. | 211,333 | 6,724,616 | |
| Goldman Sachs Group, Inc. | 69,202 | 12,628,673 | |
| IntercontinentalExchange, Inc. | 500,674 | 41,160,410 | |
| KKR & Co. LP | 203,800 | 4,540,664 | |
| Legg Mason, Inc. | 76,000 | 2,707,120 | |
| LPL Financial | 9,073 | 727,836 | |
| Monex Group, Inc. | 243,200 | 738,941 | |
| Morgan Stanley | 2,054,135 | 83,582,753 | |
| Northern Trust Corp. | 69,368 | 5,932,351 | |
| Raymond James Financial, Inc. | 88,687 | 7,323,772 | |
| S&P Global, Inc. | 169,405 | 36,232,341 | |
| SEI Investments Co. | 16,675 | 837,919 | |
| State Street Corp. | 563,547 | 31,135,972 | |
| T. Rowe Price Group, Inc. | 26,158 | 2,645,620 | |
| TD Ameritrade Holding Corp. | 448,910 | 22,333,273 | |
| The Blackstone Group LP | 763,312 | 28,891,359 | |
| The NASDAQ OMX Group, Inc. | 14,921 | 1,352,439 | |
| Tradeweb Markets, Inc. Class A | 116,790 | 5,266,061 | |
| Virtu Financial, Inc. Class A (b) | 121,770 | 2,803,145 | |
| 456,493,327 | |||
| Consumer Finance - 0.7% | |||
| 360 Finance, Inc. ADR (b) | 98,600 | 1,584,502 | |
| Ally Financial, Inc. | 499,748 | 14,427,725 | |
| American Express Co. | 203,069 | 23,294,045 | |
| Capital One Financial Corp. | 863,881 | 74,181,461 | |
| Credit Acceptance Corp. (a) | 2,062 | 941,076 | |
| Discover Financial Services | 133,595 | 9,959,507 | |
| Green Dot Corp. Class A (a) | 18,400 | 853,944 | |
| LexinFintech Holdings Ltd. ADR (a) | 158,417 | 1,790,112 | |
| Navient Corp. | 115,400 | 1,504,816 | |
| OneMain Holdings, Inc. | 350,300 | 10,463,461 | |
| PPDAI Group, Inc. ADR | 29,288 | 137,946 | |
| Santander Consumer U.S.A. Holdings, Inc. | 41,506 | 929,319 | |
| SLM Corp. | 234,592 | 2,230,970 | |
| Synchrony Financial | 580,252 | 19,513,875 | |
| 161,812,759 | |||
| Diversified Financial Services - 1.4% | |||
| AXA Equitable Holdings, Inc. | 1,812,427 | 37,245,375 | |
| Berkshire Hathaway, Inc. Class B (a) | 1,477,787 | 291,744,710 | |
| Jefferies Financial Group, Inc. | 41,079 | 725,866 | |
| Voya Financial, Inc. | 300,106 | 15,284,399 | |
| 345,000,350 | |||
| Insurance - 1.9% | |||
| AFLAC, Inc. | 175,646 | 9,010,640 | |
| Alleghany Corp. (a) | 1,762 | 1,168,735 | |
| Allstate Corp. | 360,126 | 34,395,634 | |
| American Financial Group, Inc. | 19,859 | 1,950,154 | |
| American International Group, Inc. | 1,114,700 | 56,927,729 | |
| Arch Capital Group Ltd. (a) | 17,380 | 598,393 | |
| Athene Holding Ltd. (a) | 17,653 | 717,594 | |
| Chubb Ltd. | 390,847 | 57,091,021 | |
| Cincinnati Financial Corp. | 18,898 | 1,856,540 | |
| CNA Financial Corp. | 55,000 | 2,472,800 | |
| Everest Re Group Ltd. | 27,170 | 6,728,922 | |
| FNF Group | 138,515 | 5,339,753 | |
| Genworth Financial, Inc. Class A | 116,700 | 339,597 | |
| Hartford Financial Services Group, Inc. | 229,186 | 12,068,935 | |
| Lincoln National Corp. | 339,641 | 20,191,657 | |
| Loews Corp. | 37,930 | 1,948,085 | |
| Markel Corp. (a) | 1,610 | 1,704,781 | |
| Marsh & McLennan Companies, Inc. | 304,854 | 29,144,042 | |
| MetLife, Inc. | 1,368,745 | 63,249,706 | |
| Principal Financial Group, Inc. | 30,379 | 1,566,645 | |
| Progressive Corp. | 897,062 | 71,119,075 | |
| Prudential Financial, Inc. | 124,660 | 11,516,091 | |
| Reinsurance Group of America, Inc. | 30,880 | 4,572,093 | |
| The Travelers Companies, Inc. | 237,993 | 34,644,641 | |
| Torchmark Corp. | 32,298 | 2,761,802 | |
| Unum Group | 119,243 | 3,754,962 | |
| W.R. Berkley Corp. | 21,019 | 1,307,382 | |
| Willis Group Holdings PLC | 217,871 | 38,236,361 | |
| 476,383,770 | |||
| Mortgage Real Estate Investment Trusts - 0.0% | |||
| Annaly Capital Management, Inc. | 427,600 | 3,767,156 | |
| Thrifts & Mortgage Finance - 0.0% | |||
| New York Community Bancorp, Inc. | 38,063 | 377,966 | |
| Radian Group, Inc. | 133,900 | 3,006,055 | |
| 3,384,021 | |||
| TOTAL FINANCIALS | 2,920,022,645 | ||
| HEALTH CARE - 10.9% | |||
| Biotechnology - 1.3% | |||
| AbbVie, Inc. | 287,071 | 22,021,216 | |
| Abeona Therapeutics, Inc. (a)(b) | 90,000 | 489,600 | |
| Acceleron Pharma, Inc. (a) | 32,000 | 1,276,480 | |
| Acorda Therapeutics, Inc. (a) | 55,000 | 510,950 | |
| Alexion Pharmaceuticals, Inc. (a) | 445,068 | 50,595,330 | |
| Allakos, Inc. (a)(b) | 34,000 | 1,332,800 | |
| Alnylam Pharmaceuticals, Inc. (a) | 16,000 | 1,080,320 | |
| Amgen, Inc. | 191,076 | 31,852,369 | |
| AnaptysBio, Inc. (a) | 34,000 | 2,475,540 | |
| Argenx SE ADR (a)(b) | 27,900 | 3,449,277 | |
| Array BioPharma, Inc. (a) | 80,000 | 2,113,600 | |
| Ascendis Pharma A/S sponsored ADR (a) | 32,000 | 3,989,120 | |
| Atara Biotherapeutics, Inc. (a) | 34,000 | 755,140 | |
| BeiGene Ltd. ADR (a)(b) | 16,000 | 1,886,880 | |
| Biogen, Inc. (a) | 59,978 | 13,152,576 | |
| BioMarin Pharmaceutical, Inc. (a) | 145,036 | 11,927,761 | |
| bluebird bio, Inc. (a)(b) | 15,000 | 1,798,800 | |
| Blueprint Medicines Corp. (a) | 34,000 | 2,584,000 | |
| Celgene Corp. (a) | 457,952 | 42,951,318 | |
| FibroGen, Inc. (a) | 36,000 | 1,304,640 | |
| Gilead Sciences, Inc. | 364,261 | 22,675,247 | |
| Immunomedics, Inc. (a)(b) | 82,700 | 1,080,889 | |
| Incyte Corp. (a) | 38,049 | 2,991,793 | |
| Insmed, Inc. (a) | 85,900 | 2,079,639 | |
| Intercept Pharmaceuticals, Inc. (a)(b) | 86,100 | 7,130,802 | |
| Momenta Pharmaceuticals, Inc. (a) | 90,000 | 1,046,700 | |
| Morphosys AG (a) | 8,000 | 772,621 | |
| Neurocrine Biosciences, Inc. (a) | 28,000 | 2,373,840 | |
| Principia Biopharma, Inc. | 28,000 | 819,280 | |
| Regeneron Pharmaceuticals, Inc. (a) | 28,497 | 8,598,115 | |
| Sage Therapeutics, Inc. (a) | 12,800 | 2,199,936 | |
| Sarepta Therapeutics, Inc. (a) | 69,000 | 7,855,650 | |
| Scholar Rock Holding Corp. | 29,500 | 541,030 | |
| Vertex Pharmaceuticals, Inc. (a) | 387,014 | 64,313,987 | |
| Xencor, Inc. (a) | 60,000 | 1,850,400 | |
| 323,877,646 | |||
| Health Care Equipment & Supplies - 2.2% | |||
| Abbott Laboratories | 942,831 | 71,777,724 | |
| Align Technology, Inc. (a) | 41,000 | 11,658,350 | |
| Atricure, Inc. (a) | 59,900 | 1,755,070 | |
| Becton, Dickinson & Co. | 451,260 | 105,342,134 | |
| Boston Scientific Corp. (a) | 3,959,305 | 152,076,905 | |
| Danaher Corp. | 46,000 | 6,072,460 | |
| Genmark Diagnostics, Inc. (a) | 280,000 | 1,873,200 | |
| Hologic, Inc. (a) | 345,795 | 15,218,438 | |
| Insulet Corp. (a)(b) | 38,000 | 4,172,020 | |
| Intuitive Surgical, Inc. (a) | 124,862 | 58,042,101 | |
| Masimo Corp. (a) | 24,000 | 3,137,760 | |
| Medtronic PLC | 76,556 | 7,087,554 | |
| Penumbra, Inc. (a)(b) | 30,000 | 4,281,000 | |
| Stryker Corp. | 218,000 | 39,946,320 | |
| The Cooper Companies, Inc. | 19,294 | 5,745,560 | |
| Wright Medical Group NV (a) | 120,000 | 3,686,400 | |
| Zimmer Biomet Holdings, Inc. | 364,666 | 41,546,397 | |
| 533,419,393 | |||
| Health Care Providers & Services - 2.8% | |||
| AmerisourceBergen Corp. | 60,410 | 4,703,523 | |
| Anthem, Inc. | 102,700 | 28,548,546 | |
| Cardinal Health, Inc. | 122,700 | 5,161,989 | |
| Centene Corp. (a) | 369,016 | 21,310,674 | |
| Cigna Corp. | 912,675 | 135,094,154 | |
| Covetrus, Inc. (a) | 36,000 | 887,760 | |
| CVS Health Corp. | 909,380 | 47,624,231 | |
| DaVita HealthCare Partners, Inc. (a) | 70,710 | 3,070,228 | |
| EBOS Group Ltd. | 128,000 | 1,867,348 | |
| Elanco Animal Health, Inc. | 1,580,790 | 49,447,111 | |
| G1 Therapeutics, Inc. (a) | 38,000 | 796,480 | |
| HCA Holdings, Inc. | 337,259 | 40,794,849 | |
| Henry Schein, Inc. (a) | 16,307 | 1,051,149 | |
| Humana, Inc. | 163,490 | 40,032,161 | |
| Laboratory Corp. of America Holdings (a) | 41,035 | 6,672,701 | |
| McKesson Corp. | 302,465 | 36,943,075 | |
| Molina Healthcare, Inc. (a) | 24,000 | 3,414,240 | |
| Notre Dame Intermedica Participacoes SA | 228,000 | 2,382,293 | |
| Quest Diagnostics, Inc. | 38,814 | 3,722,651 | |
| UnitedHealth Group, Inc. | 940,689 | 227,458,600 | |
| Wellcare Health Plans, Inc. (a) | 70,700 | 19,526,633 | |
| 680,510,396 | |||
| Health Care Technology - 0.0% | |||
| Castlight Health, Inc. Class B (a) | 500,000 | 1,635,000 | |
| Cerner Corp. | 72,867 | 5,098,504 | |
| 6,733,504 | |||
| Life Sciences Tools & Services - 0.4% | |||
| Agilent Technologies, Inc. | 495,633 | 33,232,193 | |
| Avantor, Inc. | 190,000 | 3,325,000 | |
| Bio-Rad Laboratories, Inc. Class A (a) | 2,700 | 774,711 | |
| Lonza Group AG | 9,000 | 2,772,135 | |
| Thermo Fisher Scientific, Inc. | 217,877 | 58,168,801 | |
| 98,272,840 | |||
| Pharmaceuticals - 4.2% | |||
| Allergan PLC | 180,271 | 21,976,838 | |
| Amneal Pharmaceuticals, Inc. (e) | 75,676 | 570,597 | |
| AstraZeneca PLC: | |||
| (United Kingdom) | 200,000 | 14,738,466 | |
| sponsored ADR | 248,410 | 9,285,566 | |
| Bayer AG | 331,690 | 19,614,089 | |
| Bristol-Myers Squibb Co. | 959,765 | 43,544,538 | |
| Dechra Pharmaceuticals PLC | 70,000 | 2,414,212 | |
| Eli Lilly & Co. | 749,244 | 86,867,349 | |
| GlaxoSmithKline PLC sponsored ADR | 676,612 | 26,144,288 | |
| Johnson & Johnson | 2,472,061 | 324,210,800 | |
| Mallinckrodt PLC (a) | 101,900 | 885,511 | |
| Merck & Co., Inc. | 2,155,069 | 170,703,015 | |
| MyoKardia, Inc. (a) | 28,000 | 1,304,240 | |
| Nektar Therapeutics (a) | 54,000 | 1,691,280 | |
| Novartis AG sponsored ADR | 43,371 | 3,714,292 | |
| Pfizer, Inc. | 5,807,269 | 241,117,809 | |
| Recordati SpA | 40,000 | 1,653,382 | |
| Roche Holding AG (participation certificate) | 72,000 | 18,910,954 | |
| Sanofi SA | 108,907 | 8,795,038 | |
| The Medicines Company (a)(b) | 40,000 | 1,426,000 | |
| Theravance Biopharma, Inc. (a)(b) | 69,000 | 1,146,780 | |
| Turning Point Therapeutics, Inc. | 19,300 | 672,026 | |
| Zoetis, Inc. Class A | 414,422 | 41,877,343 | |
| Zogenix, Inc. (a)(b) | 36,000 | 1,356,840 | |
| 1,044,621,253 | |||
| TOTAL HEALTH CARE | 2,687,435,032 | ||
| INDUSTRIALS - 8.1% | |||
| Aerospace & Defense - 2.4% | |||
| General Dynamics Corp. | 244,156 | 39,265,168 | |
| Harris Corp. | 141,100 | 26,412,509 | |
| Huntington Ingalls Industries, Inc. | 17,480 | 3,585,498 | |
| L3 Technologies, Inc. | 12,100 | 2,928,926 | |
| Lockheed Martin Corp. | 220,375 | 74,605,753 | |
| Northrop Grumman Corp. | 505,088 | 153,167,936 | |
| Raytheon Co. | 64,910 | 11,326,795 | |
| Spirit AeroSystems Holdings, Inc. Class A | 70,879 | 5,744,034 | |
| Textron, Inc. | 272,562 | 12,347,059 | |
| The Boeing Co. | 422,398 | 144,295,381 | |
| United Technologies Corp. | 857,580 | 108,312,354 | |
| 581,991,413 | |||
| Air Freight & Logistics - 0.4% | |||
| C.H. Robinson Worldwide, Inc. | 14,900 | 1,186,487 | |
| FedEx Corp. | 66,800 | 10,305,904 | |
| United Parcel Service, Inc. Class B | 820,174 | 76,210,568 | |
| 87,702,959 | |||
| Airlines - 0.5% | |||
| Alaska Air Group, Inc. | 232,242 | 13,516,484 | |
| American Airlines Group, Inc. | 109,722 | 2,987,730 | |
| Delta Air Lines, Inc. | 1,569,435 | 80,825,903 | |
| JetBlue Airways Corp. (a) | 182,898 | 3,151,333 | |
| Southwest Airlines Co. | 67,772 | 3,225,947 | |
| United Continental Holdings, Inc. (a) | 361,218 | 28,048,578 | |
| 131,755,975 | |||
| Building Products - 0.1% | |||
| Fortune Brands Home & Security, Inc. | 319,335 | 15,347,240 | |
| Johnson Controls International PLC | 75,379 | 2,903,599 | |
| Masco Corp. | 31,977 | 1,116,637 | |
| Owens Corning | 11,800 | 571,946 | |
| Resideo Technologies, Inc. (a) | 42,519 | 836,774 | |
| 20,776,196 | |||
| Commercial Services & Supplies - 0.2% | |||
| Cintas Corp. | 33,550 | 7,442,397 | |
| Deluxe Corp. | 49,200 | 1,830,240 | |
| Herman Miller, Inc. | 68,300 | 2,423,967 | |
| LSC Communications, Inc. | 14,212 | 68,928 | |
| R.R. Donnelley & Sons Co. | 131,300 | 291,486 | |
| Republic Services, Inc. | 167,680 | 14,184,051 | |
| Stericycle, Inc. (a) | 127,312 | 5,904,731 | |
| Waste Connection, Inc. (United States) | 255,745 | 24,203,707 | |
| 56,349,507 | |||
| Construction & Engineering - 0.4% | |||
| AECOM (a) | 12,759 | 407,012 | |
| Jacobs Engineering Group, Inc. | 1,174,111 | 88,398,817 | |
| Quanta Services, Inc. | 15,476 | 537,946 | |
| 89,343,775 | |||
| Electrical Equipment - 0.6% | |||
| Acuity Brands, Inc. | 4,383 | 542,046 | |
| Eaton Corp. PLC | 386,941 | 28,823,235 | |
| Emerson Electric Co. | 431,000 | 25,963,440 | |
| Fortive Corp. | 786,537 | 59,894,793 | |
| Hubbell, Inc. Class B | 5,971 | 683,918 | |
| Sensata Technologies, Inc. PLC (a) | 17,647 | 753,350 | |
| Sunrun, Inc. (a) | 1,069,786 | 16,752,849 | |
| Vivint Solar, Inc. (a) | 616,090 | 4,016,907 | |
| 137,430,538 | |||
| Industrial Conglomerates - 1.5% | |||
| Carlisle Companies, Inc. | 3,642 | 485,515 | |
| General Electric Co. | 13,529,796 | 127,721,274 | |
| Honeywell International, Inc. | 1,277,641 | 209,929,193 | |
| Roper Technologies, Inc. | 119,568 | 41,121,827 | |
| 379,257,809 | |||
| Machinery - 1.0% | |||
| AGCO Corp. | 54,171 | 3,605,622 | |
| Allison Transmission Holdings, Inc. | 104,049 | 4,306,588 | |
| Apergy Corp. (a) | 3,600 | 111,636 | |
| Cactus, Inc. (a) | 21,000 | 683,550 | |
| Caterpillar, Inc. | 87,013 | 10,425,028 | |
| Crane Co. | 4,858 | 371,443 | |
| Cummins, Inc. | 82,273 | 12,403,477 | |
| Deere & Co. | 165,174 | 23,152,440 | |
| Dover Corp. | 14,254 | 1,274,450 | |
| Flowserve Corp. | 257,700 | 11,970,165 | |
| Illinois Tool Works, Inc. | 229,980 | 32,114,407 | |
| Ingersoll-Rand PLC | 428,282 | 50,682,892 | |
| Meritor, Inc. (a) | 138,500 | 2,792,160 | |
| Minebea Mitsumi, Inc. | 250,400 | 3,639,324 | |
| Oshkosh Corp. | 71,403 | 5,083,180 | |
| PACCAR, Inc. | 476,545 | 31,366,192 | |
| Parker Hannifin Corp. | 101,707 | 15,492,010 | |
| Pentair PLC | 18,736 | 652,388 | |
| ProPetro Holding Corp. (a) | 36,300 | 704,946 | |
| Snap-On, Inc. | 6,540 | 1,019,717 | |
| Stanley Black & Decker, Inc. | 174,854 | 22,244,926 | |
| Timken Co. | 62,900 | 2,768,229 | |
| Trinity Industries, Inc. | 73,000 | 1,407,440 | |
| WABCO Holdings, Inc. (a) | 4,965 | 649,968 | |
| Wabtec Corp. (b) | 180,943 | 11,287,224 | |
| 250,209,402 | |||
| Professional Services - 0.1% | |||
| Manpower, Inc. | 42,200 | 3,608,944 | |
| Nielsen Holdings PLC | 153,400 | 3,486,782 | |
| RELX PLC (London Stock Exchange) | 494,200 | 11,511,799 | |
| Robert Half International, Inc. | 12,361 | 663,291 | |
| TransUnion Holding Co., Inc. | 205,824 | 13,489,705 | |
| 32,760,521 | |||
| Road & Rail - 0.8% | |||
| AMERCO | 2,269 | 835,491 | |
| CSX Corp. | 381,887 | 28,439,125 | |
| J.B. Hunt Transport Services, Inc. | 157,592 | 13,417,383 | |
| Kansas City Southern | 73,536 | 8,330,158 | |
| Knight-Swift Transportation Holdings, Inc. Class A | 18,852 | 521,069 | |
| Norfolk Southern Corp. | 473,409 | 92,381,032 | |
| Ryder System, Inc. | 29,700 | 1,499,850 | |
| Union Pacific Corp. | 349,034 | 58,211,891 | |
| 203,635,999 | |||
| Trading Companies & Distributors - 0.1% | |||
| Aircastle Ltd. | 132,300 | 2,569,266 | |
| Fastenal Co. | 360,092 | 11,015,214 | |
| HD Supply Holdings, Inc. (a) | 185,997 | 7,717,016 | |
| United Rentals, Inc. (a) | 29,524 | 3,250,592 | |
| W.W. Grainger, Inc. | 5,783 | 1,513,353 | |
| 26,065,441 | |||
| TOTAL INDUSTRIALS | 1,997,279,535 | ||
| INFORMATION TECHNOLOGY - 15.0% | |||
| Communications Equipment - 1.2% | |||
| Cisco Systems, Inc. (c) | 3,926,940 | 204,318,688 | |
| Juniper Networks, Inc. | 535,164 | 13,170,386 | |
| Motorola Solutions, Inc. | 466,921 | 70,014,804 | |
| Telefonaktiebolaget LM Ericsson (B Shares) sponsored ADR | 259,700 | 2,511,299 | |
| 290,015,177 | |||
| Electronic Equipment & Components - 0.2% | |||
| Amphenol Corp. Class A | 251,800 | 21,906,600 | |
| Arrow Electronics, Inc. (a) | 40,090 | 2,512,039 | |
| CDW Corp. | 17,163 | 1,689,526 | |
| Corning, Inc. | 247,426 | 7,135,766 | |
| Flextronics International Ltd. (a) | 312,600 | 2,794,644 | |
| Jabil, Inc. | 136,600 | 3,358,994 | |
| Keysight Technologies, Inc. (a) | 76,801 | 5,770,059 | |
| Tech Data Corp. (a) | 34,800 | 3,154,620 | |
| Vishay Intertechnology, Inc. | 110,800 | 1,688,592 | |
| 50,010,840 | |||
| Internet Software & Services - 0.0% | |||
| Wise Talent Information Technology Co. Ltd. (a)(b) | 822,600 | 2,208,766 | |
| IT Services - 3.1% | |||
| Accenture PLC Class A | 255,100 | 45,425,657 | |
| Akamai Technologies, Inc. (a) | 17,500 | 1,318,800 | |
| Alliance Data Systems Corp. | 74,800 | 10,285,000 | |
| Amdocs Ltd. | 241,617 | 14,356,882 | |
| Automatic Data Processing, Inc. | 183,090 | 29,316,371 | |
| Cognizant Technology Solutions Corp. Class A | 500,690 | 31,007,732 | |
| DXC Technology Co. | 170,432 | 8,102,337 | |
| Elastic NV (b) | 112,600 | 9,238,830 | |
| Fidelity National Information Services, Inc. | 176,841 | 21,273,972 | |
| Fiserv, Inc. (a) | 268,863 | 23,084,577 | |
| FleetCor Technologies, Inc. (a) | 89,100 | 23,006,511 | |
| Global Payments, Inc. | 128,721 | 19,828,183 | |
| IBM Corp. | 148,969 | 18,917,573 | |
| Leidos Holdings, Inc. | 15,709 | 1,183,359 | |
| Liveramp Holdings, Inc. (a) | 17,600 | 904,288 | |
| MasterCard, Inc. Class A | 549,457 | 138,182,941 | |
| PayPal Holdings, Inc. (a) | 776,766 | 85,250,069 | |
| The Western Union Co. | 198,984 | 3,860,290 | |
| Total System Services, Inc. | 56,200 | 6,942,386 | |
| VeriSign, Inc. (a) | 46,300 | 9,027,574 | |
| Visa, Inc. Class A (c) | 1,526,078 | 246,202,164 | |
| Worldpay, Inc. (a) | 211,661 | 25,746,444 | |
| 772,461,940 | |||
| Semiconductors & Semiconductor Equipment - 3.0% | |||
| Advanced Micro Devices, Inc. (a) | 65,000 | 1,781,650 | |
| Analog Devices, Inc. | 296,103 | 28,609,472 | |
| Applied Materials, Inc. | 1,876,819 | 72,614,127 | |
| Broadcom, Inc. | 278,099 | 69,980,832 | |
| Cirrus Logic, Inc. (a) | 51,700 | 1,932,029 | |
| Intel Corp. | 966,053 | 42,544,974 | |
| KLA-Tencor Corp. | 114,218 | 11,772,449 | |
| Lam Research Corp. | 188,841 | 32,973,527 | |
| MACOM Technology Solutions Holdings, Inc. (a) | 296,800 | 4,199,720 | |
| Marvell Technology Group Ltd. | 671,815 | 14,981,475 | |
| Microchip Technology, Inc. | 252,687 | 20,222,541 | |
| Micron Technology, Inc. (a) | 1,238,520 | 40,388,137 | |
| NVIDIA Corp. | 445,515 | 60,349,462 | |
| NXP Semiconductors NV | 496,721 | 43,790,923 | |
| ON Semiconductor Corp. (a) | 963,034 | 17,103,484 | |
| Qorvo, Inc. (a) | 13,773 | 842,632 | |
| Qualcomm, Inc. | 2,027,582 | 135,483,029 | |
| Sanken Electric Co. Ltd. | 70,700 | 1,401,626 | |
| Semtech Corp. (a) | 5,900 | 234,997 | |
| Skyworks Solutions, Inc. | 48,961 | 3,262,271 | |
| Taiwan Semiconductor Manufacturing Co. Ltd. sponsored ADR | 793,964 | 30,448,519 | |
| Teradyne, Inc. | 22,635 | 953,839 | |
| Texas Instruments, Inc. | 830,384 | 86,617,355 | |
| Xilinx, Inc. | 137,624 | 14,080,311 | |
| 736,569,381 | |||
| Software - 5.5% | |||
| 2U, Inc. (a) | 77,500 | 2,944,225 | |
| Adobe, Inc. (a) | 276,813 | 74,988,642 | |
| Autodesk, Inc. (a) | 64,800 | 10,426,968 | |
| Avast PLC (d) | 83,100 | 324,633 | |
| Benefitfocus, Inc. (a) | 66,000 | 1,871,760 | |
| Blue Prism Group PLC (a)(b) | 164,100 | 3,775,834 | |
| Box, Inc. Class A (a) | 5,200 | 96,148 | |
| Cardlytics, Inc. (a) | 11,653 | 267,436 | |
| CDK Global, Inc. | 13,242 | 640,913 | |
| Citrix Systems, Inc. | 36,600 | 3,444,792 | |
| Cloudera, Inc. (a) | 225,419 | 2,067,092 | |
| Dropbox, Inc. Class A (a) | 66,400 | 1,497,984 | |
| Envestnet, Inc. (a) | 100 | 6,691 | |
| Intuit, Inc. | 84,665 | 20,730,225 | |
| Kingsoft Corp. Ltd. | 1,280,000 | 3,526,733 | |
| Microsoft Corp. (c) | 7,128,459 | 881,647,809 | |
| Oracle Corp. | 1,415,451 | 71,621,821 | |
| Palo Alto Networks, Inc. (a) | 9,677 | 1,936,755 | |
| Parametric Technology Corp. (a) | 35,000 | 2,942,100 | |
| Pivotal Software, Inc. (a) | 46,600 | 927,340 | |
| Pluralsight, Inc. | 15,700 | 500,202 | |
| Red Hat, Inc. (a) | 132,212 | 24,366,672 | |
| Salesforce.com, Inc. (a) | 393,689 | 59,608,451 | |
| SAP SE sponsored ADR | 147,500 | 18,154,300 | |
| Sciplay Corp. (A Shares) | 162,427 | 2,598,832 | |
| ServiceNow, Inc. (a) | 36,210 | 9,484,485 | |
| Splunk, Inc. (a) | 12,500 | 1,424,875 | |
| SS&C Technologies Holdings, Inc. | 34,994 | 1,947,416 | |
| SurveyMonkey | 556,280 | 9,568,016 | |
| Symantec Corp. | 2,462,703 | 46,126,427 | |
| Synopsys, Inc. (a) | 312,674 | 36,407,761 | |
| Talend SA ADR (a) | 128,900 | 6,011,896 | |
| Totvs SA | 75,600 | 761,019 | |
| Varonis Systems, Inc. (a) | 38,500 | 2,407,790 | |
| VMware, Inc. Class A | 266,089 | 47,092,431 | |
| Workday, Inc. Class A (a) | 10,730 | 2,190,208 | |
| Zuora, Inc. (a) | 113,800 | 1,592,062 | |
| 1,355,928,744 | |||
| Technology Hardware, Storage & Peripherals - 2.0% | |||
| Apple, Inc. | 2,599,835 | 455,153,113 | |
| Hewlett Packard Enterprise Co. | 380,691 | 5,223,081 | |
| HP, Inc. | 454,001 | 8,480,739 | |
| NCR Corp. (a) | 104,900 | 3,209,940 | |
| NetApp, Inc. | 230,302 | 13,633,878 | |
| Pure Storage, Inc. Class A (a) | 284,600 | 4,513,756 | |
| Seagate Technology LLC | 89,700 | 3,753,945 | |
| Western Digital Corp. | 52,500 | 1,954,050 | |
| Xerox Corp. | 123,608 | 3,783,641 | |
| 499,706,143 | |||
| TOTAL INFORMATION TECHNOLOGY | 3,706,900,991 | ||
| MATERIALS - 1.5% | |||
| Chemicals - 1.0% | |||
| Air Products & Chemicals, Inc. | 130,100 | 26,487,059 | |
| Albemarle Corp. U.S. | 10,981 | 695,097 | |
| Amyris, Inc. (a)(b) | 187,900 | 636,981 | |
| Celanese Corp. Class A | 68,142 | 6,468,720 | |
| CF Industries Holdings, Inc. | 325,600 | 13,102,144 | |
| Dow, Inc. (a) | 291,829 | 13,645,924 | |
| DowDuPont, Inc. | 2,042,983 | 62,351,841 | |
| Eastman Chemical Co. | 247,813 | 16,088,020 | |
| Ecolab, Inc. | 44,600 | 8,210,414 | |
| FMC Corp. | 14,363 | 1,054,962 | |
| Huntsman Corp. | 182,800 | 3,175,236 | |
| LG Chemical Ltd. | 9,300 | 2,605,458 | |
| Linde PLC | 248,181 | 44,809,080 | |
| LyondellBasell Industries NV Class A | 128,435 | 9,536,299 | |
| PPG Industries, Inc. | 120,228 | 12,581,860 | |
| RPM International, Inc. | 105,500 | 5,646,360 | |
| Sherwin-Williams Co. | 34,000 | 14,261,300 | |
| Trinseo SA | 47,700 | 1,757,268 | |
| Westlake Chemical Corp. | 46,800 | 2,681,172 | |
| 245,795,195 | |||
| Construction Materials - 0.0% | |||
| Eagle Materials, Inc. | 46,700 | 4,019,002 | |
| Containers & Packaging - 0.5% | |||
| Avery Dennison Corp. | 102,679 | 10,684,777 | |
| Berry Global Group, Inc. (a) | 1,122,689 | 52,788,837 | |
| Crown Holdings, Inc. (a) | 532,662 | 29,525,455 | |
| International Paper Co. | 289,389 | 12,000,962 | |
| Owens-Illinois, Inc. | 226,193 | 3,619,088 | |
| Packaging Corp. of America | 56,524 | 5,035,158 | |
| Sealed Air Corp. | 203,412 | 8,522,963 | |
| Sonoco Products Co. | 10,784 | 666,775 | |
| WestRock Co. | 49,500 | 1,613,700 | |
| 124,457,715 | |||
| Metals & Mining - 0.0% | |||
| Nucor Corp. | 36,675 | 1,760,400 | |
| Reliance Steel & Aluminum Co. | 8,355 | 695,721 | |
| Steel Dynamics, Inc. | 25,047 | 629,932 | |
| 3,086,053 | |||
| Paper & Forest Products - 0.0% | |||
| Domtar Corp. | 62,600 | 2,632,330 | |
| Schweitzer-Mauduit International, Inc. | 75,400 | 2,359,266 | |
| 4,991,596 | |||
| TOTAL MATERIALS | 382,349,561 | ||
| REAL ESTATE - 1.4% | |||
| Equity Real Estate Investment Trusts (REITs) - 1.4% | |||
| Alexandria Real Estate Equities, Inc. | 30,600 | 4,480,146 | |
| American Tower Corp. | 118,600 | 24,760,122 | |
| AvalonBay Communities, Inc. | 45,200 | 9,176,052 | |
| Boston Properties, Inc. | 11,700 | 1,530,711 | |
| CorePoint Lodging, Inc. | 84,100 | 1,019,292 | |
| Corporate Office Properties Trust (SBI) | 124,700 | 3,471,648 | |
| Crown Castle International Corp. | 31,800 | 4,134,318 | |
| DDR Corp. | 166,350 | 2,124,290 | |
| Equinix, Inc. | 102,889 | 49,982,447 | |
| Equity Lifestyle Properties, Inc. | 26,400 | 3,211,824 | |
| Equity Residential (SBI) | 164,400 | 12,588,108 | |
| Front Yard Residential Corp. Class B | 250,643 | 2,867,356 | |
| Hospitality Properties Trust (SBI) | 122,200 | 3,039,114 | |
| Host Hotels & Resorts, Inc. | 133,600 | 2,419,496 | |
| JBG SMITH Properties | 65,850 | 2,600,417 | |
| Medical Properties Trust, Inc. | 276,438 | 4,915,068 | |
| Omega Healthcare Investors, Inc. | 149,895 | 5,339,260 | |
| Outfront Media, Inc. | 35,800 | 882,470 | |
| Park Hotels & Resorts, Inc. | 86,500 | 2,389,130 | |
| Piedmont Office Realty Trust, Inc. Class A | 128,500 | 2,612,405 | |
| Potlatch Corp. | 46,995 | 1,581,382 | |
| Prologis, Inc. | 1,212,978 | 89,360,089 | |
| Public Storage | 56,359 | 13,406,679 | |
| Realty Income Corp. | 19,678 | 1,379,034 | |
| Regency Centers Corp. | 97,700 | 6,444,292 | |
| Simon Property Group, Inc. | 83,165 | 13,480,215 | |
| SL Green Realty Corp. | 88,737 | 7,631,382 | |
| Spirit Realty Capital, Inc. | 12,960 | 552,874 | |
| Store Capital Corp. | 24,800 | 848,656 | |
| Ventas, Inc. | 233,725 | 15,028,518 | |
| VEREIT, Inc. | 453,100 | 4,023,528 | |
| VICI Properties, Inc. | 431,713 | 9,575,394 | |
| Vornado Realty Trust | 110,900 | 7,344,907 | |
| Welltower, Inc. | 108,898 | 8,844,696 | |
| Weyerhaeuser Co. | 423,321 | 9,651,719 | |
| 332,697,039 | |||
| Real Estate Management & Development - 0.0% | |||
| CBRE Group, Inc. (a) | 107,746 | 4,923,992 | |
| Cushman & Wakefield PLC | 136,700 | 2,304,762 | |
| Howard Hughes Corp. (a) | 1,468 | 150,969 | |
| Jones Lang LaSalle, Inc. | 5,258 | 654,358 | |
| 8,034,081 | |||
| TOTAL REAL ESTATE | 340,731,120 | ||
| UTILITIES - 2.2% | |||
| Electric Utilities - 1.5% | |||
| American Electric Power Co., Inc. | 53,304 | 4,590,540 | |
| Duke Energy Corp. | 178,620 | 15,291,658 | |
| Edison International | 322,396 | 19,140,651 | |
| Entergy Corp. | 253,000 | 24,558,710 | |
| Evergy, Inc. | 128,165 | 7,451,513 | |
| Eversource Energy | 243,506 | 17,980,483 | |
| Exelon Corp. | 384,100 | 18,467,528 | |
| FirstEnergy Corp. | 275,700 | 11,369,868 | |
| NextEra Energy, Inc. | 980,806 | 194,405,557 | |
| OGE Energy Corp. | 18,391 | 764,330 | |
| PG&E Corp. (a) | 37,000 | 632,700 | |
| Pinnacle West Capital Corp. | 12,092 | 1,135,560 | |
| PPL Corp. | 56,900 | 1,693,344 | |
| Southern Co. | 465,000 | 24,877,500 | |
| Vistra Energy Corp. | 122,042 | 2,875,310 | |
| Xcel Energy, Inc. | 449,935 | 25,799,273 | |
| 371,034,525 | |||
| Gas Utilities - 0.0% | |||
| Atmos Energy Corp. | 70,500 | 7,176,900 | |
| South Jersey Industries, Inc. | 46,000 | 1,451,300 | |
| 8,628,200 | |||
| Independent Power and Renewable Electricity Producers - 0.1% | |||
| NextEra Energy Partners LP | 33,300 | 1,473,525 | |
| NRG Energy, Inc. | 664,061 | 22,604,636 | |
| The AES Corp. | 122,219 | 1,931,060 | |
| 26,009,221 | |||
| Multi-Utilities - 0.5% | |||
| Ameren Corp. | 28,000 | 2,053,520 | |
| Avangrid, Inc. | 44,900 | 2,247,694 | |
| CenterPoint Energy, Inc. | 84,600 | 2,406,024 | |
| Dominion Resources, Inc. | 107,885 | 8,110,794 | |
| DTE Energy Co. | 19,432 | 2,438,133 | |
| NiSource, Inc. | 708,755 | 19,738,827 | |
| Public Service Enterprise Group, Inc. | 159,889 | 9,395,078 | |
| Sempra Energy | 460,336 | 60,511,167 | |
| WEC Energy Group, Inc. | 36,408 | 2,932,664 | |
| 109,833,901 | |||
| Water Utilities - 0.1% | |||
| American Water Works Co., Inc. | 156,114 | 17,644,004 | |
| Aqua America, Inc. | 145,748 | 5,762,876 | |
| Select Energy Services, Inc. Class A (a) | 11,200 | 119,840 | |
| 23,526,720 | |||
| TOTAL UTILITIES | 539,032,567 | ||
| TOTAL COMMON STOCKS | |||
| (Cost $13,438,395,538) | 18,727,495,843 | ||
| Convertible Preferred Stocks - 0.0% | |||
| CONSUMER DISCRETIONARY - 0.0% | |||
| Internet & Direct Marketing Retail - 0.0% | |||
| The Honest Co., Inc. Series D (a)(e)(f) | 32,084 | 1,468,164 | |
| HEALTH CARE - 0.0% | |||
| Health Care Equipment & Supplies - 0.0% | |||
| Becton, Dickinson & Co. Series A, 6.125% | 45,900 | 2,667,708 | |
| TOTAL CONVERTIBLE PREFERRED STOCKS | |||
| (Cost $3,898,506) | 4,135,872 | ||
| Equity Funds - 22.7% | |||
| Large Blend Funds - 12.5% | |||
| Fidelity SAI U.S. Large Cap Index Fund (g) | 81,518,525 | 1,207,289,362 | |
| JPMorgan U.S. Large Cap Core Plus Fund Select Class (h) | 57,998,828 | 1,519,569,294 | |
| PIMCO StocksPLUS Absolute Return Fund Institutional Class | 37,085,272 | 373,077,836 | |
| TOTAL LARGE BLEND FUNDS | 3,099,936,492 | ||
| Large Growth Funds - 10.2% | |||
| Fidelity Growth Company Fund (g) | 3,146,699 | 57,616,055 | |
| Fidelity SAI U.S. Momentum Index Fund (g) | 24,825,748 | 318,762,606 | |
| Fidelity SAI U.S. Quality Index Fund (g) | 152,618,517 | 2,148,868,718 | |
| TOTAL LARGE GROWTH FUNDS | 2,525,247,379 | ||
| TOTAL EQUITY FUNDS | |||
| (Cost $4,644,724,454) | 5,625,183,871 | ||
| Principal Amount | Value | ||
| U.S. Treasury Obligations - 0.0% | |||
| U.S. Treasury Bills, yield at date of purchase 2.38% to 2.49% 6/13/19 (i) | |||
| (Cost $2,105,297) | 2,107,000 | 2,105,676 | |
| Shares | |||
| Money Market Funds - 1.7% | |||
| Fidelity Cash Central Fund 2.41% (j) | 104,291,373 | 104,312,232 | |
| Fidelity Securities Lending Cash Central Fund 2.42% (j)(k) | 84,929,704 | 84,938,197 | |
| Invesco Government & Agency Portfolio Institutional Class 2.30% (l) | 227,575,569 | 227,575,569 | |
| TOTAL MONEY MARKET FUNDS | |||
| (Cost $416,822,547) | 416,825,998 | ||
| TOTAL INVESTMENT IN SECURITIES - 100.2% | |||
| (Cost $18,505,946,342) | 24,775,747,260 | ||
| NET OTHER ASSETS (LIABILITIES) - (0.2)% | (54,787,525) | ||
| NET ASSETS - 100% | $24,720,959,735 |
| Written Options | ||||||
| Counterparty | Number of Contracts | Notional Amount | Exercise Price | Expiration Date | Value | |
| Call Options | ||||||
| Cisco Systems, Inc. | Chicago Board Options Exchange | 383 | $1,992,749 | $55.00 | 6/21/19 | $(8,618) |
| Microsoft Corp. | Chicago Board Options Exchange | 1,404 | 17,364,672 | 115.00 | 6/21/19 | (1,330,290) |
| Procter & Gamble Co. | Chicago Board Options Exchange | 358 | 3,684,178 | 97.50 | 6/21/19 | (213,905) |
| Procter & Gamble Co. | Chicago Board Options Exchange | 478 | 4,919,098 | 105.00 | 6/21/19 | (43,020) |
| Visa, Inc. Class A | Chicago Board Options Exchange | 254 | 4,097,782 | 155.00 | 6/21/19 | (196,215) |
| TOTAL WRITTEN OPTIONS | $(1,792,048) |
| Futures Contracts | |||||
| Number of contracts | Expiration Date | Notional Amount | Value | Unrealized Appreciation/(Depreciation) | |
| Purchased | |||||
| Equity Index Contracts | |||||
| CME E-mini S&P 500 Index Contracts (United States) | 192 | June 2019 | $26,424,960 | $(453,831) | $(453,831) |
The notional amount of futures purchased as a percentage of Net Assets is 0.1%
Legend
(a) Non-income producing
(b) Security or a portion of the security is on loan at period end.
(c) Security or a portion of the security is pledged as collateral for call options written. At period end, the value of securities pledged amounted to $32,058,479.
(d) Security exempt from registration under Rule 144A of the Securities Act of 1933. These securities may be resold in transactions exempt from registration, normally to qualified institutional buyers. At the end of the period, the value of these securities amounted to $842,036 or 0.0% of net assets.
(e) Restricted securities - Investment in securities not registered under the Securities Act of 1933 (excluding 144A issues). At the end of the period, the value of restricted securities (excluding 144A issues) amounted to $2,038,761 or 0.0% of net assets.
(f) Level 3 security
(g) Affiliated Fund
(h) The JPMorgan U.S. Large Cap Core Plus Fund seeks to provide a high total return from a portfolio of selected equity securities which includes both long and short positions.
(i) Security or a portion of the security was pledged to cover margin requirements for futures contracts. At period end, the value of securities pledged amounted to $1,299,183.
(j) Affiliated fund that is generally available only to investment companies and other accounts managed by Fidelity Investments. The rate quoted is the annualized seven-day yield of the fund at period end. A complete unaudited listing of the fund's holdings as of its most recent quarter end is available upon request. In addition, each Fidelity Central Fund's financial statements, which are not covered by the Fund's Report of Independent Registered Public Accounting Firm, are available on the SEC's website or upon request.
(k) Investment made with cash collateral received from securities on loan.
(l) The rate quoted is the annualized seven-day yield of the fund at period end.
Additional information on each restricted holding is as follows:
| Security | Acquisition Date | Acquisition Cost |
| Amneal Pharmaceuticals, Inc. | 5/4/18 | $1,381,087 |
| The Honest Co., Inc. Series D | 8/12/15 | $1,468,003 |
Affiliated Central Funds
Information regarding fiscal year to date income earned by the Fund from investments in Fidelity Central Funds is as follows:
| Fund | Income earned |
| Fidelity Cash Central Fund | $1,814,924 |
| Fidelity Securities Lending Cash Central Fund | 1,399,722 |
| Total | $3,214,646 |
Amounts in the income column in the above table include any capital gain distributions from underlying funds, which are presented in the corresponding line-item in the Statement of Operations, if applicable.
Affiliated Underlying Funds
Fiscal year to date information regarding the Fund's investments in affiliated Underlying Funds, excluding any Money Market Central Funds, is presented below. Exchanges between classes of the same affiliated Underlying Funds may occur.
| Affiliate | Value, beginning of period | Purchases | Sales Proceeds | Dividend Income | Realized Gain (loss) | Change in Unrealized appreciation (depreciation) | Value, end of period |
| Fidelity Growth Company Fund | $58,661,260 | $3,020,546 | $-- | $3,020,546 | $-- | $(4,065,751) | $57,616,055 |
| Fidelity SAI U.S. Large Cap Index Fund | 728,688,694 | 2,954,980,634 | 2,525,966,104 | 4,040,358 | 92,540,136 | (42,953,998) | 1,207,289,362 |
| Fidelity SAI U.S. Momentum Index Fund | 256,743,644 | 155,943,108 | 100,000,000 | 9,432,185 | 5,895,195 | 180,659 | 318,762,606 |
| Fidelity SAI U.S. Quality Index Fund | 1,901,390,732 | 259,492,517 | 73,000,000 | 59,492,516 | 2,111,205 | 58,874,264 | 2,148,868,718 |
| Total | $2,945,484,330 | $3,373,436,805 | $2,698,966,104 | $75,985,605 | $100,546,536 | $12,035,174 | $3,732,536,741 |
Amounts in the income column in the above table include any capital gain distributions from underlying funds, which are presented in the corresponding line-item in the Statement of Operations, if applicable.
Investment Valuation
The following is a summary of the inputs used, as of May 31, 2019, involving the Fund's assets and liabilities carried at fair value. The inputs or methodology used for valuing securities may not be an indication of the risk associated with investing in those securities. For more information on valuation inputs, and their aggregation into the levels used below, please refer to the Investment Valuation section in the accompanying Notes to Financial Statements.
| Valuation Inputs at Reporting Date: | ||||
| Description | Total | Level 1 | Level 2 | Level 3 |
| Investments in Securities: | ||||
| Equities: | ||||
| Communication Services | $2,110,240,143 | $2,027,567,891 | $82,672,252 | $-- |
| Consumer Discretionary | 1,867,336,379 | 1,865,868,215 | -- | 1,468,164 |
| Consumer Staples | 1,201,654,044 | 1,201,654,044 | -- | -- |
| Energy | 975,981,990 | 975,981,990 | -- | -- |
| Financials | 2,920,022,645 | 2,919,283,704 | 738,941 | -- |
| Health Care | 2,690,102,740 | 2,625,376,485 | 64,726,255 | -- |
| Industrials | 1,997,279,535 | 1,993,640,211 | 3,639,324 | -- |
| Information Technology | 3,706,900,991 | 3,705,499,365 | 1,401,626 | -- |
| Materials | 382,349,561 | 382,349,561 | -- | -- |
| Real Estate | 340,731,120 | 340,731,120 | -- | -- |
| Utilities | 539,032,567 | 539,032,567 | -- | -- |
| Equity Funds | 5,625,183,871 | 5,625,183,871 | -- | -- |
| Other Short-Term Investments | 2,105,676 | -- | 2,105,676 | -- |
| Money Market Funds | 416,825,998 | 416,825,998 | -- | -- |
| Total Investments in Securities: | $24,775,747,260 | $24,618,995,022 | $155,284,074 | $1,468,164 |
| Derivative Instruments: | ||||
| Liabilities | ||||
| Futures Contracts | $(453,831) | $(453,831) | $-- | $-- |
| Written Options | (1,792,048) | (1,792,048) | -- | -- |
| Total Liabilities | $(2,245,879) | $(2,245,879) | $-- | $-- |
| Total Derivative Instruments: | $(2,245,879) | $(2,245,879) | $-- | $-- |
Value of Derivative Instruments
The following table is a summary of the Fund's value of derivative instruments by primary risk exposure as of May 31, 2019. For additional information on derivative instruments, please refer to the Derivative Instruments section in the accompanying Notes to Financial Statements.
| Primary Risk Exposure / Derivative Type | Value | |
| Asset | Liability | |
| Equity Risk | ||
| Futures Contracts(a) | $0 | $(453,831) |
| Written Options(b) | 0 | (1,792,048) |
| Total Equity Risk | 0 | (2,245,879) |
| Total Value of Derivatives | $0 | $(2,245,879) |
(a) Reflects gross cumulative appreciation (depreciation) on futures contracts as presented in the Schedule of Investments. In the Statement of Assets and Liabilities, the period end daily variation margin is included in receivable or payable for daily variation margin on futures contracts, and the net cumulative appreciation (depreciation) is included in distributable earnings.
(b) Gross value is presented in the Statement of Assets and Liabilities in the written options, at value line-item.
See accompanying notes which are an integral part of the financial statements.
Financial Statements
Statement of Assets and Liabilities
| May 31, 2019 | ||
| Assets | ||
| Investment in securities, at value (including securities loaned of $80,626,901) — See accompanying schedule: Unaffiliated issuers (cost $15,120,036,378) | $20,853,960,090 | |
| Fidelity Central Funds (cost $189,246,978) | 189,250,429 | |
| Other affiliated issuers (cost $3,196,662,986) | 3,732,536,741 | |
| Total Investment in Securities (cost $18,505,946,342) | $24,775,747,260 | |
| Foreign currency held at value (cost $408,829) | 409,984 | |
| Receivable for investments sold | 140,733,198 | |
| Receivable for fund shares sold | 6,703,290 | |
| Dividends receivable | 37,007,473 | |
| Interest receivable | 451,768 | |
| Distributions receivable from Fidelity Central Funds | 287,249 | |
| Other receivables | 342,833 | |
| Total assets | 24,961,683,055 | |
| Liabilities | ||
| Payable to custodian bank | $11,150,114 | |
| Payable for investments purchased | 120,482,737 | |
| Payable for fund shares redeemed | 17,511,543 | |
| Accrued management fee | 4,117,089 | |
| Payable for daily variation margin on futures contracts | 362,880 | |
| Written options, at value (premium received $816,282) | 1,792,048 | |
| Other payables and accrued expenses | 359,113 | |
| Collateral on securities loaned | 84,947,796 | |
| Total liabilities | 240,723,320 | |
| Net Assets | $24,720,959,735 | |
| Net Assets consist of: | ||
| Paid in capital | $18,020,731,380 | |
| Total distributable earnings (loss) | 6,700,228,355 | |
| Net Assets, for 1,427,771,884 shares outstanding | $24,720,959,735 | |
| Net Asset Value, offering price and redemption price per share ($24,720,959,735 ÷ 1,427,771,884 shares) | $17.31 |
See accompanying notes which are an integral part of the financial statements.
Statement of Operations
| Year ended May 31, 2019 | ||
| Investment Income | ||
| Dividends: | ||
| Unaffiliated issuers | $407,436,894 | |
| Affiliated issuers | 35,827,054 | |
| Interest | 4,242,058 | |
| Income from Fidelity Central Funds | 3,214,646 | |
| Total income | 450,720,652 | |
| Expenses | ||
| Management fee | $110,255,631 | |
| Independent trustees' fees and expenses | 282,919 | |
| Miscellaneous | 241,324 | |
| Total expenses before reductions | 110,779,874 | |
| Expense reductions | (61,999,430) | |
| Total expenses after reductions | 48,780,444 | |
| Net investment income (loss) | 401,940,208 | |
| Realized and Unrealized Gain (Loss) | ||
| Net realized gain (loss) on: | ||
| Investment securities: | ||
| Unaffiliated issuers (net of foreign taxes of $1,053) | 728,142,501 | |
| Fidelity Central Funds | 4,540 | |
| Other affiliated issuers | 100,546,536 | |
| Foreign currency transactions | (108,777) | |
| Futures contracts | (1,025,077) | |
| Written options | 1,361,782 | |
| Capital gain distributions from underlying funds: | ||
| Unaffiliated issuers | 250,603,415 | |
| Affiliated issuers | 40,158,551 | |
| Total net realized gain (loss) | 1,119,683,471 | |
| Change in net unrealized appreciation (depreciation) on: | ||
| Investment securities: | ||
| Unaffiliated issuers (net of decrease in deferred foreign taxes of $42,543) | (843,406,472) | |
| Fidelity Central Funds | 2,223 | |
| Other affiliated issuers | 12,035,174 | |
| Assets and liabilities in foreign currencies | (516) | |
| Futures contracts | (859,478) | |
| Written options | (1,706,697) | |
| Total change in net unrealized appreciation (depreciation) | (833,935,766) | |
| Net gain (loss) | 285,747,705 | |
| Net increase (decrease) in net assets resulting from operations | $687,687,913 |
See accompanying notes which are an integral part of the financial statements.
Statement of Changes in Net Assets
| Year ended May 31, 2019 | Year ended May 31, 2018 | |
| Increase (Decrease) in Net Assets | ||
| Operations | ||
| Net investment income (loss) | $401,940,208 | $340,783,688 |
| Net realized gain (loss) | 1,119,683,471 | 1,794,948,839 |
| Change in net unrealized appreciation (depreciation) | (833,935,766) | 1,146,696,041 |
| Net increase (decrease) in net assets resulting from operations | 687,687,913 | 3,282,428,568 |
| Distributions to shareholders | (1,958,616,581) | – |
| Distributions to shareholders from net investment income | – | (310,751,726) |
| Distributions to shareholders from net realized gain | – | (1,461,353,123) |
| Total distributions | (1,958,616,581) | (1,772,104,849) |
| Share transactions | ||
| Proceeds from sales of shares | 4,801,967,086 | 3,718,227,839 |
| Reinvestment of distributions | 1,950,874,827 | 1,766,119,610 |
| Cost of shares redeemed | (5,745,550,235) | (5,167,982,110) |
| Net increase (decrease) in net assets resulting from share transactions | 1,007,291,678 | 316,365,339 |
| Total increase (decrease) in net assets | (263,636,990) | 1,826,689,058 |
| Net Assets | ||
| Beginning of period | 24,984,596,725 | 23,157,907,667 |
| End of period | $24,720,959,735 | $24,984,596,725 |
| Other Information | ||
| Undistributed net investment income end of period | $134,233,540 | |
| Shares | ||
| Sold | 274,509,591 | 207,114,947 |
| Issued in reinvestment of distributions | 116,221,097 | 101,160,959 |
| Redeemed | (321,143,205) | (286,886,998) |
| Net increase (decrease) | 69,587,483 | 21,388,908 |
See accompanying notes which are an integral part of the financial statements.
Financial Highlights
Strategic Advisers Core Fund
| Years ended May 31, | 2019 | 2018 | 2017 | 2016 | 2015 |
| Selected Per–Share Data | |||||
| Net asset value, beginning of period | $18.40 | $17.32 | $15.07 | $16.12 | $15.56 |
| Income from Investment Operations | |||||
| Net investment income (loss)A | .29 | .25 | .22 | .19 | .19 |
| Net realized and unrealized gain (loss) | .08 | 2.18 | 2.48 | (.37) | 1.51 |
| Total from investment operations | .37 | 2.43 | 2.70 | (.18) | 1.70 |
| Distributions from net investment income | (.29) | (.24) | (.19) | (.19) | (.16) |
| Distributions from net realized gain | (1.17) | (1.11) | (.26) | (.68) | (.98) |
| Total distributions | (1.46) | (1.35) | (.45) | (.87) | (1.14) |
| Net asset value, end of period | $17.31 | $18.40 | $17.32 | $15.07 | $16.12 |
| Total ReturnB | 2.41% | 14.59% | 18.22% | (1.10)% | 11.37% |
| Ratios to Average Net AssetsC,D | |||||
| Expenses before reductions | .45% | .47% | .46% | .43% | .42% |
| Expenses net of fee waivers, if any | .20% | .21% | .21% | .18% | .17% |
| Expenses net of all reductions | .20% | .21% | .21% | .18% | .17% |
| Net investment income (loss) | 1.65% | 1.41% | 1.40% | 1.32% | 1.22% |
| Supplemental Data | |||||
| Net assets, end of period (000 omitted) | $24,720,960 | $24,984,597 | $23,157,908 | $23,636,860 | $24,497,753 |
| Portfolio turnover rateE | 84% | 98% | 100% | 85% | 104% |
A Calculated based on average shares outstanding during the period.
B Total returns would have been lower if certain expenses had not been reduced during the applicable periods shown.
C Fees and expenses of any underlying Fidelity Central Funds are not included in the Fund's expense ratio. The Fund indirectly bears its proportionate share of the expenses of any underlying Fidelity Central Funds.
D Expense ratios reflect operating expenses of the Fund. Expenses before reductions do not reflect amounts reimbursed by the investment adviser or reductions from brokerage service arrangements or reductions from other expense offset arrangements and do not represent the amount paid by the Fund during periods when reimbursements or reductions occur. Expenses net of fee waivers reflect expenses after reimbursement by the investment adviser but prior to reductions from brokerage service arrangements or other expense offset arrangements. Expenses net of all reductions represent the net expenses paid by the Fund. Fees and expenses of the Underlying Funds are not included in the Fund's annualized ratios. The Fund indirectly bears its proportionate share of the expenses of the Underlying Funds.
E Amount does not include the portfolio activity of any Underlying Funds.
See accompanying notes which are an integral part of the financial statements.
Notes to Financial Statements
For the period ended May 31, 2019
1. Organization.
Strategic Advisers Core Fund (the Fund) is a fund of Fidelity Rutland Square Trust II (the Trust), and is authorized to issue an unlimited number of shares. The Trust is registered under the Investment Company Act of 1940, as amended (the 1940 Act), as an open-end management investment company organized as a Delaware statutory trust. The Fund is offered exclusively to certain clients of Strategic Advisers LLC (Strategic Advisers), an affiliate of Fidelity Management & Research Company (FMR).
2. Significant Accounting Policies.
The Fund is an investment company and applies the accounting and reporting guidance of the Financial Accounting Standards Board (FASB) Accounting Standards Codification Topic 946 Financial Services – Investments Companies. The financial statements have been prepared in conformity with accounting principles generally accepted in the United States of America (GAAP), which require management to make certain estimates and assumptions at the date of the financial statements. Actual results could differ from those estimates. Subsequent events, if any, through the date that the financial statements were issued have been evaluated in the preparation of the financial statements. The following summarizes the significant accounting policies of the Fund:
Investment Valuation. Investments are valued as of 4:00 p.m. Eastern time on the last calendar day of the period. The Board of Trustees (the Board) has delegated the day to day responsibility for the valuation of the Fund's investments to the Fair Value Committee (the Committee) established by the Fund's investment adviser. In accordance with valuation policies and procedures approved by the Board, the Fund attempts to obtain prices from one or more third party pricing vendors or brokers to value its investments. When current market prices, quotations or currency exchange rates are not readily available or reliable, investments will be fair valued in good faith by the Committee, in accordance with procedures adopted by the Board. Factors used in determining fair value vary by investment type and may include market or investment specific events, changes in interest rates and credit quality. The frequency with which these procedures are used cannot be predicted and they may be utilized to a significant extent. The Committee oversees the Fund's valuation policies and procedures and reports to the Board on the Committee's activities and fair value determinations. The Board monitors the appropriateness of the procedures used in valuing the Fund's investments and ratifies the fair value determinations of the Committee.
The Fund categorizes the inputs to valuation techniques used to value its investments into a disclosure hierarchy consisting of three levels as shown below:
- Level 1 – quoted prices in active markets for identical investments
- Level 2 – other significant observable inputs (including quoted prices for similar investments, interest rates, prepayment speeds, etc.)
- Level 3 – unobservable inputs (including the Fund's own assumptions based on the best information available)
Valuation techniques used to value the Fund's investments by major category are as follows:
Equity securities, including restricted securities, for which market quotations are readily available, are valued at the last reported sale price or official closing price as reported by a third party pricing vendor on the primary market or exchange on which they are traded and are categorized as Level 1 in the hierarchy. In the event there were no sales during the day or closing prices are not available, securities are valued at the last quoted bid price or may be valued using the last available price and are generally categorized as Level 2 in the hierarchy. For foreign equity securities, when market or security specific events arise, comparisons to the valuation of American Depositary Receipts (ADRs), futures contracts, Exchange-Traded Funds (ETFs) and certain indexes as well as quoted prices for similar securities may be used and would be categorized as Level 2 in the hierarchy. For equity securities, including restricted securities, where observable inputs are limited, assumptions about market activity and risk are used and these securities may be categorized as Level 3 in the hierarchy.
Debt securities, including restricted securities, are valued based on evaluated prices received from third party pricing vendors or from brokers who make markets in such securities. U.S. government and government agency obligations are valued by pricing vendors who utilize matrix pricing which considers yield or price of bonds of comparable quality, coupon, maturity and type or by broker-supplied prices. When independent prices are unavailable or unreliable, debt securities may be valued utilizing pricing methodologies which consider similar factors that would be used by third party pricing vendors. Debt securities are generally categorized as Level 2 in the hierarchy but may be Level 3 depending on the circumstances.
Futures contracts are valued at the settlement price established each day by the board of trade or exchange on which they are traded and are categorized as Level 1 in the hierarchy. Exchange-traded options are valued using the last sale price or, in the absence of a sale, the last offering price and are categorized as Level 1 in the hierarchy. Investments in open-end mutual funds, including the Fidelity Central Funds, are valued at their closing net asset value (NAV) each business day and are categorized as Level 1 in the hierarchy. If an unaffiliated open-end mutual fund's NAV is unavailable, shares of that fund may be valued by another method that the Board believes reflects fair value in accordance with the Board's fair value pricing policies and is categorized as Level 2 in the hierarchy.
Changes in valuation techniques may result in transfers in or out of an assigned level within the disclosure hierarchy. The aggregate value of investments by input level as of May 31, 2019 is included at the end of the Fund's Schedule of Investments.
Foreign Currency. The Fund may use foreign currency contracts to facilitate transactions in foreign-denominated securities. Gains and losses from these transactions may arise from changes in the value of the foreign currency or if the counterparties do not perform under the contracts' terms.
Foreign-denominated assets, including investment securities, and liabilities are translated into U.S. dollars at the exchange rates at period end. Purchases and sales of investment securities, income and dividends received and expenses denominated in foreign currencies are translated into U.S. dollars at the exchange rate in effect on the transaction date.
The effects of exchange rate fluctuations on investments are included with the net realized and unrealized gain (loss) on investment securities. Other foreign currency transactions resulting in realized and unrealized gain (loss) are disclosed separately.
Investment Transactions and Income. For financial reporting purposes, the Fund's investment holdings and NAV include trades executed through the end of the last business day of the period. The NAV per share for processing shareholder transactions is calculated as of the close of business of the New York Stock Exchange (NYSE), normally 4:00 p.m. Eastern time and includes trades executed through the end of the prior business day. Gains and losses on securities sold are determined on the basis of identified cost and include proceeds received from litigation. Dividend income is recorded on the ex-dividend date, except for certain dividends from foreign securities where the ex-dividend date may have passed, which are recorded as soon as the Fund is informed of the ex-dividend date. Non-cash dividends included in dividend income, if any, are recorded at the fair market value of the securities received. Income and capital gain distributions from Fidelity Central Funds, if any, are recorded on the ex-dividend date. Income and capital gain distributions from Underlying Funds if any, are recorded on the ex-dividend date. Certain distributions received by the Fund represent a return of capital or capital gain. The Fund determines the components of these distributions subsequent to the ex-dividend date, based upon receipt of tax filings or other correspondence relating to the underlying investment. These distributions are recorded as a reduction of cost of investments and/or as a realized gain. Interest income is accrued as earned and includes coupon interest and amortization of premium and accretion of discount on debt securities as applicable. Investment income is recorded net of foreign taxes withheld where recovery of such taxes is uncertain.
Expenses. Expenses directly attributable to a fund are charged to that fund. Expenses attributable to more than one fund are allocated among the respective funds on the basis of relative net assets or other appropriate methods. Expense estimates are accrued in the period to which they relate and adjustments are made when actual amounts are known.
Deferred Trustee Compensation. Under a Deferred Compensation Plan (the Plan), certain independent Trustees have elected to defer receipt of a portion of their annual compensation. Deferred amounts are invested in a cross-section of Strategic Advisers funds, are marked-to-market and remain in the Fund until distributed in accordance with the Plan. The investment of deferred amounts and the offsetting payable to the Trustees of $341,331 are included in the accompanying Statement of Assets and Liabilities in other receivables and other payables and accrued expenses, respectively.
Income Tax Information and Distributions to Shareholders. Each year, the Fund intends to qualify as a regulated investment company under Subchapter M of the Internal Revenue Code, including distributing substantially all of its taxable income and realized gains. As a result, no provision for U.S. Federal income taxes is required. As of May 31, 2019, the Fund did not have any unrecognized tax benefits in the financial statements; nor is the Fund aware of any tax positions for which it is reasonably possible that the total amounts of unrecognized tax benefits will significantly change in the next twelve months. The Fund files a U.S. federal tax return, in addition to state and local tax returns as required. The Fund's federal income tax returns are subject to examination by the Internal Revenue Service (IRS) for a period of three fiscal years after they are filed. State and local tax returns may be subject to examination for an additional fiscal year depending on the jurisdiction. Foreign taxes are provided for based on the Fund's understanding of the tax rules and rates that exist in the foreign markets in which it invests. The Fund is subject to a tax imposed on capital gains by certain countries in which it invests. An estimated deferred tax liability for net unrealized appreciation on the applicable securities is included in Other payables and accrued expenses on the Statement of Assets & Liabilities.
Distributions are declared and recorded on the ex-dividend date. Income and capital gain distributions are determined in accordance with income tax regulations, which may differ from GAAP. In addition, the Fund claimed a portion of the payment made to redeeming shareholders as a distribution for income tax purposes.
Capital accounts within the financial statements are adjusted for permanent book-tax differences. These adjustments have no impact on net assets or the results of operations. Capital accounts are not adjusted for temporary book-tax differences which will reverse in a subsequent period.
Book-tax differences are primarily due to short-term gain distributions from the Underlying Funds, futures contracts, foreign currency transactions, passive foreign investment companies (PFIC), market discount, partnerships, deferred trustees compensation, certain deemed distributions and losses deferred due to wash sales.
As of period end, the cost and unrealized appreciation (depreciation) in securities, and derivatives if applicable, for federal income tax purposes were as follows:
| Gross unrealized appreciation | $6,769,223,642 |
| Gross unrealized depreciation | (673,522,842) |
| Net unrealized appreciation (depreciation) | $6,095,700,800 |
| Tax Cost | $18,678,254,412 |
The tax-based components of distributable earnings as of period end were as follows:
| Undistributed ordinary income | $122,551,647 |
| Undistributed long-term capital gain | $476,041,777 |
| Net unrealized appreciation (depreciation) on securities and other investments | $6,095,688,361 |
The tax character of distributions paid was as follows:
| May 31, 2019 | May 31, 2018 | |
| Ordinary Income | $593,572,387 | $ 569,158,031 |
| Long-term Capital Gains | 1,365,044,194 | 1,202,946,818 |
| Total | $1,958,616,581 | $ 1,772,104,849 |
Restricted Securities. The Fund may invest in securities that are subject to legal or contractual restrictions on resale. These securities generally may be resold in transactions exempt from registration or to the public if the securities are registered. Disposal of these securities may involve time-consuming negotiations and expense, and prompt sale at an acceptable price may be difficult. Information regarding restricted securities is included at the end of the Fund's Schedule of Investments.
New Rule Issuance. During August 2018, the U.S. Securities and Exchange Commission issued Final Rule Release No. 33-10532, Disclosure Update and Simplification. This Final Rule includes amendments specific to registered investment companies that are intended to eliminate overlap in disclosure requirements between Regulation S-X and GAAP. In accordance with these amendments, certain line-items in the Fund's financial statements have been combined or removed for the current period as outlined in the table below.
| Financial Statement | Current Line-Item Presentation (As Applicable) | Prior Line-Item Presentation (As Applicable) |
| Statement of Assets and Liabilities | Total distributable earnings (loss) | Undistributed/Distributions in excess of/Accumulated net investment income (loss) Accumulated/Undistributed net realized gain (loss) Net unrealized appreciation (depreciation) |
| Statement of Changes in Net Assets | N/A - removed | Undistributed/Distributions in excess of/Accumulated net investment income (loss) end of period |
| Statement of Changes in Net Assets | Distributions to shareholders | Distributions to shareholders from net investment income Distributions to shareholders from net realized gain |
3. Derivative Instruments.
Risk Exposures and the Use of Derivative Instruments. The Fund's investment objective allows the Fund to enter into various types of derivative contracts, including futures contracts and options. Derivatives are investments whose value is primarily derived from underlying assets, indices or reference rates and may be transacted on an exchange or over-the-counter (OTC). Derivatives may involve a future commitment to buy or sell a specified asset based on specified terms, to exchange future cash flows at periodic intervals based on a notional principal amount, or for one party to make one or more payments upon the occurrence of specified events in exchange for periodic payments from the other party.
The Fund used derivatives to increase returns and to manage exposure to certain risks as defined below. The success of any strategy involving derivatives depends on analysis of numerous economic factors, and if the strategies for investment do not work as intended, the Fund may not achieve its objectives.
The Fund's use of derivatives increased or decreased its exposure to the following risk:
| Equity Risk | Equity risk relates to the fluctuations in the value of financial instruments as a result of changes in market prices (other than those arising from interest rate risk or foreign exchange risk), whether caused by factors specific to an individual investment, its issuer, or all factors affecting all instruments traded in a market or market segment. |
The Fund is also exposed to additional risks from investing in derivatives, such as liquidity risk and counterparty credit risk. Liquidity risk is the risk that the Fund will be unable to close out the derivative in the open market in a timely manner. Counterparty credit risk is the risk that the counterparty will not be able to fulfill its obligation to the Fund. Derivative counterparty credit risk is managed through formal evaluation of the creditworthiness of all potential counterparties. On certain OTC derivatives such as options, the Fund attempts to reduce its exposure to counterparty credit risk by entering into an International Swaps and Derivatives Association, Inc. (ISDA) Master Agreement with each of its counterparties. The ISDA Master Agreement gives the Fund the right to terminate all transactions traded under such agreement upon the deterioration in the credit quality of the counterparty beyond specified levels. The ISDA Master Agreement gives each party the right, upon an event of default by the other party or a termination of the agreement, to close out all transactions traded under such agreement and to net amounts owed under each transaction to one net payable by one party to the other. To mitigate counterparty credit risk on bi-lateral OTC derivatives, the Fund receives collateral in the form of cash or securities once the Fund's net unrealized appreciation on outstanding derivative contracts under an ISDA Master Agreement exceeds certain applicable thresholds, subject to certain minimum transfer provisions. The collateral received is held in segregated accounts with the Fund's custodian bank in accordance with the collateral agreements entered into between the Fund, the counterparty and the Fund's custodian bank. The Fund could experience delays and costs in gaining access to the collateral even though it is held by the Fund's custodian bank. The Fund's maximum risk of loss from counterparty credit risk related to bi-lateral OTC derivatives is generally the aggregate unrealized appreciation and unpaid counterparty payments in excess of any collateral pledged by the counterparty to the Fund. The Fund may be required to pledge collateral for the benefit of the counterparties on bi-lateral OTC derivatives in an amount not less than each counterparty's unrealized appreciation on outstanding derivative contracts, subject to certain minimum transfer provisions, and any such pledged collateral is identified in the Schedule of Investments. Exchange-traded futures contracts and exchange-traded options are not covered by the ISDA Master Agreement; however counterparty credit risk related to exchange-traded futures contracts and exchange-traded options may be mitigated by the protection provided by the exchange on which they trade.
Investing in derivatives may involve greater risks than investing in the underlying assets directly and, to varying degrees, may involve risk of loss in excess of any initial investment and collateral received and amounts recognized in the Statement of Assets and Liabilities. In addition, there may be the risk that the change in value of the derivative contract does not correspond to the change in value of the underlying instrument.
Net Realized Gain (Loss) and Change in Net Unrealized Appreciation (Depreciation) on Derivatives. The table below, which reflects the impacts of derivatives on the financial performance of the Fund, summarizes the net realized gain (loss) and change in net unrealized appreciation (depreciation) for derivatives during the period as presented in the Statement of Operations.
| Primary Risk Exposure / Derivative Type | Net Realized Gain (Loss) | Change in Net Unrealized Appreciation (Depreciation) |
| Equity Risk | ||
| Futures Contracts | $(1,025,077) | $(859,478) |
| Written Options | 1,361,782 | (1,706,697) |
| Totals | $336,705 | $(2,566,175) |
A summary of the value of derivatives by primary risk exposure as of period end is included at the end of the Schedule of Investments.
Futures Contracts. A futures contract is an agreement between two parties to buy or sell a specified underlying instrument for a fixed price at a specified future date. The Fund used futures contracts to manage its exposure to the stock market.
Upon entering into a futures contract, a fund is required to deposit either cash or securities (initial margin) with a clearing broker in an amount equal to a certain percentage of the face value of the contract. Futures contracts are marked-to-market daily and subsequent daily payments (variation margin) are made or received by a fund depending on the daily fluctuations in the value of the futures contracts and are recorded as unrealized appreciation or (depreciation). This receivable and/or payable, if any, is included in daily variation margin on futures contracts in the Statement of Assets and Liabilities. Realized gain or (loss) is recorded upon the expiration or closing of a futures contract. The net realized gain (loss) and change in net unrealized appreciation (depreciation) on futures contracts during the period is presented in the Statement of Operations.
Any open futures contracts at period end are presented in the Schedule of Investments under the caption "Futures Contracts". The notional amount at value reflects each contract's exposure to the underlying instrument or index at period end and is representative of volume of activity during the period. Securities deposited to meet initial margin requirements are identified in the Schedule of Investments.
Options. Options give the purchaser the right, but not the obligation, to buy (call) or sell (put) an underlying security or financial instrument at an agreed exercise or strike price between or on certain dates. Options obligate the seller (writer) to buy (put) or sell (call) an underlying instrument at the exercise or strike price or cash settle an underlying derivative instrument if the holder exercises the option on or before the expiration date.
The Fund used exchange-traded and OTC written covered call options to manage its exposure to the market. When the Fund writes a covered call option, the Fund holds the underlying instrument which must be delivered to the holder upon the exercise of the option.
Upon entering into a written options contract, the Fund will receive a premium. Premiums received are reflected as a liability on the Statement of Assets and Liabilities. Options are valued daily and any unrealized appreciation (depreciation) is reflected on the Statement of Assets and Liabilities. When a written option is exercised, the premium is added to the proceeds from the sale of the underlying instrument in determining the gain or loss realized on that investment. When an option is closed the Fund will realize a gain or loss depending on whether the proceeds or amount paid for the closing sale transaction are greater or less than the premium received. When an option expires, gains and losses are realized to the extent of premiums received. The net realized gain (loss) on closed and expired written options and the change in net unrealized appreciation (depreciation) on written options are presented in the Statement of Operations.
Writing call options tends to decrease exposure to the underlying instrument and risk of loss is the change in value in excess of the premium received.
Any open options at period end are presented in the Schedule of Investments under the caption "Written Options" and are representative of volume of activity during the period.
4. Purchases and Sales of Investments.
Purchases and sales of securities (including the Underlying Fund shares), other than short-term securities, aggregated $20,344,602,298 and $20,650,962,881, respectively.
5. Fees and Other Transactions with Affiliates.
Management Fee. Strategic Advisers (the investment adviser) provides the Fund with investment management related services. For these services, the Fund pays a monthly management fee to the investment adviser. The management fee is calculated by adding the annual management fee rate of .25% of the Fund's average net assets throughout the month payable to the investment adviser to the aggregate of the fee rates, payable monthly, to the Fund's sub-advisers. The Fund's maximum aggregate management fee will not exceed 1.00% of the Fund's average net assets. For the reporting period, the total annual management fee rate was .45% of the Fund's average net assets. The investment adviser pays all other expenses, except the compensation of the independent Trustees and certain miscellaneous expenses such as proxy and shareholder meeting expenses. The management fee is reduced by an amount equal to the fees and expenses paid by the Fund to the independent Trustees.
During the period, the investment adviser waived its management fee as described in the Expense Reductions note.
Sub-Advisers. AllianceBernstein, L.P. (AB), Brandywine Global Investment Management, LLC, ClariVest Asset Management LLC, J.P. Morgan Investment Management, Inc., LSV Asset Management, Invesco Advisers, Inc. (effective May 24, 2019), OppenheimerFunds, Inc. (through May 23, 2019), FIAM LLC (an affiliate of the investment adviser) and T. Rowe Price Associates, Inc. each served as a sub-adviser for the Fund during the period. Sub-advisers provide discretionary investment advisory services for their allocated portion of the Fund's assets and are paid by the investment adviser and not the Fund for providing these services.
Aristotle Capital Management, LLC, Geode Capital Management, LLC, Loomis Sayles & Company, L.P., Massachusetts Financial Services Company (MFS) and Boston Partners Global Investors, Inc. have been retained to serve as a sub-adviser for the Fund. As of the date of the report, however, these sub-advisers have not been allocated any portion of the Fund's assets. These sub-advisers in the future may provide discretionary investment advisory services for an allocated portion of the Fund's assets and will be paid by the investment adviser for providing these services.
In June, 2019, the Board approved the appointment of PineBridge Investments, LLC (PineBridge) as an additional sub-adviser for the Fund. Subsequent to period end, PineBridge was allocated a portion of the Fund's assets.
Brokerage Commissions. The Fund placed a portion of its portfolio transactions with brokerage firms which are affiliates of the investment adviser. Brokerage commissions are included in net realized gain (loss) and change in net unrealized appreciation (depreciation) in the Statement of Operations. The commissions paid to these affiliated firms were $70,890 for the period.
Interfund Trades. The Fund may purchase from or sell securities to other funds affiliated with each sub-adviser under procedures adopted by the Board. The procedures have been designed to ensure these interfund trades are executed in accordance with Rule 17a-7 of the 1940 Act. Interfund trades are included within the respective purchases and sales amounts shown in the Purchases and Sales of Investments note.
Other. During the period, the investment adviser reimbursed the Fund for certain losses in the amount of $14,867.
6. Investments in Fidelity Central Funds.
The Fund invests in Fidelity Central Funds, which are open-end investment companies available only to other investment companies and accounts managed by the investment adviser and its affiliates. The Fund's Schedule of Investments lists each of the Fidelity Central Funds held as of period end, if any, as an investment of the Fund, but does not include the underlying holdings of each Fidelity Central Fund. As an Investing Fund, the Fund indirectly bears its proportionate share of the expenses of the underlying Fidelity Central Funds.
The Fidelity Money Market Central Funds are managed by Fidelity Investments Money Management, Inc. (FIMM), an affiliate of the investment adviser. Annualized expenses of the Money Market Central Funds as of their most recent shareholder report date ranged from less than .005% to .01%.
A complete unaudited list of holdings for each Fidelity Central Fund is available upon request or at the Securities and Exchange Commission (the SEC) website at www.sec.gov. In addition, the financial statements of the Fidelity Central Funds, which are not covered by the Fund's Report of Independent Registered Public Accounting Firm, are available on the SEC website or upon request.
7. Committed Line of Credit.
The Fund participates with other funds managed by the investment adviser or an affiliate in a $4.25 billion credit facility (the "line of credit") to be utilized for temporary or emergency purposes to fund shareholder redemptions or for other short-term liquidity purposes. The Fund has agreed to pay commitment fees on its pro-rata portion of the line of credit, which amounted to $66,325 and is reflected in Miscellaneous expenses on the Statement of Operations. During the period, the Fund did not borrow on this line of credit.
8. Security Lending.
The Fund lends portfolio securities through a lending agent from time to time in order to earn additional income. On the settlement date of the loan, the Fund receives collateral (in the form of U.S. Treasury obligations, letters of credit and/or cash) against the loaned securities and maintains collateral in an amount not less than 100% of the market value of the loaned securities during the period of the loan. The market value of the loaned securities is determined at the close of business of the Fund and any additional required collateral is delivered to the Fund on the next business day. The Fund or borrower may terminate the loan at any time, and if the borrower defaults on its obligation to return the securities loaned because of insolvency or other reasons, the Fund may apply collateral received from the borrower against the obligation. The Fund may experience delays and costs in recovering the securities loaned. Any cash collateral received is invested in the Fidelity Securities Lending Cash Central Fund. The value of loaned securities and cash collateral at period end are disclosed on the Fund's Statement of Assets and Liabilities. Security lending income represents the income earned on investing cash collateral, less rebates paid to borrowers and any lending agent fees associated with the loan, plus any premium payments received for lending certain types of securities. Security lending income is presented in the Statement of Operations as a component of income from Fidelity Central Funds. Total security lending income during the period amounted to $1,399,722.
9. Expense Reductions.
The investment adviser has contractually agreed to waive the Fund's management fee in an amount equal to .25% of the Fund's average net assets until September 30, 2022. During the period, this waiver reduced the Fund's management fee by $60,879,401.
In addition, the investment adviser has voluntarily agreed to waive a portion of the Fund's management fee. During the period, this waiver reduced the Fund's management fee by $876,546.
Through arrangements with the Fund's custodian, credits realized as a result of certain uninvested cash balances were used to reduce the Fund's expenses. During the period, custody credits and transfer agent credits amounted to $25,063.
In addition, during the period the investment adviser reimbursed and/or waived a portion of operating expenses in the amount of $218,420.
10. Other.
The Fund's organizational documents provide former and current trustees and officers with a limited indemnification against liabilities arising in connection with the performance of their duties to the Fund. In the normal course of business, the Fund may also enter into contracts that provide general indemnifications. The Fund's maximum exposure under these arrangements is unknown as this would be dependent on future claims that may be made against the Fund. The risk of material loss from such claims is considered remote.
The Fund does not invest in the Underlying Funds for the purpose of exercising management or control; however, investments by the Fund within its principal investment strategies may represent a significant portion of an Underlying Fund's net assets. At the end of the period, the Fund was the owner of record of approximately 27% of the total outstanding shares of Fidelity SAI U.S. Quality Index Fund.
Report of Independent Registered Public Accounting Firm
To the Board of Trustees of Fidelity Rutland Square Trust II and Shareholders of Strategic Advisers Core Fund:
Opinion on the Financial Statements
We have audited the accompanying statement of assets and liabilities, including the schedule of investments, of Strategic Advisers Core Fund (one of the funds constituting Fidelity Rutland Square Trust II, referred to hereafter as the “Fund”) as of May 31, 2019, the related statement of operations for the year ended May 31, 2019, the statement of changes in net assets for each of the two years in the period ended May 31, 2019, including the related notes, and the financial highlights for each of the five years in the period ended May 31, 2019 (collectively referred to as the “financial statements”). In our opinion, the financial statements present fairly, in all material respects, the financial position of the Fund as of May 31, 2019, the results of its operations for the year then ended, the changes in its net assets for each of the two years in the period ended May 31, 2019 and the financial highlights for each of the five years in the period ended May 31, 2019 in conformity with accounting principles generally accepted in the United States of America.
Basis for Opinion
These financial statements are the responsibility of the Fund’s management. Our responsibility is to express an opinion on the Fund’s financial statements based on our audits. We are a public accounting firm registered with the Public Company Accounting Oversight Board (United States) (PCAOB) and are required to be independent with respect to the Fund in accordance with the U.S. federal securities laws and the applicable rules and regulations of the Securities and Exchange Commission and the PCAOB.
We conducted our audits of these financial statements in accordance with the standards of the PCAOB. Those standards require that we plan and perform the audit to obtain reasonable assurance about whether the financial statements are free of material misstatement, whether due to error or fraud.
Our audits included performing procedures to assess the risks of material misstatement of the financial statements, whether due to error or fraud, and performing procedures that respond to those risks. Such procedures included examining, on a test basis, evidence regarding the amounts and disclosures in the financial statements. Our audits also included evaluating the accounting principles used and significant estimates made by management, as well as evaluating the overall presentation of the financial statements. Our procedures included confirmation of securities owned as of May 31, 2019 by correspondence with the custodian and brokers; when replies were not received from brokers, we performed other auditing procedures. We believe that our audits provide a reasonable basis for our opinion.
PricewaterhouseCoopers LLP
Boston, Massachusetts
July 16, 2019
We have served as the auditor of one or more investment companies in the Fidelity group of funds since 1932.
Trustees and Officers
The Trustees, Members of the Advisory Board (if any), and officers of the trust and fund, as applicable, are listed below. The Board of Trustees governs the fund and is responsible for protecting the interests of shareholders. The Trustees are experienced executives who meet periodically throughout the year to oversee the fund's activities, review contractual arrangements with companies that provide services to the fund, oversee management of the risks associated with such activities and contractual arrangements, and review the fund's performance. If the interests of the fund and an underlying Fidelity® fund were to diverge, a conflict of interest could arise and affect how the Trustees and Members of the Advisory Board fulfill their fiduciary duties to the affected funds. Strategic Advisers has structured the fund to avoid these potential conflicts, although there may be situations where a conflict of interest is unavoidable. In such instances, Strategic Advisers, the Trustees, and Members of the Advisory Board would take reasonable steps to minimize and, if possible, eliminate the conflict. Each of the Trustees oversees 14 funds.
The Trustees hold office without limit in time except that (a) any Trustee may resign; (b) any Trustee may be removed by written instrument, signed by at least two-thirds of the number of Trustees prior to such removal; (c) any Trustee who requests to be retired or who has become incapacitated by illness or injury may be retired by written instrument signed by a majority of the other Trustees; and (d) any Trustee may be removed at any special meeting of shareholders by a two-thirds vote of the outstanding voting securities of the trust. Officers and Advisory Board Members hold office without limit in time, except that any officer or Advisory Board Member may resign or may be removed by a vote of a majority of the Trustees at any regular meeting or any special meeting of the Trustees. Except as indicated, each individual has held the office shown or other offices in the same company for the past five years.
Each Trustee who is not an interested person (as defined in the 1940 Act) of the trust and the fund is referred to herein as an Independent Trustee.
The fund’s Statement of Additional Information (SAI) includes more information about the Trustees. To request a free copy, call Fidelity at 1-800-544-3455.
Experience, Skills, Attributes, and Qualifications of the Trustees. The Governance and Nominating Committee has adopted a statement of policy that describes the experience, qualifications, attributes, and skills that are necessary and desirable for potential Independent Trustee candidates (Statement of Policy). The Board believes that each Trustee satisfied at the time he or she was initially elected or appointed a Trustee, and continues to satisfy, the standards contemplated by the Statement of Policy. The Governance and Nominating Committee may also engage professional search firms to help identify potential Independent Trustee candidates with experience, qualifications, attributes, and skills consistent with the Statement of Policy. Additional criteria based on the composition and skills of the current Independent Trustees, as well as experience or skills that may be appropriate in light of future changes to board composition, business conditions, and regulatory or other developments, may be considered by the professional search firms and the Governance and Nominating Committee. In addition, the Board takes into account the Trustees' commitment and participation in Board and committee meetings, as well as their leadership of standing and ad hoc committees throughout their tenure.
In determining that a particular Trustee was and continues to be qualified to serve as a Trustee, the Board has considered a variety of criteria, none of which, in isolation, was controlling. The Board believes that, collectively, the Trustees have balanced and diverse experience, qualifications, attributes, and skills, which allow the Board to operate effectively in governing the fund and protecting the interests of shareholders. Information about the specific experience, skills, attributes, and qualifications of each Trustee, which in each case led to the Board's conclusion that the Trustee should serve (or continue to serve) as a trustee of the fund, is provided below.
Board Structure and Oversight Function. Robert A. Lawrence is an interested person and currently serves as Chairman. The Trustees have determined that an interested Chairman is appropriate and benefits shareholders because an interested Chairman has a personal and professional stake in the quality and continuity of services provided to the fund. Independent Trustees exercise their informed business judgment to appoint an individual of their choosing to serve as Chairman, regardless of whether the Trustee happens to be independent or a member of management. The Independent Trustees have determined that they can act independently and effectively without having an Independent Trustee serve as Chairman and that a key structural component for assuring that they are in a position to do so is for the Independent Trustees to constitute a substantial majority for the Board. The Independent Trustees also regularly meet in executive session. Mary C. Farrell serves as the lead Independent Trustee and as such (i) acts as a liaison between the Independent Trustees and management with respect to matters important to the Independent Trustees and (ii) with management prepares agendas for Board meetings.
Fidelity® funds are overseen by different Boards of Trustees. The fund's Board oversees asset allocation funds. Other Boards oversee Fidelity's investment-grade bond, money market, and asset allocation funds, and Fidelity's equity and high income funds. The fund may invest in Fidelity® funds overseen by such other Boards. The use of separate Boards, each with its own committee structure, allows the Trustees of each group of Fidelity® funds to focus on the unique issues of the funds they oversee, including common research, investment, and operational issues.
The Trustees primarily operate as a full Board, but also operate in committees, to facilitate the timely and efficient consideration of all matters of importance to the Trustees, the fund, and fund shareholders and to facilitate compliance with legal and regulatory requirements and oversight of the fund's activities and associated risks. The Board has charged Strategic Advisers and its affiliates with (i) identifying events or circumstances the occurrence of which could have demonstrably adverse effects on the fund's business and/or reputation; (ii) implementing processes and controls to lessen the possibility that such events or circumstances occur or to mitigate the effects of such events or circumstances if they do occur; and (iii) creating and maintaining a system designed to evaluate continuously business and market conditions in order to facilitate the identification and implementation processes described in (i) and (ii) above. Because the day-to-day operations and activities of the fund are carried out by or through Strategic Advisers, its affiliates and other service providers, the fund's exposure to risks is mitigated but not eliminated by the processes overseen by the Trustees. Board oversight of different aspects of the fund's activities is exercised primarily through the full Board, but also through the Audit and Compliance Committee. Appropriate personnel, including but not limited to the fund's Chief Compliance Officer (CCO), FMR's internal auditor, the independent accountants, the fund's Treasurer and portfolio management personnel, make periodic reports to the Board's committees, as appropriate. The responsibilities of each standing committee, including their oversight responsibilities, are described further under "Standing Committees of the Trustees."
Interested Trustees*:
Correspondence intended for a Trustee who is an interested person may be sent to Fidelity Investments, 245 Summer Street, Boston, Massachusetts 02210.
Name, Year of Birth; Principal Occupations and Other Relevant Experience+
Brian B. Hogan (1964)
Year of Election or Appointment: 2018
Trustee
Mr. Hogan also serves as Trustee of other funds. Mr. Hogan serves as Head of Fidelity Investments’ Investment Solutions and Innovation organization (2018-present), a Director of Strategic Advisers LLC (2018-present), and a Director of Fidelity SelectCo, LLC (investment adviser firm, 2014-present). Previously, Mr. Hogan served as President of FMR Co., Inc. (2009-2018), a Vice President of Fidelity's Equity and High Income funds (2009-2018), a Director of FMR Investment Management (UK) Limited (investment adviser firm, 2015-2018), Trustee of certain Fidelity® funds (2014-2018), President of the Equity Division of FMR (investment adviser firm, 2009-2018), Senior Vice President, Equity Research of FMR (2006-2009), and as a portfolio manager. Mr. Brian B. Hogan is not related to Mr. Colm A. Hogan.
Robert A. Lawrence (1952)
Year of Election or Appointment: 2016
Trustee
Chairman of the Board of Trustees
Mr. Lawrence also serves as Trustee of other funds. Previously, Mr. Lawrence served as a Member of the Advisory Board of certain funds. Prior to his retirement in 2008, Mr. Lawrence served as Vice President of certain Fidelity® funds (2006-2008), Senior Vice President, Head of High Income Division of Fidelity Management & Research Company (investment adviser firm, 2006-2008), and President of Fidelity Strategic Investments (investment adviser firm, 2002-2005).
* Determined to be an "Interested Trustee" by virtue of, among other things, his or her affiliation with the trust or various entities under common control with Strategic Advisers.
+ The information includes the Trustee's principal occupation during the last five years and other information relating to the experience, attributes, and skills relevant to the Trustee's qualifications to serve as a Trustee, which led to the conclusion that the Trustee should serve as a Trustee for the fund.
Independent Trustees:
Correspondence intended for an Independent Trustee may be sent to Fidelity Investments, P.O. Box 55235, Boston, Massachusetts 02205-5235.
Name, Year of Birth; Principal Occupations and Other Relevant Experience+
Peter C. Aldrich (1944)
Year of Election or Appointment: 2006
Trustee
Mr. Aldrich also serves as Trustee of other funds. Mr. Aldrich is a Director of the National Bureau of Economic Research, a Director of the funds of BlackRock Realty Group (2006-present), and a Director of LivelyHood, Inc. (private corporation, 2013-present). Previously, Mr. Aldrich served as a Trustee for the Fidelity Rutland Square Trust (2005-2010), a Managing Member of Poseidon, LLC (foreign private investment, 1998-2004), and Chairman and Managing Member of AEGIS, LLC (foreign private investment, 1997-2004). Mr. Aldrich previously was a founder, Chief Executive Officer, and Chairman of AEW Capital Management, L.P. (then “Aldrich, Eastman and Waltch, L.P.”). Mr. Aldrich also served as a Director of Zipcar, Inc. (car sharing services, 2001-2009) and as Faculty Chairman of The Research Council on Global Investment of The Conference Board (business and professional education non-profit, 1999-2004). Mr. Aldrich is a Member Emeritus of the Board of Trustees of the Museum of Fine Arts Boston and an Overseer of the Massachusetts Eye and Ear Infirmary.
Ralph F. Cox (1932)
Year of Election or Appointment: 2006
Trustee
Mr. Cox also serves as Trustee of other funds. Mr. Cox is President of RABAR Enterprises (management consulting for the petroleum industry). Mr. Cox is a Director of Abraxas Petroleum (exploration and production, 1999-present). Mr. Cox is a member of the Advisory Boards of the Business and Engineering Schools of Texas A&M University and the Engineering School of University of Texas at Austin. Previously, Mr. Cox served as a Trustee for the Fidelity Rutland Square Trust (2005-2010) and as an Advisory Director of CH2M Hill Companies (engineering, 1981-2011). Mr. Ralph F. Cox and Mr. Howard E. Cox, Jr. are not related.
Mary C. Farrell (1949)
Year of Election or Appointment: 2013
Trustee
Ms. Farrell also serves as Trustee of other funds. Ms. Farrell is a Director of the W.R. Berkley Corporation (insurance provider) and President (2009-present) and Director (2006-present) of the Howard Gilman Foundation (charitable organization). Previously, Ms. Farrell was Managing Director and Chief Investment Strategist at UBS Wealth Management USA and Co-Head of UBS Wealth Management Investment Strategy & Research Group (2003-2005). Ms. Farrell also served as Investment Strategist at PaineWebber (1982-2000) and UBS PaineWebber (2000-2002). Ms. Farrell serves as Chairman of the Board of Trustees of Yale-New Haven Hospital and on the Yale New Haven Health System Board and previously served as Trustee on the Board of Overseers of the New York University Stern School of Business.
Karen Kaplan (1960)
Year of Election or Appointment: 2006
Trustee
Ms. Kaplan also serves as Trustee of other funds. Ms. Kaplan is Chairman (2014-present) and Chief Executive Officer (2013-present) of Hill Holliday (advertising and specialized marketing). Ms. Kaplan is a Director of The Michaels Companies, Inc. (specialty retailer, 2015-present), Member of the Board of Governors of the Chief Executives’ Club of Boston (2010-present), Member of the Executive Committee of the Greater Boston Chamber of Commerce (2006-present), Advisory Board Member of the National Association of Corporate Directors Chapter (2012-present), Member of the Board of Trustees of the Post Office Square Trust (2012-present), Trustee of the Brigham and Women’s Hospital (2016-present), Overseer of the Boston Symphony Orchestra (2014-present), Member of the Board of Directors of The Advertising Council, Inc. (2016-present), and Member of the Ron Burton Training Village Executive Board of Advisors (2018-present). Previously, Ms. Kaplan served as an Advisory Board Member of Fidelity Rutland Square Trust (2006-2010), a member of the Clinton Global Initiative (2010-2015), Director of DSM (dba Delta Dental and DentaQuest) (2004-2014), Formal Appointee of the 2015 Baker-Polito Economic Development Council, Director of Vera Bradley Inc. (designer of women’s accessories, 2012-2015), Member of the Board of Directors of the Massachusetts Conference for Women (2008-2015), Member of the Board of Directors of Jobs for Massachusetts (2012-2015), President of the Massachusetts Women’s Forum (2008-2010), Treasurer of the Massachusetts Women’s Forum (2002-2006), and Vice Chair of the Board of the Massachusetts Society for the Prevention of Cruelty to Children (2003-2010).
Heidi L. Steiger (1953)
Year of Election or Appointment: 2017
Trustee
Ms. Steiger also serves as Trustee of other funds. Ms. Steiger serves as a member of the Global Advisory Board and Of Counsel to Signum Global Advisors (international policy and strategy, 2018-present), a guest lecturer in the joint degree program in Global Luxury Management at North Carolina State University (Raleigh, NC) and Skema (Paris) (2018-present), Managing Partner of Topridge Associates, LLC (consulting, 2005-present), a Non-Executive Director of CrowdBureau Corporation (financial technology company and index provider, 2018-present), and a member of the Board of Directors (2013-present) and Chair of the Audit Committee and member of the Membership and Executive Committees (2017-present) of Business Executives for National Security (nonprofit). Previously, Ms. Steiger served as Eastern Region President of The Private Client Reserve of U.S. Bancorp (banking and financial services, 2010-2015), Advisory Director of Berkshire Capital Securities, LLC (financial services, 2009-2010), President and Senior Advisor of Lowenhaupt Global Advisors, LLC (financial services, 2005-2007), and President and Contributing Editor of Worth Magazine (2004-2005) and held a variety of positions at Neuberger Berman Group, LLC (financial services, 1986-2004), including Partner and Executive Vice President and Global Head of Private Asset Management at Neuberger Berman (1999-2004). Ms. Steiger also served as a member of the Board of Directors of Nuclear Electric Insurance Ltd (insurer of nuclear utilities, 2006-2017), a member of the Board of Trustees and Audit Committee of the Eaton Vance Funds (2007-2010), a member of the Board of Directors of Aviva USA (formerly AmerUs) (insurance, 2004-2014), and a member of the Board of Trustees and Audit Committee and Chair of the Investment Committee of CIFG (financial guaranty insurance, 2009-2012), and a member of the Board of Directors of Kin Group Plc (formerly, Fitbug Holdings) (health and technology, 2016-2017).
+ The information includes the Trustee's principal occupation during the last five years and other information relating to the experience, attributes, and skills relevant to the Trustee's qualifications to serve as a Trustee, which led to the conclusion that the Trustee should serve as a Trustee for the fund.
Advisory Board Members and Officers:
Correspondence intended for an officer or Howard E. Cox, Jr. may be sent to Fidelity Investments, 245 Summer Street, Boston, Massachusetts 02210. Officers appear below in alphabetical order.
Name, Year of Birth; Principal Occupation
Howard E. Cox, Jr. (1944)
Year of Election or Appointment: 2009
Member of the Advisory Board
Mr. Cox also serves as Member of the Advisory Board of other funds. Mr. Cox is a Partner of Greylock (venture capital, 1971-present) and a Director of Stryker Corporation (medical products and services, 1974-present). Previously, Mr. Cox served as an Advisory Board Member of Fidelity Rutland Square Trust (2006-2010). Mr. Cox also serves as a Member of the Secretary of Defense's Business Board of Directors (2008-present), a Director of Business Executives for National Security (1997-present), a Director of the Brookings Institution (2010-present), a Director of the World Economic Forum’s Young Global Leaders Foundation (2009-present), and is a Member of the Harvard Medical School Board of Fellows (2002-present). Mr. Howard E. Cox, Jr. and Mr. Ralph F. Cox are not related.
Elizabeth Paige Baumann (1968)
Year of Election or Appointment: 2017
Anti-Money Laundering (AML) Officer
Ms. Baumann also serves as AML Officer of other funds. She is Chief AML Officer (2012-present) and Senior Vice President (2014-present) of FMR LLC (diversified financial services company) and is an employee of Fidelity Investments. Previously, Ms. Baumann served as AML Officer of the funds (2012-2016), and Vice President (2007-2014) and Deputy Anti-Money Laundering Officer (2007-2012) of FMR LLC.
Craig S. Brown (1977)
Year of Election or Appointment: 2019
Assistant Treasurer
Mr. Brown also serves as Assistant Treasurer of other funds. Mr. Brown is an employee of Fidelity Investments (2013-present).
John J. Burke III (1964)
Year of Election or Appointment: 2018
Chief Financial Officer
Mr. Burke also serves as Chief Financial Officer of other funds. Mr. Burke serves as Head of Investment Operations for Fidelity Fund and Investment Operations (2018-present) and is an employee of Fidelity Investments (1998-present). Previously Mr. Burke served as head of Asset Management Investment Operations (2012-2018).
Jonathan Davis (1968)
Year of Election or Appointment: 2010
Assistant Treasurer
Mr. Davis also serves as Assistant Treasurer of other funds. Mr. Davis serves as Assistant Treasurer of FMR Capital, Inc. (2017-present) and is an employee of Fidelity Investments. Previously, Mr. Davis served as Vice President and Associate General Counsel of FMR LLC (diversified financial services company, 2003-2010).
Adrien E. Deberghes (1967)
Year of Election or Appointment: 2016
President and Treasurer
Mr. Deberghes also serves as an officer of other funds. He serves as Assistant Treasurer of FMR Capital, Inc. (2017-present), Executive Vice President of Fidelity Investments Money Management, Inc. (FIMM) (investment adviser firm, 2016-present), and is an employee of Fidelity Investments (2008-present). Previously, Mr. Deberghes served as President and Treasurer of certain Fidelity® funds (2013-2018). Prior to joining Fidelity Investments, Mr. Deberghes was Senior Vice President of Mutual Fund Administration at State Street Corporation (2007-2008), Senior Director of Mutual Fund Administration at Investors Bank & Trust (2005-2007), and Director of Finance for Dunkin' Brands (2000-2005). Previously, Mr. Deberghes served in other fund officer roles.
Laura M. Del Prato (1964)
Year of Election or Appointment: 2018
Assistant Treasurer
Ms. Del Prato also serves as an officer of other funds. Ms. Del Prato is an employee of Fidelity Investments (2017-present). Prior to joining Fidelity Investments, Ms. Del Prato served as a Managing Director and Treasurer of the JPMorgan Mutual Funds (2014-2017). Prior to JPMorgan, Ms. Del Prato served as a partner at Cohen Fund Audit Services (accounting firm, 2012-2013) and KPMG LLP (accounting firm, 2004-2012).
James D. Gryglewicz (1972)
Year of Election or Appointment: 2015
Chief Compliance Officer
Mr. Gryglewicz also serves as Chief Compliance Officer of other funds. Mr. Gryglewicz serves as Compliance Officer of Strategic Advisers LLC (investment adviser firm, 2015-present) and Fidelity SelectCo, LLC (investment adviser firm, 2014-present), Senior Vice President of Asset Management Compliance (2009-present), and is an employee of Fidelity Investments (2004-present). Previously, Mr. Gryglewicz served as Chief Compliance Officer of certain Fidelity® funds (2014-2018).
John Hitt (1967)
Year of Election or Appointment: 2014
Secretary and Chief Legal Officer
Mr. Hitt also serves as an officer of other funds. Mr. Hitt serves as Senior Vice President and Deputy General Counsel in Fidelity's Asset Management Group (2010-present) and is an employee of Fidelity Investments.
Colm A. Hogan (1973)
Year of Election or Appointment: 2016
Assistant Treasurer
Mr. Hogan also serves as an officer of other funds. Mr. Hogan serves as Assistant Treasurer of FMR Capital, Inc. (2017-present) and is an employee of Fidelity Investments (2005-present). Previously, Mr. Hogan served as Assistant Treasurer of certain Fidelity® funds (2016-2018). Mr. Colm A. Hogan is not related to Mr. Brian B. Hogan.
Christina H. Lee (1975)
Year of Election or Appointment: 2018
Assistant Secretary
Ms. Lee also serves as Assistant Secretary of other funds. Ms. Lee serves as Vice President, Associate General Counsel (2014-present) and is an employee of Fidelity Investments (2007-present).
Chris Maher (1972)
Year of Election or Appointment: 2016
Assistant Treasurer
Mr. Maher serves as Assistant Treasurer of other funds. Mr. Maher is Vice President of Valuation Oversight, serves as Assistant Treasurer of FMR Capital, Inc. (2017-present), and is an employee of Fidelity Investments. Previously, Mr. Maher served as Vice President of Asset Management Compliance (2013), Vice President of the Program Management Group of FMR (investment adviser firm, 2010-2013), and Vice President of Valuation Oversight (2008-2010).
Stacie M. Smith (1974)
Year of Election or Appointment: 2016
Assistant Treasurer
Ms. Smith also serves as an officer of other funds. Ms. Smith serves as Assistant Treasurer of FMR Capital, Inc. (2017-present), is an employee of Fidelity Investments (2009-present), and has served in other fund officer roles. Prior to joining Fidelity Investments, Ms. Smith served as Senior Audit Manager of Ernst & Young LLP (accounting firm, 1996-2009). Previously, Ms. Smith served as Assistant Treasurer (2013-2018) and Deputy Treasurer (2013-2016) of certain Fidelity® funds.
Marc L. Spector (1972)
Year of Election or Appointment: 2016
Assistant Treasurer
Mr. Spector also serves as an officer of other funds. Mr. Spector serves as Assistant Treasurer of FMR Capital, Inc. (2017-present) and is an employee of Fidelity Investments (2016-present). Prior to joining Fidelity Investments, Mr. Spector served as Director at the Siegfried Group (accounting firm, 2013-2016), and prior to Siegfried Group as audit senior manager at Deloitte & Touche (accounting firm, 2005-2013).
Jim Wegmann (1979)
Year of Election or Appointment: 2019
Assistant Treasurer
Mr. Wegmann also serves as Assistant Treasurer of other funds. Mr. Wegmann is an employee of Fidelity Investments (2011-present).
Shareholder Expense Example
As a shareholder of the Fund, you incur two types of costs: (1) transaction costs and (2) ongoing costs, including management fees and other Fund expenses. This Example is intended to help you understand your ongoing costs (in dollars) of investing in the Fund and to compare these costs with the ongoing costs of investing in other mutual funds.
The Example is based on an investment of $1,000 invested at the beginning of the period and held for the entire period (December 1, 2018 to May 31, 2019).
Actual Expenses
The first line of the accompanying table provides information about actual account values and actual expenses. You may use the information in this line, together with the amount you invested, to estimate the expenses that you paid over the period. Simply divide your account value by $1,000.00 (for example, an $8,600 account value divided by $1,000.00 = 8.6), then multiply the result by the number in the first line under the heading entitled "Expenses Paid During Period" to estimate the expenses you paid on your account during this period. In addition to the direct expenses incurred by the Fund presented in the table, as a shareholder of the underlying mutual funds (the Underlying Funds), the Fund also indirectly bears its proportionate share of the expenses of the Underlying Funds. In addition, the Fund, as a shareholder in the underlying Fidelity Central Funds, will indirectly bear its pro-rata share of the fees and expenses incurred by the underlying Fidelity Central Funds. These fees and expenses are not included in the Fund's annualized expense ratio used to calculate the expense estimate in the table below.
Hypothetical Example for Comparison Purposes
The second line of the accompanying table provides information about hypothetical account values and hypothetical expenses based on the Fund's actual expense ratio and an assumed rate of return of 5% per year before expenses, which is not the Fund's actual return. The hypothetical account values and expenses may not be used to estimate the actual ending account balance or expenses you paid for the period. You may use this information to compare the ongoing costs of investing in the Fund and other funds. To do so, compare this 5% hypothetical example with the 5% hypothetical examples that appear in the shareholder reports of the other funds. In addition to the direct expenses incurred by the Fund presented in the table, as a shareholder of the Underlying Funds, the Fund also indirectly bears its proportionate share of the expenses of the Underlying Funds. In addition, the Fund, as a shareholder in the underlying Fidelity Central Funds, will indirectly bear its pro-rata share of the fees and expenses incurred by the underlying Fidelity Central Funds. These fees and expenses are not included in the Fund's annualized expense ratio used to calculate the expense estimate in the table below.
Please note that the expenses shown in the table are meant to highlight your ongoing costs only and do not reflect any transaction costs. Therefore, the second line of the table is useful in comparing ongoing costs only, and will not help you determine the relative total costs of owning different funds.
| Annualized Expense Ratio-A | Beginning Account Value December 1, 2018 | Ending Account Value May 31, 2019 | Expenses Paid During Period-B December 1, 2018 to May 31, 2019 |
|
| Actual | .20% | $1,000.00 | $1,005.50 | $1.00 |
| Hypothetical-C | $1,000.00 | $1,023.93 | $1.01 |
A Annualized expense ratio reflects expenses net of applicable fee waivers.
B Expenses are equal to the Fund's annualized expense ratio, multiplied by the average account value over the period, multiplied by 182/365 (to reflect the one-half year period). The fees and expenses of the Underlying Funds in which the Fund invests are not included in the Fund's annualized expense ratio."
C 5% return per year before expenses
Distributions (Unaudited)
The Board of Trustees of Strategic Advisers Core Fund voted to pay on July 15, 2019, to shareholders of record at the opening of business on July 12, 2019, a distribution of $.341 per share derived from capital gains realized from sales of portfolio securities and a dividend of $.088 per share from net investment income.
The fund hereby designates as a capital gain dividend with respect to the taxable year ended May 31, 2019, $1,027,008,580 or, if subsequently determined to be different, the net capital gain of such year.
The fund designates 53% and 75% of the dividends distributed in July and December, respectively during the fiscal year as qualifying for the dividends–received deduction for corporate shareholders.
The fund designates 57% and 80% of the dividends distributed in July and December, respectively, during the fiscal year as amounts which may be taken into account as a dividend for the purposes of the maximum rate under section 1(h)(11) of the Internal Revenue Code.
The fund will notify shareholders in January 2020 of amounts for use in preparing 2019 income tax returns.
Board Approval of Investment Advisory Contracts
Strategic Advisers Core Fund
On December 5, 2018, the Board of Trustees, including the Independent Trustees (together, the Board), voted at an in-person meeting to approve an amendment to the fee schedule in the existing sub-advisory agreement with Boston Partners Global Investors, Inc. (Boston Partners) for the fund (the Amended Sub-Advisory Agreement), which has the potential to lower the amount of fees paid by Strategic Advisers LLC (Strategic Advisers) to Boston Partners, on behalf of the fund. The Board also approved amendments to the termination provision and the most favored nations provision of the Amended Sub-Advisory Agreement to recognize an exception for three legacy institutional accounts. The terms of the Amended Sub-Advisory Agreement are not materially different from those of the existing sub-advisory agreement, except with respect to the date of execution, the fee schedule, the termination and most favored nations provisions, and the updated reference to the legal entity name change for Strategic Advisers.
The Board, assisted by the advice of fund counsel and Independent Trustees' counsel, considered a broad range of information it believed relevant to the approval of the Amended Sub-Advisory Agreement.
In considering whether to approve the Amended Sub-Advisory Agreement, the Board reached a determination, with the assistance of fund counsel and Independent Trustees' counsel and through the exercise of its business judgment, that the approval of the Amended Sub-Advisory Agreement is in the best interests of the fund and its shareholders and that the approval of such agreement does not involve a conflict of interest from which Strategic Advisers or its affiliates derive an inappropriate advantage. Also, the Board found that the advisory fees to be charged under the Amended Sub-Advisory Agreement bear a reasonable relationship to the services to be rendered and will be based upon services provided that will be in addition to, rather than duplicative of services provided under the advisory contract of any underlying fund in which the fund may invest. The Board's decision to approve the Amended Sub-Advisory Agreement was not based on any single factor, but rather was based on a comprehensive consideration of all the information provided to the Board. In addition, individual Trustees did not necessarily attribute the same weight or importance to each factor.
Nature, Extent, and Quality of Services Provided. The Board considered that it reviewed information regarding Boston Partners, including the backgrounds of its investment personnel, and also took into consideration the fund's investment objective, strategies and related investment philosophy, in connection with the annual renewal of the current sub-advisory agreement at its September 2018 Board meeting.The Board considered that the Amended Sub-Advisory Agreement will not result in any changes to the nature, extent and quality of the services provided to the fund. The Board also considered that the Amended Sub-Advisory Agreement would not result in any changes to (i) the investment process or strategies employed in the management of the fund's assets, or (ii) the day-to-day management of the fund or the persons primarily responsible for such management. Investment Performance. The Board considered that it received information regarding the sub-adviser's historical investment performance in managing fund assets at its June 2018 Board meeting and throughout the year. The Board noted that the Amended Sub-Advisory Agreement would not result in any changes to the fund's investment processes or strategies or in the persons primarily responsible for the day-to-day management of the fund, and considered Boston Partners' contribution to the fund's overall performance since being allocated assets to manage.Based on its review, the Board concluded that the nature, extent, and quality of services that will be provided to the fund under the Amended Sub-Advisory Agreement will continue to benefit the fund's shareholders. Competitiveness of Management Fee and Total Fund Expenses. The Board considered that the new fee schedule with Boston Partners will not result in any changes to the fund's total management fee or total fund expenses because Strategic Advisers has not allocated any assets of the fund to Boston Partners at this time. The Board considered that to the extent Strategic Advisers allocates assets of the fund to Boston Partners in the future, the new fee schedule under the Amended Sub-Advisory Agreement would result in lower fees to be paid by Strategic Advisers to Boston Partners, on behalf of the fund, compared to the fees that would be paid under current sub-advisory agreement. In addition, the Board considered that Strategic Advisers' portion of the management fee will continue to be all-inclusive and that Strategic Advisers will continue to pay the fund's operating expenses, with certain limited exceptions, out of its portion of the management fee. Based on its review, the Board concluded that the fund's management fee structure and total expenses continue to bear a reasonable relationship to the services that the fund and its shareholders will receive under the Amended Sub-Advisory Agreement and the other factors considered.In considering the lower fee schedule and the modifications to the most favored nations provision in the Amended Sub-Advisory Agreement, the Board took into account fees paid by certain legacy accounts managed by Boston Partners. The Board considered that Strategic Advisers had discussed with the Board that obtaining a lower rate than the fee schedule in the Amended Sub-Advisory Agreement from a comparable sub-adviser was unlikely. The Board also considered the reasonableness of the lower fee schedule in light of the differentiated and desirable exposure that the mandate provides to the Fund.The Board considered that the amended termination provision in the Amended Sub-Advisory Agreement would serve to extend the period during which the Fund would potentially benefit from the new fee schedule, and noted that this amendment does not modify the ability of Strategic Advisers and the fund (by action of the Board or the fund's shareholders) to terminate the Amended Sub-Advisory Agreement without penalty on 60 days' notice.Because the Amended Sub-Advisory Agreement was negotiated at arm's length and will have no impact on the maximum management fees payable by the fund, the Board did not consider the costs of services and profitability of the relationship with the fund to Strategic Advisers to be significant factors in its decision to approve the Amended Sub-Advisory Agreement. Potential Fall-Out Benefits. The Board considered that it reviews information regarding the potential of direct and indirect benefits to Strategic Advisers and its affiliates from their relationships with the fund, including non-advisory fee compensation paid to affiliates of Strategic Advisers, if any, as well as information regarding potential fall-out benefits accruing to the sub-adviser, if any, as a result of its relationship with the fund, during its annual renewal of the fund's advisory agreements at its September Board meeting. Possible Economies of Scale. The Board considered that the Amended Sub-Advisory Agreement, like the current sub-advisory agreement, provides for breakpoints that have the potential to further reduce sub-advisory fees paid to Boston Partners as assets allocated to the sub-adviser grow. The Board also considered that it reviewed whether there have been economies of scale in connection with the management of the fund during its annual renewal of the fund's advisory agreement with Strategic Advisers at its September 2018 Board meeting. Conclusion. Based on its evaluation of all of the conclusions noted above, and after considering all factors it believed relevant, the Board ultimately concluded that the Amended Sub-Advisory Agreement's fee structure continues to bear a reasonable relationship to the services rendered to the fund and that the Amended Sub-Advisory Agreement should be approved because the agreement is in the best interests of the fund and its shareholders. The Board also concluded that the sub-advisory fees to be charged thereunder will be based on services provided that will be in addition to, rather than duplicative of services provided under the advisory contract of any underlying fund in which the fund may invest. In addition, the Board concluded that the approval of the Amended Sub-Advisory Agreement does not involve a conflict of interest from which Strategic Advisers or its affiliates derive an inappropriate advantage.Board Approval of Sub-Advisory Agreement
Strategic Advisers Core Fund On December 5, 2018, the Board of Trustees, including the Independent Trustees (together, the Board) voted at an in-person meeting to approve an investment advisory agreement (the Sub-Advisory Agreement) with AllianceBernstein L.P. (AllianceBernstein) for the fund in the event of certain changes to the indirect ownership of AllianceBernstein. The Board noted that the terms of the Sub-Advisory Agreement are identical in all material respects to those of the existing sub-advisory agreement with AllianceBernstein, except with respect to the date of execution.The Board, assisted by the advice of fund counsel and Independent Trustees’ counsel, considered a broad range of information it believed relevant to the approval of the Sub-Advisory Agreement.In considering whether to approve the Sub-Advisory Agreement, the Board reached a determination, with the assistance of fund counsel and Independent Trustees' counsel and through the exercise of its business judgment, that the approval of the Sub-Advisory Agreement is in the best interests of the fund and its shareholders and that the approval of such agreement does not involve a conflict of interest from which the fund’s investment adviser, Strategic Advisers LLC (Strategic Advisers), or its affiliates derive an inappropriate advantage. Also, the Board found that the sub-advisory fees to be charged under the Sub- Advisory Agreement bear a reasonable relationship to the services to be rendered and will be based upon services provided that will be in addition to, rather than duplicative of, services provided under the advisory contract of any underlying fund in which the fund may invest. The Board’s decision to approve the Sub-Advisory Agreement was not based on any single factor, but rather was based on a comprehensive consideration of all the information provided to the Board. Nature, Extent, and Quality of Services Provided. The Board considered that it reviewed information regarding AllianceBernstein, including the backgrounds of its investment personnel, and also took into consideration the fund’s investment objective, strategies and related investment philosophy, in connection with the annual renewal of the fund’s current sub-advisory agreement with AllianceBernstein at its September 2018 Board meeting.The Board considered that the Sub-Advisory Agreement will not result in any changes to the nature, extent and quality of the services provided to the fund. The Board also considered that the Sub-Advisory Agreement would not result in any changes to (i) the investment process or strategies employed in the management of the fund’s assets or (ii) the day-to-day management of the fund or the persons primarily responsible for such management under the existing sub-advisory agreement. Investment Performance. The Board considered that it received information regarding AllianceBernstein’s historical investment performance in managing fund assets in connection with the annual renewal of the fund’s current sub-advisory agreement with AllianceBernstein and throughout the year. The Board did not consider performance to be a material factor in its decision to approve the Sub-Advisory Agreement because the Sub-Advisory Agreement would not result in any changes to the fund’s investment processes or strategies or in the persons primarily responsible for the day-to-day management of the fund.Based on its review, the Board concluded that the nature, extent, and quality of services that will be provided to the fund under the Sub-Advisory Agreement will continue to benefit the fund’s shareholders. Competitiveness of Management Fee and Total Fund Expenses. In reviewing the Sub-Advisory Agreement, the Board considered the amount and nature of fees to be paid by the fund to Strategic Advisers and the amount and nature of fees to be paid by Strategic Advisers to AllianceBernstein and the absence of any change in the fund’s total operating expenses as a result of approving the Sub-Advisory Agreement.The Board considered that there are no expected changes to the fund’s management fees or total operating expenses as a result of approving the Sub-Advisory Agreement and that the fund’s management fees and total net expenses are expected to maintain the same relationship to the competitive peer group medians reviewed by the Board in connection with the annual renewal of the fund’s advisory contracts at the September 2018 meeting.Based on its review, the Board concluded that the fund’s management fee structure and projected total expenses bear a reasonable relationship to the services that the fund and its shareholders will receive and the other factors considered.Because the Sub-Advisory Agreement was negotiated at arm’s length and will have no impact on the maximum management fees payable by the fund or Strategic Advisers portion of the management fee, the Board did not consider the costs of services and profitability to be significant factors in its decision to approve the Sub-Advisory Agreement. Potential Fall-Out Benefits. The Board considered that it reviews information regarding the potential of direct and indirect benefits to Strategic Advisers and its affiliates from their relationships with the fund, including non-advisory fee compensation paid to affiliates of Strategic Advisers, if any, during its annual renewal of the fund’s advisory agreement with Strategic Advisers. With respect to AllianceBernstein, the Board considered Strategic Advisers’ representation that it does not anticipate that the approval of the Sub-Advisory Agreement will have a material impact on the potential for fall-out benefits to Strategic Advisers or its affiliates. Possible Economies of Scale. The Board considered that it reviews whether there have been economies of scale in connection with the management of the fund during its annual renewal of the fund’s advisory agreement with Strategic Advisers and the fund’s sub-advisory agreements. The Board noted that the Sub-Advisory Agreement provides for breakpoints that have the potential to reduce sub-advisory fees paid to AllianceBernstein as assets allocated to AllianceBernstein grow. The Board also considered that it reviewed whether there have been economies of scale in connection with the management of the fund during its annual renewal of the fund’s advisory agreement with Strategic Advisers at its September 2018 Board meeting. Conclusion. Based on its evaluation of all of the conclusions noted above, and after considering all factors it believed relevant, the Board ultimately concluded that the Sub-Advisory Agreement’s fee structure bears a reasonable relationship to the services to be rendered and that the Sub-Advisory Agreement should be approved because the Sub-Advisory Agreement is in the best interests of the fund and its shareholders. The Board also concluded that the sub-advisory fees to be charged thereunder will be based on services provided that will be in addition to, rather than duplicative of, services provided under the advisory contract of any underlying fund in which the fund may invest. In addition, the Board concluded that the approval of the Sub-Advisory Agreement does not involve a conflict of interest from which Strategic Advisers or its affiliates derive an inappropriate advantage.Board Approval of Investment Advisory Contract and Management Fees
Strategic Advisers Core Fund On March 7, 2019, the Board of Trustees, including the Independent Trustees (together, the Board) voted at an in-person meeting to approve an investment advisory agreement (the Sub-Advisory Agreement) with Invesco Advisers, Inc. (Invesco) for the fund, which would take effect upon the consummation of a transaction pursuant to which Invesco Ltd. will acquire OppenheimerFunds, Inc. (Oppenheimer), a sub- adviser to the fund (Transaction). The Board noted that the terms of the Sub-Advisory Agreement are identical in all material respects to those of the fund's current sub-advisory agreement with Oppenheimer, except with respect to the date of execution, the named sub-adviser, and the legal entity name for Strategic Advisers LLC (Strategic Advisers).The Board, assisted by the advice of fund counsel and Independent Trustees' counsel, considered a broad range of information it believed relevant to the approval of the Sub-Advisory Agreement.In considering whether to approve the Sub-Advisory Agreement, the Board reached a determination, with the assistance of fund counsel and Independent Trustees' counsel and through the exercise of its business judgment, that the approval of the Sub-Advisory Agreement is in the best interests of the fund and its shareholders and that the approval of such agreement does not involve a conflict of interest from which the fund's investment adviser, Strategic Advisers, or its affiliates derive an inappropriate advantage. Also, the Board found that the fees to be charged under the Sub-Advisory Agreement bear a reasonable relationship to the services to be rendered and will be based upon services provided that will be in addition to, rather than duplicative of, services provided under the advisory contract of any underlying fund in which the fund may invest. The Board's decision to approve the Sub-Advisory Agreement was not based on any single factor, but rather was based on a comprehensive consideration of all the information provided to the Board. Nature, Extent, and Quality of Services Provided. The Board considered that the Transaction will not result in any changes to the investment personnel that currently provide services to the fund and that, after the Transaction closes, the same investment advisory personnel will continue to provide services to the fund as employees of Invesco. The Board noted that it reviewed information regarding the backgrounds of Oppenheimer's investment personnel, and also took into consideration the fund's investment objective, strategies and related investment philosophy, in connection with the annual renewal of the current sub-advisory agreement with Oppenheimer (Current Sub-Advisory Agreement) at its September 2018 Board meeting. The Board also considered Invesco's and Oppenheimer's representation that the Transaction is not anticipated to result in any changes to the nature, extent and quality of the services provided to the fund. Investment Performance. The Board did not consider performance to be a material factor in its decision to approve the Sub-Advisory Agreement because the Sub-Advisory Agreement would not result in any changes to the fund's investment processes or strategies or in the persons primarily responsible for the day-to-day management of the fund. The Board noted that it reviewed the historical investment performance of Oppenheimer, on behalf of the fund, in connection with the renewal of the Current Sub- Advisory Agreement at its September 2018 meeting.Based on its review, the Board concluded that the nature, extent, and quality of services that will be provided to the fund under the Sub-Advisory Agreement should benefit the fund's shareholders. Competitiveness of Management Fee and Total Fund Expenses. In reviewing the Sub-Advisory Agreement, the Board considered that there would be no changes to the amount and nature of fees that are currently paid by Strategic Advisers to Oppenheimer under the Current Sub-Advisory Agreement and that will be paid to Invesco under the Sub-Advisory Agreement. The Board also considered that the Sub- Advisory Agreement will not have any impact on Strategic Advisers' portion of the fund's management fee, the fund's maximum aggregate annual management fee rate, Strategic Advisers' contractual management fee waiver for the fund, or total operating expenses. The Board also considered that the fund's management fee and total net expenses are expected to maintain the same relationship to the competitive peer group medians reviewed by the Board in connection with the annual renewal of the fund's advisory contracts at the September 2018 meeting.Based on its review, the Board concluded that the fund's management fee structure and total expenses continue to bear a reasonable relationship to the services that the fund and its shareholders will receive and the other factors considered.Because the Sub-Advisory Agreement was negotiated at arm's length and will have no impact on the maximum management fees payable by the fund or Strategic Advisers portion of the management fee, the Board did not consider the costs of services and the profitability of the relationship with the fund to Strategic Advisers to be significant factors in its decision to approve the Sub-Advisory Agreement. Potential Fall-Out Benefits. The Board considered that it reviews information regarding the potential of direct and indirect benefits to Strategic Advisers and its affiliates from their relationships with the fund, including non-advisory fee compensation paid to affiliates of Strategic Advisers, if any, during its annual renewal of the fund's advisory agreement with Strategic Advisers. With respect to Invesco, the Board considered Strategic Advisers' representation that it does not anticipate that the approval of the Sub- Advisory Agreement will have a material impact on the potential for fall-out benefits to Strategic Advisers or its affiliates. Possible Economies of Scale. The Board considered that it reviews whether there have been economies of scale in connection with the management of the fund during its annual renewal of the fund's advisory agreement with Strategic Advisers and the fund's sub-advisory agreements. The Board noted that the Sub-Advisory Agreement will continue to provide for identical breakpoints as the Current Sub- Advisory agreement; however, the Board also noted that the fund has achieved asset levels above the maximum breakpoint. Conclusion. Based on its evaluation of all of the conclusions noted above, and after considering all factors it believed relevant, the Board ultimately concluded that the Sub-Advisory Agreement's fee structure bears a reasonable relationship to the services to be rendered and that the Sub-Advisory Agreement should be approved because the Sub-Advisory Agreement is in the best interests of the fund and its shareholders. The Board also concluded that the sub-advisory fees to be charged thereunder will be based on services provided that will be in addition to, rather than duplicative of, services provided under the advisory contract of any underlying fund in which the fund may invest. In addition, the Board concluded that the approval of the Sub-Advisory Agreement does not involve a conflict of interest from which Strategic Advisers or its affiliates derive an inappropriate advantage.Board Approval of Investment Advisory Contract and Management Fees
Strategic Advisers Core Fund On March 7, 2019, the Board of Trustees, including the Independent Trustees (together, the Board) voted at an in-person meeting to approve an investment advisory agreement (the Sub-Advisory Agreement) with ClariVest Asset Management LLC (ClariVest) for the fund, which would take effect upon the consummation of a transaction resulting in changes to the ownership of ClariVest, a sub-adviser to the fund. The Board noted that the terms of the Sub-Advisory Agreement are identical in all material respects to those of the existing sub-advisory agreement with ClariVest, except with respect to the date of execution. The Board, assisted by the advice of fund counsel and Independent Trustees' counsel, considered a broad range of information it believed relevant to the approval of the Sub-Advisory Agreement.In considering whether to approve the Sub-Advisory Agreement, the Board reached a determination, with the assistance of fund counsel and Independent Trustees' counsel and through the exercise of its business judgment, that the approval of the Sub-Advisory Agreement is in the best interests of the fund and its shareholders and that the approval of such agreement does not involve a conflict of interest from which the fund's investment adviser, Strategic Advisers LLC (Strategic Advisers), or its affiliates derive an inappropriate advantage. Also, the Board found that the fees to be charged under the Sub-Advisory Agreement bear a reasonable relationship to the services to be rendered and will be based upon services provided that will be in addition to, rather than duplicative of, services provided under the advisory contract of any underlying fund in which the fund may invest. The Board's decision to approve the Sub- Advisory Agreement was not based on any single factor, but rather was based on a comprehensive consideration of all the information provided to the Board. Nature, Extent, and Quality of Services Provided. The Board considered that it reviewed information regarding ClariVest, including the backgrounds of its investment personnel, and also took into consideration the fund's investment objective, strategies and related investment philosophy, in connection with the annual renewal of the fund's current sub-advisory agreement with ClariVest at its September 2018 Board meeting.The Board considered that the Sub-Advisory Agreement will not result in any changes to the nature, extent and quality of the services provided to the fund. The Board also considered that the Sub-Advisory Agreement would not result in any changes to (i) the investment process or strategies employed in the management of the fund's assets or (ii) the day-to-day management of the fund or the persons primarily responsible for such management under the existing sub-advisory agreement. Investment Performance. The Board considered that it received information regarding ClariVest's historical investment performance in managing fund assets in connection with the annual renewal of the fund's current sub-advisory agreement with ClariVest and throughout the year. The Board did not consider performance to be a material factor in its decision to approve the Sub-Advisory Agreement because the Sub-Advisory Agreement would not result in any changes to the fund's investment processes or strategies or in the persons primarily responsible for the day-to-day management of the fund.Based on its review, the Board concluded that the nature, extent, and quality of services that will be provided to the fund under the Sub-Advisory Agreement should benefit the fund's shareholders. Competitiveness of Management Fee and Total Fund Expenses. In reviewing the Sub-Advisory Agreement, the Board considered the amount and nature of fees to be paid by the fund to Strategic Advisers and the amount and nature of fees to be paid by Strategic Advisers to ClariVest and the absence of any change in the fund's total operating expenses as a result of approving the Sub- Advisory Agreement.The Board considered that there are no expected changes to the fund's management fee or total operating expenses as a result of approving the Sub-Advisory Agreement and that the fund's management fee and total net expenses are expected to maintain the same relationship to the competitive peer group medians reviewed by the Board in connection with the annual renewal of the fund's advisory contracts at the September 2018 meeting.Based on its review, the Board concluded that the fund's management fee structure and total expenses continue to bear a reasonable relationship to the services that the fund and its shareholders will receive and the other factors considered.Because the Sub-Advisory Agreement was negotiated at arm's length and will have no impact on the maximum management fees payable by the fund or Strategic Advisers portion of the management fee, the Board did not consider the costs of services and the profitability of the relationship with the fund to Strategic Advisers to be significant factors in its decision to approve the Sub-Advisory Agreement. Potential Fall-Out Benefits. The Board considered that it reviews information regarding the potential of direct and indirect benefits to Strategic Advisers and its affiliates from their relationships with the fund, including non-advisory fee compensation paid to affiliates of Strategic Advisers, if any, during its annual renewal of the fund's advisory agreement with Strategic Advisers. With respect to ClariVest, the Board considered Strategic Advisers' representation that it does not anticipate that the approval of the Sub-Advisory Agreement will have a material impact on the potential for fall-out benefits to Strategic Advisers or its affiliates. Possible Economies of Scale. The Board considered that it reviews whether there have been economies of scale in connection with the management of the fund during its annual renewal of the fund's advisory agreement with Strategic Advisers and the fund's sub-advisory agreements. The Board noted that the Sub-Advisory Agreement provides for breakpoints that have the potential to reduce sub-advisory fees paid to ClariVest as assets allocated to ClariVest grow. The Board also considered that it reviewed whether there have been economies of scale in connection with the management of the fund during its annual renewal of the fund's advisory agreement with Strategic Advisers at its September 2018 Board meeting. Conclusion. Based on its evaluation of all of the conclusions noted above, and after considering all factors it believed relevant, the Board ultimately concluded that the Sub-Advisory Agreement’s fee structure bears a reasonable relationship to the services to be rendered and that the Sub-Advisory Agreement should be approved because the Sub-Advisory Agreement is in the best interests of the fund and its shareholders. The Board also concluded that the sub-advisory fees to be charged thereunder will be based on services provided that will be in addition to, rather than duplicative of, services provided under the advisory contract of any underlying fund in which the fund may invest. In addition, the Board concluded that the approval of the Sub-Advisory Agreement does not involve a conflict of interest from which Strategic Advisers or its affiliates derive an inappropriate advantage.
![]()
SAI-COR-ANN-0719
1.902940.110
|
Strategic Advisers® Growth Fund Offered exclusively to certain clients of Strategic Advisers LLC - not available for sale to the general public Annual Report May 31, 2019 |
|
|
Beginning on January 1, 2021, as permitted by regulations adopted by the Securities and Exchange Commission, paper copies of a fund’s shareholder reports will no longer be sent by mail, unless you specifically request paper copies of the reports from the fund or from your financial intermediary, such as a financial advisor, broker-dealer or bank. Instead, the reports will be made available on a website, and you will be notified by mail each time a report is posted and provided with a website link to access the report.
If you already elected to receive shareholder reports electronically, you will not be affected by this change and you need not take any action. You may elect to receive shareholder reports and other communications from a fund electronically, by contacting your financial intermediary. For Fidelity customers, visit Fidelity's web site or call Fidelity using the contact information listed below.
You may elect to receive all future reports in paper free of charge. If you wish to continue receiving paper copies of your shareholder reports, you may contact your financial intermediary or, if you are a Fidelity customer, visit Fidelity’s website, or call Fidelity at the applicable toll-free number listed below. Your election to receive reports in paper will apply to all funds held with the fund complex/your financial intermediary.
| Account Type | Website | Phone Number |
| Brokerage, Mutual Fund, or Annuity Contracts: | fidelity.com/mailpreferences | 1-800-343-3548 |
| Employer Provided Retirement Accounts: | netbenefits.fidelity.com/preferences (choose 'no' under Required Disclosures to continue to print) | 1-800-343-0860 |
| Advisor Sold Accounts Serviced Through Your Financial Intermediary: | Contact Your Financial Intermediary | Your Financial Intermediary's phone number |
| Advisor Sold Accounts Serviced by Fidelity: | institutional.fidelity.com | 1-877-208-0098 |
Contents
|
Board Approval of Investment Advisory Contracts and Management Fees |
To view a fund's proxy voting record for the 12-month period ended June 30, visit http://www.fidelity.com/proxyvotingresults or visit the Securities and Exchange Commission's (SEC) web site at http://www.sec.gov.
You may also call 1-800-544-3455 to request a free copy of the proxy voting guidelines.
Standard & Poor's, S&P and S&P 500 are registered service marks of The McGraw-Hill Companies, Inc. and have been licensed for use by Fidelity Distributors Corporation.
Other third-party marks appearing herein are the property of their respective owners.
All other marks appearing herein are registered or unregistered trademarks or service marks of FMR LLC or an affiliated company. © 2019 FMR LLC. All rights reserved.
This report and the financial statements contained herein are submitted for the general information of the shareholders of the Fund. This report is not authorized for distribution to prospective investors in the Fund unless preceded or accompanied by an effective prospectus.
A fund files its complete schedule of portfolio holdings with the SEC for the first and third quarters of each fiscal year on Form N-PORT. Forms N-PORT are available on the SEC’s web site at http://www.sec.gov. A fund's Forms N-PORT may be reviewed and copied at the SEC’s Public Reference Room in Washington, DC. Information regarding the operation of the SEC's Public Reference Room may be obtained by calling 1-800-SEC-0330.
For a complete list of a fund's portfolio holdings, view the most recent holdings listing, semiannual report, or annual report on Fidelity's web site at http://www.fidelity.com, http://www.institutional.fidelity.com, or http://www.401k.com, as applicable.
NOT FDIC INSURED •MAY LOSE VALUE •NO BANK GUARANTEE
Neither the Fund nor Fidelity Distributors Corporation is a bank.
Performance: The Bottom Line
Average annual total return reflects the change in the value of an investment, assuming reinvestment of distributions from dividend income and capital gains (the profits earned upon the sale of securities that have grown in value, if any) and assuming a constant rate of performance each year. The hypothetical investment and the average annual total returns do not reflect the deduction of taxes that a shareholder would pay on fund distributions or the redemption of fund shares. During periods of reimbursement by Fidelity, a fund’s total return will be greater than it would be had the reimbursement not occurred. How a fund did yesterday is no guarantee of how it will do tomorrow.
Average Annual Total Returns
| For the periods ended May 31, 2019 | Past 1 year | Past 5 years | Life of fundA |
| Strategic Advisers® Growth Fund | 1.30% | 10.60% | 13.25% |
A From June 2, 2010
$10,000 Over Life of Fund
Let's say hypothetically that $10,000 was invested in Strategic Advisers® Growth Fund on June 2, 2010, when the fund started.
The chart shows how the value of your investment would have changed, and also shows how the Russell 1000® Growth Index performed over the same period.

| Period Ending Values | ||
|
| $30,633 | Strategic Advisers® Growth Fund |
|
| $34,797 | Russell 1000® Growth Index |
Management's Discussion of Fund Performance
Market Recap: The S&P 500® index gained 3.78% for the 12 months ending May 31, 2019, as U.S. equities began the new year on a high note after enduring a historically volatile final quarter of 2018. Upbeat company earnings/outlooks and signs the U.S. Federal Reserve may pause on rates boosted the index to an all-time high on April 30. In May, however, volatility spiked and stocks returned -6.35% for the month amid the Fed’s decision to hold interest rates steady and signal that it had little appetite to adjust them any time soon, as well as retaliatory tariffs imposed on the U.S. by China. The downtrend was similar to late 2018, when many investors fled from risk assets as they were still dealing with lingering uncertainty related to global trade and the Fed picking up the pace of rate hikes. The index returned -6.84% in October, at the time its largest monthly drop in seven years. But conditions worsened through Christmas, as jitters about the economy and another hike in rates led to a spike in market volatility and a -9.03% result for December. For the full period, three defensive sectors stood out: real estate (+20%), utilities (+18%) and consumer staples (+16%). Information technology was up 7% and health care stocks rose about 8%. Communication services – a newly reconstituted mix of telecommunications stocks and higher-growth media names – gained 5%, as did consumer discretionary. In contrast, energy (-20%) fared worst, while materials (-7%), financials (-2%) and industrials (-1%) also lagged. Comments from Lead Portfolio Manager John Stone: For the year, the Fund gained 1.30%, significantly trailing the 5.39% return of the benchmark Russell 1000® Growth Index. Underlying managers that were aggressively positioned or that had a significant quantitative component in their investment process worked against the Fund's relative performance. In contrast, more defensively positioned strategies or those emphasizing company quality aided performance versus the benchmark. Sub-adviser ClariVest Asset Management was the biggest relative detractor. The heavy valuation emphasis inherent in ClariVest’s quantitative strategy weighed on its performance this period, and resulted in broadly negative stock selection. Fidelity® Growth Company Fund also hampered relative performance. This manager’s aggressive-growth style was out of favor, and performance also suffered due to adverse stock selection within information technology and health care. On the plus side, sub-adviser Loomis Sayles aided the Fund’s relative result. This manager’s opportunistic and contrarian strategy provided a beneficial overweighting in the consumer staples sector, along with favorable performance among technology and health care stocks. As of May 31, we continued to reduce economically sensitive risk in the portfolio – a process we began in the prior reporting period.The views expressed above reflect those of the portfolio manager(s) only through the end of the period as stated on the cover of this report and do not necessarily represent the views of Fidelity or any other person in the Fidelity organization. Any such views are subject to change at any time based upon market or other conditions and Fidelity disclaims any responsibility to update such views. These views may not be relied on as investment advice and, because investment decisions for a Fidelity fund are based on numerous factors, may not be relied on as an indication of trading intent on behalf of any Fidelity fund.
Investment Summary (Unaudited)
The information in the following tables is based on the direct investments of the Fund.Top Ten Holdings as of May 31, 2019
| (excluding cash equivalents) | % of fund's net assets |
| Fidelity Growth Company Fund | 24.4 |
| Fidelity SAI U.S. Quality Index Fund | 10.4 |
| Fidelity Contrafund | 5.5 |
| Fidelity SAI U.S. Momentum Index Fund | 4.9 |
| Microsoft Corp. | 3.7 |
| Amazon.com, Inc. | 3.2 |
| Janus Henderson Enterprise Fund | 2.9 |
| Apple, Inc. | 2.1 |
| Visa, Inc. Class A | 2.1 |
| Facebook, Inc. Class A | 1.9 |
| 61.1 |
Top Five Market Sectors as of May 31, 2019
| (stocks only) | % of fund's net assets |
| Information Technology | 18.0 |
| Consumer Discretionary | 8.5 |
| Health Care | 6.4 |
| Communication Services | 5.9 |
| Industrials | 4.4 |
Asset Allocation (% of fund's net assets)
| As of May 31, 2019 | ||
| Common Stocks | 50.9% | |
| Preferred Stocks | 0.1% | |
| Large Blend Funds | 0.3% | |
| Large Growth Funds | 45.2% | |
| Mid-Cap Growth Funds | 2.9% | |
| Short-Term Investments and Net Other Assets (Liabilities) | 0.6% | |

Asset allocations of funds in the pie charts reflect the categorizations of assets as defined by Morningstar as of the reporting dates indicated above.
Schedule of Investments May 31, 2019
Showing Percentage of Net Assets
| Common Stocks - 50.9% | |||
| Shares | Value | ||
| COMMUNICATION SERVICES - 5.9% | |||
| Entertainment - 0.6% | |||
| Electronic Arts, Inc. (a) | 59,850 | $5,570,838 | |
| Netflix, Inc. (a) | 53,925 | 18,511,374 | |
| The Walt Disney Co. | 209,395 | 27,648,516 | |
| 51,730,728 | |||
| Interactive Media & Services - 4.9% | |||
| Alphabet, Inc.: | |||
| Class A (a) | 118,211 | 130,800,472 | |
| Class C (a) | 126,353 | 139,446,961 | |
| Facebook, Inc. Class A (a) | 1,026,932 | 182,249,622 | |
| Twitter, Inc. (a) | 392,377 | 14,298,218 | |
| 466,795,273 | |||
| Media - 0.4% | |||
| Comcast Corp. Class A | 965,920 | 39,602,720 | |
| TOTAL COMMUNICATION SERVICES | 558,128,721 | ||
| CONSUMER DISCRETIONARY - 8.4% | |||
| Auto Components - 0.1% | |||
| Lear Corp. | 99,152 | 11,802,063 | |
| Hotels, Restaurants & Leisure - 1.8% | |||
| Chipotle Mexican Grill, Inc. (a) | 11,795 | 7,784,346 | |
| Domino's Pizza, Inc. | 46,888 | 13,105,196 | |
| Marriott International, Inc. Class A | 169,460 | 21,155,386 | |
| Planet Fitness, Inc. (a) | 58,190 | 4,449,789 | |
| Starbucks Corp. | 891,263 | 67,789,464 | |
| Wyndham Destinations, Inc. | 207,193 | 8,242,138 | |
| Wyndham Hotels & Resorts, Inc. | 174,427 | 9,303,936 | |
| Yum China Holdings, Inc. | 380,550 | 15,225,806 | |
| Yum! Brands, Inc. | 228,930 | 23,430,986 | |
| 170,487,047 | |||
| Household Durables - 0.2% | |||
| PulteGroup, Inc. | 480,400 | 14,892,400 | |
| Toll Brothers, Inc. | 132,271 | 4,599,063 | |
| 19,491,463 | |||
| Internet & Direct Marketing Retail - 4.1% | |||
| Alibaba Group Holding Ltd. sponsored ADR (a) | 390,639 | 58,306,777 | |
| Amazon.com, Inc. (a) | 169,375 | 300,652,481 | |
| The Booking Holdings, Inc. (a) | 14,456 | 23,942,316 | |
| 382,901,574 | |||
| Multiline Retail - 0.3% | |||
| Kohl's Corp. | 205,422 | 10,131,413 | |
| Target Corp. | 283,973 | 22,845,628 | |
| 32,977,041 | |||
| Specialty Retail - 1.4% | |||
| Advance Auto Parts, Inc. | 84,638 | 13,118,890 | |
| AutoZone, Inc. (a) | 28,130 | 28,892,604 | |
| Best Buy Co., Inc. | 102,922 | 6,450,122 | |
| Foot Locker, Inc. | 178,800 | 7,035,780 | |
| Ross Stores, Inc. | 190,054 | 17,673,121 | |
| The Home Depot, Inc. | 319,639 | 60,683,464 | |
| 133,853,981 | |||
| Textiles, Apparel & Luxury Goods - 0.5% | |||
| Capri Holdings Ltd. (a) | 185,661 | 6,030,269 | |
| lululemon athletica, Inc. (a) | 55,559 | 9,200,015 | |
| NIKE, Inc. Class B | 223,285 | 17,224,205 | |
| PVH Corp. | 153,534 | 13,079,561 | |
| 45,534,050 | |||
| TOTAL CONSUMER DISCRETIONARY | 797,047,219 | ||
| CONSUMER STAPLES - 4.0% | |||
| Beverages - 1.3% | |||
| Keurig Dr. Pepper, Inc. (b) | 430,594 | 12,138,445 | |
| Monster Beverage Corp. (a) | 699,825 | 43,291,175 | |
| PepsiCo, Inc. | 161,787 | 20,708,736 | |
| The Coca-Cola Co. | 934,811 | 45,927,264 | |
| 122,065,620 | |||
| Food & Staples Retailing - 0.5% | |||
| Costco Wholesale Corp. | 65,497 | 15,691,771 | |
| Walgreens Boots Alliance, Inc. | 200,622 | 9,898,689 | |
| Walmart, Inc. | 258,174 | 26,189,171 | |
| 51,779,631 | |||
| Food Products - 0.9% | |||
| Danone SA sponsored ADR | 2,124,233 | 33,991,976 | |
| General Mills, Inc. | 265,330 | 13,117,915 | |
| Tyson Foods, Inc. Class A | 498,169 | 37,806,045 | |
| 84,915,936 | |||
| Household Products - 1.0% | |||
| Colgate-Palmolive Co. | 340,775 | 23,724,756 | |
| Kimberly-Clark Corp. | 167,744 | 21,452,780 | |
| Procter & Gamble Co. | 478,247 | 49,216,399 | |
| 94,393,935 | |||
| Tobacco - 0.3% | |||
| Altria Group, Inc. | 160,546 | 7,876,387 | |
| Philip Morris International, Inc. | 203,059 | 15,661,941 | |
| 23,538,328 | |||
| TOTAL CONSUMER STAPLES | 376,693,450 | ||
| ENERGY - 0.4% | |||
| Energy Equipment & Services - 0.2% | |||
| Schlumberger Ltd. | 478,151 | 16,587,058 | |
| Oil, Gas & Consumable Fuels - 0.2% | |||
| Equitrans Midstream Corp. | 231,841 | 4,604,362 | |
| Marathon Petroleum Corp. | 160,192 | 7,367,230 | |
| Phillips 66 Co. | 64,830 | 5,238,264 | |
| 17,209,856 | |||
| TOTAL ENERGY | 33,796,914 | ||
| FINANCIALS - 1.5% | |||
| Banks - 0.1% | |||
| Citigroup, Inc. | 227,354 | 14,130,051 | |
| Capital Markets - 0.6% | |||
| FactSet Research Systems, Inc. | 93,521 | 26,017,542 | |
| SEI Investments Co. | 486,854 | 24,464,414 | |
| TD Ameritrade Holding Corp. | 127,807 | 6,358,398 | |
| 56,840,354 | |||
| Consumer Finance - 0.3% | |||
| American Express Co. | 126,940 | 14,561,287 | |
| Capital One Financial Corp. | 136,061 | 11,683,558 | |
| 26,244,845 | |||
| Insurance - 0.5% | |||
| MetLife, Inc. | 341,324 | 15,772,582 | |
| Progressive Corp. | 398,331 | 31,579,682 | |
| 47,352,264 | |||
| TOTAL FINANCIALS | 144,567,514 | ||
| HEALTH CARE - 6.4% | |||
| Biotechnology - 1.7% | |||
| AbbVie, Inc. | 275,466 | 21,130,997 | |
| Amgen, Inc. | 308,509 | 51,428,450 | |
| Biogen, Inc. (a) | 75,758 | 16,612,972 | |
| Celgene Corp. (a) | 217,206 | 20,371,751 | |
| Incyte Corp. (a) | 21,548 | 1,694,319 | |
| Regeneron Pharmaceuticals, Inc. (a) | 110,936 | 33,471,610 | |
| Vertex Pharmaceuticals, Inc. (a) | 102,917 | 17,102,747 | |
| 161,812,846 | |||
| Health Care Equipment & Supplies - 0.8% | |||
| Alcon, Inc. (a)(b) | 45,788 | 2,663,946 | |
| Boston Scientific Corp. (a) | 326,320 | 12,533,951 | |
| DexCom, Inc. (a) | 20,248 | 2,456,082 | |
| IDEXX Laboratories, Inc. (a) | 13,071 | 3,264,744 | |
| Intuitive Surgical, Inc. (a) | 38,418 | 17,858,607 | |
| The Cooper Companies, Inc. | 46,248 | 13,772,192 | |
| Varian Medical Systems, Inc. (a) | 170,123 | 21,479,730 | |
| 74,029,252 | |||
| Health Care Providers & Services - 1.4% | |||
| Centene Corp. (a) | 319,074 | 18,426,524 | |
| Cigna Corp. | 49,983 | 7,398,484 | |
| HCA Holdings, Inc. | 152,333 | 18,426,200 | |
| Humana, Inc. | 4,581 | 1,121,704 | |
| McKesson Corp. | 41,875 | 5,114,613 | |
| UnitedHealth Group, Inc. | 335,999 | 81,244,558 | |
| 131,732,083 | |||
| Health Care Technology - 0.3% | |||
| Cerner Corp. | 396,039 | 27,710,849 | |
| Life Sciences Tools & Services - 0.6% | |||
| Illumina, Inc. (a) | 69,533 | 21,340,373 | |
| Thermo Fisher Scientific, Inc. | 122,193 | 32,623,087 | |
| 53,963,460 | |||
| Pharmaceuticals - 1.6% | |||
| Eli Lilly & Co. | 290,625 | 33,695,063 | |
| Johnson & Johnson | 132,118 | 17,327,276 | |
| Merck & Co., Inc. | 633,482 | 50,178,109 | |
| Novartis AG sponsored ADR | 228,941 | 19,606,507 | |
| Novo Nordisk A/S Series B sponsored ADR | 670,090 | 31,628,248 | |
| 152,435,203 | |||
| TOTAL HEALTH CARE | 601,683,693 | ||
| INDUSTRIALS - 4.4% | |||
| Aerospace & Defense - 0.6% | |||
| The Boeing Co. | 169,140 | 57,779,915 | |
| Air Freight & Logistics - 0.4% | |||
| Expeditors International of Washington, Inc. | 488,017 | 33,961,103 | |
| Airlines - 0.5% | |||
| Delta Air Lines, Inc. | 456,400 | 23,504,600 | |
| United Continental Holdings, Inc. (a) | 306,839 | 23,826,048 | |
| 47,330,648 | |||
| Commercial Services & Supplies - 0.2% | |||
| Waste Management, Inc. | 123,663 | 13,522,549 | |
| Electrical Equipment - 0.0% | |||
| Eaton Corp. PLC | 42,652 | 3,177,147 | |
| Machinery - 1.4% | |||
| AGCO Corp. | 76,635 | 5,100,826 | |
| Allison Transmission Holdings, Inc. | 188,447 | 7,799,821 | |
| Caterpillar, Inc. | 158,174 | 18,950,827 | |
| Cummins, Inc. | 150,949 | 22,757,071 | |
| Deere & Co. | 201,772 | 28,282,381 | |
| Illinois Tool Works, Inc. | 38,380 | 5,359,383 | |
| Ingersoll-Rand PLC | 337,977 | 39,996,198 | |
| Oshkosh Corp. | 109,195 | 7,773,592 | |
| 136,020,099 | |||
| Road & Rail - 1.1% | |||
| CSX Corp. | 350,258 | 26,083,713 | |
| Norfolk Southern Corp. | 119,754 | 23,368,796 | |
| Union Pacific Corp. | 322,200 | 53,736,516 | |
| 103,189,025 | |||
| Trading Companies & Distributors - 0.2% | |||
| HD Supply Holdings, Inc. (a) | 126,594 | 5,252,385 | |
| United Rentals, Inc. (a) | 134,183 | 14,773,548 | |
| 20,025,933 | |||
| TOTAL INDUSTRIALS | 415,006,419 | ||
| INFORMATION TECHNOLOGY - 18.0% | |||
| Communications Equipment - 0.9% | |||
| Cisco Systems, Inc. | 1,657,410 | 86,235,042 | |
| Electronic Equipment & Components - 0.2% | |||
| Keysight Technologies, Inc. (a) | 168,134 | 12,631,907 | |
| IT Services - 5.4% | |||
| Accenture PLC Class A | 116,915 | 20,819,054 | |
| Automatic Data Processing, Inc. | 78,142 | 12,512,097 | |
| Cognizant Technology Solutions Corp. Class A | 269,727 | 16,704,193 | |
| DXC Technology Co. | 257,431 | 12,238,270 | |
| Fidelity National Information Services, Inc. | 146,529 | 17,627,439 | |
| First Data Corp. Class A (a) | 470,496 | 11,960,008 | |
| Fiserv, Inc. (a) | 328,214 | 28,180,454 | |
| Global Payments, Inc. | 124,322 | 19,150,561 | |
| MasterCard, Inc. Class A | 458,901 | 115,409,012 | |
| Okta, Inc. (a) | 71,511 | 8,096,475 | |
| PayPal Holdings, Inc. (a) | 245,011 | 26,889,957 | |
| Visa, Inc. Class A | 1,189,471 | 191,897,356 | |
| WEX, Inc. (a) | 8,531 | 1,611,847 | |
| Worldpay, Inc. (a) | 236,014 | 28,708,743 | |
| 511,805,466 | |||
| Semiconductors & Semiconductor Equipment - 1.7% | |||
| Broadcom, Inc. | 119,658 | 30,110,739 | |
| Intel Corp. | 208,795 | 9,195,332 | |
| KLA-Tencor Corp. | 125,810 | 12,967,237 | |
| Lam Research Corp. | 23,354 | 4,077,842 | |
| Micron Technology, Inc. (a) | 258,117 | 8,417,195 | |
| NVIDIA Corp. | 281,089 | 38,076,316 | |
| Qualcomm, Inc. | 529,130 | 35,356,467 | |
| Texas Instruments, Inc. | 88,025 | 9,181,888 | |
| Xilinx, Inc. | 157,671 | 16,131,320 | |
| 163,514,336 | |||
| Software - 7.4% | |||
| Adobe, Inc. (a) | 320,702 | 86,878,172 | |
| Atlassian Corp. PLC (a) | 31,211 | 3,928,841 | |
| Autodesk, Inc. (a) | 334,754 | 53,865,266 | |
| Cadence Design Systems, Inc. (a) | 61,715 | 3,923,223 | |
| Microsoft Corp. | 2,790,101 | 345,079,692 | |
| Oracle Corp. | 1,152,268 | 58,304,761 | |
| Palo Alto Networks, Inc. (a) | 62,128 | 12,434,298 | |
| Paycom Software, Inc. (a) | 23,023 | 4,883,178 | |
| Salesforce.com, Inc. (a) | 384,178 | 58,168,391 | |
| ServiceNow, Inc. (a) | 35,997 | 9,428,694 | |
| SS&C Technologies Holdings, Inc. | 223,301 | 12,426,701 | |
| SurveyMonkey | 11 | 189 | |
| Synopsys, Inc. (a) | 280,444 | 32,654,899 | |
| Workday, Inc. Class A (a) | 70,400 | 14,370,048 | |
| Zscaler, Inc. (a)(b) | 40,822 | 2,801,614 | |
| 699,147,967 | |||
| Technology Hardware, Storage & Peripherals - 2.4% | |||
| Apple, Inc. | 1,142,884 | 200,084,702 | |
| NetApp, Inc. | 334,424 | 19,797,901 | |
| Western Digital Corp. | 118,385 | 4,406,290 | |
| 224,288,893 | |||
| TOTAL INFORMATION TECHNOLOGY | 1,697,623,611 | ||
| MATERIALS - 0.4% | |||
| Chemicals - 0.3% | |||
| CF Industries Holdings, Inc. | 381,887 | 15,367,133 | |
| Eastman Chemical Co. | 154,427 | 10,025,401 | |
| 25,392,534 | |||
| Containers & Packaging - 0.1% | |||
| Owens-Illinois, Inc. | 457,862 | 7,325,792 | |
| Metals & Mining - 0.0% | |||
| Steel Dynamics, Inc. | 159,792 | 4,018,769 | |
| TOTAL MATERIALS | 36,737,095 | ||
| REAL ESTATE - 1.3% | |||
| Equity Real Estate Investment Trusts (REITs) - 1.1% | |||
| American Tower Corp. | 57,798 | 12,066,488 | |
| Medical Properties Trust, Inc. | 595,116 | 10,581,162 | |
| Omega Healthcare Investors, Inc. | 264,820 | 9,432,888 | |
| Realty Income Corp. | 124,857 | 8,749,979 | |
| Simon Property Group, Inc. | 278,515 | 45,144,496 | |
| Welltower, Inc. | 137,362 | 11,156,542 | |
| 97,131,555 | |||
| Real Estate Management & Development - 0.2% | |||
| CBRE Group, Inc. (a) | 454,437 | 20,767,771 | |
| TOTAL REAL ESTATE | 117,899,326 | ||
| UTILITIES - 0.2% | |||
| Independent Power and Renewable Electricity Producers - 0.2% | |||
| NRG Energy, Inc. | 389,319 | 13,252,419 | |
| The AES Corp. | 539,074 | 8,517,369 | |
| 21,769,788 | |||
| TOTAL COMMON STOCKS | |||
| (Cost $2,730,884,973) | 4,800,953,750 | ||
| Convertible Preferred Stocks - 0.1% | |||
| CONSUMER DISCRETIONARY - 0.1% | |||
| Diversified Consumer Services - 0.1% | |||
| Airbnb, Inc. Series D (a)(c)(d) | |||
| (Cost $4,024,850) | 98,859 | 9,607,118 | |
| Equity Funds - 48.4% | |||
| Large Blend Funds - 0.3% | |||
| Fidelity SAI U.S. Large Cap Index Fund (e) | 1,750,360 | 25,922,833 | |
| Large Growth Funds - 45.2% | |||
| Fidelity Contrafund (e) | 42,343,596 | 523,366,843 | |
| Fidelity Growth Company Fund (e) | 125,706,271 | 2,301,681,826 | |
| Fidelity SAI U.S. Momentum Index Fund (e) | 36,347,747 | 466,705,072 | |
| Fidelity SAI U.S. Quality Index Fund (e) | 69,533,247 | 979,028,121 | |
| TOTAL LARGE GROWTH FUNDS | 4,270,781,862 | ||
| Mid-Cap Growth Funds - 2.9% | |||
| Janus Henderson Enterprise Fund | 2,109,730 | 272,513,861 | |
| TOTAL EQUITY FUNDS | |||
| (Cost $3,456,433,034) | 4,569,218,556 | ||
| Money Market Funds - 0.6% | |||
| Fidelity Securities Lending Cash Central Fund 2.42% (f)(g) | 8,134,046 | 8,134,859 | |
| Invesco Government & Agency Portfolio Institutional Class 2.30% (h) | 50,618,132 | 50,618,132 | |
| TOTAL MONEY MARKET FUNDS | |||
| (Cost $58,752,992) | 58,752,991 | ||
| TOTAL INVESTMENT IN SECURITIES - 100.0% | |||
| (Cost $6,250,095,849) | 9,438,532,415 | ||
| NET OTHER ASSETS (LIABILITIES) - 0.0% | (4,586,852) | ||
| NET ASSETS - 100% | $9,433,945,563 |
Legend
(a) Non-income producing
(b) Security or a portion of the security is on loan at period end.
(c) Restricted securities - Investment in securities not registered under the Securities Act of 1933 (excluding 144A issues). At the end of the period, the value of restricted securities (excluding 144A issues) amounted to $9,607,118 or 0.1% of net assets.
(d) Level 3 security
(e) Affiliated Fund
(f) Affiliated fund that is generally available only to investment companies and other accounts managed by Fidelity Investments. The rate quoted is the annualized seven-day yield of the fund at period end. A complete unaudited listing of the fund's holdings as of its most recent quarter end is available upon request. In addition, each Fidelity Central Fund's financial statements, which are not covered by the Fund's Report of Independent Registered Public Accounting Firm, are available on the SEC's website or upon request.
(g) Investment made with cash collateral received from securities on loan.
(h) The rate quoted is the annualized seven-day yield of the fund at period end.
Additional information on each restricted holding is as follows:
| Security | Acquisition Date | Acquisition Cost |
| Airbnb, Inc. Series D | 4/16/14 | $4,024,850 |
Affiliated Central Funds
Information regarding fiscal year to date income earned by the Fund from investments in Fidelity Central Funds is as follows:
| Fund | Income earned |
| Fidelity Securities Lending Cash Central Fund | $118,412 |
| Total | $118,412 |
Amounts in the income column in the above table include any capital gain distributions from underlying funds, which are presented in the corresponding line-item in the Statement of Operations, if applicable.
Affiliated Underlying Funds
Fiscal year to date information regarding the Fund's investments in affiliated Underlying Funds, excluding any Money Market Central Funds, is presented below. Exchanges between classes of the same affiliated Underlying Funds may occur. Certain Underlying Funds incurred name changes since their most recent shareholder report. The names of the Underlying Funds are those in effect at period end.
| Affiliate | Value, beginning of period | Purchases | Sales Proceeds | Dividend Income | Realized Gain (loss) | Change in Unrealized appreciation (depreciation) | Value, end of period |
| Fidelity Contra- fund | $-- | $538,602,565 | $-- | $25,866,500 | $-- | $(15,235,722) | $523,366,843 |
| Fidelity Growth Com- pany Fund | 2,224,523,372 | 239,635,854 | -- | 119,635,854 | -- | (162,477,400) | 2,301,681,826 |
| Fidelity SAI U.S. Large Cap Index Fund | -- | 1,488,730,553 | 1,450,703,151 | 1,150,127 | (11,664,150 ) | (440,419) | 25,922,833 |
| Fidelity SAI U.S. Mom- entum Index Fund | 228,625,066 | 281,824,227 | 40,000,000 | 8,864,053 | (2,370,009) | (1,374,212) | 466,705,072 |
| Fidelity SAI U.S. Quality Index Fund | 1,103,453,284 | 115,576,310 | 279,179,796 | 31,593,653 | 37,374,647 | 1,803,676 | 979,028,121 |
| Total | $3,556,601,722 | $2,664,369,509 | $1,769,882,947 | $187,110,187 | $23,340,488 | $(177,724,077) | $4,296,704,695 |
Amounts in the income column in the above table include any capital gain distributions from underlying funds, which are presented in the corresponding line-item in the Statement of Operations, if applicable.
Investment Valuation
The following is a summary of the inputs used, as of May 31, 2019, involving the Fund's assets and liabilities carried at fair value. The inputs or methodology used for valuing securities may not be an indication of the risk associated with investing in those securities. For more information on valuation inputs, and their aggregation into the levels used below, please refer to the Investment Valuation section in the accompanying Notes to Financial Statements.
| Valuation Inputs at Reporting Date: | ||||
| Description | Total | Level 1 | Level 2 | Level 3 |
| Investments in Securities: | ||||
| Equities: | ||||
| Communication Services | $558,128,721 | $558,128,721 | $-- | $-- |
| Consumer Discretionary | 806,654,337 | 797,047,219 | -- | 9,607,118 |
| Consumer Staples | 376,693,450 | 376,693,450 | -- | -- |
| Energy | 33,796,914 | 33,796,914 | -- | -- |
| Financials | 144,567,514 | 144,567,514 | -- | -- |
| Health Care | 601,683,693 | 601,683,693 | -- | -- |
| Industrials | 415,006,419 | 415,006,419 | -- | -- |
| Information Technology | 1,697,623,611 | 1,697,623,611 | -- | -- |
| Materials | 36,737,095 | 36,737,095 | -- | -- |
| Real Estate | 117,899,326 | 117,899,326 | -- | -- |
| Utilities | 21,769,788 | 21,769,788 | -- | -- |
| Equity Funds | 4,569,218,556 | 4,569,218,556 | -- | -- |
| Money Market Funds | 58,752,991 | 58,752,991 | -- | -- |
| Total Investments in Securities: | $9,438,532,415 | $9,428,925,297 | $-- | $9,607,118 |
See accompanying notes which are an integral part of the financial statements.
Financial Statements
Statement of Assets and Liabilities
| May 31, 2019 | ||
| Assets | ||
| Investment in securities, at value (including securities loaned of $7,754,740) — See accompanying schedule: Unaffiliated issuers (cost $3,046,740,901) | $5,133,692,861 | |
| Fidelity Central Funds (cost $8,134,860) | 8,134,859 | |
| Other affiliated issuers (cost $3,195,220,088) | 4,296,704,695 | |
| Total Investment in Securities (cost $6,250,095,849) | $9,438,532,415 | |
| Receivable for investments sold | 5,029,980 | |
| Receivable for fund shares sold | 2,529,845 | |
| Dividends receivable | 5,931,495 | |
| Interest receivable | 68,801 | |
| Distributions receivable from Fidelity Central Funds | 321 | |
| Prepaid expenses | 38,497 | |
| Other receivables | 171,948 | |
| Total assets | 9,452,303,302 | |
| Liabilities | ||
| Payable to custodian bank | $16,977 | |
| Payable for investments purchased | 3,447,633 | |
| Payable for fund shares redeemed | 5,567,086 | |
| Accrued management fee | 842,808 | |
| Other affiliated payables | 108,113 | |
| Other payables and accrued expenses | 240,272 | |
| Collateral on securities loaned | 8,134,850 | |
| Total liabilities | 18,357,739 | |
| Net Assets | $9,433,945,563 | |
| Net Assets consist of: | ||
| Paid in capital | $5,565,844,489 | |
| Total distributable earnings (loss) | 3,868,101,074 | |
| Net Assets, for 542,408,544 shares outstanding | $9,433,945,563 | |
| Net Asset Value, offering price and redemption price per share ($9,433,945,563 ÷ 542,408,544 shares) | $17.39 |
See accompanying notes which are an integral part of the financial statements.
Statement of Operations
| Year ended May 31, 2019 | ||
| Investment Income | ||
| Dividends: | ||
| Unaffiliated issuers | $77,810,591 | |
| Affiliated issuers | 40,848,397 | |
| Interest | 1,678,565 | |
| Income from Fidelity Central Funds | 118,412 | |
| Total income | 120,455,965 | |
| Expenses | ||
| Management fee | $38,591,649 | |
| Transfer agent fees | 925,754 | |
| Accounting and security lending fees | 1,320,962 | |
| Custodian fees and expenses | 74,583 | |
| Independent trustees' fees and expenses | 127,135 | |
| Registration fees | 92,482 | |
| Audit | 77,807 | |
| Legal | 43,407 | |
| Miscellaneous | 293,906 | |
| Total expenses before reductions | 41,547,685 | |
| Expense reductions | (27,085,755) | |
| Total expenses after reductions | 14,461,930 | |
| Net investment income (loss) | 105,994,035 | |
| Realized and Unrealized Gain (Loss) | ||
| Net realized gain (loss) on: | ||
| Investment securities: | ||
| Unaffiliated issuers | 1,137,667,490 | |
| Fidelity Central Funds | 318 | |
| Other affiliated issuers | 23,340,488 | |
| Foreign currency transactions | 1,968 | |
| Futures contracts | (12,160,651) | |
| Capital gain distributions from underlying funds: | ||
| Unaffiliated issuers | 84,477,600 | |
| Affiliated issuers | 146,261,790 | |
| Total net realized gain (loss) | 1,379,589,003 | |
| Change in net unrealized appreciation (depreciation) on: | ||
| Investment securities: | ||
| Unaffiliated issuers | (1,137,927,245) | |
| Fidelity Central Funds | (1) | |
| Other affiliated issuers | (177,724,077) | |
| Assets and liabilities in foreign currencies | (1,342) | |
| Total change in net unrealized appreciation (depreciation) | (1,315,652,665) | |
| Net gain (loss) | 63,936,338 | |
| Net increase (decrease) in net assets resulting from operations | $169,930,373 |
See accompanying notes which are an integral part of the financial statements.
Statement of Changes in Net Assets
| Year ended May 31, 2019 | Year ended May 31, 2018 | |
| Increase (Decrease) in Net Assets | ||
| Operations | ||
| Net investment income (loss) | $105,994,035 | $82,142,432 |
| Net realized gain (loss) | 1,379,589,003 | 1,346,430,096 |
| Change in net unrealized appreciation (depreciation) | (1,315,652,665) | 691,056,110 |
| Net increase (decrease) in net assets resulting from operations | 169,930,373 | 2,119,628,638 |
| Distributions to shareholders | (1,480,968,534) | – |
| Distributions to shareholders from net investment income | – | (83,336,854) |
| Distributions to shareholders from net realized gain | – | (835,648,765) |
| Total distributions | (1,480,968,534) | (918,985,619) |
| Share transactions | ||
| Proceeds from sales of shares | 1,698,381,942 | 1,625,484,486 |
| Reinvestment of distributions | 1,473,929,838 | 915,025,337 |
| Cost of shares redeemed | (4,028,460,404) | (3,104,974,374) |
| Net increase (decrease) in net assets resulting from share transactions | (856,148,624) | (564,464,551) |
| Total increase (decrease) in net assets | (2,167,186,785) | 636,178,468 |
| Net Assets | ||
| Beginning of period | 11,601,132,348 | 10,964,953,880 |
| End of period | $9,433,945,563 | $11,601,132,348 |
| Other Information | ||
| Undistributed net investment income end of period | $25,423,566 | |
| Shares | ||
| Sold | 93,996,420 | 86,286,096 |
| Issued in reinvestment of distributions | 86,200,709 | 51,303,699 |
| Redeemed | (222,537,369) | (164,358,613) |
| Net increase (decrease) | (42,340,240) | (26,768,818) |
See accompanying notes which are an integral part of the financial statements.
Financial Highlights
Strategic Advisers Growth Fund
| Years ended May 31, | 2019 | 2018 | 2017 | 2016 | 2015 |
| Selected Per–Share Data | |||||
| Net asset value, beginning of period | $19.84 | $17.93 | $16.51 | $17.60 | $16.51 |
| Income from Investment Operations | |||||
| Net investment income (loss)A | .18 | .13 | .15 | .13 | .12 |
| Net realized and unrealized gain (loss) | (.05)B | 3.31 | 2.89 | (.23) | 2.10 |
| Total from investment operations | .13 | 3.44 | 3.04 | (.10) | 2.22 |
| Distributions from net investment income | (.13) | (.14) | (.15) | (.12) | (.12) |
| Distributions from net realized gain | (2.45) | (1.39) | (1.47) | (.88) | (1.01) |
| Total distributions | (2.58) | (1.53) | (1.62) | (.99)C | (1.13) |
| Net asset value, end of period | $17.39 | $19.84 | $17.93 | $16.51 | $17.60 |
| Total ReturnD,E | 1.30% | 20.30% | 19.87% | (.62)% | 13.99% |
| Ratios to Average Net AssetsF,G | |||||
| Expenses before reductions | .38% | .49% | .54% | .57% | .56% |
| Expenses net of fee waivers, if any | .13% | .24% | .28% | .32% | .31% |
| Expenses net of all reductions | .13% | .24% | .28% | .32% | .31% |
| Net investment income (loss) | .98% | .72% | .89% | .79% | .73% |
| Supplemental Data | |||||
| Net assets, end of period (000 omitted) | $9,433,946 | $11,601,132 | $10,964,954 | $10,962,597 | $13,134,171 |
| Portfolio turnover rateH | 48% | 38% | 38% | 30% | 40% |
A Calculated based on average shares outstanding during the period.
B The amount shown for a share outstanding does not correspond with the aggregate net gain (loss) on investments for the period due to the timing of sales and repurchases of shares in relation to fluctuating market values of the investments of the Fund.
C Total distributions of $.99 per share is comprised of distributions from net investment income of $.115 and distributions from net realized gain of $.876 per share.
D Total returns for periods of less than one year are not annualized.
E Total returns would have been lower if certain expenses had not been reduced during the applicable periods shown.
F Fees and expenses of any underlying Fidelity Central Funds are not included in the Fund's expense ratio. The Fund indirectly bears its proportionate share of the expenses of any underlying Fidelity Central Funds.
G Expense ratios reflect operating expenses of the Fund. Expenses before reductions do not reflect amounts reimbursed by the investment adviser or reductions from brokerage service arrangements or reductions from other expense offset arrangements and do not represent the amount paid by the Fund during periods when reimbursements or reductions occur. Expenses net of fee waivers reflect expenses after reimbursement by the investment adviser but prior to reductions from brokerage service arrangements or other expense offset arrangements. Expenses net of all reductions represent the net expenses paid by the Fund. Fees and expenses of the Underlying Funds are not included in the Fund's annualized ratios. The Fund indirectly bears its proportionate share of the expenses of the Underlying Funds.
H Amount does not include the portfolio activity of any Underlying Funds.
See accompanying notes which are an integral part of the financial statements.
Notes to Financial Statements
For the period ended May 31, 2019
1. Organization.
Strategic Advisers Growth Fund (the Fund) is a fund of Fidelity Rutland Square Trust II (the Trust), and is authorized to issue an unlimited number of shares. The Trust is registered under the Investment Company Act of 1940, as amended (the 1940 Act), as an open-end management investment company organized as a Delaware statutory trust. The Fund is offered exclusively to certain clients of Strategic Advisers LLC (Strategic Advisers), an affiliate of Fidelity Management & Research Company (FMR).
2. Significant Accounting Policies.
The Fund is an investment company and applies the accounting and reporting guidance of the Financial Accounting Standards Board (FASB) Accounting Standards Codification Topic 946 Financial Services – Investments Companies. The financial statements have been prepared in conformity with accounting principles generally accepted in the United States of America (GAAP), which require management to make certain estimates and assumptions at the date of the financial statements. Actual results could differ from those estimates. Subsequent events, if any, through the date that the financial statements were issued have been evaluated in the preparation of the financial statements. The following summarizes the significant accounting policies of the Fund:
Investment Valuation. Investments are valued as of 4:00 p.m. Eastern time on the last calendar day of the period. The Board of Trustees (the Board) has delegated the day to day responsibility for the valuation of the Fund's investments to the Fair Value Committee (the Committee) established by the Fund's investment adviser. In accordance with valuation policies and procedures approved by the Board, the Fund attempts to obtain prices from one or more third party pricing vendors or brokers to value its investments. When current market prices, quotations or currency exchange rates are not readily available or reliable, investments will be fair valued in good faith by the Committee, in accordance with procedures adopted by the Board. Factors used in determining fair value vary by investment type and may include market or investment specific events. The frequency with which these procedures are used cannot be predicted and they may be utilized to a significant extent. The Committee oversees the Fund's valuation policies and procedures and reports to the Board on the Committee's activities and fair value determinations. The Board monitors the appropriateness of the procedures used in valuing the Fund's investments and ratifies the fair value determinations of the Committee.
The Fund categorizes the inputs to valuation techniques used to value its investments into a disclosure hierarchy consisting of three levels as shown below:
- Level 1 – quoted prices in active markets for identical investments
- Level 2 – other significant observable inputs (including quoted prices for similar investments, interest rates, prepayment speeds, etc.)
- Level 3 – unobservable inputs (including the Fund's own assumptions based on the best information available)
Valuation techniques used to value the Fund's investments by major category are as follows:
Equity securities, including restricted securities, for which market quotations are readily available, are valued at the last reported sale price or official closing price as reported by a third party pricing vendor on the primary market or exchange on which they are traded and are categorized as Level 1 in the hierarchy. In the event there were no sales during the day or closing prices are not available, securities are valued at the last quoted bid price or may be valued using the last available price and are generally categorized as Level 2 in the hierarchy. For foreign equity securities, when market or security specific events arise, comparisons to the valuation of American Depositary Receipts (ADRs), futures contracts, Exchange-Traded Funds (ETFs) and certain indexes as well as quoted prices for similar securities may be used and would be categorized as Level 2 in the hierarchy. For equity securities, including restricted securities, where observable inputs are limited, assumptions about market activity and risk are used and these securities may be categorized as Level 3 in the hierarchy.
Investments in open-end mutual funds, including the Fidelity Central Funds, are valued at their closing net asset value (NAV) each business day and are categorized as Level 1 in the hierarchy. If an unaffiliated open-end mutual fund's NAV is unavailable, shares of that fund may be valued by another method that the Board believes reflects fair value in accordance with the Board's fair value pricing policies and is categorized as Level 2 in the hierarchy.
Changes in valuation techniques may result in transfers in or out of an assigned level within the disclosure hierarchy. The aggregate value of investments by input level as of May 31, 2019 is included at the end of the Fund's Schedule of Investments.
Foreign Currency. The Fund may use foreign currency contracts to facilitate transactions in foreign-denominated securities. Gains and losses from these transactions may arise from changes in the value of the foreign currency or if the counterparties do not perform under the contracts' terms.
Foreign-denominated assets, including investment securities, and liabilities are translated into U.S. dollars at the exchange rates at period end. Purchases and sales of investment securities, income and dividends received and expenses denominated in foreign currencies are translated into U.S. dollars at the exchange rate in effect on the transaction date.
The effects of exchange rate fluctuations on investments are included with the net realized and unrealized gain (loss) on investment securities. Other foreign currency transactions resulting in realized and unrealized gain (loss) are disclosed separately.
Investment Transactions and Income. For financial reporting purposes, the Fund's investment holdings and NAV include trades executed through the end of the last business day of the period. The NAV per share for processing shareholder transactions is calculated as of the close of business of the New York Stock Exchange (NYSE), normally 4:00 p.m. Eastern time and includes trades executed through the end of the prior business day. Gains and losses on securities sold are determined on the basis of identified cost and include proceeds received from litigation. Dividend income is recorded on the ex-dividend date, except for certain dividends from foreign securities where the ex-dividend date may have passed, which are recorded as soon as the Fund is informed of the ex-dividend date. Non-cash dividends included in dividend income, if any, are recorded at the fair market value of the securities received. Income and capital gain distributions from Fidelity Central Funds, if any, are recorded on the ex-dividend date. Income and capital gain distributions from Underlying Funds, if any, are recorded on the ex-dividend date. Certain distributions received by the Fund represent a return of capital or capital gain. The Fund determines the components of these distributions subsequent to the ex-dividend date, based upon receipt of tax filings or other correspondence relating to the underlying investment. These distributions are recorded as a reduction of cost of investments and/or as a realized gain. Interest income is accrued as earned and includes coupon interest and amortization of premium and accretion of discount on debt securities as applicable. Investment income is recorded net of foreign taxes withheld where recovery of such taxes is uncertain.
Expenses. Expenses directly attributable to a fund are charged to that fund. Expenses attributable to more than one fund are allocated among the respective funds on the basis of relative net assets or other appropriate methods. Expense estimates are accrued in the period to which they relate and adjustments are made when actual amounts are known.
Deferred Trustee Compensation. Under a Deferred Compensation Plan (the Plan), certain independent Trustees have elected to defer receipt of a portion of their annual compensation. Deferred amounts are invested in a cross-section of Strategic Advisers funds, are marked-to-market and remain in the Fund until distributed in accordance with the Plan. The investment of deferred amounts and the offsetting payable to the Trustees of $171,948 are included in the accompanying Statement of Assets and Liabilities in other receivables and other payables and accrued expenses, respectively.
Income Tax Information and Distributions to Shareholders. Each year, the Fund intends to qualify as a regulated investment company under Subchapter M of the Internal Revenue Code, including distributing substantially all of its taxable income and realized gains. As a result, no provision for U.S. Federal income taxes is required. As of May 31, 2019, the Fund did not have any unrecognized tax benefits in the financial statements; nor is the Fund aware of any tax positions for which it is reasonably possible that the total amounts of unrecognized tax benefits will significantly change in the next twelve months. The Fund files a U.S. federal tax return, in addition to state and local tax returns as required. The Fund's federal income tax returns are subject to examination by the Internal Revenue Service (IRS) for a period of three fiscal years after they are filed. State and local tax returns may be subject to examination for an additional fiscal year depending on the jurisdiction. Foreign taxes are provided for based on the Fund's understanding of the tax rules and rates that exist in the foreign markets in which it invests.
Distributions are declared and recorded on the ex-dividend date. Income and capital gain distributions are determined in accordance with income tax regulations, which may differ from GAAP. In addition, the Fund claimed a portion of the payment made to redeeming shareholders as a distribution for income tax purposes.
Capital accounts within the financial statements are adjusted for permanent book-tax differences. These adjustments have no impact on net assets or the results of operations. Capital accounts are not adjusted for temporary book-tax differences which will reverse in a subsequent period.
Book-tax differences are primarily due to short-term gain distributions from the Underlying Funds, futures contracts, foreign currency transactions, market discount, deferred trustees compensation and losses deferred due to wash sales.
As of period end, the cost and unrealized appreciation (depreciation) in securities, and derivatives if applicable, for federal income tax purposes were as follows:
| Gross unrealized appreciation | $3,332,332,734 |
| Gross unrealized depreciation | (161,764,607) |
| Net unrealized appreciation (depreciation) | $3,170,568,127 |
| Tax Cost | $6,267,964,288 |
The tax-based components of distributable earnings as of period end were as follows:
| Undistributed ordinary income | $44,445,664 |
| Undistributed long-term capital gain | $653,259,232 |
| Net unrealized appreciation (depreciation) on securities and other investments | $3,170,568,127 |
The tax character of distributions paid was as follows:
| May 31, 2019 | May 31, 2018 | |
| Ordinary Income | $76,054,930 | $ 83,336,854 |
| Long-term Capital Gains | 1,404,913,604 | 835,648,765 |
| Total | $1,480,968,534 | $ 918,985,619 |
Restricted Securities. The Fund may invest in securities that are subject to legal or contractual restrictions on resale. These securities generally may be resold in transactions exempt from registration or to the public if the securities are registered. Disposal of these securities may involve time-consuming negotiations and expense, and prompt sale at an acceptable price may be difficult. Information regarding restricted securities is included at the end of the Fund's Schedule of Investments.
New Rule Issuance. During August 2018, the U.S. Securities and Exchange Commission issued Final Rule Release No. 33-10532, Disclosure Update and Simplification. This Final Rule includes amendments specific to registered investment companies that are intended to eliminate overlap in disclosure requirements between Regulation S-X and GAAP. In accordance with these amendments, certain line-items in the Fund's financial statements have been combined or removed for the current period as outlined in the table below.
| Financial Statement | Current Line-Item Presentation (As Applicable) | Prior Line-Item Presentation (As Applicable) |
| Statement of Assets and Liabilities | Total distributable earnings (loss) | Undistributed/Distributions in excess of/Accumulated net investment income (loss) Accumulated/Undistributed net realized gain (loss) Net unrealized appreciation (depreciation) |
| Statement of Changes in Net Assets | N/A - removed | Undistributed/Distributions in excess of/Accumulated net investment income (loss) end of period |
| Statement of Changes in Net Assets | Distributions to shareholders | Distributions to shareholders from net investment income Distributions to shareholders from net realized gain |
3. Derivative Instruments.
Risk Exposures and the Use of Derivative Instruments. The Fund's investment objective allows the Fund to enter into various types of derivative contracts, including futures contracts. Derivatives are investments whose value is primarily derived from underlying assets, indices or reference rates and may be transacted on an exchange or over-the-counter (OTC). Derivatives may involve a future commitment to buy or sell a specified asset based on specified terms, to exchange future cash flows at periodic intervals based on a notional principal amount, or for one party to make one or more payments upon the occurrence of specified events in exchange for periodic payments from the other party.
The Fund used derivatives to increase returns and to manage exposure to certain risks as defined below. The success of any strategy involving derivatives depends on analysis of numerous economic factors, and if the strategies for investment do not work as intended, the Fund may not achieve its objectives.
The Fund's use of derivatives increased or decreased its exposure to the following risk:
| Equity Risk | Equity risk relates to the fluctuations in the value of financial instruments as a result of changes in market prices (other than those arising from interest rate risk or foreign exchange risk), whether caused by factors specific to an individual investment, its issuer, or all factors affecting all instruments traded in a market or market segment. |
The Fund is also exposed to additional risks from investing in derivatives, such as liquidity risk and counterparty credit risk. Liquidity risk is the risk that the Fund will be unable to close out the derivative in the open market in a timely manner. Counterparty credit risk is the risk that the counterparty will not be able to fulfill its obligation to the Fund. Counterparty credit risk related to exchange-traded futures contracts may be mitigated by the protection provided by the exchange on which they trade.
Investing in derivatives may involve greater risks than investing in the underlying assets directly and, to varying degrees, may involve risk of loss in excess of any initial investment and collateral received and amounts recognized in the Statement of Assets and Liabilities. In addition, there may be the risk that the change in value of the derivative contract does not correspond to the change in value of the underlying instrument.
Futures Contracts. A futures contract is an agreement between two parties to buy or sell a specified underlying instrument for a fixed price at a specified future date. The Fund used futures contracts to manage its exposure to the stock market.
Upon entering into a futures contract, a fund is required to deposit either cash or securities (initial margin) with a clearing broker in an amount equal to a certain percentage of the face value of the contract. Futures contracts are marked-to-market daily and subsequent daily payments (variation margin) are made or received by a fund depending on the daily fluctuations in the value of the futures contracts and are recorded as unrealized appreciation or (depreciation). This receivable and/or payable, if any, is included in daily variation margin on futures contracts in the Statement of Assets and Liabilities. Realized gain or (loss) is recorded upon the expiration or closing of a futures contract. The net realized gain (loss) and change in net unrealized appreciation (depreciation) on futures contracts during the period is presented in the Statement of Operations.
Any open futures contracts at period end are presented in the Schedule of Investments under the caption "Futures Contracts". The notional amount at value reflects each contract's exposure to the underlying instrument or index at period end. For the period, the average monthly notional amount at value for futures contracts in the aggregate was $23,669,480.
4. Purchases and Sales of Investments.
Purchases and sales of securities (including the Underlying Fund shares), other than short-term securities, aggregated $5,130,627,451 and $7,110,795,844, respectively.
5. Fees and Other Transactions with Affiliates.
Management Fee. Strategic Advisers (the investment adviser) provides the Fund with investment management related services. For these services, the Fund pays a monthly management fee to the investment adviser. The management fee is calculated by adding the annual management fee rate of .25% of the Fund's average net assets throughout the month payable to the investment adviser to the aggregate of the fee rates, payable monthly, to the Fund's sub-advisers. The Fund's maximum aggregate management fee will not exceed .95% of the Fund's average net assets. For the reporting period, the total annual management fee rate was .36% of the Fund's average net assets.
During the period, the investment adviser waived its management fee as described in the Expense Reductions note.
Sub-Advisers. ClariVest Asset Management LLC, FIAM LLC (an affiliate of the investment adviser), Loomis Sayles & Company, L.P. and Massachusetts Financial Services Company (MFS) each served as a sub-adviser for the Fund during the period. Sub-advisers provide discretionary investment advisory services for their allocated portion of the Fund's assets and are paid by the investment adviser and not the Fund for providing these services.
Geode Capital Management, LLC (Geode) has been retained to serve as a sub-adviser for the Fund. As of the date of this report, however, Geode has not been allocated any portion of the Fund's assets. Geode in the future may provide discretionary investment advisory services for an allocated portion of the Fund's assets and will be paid by the investment adviser for providing these services.
Transfer Agent Fees. Fidelity Investments Institutional Operations Company, Inc. (FIIOC), an affiliate of the investment adviser, is the Fund's transfer, dividend disbursing and shareholder servicing agent. Effective July 1, 2018 transfer agent fees are not paid by the Fund and are instead paid by the investment adviser or an affiliate. Prior to July 1, 2018 FIIOC received account fees and asset-based fees that varied according to account size and type of account. The Fund did not directly pay transfer agent fees with respect to the portion of its assets invested in Underlying Funds. FIIOC paid for typesetting, printing and mailing of shareholder reports, except proxy statements. For the period, the transfer agent fees were equivalent to an annualized rate of .01% of average net assets.
Accounting and Security Lending Fees. Fidelity Service Company, Inc. (FSC), an affiliate of the investment adviser, maintains the Fund's accounting records. The accounting fee is based on the level of average net assets for each month. Prior to April 1, 2019, FSC had a separate agreement with the Fund for administration of the security lending program, based on the number and duration of lending transactions. For the period, the total fees paid for accounting and administration of securities lending were equivalent to an annual rate of .01%.
During June 2019, the Board approved that effective July 1, 2019 accounting fees will not be paid by the Fund and will instead be paid by the investment adviser or an affiliate.
Brokerage Commissions. The Fund placed a portion of its portfolio transactions with brokerage firms which are affiliates of the investment adviser. Brokerage commissions are included in net realized gain (loss) and change in net unrealized appreciation (depreciation) in the Statement of Operations. The commissions paid to these affiliated firms were $448 for the period.
Interfund Trades. The Fund may purchase from or sell securities to other funds affiliated with each sub-adviser under procedures adopted by the Board. The procedures have been designed to ensure these interfund trades are executed in accordance with Rule 17a-7 of the 1940 Act. Interfund trades are included within the respective purchases and sales amounts shown in the Purchases and Sales of Investments note.
6. Investments in Fidelity Central Funds.
The Fund invests in Fidelity Central Funds, which are open-end investment companies available only to other investment companies and accounts managed by the investment adviser and its affiliates. The Fund's Schedule of Investments lists each of the Fidelity Central Funds held as of period end, if any, as an investment of the Fund, but does not include the underlying holdings of each Fidelity Central Fund. As an Investing Fund, the Fund indirectly bears its proportionate share of the expenses of the underlying Fidelity Central Funds.
The Fidelity Money Market Central Funds are managed by Fidelity Investments Money Management, Inc. (FIMM), an affiliate of the investment adviser. Annualized expenses of the Money Market Central Funds as of their most recent shareholder report date ranged from less than .005% to .01%.
A complete unaudited list of holdings for each Fidelity Central Fund is available upon request or at the Securities and Exchange Commission (the SEC) website at www.sec.gov. In addition, the financial statements of the Fidelity Central Funds, which are not covered by the Fund's Report of Independent Registered Public Accounting Firm, are available on the SEC website or upon request.
7. Committed Line of Credit.
The Fund participates with other funds managed by the investment adviser or an affiliate in a $4.25 billion credit facility (the "line of credit") to be utilized for temporary or emergency purposes to fund shareholder redemptions or for other short-term liquidity purposes. The Fund has agreed to pay commitment fees on its pro-rata portion of the line of credit, which amounted to $29,957 and is reflected in Miscellaneous expenses on the Statement of Operations. During the period, the Fund did not borrow on this line of credit.
8. Security Lending.
The Fund lends portfolio securities through a lending agent from time to time in order to earn additional income. On the settlement date of the loan, the Fund receives collateral (in the form of U.S. Treasury obligations, letters of credit and/or cash) against the loaned securities and maintains collateral in an amount not less than 100% of the market value of the loaned securities during the period of the loan. The market value of the loaned securities is determined at the close of business of the Fund and any additional required collateral is delivered to the Fund on the next business day. The Fund or borrower may terminate the loan at any time, and if the borrower defaults on its obligation to return the securities loaned because of insolvency or other reasons, the Fund may apply collateral received from the borrower against the obligation. The Fund may experience delays and costs in recovering the securities loaned. Any cash collateral received is the Fidelity Securities Lending Cash Central Fund. The value of loaned securities and cash collateral at period end are disclosed on the Fund's Statement of Assets and Liabilities. Security lending income represents the income earned on investing cash collateral, less rebates paid to borrowers and any lending agent fees associated with the loan, plus any premium payments received for lending certain types of securities. Security lending income is presented in the Statement of Operations as a component of income from Fidelity Central Funds. Total security lending income during the period amounted to $118,412.
9. Expense Reductions.
The investment adviser has contractually agreed to waive the Fund's management fee in an amount equal to .25% of the Fund's average net assets until September 30, 2022. During the period, this waiver reduced the Fund's management fee by $27,081,731.
In addition, through arrangements with the Fund's custodian, credits realized as a result of certain uninvested cash balances were used to reduce the Fund's expenses. During the period, custody credits amounted to $3,714.
In addition, during the period the investment adviser reimbursed and/or waived a portion of operating expenses in the amount of $310.
10. Other.
The Fund's organizational documents provide former and current trustees and officers with a limited indemnification against liabilities arising in connection with the performance of their duties to the Fund. In the normal course of business, the Fund may also enter into contracts that provide general indemnifications. The Fund's maximum exposure under these arrangements is unknown as this would be dependent on future claims that may be made against the Fund. The risk of material loss from such claims is considered remote.
The Fund does not invest in the Underlying Funds for the purpose of exercising management or control; however, investments by the Fund within its principal investment strategies may represent a significant portion of an Underlying Fund's net assets. At the end of the period, the Fund was the owner of record of approximately 13% and 12% of the total outstanding shares of Fidelity SAI U.S. Momentum Index Fund and Fidelity SAI U.S. Quality Index Fund, respectively.
Report of Independent Registered Public Accounting Firm
To the Board of Trustees of Fidelity Rutland Square Trust II and Shareholders of Strategic Advisers Growth Fund:
Opinion on the Financial Statements
We have audited the accompanying statement of assets and liabilities, including the schedule of investments, of Strategic Advisers Growth Fund (one of the funds constituting Fidelity Rutland Square Trust II, referred to hereafter as the “Fund”) as of May 31, 2019, the related statement of operations for the year ended May 31, 2019, the statement of changes in net assets for each of the two years in the period ended May 31, 2019, including the related notes, and the financial highlights for each of the five years in the period ended May 31, 2019 (collectively referred to as the “financial statements”). In our opinion, the financial statements present fairly, in all material respects, the financial position of the Fund as of May 31, 2019, the results of its operations for the year then ended, the changes in its net assets for each of the two years in the period ended May 31, 2019 and the financial highlights for each of the five years in the period ended May 31, 2019 in conformity with accounting principles generally accepted in the United States of America.
Basis for Opinion
These financial statements are the responsibility of the Fund’s management. Our responsibility is to express an opinion on the Fund’s financial statements based on our audits. We are a public accounting firm registered with the Public Company Accounting Oversight Board (United States) (PCAOB) and are required to be independent with respect to the Fund in accordance with the U.S. federal securities laws and the applicable rules and regulations of the Securities and Exchange Commission and the PCAOB.
We conducted our audits of these financial statements in accordance with the standards of the PCAOB. Those standards require that we plan and perform the audit to obtain reasonable assurance about whether the financial statements are free of material misstatement, whether due to error or fraud.
Our audits included performing procedures to assess the risks of material misstatement of the financial statements, whether due to error or fraud, and performing procedures that respond to those risks. Such procedures included examining, on a test basis, evidence regarding the amounts and disclosures in the financial statements. Our audits also included evaluating the accounting principles used and significant estimates made by management, as well as evaluating the overall presentation of the financial statements. Our procedures included confirmation of securities owned as of May 31, 2019 by correspondence with the custodian and brokers; when replies were not received from brokers, we performed other auditing procedures. We believe that our audits provide a reasonable basis for our opinion.
PricewaterhouseCoopers LLP
Boston, Massachusetts
July 15, 2019
We have served as the auditor of one or more investment companies in the Fidelity group of funds since 1932.
Trustees and Officers
The Trustees, Members of the Advisory Board (if any), and officers of the trust and fund, as applicable, are listed below. The Board of Trustees governs the fund and is responsible for protecting the interests of shareholders. The Trustees are experienced executives who meet periodically throughout the year to oversee the fund's activities, review contractual arrangements with companies that provide services to the fund, oversee management of the risks associated with such activities and contractual arrangements, and review the fund's performance. If the interests of the fund and an underlying Fidelity® fund were to diverge, a conflict of interest could arise and affect how the Trustees and Members of the Advisory Board fulfill their fiduciary duties to the affected funds. Strategic Advisers has structured the fund to avoid these potential conflicts, although there may be situations where a conflict of interest is unavoidable. In such instances, Strategic Advisers, the Trustees, and Members of the Advisory Board would take reasonable steps to minimize and, if possible, eliminate the conflict. Each of the Trustees oversees 14 funds.
The Trustees hold office without limit in time except that (a) any Trustee may resign; (b) any Trustee may be removed by written instrument, signed by at least two-thirds of the number of Trustees prior to such removal; (c) any Trustee who requests to be retired or who has become incapacitated by illness or injury may be retired by written instrument signed by a majority of the other Trustees; and (d) any Trustee may be removed at any special meeting of shareholders by a two-thirds vote of the outstanding voting securities of the trust. Officers and Advisory Board Members hold office without limit in time, except that any officer or Advisory Board Member may resign or may be removed by a vote of a majority of the Trustees at any regular meeting or any special meeting of the Trustees. Except as indicated, each individual has held the office shown or other offices in the same company for the past five years.
Each Trustee who is not an interested person (as defined in the 1940 Act) of the trust and the fund is referred to herein as an Independent Trustee.
The fund’s Statement of Additional Information (SAI) includes more information about the Trustees. To request a free copy, call Fidelity at 1-800-544-3455.
Experience, Skills, Attributes, and Qualifications of the Trustees. The Governance and Nominating Committee has adopted a statement of policy that describes the experience, qualifications, attributes, and skills that are necessary and desirable for potential Independent Trustee candidates (Statement of Policy). The Board believes that each Trustee satisfied at the time he or she was initially elected or appointed a Trustee, and continues to satisfy, the standards contemplated by the Statement of Policy. The Governance and Nominating Committee may also engage professional search firms to help identify potential Independent Trustee candidates with experience, qualifications, attributes, and skills consistent with the Statement of Policy. Additional criteria based on the composition and skills of the current Independent Trustees, as well as experience or skills that may be appropriate in light of future changes to board composition, business conditions, and regulatory or other developments, may be considered by the professional search firms and the Governance and Nominating Committee. In addition, the Board takes into account the Trustees' commitment and participation in Board and committee meetings, as well as their leadership of standing and ad hoc committees throughout their tenure.
In determining that a particular Trustee was and continues to be qualified to serve as a Trustee, the Board has considered a variety of criteria, none of which, in isolation, was controlling. The Board believes that, collectively, the Trustees have balanced and diverse experience, qualifications, attributes, and skills, which allow the Board to operate effectively in governing the fund and protecting the interests of shareholders. Information about the specific experience, skills, attributes, and qualifications of each Trustee, which in each case led to the Board's conclusion that the Trustee should serve (or continue to serve) as a trustee of the fund, is provided below.
Board Structure and Oversight Function. Robert A. Lawrence is an interested person and currently serves as Chairman. The Trustees have determined that an interested Chairman is appropriate and benefits shareholders because an interested Chairman has a personal and professional stake in the quality and continuity of services provided to the fund. Independent Trustees exercise their informed business judgment to appoint an individual of their choosing to serve as Chairman, regardless of whether the Trustee happens to be independent or a member of management. The Independent Trustees have determined that they can act independently and effectively without having an Independent Trustee serve as Chairman and that a key structural component for assuring that they are in a position to do so is for the Independent Trustees to constitute a substantial majority for the Board. The Independent Trustees also regularly meet in executive session. Mary C. Farrell serves as the lead Independent Trustee and as such (i) acts as a liaison between the Independent Trustees and management with respect to matters important to the Independent Trustees and (ii) with management prepares agendas for Board meetings.
Fidelity® funds are overseen by different Boards of Trustees. The fund's Board oversees asset allocation funds. Other Boards oversee Fidelity's investment-grade bond, money market, and asset allocation funds, and Fidelity's equity and high income funds. The fund may invest in Fidelity® funds overseen by such other Boards. The use of separate Boards, each with its own committee structure, allows the Trustees of each group of Fidelity® funds to focus on the unique issues of the funds they oversee, including common research, investment, and operational issues.
The Trustees primarily operate as a full Board, but also operate in committees, to facilitate the timely and efficient consideration of all matters of importance to the Trustees, the fund, and fund shareholders and to facilitate compliance with legal and regulatory requirements and oversight of the fund's activities and associated risks. The Board has charged Strategic Advisers and its affiliates with (i) identifying events or circumstances the occurrence of which could have demonstrably adverse effects on the fund's business and/or reputation; (ii) implementing processes and controls to lessen the possibility that such events or circumstances occur or to mitigate the effects of such events or circumstances if they do occur; and (iii) creating and maintaining a system designed to evaluate continuously business and market conditions in order to facilitate the identification and implementation processes described in (i) and (ii) above. Because the day-to-day operations and activities of the fund are carried out by or through Strategic Advisers, its affiliates and other service providers, the fund's exposure to risks is mitigated but not eliminated by the processes overseen by the Trustees. Board oversight of different aspects of the fund's activities is exercised primarily through the full Board, but also through the Audit and Compliance Committee. Appropriate personnel, including but not limited to the fund's Chief Compliance Officer (CCO), FMR's internal auditor, the independent accountants, the fund's Treasurer and portfolio management personnel, make periodic reports to the Board's committees, as appropriate. The responsibilities of each standing committee, including their oversight responsibilities, are described further under "Standing Committees of the Trustees."
Interested Trustees*:
Correspondence intended for a Trustee who is an interested person may be sent to Fidelity Investments, 245 Summer Street, Boston, Massachusetts 02210.
Name, Year of Birth; Principal Occupations and Other Relevant Experience+
Brian B. Hogan (1964)
Year of Election or Appointment: 2018
Trustee
Mr. Hogan also serves as Trustee of other funds. Mr. Hogan serves as Head of Fidelity Investments’ Investment Solutions and Innovation organization (2018-present), a Director of Strategic Advisers LLC (2018-present), and a Director of Fidelity SelectCo, LLC (investment adviser firm, 2014-present). Previously, Mr. Hogan served as President of FMR Co., Inc. (2009-2018), a Vice President of Fidelity's Equity and High Income funds (2009-2018), a Director of FMR Investment Management (UK) Limited (investment adviser firm, 2015-2018), Trustee of certain Fidelity® funds (2014-2018), President of the Equity Division of FMR (investment adviser firm, 2009-2018), Senior Vice President, Equity Research of FMR (2006-2009), and as a portfolio manager. Mr. Brian B. Hogan is not related to Mr. Colm A. Hogan.
Robert A. Lawrence (1952)
Year of Election or Appointment: 2016
Trustee
Chairman of the Board of Trustees
Mr. Lawrence also serves as Trustee of other funds. Previously, Mr. Lawrence served as a Member of the Advisory Board of certain funds. Prior to his retirement in 2008, Mr. Lawrence served as Vice President of certain Fidelity® funds (2006-2008), Senior Vice President, Head of High Income Division of Fidelity Management & Research Company (investment adviser firm, 2006-2008), and President of Fidelity Strategic Investments (investment adviser firm, 2002-2005).
* Determined to be an "Interested Trustee" by virtue of, among other things, his or her affiliation with the trust or various entities under common control with Strategic Advisers.
+ The information includes the Trustee's principal occupation during the last five years and other information relating to the experience, attributes, and skills relevant to the Trustee's qualifications to serve as a Trustee, which led to the conclusion that the Trustee should serve as a Trustee for the fund.
Independent Trustees:
Correspondence intended for an Independent Trustee may be sent to Fidelity Investments, P.O. Box 55235, Boston, Massachusetts 02205-5235.
Name, Year of Birth; Principal Occupations and Other Relevant Experience+
Peter C. Aldrich (1944)
Year of Election or Appointment: 2006
Trustee
Mr. Aldrich also serves as Trustee of other funds. Mr. Aldrich is a Director of the National Bureau of Economic Research, a Director of the funds of BlackRock Realty Group (2006-present), and a Director of LivelyHood, Inc. (private corporation, 2013-present). Previously, Mr. Aldrich served as a Trustee for the Fidelity Rutland Square Trust (2005-2010), a Managing Member of Poseidon, LLC (foreign private investment, 1998-2004), and Chairman and Managing Member of AEGIS, LLC (foreign private investment, 1997-2004). Mr. Aldrich previously was a founder, Chief Executive Officer, and Chairman of AEW Capital Management, L.P. (then “Aldrich, Eastman and Waltch, L.P.”). Mr. Aldrich also served as a Director of Zipcar, Inc. (car sharing services, 2001-2009) and as Faculty Chairman of The Research Council on Global Investment of The Conference Board (business and professional education non-profit, 1999-2004). Mr. Aldrich is a Member Emeritus of the Board of Trustees of the Museum of Fine Arts Boston and an Overseer of the Massachusetts Eye and Ear Infirmary.
Ralph F. Cox (1932)
Year of Election or Appointment: 2006
Trustee
Mr. Cox also serves as Trustee of other funds. Mr. Cox is President of RABAR Enterprises (management consulting for the petroleum industry). Mr. Cox is a Director of Abraxas Petroleum (exploration and production, 1999-present). Mr. Cox is a member of the Advisory Boards of the Business and Engineering Schools of Texas A&M University and the Engineering School of University of Texas at Austin. Previously, Mr. Cox served as a Trustee for the Fidelity Rutland Square Trust (2005-2010) and as an Advisory Director of CH2M Hill Companies (engineering, 1981-2011). Mr. Ralph F. Cox and Mr. Howard E. Cox, Jr. are not related.
Mary C. Farrell (1949)
Year of Election or Appointment: 2013
Trustee
Ms. Farrell also serves as Trustee of other funds. Ms. Farrell is a Director of the W.R. Berkley Corporation (insurance provider) and President (2009-present) and Director (2006-present) of the Howard Gilman Foundation (charitable organization). Previously, Ms. Farrell was Managing Director and Chief Investment Strategist at UBS Wealth Management USA and Co-Head of UBS Wealth Management Investment Strategy & Research Group (2003-2005). Ms. Farrell also served as Investment Strategist at PaineWebber (1982-2000) and UBS PaineWebber (2000-2002). Ms. Farrell serves as Chairman of the Board of Trustees of Yale-New Haven Hospital and on the Yale New Haven Health System Board and previously served as Trustee on the Board of Overseers of the New York University Stern School of Business.
Karen Kaplan (1960)
Year of Election or Appointment: 2006
Trustee
Ms. Kaplan also serves as Trustee of other funds. Ms. Kaplan is Chairman (2014-present) and Chief Executive Officer (2013-present) of Hill Holliday (advertising and specialized marketing). Ms. Kaplan is a Director of The Michaels Companies, Inc. (specialty retailer, 2015-present), Member of the Board of Governors of the Chief Executives’ Club of Boston (2010-present), Member of the Executive Committee of the Greater Boston Chamber of Commerce (2006-present), Advisory Board Member of the National Association of Corporate Directors Chapter (2012-present), Member of the Board of Trustees of the Post Office Square Trust (2012-present), Trustee of the Brigham and Women’s Hospital (2016-present), Overseer of the Boston Symphony Orchestra (2014-present), Member of the Board of Directors of The Advertising Council, Inc. (2016-present), and Member of the Ron Burton Training Village Executive Board of Advisors (2018-present). Previously, Ms. Kaplan served as an Advisory Board Member of Fidelity Rutland Square Trust (2006-2010), a member of the Clinton Global Initiative (2010-2015), Director of DSM (dba Delta Dental and DentaQuest) (2004-2014), Formal Appointee of the 2015 Baker-Polito Economic Development Council, Director of Vera Bradley Inc. (designer of women’s accessories, 2012-2015), Member of the Board of Directors of the Massachusetts Conference for Women (2008-2015), Member of the Board of Directors of Jobs for Massachusetts (2012-2015), President of the Massachusetts Women’s Forum (2008-2010), Treasurer of the Massachusetts Women’s Forum (2002-2006), and Vice Chair of the Board of the Massachusetts Society for the Prevention of Cruelty to Children (2003-2010).
Heidi L. Steiger (1953)
Year of Election or Appointment: 2017
Trustee
Ms. Steiger also serves as Trustee of other funds. Ms. Steiger serves as a member of the Global Advisory Board and Of Counsel to Signum Global Advisors (international policy and strategy, 2018-present), a guest lecturer in the joint degree program in Global Luxury Management at North Carolina State University (Raleigh, NC) and Skema (Paris) (2018-present), Managing Partner of Topridge Associates, LLC (consulting, 2005-present), a Non-Executive Director of CrowdBureau Corporation (financial technology company and index provider, 2018-present), and a member of the Board of Directors (2013-present) and Chair of the Audit Committee and member of the Membership and Executive Committees (2017-present) of Business Executives for National Security (nonprofit). Previously, Ms. Steiger served as Eastern Region President of The Private Client Reserve of U.S. Bancorp (banking and financial services, 2010-2015), Advisory Director of Berkshire Capital Securities, LLC (financial services, 2009-2010), President and Senior Advisor of Lowenhaupt Global Advisors, LLC (financial services, 2005-2007), and President and Contributing Editor of Worth Magazine (2004-2005) and held a variety of positions at Neuberger Berman Group, LLC (financial services, 1986-2004), including Partner and Executive Vice President and Global Head of Private Asset Management at Neuberger Berman (1999-2004). Ms. Steiger also served as a member of the Board of Directors of Nuclear Electric Insurance Ltd (insurer of nuclear utilities, 2006-2017), a member of the Board of Trustees and Audit Committee of the Eaton Vance Funds (2007-2010), a member of the Board of Directors of Aviva USA (formerly AmerUs) (insurance, 2004-2014), and a member of the Board of Trustees and Audit Committee and Chair of the Investment Committee of CIFG (financial guaranty insurance, 2009-2012), and a member of the Board of Directors of Kin Group Plc (formerly, Fitbug Holdings) (health and technology, 2016-2017).
+ The information includes the Trustee's principal occupation during the last five years and other information relating to the experience, attributes, and skills relevant to the Trustee's qualifications to serve as a Trustee, which led to the conclusion that the Trustee should serve as a Trustee for the fund.
Advisory Board Members and Officers:
Correspondence intended for an officer or Howard E. Cox, Jr. may be sent to Fidelity Investments, 245 Summer Street, Boston, Massachusetts 02210. Officers appear below in alphabetical order.
Name, Year of Birth; Principal Occupation
Howard E. Cox, Jr. (1944)
Year of Election or Appointment: 2009
Member of the Advisory Board
Mr. Cox also serves as Member of the Advisory Board of other funds. Mr. Cox is a Partner of Greylock (venture capital, 1971-present) and a Director of Stryker Corporation (medical products and services, 1974-present). Previously, Mr. Cox served as an Advisory Board Member of Fidelity Rutland Square Trust (2006-2010). Mr. Cox also serves as a Member of the Secretary of Defense's Business Board of Directors (2008-present), a Director of Business Executives for National Security (1997-present), a Director of the Brookings Institution (2010-present), a Director of the World Economic Forum’s Young Global Leaders Foundation (2009-present), and is a Member of the Harvard Medical School Board of Fellows (2002-present). Mr. Howard E. Cox, Jr. and Mr. Ralph F. Cox are not related.
Elizabeth Paige Baumann (1968)
Year of Election or Appointment: 2017
Anti-Money Laundering (AML) Officer
Ms. Baumann also serves as AML Officer of other funds. She is Chief AML Officer (2012-present) and Senior Vice President (2014-present) of FMR LLC (diversified financial services company) and is an employee of Fidelity Investments. Previously, Ms. Baumann served as AML Officer of the funds (2012-2016), and Vice President (2007-2014) and Deputy Anti-Money Laundering Officer (2007-2012) of FMR LLC.
Craig S. Brown (1977)
Year of Election or Appointment: 2019
Assistant Treasurer
Mr. Brown also serves as Assistant Treasurer of other funds. Mr. Brown is an employee of Fidelity Investments (2013-present).
John J. Burke III (1964)
Year of Election or Appointment: 2018
Chief Financial Officer
Mr. Burke also serves as Chief Financial Officer of other funds. Mr. Burke serves as Head of Investment Operations for Fidelity Fund and Investment Operations (2018-present) and is an employee of Fidelity Investments (1998-present). Previously Mr. Burke served as head of Asset Management Investment Operations (2012-2018).
Jonathan Davis (1968)
Year of Election or Appointment: 2010
Assistant Treasurer
Mr. Davis also serves as Assistant Treasurer of other funds. Mr. Davis serves as Assistant Treasurer of FMR Capital, Inc. (2017-present) and is an employee of Fidelity Investments. Previously, Mr. Davis served as Vice President and Associate General Counsel of FMR LLC (diversified financial services company, 2003-2010).
Adrien E. Deberghes (1967)
Year of Election or Appointment: 2016
President and Treasurer
Mr. Deberghes also serves as an officer of other funds. He serves as Assistant Treasurer of FMR Capital, Inc. (2017-present), Executive Vice President of Fidelity Investments Money Management, Inc. (FIMM) (investment adviser firm, 2016-present), and is an employee of Fidelity Investments (2008-present). Previously, Mr. Deberghes served as President and Treasurer of certain Fidelity® funds (2013-2018). Prior to joining Fidelity Investments, Mr. Deberghes was Senior Vice President of Mutual Fund Administration at State Street Corporation (2007-2008), Senior Director of Mutual Fund Administration at Investors Bank & Trust (2005-2007), and Director of Finance for Dunkin' Brands (2000-2005). Previously, Mr. Deberghes served in other fund officer roles.
Laura M. Del Prato (1964)
Year of Election or Appointment: 2018
Assistant Treasurer
Ms. Del Prato also serves as an officer of other funds. Ms. Del Prato is an employee of Fidelity Investments (2017-present). Prior to joining Fidelity Investments, Ms. Del Prato served as a Managing Director and Treasurer of the JPMorgan Mutual Funds (2014-2017). Prior to JPMorgan, Ms. Del Prato served as a partner at Cohen Fund Audit Services (accounting firm, 2012-2013) and KPMG LLP (accounting firm, 2004-2012).
James D. Gryglewicz (1972)
Year of Election or Appointment: 2015
Chief Compliance Officer
Mr. Gryglewicz also serves as Chief Compliance Officer of other funds. Mr. Gryglewicz serves as Compliance Officer of Strategic Advisers LLC (investment adviser firm, 2015-present) and Fidelity SelectCo, LLC (investment adviser firm, 2014-present), Senior Vice President of Asset Management Compliance (2009-present), and is an employee of Fidelity Investments (2004-present). Previously, Mr. Gryglewicz served as Chief Compliance Officer of certain Fidelity® funds (2014-2018).
John Hitt (1967)
Year of Election or Appointment: 2014
Secretary and Chief Legal Officer
Mr. Hitt also serves as an officer of other funds. Mr. Hitt serves as Senior Vice President and Deputy General Counsel in Fidelity's Asset Management Group (2010-present) and is an employee of Fidelity Investments.
Colm A. Hogan (1973)
Year of Election or Appointment: 2016
Assistant Treasurer
Mr. Hogan also serves as an officer of other funds. Mr. Hogan serves as Assistant Treasurer of FMR Capital, Inc. (2017-present) and is an employee of Fidelity Investments (2005-present). Previously, Mr. Hogan served as Assistant Treasurer of certain Fidelity® funds (2016-2018). Mr. Colm A. Hogan is not related to Mr. Brian B. Hogan.
Christina H. Lee (1975)
Year of Election or Appointment: 2018
Assistant Secretary
Ms. Lee also serves as Assistant Secretary of other funds. Ms. Lee serves as Vice President, Associate General Counsel (2014-present) and is an employee of Fidelity Investments (2007-present).
Chris Maher (1972)
Year of Election or Appointment: 2016
Assistant Treasurer
Mr. Maher serves as Assistant Treasurer of other funds. Mr. Maher is Vice President of Valuation Oversight, serves as Assistant Treasurer of FMR Capital, Inc. (2017-present), and is an employee of Fidelity Investments. Previously, Mr. Maher served as Vice President of Asset Management Compliance (2013), Vice President of the Program Management Group of FMR (investment adviser firm, 2010-2013), and Vice President of Valuation Oversight (2008-2010).
Stacie M. Smith (1974)
Year of Election or Appointment: 2016
Assistant Treasurer
Ms. Smith also serves as an officer of other funds. Ms. Smith serves as Assistant Treasurer of FMR Capital, Inc. (2017-present), is an employee of Fidelity Investments (2009-present), and has served in other fund officer roles. Prior to joining Fidelity Investments, Ms. Smith served as Senior Audit Manager of Ernst & Young LLP (accounting firm, 1996-2009). Previously, Ms. Smith served as Assistant Treasurer (2013-2018) and Deputy Treasurer (2013-2016) of certain Fidelity® funds.
Marc L. Spector (1972)
Year of Election or Appointment: 2016
Assistant Treasurer
Mr. Spector also serves as an officer of other funds. Mr. Spector serves as Assistant Treasurer of FMR Capital, Inc. (2017-present) and is an employee of Fidelity Investments (2016-present). Prior to joining Fidelity Investments, Mr. Spector served as Director at the Siegfried Group (accounting firm, 2013-2016), and prior to Siegfried Group as audit senior manager at Deloitte & Touche (accounting firm, 2005-2013).
Jim Wegmann (1979)
Year of Election or Appointment: 2019
Assistant Treasurer
Mr. Wegmann also serves as Assistant Treasurer of other funds. Mr. Wegmann is an employee of Fidelity Investments (2011-present).
Shareholder Expense Example
As a shareholder of the Fund, you incur two types of costs: (1) transaction costs and (2) ongoing costs, including management fees and other Fund expenses. This Example is intended to help you understand your ongoing costs (in dollars) of investing in the Fund and to compare these costs with the ongoing costs of investing in other mutual funds.
The Example is based on an investment of $1,000 invested at the beginning of the period and held for the entire period (December 1, 2018 to May 31, 2019).
Actual Expenses
The first line of the accompanying table provides information about actual account values and actual expenses. You may use the information in this line, together with the amount you invested, to estimate the expenses that you paid over the period. Simply divide your account value by $1,000.00 (for example, an $8,600 account value divided by $1,000.00 = 8.6), then multiply the result by the number in the first line under the heading entitled "Expenses Paid During Period" to estimate the expenses you paid on your account during this period. In addition to the direct expenses incurred by the Fund presented in the table, as a shareholder of the underlying mutual funds (the Underlying Funds), the Fund also indirectly bears its proportionate share of the expenses of the Underlying Funds. In addition, the Fund, as a shareholder in the underlying Fidelity Central Funds, will indirectly bear its pro-rata share of the fees and expenses incurred by the underlying Fidelity Central Funds. These fees and expenses are not included in the Fund’s annualized expense ratio used to calculate the expense estimate in the table below.
Hypothetical Example for Comparison Purposes
The second line of the accompanying table provides information about hypothetical account values and hypothetical expenses based on the Fund's actual expense ratio and an assumed rate of return of 5% per year before expenses, which is not the Fund's actual return. The hypothetical account values and expenses may not be used to estimate the actual ending account balance or expenses you paid for the period. You may use this information to compare the ongoing costs of investing in the Fund and other funds. To do so, compare this 5% hypothetical example with the 5% hypothetical examples that appear in the shareholder reports of the other funds. In addition to the direct expenses incurred by the Fund presented in the table, as a shareholder of the Underlying Funds, the Fund also indirectly bears its proportionate share of the expenses of the Underlying Funds. In addition, the Fund, as a shareholder in the underlying Fidelity Central Funds, will indirectly bear its pro-rata share of the fees and expenses incurred by the underlying Fidelity Central Funds. These fees and expenses are not included in the Fund’s annualized expense ratio used to calculate the expense estimate in the table below.
Please note that the expenses shown in the table are meant to highlight your ongoing costs only and do not reflect any transaction costs. Therefore, the second line of the table is useful in comparing ongoing costs only, and will not help you determine the relative total costs of owning different funds.
| Annualized Expense Ratio-A | Beginning Account Value December 1, 2018 | Ending Account Value May 31, 2019 | Expenses Paid During Period-B December 1, 2018 to May 31, 2019 |
|
| Actual | .12% | $1,000.00 | $1,029.70 | $.61 |
| Hypothetical-C | $1,000.00 | $1,024.33 | $.61 |
A Annualized expense ratio reflects expenses net of applicable fee waivers.
B Expenses are equal to the Fund's annualized expense ratio, multiplied by the average account value over the period, multiplied by 182/365 (to reflect the one-half year period). The fees and expenses of the Underlying Funds in which the Fund invests are not included in the Fund's annualized expense ratio.
C 5% return per year before expenses
Distributions (Unaudited)
The Board of Trustees of Strategic Advisers Growth Fund voted to pay on July 15, 2019, to shareholders of record at the opening of business on July 12, 2019, a distribution of $1.22 per share derived from capital gains realized from sales of portfolio securities and a dividend of $0.083 per share from net investment income.
The fund hereby designates as a capital gain dividend with respect to the taxable year ended May 31, 2019, $1,378,966,130, or, if subsequently determined to be different, the net capital gain of such year.
The fund designates 100% of the dividends distributed during the fiscal year as qualifying for the dividends–received deduction for corporate shareholders.
The fund designates 100% of the dividends distributed during the fiscal year as amounts which may be taken into account as a dividend for the purposes of the maximum rate under section 1(h)(11) of the Internal Revenue Code.
The fund will notify shareholders in January 2020 of amounts for use in preparing 2019 income tax returns.
Board Approval of Investment Advisory Contracts and Management Fees
Strategic Advisers Growth Fund
On December 5, 2018, the Board of Trustees, including the Independent Trustees (together, the Board) voted at an in-person meeting to approve an amended sub-advisory agreement with Geode Capital Management, LLC (Geode) for the fund (the Amended Sub-Advisory Agreement) to add an additional investment mandate. The terms of the Amended Sub-Advisory Agreement are identical to those of the existing sub-advisory agreement with Geode on behalf of the fund, except with respect to the date of execution and the fee schedule, which was amended to add a new investment mandate.
The Board, assisted by the advice of fund counsel and Independent Trustees’ counsel, considered a broad range of information it believed relevant to the approval of the Amended Sub-Advisory Agreement.
In considering whether to approve the Amended Sub-Advisory Agreement, the Board reached a determination, with the assistance of fund counsel and Independent Trustees' counsel and through the exercise of its business judgment, that the approval of the Amended Sub-Advisory Agreement is in the best interests of the fund and its shareholders and that the approval of such agreement does not involve a conflict of interest from which Strategic Advisers LLC (Strategic Advisers) or its affiliates derive an inappropriate advantage. Also, the Board found that the advisory fees to be charged under the Amended Sub-Advisory Agreement bear a reasonable relationship to the services to be rendered and will be based upon services provided that will be in addition to, rather than duplicative of, services provided under the advisory contract of any underlying fund in which the fund may invest. The Board’s decision to approve the Amended Sub-Advisory Agreement was not based on any single factor, but rather was based on a comprehensive consideration of all the information provided to the Board. In addition, individual Trustees did not necessarily attribute the same weight or importance to each factor.
Nature, Extent, and Quality of Services Provided. The Board noted that it is familiar with the nature, extent and quality of services provided by Geode from its oversight of Geode on behalf of other funds overseen by the Board and that the same support staff, including compliance personnel, that currently provides services to other Strategic Advisers funds will also provide services to the fund on behalf of the new investment mandate. The Board also took into consideration the fund’s investment objective, strategies and related investment philosophy and additional information regarding the new investment mandate provided by Strategic Advisers and Geode. The Board also considered the structure of Geode’s portfolio manager compensation program with respect to the investment personnel that will provide services to the fund and whether this structure provides appropriate incentives to act in the best interests of the fund. Resources Dedicated to Investment Management and Support Services. The Board noted that Geode will utilize a different investment mandate to manage the fund than it currently uses in managing other Strategic Advisers funds and reviewed the general qualifications and capabilities of the investment staff that will provide services to the fund and its use of technology. The Board noted that Geode’s analysts have extensive resources, tools and capabilities which allow them to conduct sophisticated fundamental and/or quantitative analysis. Additionally, in their deliberations, the Board considered Geode’s trading capabilities and resources which are integral parts of the investment management process. Shareholder and Administrative Services. The Board considered (i) the nature, extent, quality, and cost of advisory services to be performed by Geode under the new investment mandate and (ii) the resources devoted by Geode to its compliance program, which the Board is familiar with through its oversight of Geode on behalf of other funds overseen by the Board. Investment Performance. The Board considered that the investment mandate to be utilized by Geode is new and, therefore, does not have historical investment performance. The Board reviewed hypothetical backtested performance of the new investment mandate. Because it is a new investment mandate, performance was not a material factor in the Board’s decision to approve the Amended Sub-Advisory Agreement.Based on its review, the Board concluded that the nature, extent, and quality of services that will be provided to the fund under the Amended Sub-Advisory Agreement should continue to benefit the fund’s shareholders. Competitiveness of Management Fee and Total Fund Expenses. In reviewing the Amended Sub-Advisory Agreement, the Board considered the amount and nature of fees to be paid by the fund to the fund’s investment adviser, Strategic Advisers, the amount and nature of fees to be paid by Strategic Advisers to Geode and the projected change in the fund’s total operating expenses, if any, as a result of the new investment mandate. The Board also considered the relevant fee comparisons for factor-based strategies charged by Geode to other Fidelity funds overseen by other Fidelity fund boards.The Board considered that the fee schedule for the additional mandate is lower than the fee schedule for the existing mandate and identical to the fee schedule for a factor-based strategy charged by Geode for another Strategic Advisers fund. The Board also considered that the Amended Sub-Advisory Agreement would not result in a change to the fund’s maximum aggregate annual management fee rate, Strategic Advisers’ portion of the fund’s management fee or Strategic Advisers’ contractual management fee waiver for the fund. The Board also considered that after allocating assets to Geode under the new investment mandate, the fund’s management fee is expected to continue to rank below median of its competitive peer group. In addition, the Board considered that no change is expected to the fund’s total net expenses after allocating assets to the new investment mandate and that net expenses of the fund are expected to continue to rank below the median expense ratio of its competitive peer group.Based on its review, the Board concluded that the fund’s management fee structure and any projected changes to total expenses (if any) bear a reasonable relationship to the services that the fund and its shareholders will receive and the other factors considered.Because the Amended Sub-Advisory Agreement will have no impact on the management fee retained by Strategic Advisers, if any, the Board did not consider the costs of services and profitability of the relationship with the fund to Strategic Advisers to be significant factors in its decision to approve the Amended Sub-Advisory Agreement. The Board noted that it will consider costs of services and profitability to Strategic Advisers and Geode as a result of their relationship with the fund in connection with future renewals of the Amended Sub-Advisory Agreement and the fund’s advisory agreement with Strategic Advisers. Potential Fall-Out Benefits. The Board considered that it reviews information regarding the potential of direct and indirect benefits that may accrue to Strategic Advisers and its affiliates and each sub-adviser from their relationships with the fund, including non-advisory fee compensation paid to affiliates of Strategic Advisers or a sub-adviser, if any, during its annual renewal of the fund’s advisory agreement with Strategic Advisers and each sub-advisory agreement. With respect to the Amended Sub-Advisory Agreement, the Board considered management’s representation that it does not anticipate that the additional investment mandate will have a material impact on the potential for fall-out benefits to Strategic Advisers or its affiliates. Possible Economies of Scale. The Board considered that it reviews whether there have been economies of scale in connection with the management of the fund during its annual renewal of the fund’s advisory agreement with Strategic Advisers and the fund’s sub-advisory agreements. Conclusion. Based on its evaluation of all of the conclusions noted above, and after considering all factors it believed relevant, the Board ultimately concluded that the Amended Sub-Advisory Agreement’s fee structure bears a reasonable relationship to the services to be rendered and that the Amended Sub- Advisory Agreement should be approved because the agreement is in the best interests of the fund and its shareholders. The Board also concluded that the sub-advisory fees to be charged thereunder will be based on services provided that will be in addition to, rather than duplicative of services provided under the advisory contract of any underlying fund in which the fund may invest. In addition, the Board concluded that the approval of the Amended Sub-Advisory Agreement does not involve a conflict of interest from which Strategic Advisers or its affiliates derive an inappropriate advantage.Board Approval of Investment Advisory Contract and Management Fees
Strategic Advisers Growth Fund On March 7, 2019, the Board of Trustees, including the Independent Trustees (together, the Board) voted at an in-person meeting to approve an investment advisory agreement (the Sub-Advisory Agreement) with ClariVest Asset Management LLC (ClariVest) for the fund, which would take effect upon the consummation of a transaction resulting in changes to the ownership of ClariVest, a sub-adviser to the fund. The Board noted that the terms of the Sub-Advisory Agreement are identical in all material respects to those of the existing sub-advisory agreement with ClariVest, except with respect to the date of execution. The Board, assisted by the advice of fund counsel and Independent Trustees' counsel, considered a broad range of information it believed relevant to the approval of the Sub-Advisory Agreement.In considering whether to approve the Sub-Advisory Agreement, the Board reached a determination, with the assistance of fund counsel and Independent Trustees' counsel and through the exercise of its business judgment, that the approval of the Sub-Advisory Agreement is in the best interests of the fund and its shareholders and that the approval of such agreement does not involve a conflict of interest from which the fund's investment adviser, Strategic Advisers LLC (Strategic Advisers), or its affiliates derive an inappropriate advantage. Also, the Board found that the fees to be charged under the Sub-Advisory Agreement bear a reasonable relationship to the services to be rendered and will be based upon services provided that will be in addition to, rather than duplicative of, services provided under the advisory contract of any underlying fund in which the fund may invest. The Board's decision to approve the Sub- Advisory Agreement was not based on any single factor, but rather was based on a comprehensive consideration of all the information provided to the Board. Nature, Extent, and Quality of Services Provided. The Board considered that it reviewed information regarding ClariVest, including the backgrounds of its investment personnel, and also took into consideration the fund's investment objective, strategies and related investment philosophy, in connection with the annual renewal of the fund's current sub-advisory agreement with ClariVest at its September 2018 Board meeting.The Board considered that the Sub-Advisory Agreement will not result in any changes to the nature, extent and quality of the services provided to the fund. The Board also considered that the Sub-Advisory Agreement would not result in any changes to (i) the investment process or strategies employed in the management of the fund's assets or (ii) the day-to-day management of the fund or the persons primarily responsible for such management under the existing sub-advisory agreement. Investment Performance. The Board considered that it received information regarding ClariVest's historical investment performance in managing fund assets in connection with the annual renewal of the fund's current sub-advisory agreement with ClariVest and throughout the year. The Board did not consider performance to be a material factor in its decision to approve the Sub-Advisory Agreement because the Sub-Advisory Agreement would not result in any changes to the fund's investment processes or strategies or in the persons primarily responsible for the day-to-day management of the fund.Based on its review, the Board concluded that the nature, extent, and quality of services that will be provided to the fund under the Sub-Advisory Agreement should benefit the fund's shareholders. Competitiveness of Management Fee and Total Fund Expenses. In reviewing the Sub-Advisory Agreement, the Board considered the amount and nature of fees to be paid by the fund to Strategic Advisers and the amount and nature of fees to be paid by Strategic Advisers to ClariVest and the absence of any change in the fund's total operating expenses as a result of approving the Sub- Advisory Agreement.The Board considered that there are no expected changes to the fund's management fee or total operating expenses as a result of approving the Sub-Advisory Agreement and that the fund's management fee and total net expenses are expected to maintain the same relationship to the competitive peer group medians reviewed by the Board in connection with the annual renewal of the fund's advisory contracts at the September 2018 meeting.Based on its review, the Board concluded that the fund's management fee structure and total expenses continue to bear a reasonable relationship to the services that the fund and its shareholders will receive and the other factors considered.Because the Sub-Advisory Agreement was negotiated at arm's length and will have no impact on the maximum management fees payable by the fund or Strategic Advisers portion of the management fee, the Board did not consider the costs of services and the profitability of the relationship with the fund to Strategic Advisers to be significant factors in its decision to approve the Sub-Advisory Agreement. Potential Fall-Out Benefits. The Board considered that it reviews information regarding the potential of direct and indirect benefits to Strategic Advisers and its affiliates from their relationships with the fund, including non-advisory fee compensation paid to affiliates of Strategic Advisers, if any, during its annual renewal of the fund's advisory agreement with Strategic Advisers. With respect to ClariVest, the Board considered Strategic Advisers' representation that it does not anticipate that the approval of the Sub-Advisory Agreement will have a material impact on the potential for fall-out benefits to Strategic Advisers or its affiliates. Possible Economies of Scale. The Board considered that it reviews whether there have been economies of scale in connection with the management of the fund during its annual renewal of the fund's advisory agreement with Strategic Advisers and the fund's sub-advisory agreements. The Board noted that the Sub-Advisory Agreement provides for breakpoints that have the potential to reduce sub-advisory fees paid to ClariVest as assets allocated to ClariVest grow. The Board also considered that it reviewed whether there have been economies of scale in connection with the management of the fund during its annual renewal of the fund's advisory agreement with Strategic Advisers at its September 2018 Board meeting. Conclusion. Based on its evaluation of all of the conclusions noted above, and after considering all factors it believed relevant, the Board ultimately concluded that the Sub-Advisory Agreement's fee structure bears a reasonable relationship to the services to be rendered and that the Sub-Advisory Agreement should be approved because the Sub-Advisory Agreement is in the best interests of the fund and its shareholders. The Board also concluded that the sub-advisory fees to be charged there under will be based on services provided that will be in addition to, rather than duplicative of, services provided under the advisory contract of any underlying fund in which the fund may invest. In addition, the Board concluded that the approval of the Sub-Advisory Agreement does not involve a conflict of interest from which Strategic Advisers or its affiliates derive an inappropriate advantage.
![]()
SGF-ANN-0719
1.907404.110
|
Strategic Advisers® Short Duration Fund Offered exclusively to certain clients of Strategic Advisers LLC - not available for sale to the general public Annual Report May 31, 2019 |
|
|
Beginning on January 1, 2021, as permitted by regulations adopted by the Securities and Exchange Commission, paper copies of a fund’s shareholder reports will no longer be sent by mail, unless you specifically request paper copies of the reports from the fund or from your financial intermediary, such as a financial advisor, broker-dealer or bank. Instead, the reports will be made available on a website, and you will be notified by mail each time a report is posted and provided with a website link to access the report.
If you already elected to receive shareholder reports electronically, you will not be affected by this change and you need not take any action. You may elect to receive shareholder reports and other communications from a fund electronically, by contacting your financial intermediary. For Fidelity customers, visit Fidelity's web site or call Fidelity using the contact information listed below.
You may elect to receive all future reports in paper free of charge. If you wish to continue receiving paper copies of your shareholder reports, you may contact your financial intermediary or, if you are a Fidelity customer, visit Fidelity’s website, or call Fidelity at the applicable toll-free number listed below. Your election to receive reports in paper will apply to all funds held with the fund complex/your financial intermediary.
| Account Type | Website | Phone Number |
| Brokerage, Mutual Fund, or Annuity Contracts: | fidelity.com/mailpreferences | 1-800-343-3548 |
| Employer Provided Retirement Accounts: | netbenefits.fidelity.com/preferences (choose 'no' under Required Disclosures to continue to print) | 1-800-343-0860 |
| Advisor Sold Accounts Serviced Through Your Financial Intermediary: | Contact Your Financial Intermediary | Your Financial Intermediary's phone number |
| Advisor Sold Accounts Serviced by Fidelity: | institutional.fidelity.com | 1-877-208-0098 |
Contents
To view a fund's proxy voting record for the 12-month period ended June 30, visit http://www.fidelity.com/proxyvotingresults or visit the Securities and Exchange Commission's (SEC) web site at http://www.sec.gov.
You may also call 1-800-544-3455 to request a free copy of the proxy voting guidelines.
Standard & Poor's, S&P and S&P 500 are registered service marks of The McGraw-Hill Companies, Inc. and have been licensed for use by Fidelity Distributors Corporation.
Other third-party marks appearing herein are the property of their respective owners.
All other marks appearing herein are registered or unregistered trademarks or service marks of FMR LLC or an affiliated company. © 2019 FMR LLC. All rights reserved.
This report and the financial statements contained herein are submitted for the general information of the shareholders of the Fund. This report is not authorized for distribution to prospective investors in the Fund unless preceded or accompanied by an effective prospectus.
A fund files its complete schedule of portfolio holdings with the SEC for the first and third quarters of each fiscal year on Form N-PORT. Forms N-PORT are available on the SEC’s web site at http://www.sec.gov. A fund's Forms N-PORT may be reviewed and copied at the SEC’s Public Reference Room in Washington, DC. Information regarding the operation of the SEC's Public Reference Room may be obtained by calling 1-800-SEC-0330.
For a complete list of a fund's portfolio holdings, view the most recent holdings listing, semiannual report, or annual report on Fidelity's web site at http://www.fidelity.com, http://www.institutional.fidelity.com, or http://www.401k.com, as applicable.
NOT FDIC INSURED •MAY LOSE VALUE •NO BANK GUARANTEE
Neither the Fund nor Fidelity Distributors Corporation is a bank.
Performance: The Bottom Line
Average annual total return reflects the change in the value of an investment, assuming reinvestment of distributions from dividend income and capital gains (the profits earned upon the sale of securities that have grown in value, if any) and assuming a constant rate of performance each year. The hypothetical investment and the average annual total returns do not reflect the deduction of taxes that a shareholder would pay on fund distributions or the redemption of fund shares. During periods of reimbursement by Fidelity, a fund’s total return will be greater than it would be had the reimbursement not occurred. How a fund did yesterday is no guarantee of how it will do tomorrow.
Average Annual Total Returns
| For the periods ended May 31, 2019 | Past 1 year | Past 5 years | Life of fundA |
| Strategic Advisers® Short Duration Fund | 2.75% | 1.43% | 1.37% |
A From December 20, 2011
$10,000 Over Life of Fund
Let's say hypothetically that $10,000 was invested in Strategic Advisers® Short Duration Fund on December 20, 2011, when the fund started.
The chart shows how the value of your investment would have changed, and also shows how the Citigroup® 6-Month U.S. Treasury Bill Index performed over the same period.
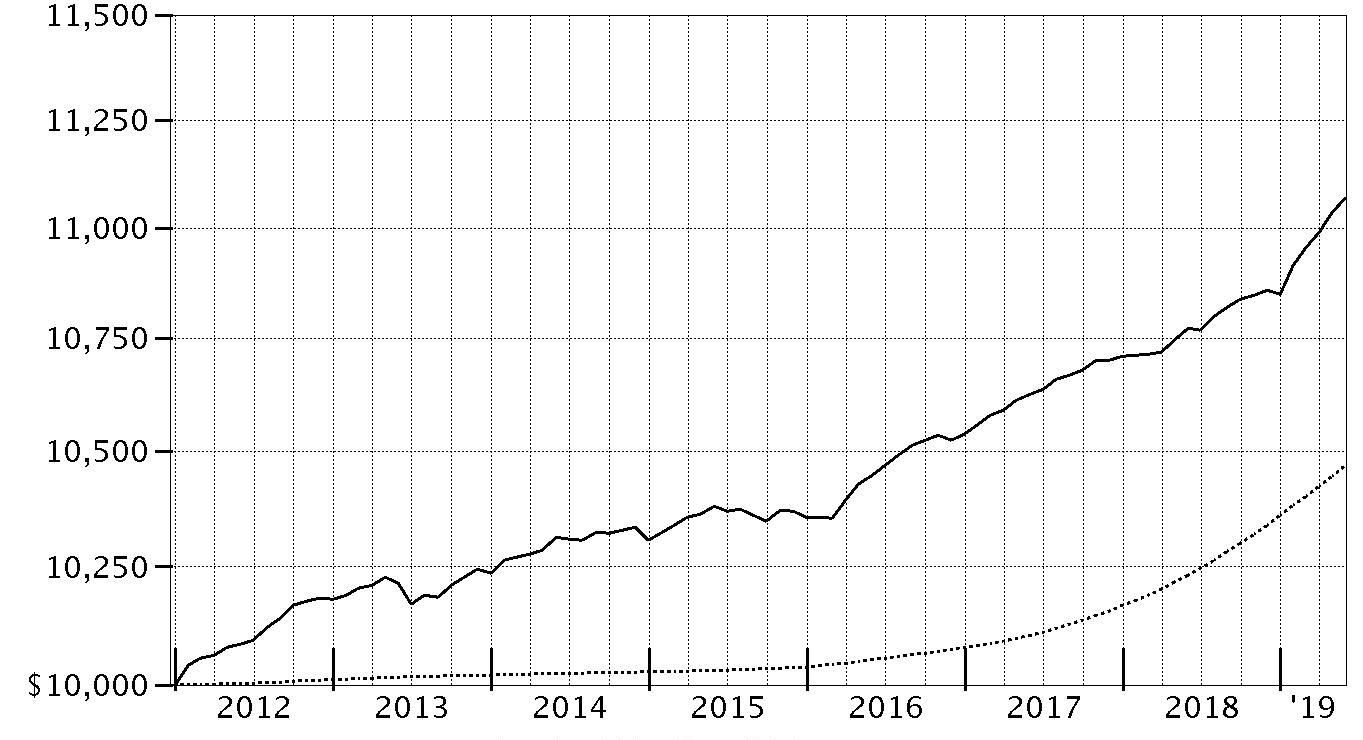
| Period Ending Values | ||
|
| $11,070 | Strategic Advisers® Short Duration Fund |
|
| $10,468 | Citigroup® 6-Month U.S. Treasury Bill Index |
Management's Discussion of Fund Performance
Market Recap: U.S. taxable investment-grade bonds advanced broadly for the 12 months ending May 31, 2019, driven by slower global economic growth and uncertainty regarding trade policy and the direction of U.S. interest rates. The Bloomberg Barclays U.S. Aggregate Bond Index gained 6.40%. Early in the period, spreads between shorter-term and longer-term Treasury bonds remained tight, due to escalating global trade tension. Yields rose in September and early October on expectations for higher inflation. Yields then declined and credit spreads widened in November and December because of disappointing U.S. manufacturing data and signs of a global slowdown. Yield spreads narrowed notably in January, as the U.S. Federal Reserve said it would be “patient” with policy rate hikes and that future increases largely would depend on economic data. Yields continued to decline toward period end, amid rising international trade tension and attacks on oil tankers in the Middle East. Within the Bloomberg Barclays index, corporate bonds gained 7.45%, topping the 6.28% advance of U.S. Treasuries. Securitized bonds rose 5.63%, led by commercial mortgage-backed securities (+7.70%). Outside the index, most non-core fixed-income segments moderately lagged nominal U.S. Treasuries, while Treasury Inflation-Protected Securities (TIPS) gained 4.36%. Comments from Lead Portfolio Manager Jonathan Duggan: For the fiscal year, the Fund gained 2.75%, outpacing the 2.32% advance of the benchmark FTSE® 6-Month U.S. Treasury Bill Index. Sub-advisers FIAM® and T. Rowe Price added the most value, contributing about equally versus the benchmark. More specifically, both managers benefited from allocations to investment-grade corporate credit. T. Rowe Price also had somewhat greater interest-rate sensitivity than the benchmark, which provided a boost to performance as interest rates declined during the period’s second half. On the downside, PIMCO Short-Term Fund was the only notable relative detractor, hampered by unfavorable interest-rate and yield-curve positioning. During the period, we sold several mutual fund positions and reallocated these assets into sub-adviser T. Rowe Price. We also reduced our allocation to Fidelity® Floating Rate High Income Fund for risk-management purposes. Looking ahead, we think it's likely that the U.S. Federal Reserve will begin reducing short-term interest rates later this year. Lastly, we plan to maintain a cushion of liquidity in the portfolio to help manage risk during periods of volatility.The views expressed above reflect those of the portfolio manager(s) only through the end of the period as stated on the cover of this report and do not necessarily represent the views of Fidelity or any other person in the Fidelity organization. Any such views are subject to change at any time based upon market or other conditions and Fidelity disclaims any responsibility to update such views. These views may not be relied on as investment advice and, because investment decisions for a Fidelity fund are based on numerous factors, may not be relied on as an indication of trading intent on behalf of any Fidelity fund.
Note to shareholders: On December 31, 2018, former Co-Manager Gregory Pappas retired from the firm, leaving Jonathan Duggan as sole manager of the Fund. On April 1, 2019, Chris Heavey assumed co-management responsibilities for the Fund.Investment Summary (Unaudited)
The information in the following tables is based on the direct investments of the Fund.Top Ten Holdings as of May 31, 2019
| (excluding cash equivalents) | % of fund's net assets |
| PIMCO Short-Term Fund – Administrator Class | 25.2 |
| Fidelity Short-Term Bond Fund | 8.7 |
| Blackrock Low Duration Bond Portfolio Investor A Shares | 6.4 |
| Metropolitan West Low Duration Bond Fund – Class M | 4.1 |
| Baird Short-Term Bond Fund - Institutional Class | 3.6 |
| iShares Short Treasury Bond ETF | 3.0 |
| PIMCO Enhanced Short Maturity Active ETF | 2.1 |
| Prudential Short-Term Corporate Bond Fund, Inc. Class A | 2.0 |
| JPMorgan Ultra-Short Income ETF | 2.0 |
| Fidelity Floating Rate High Income Fund | 1.6 |
| 58.7 |
Asset Allocation (% of fund's net assets)
| As of May 31, 2019 | ||
| Corporate Bonds | 24.3% | |
| U.S. Government and U.S. Government Agency Obligations | 3.3% | |
| Asset-Backed Securities | 7.9% | |
| CMOs and Other Mortgage Related Securities | 1.5% | |
| Bank Loan Funds | 1.6% | |
| Other Investments | 0.2% | |
| Short-Term Funds | 59.7% | |
| Short-Term Investments and Net Other Assets (Liabilities) | 1.5% | |

Asset allocations of fund in the pie chart reflect the categorizations of assets as defined by Morningstar as of the reporting date.
Schedule of Investments May 31, 2019
Showing Percentage of Net Assets
| Nonconvertible Bonds - 24.3% | |||
| Principal Amount | Value | ||
| COMMUNICATION SERVICES - 1.5% | |||
| Diversified Telecommunication Services - 0.6% | |||
| AT&T, Inc. 3 month U.S. LIBOR + 0.930% 3.531% 6/30/20 (a)(b) | $7,845,000 | $7,901,343 | |
| Deutsche Telekom International Financial BV 3 month U.S. LIBOR + 0.580% 3.168% 1/17/20 (a)(b)(c) | 10,000,000 | 10,013,960 | |
| SBA Tower Trust: | |||
| 3.156% 10/8/20 (c) | 265,000 | 266,648 | |
| 3.448% 3/15/48 (c) | 880,000 | 901,176 | |
| Telefonica Emisiones S.A.U. 5.134% 4/27/20 | 565,000 | 577,059 | |
| Verizon Communications, Inc. 3 month U.S. LIBOR + 0.550% 3.0734% 5/22/20 (a)(b) | 25,000,000 | 25,100,000 | |
| 44,760,186 | |||
| Entertainment - 0.4% | |||
| NBCUniversal Enterprise, Inc. 3 month U.S. LIBOR + 0.400% 2.9918% 4/1/21 (a)(b)(c) | 23,029,000 | 23,097,626 | |
| NBCUniversal, Inc. 5.15% 4/30/20 | 1,521,000 | 1,555,698 | |
| 24,653,324 | |||
| Interactive Media & Services - 0.1% | |||
| Baidu.com, Inc. 2.75% 6/9/19 | 2,665,000 | 2,665,040 | |
| Tencent Holdings Ltd. 2.875% 2/11/20 (c) | 1,555,000 | 1,561,220 | |
| 4,226,260 | |||
| Media - 0.4% | |||
| Charter Communications Operating LLC/Charter Communications Operating Capital Corp.: | |||
| 3.579% 7/23/20 | 1,395,000 | 1,405,342 | |
| 4.464% 7/23/22 | 2,445,000 | 2,534,675 | |
| Comcast Corp.: | |||
| 3 month U.S. LIBOR + 0.330% 2.9218% 10/1/20 (a)(b) | 7,282,000 | 7,295,895 | |
| 3 month U.S. LIBOR + 0.440% 3.0318% 10/1/21 (a)(b) | 8,940,000 | 8,974,982 | |
| 3.7% 4/15/24 | 1,715,000 | 1,790,279 | |
| Discovery Communications LLC: | |||
| 3 month U.S. LIBOR + 0.710% 3.3426% 9/20/19 (a)(b) | 3,399,000 | 3,403,922 | |
| 2.2% 9/20/19 | 565,000 | 563,780 | |
| Fox Corp.: | |||
| 3.666% 1/25/22 (c) | 260,000 | 266,604 | |
| 4.03% 1/25/24 (c) | 305,000 | 319,510 | |
| Interpublic Group of Companies, Inc. 3.5% 10/1/20 | 295,000 | 298,090 | |
| Omnicom Group, Inc.: | |||
| 4.45% 8/15/20 | 735,000 | 751,014 | |
| 6.25% 7/15/19 | 1,350,000 | 1,355,310 | |
| RELX Capital, Inc. 3.5% 3/16/23 | 575,000 | 590,705 | |
| 29,550,108 | |||
| Wireless Telecommunication Services - 0.0% | |||
| America Movil S.A.B. de CV 5% 3/30/20 | 448,000 | 457,520 | |
| Axiata SPV2 Bhd 3.466% 11/19/20 (Reg. S) | 660,000 | 665,400 | |
| Vodafone Group PLC 3.75% 1/16/24 | 650,000 | 666,754 | |
| 1,789,674 | |||
| TOTAL COMMUNICATION SERVICES | 104,979,552 | ||
| CONSUMER DISCRETIONARY - 1.6% | |||
| Automobiles - 1.3% | |||
| American Honda Finance Corp.: | |||
| 3 month U.S. LIBOR + 0.150% 2.6719% 2/21/20 (a)(b) | 5,000,000 | 5,003,900 | |
| 3 month U.S. LIBOR + 0.260% 2.8746% 6/16/20 (a)(b) | 5,000,000 | 5,006,584 | |
| 3 month U.S. LIBOR + 0.290% 2.8906% 12/10/21 (a)(b) | 5,000,000 | 4,989,576 | |
| 3.15% 1/8/21 | 1,745,000 | 1,766,020 | |
| BMW U.S. Capital LLC: | |||
| 3 month U.S. LIBOR + 0.380% 2.9686% 4/6/20 (a)(b)(c) | 7,796,000 | 7,813,338 | |
| 3 month U.S. LIBOR + 0.410% 3.0135% 4/12/21 (a)(b)(c) | 11,110,000 | 11,105,556 | |
| 3 month U.S. LIBOR + 0.500% 3.0353% 8/13/21 (a)(b)(c) | 830,000 | 832,318 | |
| Daimler Finance North America LLC: | |||
| 3 month U.S. LIBOR + 0.530% 3.0951% 5/5/20 (a)(b)(c) | 9,640,000 | 9,659,955 | |
| 3 month U.S. LIBOR + 0.620% 3.2028% 10/30/19 (a)(b)(c) | 5,000,000 | 5,008,158 | |
| 3 month U.S. LIBOR + 0.630% 3.2186% 1/6/20 (a)(b)(c) | 10,000,000 | 10,020,128 | |
| 2.2% 5/5/20 (c) | 1,420,000 | 1,413,084 | |
| 2.3% 2/12/21 (c) | 1,745,000 | 1,731,570 | |
| 3.1% 5/4/20 (c) | 765,000 | 767,244 | |
| 3.75% 11/5/21 (c) | 325,000 | 331,749 | |
| General Motors Financial Co., Inc.: | |||
| 3 month U.S. LIBOR + 0.850% 3.4421% 4/9/21 (a)(b) | 5,628,000 | 5,626,652 | |
| 3 month U.S. LIBOR + 0.930% 3.5268% 4/13/20 (a)(b) | 11,000,000 | 11,038,456 | |
| 3 month U.S. LIBOR + 1.270% 3.8724% 10/4/19 (a)(b) | 5,000,000 | 5,014,350 | |
| 3.2% 7/13/20 | 1,570,000 | 1,574,592 | |
| Harley-Davidson Financial Services, Inc.: | |||
| 3 month U.S. LIBOR + 0.500% 3.0219% 5/21/20 (a)(b)(c) | 795,000 | 795,051 | |
| 3 month U.S. LIBOR + 0.940% 3.5551% 3/2/21 (a)(b)(c) | 995,000 | 995,830 | |
| 4.05% 2/4/22 (c) | 930,000 | 958,266 | |
| Nissan Motor Acceptance Corp.: | |||
| 2.15% 9/28/20 (c) | 450,000 | 445,958 | |
| 3.65% 9/21/21 (c) | 580,000 | 588,947 | |
| Volkswagen Group of America Finance LLC 3.875% 11/13/20 (c) | 980,000 | 996,168 | |
| 93,483,450 | |||
| Diversified Consumer Services - 0.0% | |||
| ERAC U.S.A. Finance LLC 2.35% 10/15/19 (c) | 225,000 | 224,684 | |
| Hotels, Restaurants & Leisure - 0.0% | |||
| GLP Capital LP/GLP Financing II, Inc. 4.875% 11/1/20 | 935,000 | 948,922 | |
| McDonald's Corp. 3.35% 4/1/23 | 645,000 | 663,814 | |
| Royal Caribbean Cruises Ltd. 2.65% 11/28/20 | 250,000 | 250,092 | |
| Starbucks Corp. 2.7% 6/15/22 | 435,000 | 435,870 | |
| 2,298,698 | |||
| Household Durables - 0.0% | |||
| D.R. Horton, Inc. 2.55% 12/1/20 | 495,000 | 492,605 | |
| Internet & Direct Marketing Retail - 0.1% | |||
| Alibaba Group Holding Ltd. 2.5% 11/28/19 | 1,965,000 | 1,963,232 | |
| eBay, Inc. 2.15% 6/5/20 | 805,000 | 801,111 | |
| Expedia, Inc. 5.95% 8/15/20 | 335,000 | 347,265 | |
| JD.com, Inc. 3.125% 4/29/21 | 1,775,000 | 1,768,956 | |
| 4,880,564 | |||
| Multiline Retail - 0.0% | |||
| Dollar Tree, Inc. 3 month U.S. LIBOR + 0.700% 3.288% 4/17/20 (a)(b) | 1,250,000 | 1,250,128 | |
| Specialty Retail - 0.2% | |||
| Nissan Motor Acceptance Corp. 1.55% 9/13/19 (c) | 725,000 | 722,126 | |
| O'Reilly Automotive, Inc. 3.8% 9/1/22 | 385,000 | 396,406 | |
| The Home Depot, Inc. 3 month U.S. LIBOR + 0.310% 2.9361% 3/1/22 (a)(b) | 10,000,000 | 10,016,313 | |
| 11,134,845 | |||
| Textiles, Apparel & Luxury Goods - 0.0% | |||
| Invista Finance LLC 4.25% 10/15/19 (c) | 2,005,000 | 2,009,647 | |
| TOTAL CONSUMER DISCRETIONARY | 115,774,621 | ||
| CONSUMER STAPLES - 1.3% | |||
| Beverages - 0.3% | |||
| Anheuser-Busch InBev Finance, Inc. 2.65% 2/1/21 | 3,000,000 | 3,004,542 | |
| Constellation Brands, Inc. 3 month U.S. LIBOR + 0.700% 3.218% 11/15/21 (a)(b) | 5,000,000 | 5,000,800 | |
| Diageo Capital PLC 3 month U.S. LIBOR + 0.240% 2.7596% 5/18/20 (a)(b) | 12,795,000 | 12,800,648 | |
| Maple Escrow Subsidiary, Inc. 3.551% 5/25/21 (c) | 940,000 | 954,543 | |
| Molson Coors Brewing Co. 2.25% 3/15/20 | 910,000 | 906,748 | |
| Pernod Ricard SA 4.45% 1/15/22 (c) | 1,155,000 | 1,203,389 | |
| 23,870,670 | |||
| Food & Staples Retailing - 0.0% | |||
| Alimentation Couche-Tard, Inc. 3 month U.S. LIBOR + 0.500% 3.1083% 12/13/19 (a)(b)(c) | 1,845,000 | 1,844,899 | |
| Kroger Co. 1.5% 9/30/19 | 576,000 | 573,746 | |
| 2,418,645 | |||
| Food Products - 0.3% | |||
| Bunge Ltd. Finance Corp.: | |||
| 3% 9/25/22 | 405,000 | 406,398 | |
| 3.5% 11/24/20 | 2,385,000 | 2,409,178 | |
| Campbell Soup Co.: | |||
| 3 month U.S. LIBOR + 0.500% 3.1146% 3/16/20 (a)(b) | 1,005,000 | 1,003,983 | |
| 3 month U.S. LIBOR + 0.630% 3.2409% 3/15/21 (a)(b) | 1,005,000 | 1,002,745 | |
| Conagra Brands, Inc. 3 month U.S. LIBOR + 0.750% 3.3415% 10/22/20 (a)(b) | 5,641,000 | 5,642,783 | |
| Danone SA 1.691% 10/30/19 (c) | 2,430,000 | 2,420,556 | |
| General Mills, Inc. 3 month U.S. LIBOR + 0.540% 3.141% 4/16/21 (a)(b) | 7,164,000 | 7,163,857 | |
| Tyson Foods, Inc. 2.25% 8/23/21 | 600,000 | 594,613 | |
| 20,644,113 | |||
| Tobacco - 0.7% | |||
| Altria Group, Inc.: | |||
| 3.49% 2/14/22 | 2,517,000 | 2,562,646 | |
| 3.8% 2/14/24 | 1,300,000 | 1,335,979 | |
| 4.75% 5/5/21 | 4,386,000 | 4,552,429 | |
| BAT Capital Corp.: | |||
| 3 month U.S. LIBOR + 0.590% 3.1179% 8/14/20 (a)(b) | 6,600,000 | 6,606,781 | |
| 2.297% 8/14/20 | 2,575,000 | 2,562,633 | |
| 2.764% 8/15/22 | 1,230,000 | 1,219,842 | |
| Imperial Tobacco Finance PLC 2.95% 7/21/20 (c) | 15,940,000 | 15,955,767 | |
| Philip Morris International, Inc. 1.875% 11/1/19 | 10,000,000 | 9,971,176 | |
| Reynolds American, Inc.: | |||
| 3.25% 6/12/20 | 310,000 | 311,515 | |
| 8.125% 6/23/19 | 360,000 | 361,105 | |
| 45,439,873 | |||
| TOTAL CONSUMER STAPLES | 92,373,301 | ||
| ENERGY - 1.0% | |||
| Energy Equipment & Services - 0.0% | |||
| Schlumberger Holdings Corp. 3.75% 5/1/24 (c) | 620,000 | 638,375 | |
| Oil, Gas & Consumable Fuels - 1.0% | |||
| BP Capital Markets PLC 3 month U.S. LIBOR + 0.250% 2.7748% 11/24/20 (a)(b) | 10,000,000 | 10,004,700 | |
| Cenovus Energy, Inc.: | |||
| 3% 8/15/22 | 1,100,000 | 1,095,069 | |
| 5.7% 10/15/19 | 1,273,077 | 1,284,585 | |
| Chevron Corp. 3 month U.S. LIBOR + 0.480% 3.0951% 3/3/22 (a)(b) | 4,700,000 | 4,722,893 | |
| China Shenhua Overseas Capital Co. Ltd. 3.125% 1/20/20 (Reg. S) | 1,740,000 | 1,740,215 | |
| Columbia Pipeline Group, Inc. 3.3% 6/1/20 | 1,135,000 | 1,140,764 | |
| Energy Transfer Partners LP 4.25% 3/15/23 | 615,000 | 632,753 | |
| Eni SpA 4% 9/12/23 (c) | 390,000 | 401,884 | |
| Enterprise Products Operating LP: | |||
| 2.8% 2/15/21 | 1,020,000 | 1,022,410 | |
| 2.85% 4/15/21 | 3,000,000 | 3,013,128 | |
| 3.5% 2/1/22 | 1,050,000 | 1,071,741 | |
| Marathon Oil Corp. 2.7% 6/1/20 | 1,090,000 | 1,088,074 | |
| Petroleos Mexicanos: | |||
| 5.5% 1/21/21 | 155,000 | 159,263 | |
| 6.375% 2/4/21 | 866,000 | 900,203 | |
| Phillips 66 Co. 3 month U.S. LIBOR + 0.600% 3.1206% 2/26/21 (a)(b) | 5,033,000 | 5,033,127 | |
| Plains All American Pipeline LP/PAA Finance Corp.: | |||
| 2.6% 12/15/19 | 360,000 | 359,267 | |
| 5% 2/1/21 | 455,000 | 468,888 | |
| 5.75% 1/15/20 | 440,000 | 447,362 | |
| Sabine Pass Liquefaction LLC 5.625% 2/1/21 (a) | 2,690,000 | 2,790,723 | |
| Saudi Arabian Oil Co. 2.75% 4/16/22 (c) | 1,815,000 | 1,808,285 | |
| Shell International Finance BV: | |||
| 3 month U.S. LIBOR + 0.350% 2.9466% 9/12/19 (a)(b) | 10,000,000 | 10,009,460 | |
| 2.125% 5/11/20 | 5,000,000 | 4,985,671 | |
| TransCanada PipeLines Ltd. 3 month U.S. LIBOR + 0.275% 2.793% 11/15/19 (a)(b) | 15,040,000 | 15,050,164 | |
| Williams Partners LP: | |||
| 3.35% 8/15/22 | 200,000 | 203,082 | |
| 5.25% 3/15/20 | 2,630,000 | 2,681,176 | |
| 72,114,887 | |||
| TOTAL ENERGY | 72,753,262 | ||
| FINANCIALS - 14.2% | |||
| Banks - 9.4% | |||
| Abbey National PLC 2.125% 11/3/20 | 570,000 | 565,195 | |
| ABN AMRO Bank NV: | |||
| 3 month U.S. LIBOR + 0.410% 3.0015% 1/19/21 (a)(b)(c) | 10,000,000 | 10,012,800 | |
| 3 month U.S. LIBOR + 0.570% 3.0906% 8/27/21 (a)(b)(c) | 9,413,000 | 9,444,797 | |
| ANZ Banking Group Ltd. 3 month U.S. LIBOR + 0.500% 3.0196% 8/19/20 (a)(b)(c) | 7,000,000 | 7,026,845 | |
| ANZ National International Ltd. 2.2% 7/17/20 (c) | 825,000 | 822,429 | |
| Banco de Credito del Peru 2.25% 10/25/19 (c) | 280,000 | 278,600 | |
| Banco Santander Chile Mtn Rgs 2.5% 12/15/20 (c) | 1,745,000 | 1,747,181 | |
| Banco Santander SA 3 month U.S. LIBOR + 1.120% 3.7235% 4/12/23 (a)(b) | 800,000 | 794,933 | |
| Bank of America Corp.: | |||
| 3 month U.S. LIBOR + 0.380% 2.9715% 1/23/22 (a)(b) | 15,000,000 | 14,886,000 | |
| 3 month U.S. LIBOR + 0.650% 3.2418% 10/1/21 (a)(b) | 10,000,000 | 10,029,364 | |
| 3 month U.S. LIBOR + 0.650% 3.2515% 6/25/22 (a)(b) | 20,000,000 | 20,047,247 | |
| 2.503% 10/21/22 | 1,475,000 | 1,466,920 | |
| 2.625% 4/19/21 | 715,000 | 716,954 | |
| 2.738% 1/23/22 (a) | 830,000 | 830,317 | |
| 3.3% 1/11/23 | 1,445,000 | 1,469,611 | |
| Bank of America NA 3 month U.S. LIBOR + 0.250% 2.7706% 8/28/20 (a)(b) | 10,000,000 | 10,002,461 | |
| Bank of Montreal: | |||
| 3 month U.S. LIBOR + 0.440% 3.0509% 6/15/20 (a)(b) | 11,600,000 | 11,642,669 | |
| 3 month U.S. LIBOR + 0.460% 3.0568% 4/13/21 (a)(b) | 960,000 | 963,861 | |
| 3 month U.S. LIBOR + 0.570% 3.1799% 3/26/22 (a)(b) | 5,000,000 | 5,015,639 | |
| 3 month U.S. LIBOR + 0.600% 3.1966% 12/12/19 (a)(b) | 5,000,000 | 5,017,289 | |
| Bank of Nova Scotia 3 month U.S. LIBOR + 0.290% 2.8786% 1/8/21 (a)(b) | 10,000,000 | 10,010,913 | |
| Banque Federative du Credit Mutuel SA: | |||
| 3 month U.S. LIBOR + 0.490% 3.0815% 7/20/20 (a)(b)(c) | 15,000,000 | 15,043,309 | |
| 2.2% 7/20/20 (c) | 940,000 | 936,283 | |
| Barclays Bank PLC: | |||
| 3 month U.S. LIBOR + 0.460% 3.0413% 1/11/21 (a)(b) | 11,000,000 | 10,949,112 | |
| 3 month U.S. LIBOR + 0.650% 3.2151% 8/7/20 (a)(b) | 15,000,000 | 15,009,983 | |
| 2.65% 1/11/21 | 905,000 | 902,970 | |
| Barclays PLC: | |||
| 3 month U.S. LIBOR + 1.625% 4.209% 1/10/23 (a)(b) | 645,000 | 647,326 | |
| 2.75% 11/8/19 | 1,465,000 | 1,462,923 | |
| BB&T Corp. 2.15% 2/1/21 | 1,160,000 | 1,153,097 | |
| BPCE SA: | |||
| 3 month U.S. LIBOR + 1.220% 3.7434% 5/22/22 (a)(b)(c) | 605,000 | 609,689 | |
| 3.145% 7/31/20 (c) | 5,000,000 | 5,033,540 | |
| Branch Banking & Trust Co. 3 month U.S. LIBOR + 0.450% 3.0468% 1/15/20 (a)(b) | 5,000,000 | 5,009,652 | |
| Capital One NA 3 month U.S. LIBOR + 0.765% 3.3733% 9/13/19 (a)(b) | 15,000,000 | 15,017,692 | |
| Citibank NA: | |||
| 3 month U.S. LIBOR + 0.300% 2.8915% 10/20/20 (a)(b) | 4,500,000 | 4,505,385 | |
| 3 month U.S. LIBOR + 0.600% 3.1234% 5/20/22 (a)(b) | 5,000,000 | 5,002,045 | |
| 1.85% 9/18/19 | 7,000,000 | 6,985,678 | |
| Citigroup, Inc.: | |||
| 3 month U.S. LIBOR + 0.790% 3.374% 1/10/20 (a)(b) | 5,905,000 | 5,925,483 | |
| 3 month U.S. LIBOR + 0.930% 3.5366% 6/7/19 (a)(b) | 20,000,000 | 20,001,500 | |
| 2.7% 3/30/21 | 130,000 | 130,119 | |
| 2.9% 12/8/21 | 1,495,000 | 1,500,314 | |
| Citizens Bank NA: | |||
| 3 month U.S. LIBOR + 0.540% 3.1551% 3/2/20 (a)(b) | 15,000,000 | 15,021,223 | |
| 3 month U.S. LIBOR + 0.570% 3.0906% 5/26/20 (a)(b) | 10,000,000 | 10,025,140 | |
| 2.25% 3/2/20 | 685,000 | 683,032 | |
| 2.55% 5/13/21 | 520,000 | 518,417 | |
| Compass Bank 3 month U.S. LIBOR + 0.730% 3.3306% 6/11/21 (a)(b) | 10,450,000 | 10,430,433 | |
| Credit Agricole SA: | |||
| 3 month U.S. LIBOR + 0.970% 3.5706% 6/10/20 (a)(b)(c) | 13,280,000 | 13,375,882 | |
| 3 month U.S. LIBOR + 1.020% 3.6011% 4/24/23 (a)(b)(c) | 675,000 | 671,866 | |
| Credit Suisse Group Funding Guernsey Ltd. 2.75% 3/26/20 | 635,000 | 634,933 | |
| Credit Suisse New York Branch 5.4% 1/14/20 | 315,000 | 319,861 | |
| Danske Bank A/S 2.2% 3/2/20 (c) | 1,545,000 | 1,538,335 | |
| Discover Bank 7% 4/15/20 | 2,025,000 | 2,096,139 | |
| First Niagara Financial Group, Inc. 7.25% 12/15/21 | 515,000 | 570,273 | |
| HSBC Holdings PLC: | |||
| 3 month U.S. LIBOR + 0.600% 3.1196% 5/18/21 (a)(b) | 6,165,000 | 6,168,134 | |
| 3 month U.S. LIBOR + 0.650% 3.2466% 9/11/21 (a)(b) | 5,675,000 | 5,683,526 | |
| HSBC U.S.A., Inc.: | |||
| 3 month U.S. LIBOR + 0.610% 3.1453% 11/13/19 (a)(b) | 15,000,000 | 15,033,691 | |
| 2.35% 3/5/20 | 995,000 | 992,396 | |
| Huntington National Bank 3 month U.S. LIBOR + 0.510% 3.1106% 3/10/20 (a)(b) | 9,027,000 | 9,052,280 | |
| ING Bank NV 3 month U.S. LIBOR + 0.690% 3.2818% 10/1/19 (a)(b)(c) | 5,000,000 | 5,011,379 | |
| ING Groep NV 3 month U.S. LIBOR + 1.150% 3.751% 3/29/22 (a)(b) | 735,000 | 744,498 | |
| JP Morgan Chase Bank NA: | |||
| 3 month U.S. LIBOR + 0.230% 2.8561% 9/1/20 (a)(b) | 10,000,000 | 9,998,810 | |
| 3 month U.S. LIBOR + 0.590% 3.1915% 9/23/19 (a)(b) | 10,000,000 | 10,013,836 | |
| U.S. SOFR SEC OVRN FIN RATE INDX + 0.550% 2.95% 10/19/20 (a)(b) | 5,000,000 | 5,004,596 | |
| JPMorgan Chase & Co.: | |||
| 3 month U.S. LIBOR + 0.550% 3.1506% 3/9/21 (a)(b) | 1,485,000 | 1,487,530 | |
| 3 month U.S. LIBOR + 0.680% 3.3061% 6/1/21 (a)(b) | 4,000,000 | 4,015,540 | |
| 3 month U.S. LIBOR + 0.955% 3.5465% 1/23/20 (a)(b) | 7,111,000 | 7,152,029 | |
| 3 month U.S. LIBOR + 1.100% 3.7066% 6/7/21 (a)(b) | 11,083,000 | 11,228,071 | |
| 4.25% 10/15/20 | 390,000 | 398,909 | |
| 4.4% 7/22/20 | 235,000 | 240,115 | |
| 4.95% 3/25/20 | 315,000 | 321,067 | |
| KeyBank NA 3 month U.S. LIBOR + 0.660% 3.239% 2/1/22 (a)(b) | 8,128,000 | 8,158,436 | |
| Lloyds Bank PLC 3 month U.S. LIBOR + 0.490% 3.0551% 5/7/21 (a)(b) | 9,000,000 | 8,995,609 | |
| Manufacturers & Traders Trust Co. 3 month U.S. LIBOR + 0.270% 2.8503% 1/25/21 (a)(b) | 10,000,000 | 9,979,334 | |
| Mitsubishi UFJ Financial Group, Inc.: | |||
| 3 month U.S. LIBOR + 0.650% 3.2364% 7/26/21 (a)(b) | 6,926,000 | 6,951,680 | |
| 3 month U.S. LIBOR + 0.700% 3.3066% 3/7/22 (a)(b) | 10,000,000 | 10,034,408 | |
| 3 month U.S. LIBOR + 0.860% 3.4464% 7/26/23 (a)(b) | 665,000 | 666,960 | |
| 3 month U.S. LIBOR + 0.920% 3.4434% 2/22/22 (a)(b) | 840,000 | 846,437 | |
| 3.218% 3/7/22 | 1,090,000 | 1,108,408 | |
| Mizuho Financial Group, Inc. 3 month U.S. LIBOR + 1.140% 3.7483% 9/13/21 (a)(b) | 17,000,000 | 17,216,109 | |
| Nordea Bank AB 3 month U.S. LIBOR + 0.470% 2.9949% 5/29/20 (a)(b)(c) | 12,000,000 | 12,042,259 | |
| PNC Bank NA: | |||
| 3 month U.S. LIBOR + 0.350% 2.9466% 3/12/21 (a)(b) | 7,000,000 | 7,003,453 | |
| 3 month U.S. LIBOR + 0.360% 2.8796% 5/19/20 (a)(b) | 10,000,000 | 10,020,192 | |
| Rabobank (Netherlands) NV 3.95% 11/9/22 | 1,370,000 | 1,406,350 | |
| Rabobank Nederland New York Branch: | |||
| 3 month U.S. LIBOR + 0.430% 3.0164% 4/26/21 (a)(b) | 12,500,000 | 12,536,381 | |
| 3 month U.S. LIBOR + 0.830% 3.414% 1/10/22 (a)(b) | 5,000,000 | 5,056,017 | |
| Regions Bank: | |||
| 3 month U.S. LIBOR + 0.380% 2.9718% 4/1/21 (a)(b) | 11,385,000 | 11,349,818 | |
| 3 month U.S. LIBOR + 0.500% 3.0353% 8/13/21 (a)(b) | 8,000,000 | 7,986,664 | |
| Royal Bank of Canada: | |||
| 3 month U.S. LIBOR + 0.300% 2.8915% 7/22/20 (a)(b) | 5,000,000 | 5,011,457 | |
| 3 month U.S. LIBOR + 0.380% 2.9951% 3/2/20 (a)(b) | 10,000,000 | 10,020,434 | |
| 3 month U.S. LIBOR + 0.400% 2.9803% 1/25/21 (a)(b) | 5,000,000 | 5,012,868 | |
| Royal Bank of Scotland Group PLC 6.4% 10/21/19 | 295,000 | 298,858 | |
| Santander UK Group Holdings PLC 2.875% 10/16/20 | 820,000 | 818,223 | |
| Standard Chartered PLC: | |||
| 3 month U.S. LIBOR + 1.150% 3.7415% 1/20/23 (a)(b)(c) | 910,000 | 908,295 | |
| 2.1% 8/19/19 (c) | 390,000 | 389,413 | |
| 2.4% 9/8/19 (c) | 245,000 | 244,600 | |
| Sumitomo Mitsui Banking Corp.: | |||
| 3 month U.S. LIBOR + 0.350% 2.938% 1/17/20 (a)(b) | 17,048,000 | 17,080,162 | |
| 3 month U.S. LIBOR + 0.370% 2.971% 10/16/20 (a)(b) | 5,000,000 | 5,004,038 | |
| Sumitomo Mitsui Financial Group, Inc. 3 month U.S. LIBOR + 1.680% 4.2806% 3/9/21 (a)(b) | 3,000,000 | 3,065,524 | |
| SunTrust Bank: | |||
| 3 month U.S. LIBOR + 0.500% 3.0864% 10/26/21 (a)(b) | 5,000,000 | 5,005,315 | |
| 3 month U.S. LIBOR + 0.530% 3.1128% 1/31/20 (a)(b) | 10,000,000 | 10,022,677 | |
| Svenska Handelsbanken AB 3 month U.S. LIBOR + 0.470% 2.9948% 5/24/21 (a)(b) | 5,000,000 | 5,019,282 | |
| Swedbank AB 2.65% 3/10/21 (c) | 1,020,000 | 1,013,311 | |
| The Toronto-Dominion Bank: | |||
| 3 month U.S. LIBOR + 0.240% 2.8203% 1/25/21 (a)(b) | 11,565,000 | 11,570,954 | |
| 3 month U.S. LIBOR + 0.260% 2.8746% 9/17/20 (a)(b) | 5,000,000 | 5,016,577 | |
| 3 month U.S. LIBOR + 0.650% 3.1853% 8/13/19 (a)(b) | 10,000,000 | 10,012,056 | |
| U.S. Bancorp 3% 3/15/22 | 1,530,000 | 1,551,132 | |
| U.S. Bank NA: | |||
| 3 month U.S. LIBOR + 0.250% 2.8311% 7/24/20 (a)(b) | 5,000,000 | 5,009,188 | |
| 3% 2/4/21 | 5,000,000 | 5,047,647 | |
| Wells Fargo & Co.: | |||
| 3 month U.S. LIBOR + 0.880% 3.4715% 7/22/20 (a)(b) | 14,900,000 | 14,972,563 | |
| 2.55% 12/7/20 | 95,000 | 95,047 | |
| Wells Fargo Bank NA: | |||
| 3 month U.S. LIBOR + 0.230% 2.8268% 1/15/20 (a)(b) | 10,000,000 | 10,012,192 | |
| 3 month U.S. LIBOR + 0.500% 3.0915% 7/23/21 (a)(b) | 5,000,000 | 5,006,300 | |
| U.S. SOFR SEC OVRN FIN RATE INDX + 0.480% 2.88% 3/25/20 (a)(b) | 5,000,000 | 4,988,500 | |
| 3.325% 7/23/21 (a) | 1,935,000 | 1,949,424 | |
| Westpac Banking Corp. 3 month U.S. LIBOR + 0.560% 3.0796% 8/19/19 (a)(b) | 9,250,000 | 9,260,552 | |
| 671,815,170 | |||
| Capital Markets - 1.8% | |||
| Bank New York Mellon Corp.: | |||
| 3 month U.S. LIBOR + 0.280% 2.8003% 6/4/21 (a)(b) | 5,000,000 | 4,999,998 | |
| 3 month U.S. LIBOR + 0.300% 2.9151% 12/4/20 (a)(b) | 7,000,000 | 7,005,270 | |
| Cboe Global Markets, Inc. 1.95% 6/28/19 | 620,000 | 619,671 | |
| Charles Schwab Corp. 3 month U.S. LIBOR + 0.320% 2.8419% 5/21/21 (a)(b) | 990,000 | 990,209 | |
| Deutsche Bank AG New York Branch: | |||
| 3 month U.S. LIBOR + 0.815% 3.4065% 1/22/21 (a)(b) | 10,000,000 | 9,862,897 | |
| 3 month U.S. LIBOR + 1.290% 3.8551% 2/4/21 (a)(b) | 860,000 | 853,646 | |
| Goldman Sachs Group, Inc.: | |||
| 3 month U.S. LIBOR + 0.800% 3.4083% 12/13/19 (a)(b) | 15,000,000 | 15,048,807 | |
| 3 month U.S. LIBOR + 1.200% 3.8109% 9/15/20 (a)(b) | 4,670,000 | 4,708,201 | |
| 3 month U.S. LIBOR + 1.360% 3.9403% 4/23/21 (a)(b) | 10,000,000 | 10,164,546 | |
| 2.3% 12/13/19 | 810,000 | 808,612 | |
| 2.75% 9/15/20 | 220,000 | 220,392 | |
| 2.876% 10/31/22 (a) | 520,000 | 519,439 | |
| 3% 4/26/22 | 1,140,000 | 1,143,626 | |
| 5.375% 3/15/20 | 395,000 | 403,110 | |
| 5.75% 1/24/22 | 780,000 | 838,521 | |
| 6% 6/15/20 | 120,000 | 124,065 | |
| Legg Mason, Inc. 2.7% 7/15/19 | 185,000 | 184,493 | |
| Morgan Stanley: | |||
| 3 month U.S. LIBOR + 0.550% 3.0951% 2/10/21 (a)(b) | 27,000,000 | 27,029,420 | |
| 3 month U.S. LIBOR + 0.740% 3.3315% 7/23/19 (a)(b) | 5,000,000 | 5,004,922 | |
| 2.625% 11/17/21 | 1,225,000 | 1,218,455 | |
| 5.5% 1/26/20 | 300,000 | 305,371 | |
| 5.5% 7/24/20 | 670,000 | 690,865 | |
| TD Ameritrade Holding Corp. 3 month U.S. LIBOR + 0.430% 3.009% 11/1/21 (a)(b) | 5,500,000 | 5,512,416 | |
| UBS AG London Branch 3 month U.S. LIBOR + 0.580% 3.1745% 6/8/20 (a)(b)(c) | 23,790,000 | 23,873,741 | |
| UBS AG Stamford Branch 3 month U.S. LIBOR + 0.640% 3.1679% 8/14/19 (a)(b) | 4,329,000 | 4,333,242 | |
| UBS Group Funding AG 3 month U.S. LIBOR + 1.220% 3.7435% 5/23/23 (a)(b)(c) | 880,000 | 887,515 | |
| UBS Group Funding Ltd. 3% 4/15/21 (c) | 1,495,000 | 1,500,249 | |
| 128,851,699 | |||
| Consumer Finance - 1.6% | |||
| AerCap Ireland Capital Ltd./AerCap Global Aviation Trust: | |||
| 3.95% 2/1/22 | 1,070,000 | 1,090,356 | |
| 4.45% 12/16/21 | 920,000 | 948,740 | |
| 4.625% 10/30/20 | 635,000 | 650,045 | |
| American Express Co.: | |||
| 3 month U.S. LIBOR + 0.600% 3.1651% 11/5/21 (a)(b) | 6,750,000 | 6,781,191 | |
| 3% 2/22/21 | 6,095,000 | 6,125,475 | |
| American Express Credit Corp.: | |||
| 3 month U.S. LIBOR + 0.430% 3.0451% 3/3/20 (a)(b) | 15,000,000 | 15,029,184 | |
| 2.375% 5/26/20 | 230,000 | 229,573 | |
| Aviation Capital Group LLC: | |||
| 3 month U.S. LIBOR + 0.670% 3.2528% 7/30/21 (a)(b)(c) | 1,427,000 | 1,423,418 | |
| 3 month U.S. LIBOR + 0.950% 3.5761% 6/1/21 (a)(b)(c) | 4,307,000 | 4,320,408 | |
| Capital One Bank U.S.A. NA 8.8% 7/15/19 | 615,000 | 619,139 | |
| Capital One Financial Corp.: | |||
| 3 month U.S. LIBOR + 0.760% 3.2953% 5/12/20 (a)(b) | 10,000,000 | 10,039,860 | |
| 2.4% 10/30/20 | 615,000 | 613,726 | |
| 2.5% 5/12/20 | 360,000 | 359,338 | |
| 3.9% 1/29/24 | 505,000 | 524,295 | |
| Caterpillar Financial Services Corp. 3 month U.S. LIBOR + 0.510% 3.094% 1/10/20 (a)(b) | 5,000,000 | 5,013,329 | |
| Ford Motor Credit Co. LLC: | |||
| 3 month U.S. LIBOR + 0.930% 3.5315% 9/24/20 (a)(b) | 1,855,000 | 1,854,768 | |
| 3 month U.S. LIBOR + 1.000% 3.5921% 1/9/20 (a)(b) | 8,835,000 | 8,846,724 | |
| 2.343% 11/2/20 | 660,000 | 652,014 | |
| 2.459% 3/27/20 | 510,000 | 507,853 | |
| 2.681% 1/9/20 | 1,730,000 | 1,727,262 | |
| 3.157% 8/4/20 | 815,000 | 814,103 | |
| 3.47% 4/5/21 | 415,000 | 414,129 | |
| Hyundai Capital America: | |||
| 1.75% 9/27/19 (c) | 545,000 | 543,063 | |
| 2% 7/1/19 (c) | 1,035,000 | 1,034,381 | |
| John Deere Capital Corp.: | |||
| 3 month U.S. LIBOR + 0.160% 2.7486% 1/8/21 (a)(b) | 8,720,000 | 8,707,749 | |
| 3 month U.S. LIBOR + 0.170% 2.7621% 10/9/20 (a)(b) | 5,000,000 | 5,001,214 | |
| 3 month U.S. LIBOR + 0.240% 2.8366% 3/12/21 (a)(b) | 5,000,000 | 4,992,085 | |
| 3 month U.S. LIBOR + 0.260% 2.8606% 9/10/21 (a)(b) | 5,000,000 | 4,994,549 | |
| 3 month U.S. LIBOR + 0.420% 3.004% 7/10/20 (a)(b) | 5,000,000 | 5,018,558 | |
| Paccar Financial Corp. 3.1% 5/10/21 | 1,260,000 | 1,276,407 | |
| Synchrony Financial 2.7% 2/3/20 | 3,250,000 | 3,248,460 | |
| Toyota Motor Credit Corp. 3 month U.S. LIBOR + 0.170% 2.7846% 9/18/20 (a)(b) | 10,000,000 | 10,008,710 | |
| 113,410,106 | |||
| Diversified Financial Services - 0.6% | |||
| AIG Global Funding: | |||
| 3 month U.S. LIBOR + 0.460% 3.0615% 6/25/21 (a)(b)(c) | 4,293,000 | 4,291,516 | |
| 3.35% 6/25/21 (c) | 770,000 | 780,071 | |
| Avolon Holdings Funding Ltd.: | |||
| 3.625% 5/1/22 (c) | 1,065,000 | 1,066,054 | |
| 3.95% 7/1/24 (c) | 265,000 | 263,238 | |
| Boral Finance Pty Ltd. 3% 11/1/22 (c) | 135,000 | 134,386 | |
| Brixmor Operating Partnership LP 3.875% 8/15/22 | 170,000 | 173,798 | |
| Broadcom Corp./Broadcom Cayman LP: | |||
| 2.2% 1/15/21 | 225,000 | 222,305 | |
| 2.375% 1/15/20 | 1,640,000 | 1,635,629 | |
| 3% 1/15/22 | 1,540,000 | 1,531,462 | |
| Cigna Corp.: | |||
| 3 month U.S. LIBOR + 0.350% 2.9646% 3/17/20 (a)(b)(c) | 10,000,000 | 10,003,235 | |
| 3 month U.S. LIBOR + 0.650% 3.2646% 9/17/21 (a)(b)(c) | 4,790,000 | 4,791,293 | |
| CNH Industrial Capital LLC: | |||
| 3.375% 7/15/19 | 530,000 | 529,338 | |
| 3.875% 10/15/21 | 1,325,000 | 1,345,524 | |
| 4.375% 11/6/20 | 1,725,000 | 1,751,910 | |
| ENEL Finance International NV: | |||
| 2.875% 5/25/22 (c) | 1,175,000 | 1,162,012 | |
| 4.25% 9/14/23 (c) | 780,000 | 803,883 | |
| GE Capital International Funding Co. 2.342% 11/15/20 | 14,064,000 | 13,924,477 | |
| SMBC Aviation Capital Finance: | |||
| 3.55% 4/15/24 (c) | 325,000 | 331,431 | |
| 4.125% 7/15/23 (c) | 200,000 | 208,092 | |
| 44,949,654 | |||
| Insurance - 0.8% | |||
| ACE INA Holdings, Inc. 2.3% 11/3/20 | 970,000 | 969,458 | |
| AIA Group Ltd. 3 month U.S. LIBOR + 0.520% 3.1526% 9/20/21 (a)(b)(c) | 6,046,000 | 6,040,982 | |
| American International Group, Inc.: | |||
| 4.875% 6/1/22 | 675,000 | 716,362 | |
| 6.4% 12/15/20 | 375,000 | 395,998 | |
| Aon Corp. 5% 9/30/20 | 135,000 | 139,312 | |
| Aon PLC 2.8% 3/15/21 | 1,320,000 | 1,325,510 | |
| CNO Financial Group, Inc. 4.5% 5/30/20 | 620,000 | 628,432 | |
| Lincoln National Corp. 4% 9/1/23 | 270,000 | 284,157 | |
| Marsh & McLennan Companies, Inc.: | |||
| 3 month U.S. LIBOR + 1.200% 3.801% 12/29/21 (a)(b) | 4,546,000 | 4,559,940 | |
| 3.5% 12/29/20 | 3,222,000 | 3,269,336 | |
| 3.875% 3/15/24 | 725,000 | 758,909 | |
| Metropolitan Life Global Funding I: | |||
| 3 month U.S. LIBOR + 0.400% 2.9966% 6/12/20 (a)(b)(c) | 10,000,000 | 10,025,318 | |
| U.S. SOFR SEC OVRN FIN RATE INDX + 0.570% 2.97% 9/7/20 (a)(b)(c) | 5,000,000 | 5,006,580 | |
| 2.5% 12/3/20 (Reg. S) (c) | 3,000,000 | 2,997,291 | |
| New York Life Global Funding: | |||
| 3 month U.S. LIBOR + 0.320% 2.8851% 8/6/21 (a)(b)(c) | 6,177,000 | 6,187,346 | |
| 2.95% 1/28/21 (c) | 3,775,000 | 3,810,742 | |
| Principal Life Global Funding II 2.2% 4/8/20 (c) | 1,000,000 | 997,369 | |
| Protective Life Global Funding 3 month U.S. LIBOR + 0.370% 2.9668% 7/13/20 (a)(b)(c) | 7,000,000 | 7,015,249 | |
| Reinsurance Group of America, Inc.: | |||
| 5% 6/1/21 | 125,000 | 130,557 | |
| 6.45% 11/15/19 | 1,100,000 | 1,117,725 | |
| Trinity Acquisition PLC 3.5% 9/15/21 | 650,000 | 657,812 | |
| 57,034,385 | |||
| Thrifts & Mortgage Finance - 0.0% | |||
| American Airlines 2017-2 Class B Pass Through Trust equipment trust certificate 3.7% 10/15/25 | 701,137 | 693,313 | |
| Crown Castle Towers LLC/Crown Atlantic Holdings Sub LLC/Crown Communication, Inc. 3.72% 7/15/23 (c) | 370,000 | 379,933 | |
| 1,073,246 | |||
| TOTAL FINANCIALS | 1,017,134,260 | ||
| HEALTH CARE - 1.5% | |||
| Biotechnology - 0.1% | |||
| AbbVie, Inc.: | |||
| 2.3% 5/14/21 | 850,000 | 845,375 | |
| 2.9% 11/6/22 | 775,000 | 776,759 | |
| 3.2% 11/6/22 | 170,000 | 171,934 | |
| Baxalta, Inc. 3.6% 6/23/22 | 265,000 | 269,099 | |
| Biogen, Inc. 2.9% 9/15/20 | 510,000 | 511,544 | |
| Celgene Corp.: | |||
| 2.75% 2/15/23 | 605,000 | 606,644 | |
| 2.875% 8/15/20 | 1,203,000 | 1,209,154 | |
| 2.875% 2/19/21 | 1,110,000 | 1,117,500 | |
| 3.25% 2/20/23 | 185,000 | 188,667 | |
| 3.55% 8/15/22 | 600,000 | 617,652 | |
| 3.625% 5/15/24 | 160,000 | 165,932 | |
| 6,480,260 | |||
| Health Care Equipment & Supplies - 0.2% | |||
| Abbott Laboratories 2.9% 11/30/21 | 1,075,000 | 1,085,530 | |
| Becton, Dickinson & Co.: | |||
| 3 month U.S. LIBOR + 0.875% 3.476% 12/29/20 (a)(b) | 8,326,000 | 8,328,225 | |
| 2.404% 6/5/20 | 1,195,000 | 1,190,625 | |
| 2.675% 12/15/19 | 1,785,000 | 1,783,750 | |
| 2.894% 6/6/22 | 675,000 | 677,969 | |
| 3.125% 11/8/21 | 350,000 | 353,007 | |
| Zimmer Biomet Holdings, Inc. 3 month U.S. LIBOR + 0.750% 3.3753% 3/19/21 (a)(b) | 3,220,000 | 3,215,650 | |
| 16,634,756 | |||
| Health Care Providers & Services - 0.6% | |||
| AmerisourceBergen Corp. 3.5% 11/15/21 | 610,000 | 618,709 | |
| Anthem, Inc. 2.5% 11/21/20 | 665,000 | 664,649 | |
| Cigna Corp.: | |||
| 3.4% 9/17/21 (c) | 370,000 | 375,197 | |
| 3.75% 7/15/23 (c) | 660,000 | 677,261 | |
| CVS Health Corp.: | |||
| 3 month U.S. LIBOR + 0.630% 3.2306% 3/9/20 (a)(b) | 620,000 | 621,603 | |
| 3 month U.S. LIBOR + 0.720% 3.3206% 3/9/21 (a)(b) | 6,025,000 | 6,049,337 | |
| 3.125% 3/9/20 | 9,367,000 | 9,400,422 | |
| 3.35% 3/9/21 | 1,835,000 | 1,853,510 | |
| 3.7% 3/9/23 | 860,000 | 879,020 | |
| Elanco Animal Health, Inc.: | |||
| 3.912% 8/27/21 (c) | 630,000 | 643,078 | |
| 4.272% 8/28/23 (c) | 430,000 | 451,413 | |
| Express Scripts Holding Co.: | |||
| 3 month U.S. LIBOR + 0.750% 3.2703% 11/30/20 (a)(b) | 14,225,000 | 14,225,405 | |
| 2.25% 6/15/19 | 160,000 | 159,972 | |
| HCA Holdings, Inc.: | |||
| 4.25% 10/15/19 | 335,000 | 336,330 | |
| 6.5% 2/15/20 | 1,480,000 | 1,514,967 | |
| Humana, Inc.: | |||
| 2.9% 12/15/22 | 160,000 | 160,318 | |
| 3.15% 12/1/22 | 315,000 | 318,272 | |
| 3.85% 10/1/24 | 60,000 | 61,374 | |
| McKesson Corp. 3.65% 11/30/20 | 1,380,000 | 1,400,901 | |
| Medco Health Solutions, Inc. 4.125% 9/15/20 | 710,000 | 722,842 | |
| 41,134,580 | |||
| Pharmaceuticals - 0.6% | |||
| Bayer U.S. Finance II LLC: | |||
| 3 month U.S. LIBOR + 0.630% 3.2315% 6/25/21 (a)(b)(c) | 11,230,000 | 11,136,842 | |
| 3.5% 6/25/21 (c) | 855,000 | 862,224 | |
| Bristol-Myers Squibb Co.: | |||
| 2.55% 5/14/21 (c) | 9,104,000 | 9,149,202 | |
| 2.6% 5/16/22 (c) | 410,000 | 412,900 | |
| 2.9% 7/26/24 (c) | 840,000 | 850,991 | |
| Johnson & Johnson 1.95% 11/10/20 | 460,000 | 458,153 | |
| Perrigo Finance PLC 3.5% 12/15/21 | 400,000 | 396,007 | |
| Shire Acquisitions Investments Ireland DAC: | |||
| 1.9% 9/23/19 | 4,480,000 | 4,466,749 | |
| 2.875% 9/23/23 | 115,000 | 114,238 | |
| Takeda Pharmaceutical Co. Ltd. 3.8% 11/26/20 (c) | 810,000 | 821,974 | |
| Teva Pharmaceutical Finance Netherlands III BV: | |||
| 1.7% 7/19/19 | 2,280,000 | 2,273,502 | |
| 2.2% 7/21/21 | 85,000 | 78,430 | |
| Zoetis, Inc. 3 month U.S. LIBOR + 0.440% 2.9596% 8/20/21 (a)(b) | 10,000,000 | 9,923,399 | |
| 40,944,611 | |||
| TOTAL HEALTH CARE | 105,194,207 | ||
| INDUSTRIALS - 1.0% | |||
| Aerospace & Defense - 0.2% | |||
| General Dynamics Corp.: | |||
| 3 month U.S. LIBOR + 0.290% 2.8253% 5/11/20 (a)(b) | 325,000 | 325,634 | |
| 3 month U.S. LIBOR + 0.380% 2.9153% 5/11/21 (a)(b) | 550,000 | 552,234 | |
| Harris Corp. 2.7% 4/27/20 | 1,090,000 | 1,090,731 | |
| Northrop Grumman Corp. 2.08% 10/15/20 | 1,600,000 | 1,588,875 | |
| United Technologies Corp. 3 month U.S. LIBOR + 0.650% 3.1745% 8/16/21 (a)(b) | 10,750,000 | 10,756,704 | |
| 14,314,178 | |||
| Airlines - 0.1% | |||
| Delta Air Lines, Inc.: | |||
| 2.6% 12/4/20 | 290,000 | 289,128 | |
| 2.875% 3/13/20 | 1,955,000 | 1,954,305 | |
| Southwest Airlines Co. 2.75% 11/6/19 | 140,000 | 139,580 | |
| 2,383,013 | |||
| Commercial Services & Supplies - 0.0% | |||
| Waste Management, Inc. 2.95% 6/15/24 | 400,000 | 405,226 | |
| Industrial Conglomerates - 0.2% | |||
| Honeywell International, Inc. 3 month U.S. LIBOR + 0.280% 2.8628% 10/30/19 (a)(b) | 15,000,000 | 15,017,475 | |
| Roper Technologies, Inc.: | |||
| 3% 12/15/20 | 475,000 | 477,687 | |
| 3.125% 11/15/22 | 535,000 | 542,139 | |
| 3.65% 9/15/23 | 270,000 | 278,197 | |
| 16,315,498 | |||
| Machinery - 0.3% | |||
| Caterpillar Financial Services Corp.: | |||
| 3 month U.S. LIBOR + 0.230% 2.8409% 3/15/21 (a)(b) | 5,000,000 | 4,994,025 | |
| 3 month U.S. LIBOR + 0.250% 2.7706% 8/26/20 (a)(b) | 5,000,000 | 5,002,500 | |
| 3 month U.S. LIBOR + 0.280% 2.8866% 9/7/21 (a)(b) | 6,790,000 | 6,787,543 | |
| 2.95% 2/26/22 | 1,040,000 | 1,053,208 | |
| Westinghouse Air Brake Co. 3 month U.S. LIBOR + 1.050% 3.9109% 9/15/21 (a)(b) | 5,428,000 | 5,427,969 | |
| 23,265,245 | |||
| Professional Services - 0.0% | |||
| Equifax, Inc.: | |||
| 3 month U.S. LIBOR + 0.870% 3.388% 8/15/21 (a)(b) | 610,000 | 608,304 | |
| 2.3% 6/1/21 | 975,000 | 964,373 | |
| 3.6% 8/15/21 | 570,000 | 579,113 | |
| 2,151,790 | |||
| Road & Rail - 0.1% | |||
| Eastern Creation II Investment Holdings Ltd. 2.75% 9/26/20 | 1,380,000 | 1,375,593 | |
| Kansas City Southern 2.35% 5/15/20 | 1,930,000 | 1,921,573 | |
| Penske Truck Leasing Co. LP: | |||
| 2.5% 6/15/19 (c) | 925,000 | 924,647 | |
| 3.2% 7/15/20 (c) | 1,710,000 | 1,719,770 | |
| 3.3% 4/1/21 (c) | 195,000 | 196,922 | |
| 3.65% 7/29/21 (c) | 385,000 | 391,767 | |
| Union Pacific Corp. 3.2% 6/8/21 | 1,205,000 | 1,222,518 | |
| 7,752,790 | |||
| Trading Companies & Distributors - 0.1% | |||
| Air Lease Corp.: | |||
| 2.125% 1/15/20 | 1,285,000 | 1,279,703 | |
| 2.5% 3/1/21 | 275,000 | 274,046 | |
| 3.5% 1/15/22 | 560,000 | 568,468 | |
| GATX Corp.: | |||
| 2.5% 7/30/19 | 660,000 | 659,664 | |
| 2.6% 3/30/20 | 1,445,000 | 1,442,785 | |
| 4,224,666 | |||
| TOTAL INDUSTRIALS | 70,812,406 | ||
| INFORMATION TECHNOLOGY - 0.6% | |||
| Electronic Equipment & Components - 0.1% | |||
| Avnet, Inc. 3.75% 12/1/21 | 530,000 | 538,485 | |
| Jabil, Inc. 5.625% 12/15/20 | 485,000 | 502,572 | |
| Keysight Technologies, Inc. 3.3% 10/30/19 | 3,710,000 | 3,718,327 | |
| Tyco Electronics Group SA 3 month U.S. LIBOR + 0.450% 3.0485% 6/5/20 (a)(b) | 5,261,000 | 5,269,218 | |
| 10,028,602 | |||
| IT Services - 0.2% | |||
| DXC Technology Co.: | |||
| 3 month U.S. LIBOR + 0.950% 3.5761% 3/1/21 (a)(b) | 1,431,000 | 1,431,000 | |
| 2.875% 3/27/20 | 975,000 | 975,939 | |
| Fidelity National Information Services, Inc.: | |||
| 2.25% 8/15/21 | 1,080,000 | 1,071,910 | |
| 3.625% 10/15/20 | 260,000 | 261,438 | |
| IBM Corp.: | |||
| 2.5% 1/27/22 | 460,000 | 459,336 | |
| 2.8% 5/13/21 | 10,000,000 | 10,045,000 | |
| 2.85% 5/13/22 | 725,000 | 730,405 | |
| 2.875% 11/9/22 | 125,000 | 125,926 | |
| 15,100,954 | |||
| Semiconductors & Semiconductor Equipment - 0.1% | |||
| Analog Devices, Inc. 2.85% 3/12/20 | 3,085,000 | 3,089,200 | |
| Microchip Technology, Inc. 3.922% 6/1/21 (c) | 840,000 | 850,659 | |
| NXP BV/NXP Funding LLC: | |||
| 4.125% 6/1/21 (c) | 795,000 | 807,243 | |
| 4.625% 6/1/23 (c) | 625,000 | 649,875 | |
| 5,396,977 | |||
| Technology Hardware, Storage & Peripherals - 0.2% | |||
| Apple, Inc. 3 month U.S. LIBOR + 0.140% 2.7051% 8/2/19 (a)(b) | 10,000,000 | 10,003,283 | |
| Hewlett Packard Enterprise Co. 2.1% 10/4/19 (c) | 595,000 | 593,808 | |
| Xerox Corp. 5.625% 12/15/19 | 1,125,000 | 1,138,050 | |
| 11,735,141 | |||
| TOTAL INFORMATION TECHNOLOGY | 42,261,674 | ||
| MATERIALS - 0.4% | |||
| Chemicals - 0.2% | |||
| Chevron Phillips Chemical Co. LLC / Chevron Phillips Chemical Co. LP 3 month U.S. LIBOR + 0.750% 3.329% 5/1/20 (a)(b)(c) | 7,000,000 | 7,016,472 | |
| CNAC HK Finbridge Co. Ltd.: | |||
| 3% 7/19/20 (Reg. S) | 825,000 | 824,065 | |
| 4.125% 3/14/21 (Reg. S) | 765,000 | 775,985 | |
| DowDuPont, Inc. 3.766% 11/15/20 | 1,105,000 | 1,124,965 | |
| International Flavors & Fragrances, Inc. 3.4% 9/25/20 | 415,000 | 417,997 | |
| LyondellBasell Industries NV 6% 11/15/21 | 615,000 | 656,651 | |
| Sherwin-Williams Co. 2.25% 5/15/20 | 3,195,000 | 3,180,906 | |
| Solvay Finance America LLC 3.4% 12/3/20 (c) | 1,875,000 | 1,889,063 | |
| Syngenta Finance NV: | |||
| 3.698% 4/24/20 (c) | 940,000 | 944,035 | |
| 3.933% 4/23/21 (c) | 735,000 | 744,954 | |
| 17,575,093 | |||
| Construction Materials - 0.1% | |||
| Martin Marietta Materials, Inc.: | |||
| 3 month U.S. LIBOR + 0.500% 3.1326% 12/20/19 (a)(b) | 600,000 | 599,989 | |
| 3 month U.S. LIBOR + 0.650% 3.1734% 5/22/20 (a)(b) | 330,000 | 330,065 | |
| Vulcan Materials Co.: | |||
| 3 month U.S. LIBOR + 0.600% 3.2109% 6/15/20 (a)(b) | 790,000 | 789,780 | |
| 3 month U.S. LIBOR + 0.650% 3.2761% 3/1/21 (a)(b) | 1,620,000 | 1,620,323 | |
| 3,340,157 | |||
| Containers & Packaging - 0.0% | |||
| Packaging Corp. of America 2.45% 12/15/20 | 555,000 | 553,262 | |
| Metals & Mining - 0.1% | |||
| Anglo American Capital PLC: | |||
| 3.75% 4/10/22 (c) | 400,000 | 406,080 | |
| 4.125% 9/27/22 (c) | 624,000 | 641,285 | |
| ArcelorMittal SA: | |||
| 5.25% 8/5/20 (a) | 2,945,000 | 3,018,541 | |
| 5.5% 3/1/21 (a) | 1,290,000 | 1,336,493 | |
| Southern Copper Corp. 5.375% 4/16/20 | 510,000 | 520,381 | |
| Vale Overseas Ltd. 4.375% 1/11/22 | 1,520,000 | 1,551,160 | |
| 7,473,940 | |||
| Paper & Forest Products - 0.0% | |||
| Celulosa Arauco y Constitucion SA 7.25% 7/29/19 | 850,000 | 852,882 | |
| TOTAL MATERIALS | 29,795,334 | ||
| REAL ESTATE - 0.1% | |||
| Equity Real Estate Investment Trusts (REITs) - 0.1% | |||
| American Campus Communities Operating Partnership LP 3.35% 10/1/20 | 1,105,000 | 1,113,619 | |
| Crown Castle International Corp.: | |||
| 2.25% 9/1/21 | 1,195,000 | 1,185,192 | |
| 3.4% 2/15/21 | 860,000 | 868,985 | |
| HCP, Inc. 2.625% 2/1/20 | 130,000 | 129,848 | |
| Highwoods/Forsyth LP 3.625% 1/15/23 | 515,000 | 524,565 | |
| Ventas Realty LP 3.1% 1/15/23 | 180,000 | 181,979 | |
| 4,004,188 | |||
| Real Estate Management & Development - 0.0% | |||
| WEA Finance LLC/Westfield UK & Europe Finance PLC: | |||
| 2.7% 9/17/19 (c) | 1,820,000 | 1,819,353 | |
| 3.25% 10/5/20 (c) | 235,000 | 236,626 | |
| 2,055,979 | |||
| TOTAL REAL ESTATE | 6,060,167 | ||
| UTILITIES - 1.1% | |||
| Electric Utilities - 0.2% | |||
| American Electric Power Co., Inc. 3.65% 12/1/21 | 180,000 | 184,478 | |
| Duke Energy Corp. 3.55% 9/15/21 | 330,000 | 335,483 | |
| Edison International: | |||
| 2.125% 4/15/20 | 1,140,000 | 1,129,133 | |
| 2.4% 9/15/22 | 530,000 | 503,547 | |
| EDP Finance BV: | |||
| 4.125% 1/15/20 (c) | 425,000 | 425,986 | |
| 4.9% 10/1/19 (c) | 775,000 | 779,735 | |
| FirstEnergy Corp. 2.85% 7/15/22 | 885,000 | 887,822 | |
| Florida Power & Light Co. 3 month U.S. LIBOR + 0.400% 2.9651% 5/6/22 (a)(b) | 4,252,000 | 4,253,395 | |
| Mississippi Power Co. 3 month U.S. LIBOR + 0.650% 3.2588% 3/27/20 (a)(b) | 1,770,000 | 1,768,637 | |
| NextEra Energy Capital Holdings, Inc. 3 month U.S. LIBOR + 0.550% 3.0706% 8/28/21 (a)(b) | 1,285,000 | 1,282,671 | |
| PNM Resources, Inc. 3.25% 3/9/21 | 995,000 | 1,001,684 | |
| Southern Co. 2.35% 7/1/21 | 280,000 | 278,320 | |
| State Grid Overseas Investment Ltd. 2.25% 5/4/20 (c) | 2,235,000 | 2,224,301 | |
| 15,055,192 | |||
| Gas Utilities - 0.3% | |||
| CenterPoint Energy Resources Corp. 4.5% 1/15/21 | 590,000 | 606,316 | |
| ENN Energy Holdings Ltd.: | |||
| 3.25% 10/23/19 (Reg. S) | 900,000 | 900,662 | |
| 6% 5/13/21 (c) | 350,000 | 368,522 | |
| WGL Holdings, Inc.: | |||
| 3 month U.S. LIBOR + 0.400% 2.9249% 11/29/19 (a)(b) | 7,042,000 | 7,028,228 | |
| 3 month U.S. LIBOR + 0.550% 3.1466% 3/12/20 (a)(b) | 7,520,000 | 7,500,003 | |
| 16,403,731 | |||
| Independent Power and Renewable Electricity Producers - 0.0% | |||
| Exelon Generation Co. LLC: | |||
| 2.95% 1/15/20 | 1,340,000 | 1,341,367 | |
| 5.2% 10/1/19 | 150,000 | 151,038 | |
| NRG Energy, Inc. 3.75% 6/15/24 (c) | 535,000 | 543,020 | |
| 2,035,425 | |||
| Multi-Utilities - 0.6% | |||
| CenterPoint Energy, Inc. 3.6% 11/1/21 | 455,000 | 465,200 | |
| Consolidated Edison Co. of New York, Inc. 3 month U.S. LIBOR + 0.400% 3.0015% 6/25/21 (a)(b) | 11,500,000 | 11,531,344 | |
| Dominion Resources, Inc.: | |||
| 3 month U.S. LIBOR + 0.400% 3.0261% 12/1/20 (a)(b)(c) | 10,000,000 | 9,978,083 | |
| 2.579% 7/1/20 (a) | 2,335,000 | 2,328,096 | |
| 2.962% 7/1/19 | 330,000 | 329,989 | |
| San Diego Gas & Electric Co. 1.914% 2/1/22 | 205,717 | 201,400 | |
| Sempra Energy: | |||
| 3 month U.S. LIBOR + 0.500% 3.0968% 1/15/21 (a)(b) | 15,575,000 | 15,525,814 | |
| 1.625% 10/7/19 | 1,755,000 | 1,748,258 | |
| 2.875% 10/1/22 | 535,000 | 534,284 | |
| 42,642,468 | |||
| TOTAL UTILITIES | 76,136,816 | ||
| TOTAL NONCONVERTIBLE BONDS | |||
| (Cost $1,726,196,555) | 1,733,275,600 | ||
| U.S. Government and Government Agency Obligations - 2.6% | |||
| U.S. Government Agency Obligations - 0.1% | |||
| Fannie Mae 1.25% 8/17/21 | 3,000,000 | 2,954,146 | |
| Federal Home Loan Bank 2.625% 5/28/20 | 4,780,000 | 4,798,267 | |
| TOTAL U.S. GOVERNMENT AGENCY OBLIGATIONS | 7,752,413 | ||
| U.S. Treasury Obligations - 2.5% | |||
| U.S. Treasury Notes: | |||
| 1.375% 5/31/21 (d) | $54,315,000 | $53,703,956 | |
| 2.125% 5/15/22 | 4,475,000 | 4,505,416 | |
| 2.25% 4/15/22 | 23,070,000 | 23,297,996 | |
| 2.375% 3/15/22 | 9,555,000 | 9,681,529 | |
| 2.5% 1/15/22 | 11,100,000 | 11,265,199 | |
| 2.5% 2/15/22 | 2,605,000 | 2,646,008 | |
| 2.625% 12/15/21 | 30,965,000 | 31,525,031 | |
| 2.75% 11/30/20 | 25,000,000 | 25,253,906 | |
| 2.875% 10/15/21 | 17,110,000 | 17,486,286 | |
| TOTAL U.S. TREASURY OBLIGATIONS | 179,365,327 | ||
| TOTAL U.S. GOVERNMENT AND GOVERNMENT AGENCY OBLIGATIONS | |||
| (Cost $185,378,932) | 187,117,740 | ||
| U.S. Government Agency - Mortgage Securities - 0.4% | |||
| Fannie Mae - 0.3% | |||
| 12 month U.S. LIBOR + 1.528% 4.295% 7/1/35 (a)(b) | 8,184 | 8,538 | |
| 12 month U.S. LIBOR + 1.557% 4.446% 12/1/35 (a)(b) | 6,502 | 6,788 | |
| 12 month U.S. LIBOR + 1.655% 4.431% 8/1/37 (a)(b) | 4,733 | 4,956 | |
| 12 month U.S. LIBOR + 1.690% 4.379% 5/1/38 (a)(b) | 47,598 | 49,844 | |
| 12 month U.S. LIBOR + 1.788% 4.743% 5/1/38 (a)(b) | 13,075 | 13,731 | |
| 12 month U.S. LIBOR + 1.829% 4.732% 5/1/38 (a)(b) | 29,439 | 31,051 | |
| 12 month U.S. LIBOR + 1.830% 4.717% 4/1/38 (a)(b) | 18,760 | 19,651 | |
| 12 month U.S. LIBOR + 1.853% 4.603% 8/1/38 (a)(b) | 11,670 | 12,253 | |
| 12 month U.S. LIBOR + 2.040% 4.915% 12/1/36 (a)(b) | 6,875 | 7,225 | |
| 6 month U.S. LIBOR + 1.363% 4.123% 10/1/33 (a)(b) | 42,501 | 43,755 | |
| 3% 2/1/30 to 2/1/33 | 798,505 | 810,874 | |
| 3.5% 11/1/26 to 3/1/48 | 3,772,816 | 3,873,390 | |
| 4% 6/1/33 | 645,634 | 669,685 | |
| 4.5% 6/1/19 | 11 | 11 | |
| 4.5% 11/1/20 to 12/1/48 | 6,476,090 | 6,782,678 | |
| 5% 5/1/20 to 2/1/49 | 3,161,963 | 3,387,992 | |
| 5.5% 7/1/20 to 5/1/40 | 2,693,995 | 2,948,473 | |
| 6% 1/1/22 to 1/1/41 | 756,012 | 839,273 | |
| 6.5% 7/1/32 to 12/1/32 | 111,348 | 126,120 | |
| TOTAL FANNIE MAE | 19,636,288 | ||
| Freddie Mac - 0.0% | |||
| 12 month U.S. LIBOR + 1.591% 4.341% 9/1/35 (a)(b) | 3,769 | 3,928 | |
| 12 month U.S. LIBOR + 1.625% 4.375% 7/1/38 (a)(b) | 24,479 | 25,471 | |
| 12 month U.S. LIBOR + 1.625% 4.41% 6/1/38 (a)(b) | 34,966 | 36,549 | |
| 12 month U.S. LIBOR + 1.726% 4.465% 7/1/35 (a)(b) | 13,069 | 13,664 | |
| 12 month U.S. LIBOR + 1.733% 4.451% 10/1/36 (a)(b) | 34,277 | 35,864 | |
| 12 month U.S. LIBOR + 1.733% 4.858% 2/1/37 (a)(b) | 6,199 | 6,500 | |
| 12 month U.S. LIBOR + 1.744% 4.869% 2/1/37 (a)(b) | 7,939 | 8,329 | |
| 12 month U.S. LIBOR + 1.771% 4.633% 5/1/38 (a)(b) | 17,029 | 17,854 | |
| 12 month U.S. LIBOR + 1.775% 4.611% 5/1/37 (a)(b) | 11,875 | 12,488 | |
| 12 month U.S. LIBOR + 1.979% 4.847% 11/1/36 (a)(b) | 4,438 | 4,669 | |
| 12 month U.S. LIBOR + 1.983% 4.884% 12/1/36 (a)(b) | 7,270 | 7,631 | |
| 12 month U.S. LIBOR + 2.083% 5.207% 2/1/38 (a)(b) | 28,358 | 29,861 | |
| 12 month U.S. LIBOR + 2.163% 5.203% 2/1/37 (a)(b) | 14,002 | 14,720 | |
| U.S. TREASURY 1 YEAR INDEX + 2.347% 4.847% 11/1/34 (a)(b) | 14,970 | 15,612 | |
| 4.5% 10/1/19 | 1,752 | 1,753 | |
| 5% 10/1/22 to 12/1/23 | 206,680 | 213,712 | |
| 5.5% 11/1/21 to 10/1/38 | 41,355 | 43,000 | |
| 6% 7/1/21 to 1/1/38 | 158,150 | 177,260 | |
| TOTAL FREDDIE MAC | 668,865 | ||
| Ginnie Mae - 0.1% | |||
| 6% 7/15/36 | 275,237 | 309,901 | |
| 4% 2/20/48 to 1/20/49 | 775,001 | 802,927 | |
| 4.5% 9/20/40 to 1/20/48 | 710,087 | 745,321 | |
| 5% 12/20/34 to 1/20/49 | 6,856,761 | 7,194,999 | |
| 5.5% 9/15/45 to 3/20/48 | 891,257 | 979,433 | |
| TOTAL GINNIE MAE | 10,032,581 | ||
| TOTAL U.S. GOVERNMENT AGENCY - MORTGAGE SECURITIES | |||
| (Cost $30,229,494) | 30,337,734 | ||
| Asset-Backed Securities - 7.9% | |||
| Allegro CLO Ltd. Series 2015-1A Class AR, 3 month U.S. LIBOR + 0.840% 3.4203% 7/25/27 (a)(b)(c) | $1,225,000 | $1,220,535 | |
| Ally Auto Receivables Trust: | |||
| Series 2016-1 Class D, 2.84% 9/15/22 | 390,000 | 389,880 | |
| Series 2017-2: | |||
| Class C, 2.46% 9/15/22 | 745,000 | 743,955 | |
| Class D, 2.93% 11/15/23 | 200,000 | 199,812 | |
| Series 2018-1 Class A2, 2.14% 9/15/20 | 909,860 | 909,315 | |
| Series 2019-1 Class A2, 2.85% 3/15/22 | 7,998,000 | 8,023,638 | |
| Ally Master Owner Trust: | |||
| Series 2018-1 Class A1: | |||
| 1 month U.S. LIBOR + 0.280% 2.7196% 1/17/23 (a)(b) | 8,383,000 | 8,378,306 | |
| 2.7% 1/17/23 | 1,905,000 | 1,913,745 | |
| Series 2018-3 Class A, 1 month U.S. LIBOR + 0.320% 2.7596% 7/15/22 (a)(b) | 5,000,000 | 4,999,798 | |
| Series 2018-4 Class A, 3.3% 7/17/23 | 640,000 | 651,829 | |
| American Express Credit Account Master Trust Series 2019-1 Class A, 2.87% 10/15/24 | 1,749,000 | 1,781,899 | |
| AmeriCredit Automobile Receivables Trust: | |||
| Series 2014-4 Class E, 3.66% 3/8/22 | 325,000 | 324,945 | |
| Series 2015, Class D, 3% 6/8/21 | 540,000 | 540,786 | |
| Series 2015-3 Class D, 3.34% 8/8/21 | 680,000 | 682,597 | |
| Series 2016-1 Class C, 2.89% 1/10/22 | 1,855,000 | 1,857,147 | |
| Series 2016-3 Class D, 2.71% 9/8/22 | 810,000 | 811,014 | |
| Series 2016-4 Class A3, 1.53% 7/8/21 | 313,175 | 312,621 | |
| Series 2017-1: | |||
| Class C, 2.71% 8/18/22 | 240,000 | 240,801 | |
| Class D, 3.13% 1/18/23 | 1,330,000 | 1,342,588 | |
| Series 2017-3: | |||
| Class B, 2.24% 6/19/23 | 395,000 | 394,084 | |
| Class C, 2.69% 6/19/23 | 420,000 | 422,475 | |
| Class D, 3.18% 7/18/23 | 1,355,000 | 1,369,901 | |
| Series 2018-1 Class D, 3.82% 3/18/24 | 1,645,000 | 1,692,476 | |
| Applebee's/IHOP Funding LLC Series 2019-1A Class A2I, 4.194% 6/7/49 (c) | 1,730,000 | 1,739,326 | |
| ARI Fleet Lease Trust: | |||
| Series 2017-A Class A2, 1.91% 4/15/26 (c) | 108,653 | 108,232 | |
| Series 2018-A Class A2, 2.55% 10/15/26 (c) | 681,103 | 680,795 | |
| Ascentium Equipment Receivables LLC: | |||
| Series 2017-1A Class A3, 2.29% 6/10/21 (c) | 265,499 | 264,991 | |
| Series 2018-1A Class A2, 2.92% 12/10/20 (c) | 306,660 | 307,049 | |
| Avis Budget Rental Car Funding (AESOP) LLC: | |||
| Series 2014-1A Class A, 2.46% 7/20/20 (c) | 110,000 | 109,970 | |
| Series 2014-2A Class A, 2.5% 2/20/21 (c) | 2,685,000 | 2,682,536 | |
| Series 2015-2A Class A, 2.63% 12/20/21 (c) | 510,000 | 510,824 | |
| Series 2016-1A Class A, 2.99% 6/20/22 (c) | 610,000 | 615,072 | |
| Series 2017-1A Class B, 3.41% 9/20/23 (c) | 540,000 | 548,608 | |
| Series 2017-2A Class A, 2.97% 3/20/24 (c) | 905,000 | 912,455 | |
| Series 2019-1A Class B, 3.7% 3/20/23 (c) | 245,000 | 249,695 | |
| Series 2019-2A Class A, 3.35% 9/22/25 (c) | 650,000 | 665,564 | |
| Babson CLO Ltd. Series 2013-IA Class AR, 3 month U.S. LIBOR + 0.800% 3.3915% 1/20/28 (a)(b)(c) | 1,525,000 | 1,517,614 | |
| Bank of The West Auto Trust Series 2017-1 Class A2, 1.78% 2/15/21 (c) | 1,002,737 | 1,001,619 | |
| Bayview Opportunity Master Fund Series 2017-SPL4 Class A, 3.5% 1/28/55 (c) | 406,736 | 412,262 | |
| Bayview Opportunity Master Fund Trust 3.5% 1/28/58 (a)(c) | 1,335,563 | 1,355,984 | |
| Bayview Opportunity Master Funding Trust Series 2017-SPL5 Class A, 3.5% 6/28/57 (c) | 1,152,996 | 1,169,086 | |
| BlueMountain CLO Ltd. Series 2015-2A Class A1R, 3 month U.S. LIBOR + 0.930% 3.5309% 7/18/27 (a)(b)(c) | 1,595,000 | 1,586,248 | |
| BMW Floorplan Master Owner Trust Series 2018-1 Class A2, 1 month U.S. LIBOR + 0.320% 2.7596% 5/15/23 (a)(b)(c) | 6,174,000 | 6,176,441 | |
| BMW Vehicle Lease Trust: | |||
| Series 2017-2 Class A2A, 1.8% 2/20/20 | 290,527 | 290,442 | |
| Series 2018-1 Class A2, 2.97% 12/21/20 | 5,000,000 | 5,011,551 | |
| Series 2019-1 Class A2, 2.79% 3/22/21 | 5,000,000 | 5,015,987 | |
| BRE Grand Islander Timeshare Issuer Series 2019-A Class A, 3.28% 9/26/33 (c) | 380,000 | 385,241 | |
| California Republic Auto Receivables Trust Series 2015-1 Class B, 2.51% 2/16/21 | 295,000 | 294,910 | |
| Canadian Pacer Auto Receivables Trust: | |||
| Series 2018-1A Class A2B, 1 month U.S. LIBOR + 3.880% 2.6719% 8/19/20 (a)(b)(c) | 1,623,346 | 1,623,455 | |
| Series 2018-2A Class A2B, 1 month U.S. LIBOR + 0.180% 2.6219% 6/21/21 (a)(b)(c) | 4,932,359 | 4,931,894 | |
| Series 2019-1A Class A2, 2.78% 3/21/22 (c) | 4,342,000 | 4,355,980 | |
| Capital Auto Receivables Asset Trust: | |||
| Series 2016-2 Class A4, 1.63% 1/20/21 | 212,619 | 212,201 | |
| Series 2017-1: | |||
| Class B, 2.43% 5/20/22 (c) | 145,000 | 145,119 | |
| Class C, 2.7% 9/20/22 (c) | 235,000 | 234,110 | |
| Series 2018-2: | |||
| Class B, 3.48% 10/20/23 (c) | 370,000 | 374,875 | |
| Class C, 3.69% 12/20/23 (c) | 460,000 | 466,512 | |
| Capital One Multi-Asset Execution Trust Series 2016-16 Class A2, 1 month U.S. LIBOR + 0.630% 3.0696% 2/15/24 (a)(b) | 13,275,000 | 13,376,185 | |
| Capital One Prime Auto Receivables Trust Series 2019-1 Class A2, 2.58% 4/15/22 | 5,000,000 | 5,012,969 | |
| Carlyle Global Market Strategies Series 2015-3A Class A1R, 3 month U.S. LIBOR + 1.000% 3.5824% 7/28/28 (a)(b)(c) | 1,615,000 | 1,614,596 | |
| Carlyle Global Market Strategies Ltd. Series 2015-1A Class AR, 3 month U.S. LIBOR + 1.000% 3.5915% 4/20/27 (a)(b)(c) | 915,000 | 915,906 | |
| Carmax Auto Owner Trust Series 2015-4 Class D, 3% 5/16/22 | 235,000 | 234,915 | |
| CarMax Auto Owner Trust: | |||
| Series 2016-4 Class A3, 1.4% 8/15/21 | 606,832 | 603,599 | |
| Series 2017-3 Class A2A, 1.64% 9/15/20 | 145,094 | 145,027 | |
| Series 2017-4: | |||
| Class A2A, 1.8% 4/15/21 | 1,153,399 | 1,151,734 | |
| Class C, 2.7% 10/16/23 | 205,000 | 204,675 | |
| Series 2018-3 Class A2A, 2.88% 10/15/21 | 4,071,942 | 4,079,655 | |
| Series 2018-4 Class A2B, 1 month U.S. LIBOR + 0.200% 2.6396% 2/15/22 (a)(b) | 5,000,000 | 4,999,570 | |
| Series 2019-1 Class A2A, 3.02% 7/15/22 | 5,070,000 | 5,096,405 | |
| Series 2019-2 Class A2A, 2.69% 7/15/22 | 3,000,000 | 3,012,243 | |
| CCG Receivables Trust Series 2016-1 Class A2, 1.69% 9/14/22 (c) | 39,642 | 39,624 | |
| Chesapeake Funding II LLC: | |||
| Series 2017-2A Class A2, 1 month U.S. LIBOR + 0.450% 2.8896% 5/15/29 (a)(b)(c) | 5,290,385 | 5,290,791 | |
| Series 2017-4A Class A2, 1 month U.S. LIBOR + 0.340% 2.7796% 11/15/29 (a)(b)(c) | 2,342,941 | 2,342,994 | |
| Series 2018-3A Class A2, 1 month U.S. LIBOR + 0.480% 2.9196% 1/15/31(a)(b)(c) | 2,662,000 | 2,664,215 | |
| Series 2019-1A Class A1, 2.95% 4/15/31 (c) | 3,905,000 | 3,939,107 | |
| Chrysler Capital Auto Receivables Trust Series 2016-BA Class A3, 1.64% 7/15/21 (c) | 68,224 | 68,089 | |
| Citibank Credit Card Issuance Trust: | |||
| Series 2014-A6 Class A6, 2.15% 7/15/21 | 2,105,000 | 2,103,948 | |
| Series 2017-A4 Class A4, 1 month U.S. LIBOR + 0.220% 2.6871% 4/7/22 (a)(b) | 10,000,000 | 10,006,001 | |
| Series 2017-A9 Class A9, 1.8% 9/20/21 | 4,284,000 | 4,274,340 | |
| CNH Equipment Trust: | |||
| Series 2015-C: | |||
| Class A3, 1.66% 11/16/20 | 24,420 | 24,408 | |
| Class B, 2.4% 2/15/23 | 1,265,000 | 1,264,376 | |
| Series 2018-A Class B, 3.47% 10/15/25 | 380,000 | 389,557 | |
| Series 2019-A Class A2, 2.96% 5/16/22 | 4,000,000 | 4,017,621 | |
| Series 2019-B Class A2, 2.55% 9/15/22 | 7,000,000 | 7,013,964 | |
| Cole Park CLO Ltd. Series 2015-1A Class AR, 3 month U.S. LIBOR + 1.050% 3.6415% 10/20/28 (a)(b)(c) | 1,610,000 | 1,610,570 | |
| Dell Equipment Finance Trust: | |||
| Series 2017-2 Class A2A, 1.97% 2/24/20 (c) | 542,650 | 542,354 | |
| Series 2018-1 Class A2B, 1 month U.S. LIBOR + 0.300% 2.736% 10/22/20 (a)(b)(c) | 6,271,847 | 6,277,056 | |
| Series 2018-2 Class A2 3.16% 2/22/21 (c) | 5,080,000 | 5,102,572 | |
| Series 2019-1 Class A2, 2.78% 8/23/21 (c) | 4,000,000 | 4,015,895 | |
| Discover Card Master Trust Series 2012-A6 Class A6, 1.67% 1/18/22 | 2,805,000 | 2,801,950 | |
| DLL Securitization Trust Series 2017-A Class A2, 1.89% 7/15/20 (c) | 2,363,281 | 2,361,203 | |
| Elara HGV Timeshare Issuer Series 2017-A Class A, 2.69% 3/25/30 (c) | 258,204 | 258,780 | |
| Elara HGV Timeshare Issuer Trust Series 2014-A Class A, 2.53% 2/25/27 (c) | 80,654 | 80,367 | |
| Enterprise Fleet Financing LLC: | |||
| Series 2016-2 Class A2, 1.74% 2/22/22 (c) | 492,237 | 491,434 | |
| Series 2017-1 Class A2, 2.13% 7/20/22 (c) | 139,740 | 139,393 | |
| Series 2017-2 Class A2, 1.97% 1/20/23 (c) | 207,632 | 207,051 | |
| Series 2017-3 Class A2, 2.13% 5/22/23 (c) | 917,410 | 914,183 | |
| Series 2018-1 Class A2, 2.87% 10/20/23 (c) | 473,138 | 474,319 | |
| Series 2018-2 Class A2, 3.14% 2/20/24 (c) | 870,000 | 874,919 | |
| Series 2019-1 Class A2, 2.98% 10/22/24 (c) | 3,312,000 | 3,339,814 | |
| Fannie Mae Connecticut Avenue Securities 1 month U.S. LIBOR + 0.750% 3.1798% 2/25/30 (a)(b) | 215,980 | 215,938 | |
| Fifth Third Auto Trust Series 2019-1 Class A2A, 2.66% 5/16/22 | 5,000,000 | 5,011,692 | |
| Ford Credit Auto Lease Trust: | |||
| Series 2017-A Class A4, 2.02% 6/15/20 | 1,096,927 | 1,096,344 | |
| Series 2017-B Class A4, 2.17% 2/15/21 | 545,000 | 543,458 | |
| Series 2018-A Class A2B, 1 month U.S. LIBOR + 0.350% 2.6596% 12/15/20 (a)(b) | 3,088,075 | 3,089,185 | |
| Series 2018-B Class A2B, 1 month U.S. LIBOR + 0.200% 2.5996% 4/15/21 (a)(b) | 7,154,093 | 7,154,121 | |
| Ford Credit Floorplan Master Owner Trust: | |||
| Series 2015-2 Class A2, 1 month U.S. LIBOR + 0.570% 3.0096% 1/15/22 (a)(b) | 7,054,000 | 7,070,578 | |
| Series 2016-3 Class B, 1.75% 7/15/21 | 425,000 | 424,464 | |
| Series 2016-5 Class B, 2.16% 11/15/21 | 920,000 | 917,704 | |
| Series 2017-1 Class A2, 1 month U.S. LIBOR + 0.420% 2.8596% 5/15/22 (a)(b) | 10,000,000 | 10,019,831 | |
| Series 2017-2 Class A2, 1 month U.S. LIBOR + 0.350% 2.7896% 9/15/22 (a)(b) | 10,000,000 | 10,012,654 | |
| GM Financial Automobile Leasing Trust: | |||
| Series 2017-1 Class A4, 2.26% 8/20/20 | 165,000 | 164,781 | |
| Series 2017-3: | |||
| Class A4, 2.12% 9/20/21 | 245,000 | 244,345 | |
| Class C, 2.73% 9/20/21 | 300,000 | 299,528 | |
| Series 2018-1 Class A2A, 2.39% 4/20/20 | 4,203,920 | 4,202,323 | |
| Series 2018-2: | |||
| Class A2A, 2.83% 7/20/20 | 3,179,257 | 3,180,612 | |
| Class C, 3.5% 4/20/22 | 470,000 | 475,759 | |
| Series 2018-3 Class A2B, 1 month U.S. LIBOR + 0.170% 2.6106% 9/21/20 (a)(b) | 8,044,547 | 8,043,868 | |
| Series 2019-1: | |||
| Class A2A, 2.91% 4/20/21 | 5,250,000 | 5,268,641 | |
| Class C, 3.56% 12/20/22 | 835,000 | 849,120 | |
| 3.11% 12/20/21 | 435,000 | 436,487 | |
| GM Financial Securitized Auto Receivables Trust Series 2017-3A Class C, 2.52% 3/16/23 (c) | 245,000 | 245,121 | |
| GM Financial Securitized Term Auto Receivables Trust: | |||
| Series 2018-2 Class A2B, 1 month U.S. LIBOR + 0.120% 2.5676% 5/17/21 (a)(b) | 4,530,472 | 4,530,892 | |
| Series 2018-4 Class A2, 2.93% 11/16/21 | 2,385,069 | 2,389,862 | |
| Series 2019-1 Class A2, 2.99% 3/16/22 | 4,470,466 | 4,484,373 | |
| GM Financial Securitized Term Automobile Recievables Trust Series 2018-1 Class A2A, 2.08% 1/19/21 | 5,033,533 | 5,027,749 | |
| GMF Floorplan Owner Revolving Trust: | |||
| Series 2017-1: | |||
| Class A2, 1 month U.S. LIBOR + 0.570% 3.0096% 1/18/22 (a)(b)(c) | 10,000,000 | 10,018,693 | |
| Class C, 2.97% 1/18/22 (c) | 575,000 | 575,732 | |
| Series 2017-2 Class A2, 1 month U.S. LIBOR + 0.430% 2.8696% 7/15/22 (a)(b)(c) | 10,000,000 | 10,022,719 | |
| Series 2017-3: | |||
| Class B, 2.26% 8/16/21 (c) | 1,220,000 | 1,218,028 | |
| Class C, 2.46% 8/16/21 (c) | 1,530,000 | 1,528,090 | |
| Series 2018-4 Class A1, 3.5% 9/15/23 (c) | 1,410,000 | 1,445,112 | |
| Series 2019-1 Class A, 2.7% 4/15/24 (c) | 710,000 | 716,182 | |
| Golub Capital Partners CLO 39B LLC Series 2018-39A Class A1, 3 month U.S. LIBOR + 1.150% 3.7415% 10/20/28 (a)(b)(c) | 930,000 | 929,515 | |
| GreatAmerica Leasing Receivables Funding LLC: | |||
| Series 2017-1 Class A3, 2.06% 6/22/20 (c) | 44,010 | 43,933 | |
| 2.6% 6/15/21 (c) | 390,000 | 390,407 | |
| Hardee's Funding LLC / Carl's Jr. Funding LLC Series 2018-1A Class AI, 4.25% 6/20/48 (c) | 938,425 | 959,446 | |
| Hilton Grand Vacations Trust: | |||
| Series 2014-AA Class A, 1.77% 11/25/26 (c) | 125,865 | 124,981 | |
| Series 2017-AA: | |||
| Class A, 2.66% 12/26/28 (c) | 131,790 | 131,947 | |
| Class B, 2.96% 12/26/28 (a)(c) | 90,444 | 90,477 | |
| Honda Auto Receivables Owner Trust Series 2019-2 Class A2, 2.57% 12/21/21 | 5,000,000 | 5,011,183 | |
| Hyundai Auto Lease Securitization Trust: | |||
| Series 2018-A Class A2A, 2.55% 8/17/20 (c) | 2,483,852 | 2,483,130 | |
| Series 2019-A Class A2, 2.92% 7/15/21 (c) | 7,000,000 | 7,034,983 | |
| Hyundai Auto Receivables Trust: | |||
| Series 2017-A Class B, 2.38% 4/17/23 | 340,000 | 339,416 | |
| Series 2017-B Class A2A, 1.57% 8/17/20 | 218,514 | 218,401 | |
| Series 2018-A Class A2B, 1 month U.S. LIBOR + 0.120% 2.5596% 4/15/21 (a)(b) | 4,532,896 | 4,531,812 | |
| Series 2019-A: | |||
| Class A2, 2.67% 12/15/21 | 5,000,000 | 5,013,268 | |
| Class B, 2.94% 5/15/25 | 635,000 | 644,956 | |
| John Deere Owner Trust: | |||
| Series 2018-A Class A2, 2.42% 10/15/20 | 4,078,807 | 4,076,742 | |
| Series 2018-B Class A2, 2.83% 4/15/21 | 4,312,604 | 4,317,065 | |
| Series 2019-A Class A2, 2.85% 12/15/21 | 4,655,000 | 4,674,744 | |
| KKR Finanical CLO Ltd. Series 13 Class A1R, 3 month U.S. LIBOR + 0.800% 3.401% 1/16/28 (a)(b)(c) | 1,620,000 | 1,609,118 | |
| Kubota Credit Owner Trust Series 2019-1A Class A3, 2.46% 10/16/23 (c) | 2,870,000 | 2,869,650 | |
| Madison Park Funding Ltd. Series 2015-18A Class A1R, 3 month U.S. LIBOR + 1.190% 3.7815% 10/21/30 (a)(b)(c) | 1,165,000 | 1,166,970 | |
| Magnetite CLO Ltd. Series 2015-16A Class AR, 3 month U.S. LIBOR + 0.800% 3.4009% 1/18/28 (a)(b)(c) | 2,045,000 | 2,035,266 | |
| Mercedes-Benz Auto Lease Trust: | |||
| Series 2018-A Class A2, 2.2% 4/15/20 | 1,633,463 | 1,632,887 | |
| Series 2019-A: | |||
| Class A2, 3.01% 2/16/21 | 5,827,000 | 5,842,383 | |
| Class A3, 3.1% 11/15/21 | 2,592,000 | 2,617,325 | |
| Mercedes-Benz Master Owner Trust Series 2017-BA Class A, 1 month U.S. LIBOR + 0.420% 2.8596% 5/16/22 (a)(b)(c) | 10,000,000 | 10,018,948 | |
| MMAF Equipment Finance LLC Series 2017-AA Class A3, 2.04% 2/16/22 (c) | 296,234 | 295,471 | |
| MVW Owner Trust: | |||
| Series 2013-1A Class A, 2.15% 4/22/30 (c) | 38,533 | 38,325 | |
| Series 2014-1A Class A, 2.25% 9/22/31 (c) | 136,135 | 135,342 | |
| Series 2015-1A Class A, 2.52% 12/20/32 (c) | 322,414 | 321,509 | |
| Series 2017-1A: | |||
| Class A, 2.42% 12/20/34 (c) | 150,265 | 149,470 | |
| Class B, 2.75% 12/20/34 (c) | 57,794 | 57,542 | |
| Class C, 2.99% 12/20/34 (c) | 138,706 | 137,532 | |
| Navient Private Education Refi Loan Trust Series 2018-A Class A1, 2.53% 2/18/42 (c) | 611,929 | 610,511 | |
| Navient Student Loan Trust: | |||
| Series 2017-3A: | |||
| Class A1, 1 month U.S. LIBOR + 0.300% 2.7298% 7/26/66 (a)(b)(c) | 1,295,193 | 1,294,442 | |
| Class A2, 1 month U.S. LIBOR + 0.600% 3.0298% 7/26/66 (a)(b)(c) | 6,820,000 | 6,821,622 | |
| Series 2017-4A Class A1, 1 month U.S. LIBOR + 0.240% 2.6698% 9/27/66 (a)(b)(c) | 1,233,781 | 1,232,516 | |
| Series 2018-4A Class A1, 1 month U.S. LIBOR + 0.250% 2.6798% 6/27/67 (a)(b)(c) | 6,494,656 | 6,483,836 | |
| Series 2019-2A Class A1, 1 month U.S. LIBOR + 0.270% 2.75% 2/27/68 (a)(b)(c) | 860,000 | 858,639 | |
| Series 2019-CA Class A1, 2.82% 2/15/68 (c) | 1,560,000 | 1,566,493 | |
| Navistar Financial Dealer Note Master Trust Series 2018-1 Class A, 1 month U.S. LIBOR + 0.630% 3.0598% 9/25/23 (a)(b)(c) | 4,181,000 | 4,189,520 | |
| Nelnet Student Loan Trust Series 2005-4 Class A4, 3 month U.S. LIBOR + 0.180% 2.787% 3/22/32 (a)(b) | 856,197 | 826,949 | |
| Neuberger Berman CLO Ltd. Series 2017-16SA Class A, 3 month U.S. LIBOR + 0.850% 3.4468% 1/15/28 (a)(b)(c) | 915,000 | 911,847 | |
| Neuberger Berman CLO XIX Ltd. Series 2015-19A Class A1R2, 3 month U.S. LIBOR + 0.800% 3.3968% 7/15/27 (a)(b)(c) | 1,590,000 | 1,586,761 | |
| Nissan Auto Lease Trust: | |||
| Series 2017-B Class A4, 2.17% 12/15/21 | 250,000 | 249,435 | |
| Series 2018-A Class A2B, 1 month U.S. LIBOR + 0.210% 2.5896% 2/16/21 (a)(b) | 4,877,182 | 4,873,512 | |
| Nissan Auto Receivables Owner Trust: | |||
| Series 2016-A Class A3, 1.34% 10/15/20 | 44,909 | 44,834 | |
| Series 2017-B Class A2A, 1.56% 5/15/20 | 414,631 | 414,427 | |
| Nissan Master Owner Trust Receivables: | |||
| Series 2016-A: | |||
| Class A1, 1 month U.S. LIBOR + 0.640% 3.0796% 6/15/21 (a)(b) | 5,000,000 | 5,000,894 | |
| Class A2, 1.54% 6/15/21 | 750,000 | 749,627 | |
| Series 2017-B Class A, 1 month U.S. LIBOR + 0.430% 2.8696% 4/18/22 (a)(b) | 10,700,000 | 10,719,467 | |
| Series 2017-C Class A, 1 month U.S. LIBOR + 0.320% 2.7596% 10/17/22 (a)(b) | 5,000,000 | 5,001,964 | |
| OCP CLO Ltd.: | |||
| Series 2014-7A Class A1RR, 3 month U.S. LIBOR + 1.120% 3.7115% 7/20/29 (a)(b)(c) | 2,530,000 | 2,525,155 | |
| Series 2015-10A Class A1R, 3 month U.S. LIBOR + 0.820% 3.4064% 10/26/27 (a)(b)(c) | 1,385,000 | 1,382,119 | |
| OZLM Ltd. Series 2014-8A Class RR, 3 month U.S. LIBOR + 1.170% 3.758% 10/17/29 (a)(b)(c) | 1,015,000 | 1,015,212 | |
| Planet Fitness Master Issuer LLC Series 2018-1A Class A2I, 4.262% 9/5/48 (c) | 1,189,025 | 1,225,576 | |
| Santander Drive Auto Receivables Series 2018-1 Class C, 2.96% 3/15/24 | 250,000 | 251,293 | |
| Santander Drive Auto Receivables Trust: | |||
| Series 2015-3 Class D, 3.49% 5/17/21 | 1,040,310 | 1,042,174 | |
| Series 2015-4 Class D, 3.53% 8/16/21 | 530,000 | 531,873 | |
| Series 2015-5: | |||
| Class C, 2.74% 12/15/21 | 60,855 | 60,850 | |
| Class D, 3.65% 12/15/21 | 745,000 | 747,947 | |
| Series 2016-1 Class D, 4.02% 4/15/22 | 635,000 | 641,797 | |
| Series 2017-1: | |||
| Class B, 2.1% 6/15/21 | 19,674 | 19,666 | |
| Class C, 2.58% 5/16/22 | 140,000 | 139,867 | |
| Series 2018-2 Class C, 3.35% 7/17/23 | 400,000 | 404,484 | |
| Series 2018-4 Class B, 3.27% 1/17/23 | 665,000 | 669,720 | |
| Series 2018-5 Class B, 3.52% 12/15/22 | 790,000 | 799,536 | |
| Series 2019-1 Class B, 3.21% 9/15/23 | 375,000 | 379,818 | |
| Series 2019-2 Class B, 2.79% 1/16/24 | 535,000 | 537,894 | |
| Santander Retail Auto Lease Trust: | |||
| Series 2017-A: | |||
| Class A2A, 2.02% 3/20/20 (c) | 668,774 | 668,535 | |
| Class C, 2.96% 11/21/22 (c) | 325,000 | 326,277 | |
| Series 2018-A Class A2B, 1 month U.S. LIBOR + 0.270% 2.7106% 10/20/20 (a)(b)(c) | 5,135,500 | 5,135,498 | |
| Series 2019-A: | |||
| Class A2, 2.72% 1/20/22 (c) | 3,075,000 | 3,088,546 | |
| Class B, 3.01% 5/22/23 (c) | 700,000 | 707,213 | |
| SBA Tower Trust 2.877% 7/9/21 (c) | 370,000 | 370,134 | |
| Securitized Term Auto Receivables Trust Series 2019-1A Class A2, 2.862% 5/25/21 (c) | 4,573,000 | 4,583,957 | |
| Sierra Receivables Funding Co. LLC Series 2019-1A Class A, 3.2% 1/20/36 (c) | 520,170 | 530,103 | |
| Sierra Receivables Funding Co., LLC Series 2016-2A Class A, 2.33% 7/20/33 (c) | 110,065 | 109,283 | |
| Sierra Timeshare Receivables Funding Co. LLC: | |||
| Series 2014-3A Class A, 2.3% 10/20/31 (c) | 79,278 | 79,139 | |
| Series 2015-1A Class A, 2.4% 3/22/32 (c) | 628,698 | 627,042 | |
| Series 2015-2A Class 2, 2.43% 6/20/32 (c) | 147,250 | 146,588 | |
| Series 2015-3A Class A, 2.58% 9/20/32 (c) | 151,328 | 151,318 | |
| Series 2017-1A Class A, 2.91% 3/20/34 (c) | 104,950 | 105,556 | |
| SLM Student Loan Trust: | |||
| Series 2003-10A Class A3, 3 month U.S. LIBOR + 0.470% 3.0809% 12/15/27 (a)(b)(c) | 4,337,278 | 4,330,749 | |
| Series 2003-11 Class A6, 3 month U.S. LIBOR + 0.550% 3.1609% 12/15/25 (a)(b)(c) | 2,094,859 | 2,096,308 | |
| Series 2007-7 Class A4, 3 month U.S. LIBOR + 0.330% 2.9103% 1/25/22 (a)(b) | 689,679 | 675,575 | |
| Series 2008-1 Class A4, 3 month U.S. LIBOR + 0.650% 3.2303% 1/25/22 (a)(b) | 1,567,054 | 1,546,081 | |
| Series 2008-5 Class A4, 3 month U.S. LIBOR + 1.700% 4.2803% 7/25/23 (a)(b) | 214,923 | 217,791 | |
| Series 2008-9 Class A, 3 month U.S. LIBOR + 1.500% 4.0803% 4/25/23 (a)(b) | 155,561 | 157,085 | |
| Series 2010-1 Class A, 1 month U.S. LIBOR + 0.400% 2.8298% 3/25/25 (a)(b) | 976,883 | 948,085 | |
| SMB Private Education Loan Trust: | |||
| Series 2014-A Class A3, 1 month U.S. LIBOR + 1.500% 3.9396% 4/15/32 (a)(b)(c) | 1,400,000 | 1,422,373 | |
| Series 2015-A Class A2B, 1 month U.S. LIBOR + 1.000% 3.4396% 6/15/27 (a)(b)(c) | 346,509 | 348,474 | |
| Series 2016-C Class A2B, 1 month U.S. LIBOR + 1.100% 3.5396% 9/15/34 (a)(b)(c) | 1,288,889 | 1,298,068 | |
| Series 2018-B Class A2B, 1 month U.S. LIBOR + 0.720% 3.1596% 1/15/37 (a)(b)(c) | 1,900,000 | 1,886,060 | |
| Synchrony Credit Card Master Note Trust: | |||
| Series 2015-1 Class B, 2.64% 3/15/23 | 550,000 | 549,135 | |
| Series 2015-4 Class B, 2.62% 9/15/23 | 435,000 | 434,334 | |
| Series 2018-1 Class C, 3.36% 3/15/24 | 955,000 | 959,721 | |
| Tesla Auto Lease Trust Series 2018-A Class A, 2.32% 12/20/19 (c) | 861,531 | 860,813 | |
| Towd Point Mortgage Trust: | |||
| Series 2017-1 Class A1, 2.75% 10/25/56 (a)(c) | 743,570 | 742,089 | |
| Series 2017-4 Class A1, 2.75% 6/25/57 (c) | 350,962 | 350,401 | |
| Series 2017-6 Class A1, 2.75% 10/25/57 (c) | 1,878,391 | 1,877,483 | |
| Series 2018-1 Class A1, 3% 1/25/58 (c) | 384,575 | 386,864 | |
| Series 2018-2 Class A1, 3.25% 3/25/58 (c) | 1,892,760 | 1,921,841 | |
| Series 2018-5 Class A1A, 3.25% 7/25/58 (a)(c) | 1,765,300 | 1,784,193 | |
| Toyota Auto Receivables Owner Trust Series 2018-C Class A2B, 1 month U.S. LIBOR + 1.200% 2.5596% 8/16/21 (a)(b) | 6,124,174 | 6,124,611 | |
| Verizon Owner Trust: | |||
| Series 2016-1A Class A, 1.42% 1/20/21 (c) | 1,069,413 | 1,068,027 | |
| Series 2016-2A Class C, 2.36% 5/20/21 (c) | 600,000 | 598,938 | |
| Series 2017-1A: | |||
| Class A, 2.06% 9/20/21 (c) | 3,997,679 | 3,989,507 | |
| Class C, 2.65% 9/20/21 (c) | 315,000 | 314,976 | |
| Series 2017-3A: | |||
| Class A1A, 2.06% 4/20/22 (c) | 4,320,000 | 4,307,989 | |
| Class C, 2.53% 4/20/22 (c) | 700,000 | 699,883 | |
| Series 2018-1A: | |||
| Class A1B, 1 month U.S. LIBOR + 0.260% 2.7006% 9/20/22 (a)(b)(c) | 6,210,000 | 6,218,195 | |
| Class C, 3.2% 9/20/22 (c) | 970,000 | 982,165 | |
| Series 2018-A: | |||
| Class A1A, 3.23% 4/20/23 | 5,132,000 | 5,230,054 | |
| Class A1B, 1 month U.S. LIBOR + 0.240% 2.6806% 4/20/23 (a)(b) | 4,000,000 | 3,996,399 | |
| Volkswagen Auto Loan Enhanced Trust Series 2018-1 Class A2B, 1 month U.S. LIBOR + 0.000% 2.6206% 7/20/21 (a)(b) | 4,802,366 | 4,804,647 | |
| Volvo Financial Equipment LLC Series 2019-1A Class A2, 2.9% 11/15/21 (c) | 3,600,000 | 3,614,303 | |
| Volvo Financial Equipment Master Owner Trust: | |||
| Series 2017-A Class A, 1 month U.S. LIBOR + 0.500% 2.9396% 11/15/22 (a)(b)(c) | 7,547,000 | 7,569,367 | |
| Series 2018-A Class A, 1 month U.S. LIBOR + 0.520% 2.9596% 7/17/23 (a)(b)(c) | 5,080,000 | 5,098,022 | |
| Wheels SPV LLC 1.88% 4/20/26 (c) | 229,418 | 228,416 | |
| World Omni Auto Receivables Trust: | |||
| Series 2018-A Class A2, 2.19% 5/17/21 | 4,134,636 | 4,130,397 | |
| Series 2018-D Class A2B, 1 month U.S. LIBOR + 0.140% 2.5796% 4/15/22 (a)(b) | 4,712,314 | 4,711,324 | |
| Series 2019-B Class A2, 2.63% 6/15/22 | 7,000,000 | 7,017,936 | |
| World Omni Automobile Lease Securitization Trust: | |||
| Series 2018-A Class B, 3.06% 5/15/23 | 280,000 | 281,434 | |
| Series 2018-B Class A2B, 1 month U.S. LIBOR + 0.180% 2.6196% 6/15/21 (a)(b) | 4,918,599 | 4,917,511 | |
| Series 2019-A Class A3, 2.94% 5/16/22 | 2,284,000 | 2,313,233 | |
| TOTAL ASSET-BACKED SECURITIES | |||
| (Cost $564,001,929) | 564,859,622 | ||
| Collateralized Mortgage Obligations - 1.0% | |||
| Private Sponsor - 0.7% | |||
| Angel Oak Mortgage Trust: | |||
| sequential payer Series 2019-2 Class A1, 3.628% 3/25/49 (c) | 1,033,975 | 1,045,924 | |
| Series 2019-2 Class M1, 4.065% 3/25/49 (c) | 545,000 | 558,320 | |
| Colt 2019-2 Mortgage Loan Trus sequential payer Series 2019-2 Class A1, 3.337% 5/25/49 (c) | 706,772 | 714,643 | |
| COLT Funding LLC sequential payer Series 2018-1: | |||
| Class A1, 2.93% 2/25/48 (c) | 180,104 | 180,415 | |
| Class A3, 3.084% 2/25/48 (c) | 64,037 | 64,239 | |
| Colt Funding LLC sequential payer Series 2018-2: | |||
| Class A1, 3.47% 7/27/48 (c) | 1,073,210 | 1,085,074 | |
| Class A2, 3.542% 7/27/48 (c) | 519,836 | 525,577 | |
| COLT Funding LLC sequential payer: | |||
| Series 2018-3 Class A2, 3.763% 10/26/48 (c) | 382,044 | 388,987 | |
| Series 2018-4 Class A1, 4.006% 12/28/48 (c) | 956,009 | 975,550 | |
| COLT Mortgage Loan Trust: | |||
| sequential payer Series 2017-2: | |||
| Class A1A, 2.415% 10/25/47 (c) | 467,165 | 464,103 | |
| Class A2A, 2.568% 10/25/47 (c) | 197,708 | 196,812 | |
| Class A3A, 2.773% 10/25/47 (c) | 86,099 | 86,580 | |
| Series 2017-1: | |||
| Class A1, 2.614% 5/27/47 (c) | 302,779 | 302,473 | |
| Class A3, 3.074% 5/27/47 (c) | 28,080 | 28,213 | |
| COMM Mortgage Trust Series 2016-CR28 Class A1, 1.77% 2/10/49 | 96,165 | 95,531 | |
| Deephaven Residential Mortgage Trust: | |||
| Series 2017-1A Class A3, 3.485% 12/26/46 (a)(c) | 100,282 | 100,299 | |
| Series 2017-3A: | |||
| Class A1, 2.577% 10/25/47 (a)(c) | 476,908 | 474,561 | |
| Class A2, 2.711% 10/25/47 (a)(c) | 39,742 | 39,680 | |
| Class A3, 2.813% 10/25/47 (a)(c) | 37,850 | 37,655 | |
| Series 2018-1A Class A1, 2.976% 12/25/57 (a)(c) | 431,436 | 429,467 | |
| Series 2018-2A Class A1, 3.479% 4/25/58 (c) | 785,340 | 795,719 | |
| Series 2018-3A Class A3, 3.963% 8/25/58 (c) | 90,170 | 91,926 | |
| Series 2019-1A Class A1, 3.743% 1/25/59 (c) | 1,263,487 | 1,279,522 | |
| Series 2019-2A: | |||
| Class A3, 3.763% 4/25/59 (c) | 774,907 | 776,414 | |
| Class M1, 3.921% 4/25/59 (c) | 380,000 | 389,212 | |
| Freddie Mac STACR Trust floater: | |||
| Series 2018-DNA2 Class M1, 1 month U.S. LIBOR + 0.000% 3.2298% 12/25/30 (a)(b)(c) | 1,957,020 | 1,953,693 | |
| Series 2018-HRP2: | |||
| Class M1, 1 month U.S. LIBOR + 0.850% 3.2798% 2/25/47 (a)(b)(c) | 297,857 | 297,868 | |
| Class M2, 1 month U.S. LIBOR + 1.250% 3.6798% 2/25/47 (a)(b)(c) | 700,000 | 703,578 | |
| GMRF Mortgage Acquisition Co., LLC: | |||
| Series 2018-1 Class A33, 3.5% 11/25/57 (c) | 666,277 | 666,437 | |
| Series 2019-1 Class A32, 4% 2/25/59 (c) | 608,091 | 621,010 | |
| Gosforth Funding PLC floater Series 2018-1A Class A1, 3 month U.S. LIBOR + 0.450% 2.9706% 8/25/60 (b)(c) | 2,069,163 | 2,064,799 | |
| GS Mortgage-Backed Securites Trust Series 2014-EB1A Class 2A1, 2.4573% 7/25/44 (a)(c) | 94,427 | 93,302 | |
| Holmes Master Issuer PLC floater Series 2018-2A Class A2, 3 month U.S. LIBOR + 0.420% 3.0168% 10/15/54 (a)(b)(c) | 2,491,000 | 2,490,076 | |
| Homeward Opportunities Fund I Trust sequential payer Series 2019-1: | |||
| Class A1, 3.454% 1/25/59 (c) | 1,430,122 | 1,435,665 | |
| Class A3, 3.606% 1/25/59 (c) | 899,907 | 903,387 | |
| Homeward Opportunities Fund Trust sequential payer Series 2018-1: | |||
| Class A1, 3.766% 6/25/48 (c) | 792,104 | 808,363 | |
| Class A2, 3.897% 6/25/48 (c) | 634,471 | 649,671 | |
| Kubota Credit Owner Trust sequential payer Series 2016-1A Class A3, 1.5% 7/15/20 (c) | 86,630 | 86,444 | |
| Lanark Master Issuer PLC floater Series 2019-1A Class 1A1, 3 month U.S. LIBOR + 0.770% 3.2948% 12/22/69 (a)(b)(c) | 1,493,000 | 1,495,513 | |
| Metlife Securitization Trust Series 2017-1A Class A, 3% 4/25/55 (c) | 496,698 | 496,494 | |
| Mill City Mortgage Loan Trust: | |||
| Series 2016-1 Class A1, 2.5% 4/25/57 (c) | 142,014 | 141,227 | |
| Series 2017-2 Class A1, 2.75% 7/25/59 (c) | 660,743 | 660,181 | |
| New Residential Mortgage Loan Trust Series 2018-NQM1 Class A1, 3.986% 11/25/48 (c) | 1,365,286 | 1,417,765 | |
| Permanent Master Issuer PLC floater Series 2018-1A Class 1A1, 3 month U.S. LIBOR + 0.380% 2.9768% 7/15/58 (a)(b)(c) | 6,992,000 | 6,984,316 | |
| Sequoia Mortgage Trust: | |||
| sequential payer: | |||
| Series 2018-CH1 Class A11, 3.5% 2/25/48 (c) | 1,116,283 | 1,127,152 | |
| Series 2018-CH2 Class A3, 4% 6/25/48 (c) | 1,496,526 | 1,527,256 | |
| Series 2018-CH3 Class A19, 4.5% 8/25/48 (c) | 388,459 | 405,503 | |
| Series 2018-CH4 Class A2, 4% 10/25/48 (c) | 667,542 | 692,005 | |
| Silverstone Master Issuer PLC floater Series 2019-1A Class 1A, 3 month U.S. LIBOR + 0.570% 3.1485% 1/21/70 (b)(c) | 3,667,000 | 3,674,096 | |
| Starvest Emerging Markets Cbo sequential payer Series 2019-IMC1 Class A1, 3.468% 2/25/49 (c) | 655,772 | 658,320 | |
| Towd Point Mortgage Trust: | |||
| Series 2015-4 Class A1B, 2.75% 4/25/55 (c) | 364,869 | 364,240 | |
| Series 2015-5 Class A1B, 2.75% 5/25/55 (c) | 368,171 | 367,400 | |
| Series 2016-1: | |||
| Class A1B, 2.75% 2/25/55 (c) | 196,562 | 196,394 | |
| Class A3B, 3% 2/25/55 (c) | 272,820 | 272,889 | |
| Series 2016-2 Class A1A, 2.75% 8/25/55 (c) | 256,107 | 256,361 | |
| Series 2016-3 Class A1, 2.25% 4/25/56 (c) | 63,277 | 62,662 | |
| Series 2017-2 Class A1, 2.75% 4/25/57 (a)(c) | 473,625 | 472,616 | |
| Series 2017-3 Class A1, 2.75% 7/25/57 (a)(c) | 1,029,926 | 1,028,674 | |
| Verus Securitization Trust: | |||
| sequential payer: | |||
| Series 2018-3 Class A1, 4.108% 10/25/58 (c) | 1,308,884 | 1,338,523 | |
| Series 2019-1 Class A1, 3.836% 2/25/59 (c) | 1,368,537 | 1,390,421 | |
| Series 2019-2 Class A1, 3.211% 4/25/59 (c) | 980,000 | 982,264 | |
| Series 2018-2: | |||
| Class A1, 3.677% 6/1/58 (c) | 981,978 | 999,547 | |
| Class A2, 3.779% 6/1/58 (c) | 264,518 | 269,241 | |
| Class A3, 3.83% 6/1/58 (c) | 166,683 | 169,656 | |
| Series 2019-INV1: | |||
| Class A1, 3.402% 12/25/59 (a)(c) | 716,406 | 727,383 | |
| Class M1, 4.034% 12/25/59 (c) | 195,000 | 201,156 | |
| TOTAL PRIVATE SPONSOR | 52,280,444 | ||
| U.S. Government Agency - 0.3% | |||
| Fannie Mae: | |||
| floater Series 2016-85: | |||
| Class FG, 1 month U.S. LIBOR + 0.500% 2.9298% 11/25/46 (a)(b) | 955,391 | 954,039 | |
| Class FA, 1 month U.S. LIBOR + 0.500% 2.9298% 11/25/46 (a)(b) | 948,658 | 946,757 | |
| sequential payer Series 2012-114 Class DF, 1 month U.S. LIBOR + 0.400% 2.8298% 8/25/39 (a)(b) | 12,389 | 12,384 | |
| Series 2016-83 Class FA, 1 month U.S. LIBOR + 0.500% 2.9298% 11/25/46 (a)(b) | 661,762 | 660,392 | |
| Series 2017-90 Class KA, 3% 11/25/47 | 1,044,485 | 1,064,531 | |
| Series 2018-44 Class PC, 4% 6/25/44 | 1,804,972 | 1,857,427 | |
| Fannie Mae Connecticut Avenue Securities floater: | |||
| Series 2016-C07 Class 2M1, 1 month U.S. LIBOR + 1.300% 3.7298% 5/25/29 (a)(b) | 9,977 | 9,980 | |
| Series 2017-C01 Class 1M1, 1 month U.S. LIBOR + 1.300% 3.7298% 7/25/29 (a)(b) | 375,605 | 376,712 | |
| Series 2017-C02, Class 2M1, 1 month U.S. LIBOR + 1.150% 3.5798% 9/25/29 (a)(b) | 602,864 | 603,405 | |
| Series 2017-C03 Class 1M1, 1 month U.S. LIBOR + 0.950% 3.3798% 10/25/29 (a)(b) | 770,674 | 771,774 | |
| Series 2017-C04 Class 2M1, 1 month U.S. LIBOR + 0.850% 3.2798% 11/25/29 (a)(b) | 577,241 | 577,241 | |
| Series 2017-C05 Class 1M1, 1 month U.S. LIBOR + 0.550% 2.9798% 1/25/30 (a)(b) | 623,824 | 624,206 | |
| Series 2017-C06 Class 1M1, 1 month U.S. LIBOR + 0.750% 3.1798% 2/25/30 (a)(b) | 526,627 | 526,626 | |
| Series 2018-C02 Class 2M1, 1 month U.S. LIBOR + 0.650% 3.0798% 8/25/30 (a)(b) | 306,802 | 306,489 | |
| Series 2018-C03 Class 1M1, 1 month U.S. LIBOR + 0.680% 3.1098% 10/25/30 (a)(b) | 1,072,111 | 1,071,016 | |
| FHLMC Structured Agency Credit Risk Debt Notes: | |||
| floater: | |||
| Series 2017-DNA2 Class M1, 1 month U.S. LIBOR + 1.200% 3.6298% 10/25/29 (a)(b) | 1,167,672 | 1,173,526 | |
| Series 2017-DNA3 Class M1, 1 month U.S. LIBOR + 0.750% 3.1798% 3/25/30 (a)(b) | 791,132 | 790,678 | |
| Series 2017-HQA1 Class M1, 1 month U.S. LIBOR + 1.200% 3.6298% 8/25/29 (a)(b) | 627,801 | 629,192 | |
| Series 2017-DNA1 Class M1, 1 month U.S. LIBOR + 1.200% 3.6298% 7/25/29 (a)(b) | 431,026 | 432,287 | |
| Series 2017-HQA2 Class M1, 1 month U.S. LIBOR + 0.800% 3.2298% 12/25/29 (a)(b) | 215,165 | 215,164 | |
| Series 2017-HQA3 Class M1, 1 month U.S. LIBOR + 0.550% 2.9798% 4/25/30 (a)(b) | 113,492 | 113,382 | |
| Freddie Mac: | |||
| floater Series 2013-317 Class F3, 1 month U.S. LIBOR + 0.520% 2.9596% 11/15/43 (a)(b) | 1,091,685 | 1,091,027 | |
| planned amortization class Series 3713 Class PA, 2% 2/15/40 | 723,423 | 716,343 | |
| Series 4448 Class JA, 4% 11/15/36 | 132,933 | 136,727 | |
| Freddie Mac STACR Trust floater: | |||
| Series 18-HQA2 Class M1, 1 month U.S. LIBOR + 0.750% 3.1798% 10/25/48 (a)(b)(c) | 900,000 | 901,246 | |
| Series 2018-DNA3 Class M1, 1 month U.S. LIBOR + 0.750% 3.1798% 9/25/48 (a)(b)(c) | 775,000 | 775,507 | |
| Freddie Mac Whole Loan Securities Trust: | |||
| Series 2016-SC02 Class M1, 3.6074% 10/25/46 (a) | 1,597,616 | 1,603,394 | |
| Series 2017-SC02 Class M1, 3.8617% 5/25/47 (a)(c) | 216,118 | 218,016 | |
| Series 2017-SPI1 Class M1, 3.9816% 9/25/47 (a)(c) | 93,188 | 94,077 | |
| Series 2018-SPI2 Class M1, 3.8179% 5/25/48 (c) | 382,759 | 383,954 | |
| Ginnie Mae guaranteed Multi-family REMIC pass-thru securities floater Series 2018-122 Class FE, 1 month U.S. LIBOR + 0.300% 2.7406% 9/20/48 (a)(b) | 203,796 | 202,692 | |
| Ginnie Mae guaranteed REMIC pass-thru certificates floater: | |||
| Series 2019-21 Class FL, 1 month U.S. LIBOR + 0.450% 2.8906% 2/20/49 (a)(b) | 246,947 | 247,205 | |
| Series 2019-23 Class NF, 1 month U.S. LIBOR + 0.450% 2.8906% 2/20/49 (a)(b) | 192,895 | 193,285 | |
| TOTAL U.S. GOVERNMENT AGENCY | 20,280,681 | ||
| TOTAL COLLATERALIZED MORTGAGE OBLIGATIONS | |||
| (Cost $72,213,616) | 72,561,125 | ||
| Commercial Mortgage Securities - 0.8% | |||
| Atrium Hotel Portfolio Trust floater Series 2017-ATRM Class A 1 month U.S. LIBOR + 0.930% 3.3696% 12/15/36 (a)(b)(c) | 1,395,000 | 1,389,194 | |
| Banc of America Merrill Lynch Large Loan, Inc. floater Series 2018-DSNY Class A, 1 month U.S. LIBOR + 0.850% 3.2896% 9/15/34 (a)(b)(c) | 970,000 | 970,210 | |
| BX Trust: | |||
| floater Series 2018-IND Class A, 1 month U.S. LIBOR + 0.750% 3.1896% 11/15/35 (a)(b)(c) | 824,306 | 823,618 | |
| floater, sequential payer Series 2019-IMC Class A, 1 month U.S. LIBOR + 1.000% 3.5% 4/15/34 (a)(b)(c) | 2,135,000 | 2,137,007 | |
| CGDBB Commercial Mortgage Trust floater Series 2017-BIOC Class A, 1 month U.S. LIBOR + 0.790% 3.2296% 7/15/32 (a)(b)(c) | 3,084,000 | 3,082,141 | |
| Citigroup Commercial Mortgage Trust: | |||
| floater Series 2017-1500 Class A, 1 month U.S. LIBOR + 0.850% 3.2896% 7/15/32 (a)(b)(c) | 2,938,000 | 2,938,916 | |
| Series 2015-GC31 Class A1, 1.637% 6/10/48 | 129,624 | 129,253 | |
| Series 2015-GC33 Class A1, 1.643% 9/10/58 | 124,489 | 123,663 | |
| Series 2015-P1 Class A1, 1.648% 9/15/48 | 99,706 | 99,209 | |
| CLNS Trust floater Series 2017-IKPR: | |||
| Class A, 1 month U.S. LIBOR + 0.800% 3.2534% 6/11/32 (a)(b)(c) | 515,000 | 514,050 | |
| Class B, 1 month U.S. LIBOR + 1.000% 3.4534% 6/11/32 (a)(b)(c) | 760,000 | 759,076 | |
| COMM Mortgage Trust: | |||
| Series 2015-LC23 Class A2, 3.221% 10/10/48 | 1,400,000 | 1,410,070 | |
| Series 2015-PC1 Class A1, 1.667% 7/10/50 | 120,564 | 120,383 | |
| Credit Suisse Mortgage Trust floater Series 2019-ICE4: | |||
| Class A, 1 month U.S. LIBOR + 0.980% 3.443% 5/15/36 (a)(b)(c) | 5,000,000 | 5,000,000 | |
| Class C, 1 month U.S. LIBOR + 1.430% 3.893% 5/15/36 (a)(b)(c) | 1,015,000 | 1,015,000 | |
| Class D, 1 month U.S. LIBOR + 1.600% 4.063% 5/15/36 (a)(b)(c) | 780,000 | 780,000 | |
| CSAIL Commercial Mortgage Trust: | |||
| Series 2015-C1 Class A1, 1.684% 4/15/50 | 22,599 | 22,548 | |
| Series 2015-C3 Class A1, 1.7167% 8/15/48 | 213,359 | 212,030 | |
| Series 2015-C4 Class A1, 2.0102% 11/15/48 | 295,319 | 293,670 | |
| Series 2016-C5 Class A1, 1.7466% 11/15/48 (a) | 48,075 | 47,818 | |
| CSMC Trust Series 2017-CHOP Class A, 1 month U.S. LIBOR + 0.750% 3.1896% 7/15/32 (a)(b)(c) | 4,189,000 | 4,181,261 | |
| Great Wolf Trust floater Series 2017-WOLF: | |||
| Class A, 1 month U.S. LIBOR + 0.850% 3.2896% 9/15/34 (a)(b)(c) | 670,000 | 669,569 | |
| Class C, 1 month U.S. LIBOR + 1.320% 3.7596% 9/15/34 (a)(b)(c) | 965,000 | 964,689 | |
| GS Mortgage Securities Trust: | |||
| floater Series 2018-FBLU: | |||
| Class A 1 month U.S. LIBOR + 0.950% 3.3824% 11/15/35 (a)(b)(c) | 615,000 | 613,979 | |
| Class D 1 month U.S. LIBOR + 2.000% 4.4396% 11/15/35 (a)(b)(c) | 320,000 | 318,520 | |
| Series 2015-GC28 Class A1, 1.528% 2/10/48 | 49,388 | 49,319 | |
| Series 2015-GC32 Class A1, 1.593% 7/10/48 | 69,548 | 69,282 | |
| Series 2016-GS3 Class A1, 1.429% 10/10/49 | 108,426 | 107,264 | |
| Halcyon Loan Advisors Funding LLC Series 2017-3A Class B1R, 3 month U.S. LIBOR + 1.700% 4.2915% 10/22/25 (a)(b)(c) | 745,000 | 744,233 | |
| Intown Hotel Portfolio Trust Series 2018-STAY: | |||
| Class A, 1 month U.S. LIBOR + 0.700% 3.1396% 1/15/33 (a)(b)(c) | 245,000 | 243,290 | |
| Class C, 1 month U.S. LIBOR + 1.250% 3.6896% 1/15/33 (a)(b)(c) | 205,000 | 203,962 | |
| JP Morgan Chase Commercial Mortgage Securities Trust Series 2015-JP1 Class A1, 1.949% 1/15/49 | 149,691 | 149,042 | |
| JPMBB Commercial Mortgage Securities Trust Series 2015-C27 Class A1, 1.4137% 2/15/48 | 64,004 | 63,868 | |
| Morgan Stanley BAML Trust: | |||
| Series 2014-C18 Class A/S, 4.11% 10/15/47 | 370,000 | 392,234 | |
| Series 2014-C19 Class A1, 1.573% 12/15/47 | 43,784 | 43,718 | |
| Series 2015-C24 Class A1, 1.706% 5/15/48 | 223,094 | 221,634 | |
| Series 2016-C30 Class A1, 1.389% 9/15/49 | 191,167 | 188,753 | |
| Morgan Stanley Capital I Trust: | |||
| floater: | |||
| Series 2018-BOP Class A, 1 month U.S. LIBOR + 0.850% 3.2896% 8/15/33 (a)(b)(c) | 5,790,000 | 5,768,198 | |
| Series 2019-AGLN Class A, 1 month U.S. LIBOR + 0.950% 3.3896% 3/15/34 (a)(b)(c) | 3,558,000 | 3,557,993 | |
| Series 2015-MS1 Class A1, 1.638% 5/15/48 | 223,679 | 222,282 | |
| Series 2017-CLS: | |||
| Class B, 1 month U.S. LIBOR + 0.850% 3.2896% 11/15/34 (a)(b)(c) | 755,000 | 752,368 | |
| Class C, 1 month U.S. LIBOR + 1.000% 3.4396% 11/15/34 (a)(b)(c) | 605,000 | 602,513 | |
| New Orleans Hotel Trust floater Series 2019-HNLA Class B, 1 month U.S. LIBOR + 1.289% 3.7887% 4/15/32 (a)(b)(c) | 1,585,000 | 1,580,593 | |
| RETL floater Series 2019-RVP Class A, 1 month U.S. LIBOR + 1.150% 3.5896% 3/15/36 (a)(b)(c) | 2,734,688 | 2,735,654 | |
| SBA Tower Trust 3.168% 4/9/47 (c) | 915,000 | 922,477 | |
| Slide floater Series 2018-FUN Class D, 1 month U.S. LIBOR + 1.850% 4.2896% 6/15/31 (a)(b)(c) | 810,235 | 812,612 | |
| UBS-Barclays Commercial Mortgage Trust floater Series 2013-C6 Class A3, 1 month U.S. LIBOR + 0.790% 3.2414% 4/10/46 (a)(b)(c) | 3,109,986 | 3,144,932 | |
| Verus Securitization Trust Series 2018-1 Class A1, 2.929% 2/25/48 (a)(c) | 210,892 | 210,751 | |
| Waldorf Astoria Boca Raton Trust floater Series 2016-BOCA Class A, 1 month U.S. LIBOR + 1.350% 3.7896% 6/15/29 (a)(b)(c) | 1,833,000 | 1,831,907 | |
| Wells Fargo Commercial Mortgage Trust: | |||
| Series 2015-C31 Class A1, 1.679% 11/15/48 | 37,365 | 37,306 | |
| Series 2015-NXS2 Class A2, 3.02% 7/15/58 | 1,180,000 | 1,179,733 | |
| Series 2015-SG1 Class A1, 1.568% 9/15/48 | 62,060 | 61,899 | |
| Series 2016-C32 Class A1, 1.577% 1/15/59 | 206,175 | 204,665 | |
| Series 2016-LC24 Class A1, 1.441% 10/15/49 | 53,966 | 53,731 | |
| WF-RBS Commercial Mortgage Trust: | |||
| floater Series 2013-C14 Class A3, 1 month U.S. LIBOR + 0.720% 3.1524% 6/15/46 (a)(b)(c) | 3,296,960 | 3,297,597 | |
| Series 2012-C6 Class B, 4.697% 4/15/45 | 760,000 | 794,911 | |
| TOTAL COMMERCIAL MORTGAGE SECURITIES | |||
| (Cost $58,980,157) | 58,864,595 | ||
| Municipal Securities - 0.0% | |||
| Florida State Board Administration Fin. Corp. Series 2016 A, 2.163% 7/1/19 | |||
| (Cost $1,085,000) | 1,085,000 | 1,084,732 | |
| Bank Notes - 0.2% | |||
| Capital One NA 2.35% 1/31/20 | 1,760,000 | 1,756,372 | |
| Citibank NA: | |||
| 2.125% 10/20/20 | $1,255,000 | $1,248,555 | |
| 2.844% 5/20/22 (a) | 1,235,000 | 1,238,274 | |
| Citizens Bank NA: | |||
| 2.25% 10/30/20 | 250,000 | 248,827 | |
| 3.25% 2/14/22 | 615,000 | 624,293 | |
| Discover Bank 3.1% 6/4/20 | 965,000 | 967,982 | |
| Huntington National Bank 2.375% 3/10/20 | 1,465,000 | 1,463,462 | |
| JP Morgan Chase Bank NA 2.604% 2/1/21 (a)(b) | 595,000 | 594,595 | |
| PNC Bank NA 2.45% 11/5/20 | 870,000 | 870,297 | |
| SunTrust Bank: | |||
| 2.59% 1/29/21 (a) | 1,540,000 | 1,539,794 | |
| 2.8% 5/17/22 | 965,000 | 967,509 | |
| Svenska Handelsbanken AB 3.35% 5/24/21 | 1,105,000 | 1,123,425 | |
| Synchrony Bank 3.65% 5/24/21 | 3,082,000 | 3,122,859 | |
| TOTAL BANK NOTES | |||
| (Cost $15,729,225) | 15,766,244 | ||
| Certificates of Deposit - 0.1% | |||
| Natexis Banques Populaires New York Branch yankee 2.68% 12/27/19 | |||
| (Cost $4,000,000) | 4,000,000 | 4,003,561 | |
| Commercial Paper - 0.5% | |||
| Catholic Health Initiatives: | |||
| 3.05% 7/17/19 | 11,000,000 | 10,964,441 | |
| 3.05% 7/17/19 | 4,000,000 | 3,987,070 | |
| Duke Energy Corp. 2.79% 6/18/19 | 10,000,000 | 9,986,800 | |
| Intesa Funding LLC 3% 8/26/19 | 2,000,000 | 1,986,037 | |
| Sempra Global 2.88% 8/26/19 | 5,000,000 | 4,966,807 | |
| TransCanada PipeLines Ltd. 2.81% 8/1/19 | 5,000,000 | 4,976,561 | |
| TOTAL COMMERCIAL PAPER | |||
| (Cost $36,855,827) | 36,867,716 | ||
| Shares | Value | ||
| Fixed-Income Funds - 1.6% | |||
| Bank Loan Funds - 1.6% | |||
| Fidelity Floating Rate High Income Fund (e) | |||
| (Cost $112,422,745) | 11,868,187 | 112,629,093 | |
| Short-Term Funds - 59.7% | |||
| Short-Term Funds - 59.7% | |||
| Baird Short-Term Bond Fund - Institutional Class | 26,190,320 | 254,308,010 | |
| BlackRock Low Duration Bond Portfolio Investor A Shares | 47,517,910 | 455,221,578 | |
| Fidelity Conservative Income Bond Fund Institutional Class (e) | 6,320,143 | 63,454,234 | |
| Fidelity Short-Term Bond Fund (e) | 72,195,999 | 624,495,388 | |
| iShares Short Maturity Bond ETF (f) | 1,870,665 | 94,113,156 | |
| iShares Short Treasury Bond ETF | 1,947,280 | 215,388,641 | |
| JPMorgan Ultra-Short Income ETF | 2,787,145 | 140,360,622 | |
| Metropolitan West Low Duration Bond Fund - Class M | 33,632,724 | 293,613,678 | |
| PIMCO Enhanced Low Duration Active ETF | 253,760 | 25,356,968 | |
| PIMCO Enhanced Short Maturity Active ETF | 1,492,385 | 151,790,478 | |
| PIMCO Short-Term Fund - Administrator Class | 183,639,358 | 1,797,829,313 | |
| Prudential Short-Term Corporate Bond Fund, Inc. Class A | 13,159,410 | 144,490,325 | |
| TOTAL SHORT-TERM FUNDS | |||
| (Cost $4,254,197,864) | 4,260,422,391 | ||
| Money Market Funds - 1.1% | |||
| Fidelity Cash Central Fund 2.41%(g) | 49,721,105 | 49,731,050 | |
| Fidelity Investments Money Market Government Portfolio Institutional Class 2.31% (e)(h) | 3,013,983 | 3,013,983 | |
| Fidelity Securities Lending Cash Central Fund 2.42% (g)(i) | 4,664,574 | 4,665,040 | |
| State Street Institutional U.S. Government Money Market Fund Premier Class 2.32% (h) | 20,611,841 | 20,611,841 | |
| TOTAL MONEY MARKET FUNDS | |||
| (Cost $78,016,939) | 78,021,914 | ||
| TOTAL INVESTMENT IN SECURITIES - 100.2% | |||
| (Cost $7,139,308,283) | 7,155,812,067 | ||
| NET OTHER ASSETS (LIABILITIES) - (0.2)% | (11,059,050) | ||
| NET ASSETS - 100% | $7,144,753,017 |
| Futures Contracts | |||||
| Number of contracts | Expiration Date | Notional Amount | Value | Unrealized Appreciation/(Depreciation) | |
| Purchased | |||||
| Treasury Contracts | |||||
| CBOT 2-Year U.S. Treasury Note Contracts (United States) | 527 | Sept. 2019 | $113,132,078 | $358,240 | $358,240 |
The notional amount of futures purchased as a percentage of Net Assets is 1.6%
Security Type Abbreviations
ETF – Exchange-Traded Fund
Legend
(a) Coupon rates for floating and adjustable rate securities reflect the rates in effect at period end.
(b) Coupon is indexed to a floating interest rate which may be multiplied by a specified factor and/or subject to caps or floors.
(c) Security exempt from registration under Rule 144A of the Securities Act of 1933. These securities may be resold in transactions exempt from registration, normally to qualified institutional buyers. At the end of the period, the value of these securities amounted to $709,801,044 or 9.9% of net assets.
(d) Security or a portion of the security was pledged to cover margin requirements for futures contracts. At period end, the value of securities pledged amounted to $314,423.
(e) Affiliated Fund
(f) Security or a portion of the security is on loan at period end.
(g) Affiliated fund that is generally available only to investment companies and other accounts managed by Fidelity Investments. The rate quoted is the annualized seven-day yield of the fund at period end. A complete unaudited listing of the fund's holdings as of its most recent quarter end is available upon request. In addition, each Fidelity Central Fund's financial statements, which are not covered by the Fund's Report of Independent Registered Public Accounting Firm, are available on the SEC's website or upon request.
(h) The rate quoted is the annualized seven-day yield of the fund at period end.
(i) Investment made with cash collateral received from securities on loan.
Affiliated Central Funds
Information regarding fiscal year to date income earned by the Fund from investments in Fidelity Central Funds is as follows:
| Fund | Income earned |
| Fidelity Cash Central Fund | $804,526 |
| Fidelity Securities Lending Cash Central Fund | 362,089 |
| Total | $1,166,615 |
Amounts in the income column in the above table include any capital gain distributions from underlying funds, which are presented in the corresponding line-item in the Statement of Operations, if applicable.
Affiliated Underlying Funds
Fiscal year to date information regarding the Fund's investments in affiliated Underlying Funds, excluding any Money Market Central Funds, is presented below. Exchanges between classes of the same affiliated Underlying Funds may occur. Certain Underlying Funds incurred name changes since their most recent shareholder report. The names of the Underlying Funds are those in effect at period end.
| Affiliate | Value, beginning of period | Purchases | Sales Proceeds | Dividend Income | Realized Gain (loss) | Change in Unrealized appreciation (depreciation) | Value, end of period |
| Fidelity Conservative Income Bond Fund Institutional Class | $1,179,081,935 | $48,378,525 | $1,163,175,182 | $5,278,269 | $302,049 | $(1,133,093) | $63,454,234 |
| Fidelity Floating Rate High Income Fund | 353,310,639 | 21,474,837 | 257,423,292 | 14,026,395 | (9,807,434) | 5,074,343 | 112,629,093 |
| Fidelity Investments Money Market Government Portfolio Institutional Class 2.31% | 216,550,243 | 3,638,576 | 217,174,836 | 199,253 | -- | -- | 3,013,983 |
| Fidelity Investments Money Market Prime Reserves Portfolio - Institutional Class 2.44% | 228,801,490 | 2,685,275 | 231,467,063 | 2,328,860 | 3,187 | (22,889) | -- |
| Fidelity Short-Term Bond Fund | 608,681,152 | 12,140,328 | 5,730,665 | 11,269,810 | 13,503 | 9,391,070 | 624,495,388 |
| Total | $2,586,425,459 | $88,317,541 | $1,874,971,038 | $33,102,587 | $(9,488,695) | $13,309,431 | $803,592,698 |
Amounts in the income column in the above table include any capital gain distributions from underlying funds, which are presented in the corresponding line-item in the Statement of Operations, if applicable.
Investment Valuation
The following is a summary of the inputs used, as of May 31, 2019, involving the Fund's assets and liabilities carried at fair value. The inputs or methodology used for valuing securities may not be an indication of the risk associated with investing in those securities. For more information on valuation inputs, and their aggregation into the levels used below, please refer to the Investment Valuation section in the accompanying Notes to Financial Statements.
| Valuation Inputs at Reporting Date: | ||||
| Description | Total | Level 1 | Level 2 | Level 3 |
| Investments in Securities: | ||||
| Corporate Bonds | $1,733,275,600 | $-- | $1,733,275,600 | $-- |
| U.S. Government and Government Agency Obligations | 187,117,740 | -- | 187,117,740 | -- |
| U.S. Government Agency - Mortgage Securities | 30,337,734 | -- | 30,337,734 | -- |
| Asset-Backed Securities | 564,859,622 | -- | 564,859,622 | -- |
| Collateralized Mortgage Obligations | 72,561,125 | -- | 72,561,125 | -- |
| Commercial Mortgage Securities | 58,864,595 | -- | 58,864,595 | -- |
| Municipal Securities | 1,084,732 | -- | 1,084,732 | -- |
| Bank Notes | 15,766,244 | -- | 15,766,244 | -- |
| Certificates of Deposit | 4,003,561 | -- | 4,003,561 | -- |
| Commercial Paper | 36,867,716 | -- | 36,867,716 | -- |
| Fixed-Income Funds | 112,629,093 | 112,629,093 | -- | -- |
| Short-Term Funds | 4,260,422,391 | 4,260,422,391 | -- | -- |
| Money Market Funds | 78,021,914 | 78,021,914 | -- | -- |
| Total Investments in Securities: | $7,155,812,067 | $4,451,073,398 | $2,704,738,669 | $-- |
| Derivative Instruments: | ||||
| Assets | ||||
| Futures Contracts | $358,240 | $358,240 | $-- | $-- |
| Total Assets | $358,240 | $358,240 | $-- | $-- |
| Total Derivative Instruments: | $358,240 | $358,240 | $-- | $-- |
Value of Derivative Instruments
The following table is a summary of the Fund's value of derivative instruments by primary risk exposure as of May 31, 2019. For additional information on derivative instruments, please refer to the Derivative Instruments section in the accompanying Notes to Financial Statements.
| Primary Risk Exposure / Derivative Type | Value | |
| Asset | Liability | |
| Interest Rate Risk | ||
| Futures Contracts(a) | $358,240 | $0 |
| Total Interest Rate Risk | 358,240 | 0 |
| Total Value of Derivatives | $358,240 | $0 |
(a) Reflects gross cumulative appreciation (depreciation) on futures contracts as presented in the Schedule of Investments. In the Statement of Assets and Liabilities, the period end daily variation margin is included in receivable or payable for daily variation margin on futures contracts, and the net cumulative appreciation (depreciation) is included in distributable earnings.
See accompanying notes which are an integral part of the financial statements.
Financial Statements
Statement of Assets and Liabilities
| May 31, 2019 | ||
| Assets | ||
| Investment in securities, at value (including securities loaned of $4,553,055) — See accompanying schedule: Unaffiliated issuers (cost $6,289,612,640) | $6,297,823,279 | |
| Fidelity Central Funds (cost $54,391,115) | 54,396,090 | |
| Other affiliated issuers (cost $795,304,528) | 803,592,698 | |
| Total Investment in Securities (cost $7,139,308,283) | $7,155,812,067 | |
| Cash | 278,363 | |
| Receivable for investments sold | 1,904,281 | |
| Receivable for fund shares sold | 5,229,046 | |
| Dividends receivable | 328,996 | |
| Interest receivable | 10,708,463 | |
| Distributions receivable from Fidelity Central Funds | 109,699 | |
| Receivable for daily variation margin on futures contracts | 284,086 | |
| Prepaid expenses | 26,381 | |
| Other receivables | 114,439 | |
| Total assets | 7,174,795,821 | |
| Liabilities | ||
| Payable for investments purchased | $17,381,794 | |
| Payable for fund shares redeemed | 6,404,516 | |
| Distributions payable | 1,063,551 | |
| Accrued management fee | 240,897 | |
| Other affiliated payables | 104,614 | |
| Other payables and accrued expenses | 186,682 | |
| Collateral on securities loaned | 4,660,750 | |
| Total liabilities | 30,042,804 | |
| Net Assets | $7,144,753,017 | |
| Net Assets consist of: | ||
| Paid in capital | $7,177,777,467 | |
| Total distributable earnings (loss) | (33,024,450) | |
| Net Assets, for 711,697,818 shares outstanding | $7,144,753,017 | |
| Net Asset Value, offering price and redemption price per share ($7,144,753,017 ÷ 711,697,818 shares) | $10.04 |
See accompanying notes which are an integral part of the financial statements.
Statement of Operations
| Year ended May 31, 2019 | ||
| Investment Income | ||
| Dividends: | ||
| Unaffiliated issuers | $85,694,846 | |
| Affiliated issuers | 33,102,587 | |
| Interest | 76,804,776 | |
| Income from Fidelity Central Funds | 1,166,615 | |
| Total income | 196,768,824 | |
| Expenses | ||
| Management fee | $21,859,400 | |
| Transfer agent fees | 394,197 | |
| Accounting and security lending fees | 1,282,316 | |
| Custodian fees and expenses | 62,736 | |
| Independent trustees' fees and expenses | 90,670 | |
| Registration fees | 72,406 | |
| Audit | 72,104 | |
| Legal | 29,380 | |
| Miscellaneous | 89,197 | |
| Total expenses before reductions | 23,952,406 | |
| Expense reductions | (18,973,982) | |
| Total expenses after reductions | 4,978,424 | |
| Net investment income (loss) | 191,790,400 | |
| Realized and Unrealized Gain (Loss) | ||
| Net realized gain (loss) on: | ||
| Investment securities: | ||
| Unaffiliated issuers | (17,413,640) | |
| Fidelity Central Funds | (4,118) | |
| Other affiliated issuers | (9,488,695) | |
| Foreign currency transactions | (24,373) | |
| Futures contracts | 1,090,229 | |
| Capital gain distributions from underlying funds: | ||
| Unaffiliated issuers | 2,876,783 | |
| Total net realized gain (loss) | (22,963,814) | |
| Change in net unrealized appreciation (depreciation) on: | ||
| Investment securities: | ||
| Unaffiliated issuers | 19,569,804 | |
| Fidelity Central Funds | 4,975 | |
| Other affiliated issuers | 13,309,431 | |
| Futures contracts | 94,546 | |
| Total change in net unrealized appreciation (depreciation) | 32,978,756 | |
| Net gain (loss) | 10,014,942 | |
| Net increase (decrease) in net assets resulting from operations | $201,805,342 |
See accompanying notes which are an integral part of the financial statements.
Statement of Changes in Net Assets
| Year ended May 31, 2019 | Year ended May 31, 2018 | |
| Increase (Decrease) in Net Assets | ||
| Operations | ||
| Net investment income (loss) | $191,790,400 | $162,578,435 |
| Net realized gain (loss) | (22,963,814) | (16,304,670) |
| Change in net unrealized appreciation (depreciation) | 32,978,756 | (20,235,206) |
| Net increase (decrease) in net assets resulting from operations | 201,805,342 | 126,038,559 |
| Distributions to shareholders | (196,218,113) | – |
| Distributions to shareholders from net investment income | – | (154,361,140) |
| Total distributions | (196,218,113) | (154,361,140) |
| Share transactions | ||
| Proceeds from sales of shares | 2,337,683,827 | 2,773,274,712 |
| Reinvestment of distributions | 184,555,853 | 129,216,516 |
| Cost of shares redeemed | (4,224,267,039) | (3,953,912,621) |
| Net increase (decrease) in net assets resulting from share transactions | (1,702,027,359) | (1,051,421,393) |
| Total increase (decrease) in net assets | (1,696,440,130) | (1,079,743,974) |
| Net Assets | ||
| Beginning of period | 8,841,193,147 | 9,920,937,121 |
| End of period | $7,144,753,017 | $8,841,193,147 |
| Other Information | ||
| Undistributed net investment income end of period | $11,143,546 | |
| Shares | ||
| Sold | 233,616,566 | 276,147,746 |
| Issued in reinvestment of distributions | 18,458,739 | 12,870,517 |
| Redeemed | (422,246,045) | (393,872,603) |
| Net increase (decrease) | (170,170,740) | (104,854,340) |
See accompanying notes which are an integral part of the financial statements.
Financial Highlights
Strategic Advisers Short Duration Fund
| Years ended May 31, | 2019 | 2018 | 2017 | 2016 | 2015 |
| Selected Per–Share Data | |||||
| Net asset value, beginning of period | $10.03 | $10.05 | $10.01 | $10.07 | $10.10 |
| Income from Investment Operations | |||||
| Net investment income (loss)A | .254 | .168 | .136 | .115 | .095 |
| Net realized and unrealized gain (loss) | .018 | (.028) | .033 | (.051) | (.028) |
| Total from investment operations | .272 | .140 | .169 | .064 | .067 |
| Distributions from net investment income | (.259) | (.160) | (.129) | (.118) | (.093) |
| Distributions from net realized gain | (.003) | – | – | (.006) | (.004) |
| Total distributions | (.262) | (.160) | (.129) | (.124) | (.097) |
| Net asset value, end of period | $10.04 | $10.03 | $10.05 | $10.01 | $10.07 |
| Total ReturnB,C | 2.75% | 1.40% | 1.69% | .64% | .66% |
| Ratios to Average Net AssetsD,E | |||||
| Expenses before reductions | .32% | .35% | .36% | .36% | .35% |
| Expenses net of fee waivers, if any | .07% | .10% | .10% | .11% | .10% |
| Expenses net of all reductions | .07% | .10% | .10% | .11% | .10% |
| Net investment income (loss) | 2.54% | 1.67% | 1.36% | 1.15% | .94% |
| Supplemental Data | |||||
| Net assets, end of period (000 omitted) | $7,144,753 | $8,841,193 | $9,920,937 | $6,593,754 | $7,262,264 |
| Portfolio turnover rateF | 33% | 25% | 26% | 33% | 16% |
A Calculated based on average shares outstanding during the period.
B Total returns for periods of less than one year are not annualized.
C Total returns would have been lower if certain expenses had not been reduced during the applicable periods shown.
D Fees and expenses of any underlying Fidelity Central Funds are not included in the Fund's expense ratio. The Fund indirectly bears its proportionate share of the expenses of any underlying Fidelity Central Funds.
E Expense ratios reflect operating expenses of the Fund. Expenses before reductions do not reflect amounts reimbursed by the investment adviser or reductions from brokerage service arrangements or reductions from other expense offset arrangements and do not represent the amount paid by the Fund during periods when reimbursements or reductions occur. Expenses net of fee waivers reflect expenses after reimbursement by the investment adviser but prior to reductions from brokerage service arrangements or other expense offset arrangements. Expenses net of all reductions represent the net expenses paid by the Fund. Fees and expenses of the Underlying Funds are not included in the Fund's annualized ratios. The Fund indirectly bears its proportionate share of the expenses of the Underlying Funds.
F Amount does not include the portfolio activity of any Underlying Funds.
See accompanying notes which are an integral part of the financial statements.
Notes to Financial Statements
For the period ended May 31, 2019
1. Organization.
Strategic Advisers Short Duration Fund (the Fund) is a fund of Fidelity Rutland Square Trust II (the Trust), and is authorized to issue an unlimited number of shares. The Trust is registered under the Investment Company Act of 1940, as amended (the 1940 Act), as an open-end management investment company organized as a Delaware statutory trust. The Fund is offered exclusively to certain clients of Strategic Advisers LLC (Strategic Advisers), an affiliate of Fidelity Management & Research Company (FMR).
2. Significant Accounting Policies.
The Fund is an investment company and applies the accounting and reporting guidance of the Financial Accounting Standards Board (FASB) Accounting Standards Codification Topic 946 Financial Services – Investments Companies. The financial statements have been prepared in conformity with accounting principles generally accepted in the United States of America (GAAP), which require management to make certain estimates and assumptions at the date of the financial statements. Actual results could differ from those estimates. Subsequent events, if any, through the date that the financial statements were issued have been evaluated in the preparation of the financial statements. The following summarizes the significant accounting policies of the Fund:
Investment Valuation. Investments are valued as of 4:00 p.m. Eastern time on the last calendar day of the period. The Board of Trustees (the Board) has delegated the day to day responsibility for the valuation of the Fund's investments to the Fair Value Committee (the Committee) established by the Fund's investment adviser. In accordance with valuation policies and procedures approved by the Board, the Fund attempts to obtain prices from one or more third party pricing vendors or brokers to value its investments. When current market prices, quotations or currency exchange rates are not readily available or reliable, investments will be fair valued in good faith by the Committee, in accordance with procedures adopted by the Board. Factors used in determining fair value vary by investment type and may include market or investment specific events, changes in interest rates and credit quality. The frequency with which these procedures are used cannot be predicted and they may be utilized to a significant extent. The Committee oversees the Fund's valuation policies and procedures and reports to the Board on the Committee's activities and fair value determinations. The Board monitors the appropriateness of the procedures used in valuing the Fund's investments and ratifies the fair value determinations of the Committee.
The Fund categorizes the inputs to valuation techniques used to value its investments into a disclosure hierarchy consisting of three levels as shown below:
- Level 1 – quoted prices in active markets for identical investments
- Level 2 – other significant observable inputs (including quoted prices for similar investments, interest rates, prepayment speeds, etc.)
- Level 3 – unobservable inputs (including the Fund's own assumptions based on the best information available)
Valuation techniques used to value the Fund's investments by major category are as follows:
Debt securities, including restricted securities, are valued based on evaluated prices received from third party pricing vendors or from brokers who make markets in such securities. Corporate bonds, bank notes, municipal securities, U.S. government and government agency obligations, commercial paper and certificates of deposit are valued by pricing vendors who utilize matrix pricing which considers yield or price of bonds of comparable quality, coupon, maturity and type or by broker-supplied prices. Asset backed securities, collateralized mortgage obligations, commercial mortgage securities and U.S. government agency mortgage securities are valued by pricing vendors who utilize matrix pricing which considers prepayment speed assumptions, attributes of the collateral, yield or price of bonds of comparable quality, coupon, maturity and type or by broker-supplied prices. When independent prices are unavailable or unreliable, debt securities may be valued utilizing pricing methodologies which consider similar factors that would be used by third party pricing vendors. Debt securities are generally categorized as Level 2 in the hierarchy but may be Level 3 depending on the circumstances.
Exchange-Traded Funds (ETFs) are valued at their last sale price or official closing price as reported by a third party pricing vendor on the primary market or exchange on which they are traded and are categorized as Level 1 in the hierarchy. In the event there were no sales during the day but the exchange reports a closing bid level, ETFs are valued at the closing bid and would be categorized as Level 1 in the hierarchy. In the event there was no closing bid, ETFs may be valued by another method that the Board believes reflects fair value in accordance with the Board's fair value pricing policies and may be categorized as Level 2 in the hierarchy.
Futures contracts are valued at the settlement price established each day by the board of trade or exchange on which they are traded and are categorized as Level 1 in the hierarchy. Investments in open-end mutual funds, including the Fidelity Central Funds, are valued at their closing net asset value (NAV) each business day and are categorized as Level 1 in the hierarchy. If an unaffiliated open-end mutual fund's NAV is unavailable, shares of that fund may be valued by another method that the Board believes reflects fair value in accordance with the Board's fair value pricing policies and is categorized as Level 2 in the hierarchy.
Changes in valuation techniques may result in transfers in or out of an assigned level within the disclosure hierarchy. The aggregate value of investments by input level as of May 31, 2019 is included at the end of the Fund's Schedule of Investments.
Foreign Currency. The Fund may use foreign currency contracts to facilitate transactions in foreign-denominated securities. Gains and losses from these transactions may arise from changes in the value of the foreign currency or if the counterparties do not perform under the contracts' terms.
Foreign-denominated assets, including investment securities, and liabilities are translated into U.S. dollars at the exchange rates at period end. Purchases and sales of investment securities, income and dividends received and expenses denominated in foreign currencies are translated into U.S. dollars at the exchange rate in effect on the transaction date.
The effects of exchange rate fluctuations on investments are included with the net realized and unrealized gain (loss) on investment securities. Other foreign currency transactions resulting in realized and unrealized gain (loss) are disclosed separately.
Investment Transactions and Income. For financial reporting purposes, the Fund's investment holdings and NAV include trades executed through the end of the last business day of the period. The NAV per share for processing shareholder transactions is calculated as of the close of business of the New York Stock Exchange (NYSE), normally 4:00 p.m. Eastern time and includes trades executed through the end of the prior business day. Gains and losses on securities sold are determined on the basis of identified cost and include proceeds received from litigation. Dividend income is recorded on the ex-dividend date, except for certain dividends from foreign securities where the ex-dividend date may have passed, which are recorded as soon as the Fund is informed of the ex-dividend date. Non-cash dividends included in dividend income, if any, are recorded at the fair market value of the securities received. Income and capital gain distributions from Fidelity Central Funds, if any, are recorded on the ex-dividend date. Income and capital gain distributions from Underlying Funds and distributions from ETFs, if any, are recorded on the ex-dividend date. Certain distributions received by the Fund represent a return of capital or capital gain. The Fund determines the components of these distributions subsequent to the ex-dividend date, based upon receipt of tax filings or other correspondence relating to the underlying investment. These distributions are recorded as a reduction of cost of investments and/or as a realized gain. Interest income is accrued as earned and includes coupon interest and amortization of premium and accretion of discount on debt securities as applicable. The principal amount on inflation-indexed securities is periodically adjusted to the rate of inflation and interest is accrued based on the principal amount. The adjustments to principal due to inflation are reflected as increases or decreases to Interest in the accompanying Statement of Operations. Investment income is recorded net of foreign taxes withheld where recovery of such taxes is uncertain. Debt obligations may be placed on non-accrual status and related interest income may be reduced by ceasing current accruals and writing off interest receivables when the collection of all or a portion of interest has become doubtful based on consistently applied procedures. A debt obligation is removed from non-accrual status when the issuer resumes interest payments or when collectability of interest is reasonably assured.
Expenses. Expenses directly attributable to a fund are charged to that fund. Expenses attributable to more than one fund are allocated among the respective funds on the basis of relative net assets or other appropriate methods. Expense estimates are accrued in the period to which they relate and adjustments are made when actual amounts are known.
Deferred Trustee Compensation. Under a Deferred Compensation Plan (the Plan), certain independent Trustees have elected to defer receipt of a portion of their annual compensation. Deferred amounts are invested in a cross-section of Strategic Advisers funds, are marked-to-market and remain in the Fund until distributed in accordance with the Plan. The investment of deferred amounts and the offsetting payable to the Trustees of $113,164 are included in the accompanying Statement of Assets and Liabilities in other receivables and other payables and accrued expenses, respectively.
Income Tax Information and Distributions to Shareholders. Each year, the Fund intends to qualify as a regulated investment company under Subchapter M of the Internal Revenue Code, including distributing substantially all of its taxable income and realized gains. As a result, no provision for U.S. Federal income taxes is required. As of May 31, 2019, the Fund did not have any unrecognized tax benefits in the financial statements; nor is the Fund aware of any tax positions for which it is reasonably possible that the total amounts of unrecognized tax benefits will significantly change in the next twelve months. The Fund files a U.S. federal tax return, in addition to state and local tax returns as required. The Fund's federal income tax returns are subject to examination by the Internal Revenue Service (IRS) for a period of three fiscal years after they are filed. State and local tax returns may be subject to examination for an additional fiscal year depending on the jurisdiction. Foreign taxes are provided for based on the Fund's understanding of the tax rules and rates that exist in the foreign markets in which it invests.
Distributions are declared and recorded daily and paid monthly from net investment income. Distributions from realized gains, if any, are declared and recorded on the ex-dividend date. Income and capital gain distributions are determined in accordance with income tax regulations, which may differ from GAAP.
Capital accounts within the financial statements are adjusted for permanent book-tax differences. These adjustments have no impact on net assets or the results of operations. Capital accounts are not adjusted for temporary book-tax differences which will reverse in a subsequent period.
Book-tax differences are primarily due to the short-term gain distributions from the Underlying Funds, market discount, capital loss carryforwards, futures contracts, foreign currency transactions, deferred trustees compensation and losses deferred due to wash sales.
As of period end, the cost and unrealized appreciation (depreciation) in securities, and derivatives if applicable, for federal income tax purposes were as follows:
| Gross unrealized appreciation | $31,653,973 |
| Gross unrealized depreciation | (14,870,942) |
| Net unrealized appreciation (depreciation) | $16,783,031 |
| Tax Cost | $7,139,029,036 |
The tax-based components of distributable earnings as of period end were as follows:
| Undistributed ordinary income | $6,953,348 |
| Capital loss carryforward | $(56,647,665) |
| Net unrealized appreciation (depreciation) on securities and other investments | $16,783,031 |
Capital loss carryforwards are only available to offset future capital gains of the Fund to the extent provided by regulations and may be limited. Under the Regulated Investment Company Modernization Act of 2010 (the Act), the Fund is permitted to carry forward capital losses incurred in taxable years beginning after December 22, 2010 for an unlimited period and such capital losses are required to be used prior to any losses that expire. The capital loss carryforward information presented below, including any applicable limitation, is estimated as of fiscal period end and is subject to adjustment.
| No expiration | |
| Short-term | $(4,089,563) |
| Long-term | (52,558,102) |
| Total capital loss carryforward | $(56,647,665) |
The tax character of distributions paid was as follows:
| May 31, 2019 | May 31, 2018 | |
| Ordinary Income | $196,218,113 | $ 154,361,140 |
Restricted Securities. The Fund may invest in securities that are subject to legal or contractual restrictions on resale. These securities generally may be resold in transactions exempt from registration or to the public if the securities are registered. Disposal of these securities may involve time-consuming negotiations and expense, and prompt sale at an acceptable price may be difficult. Information regarding restricted securities is included at the end of the Fund's Schedule of Investments.
New Rule Issuance. During August 2018, the U.S. Securities and Exchange Commission issued Final Rule Release No. 33-10532, Disclosure Update and Simplification. This Final Rule includes amendments specific to registered investment companies that are intended to eliminate overlap in disclosure requirements between Regulation S-X and GAAP. In accordance with these amendments, certain line-items in the Fund's financial statements have been combined or removed for the current period as outlined in the table below.
| Financial Statement | Current Line-Item Presentation (As Applicable) | Prior Line-Item Presentation (As Applicable) |
| Statement of Assets and Liabilities | Total distributable earnings (loss) | Undistributed/Distributions in excess of/Accumulated net investment income (loss) Accumulated/Undistributed net realized gain (loss) Net unrealized appreciation (depreciation) |
| Statement of Changes in Net Assets | N/A - removed | Undistributed/Distributions in excess of/Accumulated net investment income (loss) end of period |
| Statement of Changes in Net Assets | Distributions to shareholders | Distributions to shareholders from net investment income Distributions to shareholders from net realized gain |
3. Derivative Instruments.
Risk Exposures and the Use of Derivative Instruments. The Fund's investment objective allows the Fund to enter into various types of derivative contracts, including futures contracts. Derivatives are investments whose value is primarily derived from underlying assets, indices or reference rates and may be transacted on an exchange or over-the-counter (OTC). Derivatives may involve a future commitment to buy or sell a specified asset based on specified terms, to exchange future cash flows at periodic intervals based on a notional principal amount, or for one party to make one or more payments upon the occurrence of specified events in exchange for periodic payments from the other party.
The Fund used derivatives to increase returns and to manage exposure to certain risks as defined below. The success of any strategy involving derivatives depends on analysis of numerous economic factors, and if the strategies for investment do not work as intended, the Fund may not achieve its objectives.
The Fund's use of derivatives increased or decreased its exposure to the following risk:
| Interest Rate Risk | Interest rate risk relates to the fluctuations in the value of interest-bearing securities due to changes in the prevailing levels of market interest rates. |
The Fund is also exposed to additional risks from investing in derivatives, such as liquidity risk and counterparty credit risk. Liquidity risk is the risk that the Fund will be unable to close out the derivative in the open market in a timely manner. Counterparty credit risk is the risk that the counterparty will not be able to fulfill its obligation to the Fund. Counterparty credit risk related to exchange-traded futures contracts may be mitigated by the protection provided by the exchange on which they trade.
Investing in derivatives may involve greater risks than investing in the underlying assets directly and, to varying degrees, may involve risk of loss in excess of any initial investment and collateral received and amounts recognized in the Statement of Assets and Liabilities. In addition, there may be the risk that the change in value of the derivative contract does not correspond to the change in value of the underlying instrument.
Futures Contracts. A futures contract is an agreement between two parties to buy or sell a specified underlying instrument for a fixed price at a specified future date. The Fund used futures contracts to manage its exposure to the bond market and fluctuations in interest rates.
Upon entering into a futures contract, a fund is required to deposit either cash or securities (initial margin) with a clearing broker in an amount equal to a certain percentage of the face value of the contract. Futures contracts are marked-to-market daily and subsequent daily payments (variation margin) are made or received by a fund depending on the daily fluctuations in the value of the futures contracts and are recorded as unrealized appreciation or (depreciation). This receivable and/or payable, if any, is included in daily variation margin on futures contracts in the Statement of Assets and Liabilities. Realized gain or (loss) is recorded upon the expiration or closing of a futures contract. The net realized gain (loss) and change in net unrealized appreciation (depreciation) on futures contracts during the period is presented in the Statement of Operations.
Any open futures contracts at period end are presented in the Schedule of Investments under the caption "Futures Contracts". The notional amount at value reflects each contract's exposure to the underlying instrument or index at period end and is representative of volume of activity during the period. Securities deposited to meet initial margin requirements are identified in the Schedule of Investments.
4. Purchases and Sales of Investments.
Purchases and sales of securities (including the Underlying Fund shares), other than short-term securities and U.S. government securities, aggregated $2,159,804,406 and $3,960,192,895, respectively.
5. Fees and Other Transactions with Affiliates.
Management Fee. Strategic Advisers (the investment adviser) provides the Fund with investment management related services. For these services, the Fund pays a monthly management fee to the investment adviser. The management fee is calculated by adding the annual management fee rate of .25% of the Fund's average net assets throughout the month payable to the investment adviser to the aggregate of the fee rates, payable monthly, to the Fund's sub-advisers. The Fund's maximum aggregate management fee will not exceed .55% of the Fund's average net assets. For the reporting period, the total annual management fee rate was .29% of the Fund's average net assets.
During the period, the investment adviser waived its management fee as described in the Expense Reductions note.
Sub-Advisers. FIAM LLC (an affiliate of the investment adviser) and T. Rowe Price Associates, Inc. each served as a sub-adviser for the Fund during the period. Sub-advisers provide discretionary investment advisory services for their allocated portion of the Fund's assets and are paid by the investment adviser and not the Fund for providing these services.
Transfer Agent Fees. Fidelity Investments Institutional Operations Company, Inc. (FIIOC), an affiliate of the investment adviser, is the Fund's transfer, dividend disbursing and shareholder servicing agent. Effective July 1, 2018 transfer agent fees are not paid by the Fund and are instead paid by the investment adviser or an affiliate. Prior to July 1, 2018 FIIOC received account fees and asset-based fees that varied according to account size and type of account. The Fund did not directly pay transfer agent fees with respect to the portion of its assets invested in Underlying Funds, excluding exchange-traded funds. FIIOC paid for typesetting, printing and mailing of shareholder reports, except proxy statements. For the period, the transfer agent fees were equivalent to an annual rate of .01% of average net assets.
Accounting and Security Lending Fees. Fidelity Service Company, Inc. (FSC), an affiliate of the investment adviser, maintains the Fund's accounting records. The accounting fee is based on the level of average net assets for each month. Prior to April 1, 2019, FSC had a separate agreement with the Fund for administration of the security lending program, based on the number and duration of lending transactions. For the period, the total fees paid for accounting and administration of securities lending were equivalent to an annual rate of .02%.
During June 2019, the Board approved that effective July 1, 2019 accounting fees will not be paid by the Fund and will instead be paid by the investment adviser or an affiliate.
Brokerage Commissions. The Fund placed a portion of its portfolio transactions with brokerage firms which are affiliates of the investment adviser. Brokerage commissions are included in net realized gain (loss) and change in net unrealized appreciation (depreciation) in the Statement of Operations. The commissions paid to these affiliated firms were $7,899 for the period.
Interfund Trades. The Fund may purchase from or sell securities to other funds affiliated with each sub-adviser under procedures adopted by the Board. The procedures have been designed to ensure these interfund trades are executed in accordance with Rule 17a-7 of the 1940 Act. Interfund trades are included within the respective purchases and sales amounts shown in the Purchases and Sales of Investments note.
6. Investments in Fidelity Central Funds.
The Fund invests in Fidelity Central Funds, which are open-end investment companies available only to other investment companies and accounts managed by the investment adviser and its affiliates. The Fund's Schedule of Investments lists each of the Fidelity Central Funds held as of period end, if any, as an investment of the Fund, but does not include the underlying holdings of each Fidelity Central Fund. As an Investing Fund, the Fund indirectly bears its proportionate share of the expenses of the underlying Fidelity Central Funds.
The Fidelity Money Market Central Funds are managed by Fidelity Investments Money Management, Inc. (FIMM), an affiliate of the investment adviser. Annualized expenses of the Money Market Central Funds as of their most recent shareholder report date ranged from less than .005% to .01%.
A complete unaudited list of holdings for each Fidelity Central Fund is available upon request or at the Securities and Exchange Commission (the SEC) website at www.sec.gov. In addition, the financial statements of the Fidelity Central Funds, which are not covered by the Fund's Report of Independent Registered Public Accounting Firm, are available on the SEC website or upon request.
7. Committed Line of Credit.
The Fund participates with other funds managed by the investment adviser or an affiliate in a $4.25 billion credit facility (the "line of credit") to be utilized for temporary or emergency purposes to fund shareholder redemptions or for other short-term liquidity purposes. The Fund has agreed to pay commitment fees on its pro-rata portion of the line of credit, which amounted to $21,885 and is reflected in Miscellaneous expenses on the Statement of Operations. During the period, the Fund did not borrow on this line of credit.
8. Security Lending.
The Fund lends portfolio securities through a lending agent from time to time in order to earn additional income. On the settlement date of the loan, the Fund receives collateral (in the form of U.S. Treasury obligations, letters of credit and/or cash) against the loaned securities and maintains collateral in an amount not less than 100% of the market value of the loaned securities during the period of the loan. The market value of the loaned securities is determined at the close of business of the Fund and any additional required collateral is delivered to the Fund on the next business day. The Fund or borrower may terminate the loan at any time, and if the borrower defaults on its obligation to return the securities loaned because of insolvency or other reasons, the Fund may apply collateral received from the borrower against the obligation. The Fund may experience delays and costs in recovering the securities loaned. Any cash collateral received is invested in the Fidelity Securities Lending Cash Central Fund. The value of loaned securities and cash collateral at period end are disclosed on the Fund's Statement of Assets and Liabilities. Security lending income represents the income earned on investing cash collateral, less rebates paid to borrowers and any lending agent fees associated with the loan, plus any premium payments received for lending certain types of securities. Security lending income is presented in the Statement of Operations as a component of income from Fidelity Central Funds. Total security lending income during the period amounted to $362,089.
9. Expense Reductions.
The investment adviser has contractually agreed to waive the Fund's management fee in an amount equal to .25% of the Fund's average net assets until September 30, 2022. During the period, this waiver reduced the Fund's management fee by $18,884,162.
In addition, the investment adviser has voluntarily agreed to waive a portion of the Fund's management fee. During the period, this waiver reduced the Fund's management fee by $53,388.
Commissions paid to certain brokers with whom the investment adviser, or its affiliates, places trades on behalf of the Fund include an amount in addition to trade execution, which may be rebated back to the Fund to offset certain expenses. This amount totaled $10,391 for the period.
In addition, through arrangements with the Fund's custodian, credits realized as a result of certain uninvested cash balances were used to reduce the Fund's expenses. During the period, custody credits and transfer agent credits amounted to $26,041.
10. Other.
The Fund's organizational documents provide former and current trustees and officers with a limited indemnification against liabilities arising in connection with the performance of their duties to the Fund. In the normal course of business, the Fund may also enter into contracts that provide general indemnifications. The Fund's maximum exposure under these arrangements is unknown as this would be dependent on future claims that may be made against the Fund. The risk of material loss from such claims is considered remote.
The Fund does not invest in the Underlying Funds for the purpose of exercising management or control; however, investments by the Fund within its principal investment strategies may represent a significant portion of an Underlying Fund's net assets. At the end of the period, the Fund was the owner of record of approximately 11% of the total outstanding shares of Fidelity Short-Term Bond Fund.
Report of Independent Registered Public Accounting Firm
To the Board of Trustees of Fidelity Rutland Square Trust II and Shareholders of Strategic Advisers Short Duration Fund:
Opinion on the Financial Statements
We have audited the accompanying statement of assets and liabilities, including the schedule of investments, of Strategic Advisers Short Duration Fund (one of the funds constituting Fidelity Rutland Square Trust II, referred to hereafter as the “Fund”) as of May 31, 2019, the related statement of operations for the year ended May 31, 2019, the statement of changes in net assets for each of the two years in the period ended May 31, 2019, including the related notes, and the financial highlights for each of the five years in the period ended May 31, 2019 (collectively referred to as the “financial statements”). In our opinion, the financial statements present fairly, in all material respects, the financial position of the Fund as of May 31, 2019, the results of its operations for the year then ended, the changes in its net assets for each of the two years in the period ended May 31, 2019 and the financial highlights for each of the five years in the period ended May 31, 2019 in conformity with accounting principles generally accepted in the United States of America.
Basis for Opinion
These financial statements are the responsibility of the Fund’s management. Our responsibility is to express an opinion on the Fund’s financial statements based on our audits. We are a public accounting firm registered with the Public Company Accounting Oversight Board (United States) (PCAOB) and are required to be independent with respect to the Fund in accordance with the U.S. federal securities laws and the applicable rules and regulations of the Securities and Exchange Commission and the PCAOB.
We conducted our audits of these financial statements in accordance with the standards of the PCAOB. Those standards require that we plan and perform the audit to obtain reasonable assurance about whether the financial statements are free of material misstatement, whether due to error or fraud.
Our audits included performing procedures to assess the risks of material misstatement of the financial statements, whether due to error or fraud, and performing procedures that respond to those risks. Such procedures included examining, on a test basis, evidence regarding the amounts and disclosures in the financial statements. Our audits also included evaluating the accounting principles used and significant estimates made by management, as well as evaluating the overall presentation of the financial statements. Our procedures included confirmation of securities owned as of May 31, 2019 by correspondence with the custodian and brokers; when replies were not received from brokers, we performed other auditing procedures. We believe that our audits provide a reasonable basis for our opinion.
PricewaterhouseCoopers LLP
Boston, Massachusetts
July 16, 2019
We have served as the auditor of one or more investment companies in the Fidelity group of funds since 1932.
Trustees and Officers
The Trustees, Members of the Advisory Board (if any), and officers of the trust and fund, as applicable, are listed below. The Board of Trustees governs the fund and is responsible for protecting the interests of shareholders. The Trustees are experienced executives who meet periodically throughout the year to oversee the fund's activities, review contractual arrangements with companies that provide services to the fund, oversee management of the risks associated with such activities and contractual arrangements, and review the fund's performance. If the interests of the fund and an underlying Fidelity® fund were to diverge, a conflict of interest could arise and affect how the Trustees and Members of the Advisory Board fulfill their fiduciary duties to the affected funds. Strategic Advisers has structured the fund to avoid these potential conflicts, although there may be situations where a conflict of interest is unavoidable. In such instances, Strategic Advisers, the Trustees, and Members of the Advisory Board would take reasonable steps to minimize and, if possible, eliminate the conflict. Each of the Trustees oversees 14 funds.
The Trustees hold office without limit in time except that (a) any Trustee may resign; (b) any Trustee may be removed by written instrument, signed by at least two-thirds of the number of Trustees prior to such removal; (c) any Trustee who requests to be retired or who has become incapacitated by illness or injury may be retired by written instrument signed by a majority of the other Trustees; and (d) any Trustee may be removed at any special meeting of shareholders by a two-thirds vote of the outstanding voting securities of the trust. Officers and Advisory Board Members hold office without limit in time, except that any officer or Advisory Board Member may resign or may be removed by a vote of a majority of the Trustees at any regular meeting or any special meeting of the Trustees. Except as indicated, each individual has held the office shown or other offices in the same company for the past five years.
Each Trustee who is not an interested person (as defined in the 1940 Act) of the trust and the fund is referred to herein as an Independent Trustee.
The fund’s Statement of Additional Information (SAI) includes more information about the Trustees. To request a free copy, call Fidelity at 1-800-544-3455.
Experience, Skills, Attributes, and Qualifications of the Trustees. The Governance and Nominating Committee has adopted a statement of policy that describes the experience, qualifications, attributes, and skills that are necessary and desirable for potential Independent Trustee candidates (Statement of Policy). The Board believes that each Trustee satisfied at the time he or she was initially elected or appointed a Trustee, and continues to satisfy, the standards contemplated by the Statement of Policy. The Governance and Nominating Committee may also engage professional search firms to help identify potential Independent Trustee candidates with experience, qualifications, attributes, and skills consistent with the Statement of Policy. Additional criteria based on the composition and skills of the current Independent Trustees, as well as experience or skills that may be appropriate in light of future changes to board composition, business conditions, and regulatory or other developments, may be considered by the professional search firms and the Governance and Nominating Committee. In addition, the Board takes into account the Trustees' commitment and participation in Board and committee meetings, as well as their leadership of standing and ad hoc committees throughout their tenure.
In determining that a particular Trustee was and continues to be qualified to serve as a Trustee, the Board has considered a variety of criteria, none of which, in isolation, was controlling. The Board believes that, collectively, the Trustees have balanced and diverse experience, qualifications, attributes, and skills, which allow the Board to operate effectively in governing the fund and protecting the interests of shareholders. Information about the specific experience, skills, attributes, and qualifications of each Trustee, which in each case led to the Board's conclusion that the Trustee should serve (or continue to serve) as a trustee of the fund, is provided below.
Board Structure and Oversight Function. Robert A. Lawrence is an interested person and currently serves as Chairman. The Trustees have determined that an interested Chairman is appropriate and benefits shareholders because an interested Chairman has a personal and professional stake in the quality and continuity of services provided to the fund. Independent Trustees exercise their informed business judgment to appoint an individual of their choosing to serve as Chairman, regardless of whether the Trustee happens to be independent or a member of management. The Independent Trustees have determined that they can act independently and effectively without having an Independent Trustee serve as Chairman and that a key structural component for assuring that they are in a position to do so is for the Independent Trustees to constitute a substantial majority for the Board. The Independent Trustees also regularly meet in executive session. Mary C. Farrell serves as the lead Independent Trustee and as such (i) acts as a liaison between the Independent Trustees and management with respect to matters important to the Independent Trustees and (ii) with management prepares agendas for Board meetings.
Fidelity® funds are overseen by different Boards of Trustees. The fund's Board oversees asset allocation funds. Other Boards oversee Fidelity's investment-grade bond, money market, and asset allocation funds, and Fidelity's equity and high income funds. The fund may invest in Fidelity® funds overseen by such other Boards. The use of separate Boards, each with its own committee structure, allows the Trustees of each group of Fidelity® funds to focus on the unique issues of the funds they oversee, including common research, investment, and operational issues.
The Trustees primarily operate as a full Board, but also operate in committees, to facilitate the timely and efficient consideration of all matters of importance to the Trustees, the fund, and fund shareholders and to facilitate compliance with legal and regulatory requirements and oversight of the fund's activities and associated risks. The Board has charged Strategic Advisers and its affiliates with (i) identifying events or circumstances the occurrence of which could have demonstrably adverse effects on the fund's business and/or reputation; (ii) implementing processes and controls to lessen the possibility that such events or circumstances occur or to mitigate the effects of such events or circumstances if they do occur; and (iii) creating and maintaining a system designed to evaluate continuously business and market conditions in order to facilitate the identification and implementation processes described in (i) and (ii) above. Because the day-to-day operations and activities of the fund are carried out by or through Strategic Advisers, its affiliates and other service providers, the fund's exposure to risks is mitigated but not eliminated by the processes overseen by the Trustees. Board oversight of different aspects of the fund's activities is exercised primarily through the full Board, but also through the Audit and Compliance Committee. Appropriate personnel, including but not limited to the fund's Chief Compliance Officer (CCO), FMR's internal auditor, the independent accountants, the fund's Treasurer and portfolio management personnel, make periodic reports to the Board's committees, as appropriate. The responsibilities of each standing committee, including their oversight responsibilities, are described further under "Standing Committees of the Trustees."
Interested Trustees*:
Correspondence intended for a Trustee who is an interested person may be sent to Fidelity Investments, 245 Summer Street, Boston, Massachusetts 02210.
Name, Year of Birth; Principal Occupations and Other Relevant Experience+
Brian B. Hogan (1964)
Year of Election or Appointment: 2018
Trustee
Mr. Hogan also serves as Trustee of other funds. Mr. Hogan serves as Head of Fidelity Investments’ Investment Solutions and Innovation organization (2018-present), a Director of Strategic Advisers LLC (2018-present), and a Director of Fidelity SelectCo, LLC (investment adviser firm, 2014-present). Previously, Mr. Hogan served as President of FMR Co., Inc. (2009-2018), a Vice President of Fidelity's Equity and High Income funds (2009-2018), a Director of FMR Investment Management (UK) Limited (investment adviser firm, 2015-2018), Trustee of certain Fidelity® funds (2014-2018), President of the Equity Division of FMR (investment adviser firm, 2009-2018), Senior Vice President, Equity Research of FMR (2006-2009), and as a portfolio manager. Mr. Brian B. Hogan is not related to Mr. Colm A. Hogan.
Robert A. Lawrence (1952)
Year of Election or Appointment: 2016
Trustee
Chairman of the Board of Trustees
Mr. Lawrence also serves as Trustee of other funds. Previously, Mr. Lawrence served as a Member of the Advisory Board of certain funds. Prior to his retirement in 2008, Mr. Lawrence served as Vice President of certain Fidelity® funds (2006-2008), Senior Vice President, Head of High Income Division of Fidelity Management & Research Company (investment adviser firm, 2006-2008), and President of Fidelity Strategic Investments (investment adviser firm, 2002-2005).
* Determined to be an "Interested Trustee" by virtue of, among other things, his or her affiliation with the trust or various entities under common control with Strategic Advisers.
+ The information includes the Trustee's principal occupation during the last five years and other information relating to the experience, attributes, and skills relevant to the Trustee's qualifications to serve as a Trustee, which led to the conclusion that the Trustee should serve as a Trustee for the fund.
Independent Trustees:
Correspondence intended for an Independent Trustee may be sent to Fidelity Investments, P.O. Box 55235, Boston, Massachusetts 02205-5235.
Name, Year of Birth; Principal Occupations and Other Relevant Experience+
Peter C. Aldrich (1944)
Year of Election or Appointment: 2006
Trustee
Mr. Aldrich also serves as Trustee of other funds. Mr. Aldrich is a Director of the National Bureau of Economic Research, a Director of the funds of BlackRock Realty Group (2006-present), and a Director of LivelyHood, Inc. (private corporation, 2013-present). Previously, Mr. Aldrich served as a Trustee for the Fidelity Rutland Square Trust (2005-2010), a Managing Member of Poseidon, LLC (foreign private investment, 1998-2004), and Chairman and Managing Member of AEGIS, LLC (foreign private investment, 1997-2004). Mr. Aldrich previously was a founder, Chief Executive Officer, and Chairman of AEW Capital Management, L.P. (then “Aldrich, Eastman and Waltch, L.P.”). Mr. Aldrich also served as a Director of Zipcar, Inc. (car sharing services, 2001-2009) and as Faculty Chairman of The Research Council on Global Investment of The Conference Board (business and professional education non-profit, 1999-2004). Mr. Aldrich is a Member Emeritus of the Board of Trustees of the Museum of Fine Arts Boston and an Overseer of the Massachusetts Eye and Ear Infirmary.
Ralph F. Cox (1932)
Year of Election or Appointment: 2006
Trustee
Mr. Cox also serves as Trustee of other funds. Mr. Cox is President of RABAR Enterprises (management consulting for the petroleum industry). Mr. Cox is a Director of Abraxas Petroleum (exploration and production, 1999-present). Mr. Cox is a member of the Advisory Boards of the Business and Engineering Schools of Texas A&M University and the Engineering School of University of Texas at Austin. Previously, Mr. Cox served as a Trustee for the Fidelity Rutland Square Trust (2005-2010) and as an Advisory Director of CH2M Hill Companies (engineering, 1981-2011). Mr. Ralph F. Cox and Mr. Howard E. Cox, Jr. are not related.
Mary C. Farrell (1949)
Year of Election or Appointment: 2013
Trustee
Ms. Farrell also serves as Trustee of other funds. Ms. Farrell is a Director of the W.R. Berkley Corporation (insurance provider) and President (2009-present) and Director (2006-present) of the Howard Gilman Foundation (charitable organization). Previously, Ms. Farrell was Managing Director and Chief Investment Strategist at UBS Wealth Management USA and Co-Head of UBS Wealth Management Investment Strategy & Research Group (2003-2005). Ms. Farrell also served as Investment Strategist at PaineWebber (1982-2000) and UBS PaineWebber (2000-2002). Ms. Farrell serves as Chairman of the Board of Trustees of Yale-New Haven Hospital and on the Yale New Haven Health System Board and previously served as Trustee on the Board of Overseers of the New York University Stern School of Business.
Karen Kaplan (1960)
Year of Election or Appointment: 2006
Trustee
Ms. Kaplan also serves as Trustee of other funds. Ms. Kaplan is Chairman (2014-present) and Chief Executive Officer (2013-present) of Hill Holliday (advertising and specialized marketing). Ms. Kaplan is a Director of The Michaels Companies, Inc. (specialty retailer, 2015-present), Member of the Board of Governors of the Chief Executives’ Club of Boston (2010-present), Member of the Executive Committee of the Greater Boston Chamber of Commerce (2006-present), Advisory Board Member of the National Association of Corporate Directors Chapter (2012-present), Member of the Board of Trustees of the Post Office Square Trust (2012-present), Trustee of the Brigham and Women’s Hospital (2016-present), Overseer of the Boston Symphony Orchestra (2014-present), Member of the Board of Directors of The Advertising Council, Inc. (2016-present), and Member of the Ron Burton Training Village Executive Board of Advisors (2018-present). Previously, Ms. Kaplan served as an Advisory Board Member of Fidelity Rutland Square Trust (2006-2010), a member of the Clinton Global Initiative (2010-2015), Director of DSM (dba Delta Dental and DentaQuest) (2004-2014), Formal Appointee of the 2015 Baker-Polito Economic Development Council, Director of Vera Bradley Inc. (designer of women’s accessories, 2012-2015), Member of the Board of Directors of the Massachusetts Conference for Women (2008-2015), Member of the Board of Directors of Jobs for Massachusetts (2012-2015), President of the Massachusetts Women’s Forum (2008-2010), Treasurer of the Massachusetts Women’s Forum (2002-2006), and Vice Chair of the Board of the Massachusetts Society for the Prevention of Cruelty to Children (2003-2010).
Heidi L. Steiger (1953)
Year of Election or Appointment: 2017
Trustee
Ms. Steiger also serves as Trustee of other funds. Ms. Steiger serves as a member of the Global Advisory Board and Of Counsel to Signum Global Advisors (international policy and strategy, 2018-present), a guest lecturer in the joint degree program in Global Luxury Management at North Carolina State University (Raleigh, NC) and Skema (Paris) (2018-present), Managing Partner of Topridge Associates, LLC (consulting, 2005-present), a Non-Executive Director of CrowdBureau Corporation (financial technology company and index provider, 2018-present), and a member of the Board of Directors (2013-present) and Chair of the Audit Committee and member of the Membership and Executive Committees (2017-present) of Business Executives for National Security (nonprofit). Previously, Ms. Steiger served as Eastern Region President of The Private Client Reserve of U.S. Bancorp (banking and financial services, 2010-2015), Advisory Director of Berkshire Capital Securities, LLC (financial services, 2009-2010), President and Senior Advisor of Lowenhaupt Global Advisors, LLC (financial services, 2005-2007), and President and Contributing Editor of Worth Magazine (2004-2005) and held a variety of positions at Neuberger Berman Group, LLC (financial services, 1986-2004), including Partner and Executive Vice President and Global Head of Private Asset Management at Neuberger Berman (1999-2004). Ms. Steiger also served as a member of the Board of Directors of Nuclear Electric Insurance Ltd (insurer of nuclear utilities, 2006-2017), a member of the Board of Trustees and Audit Committee of the Eaton Vance Funds (2007-2010), a member of the Board of Directors of Aviva USA (formerly AmerUs) (insurance, 2004-2014), and a member of the Board of Trustees and Audit Committee and Chair of the Investment Committee of CIFG (financial guaranty insurance, 2009-2012), and a member of the Board of Directors of Kin Group Plc (formerly, Fitbug Holdings) (health and technology, 2016-2017).
+ The information includes the Trustee's principal occupation during the last five years and other information relating to the experience, attributes, and skills relevant to the Trustee's qualifications to serve as a Trustee, which led to the conclusion that the Trustee should serve as a Trustee for the fund.
Advisory Board Members and Officers:
Correspondence intended for an officer or Howard E. Cox, Jr. may be sent to Fidelity Investments, 245 Summer Street, Boston, Massachusetts 02210. Officers appear below in alphabetical order.
Name, Year of Birth; Principal Occupation
Howard E. Cox, Jr. (1944)
Year of Election or Appointment: 2009
Member of the Advisory Board
Mr. Cox also serves as Member of the Advisory Board of other funds. Mr. Cox is a Partner of Greylock (venture capital, 1971-present) and a Director of Stryker Corporation (medical products and services, 1974-present). Previously, Mr. Cox served as an Advisory Board Member of Fidelity Rutland Square Trust (2006-2010). Mr. Cox also serves as a Member of the Secretary of Defense's Business Board of Directors (2008-present), a Director of Business Executives for National Security (1997-present), a Director of the Brookings Institution (2010-present), a Director of the World Economic Forum’s Young Global Leaders Foundation (2009-present), and is a Member of the Harvard Medical School Board of Fellows (2002-present). Mr. Howard E. Cox, Jr. and Mr. Ralph F. Cox are not related.
Elizabeth Paige Baumann (1968)
Year of Election or Appointment: 2017
Anti-Money Laundering (AML) Officer
Ms. Baumann also serves as AML Officer of other funds. She is Chief AML Officer (2012-present) and Senior Vice President (2014-present) of FMR LLC (diversified financial services company) and is an employee of Fidelity Investments. Previously, Ms. Baumann served as AML Officer of the funds (2012-2016), and Vice President (2007-2014) and Deputy Anti-Money Laundering Officer (2007-2012) of FMR LLC.
Craig S. Brown (1977)
Year of Election or Appointment: 2019
Assistant Treasurer
Mr. Brown also serves as Assistant Treasurer of other funds. Mr. Brown is an employee of Fidelity Investments (2013-present).
John J. Burke III (1964)
Year of Election or Appointment: 2018
Chief Financial Officer
Mr. Burke also serves as Chief Financial Officer of other funds. Mr. Burke serves as Head of Investment Operations for Fidelity Fund and Investment Operations (2018-present) and is an employee of Fidelity Investments (1998-present). Previously Mr. Burke served as head of Asset Management Investment Operations (2012-2018).
Jonathan Davis (1968)
Year of Election or Appointment: 2010
Assistant Treasurer
Mr. Davis also serves as Assistant Treasurer of other funds. Mr. Davis serves as Assistant Treasurer of FMR Capital, Inc. (2017-present) and is an employee of Fidelity Investments. Previously, Mr. Davis served as Vice President and Associate General Counsel of FMR LLC (diversified financial services company, 2003-2010).
Adrien E. Deberghes (1967)
Year of Election or Appointment: 2016
President and Treasurer
Mr. Deberghes also serves as an officer of other funds. He serves as Assistant Treasurer of FMR Capital, Inc. (2017-present), Executive Vice President of Fidelity Investments Money Management, Inc. (FIMM) (investment adviser firm, 2016-present), and is an employee of Fidelity Investments (2008-present). Previously, Mr. Deberghes served as President and Treasurer of certain Fidelity® funds (2013-2018). Prior to joining Fidelity Investments, Mr. Deberghes was Senior Vice President of Mutual Fund Administration at State Street Corporation (2007-2008), Senior Director of Mutual Fund Administration at Investors Bank & Trust (2005-2007), and Director of Finance for Dunkin' Brands (2000-2005). Previously, Mr. Deberghes served in other fund officer roles.
Laura M. Del Prato (1964)
Year of Election or Appointment: 2018
Assistant Treasurer
Ms. Del Prato also serves as an officer of other funds. Ms. Del Prato is an employee of Fidelity Investments (2017-present). Prior to joining Fidelity Investments, Ms. Del Prato served as a Managing Director and Treasurer of the JPMorgan Mutual Funds (2014-2017). Prior to JPMorgan, Ms. Del Prato served as a partner at Cohen Fund Audit Services (accounting firm, 2012-2013) and KPMG LLP (accounting firm, 2004-2012).
James D. Gryglewicz (1972)
Year of Election or Appointment: 2015
Chief Compliance Officer
Mr. Gryglewicz also serves as Chief Compliance Officer of other funds. Mr. Gryglewicz serves as Compliance Officer of Strategic Advisers LLC (investment adviser firm, 2015-present) and Fidelity SelectCo, LLC (investment adviser firm, 2014-present), Senior Vice President of Asset Management Compliance (2009-present), and is an employee of Fidelity Investments (2004-present). Previously, Mr. Gryglewicz served as Chief Compliance Officer of certain Fidelity® funds (2014-2018).
John Hitt (1967)
Year of Election or Appointment: 2014
Secretary and Chief Legal Officer
Mr. Hitt also serves as an officer of other funds. Mr. Hitt serves as Senior Vice President and Deputy General Counsel in Fidelity's Asset Management Group (2010-present) and is an employee of Fidelity Investments.
Colm A. Hogan (1973)
Year of Election or Appointment: 2016
Assistant Treasurer
Mr. Hogan also serves as an officer of other funds. Mr. Hogan serves as Assistant Treasurer of FMR Capital, Inc. (2017-present) and is an employee of Fidelity Investments (2005-present). Previously, Mr. Hogan served as Assistant Treasurer of certain Fidelity® funds (2016-2018). Mr. Colm A. Hogan is not related to Mr. Brian B. Hogan.
Christina H. Lee (1975)
Year of Election or Appointment: 2018
Assistant Secretary
Ms. Lee also serves as Assistant Secretary of other funds. Ms. Lee serves as Vice President, Associate General Counsel (2014-present) and is an employee of Fidelity Investments (2007-present).
Chris Maher (1972)
Year of Election or Appointment: 2016
Assistant Treasurer
Mr. Maher serves as Assistant Treasurer of other funds. Mr. Maher is Vice President of Valuation Oversight, serves as Assistant Treasurer of FMR Capital, Inc. (2017-present), and is an employee of Fidelity Investments. Previously, Mr. Maher served as Vice President of Asset Management Compliance (2013), Vice President of the Program Management Group of FMR (investment adviser firm, 2010-2013), and Vice President of Valuation Oversight (2008-2010).
Stacie M. Smith (1974)
Year of Election or Appointment: 2016
Assistant Treasurer
Ms. Smith also serves as an officer of other funds. Ms. Smith serves as Assistant Treasurer of FMR Capital, Inc. (2017-present), is an employee of Fidelity Investments (2009-present), and has served in other fund officer roles. Prior to joining Fidelity Investments, Ms. Smith served as Senior Audit Manager of Ernst & Young LLP (accounting firm, 1996-2009). Previously, Ms. Smith served as Assistant Treasurer (2013-2018) and Deputy Treasurer (2013-2016) of certain Fidelity® funds.
Marc L. Spector (1972)
Year of Election or Appointment: 2016
Assistant Treasurer
Mr. Spector also serves as an officer of other funds. Mr. Spector serves as Assistant Treasurer of FMR Capital, Inc. (2017-present) and is an employee of Fidelity Investments (2016-present). Prior to joining Fidelity Investments, Mr. Spector served as Director at the Siegfried Group (accounting firm, 2013-2016), and prior to Siegfried Group as audit senior manager at Deloitte & Touche (accounting firm, 2005-2013).
Jim Wegmann (1979)
Year of Election or Appointment: 2019
Assistant Treasurer
Mr. Wegmann also serves as Assistant Treasurer of other funds. Mr. Wegmann is an employee of Fidelity Investments (2011-present).
Shareholder Expense Example
As a shareholder of the Fund, you incur two types of costs: (1) transaction costs and (2) ongoing costs, including management fees and other Fund expenses. This Example is intended to help you understand your ongoing costs (in dollars) of investing in the Fund and to compare these costs with the ongoing costs of investing in other mutual funds.
The Example is based on an investment of $1,000 invested at the beginning of the period and held for the entire period (December 1, 2018 to May 31, 2019).
Actual Expenses
The first line of the accompanying table provides information about actual account values and actual expenses. You may use the information in this line, together with the amount you invested, to estimate the expenses that you paid over the period. Simply divide your account value by $1,000.00 (for example, an $8,600 account value divided by $1,000.00 = 8.6), then multiply the result by the number in the first line under the heading entitled "Expenses Paid During Period" to estimate the expenses you paid on your account during this period. In addition to the direct expenses incurred by the Fund presented in the table, as a shareholder of the underlying mutual funds and exchange-traded funds (ETFs) (the Underlying Funds), the Fund also indirectly bears its proportionate share of the expenses of the Underlying Funds. In addition, the Fund, as a shareholder in the underlying Fidelity Central Funds, will indirectly bear its pro-rata share of the fees and expenses incurred by the underlying Fidelity Central Funds. These fees and expenses are not included in the Fund's annualized expense ratio used to calculate the expense estimate in the table below.
Hypothetical Example for Comparison Purposes
The second line of the accompanying table provides information about hypothetical account values and hypothetical expenses based on the Fund's actual expense ratio and an assumed rate of return of 5% per year before expenses, which is not the Fund's actual return. The hypothetical account values and expenses may not be used to estimate the actual ending account balance or expenses you paid for the period. You may use this information to compare the ongoing costs of investing in the Fund and other funds. To do so, compare this 5% hypothetical example with the 5% hypothetical examples that appear in the shareholder reports of the other funds. In addition to the direct expenses incurred by the Fund presented in the table, as a shareholder of the Underlying Funds, the Fund also indirectly bears its proportionate share of the expenses of the Underlying Funds. In addition, the Fund, as a shareholder in the underlying Fidelity Central Funds, will indirectly bear its pro-rata share of the fees and expenses incurred by the underlying Fidelity Central Funds. These fees and expenses are not included in the Fund's annualized expense ratio used to calculate the expense estimate in the table below.
Please note that the expenses shown in the table are meant to highlight your ongoing costs only and do not reflect any transaction costs. Therefore, the second line of the table is useful in comparing ongoing costs only, and will not help you determine the relative total costs of owning different funds.
| Annualized Expense Ratio-A | Beginning Account Value December 1, 2018 | Ending Account Value May 31, 2019 | Expenses Paid During Period-B December 1, 2018 to May 31, 2019 |
|
| Actual | .06% | $1,000.00 | $1,019.50 | $.30 |
| Hypothetical-C | $1,000.00 | $1,024.63 | $.30 |
A Annualized expense ratio reflects expenses net of applicable fee waivers.
B Expenses are equal to the Fund's annualized expense ratio, multiplied by the average account value over the period, multiplied by 182/365 (to reflect the one-half year period). The fees and expenses of the Underlying Funds in which the Fund invests are not included in the Fund's annualized expense ratio.
C 5% return per year before expenses
Distributions (Unaudited)
A total of 5.33% of the dividends distributed during the fiscal year was derived from interest on U.S. Government securities which is generally exempt from state income tax.
The fund will notify shareholders in January 2020 of amounts for use in preparing 2019 income tax returns.
![]()
ASD-ANN-0719
1.934458.107
|
Strategic Advisers® Tax-Sensitive Short Duration Fund Offered exclusively to certain clients of Strategic Advisers LLC - not available for sale to the general public Annual Report May 31, 2019 |
|
|
Beginning on January 1, 2021, as permitted by regulations adopted by the Securities and Exchange Commission, paper copies of a fund’s shareholder reports will no longer be sent by mail, unless you specifically request paper copies of the reports from the fund or from your financial intermediary, such as a financial advisor, broker-dealer or bank. Instead, the reports will be made available on a website, and you will be notified by mail each time a report is posted and provided with a website link to access the report.
If you already elected to receive shareholder reports electronically, you will not be affected by this change and you need not take any action. You may elect to receive shareholder reports and other communications from a fund electronically, by contacting your financial intermediary. For Fidelity customers, visit Fidelity's web site or call Fidelity using the contact information listed below.
You may elect to receive all future reports in paper free of charge. If you wish to continue receiving paper copies of your shareholder reports, you may contact your financial intermediary or, if you are a Fidelity customer, visit Fidelity’s website, or call Fidelity at the applicable toll-free number listed below. Your election to receive reports in paper will apply to all funds held with the fund complex/your financial intermediary.
| Account Type | Website | Phone Number |
| Brokerage, Mutual Fund, or Annuity Contracts: | fidelity.com/mailpreferences | 1-800-343-3548 |
| Employer Provided Retirement Accounts: | netbenefits.fidelity.com/preferences (choose 'no' under Required Disclosures to continue to print) | 1-800-343-0860 |
| Advisor Sold Accounts Serviced Through Your Financial Intermediary: | Contact Your Financial Intermediary | Your Financial Intermediary's phone number |
| Advisor Sold Accounts Serviced by Fidelity: | institutional.fidelity.com | 1-877-208-0098 |
Contents
To view a fund's proxy voting record for the 12-month period ended June 30, visit http://www.fidelity.com/proxyvotingresults or visit the Securities and Exchange Commission's (SEC) web site at http://www.sec.gov.
You may also call 1-800-544-3455 to request a free copy of the proxy voting guidelines.
Standard & Poor's, S&P and S&P 500 are registered service marks of The McGraw-Hill Companies, Inc. and have been licensed for use by Fidelity Distributors Corporation.
Other third-party marks appearing herein are the property of their respective owners.
All other marks appearing herein are registered or unregistered trademarks or service marks of FMR LLC or an affiliated company. © 2019 FMR LLC. All rights reserved.
This report and the financial statements contained herein are submitted for the general information of the shareholders of the Fund. This report is not authorized for distribution to prospective investors in the Fund unless preceded or accompanied by an effective prospectus.
A fund files its complete schedule of portfolio holdings with the SEC for the first and third quarters of each fiscal year on Form N-PORT. Forms N-PORT are available on the SEC’s web site at http://www.sec.gov. A fund's Forms N-PORT may be reviewed and copied at the SEC’s Public Reference Room in Washington, DC. Information regarding the operation of the SEC's Public Reference Room may be obtained by calling 1-800-SEC-0330.
For a complete list of a fund's portfolio holdings, view the most recent holdings listing, semiannual report, or annual report on Fidelity's web site at http://www.fidelity.com, http://www.institutional.fidelity.com, or http://www.401k.com, as applicable.
NOT FDIC INSURED •MAY LOSE VALUE •NO BANK GUARANTEE
Neither the Fund nor Fidelity Distributors Corporation is a bank.
Performance: The Bottom Line
Average annual total return reflects the change in the value of an investment, assuming reinvestment of distributions from dividend income and capital gains (the profits earned upon the sale of securities that have grown in value, if any) and assuming a constant rate of performance each year. The hypothetical investment and the average annual total returns do not reflect the deduction of taxes that a shareholder would pay on fund distributions or the redemption of fund shares. During periods of reimbursement by Fidelity, a fund’s total return will be greater than it would be had the reimbursement not occurred. How a fund did yesterday is no guarantee of how it will do tomorrow.
Average Annual Total Returns
| For the periods ended May 31, 2019 | Past 1 year | Life of fundA |
| Strategic Advisers® Tax-Sensitive Short Duration Fund | 2.19% | 1.81% |
A From December 28, 2017
$10,000 Over Life of Fund
Let's say hypothetically that $10,000 was invested in Strategic Advisers® Tax-Sensitive Short Duration Fund on December 28, 2017, when the fund started.
The chart shows how the value of your investment would have changed, and also shows how the Bloomberg Barclays Municipal Bond 1 Year (1-2 Y) Index performed over the same period.
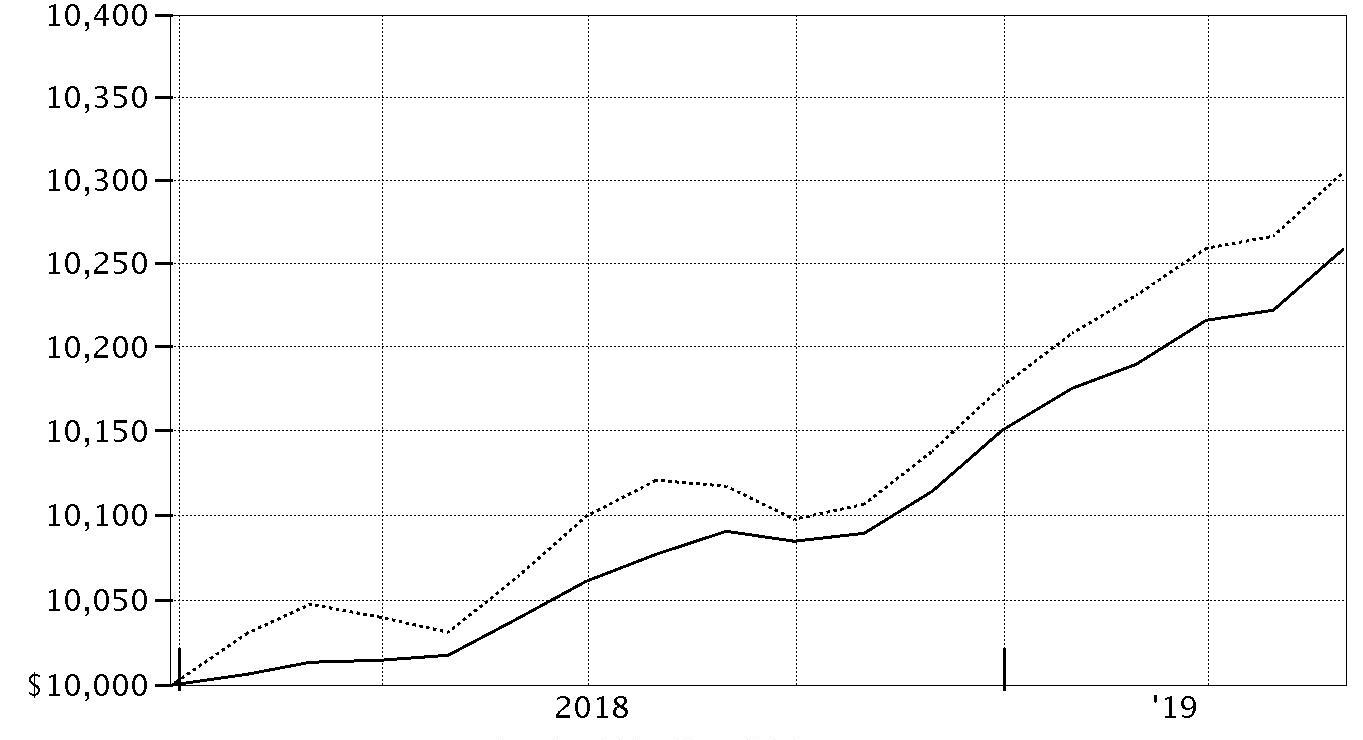
| Period Ending Values | ||
|
| $10,258 | Strategic Advisers® Tax-Sensitive Short Duration Fund |
|
| $10,305 | Bloomberg Barclays Municipal Bond 1 Year (1-2 Y) Index |
Management's Discussion of Fund Performance
Market Recap: Tax-exempt municipal bonds posted a healthy gain for the 12 months ending May 31, 2019, supported by below-average bond issuance and strong investor demand. The Bloomberg Barclays Municipal Bond Index returned 6.40% for the year. Gross municipal bond issuance remained below the long-term historical average due to the elimination of tax-exempt advance refundings under the new tax law, historically a significant source of supply. Despite stable municipal finances and fairly benign inflation, the municipal market experienced volatility in September into October 2018, due to concerns that the U.S. Federal Reserve would continue to raise interest rates despite evidence of an international economic slowdown. Munis then rebounded in late 2018 and early 2019 amid a pause in Fed interest rate hikes. Demand for fixed-income assets, in general, was strong, amid increased market volatility due to slowing global economic growth and rising international trade tension. In particular, demand for tax-exempt debt increased as wealthy taxpayers felt the full impact of tax reform passed in late 2017. The cap on the federal deduction for state and local taxes made tax-exempt debt more attractive, particularly in high-tax states. For the period, general obligation bonds gained 5.82%, with local bonds moderately outperforming state-backed bonds. Comments from Lead Portfolio Manager Chris Heavey: For the fiscal year, the Fund gained 2.19%, outpacing the 1.79% return of the Strategic Advisers® Tax-Sensitive Short-Duration Composite Index. Underlying managers with interest-rate sensitivity greater than the benchmark aided the Fund's relative performance, benefitting from declining rates during the second half of the period. Managers holding lower-rated investment-grade bonds also contributed, as BBB-rated municipal debt outperformed higher-rated credits. Several sub-advised strategies added the most value versus the benchmark. These included the Ultra Short Fixed Income strategy from Wells Capital Management and two strategies from FIAM®: Limited Term Municipal Income (LTMI) and Conservative Income Municipal Bond (CIMB). Both Wells Capital and FIAM CIMB outperformed due to positions in lower-rated bonds and longer-than-benchmark durations. FIAM LTMI primarily gained from its greater rate sensitivity. Cash was the only notable detractor this period, both at the total Fund level and also for the U.S. Muni Enhanced Cash strategy managed by sub-adviser T. Rowe Price. Looking ahead, we expect to see continued strong demand for municipal bonds but limited new supply.The views expressed above reflect those of the portfolio manager(s) only through the end of the period as stated on the cover of this report and do not necessarily represent the views of Fidelity or any other person in the Fidelity organization. Any such views are subject to change at any time based upon market or other conditions and Fidelity disclaims any responsibility to update such views. These views may not be relied on as investment advice and, because investment decisions for a Fidelity fund are based on numerous factors, may not be relied on as an indication of trading intent on behalf of any Fidelity fund.
Note to shareholders: On April 1, 2019, Jonathan Duggan assumed co-management responsibilities for the fund, joining Lead Manager Chris Heavey.Investment Summary (Unaudited)
The information in the following tables is based on the direct investments of the Fund.Top Ten Holdings as of May 31, 2019
| (excluding cash equivalents) | % of fund's net assets |
| New York Metropolitan Transportation Authority Rev. | 2.2 |
| Denver City & County Airport Rev. | 1.7 |
| Port Arthur Navigation Dist. Environmental Facilities Rev. | 1.5 |
| Texas General Obligation | 1.3 |
| Illinois Gen. Oblig. | 1.3 |
| New York City Gen. Oblig. | 1.2 |
| Public Fin Auth Solid Waste | 1.0 |
| Suffolk County Gen. Oblig. | 1.0 |
| Massachusetts General Obligation | 1.0 |
| Connecticut Gen. Oblig. | 0.8 |
Top Five Sectors as of May 31, 2019
| % of fund's net assets | |
| General Obligations | 24.7 |
| Other | 9.5 |
| Transportation | 9.3 |
| Health Care | 8.4 |
| Synthetics | 6.5 |
Quality Diversification (% of fund's net assets)
| As of May 31, 2019 | ||
| AAA,AA,A | 45.6% | |
| BBB | 6.8% | |
| Not Rated | 5.7% | |
| Equities | 0.5% | |
| Short-Term Investments and Net Other Assets | 41.4% | |

We have used ratings from Moody's Investors Service, Inc. Where Moody's® ratings are not available, we have used S&P® ratings. All ratings are as of the date indicated and do not reflect subsequent changes.
Asset Allocation (% of fund's net assets)
| As of May 31, 2019 | ||
| Municipal Bonds | 27.8% | |
| Investment Companies | 0.7% | |
| Short-Term Investments and Net Other Assets (Liabilities) | 71.5% | |

Schedule of Investments May 31, 2019
Showing Percentage of Net Assets
| Municipal Bonds - 57.9% | |||
| Principal Amount | Value | ||
| Alabama - 0.7% | |||
| Black Belt Energy Gas District: | |||
| (Proj. No. 4) Series 2019 A: | $ | $ | |
| 4% 6/1/20 | 1,500,000 | 1,533,184 | |
| 4% 6/1/21 | 1,250,000 | 1,303,850 | |
| 4% 6/1/23 | 1,750,000 | 1,886,500 | |
| Bonds: | |||
| Series 2016 A, 4%, tender 6/1/21 (a) | 3,035,000 | 3,167,963 | |
| Series 2017 A, 4%, tender 7/1/22 (a) | 1,500,000 | 1,597,470 | |
| Chatom Ind. Dev. Board Gulf Opportunity Zone Rev. (Alabama Elec. Coop., Inc. Proj.) Series 2007 A, 1.85%, tender 8/1/19 (a) | 3,000,000 | 3,000,808 | |
| Health Care Auth. for Baptist Health Series 2006 B, 2.15%, tender 11/15/37 (a) | 1,100,000 | 1,100,000 | |
| Jefferson County Gen. Oblig. Series 2018 B, 5% 4/1/21 | 270,000 | 286,592 | |
| Mobile County Board of School Commissioners: | |||
| Series 2016 A: | |||
| 5% 3/1/22 | 15,000 | 16,266 | |
| 5% 3/1/23 | 20,000 | 22,233 | |
| 5% 3/1/24 | 25,000 | 28,428 | |
| 5% 3/1/25 | 25,000 | 29,008 | |
| Series 2016 B: | |||
| 5% 3/1/22 | 80,000 | 86,754 | |
| 5% 3/1/23 | 405,000 | 450,214 | |
| 5% 3/1/24 | 45,000 | 51,171 | |
| Mobile Indl. Dev. Board Poll. Cont. Rev. Bonds Series 2009 E, 1.85%, tender 3/24/20 (a) | 8,240,000 | 8,203,948 | |
| Montgomery Med. Clinic Facilities Series 2015: | |||
| 5% 3/1/20 | 65,000 | 66,325 | |
| 5% 3/1/21 | 10,000 | 10,480 | |
| 5% 3/1/22 | 70,000 | 75,267 | |
| 5% 3/1/25 | 35,000 | 40,039 | |
| TOTAL ALABAMA | 22,956,500 | ||
| Alaska - 0.1% | |||
| Anchorage Gen. Oblig.: | |||
| Series A, 5% 9/1/20 | 25,000 | 26,097 | |
| Series B: | |||
| 5% 9/1/20 | 45,000 | 46,975 | |
| 5% 9/1/22 | 30,000 | 33,365 | |
| Series C: | |||
| 5% 9/1/20 | 30,000 | 31,317 | |
| 5% 9/1/22 | 20,000 | 22,243 | |
| Series D, 5% 9/1/20 | 45,000 | 46,975 | |
| North Slope Borough Gen. Oblig. Series 2017 A, 5% 6/30/21 (Pre-Refunded to 6/30/20 @ 100) | 150,000 | 155,742 | |
| Valdez Marine Term. Rev. (BP Pipelines (Alaska), Inc. Proj.) Series 2003 B, 5% 1/1/21 | 1,450,000 | 1,520,557 | |
| TOTAL ALASKA | 1,883,271 | ||
| Arizona - 1.9% | |||
| Arizona Ctfs. of Prtn. Series 2019 A: | |||
| 5% 10/1/20 (b) | 160,000 | 166,923 | |
| 5% 10/1/21 (b) | 140,000 | 150,844 | |
| 5% 10/1/22 (b) | 150,000 | 166,646 | |
| 5% 10/1/23 (b) | 195,000 | 222,659 | |
| 5% 10/1/24 (b) | 195,000 | 228,727 | |
| Arizona Health Facilities Auth. Rev.: | |||
| (Scottsdale Lincoln Hospitals Proj.) Series 2014 A: | |||
| 5% 12/1/19 | 15,000 | 15,256 | |
| 5% 12/1/20 | 20,000 | 21,017 | |
| 5% 12/1/21 | 25,000 | 27,033 | |
| 5% 12/1/22 | 15,000 | 16,671 | |
| 5% 12/1/23 | 20,000 | 22,801 | |
| 5% 12/1/24 | 35,000 | 40,921 | |
| Bonds Series 2013 A3, 3.27%, tender 2/1/23 (a) | 2,000,000 | 2,071,280 | |
| Arizona State Lottery Rev. Series 2019: | |||
| 5% 7/1/20 (b) | 460,000 | 471,725 | |
| 5% 7/1/21 (b) | 865,000 | 916,459 | |
| 5% 7/1/22 (b) | 690,000 | 753,853 | |
| Arizona Wtr. Infrastructure Fin. Auth. Rev. Series 2009 A, 5% 10/1/20 (Pre-Refunded to 10/1/19 @ 100) | 115,000 | 116,350 | |
| Chandler Indl. Dev. Auth. Indl. Dev. Rev. Bonds (Intel Corp. Proj.): | |||
| Series 2005, 2.4%, tender 8/14/23 (a) | 5,000,000 | 5,122,400 | |
| Series 2007, 2.7%, tender 8/14/23 (a)(c) | 4,000,000 | 4,110,240 | |
| Series 2019, 5%, tender 6/3/24 (a)(c) | 1,200,000 | 1,372,680 | |
| Coconino County Poll. Cont. Corp. Rev. Bonds (Nevada Pwr. Co. Projs.): | |||
| Series 2017 A, 1.8%, tender 5/21/20 (a)(c) | 2,405,000 | 2,402,935 | |
| Series 2017 B, 1.6%, tender 5/21/20 (a) | 280,000 | 279,493 | |
| Glendale Gen. Oblig.: | |||
| Series 2010, 5% 7/1/20 | 3,585,000 | 3,721,015 | |
| Series 2015, 5% 7/1/22 (FSA Insured) | 20,000 | 22,101 | |
| Series 2017: | |||
| 5% 7/1/21 | 65,000 | 69,700 | |
| 5% 7/1/22 | 75,000 | 82,877 | |
| Glendale Trans. Excise Tax Rev.: | |||
| 5% 7/1/21 (FSA Insured) | 15,000 | 16,091 | |
| 5% 7/1/22 (FSA Insured) | 25,000 | 27,666 | |
| 5% 7/1/23 (FSA Insured) | 30,000 | 34,123 | |
| Maricopa County Indl. Dev. Auth. Series 2019 A, 5% 9/1/19 | 1,000,000 | 1,008,430 | |
| Maricopa County Indl. Dev. Auth. Rev.: | |||
| Bonds Series B, 5%, tender 10/18/22 (a) | 1,090,000 | 1,209,366 | |
| Series 2016 A: | |||
| 5% 1/1/20 | 815,000 | 831,024 | |
| 5% 1/1/25 | 105,000 | 123,748 | |
| 5% 1/1/26 | 235,000 | 283,323 | |
| Maricopa County Unified School District #41 Gilbert Series 2016, 3% 7/1/19 | 840,000 | 840,970 | |
| Phoenix Ariz Ind. Dev. Auth. Rev. Series 2015A, 3% 7/1/20 (d) | 430,000 | 430,310 | |
| Phoenix Civic Impt. Board Arpt. Rev.: | |||
| Series 2013: | |||
| 5% 7/1/20 (c) | 3,000,000 | 3,110,220 | |
| 5% 7/1/21 (c) | 2,750,000 | 2,940,658 | |
| Series 2018: | |||
| 5% 7/1/19 (c) | 525,000 | 526,360 | |
| 5% 7/1/20 (c) | 620,000 | 642,779 | |
| Phoenix Indl. Solid Waste Disp. Rev. Bonds (Republic Svc., Inc. Proj.) Series 2013, 1.9%, tender 8/1/19 (a)(c) | 14,080,000 | 14,084,158 | |
| Pima County Indl. Dev. Auth. E Series 2013 Q, 4% 7/1/19 | 265,000 | 265,350 | |
| Pima County Ctfs. of Prtn. Series 2014: | |||
| 5% 12/1/21 | 50,000 | 54,284 | |
| 5% 12/1/22 | 55,000 | 61,525 | |
| 5% 12/1/23 | 75,000 | 86,311 | |
| Scottsdale Indl. Dev. Auth. Hosp. Rev. Series 2006 F, 2.1%, tender 9/1/45 (FSA Insured) (a) | 14,725,000 | 14,725,000 | |
| Univ. Med. Ctr. Corp. Hosp. Rev. Series 2009, 6.5% 7/1/39 (Pre-Refunded to 7/1/19 @ 100) | 400,000 | 401,512 | |
| TOTAL ARIZONA | 64,295,814 | ||
| Arkansas - 0.4% | |||
| Arkansas Dev. Fin. Auth. Multi-family Hsg. Rev. Bonds: | |||
| (Hsg. Alliance 2 Proj.) Series 2018 B, 2.1%, tender 12/1/20 (a) | 2,900,000 | 2,921,692 | |
| (Pine Bluff RAD Conversion Proj.) Series 2017, 1.69%, tender 11/1/19 | 2,070,000 | 2,071,293 | |
| Series 2018 A, 2.1%, tender 12/1/20 (a) | 8,000,000 | 8,058,640 | |
| Little Rock School District Series 2017, 3% 2/1/21 | 1,470,000 | 1,504,751 | |
| TOTAL ARKANSAS | 14,556,376 | ||
| California - 2.8% | |||
| Alameda Corridor Trans. Auth. Rev. Series 2004: | |||
| 0% 10/1/19 | 5,000 | 4,965 | |
| 0% 10/1/19 (Escrowed to Maturity) | 75,000 | 74,675 | |
| Bay Area Toll Auth. San Francisco Bay Toll Bridge Rev. Bonds: | |||
| Series A, 2.95%, tender 4/1/26 (a) | 115,000 | 123,347 | |
| Series B, 2.85%, tender 4/1/25 (a) | 95,000 | 100,622 | |
| Series C, 2.1%, tender 4/1/22 (a) | 1,085,000 | 1,096,761 | |
| California Gen. Oblig.: | |||
| Bonds: | |||
| Series 2012 A, 1.67%, tender 5/1/21 (a) | 5,995,000 | 5,989,485 | |
| Series 2013 D, 1.71%, tender 12/1/20 (a) | 4,690,000 | 4,690,938 | |
| Series 2013, 1.8%, tender 12/1/22 (a) | 3,270,000 | 3,272,780 | |
| 5.25% 9/1/22 | 35,000 | 39,427 | |
| California Health Facilities Fing. Auth. Rev. Bonds: | |||
| Series 2013 C, 5%, tender 10/15/19 (a) | 475,000 | 481,192 | |
| Series 2016 C, 1%, tender 8/15/19 (a) | 2,520,000 | 2,515,961 | |
| California Infrastructure and Econ. Dev. Bank Rev. Bonds: | |||
| Series 2011 A-2, 3 month U.S. LIBOR + 0.370% 2.175%, tender 6/1/19 (a)(e) | 7,150,000 | 7,157,365 | |
| Series 2012 B, 1 month U.S. LIBOR + 0.200% 1.94%, tender 4/1/21 (a)(e) | 5,000,000 | 4,991,700 | |
| Series 2018 A, 1 month U.S. LIBOR + 0.380% 2.08%, tender 8/1/21 (a)(e) | 400,000 | 400,096 | |
| Series 2018 C, 1 month U.S. LIBOR + 0.380% 2.08%, tender 8/1/21 (a)(e) | 1,255,000 | 1,255,301 | |
| Series 2018 D, 1 month U.S. LIBOR + 0.380% 2.081%, tender 8/1/21 (a)(e) | 5,500,000 | 5,501,320 | |
| California Poll. Cont. Fing. Auth. Solid Waste Disp. Rev. Bonds (Republic Svcs., Inc. Proj.): | |||
| Series 2010 A, 1.9%, tender 8/1/19 (a)(c)(d) | 4,600,000 | 4,601,358 | |
| Series 2017 A1, 1.9%, tender 7/15/19 (a)(c)(d) | 2,750,000 | 2,750,549 | |
| California Pub. Works Board Lease Rev. (Univ. Proj.) Series 2011 B, 5% 10/1/19 (Escrowed to Maturity) | 35,000 | 35,428 | |
| California Statewide Cmntys. Dev. Auth. Hosp. Rev. Series 2018, 5% 1/1/20 | 250,000 | 254,668 | |
| California Statewide Cmntys. Dev. Auth. Poll. Cont. Rev. Bonds (Southern California Edison Co.) Series 2006 A & B, 1.9%, tender 4/1/20 (a) | 2,040,000 | 2,033,509 | |
| California Statewide Cmntys. Dev. Auth. Rev. Series 2007: | |||
| 1.79%, tender 7/1/41 (FSA Insured) (a) | 9,000,000 | 9,000,000 | |
| 2.01%, tender 7/1/40 (FSA Insured) (a) | 5,200,000 | 5,200,000 | |
| 2.15%, tender 7/1/40 (FSA Insured) (a) | 10,450,000 | 10,450,000 | |
| Compton Unified School District Series 2006 D, 0% 6/1/20 (AMBAC Insured) | 2,280,000 | 2,243,809 | |
| Golden State Tobacco Securitization Corp. Tobacco Settlement Rev.: | |||
| Series 2017 A1: | |||
| 5% 6/1/21 | 25,000 | 26,619 | |
| 5% 6/1/22 | 40,000 | 43,700 | |
| 5% 6/1/23 | 45,000 | 50,246 | |
| 5% 6/1/24 | 25,000 | 28,330 | |
| Series A, 0% 6/1/24 (AMBAC Insured) | 75,000 | 68,720 | |
| Oakland Unified School District Alameda County Series 2013, 5.5% 8/1/23 | 20,000 | 22,720 | |
| Palomar Pomerado Health Care Dis: | |||
| Series 2006 A, 2.5%, tender 11/1/36 (FSA Insured) (a) | 5,350,000 | 5,350,000 | |
| Series 2006 B, 2.5%, tender 11/1/36 (FSA Insured) (a) | 7,125,000 | 7,125,000 | |
| Series 2006 C, 2.5%, tender 11/1/36 (FSA Insured) (a) | 2,500,000 | 2,500,000 | |
| Port of Oakland Rev. Series 2012 P, 5% 5/1/21 (c) | 55,000 | 58,511 | |
| San Francisco City & County Arpts. Commission Int'l. Arpt. Rev. Series 2019 A, 5% 1/1/20 (c) | 1,010,000 | 1,029,975 | |
| San Jose Int. Arpt. Rev.: | |||
| Series 2011 A1, 5.25% 3/1/20 (c) | 2,000,000 | 2,055,364 | |
| Series 2017 A, 5% 3/1/21 (c) | 2,550,000 | 2,703,255 | |
| San Pablo Redev. Agcy. Series 2014 A, 5% 6/15/24 (FSA Insured) | 30,000 | 35,038 | |
| TOTAL CALIFORNIA | 95,362,734 | ||
| Colorado - 1.1% | |||
| Colorado Health Facilities Auth. Retirement Hsg. Rev. (Liberty Heights Proj.) 0% 7/15/22 (Escrowed to Maturity) | 620,000 | 589,440 | |
| Colorado Health Facilities Auth. Rev. Bonds: | |||
| Series 2008 D3, 5%, tender 11/12/21 (a) | 115,000 | 123,530 | |
| Series 2009 B-3, 1.875%, tender 11/6/19 (a) | 1,140,000 | 1,139,437 | |
| Colorado Hsg. & Fin. Auth. Series 2019 F, 4.25% 11/1/49 (b) | 200,000 | 219,168 | |
| Colorado Hsg. & Fin. Auth. Multi-family Hsg. Rev. Bonds (Park Ter Proj.) Series 2018, 1.85%, tender 10/1/19 (a) | 1,325,000 | 1,326,350 | |
| Colorado Reg'l. Trans. District Ctfs. of Prtn.: | |||
| Series 2013 A: | |||
| 5% 6/1/20 | 115,000 | 119,005 | |
| 5% 6/1/23 | 100,000 | 113,267 | |
| Series 2014 A, 5% 6/1/23 | 85,000 | 96,277 | |
| Series 2015 A, 5% 6/1/19 | 250,000 | 250,000 | |
| Colorado Univ. Co. Hosp. Auth. Rev. Bonds: | |||
| Series 2017C-1, 4%, tender 3/1/20 (a) | 5,865,000 | 5,897,362 | |
| Series 2017C-2, 5%, tender 3/1/22 (a) | 450,000 | 483,012 | |
| Denver City & County Arpt. Rev.: | |||
| Series 2007, 2%, tender 11/15/25 (a) | 3,525,000 | 3,525,000 | |
| Series 2011 A: | |||
| 5.25% 11/15/22 (c) | 1,750,000 | 1,903,370 | |
| 5.5% 11/15/19 (c) | 3,960,000 | 4,029,214 | |
| Series 2012 B, 5% 11/15/20 | 500,000 | 525,695 | |
| Series 2017 A, 5% 11/15/19 (c) | 1,420,000 | 1,441,669 | |
| Series 2018 A: | |||
| 5% 12/1/19 (c) | 1,750,000 | 1,778,933 | |
| 5% 12/1/20 (c) | 8,375,000 | 8,784,203 | |
| Denver Health & Hosp. Auth. Healthcare Rev. Series 2017 A: | |||
| 5% 12/1/19 (d) | 375,000 | 380,847 | |
| 5% 12/1/20 (d) | 325,000 | 340,168 | |
| E-470 Pub. Hwy. Auth. Rev.: | |||
| Bonds Series 2019 A, 1 month U.S. LIBOR + 0.420% 2.052%, tender 9/1/21 (a)(e) | 2,250,000 | 2,250,000 | |
| Series 2000 B: | |||
| 0% 9/1/19 (Nat'l. Pub. Fin. Guarantee Corp. Insured) | 1,380,000 | 1,374,321 | |
| 0% 9/1/20 (Nat'l. Pub. Fin. Guarantee Corp. Insured) | 505,000 | 494,238 | |
| Series 2015 A: | |||
| 2.35% 9/1/20 | 100,000 | 100,705 | |
| 5% 9/1/19 | 20,000 | 20,156 | |
| 5% 9/1/20 | 275,000 | 285,846 | |
| Series B: | |||
| 0% 9/1/20 (Nat'l. Pub. Fin. Guarantee Corp. Insured) | 1,000,000 | 978,690 | |
| 0% 9/1/21 (Nat'l. Pub. Fin. Guarantee Corp. Insured) | 525,000 | 503,748 | |
| Pueblo Colo Urban Renewal Auth. Series 2017, 2.75% 6/1/20 | 155,000 | 155,483 | |
| TOTAL COLORADO | 39,229,134 | ||
| Connecticut - 2.1% | |||
| Connecticut Gen. Oblig.: | |||
| Series 2011 B: | |||
| 5% 5/15/20 | 275,000 | 283,911 | |
| 5% 5/15/21 | 505,000 | 536,982 | |
| Series 2011 D, 5% 11/1/19 | 790,000 | 801,396 | |
| Series 2012 A, SIFMA Municipal Swap Index + 1.250% 2.67% 4/15/20 (a)(e) | 4,135,000 | 4,169,192 | |
| Series 2012 C: | |||
| 5% 6/1/19 | 130,000 | 130,000 | |
| 5% 6/1/20 | 860,000 | 889,171 | |
| 5% 6/1/21 | 510,000 | 544,170 | |
| Series 2012 D, SIFMA Municipal Swap Index + 0.920% 2.34% 9/15/19 (a)(e) | 645,000 | 646,089 | |
| Series 2013 A: | |||
| SIFMA Municipal Swap Index + 0.650% 2.07% 3/1/20 (a)(e) | 105,000 | 105,284 | |
| 5% 10/15/19 | 360,000 | 364,627 | |
| Series 2013 D: | |||
| SIFMA Municipal Swap Index + 0.880% 2.3% 8/15/19 (a)(e) | 255,000 | 255,304 | |
| 5% 8/15/20 | 190,000 | 197,765 | |
| Series 2014 A, 4% 3/1/22 | 300,000 | 318,255 | |
| Series 2014 C, 5% 6/15/20 | 400,000 | 414,094 | |
| Series 2014 E, 5% 9/1/19 | 430,000 | 433,710 | |
| Series 2014 H, 5% 11/15/21 | 680,000 | 735,706 | |
| Series 2015 A, 5% 3/15/22 | 275,000 | 300,022 | |
| Series 2015 C, SIFMA Municipal Swap Index + 0.900% 2.32% 6/15/21 (a)(e) | 2,500,000 | 2,519,475 | |
| Series 2015 F, 5% 11/15/20 | 180,000 | 188,878 | |
| Series 2016 A, 5% 3/15/26 | 45,000 | 53,831 | |
| Series 2016 B: | |||
| 5% 5/15/20 | 440,000 | 454,257 | |
| 5% 5/15/21 | 1,770,000 | 1,882,094 | |
| Series 2016 E: | |||
| 4% 10/15/19 | 885,000 | 893,176 | |
| 5% 10/15/20 | 1,080,000 | 1,130,220 | |
| Series 2016 G: | |||
| 3% 11/1/20 | 285,000 | 290,771 | |
| 5% 11/1/19 | 510,000 | 517,357 | |
| Series 2017 A, 5% 4/15/20 | 2,825,000 | 2,908,509 | |
| Series 2017 B: | |||
| 3% 4/15/22 | 325,000 | 336,580 | |
| 5% 4/15/20 | 100,000 | 102,956 | |
| Series 2018 A, 5% 4/15/20 | 685,000 | 705,249 | |
| Series 2018 B: | |||
| 5% 4/15/21 | 1,760,000 | 1,867,747 | |
| 5% 4/15/22 | 685,000 | 749,137 | |
| Series 2018 E, 5% 9/15/20 | 415,000 | 433,127 | |
| Series 2018 F, 5% 9/15/20 | 750,000 | 782,760 | |
| Series 2019 A: | |||
| 5% 4/15/23 | 525,000 | 590,000 | |
| 5% 4/15/25 | 1,480,000 | 1,743,410 | |
| Series A, 5% 2/15/21 | 2,250,000 | 2,255,648 | |
| Series D, SIFMA Municipal Swap Index + 1.020% 2.44% 8/15/20 (a)(e) | 890,000 | 897,414 | |
| Connecticut Health & Edl. Facilities Auth. Rev.: | |||
| (Connecticut St Univ. Sys. Proj.) Series 2013 N, 5% 11/1/20 | 2,035,000 | 2,129,770 | |
| (Stamford Hosp. Proj.) Series 2010 I, 5% 7/1/20 | 900,000 | 929,241 | |
| Bonds: | |||
| (Yale New Haven Hosp. Proj.) Series B, 1 month U.S. LIBOR + 0.550% 2.216%, tender 6/3/19 (a)(e) | 6,275,000 | 6,276,763 | |
| (Yale Univ. Proj.): | |||
| Series 2014 A, 1.3%, tender 2/3/20 (a) | 2,855,000 | 2,851,790 | |
| Series 2017 B, 5%, tender 7/1/20 (a) | 1,635,000 | 1,697,032 | |
| Series 2013 A, 1%, tender 7/1/19 (a) | 3,270,000 | 3,268,882 | |
| Series 2015 A, 2.05%, tender 7/21/21 (a) | 9,975,000 | 10,094,401 | |
| Series 2016 CT, 3% 12/1/19 | 155,000 | 156,157 | |
| Series 2018 S, 5% 7/1/20 | 1,200,000 | 1,243,824 | |
| Series A: | |||
| 5% 7/1/20 | 505,000 | 524,382 | |
| 5% 7/1/21 | 800,000 | 854,272 | |
| Series N, 5% 7/1/21 | 610,000 | 651,773 | |
| Connecticut Higher Ed. Supplemental Ln. Auth. Rev.: | |||
| (Chesla Ln. Prog.) Series 2017 A, 5% 11/15/22 (c) | 300,000 | 329,001 | |
| Series 2017 B: | |||
| 4% 11/15/19 (c) | 265,000 | 267,451 | |
| 5% 11/15/21 (c) | 655,000 | 701,466 | |
| 5% 11/15/23 (c) | 125,000 | 140,123 | |
| Connecticut Hsg. Fin. Auth.: | |||
| (Ct Gen. Hsg. 9/27/72 Proj.) Series 2012 A, 2.4% 11/15/20 | 270,000 | 272,905 | |
| Bonds Series 2017 E-3, 1.5%, tender 11/15/20 (a) | 940,000 | 940,009 | |
| Series 2013 B2, 4% 11/15/32 | 85,000 | 87,296 | |
| Series 2016 F: | |||
| 1.55% 5/15/20 (c) | 220,000 | 219,403 | |
| 1.6% 11/15/20 (c) | 565,000 | 563,039 | |
| Connecticut Spl. Tax Oblig. Trans. Infrastructure Rev. Series 2012 B, 5% 1/1/21 | 325,000 | 342,323 | |
| Hartford Gen. Oblig. Series 2012 A, 5% 4/1/21 (FSA Insured) | 2,000,000 | 2,121,040 | |
| Naugatuck Ctfs. of Prtn. (Naugatuck Incineration Facilities Proj.) Series 2014 A: | |||
| 5% 6/15/19 (c) | 250,000 | 250,272 | |
| 5% 6/15/20 (c) | 315,000 | 326,099 | |
| New Britain Gen. Oblig. Series 2017 A: | |||
| 5% 3/1/20 (FSA Insured) | 65,000 | 66,646 | |
| 5% 3/1/21 (FSA Insured) | 90,000 | 95,169 | |
| New Haven Gen. Oblig.: | |||
| Series 2016 A, 5% 8/15/25 (FSA Insured) | 20,000 | 23,305 | |
| Series 2017 A, 5.25% 8/1/19 | 160,000 | 160,843 | |
| Stratford Gen. Oblig. Series 2017, 4% 7/1/19 (FSA Insured) | 165,000 | 165,305 | |
| Univ. of Connecticut Gen. Oblig.: | |||
| Series 2016 A, 5% 3/15/22 | 190,000 | 207,396 | |
| Series 2019 A, 5% 11/1/25 | 225,000 | 267,993 | |
| TOTAL CONNECTICUT | 70,653,645 | ||
| Delaware, New Jersey - 0.0% | |||
| Delaware River & Bay Auth. Rev. Series 2014 C: | |||
| 5% 1/1/20 | 55,000 | 56,088 | |
| 5% 1/1/21 | 45,000 | 47,442 | |
| TOTAL DELAWARE, NEW JERSEY | 103,530 | ||
| District Of Columbia - 0.5% | |||
| District of Columbia Hsg. Fin. Agcy. Multi-family Hsg. Rev. Bonds (Liberty Place Apts. Proj.) Series 2018, 2.13%, tender 12/1/20 (a) | 5,000,000 | 5,030,900 | |
| Metropolitan Washington DC Arpts. Auth. Sys. Rev.: | |||
| Series 2012 A, 5% 10/1/22 (c) | 140,000 | 155,173 | |
| Series 2014 A: | |||
| 5% 10/1/19 (c) | 315,000 | 318,490 | |
| 5% 10/1/23 (c) | 10,000 | 11,383 | |
| Series 2017 A, 5% 10/1/26 (c) | 145,000 | 176,423 | |
| Series 2018 A, 5% 10/1/19 (c) | 2,615,000 | 2,643,973 | |
| Washington Convention & Sports Auth. Series 2018 A: | |||
| 5% 10/1/19 | 4,300,000 | 4,349,912 | |
| 5% 10/1/21 | 2,000,000 | 2,157,280 | |
| Washington D.C. Metropolitan Transit Auth. Rev. Series 2018, 5% 7/1/20 | 1,000,000 | 1,037,940 | |
| TOTAL DISTRICT OF COLUMBIA | 15,881,474 | ||
| Florida - 2.5% | |||
| Brevard County School Board Ctfs. of Prtn.: | |||
| Series 2014: | |||
| 5% 7/1/20 | 485,000 | 503,508 | |
| 5% 7/1/21 | 20,000 | 21,399 | |
| Series 2015 C: | |||
| 5% 7/1/21 | 15,000 | 16,053 | |
| 5% 7/1/22 | 80,000 | 88,149 | |
| 5% 7/1/23 | 65,000 | 73,685 | |
| Broward County Arpt. Sys. Rev.: | |||
| Series 2012 P1, 4% 10/1/19 (c) | 1,635,000 | 1,648,863 | |
| Series 2012 Q, 5% 10/1/21 (c) | 320,000 | 344,630 | |
| Series 2012 Q1, 5% 10/1/21 | 20,000 | 21,640 | |
| Series 2015 A, 5% 10/1/20 (c) | 1,750,000 | 1,827,420 | |
| Series 2015 C, 5% 10/1/24 (c) | 110,000 | 128,019 | |
| Series A: | |||
| 5% 10/1/22 (c) | 65,000 | 71,956 | |
| 5% 10/1/23 (c) | 90,000 | 102,200 | |
| Broward County Port Facilities Rev. Series 2011 B: | |||
| 5% 9/1/20 (c) | 500,000 | 520,740 | |
| 5% 9/1/21 (c) | 355,000 | 380,475 | |
| Broward County School Board Ctfs. of Prtn.: | |||
| (Broward County School District Proj.) Series 2017 C, 5% 7/1/22 | 70,000 | 77,375 | |
| Series 2015 A: | |||
| 5% 7/1/20 | 85,000 | 88,244 | |
| 5% 7/1/21 | 100,000 | 107,188 | |
| 5% 7/1/22 | 75,000 | 82,806 | |
| 5% 7/1/23 | 60,000 | 68,169 | |
| 5% 7/1/24 | 30,000 | 35,032 | |
| Series 2015 B: | |||
| 5% 7/1/20 | 65,000 | 67,480 | |
| 5% 7/1/21 | 135,000 | 144,704 | |
| 5% 7/1/22 | 100,000 | 110,408 | |
| 5% 7/1/23 | 60,000 | 68,169 | |
| 5% 7/1/24 | 25,000 | 29,193 | |
| Central Florida Expressway Auth. Sr. Lien Rev. Series 2018, 5% 7/1/19 | 280,000 | 280,758 | |
| Citizens Property Ins. Corp.: | |||
| (Citizens Pla Proj.) Series 2012 A-1, 5% 6/1/20 | 1,215,000 | 1,257,803 | |
| Series 2012 A1, 5% 6/1/21 | 2,715,000 | 2,905,213 | |
| Florida Board of Ed. Pub. Ed. Cap. Outlay: | |||
| Series 2011 A, 5% 6/1/19 | 1,000,000 | 1,000,000 | |
| Series 2013 C, 5% 6/1/19 | 1,210,000 | 1,210,000 | |
| Series 2016 C, 5% 6/1/19 | 1,320,000 | 1,320,000 | |
| Florida Dev. Fin. Corp. Healthcare Facility Rev. (Univ. Health Proj.) Series 2013 A, 5% 2/1/20 | 45,000 | 45,690 | |
| Florida Hsg. Fin. Corp. Multi-family Mtg. Rev. Series 2019 A, 2% 8/1/21 | 2,500,000 | 2,512,050 | |
| Florida Hsg. Fin. Corp. Rev. Series 2017: | |||
| 1.95% 1/1/21 | 445,000 | 447,723 | |
| 2% 7/1/21 | 390,000 | 393,491 | |
| 2.05% 1/1/22 | 295,000 | 298,664 | |
| Florida Mid-Bay Bridge Auth. Rev. Series 2015 A: | |||
| 5% 10/1/21 | 20,000 | 21,459 | |
| 5% 10/1/22 | 45,000 | 49,417 | |
| 5% 10/1/23 | 55,000 | 61,772 | |
| 5% 10/1/24 | 45,000 | 51,582 | |
| 5% 10/1/25 | 40,000 | 46,828 | |
| 5% 10/1/26 | 45,000 | 52,414 | |
| Greater Orlando Aviation Auth. Arpt. Facilities Rev.: | |||
| Series 2016: | |||
| 5% 10/1/19 (c) | 2,900,000 | 2,933,374 | |
| 5% 10/1/20 (c) | 50,000 | 52,212 | |
| Series 2017 A: | |||
| 5% 10/1/25 (c) | 20,000 | 23,792 | |
| 5% 10/1/26 (c) | 45,000 | 54,545 | |
| Halifax Hosp. Med. Ctr. Rev. Series 2015, 5% 6/1/23 | 30,000 | 33,352 | |
| Hillsborough County Indl. Dev. Auth. Indl. Dev. Rev. (Health Facilities/Univ. Cmnty. Hosp. Proj.) Series 2008 B, 8% 8/15/32 (Pre-Refunded to 8/15/19 @ 101) | 1,070,000 | 1,094,289 | |
| Hillsborough County School District Sales Tax Rev. Series 2015 B, 5% 10/1/22 (FSA Insured) | 45,000 | 50,001 | |
| Indian River County School Board Ctfs. of Prtn. Series 2014: | |||
| 5% 7/1/20 | 20,000 | 20,763 | |
| 5% 7/1/22 | 45,000 | 49,584 | |
| 5% 7/1/23 | 45,000 | 50,955 | |
| Jacksonville Elec. Auth. Elec. Sys. Rev.: | |||
| Series 2013 B, 5% 10/1/21 | 750,000 | 803,100 | |
| Series 2013 C: | |||
| 5% 10/1/19 | 920,000 | 929,587 | |
| 5% 10/1/22 | 430,000 | 472,789 | |
| Series 2013 D, 5% 10/1/20 | 670,000 | 698,019 | |
| Series 2014 A: | |||
| 5% 10/1/19 | 335,000 | 338,491 | |
| 5% 10/1/20 | 770,000 | 802,201 | |
| 5% 10/1/21 | 1,215,000 | 1,303,318 | |
| JEA Saint Johns River Pwr. Park Sys. Rev. Series 6, 5% 10/1/20 | 250,000 | 252,638 | |
| Lakeland Hosp. Sys. Rev. Series 2016, 5% 11/15/19 | 70,000 | 71,087 | |
| Lee County Solid Waste Sys. Rev. Series 2016, 5% 10/1/20 (c) | 1,425,000 | 1,479,763 | |
| Manatee County Rev. Series 2013: | |||
| 5% 10/1/21 | 45,000 | 48,571 | |
| 5% 10/1/22 | 20,000 | 22,243 | |
| Manatee County School District Series 2017, 5% 10/1/24 (FSA Insured) | 30,000 | 35,282 | |
| Miami Dade County Hsg. Multifamily Hsg. Rev. Bonds Series 2016, 2%, tender 8/1/19 (a) | 2,125,000 | 2,125,065 | |
| Miami Health Facilities Auth. Rev. Series 2017, 5% 7/1/20 | 110,000 | 113,098 | |
| Miami-Dade County Series 2013 D, 5% 10/1/19 (c) | 1,245,000 | 1,257,482 | |
| Miami-Dade County Aviation Rev.: | |||
| Series 2009 B, 5.5% 10/1/36 (Pre-Refunded to 10/1/19 @ 100) | 3,190,000 | 3,232,076 | |
| Series 2012 A: | |||
| 5% 10/1/19 (c) | 740,000 | 748,663 | |
| 5% 10/1/20 (c) | 1,150,000 | 1,200,876 | |
| 5% 10/1/21 (c) | 285,000 | 306,731 | |
| Series 2014, 5% 10/1/20 (c) | 560,000 | 584,774 | |
| Series 2017 B: | |||
| 5% 10/1/19 (c) | 2,170,000 | 2,195,331 | |
| 5% 10/1/20 (c) | 545,000 | 569,111 | |
| Series 2018 A, 4% 10/1/19 (c) | 8,805,000 | 8,879,364 | |
| Series A1, 5% 10/1/21 | 200,000 | 209,542 | |
| Miami-Dade County Expressway Auth.: | |||
| (Waste Mgmt., Inc. of Florida Proj.): | |||
| 5% 7/1/20 | 20,000 | 20,739 | |
| 5% 7/1/21 | 45,000 | 48,168 | |
| 5% 7/1/22 | 45,000 | 49,555 | |
| 5% 7/1/23 | 45,000 | 49,470 | |
| Series 2014 A: | |||
| 5% 7/1/21 | 250,000 | 267,598 | |
| 5% 7/1/24 | 15,000 | 17,365 | |
| Series 2014 B: | |||
| 5% 7/1/22 | 35,000 | 38,543 | |
| 5% 7/1/23 | 70,000 | 79,116 | |
| Miami-Dade County Health Facilities Auth. Hosp. Rev. Series 2010, 5.25% 8/1/21 | 120,000 | 125,102 | |
| Miami-Dade County Indl. Dev. Auth. Solid Waste Disp. Rev. Bonds (Waste Mgmt. of Florida Proj.) Series 2018, 2.85%, tender 8/2/21 (a)(c) | 3,960,000 | 4,034,092 | |
| Miami-Dade County School Board Ctfs. of Prtn.: | |||
| (Miami-Dade County School District) Series 2012 B-2, 4% 4/1/20 | 190,000 | 193,972 | |
| Series 2014 D: | |||
| 5% 11/1/20 | 320,000 | 335,821 | |
| 5% 11/1/21 | 135,000 | 145,820 | |
| 5% 11/1/22 | 65,000 | 72,236 | |
| 5% 11/1/23 | 165,000 | 188,154 | |
| Series 2015 A: | |||
| 5% 5/1/20 | 1,155,000 | 1,191,958 | |
| 5% 5/1/21 | 250,000 | 266,495 | |
| 5% 5/1/22 | 80,000 | 87,603 | |
| 5% 5/1/23 | 140,000 | 157,580 | |
| Series 2015 B, 5% 5/1/24 | 645,000 | 744,530 | |
| Series 2015 D, 5% 2/1/22 | 410,000 | 445,719 | |
| Series 2016 A, 5% 8/1/27 | 120,000 | 144,462 | |
| Series 2016 C, 5% 2/1/20 | 470,000 | 480,915 | |
| North Broward Hosp. District Rev. Series 2017 B: | |||
| 5% 1/1/20 | 220,000 | 223,891 | |
| 5% 1/1/21 | 205,000 | 214,502 | |
| Orange County Health Facilities Auth. Series B: | |||
| 4% 10/1/19 (b) | 1,825,000 | 1,834,870 | |
| 5% 10/1/20 (b) | 1,660,000 | 1,725,238 | |
| 5% 10/1/21 (b) | 1,330,000 | 1,428,886 | |
| 5% 10/1/22 (b) | 1,295,000 | 1,432,477 | |
| Palm Beach County Health Facilities A Series 2016, 4% 11/15/19 | 3,085,000 | 3,118,664 | |
| Palm Beach County Health Facilities Auth. Hosp. Rev. Series 2014: | |||
| 4% 12/1/19 | 20,000 | 20,218 | |
| 5% 12/1/20 | 30,000 | 31,407 | |
| 5% 12/1/21 | 35,000 | 37,704 | |
| 5% 12/1/23 | 5,000 | 5,668 | |
| 5% 12/1/24 | 10,000 | 11,601 | |
| Palm Beach County School Board Ctfs. of Prtn.: | |||
| (Palm Beach County School District Proj.): | |||
| Series 2018 A, 5% 8/1/21 | 2,000,000 | 2,149,380 | |
| Series 2018 B, 5% 8/1/21 | 1,100,000 | 1,182,159 | |
| Series 2014 B: | |||
| 4% 8/1/21 | 90,000 | 94,719 | |
| 5% 8/1/21 | 115,000 | 123,589 | |
| 5% 8/1/22 | 20,000 | 22,155 | |
| Pasco County School Board Ctfs. of Prtn. Series 2005 B, 2.2%, tender 8/1/30 (a) | 3,975,000 | 3,975,000 | |
| Pasco County School District Sales Tax Rev. Series 2013: | |||
| 5% 10/1/19 | 25,000 | 25,289 | |
| 5% 10/1/20 | 20,000 | 20,931 | |
| 5% 10/1/21 | 20,000 | 21,558 | |
| 5% 10/1/22 | 20,000 | 22,154 | |
| Pasco County Solid Waste Disp. & Resource Recovery Sys. Rev. Series 2011, 5% 10/1/19 (c) | 45,000 | 45,509 | |
| Seminole County School Board Ctfs. of Prtn. Series 2016 C: | |||
| 5% 7/1/25 | 20,000 | 23,840 | |
| 5% 7/1/26 | 25,000 | 30,490 | |
| South Miami Health Facilities Auth. Hosp. Rev. Series 2017, 5% 8/15/19 | 3,520,000 | 3,543,645 | |
| Tallahassee Health Facilities Rev. (Tallahassee Memorial Healthcare, Inc. Proj.) Series 2016 A, 5% 12/1/21 | 65,000 | 69,873 | |
| Tampa Bay Wtr. Reg'l. Wtr. Supply Auth. Util. Sys. Rev. Series 2005, 5.5% 10/1/22 (FGIC Insured) | 30,000 | 33,933 | |
| Tampa Solid Waste Sys. Rev.: | |||
| Series 2010, 5% 10/1/19 (FSA Insured) (c) | 255,000 | 257,792 | |
| Series 2013, 5% 10/1/20 (c) | 195,000 | 203,444 | |
| Tampa Tax Allocation (H. Lee Moffitt Cancer Ctr. Proj.): | |||
| Series 2012 A, 5% 9/1/20 | 40,000 | 41,644 | |
| Series 2016 A: | |||
| 5% 9/1/19 | 130,000 | 131,070 | |
| 5% 9/1/20 | 150,000 | 156,167 | |
| Univ. North Florida Fing. Corp. Cir Series 2016, 5% 11/1/19 (FSA Insured) | 705,000 | 714,238 | |
| Volusia County School Board Ctfs. of Prtn. (Master Lease Prog.) Series 2014 B, 5% 8/1/19 | 5,000 | 5,028 | |
| TOTAL FLORIDA | 83,788,184 | ||
| Georgia - 2.0% | |||
| Atlanta Urban Resdtl Fin. Bonds: | |||
| (Bethel Towers Apt. Proj.) Series 2018, 2.07%, tender 11/1/20 (a) | 10,000,000 | 10,040,300 | |
| (Creekside at Adamsville Place Proj.) Series 2019, 1.95%, tender 5/1/21 (a) | 7,000,000 | 7,022,470 | |
| Atlanta Arpt. Rev.: | |||
| Series 2014 C, 5% 1/1/20 (c) | 565,000 | 575,977 | |
| 5% 1/1/22 | 20,000 | 21,806 | |
| Bartow County Dev. Auth. Poll. Cont. Rev. Bonds (Georgia Pwr. Co. Plant Bowen Proj.) Series 2009 1st, 2.75%, tender 3/15/23 (a) | 1,500,000 | 1,534,395 | |
| Burke County Indl. Dev. Auth. Poll. Cont. Rev. Bonds: | |||
| (Georgia Pwr. Co. Plant Vogtle Proj.): | |||
| Series 1994, 2.25%, tender 5/25/23 (a) | 1,405,000 | 1,412,531 | |
| Series 1995 5, 2.05%, tender 11/19/21 (a) | 375,000 | 374,693 | |
| Series 2008, 1.65%, tender 6/18/21 (a) | 485,000 | 480,208 | |
| Series 2013 1st, 2.925%, tender 3/12/24 (a) | 990,000 | 1,023,818 | |
| (Georgia Pwr. Co. Proj.) Series 2017, 1.85%, tender 8/22/19 (a) | 3,635,000 | 3,634,214 | |
| (Oglethorpe Pwr. Corp. Vogtle Proj.): | |||
| Series 2013 A, 2.4%, tender 4/1/20 (a) | 220,000 | 220,086 | |
| Series 2017 E, 3.25%, tender 2/3/25 (a) | 100,000 | 103,205 | |
| Series 1996, 2.35%, tender 12/11/20 (a) | 1,485,000 | 1,491,623 | |
| Clarke County Hosp. Auth. Series 2016: | |||
| 5% 7/1/19 | 295,000 | 295,766 | |
| 5% 7/1/20 | 190,000 | 197,002 | |
| Cobb County Kennestone Hosp. Auth. Rev. (Wellstar Health Sys., Inc. Proj.) Series 2017 A: | |||
| 5% 4/1/20 | 45,000 | 46,267 | |
| 5% 4/1/21 | 100,000 | 105,754 | |
| DeKalb County Hsg. Auth. Multi-family Hsg. Rev. Bonds Series 2019 A, 2%, tender 2/1/21 (a) | 9,000,000 | 9,025,380 | |
| Fulton County Dev. Auth. Hosp. R (Wellstar Health Sys., Inc. Proj.) Series 2017 A: | |||
| 5% 4/1/20 | 40,000 | 41,126 | |
| 5% 4/1/21 | 85,000 | 89,891 | |
| Fulton County Dev. Auth.: | |||
| (Piedmont Healthcare, Inc. Proj.) Series 2016, 5% 7/1/20 | 130,000 | 134,791 | |
| Bonds Series 2018 A, 2%, tender 3/1/20 (a) | 4,000,000 | 4,010,633 | |
| Gainesville & Hall County Hosp. Auth. Rev. Bonds (Northeast Georgia Health Sys., Inc. Proj.) Series 2014 B, SIFMA Municipal Swap Index + 0.950% 2.37%, tender 6/6/19 (a)(e) | 2,125,000 | 2,125,806 | |
| Georgia Muni. Elec. Auth. Pwr. Rev.: | |||
| Series 2008 A, 5.25% 1/1/21 | 140,000 | 147,465 | |
| Series 2009 B, 5% 1/1/20 | 4,830,000 | 4,918,232 | |
| Series 2010 A, 5% 11/1/19 | 955,000 | 967,710 | |
| Series 2011 A: | |||
| 5% 1/1/20 | 445,000 | 453,129 | |
| 5% 1/1/21 | 1,475,000 | 1,547,954 | |
| Series 2015 A: | |||
| 5% 1/1/20 | 390,000 | 397,124 | |
| 5% 1/1/21 | 255,000 | 267,612 | |
| Series 2016 A: | |||
| 4% 1/1/21 | 280,000 | 289,520 | |
| 5% 1/1/20 | 735,000 | 748,427 | |
| 5% 1/1/22 | 250,000 | 269,018 | |
| Series C, 5% 1/1/22 | 1,105,000 | 1,189,057 | |
| Series GG: | |||
| 5% 1/1/20 | 135,000 | 137,505 | |
| 5% 1/1/21 | 255,000 | 267,816 | |
| Georgia Muni. Gas Auth. Rev.: | |||
| (Gas Portfolio III Proj.): | |||
| Series 2014 U: | |||
| 5% 10/1/19 | 35,000 | 35,395 | |
| 5% 10/1/22 | 20,000 | 22,181 | |
| 5% 10/1/23 | 55,000 | 62,579 | |
| Series R, 5% 10/1/21 | 110,000 | 118,467 | |
| Series 2016 A, 5% 10/1/19 | 1,050,000 | 1,061,841 | |
| Griffin-Spalding County Hosp. (Wellstar Health Sys., Inc. Proj.) Series 2017 A: | |||
| 3% 4/1/20 | 40,000 | 40,473 | |
| 3% 4/1/21 | 35,000 | 35,763 | |
| Lagrange-Troup County Hosp. Rev. (Wellstar Health Sys., Inc. Proj.) Series 2017 A: | |||
| 5% 4/1/20 | 30,000 | 30,845 | |
| 5% 4/1/21 | 85,000 | 89,891 | |
| Macon-Bibb County Hsg. Auth. Bonds Series 2018, 2.04%, tender 4/1/20 (a) | 5,000,000 | 5,015,159 | |
| Main Street Natural Gas, Inc.: | |||
| Series 2018 C, 4% 12/1/19 | 215,000 | 217,421 | |
| Series 2019 A: | |||
| 5% 5/15/20 | 500,000 | 514,477 | |
| 5% 5/15/22 | 1,000,000 | 1,081,850 | |
| Monroe County Dev. Auth. Poll. Cont. Rev. Bonds: | |||
| (Georgia Pwr. Co. Plant Scherer Proj.): | |||
| Series 2009 1, 2.05%, tender 11/19/21 (a) | 705,000 | 704,253 | |
| Series 2009, 2.35%, tender 12/11/20 (a) | 2,175,000 | 2,173,391 | |
| (Gulf Pwr. Co. Plant Scherer Proj.) Series 2002 1, 2%, tender 6/25/20 (a) | 250,000 | 248,960 | |
| Northwest Georgia Hsg. Auth. Multifamily Hsg. Bonds (Meadow Lane Apts. Proj.) Series 2017, 1.7%, tender 9/1/20 (a) | 1,500,000 | 1,495,140 | |
| Private Colleges & Univs. Auth. Rev. (The Savannah College of Arts and Design Projs.) Series 2014, 5% 4/1/21 | 75,000 | 79,640 | |
| TOTAL GEORGIA | 68,636,037 | ||
| Hawaii - 0.3% | |||
| Hawaii Arpts. Sys. Rev. Series 2011, 5% 7/1/19 (c) | 2,085,000 | 2,090,369 | |
| Hawaii Dept. of Budget & Fin. Spl. Purp. Rev. (Queens Health Sys. Proj.) Series 2015 B, SIFMA Municipal Swap Index + 0.140% 1.87%, tender 7/1/39 (a)(e) | 605,000 | 605,000 | |
| Hawaii Gen. Oblig. Series 2011 DZ, 5% 12/1/28 (Pre-Refunded to 12/1/21 @ 100) | 1,945,000 | 2,111,881 | |
| Honolulu City & County Gen. Oblig. Bonds Series 2017 H: | |||
| SIFMA Municipal Swap Index + 0.310% 1.73%, tender 9/1/20 (a)(e) | 2,180,000 | 2,179,477 | |
| SIFMA Municipal Swap Index + 0.320% 1.74%, tender 9/1/20 (a)(e) | 1,965,000 | 1,964,528 | |
| SIFMA Municipal Swap Index + 0.320% 1.74%, tender 9/1/20 (a)(e) | 875,000 | 874,790 | |
| State of Hawaii Dept. of Trans. Series 2013: | |||
| 5% 8/1/19 (c) | 30,000 | 30,160 | |
| 5% 8/1/20 (c) | 65,000 | 67,433 | |
| 5% 8/1/21 (c) | 10,000 | 10,672 | |
| 5% 8/1/22 (c) | 45,000 | 49,337 | |
| 5% 8/1/23 (c) | 30,000 | 33,636 | |
| TOTAL HAWAII | 10,017,283 | ||
| Idaho - 0.2% | |||
| Idaho Health Facilities Auth. Hosp. Rev. Bonds Series 2013 ID, 1.75%, tender 8/1/19 (a) | 4,990,000 | 4,991,478 | |
| Idaho Health Facilities Auth. Rev. (St. Luke's Health Sys. Proj.) Series 2018 A, 5% 3/1/20 | 515,000 | 527,575 | |
| Idaho Hsg. & Fin. Assoc. Single Family Mtg. (Idaho St Garvee Proj.) Series 2017 A: | |||
| 5% 7/15/20 | 220,000 | 228,496 | |
| 5% 7/15/21 | 230,000 | 246,535 | |
| TOTAL IDAHO | 5,994,084 | ||
| Illinois - 3.3% | |||
| Champaign County Ill Cmnty. Unit Series 2017, 5% 1/1/21 | 355,000 | 373,581 | |
| Chicago Gen. Oblig.: | |||
| Series 2003 B, 5% 1/1/20 | 720,000 | 731,111 | |
| Series 2010, 5% 12/1/19 | 220,000 | 222,941 | |
| Series 2015 C: | |||
| 5% 1/1/20 | 280,000 | 284,321 | |
| 5% 1/1/21 (Escrowed to Maturity) | 435,000 | 458,325 | |
| Chicago Metropolitan Wtr. Reclamation District of Greater Chicago Series 2014 D, 5% 12/1/19 | 2,255,000 | 2,292,842 | |
| Chicago Midway Arpt. Rev.: | |||
| Series 2014 B: | |||
| 5% 1/1/20 | 15,000 | 15,300 | |
| 5% 1/1/21 | 10,000 | 10,543 | |
| 5% 1/1/23 | 55,000 | 61,388 | |
| 5% 1/1/22 | 110,000 | 119,438 | |
| 5% 1/1/23 | 130,000 | 145,098 | |
| Chicago Motor Fuel Tax Rev. Series 2013: | |||
| 5% 1/1/20 | 5,000 | 5,066 | |
| 5% 1/1/21 | 10,000 | 10,355 | |
| 5% 1/1/22 | 5,000 | 5,268 | |
| 5% 1/1/23 | 10,000 | 10,687 | |
| Chicago O'Hare Int'l. Arpt. Rev.: | |||
| Series 2012 A, 5% 1/1/21 | 30,000 | 31,633 | |
| Series 2012 B: | |||
| 4% 1/1/20 (c) | 3,500,000 | 3,547,852 | |
| 5% 1/1/21 (c) | 100,000 | 105,170 | |
| Series 2013 B, 5% 1/1/22 | 85,000 | 92,316 | |
| Series 2013 D, 5% 1/1/22 | 70,000 | 76,025 | |
| Series 2017 D, 5% 1/1/27 (c) | 35,000 | 42,161 | |
| Series 2018 A: | |||
| 5% 1/1/20 (c) | 800,000 | 815,496 | |
| 5% 1/1/21 (c) | 250,000 | 262,925 | |
| Chicago Park District Gen. Oblig.: | |||
| Series 2010 C, 5% 1/1/20 | 250,000 | 254,350 | |
| Series 2013 D, 5% 1/1/20 | 355,000 | 361,176 | |
| Series 2015 B, 5% 1/1/21 | 425,000 | 444,104 | |
| Series 2018 E, 5% 11/15/20 | 290,000 | 302,522 | |
| Chicago Transit Auth. Cap. Grant Receipts Rev. Series 2017: | |||
| 4% 6/1/19 | 525,000 | 525,000 | |
| 5% 6/1/20 | 860,000 | 885,894 | |
| 5% 6/1/21 | 635,000 | 672,522 | |
| 5% 6/1/25 | 25,000 | 29,000 | |
| Chicago Wastewtr. Transmission Rev. Series 2012, 5% 1/1/23 | 25,000 | 26,885 | |
| Chicago Wtr. Rev. Series 2017 2, 5% 11/1/19 | 545,000 | 552,231 | |
| Cook County Gen. Oblig.: | |||
| Series 2009 C, 5% 11/15/21 | 185,000 | 187,731 | |
| Series 2009 D, 5% 11/15/21 | 500,000 | 507,380 | |
| Series 2010 A, 5.25% 11/15/22 | 110,000 | 115,543 | |
| Series 2011 A: | |||
| 5% 11/15/19 | 180,000 | 182,706 | |
| 5.25% 11/15/22 | 20,000 | 21,608 | |
| Series 2012 C: | |||
| 5% 11/15/19 | 70,000 | 71,052 | |
| 5% 11/15/20 | 155,000 | 162,325 | |
| 5% 11/15/21 | 120,000 | 129,062 | |
| 5% 11/15/22 | 30,000 | 33,068 | |
| Series 2014 A: | |||
| 3% 11/15/19 | 500,000 | 503,080 | |
| 5% 11/15/20 | 20,000 | 20,945 | |
| 5% 11/15/21 | 10,000 | 10,755 | |
| 5% 11/15/22 | 30,000 | 33,068 | |
| Series 2016 A, 5% 11/15/21 | 2,250,000 | 2,419,920 | |
| Series 2018, 5% 11/15/19 | 385,000 | 390,788 | |
| Cook County School District No. 87 Series 2012 A, 3% 12/1/19 | 1,215,000 | 1,223,355 | |
| DeKalb County Cmnty. Unit Scd Series 2001, 0% 1/1/21 (AMBAC Insured) | 1,175,000 | 1,138,469 | |
| Grundy Kendall & Will Cntys Series 2008, 5.75% 10/15/19 | 120,000 | 120,406 | |
| Illinois Edl. Facilities Auth. Rev. Bonds: | |||
| (Univ. of Chicago Proj.) Series B2, 1.55%, tender 2/13/20 (a) | 220,000 | 219,818 | |
| Series 1998 B, 1.875%, tender 2/13/20 (a) | 1,500,000 | 1,502,504 | |
| Illinois Fin. Auth. Rev.: | |||
| (Bradley Univ. Proj.) Series 2017 C, 5% 8/1/26 | 35,000 | 41,413 | |
| (Hosp. Sisters Svcs., Inc. Proj.) Series 2012 C, 5% 8/15/20 | 690,000 | 717,607 | |
| (Osf Healthcare Sys.) Series 2010 A, 6% 5/15/39 (Pre-Refunded to 5/15/20 @ 100) | 1,000,000 | 1,041,770 | |
| (OSF Healthcare Sys.) Series 2018 A, 5% 5/15/20 | 700,000 | 722,481 | |
| (Rush Univ. Med. Ctr. Proj.) Series 2015 A, 5% 11/15/19 | 535,000 | 543,382 | |
| Bonds: | |||
| (Advocate Health Care Network Proj.): | |||
| Series 2008 A1, 5%, tender 1/15/20 (a) | 725,000 | 740,076 | |
| Series 2008 A2, 5%, tender 2/12/20 (a) | 815,000 | 834,004 | |
| (Ascension Health Cr. Group Proj.) Series 2012 E2, 1.75%, tender 4/1/21 (a) | 3,030,000 | 3,040,847 | |
| Series 2016 B, 1 month U.S. LIBOR + 1.350% 3.09%, tender 5/1/21 (a)(e) | 1,090,000 | 1,093,052 | |
| Series 2017 B, 5%, tender 12/15/22 (a) | 65,000 | 72,460 | |
| Series E, 2.25%, tender 4/29/22 (a) | 500,000 | 506,195 | |
| Series 2009 A, 5% 8/15/19 (Escrowed to Maturity) | 1,395,000 | 1,404,651 | |
| Series 2011 IL, 5% 12/1/22 (Pre-Refunded to 12/1/21 @ 100) | 25,000 | 27,100 | |
| Series 2012 A, 5% 5/15/23 | 30,000 | 32,816 | |
| Series 2012: | |||
| 5% 9/1/20 | 30,000 | 31,275 | |
| 5% 9/1/21 | 45,000 | 48,405 | |
| 5% 9/1/22 | 75,000 | 83,060 | |
| Series 2015 A: | |||
| 5% 11/15/22 | 10,000 | 11,122 | |
| 5% 11/15/22 | 800,000 | 887,760 | |
| 5% 11/15/24 | 35,000 | 40,777 | |
| 5% 11/15/25 | 45,000 | 53,433 | |
| 5% 11/15/26 | 45,000 | 53,033 | |
| Series 2015 B: | |||
| 5% 11/15/20 | 35,000 | 36,747 | |
| 5% 11/15/24 | 45,000 | 52,581 | |
| Series 2016 A: | |||
| 4% 11/1/19 | 110,000 | 110,969 | |
| 5% 7/1/19 | 155,000 | 155,378 | |
| 5% 8/15/19 | 130,000 | 130,711 | |
| 5% 8/15/20 | 10,000 | 10,326 | |
| 5% 2/15/21 | 15,000 | 15,830 | |
| 5% 8/15/21 | 15,000 | 15,885 | |
| 5% 2/15/23 | 20,000 | 22,344 | |
| 5% 8/15/23 | 35,000 | 38,817 | |
| 5% 8/15/24 | 50,000 | 56,624 | |
| Series 2016 C: | |||
| 5% 2/15/20 | 110,000 | 112,386 | |
| 5% 2/15/22 | 225,000 | 245,691 | |
| 5% 2/15/23 | 100,000 | 112,334 | |
| 5% 2/15/24 | 115,000 | 132,755 | |
| Series 2016 D, 5% 2/15/20 | 505,000 | 517,095 | |
| Series 2016: | |||
| 5% 11/15/19 | 170,000 | 172,556 | |
| 5% 5/15/21 | 520,000 | 553,348 | |
| 5% 7/1/22 | 65,000 | 71,807 | |
| 5% 5/15/25 | 10,000 | 11,754 | |
| 5% 5/15/26 | 20,000 | 23,848 | |
| 5% 5/15/27 | 25,000 | 29,635 | |
| Series 2017: | |||
| 5% 1/1/23 | 35,000 | 39,194 | |
| 5% 1/1/25 | 50,000 | 59,015 | |
| Series 2019, 5% 4/1/26 | 1,000,000 | 1,199,460 | |
| Illinois Gen. Oblig.: | |||
| Series 2006 A, 5% 6/1/19 | 215,000 | 215,000 | |
| Series 2006, 5% 6/1/21 | 405,000 | 428,445 | |
| Series 2010: | |||
| 5% 1/1/21 (FSA Insured) | 35,000 | 35,615 | |
| 5% 1/1/23 (FSA Insured) | 250,000 | 254,420 | |
| Series 2012 A, 4% 1/1/23 | 30,000 | 31,023 | |
| Series 2012: | |||
| 5% 8/1/19 | 2,560,000 | 2,572,933 | |
| 5% 8/1/21 | 55,000 | 58,442 | |
| 5% 8/1/22 | 760,000 | 825,444 | |
| Series 2013: | |||
| 5% 7/1/21 | 140,000 | 148,435 | |
| 5% 7/1/22 | 375,000 | 406,489 | |
| Series 2014: | |||
| 5% 2/1/20 | 665,000 | 678,318 | |
| 5% 2/1/21 | 865,000 | 906,805 | |
| 5% 2/1/22 | 65,000 | 69,748 | |
| 5% 4/1/23 | 50,000 | 54,769 | |
| 5% 2/1/25 | 50,000 | 55,008 | |
| Series 2016: | |||
| 5% 1/1/20 | 1,760,000 | 1,790,824 | |
| 5% 1/1/21 | 2,865,000 | 2,996,647 | |
| 5% 2/1/21 | 4,000,000 | 4,193,320 | |
| 5% 11/1/21 | 1,505,000 | 1,609,748 | |
| 5% 1/1/22 | 1,650,000 | 1,766,919 | |
| 5% 1/1/26 | 300,000 | 339,897 | |
| 5% 2/1/26 | 1,235,000 | 1,400,861 | |
| Series 2017 B, 5% 11/1/19 | 3,955,000 | 4,006,659 | |
| Series 2017 D: | |||
| 5% 11/1/21 | 2,180,000 | 2,331,728 | |
| 5% 11/1/25 | 2,210,000 | 2,510,494 | |
| Series 2018 A: | |||
| 5% 10/1/20 | 1,000,000 | 1,039,940 | |
| 5% 10/1/21 | 1,500,000 | 1,600,890 | |
| 5% 10/1/26 | 1,340,000 | 1,533,429 | |
| Series 2019 B, 5% 9/1/20 | 1,260,000 | 1,307,200 | |
| Illinois Muni. Elec. Agcy. Pwr. Supply: | |||
| Series 2007 C, 5.25% 2/1/20 | 185,000 | 189,462 | |
| Series 2015 A: | |||
| 5% 2/1/20 | 1,135,000 | 1,160,525 | |
| 5% 2/1/21 | 470,000 | 495,164 | |
| 5% 2/1/22 | 380,000 | 411,760 | |
| 5% 2/1/23 | 25,000 | 27,817 | |
| Illinois Reg'l. Trans. Auth.: | |||
| Series 2002 A, 6% 7/1/21 | 460,000 | 500,945 | |
| Series 2003 B, 5.5% 6/1/19 | 1,270,000 | 1,270,000 | |
| Series 2010A, 5% 7/1/20 | 465,000 | 473,951 | |
| Series 2014 A, 5% 6/1/19 | 200,000 | 200,000 | |
| Series 2017 A: | |||
| 5% 7/1/19 | 4,000,000 | 4,010,116 | |
| 5% 7/1/20 | 210,000 | 217,531 | |
| 5% 7/1/21 | 210,000 | 224,246 | |
| Illinois Sales Tax Rev.: | |||
| Series 2002, 5.75% 6/15/19 (Nat'l. Pub. Fin. Guarantee Corp. Insured) | 1,360,000 | 1,361,591 | |
| Series 2011, 4% 6/15/20 | 1,635,000 | 1,667,844 | |
| Series 2013: | |||
| 5% 6/15/19 | 1,035,000 | 1,035,975 | |
| 5% 6/15/20 | 2,380,000 | 2,451,959 | |
| Series 2016 D, 5% 6/15/23 | 1,500,000 | 1,643,160 | |
| Illinois Toll Hwy. Auth. Toll Hwy. Rev. Series 2014 A, 5% 12/1/19 | 255,000 | 259,254 | |
| Kane County School District #129, Aurora West Side Series 2014 A, 2.75% 2/1/22 | 1,000,000 | 1,018,610 | |
| Mc Henry & Lake Cntys Ill Cmnt Series 2012 A, 3% 12/1/19 | 1,015,000 | 1,022,279 | |
| McHenry County Cmnty. School District #200 Series 2006 B: | |||
| 0% 1/15/24 | 105,000 | 94,807 | |
| 0% 1/15/25 | 110,000 | 96,929 | |
| 0% 1/15/26 | 80,000 | 68,570 | |
| McHenry County Conservation District Gen. Oblig. Series 2014: | |||
| 5% 2/1/20 | 50,000 | 51,144 | |
| 5% 2/1/23 | 50,000 | 55,898 | |
| Metropolitan Pier & Exposition Series 2012 B, 5% 12/15/22 | 1,655,000 | 1,787,566 | |
| Minooka Ill Spl. Assmt Series 2014, 3.5% 12/1/19 (FSA Insured) | 120,000 | 120,811 | |
| Railsplitter Tobacco Settlement Auth. Rev.: | |||
| Series 2010: | |||
| 5% 6/1/19 | 1,850,000 | 1,850,000 | |
| 5.125% 6/1/19 | 1,230,000 | 1,230,000 | |
| 5.25% 6/1/20 | 2,060,000 | 2,129,538 | |
| Series 2017, 5% 6/1/22 | 220,000 | 240,007 | |
| Rockford Park District Series 2019 B, 3% 12/15/20 | 1,165,000 | 1,182,114 | |
| Skokie Pk District Series 2003, 0% 12/1/22 | 1,830,000 | 1,701,863 | |
| Univ. of Illinois Rev. Series 2011 A, 5% 4/1/21 | 250,000 | 264,898 | |
| Waukegan Gen. Oblig. Series 2018 A: | |||
| 3% 12/30/20 (FSA Insured) | 1,000,000 | 1,020,860 | |
| 4% 12/30/21 (FSA Insured) | 410,000 | 432,829 | |
| 4% 12/30/22 (FSA Insured) | 425,000 | 455,354 | |
| Whiteside & Lee Counties Cmnty. Unit School District Series 2018 A, 4% 12/1/21 | 1,325,000 | 1,387,951 | |
| Will County Cmnty. Consolidated School District Series 2013, 2.3% 1/1/21 | 2,950,000 | 2,981,978 | |
| Will County Cmnty. Unit School District No. 200-U Series 2012, 4% 11/1/20 | 1,910,000 | 1,973,832 | |
| TOTAL ILLINOIS | 112,659,506 | ||
| Indiana - 1.4% | |||
| Hammond Loc Pub. Impt. Bd Bank Series 2019 A, 3.1% 12/31/19 | 4,250,000 | 4,273,148 | |
| Indiana Bond Bank Series 2019 A, 4% 1/3/20 | 6,500,000 | 6,591,671 | |
| Indiana Fin. Auth. (Citizens Energy Group Wtr. Proj.) Series 2014 A, 5% 10/1/19 | 115,000 | 116,312 | |
| Indiana Fin. Auth. Econ. Dev. Rev. Bonds (Republic Svcs., Inc. Proj.) Series A, 2.1%, tender 6/3/19 (a)(c) | 4,700,000 | 4,700,000 | |
| Indiana Fin. Auth. Hosp. Rev. Series 2013: | |||
| 5% 8/15/22 | 15,000 | 16,571 | |
| 5% 8/15/23 | 20,000 | 22,679 | |
| Indiana Fin. Auth. Rev.: | |||
| Series 2010 B, 5% 12/1/19 | 290,000 | 294,996 | |
| Series 2012: | |||
| 5% 3/1/20 | 15,000 | 15,375 | |
| 5% 3/1/21 | 25,000 | 26,365 | |
| Series 2016: | |||
| 3% 9/1/19 | 65,000 | 65,200 | |
| 4% 9/1/20 | 130,000 | 133,591 | |
| Indiana Fin. Auth. Wastewtr. Util. Rev. (CWA Auth. Proj.): | |||
| Series 2012 A: | |||
| 5% 10/1/20 | 20,000 | 20,898 | |
| 5% 10/1/22 | 35,000 | 38,902 | |
| Series 2014 A: | |||
| 5% 10/1/20 | 10,000 | 10,449 | |
| 5% 10/1/21 | 10,000 | 10,789 | |
| 5% 10/1/22 | 15,000 | 16,672 | |
| Series 2015 A: | |||
| 5% 10/1/24 | 35,000 | 41,064 | |
| 5% 10/1/25 | 35,000 | 40,947 | |
| Indiana Health Facility Fing. Auth. Rev. Bonds: | |||
| Series 2001 A2, 2%, tender 2/1/23 (a) | 155,000 | 156,570 | |
| Series 2005 A-5, 1.35%, tender 8/4/20 (a) | 2,695,000 | 2,689,098 | |
| Series 2005 A-8, 1.25%, tender 5/1/20 (a) | 380,000 | 379,008 | |
| Series 2005 A1, 2.8%, tender 8/1/19 (a) | 2,075,000 | 2,079,081 | |
| Series 2017: | |||
| 1.35%, tender 8/4/20 (a) | 175,000 | 174,617 | |
| 1.375%, tender 5/1/20 (a) | 980,000 | 978,543 | |
| Indiana Muni. Pwr. Agcy. Pwr. Supply Sys. Rev. Series 2011 A, 5% 1/1/20 | 25,000 | 25,509 | |
| Indianapolis Local Pub. Impt.: | |||
| (Indianapolis Arpt. Auth. Proj.) Series 2016 A1: | |||
| 5% 1/1/21 (c) | 60,000 | 62,968 | |
| 5% 1/1/23 (c) | 45,000 | 49,829 | |
| 5% 1/1/24 (c) | 60,000 | 68,014 | |
| 5% 1/1/25 (c) | 65,000 | 75,440 | |
| Series 2016, 5% 1/1/20 (c) | 685,000 | 698,070 | |
| Lake Central Multi-District School Bldg. Corp. Series 2012 B: | |||
| 4% 1/15/20 | 30,000 | 30,447 | |
| 4% 1/15/21 | 25,000 | 25,968 | |
| 5% 7/15/20 | 25,000 | 25,949 | |
| 5% 7/15/21 | 20,000 | 21,407 | |
| Michigan City School Bldg. Corp. (Michigan Gen. Oblig. Proj.): | |||
| Series 2015, 4% 7/15/19 | 550,000 | 551,421 | |
| Series 2016 A, 5% 7/15/20 | 1,040,000 | 1,069,567 | |
| Mount Vernon Ind. Envir. Bonds (Southern Indiana Gas & Elec. Co. Proj.) Series 2015, 2.375%, tender 9/1/20 (a)(c) | 1,000,000 | 998,460 | |
| Purdue Univ. Rev. Series 2012 AA, 5% 7/1/27 | 255,000 | 281,298 | |
| Whiting Envir. Facilities Rev.: | |||
| (BP Products North America, Inc. Proj.) Series 2009, 5.25% 1/1/21 | 1,525,000 | 1,605,093 | |
| Bonds: | |||
| (BP Products North America, Inc. Proj.): | |||
| Series 2008, 1.85%, tender 10/1/19 (a) | 4,100,000 | 4,102,317 | |
| Series 2015, 5%, tender 11/1/22 (a)(c) | 980,000 | 1,079,666 | |
| Series 2016 A, 5%, tender 3/1/23 (a)(c) | 500,000 | 554,800 | |
| Series 2014, SIFMA Municipal Swap Index + 0.750% 2.17%, tender 6/6/19 (a)(c)(e) | 12,440,000 | 12,445,256 | |
| TOTAL INDIANA | 46,664,025 | ||
| Iowa - 0.6% | |||
| Iowa Fin. Auth. Multi-family Rev. Bonds (Elevate at Jordan Creek Apts. Proj.) Series 2018, 2%, tender 3/1/20 (a) | 12,600,000 | 12,625,550 | |
| Iowa Fin. Auth. Rev. Series 2018 B, 5% 2/15/20 | 300,000 | 307,164 | |
| Iowa Fin. Auth. Single Family Mtg. Bonds Series 2018 B, SIFMA Municipal Swap Index + 0.300% 1.72%, tender 5/3/21 (a)(e) | 3,500,000 | 3,493,980 | |
| Iowa Student Ln. Liquidity Corp. Student Ln. Rev.: | |||
| Series 2015 A, 5% 12/1/21 (c) | 1,000,000 | 1,071,430 | |
| Series 2018 A: | |||
| 5% 12/1/20 (c) | 500,000 | 522,055 | |
| 5% 12/1/21 (c) | 500,000 | 535,715 | |
| 5% 12/1/22 (c) | 725,000 | 795,173 | |
| TOTAL IOWA | 19,351,067 | ||
| Kansas - 0.4% | |||
| Desoto Usd # 232 Series 2015 A, 5% 9/1/22 | 35,000 | 38,867 | |
| Kansas Dept. of Trans. Hwy. Rev.: | |||
| Series 2004 C1, 1 month U.S. LIBOR + 0.300% 2.04% 9/1/21 (a)(e) | 5,000,000 | 5,001,752 | |
| Series 2014 B, 1 month U.S. LIBOR + 0.400% 2.066% 9/1/19 (a)(e) | 1,310,000 | 1,310,949 | |
| Series 2018 A, 5% 9/1/20 | 1,020,000 | 1,065,155 | |
| Kansas Dev. Fin. Agcy. Series 2009, 5.25% 11/15/21 | 685,000 | 696,398 | |
| Wichita Gen. Oblig. Series 2018 292, 4% 10/15/19 | 5,000,000 | 5,045,252 | |
| Wyandotte County/Kansas City Unified Govt. Util. Sys. Rev. Series 2016 A: | |||
| 5% 9/1/22 | 10,000 | 11,058 | |
| 5% 9/1/23 | 15,000 | 17,016 | |
| 5% 9/1/25 | 15,000 | 17,821 | |
| TOTAL KANSAS | 13,204,268 | ||
| Kentucky - 1.5% | |||
| Ashland Med. Ctr. Rev.: | |||
| (Ashland Hosp. Corp. D/B/A King's Daughters Med. Ctr. Proj.) Series 2016 A: | |||
| 4% 2/1/20 | 205,000 | 207,232 | |
| 5% 2/1/24 | 30,000 | 33,395 | |
| (Ashland Hosp. Corp. D/B/A Kings Daughters Med. Ctr. Proj.) Series 2016 A, 5% 2/1/25 | 20,000 | 22,705 | |
| Carroll County Poll. Ctlr Rev. Bonds (Kentucky Utils. Co. Proj.) Series 2016 A, 1.05%, tender 9/1/19 (a) | 4,000,000 | 3,990,905 | |
| Kenton County Arpt. Board Arpt. Rev. Series 2016: | |||
| 5% 1/1/20 | 55,000 | 56,059 | |
| 5% 1/1/22 | 285,000 | 310,661 | |
| Kentucky Bond Dev. Corp. (Lexington Ctr. Corp. Proj.) Series 2018 A, 5% 9/1/21 | 360,000 | 386,082 | |
| Kentucky Econ. Dev. Fin. Auth. Bonds: | |||
| Series 2009 B, 2.7%, tender 11/10/21 (a) | 345,000 | 351,745 | |
| Series 2011 B, 1 month U.S. LIBOR + 0.900% 2.59%, tender 6/1/19 (a)(e) | 1,530,000 | 1,530,246 | |
| Kentucky Econ. Dev. Fin. Auth. Hosp. Rev. Series 2017 A: | |||
| 5% 6/1/20 | 110,000 | 112,884 | |
| 5% 6/1/21 | 230,000 | 241,751 | |
| Kentucky Higher Ed. Student Ln. Corp. Rev.: | |||
| Series 2019 A1 5% 6/1/23 (c) | 250,000 | 276,015 | |
| Series 2019 A1, 5% 6/1/22 (c) | 200,000 | 216,124 | |
| Kentucky Hsg. Corp. Hsg. Rev. Bonds (Westminster Village Proj.) Series 2019, 2%, tender 4/1/21 (a) | 2,000,000 | 2,007,220 | |
| Kentucky Rural Wtr. Fin. Corp. Series 2018 E1, 2.25% 3/1/20 | 6,000,000 | 6,007,363 | |
| Kentucky State Property & Buildings Commission Rev.: | |||
| (Kentucky St Proj.) Series D: | |||
| 5% 5/1/20 | 1,635,000 | 1,686,262 | |
| 5% 5/1/21 | 210,000 | 223,201 | |
| (Kentucky St Proj.): | |||
| Series 2005 5% 8/1/21 (Nat'l. Pub. Fin. Guarantee Corp. Insured) | 360,000 | 386,089 | |
| Series 2005, 5% 8/1/20 (Nat'l. Pub. Fin. Guarantee Corp. Insured) | 460,000 | 478,354 | |
| (Proj. No. 100) Series 2011 A, 5% 8/1/20 | 605,000 | 629,140 | |
| (Proj. No. 115) Series 2017, 5% 4/1/20 | 775,000 | 797,076 | |
| (Proj. No. 117) Series B, 3% 5/1/20 | 540,000 | 547,227 | |
| (Proj. No. 83) Series 2004, 5% 10/1/19 (AMBAC Insured) | 525,000 | 531,059 | |
| (Proj. No. 98) Series 2010: | |||
| 4% 8/1/19 | 360,000 | 361,456 | |
| 4% 8/1/20 | 675,000 | 694,217 | |
| 5% 8/1/21 | 460,000 | 477,968 | |
| Series 2011, 5% 10/1/19 | 500,000 | 505,771 | |
| Series 2015 B, 5% 8/1/20 | 615,000 | 639,539 | |
| Series 2015, 4% 8/1/20 | 300,000 | 308,541 | |
| Series 2016 B, 5% 11/1/19 | 890,000 | 902,912 | |
| Series 2017: | |||
| 5% 4/1/21 | 600,000 | 637,428 | |
| 5% 4/1/22 | 400,000 | 436,728 | |
| Series A, 5% 8/1/22 | 350,000 | 374,672 | |
| Series B: | |||
| 5% 11/1/21 | 250,000 | 269,978 | |
| 5% 8/1/22 | 250,000 | 275,553 | |
| Kentucky, Inc. Pub. Energy: | |||
| Bonds Series 2019 A1, 4%, tender 6/1/25 (a) | 1,000,000 | 1,097,130 | |
| Series 2018 B: | |||
| 4% 1/1/20 | 430,000 | 435,333 | |
| 4% 7/1/20 | 1,000,000 | 1,022,870 | |
| 4% 7/1/21 | 1,350,000 | 1,407,402 | |
| Louisville & Jefferson County (Norton Healthcare, Inc. Proj.) Series 2016 A, 5% 10/1/19 | 290,000 | 293,117 | |
| Louisville Reg'l. Arpt. Auth. Sys. Rev. Series 2014 A: | |||
| 5% 7/1/21 (c) | 1,250,000 | 1,329,788 | |
| 5% 7/1/23 (c) | 1,750,000 | 1,957,375 | |
| Louisville/Jefferson County Metropolitan Gov. Series 2012 A: | |||
| 5% 12/1/28 | 55,000 | 59,857 | |
| 5% 12/1/29 | 230,000 | 250,001 | |
| Louisville/Jefferson County Metropolitan Govt. Poll. Cont. Rev. Bonds: | |||
| (Louisville Gas and Elec. Co. Proj.): | |||
| Series 2001 B, 2.55%, tender 5/3/21 (a) | 2,000,000 | 2,036,040 | |
| Series 2007 A, 1.65%, tender 6/1/21 (a)(b) | 7,250,000 | 7,258,483 | |
| Series 2007 B, 1.65%, tender 6/1/21 (a)(b) | 2,000,000 | 2,002,340 | |
| Series 2007 A, 1.25%, tender 6/3/19 (a) | 875,000 | 875,000 | |
| Trimble County Poll. Cont. Rev. Bonds (Louisville Gas and Elec. Co. Proj.): | |||
| Series 2001 A, 2.3%, tender 9/1/21 (a) | 600,000 | 608,124 | |
| Series 2001 B, 2.55%, tender 5/3/21 (a) | 2,590,000 | 2,636,672 | |
| Univ. Louisville Revs. Series 2016 C, 3% 9/1/21 | 780,000 | 802,862 | |
| TOTAL KENTUCKY | 50,985,952 | ||
| Louisiana - 0.6% | |||
| Lafayette Pub. Impt. Sale Tax Series 2015, 5% 5/1/20 | 1,000,000 | 1,031,814 | |
| Louisiana Citizens Property Ins. Corp. Assessment Rev. Series 2015: | |||
| 5% 6/1/19 | 495,000 | 495,000 | |
| 5% 6/1/20 | 1,640,000 | 1,697,775 | |
| 5% 6/1/21 (FSA Insured) | 1,660,000 | 1,772,565 | |
| Louisiana Gen. Oblig.: | |||
| Series 2012 A, 5% 8/1/22 | 35,000 | 38,737 | |
| Series 2014 D1, 5% 12/1/22 | 30,000 | 33,527 | |
| Series 2016 B: | |||
| 5% 8/1/22 | 310,000 | 342,593 | |
| 5% 8/1/23 | 135,000 | 153,445 | |
| Series 2016 D: | |||
| 5% 9/1/22 | 140,000 | 155,326 | |
| 5% 9/1/24 | 155,000 | 181,629 | |
| Louisiana Hsg. Corp. Multifamily Hsg. Rev. Bonds Series 2018, 2.4%, tender 6/1/20 (a) | 7,000,000 | 7,041,777 | |
| Louisiana Offshore Term. Auth. Deepwater Port Rev. Bonds Series 2010 B-1A, 2%, tender 10/1/22 (a) | 815,000 | 814,487 | |
| Louisiana Pub. Facilities Auth. Rev.: | |||
| (Tulane Univ. of Louisiana Proj.) Series 2016 A, 5% 12/15/19 | 255,000 | 259,616 | |
| Series 2009 A, 5.25% 7/1/20 (Escrowed to Maturity) | 870,000 | 902,843 | |
| Series 2017, 4% 8/1/19 | 945,000 | 948,534 | |
| Louisiana Stadium and Exposition District Series 2013 A: | |||
| 5% 7/1/19 | 250,000 | 250,644 | |
| 5% 7/1/21 | 35,000 | 37,441 | |
| 5% 7/1/22 | 20,000 | 22,024 | |
| New Orleans Aviation Board Rev.: | |||
| (North Term. Proj.) Series 2017 B: | |||
| 5% 1/1/20 (c) | 710,000 | 723,299 | |
| 5% 1/1/22 (c) | 280,000 | 301,888 | |
| 5% 1/1/23 (c) | 705,000 | 779,378 | |
| 5% 1/1/24 (c) | 5,000 | 5,649 | |
| 5% 1/1/25 (c) | 5,000 | 5,769 | |
| 5% 1/1/26 (c) | 10,000 | 11,777 | |
| Series 2017 D1, 5% 1/1/20 | 475,000 | 484,450 | |
| Series 2017 D2: | |||
| 5% 1/1/20 (c) | 50,000 | 50,937 | |
| 5% 1/1/21 (c) | 290,000 | 304,065 | |
| 5% 1/1/22 (c) | 345,000 | 371,969 | |
| 5% 1/1/23 (c) | 10,000 | 11,055 | |
| 5% 1/1/24 (c) | 15,000 | 16,947 | |
| 5% 1/1/25 (c) | 10,000 | 11,538 | |
| New Orleans Gen. Oblig. Series 2012, 5% 12/1/20 | 60,000 | 62,968 | |
| St. Tammany Parish Hosp. Svc. (St. Tammany Parish Hosp. Proj.) Series 2011, 4.5% 7/1/21 (Escrowed to Maturity) | 600,000 | 636,636 | |
| Tobacco Settlement Fing. Corp. Series 2013 A: | |||
| 5% 5/15/20 | 925,000 | 952,490 | |
| 5% 5/15/21 | 435,000 | 460,569 | |
| 5% 5/15/23 | 100,000 | 111,130 | |
| TOTAL LOUISIANA | 21,482,291 | ||
| Maine - 0.0% | |||
| Maine Fin. Auth. Student Ln. Rev. Series 2019 A, 5% 12/1/23 (FSA Insured) (c) | 500,000 | 563,115 | |
| Maine Health & Higher Edl. Facilities Auth. Rev.: | |||
| (Univ. of New England Proj.) Series 2017 A, 4% 7/1/20 | 250,000 | 256,395 | |
| Series 2017 B, 4% 7/1/21 | 85,000 | 89,058 | |
| Maine Tpk. Auth. Tpk. Rev. Series 2015: | |||
| 5% 7/1/21 | 50,000 | 53,626 | |
| 5% 7/1/22 | 40,000 | 44,252 | |
| TOTAL MAINE | 1,006,446 | ||
| Maryland - 1.2% | |||
| Baltimore Proj. Rev. Series 2017 D: | |||
| 5% 7/1/24 | 70,000 | 81,890 | |
| 5% 7/1/25 | 75,000 | 89,785 | |
| Cmnty. Dev. Admin Dept. Hsg. Series 2018 A, 2.44% 3/1/20 | 3,000,000 | 3,004,118 | |
| County Commissioners of Charles County Consolidated Series 2018, 5% 10/1/20 | 2,990,000 | 3,132,384 | |
| Howard County Gen. Oblig. (MD Consolidated Pub. Impt. Proj.) Series 2018 A, 5% 2/15/20 | 975,000 | 999,525 | |
| Maryland Dept. of Trans. Consolidated Trans. Rev. Series 2016, 5% 11/1/19 | 2,055,000 | 2,085,323 | |
| Maryland Econ. Dev. Corp. Lease Rev. (Maryland Pub. Health Lab. Proj.) Series 2011, 5% 6/1/19 | 3,415,000 | 3,415,000 | |
| Maryland Gen. Oblig. Third Series 2009 C, 5% 11/1/19 | 2,810,000 | 2,851,697 | |
| Maryland Health & Higher Edl. Facilities Auth. Rev.: | |||
| Series 2015: | |||
| 5% 7/1/19 | 10,000 | 10,024 | |
| 5% 7/1/22 | 20,000 | 21,886 | |
| 5% 7/1/23 | 20,000 | 22,420 | |
| 5% 7/1/24 | 45,000 | 51,670 | |
| 5% 7/1/25 | 40,000 | 46,898 | |
| Series 2017, 5% 7/1/20 | 1,330,000 | 1,378,718 | |
| Maryland St Cmnty. Dev. Admin Dept. Hsg. & Cmnty. Dev.: | |||
| Series 2017 D, 1.83% 6/1/19 | 1,460,000 | 1,460,000 | |
| Series 2018 B, 2.61% 4/1/20 | 4,655,000 | 4,667,406 | |
| Series 2019 B: | |||
| 1.55% 9/1/20 (b) | 1,020,000 | 1,020,826 | |
| 1.6% 3/1/21 (b) | 1,390,000 | 1,391,473 | |
| 4% 9/1/49 (b) | 285,000 | 309,912 | |
| Maryland-Nat'l. Cap. Park and Planning Commission Series 2018 A, 5% 11/1/20 | 675,000 | 709,148 | |
| Montgomery County Gen. Oblig. Bonds Series 2013 MD, 1.85%, tender 6/3/19 (a)(b) | 9,060,000 | 9,060,000 | |
| Prince Georges County Gen. Oblig. Series 2018 A, 5% 7/15/19 | 5,000,000 | 5,020,605 | |
| TOTAL MARYLAND | 40,830,708 | ||
| Massachusetts - 1.2% | |||
| Massachusetts Dept. of Trans. Metropolitan Hwy. Sys. Rev. Series 2010 B, 5% 1/1/20 | 130,000 | 132,662 | |
| Massachusetts Dev. Fin. Agcy. Rev.: | |||
| (Lesley Univ. Proj.) Series 2016, 5% 7/1/20 | 260,000 | 269,552 | |
| Series 2011, 7.25% 1/1/32 (Pre-Refunded to 1/1/21 @ 100) | 1,700,000 | 1,849,056 | |
| Series 2012 G, 5% 10/1/19 | 400,000 | 404,577 | |
| Series 2016 A, 5% 7/15/22 | 30,000 | 33,364 | |
| Series 2016 I: | |||
| 5% 7/1/21 | 10,000 | 10,664 | |
| 5% 7/1/22 | 15,000 | 16,447 | |
| 5% 7/1/23 | 15,000 | 16,878 | |
| 5% 7/1/24 | 25,000 | 28,823 | |
| 5% 7/1/25 | 20,000 | 23,549 | |
| 5% 7/1/26 | 20,000 | 23,964 | |
| Series 2019 A: | |||
| 5% 7/1/20 | 450,000 | 466,088 | |
| 5% 7/1/21 | 200,000 | 213,188 | |
| 5% 7/1/22 | 450,000 | 492,710 | |
| 5% 7/1/24 | 155,000 | 177,328 | |
| Series Z1, 1.5% 8/1/19 | 2,500,000 | 2,500,208 | |
| Massachusetts Edl. Fing. Auth. Rev.: | |||
| Series 2011 J, 5.125% 7/1/22 (c) | 1,000,000 | 1,066,520 | |
| Series 2012 J, 5% 7/1/19 (c) | 6,000,000 | 6,014,945 | |
| Series 2013, 5% 7/1/19 (c) | 105,000 | 105,262 | |
| Series 2015 A, 5% 1/1/22 (c) | 300,000 | 323,766 | |
| Series 2016 J: | |||
| 5% 7/1/21 (c) | 1,245,000 | 1,326,037 | |
| 5% 7/1/22 (c) | 510,000 | 557,925 | |
| 5% 7/1/23 (c) | 725,000 | 812,725 | |
| Series 2016, 4% 7/1/20 (c) | 1,950,000 | 1,996,898 | |
| Series 2017 A: | |||
| 3% 7/1/19 (c) | 65,000 | 65,065 | |
| 4% 7/1/20 (c) | 95,000 | 97,285 | |
| Massachusetts Gen. Oblig.: | |||
| Bonds Series 2014 D1, 1.05%, tender 7/1/20 (a) | 1,980,000 | 1,969,486 | |
| Series 2017 B, SIFMA Municipal Swap Index + 0.600% 2.02% 2/1/20 (a)(e) | 4,480,000 | 4,483,392 | |
| Series 2018 B, 5% 7/1/19 | 5,000,000 | 5,013,566 | |
| Massachusetts Health & Edl. Facilities Auth. Rev. (Partners Healthcare Sys., Inc. Proj.): | |||
| Series 2007 G2, 2.09%, tender 6/7/19 (FSA Insured) (a) | 4,995,000 | 4,995,000 | |
| Series 2010, 5% 7/1/21 | 145,000 | 145,377 | |
| Massachusetts Hsg. Fin. Agcy. Hsg. Rev.: | |||
| Bonds Series 2017, 1.5%, tender 7/1/20 (a) | 340,000 | 339,850 | |
| Series 2013 163: | |||
| 2.2% 6/1/19 (c) | 1,175,000 | 1,175,000 | |
| 2.5% 6/1/20 (c) | 1,235,000 | 1,244,795 | |
| Massachusetts Port Auth. Rev.: | |||
| Series 2017 A: | |||
| 5% 7/1/24 (c) | 65,000 | 75,385 | |
| 5% 7/1/25 (c) | 25,000 | 29,705 | |
| Series 2019 A, 5% 7/1/20 (c) | 2,250,000 | 2,330,685 | |
| TOTAL MASSACHUSETTS | 40,827,727 | ||
| Michigan - 1.0% | |||
| Clarkston Cmnty. Schools: | |||
| Series 2016 I, 4% 5/1/20 | 90,000 | 92,071 | |
| 5% 5/1/22 | 35,000 | 38,442 | |
| Detroit Downtown Dev. Auth. Tax: | |||
| Series 1, 5% 7/1/22 (FSA Insured) | 500,000 | 545,885 | |
| Series A, 5% 7/1/25 (FSA Insured) | 550,000 | 629,431 | |
| Detroit Swr. Disp. Rev. Series 2006 D, 3 month U.S. LIBOR + 0.600% 2.336% 7/1/32 (a)(e) | 90,000 | 89,555 | |
| Ferris State Univ. Rev. Series 2016: | |||
| 5% 10/1/19 | 100,000 | 101,141 | |
| 5% 10/1/20 | 140,000 | 146,420 | |
| Grand Blanc Cmnty. Schools Series 2013: | |||
| 5% 5/1/20 | 60,000 | 61,920 | |
| 5% 5/1/21 | 45,000 | 47,996 | |
| 5% 5/1/22 | 40,000 | 43,922 | |
| Grand Haven Area Pub. Schools Series 2013, 3% 5/1/20 | 130,000 | 131,858 | |
| Grand Rapids Pub. Schools 5% 5/1/23 (FSA Insured) | 30,000 | 33,828 | |
| Grand Valley Michigan State Univ. Rev. Series 2011, 5% 2/1/20 | 335,000 | 342,668 | |
| Huron Valley School District Series 2011, 5% 5/1/21 | 510,000 | 543,747 | |
| Kalamazoo Hosp. Fin. Auth. Hosp. Facilities Rev. Series 2016: | |||
| 5% 5/15/22 | 20,000 | 21,793 | |
| 5% 5/15/24 | 10,000 | 11,463 | |
| 5% 5/15/25 | 15,000 | 17,603 | |
| 5% 5/15/26 | 15,000 | 17,972 | |
| Kent Hosp. Fin. Auth. Hosp. Facilities Rev. (Spectrum Health Sys. Proj.) Series 2011 A: | |||
| 5% 11/15/19 | 20,000 | 20,312 | |
| 5% 11/15/20 | 165,000 | 172,993 | |
| Lapeer Cmnty. Schools Series 2016, 4% 5/1/20 | 310,000 | 316,707 | |
| Michigan Bldg. Auth. Rev. (Facilities Prog.) Series 2016 I: | |||
| 5% 4/15/22 | 455,000 | 499,886 | |
| 5% 4/15/24 | 30,000 | 34,879 | |
| Michigan Fin. Auth. Rev.: | |||
| (Mclaren Health Care Corp. Proj.) 5% 5/15/21 | 145,000 | 154,558 | |
| Bonds: | |||
| Series 2013 M1, 1.85%, tender 6/3/19 (a)(b) | 3,560,000 | 3,560,000 | |
| Series 2016 MI2, SIFMA Municipal Swap Index + 0.480% 1.9%, tender 2/1/22 (a)(e) | 5,000,000 | 4,998,650 | |
| Series 2019 MI2, 5%, tender 2/1/25 (a) | 1,605,000 | 1,874,752 | |
| 1.1%, tender 8/15/19 (a) | 1,455,000 | 1,453,727 | |
| Series 2014, 4% 6/1/19 | 450,000 | 450,000 | |
| Series 2015 A: | |||
| 5% 8/1/22 | 1,050,000 | 1,160,061 | |
| 5% 8/1/23 | 85,000 | 96,577 | |
| Series 2016: | |||
| 3% 1/1/20 | 40,000 | 40,289 | |
| 5% 11/15/19 | 130,000 | 131,931 | |
| Michigan Gen. Oblig. Series 2016: | |||
| 5% 3/15/20 | 355,000 | 364,682 | |
| 5% 3/15/21 | 20,000 | 21,232 | |
| 5% 3/15/22 | 50,000 | 54,736 | |
| 5% 3/15/23 | 85,000 | 95,741 | |
| Michigan Hosp. Fin. Auth. Rev.: | |||
| Bonds: | |||
| (Ascension Health Cr. Group Proj.) Series F5, 2.4%, tender 3/15/23 (a) | 80,000 | 81,378 | |
| Series 2005 A, 1.5%, tender 5/1/20 (a) | 340,000 | 339,876 | |
| Series 2005 A4, 1.625%, tender 11/1/19 (a) | 145,000 | 145,049 | |
| Series 2010 F4, 1.95%, tender 4/1/20 (a) | 1,350,000 | 1,354,509 | |
| Series 2010 B, 5% 11/15/21 | 265,000 | 269,115 | |
| Michigan Strategic Fund Ltd. Oblig. Rev. Bonds: | |||
| Series 2008 ET2, 1.45%, tender 9/1/21 (a) | 2,700,000 | 2,668,653 | |
| Series CC, 1.45%, tender 9/1/21 (a) | 155,000 | 153,200 | |
| Milan Area Schools Series 2019, 5% 5/1/20 | 760,000 | 782,779 | |
| Mount Clemens Cmnty. School District Series 2017 A, 5% 5/1/20 | 220,000 | 227,161 | |
| Oakland Univ. Rev. Series 2016, 5% 3/1/22 | 385,000 | 418,368 | |
| Portage Pub. Schools Series 2016: | |||
| 5% 5/1/20 | 175,000 | 180,680 | |
| 5% 5/1/23 | 45,000 | 50,669 | |
| 5% 11/1/23 | 30,000 | 34,210 | |
| 5% 5/1/24 | 40,000 | 46,295 | |
| 5% 11/1/24 | 45,000 | 52,758 | |
| 5% 5/1/25 | 25,000 | 29,682 | |
| 5% 11/1/25 | 25,000 | 30,028 | |
| 5% 5/1/26 | 35,000 | 42,585 | |
| 5% 11/1/26 | 25,000 | 30,375 | |
| 5% 11/1/28 | 20,000 | 24,168 | |
| Royal Oak City School District Series 2018: | |||
| 5% 5/1/21 | 250,000 | 266,935 | |
| 5% 5/1/22 | 440,000 | 482,742 | |
| Royal Oak Hosp. Fin. Auth. Hosp. Rev. Series 2014 D: | |||
| 5% 9/1/21 | 35,000 | 37,632 | |
| 5% 9/1/23 | 10,000 | 11,388 | |
| Spring Lake Pub. Schools: | |||
| 5% 5/1/20 | 805,000 | 830,759 | |
| 5% 11/1/20 | 40,000 | 41,978 | |
| 5% 5/1/21 | 90,000 | 95,991 | |
| Univ. of Michigan Rev. Bonds Series 2012 E, SIFMA Municipal Swap Index + 0.270% 2.57%, tender 4/1/22 (a)(e) | 1,985,000 | 1,976,782 | |
| Wayne County Arpt. Auth. Rev.: | |||
| Series 2011 A, 5% 12/1/19 (c) | 1,575,000 | 1,600,727 | |
| Series 2017 A: | |||
| 5% 12/1/19 | 320,000 | 325,608 | |
| 5% 12/1/20 | 155,000 | 163,091 | |
| Series 2017 B: | |||
| 5% 12/1/19 (c) | 365,000 | 370,962 | |
| 5% 12/1/20 (c) | 270,000 | 283,109 | |
| 5% 12/1/21 (c) | 300,000 | 323,025 | |
| Zeeland Pub. Schools Series 2015, 5% 5/1/21 | 445,000 | 473,320 | |
| TOTAL MICHIGAN | 32,665,015 | ||
| Minnesota - 0.4% | |||
| Apple Vy Minn Sr Living Rev. Series 2016 B: | |||
| 3% 1/1/20 | 145,000 | 145,195 | |
| 4% 1/1/21 | 150,000 | 152,601 | |
| 4% 1/1/22 | 155,000 | 159,137 | |
| Dakota & Washington Counties Hsg. & Redev. Auth. Series 1988, 8.45% 9/1/19 (Escrowed to Maturity) (c) | 2,655,000 | 2,697,299 | |
| Kanabec County Minn Healthcare R Series 2018, 2.75% 12/1/19 | 875,000 | 875,231 | |
| Maple Grove Health Care Sys. Rev. Series 2017: | |||
| 4% 5/1/20 | 890,000 | 907,794 | |
| 4% 5/1/21 | 110,000 | 114,607 | |
| 4% 5/1/22 | 110,000 | 116,795 | |
| 5% 5/1/23 | 110,000 | 122,971 | |
| Minneapolis & Saint Paul Metropolitan Arpts. Commission Arpt. Rev.: | |||
| Series 2014 A: | |||
| 5% 1/1/22 | 20,000 | 21,780 | |
| 5% 1/1/23 | 20,000 | 22,426 | |
| Series 2014 B: | |||
| 5% 1/1/21 (c) | 50,000 | 52,553 | |
| 5% 1/1/22 (c) | 45,000 | 48,683 | |
| 5% 1/1/23 (c) | 20,000 | 22,220 | |
| Minneapolis Multi-family Rev. Bonds (1500 Nicollet Apts. Proj.) Series 2017 A, 1.375%, tender 11/1/19 (a) | 2,250,000 | 2,246,526 | |
| Minnesota Hsg. Fin. Agcy.: | |||
| Bonds Series 2018 D, SIFMA Municipal Swap Index + 0.430% 1.85%, tender 7/3/23 (a)(e) | 3,000,000 | 2,983,740 | |
| Series 2018 F, 2.4% 1/1/20 (c) | 925,000 | 928,154 | |
| Moorhead Edl. Facilities Rev. (The Concordia College Corp. Proj.) Series 2016, 5% 12/1/25 | 65,000 | 72,873 | |
| Northern Muni. Pwr. Agcy. Elec. Sys. Rev. Series 2017: | |||
| 5% 1/1/22 | 25,000 | 27,125 | |
| 5% 1/1/23 | 25,000 | 27,904 | |
| 5% 1/1/24 | 35,000 | 40,104 | |
| Roseville Independent School District #623 Series 2018A, 5% 2/1/21 | 1,715,000 | 1,810,594 | |
| Saint Paul Hsg. & Redev. Auth. Rev. Bonds (Union Flats Apts. Proj.) Series 2017 B, 2.75%, tender 2/1/21 (a) | 980,000 | 978,020 | |
| Western Minnesota Muni. Pwr. Agcy. Pwr. Supply Rev. Series 2014 A: | |||
| 5% 1/1/22 | 20,000 | 21,780 | |
| 5% 1/1/23 | 35,000 | 39,246 | |
| 5% 1/1/24 | 20,000 | 23,069 | |
| TOTAL MINNESOTA | 14,658,427 | ||
| Mississippi - 0.1% | |||
| Mississippi Dev. Bank Spl. Oblig. Series 2010 D, 5% 8/1/21 (Pre-Refunded to 8/1/20 @ 100) | 1,880,000 | 1,955,463 | |
| Missouri - 0.3% | |||
| Cape Girardeau County Indl. Dev. Auth. (Southeast Hosp. Proj.) Series 2017 A: | |||
| 5% 3/1/20 | 5,000 | 5,106 | |
| 5% 3/1/21 | 10,000 | 10,469 | |
| 5% 3/1/22 | 15,000 | 16,083 | |
| 5% 3/1/23 | 20,000 | 21,891 | |
| 5% 3/1/24 | 15,000 | 16,754 | |
| 5% 3/1/25 | 15,000 | 17,090 | |
| 5% 3/1/26 | 20,000 | 23,152 | |
| Kansas City Santn Swr. Sys. R: | |||
| Series 2018 A, 4% 1/1/21 | 350,000 | 364,123 | |
| Series 2018 B, 5% 1/1/20 | 100,000 | 102,065 | |
| Kansas City Indl. Dev. Auth. Multi-family Hsg. Rev. Bonds (Gotham Apts. Proj.) Series 2018, 1.81%, tender 8/1/19 (a) | 1,000,000 | 1,000,291 | |
| Missouri Health & Edl. Facilities Rev.: | |||
| Series 2016, 5% 5/15/20 | 200,000 | 206,308 | |
| Series 2019 A: | |||
| 5% 2/15/20 | 1,750,000 | 1,793,399 | |
| 5% 2/15/21 | 775,000 | 821,082 | |
| Saint Louis Arpt. Rev. Series 2017 B, 4% 7/1/19 (FSA Insured) (c) | 5,985,000 | 5,995,729 | |
| St Louis County Libr District Ctfs. Series 2013, 5% 4/1/20 | 1,545,000 | 1,590,045 | |
| TOTAL MISSOURI | 11,983,587 | ||
| Montana - 0.1% | |||
| Montana Facility Fin. Auth. Rev. Series 2016: | |||
| 5% 2/15/20 | 1,815,000 | 1,857,574 | |
| 5% 2/15/21 | 550,000 | 580,322 | |
| TOTAL MONTANA | 2,437,896 | ||
| Nebraska - 0.1% | |||
| Douglas County Hsg. Auth. (Sorensen Sr. Residences Proj.) Series 2017 A, 2.05% 3/1/20 | 3,000,000 | 3,001,808 | |
| Nebraska Invt. Fin. Auth. Single Family Hsg. Rev.: | |||
| Series 2013 B, 2.15% 9/1/19 (c) | 555,000 | 555,360 | |
| Series 2019 B, 4% 9/1/49 (c) | 170,000 | 182,264 | |
| TOTAL NEBRASKA | 3,739,432 | ||
| Nevada - 0.7% | |||
| Clark County Arpt. Rev.: | |||
| (Sub Lien Proj.) Series 2017 A-1: | |||
| 5% 7/1/20 (c) | 1,355,000 | 1,401,531 | |
| 5% 7/1/21 (c) | 1,825,000 | 1,946,874 | |
| 5% 7/1/22 (c) | 85,000 | 93,228 | |
| Series 2010 D, 5% 7/1/20 | 320,000 | 326,384 | |
| Series 2013 A, 5% 7/1/20 (c) | 500,000 | 516,900 | |
| Series 2014 A, 5% 7/1/20 (c) | 1,000,000 | 1,034,340 | |
| Series 2017 C, 5% 7/1/21 (c) | 2,290,000 | 2,440,522 | |
| Clark County McCarran Int'l. Arpt. Passenger Facility Charge Rev. Series 2015 C, 5% 7/1/19 | 1,875,000 | 1,879,742 | |
| Clark County Poll. Cont. Rev. Bonds (Nevada Pwr. Co. Projs.) Series 2017, 1.6%, tender 5/21/20 (a) | 1,060,000 | 1,058,081 | |
| Clark County School District: | |||
| Series 2007 A, 4.5% 6/15/19 | 85,000 | 85,080 | |
| Series 2012 A, 5% 6/15/21 | 500,000 | 534,350 | |
| Series 2015 D, 5% 6/15/20 | 210,000 | 217,443 | |
| Series 2016 A: | |||
| 5% 6/15/21 | 35,000 | 37,405 | |
| 5% 6/15/23 | 30,000 | 33,979 | |
| Series 2016 F, 5% 6/15/19 | 1,000,000 | 1,001,077 | |
| Series 2017 A, 5% 6/15/22 | 2,000,000 | 2,204,020 | |
| Series 2017 B, 5% 6/15/19 | 205,000 | 205,221 | |
| Series 2017 C, 5% 6/15/20 | 925,000 | 957,787 | |
| Series 2017 D, 5% 6/15/20 | 230,000 | 238,152 | |
| Humboldt County Nev Poll. Cont. Rev. Bonds (Sierra Pacific Pwr. Co. Proj.) Series 2016 A, 1.25%, tender 6/3/19 (a) | 45,000 | 45,000 | |
| Nevada Gen. Oblig. Series 2013 D1, 5% 3/1/24 | 60,000 | 67,555 | |
| Washoe County Gas & Wtr. Facilities Bonds (Sierra Pacific Pwr. Co. Proj.) Series 2016 B, 3%, tender 6/1/22 (a) | 115,000 | 119,442 | |
| Washoe County Gas Facilities Rev. Bonds: | |||
| (Sierra Pacific Pwr. Co. Proj.) Series 2016 A, 1.5%, tender 6/3/19 (a)(c) | 680,000 | 680,000 | |
| Series 2016 F, 2.05%, tender 4/15/22 (a)(c) | 6,000,000 | 6,031,740 | |
| TOTAL NEVADA | 23,155,853 | ||
| New Hampshire - 0.2% | |||
| New Hampshire Health & Ed. Facilities Auth. Rev.: | |||
| (Dartmouth-Hitchcock Obligated Group Proj.) Series 2010, 5% 8/1/40 (Pre-Refunded to 8/1/20 @ 100) | 2,000,000 | 2,079,100 | |
| (Southern NH Med. Ctr. Proj.) Series 2016: | |||
| 3% 10/1/19 | 160,000 | 160,668 | |
| 3% 10/1/21 | 225,000 | 230,792 | |
| (Wentworth-Douglas Hosp. Proj.) Series 2011 A, 6% 1/1/34 (Pre-Refunded to 1/1/21 @ 100) | 2,710,000 | 2,897,315 | |
| Series 2012: | |||
| 4% 7/1/20 | 60,000 | 61,359 | |
| 4% 7/1/21 | 35,000 | 36,532 | |
| Series 2016: | |||
| 3% 10/1/20 | 280,000 | 284,192 | |
| 5% 10/1/21 | 25,000 | 26,776 | |
| 5% 10/1/23 | 425,000 | 479,587 | |
| TOTAL NEW HAMPSHIRE | 6,256,321 | ||
| New Jersey - 3.4% | |||
| Camden County Impt. Auth. Health Care Redev. Rev. Series 2014 A: | |||
| 5% 2/15/20 | 70,000 | 71,533 | |
| 5% 2/15/21 | 55,000 | 57,884 | |
| 5% 2/15/22 | 55,000 | 59,586 | |
| 5% 2/15/23 | 70,000 | 77,727 | |
| Garden State Preservation Trust Open Space & Farmland Preservation Series 2012 A, 5% 11/1/19 | 2,315,000 | 2,346,098 | |
| Hudson County Impt. Auth. Rev. Series 2019 A, 3% 3/6/20 | 1,000,000 | 1,012,014 | |
| Jersey City Gen. Oblig. Series 2015, 4% 2/15/20 (FSA Insured) | 134,000 | 136,416 | |
| New Jersey Bldg. Auth. State Bldg. Rev. Series 2016 A, 5% 6/15/19 | 145,000 | 145,151 | |
| New Jersey Econ. Dev. Auth. Rev.: | |||
| (New Jersey Gen. Oblig. Proj.): | |||
| Series 2009 AA, 5.25% 12/15/20 | 255,000 | 255,293 | |
| Series 2011 EE, 4.5% 9/1/20 | 80,000 | 82,578 | |
| Series 2017 B, 5% 11/1/19 | 1,940,000 | 1,966,300 | |
| (Provident Montclair Proj.) Series 2017: | |||
| 4% 6/1/22 (FSA Insured) | 20,000 | 21,251 | |
| 5% 6/1/23 (FSA Insured) | 25,000 | 28,008 | |
| 5% 6/1/24 (FSA Insured) | 20,000 | 22,971 | |
| Series 2011 EE: | |||
| 5% 9/1/20 | 30,000 | 31,150 | |
| 5% 9/1/20 (Escrowed to Maturity) | 105,000 | 109,449 | |
| Series 2012 II: | |||
| 5% 3/1/21 | 150,000 | 157,397 | |
| 5% 3/1/22 | 135,000 | 145,531 | |
| Series 2013: | |||
| 5% 3/1/20 | 1,270,000 | 1,299,202 | |
| 5% 3/1/23 | 5,155,000 | 5,669,675 | |
| Series 2014 PP, 5% 6/15/19 | 3,110,000 | 3,113,233 | |
| Series 2014 UU, 5% 6/15/19 | 475,000 | 475,494 | |
| Series 2015 XX, 5% 6/15/19 | 3,270,000 | 3,273,399 | |
| Series 2016 BBB, 5% 6/15/21 | 1,090,000 | 1,157,438 | |
| Series 2017 B, 5% 11/1/20 | 2,180,000 | 2,274,677 | |
| Series 2017 DDD: | |||
| 5% 6/15/19 | 130,000 | 130,135 | |
| 5% 6/15/20 | 130,000 | 134,147 | |
| 5% 6/15/22 | 220,000 | 238,896 | |
| Series PP, 5% 6/15/20 | 50,000 | 51,595 | |
| New Jersey Edl. Facility: | |||
| ( William Paterson College Proj.) Series 2017 B, 5% 7/1/20 | 123,000 | 127,558 | |
| Series 2014: | |||
| 5% 6/15/20 | 240,000 | 247,656 | |
| 5% 6/15/21 | 240,000 | 254,849 | |
| Series 2016 A: | |||
| 5% 7/1/21 | 50,000 | 52,856 | |
| 5% 7/1/22 | 140,000 | 151,712 | |
| 5% 7/1/23 | 75,000 | 83,141 | |
| 5% 7/1/24 | 175,000 | 198,490 | |
| Series 2016 E, 5% 7/1/22 | 625,000 | 686,094 | |
| New Jersey Gen. Oblig.: | |||
| Series 2005 L, 5.25% 7/15/19 | 155,000 | 155,652 | |
| Series 2014, 5% 6/1/19 | 160,000 | 160,000 | |
| Series 2016 T, 5% 6/1/20 | 175,000 | 180,918 | |
| Series O, 5% 8/1/19 | 300,000 | 301,637 | |
| New Jersey Health Care Facilities Fing. Auth. Rev.: | |||
| (Barnabas Health Proj.) Series 2011 A, 5% 7/1/20 (Escrowed to Maturity) | 2,320,000 | 2,406,490 | |
| Series 2016 A: | |||
| 5% 7/1/19 | 35,000 | 35,078 | |
| 5% 7/1/19 | 200,000 | 200,524 | |
| 5% 7/1/21 | 5,000 | 5,313 | |
| 5% 7/1/22 | 5,000 | 5,464 | |
| 5% 7/1/23 | 15,000 | 16,771 | |
| 5% 7/1/24 | 20,000 | 22,829 | |
| 5% 7/1/24 | 10,000 | 11,415 | |
| 5% 7/1/24 | 25,000 | 29,074 | |
| 5% 7/1/25 | 10,000 | 11,637 | |
| 5% 7/1/26 | 5,000 | 5,911 | |
| 5% 7/1/27 | 5,000 | 5,901 | |
| Series 2016: | |||
| 4% 7/1/19 | 265,000 | 265,394 | |
| 4% 7/1/20 | 425,000 | 433,989 | |
| 5% 7/1/20 | 515,000 | 534,086 | |
| 5% 7/1/21 | 220,000 | 233,209 | |
| New Jersey Higher Ed. Student Assistance Auth. Student Ln. Rev.: | |||
| Series 2011 1, 5% 12/1/20 (c) | 3,520,000 | 3,682,694 | |
| Series 2012 1A, 5% 12/1/20 (c) | 2,000,000 | 2,092,440 | |
| Series 2013: | |||
| 4% 12/1/20 (c) | 1,055,000 | 1,088,306 | |
| 5% 12/1/19 (c) | 85,000 | 86,321 | |
| 5% 12/1/21 (c) | 1,500,000 | 1,612,455 | |
| Series 2015 1A: | |||
| 5% 12/1/21 (c) | 4,500,000 | 4,837,365 | |
| 5% 12/1/22 (c) | 200,000 | 220,352 | |
| Series 2017 1A: | |||
| 5% 12/1/22 (c) | 215,000 | 236,878 | |
| 5% 12/1/23 (c) | 45,000 | 50,701 | |
| Series 2017 1B: | |||
| 5% 12/1/19 (c) | 855,000 | 868,289 | |
| 5% 12/1/20 (c) | 1,665,000 | 1,741,956 | |
| 5% 12/1/21 (c) | 20,000 | 21,499 | |
| Series 2018 B: | |||
| 5% 12/1/20 (c) | 4,475,000 | 4,681,835 | |
| 5% 12/1/21(c) | 710,000 | 763,229 | |
| New Jersey Hsg. & Mtg. Fin. Agcy.: | |||
| (Spruce Spires Proj.) Bonds Series 2018 B, 2.02%, tender 8/1/20 (a) | 5,000,000 | 5,013,550 | |
| Bonds Series F, 1.9%, tender 8/1/19 (a) | 735,000 | 735,231 | |
| New Jersey Hsg. & Mtg. Fin. Agcy. Multi-family Rev.: | |||
| Series 2017 A, 1.5% 11/1/19 | 130,000 | 129,951 | |
| Series 2017 B, 1.75% 11/1/20 | 1,800,000 | 1,802,646 | |
| New Jersey Hsg. & Mtg. Fin. Agcy. Rev.: | |||
| Series 2018 B: | |||
| 2.25% 10/1/20 (c) | 4,650,000 | 4,668,554 | |
| 2.5% 4/1/21 (c) | 4,430,000 | 4,461,719 | |
| Series 2019 D: | |||
| 4% 4/1/20 (c) | 110,000 | 111,943 | |
| 4% 10/1/22 (c) | 1,340,000 | 1,417,037 | |
| 4% 4/1/23 (c) | 115,000 | 122,395 | |
| 4% 10/1/23 (c) | 125,000 | 133,898 | |
| 4% 4/1/25 (c) | 150,000 | 163,410 | |
| New Jersey Sports & Exposition Auth. Contract Rev. Series 2018 A: | |||
| 4% 9/1/19 | 1,000,000 | 1,004,980 | |
| 5% 9/1/20 | 1,000,000 | 1,035,950 | |
| New Jersey Tobacco Settlement Fing. Corp. Series 2018 A: | |||
| 5% 6/1/19 | 3,290,000 | 3,290,000 | |
| 5% 6/1/20 | 3,275,000 | 3,375,902 | |
| 5% 6/1/21 | 1,885,000 | 1,997,761 | |
| 5% 6/1/22 | 1,730,000 | 1,881,877 | |
| New Jersey Tpk. Auth. Tpk. Rev.: | |||
| Bonds Series 2017 C5, 1 month U.S. LIBOR + 0.460% 2.2%, tender 1/1/21 (a)(e) | 5,905,000 | 5,913,267 | |
| Series 2017 C1, 1 month U.S. LIBOR + 0.340% 2.08% 1/1/21 (a)(e) | 195,000 | 195,098 | |
| New Jersey Trans. Trust Fund Auth.: | |||
| Series 1999 A, 5.75% 6/15/20 | 70,000 | 71,475 | |
| Series 2006, 5.25% 12/15/21 (Nat'l. Pub. Fin. Guarantee Corp. Insured) | 165,000 | 178,784 | |
| Series 2010 A, 0% 12/15/27 | 1,000,000 | 780,610 | |
| Series 2013 A: | |||
| 5% 12/15/19 | 960,000 | 976,913 | |
| 5% 6/15/20 | 515,000 | 531,535 | |
| Series 2013 AA, 5% 6/15/19 | 120,000 | 120,125 | |
| Series 2016 A: | |||
| 5% 6/15/20 | 5,545,000 | 5,728,226 | |
| 5% 6/15/27 | 90,000 | 105,626 | |
| Series 2016 A-1 & A-2, 5% 6/15/19 | 1,180,000 | 1,181,289 | |
| Series 2018 A: | |||
| 4% 6/15/19 | 800,000 | 800,631 | |
| 4% 6/15/20 | 1,035,000 | 1,058,676 | |
| 5% 6/15/21 | 3,345,000 | 3,551,955 | |
| 5% 6/15/22 | 3,975,000 | 4,329,888 | |
| Series A, 5.25% 12/15/20 | 275,000 | 288,745 | |
| Series AA, 5% 6/15/20 | 375,000 | 387,040 | |
| New Jersey Transit Corp. Ctfs. of Prtn. Series 2014 A: | |||
| 5% 9/15/19 | 2,130,000 | 2,150,426 | |
| 5% 9/15/21 | 380,000 | 406,581 | |
| South Jersey Port Corp. Rev. Series 2012 R, 4% 1/1/20 (c) | 1,750,000 | 1,764,465 | |
| TOTAL NEW JERSEY | 115,220,355 | ||
| New Mexico - 0.4% | |||
| Farmington Poll. Cont. Rev. Bonds: | |||
| (Pub. Svc. Co. of New Mexico Proj.) Series 2010 A, 5.2%, tender 6/1/20 (a) | 220,000 | 227,054 | |
| (Southern California Edison Co. Four Corners Proj.): | |||
| Series 2005 A, 1.875%, tender 4/1/20 (a) | 1,010,000 | 1,005,917 | |
| Series 2005 B, 1.875%, tender 4/1/20 (a) | 690,000 | 687,210 | |
| Series 2011, 1.875%, tender 4/1/20 (a) | 135,000 | 134,454 | |
| New Mexico Mtg. Fin. Auth. Series 2019 C, 4% 7/1/50 | 540,000 | 582,979 | |
| New Mexico Muni. Energy Acquisition Auth. Gas Supply Rev. Bonds: | |||
| Series 2014 A, 5%, tender 8/1/19 (Liquidity Facility Royal Bank of Canada) (a) | 2,160,000 | 2,171,052 | |
| Series 2014 B, 1 month U.S. LIBOR + 0.750% 2.415%, tender 6/3/19 (Liquidity Facility Royal Bank of Canada) (a)(e) | 8,975,000 | 8,976,928 | |
| New Mexico Severance Tax Rev. Series 2015 B, 5% 7/1/21 | 1,495,000 | 1,602,132 | |
| TOTAL NEW MEXICO | 15,387,726 | ||
| New York - 3.4% | |||
| Dorm. Auth. New York Univ. Rev.: | |||
| Series 2016 A: | |||
| 5% 7/1/22 | 10,000 | 11,015 | |
| 5% 7/1/24 | 40,000 | 46,391 | |
| Series 2017 4% 12/1/20 (d) | 200,000 | 205,598 | |
| Series 2017, 4% 12/1/19 (d) | 300,000 | 302,832 | |
| Dutchess County Local Dev. Corp. Rev. (Health Quest Systems, Inc. Proj.) Series 2010 A, 5% 7/1/19 (Assured Guaranty Corp. Insured) (FSA Insured) | 15,000 | 15,038 | |
| Long Island Pwr. Auth. Elec. Sys. Rev.: | |||
| Series 2000 A, 0% 6/1/19 (FSA Insured) | 135,000 | 135,000 | |
| Series 2016 B: | |||
| 5% 9/1/25 | 60,000 | 72,347 | |
| 5% 9/1/26 | 25,000 | 30,826 | |
| New York City Gen. Oblig.: | |||
| Series 2006, 1.95%, tender 6/1/36 (FSA Insured) (a) | 5,425,000 | 5,425,000 | |
| Series 2007 A, 2%, tender 8/1/26 (FSA Insured) (a) | 1,100,000 | 1,100,000 | |
| Series 2007 C-4, 1.99%, tender 1/1/32 (FSA Insured) (a) | 225,000 | 225,000 | |
| Series 2007, 1%, tender 6/7/19 (FSA Insured) (a) | 6,200,000 | 6,200,000 | |
| Series 2008 A-3, 2.15%, tender 8/1/26 (FSA Insured) (a) | 3,775,000 | 3,775,000 | |
| Series 2008 C-4, 2.15%, tender 10/1/27 (a) | 13,375,000 | 13,375,000 | |
| Series 2014 J, 5% 8/1/19 | 4,250,000 | 4,274,766 | |
| Series 2015 A, 5% 8/1/19 | 1,000,000 | 1,005,827 | |
| Series 2015 C, 5% 8/1/25 | 35,000 | 41,670 | |
| New York City Hsg. Dev. Corp.: | |||
| Bonds: | |||
| Series 2016 1-2-B, 1.85%, tender 12/1/19 (a) | 3,500,000 | 3,500,313 | |
| Series 2016 C2, 1.45%, tender 4/29/20 (a) | 1,620,000 | 1,617,679 | |
| Series 2017 G-2, 2%, tender 12/31/21 (a) | 2,630,000 | 2,639,126 | |
| Series 2017 A2A, 1.9% 5/1/21 | 1,150,000 | 1,150,898 | |
| New York Metropolitan Trans. Auth. Dedicated Tax Fund Rev. Bonds Series 2008 A, SIFMA Municipal Swap Index + 0.450% 1.87%, tender 6/1/22 (a)(e) | 1,605,000 | 1,602,336 | |
| New York Metropolitan Trans. Auth. Rev.: | |||
| Bonds: | |||
| Series 2011 B, 1 month U.S. LIBOR + 0.550% 2.216%, tender 11/1/22 (a)(e) | 1,745,000 | 1,734,827 | |
| Series 2014 D-2, SIFMA Municipal Swap Index + 0.450% 1.87%, tender 11/15/22 (a)(e) | 6,540,000 | 6,515,933 | |
| Series 2018 A, 5%, tender 11/15/20(a) | 3,000,000 | 3,140,010 | |
| Series 2008 B2: | |||
| 5% 11/15/20 | 120,000 | 126,078 | |
| 5% 11/15/21 | 110,000 | 119,260 | |
| Series 2012 B, 5% 11/15/22 | 45,000 | 50,257 | |
| Series 2012 E: | |||
| 4% 11/15/19 (Escrowed to Maturity) | 50,000 | 50,606 | |
| 5% 11/15/21 | 55,000 | 59,630 | |
| Series 2014 C, 5% 11/15/21 | 60,000 | 65,051 | |
| Series 2016 B, 5% 11/15/21 | 50,000 | 54,209 | |
| Series 2018 A-2, 4% 8/15/19 | 1,760,000 | 1,768,782 | |
| Series 2018 A-4, 4% 8/15/19 | 1,000,000 | 1,004,990 | |
| Series 2018 A-5, 4% 8/15/19 | 1,000,000 | 1,005,010 | |
| Series 2018 B: | |||
| 5% 11/15/19 | 3,985,000 | 4,048,694 | |
| 5% 5/15/21 | 10,000,000 | 10,650,100 | |
| Series 2018 B1, 5% 5/15/20 | 5,000,000 | 5,160,564 | |
| New York St Mtg. Agcy. Homeowner: | |||
| Series 2012, 2.75% 10/1/19 (c) | 1,865,000 | 1,869,762 | |
| Series 2014 189, 2.5% 10/1/21 (c) | 1,640,000 | 1,656,548 | |
| New York State Energy Research & Dev. Auth. Poll. Cont. Rev. Series 1999, 2%, tender 6/7/19 (AMBAC Insured) (a) | 300,000 | 300,000 | |
| New York State Hsg. Fin. Agcy. Rev. Bonds Series 2019 F: | |||
| 1.7%, tender 11/1/19 (a) | 3,940,000 | 3,940,157 | |
| 1.8%, tender 5/1/20 (a) | 775,000 | 775,068 | |
| 1.875%, tender 11/1/21 (a) | 2,500,000 | 2,503,150 | |
| New York State Mtg. Agcy. Rev. Series 52, 1.8% 4/1/20 (c) | 1,885,000 | 1,882,832 | |
| New York Trans. Dev. Corp. (Delta Air Lines, Inc. Laguardia Arpt. Terminals C&D Redev. Proj.) Series 2018, 5% 1/1/22 (c) | 1,500,000 | 1,612,545 | |
| New York Transportation Development Corp. (Terminal One Group Association, LP Proj.) Series 2015, 5% 1/1/20 (c) | 7,755,000 | 7,898,013 | |
| Niagara Frontier Trans. Auth. Arpt. Rev. Series 2019 A: | |||
| 5% 4/1/20 (c) | 1,500,000 | 1,540,346 | |
| 5% 4/1/22 (c) | 400,000 | 434,068 | |
| 5% 4/1/23 (c) | 2,575,000 | 2,859,435 | |
| 5% 4/1/24 (c) | 1,720,000 | 1,952,957 | |
| Onondaga County Ind. Dev. Agcy. Swr. Facilities Rev. (Bristol-Meyers Squibb Co. Proj.) 5.75% 3/1/24 (c) | 570,000 | 658,755 | |
| Oyster Bay Gen. Oblig. Series 2018, 4% 2/15/20 | 2,000,000 | 2,028,629 | |
| Suffolk County Gen. Oblig. Series 2015 B, 2% 10/15/19 | 195,000 | 195,407 | |
| Triborough Bridge & Tunnel Auth. Revs. Bonds Series 2001 B, U.S. SOFR SEC OVRN FIN RATE INDX + 0.430% 2.038%, tender 6/1/19 (a)(e) | 1,890,000 | 1,890,813 | |
| Yonkers Gen. Oblig. Series 2017 C, 5% 10/1/22 (Build America Mutual Assurance Insured) | 55,000 | 61,302 | |
| TOTAL NEW YORK | 116,365,450 | ||
| New York And New Jersey - 0.2% | |||
| Port Auth. of New York & New Jersey: | |||
| Series 178-180, 5% 12/1/19 (c) | 1,335,000 | 1,357,933 | |
| Series 2011 167, 5% 9/15/19 (c) | 1,000,000 | 1,009,789 | |
| Series 2016, 5% 10/1/19 (c) | 1,125,000 | 1,137,761 | |
| Series 2018, 5% 9/15/22 (c) | 4,000,000 | 4,432,040 | |
| TOTAL NEW YORK AND NEW JERSEY | 7,937,523 | ||
| Non-State Specific - 0.1% | |||
| BB&T Muni. Trust Series 2018, SIFMA Municipal Swap Index + 0.550% 1.97% 11/30/19, LOC Rabobank Nederland (a)(d)(e) | 4,000,000 | 4,000,000 | |
| North Carolina - 0.8% | |||
| Durham Hsg. Auth. MultiFamily Hsg. Rev. Bonds Series 2017, 1.85%, tender 1/1/20 | 875,000 | 876,018 | |
| Gastonia Hsg. Auth. Multi-family Hsg. Rev. Bonds Series 2017: | |||
| 1.78%, tender 11/1/19 | 2,285,000 | 2,285,867 | |
| 1.78%, tender 11/1/19 | 1,090,000 | 1,090,414 | |
| 1.78%, tender 11/1/19 | 1,035,000 | 1,035,393 | |
| Montgomery County Pub. Facilities Corp. Ltd. Oblig. Series 2018, 3% 9/1/20 | 2,500,000 | 2,525,100 | |
| North Carolina Cap. Facilities Fin. Agcy. Rev. Bonds (Republic Svcs., Inc. Proj.) Series 2010 B, 2.1%, tender 6/3/19 (a)(c) | 4,000,000 | 4,000,000 | |
| North Carolina Eastern Muni. Pwr. Agcy. Pwr. Sys. Rev. Series 1993 B, 6% 1/1/22 (Escrowed to Maturity) | 1,750,000 | 1,948,170 | |
| North Carolina Grant Anticipation Rev.: | |||
| Series 2017: | |||
| 5% 3/1/22 | 80,000 | 87,655 | |
| 5% 3/1/23 | 80,000 | 90,198 | |
| Series 2019, 5% 3/1/20 (b) | 10,000,000 | 10,262,221 | |
| North Carolina Med. Care Commission Health Care Facilities Rev. Bonds Series 2019 B, 2.2%, tender 12/1/22 (a) | 1,420,000 | 1,430,650 | |
| North Carolina Muni. Pwr. Agcy. #1 Catawba Elec. Rev.: | |||
| Series 2010 A, 5% 1/1/20 | 115,000 | 117,301 | |
| Series 2010 B, 5% 1/1/21 | 310,000 | 316,185 | |
| Series 2015 E: | |||
| 5% 1/1/22 | 110,000 | 119,876 | |
| 5% 1/1/23 | 35,000 | 39,298 | |
| Series C, 5% 1/1/21 | 125,000 | 125,326 | |
| North Carolina Tpk. Auth. Triangle Expressway Sys.: | |||
| Series 2017, 5% 1/1/20 | 350,000 | 356,373 | |
| Series 2018, 4% 1/1/20 | 400,000 | 405,007 | |
| TOTAL NORTH CAROLINA | 27,111,052 | ||
| North Dakota - 0.1% | |||
| North Dakota Hsg. Fin. Agcy. Bonds (Home Mtg. Fin. Prog.) Series 2019 B, SIFMA Municipal Swap Index + 0.400% 1.82%, tender 2/1/22 (a)(e) | 4,000,000 | 3,998,920 | |
| Ohio - 2.0% | |||
| Akron Bath Copley Hosp. District Rev.: | |||
| Series 2012, 5% 11/15/20 | 325,000 | 341,270 | |
| Series 2016, 5% 11/15/24 | 45,000 | 51,747 | |
| Allen County Hosp. Facilities Rev.: | |||
| Bonds: | |||
| (Mercy Health Proj.) Series 2015 B, SIFMA Municipal Swap Index + 0.750% 2.17%, tender 6/6/19 (a)(e) | 4,430,000 | 4,433,131 | |
| (Mercy Health) Series 2017 B, 5%, tender 5/5/22 (a) | 120,000 | 131,375 | |
| Series 2010 B, 4.125% 9/1/20 | 500,000 | 515,515 | |
| Series 2017 A, 5% 8/1/21 | 780,000 | 833,087 | |
| American Muni. Pwr., Inc. Rev. Bonds: | |||
| (Combined Hydroelectric Proj.) Series 2018, 2.25%, tender 8/15/21 (a) | 3,000,000 | 3,024,120 | |
| Series 2019 A, 2.3%, tender 2/15/22 (a) | 1,800,000 | 1,823,292 | |
| Series B, 5%, tender 8/15/20 (a) | 1,065,000 | 1,090,645 | |
| Cleveland Arpt. Sys. Rev.: | |||
| Series 2016 A, 5% 1/1/26 (FSA Insured) | 10,000 | 11,712 | |
| Series 2018 A, 5% 1/1/20 (c) | 7,180,000 | 7,311,993 | |
| 5% 1/1/20 (FSA Insured) | 10,000 | 10,193 | |
| 5% 1/1/22 (FSA Insured) | 30,000 | 32,574 | |
| 5% 1/1/24 (FSA Insured) | 25,000 | 28,610 | |
| 5% 1/1/25 (FSA Insured) | 370,000 | 433,696 | |
| Cleveland Ctfs. of Prtn. Series 2010 A, 5% 11/15/19 | 875,000 | 887,562 | |
| Cleveland Pub. Pwr. Sys. Rev.: | |||
| Series 2016 A, 5% 11/15/19 | 485,000 | 492,532 | |
| Series 2016, 5% 11/15/21 (FSA Insured) | 1,400,000 | 1,513,988 | |
| Columbus Gen. Oblig. Series 2018 A, 5% 4/1/20 | 3,185,000 | 3,278,929 | |
| Cuyahoga Metropolitan Hsg. Auth. Bonds: | |||
| (Carver Park Phase II Proj.) Series 2018, 2.2%, tender 6/1/20 (a) | 3,675,000 | 3,688,298 | |
| (Riverside Park Phase II Proj.) Series 2019, 2%, tender 4/1/21 (a) | 3,000,000 | 3,008,700 | |
| Fairfield County Hosp. Facilities Rev. (Fairfield Med. Ctr. Proj.) Series 2013: | |||
| 5% 6/15/22 | 45,000 | 48,645 | |
| 5% 6/15/23 | 40,000 | 44,070 | |
| Franklin County Hosp. Facilities Rev.: | |||
| Bonds (Ohio Health Corp.) Series 2018 B, SIFMA Municipal Swap Index + 0.430% 1.85%, tender 11/15/21 (a)(e) | 3,800,000 | 3,800,798 | |
| Series 2016 C, 5% 11/1/23 | 60,000 | 68,777 | |
| Franklin County Multi-family Rev. Bonds Series 2017, 1.3%, tender 6/1/19 (a) | 1,000,000 | 999,986 | |
| Franklin County Rev. Bonds Series 2013 OH, 1.75%, tender 8/1/19 (a) | 1,950,000 | 1,950,577 | |
| Hamilton County Convention Facilities Auth. Rev. Series 2014: | |||
| 5% 12/1/19 | 40,000 | 40,681 | |
| 5% 12/1/20 | 50,000 | 52,534 | |
| 5% 12/1/21 | 45,000 | 48,477 | |
| Hamilton County HealthCare Facilities Rev.: | |||
| (Christ Hosp., OH. Proj.) Series 2012, 5% 6/1/20 | 220,000 | 227,131 | |
| Series 2012, 5% 6/1/21 | 400,000 | 425,740 | |
| Jobsohio Beverage Sys. Statewide Series 2013 A, 5% 1/1/20 | 4,310,000 | 4,396,997 | |
| Lucas County Hosp. Rev.: | |||
| Series 2011 D, 4% 11/15/20 | 2,200,000 | 2,261,160 | |
| Series 2018 A, 5% 11/15/19 | 1,160,000 | 1,175,607 | |
| Miami County Hosp. Facilities Rev. (Kettering Health Network Obligated Group Proj.) Series 2019: | |||
| 5% 8/1/24 | 620,000 | 721,909 | |
| 5% 8/1/25 | 310,000 | 369,433 | |
| 5% 8/1/26 | 535,000 | 647,992 | |
| Ohio Gen. Oblig. Series 2018, 5% 5/1/20 | 3,845,000 | 3,969,808 | |
| Ohio Higher Edl. Facility Commission Rev.: | |||
| (Case Western Reserve Univ. Proj.) Series 2016, 5% 12/1/22 | 585,000 | 653,556 | |
| (Kenyon College, Oh. Proj.) Series 2017, 4% 7/1/19 | 50,000 | 50,092 | |
| (Kenyon College, Oh. Proj.) Series 2017, 4% 7/1/20 | 50,000 | 51,306 | |
| Ohio Hosp. Facilities Rev. Series 2017 A: | |||
| 4% 1/1/20 | 55,000 | 55,793 | |
| 5% 1/1/21 | 60,000 | 63,275 | |
| 5% 1/1/22 | 35,000 | 38,096 | |
| 5% 1/1/23 | 45,000 | 50,426 | |
| 5% 1/1/24 | 40,000 | 46,100 | |
| 5% 1/1/25 | 45,000 | 53,219 | |
| Ohio Hsg. Fin. Agcy. Multi-family Hsg. Rev.: | |||
| Bonds (Brandt Meadows Apts. Proj.) Series 2019, 2%, tender 9/1/20 (a) | 3,700,000 | 3,708,917 | |
| Series 2018, 2.4% 4/1/21 (a) | 3,820,000 | 3,839,891 | |
| Ohio Solid Waste Rev. Bonds (Republic Svcs., Inc. Proj.) 1.95%, tender 6/3/19 (a) | 2,500,000 | 2,500,000 | |
| Ohio Wtr. Dev. Auth. Wtr. Poll. Cont. Rev. Series 2017 B, SIFMA Municipal Swap Index + 0.220% 1.64% 12/1/20 (a)(e) | 860,000 | 859,243 | |
| Scioto County Hosp. Facilities Rev. Series 2016: | |||
| 5% 2/15/20 | 700,000 | 715,531 | |
| 5% 2/15/21 | 15,000 | 15,796 | |
| 5% 2/15/22 | 25,000 | 27,098 | |
| 5% 2/15/23 | 45,000 | 50,053 | |
| 5% 2/15/24 | 35,000 | 39,808 | |
| 5% 2/15/25 | 35,000 | 40,735 | |
| 5% 2/15/26 | 385,000 | 456,572 | |
| TOTAL OHIO | 67,508,798 | ||
| Oklahoma - 0.2% | |||
| Canadian Cny Edl. Facilities Auth. (Yukon Pub. Schools Proj.) Series 2019, 5% 12/1/20 | 2,050,000 | 2,137,474 | |
| Midwest City- Del City School Dis Series 2018 A, 2.5% 1/1/20 | 660,000 | 663,799 | |
| Oklahoma County Fin. Auth. Edl. Facilities (Midwest City- Del City School Dis Proj.) Series 2018: | |||
| 5% 10/1/19 | 165,000 | 166,866 | |
| 5% 10/1/21 | 240,000 | 258,358 | |
| Oklahoma County Independent School District No. 53 Series 2017: | |||
| 1.75% 7/1/19 | 240,000 | 239,967 | |
| 1.75% 7/1/20 | 265,000 | 264,494 | |
| Oklahoma County Independent School District No. 9 Series 2018, 2.5% 6/1/21 | 1,535,000 | 1,553,220 | |
| Oklahoma Dev. Fin. Auth. Rev.: | |||
| (Saint John Health Sys. Proj.) Series 2012, 5% 2/15/23 (Pre-Refunded to 2/15/22 @ 100) | 55,000 | 60,069 | |
| Series 2004 A, 2.375% 12/1/21 (a) | 30,000 | 30,276 | |
| Tulsa County Indl. Auth. Edl. Facilities Lease Rev. Series 2018, 5% 9/1/20 | 1,500,000 | 1,563,930 | |
| TOTAL OKLAHOMA | 6,938,453 | ||
| Oregon - 0.0% | |||
| Oregon Bus. Dev. Commn Recovery Zone Facility Bonds (Intel Corp. Proj.) Series 232, 2.4%, tender 8/14/23 (a) | 770,000 | 788,226 | |
| Oregon Facilities Auth. Rev. Series 2011 C, 5% 10/1/20 | 110,000 | 115,001 | |
| Oregon Gen. Oblig. Series 2018 C, 3% 6/1/19 | 330,000 | 330,000 | |
| TOTAL OREGON | 1,233,227 | ||
| Pennsylvania - 3.1% | |||
| Adams County Indl. Dev. Auth. Rev. Series 2010, 5% 8/15/20 | 490,000 | 510,085 | |
| Allegheny County Arpt. Auth. Rev. Series 2006 B: | |||
| 5% 1/1/21 (Nat'l. Pub. Fin. Guarantee Corp. Insured) (c) | 290,000 | 304,111 | |
| 5% 1/1/22 (Nat'l. Pub. Fin. Guarantee Corp. Insured) (c) | 400,000 | 431,268 | |
| Beaver County Indl. Dev. Auth. Poll. Cont. Rev. Bonds Series 2008 B, 4.25%, tender 4/1/21 (a) | 1,090,000 | 1,090,000 | |
| Bethlehem Area School District Auth. Bonds (School District Rfdg. Proj.) Series 2018 A, 1 month U.S. LIBOR + 0.480% 2.181%, tender 11/1/21 (a)(e) | 3,995,000 | 3,980,778 | |
| Butler Area School District Series 2018, 5% 10/1/22 | 1,250,000 | 1,381,625 | |
| Centre County Pennsylvania Hosp. Auth. Rev. (Mount Nittany Med. Ctr. Proj.) Series 2018 A, 3% 11/15/19 | 1,000,000 | 1,006,116 | |
| Chester County Health & Ed. Auth. Rev. Series 2017: | |||
| 4% 11/1/19 | 145,000 | 145,649 | |
| 5% 11/1/20 | 155,000 | 159,239 | |
| 5% 11/1/21 | 160,000 | 167,112 | |
| Commonwealth Fing. Auth. Tobm Series 2018, 5% 6/1/21 | 1,000,000 | 1,065,800 | |
| Commonwealth Fing. Auth. Rev.: | |||
| Series 2019 B, 5% 6/1/24 | 265,000 | 307,238 | |
| Series 2020 A, 5% 6/1/23 (b) | 350,000 | 385,028 | |
| Cumberland County Muni. Auth. Rev. Bonds Series 2014 T1, 2%, tender 4/30/20 (a) | 325,000 | 323,666 | |
| Delaware Valley Reg'l. Fin. Auth. Local Govt. Rev. Bonds SIFMA Municipal Swap Index + 0.420% 1.84%, tender 9/1/22 (a)(e) | 5,000,000 | 4,998,500 | |
| Doylestown Hosp. Auth. Hosp. Rev. Series 2016 B, 5% 7/1/20 | 150,000 | 153,965 | |
| Easton Area School District Series 2013 A, 5% 4/1/23 | 705,000 | 761,280 | |
| Lehigh County Indl. Dev. Auth. Poll. Cont. Rev. Bonds: | |||
| (PPL Elec. Utils. Corp. Proj.) Series 2016 A, 1.8%, tender 9/1/22 (a) | 730,000 | 725,992 | |
| Series B, 1.8%, tender 8/15/22 (a) | 75,000 | 74,989 | |
| Lycoming County Auth. Rev. Bonds Series 2013 S2, 1.85%, tender 11/1/19 (a) | 435,000 | 435,000 | |
| Lycoming County Auth. College Rev. Series 2016, 4% 10/1/19 | 255,000 | 256,919 | |
| Montgomery County Higher Ed. & Health Auth. Rev.: | |||
| Bonds Series 2017, 3%, tender 5/1/21 (a) | 1,250,000 | 1,265,300 | |
| Series 2014 A: | |||
| 4% 10/1/19 | 15,000 | 15,080 | |
| 5% 10/1/20 | 30,000 | 30,965 | |
| 5% 10/1/23 | 5,000 | 5,498 | |
| Series 2017: | |||
| 2% 12/1/19 | 160,000 | 159,681 | |
| 2% 12/1/20 | 145,000 | 143,495 | |
| 3% 12/1/21 | 155,000 | 155,612 | |
| Series 2018 A, 5% 9/1/19 | 500,000 | 504,117 | |
| Montgomery County Indl. Dev. Auth. Poll. Cont. Rev. Bonds (Exelon Generation Co. LLC Proj.) Series 2015 A, 2.6%, tender 9/1/20 (a) | 1,090,000 | 1,096,224 | |
| Montgomery County Indl. Dev. Auth. Rev. (Meadowood Sr. Living Proj.) Series 2018 A: | |||
| 3% 12/1/19 | 140,000 | 140,572 | |
| 3% 12/1/20 | 250,000 | 252,133 | |
| New Kensington-Arnold School District Series 2019 A: | |||
| 4% 5/15/21 | 940,000 | 980,495 | |
| 4% 5/15/22 | 975,000 | 1,037,732 | |
| North Pennsylvania Wtr. Auth. Wtr. Rev.: | |||
| Bonds Series 2014, 1 month U.S. LIBOR + 0.500% 2.165%, tender 6/1/19 (a)(e) | 1,090,000 | 1,090,088 | |
| Series 2014, 1 month U.S. LIBOR + 0.410% 2.076% 11/1/19 (a)(e) | 220,000 | 220,008 | |
| Northeastern Hosp. & Ed. Auth. Series 2016 A: | |||
| 4% 3/1/20 | 160,000 | 161,819 | |
| 5% 3/1/21 | 110,000 | 114,527 | |
| Pennsylvania Ctfs. Prtn. Series 2018 A, 5% 7/1/20 | 300,000 | 310,203 | |
| Pennsylvania Econ. Dev. Auth. Governmental Lease (Forum Place Proj.) Series 2012, 5% 3/1/20 | 45,000 | 46,058 | |
| Pennsylvania Econ. Dev. Fing. Auth. Solid Waste Disp. Rev. Bonds: | |||
| (Republic Svcs., Inc. Proj.): | |||
| Series 2019 A, 1.95%, tender 7/15/19 (a)(c) | 1,350,000 | 1,350,346 | |
| Series 2019 B1, 1.95%, tender 7/15/19 (a)(c) | 900,000 | 900,231 | |
| (Waste Mgmt., Inc. Proj.) Series 2013, 1.95%, tender 8/1/19 (a)(c) | 4,940,000 | 4,941,457 | |
| (Waste Mgmt., Inc. Proj.): | |||
| Series 2009, 2.8%, tender 12/1/21 (a) | 600,000 | 613,500 | |
| Series 2017 A, 1.7%, tender 8/3/20 (a)(c) | 70,000 | 69,928 | |
| Series 2011, 2.25%, tender 7/1/19 (a)(c) | 1,000,000 | 1,000,385 | |
| 1.95%, tender 7/1/19 (a)(c) | 3,000,000 | 3,000,301 | |
| Pennsylvania Gen. Oblig.: | |||
| Series 2004, 5.375% 7/1/19 | 4,305,000 | 4,317,817 | |
| Series 2009, 5% 7/1/19 | 3,800,000 | 3,810,252 | |
| Series 2010 A, 5% 5/1/20 | 195,000 | 201,312 | |
| Series 2011, 5% 7/1/21 | 40,000 | 42,875 | |
| Series 2016: | |||
| 5% 1/15/20 | 3,585,000 | 3,663,560 | |
| 5% 1/15/22 | 1,215,000 | 1,322,734 | |
| Pennsylvania Higher Edl. Facilities Auth. Rev.: | |||
| Bonds: | |||
| Series 2014 T3 and T4, 2.05%, tender 5/1/20 (a) | 1,700,000 | 1,702,579 | |
| 2.25%, tender 4/30/20 (a) | 1,000,000 | 1,006,012 | |
| Series 2014: | |||
| 5% 12/1/21 | 5,000 | 5,435 | |
| 5% 12/1/22 | 20,000 | 22,373 | |
| Pennsylvania Hsg. Fin. Agcy.: | |||
| Bonds Series 2018 127C, 2.271%, tender 10/1/23 (a) | 4,000,000 | 4,002,800 | |
| Series 2018 127A: | |||
| 2.05% 4/1/20 (c) | 1,815,000 | 1,816,458 | |
| 2.15% 10/1/20 (c) | 1,710,000 | 1,713,471 | |
| 2.25% 4/1/21 (c) | 1,900,000 | 1,909,215 | |
| Pennsylvania Hsg. Fin. Agcy. Multifamily Hsg. Dev. Rev. Bonds Series 2017, 1.65%, tender 11/1/19 (a) | 3,885,000 | 3,882,695 | |
| Pennsylvania Hsg. Fin. Agcy. Single Family Mtg. Rev. Series 114A, 2.9% 10/1/21 (c) | 585,000 | 595,787 | |
| Pennsylvania Indl. Dev. Auth. Rev. Series 2012, 5% 7/1/21 | 335,000 | 358,437 | |
| Pennsylvania Pub. School Bldg. Auth. School Rev. (The School District of Harrisburg Proj.) Series 2016 A, 5% 12/1/21 (FSA Insured) | 110,000 | 118,470 | |
| Pennsylvania Tpk. Commission Tpk. Rev.: | |||
| Series 2013, SIFMA Municipal Swap Index + 1.150% 2.57% 12/1/19 (a)(e) | 605,000 | 605,291 | |
| Series 2018 A1: | |||
| SIFMA Municipal Swap Index + 0.350% 1.77% 12/1/20 (a)(e) | 2,800,000 | 2,800,252 | |
| SIFMA Municipal Swap Index + 0.430% 1.85% 12/1/21 (a)(e) | 3,500,000 | 3,506,510 | |
| Series 2018 B, SIFMA Municipal Swap Index + 0.500% 1.92% 12/1/21 (a)(e) | 3,460,000 | 3,468,408 | |
| Philadelphia Arpt. Rev.: | |||
| Series 2010 A, 5% 6/15/19 | 250,000 | 250,266 | |
| Series 2010 D, 5% 6/15/21 (c) | 490,000 | 506,959 | |
| Series 2011 A, 5% 6/15/21 (c) | 190,000 | 201,991 | |
| Series 2015 A, 5% 6/15/19 (c) | 1,305,000 | 1,306,279 | |
| Series 2017 A, 5% 7/1/24 | 10,000 | 11,629 | |
| Series 2017 B: | |||
| 5% 7/1/21 (c) | 800,000 | 852,240 | |
| 5% 7/1/24 (c) | 55,000 | 63,238 | |
| Philadelphia Auth. For Indl. Dev. (Rebuild Proj.) Series 2018, 5% 5/1/20 | 400,000 | 412,246 | |
| Philadelphia Gas Works Rev.: | |||
| Series 10, 5% 7/1/20 (FSA Insured) | 305,000 | 316,206 | |
| Series 15, 5% 8/1/21 | 25,000 | 26,790 | |
| Series 2015 13: | |||
| 5% 8/1/20 | 600,000 | 623,730 | |
| 5% 8/1/21 | 850,000 | 910,852 | |
| Series 2016 14, 5% 10/1/20 | 445,000 | 465,110 | |
| Series 2017 15: | |||
| 4% 8/1/20 | 130,000 | 133,656 | |
| 5% 8/1/22 | 480,000 | 529,685 | |
| Philadelphia Gen. Oblig. Series 2019 A, 5% 8/1/20 | 1,530,000 | 1,591,781 | |
| Philadelphia Hospitals & Higher Ed. Facilities Auth. Hosp. Rev. Series 2017: | |||
| 5% 7/1/19 | 220,000 | 220,425 | |
| 5% 7/1/20 | 220,000 | 226,028 | |
| Philadelphia School District: | |||
| Series 2016 D, 5% 9/1/19 | 270,000 | 272,104 | |
| Series 2016 F, 5% 9/1/19 | 220,000 | 221,714 | |
| Phoenixville Area School District Gen. Oblig. Series 2016 B, 4% 8/15/21 | 500,000 | 525,010 | |
| Pittsburgh & Alleg County Parkin Series 2017, 4% 12/15/19 | 85,000 | 86,127 | |
| Pittsburgh Hsg. Auth. Rev. Bonds Series 2017, 1.4%, tender 10/1/19 (a) | 1,045,000 | 1,043,499 | |
| Pittsburgh Urban Redev. Auth. Rev. Bonds (Crawford Square Apts. Proj.) Series 2018, 2.25%, tender 6/1/20 (a) | 1,500,000 | 1,503,475 | |
| Pittsburgh Wtr. & Swr. Auth. Wtr. & Swr. Sys. Rev. Bonds Series 2017 C, 1 month U.S. LIBOR + 0.640% 2.39%, tender 12/1/20 (FSA Insured) (a)(e) | 3,270,000 | 3,271,733 | |
| Quakertown Gen. Auth. Health Facilities Series 2017 A, 3.125% 7/1/21 | 705,000 | 701,412 | |
| Reading School District Series 2017: | |||
| 5% 3/1/21 (FSA Insured) | 50,000 | 52,686 | |
| 5% 3/1/25 (FSA Insured) | 5,000 | 5,816 | |
| 5% 3/1/26 (FSA Insured) | 5,000 | 5,942 | |
| 5% 3/1/27 (FSA Insured) | 5,000 | 6,052 | |
| 5% 3/1/28 (FSA Insured) | 5,000 | 6,025 | |
| Saint Mary Hosp. Auth. Health Sys. Rev.: | |||
| Series 2010 B: | |||
| 5% 11/15/19 | 260,000 | 264,073 | |
| 5% 11/15/19 (Escrowed to Maturity) | 55,000 | 55,839 | |
| Series 2012, 5% 11/15/27 (Pre-Refunded to 5/15/20 @ 100) | 1,495,000 | 1,543,438 | |
| Scranton School District: | |||
| Series 2017 A: | |||
| 5% 6/1/19 | 110,000 | 110,000 | |
| 5% 6/1/20 | 135,000 | 138,755 | |
| Series 2017 B, 5% 6/1/20 | 120,000 | 123,338 | |
| Scranton Tax & Rev. Series 2017, 5% 9/1/19 (d) | 460,000 | 462,817 | |
| Southeastern Pennsylvania Trans. Auth. Rev. Series 2011, 5% 6/1/19 | 5,000 | 5,000 | |
| State Pub. School Bldg. Auth. College Rev. (Cmnty. College of Philadelphia Proj.) Series 2018, 4% 6/15/19 | 1,835,000 | 1,836,340 | |
| Univ. of Pittsburgh Commonwealth Sys. of Higher Ed. Series 2018, SIFMA Municipal Swap Index + 0.240% 1.66% 9/15/21 (a)(e) | 4,500,000 | 4,491,855 | |
| TOTAL PENNSYLVANIA | 104,525,019 | ||
| Pennsylvania, New Jersey - 0.0% | |||
| Delaware River Port Auth. Pennsylvania & New Jersey Rev. Series 2018 B, 5% 1/1/21 | 1,000,000 | 1,054,430 | |
| Rhode Island - 0.1% | |||
| Rhode Is Comm Corp. Spl. Facilities Rev. Series 2018, 5% 7/1/21 | 685,000 | 728,867 | |
| Rhode Island Health & Edl. Bldg. Corp. Higher Ed. Facilities Rev. Series 2016: | |||
| 5% 5/15/20 | 15,000 | 15,433 | |
| 5% 5/15/22 | 45,000 | 48,831 | |
| 5% 5/15/23 | 25,000 | 27,754 | |
| 5% 5/15/24 | 50,000 | 56,706 | |
| 5% 5/15/25 | 120,000 | 138,997 | |
| Rhode Island Health & Edl. Bldg. Corp. Pub. Schools Rev. Series 2015, 5% 5/15/25 (FSA Insured) | 130,000 | 153,283 | |
| Rhode Island Student Ln. Auth. Student Ln. Rev.: | |||
| Series 2015 A, 5% 12/1/19 (c) | 1,160,000 | 1,178,029 | |
| Series 2019 A, 5% 12/1/28 (c) | 490,000 | 595,389 | |
| Series A, 5% 12/1/20 (c) | 250,000 | 261,480 | |
| Tobacco Setlement Fing. Corp. Series 2015 A: | |||
| 5% 6/1/21 | 555,000 | 588,805 | |
| 5% 6/1/26 | 75,000 | 85,508 | |
| 5% 6/1/27 | 20,000 | 22,659 | |
| TOTAL RHODE ISLAND | 3,901,741 | ||
| South Carolina - 0.7% | |||
| Greenville County School District Series 2018 C, 5% 6/1/19 | 10,000,000 | 10,000,000 | |
| Lancaster County School District ( South Carolina Gen. Oblig. Proj.) Series 2017, 5% 3/1/22 | 45,000 | 49,344 | |
| Lexington County Health Svcs. District, Inc. Hosp. Rev. Series 2011, 5% 11/1/19 | 725,000 | 734,500 | |
| Piedmont Muni. Pwr. Agcy. Elec. Rev. Series A4: | |||
| 5% 1/1/20 (Escrowed to Maturity) | 785,000 | 801,028 | |
| 5% 1/1/20 (Escrowed to Maturity) | 810,000 | 826,538 | |
| Richland County Gen. Oblig. Series 2019, 3% 2/27/20 | 9,000,000 | 9,093,344 | |
| Richland County School District #2 Gen. Oblig. (South Carolina Gen. Oblig. Proj.) Series 2015 A, 5% 2/1/23 | 55,000 | 61,946 | |
| Scago Edl. Facilities Corp. for Colleton School District (School District of Colleton County Proj.) Series 2015: | |||
| 5% 12/1/23 | 95,000 | 107,998 | |
| 5% 12/1/26 | 25,000 | 29,271 | |
| South Carolina Jobs-Econ. Dev. Auth. (Anmed Health Proj.) Series 2016, 5% 2/1/20 | 190,000 | 194,172 | |
| South Carolina Jobs-Econ. Dev. Auth. Econ. Dev. Rev. (Bon Secours Health Sys. Proj.) Series 2013, 5% 11/1/28 (Pre-Refunded to 11/1/22 @ 100) | 150,000 | 167,325 | |
| South Carolina Ports Auth. Ports Rev. Series 2018, 5% 7/1/19 (c) | 2,000,000 | 2,005,058 | |
| South Carolina Pub. Svc. Auth. Rev.: | |||
| Series 2010 B, 4% 1/1/20 (Escrowed to Maturity) | 175,000 | 177,575 | |
| Series 2012 B, 5% 12/1/20 | 20,000 | 20,938 | |
| Series 2012 D, 4% 12/1/19 (Escrowed to Maturity) | 65,000 | 65,822 | |
| Series 2014 C: | |||
| 5% 12/1/22 | 25,000 | 27,768 | |
| 5% 12/1/23 | 110,000 | 125,203 | |
| Series A, 5% 12/1/23 | 1,015,000 | 1,155,283 | |
| TOTAL SOUTH CAROLINA | 25,643,113 | ||
| South Dakota - 0.0% | |||
| South Dakota Health & Edl. Facilities Auth. Rev. Series 2014 B: | |||
| 4% 11/1/19 | 10,000 | 10,100 | |
| 4% 11/1/20 | 15,000 | 15,506 | |
| 4% 11/1/21 | 10,000 | 10,574 | |
| 5% 11/1/22 | 10,000 | 11,124 | |
| TOTAL SOUTH DAKOTA | 47,304 | ||
| Tennessee - 0.7% | |||
| Greeneville Health & Edl. Facilities Board Series 2018 A: | |||
| 5% 7/1/19 | 2,000,000 | 2,004,966 | |
| 5% 7/1/22 | 1,000,000 | 1,097,430 | |
| Jackson Hosp. Rev. Series 2018 A, 5% 4/1/20 | 835,000 | 857,111 | |
| Knox County Health Edl. & Hsg. Facilities Board Rev. Series 2016: | |||
| 5% 9/1/25 | 35,000 | 40,223 | |
| 5% 9/1/26 | 40,000 | 46,523 | |
| Lewisburg Indl. Dev. Board Bonds (Waste Mgmt. Tennessee Proj.) Series 2012, 1.95%, tender 8/1/19 (a)(c) | 3,000,000 | 3,000,845 | |
| Memphis Health, Edl. & Hsg. Facilities Board Bonds Series 2018, 2.03%, tender 8/1/20 (a) | 7,400,000 | 7,426,048 | |
| Memphis-Shelby County Arpt. Auth. Arpt. Rev.: | |||
| Series 2010 B, 5.5% 7/1/19 (c) | 670,000 | 671,892 | |
| Series 2011 C, 5% 7/1/19 (c) | 570,000 | 571,398 | |
| Metropolitan Govt. Nashville & Davidson County Health & Edl. Facilities Board Bonds (Twelfth and Wedgewood Apts. Proj.) Series 2017, 1.8%, tender 12/1/19 | 325,000 | 325,269 | |
| Nashville and Davidson County Metropolitan Govt. Health & Edl. Facilities Board Rev. Bonds Series 2001 B, 1.55%, tender 11/3/20 (a) | 3,410,000 | 3,410,477 | |
| Tennergy Corp. Gas Rev. Bonds Series 2019 A, 5%, tender 10/1/24 (a) | 2,050,000 | 2,365,065 | |
| Tennessee Energy Acquisition Corp. Series 2018, 5% 11/1/22 | 1,500,000 | 1,636,215 | |
| TOTAL TENNESSEE | 23,453,462 | ||
| Texas - 9.8% | |||
| Alamito Pub. Facilities Corp. Bonds: | |||
| (Cramer Three Apts. Proj.) Series 2018, 2.5%, tender 5/1/21 (a) | 5,000,000 | 5,069,700 | |
| (Sandoval Apts. and Valle Verde Apts. Proj.) Series 2018, 2.25%, tender 6/1/20 (a) | 3,000,000 | 3,014,718 | |
| Alamo Cmnty. Coll District Rev. Bonds Series 2017, 3%, tender 11/1/19 (a) | 890,000 | 894,311 | |
| Alamo Cmnty. College District Series 2017, 3% 8/15/21 | 3,000,000 | 3,100,080 | |
| Aledo Independent School District Series 2015, 0% 2/15/24 | 25,000 | 22,975 | |
| Allen Independent School District Series 2011, 5% 2/15/41 (Pre-Refunded to 2/15/21 @ 100) | 860,000 | 910,387 | |
| Anahuac Independent School District Series 2010, 4.5% 2/15/20 | 405,000 | 413,702 | |
| Austin Arpt. Sys. Rev. Series 2019: | |||
| 5% 11/15/19 (c) | 1,000,000 | 1,015,440 | |
| 5% 11/15/20 (c) | 1,250,000 | 1,311,100 | |
| Austin Independent School District Series 2017, 5% 8/1/19 | 3,000,000 | 3,017,143 | |
| Austin-Bergstrom Landhost Ente Series 2017: | |||
| 5% 10/1/19 | 135,000 | 136,411 | |
| 5% 10/1/20 | 235,000 | 244,861 | |
| 5% 10/1/21 | 280,000 | 300,222 | |
| Brownsville Independent School District Series 2017, 4% 8/15/22 | 1,910,000 | 2,055,103 | |
| Burleson Independent School District Bonds Series 2018, 2.5%, tender 8/1/22 (a) | 5,000,000 | 5,104,800 | |
| Cap. Area Hsg. Fin. Corp. Multi-family Hsg. Rev. Bonds: | |||
| Series 2018, 2.05%, tender 8/1/20 (a) | 10,000,000 | 10,038,600 | |
| Series 2019, 2.1%, tender 9/1/22 (a) | 2,000,000 | 2,014,100 | |
| Central Reg'l. Mobility Auth.: | |||
| Bonds Series 2015 B, 5%, tender 1/7/21 (a) | 1,000,000 | 1,033,960 | |
| Series 2011, 6% 1/1/41 (Pre-Refunded to 1/1/21 @ 100) | 5,720,000 | 6,115,366 | |
| Series 2016: | |||
| 5% 1/1/21 | 10,000 | 10,486 | |
| 5% 1/1/22 | 35,000 | 37,717 | |
| 5% 1/1/23 | 55,000 | 60,822 | |
| 5% 1/1/24 | 75,000 | 84,841 | |
| 5% 1/1/26 | 65,000 | 76,856 | |
| Corpus Christi Util. Sys. Rev. Series 2015, 4% 7/15/19 | 175,000 | 175,501 | |
| Cypress-Fairbanks Independent School District Bonds: | |||
| Series 2014 B1, 3%, tender 8/15/19 (a) | 475,000 | 476,351 | |
| Series 2014 B2, 1.4%, tender 8/17/20 (a) | 1,700,000 | 1,697,161 | |
| Series 2014 B3, 1.4%, tender 8/17/20 (a) | 2,425,000 | 2,420,950 | |
| Series 2015 B2, 2.125%, tender 8/16/21 (a) | 8,000,000 | 8,065,920 | |
| Series 2017 A-2, 2.5%, tender 8/15/19 (a) | 3,705,000 | 3,711,909 | |
| Series 2017 A-3, 3%, tender 8/17/20 (a) | 630,000 | 640,912 | |
| Series 2017 A1, 2.125%, tender 8/16/21 (a) | 9,015,000 | 9,077,564 | |
| Dallas County Gen. Oblig. Series 2016 5% 8/15/22 | 75,000 | 83,227 | |
| Dallas County Util. and Reclamation District Series 2016, 5% 2/15/20 | 340,000 | 348,119 | |
| Dallas Fort Worth Int'l. Arpt. Rev.: | |||
| Series 2013 E, 5% 11/1/19 (c) | 3,500,000 | 3,549,329 | |
| Series 2013 F: | |||
| 5% 11/1/20 | 35,000 | 36,741 | |
| 5% 11/1/21 | 65,000 | 70,387 | |
| 5% 11/1/22 | 110,000 | 122,712 | |
| Dallas Gen. Oblig. Series 2010, 5% 2/15/21 | 3,390,000 | 3,472,377 | |
| Dallas Independent School District Bonds: | |||
| Series 2016 B4, 5%, tender 2/15/20 (a) | 155,000 | 158,701 | |
| Series 2016 B5, 5%, tender 2/15/21 (a) | 175,000 | 185,101 | |
| Series 2016, 5%, tender 2/15/22 (a) | 5,000 | 5,468 | |
| Series 2019, 5%, tender 2/15/22 (a) | 200,000 | 217,560 | |
| Del Rio Hsg. Facilities Corp. Multifamily Hsg. Rev. Bonds Series 2017, 1.35%, tender 6/1/19 (a) | 545,000 | 545,000 | |
| Denton Independent School District: | |||
| Bonds Series 2013, 2%, tender 8/1/20 (a) | 1,130,000 | 1,135,933 | |
| Series 2016, 0% 8/15/25 | 35,000 | 31,286 | |
| Dickinson Independent School District Bonds Series 2013, 1.35%, tender 8/1/19 (a) | 1,420,000 | 1,419,558 | |
| El Paso County Hosp. District Series 2013, 5% 8/15/20 | 1,160,000 | 1,199,811 | |
| Fort Bend Independent School District Bonds: | |||
| Series 2015 A, 1.75%, tender 8/1/19 (a) | 7,000,000 | 7,002,220 | |
| Series 2015 B, 1.35%, tender 8/1/19 (a) | 425,000 | 424,868 | |
| Series 2019 A, 1.95%, tender 8/1/22 (a) | 5,920,000 | 5,970,083 | |
| Series C, 1.35%, tender 8/1/20 (a) | 40,000 | 39,913 | |
| Series D, 1.5%, tender 8/1/21 (a) | 70,000 | 69,600 | |
| Fort Worth Gen. Oblig. Series 2015 A, 5% 3/1/23 | 35,000 | 39,448 | |
| Fort Worth Independent School District Series 2015, 5% 2/15/22 | 35,000 | 38,257 | |
| Georgetown Independent School District Bonds Series 2012, 2.5%, tender 8/1/19 (a) | 2,785,000 | 2,789,165 | |
| Goose Creek Consolidated Independent School District Bonds Series 2014 B, 1.18%, tender 8/15/19 (a) | 2,180,000 | 2,178,433 | |
| Grapevine-Colleyville Independent School District Bonds: | |||
| Series 2012, 2%, tender 8/1/20 (a) | 975,000 | 980,119 | |
| Series B, 2%, tender 8/1/20 (a) | 880,000 | 883,511 | |
| Gregg County Health Facilities Dev. Series 2012 C, 5% 7/1/42 (Pre-Refunded to 7/1/22 @ 100) | 2,070,000 | 2,282,962 | |
| Harlandale Independent School District Bonds Series 2015, 3%, tender 8/15/21 (a) | 6,000,000 | 6,085,380 | |
| Harris County Cultural Ed. Facilities Fin. Corp. Med. Facilities Rev. (Baylor College of Medicine Proj.) Series 2016, 5% 11/15/19 | 790,000 | 802,019 | |
| Harris County Cultural Ed. Facilities Fin. Corp. Rev.: | |||
| Bonds: | |||
| Series 2014 B, 2%, tender 6/6/19 (a) | 1,680,000 | 1,680,018 | |
| Series 2015 3, 1 month U.S. LIBOR + 0.850% 2.508%, tender 6/6/19 (a)(e) | 665,000 | 667,068 | |
| Series 2013 B, SIFMA Municipal Swap Index + 0.900% 2.32% 6/1/22 (a)(e) | 600,000 | 604,008 | |
| Series 2015, 5% 10/1/20 | 570,000 | 595,912 | |
| Harris County Health Facilities Dev. Corp. Rev.: | |||
| Series 2005 A4, 2%, tender 7/1/31 (FSA Insured) (a) | 10,200,000 | 10,200,000 | |
| Series A3, 2%, tender 7/1/31 (FSA Insured) (a) | 725,000 | 725,000 | |
| Harris County Indl. Dev. Corp. Solid Waste Disp. Rev. Series 2006, 5% 2/1/23 (Pre-Refunded to 12/1/19 @ 100) | 5,000,000 | 5,086,400 | |
| Houston Arpt. Sys. Rev.: | |||
| (Houston TX Arpt. Sys. Rev. Subord Proj.) Series 2011 A, 5% 7/1/21 (c) | 675,000 | 720,218 | |
| Series 2011 A, 5% 7/1/19 (c) | 405,000 | 406,121 | |
| Series 2012 A: | |||
| 5% 7/1/19 (c) | 4,000,000 | 4,011,068 | |
| 5% 7/1/23 (c) | 45,000 | 49,512 | |
| Series 2018 A, 5% 7/1/21 (c) | 275,000 | 293,422 | |
| Series 2018 C: | |||
| 5% 7/1/19 (c) | 1,900,000 | 1,905,257 | |
| 5% 7/1/20 (c) | 3,000,000 | 3,109,230 | |
| 5% 7/1/21 (c) | 335,000 | 357,442 | |
| Houston Convention and Entertainment Facilities Dept. Hotel Occupancy Tax and Spl. Rev. Series 2019: | |||
| 4% 9/1/19 | 2,730,000 | 2,746,266 | |
| 5% 9/1/20 | 2,485,000 | 2,589,022 | |
| Houston Gen. Oblig. Series 2013 A, 5% 3/1/22 | 1,600,000 | 1,749,936 | |
| Houston Independent School District Bonds: | |||
| Series 2012: | |||
| 1.45%, tender 6/1/20 (a) | 4,360,000 | 4,352,735 | |
| 2.4%, tender 6/1/21 (a) | 2,985,000 | 3,029,865 | |
| Series 2013 B: | |||
| 1.45%, tender 6/1/20 (a) | 2,385,000 | 2,381,026 | |
| 2.4%, tender 6/1/21 (a) | 3,100,000 | 3,146,593 | |
| Series 2014 A, 2.2%, tender 6/1/20 (a) | 3,000,000 | 3,017,047 | |
| Series 2014 A2: | |||
| 2.25%, tender 6/1/22 (a)(b) | 10,000,000 | 10,186,000 | |
| 3%, tender 6/1/19 (a) | 3,000,000 | 3,000,000 | |
| Houston Util. Sys. Rev.: | |||
| Bonds: | |||
| Series 2012 A, SIFMA Municipal Swap Index + 0.900% 2.32%, tender 6/6/19 (a)(e) | 500,000 | 500,993 | |
| Series 2018 C, 3 month U.S. LIBOR + 0.360% 2.061%, tender 8/1/21 (a)(e) | 8,000,000 | 7,983,680 | |
| Series 2010 C, 4% 11/15/19 | 425,000 | 429,982 | |
| Irving Hosp. Auth. Hosp. Rev. Series 2017 A: | |||
| 5% 10/15/20 | 130,000 | 135,416 | |
| 5% 10/15/21 | 65,000 | 69,614 | |
| Leander Independent School District Series 2013 A: | |||
| 0% 8/15/21 | 550,000 | 531,058 | |
| 0% 8/15/23 | 1,000,000 | 930,590 | |
| Love Field Arpt. Modernization Rev.: | |||
| Series 2015, 5% 11/1/19 (c) | 255,000 | 258,594 | |
| Series 2017, 5% 11/1/19 (c) | 975,000 | 988,742 | |
| Lower Colorado River Auth. Rev.: | |||
| Series 2010 B, 5% 5/15/21 | 915,000 | 945,524 | |
| Series 2010: | |||
| 5% 5/15/20 | 80,000 | 82,677 | |
| 5% 5/15/21 | 430,000 | 444,345 | |
| Mansfield Independent School District Series 2016, 5% 2/15/24 | 95,000 | 109,901 | |
| Matagorda County Navigation District No. 1 Poll. Cont. Rev. Bonds Series 1996, 1.75%, tender 9/1/20 (a)(c) | 1,850,000 | 1,838,493 | |
| Mission Econ. Dev. Corp. Solid Waste Disp. Rev. Bonds (Republic Svcs., Inc. Proj.) Series 2008 A: | |||
| 1.75%, tender 7/2/19 (a) | 3,750,000 | 3,750,332 | |
| 1.9%, tender 8/1/19 (a)(c) | 9,420,000 | 9,422,661 | |
| New Hope Cultural Ed. Fa Series 2017 A, 3.25% 8/1/19 | 3,425,000 | 3,425,033 | |
| Newark Higher Ed. Fin. Corp. (Abilene Christian Univ. Proj.) Series 2016 A, 5% 4/1/26 | 55,000 | 64,774 | |
| North East Texas Independent School District: | |||
| Bonds Series 2013 B, 1.42%, tender 8/1/21 (a) | 365,000 | 361,303 | |
| Series 2018, 5% 8/1/20 | 1,080,000 | 1,124,626 | |
| North Harris County Reg'l. Wtr. Auth. Series 2013, 4% 12/15/22 | 35,000 | 37,897 | |
| North Texas Tollway Auth. Rev.: | |||
| Series 2011 A, 5.5% 9/1/41 (Pre-Refunded to 9/1/21 @ 100) | 1,715,000 | 1,865,628 | |
| Series 2011 B, 5% 1/1/20 | 500,000 | 510,063 | |
| Series 2011 D, 5% 9/1/28 (Pre-Refunded to 9/1/21 @ 100) | 2,150,000 | 2,315,228 | |
| Series 2015 A, 5% 1/1/20 | 1,105,000 | 1,127,240 | |
| Northside Independent School District: | |||
| (Permanent School Fund of Texas Proj.) Bonds Series 2014, 2%, tender 8/1/19 (a) | 790,000 | 790,561 | |
| Bonds: | |||
| Series 2011 A, 2%, tender 6/1/19 (a) | 6,100,000 | 6,100,000 | |
| Series 2017, 1.45%, tender 6/1/20 (a) | 975,000 | 974,139 | |
| 2%, tender 6/1/21 (a) | 2,705,000 | 2,720,446 | |
| Series 2011, 2.125%, tender 8/1/20 (a) | 3,810,000 | 3,813,467 | |
| Plano Independent School District Series 2016 A, 5% 2/15/22 | 160,000 | 174,891 | |
| Port Arthur Navigation District Exempt Facilities Bonds (Emerald Renewable Diesel LLC Proj.) Series 2018, 1.9%, tender 10/3/19 (c)(d) | 21,000,000 | 21,002,071 | |
| Port Houston Auth. Harris County Series 2015 B, 5% 10/1/19 (c) | 2,355,000 | 2,381,247 | |
| Royse City Independent School District Series 2014, 0% 2/15/20 | 140,000 | 138,549 | |
| Sam Rayburn Muni. Pwr. Agcy. Series 2012, 5% 10/1/20 | 20,000 | 20,804 | |
| San Antonio Arpt. Sys. Rev. Series 2012, 4% 7/1/20 (c) | 1,385,000 | 1,420,719 | |
| San Antonio Elec. & Gas Sys. Rev.: | |||
| Bonds: | |||
| Series 2015 A, 2.25%, tender 12/1/19 (a) | 4,360,000 | 4,372,112 | |
| Series 2015 B, 2%, tender 12/1/21 (a) | 3,550,000 | 3,566,011 | |
| Series 2018, 5% 2/1/20 | 1,500,000 | 1,534,935 | |
| San Antonio Gen. Oblig. Series 2018, 4% 8/1/19 | 5,000,000 | 5,020,548 | |
| San Antonio Pub. Facilities Corp. and Rfdg. Lease (Convention Ctr. Proj.) Series 2012: | |||
| 5% 9/15/21 | 20,000 | 21,515 | |
| 5% 9/15/22 | 75,000 | 83,075 | |
| San Antonio Wtr. Sys. Rev. Bonds Series 2013 F, 2%, tender 11/1/21 (a) | 1,000,000 | 1,005,070 | |
| Sherman Independent School District Bonds Series 2018 B: | |||
| 3%, tender 8/1/20 (a) | 75,000 | 76,252 | |
| 3%, tender 8/1/20 (a) | 3,925,000 | 3,990,508 | |
| Southwest Higher Ed. Auth. Rev. (Southern Methodist Univ. Proj.) Series 2016 A: | |||
| 5% 10/1/20 | 150,000 | 156,900 | |
| 5% 10/1/21 | 65,000 | 70,189 | |
| Spring Branch Independent School District Bonds Series 2013, 3%, tender 6/18/19 (a) | 6,000,000 | 6,003,355 | |
| Tarrant County Cultural Ed. Facilities Fin. Corp. Hosp. Rev.: | |||
| (Scott & White Healthcare Proj.) Series 2013 A: | |||
| 5% 8/15/21 | 15,000 | 16,103 | |
| 5% 8/15/23 | 20,000 | 22,661 | |
| Series 2013: | |||
| 5% 9/1/19 | 15,000 | 15,125 | |
| 5% 9/1/20 | 20,000 | 20,847 | |
| Tarrant County Cultural Ed. Facilities Fin. Corp. Retirement Facility Rev.: | |||
| (Mrc Crestview Proj.) Series 2010, 8.125% 11/15/44 (Pre-Refunded to 11/15/20 @ 100) | 250,000 | 273,355 | |
| Series 2015 A, 4% 11/15/19 | 110,000 | 110,287 | |
| Series 2015 B, 4% 11/15/19 | 155,000 | 155,405 | |
| Tarrant County Cultural Ed. Facilities Fin. Corp. Rev.: | |||
| Series 2016 A, 5% 2/15/26 | 35,000 | 42,311 | |
| Series 2017 A, 5% 2/15/24 | 45,000 | 51,881 | |
| Texas A&M Univ. Rev. Series B, 5% 5/15/20 | 4,030,000 | 4,166,786 | |
| Texas Dept. of Hsg. & Cmnty. Affairs Multi-family Hsg. Rev. Bonds: | |||
| Series 2017, 1.8%, tender 12/1/19 (a) | 545,000 | 545,079 | |
| Series 2018: | |||
| 2%, tender 2/1/20 (a) | 3,400,000 | 3,408,825 | |
| 2.2%, tender 5/1/20 (a) | 4,000,000 | 4,014,322 | |
| 2.23%, tender 5/1/20 (a) | 3,300,000 | 3,311,812 | |
| Series 2019, 2.11%, tender 2/1/22 | 2,880,000 | 2,893,738 | |
| Texas Gen. Oblig.: | |||
| Bonds: | |||
| Series 2019 C2, 1.85%, tender 8/1/22 (a)(b) | 165,000 | 165,196 | |
| Series 2019 E2, 2.25%, tender 8/1/22 (a)(b) | 740,000 | 745,269 | |
| Series 2013 B, 5.25% 8/1/21 (c) | 940,000 | 1,012,258 | |
| Series 2018: | |||
| 3% 8/1/19 (c) | 4,025,000 | 4,034,439 | |
| 4% 8/1/21 (c) | 790,000 | 829,871 | |
| Texas Trans. Commission Central Texas Tpk. Sys. Rev. Bonds Series 2015 A, 5%, tender 4/1/20 (a) | 725,000 | 744,017 | |
| Tomball Independent School District Bonds Series 2014 B2, 2.125%, tender 8/15/21 (a) | 1,000,000 | 1,008,890 | |
| Travis County Health Facilities Dev. Corp. Rev. (Longhorn Village Proj.) Series 2012 A, 7% 1/1/32 (Pre-Refunded to 1/1/21 @ 100) | 1,740,000 | 1,885,812 | |
| Trinity River Auth. Reg'l. Wastewtr. Sys. Rev. Series 2016, 5% 8/1/23 | 35,000 | 39,919 | |
| Univ. of Texas Board of Regents Sys. Rev.: | |||
| Series 2016 C, 5% 8/15/19 | 13,705,000 | 13,803,120 | |
| Series 2017 C: | |||
| 5% 8/15/20 | 1,090,000 | 1,136,805 | |
| 5% 8/15/21 | 1,945,000 | 2,096,768 | |
| Williamson County Gen. Oblig. Bonds Series 2014, 1.85%, tender 8/15/19 (a) | 4,000,000 | 4,000,472 | |
| TOTAL TEXAS | 336,369,554 | ||
| Virginia - 1.6% | |||
| Alexandria Gen. Oblig. Series 2012 A, 4.5% 6/15/19 | 2,250,000 | 2,252,201 | |
| Charles City County Econ. Dev. Auth. Solid Waste Disp. Rev. Bonds (Waste Mgmt., Inc. Proj.) Series 2003 A, 2.4%, tender 5/2/22 (a)(c) | 1,750,000 | 1,755,548 | |
| Chesapeake Trans. Sys. Toll Road Rev. Series 2012 A: | |||
| 4% 7/15/20 | 15,000 | 15,340 | |
| 5% 7/15/21 | 10,000 | 10,628 | |
| Colonial Heights Econ. Dev. Auth. MultiFamily Hsg. Rev. Bonds Series 2017 A, 1.8%, tender 7/1/19 | 2,180,000 | 2,180,158 | |
| Fairfax County Redev. & Hsg. Auth. Rev. Bonds Series 2018: | |||
| 2.21%, tender 8/1/20 (a)(c) | 2,000,000 | 2,009,760 | |
| 2.26%, tender 8/1/20 (a) | 2,000,000 | 2,009,760 | |
| Fredericksburg Econ. Dev. Auth. Rev. Series 2014, 5% 6/15/24 | 50,000 | 57,871 | |
| Halifax County Indl. Dev. Auth. Bonds 2.15%, tender 9/1/20 (a) | 2,870,000 | 2,887,191 | |
| King George County Indl. Dev. Auth. Solid Waste Disp. Fac. Rev. (King George Landfill, Inc. Proj.) Series 2003 A, 2.5% 6/1/23 (a)(c) | 735,000 | 740,042 | |
| Louisa Indl. Dev. Auth. Poll. Cont. Rev. Bonds: | |||
| (Virginia Elec. and Pwr. Co. Proj.) Series 2008 A, 1.9%, tender 6/1/23 (a) | 2,500,000 | 2,512,325 | |
| Series 2008 B, 2.15%, tender 9/1/20 (a) | 2,010,000 | 2,022,040 | |
| Lynchburg Econ. Dev. (Centra Health Proj.) Series A, 5% 1/1/20 | 130,000 | 132,511 | |
| Newport New Redev. & Hsg. Multi-family Hsg. Bonds Series 2018, 2.05%, tender 8/1/20 (a) | 7,000,000 | 7,030,240 | |
| Russell County Poll. Cont. (Appalachian Pwr. Co. Proj.) Series K 4.625% 11/1/21 | 250,000 | 255,025 | |
| Stafford County Econ. Dev. Auth. Hosp. Facilities Rev. Series 2016: | |||
| 5% 6/15/24 | 25,000 | 28,935 | |
| 5% 6/15/25 | 20,000 | 23,665 | |
| 5% 6/15/26 | 35,000 | 42,259 | |
| Staunton Redev. & Hsg. Auth. M Bonds Series 2019, 1.95%, tender 11/1/20 (a) | 5,500,000 | 5,511,880 | |
| Sussex County Indl. Dev. Auth. Solid Waste Disp. Rev. Bonds Series 2003 A, 2.4%, tender 5/2/22 (a)(c) | 805,000 | 807,761 | |
| Virginia Port Auth. Port Facilities Rev. Series 2016 B, 5% 7/1/19 (c) | 1,905,000 | 1,909,570 | |
| Virginia Pub. Bldg. Auth. Pub. Facilities Rev. Series 2019 B, 5% 8/1/20 (c) | 4,030,000 | 4,187,009 | |
| Virginia Pub. School Auth. School Fing. Series 2018 B, 5% 8/1/20 | 4,670,000 | 4,864,085 | |
| Virginia Resources Auth. Moral Oblig.: | |||
| (Virginia Pooled Fing. Prog.) Series 2018 C, 5% 11/1/19 | 1,120,000 | 1,136,388 | |
| (Virginia Pooled Fing. Prog.) Series 2018 C, 5% 11/1/20 | 1,115,000 | 1,170,449 | |
| Virginia St Pub. School Auth. Spl. Oblig. Series 2018, 5% 3/1/20 | 3,790,000 | 3,892,237 | |
| Wise County Indl. Dev. Auth. Waste & Sewage Rev. Bonds: | |||
| (Virginia Elec. and Pwr. Co. Proj.) Series 2010 A, 1.875%, tender 6/1/20 (a) | 2,975,000 | 2,981,263 | |
| Series 2009 A, 2.15%, tender 9/1/20 (a) | 1,075,000 | 1,081,439 | |
| TOTAL VIRGINIA | 53,507,580 | ||
| Washington - 1.3% | |||
| Central Puget Sound Reg'l. Trans. Auth. Sales & Use Tax Rev. Bonds Series 2015 S2A, 1.72%, tender 11/1/21 (a) | 20,000,000 | 19,993,200 | |
| Grant County Pub. Util. District #2 Series 2012 A, 5% 1/1/21 | 40,000 | 42,177 | |
| Grays Hbr. County Wash Pub. Hosp. D Series 2017, 3% 8/1/19 | 1,665,000 | 1,665,103 | |
| King County Hsg. Auth. Rev. Series 2018: | |||
| 2.05% 5/1/20 | 765,000 | 768,018 | |
| 2.15% 5/1/20 | 405,000 | 406,378 | |
| 3.5% 5/1/21 | 500,000 | 515,890 | |
| King County Swr. Rev. Bonds Series 2012, 2.6%, tender 12/1/21 (a) | 3,600,000 | 3,644,352 | |
| Port of Seattle Rev.: | |||
| Series 2010 C, 5% 2/1/20 (c) | 1,280,000 | 1,308,275 | |
| Series 2015 C: | |||
| 5% 4/1/20 (c) | 1,885,000 | 1,937,119 | |
| 5% 4/1/21 (c) | 540,000 | 572,076 | |
| Series 2016 B: | |||
| 5% 10/1/20 (c) | 65,000 | 67,928 | |
| 5% 10/1/21 (c) | 60,000 | 64,604 | |
| 5% 10/1/22 (c) | 55,000 | 60,942 | |
| 5% 10/1/23 (c) | 65,000 | 73,870 | |
| Seattle Muni. Lt. & Pwr. Rev. Bonds Series 2018 B2, SIFMA Municipal Swap Index + 0.290% 1.71%, tender 11/1/21 (a)(e) | 10,000,000 | 9,972,600 | |
| Tacoma Elec. Sys. Rev.: | |||
| Series 2013 A: | |||
| 4% 1/1/21 | 5,000 | 5,199 | |
| 5% 1/1/21 | 40,000 | 42,209 | |
| Series 2017: | |||
| 5% 1/1/22 | 15,000 | 16,347 | |
| 5% 1/1/25 | 15,000 | 17,766 | |
| 5% 1/1/26 | 10,000 | 12,126 | |
| Tobacco Settlement Auth. Rev. Series 2013, 5% 6/1/20 | 1,190,000 | 1,225,473 | |
| Washington Ctfs. of Prtn. Series 2019 A, 5% 7/1/19 | 515,000 | 516,409 | |
| Washington Gen. Oblig. Series 2003 C, 0% 6/1/20 | 345,000 | 339,925 | |
| Washington Health Care Facilities Auth. Rev.: | |||
| (MultiCare Health Sys. Proj.) Series 2010 A, 5.25% 8/15/19 | 330,000 | 332,418 | |
| (Providence Health Systems Proj.) Series 2011 B, 5% 10/1/19 | 300,000 | 303,393 | |
| (Virginia Mason Med. Ctr. Proj.) Series 2017: | |||
| 5% 8/15/25 | 20,000 | 23,041 | |
| 5% 8/15/26 | 45,000 | 52,659 | |
| 5% 8/15/27 | 50,000 | 59,300 | |
| Bonds Series 2012 B, 5%, tender 10/1/21 (a) | 120,000 | 129,208 | |
| Series 2009, 7% 7/1/39 (Pre-Refunded to 7/1/19 @ 100) | 655,000 | 657,646 | |
| TOTAL WASHINGTON | 44,825,651 | ||
| West Virginia - 0.3% | |||
| Harrison County Commission Solid Waste Disp. Rev. Bonds (Monongahela Pwr. Co. Proj.) Series 2018 A, 3%, tender 10/15/21 (a)(c) | 5,700,000 | 5,725,764 | |
| Mason Co. Poll. Cont. Rev. (Appalachian Pwr. Co. Proj.) Series 2003 L, 2.75% 10/1/22 | 2,445,000 | 2,501,284 | |
| West Virginia Econ. Dev. Auth. Solid Waste Disp. Facilities Rev. Bonds (Appalachian Pwr. Co. Amos Proj.) Series 2011 A, 1.7%, tender 9/1/20 (a)(c) | 2,125,000 | 2,118,243 | |
| West Virginia Hsg. Dev. Fund Series 2017 A, 2.4% 11/1/22 (c) | 960,000 | 968,842 | |
| TOTAL WEST VIRGINIA | 11,314,133 | ||
| Wisconsin - 1.9% | |||
| Milwaukee County Arpt. Rev.: | |||
| Series 2013 A: | |||
| 5% 12/1/20 (c) | 30,000 | 31,434 | |
| 5% 12/1/22 (c) | 30,000 | 33,160 | |
| 5.25% 12/1/23 (c) | 35,000 | 39,986 | |
| Series 2016 A, 5% 12/1/19 (c) | 625,000 | 635,333 | |
| PMA Levy & Aid Anticipation Nts Prog. Series 2018 A, 3% 7/19/19 | 3,000,000 | 3,005,520 | |
| Pub. Fin. Auth. Solid Waste Bonds (Waste Mgmt., Inc. Proj.): | |||
| Series 2017 A, 1.95%, tender 8/1/19 (a)(c) | 8,000,000 | 8,002,360 | |
| Series 2017 A-1, 1.95%, tender 8/1/19 (a)(c) | 2,080,000 | 2,080,614 | |
| Series 2017 A-2, 1.95%, tender 8/1/19 (a)(c) | 24,800,000 | 24,807,316 | |
| Pub. Fin. Auth. Wis Edl. Facilities: | |||
| Series 2016, 5% 1/1/20 | 135,000 | 136,974 | |
| Series 2018, 5% 7/1/20 (d) | 545,000 | 554,750 | |
| Waukesha Gen. Oblig. Series 2019 D, 4% 7/1/20 | 4,200,000 | 4,292,610 | |
| Wisconsin Health & Edl. Facilities: | |||
| (Agnesian Healthcare Proj.) Series 2017: | |||
| 4% 7/1/19 | 100,000 | 100,166 | |
| 5% 7/1/21 | 100,000 | 106,467 | |
| Bonds: | |||
| (Ascension Health Cr. Group Proj.) Series 2013 B: | |||
| 5%, tender 6/1/20 (a) | 2,020,000 | 2,088,518 | |
| 5%, tender 6/1/21 (a) | 1,905,000 | 2,033,397 | |
| Series 2013 B-5, 1.375%, tender 12/3/19 (a) | 340,000 | 339,723 | |
| Series 2018 B, 5%, tender 1/26/22 (a) | 3,340,000 | 3,628,609 | |
| Series 2018 C, SIFMA Municipal Swap Index + 0.450% 1.87%, tender 7/27/22 (a)(e) | 3,885,000 | 3,878,590 | |
| Series 2018 C3, 1.97%, tender 7/26/23 (a) | 4,000,000 | 4,002,680 | |
| Series 2013 A, 5% 11/15/19 | 385,000 | 391,136 | |
| Series 2014: | |||
| 5% 5/1/20 | 10,000 | 10,258 | |
| 5% 5/1/21 | 15,000 | 15,804 | |
| Series 2017 A, 2.65% 11/1/20 | 2,875,000 | 2,879,083 | |
| Wisconsin Health & Edl. Facilities Auth. Rev.: | |||
| (Mercy Alliance, Inc. Proj.) Series 2012, 5% 6/1/19 | 200,000 | 200,000 | |
| Series 2010, 5% 12/15/20 | 350,000 | 361,529 | |
| Series 2012, 5% 10/1/21 | 30,000 | 32,359 | |
| Wisconsin Hsg. & Econ. Dev. Auth. Series 2018 A, 2.05% 9/1/20 (c) | 1,195,000 | 1,197,725 | |
| Wisconsin Hsg. & Econ. Dev. Auth. Hsg. Rev. Bonds Series 2017 A, 1.95%, tender 5/1/20 (a) | 1,360,000 | 1,360,577 | |
| TOTAL WISCONSIN | 66,246,678 | ||
| Wyoming - 0.1% | |||
| Wyoming Cmnty. Dev. Auth. Hsg. Rev. Bonds Series 2018 4, 1.74%, tender 9/1/21 (a) | 5,000,000 | 5,008,100 | |
| TOTAL MUNICIPAL BONDS | |||
| (Cost $1,970,492,009) | 1,978,820,319 | ||
| Municipal Notes - 27.1% | |||
| Alabama - 0.4% | |||
| Health Care Auth. for Baptist Health Series 2013 B, 1.81% 6/7/19, VRDN (a) | 3,705,000 | $3,705,000 | |
| Lower Gas District Participating VRDN Series Floaters XM 01 84, 1.82% 6/7/19 (a)(f)(g) | 6,845,000 | 6,845,000 | |
| Tuscaloosa Co. Indl. Dev. Auth. Solid Wste (Nucor Corp. Proj.) Series 2004, 1.62% 6/7/19, VRDN (a)(c) | 2,700,000 | 2,700,000 | |
| TOTAL ALABAMA | 13,250,000 | ||
| California - 1.6% | |||
| California Dept. of Wtr. Resources Series 2019, 1.76% 6/5/19 (Liquidity Facility Bank of America NA), CP | 3,682,000 | 3,682,305 | |
| California Health Facilities Fing. Auth. Rev. Participating VRDN: | |||
| Series Floaters 013, 1.54% 7/12/19 (Liquidity Facility Barclays Bank PLC) (a)(f)(g)(h) | 2,430,000 | 2,430,000 | |
| Series Floaters XG 01 75, 1.56% 6/7/19 (Liquidity Facility Bank of America NA) (a)(f)(g) | 5,300,000 | 5,300,000 | |
| California Statewide Cmntys. Dev. Auth. Multi-family Hsg. Rev. (Westgate Pasadena Apts. Proj.) Series 2013 B, 1.69% 6/7/19, VRDN (a)(c) | 6,000,000 | 6,000,000 | |
| Dignity Health Participating VRDN Series 17 04, 1.54% 7/12/19 (Liquidity Facility Barclays Bank PLC) (a)(f)(g)(h) | 8,270,000 | 8,270,000 | |
| El Centro Reg'l. Med. Cen Participating VRDN Series Floaters XF 10 72, 1.7% 6/7/19 (Liquidity Facility Deutsche Bank AG New York Branch) (a)(f)(g) | 5,100,000 | 5,100,000 | |
| Los Angeles County Schools Pooled Fing. Prog. Ctfs. of Prtn. TRAN Series 2018 A, 4% 7/1/19 | 1,000,000 | 1,001,717 | |
| Sacramento Muni. Util. District Elec. Rev. Series 2019, 1.9% 6/5/19, LOC Bank of America NA, CP | 3,300,000 | 3,300,351 | |
| San Francisco Calif. City & Cnty. Arpts. Commn. Int'l. Arpt. Rev. Participating VRDN Series 15 ZF 01 64, 1.67% 6/7/19 (Liquidity Facility JPMorgan Chase Bank) (a)(c)(f)(g) | 1,705,000 | 1,705,000 | |
| San Francisco City & County Arpts. Commission Int'l. Arpt. Rev. Participating VRDN: | |||
| Series Floaters XM 06 75, 1.67% 6/7/19 (Liquidity Facility Morgan Stanley Bank, West Valley City Utah) (a)(c)(f)(g) | 500,000 | 500,000 | |
| Series Floaters ZF 26 76, 1.62% 6/7/19 (Liquidity Facility Morgan Stanley Bank, West Valley City Utah) (a)(c)(f)(g) | 7,185,000 | 7,185,000 | |
| Series Floaters ZM 06 41, 1.67% 6/7/19 (Liquidity Facility JPMorgan Chase Bank) (a)(c)(f)(g) | 5,250,000 | 5,250,000 | |
| Shafter Indl. Dev. Auth. Indl. Dev. Rev. 1.76% 6/7/19, LOC Deutsche Bank AG New York Branch, VRDN (a)(c) | 355,000 | 355,000 | |
| Wilshire Vermont Station Apts Participating VRDN Series Spears DBE 80 16, 1.77% 6/7/19 (Liquidity Facility Deutsche Bank AG New York Branch) (a)(c)(f)(g) | 4,245,000 | 4,245,000 | |
| TOTAL CALIFORNIA | 54,324,373 | ||
| Colorado - 1.0% | |||
| Colorado Ed. Ln. Prog. TRAN Series 2018 A, 4% 6/27/19 | 5,000,000 | 5,008,442 | |
| Colorado Edl. & Cultural Facilities Auth. Rev. (Mesivta of Greater Los Angeles Proj.) Series 2005, 1.77% 6/7/19, LOC Deutsche Bank AG, VRDN (a) | 890,000 | 890,000 | |
| Denver City & County Arpt. Rev. Participating VRDN: | |||
| Series DBE 8027, 1.67% 6/7/19 (Liquidity Facility Deutsche Bank AG New York Branch) (a)(c)(f)(g) | 1,700,000 | 1,700,000 | |
| Series Floaters XL 00 90, 1.67% 6/7/19 (Liquidity Facility Morgan Stanley Bank, West Valley City Utah) (a)(c)(f)(g) | 25,225,000 | 25,225,000 | |
| Series Floaters XM 07 15, 1.72% 6/7/19 (Liquidity Facility Morgan Stanley Bank, West Valley City Utah) (a)(c)(f)(g) | 1,600,000 | 1,600,000 | |
| TOTAL COLORADO | 34,423,442 | ||
| Connecticut - 0.1% | |||
| New Britain Gen. Oblig. BAN Series 2018, 5% 12/19/19 | 2,300,000 | 2,341,572 | |
| District Of Columbia - 0.2% | |||
| District of Columbia Rev. Participating VRDN Series Floaters XF 10 78, 1.82% 6/7/19 (Liquidity Facility Deutsche Bank AG New York Branch) (a)(f)(g) | 7,600,000 | 7,600,000 | |
| Florida - 1.9% | |||
| Aqua One Cmnty. Dev. District Fla Participating VRDN Series Floaters XF 10 76, 1.77% 6/7/19 (Liquidity Facility Deutsche Bank AG New York Branch) (a)(f)(g) | 4,900,000 | 4,900,000 | |
| Avenir Cmnty. Dev. District Participating VRDN Series Floaters XF 10 74, 1.77% 6/7/19 (Liquidity Facility Deutsche Bank AG New York Branch) (a)(f)(g) | 5,770,000 | 5,770,000 | |
| Broward County Arpt. Sys. Rev. Participating VRDN Series Floaters XL 00 88, 1.77% 6/7/19 (Liquidity Facility Citibank NA) (a)(c)(f)(g) | 6,730,000 | 6,730,000 | |
| Broward County School District TAN Series 2018, 3% 6/12/19 | 10,000,000 | 10,003,847 | |
| Greater Orlando Aviation Auth. Arpt. Facilities Rev. Participating VRDN Series Floaters XF 05 77, 1.62% 6/7/19 (Liquidity Facility Royal Bank of Canada) (a)(c)(f)(g) | 1,165,000 | 1,165,000 | |
| Jacksonville Health Care Series 2019, 1.85% 6/4/19, CP | 2,500,000 | 2,499,902 | |
| Lee County Indl. Dev. Auth. Rev. (Florida Pwr. & Lt. Co. Proj.) Series 2016 A, 2.5% 6/3/19, VRDN (a)(c) | 2,820,000 | 2,820,000 | |
| Lee Memorial Health Sys. Hosp. Rev. Series 2019 B, 1.67% 6/6/22, VRDN (a) | 7,600,000 | 7,600,000 | |
| Orange County Health Facilities Auth. Rev. Series 2008, 1.46% 6/7/19, LOC SunTrust Banks, Inc., VRDN (a) | 1,805,000 | 1,805,000 | |
| Palm Beach County School District TAN Series 2018, 3% 8/30/19 | 8,650,000 | 8,681,422 | |
| Pinellas County Health Facilities Auth. Rev. (Suncoast Hospice Proj.) Series 2004, 1.56% 6/7/19, LOC Wells Fargo Bank NA, VRDN (a) | 760,000 | 760,000 | |
| South Miami Health Facilities Auth. Hosp. Rev. Participating VRDN Series Floaters XF 25 17, 1.52% 6/7/19 (Liquidity Facility Morgan Stanley Bank, West Valley City Utah) (a)(f)(g) | 2,210,000 | 2,210,000 | |
| St. Lucie School District TAN Series 2018, 3% 6/28/19 | 10,000,000 | 10,010,271 | |
| TOTAL FLORIDA | 64,955,442 | ||
| Georgia - 0.5% | |||
| Emory Univ. Series 2019, 1.55% 9/5/19, CP | 10,000,000 | 10,002,886 | |
| Gainesville & Hall County Hosp. Auth. Rev. Series 2017 C, 1.65% 6/7/19, VRDN (a) | 1,855,000 | 1,855,000 | |
| Griffin-Spalding County Hosp. Participating VRDN Series Floaters XL 00 76, 1.57% 6/7/19 (Liquidity Facility JPMorgan Chase Bank) (a)(f)(g) | 2,250,000 | 2,250,000 | |
| Heard County Dev. Auth. Poll. Cont. Rev. Series 2007, 2.31% 6/3/19, VRDN (a)(c) | 1,000,000 | 1,000,000 | |
| Savannah Econ. Dev. Auth. Rev. (Home Depot, Inc. Proj.) Series 1995, 1.48% 6/7/19, LOC SunTrust Banks, Inc., VRDN (a)(c) | 1,395,000 | 1,395,000 | |
| TOTAL GEORGIA | 16,502,886 | ||
| Idaho - 0.2% | |||
| Idaho Gen. Oblig. TAN Series 2018, 4% 6/28/19 | 6,035,000 | 6,045,529 | |
| Idaho Hsg. & Fin. Assoc. Single Family Mtg. Series A, 1.6% 6/7/19 (Liquidity Facility Fannie Mae) (Liquidity Facility Freddie Mac), VRDN (a) | 1,880,000 | 1,880,000 | |
| TOTAL IDAHO | 7,925,529 | ||
| Illinois - 0.7% | |||
| Chicago Board of Ed. Participating VRDN Series Floaters XG 01 08, 1.6% 6/7/19 (a)(f)(g) | 7,420,000 | 7,420,000 | |
| Chicago Park District Gen. Oblig. Participating VRDN Series ROC II R 11935, 1.77% 6/7/19 (Liquidity Facility Citibank NA) (a)(f)(g) | 2,400,000 | 2,400,000 | |
| Cook County Gen. Oblig. Participating VRDN Series 2015 XF0124, 1.65% 6/7/19 (Liquidity Facility JPMorgan Chase Bank) (a)(f)(g) | 1,280,000 | 1,280,000 | |
| Illinois Fin. Auth. Rev. Series 2007 A3, 2.25% 6/7/19 (Liquidity Facility JPMorgan Chase Bank), VRDN (a) | 1,530,000 | 1,530,000 | |
| Illinois Gen. Oblig. Participating VRDN Series Floaters XM 01 86, 1.67% 6/7/19 (Liquidity Facility Deutsche Bank AG New York Branch) (a)(f)(g) | 1,000,000 | 1,000,000 | |
| Metropolitan Pier & Exposition Participating VRDN Series Floaters XF 10 45, 1.6% 6/7/19 (Liquidity Facility Barclays Bank PLC) (a)(f)(g) | 1,620,000 | 1,620,000 | |
| Reg'l. Transn Auth. Extend Series 2005 B, 2.2% 7/1/19, VRDN (a) | 7,915,000 | 7,915,000 | |
| Sales Tax Securitization Corp. Participating VRDN Series Floaters XM 06 83, 1.59% 6/7/19 (Liquidity Facility Bank of America NA) (a)(f)(g) | 1,000,000 | 1,000,000 | |
| TOTAL ILLINOIS | 24,165,000 | ||
| Indiana - 0.3% | |||
| Ctr. Grove Multi-Facility School Bldg. Corp. BAN Series 2019, 2.5% 12/15/20 (b) | 3,200,000 | 3,224,928 | |
| Indiana Dev. Fin. Auth. Envir. Rev. (PSI Energy Proj.): | |||
| Series 2003 A, 1.65% 6/7/19, VRDN (a)(c) | 350,000 | 350,000 | |
| Series 2003 B, 1.57% 6/7/19, VRDN (a)(c) | 1,000,000 | 1,000,000 | |
| Indiana Fin. Auth. Rev. Series 2008 E7, 1.4% 6/7/19, VRDN (a) | 3,305,000 | 3,305,000 | |
| Indiana Univ. Student Fee Revs. Series 2019, 1.55% 9/4/19, CP | 2,400,000 | 2,399,870 | |
| TOTAL INDIANA | 10,279,798 | ||
| Iowa - 0.3% | |||
| Hills Health Facilities Rev. Participating VRDN Series Floaters XF 10 73, 1.77% 6/7/19 (Liquidity Facility Deutsche Bank AG New York Branch) (a)(f)(g) | 4,875,000 | 4,875,000 | |
| Iowa Fin. Auth. Midwestern Disaster Area Econ. Dev. Series 2012 IA, 1.88% 6/7/19, VRDN (a) | 6,775,000 | 6,775,000 | |
| Iowa Fin. Auth. Rev. Series 2018 F, 2.43% 6/3/19, LOC JPMorgan Chase Bank, VRDN (a) | 185,000 | 185,000 | |
| TOTAL IOWA | 11,835,000 | ||
| Kansas - 0.1% | |||
| Burlington Envir. Impt. Rev. (Kansas City Pwr. and Lt. Co. Proj.): | |||
| Series 2007 A, 1.75% 6/7/19, VRDN (a) | 2,000,000 | 2,000,000 | |
| Series 2007 B, 1.75% 6/7/19, VRDN (a) | 2,000,000 | 2,000,000 | |
| Wamego Kansas Poll. Cont. Rfdg. Rev. (Kansas Gas & Elec. Co. Proj.) Series 1994, 1.7% 6/7/19, VRDN (a) | 500,000 | 500,000 | |
| TOTAL KANSAS | 4,500,000 | ||
| Louisiana - 0.5% | |||
| Louisiana Pub. Facilities Auth. Hosp. Rev. Participating VRDN Series Floaters BAML 70 02, 1.46% 6/7/19, LOC Bank of America NA, (Liquidity Facility Bank of America NA) (a)(f)(g) | 10,000,000 | 10,000,000 | |
| Saint James Parish Gen. Oblig. (Nucor Steel Louisiana LLC Proj.): | |||
| Series 2010 A1, 1.58% 6/7/19, VRDN (a) | 3,000,000 | 3,000,000 | |
| Series 2010 B1, 1.6% 6/7/19, VRDN (a) | 3,100,000 | 3,100,000 | |
| TOTAL LOUISIANA | 16,100,000 | ||
| Maine - 0.1% | |||
| Auburn Rev. Oblig. Secs Series 2001, 1.67% 6/7/19, LOC TD Banknorth, NA, VRDN (a)(c) | 130,000 | 130,000 | |
| Old Town ME Solid Waste Disp. Series 2004, 1.62% 6/7/19, VRDN (a)(c)(d) | 3,330,000 | 3,330,000 | |
| TOTAL MAINE | 3,460,000 | ||
| Maryland - 0.7% | |||
| Baltimore County Gen. Oblig. BAN Series 2019, 4% 3/19/20 | 17,300,000 | 17,657,999 | |
| Baltimore Proj. Rev. Bonds Series Floaters G 42, 1.62%, tender 7/1/19 (Liquidity Facility Royal Bank of Canada) (a)(f)(g)(h) | 4,500,000 | 4,500,000 | |
| Maryland Health & Higher Edl. Facilities Auth. Rev. Series 2019, 1.78% 6/6/19, CP | 2,000,000 | 2,000,151 | |
| TOTAL MARYLAND | 24,158,150 | ||
| Massachusetts - 0.7% | |||
| Massachusetts Edl. Fing. Auth. Rev. Participating VRDN Series Floaters XF 23 06, 1.67% 6/7/19 (Liquidity Facility Morgan Stanley Bank, West Valley City Utah) (a)(c)(f)(g) | 2,430,000 | 2,430,000 | |
| Massachusetts Gen. Oblig. RAN Series 2018 C, 4% 6/20/19 | 21,000,000 | 21,024,203 | |
| Nahant BAN Series 2018 A, 3% 6/28/19 | 813,000 | 813,612 | |
| TOTAL MASSACHUSETTS | 24,267,815 | ||
| Michigan - 0.3% | |||
| Michigan Fin. Auth. Rev. RAN Series 2018 A, 4% 8/20/19 | 11,000,000 | 11,056,560 | |
| Minnesota - 0.3% | |||
| Shakopee Minn Sr Hsg. Rev. Participating VRDN: | |||
| Series Floaters 001, 1.72% 7/12/19 (Liquidity Facility Barclays Bank PLC) (a)(f)(g)(h) | 5,000,000 | 5,000,000 | |
| Series Floaters YX 11 03, 1.6% 6/7/19 (Liquidity Facility Barclays Bank PLC) (a)(f)(g) | 3,800,000 | 3,800,000 | |
| TOTAL MINNESOTA | 8,800,000 | ||
| Mississippi - 0.4% | |||
| Mississippi Bus. Fin. Corp. Rev. (Utils. Optimization LLC Proj.) Series 2002 A, 1.7% 6/7/19, LOC Cap. One Bank, VRDN (a)(c) | 600,000 | 600,000 | |
| Mississippi Bus. Fin. Corp. Solid Waste Disp. Rev. (Gulf Pwr. Co. Proj.) Series 2012, 2.17% 6/3/19, VRDN (a)(c) | 1,945,000 | 1,945,000 | |
| Perry County Poll. Cont. Rev. Series 2002, 1.62% 6/7/19, VRDN (a)(d) | 10,575,000 | 10,575,000 | |
| TOTAL MISSISSIPPI | 13,120,000 | ||
| Missouri - 0.1% | |||
| Curators of the Univ. of Missouri Series A, 1.63% 9/5/19, CP | 2,000,000 | 2,001,368 | |
| Nevada - 0.1% | |||
| Clark County Arpt. Rev. Participating VRDN Series ROC II R 11823, 1.62% 6/7/19 (Liquidity Facility Citibank NA) (a)(f)(g) | 4,590,000 | 4,590,000 | |
| Sparks Econ. Dev. Rev. (RIX Industries Proj.) Series 2002, 1.66% 6/7/19, LOC Wells Fargo Bank NA, VRDN (a)(c) | 120,000 | 120,000 | |
| TOTAL NEVADA | 4,710,000 | ||
| New Jersey - 1.9% | |||
| Borough of Riverdale BAN Series 2018, 3% 9/13/19 | 2,100,000 | 2,107,951 | |
| Burlington County Bridge Commission Lease Rev. BAN (Governmental Leasing Prog.) Series 2019 B, 2.75% 4/17/20 | 5,000,000 | 5,054,781 | |
| Chester Township Gen. Oblig. BAN Series 2018, 3% 10/11/19 | 3,000,000 | 3,015,204 | |
| Delran Township BAN Series 2018, 3% 10/25/19 | 4,815,090 | 4,840,656 | |
| East Brunswick Township Gen. Oblig. BAN Series 2019, 3.5% 1/10/20 | 1,677,000 | 1,697,338 | |
| Flemington BAN 3.5% 1/15/20 | 2,400,000 | 2,426,209 | |
| Gloucester Township BAN Series 2018 B, 3% 6/20/19 | 6,600,000 | 6,603,819 | |
| Maple Shade Township BAN Series 2018: | |||
| 3% 6/27/19 | 1,800,000 | 1,801,701 | |
| 3% 6/27/19 | 4,163,884 | 4,167,818 | |
| Millburn Township Gen. Oblig. BAN Series 2018, 3% 6/14/19 | 2,659,857 | 2,660,861 | |
| Millstone Township Gen. Oblig. BAN Series 2018, 3% 9/10/19 | 2,700,000 | 2,710,061 | |
| New Jersey Health Care Facilities Fing. Auth. Rev. Participating VRDN Series 16 XG 00 47, 1.52% 6/7/19 (Liquidity Facility Deutsche Bank AG New York Branch) (a)(f)(g) | 3,913,724 | 3,913,724 | |
| New Jersey Trans. Trust Fund Auth. TRAN Series 2018 A, 5% 6/15/19 | 500,000 | 500,520 | |
| Roselle County of Union BAN Series 2018, 3.5% 12/6/19 | 2,658,145 | 2,684,016 | |
| Sea Isle City BAN Series 2018, 3.5% 9/12/19 | 4,000,000 | 4,021,225 | |
| South River Borough Gen. Oblig. BAN Series 2018, 3.5% 12/10/19 | 5,300,000 | 5,354,078 | |
| Teaneck Township Gen. Oblig. BAN Series 2018, 3% 6/28/19 | 1,200,000 | 1,200,988 | |
| Vineland Gen. Oblig. BAN Series 2018, 3.5% 11/14/19 | 4,500,000 | 4,537,907 | |
| Wall Township Gen. Oblig. BAN Series 2018, 3% 6/28/19 | 5,000,000 | 5,004,151 | |
| TOTAL NEW JERSEY | 64,303,008 | ||
| New York - 5.9% | |||
| Amsterdam City School District BAN Series 2018, 3% 6/28/19 | 6,700,000 | 6,705,610 | |
| Binghamton Gen. Oblig. BAN Series 2019 B, 3.5% 4/17/20 | 5,000,000 | 5,084,957 | |
| Broome County Gen. Oblig. BAN Series 2019 A, 2.5% 5/1/20 | 5,000,000 | 5,045,044 | |
| Build NYC Resource Corp. Rev. Participating VRDN Series Floaters XF 10 80, 1.82% 6/7/19 (Liquidity Facility Deutsche Bank AG New York Branch) (a)(f)(g) | 3,300,000 | 3,300,000 | |
| Eastport-South Manor Central School District TAN Series 2018, 2.75% 6/25/19 | 5,000,000 | 5,003,483 | |
| Eden N Y Cent School District BAN Series 2019, 3% 6/6/19 | 2,700,000 | 2,700,235 | |
| Galway Cent School District BAN Series 2019, 3% 4/30/20 | 5,000,000 | 5,064,645 | |
| Gloversville School District BAN Series 2018, 3% 10/18/19 | 12,500,000 | 12,561,664 | |
| Hempstead Union Free School District TAN Series 2018, 2.75% 6/27/19 | 7,000,000 | 7,004,045 | |
| Nassau County Gen. Oblig.: | |||
| RAN Series 2019 A, 4% 12/10/19 | 4,450,000 | 4,509,197 | |
| TAN Series 2018 B, 4% 9/16/19 | 6,000,000 | 6,042,688 | |
| New York City Gen. Oblig. Series 2006, 2.15% 6/7/19 (FSA Insured), VRDN (a) | 7,575,000 | 7,575,000 | |
| New York City Muni. Wtr. Fin. Auth. Wtr. & Swr. Sys. Rev.: | |||
| Series 2008 B3, 2.2% 6/3/19 (Liquidity Facility Bank of America NA), VRDN (a) | 10,000,000 | 10,000,000 | |
| Series 2017 BB, 2.26% 6/3/19 (Liquidity Facility State Street Bank & Trust Co., Boston), VRDN (a) | 1,530,000 | 1,530,000 | |
| New York City Transitional Fin. Auth. Rev. Series 2002 3, 1.53% 6/7/19, VRDN (a) | 1,600,000 | 1,600,000 | |
| New York Hsg. Fin. Agcy. Rev. Series 2014 A, 1.49% 6/7/19, VRDN (a) | 1,530,000 | 1,530,000 | |
| New York Metropolitan Trans. Auth. Rev. BAN: | |||
| Series 2018 B, 5% 5/15/21 | 3,695,000 | 3,935,212 | |
| Series 2018 C, 5% 9/1/21 | 3,250,000 | 3,492,580 | |
| Series 2019 A, 4% 2/3/20 | 28,915,000 | 29,398,080 | |
| New York Thruway Auth. Gen. Rev. BAN Series 2019 A, 4% 2/1/20 | 10,000,000 | 10,068,910 | |
| Penn Yan NY Central School District BAN Series 2018, 3% 7/19/19 | 2,900,000 | 2,904,437 | |
| Port Chester-Rye BAN Series 2019, 2.5% 6/12/20 (b) | 10,000,000 | 10,096,624 | |
| Poughkeepsie Gen. Oblig. BAN Series 2019 A, 3% 5/2/20 | 1,417,544 | 1,426,193 | |
| Queensbury Union Free School District BAN Series 2018, 3% 7/12/19 | 5,600,000 | 5,608,304 | |
| Rockland County Gen. Oblig. TAN Series 2019, 3% 4/2/20 | 5,800,000 | 5,869,061 | |
| Sidney Cent School District BAN Series 2018, 3% 7/10/19 | 1,600,000 | 1,601,918 | |
| South Glens Falls Central School District BAN Series 2018 B, 3% 7/26/19 | 500,000 | 501,023 | |
| Suffolk County Gen. Oblig.: | |||
| RAN Series 2019, 2% 3/20/20 | 10,000,000 | 10,031,465 | |
| TAN: | |||
| Series 2018 I, 4% 9/26/19 | 10,000,000 | 10,077,438 | |
| Series 2018, 5% 7/24/19 | 14,000,000 | 14,065,904 | |
| Troy Rensselaer County BAN Series B, 3% 8/2/19 | 4,300,000 | 4,309,869 | |
| Ulster County Indl. Dev. Agcy. I (Selux Corp. Proj.) Series A, 1.8% 6/7/19, LOC Manufacturers & Traders Trust Co., VRDN (a)(c) | 35,000 | 35,000 | |
| Village of Island Park BAN Series 2019 A, 3% 3/5/20 | 2,442,000 | 2,465,325 | |
| TOTAL NEW YORK | 201,143,911 | ||
| Non-State Specific - 0.1% | |||
| BB&T Muni. Trust Series 2016, 2.47% 12/31/19, CP (a)(d) | 397,422 | 397,422 | |
| Fed. Home Ln. Mtg. Corp. Series 2018 M46, 1.67% 6/7/19 (Liquidity Facility Freddie Mac), VRDN (a) | 4,965,000 | 4,964,950 | |
| TOTAL NON-STATE SPECIFIC | 5,362,372 | ||
| North Carolina - 0.0% | |||
| Alamance County Idnl Facilities Poll Fing. Auth. Series 2001, 1.61% 6/7/19, LOC Wells Fargo Bank NA, VRDN (a)(c) | 400,000 | 400,000 | |
| Hertford County Indl. Facilities Poll. Cont. Fing. Auth. Series 2000 B, 1.63% 6/7/19, VRDN (a)(c) | 500,000 | 500,000 | |
| North Carolina Cap. Facilities Fin. Agcy. Edl. Facilities Rev. Series 2003, 1.49% 6/7/19, LOC Branch Banking & Trust Co., VRDN (a) | 260,000 | 260,000 | |
| TOTAL NORTH CAROLINA | 1,160,000 | ||
| Ohio - 0.5% | |||
| Avon Gen. Oblig. BAN Series 2018, 3% 9/5/19 | 2,250,000 | 2,258,471 | |
| East Clinton Local School District BAN Series 2019: | |||
| 2.8% 12/3/19 | 2,700,000 | 2,714,994 | |
| 3% 12/17/19 | 2,600,000 | 2,616,924 | |
| Englewood BAN Series 2019, 3% 1/22/20 | 3,300,000 | 3,323,844 | |
| Forest Park Gen. Oblig. BAN Series 2019, 2.5% 5/27/20 | 600,000 | 604,309 | |
| Highland Heights Gen. Oblig. BAN Series 2018, 2.75% 6/13/19 | 2,300,000 | 2,300,598 | |
| Lake County Gen. Oblig. BAN Series 2018, 2.5% 6/13/19 | 1,000,000 | 1,000,262 | |
| Lorain County Gen. Oblig. BAN Series 2019, 3% 2/7/20 | 2,000,000 | 2,019,180 | |
| Ohio Indl. Dev. Rev. Series 2000, 1.66% 6/7/19, LOC JPMorgan Chase Bank, VRDN (a)(c) | 900,000 | 900,000 | |
| Tipp City BAN Series 2019, 3% 2/12/20 | 1,000,000 | 1,008,956 | |
| TOTAL OHIO | 18,747,538 | ||
| Pennsylvania - 1.0% | |||
| Lehigh County Gen. Purp. Hosp. Rev. Participating VRDN Series Floaters 2019 003, 1.57% 7/12/19 (Liquidity Facility Barclays Bank PLC) (a)(f)(g)(h) | 8,000,000 | 8,000,000 | |
| Montgomery County Higher Ed. & Health Auth. Rev. Series 2018 D, 1.66% 6/6/22, VRDN (a) | 6,000,000 | 6,000,000 | |
| Pennsylvania Econ. Dev. Participating VRDN Series XM 0048, 1.52% 6/7/19 (Liquidity Facility Deutsche Bank AG New York Branch) (a)(f)(g) | 2,900,000 | 2,900,000 | |
| Pennsylvania Higher Edl. Facilities Auth. Rev. Series 2015 B, 1.66% 6/6/22, VRDN (a) | 6,035,000 | 6,035,000 | |
| Philadelphia Auth. For Indl. Series 2017 B, 1.66% 6/7/19, VRDN (a) | 11,355,000 | 11,355,000 | |
| TOTAL PENNSYLVANIA | 34,290,000 | ||
| South Carolina - 0.7% | |||
| Berkeley County Indl. Dev. Rev. (Nucor Corp. Proj.) Series 1997, 1.62% 6/7/19, VRDN (a)(c) | 1,100,000 | 1,100,000 | |
| Lexington County School District #1 BAN Series 2019 A, 3% 10/30/19 | 10,000,000 | 10,062,757 | |
| South Carolina Jobs-Econ. Dev. Auth. Series 2018 C, 1.65% 6/6/22, VRDN (a) | 10,825,000 | 10,825,000 | |
| South Carolina Jobs-Econ. Dev. Auth. Econ. Dev. Rev. Series 2008, 1.46% 6/7/19, LOC SunTrust Banks, Inc., VRDN (a) | 1,415,000 | 1,415,000 | |
| South Carolina Pub. Svc. Auth. Rev. Participating VRDN: | |||
| Series Floaters XG 02 09, 1.77% 6/7/19 (Liquidity Facility Toronto-Dominion Bank) (a)(f)(g) | 1,000,000 | 1,000,000 | |
| Series Floaters XM 02 91, 1.67% 6/7/19 (Liquidity Facility Royal Bank of Canada) (a)(f)(g) | 300,000 | 300,000 | |
| South Carolina St. Pub. Svc. Auth. Rev. Participating VRDN Series XG 0046, 1.77% 6/7/19 (Liquidity Facility Toronto-Dominion Bank) (a)(f)(g) | 80,000 | 80,000 | |
| TOTAL SOUTH CAROLINA | 24,782,757 | ||
| Tennessee - 0.5% | |||
| Tennessee Gen. Oblig. Series 2019: | |||
| 1.6% 9/16/19 (Liquidity Facility Tennessee Consldatd Retire Sys.), CP | 4,000,000 | 3,999,689 | |
| 1.8% 8/29/19 (Liquidity Facility Tennessee Consldatd Retire Sys.), CP | 12,000,000 | 12,007,814 | |
| TOTAL TENNESSEE | 16,007,503 | ||
| Texas - 4.1% | |||
| Dallas Fort Worth Int'l. Arpt. Rev. Participating VRDN Series Floaters XF 10 61, 1.62% 6/7/19 (Liquidity Facility Deutsche Bank AG New York Branch) (a)(c)(f)(g) | 2,880,000 | 2,880,000 | |
| Deutsche Spears/Lifers Trust Participating VRDN Series Floaters XG 00 58, 1.54% 6/7/19 (Liquidity Facility Deutsche Bank AG) (a)(f)(g) | 1,085,000 | 1,085,000 | |
| Garland Wtr. & Swr. Rev. Series 2019, 2.3% 7/12/19, LOC Sumitomo Mitsui Banking Corp., CP | 900,000 | 900,430 | |
| Harris County Cultural Ed. Facilities Fin. Corp. Med. Facilities Rev. Participating VRDN Series Floaters 010, 1.57% 7/12/19 (Liquidity Facility Barclays Bank PLC) (a)(f)(g) | 8,000,000 | 8,000,000 | |
| Harris County Cultural Ed. Facilities Fin. Corp. Rev. Series 2019, 1.75% tender 6/4/19, CP mode | 4,800,000 | 4,799,725 | |
| Harris County Gen. Oblig.: | |||
| Series 2019, 1.77% 6/6/19 (Liquidity Facility Bank of America NA), CP | 3,670,000 | 3,670,306 | |
| Series D, 1.77% 6/6/19 (Liquidity Facility JPMorgan Chase Bank), CP | 2,780,000 | 2,780,232 | |
| Harris County Tex Iam Commercial Paper Series 2019, 1.78% 6/6/19, CP | 1,450,000 | 1,450,085 | |
| Houston Gen. Oblig. TRAN Series 2018, 4% 6/28/19 | 10,000,000 | 10,017,235 | |
| Houston Higher Ed. Fin. Corp. Higher Ed. Rev. Series 2019, 1.82% 6/4/19, CP | 4,000,000 | 3,999,838 | |
| Houston Util. Sys. Rev. Series B4, 1.85% 7/12/19 (Liquidity Facility State Street Bank & Trust Co., Boston), CP | 4,750,000 | 4,752,389 | |
| North Texas Tollway Auth. Rev. Participating VRDN Series XM0085, 1.62% 6/7/19 (Liquidity Facility Barclays Bank PLC) (a)(f)(g) | 1,900,000 | 1,900,000 | |
| Port Arthur Navigation District Envir. Facilities Rev. (Motiva Enterprises LLC Proj.): | |||
| Series 2001 A, 2.45% 6/3/19, VRDN (a) | 8,150,000 | 8,150,000 | |
| Series 2004, 1.63% 6/7/19, VRDN (a)(c) | 20,415,000 | 20,415,000 | |
| Series 2010 B, 2.45% 6/3/19, VRDN (a) | 5,785,000 | 5,785,000 | |
| Series 2010 C, 2.45% 6/3/19, VRDN (a) | 6,440,000 | 6,440,000 | |
| Series 2010 D: | |||
| 1.55% 6/7/19, VRDN (a) | 7,685,000 | 7,685,000 | |
| 1.55% 6/7/19, VRDN (a) | 4,160,000 | 4,160,000 | |
| San Antonio Arpt. Sys. Rev. 1.5% 6/6/19, LOC Bank of America NA, VRDN (a)(c) | 400,000 | 400,000 | |
| San Antonio Elec. & Gas Sys. Rev. Series C, 1.73% 6/21/19, CP | 3,000,000 | 3,000,756 | |
| Texas Gen. Oblig. TRAN Series 2018, 4% 8/29/19 | 39,000,000 | 39,233,462 | |
| TOTAL TEXAS | 141,504,458 | ||
| Utah - 0.2% | |||
| Salt Lake City Arpt. Rev. Participating VRDN Series Floaters XM 06 99, 1.72% 6/7/19 (Liquidity Facility Cr. Suisse AG) (a)(c)(f)(g) | 6,600,000 | 6,600,000 | |
| Virginia - 0.4% | |||
| Norfolk Wtr. Rev. Participating VRDN Series Floaters XS 00 03, 1.7% 7/11/19 (a)(f)(g) | 11,985,000 | 11,985,000 | |
| Washington - 0.3% | |||
| Kitsap County Indl. Dev. Corpre (Cara Land Co., L.L.C. Proj.) Series 2006, 1.66% 6/7/19, LOC Wells Fargo Bank NA, VRDN (a)(c) | 635,000 | 635,000 | |
| Port Chehalis Indl. Dev. Rev. (JLT Holding, LLC Proj.) Series 2003, 1.61% 6/7/19, LOC Wells Fargo Bank NA, VRDN (a)(c) | 600,000 | 600,000 | |
| Univ. of Washington Univ. Revs. Series 2019, 1.67% 6/11/19, CP | 1,500,000 | 1,500,089 | |
| Washington Econ. Dev. Fin. Auth. Rev. Participating VRDN Series Floaters 005, 1.77% 7/12/19 (Liquidity Facility Barclays Bank PLC) (a)(c)(f)(g)(h) | 5,200,000 | 5,200,000 | |
| Washington Health Care Facilities Auth. Rev. Participating VRDN Series MS 3354, 1.82% 6/7/19 (Liquidity Facility Morgan Stanley Bank, West Valley City Utah) (a)(f)(g) | 2,275,000 | 2,275,000 | |
| TOTAL WASHINGTON | 10,210,089 | ||
| West Virginia - 0.1% | |||
| West Virginia Hosp. Fin. Auth. Hosp. Rev. Series 2018 E, 1.65% 6/6/22, VRDN (a) | 2,000,000 | 2,000,000 | |
| Wisconsin - 0.9% | |||
| Deforest Area School District BAN Series 2019, 3% 12/18/19 (b) | 4,700,000 | 4,710,101 | |
| Deutsche Bank Spears/Lifers Trust Participating VRDN Series Floaters XF 10 28, 1.49% 6/7/19 (Liquidity Facility Deutsche Bank AG) (a)(f)(g) | 2,370,000 | 2,370,000 | |
| JPMorgan Chase Participating VRDN Series Floaters XF 01 27, 1.6% 6/7/19 (a)(f)(g) | 1,060,000 | 1,060,000 | |
| Milton School District BAN Series 2019, 5% 8/19/19 (b) | 3,600,000 | 3,620,553 | |
| Milwaukee Gen. Oblig. RAN Series 2019 R2: | |||
| 3% 5/7/20 | 5,000,000 | 5,068,811 | |
| 4% 5/7/20 | 5,000,000 | 5,114,696 | |
| Oconto Falls Pub. Schools TRAN Series 2018, 3% 10/1/19 | 2,000,000 | 2,008,418 | |
| Univ. of Wisconsin Hosp. & Clinics Auth. Series 2018 C, 2.18% 6/3/19 (Liquidity Facility BMO Harris Bank NA), VRDN (a) | 6,200,000 | 6,200,000 | |
| TOTAL WISCONSIN | 30,152,579 | ||
| TOTAL MUNICIPAL NOTES | |||
| (Cost $927,435,193) | 928,026,150 | ||
| Commercial Paper – 0.2% | |||
| Houston Airport System Rev. 1.87% 6/4/19 | |||
| (Cost $7,000,000) | 7,000,000 | $6,999,724 | |
| Shares | Value | ||
| Municipal Bond Funds – 0.7% | |||
| Nuveen AMT-Free Quality Municipal Income Fund Preferred Shares 1.77%(a) | 5,000,000 | 5,000,000 | |
| Nuveen California AMT-Free Quality Municipal Income Fund Preferred Shares 1.72%(a) | 9,400,000 | 9,400,000 | |
| Nuveen NY AMT-Free Quality Municipal Income Fund Preferred Shares 1.72%(a) | 6,800,000 | 6,800,000 | |
| TOTAL MUNICIPAL BOND FUNDS | |||
| (Cost $21,200,000) | 21,200,000 | ||
| Shares | Value | ||
| Money Market Funds - 15.5% | |||
| Fidelity Investments Money Market Government Portfolio Institutional Class 2.31% (i)(j) | 200,078,086 | 200,078,086 | |
| Fidelity Municipal Cash Central Fund, 1.82% (k)(l) | 45,527,447 | 45,532,000 | |
| Fidelity SAI Municipal Money Market Fund, 1.19% (i)(j) | 281,734,178 | 281,762,299 | |
| State Street Institutional U.S. Government Money Market Fund Premier Class 2.32% (i) | 1,221,454 | 1,221,454 | |
| TOTAL MONEY MARKET FUNDS | |||
| (Cost $528,556,858) | 528,593,839 | ||
| TOTAL INVESTMENT IN SECURITIES - 101.4% | |||
| (Cost $3,454,684,060) | 3,463,640,032 | ||
| NET OTHER ASSETS (LIABILITIES) - (1.4)% | (47,763,402) | ||
| NET ASSETS - 100% | $3,415,876,630 |
Security Type Abbreviations
VRDN – VARIABLE RATE DEMAND NOTE (A debt instrument that is payable upon demand, either daily, weekly or monthly)
CP – COMMERCIAL PAPER
Legend
(a) Coupon rates for floating and adjustable rate securities reflect the rates in effect at period end.
(b) Security or a portion of the security purchased on a delayed delivery or when-issued basis.
(c) Private activity obligations whose interest is subject to the federal alternative minimum tax for individuals.
(d) Security exempt from registration under Rule 144A of the Securities Act of 1933. These securities may be resold in transactions exempt from registration, normally to qualified institutional buyers. At the end of the period, the value of these securities amounted to $65,533,722 or 1.9% of net assets.
(e) Coupon is indexed to a floating interest rate which may be multiplied by a specified factor and/or subject to caps or floors.
(f) Provides evidence of ownership in one or more underlying municipal bonds.
(g) Coupon rates are determined by re-marketing agents based on current market conditions.
(h) Restricted securities - Investment in securities not registered under the Securities Act of 1933 (excluding 144A issues). At the end of the period, the value of restricted securities (excluding 144A issues) amounted to $33,400,000 or 1.0% of net assets.
(i) The rate quoted is the annualized seven-day yield of the fund at period end.
(j) Affiliated Fund
(k) Information in this report regarding holdings by state and security types does not reflect the holdings of the Fidelity Municipal Cash Central Fund.
(l) Affiliated fund that is available only to investment companies and other accounts managed by Fidelity Investments. The rate quoted is the annualized seven-day yield of the fund at period end. A complete unaudited listing of the fund's holdings as of its most recent quarter end is available upon request. In addition, each Fidelity Central Fund's financial statements, which are not covered by the Fund's Report of Independent Registered Public Accounting Firm, are available on the SEC's website or upon request.
Additional information on each restricted holding is as follows:
| Security | Acquisition Date | Acquisition Cost |
| Baltimore Proj. Rev. Bonds Series Floaters G 42, 1.62%, tender 7/1/19 (Liquidity Facility Royal Bank of Canada) | 1/2/19 | $4,500,000 |
| California Health Facilities Fing. Auth. Rev. Participating VRDN Series Floaters 013, 1.54% 7/12/19 (Liquidity Facility Barclays Bank PLC) | 2/2/18 - 2/9/18 | $2,430,000 |
| Dignity Health Participating VRDN Series 17 04, 1.54% 7/12/19 (Liquidity Facility Barclays Bank PLC) | 2/2/18 - 4/3/19 | $8,270,000 |
| Lehigh County Gen. Purp. Hosp. Rev. Participating VRDN Series Floaters 2019 003, 1.57% 7/12/19 (Liquidity Facility Barclays Bank PLC) | 1/17/19 | $8,000,000 |
| Shakopee Minn Sr Hsg. Rev. Participating VRDN Series Floaters 001, 1.72% 7/12/19 (Liquidity Facility Barclays Bank PLC) | 1/10/19 | $5,000,000 |
| Washington Econ. Dev. Fin. Auth. Rev. Participating VRDN Series Floaters 005, 1.77% 7/12/19 (Liquidity Facility Barclays Bank PLC) | 3/1/18 - 1/18/19 | $5,200,000 |
Affiliated Central Funds
Information regarding fiscal year to date income earned by the Fund from investments in Fidelity Central Funds is as follows:
| Fund | Income earned |
| Fidelity Municipal Cash Central Fund | $206,113 |
| Total | $206,113 |
Amounts in the income column in the above table include any capital gain distributions from underlying funds, which are presented in the corresponding line-item in the Statement of Operations, if applicable.
Affiliated Underlying Funds
Fiscal year to date information regarding the Fund's investments in affiliated Underlying Funds, excluding any Money Market Central Funds, is presented below. Exchanges between classes of the same affiliated Underlying Funds may occur.
| Affiliate | Value, beginning of period | Purchases | Sales Proceeds | Dividend Income | Realized Gain (loss) | Change in Unrealized appreciation (depreciation) | Value, end of period |
| Fidelity Investments Money Market Government Portfolio Institutional Class 2.31% | $188,320,059 | $319,095,951 | $307,337,924 | $3,006,503 | $-- | $-- | $200,078,086 |
| Fidelity SAI Municipal Money Market Fund, 1.19% | 316,565,589 | 101,683,696 | 136,490,298 | 5,250,857 | 4,056 | (744) | 281,762,299 |
| Total | $504,885,648 | $420,779,647 | $443,828,222 | $8,257,360 | $4,056 | $(744) | $481,840,385 |
Amounts in the income column in the above table include any capital gain distributions from underlying funds, which are presented in the corresponding line-item in the Statement of Operations, if applicable.
Investment Valuation
The following is a summary of the inputs used, as of May 31, 2019, involving the Fund's assets and liabilities carried at fair value. The inputs or methodology used for valuing securities may not be an indication of the risk associated with investing in those securities. For more information on valuation inputs, and their aggregation into the levels used below, please refer to the Investment Valuation section in the accompanying Notes to Financial Statements.
| Valuation Inputs at Reporting Date: | ||||
| Description | Total | Level 1 | Level 2 | Level 3 |
| Investments in Securities: | ||||
| Municipal Securities | $2,906,846,469 | $-- | $2,906,846,469 | $-- |
| Money Market Funds | 528,593,839 | 528,593,839 | -- | -- |
| Commercial Paper | 6,999,724 | -- | 6,999,724 | -- |
| Investment Companies | 21,200,000 | -- | 21,200,000 | -- |
| Total Investments in Securities: | $3,463,640,032 | $528,593,839 | $2,935,046,193 | $-- |
See accompanying notes which are an integral part of the financial statements.
Financial Statements
Statement of Assets and Liabilities
| May 31, 2019 | ||
| Assets | ||
| Investment in securities, at value — See accompanying schedule: Unaffiliated issuers (cost $2,927,348,649) | $2,936,267,647 | |
| Fidelity Central Funds (cost $45,532,000) | 45,532,000 | |
| Other affiliated issuers (cost $481,803,411) | 481,840,385 | |
| Total Investment in Securities (cost $3,454,684,060) | $3,463,640,032 | |
| Cash | 6,963,411 | |
| Receivable for investments sold | 4,813,241 | |
| Receivable for fund shares sold | 3,348,501 | |
| Dividends receivable | 774,614 | |
| Interest receivable | 26,407,018 | |
| Distributions receivable from Fidelity Central Funds | 62,563 | |
| Prepaid expenses | 11,908 | |
| Other receivables | 4,045 | |
| Total assets | 3,506,025,333 | |
| Liabilities | ||
| Payable for investments purchased | ||
| Regular delivery | $7,900,893 | |
| Delayed delivery | 73,567,437 | |
| Payable for fund shares redeemed | 3,219,378 | |
| Distributions payable | 4,989,414 | |
| Accrued management fee | 237,301 | |
| Other affiliated payables | 48,626 | |
| Other payables and accrued expenses | 185,654 | |
| Total liabilities | 90,148,703 | |
| Net Assets | $3,415,876,630 | |
| Net Assets consist of: | ||
| Paid in capital | $3,406,873,812 | |
| Total distributable earnings (loss) | 9,002,818 | |
| Net Assets, for 340,669,761 shares outstanding | $3,415,876,630 | |
| Net Asset Value, offering price and redemption price per share ($3,415,876,630 ÷ 340,669,761 shares) | $10.03 |
See accompanying notes which are an integral part of the financial statements.
Statement of Operations
| Year ended May 31, 2019 | ||
| Investment Income | ||
| Dividends: | ||
| Affiliated issuers | $8,257,360 | |
| Interest | 53,665,901 | |
| Income from Fidelity Central Funds | 206,113 | |
| Total income | 62,129,374 | |
| Expenses | ||
| Management fee | $11,130,409 | |
| Transfer agent fees | 220,875 | |
| Accounting fees and expenses | 572,613 | |
| Custodian fees and expenses | 43,777 | |
| Independent trustees' fees and expenses | 38,449 | |
| Registration fees | 185,762 | |
| Audit | 70,454 | |
| Legal | 11,189 | |
| Miscellaneous | 29,614 | |
| Total expenses before reductions | 12,303,142 | |
| Expense reductions | (8,402,074) | |
| Total expenses after reductions | 3,901,068 | |
| Net investment income (loss) | 58,228,306 | |
| Realized and Unrealized Gain (Loss) | ||
| Net realized gain (loss) on: | ||
| Investment securities: | ||
| Unaffiliated issuers | 266,136 | |
| Affiliated issuers | 4,056 | |
| Total net realized gain (loss) | 270,192 | |
| Change in net unrealized appreciation (depreciation) on: | ||
| Investment securities: | ||
| Unaffiliated issuers | 11,365,983 | |
| Affiliated issuers | (744) | |
| Total change in net unrealized appreciation (depreciation) | 11,365,239 | |
| Net gain (loss) | 11,635,431 | |
| Net increase (decrease) in net assets resulting from operations | $69,863,737 |
See accompanying notes which are an integral part of the financial statements.
Statement of Changes in Net Assets
| Year ended May 31, 2019 | For the period December 28, 2017 (commencement of operations) to May 31, 2018 |
|
| Increase (Decrease) in Net Assets | ||
| Operations | ||
| Net investment income (loss) | $58,228,306 | $14,354,933 |
| Net realized gain (loss) | 270,192 | 421,325 |
| Change in net unrealized appreciation (depreciation) | 11,365,239 | (2,409,267) |
| Net increase (decrease) in net assets resulting from operations | 69,863,737 | 12,366,991 |
| Distributions to shareholders | (58,929,136) | – |
| Distributions to shareholders from net investment income | – | (14,280,034) |
| Total distributions | (58,929,136) | (14,280,034) |
| Share transactions | ||
| Proceeds from sales of shares | 1,046,812,103 | 3,425,934,174 |
| Reinvestment of distributions | 3,887,466 | 1,205,214 |
| Cost of shares redeemed | (864,875,731) | (206,108,154) |
| Net increase (decrease) in net assets resulting from share transactions | 185,823,838 | 3,221,031,234 |
| Total increase (decrease) in net assets | 196,758,439 | 3,219,118,191 |
| Net Assets | ||
| Beginning of period | 3,219,118,191 | – |
| End of period | $3,415,876,630 | $3,219,118,191 |
| Other Information | ||
| Undistributed net investment income end of period | $72,416 | |
| Shares | ||
| Sold | 104,689,689 | 342,618,277 |
| Issued in reinvestment of distributions | 388,671 | 120,636 |
| Redeemed | (86,524,339) | (20,623,173) |
| Net increase (decrease) | 18,554,021 | 322,115,740 |
See accompanying notes which are an integral part of the financial statements.
Financial Highlights
Strategic Advisers Tax-Sensitive Short Duration Fund
| Years ended May 31, | 2019 | 2018 A |
| Selected Per–Share Data | ||
| Net asset value, beginning of period | $9.99 | $10.00 |
| Income from Investment Operations | ||
| Net investment income (loss)B | .174 | .053 |
| Net realized and unrealized gain (loss) | .042 | (.014) |
| Total from investment operations | .216 | .039 |
| Distributions from net investment income | (.173) | (.049) |
| Distributions from net realized gain | (.003) | – |
| Total distributions | (.176) | (.049) |
| Net asset value, end of period | $10.03 | $9.99 |
| Total ReturnC,D | 2.19% | .39% |
| Ratios to Average Net AssetsE,F | ||
| Expenses before reductions | .37% | .52%G |
| Expenses net of fee waivers, if any | .12% | .26%G,H |
| Expenses net of all reductions | .12% | .26%G,H |
| Net investment income (loss) | 1.74% | 1.28%G |
| Supplemental Data | ||
| Net assets, end of period (000 omitted) | $3,415,877 | $3,219,118 |
| Portfolio turnover rateI | 57% | 180%J |
A For the period December 28, 2017 (commencement of operations) to May 31, 2018.
B Calculated based on average shares outstanding during the period.
C Total returns for periods of less than one year are not annualized.
D Total returns would have been lower if certain expenses had not been reduced during the applicable periods shown.
E Fees and expenses of any underlying Fidelity Central Funds are not included in the Fund's expense ratio. The Fund indirectly bears its proportionate share of the expenses of any underlying Fidelity Central Funds.
F Expense ratios reflect operating expenses of the Fund. Expenses before reductions do not reflect amounts reimbursed by the investment adviser or reductions from expense offset arrangements and do not represent the amount paid by the Fund during periods when reimbursements or reductions occur. Expense ratios before reductions for start-up periods may not be representative of longer term operating periods. Expenses net of fee waivers reflect expenses after reimbursement by the investment adviser but prior to reductions from expense offset arrangements. Expenses net of all reductions represent the net expenses paid by the Fund. Fees and expenses of the Underlying Funds are not included in the Fund's annualized ratios. The Fund indirectly bears its proportionate share of the expenses of the Underlying Funds.
G Annualized
H Audit fees are not annualized.
I Amount does not include the portfolio activity of any Underlying Funds.
J Amount not annualized.
See accompanying notes which are an integral part of the financial statements.
Notes to Financial Statements
For the period ended May 31, 2019
1. Organization.
Strategic Advisers Tax-Sensitive Short Duration Fund (the Fund) is a fund of Fidelity Rutland Square Trust II (the Trust), and is authorized to issue an unlimited number of shares. The Trust is registered under the Investment Company Act of 1940, as amended (the 1940 Act), as an open-end management investment company organized as a Delaware statutory trust. The Fund is offered exclusively to certain clients of Strategic Advisers LLC (Strategic Advisers), an affiliate of Fidelity Management & Research Company (FMR).
2. Significant Accounting Policies.
The Fund is an investment company and applies the accounting and reporting guidance of the Financial Accounting Standards Board (FASB) Accounting Standards Codification Topic 946 Financial Services – Investments Companies. The financial statements have been prepared in conformity with accounting principles generally accepted in the United States of America (GAAP), which require management to make certain estimates and assumptions at the date of the financial statements. Actual results could differ from those estimates. Subsequent events, if any, through the date that the financial statements were issued have been evaluated in the preparation of the financial statements. The following summarizes the significant accounting policies of the Fund:
Investment Valuation. Investments are valued as of 4:00 p.m. Eastern time on the last calendar day of the period. The Board of Trustees (the Board) has delegated the day to day responsibility for the valuation of the Fund's investments to the Fair Value Committee (the Committee) established by the Fund's investment adviser. In accordance with valuation policies and procedures approved by the Board, the Fund attempts to obtain prices from one or more third party pricing vendors or brokers to value its investments. When current market prices, quotations or currency exchange rates are not readily available or reliable, investments will be fair valued in good faith by the Committee, in accordance with procedures adopted by the Board. Factors used in determining fair value vary by investment type and may include market or investment specific events, changes in interest rates and credit quality. The frequency with which these procedures are used cannot be predicted and they may be utilized to a significant extent. The Committee oversees the Fund's valuation policies and procedures and reports to the Board on the Committee's activities and fair value determinations. The Board monitors the appropriateness of the procedures used in valuing the Fund's investments and ratifies the fair value determinations of the Committee.
The Fund categorizes the inputs to valuation techniques used to value its investments into a disclosure hierarchy consisting of three levels as shown below:
- Level 1 – quoted prices in active markets for identical investments
- Level 2 – other significant observable inputs (including quoted prices for similar investments, interest rates, prepayment speeds, etc.)
- Level 3 – unobservable inputs (including the Fund's own assumptions based on the best information available)
Valuation techniques used to value the Fund's investments by major category are as follows:
Debt securities, including restricted securities, are valued based on evaluated prices received from third party pricing vendors or from brokers who make markets in such securities. Municipal securities and commercial paper are valued by pricing vendors who utilize matrix pricing which considers yield or price of bonds of comparable quality, coupon, maturity and type or by broker-supplied prices. When independent prices are unavailable or unreliable, debt securities may be valued utilizing pricing methodologies which consider similar factors that would be used by third party pricing vendors. Debt securities are generally categorized as Level 2 in the hierarchy but may be Level 3 depending on the circumstances.
Investments in open-end mutual funds, including the Fidelity Central Funds, are valued at their closing net asset value (NAV) each business day and are categorized as Level 1 in the hierarchy. If an unaffiliated open-end mutual fund's NAV is unavailable, shares of that fund may be valued by another method that the Board believes reflects fair value in accordance with the Board's fair value pricing policies and is categorized as Level 2 in the hierarchy.
Changes in valuation techniques may result in transfers in or out of an assigned level within the disclosure hierarchy. The aggregate value of investments by input level as of May 31, 2019 is included at the end of the Fund's Schedule of Investments.
Investment Transactions and Income. For financial reporting purposes, the Fund's investment holdings and NAV include trades executed through the end of the last business day of the period. The NAV per share for processing shareholder transactions is calculated as of the close of business of the New York Stock Exchange (NYSE), normally 4:00 p.m. Eastern time and includes trades executed through the end of the prior business day. Gains and losses on securities sold are determined on the basis of identified cost. Dividend income is recorded on the ex-dividend date, except for certain dividends from foreign securities where the ex-dividend date may have passed, which are recorded as soon as the Fund is informed of the ex-dividend date. Non-cash dividends included in dividend income, if any, are recorded at the fair market value of the securities received. Income and capital gain distributions from Fidelity Central Funds, if any, are recorded on the ex-dividend date. Income and capital gain distributions from Underlying Funds, if any, are recorded on the ex-dividend date. Interest income is accrued as earned and includes coupon interest and amortization of premium and accretion of discount on debt securities as applicable. Debt obligations may be placed on non-accrual status and related interest income may be reduced by ceasing current accruals and writing off interest receivables when the collection of all or a portion of interest has become doubtful based on consistently applied procedures. A debt obligation is removed from non-accrual status when the issuer resumes interest payments or when collectability of interest is reasonably assured.
Expenses. Expenses directly attributable to a fund are charged to that fund. Expenses attributable to more than one fund are allocated among the respective funds on the basis of relative net assets or other appropriate methods. Expense estimates are accrued in the period to which they relate and adjustments are made when actual amounts are known.
Deferred Trustee Compensation. Under a Deferred Compensation Plan (the Plan), certain independent Trustees have elected to defer receipt of a portion of their annual compensation. Deferred amounts are invested in a cross-section of Strategic Advisers funds, are marked-to-market and remain in the Fund until distributed in accordance with the Plan. The investment of deferred amounts and the offsetting payable to the Trustees of $4,044 are included in the accompanying Statement of Assets and Liabilities in other receivables and other payables and accrued expenses, respectively.
Income Tax Information and Distributions to Shareholders. Each year, the Fund intends to qualify as a regulated investment company under Subchapter M of the Internal Revenue Code, including distributing substantially all of its taxable income and realized gains. As a result, no provision for U.S. Federal income taxes is required. As of May 31, 2019, the Fund did not have any unrecognized tax benefits in the financial statements; nor is the Fund aware of any tax positions for which it is reasonably possible that the total amounts of unrecognized tax benefits will significantly change in the next twelve months. The Fund files a U.S. federal tax return, in addition to state and local tax returns as required. The Fund's federal income tax returns are subject to examination by the Internal Revenue Service (IRS) for a period of three fiscal years after they are filed. State and local tax returns may be subject to examination for an additional fiscal year depending on the jurisdiction.
Distributions are declared and recorded daily and paid monthly from net investment income. Distributions from realized gains, if any, are declared and recorded on the ex-dividend date. Income and capital gain distributions are determined in accordance with income tax regulations, which may differ from GAAP. In addition, the Fund claimed a portion of the payment made to redeeming shareholders as a distribution for income tax purposes.
Capital accounts within the financial statements are adjusted for permanent book-tax differences. These adjustments have no impact on net assets or the results of operations. Capital accounts are not adjusted for temporary book-tax differences which will reverse in a subsequent period.
Book-tax differences are primarily due to market discount, deferred trustees compensation and losses deferred due to wash sales.
As of period end, the cost and unrealized appreciation (depreciation) in securities, and derivatives if applicable, for federal income tax purposes were as follows:
| Gross unrealized appreciation | $9,315,535 |
| Gross unrealized depreciation | (245,359) |
| Net unrealized appreciation (depreciation) | $9,070,176 |
| Tax Cost | $3,454,569,856 |
The tax-based components of distributable earnings as of period end were as follows:
| Net unrealized appreciation (depreciation) on securities and other investments | $9,070,176 |
The tax character of distributions paid was as follows:
| May 31, 2019 | May 31, 2018(a) | |
| Tax-exempt Income | $55,077,316 | $14,280,034 |
| Ordinary Income | 3,851,820 | – |
| Total | $58,929,136 | $ 14,280,034 |
(a) For the period December 28, 2017 (commencement of operations) to May 31, 2018.
Delayed Delivery Transactions and When-Issued Securities. During the period, the Fund transacted in securities on a delayed delivery or when-issued basis. Payment and delivery may take place after the customary settlement period for that security. The price of the underlying securities and the date when the securities will be delivered and paid for are fixed at the time the transaction is negotiated. The securities purchased on a delayed delivery or when-issued basis are identified as such in the Fund's Schedule of Investments. The Fund may receive compensation for interest forgone in the purchase of a delayed delivery or when-issued security. With respect to purchase commitments, the Fund identifies securities as segregated in its records with a value at least equal to the amount of the commitment. Losses may arise due to changes in the value of the underlying securities or if the counterparty does not perform under the contract's terms, or if the issuer does not issue the securities due to political, economic, or other factors.
Restricted Securities. The Fund may invest in securities that are subject to legal or contractual restrictions on resale. These securities generally may be resold in transactions exempt from registration or to the public if the securities are registered. Disposal of these securities may involve time-consuming negotiations and expense, and prompt sale at an acceptable price may be difficult. Information regarding restricted securities is included at the end of the Fund's Schedule of Investments.
New Rule Issuance. During August 2018, the U.S. Securities and Exchange Commission issued Final Rule Release No. 33-10532, Disclosure Update and Simplification. This Final Rule includes amendments specific to registered investment companies that are intended to eliminate overlap in disclosure requirements between Regulation S-X and GAAP. In accordance with these amendments, certain line-items in the Fund's financial statements have been combined or removed for the current period as outlined in the table below.
| Financial Statement | Current Line-Item Presentation (As Applicable) | Prior Line-Item Presentation (As Applicable) |
| Statement of Assets and Liabilities | Total distributable earnings (loss) | Undistributed/Distributions in excess of/Accumulated net investment income (loss) Accumulated/Undistributed net realized gain (loss) Net unrealized appreciation (depreciation) |
| Statement of Changes in Net Assets | N/A - removed | Undistributed/Distributions in excess of/Accumulated net investment income (loss) end of period |
| Statement of Changes in Net Assets | Distributions to shareholders | Distributions to shareholders from net investment income Distributions to shareholders from net realized gain |
3. Purchases and Sales of Investments.
Purchases and sales of securities (including the Underlying Fund shares), other than short-term securities, aggregated $2,023,139,767 and $1,344,441,911, respectively.
Prior Fiscal Year Reallocation of Underlying Fund Investments. During the prior period, the investment adviser reallocated investments of the Fund. This involved a taxable redemption of the Fund's interest in Wells Fargo Advantage Ultra Short-Term Municipal Income Funds Administrator Class. The Fund redeemed 106,452,587 shares of Wells Fargo Advantage Ultra Short-Term Municipal Income Fund Administrator Class in exchange for investments, including accrued interest, and cash with a value of $1,018,092,361. The Fund had net realized gain of $150,618 on the Fund's redemptions of Wells Fargo Advantage Ultra Short-Term Municipal Income Fund Administrator Class shares.
4. Fees and Other Transactions with Affiliates.
Management Fee. Strategic Advisers (the investment adviser) provides the Fund with investment management related services. For these services, the Fund pays a monthly management fee to the investment adviser. The management fee is calculated by adding the annual management fee rate of .25% of the Fund's average net assets throughout the month payable to the investment adviser to the aggregate of the fee rates, payable monthly, to the Fund's sub-advisers. The Fund's maximum aggregate management fee will not exceed .55% of the Fund's average net assets. For the reporting period, the total annualized management fee rate was .33% of the Fund's average net assets.
During the period, the investment adviser waived its management fee as described in the Expense Reductions note.
Sub-Advisers. FIAM LLC (an affiliate of the investment adviser), T. Rowe Price Associates, Inc. and Wells Capital Management, Inc. each served as a sub-adviser for the Fund during the period. Sub-advisers provide discretionary investment advisory services for their allocated portion of the Fund's assets and are paid by the investment adviser and not the Fund for providing these services.
Transfer Agent Fees. Fidelity Investments Institutional Operations Company, Inc. (FIIOC), an affiliate of the investment adviser, is the Fund's transfer, dividend disbursing and shareholder servicing agent. Effective July 1, 2018 transfer agent fees are not paid by the Fund and are instead paid by the investment adviser or an affiliate. Prior to July 1, 2018 FIIOC received account fees and asset-based fees that varied according to account size and type of account. The Fund did not directly pay transfer agent fees with respect to the portion of its assets invested in Underlying Funds. FIIOC paid for typesetting, printing and mailing of shareholder reports, except proxy statements. For the period, the transfer agent fees were equivalent to an annualized rate of .01% of average net assets.
Accounting and Security Lending Fees. Fidelity Service Company, Inc. (FSC), an affiliate of the investment adviser, maintains the Fund's accounting records. The accounting fee is based on the level of average net assets for each month. Prior to April 1, 2019, FSC had a separate agreement with the Fund for administration of the security lending program, based on the number and duration of lending transactions. For the period, the total fees paid for accounting and administration of securities lending were equivalent to an annual rate of .02%.
During June 2019, the Board approved that effective July 1, 2019 accounting fees will not be paid by the Fund and will instead be paid by the investment adviser or an affiliate.
Interfund Trades. The Fund may purchase from or sell securities to other funds affiliated with each sub-adviser under procedures adopted by the Board. The procedures have been designed to ensure these interfund trades are executed in accordance with Rule 17a-7 of the 1940 Act. Interfund trades are included within the respective purchases and sales amounts shown in the Purchases and Sales of Investments note.
Prior Fiscal Year Reallocation of Underlying Fund Investments. During the prior period, the investment adviser reallocated investments of the Fund. This involved taxable redemptions of the Fund's interest in Underlying Fidelity Funds, see table below, in exchange for investments and cash, including accrued interest, totaling $624,833,525. The Fund had net realized gain of $330,903 on the redemptions of Underlying Fidelity Funds.
| Underlying Fidelity Funds | Shares Redeemed | Value of Investments and Cash, including Accrued Interest Exchanged | Net Realized gain (loss) |
| Fidelity Limited Term Municipal Income Fund | 6,984,147 | $73,333,542 | $(66,508) |
| Fidelity Conservative Income Municipal Bond Fund Institutional Class | 55,039,919 | 551,499,983 | 397,411 |
| Total | 62,024,066 | $624,833,525 | $330,903 |
5. Investments in Fidelity Central Funds.
The Fund invests in Fidelity Central Funds, which are open-end investment companies available only to other investment companies and accounts managed by the investment adviser and its affiliates. The Fund's Schedule of Investments lists each of the Fidelity Central Funds held as of period end, if any, as an investment of the Fund, but does not include the underlying holdings of each Fidelity Central Fund. As an Investing Fund, the Fund indirectly bears its proportionate share of the expenses of the underlying Fidelity Central Funds.
The Fidelity Money Market Central Funds are managed by Fidelity Investments Money Management, Inc. (FIMM), an affiliate of the investment adviser. Annualized expenses of the Money Market Central Funds as of their most recent shareholder report date ranged from less than .005% to .01%.
A complete unaudited list of holdings for each Fidelity Central Fund is available upon request or at the Securities and Exchange Commission (the SEC) website at www.sec.gov. In addition, the financial statements of the Fidelity Central Funds, which are not covered by the Fund's Report of Independent Registered Public Accounting Firm, are available on the SEC website or upon request.
6. Committed Line of Credit.
The Fund participates with other funds managed by the investment adviser or an affiliate in a $4.25 billion credit facility (the "line of credit") to be utilized for temporary or emergency purposes to fund shareholder redemptions or for other short-term liquidity purposes. The Fund has agreed to pay commitment fees on its pro-rata portion of the line of credit, which amounted to $8,987 and is reflected in Miscellaneous expenses on the Statement of Operations. During the period, the Fund did not borrow on this line of credit.
7. Expense Reductions.
The investment adviser has contractually agreed to waive the Fund's management fee in an amount equal to .25% of the Fund's average net assets until September 30, 2022. During the period, this waiver reduced the Fund's management fee by $ 8,351,165.
In addition, through arrangements with the Fund's custodian, credits realized as a result of certain uninvested cash balances were used to reduce the Fund's expenses. During the period, these credits reduced the Fund's expenses by $50,909.
8. Other.
The Fund's organizational documents provide former and current trustees and officers with a limited indemnification against liabilities arising in connection with the performance of their duties to the Fund. In the normal course of business, the Fund may also enter into contracts that provide general indemnifications. The Fund's maximum exposure under these arrangements is unknown as this would be dependent on future claims that may be made against the Fund. The risk of material loss from such claims is considered remote.
The Fund does not invest in the Underlying Funds for the purpose of exercising management or control; however, investments by the Fund within its principal investment strategies may represent a significant portion of an Underlying Fund's net assets. At the end of the period, the Fund was the owner of record of approximately 100% of the total outstanding shares of Fidelity SAI Municipal Money Market Fund.
Report of Independent Registered Public Accounting Firm
To the Board of Trustees of Fidelity Rutland Square Trust II and Shareholders of Strategic Advisers Tax-Sensitive Short Duration Fund:
Opinion on the Financial Statements
We have audited the accompanying statement of assets and liabilities, including the schedule of investments, of Strategic Advisers Tax-Sensitive Short Duration Fund (one of the funds constituting Fidelity Rutland Square Trust II, referred to hereafter as the “Fund”) as of May 31, 2019, the related statement of operations for the year ended May 31, 2019 and the statement of changes in net assets and the financial highlights for the year ended May 31, 2019 and for the period December 28, 2017 (commencement of operations) through May 31, 2018, including the related notes (collectively referred to as the “financial statements”). In our opinion, the financial statements present fairly, in all material respects, the financial position of the Fund as of May 31, 2019, the results of its operations for the year ended May 31, 2019, and the changes in its net assets and the financial highlights for the year ended May 31, 2019 and for the period December 28, 2017 (commencement of operations) through May 31, 2018 in conformity with accounting principles generally accepted in the United States of America.
Basis for Opinion
These financial statements are the responsibility of the Fund’s management. Our responsibility is to express an opinion on the Fund’s financial statements based on our audits. We are a public accounting firm registered with the Public Company Accounting Oversight Board (United States) (PCAOB) and are required to be independent with respect to the Fund in accordance with the U.S. federal securities laws and the applicable rules and regulations of the Securities and Exchange Commission and the PCAOB.
We conducted our audits of these financial statements in accordance with the standards of the PCAOB. Those standards require that we plan and perform the audit to obtain reasonable assurance about whether the financial statements are free of material misstatement, whether due to error or fraud.
Our audits included performing procedures to assess the risks of material misstatement of the financial statements, whether due to error or fraud, and performing procedures that respond to those risks. Such procedures included examining, on a test basis, evidence regarding the amounts and disclosures in the financial statements. Our audits also included evaluating the accounting principles used and significant estimates made by management, as well as evaluating the overall presentation of the financial statements. Our procedures included confirmation of securities owned as of May 31, 2019 by correspondence with the custodian and brokers; when replies were not received from brokers, we performed other auditing procedures. We believe that our audits provide a reasonable basis for our opinion.
PricewaterhouseCoopers LLP
Boston, Massachusetts
July 16, 2019
We have served as the auditor of one or more investment companies in the Fidelity group of funds since 1932.
Trustees and Officers
The Trustees, Members of the Advisory Board (if any), and officers of the trust and fund, as applicable, are listed below. The Board of Trustees governs the fund and is responsible for protecting the interests of shareholders. The Trustees are experienced executives who meet periodically throughout the year to oversee the fund's activities, review contractual arrangements with companies that provide services to the fund, oversee management of the risks associated with such activities and contractual arrangements, and review the fund's performance. If the interests of the fund and an underlying Fidelity® fund were to diverge, a conflict of interest could arise and affect how the Trustees and Members of the Advisory Board fulfill their fiduciary duties to the affected funds. Strategic Advisers has structured the fund to avoid these potential conflicts, although there may be situations where a conflict of interest is unavoidable. In such instances, Strategic Advisers, the Trustees, and Members of the Advisory Board would take reasonable steps to minimize and, if possible, eliminate the conflict. Each of the Trustees oversees 14 funds.
The Trustees hold office without limit in time except that (a) any Trustee may resign; (b) any Trustee may be removed by written instrument, signed by at least two-thirds of the number of Trustees prior to such removal; (c) any Trustee who requests to be retired or who has become incapacitated by illness or injury may be retired by written instrument signed by a majority of the other Trustees; and (d) any Trustee may be removed at any special meeting of shareholders by a two-thirds vote of the outstanding voting securities of the trust. Officers and Advisory Board Members hold office without limit in time, except that any officer or Advisory Board Member may resign or may be removed by a vote of a majority of the Trustees at any regular meeting or any special meeting of the Trustees. Except as indicated, each individual has held the office shown or other offices in the same company for the past five years.
Each Trustee who is not an interested person (as defined in the 1940 Act) of the trust and the fund is referred to herein as an Independent Trustee.
The fund’s Statement of Additional Information (SAI) includes more information about the Trustees. To request a free copy, call Fidelity at 1-800-544-3455.
Experience, Skills, Attributes, and Qualifications of the Trustees. The Governance and Nominating Committee has adopted a statement of policy that describes the experience, qualifications, attributes, and skills that are necessary and desirable for potential Independent Trustee candidates (Statement of Policy). The Board believes that each Trustee satisfied at the time he or she was initially elected or appointed a Trustee, and continues to satisfy, the standards contemplated by the Statement of Policy. The Governance and Nominating Committee may also engage professional search firms to help identify potential Independent Trustee candidates with experience, qualifications, attributes, and skills consistent with the Statement of Policy. Additional criteria based on the composition and skills of the current Independent Trustees, as well as experience or skills that may be appropriate in light of future changes to board composition, business conditions, and regulatory or other developments, may be considered by the professional search firms and the Governance and Nominating Committee. In addition, the Board takes into account the Trustees' commitment and participation in Board and committee meetings, as well as their leadership of standing and ad hoc committees throughout their tenure.
In determining that a particular Trustee was and continues to be qualified to serve as a Trustee, the Board has considered a variety of criteria, none of which, in isolation, was controlling. The Board believes that, collectively, the Trustees have balanced and diverse experience, qualifications, attributes, and skills, which allow the Board to operate effectively in governing the fund and protecting the interests of shareholders. Information about the specific experience, skills, attributes, and qualifications of each Trustee, which in each case led to the Board's conclusion that the Trustee should serve (or continue to serve) as a trustee of the fund, is provided below.
Board Structure and Oversight Function. Robert A. Lawrence is an interested person and currently serves as Chairman. The Trustees have determined that an interested Chairman is appropriate and benefits shareholders because an interested Chairman has a personal and professional stake in the quality and continuity of services provided to the fund. Independent Trustees exercise their informed business judgment to appoint an individual of their choosing to serve as Chairman, regardless of whether the Trustee happens to be independent or a member of management. The Independent Trustees have determined that they can act independently and effectively without having an Independent Trustee serve as Chairman and that a key structural component for assuring that they are in a position to do so is for the Independent Trustees to constitute a substantial majority for the Board. The Independent Trustees also regularly meet in executive session. Mary C. Farrell serves as the lead Independent Trustee and as such (i) acts as a liaison between the Independent Trustees and management with respect to matters important to the Independent Trustees and (ii) with management prepares agendas for Board meetings.
Fidelity® funds are overseen by different Boards of Trustees. The fund's Board oversees asset allocation funds. Other Boards oversee Fidelity's investment-grade bond, money market, and asset allocation funds, and Fidelity's equity and high income funds. The fund may invest in Fidelity® funds overseen by such other Boards. The use of separate Boards, each with its own committee structure, allows the Trustees of each group of Fidelity® funds to focus on the unique issues of the funds they oversee, including common research, investment, and operational issues.
The Trustees primarily operate as a full Board, but also operate in committees, to facilitate the timely and efficient consideration of all matters of importance to the Trustees, the fund, and fund shareholders and to facilitate compliance with legal and regulatory requirements and oversight of the fund's activities and associated risks. The Board has charged Strategic Advisers and its affiliates with (i) identifying events or circumstances the occurrence of which could have demonstrably adverse effects on the fund's business and/or reputation; (ii) implementing processes and controls to lessen the possibility that such events or circumstances occur or to mitigate the effects of such events or circumstances if they do occur; and (iii) creating and maintaining a system designed to evaluate continuously business and market conditions in order to facilitate the identification and implementation processes described in (i) and (ii) above. Because the day-to-day operations and activities of the fund are carried out by or through Strategic Advisers, its affiliates and other service providers, the fund's exposure to risks is mitigated but not eliminated by the processes overseen by the Trustees. Board oversight of different aspects of the fund's activities is exercised primarily through the full Board, but also through the Audit and Compliance Committee. Appropriate personnel, including but not limited to the fund's Chief Compliance Officer (CCO), FMR's internal auditor, the independent accountants, the fund's Treasurer and portfolio management personnel, make periodic reports to the Board's committees, as appropriate. The responsibilities of each standing committee, including their oversight responsibilities, are described further under "Standing Committees of the Trustees."
Interested Trustees*:
Correspondence intended for a Trustee who is an interested person may be sent to Fidelity Investments, 245 Summer Street, Boston, Massachusetts 02210.
Name, Year of Birth; Principal Occupations and Other Relevant Experience+
Brian B. Hogan (1964)
Year of Election or Appointment: 2018
Trustee
Mr. Hogan also serves as Trustee of other funds. Mr. Hogan serves as Head of Fidelity Investments’ Investment Solutions and Innovation organization (2018-present), a Director of Strategic Advisers LLC (2018-present), and a Director of Fidelity SelectCo, LLC (investment adviser firm, 2014-present). Previously, Mr. Hogan served as President of FMR Co., Inc. (2009-2018), a Vice President of Fidelity's Equity and High Income funds (2009-2018), a Director of FMR Investment Management (UK) Limited (investment adviser firm, 2015-2018), Trustee of certain Fidelity® funds (2014-2018), President of the Equity Division of FMR (investment adviser firm, 2009-2018), Senior Vice President, Equity Research of FMR (2006-2009), and as a portfolio manager. Mr. Brian B. Hogan is not related to Mr. Colm A. Hogan.
Robert A. Lawrence (1952)
Year of Election or Appointment: 2016
Trustee
Chairman of the Board of Trustees
Mr. Lawrence also serves as Trustee of other funds. Previously, Mr. Lawrence served as a Member of the Advisory Board of certain funds. Prior to his retirement in 2008, Mr. Lawrence served as Vice President of certain Fidelity® funds (2006-2008), Senior Vice President, Head of High Income Division of Fidelity Management & Research Company (investment adviser firm, 2006-2008), and President of Fidelity Strategic Investments (investment adviser firm, 2002-2005).
* Determined to be an "Interested Trustee" by virtue of, among other things, his or her affiliation with the trust or various entities under common control with Strategic Advisers.
+ The information includes the Trustee's principal occupation during the last five years and other information relating to the experience, attributes, and skills relevant to the Trustee's qualifications to serve as a Trustee, which led to the conclusion that the Trustee should serve as a Trustee for the fund.
Independent Trustees:
Correspondence intended for an Independent Trustee may be sent to Fidelity Investments, P.O. Box 55235, Boston, Massachusetts 02205-5235.
Name, Year of Birth; Principal Occupations and Other Relevant Experience+
Peter C. Aldrich (1944)
Year of Election or Appointment: 2006
Trustee
Mr. Aldrich also serves as Trustee of other funds. Mr. Aldrich is a Director of the National Bureau of Economic Research, a Director of the funds of BlackRock Realty Group (2006-present), and a Director of LivelyHood, Inc. (private corporation, 2013-present). Previously, Mr. Aldrich served as a Trustee for the Fidelity Rutland Square Trust (2005-2010), a Managing Member of Poseidon, LLC (foreign private investment, 1998-2004), and Chairman and Managing Member of AEGIS, LLC (foreign private investment, 1997-2004). Mr. Aldrich previously was a founder, Chief Executive Officer, and Chairman of AEW Capital Management, L.P. (then “Aldrich, Eastman and Waltch, L.P.”). Mr. Aldrich also served as a Director of Zipcar, Inc. (car sharing services, 2001-2009) and as Faculty Chairman of The Research Council on Global Investment of The Conference Board (business and professional education non-profit, 1999-2004). Mr. Aldrich is a Member Emeritus of the Board of Trustees of the Museum of Fine Arts Boston and an Overseer of the Massachusetts Eye and Ear Infirmary.
Ralph F. Cox (1932)
Year of Election or Appointment: 2006
Trustee
Mr. Cox also serves as Trustee of other funds. Mr. Cox is President of RABAR Enterprises (management consulting for the petroleum industry). Mr. Cox is a Director of Abraxas Petroleum (exploration and production, 1999-present). Mr. Cox is a member of the Advisory Boards of the Business and Engineering Schools of Texas A&M University and the Engineering School of University of Texas at Austin. Previously, Mr. Cox served as a Trustee for the Fidelity Rutland Square Trust (2005-2010) and as an Advisory Director of CH2M Hill Companies (engineering, 1981-2011). Mr. Ralph F. Cox and Mr. Howard E. Cox, Jr. are not related.
Mary C. Farrell (1949)
Year of Election or Appointment: 2013
Trustee
Ms. Farrell also serves as Trustee of other funds. Ms. Farrell is a Director of the W.R. Berkley Corporation (insurance provider) and President (2009-present) and Director (2006-present) of the Howard Gilman Foundation (charitable organization). Previously, Ms. Farrell was Managing Director and Chief Investment Strategist at UBS Wealth Management USA and Co-Head of UBS Wealth Management Investment Strategy & Research Group (2003-2005). Ms. Farrell also served as Investment Strategist at PaineWebber (1982-2000) and UBS PaineWebber (2000-2002). Ms. Farrell serves as Chairman of the Board of Trustees of Yale-New Haven Hospital and on the Yale New Haven Health System Board and previously served as Trustee on the Board of Overseers of the New York University Stern School of Business.
Karen Kaplan (1960)
Year of Election or Appointment: 2006
Trustee
Ms. Kaplan also serves as Trustee of other funds. Ms. Kaplan is Chairman (2014-present) and Chief Executive Officer (2013-present) of Hill Holliday (advertising and specialized marketing). Ms. Kaplan is a Director of The Michaels Companies, Inc. (specialty retailer, 2015-present), Member of the Board of Governors of the Chief Executives’ Club of Boston (2010-present), Member of the Executive Committee of the Greater Boston Chamber of Commerce (2006-present), Advisory Board Member of the National Association of Corporate Directors Chapter (2012-present), Member of the Board of Trustees of the Post Office Square Trust (2012-present), Trustee of the Brigham and Women’s Hospital (2016-present), Overseer of the Boston Symphony Orchestra (2014-present), Member of the Board of Directors of The Advertising Council, Inc. (2016-present), and Member of the Ron Burton Training Village Executive Board of Advisors (2018-present). Previously, Ms. Kaplan served as an Advisory Board Member of Fidelity Rutland Square Trust (2006-2010), a member of the Clinton Global Initiative (2010-2015), Director of DSM (dba Delta Dental and DentaQuest) (2004-2014), Formal Appointee of the 2015 Baker-Polito Economic Development Council, Director of Vera Bradley Inc. (designer of women’s accessories, 2012-2015), Member of the Board of Directors of the Massachusetts Conference for Women (2008-2015), Member of the Board of Directors of Jobs for Massachusetts (2012-2015), President of the Massachusetts Women’s Forum (2008-2010), Treasurer of the Massachusetts Women’s Forum (2002-2006), and Vice Chair of the Board of the Massachusetts Society for the Prevention of Cruelty to Children (2003-2010).
Heidi L. Steiger (1953)
Year of Election or Appointment: 2017
Trustee
Ms. Steiger also serves as Trustee of other funds. Ms. Steiger serves as a member of the Global Advisory Board and Of Counsel to Signum Global Advisors (international policy and strategy, 2018-present), a guest lecturer in the joint degree program in Global Luxury Management at North Carolina State University (Raleigh, NC) and Skema (Paris) (2018-present), Managing Partner of Topridge Associates, LLC (consulting, 2005-present), a Non-Executive Director of CrowdBureau Corporation (financial technology company and index provider, 2018-present), and a member of the Board of Directors (2013-present) and Chair of the Audit Committee and member of the Membership and Executive Committees (2017-present) of Business Executives for National Security (nonprofit). Previously, Ms. Steiger served as Eastern Region President of The Private Client Reserve of U.S. Bancorp (banking and financial services, 2010-2015), Advisory Director of Berkshire Capital Securities, LLC (financial services, 2009-2010), President and Senior Advisor of Lowenhaupt Global Advisors, LLC (financial services, 2005-2007), and President and Contributing Editor of Worth Magazine (2004-2005) and held a variety of positions at Neuberger Berman Group, LLC (financial services, 1986-2004), including Partner and Executive Vice President and Global Head of Private Asset Management at Neuberger Berman (1999-2004). Ms. Steiger also served as a member of the Board of Directors of Nuclear Electric Insurance Ltd (insurer of nuclear utilities, 2006-2017), a member of the Board of Trustees and Audit Committee of the Eaton Vance Funds (2007-2010), a member of the Board of Directors of Aviva USA (formerly AmerUs) (insurance, 2004-2014), and a member of the Board of Trustees and Audit Committee and Chair of the Investment Committee of CIFG (financial guaranty insurance, 2009-2012), and a member of the Board of Directors of Kin Group Plc (formerly, Fitbug Holdings) (health and technology, 2016-2017).
+ The information includes the Trustee's principal occupation during the last five years and other information relating to the experience, attributes, and skills relevant to the Trustee's qualifications to serve as a Trustee, which led to the conclusion that the Trustee should serve as a Trustee for the fund.
Advisory Board Members and Officers:
Correspondence intended for an officer or Howard E. Cox, Jr. may be sent to Fidelity Investments, 245 Summer Street, Boston, Massachusetts 02210. Officers appear below in alphabetical order.
Name, Year of Birth; Principal Occupation
Howard E. Cox, Jr. (1944)
Year of Election or Appointment: 2009
Member of the Advisory Board
Mr. Cox also serves as Member of the Advisory Board of other funds. Mr. Cox is a Partner of Greylock (venture capital, 1971-present) and a Director of Stryker Corporation (medical products and services, 1974-present). Previously, Mr. Cox served as an Advisory Board Member of Fidelity Rutland Square Trust (2006-2010). Mr. Cox also serves as a Member of the Secretary of Defense's Business Board of Directors (2008-present), a Director of Business Executives for National Security (1997-present), a Director of the Brookings Institution (2010-present), a Director of the World Economic Forum’s Young Global Leaders Foundation (2009-present), and is a Member of the Harvard Medical School Board of Fellows (2002-present). Mr. Howard E. Cox, Jr. and Mr. Ralph F. Cox are not related.
Elizabeth Paige Baumann (1968)
Year of Election or Appointment: 2017
Anti-Money Laundering (AML) Officer
Ms. Baumann also serves as AML Officer of other funds. She is Chief AML Officer (2012-present) and Senior Vice President (2014-present) of FMR LLC (diversified financial services company) and is an employee of Fidelity Investments. Previously, Ms. Baumann served as AML Officer of the funds (2012-2016), and Vice President (2007-2014) and Deputy Anti-Money Laundering Officer (2007-2012) of FMR LLC.
Craig S. Brown (1977)
Year of Election or Appointment: 2019
Assistant Treasurer
Mr. Brown also serves as Assistant Treasurer of other funds. Mr. Brown is an employee of Fidelity Investments (2013-present).
John J. Burke III (1964)
Year of Election or Appointment: 2018
Chief Financial Officer
Mr. Burke also serves as Chief Financial Officer of other funds. Mr. Burke serves as Head of Investment Operations for Fidelity Fund and Investment Operations (2018-present) and is an employee of Fidelity Investments (1998-present). Previously Mr. Burke served as head of Asset Management Investment Operations (2012-2018).
Jonathan Davis (1968)
Year of Election or Appointment: 2010
Assistant Treasurer
Mr. Davis also serves as Assistant Treasurer of other funds. Mr. Davis serves as Assistant Treasurer of FMR Capital, Inc. (2017-present) and is an employee of Fidelity Investments. Previously, Mr. Davis served as Vice President and Associate General Counsel of FMR LLC (diversified financial services company, 2003-2010).
Adrien E. Deberghes (1967)
Year of Election or Appointment: 2016
President and Treasurer
Mr. Deberghes also serves as an officer of other funds. He serves as Assistant Treasurer of FMR Capital, Inc. (2017-present), Executive Vice President of Fidelity Investments Money Management, Inc. (FIMM) (investment adviser firm, 2016-present), and is an employee of Fidelity Investments (2008-present). Previously, Mr. Deberghes served as President and Treasurer of certain Fidelity® funds (2013-2018). Prior to joining Fidelity Investments, Mr. Deberghes was Senior Vice President of Mutual Fund Administration at State Street Corporation (2007-2008), Senior Director of Mutual Fund Administration at Investors Bank & Trust (2005-2007), and Director of Finance for Dunkin' Brands (2000-2005). Previously, Mr. Deberghes served in other fund officer roles.
Laura M. Del Prato (1964)
Year of Election or Appointment: 2018
Assistant Treasurer
Ms. Del Prato also serves as an officer of other funds. Ms. Del Prato is an employee of Fidelity Investments (2017-present). Prior to joining Fidelity Investments, Ms. Del Prato served as a Managing Director and Treasurer of the JPMorgan Mutual Funds (2014-2017). Prior to JPMorgan, Ms. Del Prato served as a partner at Cohen Fund Audit Services (accounting firm, 2012-2013) and KPMG LLP (accounting firm, 2004-2012).
James D. Gryglewicz (1972)
Year of Election or Appointment: 2015
Chief Compliance Officer
Mr. Gryglewicz also serves as Chief Compliance Officer of other funds. Mr. Gryglewicz serves as Compliance Officer of Strategic Advisers LLC (investment adviser firm, 2015-present) and Fidelity SelectCo, LLC (investment adviser firm, 2014-present), Senior Vice President of Asset Management Compliance (2009-present), and is an employee of Fidelity Investments (2004-present). Previously, Mr. Gryglewicz served as Chief Compliance Officer of certain Fidelity® funds (2014-2018).
John Hitt (1967)
Year of Election or Appointment: 2014
Secretary and Chief Legal Officer
Mr. Hitt also serves as an officer of other funds. Mr. Hitt serves as Senior Vice President and Deputy General Counsel in Fidelity's Asset Management Group (2010-present) and is an employee of Fidelity Investments.
Colm A. Hogan (1973)
Year of Election or Appointment: 2016
Assistant Treasurer
Mr. Hogan also serves as an officer of other funds. Mr. Hogan serves as Assistant Treasurer of FMR Capital, Inc. (2017-present) and is an employee of Fidelity Investments (2005-present). Previously, Mr. Hogan served as Assistant Treasurer of certain Fidelity® funds (2016-2018). Mr. Colm A. Hogan is not related to Mr. Brian B. Hogan.
Christina H. Lee (1975)
Year of Election or Appointment: 2018
Assistant Secretary
Ms. Lee also serves as Assistant Secretary of other funds. Ms. Lee serves as Vice President, Associate General Counsel (2014-present) and is an employee of Fidelity Investments (2007-present).
Chris Maher (1972)
Year of Election or Appointment: 2016
Assistant Treasurer
Mr. Maher serves as Assistant Treasurer of other funds. Mr. Maher is Vice President of Valuation Oversight, serves as Assistant Treasurer of FMR Capital, Inc. (2017-present), and is an employee of Fidelity Investments. Previously, Mr. Maher served as Vice President of Asset Management Compliance (2013), Vice President of the Program Management Group of FMR (investment adviser firm, 2010-2013), and Vice President of Valuation Oversight (2008-2010).
Stacie M. Smith (1974)
Year of Election or Appointment: 2016
Assistant Treasurer
Ms. Smith also serves as an officer of other funds. Ms. Smith serves as Assistant Treasurer of FMR Capital, Inc. (2017-present), is an employee of Fidelity Investments (2009-present), and has served in other fund officer roles. Prior to joining Fidelity Investments, Ms. Smith served as Senior Audit Manager of Ernst & Young LLP (accounting firm, 1996-2009). Previously, Ms. Smith served as Assistant Treasurer (2013-2018) and Deputy Treasurer (2013-2016) of certain Fidelity® funds.
Marc L. Spector (1972)
Year of Election or Appointment: 2016
Assistant Treasurer
Mr. Spector also serves as an officer of other funds. Mr. Spector serves as Assistant Treasurer of FMR Capital, Inc. (2017-present) and is an employee of Fidelity Investments (2016-present). Prior to joining Fidelity Investments, Mr. Spector served as Director at the Siegfried Group (accounting firm, 2013-2016), and prior to Siegfried Group as audit senior manager at Deloitte & Touche (accounting firm, 2005-2013).
Jim Wegmann (1979)
Year of Election or Appointment: 2019
Assistant Treasurer
Mr. Wegmann also serves as Assistant Treasurer of other funds. Mr. Wegmann is an employee of Fidelity Investments (2011-present).
Shareholder Expense Example
As a shareholder of the Fund, you incur two types of costs: (1) transaction costs and (2) ongoing costs, including management fees and other Fund expenses. This Example is intended to help you understand your ongoing costs (in dollars) of investing in the Fund and to compare these costs with the ongoing costs of investing in other mutual funds.
The Example is based on an investment of $1,000 invested at the beginning of the period and held for the entire period (December 1, 2018 to May 31, 2019).
Actual Expenses
The first line of the accompanying table provides information about actual account values and actual expenses. You may use the information in this line, together with the amount you invested, to estimate the expenses that you paid over the period. Simply divide your account value by $1,000.00 (for example, an $8,600 account value divided by $1,000.00 = 8.6), then multiply the result by the number in the first line under the heading entitled "Expenses Paid During Period" to estimate the expenses you paid on your account during this period. In addition to the direct expenses incurred by the Fund presented in the table, as a shareholder of the underlying mutual funds (the Underlying Funds), the Fund also indirectly bears its proportionate share of the expenses of the Underlying Funds. In addition, the Fund, as a shareholder in the underlying Fidelity Central Funds, will indirectly bear its pro-rata share of the fees and expenses incurred by the underlying Fidelity Central Funds.
Hypothetical Example for Comparison Purposes
The second line of the accompanying table provides information about hypothetical account values and hypothetical expenses based on the Fund's actual expense ratio and an assumed rate of return of 5% per year before expenses, which is not the Fund's actual return. The hypothetical account values and expenses may not be used to estimate the actual ending account balance or expenses you paid for the period. You may use this information to compare the ongoing costs of investing in the Fund and other funds. To do so, compare this 5% hypothetical example with the 5% hypothetical examples that appear in the shareholder reports of the other funds. In addition to the direct expenses incurred by the Fund presented in the table, as a shareholder of the Underlying Funds, the Fund also indirectly bears its proportionate share of the expenses of the Underlying Funds. In addition, the Fund, as a shareholder in the underlying Fidelity Central Funds, will indirectly bear its pro-rata share of the fees and expenses incurred by the underlying Fidelity Central Funds.
Please note that the expenses shown in the table are meant to highlight your ongoing costs only and do not reflect any transaction costs. Therefore, the second line of the table is useful in comparing ongoing costs only, and will not help you determine the relative total costs of owning different funds.
| Annualized Expense Ratio-A | Beginning Account Value December 1, 2018 | Ending Account Value May 31, 2019 | Expenses Paid During Period-B December 1, 2018 to May 31, 2019 |
|
| Actual | .11% | $1,000.00 | $1,014.30 | $.55 |
| Hypothetical-C | $1,000.00 | $1,024.38 | $.56 |
A Annualized expense ratio reflects expenses net of applicable fee waivers.
B Expenses are equal to the Fund's annualized expense ratio, multiplied by the average account value over the period, multiplied by 182/365 (to reflect the one-half year period). The fees and expenses of the Underlying Funds in which the Fund invests are not included in the Fund's annualized expense ratio.
C 5% return per year before expenses
Distributions (Unaudited)
The fund hereby designates as a capital gain dividend with respect to the taxable year ended May 31, 2019, $89,503, or, if subsequently determined to be different, the net capital gain of such year.
A total of 49.18% of the dividends distributed during the fiscal year was derived from interest on U.S. Government securities which is generally exempt from state income tax.
The fund designates $1,303,619 of distributions paid during the period January 01, 2019 to May 31, 2019 as qualifying to be taxed as interest-related dividends for nonresident alien shareholders.
During fiscal year ended 2019, 100% of the fund's income dividends was free from federal income tax, and 16.72% of the fund's income dividends was subject to the federal alternative minimum tax.
The fund will notify shareholders in January 2020 of amounts for use in preparing 2019 income tax returns.
![]()
TSS-ANN-0719
1.9885904.101
|
Strategic Advisers® Fidelity® U.S. Total Stock Fund Offered exclusively to certain clients of Strategic Advisers LLC - not available for sale to the general public Annual Report May 31, 2019 |
|
|
Beginning on January 1, 2021, as permitted by regulations adopted by the Securities and Exchange Commission, paper copies of a fund’s shareholder reports will no longer be sent by mail, unless you specifically request paper copies of the reports from the fund or from your financial intermediary, such as a financial advisor, broker-dealer or bank. Instead, the reports will be made available on a website, and you will be notified by mail each time a report is posted and provided with a website link to access the report.
If you already elected to receive shareholder reports electronically, you will not be affected by this change and you need not take any action. You may elect to receive shareholder reports and other communications from a fund electronically, by contacting your financial intermediary. For Fidelity customers, visit Fidelity's web site or call Fidelity using the contact information listed below.
You may elect to receive all future reports in paper free of charge. If you wish to continue receiving paper copies of your shareholder reports, you may contact your financial intermediary or, if you are a Fidelity customer, visit Fidelity’s website, or call Fidelity at the applicable toll-free number listed below. Your election to receive reports in paper will apply to all funds held with the fund complex/your financial intermediary.
| Account Type | Website | Phone Number |
| Brokerage, Mutual Fund, or Annuity Contracts: | fidelity.com/mailpreferences | 1-800-343-3548 |
| Employer Provided Retirement Accounts: | netbenefits.fidelity.com/preferences (choose 'no' under Required Disclosures to continue to print) | 1-800-343-0860 |
| Advisor Sold Accounts Serviced Through Your Financial Intermediary: | Contact Your Financial Intermediary | Your Financial Intermediary's phone number |
| Advisor Sold Accounts Serviced by Fidelity: | institutional.fidelity.com | 1-877-208-0098 |
Contents
To view a fund's proxy voting record for the 12-month period ended June 30, visit http://www.fidelity.com/proxyvotingresults or visit the Securities and Exchange Commission's (SEC) web site at http://www.sec.gov.
You may also call 1-800-544-3455 to request a free copy of the proxy voting guidelines.
Standard & Poor's, S&P and S&P 500 are registered service marks of The McGraw-Hill Companies, Inc. and have been licensed for use by Fidelity Distributors Corporation.
Other third-party marks appearing herein are the property of their respective owners.
All other marks appearing herein are registered or unregistered trademarks or service marks of FMR LLC or an affiliated company. © 2019 FMR LLC. All rights reserved.
This report and the financial statements contained herein are submitted for the general information of the shareholders of the Fund. This report is not authorized for distribution to prospective investors in the Fund unless preceded or accompanied by an effective prospectus.
A fund files its complete schedule of portfolio holdings with the SEC for the first and third quarters of each fiscal year on Form N-PORT. Forms N-PORT are available on the SEC’s web site at http://www.sec.gov. A fund's Forms N-PORT may be reviewed and copied at the SEC’s Public Reference Room in Washington, DC. Information regarding the operation of the SEC's Public Reference Room may be obtained by calling 1-800-SEC-0330.
For a complete list of a fund's portfolio holdings, view the most recent holdings listing, semiannual report, or annual report on Fidelity's web site at http://www.fidelity.com, http://www.institutional.fidelity.com, or http://www.401k.com, as applicable.
NOT FDIC INSURED •MAY LOSE VALUE •NO BANK GUARANTEE
Neither the Fund nor Fidelity Distributors Corporation is a bank.
Performance: The Bottom Line
Average annual total return reflects the change in the value of an investment, assuming reinvestment of distributions from dividend income and capital gains (the profits earned upon the sale of securities that have grown in value, if any) and assuming a constant rate of performance each year. The hypothetical investment and the average annual total returns do not reflect the deduction of taxes that a shareholder would pay on fund distributions or the redemption of fund shares. During periods of reimbursement by Fidelity, a fund’s total return will be greater than it would be had the reimbursement not occurred. How a fund did yesterday is no guarantee of how it will do tomorrow.
Average Annual Total Returns
| For the periods ended May 31, 2019 | Past 1 year | Life of fundA |
| Strategic Advisers® Fidelity® U.S. Total Stock Fund | (0.04)% | (0.36)% |
A From March 20, 2018
$10,000 Over Life of Fund
Let's say hypothetically that $10,000 was invested in Strategic Advisers® Fidelity® U.S. Total Stock Fund on March 20, 2018, when the fund started.
The chart shows how the value of your investment would have changed, and also shows how the Dow Jones U.S. Total Stock Market Index℠ performed over the same period.
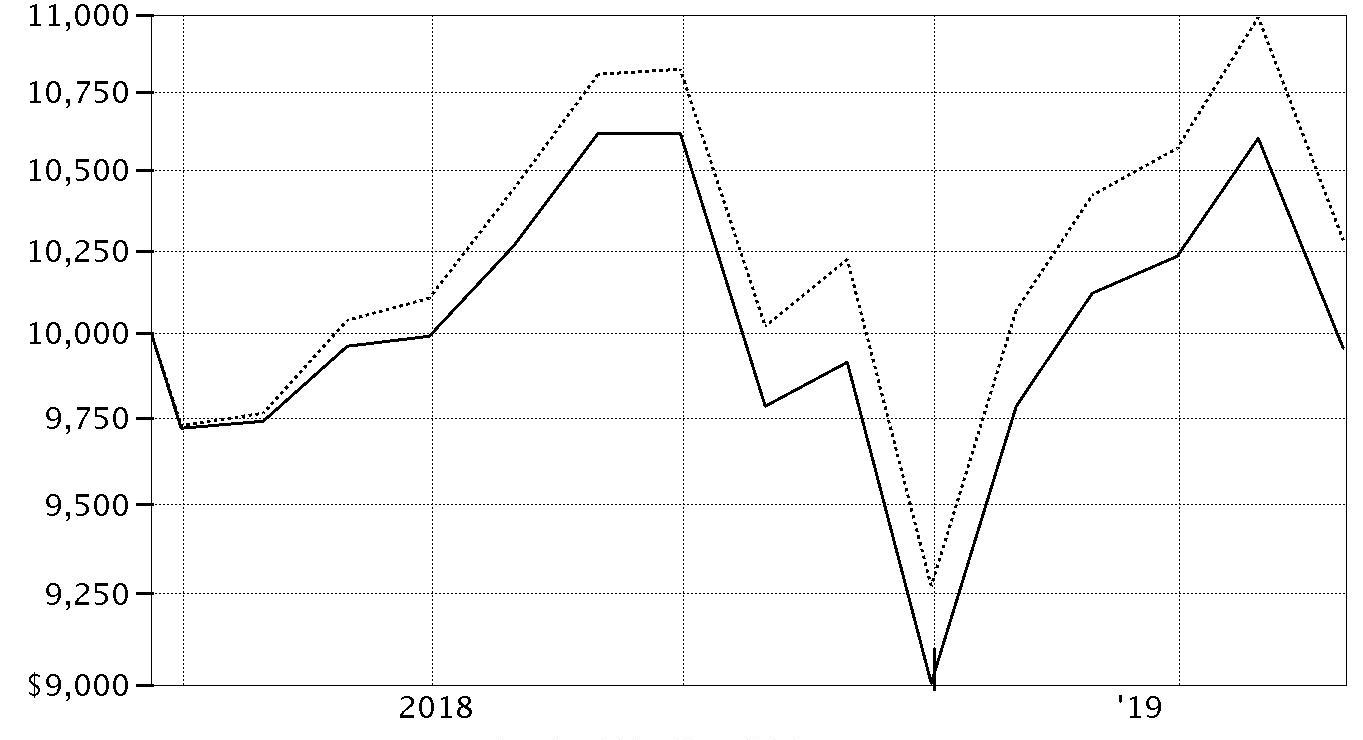
| Period Ending Values | ||
|
| $9,956 | Strategic Advisers® Fidelity® U.S. Total Stock Fund |
|
| $10,283 | Dow Jones U.S. Total Stock Market Index℠ |
Management's Discussion of Fund Performance
Market Recap: The S&P 500® index gained 3.78% for the 12 months ending May 31, 2019, as U.S. equities began the new year on a high note after enduring a historically volatile final quarter of 2018. Upbeat company earnings/outlooks and signs the U.S. Federal Reserve may pause on rates boosted the index to an all-time high on April 30. In May, however, volatility spiked and stocks returned -6.35% for the month amid the Fed’s decision to hold interest rates steady and signal that it had little appetite to adjust them any time soon, as well as retaliatory tariffs imposed on the U.S. by China. The downtrend was similar to late 2018, when many investors fled from risk assets as they were still dealing with lingering uncertainty related to global trade and the Fed picking up the pace of rate hikes. The index returned -6.84% in October, at the time its largest monthly drop in seven years. But conditions worsened through Christmas, as jitters about the economy and another hike in rates led to a spike in market volatility and a -9.03% result for December. For the full period, three defensive sectors stood out: real estate (+20%), utilities (+18%) and consumer staples (+16%). Information technology was up 7% and health care stocks rose about 8%. Communication services – a newly reconstituted mix of telecommunications stocks and higher-growth media names – gained 5%, as did consumer discretionary. In contrast, energy (-20%) fared worst, while materials (-7%), financials (-2%) and industrials (-1%) also lagged. Comments from Portfolio Manager Barry Golden: For the year, the Fund returned -0.04%, trailing the 2.42% gain of the benchmark Dow Jones U.S. Total Stock Market Index℠. The Sector Managed strategy from sub-adviser FIAM® was the biggest relative detractor, hampered by its smaller-cap and higher-growth bias relative to the benchmark, as well as broadly negative stock selection. The FIAM Small-Mid Cap Core strategy also detracted but performed in line with our expectations. This strategy outperformed its SMID-cap benchmark, but lagged the Fund's broader benchmark given that large-cap stocks outpaced small caps by such an outsized margin this period. FIAM's Intrinsic Opportunities strategy was a further dampener on relative performance. Specifically, this manager's opportunistic approach to finding undervalued stocks, focusing mostly on small- and mid-cap companies, faced a significant headwind this period. On the plus side, both Fidelity® SAI® U.S. Quality Index Fund and Fidelity® SAI® U.S. Minimum Volatility Index Fund contributed versus the benchmark. Here, the stocks of companies with stable earnings that are typically less volatile than the broader market performed well amid the market turbulence of 2018's fourth quarter. Lastly, at of period end, I was looking for ways to reduce economically sensitive risk in the portfolio, but am cautious due to elevated valuations of defensively oriented, minimum-volatility strategies.The views expressed above reflect those of the portfolio manager(s) only through the end of the period as stated on the cover of this report and do not necessarily represent the views of Fidelity or any other person in the Fidelity organization. Any such views are subject to change at any time based upon market or other conditions and Fidelity disclaims any responsibility to update such views. These views may not be relied on as investment advice and, because investment decisions for a Fidelity fund are based on numerous factors, may not be relied on as an indication of trading intent on behalf of any Fidelity fund.
Investment Summary (Unaudited)
The information in the following tables is based on the direct investments of the Fund.Top Ten Holdings as of May 31, 2019
| (excluding cash equivalents) | % of fund's net assets |
| Fidelity SAI U.S. Quality Index Fund | 10.8 |
| Fidelity Growth Company Fund | 8.8 |
| Fidelity Contrafund | 6.9 |
| Fidelity Large Cap Value Enhanced Index Fund | 6.8 |
| Fidelity SAI U.S. Momentum Index Fund | 6.6 |
| Fidelity Total Market Index Fund | 5.8 |
| Fidelity SAI U.S. Low Volatility Index Fund | 2.5 |
| Fidelity SAI U.S. Value Index Fund | 2.5 |
| Fidelity Small Cap Index Fund | 2.2 |
| Microsoft Corp.(a) | 1.3 |
| 54.2 |
(a) Security or a portion of the security is pledged as collateral for call options written.
Asset Allocation (% of fund's net assets)
| As of May 31, 2019 * | ||
| Common Stocks | 45.5% | |
| Large Blend Funds | 8.3% | |
| Large Growth Funds | 33.1% | |
| Large Value Funds | 9.3% | |
| Small Blend Funds | 2.2% | |
| Short-Term Investments and Net Other Assets (Liabilities) | 1.6% | |

* Written options - (0.0)%
Percentages shown as 0.0% may reflect amounts less than 0.05%.
Schedule of Investments May 31, 2019
Showing Percentage of Net Assets
| Common Stocks - 45.5% | |||
| Shares | Value | ||
| COMMUNICATION SERVICES - 4.0% | |||
| Diversified Telecommunication Services - 0.3% | |||
| AT&T, Inc. | 547,401 | $16,739,523 | |
| Verizon Communications, Inc. | 1,131,987 | 61,523,493 | |
| 78,263,016 | |||
| Entertainment - 1.0% | |||
| Activision Blizzard, Inc. | 527,500 | 22,877,675 | |
| Cinemark Holdings, Inc. | 279,000 | 10,599,210 | |
| Electronic Arts, Inc. (a) | 253,900 | 23,633,012 | |
| Lions Gate Entertainment Corp. Class B | 642,000 | 8,833,920 | |
| Netflix, Inc. (a) | 50,700 | 17,404,296 | |
| Nihon Falcom Corp. | 5,000 | 66,654 | |
| Take-Two Interactive Software, Inc. (a) | 48,998 | 5,299,134 | |
| The Madison Square Garden Co. (a) | 24,700 | 7,307,248 | |
| The Walt Disney Co. | 625,128 | 82,541,901 | |
| Viacom, Inc.: | |||
| Class A | 166,200 | 5,687,364 | |
| Class B (non-vtg.) | 81,800 | 2,374,654 | |
| Vivendi SA | 547,100 | 14,731,437 | |
| World Wrestling Entertainment, Inc. Class A | 200,100 | 14,555,274 | |
| 215,911,779 | |||
| Interactive Media & Services - 1.2% | |||
| Alphabet, Inc.: | |||
| Class A (a) | 104,400 | 115,518,600 | |
| Class C (a) | 40,800 | 45,028,104 | |
| Eventbrite, Inc. (b) | 10,900 | 170,694 | |
| Facebook, Inc. Class A (a) | 421,000 | 74,714,870 | |
| Momo, Inc. ADR | 172,900 | 4,766,853 | |
| Twitter, Inc. (a) | 158,500 | 5,775,740 | |
| Yahoo! Japan Corp. | 4,350,000 | 12,457,575 | |
| YY, Inc. ADR (a) | 8,900 | 609,205 | |
| 259,041,641 | |||
| Media - 1.4% | |||
| Altice U.S.A., Inc. Class A | 762,360 | 17,907,836 | |
| AMC Networks, Inc. Class A (a) | 9,100 | 480,207 | |
| Charter Communications, Inc. Class A (a) | 48,700 | 18,350,160 | |
| Comcast Corp. Class A | 4,960,000 | 203,360,000 | |
| comScore, Inc. (a) | 139,089 | 1,268,492 | |
| Corus Entertainment, Inc. Class B (non-vtg.) | 95,400 | 455,260 | |
| Discovery Communications, Inc.: | |||
| Class A (a) | 550,000 | 14,993,000 | |
| Class C (non-vtg.) (a) | 107,400 | 2,753,736 | |
| F@N Communications, Inc. | 26,900 | 128,972 | |
| Fox Corp. Class A | 669,832 | 23,598,181 | |
| Hyundai HCN | 461,413 | 1,543,064 | |
| Interpublic Group of Companies, Inc. | 1,088,000 | 23,087,360 | |
| Nippon Television Network Corp. | 59,800 | 855,519 | |
| The New York Times Co. Class A | 182,000 | 5,791,240 | |
| WOWOW INC. | 73,700 | 1,791,749 | |
| 316,364,776 | |||
| Wireless Telecommunication Services - 0.1% | |||
| Okinawa Cellular Telephone Co. | 28,300 | 886,345 | |
| T-Mobile U.S., Inc. (a) | 283,400 | 20,812,896 | |
| 21,699,241 | |||
| TOTAL COMMUNICATION SERVICES | 891,280,453 | ||
| CONSUMER DISCRETIONARY - 3.8% | |||
| Auto Components - 0.3% | |||
| Adient PLC | 100,000 | 1,726,000 | |
| Aptiv PLC | 172,400 | 11,040,496 | |
| BorgWarner, Inc. | 311,300 | 11,044,924 | |
| Cooper Tire & Rubber Co. | 162,700 | 4,487,266 | |
| Cooper-Standard Holding, Inc. (a) | 5,000 | 193,300 | |
| DaikyoNishikawa Corp. | 27,200 | 201,050 | |
| Dongah Tire & Rubber Co. Ltd. (a) | 11,829 | 339,857 | |
| Eagle Industry Co. Ltd. | 67,200 | 621,385 | |
| G-Tekt Corp. | 455,000 | 6,160,745 | |
| Gentex Corp. | 47,200 | 1,008,192 | |
| Hi-Lex Corp. | 85,000 | 1,457,616 | |
| Hyundai Mobis | 86,687 | 15,825,982 | |
| IJT Technology Holdings Co. Ltd. | 276,000 | 1,357,537 | |
| Lear Corp. | 68,900 | 8,201,167 | |
| Strattec Security Corp. | 11,700 | 288,288 | |
| TPR Co. Ltd. | 173,000 | 2,793,955 | |
| 66,747,760 | |||
| Automobiles - 0.1% | |||
| Audi AG | 4,727 | 4,224,614 | |
| Fiat Chrysler Automobiles NV | 50,100 | 632,262 | |
| Fiat Chrysler Automobiles NV | 101,500 | 1,296,963 | |
| General Motors Co. | 88,100 | 2,937,254 | |
| Renault SA | 28,800 | 1,734,818 | |
| 10,825,911 | |||
| Distributors - 0.0% | |||
| Arata Corp. | 5,000 | 172,540 | |
| Harima-Kyowa Co. Ltd. (b) | 24,100 | 343,868 | |
| Yagi & Co. Ltd. | 50,800 | 675,293 | |
| 1,191,701 | |||
| Diversified Consumer Services - 0.2% | |||
| Arco Platform Ltd. Class A | 83,500 | 3,206,400 | |
| Grand Canyon Education, Inc. (a) | 9,400 | 1,126,684 | |
| Heian Ceremony Service Co. Ltd. | 128,400 | 1,040,677 | |
| MegaStudy Co. Ltd. | 79,794 | 765,301 | |
| Multicampus Co. Ltd. | 28,028 | 1,101,199 | |
| Service Corp. International | 526,542 | 23,099,398 | |
| ServiceMaster Global Holdings, Inc. (a) | 213,060 | 11,505,240 | |
| 41,844,899 | |||
| Hotels, Restaurants & Leisure - 0.6% | |||
| Domino's Pizza, Inc. | 117,100 | 32,729,450 | |
| Eldorado Resorts, Inc. (a) | 170,261 | 8,371,733 | |
| Hilton Grand Vacations, Inc. (a) | 176,196 | 4,478,902 | |
| McDonald's Corp. | 212,700 | 42,172,029 | |
| Royal Caribbean Cruises Ltd. | 134,900 | 16,425,424 | |
| The Restaurant Group PLC | 1,119,700 | 1,847,333 | |
| The Stars Group, Inc. (a)(b) | 205,200 | 3,398,112 | |
| U.S. Foods Holding Corp. (a) | 350,300 | 12,106,368 | |
| Wendy's Co. | 1,005,850 | 18,497,582 | |
| 140,026,933 | |||
| Household Durables - 0.2% | |||
| Cuckoo Holdings Co. Ltd. | 19,647 | 2,173,597 | |
| FJ Next Co. Ltd. | 309,600 | 2,725,883 | |
| Gree Electric Appliances, Inc. of Zhuhai (A Shares) | 398,613 | 3,019,760 | |
| Hamilton Beach Brands Holding Co. Class A | 15,700 | 274,593 | |
| Iida Group Holdings Co. Ltd. | 58,300 | 921,946 | |
| Lennar Corp. Class A | 271,500 | 13,482,690 | |
| Mohawk Industries, Inc. (a) | 29,900 | 4,052,945 | |
| Toll Brothers, Inc. | 406,085 | 14,119,575 | |
| 40,770,989 | |||
| Internet & Direct Marketing Retail - 1.0% | |||
| Amazon.com, Inc. (a) | 71,100 | 126,207,477 | |
| eBay, Inc. | 364,600 | 13,100,078 | |
| GrubHub, Inc. (a)(b) | 94,560 | 6,160,584 | |
| Hyundai Home Shopping Network Corp. | 4,861 | 373,791 | |
| Meituan Dianping Class B (b) | 2,660,300 | 20,547,246 | |
| Mercari, Inc. (a) | 10,000 | 292,251 | |
| NS Shopping Co. Ltd. | 21,105 | 225,500 | |
| The Booking Holdings, Inc. (a) | 27,670 | 45,827,607 | |
| 212,734,534 | |||
| Leisure Products - 0.1% | |||
| Brunswick Corp. | 631,992 | 26,215,028 | |
| Multiline Retail - 0.2% | |||
| Dollar General Corp. | 211,400 | 26,906,992 | |
| Dollar Tree, Inc. (a) | 133,000 | 13,511,470 | |
| Lifestyle International Holdings Ltd. | 759,000 | 1,111,457 | |
| Macy's, Inc. | 31,700 | 652,069 | |
| 42,181,988 | |||
| Specialty Retail - 0.8% | |||
| Arc Land Sakamoto Co. Ltd. | 30,000 | 365,578 | |
| AT-Group Co. Ltd. | 124,200 | 2,296,865 | |
| AutoNation, Inc. (a) | 100,000 | 3,947,000 | |
| Bed Bath & Beyond, Inc. (b) | 306,300 | 3,886,947 | |
| Best Buy Co., Inc. | 37,700 | 2,362,659 | |
| Burlington Stores, Inc. (a) | 217,045 | 33,984,906 | |
| Dunelm Group PLC | 231,500 | 2,604,797 | |
| GameStop Corp. Class A (b) | 185,000 | 1,402,300 | |
| GNC Holdings, Inc. Class A (a)(b) | 680,400 | 952,560 | |
| Hibbett Sports, Inc. (a) | 70,200 | 1,552,824 | |
| JB Hi-Fi Ltd. (b) | 63,375 | 1,236,246 | |
| John David Group PLC | 877,200 | 6,840,313 | |
| Ku Holdings Co. Ltd. | 47,500 | 369,086 | |
| Lookers PLC | 804,734 | 873,934 | |
| Lowe's Companies, Inc. | 276,480 | 25,790,054 | |
| Mandarake, Inc. | 15,700 | 90,315 | |
| Sally Beauty Holdings, Inc. (a) | 675,000 | 10,246,500 | |
| Samse SA | 2,200 | 340,396 | |
| The Home Depot, Inc. | 234,500 | 44,519,825 | |
| TJX Companies, Inc. | 550,982 | 27,708,885 | |
| Tokatsu Holdings Co. Ltd. | 18,700 | 72,846 | |
| Urban Outfitters, Inc. (a) | 442,170 | 9,935,560 | |
| Vitamin Shoppe, Inc. (a)(b) | 211,900 | 792,506 | |
| Williams-Sonoma, Inc. (b) | 130,000 | 7,605,000 | |
| 189,777,902 | |||
| Textiles, Apparel & Luxury Goods - 0.3% | |||
| Capri Holdings Ltd. (a) | 59,500 | 1,932,560 | |
| Carter's, Inc. | 130,660 | 10,989,813 | |
| Columbia Sportswear Co. | 128,100 | 12,013,218 | |
| Embry Holdings Ltd. | 280,000 | 77,147 | |
| Ff Group (a)(c) | 2,700 | 3,620 | |
| Fossil Group, Inc. (a) | 20,800 | 203,632 | |
| NIKE, Inc. Class B | 178,400 | 13,761,776 | |
| PVH Corp. | 176,700 | 15,053,073 | |
| Sitoy Group Holdings Ltd. | 2,613,000 | 543,295 | |
| Tapestry, Inc. | 769,027 | 21,963,411 | |
| Yue Yuen Industrial (Holdings) Ltd. | 420,000 | 1,175,960 | |
| 77,717,505 | |||
| TOTAL CONSUMER DISCRETIONARY | 850,035,150 | ||
| CONSUMER STAPLES - 3.3% | |||
| Beverages - 0.5% | |||
| Britvic PLC | 499,246 | 5,617,429 | |
| C&C Group PLC | 3,406,400 | 13,870,901 | |
| Coca-Cola European Partners PLC | 264,700 | 14,664,380 | |
| Constellation Brands, Inc. Class A (sub. vtg.) | 124,900 | 22,038,605 | |
| PepsiCo, Inc. | 281,100 | 35,980,800 | |
| The Coca-Cola Co. | 528,160 | 25,948,501 | |
| Yantai Changyu Pioneer Wine Co. Ltd. (B Shares) | 690,621 | 1,425,369 | |
| 119,545,985 | |||
| Food & Staples Retailing - 0.8% | |||
| Amsterdam Commodities NV | 34,400 | 747,847 | |
| Halows Co. Ltd. | 21,800 | 438,045 | |
| Kroger Co. | 147,300 | 3,359,913 | |
| Nihon Chouzai Co. Ltd. | 6,700 | 218,835 | |
| OM2 Network Co. Ltd. (a) | 60,000 | 689,406 | |
| Performance Food Group Co. (a) | 232,710 | 9,157,139 | |
| Qol Holdings Co. Ltd. | 50,800 | 671,134 | |
| Retail Partners Co. Ltd. | 130,700 | 1,379,361 | |
| Sapporo Clinical Laboratory | 8,200 | 160,992 | |
| Satoh & Co. Ltd. (b) | 12,300 | 185,364 | |
| Sysco Corp. | 679,900 | 46,790,718 | |
| United Natural Foods, Inc. (a) | 30,500 | 309,575 | |
| Walgreens Boots Alliance, Inc. | 350,000 | 17,269,000 | |
| Walmart, Inc. | 911,600 | 92,472,704 | |
| 173,850,033 | |||
| Food Products - 0.9% | |||
| Axyz Co. Ltd. | 10,000 | 235,515 | |
| Changshouhua Food Co. Ltd. | 2,144,000 | 820,455 | |
| Conagra Brands, Inc. | 765,300 | 20,487,081 | |
| Danone SA (b) | 271,500 | 21,687,219 | |
| JC Comsa Corp. | 26,800 | 89,673 | |
| Kaneko Seeds Co. Ltd. | 75,300 | 935,201 | |
| Lotte Samkang Co. Ltd. (a) | 1,057 | 475,758 | |
| Mondelez International, Inc. | 809,800 | 41,178,330 | |
| Nestle SA sponsored ADR | 290,900 | 28,845,644 | |
| Pickles Corp. | 27,500 | 483,471 | |
| Post Holdings, Inc. (a) | 272,877 | 28,679,373 | |
| Prima Meat Packers Ltd. | 14,600 | 284,601 | |
| S Foods, Inc. | 26,000 | 874,779 | |
| Seaboard Corp. | 2,075 | 8,507,500 | |
| The Hershey Co. | 272,000 | 35,893,120 | |
| The J.M. Smucker Co. | 123,900 | 15,061,284 | |
| Toyo Sugar Refining Co. Ltd. | 39,400 | 348,679 | |
| 204,887,683 | |||
| Household Products - 0.3% | |||
| Procter & Gamble Co. (d) | 701,998 | 72,242,614 | |
| Personal Products - 0.1% | |||
| Hengan International Group Co. Ltd. | 202,500 | 1,485,257 | |
| Herbalife Nutrition Ltd. (a) | 692,782 | 28,944,432 | |
| 30,429,689 | |||
| Tobacco - 0.7% | |||
| Altria Group, Inc. | 1,805,340 | 88,569,980 | |
| British American Tobacco PLC sponsored ADR | 434,014 | 15,047,265 | |
| KT&G Corp. | 20,099 | 1,707,862 | |
| Philip Morris International, Inc. | 478,300 | 36,891,279 | |
| Scandinavian Tobacco Group A/S (e) | 32,565 | 396,546 | |
| 142,612,932 | |||
| TOTAL CONSUMER STAPLES | 743,568,936 | ||
| ENERGY - 3.2% | |||
| Energy Equipment & Services - 0.3% | |||
| AKITA Drilling Ltd. Class A (non-vtg.) | 43,413 | 90,256 | |
| Baker Hughes, a GE Co. Class A | 1,095,423 | 23,453,006 | |
| Carbo Ceramics, Inc. (a)(b) | 159,200 | 229,248 | |
| Diamond Offshore Drilling, Inc. (a)(b) | 393,700 | 3,098,419 | |
| Dmc Global, Inc. | 2,400 | 162,336 | |
| Ensco PLC Class A | 319,125 | 2,671,076 | |
| Forum Energy Technologies, Inc. (a) | 179,400 | 685,308 | |
| Geospace Technologies Corp. (a) | 39,300 | 491,643 | |
| Halliburton Co. | 33,200 | 706,828 | |
| Helix Energy Solutions Group, Inc. (a) | 22,100 | 149,396 | |
| High Arctic Energy Services, Inc. | 362,600 | 912,134 | |
| Hunting PLC | 50,000 | 321,120 | |
| Liberty Oilfield Services, Inc. Class A (b) | 206,000 | 2,626,500 | |
| Nabors Industries Ltd. | 379,100 | 894,676 | |
| National Oilwell Varco, Inc. | 66,500 | 1,386,525 | |
| Odfjell Drilling Ltd. (a) | 112,300 | 332,600 | |
| Patterson-UTI Energy, Inc. | 31,900 | 339,097 | |
| Precision Drilling Corp. (a) | 174,402 | 318,713 | |
| RigNet, Inc. (a) | 77,900 | 649,686 | |
| Schlumberger Ltd. | 57,000 | 1,977,330 | |
| Shelf Drilling Ltd. (a)(e) | 250,499 | 1,041,873 | |
| Shinko Plantech Co. Ltd. | 381,700 | 4,221,030 | |
| Solaris Oilfield Infrastructure, Inc. Class A | 76,600 | 1,090,018 | |
| Tecnicas Reunidas SA (b) | 37,400 | 939,246 | |
| Tenaris SA sponsored ADR | 7,100 | 165,501 | |
| Transocean Ltd. (United States) (a)(b) | 466,500 | 2,892,300 | |
| 51,845,865 | |||
| Oil, Gas & Consumable Fuels - 2.9% | |||
| Anadarko Petroleum Corp. | 42,300 | 2,976,651 | |
| Baytex Energy Corp. (a) | 1,949,600 | 3,014,697 | |
| Berry Petroleum Corp. | 94,100 | 1,011,575 | |
| Bonavista Energy Corp. | 877,200 | 389,405 | |
| Bonterra Energy Corp. (b) | 218,300 | 920,620 | |
| BP PLC sponsored ADR | 762,042 | 31,030,350 | |
| Brigham Minerals, Inc. Class A | 66,100 | 1,357,033 | |
| Cabot Oil & Gas Corp. | 140,700 | 3,520,314 | |
| Canadian Natural Resources Ltd. | 6,000 | 161,940 | |
| Cenovus Energy, Inc. (Canada) | 2,214,310 | 18,152,231 | |
| Cheniere Energy, Inc. (a) | 88,000 | 5,559,840 | |
| Chevron Corp. | 894,628 | 101,853,398 | |
| China Petroleum & Chemical Corp.: | |||
| (H Shares) | 18,776,000 | 12,502,085 | |
| sponsored ADR (H Shares) | 9,000 | 594,990 | |
| CNOOC Ltd. sponsored ADR | 16,400 | 2,662,868 | |
| CNX Resources Corp. (a) | 124,400 | 960,368 | |
| Concho Resources, Inc. | 25,064 | 2,456,523 | |
| ConocoPhillips Co. | 211,400 | 12,464,144 | |
| Contango Oil & Gas Co. (a)(b) | 223,300 | 477,862 | |
| Continental Resources, Inc. (a) | 71,344 | 2,497,040 | |
| Delek U.S. Holdings, Inc. | 304,028 | 9,306,297 | |
| Devon Energy Corp. | 134,600 | 3,386,536 | |
| Diamondback Energy, Inc. | 202,272 | 19,834,792 | |
| Enagas SA | 50,598 | 1,384,876 | |
| Encana Corp. (Toronto) | 584,600 | 3,083,899 | |
| Enterprise Products Partners LP | 41,700 | 1,163,013 | |
| EOG Resources, Inc. | 157,600 | 12,904,288 | |
| Equinor ASA sponsored ADR (b) | 1,004,391 | 19,234,088 | |
| Euronav NV (b) | 88,220 | 741,048 | |
| Exxon Mobil Corp. | 2,444,345 | 172,986,296 | |
| FLEX LNG Ltd. (a) | 496,520 | 6,081,898 | |
| Galp Energia SGPS SA Class B | 372,300 | 5,606,533 | |
| GasLog Ltd. | 228,100 | 3,284,640 | |
| GasLog Partners LP (b) | 734,121 | 15,511,977 | |
| Golar LNG Ltd. | 51,500 | 936,785 | |
| Golar LNG Partners LP | 775,166 | 8,705,114 | |
| Hess Corp. | 364,400 | 20,355,384 | |
| Hoegh LNG Partners LP | 241,000 | 4,125,920 | |
| Husky Energy, Inc. | 990,500 | 9,299,678 | |
| Imperial Oil Ltd. (b) | 118,600 | 3,170,330 | |
| Kosmos Energy Ltd. | 216,100 | 1,331,176 | |
| Lundin Petroleum AB | 46,000 | 1,254,933 | |
| Magnolia Oil & Gas Corp. Class A (a)(b) | 1,192,200 | 13,149,966 | |
| Marathon Oil Corp. | 103,400 | 1,359,710 | |
| Marathon Petroleum Corp. | 110,242 | 5,070,030 | |
| Motor Oil (HELLAS) Corinth Refineries SA | 99,400 | 2,531,819 | |
| Murphy Oil Corp. | 216,000 | 5,367,600 | |
| National Energy Services Reunited Corp. (a) | 2,000 | 18,060 | |
| Noble Energy, Inc. | 171,800 | 3,676,520 | |
| Northern Oil & Gas, Inc. (a) | 531,700 | 1,058,083 | |
| NuVista Energy Ltd. (a) | 5,000 | 10,876 | |
| Occidental Petroleum Corp. | 40,800 | 2,030,616 | |
| Par Pacific Holdings, Inc. (a) | 54,000 | 1,058,400 | |
| Parex Resources, Inc. (a) | 168,900 | 2,555,493 | |
| Parsley Energy, Inc. Class A (a) | 975,780 | 17,398,157 | |
| PDC Energy, Inc. (a) | 27,200 | 830,144 | |
| Peabody Energy Corp. | 17,500 | 411,600 | |
| Phillips 66 Co. | 117,600 | 9,502,080 | |
| Pioneer Natural Resources Co. | 54,700 | 7,765,212 | |
| QEP Resources, Inc. (a) | 35,700 | 246,687 | |
| Seven Generations Energy Ltd. (a) | 5,000 | 26,746 | |
| Sinopec Kantons Holdings Ltd. | 4,288,000 | 1,772,183 | |
| Southwestern Energy Co. (a) | 911,900 | 3,273,721 | |
| Star Petroleum Refining PCL | 2,244,600 | 662,469 | |
| Suncor Energy, Inc. | 84,400 | 2,600,814 | |
| Talos Energy, Inc. (a) | 23,400 | 546,156 | |
| Teekay Corp. (b) | 214,817 | 689,563 | |
| Teekay LNG Partners LP | 727,700 | 9,554,701 | |
| Teekay Offshore Partners LP | 1,913,600 | 2,200,640 | |
| Texas Pacific Land Trust | 100 | 73,701 | |
| Thai Oil PCL (For. Reg.) | 396,400 | 741,373 | |
| The Williams Companies, Inc. | 40,500 | 1,068,390 | |
| Total SA sponsored ADR | 330,000 | 16,995,000 | |
| Valero Energy Corp. | 124,200 | 8,743,680 | |
| Viper Energy Partners LP | 114,200 | 3,197,600 | |
| W&T Offshore, Inc. (a) | 44,200 | 185,640 | |
| Whiting Petroleum Corp. (a) | 58,700 | 1,078,906 | |
| World Fuel Services Corp. | 42,900 | 1,250,106 | |
| 656,955,877 | |||
| TOTAL ENERGY | 708,801,742 | ||
| FINANCIALS - 8.2% | |||
| Banks - 3.7% | |||
| Bank of America Corp. | 4,694,809 | 124,881,919 | |
| BankUnited, Inc. | 122,681 | 3,984,679 | |
| Boston Private Financial Holdings, Inc. | 597,160 | 6,120,890 | |
| Citigroup, Inc. | 1,411,870 | 87,747,721 | |
| Credit Agricole Atlantique Vendee | 6,600 | 1,186,789 | |
| EFG Eurobank Ergasias SA (a) | 1,253,400 | 1,225,206 | |
| First Citizens Bancshares, Inc. | 35,893 | 15,078,649 | |
| First Foundation, Inc. | 558,041 | 7,315,918 | |
| First Horizon National Corp. | 1,417,270 | 19,005,591 | |
| FNB Corp., Pennsylvania | 1,810,555 | 19,916,105 | |
| Great Western Bancorp, Inc. | 232,026 | 7,209,048 | |
| Gunma Bank Ltd. | 396,600 | 1,396,245 | |
| Hanmi Financial Corp. | 120,369 | 2,482,009 | |
| Hiroshima Bank Ltd. | 65,700 | 334,726 | |
| Huntington Bancshares, Inc. | 1,883,400 | 23,825,010 | |
| IBERIABANK Corp. | 263,700 | 18,854,550 | |
| JPMorgan Chase & Co. | 639,671 | 67,779,539 | |
| KeyCorp | 677,495 | 10,819,595 | |
| M&T Bank Corp. | 157,600 | 25,152,960 | |
| Mitsubishi UFJ Financial Group, Inc. | 1,371,600 | 6,299,522 | |
| NIBC Holding NV (e) | 590,026 | 5,259,997 | |
| Northrim Bancorp, Inc. | 5,000 | 167,150 | |
| Ogaki Kyoritsu Bank Ltd. | 43,500 | 959,490 | |
| PNC Financial Services Group, Inc. | 616,411 | 78,444,464 | |
| Sberbank of Russia sponsored ADR | 212,600 | 3,072,070 | |
| Shinsei Bank Ltd. | 69,900 | 988,218 | |
| Signature Bank | 52,200 | 5,979,510 | |
| Skandiabanken ASA (e) | 98,800 | 801,536 | |
| Sumitomo Mitsui Financial Group, Inc. | 338,000 | 11,712,343 | |
| SunTrust Banks, Inc. | 642,400 | 38,550,424 | |
| The Keiyo Bank Ltd. | 125,700 | 719,119 | |
| The San-In Godo Bank Ltd. | 120,400 | 769,547 | |
| U.S. Bancorp | 1,373,227 | 68,935,995 | |
| Unicaja Banco SA (e) | 1,549,300 | 1,510,989 | |
| United Community Bank, Inc. | 509,599 | 13,509,469 | |
| Van Lanschot NV (Bearer) | 5,800 | 132,181 | |
| Wells Fargo & Co. | 3,387,913 | 150,321,700 | |
| Yamaguchi Financial Group, Inc. | 108,200 | 797,546 | |
| 833,248,419 | |||
| Capital Markets - 1.1% | |||
| Affiliated Managers Group, Inc. | 75,600 | 6,336,792 | |
| Ares Capital Corp. | 34,629 | 608,085 | |
| BlackRock, Inc. Class A | 24,100 | 10,014,996 | |
| Cboe Global Markets, Inc. | 97,000 | 10,528,380 | |
| Charles Schwab Corp. | 194,065 | 8,075,045 | |
| E*TRADE Financial Corp. | 550,348 | 24,655,590 | |
| Goldman Sachs Group, Inc. | 247,900 | 45,239,271 | |
| Invesco Ltd. | 312,700 | 6,110,158 | |
| Lazard Ltd. Class A | 368,908 | 11,495,173 | |
| Monex Group, Inc. | 381,000 | 1,157,634 | |
| Morgan Stanley | 651,730 | 26,518,894 | |
| Morningstar, Inc. | 61,000 | 8,542,440 | |
| Northern Trust Corp. | 71,200 | 6,089,024 | |
| Raymond James Financial, Inc. | 131,990 | 10,899,734 | |
| State Street Corp. | 923,946 | 51,048,017 | |
| TD Ameritrade Holding Corp. | 83,200 | 4,139,200 | |
| Tradeweb Markets, Inc. Class A | 44,600 | 2,011,014 | |
| Virtu Financial, Inc. Class A (b) | 198,000 | 4,557,960 | |
| 238,027,407 | |||
| Consumer Finance - 0.8% | |||
| 360 Finance, Inc. ADR (b) | 151,480 | 2,434,284 | |
| Aeon Credit Service (Asia) Co. Ltd. | 3,340,000 | 3,139,951 | |
| Ally Financial, Inc. | 180,900 | 5,222,583 | |
| American Express Co. | 168,400 | 19,317,164 | |
| Capital One Financial Corp. | 800,300 | 68,721,761 | |
| Discover Financial Services | 470,700 | 35,090,685 | |
| First Cash Financial Services, Inc. | 159,910 | 15,146,675 | |
| Green Dot Corp. Class A (a) | 30,000 | 1,392,300 | |
| LexinFintech Holdings Ltd. ADR (a) | 251,100 | 2,837,430 | |
| Navient Corp. | 78,400 | 1,022,336 | |
| OneMain Holdings, Inc. | 420,059 | 12,547,162 | |
| PPDAI Group, Inc. ADR | 40,752 | 191,942 | |
| Santander Consumer U.S.A. Holdings, Inc. | 157,000 | 3,515,230 | |
| SLM Corp. | 381,900 | 3,631,869 | |
| Synchrony Financial | 553,836 | 18,625,505 | |
| 192,836,877 | |||
| Diversified Financial Services - 0.5% | |||
| AXA Equitable Holdings, Inc. | 770,000 | 15,823,500 | |
| Berkshire Hathaway, Inc. Class B (a) | 381,800 | 75,374,956 | |
| Fuyo General Lease Co. Ltd. | 78,100 | 3,783,094 | |
| Ricoh Leasing Co. Ltd. | 96,500 | 2,968,676 | |
| Voya Financial, Inc. | 194,410 | 9,901,301 | |
| 107,851,527 | |||
| Insurance - 1.6% | |||
| AFLAC, Inc. | 244,200 | 12,527,460 | |
| Allstate Corp. | 141,000 | 13,466,910 | |
| American International Group, Inc. | 322,700 | 16,480,289 | |
| ASR Nederland NV | 78,300 | 2,970,578 | |
| Assurant, Inc. | 167,430 | 16,736,303 | |
| Axis Capital Holdings Ltd. | 108,300 | 6,452,514 | |
| Brown & Brown, Inc. | 872,882 | 27,556,885 | |
| Chubb Ltd. | 225,800 | 32,982,606 | |
| Db Insurance Co. Ltd. (a) | 139,982 | 7,242,763 | |
| FNF Group | 320,600 | 12,359,130 | |
| Genworth Financial, Inc. Class A | 289,400 | 842,154 | |
| Hartford Financial Services Group, Inc. | 132,500 | 6,977,450 | |
| Hyundai Fire & Marine Insurance Co. Ltd. (a) | 180,042 | 4,657,747 | |
| Lincoln National Corp. | 33,100 | 1,967,795 | |
| Marsh & McLennan Companies, Inc. | 190,300 | 18,192,680 | |
| MetLife, Inc. | 1,251,200 | 57,817,952 | |
| NN Group NV (b) | 134,103 | 5,096,644 | |
| NN Group NV rights (a)(f) | 134,103 | 185,768 | |
| Prudential Financial, Inc. | 56,800 | 5,247,184 | |
| Prudential PLC | 749,350 | 14,935,375 | |
| Reinsurance Group of America, Inc. | 188,480 | 27,906,349 | |
| Sony Financial Holdings, Inc. | 60,900 | 1,343,412 | |
| Sul America SA unit | 219,800 | 1,955,483 | |
| The Travelers Companies, Inc. | 338,300 | 49,246,331 | |
| Willis Group Holdings PLC | 94,800 | 16,637,400 | |
| 361,785,162 | |||
| Mortgage Real Estate Investment Trusts - 0.3% | |||
| AGNC Investment Corp. | 1,799,100 | 29,505,240 | |
| Annaly Capital Management, Inc. | 1,961,400 | 17,279,934 | |
| MFA Financial, Inc. | 3,001,000 | 21,127,040 | |
| Redwood Trust, Inc. | 67,500 | 1,075,275 | |
| 68,987,489 | |||
| Thrifts & Mortgage Finance - 0.2% | |||
| ASAX Co. Ltd. | 159,600 | 806,836 | |
| Essent Group Ltd. (a) | 727,031 | 34,134,105 | |
| Genworth Mortgage Insurance Ltd. | 232,786 | 436,006 | |
| LIC Housing Finance Ltd. | 469,500 | 3,766,032 | |
| 39,142,979 | |||
| TOTAL FINANCIALS | 1,841,879,860 | ||
| HEALTH CARE - 7.0% | |||
| Biotechnology - 1.7% | |||
| Abeona Therapeutics, Inc. (a) | 140,000 | 761,600 | |
| Acceleron Pharma, Inc. (a) | 50,000 | 1,994,500 | |
| Acorda Therapeutics, Inc. (a) | 55,000 | 510,950 | |
| Alexion Pharmaceuticals, Inc. (a) | 256,700 | 29,181,656 | |
| Allakos, Inc. (a)(b) | 60,000 | 2,352,000 | |
| Alnylam Pharmaceuticals, Inc. (a) | 22,000 | 1,485,440 | |
| Amgen, Inc. | 427,100 | 71,197,570 | |
| AnaptysBio, Inc. (a) | 44,000 | 3,203,640 | |
| Argenx SE ADR (a) | 38,000 | 4,697,940 | |
| Array BioPharma, Inc. (a) | 699,870 | 18,490,565 | |
| Ascendis Pharma A/S sponsored ADR (a) | 50,000 | 6,233,000 | |
| Atara Biotherapeutics, Inc. (a) | 50,000 | 1,110,500 | |
| BeiGene Ltd. ADR (a)(b) | 24,000 | 2,830,320 | |
| Biogen, Inc. (a) | 55,000 | 12,060,950 | |
| bluebird bio, Inc. (a)(b) | 22,800 | 2,734,176 | |
| Blueprint Medicines Corp. (a) | 226,898 | 17,244,248 | |
| Celgene Corp. (a) | 582,700 | 54,651,433 | |
| Cell Biotech Co. Ltd. | 46,872 | 822,198 | |
| FibroGen, Inc. (a) | 60,000 | 2,174,400 | |
| Gilead Sciences, Inc. | 168,700 | 10,501,575 | |
| Global Blood Therapeutics, Inc. (a) | 212,530 | 12,917,573 | |
| Immunomedics, Inc. (a)(b) | 748,400 | 9,781,588 | |
| Insmed, Inc. (a) | 114,259 | 2,766,210 | |
| Intercept Pharmaceuticals, Inc. (a) | 89,700 | 7,428,954 | |
| Mirati Therapeutics, Inc. (a)(b) | 112,900 | 7,653,491 | |
| Momenta Pharmaceuticals, Inc. (a) | 120,000 | 1,395,600 | |
| Morphosys AG (a) | 12,000 | 1,158,931 | |
| Neurocrine Biosciences, Inc. (a) | 276,368 | 23,430,479 | |
| Principia Biopharma, Inc. (b) | 39,900 | 1,167,474 | |
| Sage Therapeutics, Inc. (a) | 18,000 | 3,093,660 | |
| Sarepta Therapeutics, Inc. (a)(b) | 318,192 | 36,226,159 | |
| Scholar Rock Holding Corp. (b) | 47,900 | 878,486 | |
| United Therapeutics Corp. (a) | 51,200 | 4,299,264 | |
| Vertex Pharmaceuticals, Inc. (a) | 126,000 | 20,938,680 | |
| Xencor, Inc. (a) | 70,000 | 2,158,800 | |
| 379,534,010 | |||
| Health Care Equipment & Supplies - 1.1% | |||
| A&T Corp. | 21,000 | 172,306 | |
| Atricure, Inc. (a) | 87,014 | 2,549,510 | |
| Becton, Dickinson & Co. | 167,000 | 38,984,480 | |
| Boston Scientific Corp. (a) | 1,252,921 | 48,124,696 | |
| Danaher Corp. | 80,000 | 10,560,800 | |
| Dentsply Sirona, Inc. | 265,700 | 14,313,259 | |
| Fukuda Denshi Co. Ltd. | 59,550 | 3,846,332 | |
| Genmark Diagnostics, Inc. (a) | 280,000 | 1,873,200 | |
| Glaukos Corp. (a) | 218,900 | 14,114,672 | |
| Hologic, Inc. (a) | 150,000 | 6,601,500 | |
| Insulet Corp. (a)(b) | 60,000 | 6,587,400 | |
| Intuitive Surgical, Inc. (a) | 29,000 | 13,480,650 | |
| Masimo Corp. (a) | 40,000 | 5,229,600 | |
| Medtronic PLC | 87,600 | 8,110,008 | |
| Penumbra, Inc. (a)(b) | 46,000 | 6,564,200 | |
| STERIS PLC | 139,549 | 18,654,910 | |
| Stryker Corp. | 97,500 | 17,865,900 | |
| ViewRay, Inc. (a)(b) | 1,107,316 | 9,301,454 | |
| Wright Medical Group NV (a)(b) | 830,987 | 25,527,921 | |
| 252,462,798 | |||
| Health Care Providers & Services - 2.3% | |||
| Anthem, Inc. | 281,478 | 78,245,254 | |
| Centene Corp. (a) | 388,400 | 22,430,100 | |
| Cigna Corp. | 508,377 | 75,249,964 | |
| Covetrus, Inc. (a) | 60,000 | 1,479,600 | |
| CVS Health Corp. | 1,156,212 | 60,550,822 | |
| EBOS Group Ltd. | 160,000 | 2,334,186 | |
| G1 Therapeutics, Inc. (a) | 50,000 | 1,048,000 | |
| HCA Holdings, Inc. | 108,000 | 13,063,680 | |
| Humana, Inc. | 120,100 | 29,407,686 | |
| Laboratory Corp. of America Holdings (a) | 55,000 | 8,943,550 | |
| McKesson Corp. | 239,699 | 29,276,836 | |
| MEDNAX, Inc. (a) | 48,100 | 1,186,146 | |
| Molina Healthcare, Inc. (a) | 157,400 | 22,391,724 | |
| Notre Dame Intermedica Participacoes SA | 360,000 | 3,761,516 | |
| Patterson Companies, Inc. | 49,100 | 1,032,082 | |
| Quest Diagnostics, Inc. | 3,700 | 354,867 | |
| Tokai Corp. | 107,400 | 2,366,852 | |
| UnitedHealth Group, Inc. | 544,700 | 131,708,460 | |
| Universal Health Services, Inc. Class B | 40,000 | 4,782,000 | |
| Wellcare Health Plans, Inc. (a) | 88,900 | 24,553,291 | |
| 514,166,616 | |||
| Health Care Technology - 0.1% | |||
| Castlight Health, Inc. Class B (a) | 720,000 | 2,354,400 | |
| Teladoc Health, Inc. (a)(b) | 185,570 | 10,785,328 | |
| 13,139,728 | |||
| Life Sciences Tools & Services - 0.1% | |||
| Avantor, Inc. | 300,000 | 5,250,000 | |
| Bio-Rad Laboratories, Inc. Class A (a) | 66,716 | 19,142,822 | |
| ICON PLC (a) | 4,400 | 622,864 | |
| Lonza Group AG | 16,000 | 4,928,240 | |
| 29,943,926 | |||
| Pharmaceuticals - 1.7% | |||
| Allergan PLC | 250,900 | 30,587,219 | |
| AstraZeneca PLC: | |||
| (United Kingdom) | 336,000 | 24,760,624 | |
| sponsored ADR | 59,500 | 2,224,110 | |
| Bayer AG | 382,882 | 22,641,267 | |
| Bristol-Myers Squibb Co. | 1,281,700 | 58,150,729 | |
| Dawnrays Pharmaceutical Holdings Ltd. | 6,848,000 | 1,249,133 | |
| Dechra Pharmaceuticals PLC | 100,000 | 3,448,874 | |
| Eli Lilly & Co. | 80,000 | 9,275,200 | |
| Genomma Lab Internacional SA de CV (a) | 1,796,300 | 1,512,288 | |
| GlaxoSmithKline PLC sponsored ADR | 780,758 | 30,168,489 | |
| InflaRx NV (a)(b) | 164,400 | 5,916,756 | |
| Intersect ENT, Inc. (a) | 292,400 | 6,894,792 | |
| Johnson & Johnson | 503,985 | 66,097,633 | |
| Korea United Pharm, Inc. (a) | 37,112 | 738,418 | |
| MyoKardia, Inc. (a) | 40,000 | 1,863,200 | |
| Nektar Therapeutics (a) | 84,000 | 2,630,880 | |
| Nippon Chemiphar Co. Ltd. | 10,400 | 275,313 | |
| Novartis AG sponsored ADR | 49,573 | 4,245,432 | |
| Pfizer, Inc. | 68,700 | 2,852,424 | |
| Recordati SpA | 67,000 | 2,769,415 | |
| Roche Holding AG (participation certificate) | 215,306 | 56,550,580 | |
| Sanofi SA | 124,509 | 10,055,014 | |
| Sanofi SA sponsored ADR | 486,600 | 19,673,238 | |
| Takeda Pharmaceutical Co. Ltd. ADR | 464,780 | 7,887,317 | |
| Taro Pharmaceutical Industries Ltd. | 9,500 | 883,310 | |
| The Medicines Company (a)(b) | 54,000 | 1,925,100 | |
| Theravance Biopharma, Inc. (a) | 80,700 | 1,341,234 | |
| Turning Point Therapeutics, Inc. (b) | 60,000 | 2,089,200 | |
| Zogenix, Inc. (a)(b) | 60,000 | 2,261,400 | |
| 380,968,589 | |||
| TOTAL HEALTH CARE | 1,570,215,667 | ||
| INDUSTRIALS - 4.9% | |||
| Aerospace & Defense - 1.3% | |||
| General Dynamics Corp. | 24,023 | 3,863,379 | |
| Harris Corp. | 101,700 | 19,037,223 | |
| HEICO Corp. Class A | 421,546 | 41,421,110 | |
| Lockheed Martin Corp. | 138,900 | 47,023,206 | |
| The Boeing Co. | 167,800 | 57,322,158 | |
| United Technologies Corp. | 907,669 | 114,638,595 | |
| Vectrus, Inc. (a) | 5,000 | 176,450 | |
| 283,482,121 | |||
| Air Freight & Logistics - 0.3% | |||
| C.H. Robinson Worldwide, Inc. | 262,200 | 20,878,986 | |
| FedEx Corp. | 41,830 | 6,453,532 | |
| Onelogix Group Ltd. | 291,841 | 70,124 | |
| United Parcel Service, Inc. Class B | 354,006 | 32,894,238 | |
| 60,296,880 | |||
| Airlines - 0.1% | |||
| Alaska Air Group, Inc. | 253,200 | 14,736,240 | |
| Building Products - 0.1% | |||
| Apogee Enterprises, Inc. | 5,000 | 181,250 | |
| Fortune Brands Home & Security, Inc. | 602,029 | 28,933,514 | |
| KVK Corp. | 5,500 | 77,219 | |
| Nihon Dengi Co. Ltd. | 88,000 | 2,268,741 | |
| 31,460,724 | |||
| Commercial Services & Supplies - 0.0% | |||
| Healthcare Services Group, Inc. (b) | 180,500 | 5,705,605 | |
| Nippon Kanzai Co. Ltd. | 26,600 | 444,251 | |
| 6,149,856 | |||
| Construction & Engineering - 0.0% | |||
| Arcadis NV (b) | 50,193 | 931,935 | |
| Boustead Projs. Pte Ltd. | 1,846,700 | 1,303,996 | |
| Joban Kaihatsu Co. Ltd. | 1,400 | 63,961 | |
| Kawasaki Setsubi Kogyo Co. Ltd. | 23,200 | 77,591 | |
| Meisei Industrial Co. Ltd. | 360,100 | 2,172,771 | |
| Seikitokyu Kogyo Co. Ltd. | 64,600 | 365,722 | |
| Watanabe Sato Co. Ltd. | 4,100 | 69,221 | |
| 4,985,197 | |||
| Electrical Equipment - 0.5% | |||
| Aichi Electric Co. Ltd. | 31,300 | 809,163 | |
| Eaton Corp. PLC | 14,200 | 1,057,758 | |
| Emerson Electric Co. | 575,600 | 34,674,144 | |
| Fortive Corp. | 532,200 | 40,527,030 | |
| Gerard Perrier Industrie SA | 5,000 | 278,170 | |
| Iwabuchi Corp. | 1,600 | 74,339 | |
| Siemens Gamesa Renewable Energy SA | 226,700 | 3,532,948 | |
| Sunrun, Inc. (a)(b) | 1,654,500 | 25,909,470 | |
| Terasaki Electric Co. Ltd. | 33,600 | 274,126 | |
| Vivint Solar, Inc. (a)(b) | 1,038,963 | 6,774,039 | |
| 113,911,187 | |||
| Industrial Conglomerates - 0.6% | |||
| Carlisle Companies, Inc. | 178,520 | 23,798,501 | |
| General Electric Co. | 11,530,408 | 108,847,052 | |
| Mytilineos Holdings SA | 202,900 | 2,213,430 | |
| Reunert Ltd. | 56,900 | 269,143 | |
| 135,128,126 | |||
| Machinery - 0.8% | |||
| Apergy Corp. (a) | 5,500 | 170,555 | |
| Cactus, Inc. (a) | 33,100 | 1,077,405 | |
| Conrad Industries, Inc. (a) | 5,400 | 73,440 | |
| Deere & Co. | 135,600 | 19,007,052 | |
| Flowserve Corp. | 427,427 | 19,853,984 | |
| Fukushima Industries Corp. | 4,100 | 133,290 | |
| Global Brass & Copper Holdings, Inc. | 35,000 | 1,527,050 | |
| Haitian International Holdings Ltd. | 1,150,000 | 2,273,727 | |
| Hy-Lok Corp. | 14,316 | 192,105 | |
| IDEX Corp. | 222,427 | 33,966,827 | |
| Ingersoll-Rand PLC | 559,200 | 66,175,728 | |
| Koike Sanso Kogyo Co. Ltd. | 2,200 | 44,952 | |
| Minebea Mitsumi, Inc. | 399,000 | 5,799,082 | |
| Nakanishi Manufacturing Co. Ltd. | 20,000 | 194,335 | |
| Nansin Co. Ltd. | 32,900 | 159,106 | |
| ProPetro Holding Corp. (a) | 57,300 | 1,112,766 | |
| Sakura Rubber Co. Ltd. | 9,700 | 483,701 | |
| The Hanshin Diesel Works Ltd. | 4,500 | 82,803 | |
| WABCO Holdings, Inc. (a) | 217,926 | 28,528,693 | |
| Wabtec Corp. (b) | 39,262 | 2,449,164 | |
| Yamada Corp. | 19,700 | 432,234 | |
| 183,737,999 | |||
| Marine - 0.0% | |||
| Japan Transcity Corp. | 237,400 | 964,568 | |
| Professional Services - 0.1% | |||
| ABIST Co. Ltd. | 24,400 | 553,126 | |
| Bertrandt AG | 15,400 | 1,083,859 | |
| Career Design Center Co. Ltd. | 22,100 | 312,711 | |
| McMillan Shakespeare Ltd. | 46,017 | 412,751 | |
| RELX PLC (London Stock Exchange) | 570,400 | 13,286,787 | |
| SHL-JAPAN Ltd. | 24,000 | 432,485 | |
| 16,081,719 | |||
| Road & Rail - 0.8% | |||
| Autohellas SA | 12,900 | 330,017 | |
| CSX Corp. | 517,300 | 38,523,331 | |
| Daqin Railway Co. Ltd. (A Shares) | 2,500,041 | 3,026,842 | |
| Genesee & Wyoming, Inc. Class A (a) | 269,575 | 25,668,932 | |
| J.B. Hunt Transport Services, Inc. | 150,800 | 12,839,112 | |
| Landstar System, Inc. | 161,920 | 15,584,800 | |
| Meitetsu Transport Co. Ltd. | 5,000 | 104,634 | |
| NANSO Transport Co. Ltd. | 43,900 | 469,212 | |
| Nikkon Holdings Co. Ltd. | 40,300 | 911,357 | |
| Norfolk Southern Corp. | 77,745 | 15,171,159 | |
| Old Dominion Freight Lines, Inc. | 157,473 | 20,855,724 | |
| STEF-TFE Group | 3,667 | 290,858 | |
| Tohbu Network Co. Ltd. | 42,500 | 392,726 | |
| Union Pacific Corp. | 258,543 | 43,119,802 | |
| Utoc Corp. | 121,800 | 566,817 | |
| 177,855,323 | |||
| Trading Companies & Distributors - 0.3% | |||
| AerCap Holdings NV (a) | 75,000 | 3,361,500 | |
| Canox Corp. | 37,700 | 281,799 | |
| Daiichi Jitsugyo Co. Ltd. | 5,900 | 177,005 | |
| Green Cross Co. Ltd. | 70,200 | 646,934 | |
| HD Supply Holdings, Inc. (a) | 402,080 | 16,682,299 | |
| Howden Joinery Group PLC | 26,900 | 170,858 | |
| Itochu Corp. | 1,620,000 | 29,740,521 | |
| Kamei Corp. | 194,100 | 2,022,698 | |
| Mitani Shoji Co. Ltd. | 47,900 | 2,486,119 | |
| Mitsubishi Corp. | 201,900 | 5,232,508 | |
| MRC Global, Inc. (a) | 782,640 | 11,583,072 | |
| Narasaki Sangyo Co. Ltd. | 9,600 | 149,546 | |
| Nishikawa Keisoku Co. Ltd. | 5,800 | 245,733 | |
| Pla Matels Corp. | 49,800 | 230,175 | |
| Shinsho Corp. | 77,000 | 1,601,811 | |
| 74,612,578 | |||
| Transportation Infrastructure - 0.0% | |||
| Isewan Terminal Service Co. Ltd. | 156,100 | 1,120,221 | |
| Qingdao Port International Co. Ltd. (H Shares) (a)(e) | 3,809,000 | 2,545,957 | |
| 3,666,178 | |||
| TOTAL INDUSTRIALS | 1,107,068,696 | ||
| INFORMATION TECHNOLOGY - 6.6% | |||
| Communications Equipment - 0.0% | |||
| Cisco Systems, Inc. (d) | 155,400 | 8,085,462 | |
| Juniper Networks, Inc. | 41,100 | 1,011,471 | |
| Telefonaktiebolaget LM Ericsson (B Shares) sponsored ADR | 411,600 | 3,980,172 | |
| 13,077,105 | |||
| Electronic Equipment & Components - 0.4% | |||
| Avnet, Inc. | 327,200 | 13,362,848 | |
| Daido Signal Co. Ltd. | 98,300 | 435,549 | |
| Dell Technologies, Inc. (a) | 17,996 | 1,071,662 | |
| Elematec Corp. | 98,400 | 881,652 | |
| Fabrinet (a) | 14,500 | 618,280 | |
| Flextronics International Ltd. (a) | 328,300 | 2,935,002 | |
| HAGIAWARA ELECTRIC Co. Ltd. | 5,000 | 119,784 | |
| Jabil, Inc. | 606,800 | 14,921,212 | |
| Kingboard Chemical Holdings Ltd. | 311,000 | 817,215 | |
| Makus, Inc. | 587,111 | 2,227,685 | |
| New Cosmos Electric Co. Ltd. | 6,200 | 88,579 | |
| PAX Global Technology Ltd. (b) | 4,204,000 | 1,565,865 | |
| Riken Kieki Co. Ltd. | 46,800 | 826,934 | |
| ScanSource, Inc. (a) | 28,100 | 820,801 | |
| TE Connectivity Ltd. | 267,300 | 22,514,679 | |
| Trimble, Inc. (a) | 447,500 | 17,855,250 | |
| 81,062,997 | |||
| Internet Software & Services - 0.0% | |||
| Wise Talent Information Technology Co. Ltd. (a)(b) | 1,270,400 | 3,411,155 | |
| IT Services - 1.3% | |||
| Akamai Technologies, Inc. (a) | 26,800 | 2,019,648 | |
| Alliance Data Systems Corp. | 190,383 | 26,177,663 | |
| Amdocs Ltd. | 336,000 | 19,965,120 | |
| Avant Corp. | 125,900 | 2,207,780 | |
| Cielo SA | 346,800 | 592,148 | |
| Cognizant Technology Solutions Corp. Class A | 440,400 | 27,273,972 | |
| DXC Technology Co. | 62,200 | 2,956,988 | |
| E-Credible Co. Ltd. | 78,916 | 1,195,073 | |
| Elastic NV (b) | 178,400 | 14,637,720 | |
| Enea Data AB (a) | 57,300 | 830,531 | |
| Fidelity National Information Services, Inc. | 28,600 | 3,440,580 | |
| Fiserv, Inc. (a) | 51,400 | 4,413,204 | |
| FleetCor Technologies, Inc. (a) | 6,100 | 1,575,081 | |
| Gartner, Inc. (a) | 91,900 | 13,904,470 | |
| Korea Information & Communication Co. Ltd. (a) | 18,423 | 139,650 | |
| Leidos Holdings, Inc. | 246,400 | 18,561,312 | |
| Liveramp Holdings, Inc. (a) | 27,900 | 1,433,502 | |
| MasterCard, Inc. Class A | 64,200 | 16,145,658 | |
| PayPal Holdings, Inc. (a) | 248,100 | 27,228,975 | |
| The Western Union Co. | 499,100 | 9,682,540 | |
| Total System Services, Inc. | 137,181 | 16,945,969 | |
| Visa, Inc. Class A (d) | 396,657 | 63,992,674 | |
| WEX, Inc. (a) | 89,600 | 16,929,024 | |
| 292,249,282 | |||
| Semiconductors & Semiconductor Equipment - 1.3% | |||
| Advanced Micro Devices, Inc. (a) | 102,900 | 2,820,489 | |
| Analog Devices, Inc. | 39,300 | 3,797,166 | |
| Applied Materials, Inc. | 577,400 | 22,339,606 | |
| Broadcom, Inc. | 54,800 | 13,789,872 | |
| KLA-Tencor Corp. | 113,400 | 11,688,138 | |
| Lam Research Corp. | 110,400 | 19,276,944 | |
| MACOM Technology Solutions Holdings, Inc. (a) | 472,900 | 6,691,535 | |
| Marvell Technology Group Ltd. | 1,451,750 | 32,374,025 | |
| Microchip Technology, Inc. (b) | 27,700 | 2,216,831 | |
| Micron Technology, Inc. (a) | 438,400 | 14,296,224 | |
| Miraial Co. Ltd. | 30,400 | 293,003 | |
| NVIDIA Corp. | 141,200 | 19,126,952 | |
| NXP Semiconductors NV | 235,800 | 20,788,128 | |
| ON Semiconductor Corp. (a) | 1,224,300 | 21,743,568 | |
| Phison Electronics Corp. | 44,000 | 398,960 | |
| Qualcomm, Inc. | 1,120,330 | 74,860,451 | |
| Sanken Electric Co. Ltd. | 111,900 | 2,218,415 | |
| Semtech Corp. (a) | 9,400 | 374,402 | |
| Skyworks Solutions, Inc. | 209,200 | 13,938,996 | |
| Taiwan Semiconductor Manufacturing Co. Ltd. sponsored ADR | 117,300 | 4,498,455 | |
| Versum Materials, Inc. | 194,500 | 9,987,575 | |
| Xilinx, Inc. | 26,500 | 2,711,215 | |
| 300,230,950 | |||
| Software - 2.7% | |||
| 2U, Inc. (a) | 122,800 | 4,665,172 | |
| Adobe, Inc. (a) | 74,900 | 20,290,410 | |
| Autodesk, Inc. (a) | 102,600 | 16,509,366 | |
| Avast PLC (e) | 131,700 | 514,490 | |
| Benefitfocus, Inc. (a) | 94,000 | 2,665,840 | |
| Blackbaud, Inc. | 185,200 | 14,245,584 | |
| BlackLine, Inc. (a) | 208,100 | 10,698,421 | |
| Blue Prism Group PLC (a) | 261,500 | 6,016,945 | |
| Box, Inc. Class A (a) | 804,200 | 14,869,658 | |
| Cardlytics, Inc. (a) | 25,400 | 582,930 | |
| Citrix Systems, Inc. | 220,900 | 20,791,108 | |
| Cloudera, Inc. (a) | 357,102 | 3,274,625 | |
| Dropbox, Inc. Class A (a) | 105,300 | 2,375,568 | |
| eBase Co. Ltd. | 75,500 | 724,052 | |
| Envestnet, Inc. (a) | 100 | 6,691 | |
| HubSpot, Inc. (a) | 60,200 | 10,431,456 | |
| Instructure, Inc. (a) | 235,400 | 9,787,932 | |
| Kingsoft Corp. Ltd. | 2,027,000 | 5,584,912 | |
| Micro Focus International PLC sponsored ADR | 12,029 | 288,335 | |
| Microsoft Corp. (d) | 2,266,600 | 280,333,088 | |
| Minori Solutions Co. Ltd. | 5,000 | 74,732 | |
| Oracle Corp. | 608,769 | 30,803,711 | |
| Parametric Technology Corp. (a) | 54,100 | 4,547,646 | |
| Pivotal Software, Inc. (a) | 685,500 | 13,641,450 | |
| Pluralsight, Inc. | 24,900 | 793,314 | |
| Proofpoint, Inc. (a) | 114,620 | 12,878,703 | |
| RealPage, Inc. (a) | 261,700 | 15,262,344 | |
| Salesforce.com, Inc. (a) | 163,200 | 24,710,112 | |
| SAP SE sponsored ADR | 169,656 | 20,881,260 | |
| Sinosoft Tech Group Ltd. | 4,769,000 | 1,459,982 | |
| Splunk, Inc. (a) | 19,900 | 2,268,401 | |
| SurveyMonkey | 834,821 | 14,358,921 | |
| Symantec Corp. | 646,800 | 12,114,564 | |
| System Research Co. Ltd. | 7,100 | 186,653 | |
| Talend SA ADR (a) | 205,400 | 9,579,856 | |
| Toho System Science Co. Ltd. | 11,200 | 94,229 | |
| Totvs SA | 116,900 | 1,176,761 | |
| Varonis Systems, Inc. (a) | 59,500 | 3,721,130 | |
| Zoom Video Communications, Inc. Class A (b) | 2,600 | 207,298 | |
| Zuora, Inc. (a) | 180,400 | 2,523,796 | |
| 595,941,446 | |||
| Technology Hardware, Storage & Peripherals - 0.9% | |||
| Apple, Inc. | 925,994 | 162,113,770 | |
| Elecom Co. Ltd. | 44,100 | 1,424,434 | |
| Hewlett Packard Enterprise Co. | 67,500 | 926,100 | |
| HP, Inc. | 452,000 | 8,443,360 | |
| Pure Storage, Inc. Class A (a) | 451,000 | 7,152,860 | |
| Western Digital Corp. | 332,200 | 12,364,484 | |
| 192,425,008 | |||
| TOTAL INFORMATION TECHNOLOGY | 1,478,397,943 | ||
| MATERIALS - 1.2% | |||
| Chemicals - 0.6% | |||
| Amyris, Inc. (a)(b) | 297,800 | 1,009,542 | |
| C. Uyemura & Co. Ltd. | 62,700 | 3,691,932 | |
| Cabot Corp. | 7,400 | 295,556 | |
| CF Industries Holdings, Inc. | 1,173,210 | 47,209,970 | |
| DowDuPont, Inc. | 1,047,900 | 31,981,908 | |
| Innospec, Inc. | 145,611 | 11,752,264 | |
| Isamu Paint Co. Ltd. | 2,600 | 79,477 | |
| KPC Holdings Corp. | 7,154 | 347,282 | |
| LG Chemical Ltd. | 14,730 | 4,126,710 | |
| LyondellBasell Industries NV Class A | 30,100 | 2,234,925 | |
| NOF Corp. | 18,300 | 655,192 | |
| Sherwin-Williams Co. | 23,200 | 9,731,240 | |
| The Scotts Miracle-Gro Co. Class A | 161,500 | 14,459,095 | |
| Toho Acetylene Co. Ltd. | 78,450 | 955,552 | |
| Yara International ASA | 44,900 | 1,928,529 | |
| Yip's Chemical Holdings Ltd. | 450,000 | 146,373 | |
| 130,605,547 | |||
| Construction Materials - 0.1% | |||
| Eagle Materials, Inc. | 348,831 | 30,020,396 | |
| Kunimine Industries Co. Ltd. | 5,000 | 37,049 | |
| Mitani Sekisan Co. Ltd. | 14,700 | 383,705 | |
| 30,441,150 | |||
| Containers & Packaging - 0.3% | |||
| Crown Holdings, Inc. (a) | 864,230 | 47,904,269 | |
| Graphic Packaging Holding Co. | 1,197,300 | 15,564,900 | |
| Mayr-Melnhof Karton AG | 7,900 | 986,689 | |
| Silgan Holdings, Inc. | 16,200 | 469,638 | |
| 64,925,496 | |||
| Metals & Mining - 0.2% | |||
| ArcelorMittal SA Class A unit (b) | 86,200 | 1,268,864 | |
| Ausdrill Ltd. | 2,027,719 | 2,060,711 | |
| Chubu Steel Plate Co. Ltd. | 151,600 | 857,323 | |
| CI Resources Ltd. | 136,202 | 127,552 | |
| CK-SAN-ETSU Co. Ltd. | 32,800 | 828,829 | |
| Compania de Minas Buenaventura SA sponsored ADR | 150,400 | 2,281,568 | |
| Labrador Iron Ore Royalty Corp. | 4,700 | 109,606 | |
| Mount Gibson Iron Ltd. | 3,793,094 | 3,210,149 | |
| Pacific Metals Co. Ltd. | 52,000 | 1,053,796 | |
| Rio Tinto PLC sponsored ADR | 49,000 | 2,838,570 | |
| Royal Gold, Inc. | 164,500 | 14,474,355 | |
| Teck Resources Ltd. Class B (sub. vtg.) | 82,400 | 1,674,703 | |
| 30,786,026 | |||
| TOTAL MATERIALS | 256,758,219 | ||
| REAL ESTATE - 1.7% | |||
| Equity Real Estate Investment Trusts (REITs) - 1.6% | |||
| Alexander & Baldwin, Inc. | 349,120 | 8,054,198 | |
| Alexandria Real Estate Equities, Inc. | 48,100 | 7,042,321 | |
| American Tower Corp. | 280,817 | 58,626,165 | |
| Apartment Investment & Management Co. Class A | 317,600 | 15,864,120 | |
| Boston Properties, Inc. | 18,100 | 2,368,023 | |
| Brandywine Realty Trust (SBI) | 991,947 | 14,988,319 | |
| CorePoint Lodging, Inc. | 129,300 | 1,567,116 | |
| CoreSite Realty Corp. | 166,642 | 19,450,454 | |
| Corporate Office Properties Trust (SBI) | 211,700 | 5,893,728 | |
| Crown Castle International Corp. | 66,216 | 8,608,742 | |
| Douglas Emmett, Inc. | 288,976 | 11,642,843 | |
| Empire State Realty Trust, Inc. | 937,926 | 14,406,543 | |
| Equinix, Inc. | 50,300 | 24,435,237 | |
| Equity Commonwealth | 171,500 | 5,585,755 | |
| Equity Lifestyle Properties, Inc. | 40,800 | 4,963,728 | |
| Front Yard Residential Corp. Class B | 388,000 | 4,438,720 | |
| Healthcare Trust of America, Inc. | 890,460 | 25,636,343 | |
| Liberty Property Trust (SBI) | 440,624 | 20,916,421 | |
| Medical Properties Trust, Inc. | 664,630 | 11,817,121 | |
| Outfront Media, Inc. | 805,340 | 19,851,631 | |
| Potlatch Corp. | 72,493 | 2,439,389 | |
| Prologis, Inc. | 170,200 | 12,538,634 | |
| Public Storage | 4,900 | 1,165,612 | |
| Sabra Health Care REIT, Inc. | 1,082,700 | 20,885,283 | |
| Simon Property Group, Inc. | 116,400 | 18,867,276 | |
| Spirit Realty Capital, Inc. | 19,940 | 850,640 | |
| Store Capital Corp. | 38,100 | 1,303,782 | |
| VICI Properties, Inc. | 135,500 | 3,005,390 | |
| Welltower, Inc. | 135,300 | 10,989,066 | |
| 358,202,600 | |||
| Real Estate Management & Development - 0.1% | |||
| CBRE Group, Inc. (a) | 573,900 | 26,227,230 | |
| Cushman & Wakefield PLC | 211,900 | 3,572,634 | |
| Nisshin Fudosan Co. Ltd. | 64,700 | 256,102 | |
| 30,055,966 | |||
| TOTAL REAL ESTATE | 388,258,566 | ||
| UTILITIES - 1.6% | |||
| Electric Utilities - 1.1% | |||
| Edison International | 118,300 | 7,023,471 | |
| Entergy Corp. | 83,600 | 8,115,052 | |
| Evergy, Inc. | 440,597 | 25,616,310 | |
| Exelon Corp. | 1,190,573 | 57,242,750 | |
| FirstEnergy Corp. | 258,900 | 10,677,036 | |
| NextEra Energy, Inc. | 50,100 | 9,930,321 | |
| OGE Energy Corp. | 197,400 | 8,203,944 | |
| PG&E Corp. (a) | 171,000 | 2,924,100 | |
| Pinnacle West Capital Corp. | 12,600 | 1,183,266 | |
| PPL Corp. | 886,100 | 26,370,336 | |
| Southern Co. | 655,200 | 35,053,200 | |
| Vistra Energy Corp. | 197,300 | 4,648,388 | |
| Xcel Energy, Inc. | 697,300 | 39,983,182 | |
| 236,971,356 | |||
| Gas Utilities - 0.1% | |||
| Atmos Energy Corp. | 17,500 | 1,781,500 | |
| Busan City Gas Co. Ltd. | 54,716 | 1,703,229 | |
| China Resource Gas Group Ltd. | 648,000 | 3,103,801 | |
| Hokuriku Gas Co. | 6,200 | 164,015 | |
| Keiyo Gas Co. Ltd. | 3,000 | 84,757 | |
| Seoul City Gas Co. Ltd. | 11,774 | 751,835 | |
| South Jersey Industries, Inc. | 590,100 | 18,617,655 | |
| YESCO Co. Ltd. (a) | 22,407 | 782,328 | |
| 26,989,120 | |||
| Independent Power and Renewable Electricity Producers - 0.1% | |||
| NextEra Energy Partners LP | 44,700 | 1,977,975 | |
| NRG Energy, Inc. | 220,400 | 7,502,416 | |
| NRG Yield, Inc. Class C | 272,400 | 4,086,000 | |
| The AES Corp. | 82,200 | 1,298,760 | |
| 14,865,151 | |||
| Multi-Utilities - 0.3% | |||
| Avangrid, Inc. | 51,600 | 2,583,096 | |
| CenterPoint Energy, Inc. | 119,400 | 3,395,736 | |
| Dominion Resources, Inc. | 177,657 | 13,356,253 | |
| MDU Resources Group, Inc. | 792,600 | 19,561,368 | |
| Public Service Enterprise Group, Inc. | 161,700 | 9,501,492 | |
| Sempra Energy | 64,400 | 8,465,380 | |
| WEC Energy Group, Inc. | 232,800 | 18,752,040 | |
| 75,615,365 | |||
| Water Utilities - 0.0% | |||
| Select Energy Services, Inc. Class A (a) | 17,000 | 181,900 | |
| TOTAL UTILITIES | 354,622,892 | ||
| TOTAL COMMON STOCKS | |||
| (Cost $10,227,118,575) | 10,190,888,124 | ||
| Preferred Stocks - 0.0% | |||
| Convertible Preferred Stocks - 0.0% | |||
| HEALTH CARE - 0.0% | |||
| Health Care Equipment & Supplies - 0.0% | |||
| Becton, Dickinson & Co. Series A, 6.125% | 51,700 | 3,004,804 | |
| Nonconvertible Preferred Stocks - 0.0% | |||
| UTILITIES - 0.0% | |||
| Electric Utilities - 0.0% | |||
| Companhia Paranaense de Energia-Copel (PN-B) | 36,200 | 442,819 | |
| TOTAL PREFERRED STOCKS | |||
| (Cost $3,417,603) | 3,447,623 | ||
| Equity Funds - 52.9% | |||
| Large Blend Funds - 8.3% | |||
| Fidelity SAI U.S. Low Volatility Index Fund (g) | 40,962,113 | 563,638,676 | |
| Fidelity Total Market Index Fund (g) | 16,641,932 | 1,297,238,579 | |
| TOTAL LARGE BLEND FUNDS | 1,860,877,255 | ||
| Large Growth Funds - 33.1% | |||
| Fidelity Contrafund (g) | 124,755,856 | 1,541,982,376 | |
| Fidelity Growth Company Fund (g) | 107,888,144 | 1,975,431,920 | |
| Fidelity SAI U.S. Momentum Index Fund (g) | 114,239,171 | 1,466,830,954 | |
| Fidelity SAI U.S. Quality Index Fund (g) | 172,547,734 | 2,429,472,096 | |
| TOTAL LARGE GROWTH FUNDS | 7,413,717,346 | ||
| Large Value Funds - 9.3% | |||
| Fidelity Large Cap Value Enhanced Index Fund (g) | 125,868,541 | 1,533,078,826 | |
| Fidelity SAI U.S. Value Index Fund (g) | 60,841,324 | 550,613,983 | |
| TOTAL LARGE VALUE FUNDS | 2,083,692,809 | ||
| Small Blend Funds - 2.2% | |||
| Fidelity Small Cap Index Fund (g) | 26,736,716 | 503,719,722 | |
| TOTAL EQUITY FUNDS | |||
| (Cost $11,976,632,646) | 11,862,007,132 | ||
| Money Market Funds - 2.5% | |||
| Fidelity Cash Central Fund 2.41% (h) | 339,034,976 | 339,102,783 | |
| Fidelity Securities Lending Cash Central Fund 2.42% (h)(i) | 216,245,852 | 216,267,476 | |
| TOTAL MONEY MARKET FUNDS | |||
| (Cost $555,367,932) | 555,370,259 | ||
| TOTAL INVESTMENT IN SECURITIES - 100.9% | |||
| (Cost $22,762,536,756) | 22,611,713,138 | ||
| NET OTHER ASSETS (LIABILITIES) - (0.9)% | (200,009,618) | ||
| NET ASSETS - 100% | $22,411,703,520 |
| Written Options | ||||||
| Counterparty | Number of Contracts | Notional Amount | Exercise Price | Expiration Date | Value | |
| Call Options | ||||||
| Cisco Systems, Inc. | Chicago Board Options Exchange | 409 | $2,128,027 | $55.00 | 6/21/19 | $(9,203) |
| Microsoft Corp. | Chicago Board Options Exchange | 1,498 | 18,527,264 | 115.00 | 6/21/19 | (1,419,354) |
| Procter & Gamble Co. | Chicago Board Options Exchange | 353 | 3,632,723 | 97.50 | 6/21/19 | (210,918) |
| Procter & Gamble Co. | Chicago Board Options Exchange | 512 | 5,268,992 | 105.00 | 6/21/19 | (46,080) |
| Visa, Inc. | Chicago Board Options Exchange | 272 | 4,388,176 | 155.00 | 6/21/19 | (210,120) |
| TOTAL WRITTEN OPTIONS | $(1,895,675) |
Legend
(a) Non-income producing
(b) Security or a portion of the security is on loan at period end.
(c) Level 3 security
(d) Security or a portion of the security is pledged as collateral for call options written. At period end, the value of securities pledged amounted to $33,945,182.
(e) Security exempt from registration under Rule 144A of the Securities Act of 1933. These securities may be resold in transactions exempt from registration, normally to qualified institutional buyers. At the end of the period, the value of these securities amounted to $12,071,388 or 0.1% of net assets.
(f) Security or a portion of the security purchased on a delayed delivery or when-issued basis.
(g) Affiliated Fund
(h) Affiliated fund that is generally available only to investment companies and other accounts managed by Fidelity Investments. The rate quoted is the annualized seven-day yield of the fund at period end. A complete unaudited listing of the fund's holdings as of its most recent quarter end is available upon request. In addition, each Fidelity Central Fund's financial statements, which are not covered by the Fund's Report of Independent Registered Public Accounting Firm, are available on the SEC's website or upon request.
(i) Investment made with cash collateral received from securities on loan.
Affiliated Central Funds
Information regarding fiscal year to date income earned by the Fund from investments in Fidelity Central Funds is as follows:
| Fund | Income earned |
| Fidelity Cash Central Fund | $6,643,245 |
| Fidelity Securities Lending Cash Central Fund | 822,015 |
| Total | $7,465,260 |
Amounts in the income column in the above table include any capital gain distributions from underlying funds, which are presented in the corresponding line-item in the Statement of Operations, if applicable.
Affiliated Underlying Funds
Fiscal year to date information regarding the Fund's investments in affiliated Underlying Funds, excluding any Money Market Central Funds, is presented below. Exchanges between classes of the same affiliated Underlying Funds may occur.
| Affil- iate | Value, beginning of period | Purchases | Sales Proceeds(a) | Dividend Income | Realized Gain (loss) | Change in Unrealized appreciation (depreciation) | Value, end of period |
| Fidelity Con- tra- fund | $864,145,253 | $730,793,458 | $-- | $80,793,458 | $-- | $(52,956,335) | $1,541,982,376 |
| Fidelity Gro- wth Com- pany Fund | 1,714,598,600 | 389,560,014 | -- | 89,560,013 | -- | (128,726,694) | 1,975,431,920 |
| Fidelity Lar- ge Cap St- ock Fund | 254,744,823 | -- | 257,324,133 | -- | 8,193,103 | (5,613,793) | -- |
| Fidelity Lar- ge Cap Val- ue En- han- ced In- dex Fund | 1,823,547,037 | 289,538,378 | 500,000,000 | 89,538,384 | 19,380,848 | (99,387,437) | 1,533,078,826 |
| Fidelity SAI U.S. Low Vola- tility Index Fund | 321,864,741 | 200,398,239 | -- | 12,237,281 | -- | 41,375,696 | 563,638,676 |
| Fidelity SAI U.S. Mo- men- tum In- dex Fund | 502,503,608 | 972,158,266 | -- | 31,051,113 | -- | (7,830,920) | 1,466,830,954 |
| Fidelity SAI U.S. Qua- lity Index Fund | 1,628,768,215 | 757,626,119 | -- | 47,626,114 | -- | 43,077,762 | 2,429,472,096 |
| Fidelity SAI U.S. Value Index Fund | 684,297,013 | 165,308,968 | 250,000,000 | 25,477,997 | (1,537,928) | (47,454,070) | 550,613,983 |
| Fidelity Sm- all Cap Index Fund | 134,732,836 | 402,510,655 | -- | 12,510,655 | -- | (33,523,769) | 503,719,722 |
| Fidelity Total Mar- ket Index Fund | 382,159,283 | 6,461,729,321 | 5,476,113,234 | 28,538,666 | (49,546,099) | (20,990,692) | 1,297,238,579 |
| $8,311,361,409 | $10,369,623,418 | $6,483,437,367 | $417,333,681 | $(23,510,076) | $(312,030,252) | $11,862,007,132 |
(a) Includes the value of shares redeemed through in-kind transactions, if applicable. See the Notes to Financial Statements for additional details.
Amounts in the income column in the above table include any capital gain distributions from underlying funds, which are presented in the corresponding line-item in the Statement of Operations, if applicable.
Investment Valuation
The following is a summary of the inputs used, as of May 31, 2019, involving the Fund's assets and liabilities carried at fair value. The inputs or methodology used for valuing securities may not be an indication of the risk associated with investing in those securities. For more information on valuation inputs, and their aggregation into the levels used below, please refer to the Investment Valuation section in the accompanying Notes to Financial Statements.
| Valuation Inputs at Reporting Date: | ||||
| Description | Total | Level 1 | Level 2 | Level 3 |
| Investments in Securities: | ||||
| Equities: | ||||
| Communication Services | $891,280,453 | $860,362,202 | $30,918,251 | $-- |
| Consumer Discretionary | 850,035,150 | 828,072,094 | 21,959,436 | 3,620 |
| Consumer Staples | 743,568,936 | 714,886,661 | 28,682,275 | -- |
| Energy | 708,801,742 | 704,580,712 | 4,221,030 | -- |
| Financials | 1,841,879,860 | 1,792,908,077 | 48,971,783 | -- |
| Health Care | 1,573,220,471 | 1,449,547,379 | 123,673,092 | -- |
| Industrials | 1,107,068,696 | 1,044,399,382 | 62,669,314 | -- |
| Information Technology | 1,478,397,943 | 1,468,822,147 | 9,575,796 | -- |
| Materials | 256,758,219 | 248,215,364 | 8,542,855 | -- |
| Real Estate | 388,258,566 | 388,002,464 | 256,102 | -- |
| Utilities | 355,065,711 | 354,816,939 | 248,772 | -- |
| Equity Funds | 11,862,007,132 | 11,862,007,132 | -- | -- |
| Money Market Funds | 555,370,259 | 555,370,259 | -- | -- |
| Total Investments in Securities: | $22,611,713,138 | $22,271,990,812 | $339,718,706 | $3,620 |
| Derivative Instruments: | ||||
| Liabilities | ||||
| Written Options | $(1,895,675) | $(1,895,675) | $-- | $-- |
| Total Liabilities | $(1,895,675) | $(1,895,675) | $-- | $-- |
| Total Derivative Instruments: | $(1,895,675) | $(1,895,675) | $-- | $-- |
Value of Derivative Instruments
The following table is a summary of the Fund's value of derivative instruments by primary risk exposure as of May 31, 2019. For additional information on derivative instruments, please refer to the Derivative Instruments section in the accompanying Notes to Financial Statements.
| Primary Risk Exposure / Derivative Type | Value | |
| Asset | Liability | |
| Equity Risk | ||
| Written Options(a) | $0 | $(1,895,675) |
| Total Equity Risk | 0 | (1,895,675) |
| Total Value of Derivatives | $0 | $(1,895,675) |
(a) Gross value is presented in the Statement of Assets and Liabilities in the written options, at value line-item.
See accompanying notes which are an integral part of the financial statements.
Financial Statements
Statement of Assets and Liabilities
| May 31, 2019 | ||
| Assets | ||
| Investment in securities, at value (including securities loaned of $207,321,743) — See accompanying schedule: Unaffiliated issuers (cost $10,230,536,178) | $10,194,335,747 | |
| Fidelity Central Funds (cost $555,367,932) | 555,370,259 | |
| Other affiliated issuers (cost $11,976,632,646) | 11,862,007,132 | |
| Total Investment in Securities (cost $22,762,536,756) | $22,611,713,138 | |
| Cash | 1,606,916 | |
| Foreign currency held at value (cost $30,333) | 30,403 | |
| Receivable for investments sold | 21,223,788 | |
| Receivable for fund shares sold | 35,348,211 | |
| Dividends receivable | 25,275,106 | |
| Distributions receivable from Fidelity Central Funds | 915,667 | |
| Prepaid expenses | 74,418 | |
| Other receivables | 95,304 | |
| Total assets | 22,696,282,951 | |
| Liabilities | ||
| Payable for investments purchased | ||
| Regular delivery | $48,437,136 | |
| Delayed delivery | 185,768 | |
| Payable for fund shares redeemed | 13,761,554 | |
| Accrued management fee | 2,551,847 | |
| Written options, at value (premium received $874,123) | 1,895,675 | |
| Other affiliated payables | 151,021 | |
| Other payables and accrued expenses | 1,325,446 | |
| Collateral on securities loaned | 216,270,984 | |
| Total liabilities | 284,579,431 | |
| Net Assets | $22,411,703,520 | |
| Net Assets consist of: | ||
| Paid in capital | $22,517,845,971 | |
| Total distributable earnings (loss) | (106,142,451) | |
| Net Assets, for 2,305,602,834 shares outstanding | $22,411,703,520 | |
| Net Asset Value, offering price and redemption price per share ($22,411,703,520 ÷ 2,305,602,834 shares) | $9.72 |
See accompanying notes which are an integral part of the financial statements.
Statement of Operations
| Year ended May 31, 2019 | ||
| Investment Income | ||
| Dividends: | ||
| Unaffiliated issuers | $190,467,326 | |
| Affiliated issuers | 182,768,372 | |
| Interest | 6,600 | |
| Income from Fidelity Central Funds | 7,465,260 | |
| Total income | 380,707,558 | |
| Expenses | ||
| Management fee | $75,042,970 | |
| Transfer agent fees | 1,026,225 | |
| Accounting and security lending fees | 1,677,008 | |
| Custodian fees and expenses | 394,702 | |
| Independent trustees' fees and expenses | 212,019 | |
| Registration fees | 2,125,606 | |
| Audit | 83,937 | |
| Legal | 52,760 | |
| Miscellaneous | 41,693 | |
| Total expenses before reductions | 80,656,920 | |
| Expense reductions | (48,756,086) | |
| Total expenses after reductions | 31,900,834 | |
| Net investment income (loss) | 348,806,724 | |
| Realized and Unrealized Gain (Loss) | ||
| Net realized gain (loss) on: | ||
| Investment securities: | ||
| Unaffiliated issuers | (201,956,657) | |
| Fidelity Central Funds | (7,135) | |
| Other affiliated issuers | (23,510,076) | |
| Foreign currency transactions | (104,848) | |
| Futures contracts | 6,008,403 | |
| Written options | 527,256 | |
| Capital gain distributions from underlying funds: | ||
| Affiliated issuers | 234,565,309 | |
| Total net realized gain (loss) | 15,522,252 | |
| Change in net unrealized appreciation (depreciation) on: | ||
| Investment securities: | ||
| Unaffiliated issuers (net of increase in deferred foreign taxes of $118,765) | (84,944,357) | |
| Fidelity Central Funds | 2,327 | |
| Other affiliated issuers | (312,030,252) | |
| Assets and liabilities in foreign currencies | 70,096 | |
| Futures contracts | 237,595 | |
| Written options | (1,021,552) | |
| Total change in net unrealized appreciation (depreciation) | (397,686,143) | |
| Net gain (loss) | (382,163,891) | |
| Net increase (decrease) in net assets resulting from operations | $(33,357,167) |
See accompanying notes which are an integral part of the financial statements.
Statement of Changes in Net Assets
| Year ended May 31, 2019 | For the period March 20, 2018 (commencement of operations) to May 31, 2018 |
|
| Increase (Decrease) in Net Assets | ||
| Operations | ||
| Net investment income (loss) | $348,806,724 | $12,312,503 |
| Net realized gain (loss) | 15,522,252 | 101,039,612 |
| Change in net unrealized appreciation (depreciation) | (397,686,143) | 245,771,205 |
| Net increase (decrease) in net assets resulting from operations | (33,357,167) | 359,123,320 |
| Distributions to shareholders | (408,509,406) | – |
| Total distributions | (408,509,406) | – |
| Share transactions | ||
| Proceeds from sales of shares | 10,552,036,542 | 16,555,025,270 |
| Reinvestment of distributions | 407,855,035 | – |
| Cost of shares redeemed | (4,743,732,730) | (276,737,344) |
| Net increase (decrease) in net assets resulting from share transactions | 6,216,158,847 | 16,278,287,926 |
| Total increase (decrease) in net assets | 5,774,292,274 | 16,637,411,246 |
| Net Assets | ||
| Beginning of period | 16,637,411,246 | – |
| End of period | $22,411,703,520 | $16,637,411,246 |
| Other Information | ||
| Undistributed net investment income end of period | $12,240,858 | |
| Shares | ||
| Sold | 1,069,485,869 | 1,698,455,031 |
| Issued in reinvestment of distributions | 45,736,139 | – |
| Redeemed | (480,126,871) | (27,947,334) |
| Net increase (decrease) | 635,095,137 | 1,670,507,697 |
See accompanying notes which are an integral part of the financial statements.
Financial Highlights
Strategic Advisers Fidelity U.S. Total Stock Fund
| Years ended May 31, | 2019 | 2018 A |
| Selected Per–Share Data | ||
| Net asset value, beginning of period | $9.96 | $10.00 |
| Income from Investment Operations | ||
| Net investment income (loss)B | .18 | .01 |
| Net realized and unrealized gain (loss) | (.20) | (.05)C |
| Total from investment operations | (.02) | (.04) |
| Distributions from net investment income | (.09)D | – |
| Distributions from net realized gain | (.13)D | – |
| Total distributions | (.22) | – |
| Net asset value, end of period | $9.72 | $9.96 |
| Total ReturnE,F | (.04)% | (.40)% |
| Ratios to Average Net AssetsG,H | ||
| Expenses before reductions | .42% | .54%I |
| Expenses net of fee waivers, if any | .17% | .29%I,J |
| Expenses net of all reductions | .17% | .29%I,J |
| Net investment income (loss) | 1.81% | .55%I |
| Supplemental Data | ||
| Net assets, end of period (000 omitted) | $22,411,704 | $16,637,411 |
| Portfolio turnover rateK | 61% | 126%L,M |
A For the period March 20, 2018 (commencement of operations) to May 31, 2018.
B Calculated based on average shares outstanding during the period.
C The amount shown for a share outstanding does not correspond with the aggregate net gain (loss) on investments for the period due to the timing of sales and repurchases of shares in relation to fluctuating market values of the investments of the Fund.
D The amounts shown reflect certain reclassifications related to book to tax differences that were made in the year shown.
E Total returns for periods of less than one year are not annualized.
F Total returns would have been lower if certain expenses had not been reduced during the applicable periods shown.
G Fees and expenses of any underlying Fidelity Central Funds are not included in the Fund's expense ratio. The Fund indirectly bears its proportionate share of the expenses of any underlying Fidelity Central Funds.
H Expense ratios reflect operating expenses of the Fund. Expenses before reductions do not reflect amounts reimbursed by the investment adviser or reductions from brokerage service arrangements or reductions from other expense offset arrangements and do not represent the amount paid by the Fund during periods when reimbursements or reductions occur. Expense ratios before reductions for start-up periods may not be representative of longer term operating periods. Expenses net of fee waivers reflect expenses after reimbursement by the investment adviser but prior to reductions from brokerage service arrangements or other expense offset arrangements. Expenses net of all reductions represent the net expenses paid by the Fund. Fees and expenses of the Underlying Funds are not included in the Fund's annualized ratios. The Fund indirectly bears its proportionate share of the expenses of the Underlying Funds.
I Annualized
J Audit fees are not annualized.
K Amount does not include the portfolio activity of any Underlying Funds.
L Portfolio turnover rate excludes securities received or delivered in-kind.
M Amount not annualized.
See accompanying notes which are an integral part of the financial statements.
Notes to Financial Statements
For the period ended May 31, 2019
1. Organization.
Strategic Advisers Fidelity U.S. Total Stock Fund (the Fund) is a fund of Fidelity Rutland Square Trust II (the Trust), and is authorized to issue an unlimited number of shares. The Trust is registered under the Investment Company Act of 1940, as amended (the 1940 Act), as an open-end management investment company organized as a Delaware statutory trust. The Fund is offered exclusively to certain clients of Strategic Advisers LLC (Strategic Advisers), an affiliate of Fidelity Management & Research Company (FMR).
2. Significant Accounting Policies.
The Fund is an investment company and applies the accounting and reporting guidance of the Financial Accounting Standards Board (FASB) Accounting Standards Codification Topic 946 Financial Services – Investments Companies. The financial statements have been prepared in conformity with accounting principles generally accepted in the United States of America (GAAP), which require management to make certain estimates and assumptions at the date of the financial statements. Actual results could differ from those estimates. Subsequent events, if any, through the date that the financial statements were issued have been evaluated in the preparation of the financial statements. The following summarizes the significant accounting policies of the Fund:
Investment Valuation. Investments are valued as of 4:00 p.m. Eastern time on the last calendar day of the period. The Board of Trustees (the Board) has delegated the day to day responsibility for the valuation of the Fund's investments to the Fair Value Committee (the Committee) established by the Fund's investment adviser. In accordance with valuation policies and procedures approved by the Board, the Fund attempts to obtain prices from one or more third party pricing vendors or brokers to value its investments. When current market prices, quotations or currency exchange rates are not readily available or reliable, investments will be fair valued in good faith by the Committee, in accordance with procedures adopted by the Board. Factors used in determining fair value vary by investment type and may include market or investment specific events. The frequency with which these procedures are used cannot be predicted and they may be utilized to a significant extent. The Committee oversees the Fund's valuation policies and procedures and reports to the Board on the Committee's activities and fair value determinations. The Board monitors the appropriateness of the procedures used in valuing the Fund's investments and ratifies the fair value determinations of the Committee.
The Fund categorizes the inputs to valuation techniques used to value its investments into a disclosure hierarchy consisting of three levels as shown below:
- Level 1 – quoted prices in active markets for identical investments
- Level 2 – other significant observable inputs (including quoted prices for similar investments, interest rates, prepayment speeds, etc.)
- Level 3 – unobservable inputs (including the Fund's own assumptions based on the best information available)
Valuation techniques used to value the Fund's investments by major category are as follows:
Equity securities, including restricted securities, for which market quotations are readily available, are valued at the last reported sale price or official closing price as reported by a third party pricing vendor on the primary market or exchange on which they are traded and are categorized as Level 1 in the hierarchy. In the event there were no sales during the day or closing prices are not available, securities are valued at the last quoted bid price or may be valued using the last available price and are generally categorized as Level 2 in the hierarchy. For foreign equity securities, when market or security specific events arise, comparisons to the valuation of American Depositary Receipts (ADRs), futures contracts, Exchange-Traded Funds (ETFs) and certain indexes as well as quoted prices for similar securities may be used and would be categorized as Level 2 in the hierarchy. For equity securities, including restricted securities, where observable inputs are limited, assumptions about market activity and risk are used and these securities may be categorized as Level 3 in the hierarchy.
Exchange-traded options are valued using the last sale price or, in the absence of a sale, the last offering price and are categorized as Level 1 in the hierarchy.
Investments in open-end mutual funds, including the Fidelity Central Funds, are valued at their closing net asset value (NAV) each business day and are categorized as Level 1 in the hierarchy.
Changes in valuation techniques may result in transfers in or out of an assigned level within the disclosure hierarchy. The aggregate value of investments by input level as of May 31, 2019 is included at the end of the Fund's Schedule of Investments.
Foreign Currency. The Fund may use foreign currency contracts to facilitate transactions in foreign-denominated securities. Gains and losses from these transactions may arise from changes in the value of the foreign currency or if the counterparties do not perform under the contracts' terms.
Foreign-denominated assets, including investment securities, and liabilities are translated into U.S. dollars at the exchange rates at period end. Purchases and sales of investment securities, income and dividends received and expenses denominated in foreign currencies are translated into U.S. dollars at the exchange rate in effect on the transaction date.
The effects of exchange rate fluctuations on investments are included with the net realized and unrealized gain (loss) on investment securities. Other foreign currency transactions resulting in realized and unrealized gain (loss) are disclosed separately.
Investment Transactions and Income. For financial reporting purposes, the Fund's investment holdings and NAV include trades executed through the end of the last business day of the period. The NAV per share for processing shareholder transactions is calculated as of the close of business of the New York Stock Exchange (NYSE), normally 4:00 p.m. Eastern time and includes trades executed through the end of the prior business day. Gains and losses on securities sold are determined on the basis of identified cost. Dividend income is recorded on the ex-dividend date, except for certain dividends from foreign securities where the ex-dividend date may have passed, which are recorded as soon as the Fund is informed of the ex-dividend date. Non-cash dividends included in dividend income, if any, are recorded at the fair market value of the securities received. Income and capital gain distributions from Fidelity Central Funds, if any, are recorded on the ex-dividend date. Income and capital gain distributions from Underlying Funds, if any, are recorded on the ex-dividend date. Certain distributions received by the Fund represent a return of capital or capital gain. The Fund determines the components of these distributions subsequent to the ex-dividend date, based upon receipt of tax filings or other correspondence relating to the underlying investment. These distributions are recorded as a reduction of cost of investments and/or as a realized gain. Interest income is accrued as earned and includes coupon interest and amortization of premium and accretion of discount on debt securities as applicable. Investment income is recorded net of foreign taxes withheld where recovery of such taxes is uncertain.
Expenses. Expenses directly attributable to a fund are charged to that fund. Expenses attributable to more than one fund are allocated among the respective funds on the basis of relative net assets or other appropriate methods. Expense estimates are accrued in the period to which they relate and adjustments are made when actual amounts are known.
Deferred Trustee Compensation. Under a Deferred Compensation Plan (the Plan), certain independent Trustees have elected to defer receipt of a portion of their annual compensation. Deferred amounts are invested in a cross-section of Strategic Advisers funds, are marked-to-market and remain in the Fund until distributed in accordance with the Plan. The investment of deferred amounts and the offsetting payable to the Trustees of $15,872 are included in the accompanying Statement of Assets and Liabilities in other receivables and other payables and accrued expenses, respectively.
Income Tax Information and Distributions to Shareholders. Each year, the Fund intends to qualify as a regulated investment company under Subchapter M of the Internal Revenue Code, including distributing substantially all of its taxable income and realized gains. As a result, no provision for U.S. Federal income taxes is required. As of May 31, 2019, the Fund did not have any unrecognized tax benefits in the financial statements; nor is the Fund aware of any tax positions for which it is reasonably possible that the total amounts of unrecognized tax benefits will significantly change in the next twelve months. The Fund files a U.S. federal tax return, in addition to state and local tax returns as required. The Fund's federal income tax returns are subject to examination by the Internal Revenue Service (IRS) for a period of three fiscal years after they are filed. State and local tax returns may be subject to examination for an additional fiscal year depending on the jurisdiction. Foreign taxes are provided for based on the Fund's understanding of the tax rules and rates that exist in the foreign markets in which it invests. The Fund is subject to a tax imposed on capital gains by certain countries in which it invests. An estimated deferred tax liability for net unrealized appreciation on the applicable securities is included in Other payables and accrued expenses on the Statement of Assets & Liabilities.
Distributions are declared and recorded on the ex-dividend date. Income and capital gain distributions are determined in accordance with income tax regulations, which may differ from GAAP. These differences resulted in distribution reclassifications. In addition, the Fund claimed a portion of the payment made to redeeming shareholders as a distribution for income tax purposes.
Capital accounts within the financial statements are adjusted for permanent book-tax differences. These adjustments have no impact on net assets or the results of operations. Capital accounts are not adjusted for temporary book-tax differences which will reverse in a subsequent period.
Book-tax differences are primarily due to the short-term gain distributions from the Underlying Funds, futures contracts, options, foreign currency transactions, passive foreign investment companies (PFIC), partnerships, deferred trustees compensation and losses deferred due to wash sales.
As of period end, the cost and unrealized appreciation (depreciation) in securities, and derivatives if applicable, for federal income tax purposes were as follows:
| Gross unrealized appreciation | $928,514,364 |
| Gross unrealized depreciation | (1,193,048,635) |
| Net unrealized appreciation (depreciation) | $(264,534,271) |
| Tax Cost | $22,874,351,734 |
The tax-based components of distributable earnings as of period end were as follows:
| Undistributed ordinary income | $116,508,259 |
| Undistributed long-term capital gain | $41,969,589 |
| Net unrealized appreciation (depreciation) on securities and other investments | $(264,485,663) |
The tax character of distributions paid was as follows:
| May 31, 2019 | |
| Ordinary Income | $388,841,180 |
| Long-term Capital Gains | 19,668,226 |
| Total | $408,509,406 |
Delayed Delivery Transactions and When-Issued Securities. During the period, the Fund transacted in securities on a delayed delivery or when-issued basis. Payment and delivery may take place after the customary settlement period for that security. The price of the underlying securities and the date when the securities will be delivered and paid for are fixed at the time the transaction is negotiated. The securities purchased on a delayed delivery or when-issued basis are identified as such in the Fund's Schedule of Investments. Losses may arise due to changes in the value of the underlying securities or if the counterparty does not perform under the contract's terms, or if the issuer does not issue the securities due to political, economic, or other factors.
Restricted Securities. The Fund may invest in securities that are subject to legal or contractual restrictions on resale. These securities generally may be resold in transactions exempt from registration or to the public if the securities are registered. Disposal of these securities may involve time-consuming negotiations and expense, and prompt sale at an acceptable price may be difficult. Information regarding restricted securities is included at the end of the Fund's Schedule of Investments.
New Rule Issuance. During August 2018, the U.S. Securities and Exchange Commission issued Final Rule Release No. 33-10532, Disclosure Update and Simplification. This Final Rule includes amendments specific to registered investment companies that are intended to eliminate overlap in disclosure requirements between Regulation S-X and GAAP. In accordance with these amendments, certain line-items in the Fund's financial statements have been combined or removed for the current period as outlined in the table below.
| Financial Statement | Current Line-Item Presentation (As Applicable) | Prior Line-Item Presentation (As Applicable) |
| Statement of Assets and Liabilities | Total distributable earnings (loss) | Undistributed/Distributions in excess of/Accumulated net investment income (loss) Accumulated/Undistributed net realized gain (loss) Net unrealized appreciation (depreciation) |
| Statement of Changes in Net Assets | N/A - removed | Undistributed/Distributions in excess of/Accumulated net investment income (loss) end of period |
| Statement of Changes in Net Assets | Distributions to shareholders | Distributions to shareholders from net investment income Distributions to shareholders from net realized gain |
3. Derivative Instruments.
Risk Exposures and the Use of Derivative Instruments. The Fund's investment objective allows the Fund to enter into various types of derivative contracts, including futures contracts and options. Derivatives are investments whose value is primarily derived from underlying assets, indices or reference rates and may be transacted on an exchange or over-the-counter (OTC). Derivatives may involve a future commitment to buy or sell a specified asset based on specified terms, to exchange future cash flows at periodic intervals based on a notional principal amount, or for one party to make one or more payments upon the occurrence of specified events in exchange for periodic payments from the other party.
The Fund used derivatives to increase returns and to manage exposure to certain risks as defined below. The success of any strategy involving derivatives depends on analysis of numerous economic factors, and if the strategies for investment do not work as intended, the Fund may not achieve its objectives.
The Fund's use of derivatives increased or decreased its exposure to the following risk:
| Equity Risk | Equity risk relates to the fluctuations in the value of financial instruments as a result of changes in market prices (other than those arising from interest rate risk or foreign exchange risk), whether caused by factors specific to an individual investment, its issuer, or all factors affecting all instruments traded in a market or market segment. |
The Fund is also exposed to additional risks from investing in derivatives, such as liquidity risk and counterparty credit risk. Liquidity risk is the risk that the Fund will be unable to close out the derivative in the open market in a timely manner. Counterparty credit risk is the risk that the counterparty will not be able to fulfill its obligation to the Fund. Counterparty credit risk related to exchange-traded futures contracts and exchange-traded options may be mitigated by the protection provided by the exchange on which they trade.
Investing in derivatives may involve greater risks than investing in the underlying assets directly and, to varying degrees, may involve risk of loss in excess of any initial investment and collateral received and amounts recognized in the Statement of Assets and Liabilities. In addition, there may be the risk that the change in value of the derivative contract does not correspond to the change in value of the underlying instrument.
Net Realized Gain (Loss) and Change in Net Unrealized Appreciation (Depreciation) on Derivatives. The table below, which reflects the impacts of derivatives on the financial performance of the Fund, summarizes the net realized gain (loss) and change in net unrealized appreciation (depreciation) for derivatives during the period as presented in the Statement of Operations.
| Primary Risk Exposure / Derivative Type | Net Realized Gain (Loss) | Change in Net Unrealized Appreciation (Depreciation) |
| Equity Risk | ||
| Futures Contracts | $6,008,403 | $237,595 |
| Written Options | 527,256 | (1,021,552) |
| Total Equity Risk | $6,535,659 | $(783,957) |
| Totals | $6,535,659 | $(783,957) |
A summary of the value of derivatives by primary risk exposure as of period end, if any, is included at the end of the Schedule of Investments.
Futures Contracts. A futures contract is an agreement between two parties to buy or sell a specified underlying instrument for a fixed price at a specified future date. The Fund used futures contracts to manage its exposure to the stock market.
Upon entering into a futures contract, a fund is required to deposit either cash or securities (initial margin) with a clearing broker in an amount equal to a certain percentage of the face value of the contract. Futures contracts are marked-to-market daily and subsequent daily payments (variation margin) are made or received by a fund depending on the daily fluctuations in the value of the futures contracts and are recorded as unrealized appreciation or (depreciation). This receivable and/or payable, if any, is included in daily variation margin on futures contracts in the Statement of Assets and Liabilities. Realized gain or (loss) is recorded upon the expiration or closing of a futures contract. The net realized gain (loss) and change in net unrealized appreciation (depreciation) on futures contracts during the period is presented in the Statement of Operations.
Any open futures contracts at period end are presented in the Schedule of Investments under the caption "Futures Contracts". The notional amount at value reflects each contract's exposure to the underlying instrument or index at period end. For the period, the average monthly notional amount at value for futures contracts in the aggregate was $9,315,634.
Options. Options give the purchaser the right, but not the obligation, to buy (call) or sell (put) an underlying security or financial instrument at an agreed exercise or strike price between or on certain dates. Options obligate the seller (writer) to buy (put) or sell (call) an underlying instrument at the exercise or strike price or cash settle an underlying derivative instrument if the holder exercises the option on or before the expiration date.
The Fund used exchange-traded written covered call options to manage its exposure to the market. When the Fund writes a covered call option, the Fund holds the underlying instrument which must be delivered to the holder upon the exercise of the option.
Upon entering into a written options contract, the Fund will receive a premium. Premiums received are reflected as a liability on the Statement of Assets and Liabilities. Options are valued daily and any unrealized appreciation (depreciation) is reflected on the Statement of Assets and Liabilities. When a written option is exercised, the premium is added to the proceeds from the sale of the underlying instrument in determining the gain or loss realized on that investment. When an option is closed the Fund will realize a gain or loss depending on whether the proceeds or amount paid for the closing sale transaction are greater or less than the premium received. When an option expires, gains and losses are realized to the extent of premiums received. The net realized gain (loss) on closed and expired written options and the change in net unrealized appreciation (depreciation) on written options are presented in the Statement of Operations.
Writing call options tends to decrease exposure to the underlying instrument and risk of loss is the change in value in excess of the premium received.
Any open options at period end are presented in the Schedule of Investments under the caption "Written Options" and are representative of volume of activity during the period.
4. Purchases and Sales of Investments.
Purchases and sales of securities (including the Underlying Fund shares and in-kind transactions), other than short-term securities, aggregated $18,208,524,512 and $11,671,397,482, respectively.
5. Fees and Other Transactions with Affiliates.
Management Fee. Strategic Advisers (the investment adviser) provides the Fund with investment management related services. For these services, the Fund pays a monthly management fee to the investment adviser. The management fee is calculated by adding the annual management fee rate of .25% of the Fund's average net assets throughout the month payable to the investment adviser to the aggregate of the fee rates, payable monthly, to the Fund's sub-advisers. The Fund's maximum aggregate management fee will not exceed 1.00% of the Fund's average net assets. For the reporting period, the total annualized management fee rate was .39% of the Fund's average net assets.
During the period, the investment adviser waived its management fee as described in the Expense Reductions note.
Sub-Advisers. FIAM LLC (an affiliate of the investment adviser) served as a sub-adviser for the Fund during the period. Sub-advisers provide discretionary investment advisory services for their allocated portion of the Fund's assets and are paid by the investment adviser and not the Fund for providing these services.
Geode Capital Management, LLC (Geode) has been retained to serve as a sub-adviser for the Fund. As of the date of this report, however, Geode has not been allocated any portion of the Fund's assets. Geode in the future may provide discretionary investment advisory services for an allocated portion of the Fund's assets and will be paid by the investment adviser for providing these services.
Transfer Agent Fees. Fidelity Investments Institutional Operations Company, Inc. (FIIOC), an affiliate of the investment adviser, is the Fund's transfer, dividend disbursing and shareholder servicing agent. Effective July 1, 2018 transfer agent fees are not paid by the Fund and are instead paid by the investment adviser or an affiliate. Prior to July 1, 2018 FIIOC received account fees and asset-based fees that varied according to account size and type of account. The Fund did not directly pay transfer agent fees with respect to the portion of its assets invested in Underlying Funds. FIIOC paid for typesetting, printing and mailing of shareholder reports, except proxy statements. For the period, the transfer agent fees were equivalent to an annualized rate of .01% of average net assets.
Accounting and Security Lending Fees. Fidelity Service Company, Inc. (FSC), an affiliate of the investment adviser, maintains the Fund's accounting records. The accounting fee is based on the level of average net assets for each month. Prior to April 1, 2019, FSC had a separate agreement with the Fund for administration of the security lending program, based on the number and duration of lending transactions. For the period, the total fees paid for accounting and administration of securities lending were equivalent to an annual rate of .01%.
During June 2019, the Board approved that effective July 1, 2019 accounting fees will not be paid by the Fund and will instead be paid by the investment adviser or an affiliate.
Brokerage Commissions. The Fund placed a portion of its portfolio transactions with brokerage firms which are affiliates of the investment adviser. Brokerage commissions are included in net realized gain (loss) and change in net unrealized appreciation (depreciation) in the Statement of Operations. The commissions paid to these affiliated firms were $144,310 for the period.
Interfund Trades. The Fund may purchase from or sell securities to other funds affiliated with each sub-adviser under procedures adopted by the Board. The procedures have been designed to ensure these interfund trades are executed in accordance with Rule 17a-7 of the 1940 Act. Interfund trades are included within the respective purchases and sales amounts shown in the Purchases and Sales of Investments note.
Affiliated Exchanges In-Kind. During the period, the Fund redeemed 7,586,207 shares of Fidelity Large Cap Stock Fund in exchange for investments with a value of $257,324,134. The net realized gains of $8,193,103 on the Fund's redemptions of Fidelity Large Cap Stock Fund shares is included in "Net realized gain (loss) on Investment securities: Other afliated issuers" in the accompanying Statement of Operations. The Fund recognized net gains on the exchanges for federal income tax purposes.
Prior Fiscal Year Exchanges In-Kind. During the prior period, an affiliated entity completed an exchange in-kind with the Fund. The affiliated entity delivered shares of the Underlying Fidelity Funds, see below table, and cash with total value of $3,633,831,512 in exchange for 373,083,317 shares of the Fund. The amount of in-kind exchanges is included in share transactions in the accompanying Statement of Changes in Net Assets as well as the Notes to Financial Statements. The Fund recognized no gain or loss for federal income tax purposes.
Prior Fiscal Year Reallocation of Underlying Fund Investments. In addition, during the prior period, the investment adviser reallocated investments of the Fund. This involved taxable redemptions of the Fund's interest in Underlying Fidelity Funds, see table below, in exchange for investments and cash, totaling $6,160,012,948. The Fund had a net realized gain of $65,353,946 on the redemptions of Underlying Fidelity Funds.
| Exchanges In-Kind | Reallocation of Underlying Fund Investments | ||||
| Underlying Fidelity Funds | Shares Received | Value of Investments and Cash Received | Shares Sold | Value of Investments and Cash Exchanged | Net Realized gain (loss) |
| Fidelity Consumer Discretionary Central Fund | 1,210,681 | $371,570,155 | 1,210,681 | $378,555,792 | $6,985,637 |
| Fidelity Consumer Staples Central Fund | 1,264,850 | 262,494,239 | 1,264,850 | 252,919,327 | (9,574,912) |
| Fidelity Energy Central Fund | 1,770,852 | 224,490,899 | 1,770,852 | 236,019,145 | 11,528,246 |
| Fidelity Financials Central Fund | 6,136,967 | 641,374,398 | 6,136,967 | 648,125,061 | 6,750,663 |
| Fidelity Health Care Central Fund | 1,316,740 | 534,873,137 | 1,316,740 | 540,969,646 | 6,096,508 |
| Fidelity Industrials Central Fund | 1,193,404 | 342,459,245 | 1,193,404 | 351,576,852 | 9,117,607 |
| Fidelity Information Technology Central Fund | 2,179,737 | 982,734,269 | 2,179,737 | 990,210,766 | 7,476,497 |
| Fidelity Large Cap Stock Fund | 0 | 0 | 38,885,000 | 1,288,648,900 | 11,658,935 |
| Fidelity Materials Central Fund | 374,592 | 92,513,052 | 374,592 | 95,285,035 | 2,771,983 |
| Fidelity Telecom Services Central Fund | 436,231 | 76,126,636 | 436,231 | 76,741,721 | 615,085 |
| Fidelity Utilities Central Fund | 598,211 | 104,633,006 | 598,211 | 105,225,234 | 592,228 |
| Fidelity Value Discovery Fund | 0 | 0 | 41,999,841 | 1,195,735,469 | 11,335,469 |
| Total | 16,482,265 | $3,633,269,036 | 97,367,106 | $6,160,012,948 | $65,353,946 |
Other. During the period, the investment adviser reimbursed the Fund for certain losses in the amount of $271,293.
6. Investments in Fidelity Central Funds.
The Fund invests in Fidelity Central Funds, which are open-end investment companies available only to other investment companies and accounts managed by the investment adviser and its affiliates. The Fund's Schedule of Investments lists each of the Fidelity Central Funds held as of period end, if any, as an investment of the Fund, but does not include the underlying holdings of each Fidelity Central Fund. As an Investing Fund, the Fund indirectly bears its proportionate share of the expenses of the underlying Fidelity Central Funds.
The Fidelity Money Market Central Funds are managed by Fidelity Investments Money Management, Inc. (FIMM), an affiliate of the investment adviser. Annualized expenses of the Money Market Central Funds as of their most recent shareholder report date ranged from less than .005% to .01%.
A complete unaudited list of holdings for each Fidelity Central Fund is available upon request or at the Securities and Exchange Commission (the SEC) website at www.sec.gov. In addition, the financial statements of the Fidelity Central Funds, which are not covered by the Fund's Report of Independent Registered Public Accounting Firm, are available on the SEC website or upon request.
7. Committed Line of Credit.
The Fund participates with other funds managed by the investment adviser or an affiliate in a $4.25 billion credit facility (the "line of credit") to be utilized for temporary or emergency purposes to fund shareholder redemptions or for other short-term liquidity purposes. The Fund has agreed to pay commitment fees on its pro-rata portion of the line of credit, which amounted to $4,343 and is reflected in Miscellaneous expenses on the Statement of Operations. During the period, the Fund did not borrow on this line of credit.
8. Security Lending.
The Fund lends portfolio securities through a lending agent from time to time in order to earn additional income. On the settlement date of the loan, the Fund receives collateral (in the form of U.S. Treasury obligations, letters of credit and/or cash) against the loaned securities and maintains collateral in an amount not less than 100% of the market value of the loaned securities during the period of the loan. The market value of the loaned securities is determined at the close of business of the Fund and any additional required collateral is delivered to the Fund on the next business day. The Fund or borrower may terminate the loan at any time, and if the borrower defaults on its obligation to return the securities loaned because of insolvency or other reasons, the Fund may apply collateral received from the borrower against the obligation. The Fund may experience delays and costs in recovering the securities loaned. Any cash collateral received is invested in the Fidelity Securities Lending Cash Central Fund. The value of loaned securities and cash collateral at period end are disclosed on the Fund's Statement of Assets and Liabilities. Security lending income represents the income earned on investing cash collateral, less rebates paid to borrowers and any lending agent fees associated with the loan, plus any premium payments received for lending certain types of securities. Security lending income is presented in the Statement of Operations as a component of income from Fidelity Central Funds. Total security lending income during the period amounted to $822,015.
9. Expense Reductions.
The investment adviser has contractually agreed to waive the Fund's management fee in an amount equal to .25% of the Fund's average net assets until September 30, 2022. During the period, this waiver reduced the Fund's management fee by $48,170,924.
Commissions paid to certain brokers with whom the investment adviser, or its affiliates, places trades on behalf of the Fund include an amount in addition to trade execution, which may be rebated back to the Fund to offset certain expenses. This amount totaled $569,736 for the period.
In addition, through arrangements with the Fund's custodian, credits realized as a result of certain uninvested cash balances were used to reduce the Fund's expenses. During the period, custody credits amounted to $15,426.
10. Other.
The Fund's organizational documents provide former and current trustees and officers with a limited indemnification against liabilities arising in connection with the performance of their duties to the Fund. In the normal course of business, the Fund may also enter into contracts that provide general indemnifications. The Fund's maximum exposure under these arrangements is unknown as this would be dependent on future claims that may be made against the Fund. The risk of material loss from such claims is considered remote.
The Fund does not invest in the Underlying Funds for the purpose of exercising management or control; however, investments by the Fund within its principal investment strategies may represent a significant portion of an Underlying Fund's net assets. At the end of the period, the Fund was the owner of record of 10% or more of the total outstanding shares of the following Underlying Funds.
| Fund | % of shares held |
| Fidelity Large Cap Value Enhanced Index Fund | 44% |
| Fidelity SAI U.S. Low Volatility Index Fund | 18% |
| Fidelity SAI U.S. Momentum Index Fund | 41% |
| Fidelity SAI U.S. Quality Index Fund | 31% |
| Fidelity SAI U.S. Value Index Fund | 33% |
Report of Independent Registered Public Accounting Firm
To the Board of Trustees of Fidelity Rutland Square Trust II and Shareholders of Strategic Advisers Fidelity U.S. Total Stock Fund:
Opinion on the Financial Statements
We have audited the accompanying statement of assets and liabilities, including the schedule of investments, of Strategic Advisers Fidelity U.S. Total Stock Fund (one of the funds constituting Fidelity Rutland Square Trust II, referred to hereafter as the “Fund”) as of May 31, 2019, the related statement of operations for the year ended May 31, 2019 and the statement of changes in net assets and the financial highlights for the year ended May 31, 2019 and for the period March 20, 2018 (commencement of operations) through May 31, 2018, including the related notes (collectively referred to as the “financial statements”). In our opinion, the financial statements present fairly, in all material respects, the financial position of the Fund as of May 31, 2019, the results of its operations for the year ended May 31, 2019, and the changes in its net assets and the financial highlights for the year ended May 31, 2019 and for the period March 20, 2018 (commencement of operations) through May 31, 2018 in conformity with accounting principles generally accepted in the United States of America.
Basis for Opinion
These financial statements are the responsibility of the Fund’s management. Our responsibility is to express an opinion on the Fund’s financial statements based on our audits. We are a public accounting firm registered with the Public Company Accounting Oversight Board (United States) (PCAOB) and are required to be independent with respect to the Fund in accordance with the U.S. federal securities laws and the applicable rules and regulations of the Securities and Exchange Commission and the PCAOB.
We conducted our audits of these financial statements in accordance with the standards of the PCAOB. Those standards require that we plan and perform the audit to obtain reasonable assurance about whether the financial statements are free of material misstatement, whether due to error or fraud.
Our audits included performing procedures to assess the risks of material misstatement of the financial statements, whether due to error or fraud, and performing procedures that respond to those risks. Such procedures included examining, on a test basis, evidence regarding the amounts and disclosures in the financial statements. Our audits also included evaluating the accounting principles used and significant estimates made by management, as well as evaluating the overall presentation of the financial statements. Our procedures included confirmation of securities owned as of May 31, 2019 by correspondence with the custodian and brokers; when replies were not received from brokers, we performed other auditing procedures. We believe that our audits provide a reasonable basis for our opinion.
PricewaterhouseCoopers LLP
Boston, Massachusetts
July 16, 2019
We have served as the auditor of one or more investment companies in the Fidelity group of funds since 1932.
Trustees and Officers
The Trustees, Members of the Advisory Board (if any), and officers of the trust and fund, as applicable, are listed below. The Board of Trustees governs the fund and is responsible for protecting the interests of shareholders. The Trustees are experienced executives who meet periodically throughout the year to oversee the fund's activities, review contractual arrangements with companies that provide services to the fund, oversee management of the risks associated with such activities and contractual arrangements, and review the fund's performance. If the interests of the fund and an underlying Fidelity® fund were to diverge, a conflict of interest could arise and affect how the Trustees and Members of the Advisory Board fulfill their fiduciary duties to the affected funds. Strategic Advisers has structured the fund to avoid these potential conflicts, although there may be situations where a conflict of interest is unavoidable. In such instances, Strategic Advisers, the Trustees, and Members of the Advisory Board would take reasonable steps to minimize and, if possible, eliminate the conflict. Each of the Trustees oversees 14 funds.
The Trustees hold office without limit in time except that (a) any Trustee may resign; (b) any Trustee may be removed by written instrument, signed by at least two-thirds of the number of Trustees prior to such removal; (c) any Trustee who requests to be retired or who has become incapacitated by illness or injury may be retired by written instrument signed by a majority of the other Trustees; and (d) any Trustee may be removed at any special meeting of shareholders by a two-thirds vote of the outstanding voting securities of the trust. Officers and Advisory Board Members hold office without limit in time, except that any officer or Advisory Board Member may resign or may be removed by a vote of a majority of the Trustees at any regular meeting or any special meeting of the Trustees. Except as indicated, each individual has held the office shown or other offices in the same company for the past five years.
Each Trustee who is not an interested person (as defined in the 1940 Act) of the trust and the fund is referred to herein as an Independent Trustee.
The fund’s Statement of Additional Information (SAI) includes more information about the Trustees. To request a free copy, call Fidelity at 1-800-544-3455.
Experience, Skills, Attributes, and Qualifications of the Trustees. The Governance and Nominating Committee has adopted a statement of policy that describes the experience, qualifications, attributes, and skills that are necessary and desirable for potential Independent Trustee candidates (Statement of Policy). The Board believes that each Trustee satisfied at the time he or she was initially elected or appointed a Trustee, and continues to satisfy, the standards contemplated by the Statement of Policy. The Governance and Nominating Committee may also engage professional search firms to help identify potential Independent Trustee candidates with experience, qualifications, attributes, and skills consistent with the Statement of Policy. Additional criteria based on the composition and skills of the current Independent Trustees, as well as experience or skills that may be appropriate in light of future changes to board composition, business conditions, and regulatory or other developments, may be considered by the professional search firms and the Governance and Nominating Committee. In addition, the Board takes into account the Trustees' commitment and participation in Board and committee meetings, as well as their leadership of standing and ad hoc committees throughout their tenure.
In determining that a particular Trustee was and continues to be qualified to serve as a Trustee, the Board has considered a variety of criteria, none of which, in isolation, was controlling. The Board believes that, collectively, the Trustees have balanced and diverse experience, qualifications, attributes, and skills, which allow the Board to operate effectively in governing the fund and protecting the interests of shareholders. Information about the specific experience, skills, attributes, and qualifications of each Trustee, which in each case led to the Board's conclusion that the Trustee should serve (or continue to serve) as a trustee of the fund, is provided below.
Board Structure and Oversight Function. Robert A. Lawrence is an interested person and currently serves as Chairman. The Trustees have determined that an interested Chairman is appropriate and benefits shareholders because an interested Chairman has a personal and professional stake in the quality and continuity of services provided to the fund. Independent Trustees exercise their informed business judgment to appoint an individual of their choosing to serve as Chairman, regardless of whether the Trustee happens to be independent or a member of management. The Independent Trustees have determined that they can act independently and effectively without having an Independent Trustee serve as Chairman and that a key structural component for assuring that they are in a position to do so is for the Independent Trustees to constitute a substantial majority for the Board. The Independent Trustees also regularly meet in executive session. Mary C. Farrell serves as the lead Independent Trustee and as such (i) acts as a liaison between the Independent Trustees and management with respect to matters important to the Independent Trustees and (ii) with management prepares agendas for Board meetings.
Fidelity® funds are overseen by different Boards of Trustees. The fund's Board oversees asset allocation funds. Other Boards oversee Fidelity's investment-grade bond, money market, and asset allocation funds, and Fidelity's equity and high income funds. The fund may invest in Fidelity® funds overseen by such other Boards. The use of separate Boards, each with its own committee structure, allows the Trustees of each group of Fidelity® funds to focus on the unique issues of the funds they oversee, including common research, investment, and operational issues.
The Trustees primarily operate as a full Board, but also operate in committees, to facilitate the timely and efficient consideration of all matters of importance to the Trustees, the fund, and fund shareholders and to facilitate compliance with legal and regulatory requirements and oversight of the fund's activities and associated risks. The Board has charged Strategic Advisers and its affiliates with (i) identifying events or circumstances the occurrence of which could have demonstrably adverse effects on the fund's business and/or reputation; (ii) implementing processes and controls to lessen the possibility that such events or circumstances occur or to mitigate the effects of such events or circumstances if they do occur; and (iii) creating and maintaining a system designed to evaluate continuously business and market conditions in order to facilitate the identification and implementation processes described in (i) and (ii) above. Because the day-to-day operations and activities of the fund are carried out by or through Strategic Advisers, its affiliates and other service providers, the fund's exposure to risks is mitigated but not eliminated by the processes overseen by the Trustees. Board oversight of different aspects of the fund's activities is exercised primarily through the full Board, but also through the Audit and Compliance Committee. Appropriate personnel, including but not limited to the fund's Chief Compliance Officer (CCO), FMR's internal auditor, the independent accountants, the fund's Treasurer and portfolio management personnel, make periodic reports to the Board's committees, as appropriate. The responsibilities of each standing committee, including their oversight responsibilities, are described further under "Standing Committees of the Trustees."
Interested Trustees*:
Correspondence intended for a Trustee who is an interested person may be sent to Fidelity Investments, 245 Summer Street, Boston, Massachusetts 02210.
Name, Year of Birth; Principal Occupations and Other Relevant Experience+
Brian B. Hogan (1964)
Year of Election or Appointment: 2018
Trustee
Mr. Hogan also serves as Trustee of other funds. Mr. Hogan serves as Head of Fidelity Investments’ Investment Solutions and Innovation organization (2018-present), a Director of Strategic Advisers LLC (2018-present), and a Director of Fidelity SelectCo, LLC (investment adviser firm, 2014-present). Previously, Mr. Hogan served as President of FMR Co., Inc. (2009-2018), a Vice President of Fidelity's Equity and High Income funds (2009-2018), a Director of FMR Investment Management (UK) Limited (investment adviser firm, 2015-2018), Trustee of certain Fidelity® funds (2014-2018), President of the Equity Division of FMR (investment adviser firm, 2009-2018), Senior Vice President, Equity Research of FMR (2006-2009), and as a portfolio manager. Mr. Brian B. Hogan is not related to Mr. Colm A. Hogan.
Robert A. Lawrence (1952)
Year of Election or Appointment: 2016
Trustee
Chairman of the Board of Trustees
Mr. Lawrence also serves as Trustee of other funds. Previously, Mr. Lawrence served as a Member of the Advisory Board of certain funds. Prior to his retirement in 2008, Mr. Lawrence served as Vice President of certain Fidelity® funds (2006-2008), Senior Vice President, Head of High Income Division of Fidelity Management & Research Company (investment adviser firm, 2006-2008), and President of Fidelity Strategic Investments (investment adviser firm, 2002-2005).
* Determined to be an "Interested Trustee" by virtue of, among other things, his or her affiliation with the trust or various entities under common control with Strategic Advisers.
+ The information includes the Trustee's principal occupation during the last five years and other information relating to the experience, attributes, and skills relevant to the Trustee's qualifications to serve as a Trustee, which led to the conclusion that the Trustee should serve as a Trustee for the fund.
Independent Trustees:
Correspondence intended for an Independent Trustee may be sent to Fidelity Investments, P.O. Box 55235, Boston, Massachusetts 02205-5235.
Name, Year of Birth; Principal Occupations and Other Relevant Experience+
Peter C. Aldrich (1944)
Year of Election or Appointment: 2006
Trustee
Mr. Aldrich also serves as Trustee of other funds. Mr. Aldrich is a Director of the National Bureau of Economic Research, a Director of the funds of BlackRock Realty Group (2006-present), and a Director of LivelyHood, Inc. (private corporation, 2013-present). Previously, Mr. Aldrich served as a Trustee for the Fidelity Rutland Square Trust (2005-2010), a Managing Member of Poseidon, LLC (foreign private investment, 1998-2004), and Chairman and Managing Member of AEGIS, LLC (foreign private investment, 1997-2004). Mr. Aldrich previously was a founder, Chief Executive Officer, and Chairman of AEW Capital Management, L.P. (then “Aldrich, Eastman and Waltch, L.P.”). Mr. Aldrich also served as a Director of Zipcar, Inc. (car sharing services, 2001-2009) and as Faculty Chairman of The Research Council on Global Investment of The Conference Board (business and professional education non-profit, 1999-2004). Mr. Aldrich is a Member Emeritus of the Board of Trustees of the Museum of Fine Arts Boston and an Overseer of the Massachusetts Eye and Ear Infirmary.
Ralph F. Cox (1932)
Year of Election or Appointment: 2006
Trustee
Mr. Cox also serves as Trustee of other funds. Mr. Cox is President of RABAR Enterprises (management consulting for the petroleum industry). Mr. Cox is a Director of Abraxas Petroleum (exploration and production, 1999-present). Mr. Cox is a member of the Advisory Boards of the Business and Engineering Schools of Texas A&M University and the Engineering School of University of Texas at Austin. Previously, Mr. Cox served as a Trustee for the Fidelity Rutland Square Trust (2005-2010) and as an Advisory Director of CH2M Hill Companies (engineering, 1981-2011). Mr. Ralph F. Cox and Mr. Howard E. Cox, Jr. are not related.
Mary C. Farrell (1949)
Year of Election or Appointment: 2013
Trustee
Ms. Farrell also serves as Trustee of other funds. Ms. Farrell is a Director of the W.R. Berkley Corporation (insurance provider) and President (2009-present) and Director (2006-present) of the Howard Gilman Foundation (charitable organization). Previously, Ms. Farrell was Managing Director and Chief Investment Strategist at UBS Wealth Management USA and Co-Head of UBS Wealth Management Investment Strategy & Research Group (2003-2005). Ms. Farrell also served as Investment Strategist at PaineWebber (1982-2000) and UBS PaineWebber (2000-2002). Ms. Farrell serves as Chairman of the Board of Trustees of Yale-New Haven Hospital and on the Yale New Haven Health System Board and previously served as Trustee on the Board of Overseers of the New York University Stern School of Business.
Karen Kaplan (1960)
Year of Election or Appointment: 2006
Trustee
Ms. Kaplan also serves as Trustee of other funds. Ms. Kaplan is Chairman (2014-present) and Chief Executive Officer (2013-present) of Hill Holliday (advertising and specialized marketing). Ms. Kaplan is a Director of The Michaels Companies, Inc. (specialty retailer, 2015-present), Member of the Board of Governors of the Chief Executives’ Club of Boston (2010-present), Member of the Executive Committee of the Greater Boston Chamber of Commerce (2006-present), Advisory Board Member of the National Association of Corporate Directors Chapter (2012-present), Member of the Board of Trustees of the Post Office Square Trust (2012-present), Trustee of the Brigham and Women’s Hospital (2016-present), Overseer of the Boston Symphony Orchestra (2014-present), Member of the Board of Directors of The Advertising Council, Inc. (2016-present), and Member of the Ron Burton Training Village Executive Board of Advisors (2018-present). Previously, Ms. Kaplan served as an Advisory Board Member of Fidelity Rutland Square Trust (2006-2010), a member of the Clinton Global Initiative (2010-2015), Director of DSM (dba Delta Dental and DentaQuest) (2004-2014), Formal Appointee of the 2015 Baker-Polito Economic Development Council, Director of Vera Bradley Inc. (designer of women’s accessories, 2012-2015), Member of the Board of Directors of the Massachusetts Conference for Women (2008-2015), Member of the Board of Directors of Jobs for Massachusetts (2012-2015), President of the Massachusetts Women’s Forum (2008-2010), Treasurer of the Massachusetts Women’s Forum (2002-2006), and Vice Chair of the Board of the Massachusetts Society for the Prevention of Cruelty to Children (2003-2010).
Heidi L. Steiger (1953)
Year of Election or Appointment: 2017
Trustee
Ms. Steiger also serves as Trustee of other funds. Ms. Steiger serves as a member of the Global Advisory Board and Of Counsel to Signum Global Advisors (international policy and strategy, 2018-present), a guest lecturer in the joint degree program in Global Luxury Management at North Carolina State University (Raleigh, NC) and Skema (Paris) (2018-present), Managing Partner of Topridge Associates, LLC (consulting, 2005-present), a Non-Executive Director of CrowdBureau Corporation (financial technology company and index provider, 2018-present), and a member of the Board of Directors (2013-present) and Chair of the Audit Committee and member of the Membership and Executive Committees (2017-present) of Business Executives for National Security (nonprofit). Previously, Ms. Steiger served as Eastern Region President of The Private Client Reserve of U.S. Bancorp (banking and financial services, 2010-2015), Advisory Director of Berkshire Capital Securities, LLC (financial services, 2009-2010), President and Senior Advisor of Lowenhaupt Global Advisors, LLC (financial services, 2005-2007), and President and Contributing Editor of Worth Magazine (2004-2005) and held a variety of positions at Neuberger Berman Group, LLC (financial services, 1986-2004), including Partner and Executive Vice President and Global Head of Private Asset Management at Neuberger Berman (1999-2004). Ms. Steiger also served as a member of the Board of Directors of Nuclear Electric Insurance Ltd (insurer of nuclear utilities, 2006-2017), a member of the Board of Trustees and Audit Committee of the Eaton Vance Funds (2007-2010), a member of the Board of Directors of Aviva USA (formerly AmerUs) (insurance, 2004-2014), and a member of the Board of Trustees and Audit Committee and Chair of the Investment Committee of CIFG (financial guaranty insurance, 2009-2012), and a member of the Board of Directors of Kin Group Plc (formerly, Fitbug Holdings) (health and technology, 2016-2017).
+ The information includes the Trustee's principal occupation during the last five years and other information relating to the experience, attributes, and skills relevant to the Trustee's qualifications to serve as a Trustee, which led to the conclusion that the Trustee should serve as a Trustee for the fund.
Advisory Board Members and Officers:
Correspondence intended for an officer or Howard E. Cox, Jr. may be sent to Fidelity Investments, 245 Summer Street, Boston, Massachusetts 02210. Officers appear below in alphabetical order.
Name, Year of Birth; Principal Occupation
Howard E. Cox, Jr. (1944)
Year of Election or Appointment: 2009
Member of the Advisory Board
Mr. Cox also serves as Member of the Advisory Board of other funds. Mr. Cox is a Partner of Greylock (venture capital, 1971-present) and a Director of Stryker Corporation (medical products and services, 1974-present). Previously, Mr. Cox served as an Advisory Board Member of Fidelity Rutland Square Trust (2006-2010). Mr. Cox also serves as a Member of the Secretary of Defense's Business Board of Directors (2008-present), a Director of Business Executives for National Security (1997-present), a Director of the Brookings Institution (2010-present), a Director of the World Economic Forum’s Young Global Leaders Foundation (2009-present), and is a Member of the Harvard Medical School Board of Fellows (2002-present). Mr. Howard E. Cox, Jr. and Mr. Ralph F. Cox are not related.
Elizabeth Paige Baumann (1968)
Year of Election or Appointment: 2017
Anti-Money Laundering (AML) Officer
Ms. Baumann also serves as AML Officer of other funds. She is Chief AML Officer (2012-present) and Senior Vice President (2014-present) of FMR LLC (diversified financial services company) and is an employee of Fidelity Investments. Previously, Ms. Baumann served as AML Officer of the funds (2012-2016), and Vice President (2007-2014) and Deputy Anti-Money Laundering Officer (2007-2012) of FMR LLC.
Craig S. Brown (1977)
Year of Election or Appointment: 2019
Assistant Treasurer
Mr. Brown also serves as Assistant Treasurer of other funds. Mr. Brown is an employee of Fidelity Investments (2013-present).
John J. Burke III (1964)
Year of Election or Appointment: 2018
Chief Financial Officer
Mr. Burke also serves as Chief Financial Officer of other funds. Mr. Burke serves as Head of Investment Operations for Fidelity Fund and Investment Operations (2018-present) and is an employee of Fidelity Investments (1998-present). Previously Mr. Burke served as head of Asset Management Investment Operations (2012-2018).
Jonathan Davis (1968)
Year of Election or Appointment: 2010
Assistant Treasurer
Mr. Davis also serves as Assistant Treasurer of other funds. Mr. Davis serves as Assistant Treasurer of FMR Capital, Inc. (2017-present) and is an employee of Fidelity Investments. Previously, Mr. Davis served as Vice President and Associate General Counsel of FMR LLC (diversified financial services company, 2003-2010).
Adrien E. Deberghes (1967)
Year of Election or Appointment: 2016
President and Treasurer
Mr. Deberghes also serves as an officer of other funds. He serves as Assistant Treasurer of FMR Capital, Inc. (2017-present), Executive Vice President of Fidelity Investments Money Management, Inc. (FIMM) (investment adviser firm, 2016-present), and is an employee of Fidelity Investments (2008-present). Previously, Mr. Deberghes served as President and Treasurer of certain Fidelity® funds (2013-2018). Prior to joining Fidelity Investments, Mr. Deberghes was Senior Vice President of Mutual Fund Administration at State Street Corporation (2007-2008), Senior Director of Mutual Fund Administration at Investors Bank & Trust (2005-2007), and Director of Finance for Dunkin' Brands (2000-2005). Previously, Mr. Deberghes served in other fund officer roles.
Laura M. Del Prato (1964)
Year of Election or Appointment: 2018
Assistant Treasurer
Ms. Del Prato also serves as an officer of other funds. Ms. Del Prato is an employee of Fidelity Investments (2017-present). Prior to joining Fidelity Investments, Ms. Del Prato served as a Managing Director and Treasurer of the JPMorgan Mutual Funds (2014-2017). Prior to JPMorgan, Ms. Del Prato served as a partner at Cohen Fund Audit Services (accounting firm, 2012-2013) and KPMG LLP (accounting firm, 2004-2012).
James D. Gryglewicz (1972)
Year of Election or Appointment: 2015
Chief Compliance Officer
Mr. Gryglewicz also serves as Chief Compliance Officer of other funds. Mr. Gryglewicz serves as Compliance Officer of Strategic Advisers LLC (investment adviser firm, 2015-present) and Fidelity SelectCo, LLC (investment adviser firm, 2014-present), Senior Vice President of Asset Management Compliance (2009-present), and is an employee of Fidelity Investments (2004-present). Previously, Mr. Gryglewicz served as Chief Compliance Officer of certain Fidelity® funds (2014-2018).
John Hitt (1967)
Year of Election or Appointment: 2014
Secretary and Chief Legal Officer
Mr. Hitt also serves as an officer of other funds. Mr. Hitt serves as Senior Vice President and Deputy General Counsel in Fidelity's Asset Management Group (2010-present) and is an employee of Fidelity Investments.
Colm A. Hogan (1973)
Year of Election or Appointment: 2016
Assistant Treasurer
Mr. Hogan also serves as an officer of other funds. Mr. Hogan serves as Assistant Treasurer of FMR Capital, Inc. (2017-present) and is an employee of Fidelity Investments (2005-present). Previously, Mr. Hogan served as Assistant Treasurer of certain Fidelity® funds (2016-2018). Mr. Colm A. Hogan is not related to Mr. Brian B. Hogan.
Christina H. Lee (1975)
Year of Election or Appointment: 2018
Assistant Secretary
Ms. Lee also serves as Assistant Secretary of other funds. Ms. Lee serves as Vice President, Associate General Counsel (2014-present) and is an employee of Fidelity Investments (2007-present).
Chris Maher (1972)
Year of Election or Appointment: 2016
Assistant Treasurer
Mr. Maher serves as Assistant Treasurer of other funds. Mr. Maher is Vice President of Valuation Oversight, serves as Assistant Treasurer of FMR Capital, Inc. (2017-present), and is an employee of Fidelity Investments. Previously, Mr. Maher served as Vice President of Asset Management Compliance (2013), Vice President of the Program Management Group of FMR (investment adviser firm, 2010-2013), and Vice President of Valuation Oversight (2008-2010).
Stacie M. Smith (1974)
Year of Election or Appointment: 2016
Assistant Treasurer
Ms. Smith also serves as an officer of other funds. Ms. Smith serves as Assistant Treasurer of FMR Capital, Inc. (2017-present), is an employee of Fidelity Investments (2009-present), and has served in other fund officer roles. Prior to joining Fidelity Investments, Ms. Smith served as Senior Audit Manager of Ernst & Young LLP (accounting firm, 1996-2009). Previously, Ms. Smith served as Assistant Treasurer (2013-2018) and Deputy Treasurer (2013-2016) of certain Fidelity® funds.
Marc L. Spector (1972)
Year of Election or Appointment: 2016
Assistant Treasurer
Mr. Spector also serves as an officer of other funds. Mr. Spector serves as Assistant Treasurer of FMR Capital, Inc. (2017-present) and is an employee of Fidelity Investments (2016-present). Prior to joining Fidelity Investments, Mr. Spector served as Director at the Siegfried Group (accounting firm, 2013-2016), and prior to Siegfried Group as audit senior manager at Deloitte & Touche (accounting firm, 2005-2013).
Jim Wegmann (1979)
Year of Election or Appointment: 2019
Assistant Treasurer
Mr. Wegmann also serves as Assistant Treasurer of other funds. Mr. Wegmann is an employee of Fidelity Investments (2011-present).
Shareholder Expense Example
As a shareholder of the Fund, you incur two types of costs: (1) transaction costs and (2) ongoing costs, including management fees and other Fund expenses. This Example is intended to help you understand your ongoing costs (in dollars) of investing in the Fund and to compare these costs with the ongoing costs of investing in other mutual funds.
The Example is based on an investment of $1,000 invested at the beginning of the period and held for the entire period (December 1, 2018 to May 31, 2019).
Actual Expenses
The first line of the accompanying table provides information about actual account values and actual expenses. You may use the information in this line, together with the amount you invested, to estimate the expenses that you paid over the period. Simply divide your account value by $1,000.00 (for example, an $8,600 account value divided by $1,000.00 = 8.6), then multiply the result by the number in the first line under the heading entitled "Expenses Paid During Period" to estimate the expenses you paid on your account during this period. In addition to the direct expenses incurred by the Fund presented in the table, as a shareholder of the underlying mutual funds (the Underlying Funds), the Fund also indirectly bears its proportionate share of the expenses of the Underlying Funds. In addition, the Fund, as a shareholder in the underlying Fidelity Central Funds, will indirectly bear its pro-rata share of the fees and expenses incurred by the underlying Fidelity Central Funds. These fees and expenses are not included in the Fund's annualized expense ratio used to calculate the expense estimate in the table below.
Hypothetical Example for Comparison Purposes
The second line of the accompanying table provides information about hypothetical account values and hypothetical expenses based on the Fund's actual expense ratio and an assumed rate of return of 5% per year before expenses, which is not the Fund's actual return. The hypothetical account values and expenses may not be used to estimate the actual ending account balance or expenses you paid for the period. You may use this information to compare the ongoing costs of investing in the Fund and other funds. To do so, compare this 5% hypothetical example with the 5% hypothetical examples that appear in the shareholder reports of the other funds. In addition to the direct expenses incurred by the Fund presented in the table, as a shareholder of the Underlying Funds, the Fund also indirectly bears its proportionate share of the expenses of the Underlying Funds. In addition, the Fund, as a shareholder in the underlying Fidelity Central Funds, will indirectly bear its pro-rata share of the fees and expenses incurred by the underlying Fidelity Central Funds. These fees and expenses are not included in the Fund's annualized expense ratio used to calculate the expense estimate in the table below.
Please note that the expenses shown in the table are meant to highlight your ongoing costs only and do not reflect any transaction costs. Therefore, the second line of the table is useful in comparing ongoing costs only, and will not help you determine the relative total costs of owning different funds.
| Annualized Expense Ratio-A | Beginning Account Value December 1, 2018 | Ending Account Value May 31, 2019 | Expenses Paid During Period-B December 1, 2018 to May 31, 2019 |
|
| Actual | .16% | $1,000.00 | $1,004.30 | $.80 |
| Hypothetical-C | $1,000.00 | $1,024.13 | $.81 |
A Annualized expense ratio reflects expenses net of applicable fee waivers.
B Expenses are equal to the Fund's annualized expense ratio, multiplied by the average account value over the period, multiplied by 182/365 (to reflect the one-half year period). The fees and expenses of the Underlying Funds in which the Fund invests are not included in the Fund's annualized expense ratio.
C 5% return per year before expenses
Distributions (Unaudited)
The Board of Trustees of Strategic Advisers Fidelity U.S. Total Stock Fund voted to pay on July 15, 2019, to shareholders of record at the opening of business on July 12, 2019, a distribution of $0.018 per share derived from capital gains realized from sales of portfolio securities and a dividend of $0.050 per share from net investment income.
The fund hereby designates as a capital gain dividend with respect to the taxable year ended May 31, 2019, $66,315,882, or, if subsequently determined to be different, the net capital gain of such year.
The fund designates 12% and 71% of the dividends distributed in July and December, respectively during the fiscal year as qualifying for the dividends–received deduction for corporate shareholders.
The fund designates 16% and 79% of the dividends distributed in July and December, respectively during the fiscal year as amounts which may be taken into account as a dividend for the purposes of the maximum rate under section 1(h)(11) of the Internal Revenue Code.
The fund will notify shareholders in January 2020 of amounts for use in preparing 2019 income tax returns.
![]()
TSF-ANN-0719
1.9887487.101
|
Strategic Advisers® Fidelity® Core Income Fund Offered exclusively to certain clients of Strategic Advisers LLC - not available for sale to the general public Annual Report May 31, 2019 |
|
|
Beginning on January 1, 2021, as permitted by regulations adopted by the Securities and Exchange Commission, paper copies of a fund’s shareholder reports will no longer be sent by mail, unless you specifically request paper copies of the reports from the fund or from your financial intermediary, such as a financial advisor, broker-dealer or bank. Instead, the reports will be made available on a website, and you will be notified by mail each time a report is posted and provided with a website link to access the report.
If you already elected to receive shareholder reports electronically, you will not be affected by this change and you need not take any action. You may elect to receive shareholder reports and other communications from a fund electronically, by contacting your financial intermediary. For Fidelity customers, visit Fidelity's web site or call Fidelity using the contact information listed below.
You may elect to receive all future reports in paper free of charge. If you wish to continue receiving paper copies of your shareholder reports, you may contact your financial intermediary or, if you are a Fidelity customer, visit Fidelity’s website, or call Fidelity at the applicable toll-free number listed below. Your election to receive reports in paper will apply to all funds held with the fund complex/your financial intermediary.
| Account Type | Website | Phone Number |
| Brokerage, Mutual Fund, or Annuity Contracts: | fidelity.com/mailpreferences | 1-800-343-3548 |
| Employer Provided Retirement Accounts: | netbenefits.fidelity.com/preferences (choose 'no' under Required Disclosures to continue to print) | 1-800-343-0860 |
| Advisor Sold Accounts Serviced Through Your Financial Intermediary: | Contact Your Financial Intermediary | Your Financial Intermediary's phone number |
| Advisor Sold Accounts Serviced by Fidelity: | institutional.fidelity.com | 1-877-208-0098 |
Contents
To view a fund's proxy voting record for the 12-month period ended June 30, visit http://www.fidelity.com/proxyvotingresults or visit the Securities and Exchange Commission's (SEC) web site at http://www.sec.gov.
You may also call 1-800-544-3455 to request a free copy of the proxy voting guidelines.
Standard & Poor's, S&P and S&P 500 are registered service marks of The McGraw-Hill Companies, Inc. and have been licensed for use by Fidelity Distributors Corporation.
Other third-party marks appearing herein are the property of their respective owners.
All other marks appearing herein are registered or unregistered trademarks or service marks of FMR LLC or an affiliated company. © 2019 FMR LLC. All rights reserved.
This report and the financial statements contained herein are submitted for the general information of the shareholders of the Fund. This report is not authorized for distribution to prospective investors in the Fund unless preceded or accompanied by an effective prospectus.
A fund files its complete schedule of portfolio holdings with the SEC for the first and third quarters of each fiscal year on Form N-PORT. Forms N-PORT are available on the SEC’s web site at http://www.sec.gov. A fund's Forms N-PORT may be reviewed and copied at the SEC’s Public Reference Room in Washington, DC. Information regarding the operation of the SEC's Public Reference Room may be obtained by calling 1-800-SEC-0330.
For a complete list of a fund's portfolio holdings, view the most recent holdings listing, semiannual report, or annual report on Fidelity's web site at http://www.fidelity.com, http://www.institutional.fidelity.com, or http://www.401k.com, as applicable.
NOT FDIC INSURED •MAY LOSE VALUE •NO BANK GUARANTEE
Neither the Fund nor Fidelity Distributors Corporation is a bank.
Performance: The Bottom Line
Average annual total return reflects the change in the value of an investment, assuming reinvestment of distributions from dividend income and capital gains (the profits earned upon the sale of securities that have grown in value, if any) and assuming a constant rate of performance each year. The hypothetical investment and the average annual total returns do not reflect the deduction of taxes that a shareholder would pay on fund distributions or the redemption of fund shares. During periods of reimbursement by Fidelity, a fund’s total return will be greater than it would be had the reimbursement not occurred. How a fund did yesterday is no guarantee of how it will do tomorrow.
Average annual total returns for Strategic Advisers® Fidelity® Core Income Fund will be reported once the fund is a year old.
$10,000 Over Life of Fund
Let's say hypothetically that $10,000 was invested in Strategic Advisers® Fidelity® Core Income Fund on October 16, 2018, when the fund started.
The chart shows how the value of your investment would have changed, and also shows how the Bloomberg Barclays U.S. Aggregate Bond Index performed over the same period.
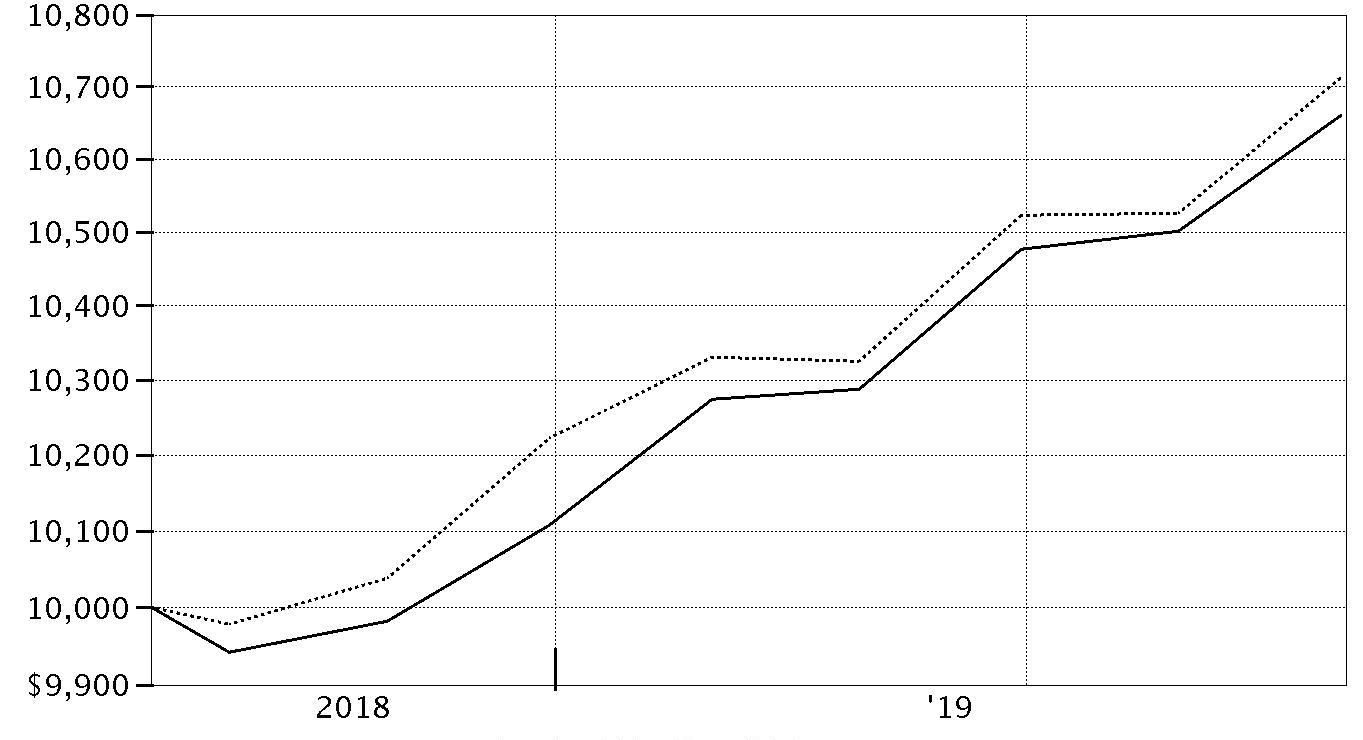
| Period Ending Values | ||
|
| $10,660 | Strategic Advisers® Fidelity® Core Income Fund |
|
| $10,712 | Bloomberg Barclays U.S. Aggregate Bond Index |
Management's Discussion of Fund Performance
Market Recap: U.S. taxable investment-grade bonds advanced broadly for the 12 months ending May 31, 2019, driven by slower global economic growth and uncertainty regarding trade policy and the direction of U.S. interest rates. The Bloomberg Barclays U.S. Aggregate Bond Index gained 6.40%. Early in the period, spreads between shorter-term and longer-term Treasury bonds remained tight, due to escalating global trade tension. Yields rose in September and early October on expectations for higher inflation. Yields then declined and credit spreads widened in November and December because of disappointing U.S. manufacturing data and signs of a global slowdown. Yield spreads narrowed notably in January, as the U.S. Federal Reserve said it would be “patient” with policy rate hikes and that future increases largely would depend on economic data. Yields continued to decline toward period end, amid rising international trade tension and attacks on oil tankers in the Middle East. Within the Bloomberg Barclays index, corporate bonds gained 7.45%, topping the 6.28% advance of U.S. Treasuries. Securitized bonds rose 5.63%, led by commercial mortgage-backed securities (+7.70%). Outside the index, most non-core fixed-income segments moderately lagged nominal U.S. Treasuries, while Treasury Inflation-Protected Securities (TIPS) gained 4.36%. Comments from Portfolio Manager Jonathan Duggan: From its inception on October 16, 2018, to May 31, 2019, the Fund gained 6.60%, performing close to in line with the 7.12% advance of the benchmark Bloomberg Barclays U.S. Aggregate Bond Index. The Core Investment Grade strategy managed by sub-adviser FIAM® was the top relative contributor. This strategy topped the benchmark partly by avoiding credits that severely underperformed during the period, such as bonds issued by General Electric and electric utility PG&E. On the downside, Fidelity® SAI® Total Bond Fund was the largest relative detractor. Here, an allocation to high-yield corporate bonds hampered the manager, as the asset class underperformed in the fourth quarter of 2018. During this inaugural reporting period, I reduced the large initial allocations to these two managers. By May 31, the FIAM Core Investment Grade strategy and Fidelity SAI Total Bond Fund combined represented about 78% of Fund assets, down from roughly 99% of assets when the Fund was launched. In adjusting the portfolio, I added positions to increase the Fund's exposure to U.S. Treasuries and mortgage-backed securities, and sought to reduce a large overweighting in corporate credit.The views expressed above reflect those of the portfolio manager(s) only through the end of the period as stated on the cover of this report and do not necessarily represent the views of Fidelity or any other person in the Fidelity organization. Any such views are subject to change at any time based upon market or other conditions and Fidelity disclaims any responsibility to update such views. These views may not be relied on as investment advice and, because investment decisions for a Fidelity fund are based on numerous factors, may not be relied on as an indication of trading intent on behalf of any Fidelity fund.
Note to shareholders: On December 31, 2018, former Co-Manager Gregory Pappas retired from the firm, leaving Jonathan Duggan as sole manager of the fund.Investment Summary (Unaudited)
The information in the following tables is based on the direct investments of the Fund.Top Ten Holdings as of May 31, 2019
| (excluding cash equivalents) | % of fund's net assets |
| Fidelity SAI Total Bond Fund | 39.1 |
| U.S. Treasury Obligations | 14.3 |
| Fidelity SAI U.S. Treasury Bond Index Fund | 10.3 |
| Fannie Mae | 7.5 |
| Ginnie Mae | 4.0 |
| Freddie Mac | 3.6 |
| Fidelity U.S. Bond Index Fund | 2.1 |
| Fidelity Floating Rate High Income Fund | 2.0 |
| Fidelity Specialized High Income Central Fund | 1.4 |
| Fidelity New Markets Income Fund | 0.9 |
Asset Allocation (% of fund's net assets)
| As of May 31, 2019* | ||
| Corporate Bonds | 11.5% | |
| U.S. Government and U.S. Government Agency Obligations | 31.0% | |
| Asset-Backed Securities | 1.0% | |
| CMOs and Other Mortgage Related Securities | 1.1% | |
| Municipal Securities | 0.2% | |
| Bank Loan Funds | 2.0% | |
| High Yield Fixed-Income Funds | 2.3% | |
| Intermediate-Term Bond Funds | 41.2% | |
| Intermediate Government Funds | 10.3% | |
| Other Investments | 0.2% | |
| Short-Term Investments and Net Other Assets (Liabilities)** | (0.8)% | |

* Futures and Swaps - 0.4%
** Short-Term Investments and Net Other Assets (Liabilities) are not included in the pie chart
Asset allocations of funds in the pie chart reflect the categorizations of assets as defined by Morningstar as of the reporting date.
Percentages in the above tables are adjusted for the effect of TBA Sale Commitments.
Percentages are adjusted for the effect of futures contracts and swaps, if applicable.
Schedule of Investments May 31, 2019
Showing Percentage of Net Assets
| Nonconvertible Bonds - 11.5% | |||
| Principal Amount | Value | ||
| COMMUNICATION SERVICES - 1.2% | |||
| Diversified Telecommunication Services - 0.5% | |||
| AT&T, Inc.: | |||
| 0% 6/15/42 (a)(b) | $6,909,000 | $7,101,250 | |
| 3.6% 2/17/23 | 4,947,000 | 5,074,351 | |
| 4.45% 4/1/24 | 479,000 | 511,133 | |
| 4.5% 3/9/48 | 25,004,000 | 24,071,894 | |
| 4.75% 5/15/46 | 25,000,000 | 24,912,714 | |
| 5.55% 8/15/41 | 12,537,000 | 13,850,081 | |
| 6.2% 3/15/40 (b) | 2,303,000 | 2,716,819 | |
| BellSouth Capital Funding Corp. 7.875% 2/15/30 | 102,000 | 127,343 | |
| CenturyLink, Inc. 6.15% 9/15/19 | 1,501,000 | 1,504,753 | |
| Verizon Communications, Inc.: | |||
| 4.862% 8/21/46 | 3,453,000 | 3,804,870 | |
| 5.012% 4/15/49 | 1,323,000 | 1,495,426 | |
| 85,170,634 | |||
| Entertainment - 0.0% | |||
| NBCUniversal, Inc.: | |||
| 4.45% 1/15/43 | 2,043,000 | 2,152,486 | |
| 5.95% 4/1/41 | 1,429,000 | 1,781,788 | |
| 3,934,274 | |||
| Media - 0.7% | |||
| Charter Communications Operating LLC/Charter Communications Operating Capital Corp.: | |||
| 4.464% 7/23/22 | 5,986,000 | 6,205,548 | |
| 4.908% 7/23/25 | 4,642,000 | 4,911,406 | |
| 5.375% 5/1/47 | 35,710,000 | 35,794,562 | |
| 5.75% 4/1/48 | 18,275,000 | 19,029,758 | |
| Comcast Corp.: | |||
| 3.9% 3/1/38 | 1,096,000 | 1,110,087 | |
| 3.969% 11/1/47 | 3,547,000 | 3,514,592 | |
| 4.6% 8/15/45 | 2,885,000 | 3,119,685 | |
| 4.65% 7/15/42 | 2,578,000 | 2,842,031 | |
| Fox Corp.: | |||
| 3.666% 1/25/22 (c) | 902,000 | 924,909 | |
| 4.03% 1/25/24 (c) | 1,586,000 | 1,661,451 | |
| 4.709% 1/25/29 (c) | 2,296,000 | 2,510,953 | |
| 5.476% 1/25/39 (c) | 2,264,000 | 2,580,369 | |
| 5.576% 1/25/49 (c) | 1,502,000 | 1,753,094 | |
| Time Warner Cable, Inc.: | |||
| 4% 9/1/21 | 12,819,000 | 13,075,961 | |
| 4.5% 9/15/42 | 886,000 | 785,677 | |
| 5.5% 9/1/41 | 1,530,000 | 1,531,293 | |
| 5.875% 11/15/40 | 3,289,000 | 3,403,394 | |
| 6.55% 5/1/37 | 5,846,000 | 6,471,069 | |
| 7.3% 7/1/38 | 3,785,000 | 4,431,691 | |
| 115,657,530 | |||
| TOTAL COMMUNICATION SERVICES | 204,762,438 | ||
| CONSUMER DISCRETIONARY - 0.4% | |||
| Automobiles - 0.1% | |||
| General Motors Financial Co., Inc.: | |||
| 3.5% 7/10/19 | 2,737,000 | 2,739,191 | |
| 3.7% 5/9/23 | 8,751,000 | 8,773,530 | |
| 4.25% 5/15/23 | 1,359,000 | 1,381,669 | |
| 4.375% 9/25/21 | 5,310,000 | 5,440,129 | |
| 18,334,519 | |||
| Hotels, Restaurants & Leisure - 0.0% | |||
| Aramark Services, Inc. 5% 2/1/28 (c) | 975,000 | 964,641 | |
| Household Durables - 0.3% | |||
| Lennar Corp.: | |||
| 4.75% 11/29/27 | 9,429,000 | 9,488,874 | |
| 5% 6/15/27 | 12,243,000 | 12,334,823 | |
| 5.25% 6/1/26 | 2,965,000 | 3,057,656 | |
| Toll Brothers Finance Corp.: | |||
| 4.35% 2/15/28 | 14,431,000 | 13,727,489 | |
| 4.875% 3/15/27 | 13,719,000 | 13,717,079 | |
| 52,325,921 | |||
| TOTAL CONSUMER DISCRETIONARY | 71,625,081 | ||
| CONSUMER STAPLES - 0.6% | |||
| Beverages - 0.5% | |||
| Anheuser-Busch InBev Finance, Inc.: | |||
| 3.65% 2/1/26 | 8,244,000 | 8,492,516 | |
| 4.7% 2/1/36 | 7,195,000 | 7,432,098 | |
| 4.9% 2/1/46 | 14,391,000 | 14,787,351 | |
| Anheuser-Busch InBev Worldwide, Inc.: | |||
| 4.75% 4/15/58 | 5,641,000 | 5,643,475 | |
| 5.45% 1/23/39 | 5,480,000 | 6,121,318 | |
| 5.55% 1/23/49 | 13,389,000 | 15,195,972 | |
| 5.8% 1/23/59 (Reg. S) | 14,304,000 | 16,629,796 | |
| Constellation Brands, Inc. 4.75% 11/15/24 | 3,799,000 | 4,124,364 | |
| 78,426,890 | |||
| Food & Staples Retailing - 0.0% | |||
| Walgreens Boots Alliance, Inc. 3.3% 11/18/21 | 1,926,000 | 1,953,192 | |
| Food Products - 0.1% | |||
| H.J. Heinz Co.: | |||
| 4.375% 6/1/46 | 6,995,000 | 6,162,473 | |
| 5.2% 7/15/45 | 3,303,000 | 3,248,364 | |
| H.J. Heinz Finance Co. 7.125% 8/1/39 (c) | 4,577,000 | 5,444,068 | |
| 14,854,905 | |||
| Tobacco - 0.0% | |||
| Altria Group, Inc. 9.25% 8/6/19 | 818,000 | 826,770 | |
| Reynolds American, Inc. 4% 6/12/22 | 939,000 | 965,883 | |
| 1,792,653 | |||
| TOTAL CONSUMER STAPLES | 97,027,640 | ||
| ENERGY - 1.5% | |||
| Energy Equipment & Services - 0.0% | |||
| El Paso Pipeline Partners Operating Co. LLC 5% 10/1/21 | 1,456,000 | 1,520,140 | |
| Oil, Gas & Consumable Fuels - 1.5% | |||
| Alberta Energy Co. Ltd. 8.125% 9/15/30 | 5,649,000 | 7,452,778 | |
| Amerada Hess Corp.: | |||
| 7.3% 8/15/31 | 1,709,000 | 2,051,345 | |
| 7.875% 10/1/29 | 2,223,000 | 2,753,303 | |
| Anadarko Finance Co. 7.5% 5/1/31 | 6,280,000 | 8,208,923 | |
| Anadarko Petroleum Corp.: | |||
| 4.85% 3/15/21 | 1,251,000 | 1,292,206 | |
| 5.55% 3/15/26 | 4,939,000 | 5,442,757 | |
| 6.45% 9/15/36 | 4,300,000 | 5,160,930 | |
| 6.6% 3/15/46 | 4,886,000 | 6,273,066 | |
| Canadian Natural Resources Ltd.: | |||
| 3.45% 11/15/21 | 2,648,000 | 2,687,302 | |
| 5.85% 2/1/35 | 2,024,000 | 2,291,683 | |
| Cenovus Energy, Inc. 4.25% 4/15/27 | 4,895,000 | 4,882,284 | |
| Columbia Pipeline Group, Inc.: | |||
| 3.3% 6/1/20 | 2,797,000 | 2,811,204 | |
| 4.5% 6/1/25 | 852,000 | 910,444 | |
| DCP Midstream LLC: | |||
| 4.75% 9/30/21 (c) | 2,233,000 | 2,255,665 | |
| 5.35% 3/15/20 (c) | 2,290,000 | 2,315,763 | |
| 5.85% 5/21/43 (c)(d) | 4,466,000 | 4,142,215 | |
| DCP Midstream Operating LP: | |||
| 3.875% 3/15/23 | 3,116,000 | 3,077,050 | |
| 5.6% 4/1/44 | 2,703,000 | 2,520,548 | |
| El Paso Corp. 6.5% 9/15/20 | 7,470,000 | 7,821,521 | |
| Enable Midstream Partners LP 3.9% 5/15/24 (d) | 869,000 | 869,238 | |
| Enbridge Energy Partners LP 4.2% 9/15/21 | 2,622,000 | 2,685,989 | |
| Enbridge, Inc. 4.25% 12/1/26 | 1,461,000 | 1,554,125 | |
| Energy Transfer Partners LP: | |||
| 4.2% 9/15/23 | 1,203,000 | 1,243,671 | |
| 4.5% 4/15/24 | 1,576,000 | 1,647,944 | |
| 4.95% 6/15/28 | 4,103,000 | 4,328,280 | |
| 5.25% 4/15/29 | 2,564,000 | 2,766,959 | |
| 5.8% 6/15/38 | 2,288,000 | 2,438,480 | |
| 6% 6/15/48 | 1,490,000 | 1,612,367 | |
| 6.25% 4/15/49 | 3,997,000 | 4,464,760 | |
| Kinder Morgan, Inc. 5.55% 6/1/45 | 3,046,000 | 3,304,018 | |
| Marathon Petroleum Corp. 5.125% 3/1/21 | 1,583,000 | 1,649,541 | |
| MPLX LP: | |||
| 4.8% 2/15/29 | 1,376,000 | 1,460,789 | |
| 4.875% 12/1/24 | 1,974,000 | 2,113,472 | |
| 5.5% 2/15/49 | 4,129,000 | 4,364,876 | |
| Nakilat, Inc. 6.067% 12/31/33 (c) | 1,213,000 | 1,388,885 | |
| Petrobras Global Finance BV 7.25% 3/17/44 | 27,432,000 | 29,097,122 | |
| Petroleos Mexicanos: | |||
| 4.625% 9/21/23 | 5,937,000 | 5,899,567 | |
| 4.875% 1/18/24 | 2,015,000 | 2,009,761 | |
| 5.375% 3/13/22 | 2,259,000 | 2,322,049 | |
| 5.625% 1/23/46 | 13,487,000 | 10,978,418 | |
| 6.375% 2/4/21 | 5,370,000 | 5,582,088 | |
| 6.375% 1/23/45 | 21,193,000 | 18,606,924 | |
| 6.5% 3/13/27 | 4,256,000 | 4,284,430 | |
| 6.5% 6/2/41 | 23,459,000 | 21,201,071 | |
| 6.75% 9/21/47 | 22,490,000 | 20,303,972 | |
| Plains All American Pipeline LP/PAA Finance Corp. 3.65% 6/1/22 | 3,779,000 | 3,838,640 | |
| Sunoco Logistics Partner Operations LP 5.4% 10/1/47 | 1,732,000 | 1,749,068 | |
| The Williams Companies, Inc.: | |||
| 3.7% 1/15/23 | 808,000 | 823,906 | |
| 4.55% 6/24/24 | 8,829,000 | 9,308,415 | |
| Western Gas Partners LP: | |||
| 4.65% 7/1/26 | 917,000 | 919,896 | |
| 4.75% 8/15/28 | 1,236,000 | 1,236,299 | |
| 5.375% 6/1/21 | 4,807,000 | 4,953,653 | |
| Williams Partners LP: | |||
| 4% 11/15/21 | 581,000 | 597,277 | |
| 4.125% 11/15/20 | 474,000 | 481,922 | |
| 4.3% 3/4/24 | 1,992,000 | 2,091,530 | |
| 258,530,389 | |||
| TOTAL ENERGY | 260,050,529 | ||
| FINANCIALS - 5.7% | |||
| Banks - 3.0% | |||
| Bank of America Corp.: | |||
| 3.004% 12/20/23 (d) | 1,314,000 | 1,322,022 | |
| 3.3% 1/11/23 | 2,658,000 | 2,703,271 | |
| 3.419% 12/20/28 (d) | 5,193,000 | 5,185,425 | |
| 3.5% 4/19/26 | 6,078,000 | 6,208,040 | |
| 3.95% 4/21/25 | 37,660,000 | 38,580,948 | |
| 4% 1/22/25 | 26,856,000 | 27,734,346 | |
| 4.1% 7/24/23 | 1,426,000 | 1,495,924 | |
| 4.183% 11/25/27 | 6,909,000 | 7,133,468 | |
| 4.2% 8/26/24 | 8,311,000 | 8,704,667 | |
| 4.25% 10/22/26 | 38,178,000 | 39,783,546 | |
| 4.45% 3/3/26 | 6,522,000 | 6,876,322 | |
| Barclays Bank PLC 10.179% 6/12/21 (c) | 1,750,000 | 1,974,174 | |
| Barclays PLC: | |||
| 2.75% 11/8/19 | 2,357,000 | 2,353,658 | |
| 4.375% 1/12/26 | 4,468,000 | 4,516,076 | |
| 4.836% 5/9/28 | 6,102,000 | 6,079,996 | |
| 5.2% 5/12/26 | 1,556,000 | 1,590,766 | |
| BPCE SA 4.875% 4/1/26 (c) | 7,383,000 | 7,758,313 | |
| CIT Group, Inc.: | |||
| 4.75% 2/16/24 | 2,520,000 | 2,591,157 | |
| 6.125% 3/9/28 | 7,275,000 | 8,002,500 | |
| Citigroup, Inc.: | |||
| 2.7% 10/27/22 | 32,935,000 | 32,848,419 | |
| 4.05% 7/30/22 | 1,320,000 | 1,366,644 | |
| 4.075% 4/23/29 (d) | 4,606,000 | 4,793,340 | |
| 4.125% 7/25/28 | 6,909,000 | 7,088,740 | |
| 4.3% 11/20/26 | 1,766,000 | 1,831,497 | |
| 4.4% 6/10/25 | 18,053,000 | 18,907,501 | |
| 4.45% 9/29/27 | 3,141,000 | 3,286,371 | |
| 4.5% 1/14/22 | 3,193,000 | 3,334,195 | |
| 4.6% 3/9/26 | 6,674,000 | 7,047,269 | |
| 5.3% 5/6/44 | 9,501,000 | 10,912,238 | |
| 5.5% 9/13/25 | 7,738,000 | 8,593,610 | |
| Citizens Bank NA 2.55% 5/13/21 | 1,236,000 | 1,232,237 | |
| Citizens Financial Group, Inc.: | |||
| 4.15% 9/28/22 (c) | 3,130,000 | 3,211,307 | |
| 4.3% 12/3/25 | 6,411,000 | 6,687,120 | |
| Credit Suisse Group Funding Guernsey Ltd.: | |||
| 3.75% 3/26/25 | 9,717,000 | 9,893,222 | |
| 3.8% 9/15/22 | 4,767,000 | 4,903,792 | |
| 3.8% 6/9/23 | 6,892,000 | 7,061,042 | |
| 4.55% 4/17/26 | 3,126,000 | 3,313,069 | |
| Discover Bank 7% 4/15/20 | 3,087,000 | 3,195,448 | |
| Fifth Third Bancorp 8.25% 3/1/38 | 1,098,000 | 1,576,357 | |
| HSBC Holdings PLC: | |||
| 4.25% 3/14/24 | 1,433,000 | 1,481,106 | |
| 5.25% 3/14/44 | 1,039,000 | 1,150,954 | |
| Huntington Bancshares, Inc. 7% 12/15/20 | 736,000 | 783,072 | |
| Intesa Sanpaolo SpA: | |||
| 5.017% 6/26/24 (c) | 1,324,000 | 1,254,879 | |
| 5.71% 1/15/26 (c) | 29,145,000 | 27,821,653 | |
| JPMorgan Chase & Co.: | |||
| 2.95% 10/1/26 | 3,081,000 | 3,051,659 | |
| 3.797% 7/23/24 (d) | 9,901,000 | 10,232,951 | |
| 3.875% 9/10/24 | 6,291,000 | 6,538,946 | |
| 4.125% 12/15/26 | 25,341,000 | 26,599,838 | |
| 4.35% 8/15/21 | 8,482,000 | 8,799,626 | |
| 4.625% 5/10/21 | 1,251,000 | 1,300,280 | |
| Rabobank Nederland 4.375% 8/4/25 | 4,789,000 | 4,958,052 | |
| Regions Bank 6.45% 6/26/37 | 4,251,000 | 5,283,798 | |
| Regions Financial Corp. 3.2% 2/8/21 | 2,243,000 | 2,259,758 | |
| Royal Bank of Scotland Group PLC: | |||
| 5.125% 5/28/24 | 16,223,000 | 16,692,299 | |
| 6% 12/19/23 | 13,577,000 | 14,487,265 | |
| 6.1% 6/10/23 | 6,222,000 | 6,601,243 | |
| 6.125% 12/15/22 | 21,905,000 | 23,297,189 | |
| Societe Generale 4.25% 4/14/25 (c) | 7,110,000 | 7,131,914 | |
| Synchrony Bank 3% 6/15/22 | 3,984,000 | 3,980,710 | |
| UniCredit SpA 6.572% 1/14/22 (c) | 6,953,000 | 7,265,221 | |
| 502,650,450 | |||
| Capital Markets - 1.7% | |||
| Affiliated Managers Group, Inc. 4.25% 2/15/24 | 1,396,000 | 1,472,937 | |
| Deutsche Bank AG 4.5% 4/1/25 | 5,769,000 | 5,413,252 | |
| Deutsche Bank AG New York Branch: | |||
| 3.3% 11/16/22 | 7,369,000 | 7,163,294 | |
| 4.1% 1/13/26 | 8,332,000 | 8,093,885 | |
| 5% 2/14/22 | 11,778,000 | 12,024,977 | |
| Goldman Sachs Group, Inc.: | |||
| 2.876% 10/31/22 (d) | 10,640,000 | 10,628,530 | |
| 3.2% 2/23/23 | 5,987,000 | 6,054,699 | |
| 3.272% 9/29/25 (d) | 35,921,000 | 35,907,464 | |
| 4.25% 10/21/25 | 12,215,000 | 12,657,762 | |
| 6.75% 10/1/37 | 59,592,000 | 75,036,751 | |
| IntercontinentalExchange, Inc.: | |||
| 2.75% 12/1/20 | 1,140,000 | 1,142,948 | |
| 3.75% 12/1/25 | 2,038,000 | 2,143,110 | |
| Moody's Corp.: | |||
| 3.25% 1/15/28 | 2,085,000 | 2,087,155 | |
| 4.875% 2/15/24 | 1,958,000 | 2,124,954 | |
| Morgan Stanley: | |||
| 3.125% 1/23/23 | 5,527,000 | 5,576,268 | |
| 3.125% 7/27/26 | 14,775,000 | 14,673,532 | |
| 3.625% 1/20/27 | 16,594,000 | 16,903,135 | |
| 3.7% 10/23/24 | 4,754,000 | 4,917,967 | |
| 3.75% 2/25/23 | 3,789,000 | 3,913,227 | |
| 3.875% 4/29/24 | 4,377,000 | 4,567,575 | |
| 4.1% 5/22/23 | 5,527,000 | 5,744,403 | |
| 4.431% 1/23/30 (d) | 5,526,000 | 5,935,670 | |
| 4.875% 11/1/22 | 9,955,000 | 10,592,305 | |
| 5% 11/24/25 | 21,351,000 | 23,265,396 | |
| 5.75% 1/25/21 | 4,669,000 | 4,894,376 | |
| 282,935,572 | |||
| Consumer Finance - 0.5% | |||
| AerCap Ireland Capital Ltd./AerCap Global Aviation Trust: | |||
| 3.5% 5/26/22 | 1,452,000 | 1,460,470 | |
| 4.125% 7/3/23 | 4,250,000 | 4,379,429 | |
| 4.45% 12/16/21 | 3,670,000 | 3,784,646 | |
| 4.45% 4/3/26 | 4,254,000 | 4,340,575 | |
| 4.5% 5/15/21 | 1,333,000 | 1,369,227 | |
| 4.875% 1/16/24 | 6,629,000 | 7,006,796 | |
| 5% 10/1/21 | 1,999,000 | 2,083,053 | |
| Capital One Financial Corp. 3.8% 1/31/28 | 4,331,000 | 4,330,090 | |
| Discover Financial Services: | |||
| 3.85% 11/21/22 | 2,241,000 | 2,313,145 | |
| 3.95% 11/6/24 | 1,874,000 | 1,939,240 | |
| 4.1% 2/9/27 | 4,579,000 | 4,633,731 | |
| 4.5% 1/30/26 | 5,913,000 | 6,179,745 | |
| 5.2% 4/27/22 | 1,887,000 | 2,008,516 | |
| Ford Motor Credit Co. LLC: | |||
| 5.085% 1/7/21 | 3,662,000 | 3,760,556 | |
| 5.584% 3/18/24 | 8,520,000 | 8,870,999 | |
| 5.596% 1/7/22 | 7,576,000 | 7,928,296 | |
| Synchrony Financial: | |||
| 3% 8/15/19 | 526,000 | 526,050 | |
| 3.75% 8/15/21 | 1,457,000 | 1,480,770 | |
| 3.95% 12/1/27 | 8,239,000 | 7,971,033 | |
| 4.25% 8/15/24 | 1,467,000 | 1,498,464 | |
| 4.375% 3/19/24 | 3,110,000 | 3,197,205 | |
| 5.15% 3/19/29 | 8,944,000 | 9,281,334 | |
| 90,343,370 | |||
| Diversified Financial Services - 0.3% | |||
| Avolon Holdings Funding Ltd.: | |||
| 3.625% 5/1/22 (c) | 2,141,000 | 2,143,120 | |
| 3.95% 7/1/24 (c) | 2,844,000 | 2,825,087 | |
| 4.375% 5/1/26 (c) | 2,741,000 | 2,747,112 | |
| 5.25% 5/15/24 (c) | 2,900,000 | 3,012,520 | |
| AXA Equitable Holdings, Inc. 3.9% 4/20/23 | 1,038,000 | 1,075,435 | |
| Brixmor Operating Partnership LP: | |||
| 4.125% 6/15/26 | 1,631,000 | 1,671,070 | |
| 4.125% 5/15/29 | 1,066,000 | 1,083,816 | |
| Cigna Corp.: | |||
| 4.125% 11/15/25 (c) | 2,569,000 | 2,683,505 | |
| 4.375% 10/15/28 (c) | 6,630,000 | 6,959,427 | |
| 4.8% 8/15/38 (c) | 4,128,000 | 4,223,370 | |
| 4.9% 12/15/48 (c) | 4,124,000 | 4,220,108 | |
| Park Aerospace Holdings Ltd. 5.5% 2/15/24 (c) | 7,300,000 | 7,652,663 | |
| Pine Street Trust I: | |||
| 4.572% 2/15/29 (c) | 7,749,000 | 7,967,315 | |
| 5.568% 2/15/49 (c) | 7,700,000 | 8,092,389 | |
| Voya Financial, Inc. 3.125% 7/15/24 | 2,503,000 | 2,510,746 | |
| 58,867,683 | |||
| Insurance - 0.2% | |||
| American International Group, Inc. 4.875% 6/1/22 | 2,648,000 | 2,810,263 | |
| Aon Corp. 5% 9/30/20 | 983,000 | 1,014,398 | |
| Hartford Financial Services Group, Inc. 5.125% 4/15/22 | 2,692,000 | 2,873,321 | |
| Liberty Mutual Group, Inc. 4.569% 2/1/29 (c) | 2,429,000 | 2,588,286 | |
| Marsh & McLennan Companies, Inc.: | |||
| 4.375% 3/15/29 | 4,970,000 | 5,338,359 | |
| 4.75% 3/15/39 | 2,280,000 | 2,527,232 | |
| 4.8% 7/15/21 | 1,355,000 | 1,409,878 | |
| 4.9% 3/15/49 | 4,538,000 | 5,120,205 | |
| Pacific LifeCorp 5.125% 1/30/43 (c) | 2,623,000 | 2,912,702 | |
| Pricoa Global Funding I 5.375% 5/15/45 (d) | 3,148,000 | 3,210,960 | |
| Prudential Financial, Inc. 4.5% 11/16/21 | 1,288,000 | 1,347,079 | |
| Swiss Re Finance Luxembourg SA 5% 4/2/49 (c)(d) | 3,000,000 | 3,101,250 | |
| TIAA Asset Management Finance LLC 4.125% 11/1/24 (c) | 1,159,000 | 1,234,117 | |
| Unum Group: | |||
| 5.625% 9/15/20 | 1,914,000 | 1,987,403 | |
| 5.75% 8/15/42 | 1,622,000 | 1,825,621 | |
| 39,301,074 | |||
| TOTAL FINANCIALS | 974,098,149 | ||
| HEALTH CARE - 0.6% | |||
| Health Care Providers & Services - 0.5% | |||
| Cigna Corp. 3.75% 7/15/23 (c) | 5,313,000 | 5,451,948 | |
| CVS Health Corp.: | |||
| 4.1% 3/25/25 | 26,844,000 | 27,788,642 | |
| 4.3% 3/25/28 | 12,941,000 | 13,335,632 | |
| 4.78% 3/25/38 | 5,761,000 | 5,740,951 | |
| 5.05% 3/25/48 | 8,470,000 | 8,609,500 | |
| Elanco Animal Health, Inc.: | |||
| 3.912% 8/27/21 (c) | 1,077,000 | 1,099,356 | |
| 4.272% 8/28/23 (c) | 3,402,000 | 3,571,415 | |
| 4.9% 8/28/28 (c) | 1,432,000 | 1,552,506 | |
| HCA Holdings, Inc.: | |||
| 4.75% 5/1/23 | 138,000 | 145,351 | |
| 5.875% 3/15/22 | 164,000 | 175,404 | |
| 6.5% 2/15/20 | 2,079,000 | 2,128,119 | |
| Toledo Hospital: | |||
| 5.325% 11/15/28 | 2,395,000 | 2,577,409 | |
| 6.015% 11/15/48 | 9,929,000 | 11,286,597 | |
| WellPoint, Inc. 3.3% 1/15/23 | 4,322,000 | 4,388,299 | |
| 87,851,129 | |||
| Pharmaceuticals - 0.1% | |||
| Bayer U.S. Finance II LLC 4.25% 12/15/25 (c) | 5,418,000 | 5,572,081 | |
| Mylan NV: | |||
| 2.5% 6/7/19 | 1,694,000 | 1,693,887 | |
| 3.15% 6/15/21 | 4,013,000 | 3,992,900 | |
| 3.95% 6/15/26 | 2,065,000 | 1,941,393 | |
| Perrigo Finance PLC 3.5% 12/15/21 | 292,000 | 289,085 | |
| Teva Pharmaceutical Finance Netherlands III BV 2.2% 7/21/21 | 2,887,000 | 2,663,835 | |
| Zoetis, Inc. 3.25% 2/1/23 | 1,210,000 | 1,228,714 | |
| 17,381,895 | |||
| TOTAL HEALTH CARE | 105,233,024 | ||
| INDUSTRIALS - 0.1% | |||
| Building Products - 0.0% | |||
| Masco Corp. 4.45% 4/1/25 | 1,041,000 | 1,090,171 | |
| Trading Companies & Distributors - 0.1% | |||
| Air Lease Corp.: | |||
| 3% 9/15/23 | 583,000 | 578,700 | |
| 3.375% 6/1/21 | 1,957,000 | 1,975,560 | |
| 3.75% 2/1/22 | 2,924,000 | 2,982,640 | |
| 3.875% 4/1/21 | 2,112,000 | 2,148,804 | |
| 4.25% 2/1/24 | 7,180,000 | 7,459,145 | |
| 4.25% 9/15/24 | 2,331,000 | 2,427,257 | |
| 17,572,106 | |||
| Transportation Infrastructure - 0.0% | |||
| BNSF Funding Trust I 6.613% 12/15/55 (d) | 1,374,000 | 1,470,180 | |
| TOTAL INDUSTRIALS | 20,132,457 | ||
| INFORMATION TECHNOLOGY - 0.1% | |||
| Electronic Equipment & Components - 0.1% | |||
| Diamond 1 Finance Corp./Diamond 2 Finance Corp.: | |||
| 5.45% 6/15/23 (c) | 5,600,000 | 5,953,300 | |
| 6.02% 6/15/26 (c) | 1,948,000 | 2,097,653 | |
| 8,050,953 | |||
| Technology Hardware, Storage & Peripherals - 0.0% | |||
| Hewlett Packard Enterprise Co. 4.4% 10/15/22 (d) | 3,173,000 | 3,324,076 | |
| TOTAL INFORMATION TECHNOLOGY | 11,375,029 | ||
| MATERIALS - 0.1% | |||
| Chemicals - 0.0% | |||
| Nutrien Ltd.: | |||
| 4.2% 4/1/29 | 834,000 | 867,992 | |
| 5% 4/1/49 | 1,452,000 | 1,509,360 | |
| 2,377,352 | |||
| Metals & Mining - 0.1% | |||
| Anglo American Capital PLC 4.125% 4/15/21 (c) | 2,910,000 | 2,957,870 | |
| BHP Billiton Financial (U.S.A.) Ltd. 6.25% 10/19/75 (c)(d) | 1,321,000 | 1,367,896 | |
| Corporacion Nacional del Cobre de Chile (Codelco): | |||
| 3.625% 8/1/27 (c) | 1,499,000 | 1,524,491 | |
| 4.5% 8/1/47 (c) | 1,522,000 | 1,593,055 | |
| 7,443,312 | |||
| TOTAL MATERIALS | 9,820,664 | ||
| REAL ESTATE - 0.8% | |||
| Equity Real Estate Investment Trusts (REITs) - 0.5% | |||
| Alexandria Real Estate Equities, Inc.: | |||
| 2.75% 1/15/20 | 584,000 | 583,938 | |
| 4.6% 4/1/22 | 843,000 | 887,046 | |
| American Campus Communities Operating Partnership LP 3.75% 4/15/23 | 857,000 | 877,689 | |
| Boston Properties, Inc. 4.5% 12/1/28 | 4,766,000 | 5,176,082 | |
| Camden Property Trust: | |||
| 2.95% 12/15/22 | 1,200,000 | 1,210,629 | |
| 4.25% 1/15/24 | 2,252,000 | 2,385,824 | |
| Corporate Office Properties LP 5% 7/1/25 | 2,273,000 | 2,405,886 | |
| DDR Corp.: | |||
| 3.625% 2/1/25 | 1,532,000 | 1,527,701 | |
| 4.25% 2/1/26 | 2,753,000 | 2,819,571 | |
| 4.625% 7/15/22 | 1,302,000 | 1,350,711 | |
| Duke Realty LP: | |||
| 3.25% 6/30/26 | 589,000 | 590,167 | |
| 3.625% 4/15/23 | 1,544,000 | 1,587,443 | |
| 3.875% 10/15/22 | 4,345,000 | 4,491,683 | |
| 4.375% 6/15/22 | 1,300,000 | 1,361,304 | |
| Equity One, Inc. 3.75% 11/15/22 | 5,527,000 | 5,705,989 | |
| Highwoods/Forsyth LP 3.2% 6/15/21 | 1,625,000 | 1,631,579 | |
| Hudson Pacific Properties LP 4.65% 4/1/29 | 1,833,000 | 1,932,042 | |
| Lexington Corporate Properties Trust 4.4% 6/15/24 | 948,000 | 967,263 | |
| Omega Healthcare Investors, Inc.: | |||
| 4.375% 8/1/23 | 4,882,000 | 5,042,622 | |
| 4.5% 1/15/25 | 2,013,000 | 2,081,774 | |
| 4.5% 4/1/27 | 716,000 | 737,028 | |
| 4.75% 1/15/28 | 11,294,000 | 11,755,938 | |
| 4.95% 4/1/24 | 882,000 | 926,470 | |
| 5.25% 1/15/26 | 3,755,000 | 4,006,489 | |
| Retail Opportunity Investments Partnership LP: | |||
| 4% 12/15/24 | 641,000 | 631,626 | |
| 5% 12/15/23 | 494,000 | 510,535 | |
| Store Capital Corp. 4.625% 3/15/29 | 2,374,000 | 2,486,219 | |
| Ventas Realty LP: | |||
| 3.125% 6/15/23 | 1,033,000 | 1,048,193 | |
| 4% 3/1/28 | 2,150,000 | 2,217,657 | |
| 4.125% 1/15/26 | 999,000 | 1,043,217 | |
| Weingarten Realty Investors 3.375% 10/15/22 | 456,000 | 461,496 | |
| WP Carey, Inc.: | |||
| 4% 2/1/25 | 3,423,000 | 3,486,420 | |
| 4.6% 4/1/24 | 5,327,000 | 5,631,095 | |
| 79,559,326 | |||
| Real Estate Management & Development - 0.3% | |||
| Brandywine Operating Partnership LP: | |||
| 3.95% 2/15/23 | 7,832,000 | 8,097,161 | |
| 3.95% 11/15/27 | 4,382,000 | 4,420,052 | |
| 4.1% 10/1/24 | 2,782,000 | 2,874,824 | |
| CBRE Group, Inc. 4.875% 3/1/26 | 7,844,000 | 8,394,649 | |
| Digital Realty Trust LP 3.95% 7/1/22 | 2,137,000 | 2,215,688 | |
| Essex Portfolio LP 3.875% 5/1/24 | 1,923,000 | 1,998,238 | |
| Liberty Property LP: | |||
| 3.25% 10/1/26 | 1,586,000 | 1,563,973 | |
| 3.375% 6/15/23 | 1,643,000 | 1,670,217 | |
| 4.125% 6/15/22 | 1,115,000 | 1,156,189 | |
| Mack-Cali Realty LP: | |||
| 3.15% 5/15/23 | 3,573,000 | 3,293,683 | |
| 4.5% 4/18/22 | 678,000 | 663,781 | |
| Mid-America Apartments LP 4% 11/15/25 | 828,000 | 865,948 | |
| Post Apartment Homes LP 3.375% 12/1/22 | 502,000 | 510,013 | |
| Tanger Properties LP: | |||
| 3.125% 9/1/26 | 2,628,000 | 2,466,259 | |
| 3.75% 12/1/24 | 2,635,000 | 2,631,146 | |
| 3.875% 12/1/23 | 1,186,000 | 1,200,643 | |
| 3.875% 7/15/27 | 6,947,000 | 6,841,760 | |
| 50,864,224 | |||
| TOTAL REAL ESTATE | 130,423,550 | ||
| UTILITIES - 0.4% | |||
| Electric Utilities - 0.2% | |||
| Duquesne Light Holdings, Inc.: | |||
| 5.9% 12/1/21 (c) | 3,889,000 | 4,142,912 | |
| 6.4% 9/15/20 (c) | 5,173,000 | 5,397,286 | |
| FirstEnergy Corp.: | |||
| 4.25% 3/15/23 | 4,502,000 | 4,718,870 | |
| 7.375% 11/15/31 | 6,310,000 | 8,473,771 | |
| IPALCO Enterprises, Inc.: | |||
| 3.45% 7/15/20 | 4,960,000 | 4,988,824 | |
| 3.7% 9/1/24 | 1,963,000 | 2,005,164 | |
| 29,726,827 | |||
| Gas Utilities - 0.0% | |||
| Southern Natural Gas Co./Southern Natural Issuing Corp. 4.4% 6/15/21 | 701,000 | 720,971 | |
| Independent Power and Renewable Electricity Producers - 0.1% | |||
| Dolphin Subsidiary II, Inc. 7.25% 10/15/21 | 5,898,000 | 6,281,370 | |
| Emera U.S. Finance LP: | |||
| 2.15% 6/15/19 | 966,000 | 965,692 | |
| 2.7% 6/15/21 | 951,000 | 947,784 | |
| 8,194,846 | |||
| Multi-Utilities - 0.1% | |||
| Dominion Resources, Inc.: | |||
| 3 month U.S. LIBOR + 2.300% 4.901% 9/30/66 (d)(e) | 5,861,000 | 5,392,120 | |
| 3 month U.S. LIBOR + 2.825% 5.4168% 6/30/66 (d)(e) | 1,683,000 | 1,582,020 | |
| NiSource Finance Corp. 5.95% 6/15/41 | 2,273,000 | 2,745,389 | |
| Puget Energy, Inc.: | |||
| 5.625% 7/15/22 | 3,305,000 | 3,535,721 | |
| 6% 9/1/21 | 3,185,000 | 3,395,260 | |
| 6.5% 12/15/20 | 1,021,000 | 1,077,229 | |
| Sempra Energy 6% 10/15/39 | 2,744,000 | 3,305,174 | |
| Wisconsin Energy Corp. 3 month U.S. LIBOR + 2.113% 4.6305% 5/15/67 (d)(e) | 1,843,000 | 1,539,827 | |
| 22,572,740 | |||
| TOTAL UTILITIES | 61,215,384 | ||
| TOTAL NONCONVERTIBLE BONDS | |||
| (Cost $1,847,757,864) | 1,945,763,945 | ||
| U.S. Treasury Obligations - 14.3% | |||
| U.S. Treasury Notes: | |||
| 2.125% 7/31/24 | $338,291,000 | $341,211,402 | |
| 2.125% 11/30/24 | 28,603,400 | 28,840,272 | |
| 2.125% 5/15/25 | 45,672,600 | 46,008,008 | |
| 2.25% 10/31/24 | 21,880,400 | 22,204,333 | |
| 2.25% 12/31/24 | 68,047,200 | 69,049,301 | |
| 2.25% 2/15/27 | 81,654,000 | 82,770,364 | |
| 2.375% 5/15/27 | 146,537,200 | 149,840,011 | |
| 2.5% 3/31/23 | 216,098,100 | 220,791,481 | |
| 2.625% 6/30/23 | 11,377,500 | 11,693,048 | |
| 2.625% 12/31/23 | 234,040,000 | 241,106,910 | |
| 2.625% 3/31/25 | 85,883,300 | 88,916,054 | |
| 2.75% 6/30/25 | 457,127,400 | 476,823,164 | |
| 2.875% 11/30/25 | 324,464,000 | 341,422,312 | |
| 3.125% 11/15/28 | 284,242,000 | 308,324,847 | |
| TOTAL U.S. TREASURY OBLIGATIONS | |||
| (Cost $2,327,206,073) | 2,429,001,507 | ||
| U.S. Government Agency - Mortgage Securities - 17.4% | |||
| Fannie Mae - 9.6% | |||
| 12 month U.S. LIBOR + 1.445% 4.497% 4/1/37 (d)(e) | 20,094 | 20,954 | |
| 12 month U.S. LIBOR + 1.480% 4.287% 7/1/34 (d)(e) | 5,568 | 5,783 | |
| 12 month U.S. LIBOR + 1.495% 4.511% 1/1/35 (d)(e) | 21,681 | 22,567 | |
| 12 month U.S. LIBOR + 1.523% 4.66% 3/1/36 (d)(e) | 1,978 | 2,067 | |
| 12 month U.S. LIBOR + 1.553% 4.268% 6/1/36 (d)(e) | 22,273 | 23,263 | |
| 12 month U.S. LIBOR + 1.565% 4.69% 3/1/37 (d)(e) | 7,044 | 7,371 | |
| 12 month U.S. LIBOR + 1.594% 4.308% 5/1/36 (d)(e) | 43,616 | 45,595 | |
| 12 month U.S. LIBOR + 1.617% 4.582% 3/1/33 (d)(e) | 12,779 | 13,322 | |
| 12 month U.S. LIBOR + 1.641% 4.375% 9/1/36 (d)(e) | 11,237 | 11,745 | |
| 12 month U.S. LIBOR + 1.645% 4.693% 6/1/47 (d)(e) | 14,482 | 15,271 | |
| 12 month U.S. LIBOR + 1.685% 4.56% 4/1/36 (d)(e) | 4,412 | 4,621 | |
| 12 month U.S. LIBOR + 1.690% 4.489% 8/1/35 (d)(e) | 11,161 | 11,687 | |
| 12 month U.S. LIBOR + 1.718% 4.406% 5/1/35 (d)(e) | 27,283 | 28,494 | |
| 12 month U.S. LIBOR + 1.725% 3.252% 6/1/42 (d)(e) | 35,122 | 36,335 | |
| 12 month U.S. LIBOR + 1.728% 4.54% 11/1/36 (d)(e) | 9,650 | 10,100 | |
| 12 month U.S. LIBOR + 1.730% 3.544% 7/1/43 (d)(e) | 745,822 | 776,669 | |
| 12 month U.S. LIBOR + 1.741% 4.73% 3/1/40 (d)(e) | 46,845 | 49,099 | |
| 12 month U.S. LIBOR + 1.745% 4.742% 7/1/35 (d)(e) | 13,298 | 13,922 | |
| 12 month U.S. LIBOR + 1.750% 4.5% 8/1/41 (d)(e) | 52,385 | 54,578 | |
| 12 month U.S. LIBOR + 1.800% 4.546% 7/1/41 (d)(e) | 35,155 | 36,671 | |
| 12 month U.S. LIBOR + 1.800% 4.788% 1/1/42 (d)(e) | 70,487 | 73,462 | |
| 12 month U.S. LIBOR + 1.810% 4.81% 12/1/39 (d)(e) | 14,026 | 14,656 | |
| 12 month U.S. LIBOR + 1.812% 4.609% 12/1/40 (d)(e) | 985,012 | 1,027,124 | |
| 12 month U.S. LIBOR + 1.818% 4.546% 7/1/41 (d)(e) | 20,211 | 21,092 | |
| 12 month U.S. LIBOR + 1.818% 4.568% 9/1/41 (d)(e) | 12,315 | 12,863 | |
| 12 month U.S. LIBOR + 1.818% 4.933% 2/1/42 (d)(e) | 75,873 | 79,334 | |
| 12 month U.S. LIBOR + 1.825% 4.95% 2/1/35 (d)(e) | 119,281 | 125,521 | |
| 12 month U.S. LIBOR + 1.830% 4.657% 10/1/41 (d)(e) | 12,291 | 12,846 | |
| 12 month U.S. LIBOR + 1.851% 4.512% 5/1/36 (d)(e) | 12,085 | 12,684 | |
| 12 month U.S. LIBOR + 1.875% 4.75% 10/1/36 (d)(e) | 11,632 | 12,188 | |
| 12 month U.S. LIBOR + 1.900% 4.634% 7/1/37 (d)(e) | 21,710 | 22,931 | |
| 6 month U.S. LIBOR + 1.505% 4.255% 1/1/35 (d)(e) | 29,473 | 30,439 | |
| 6 month U.S. LIBOR + 1.535% 4.39% 12/1/34 (d)(e) | 6,651 | 6,876 | |
| 6 month U.S. LIBOR + 1.535% 4.41% 3/1/35 (d)(e) | 4,193 | 4,337 | |
| 6 month U.S. LIBOR + 1.556% 4.33% 10/1/33 (d)(e) | 2,409 | 2,490 | |
| 6 month U.S. LIBOR + 1.565% 4.42% 7/1/35 (d)(e) | 2,666 | 2,759 | |
| 6 month U.S. LIBOR + 1.740% 4.365% 12/1/34 (d)(e) | 402 | 419 | |
| 6 month U.S. LIBOR + 1.960% 4.725% 9/1/35 (d)(e) | 4,849 | 5,075 | |
| U.S. TREASURY 1 YEAR INDEX + 2.208% 4.833% 3/1/35 (d)(e) | 4,622 | 4,832 | |
| U.S. TREASURY 1 YEAR INDEX + 2.270% 4.676% 6/1/36 (d)(e) | 41,767 | 43,553 | |
| U.S. TREASURY 1 YEAR INDEX + 2.295% 4.678% 10/1/33 (d)(e) | 16,784 | 17,496 | |
| U.S. TREASURY 1 YEAR INDEX + 2.447% 4.872% 7/1/34 (d)(e) | 35,558 | 37,108 | |
| 2.5% 6/1/34 (b) | 6,100,000 | 6,103,935 | |
| 2.5% 6/1/34 (b) | 6,300,000 | 6,304,064 | |
| 2.5% 4/1/37 to 8/1/43 | 31,781,956 | 31,656,214 | |
| 3% 6/1/34 (b) | 1,850,000 | 1,877,085 | |
| 3% 6/1/34 (b) | 3,150,000 | 3,196,118 | |
| 3% 6/1/34 (b) | 5,750,000 | 5,834,184 | |
| 3% 6/1/34 (b) | 4,350,000 | 4,413,687 | |
| 3% 6/1/34 (b) | 7,600,000 | 7,711,269 | |
| 3% 6/1/34 (b) | 10,000,000 | 10,146,407 | |
| 3% 6/1/34 (b) | 4,500,000 | 4,565,883 | |
| 3% 6/1/34 (b) | 15,300,000 | 15,524,003 | |
| 3% 7/1/34 (b) | 5,300,000 | 5,376,147 | |
| 3% 7/1/34 (b) | 2,650,000 | 2,688,073 | |
| 3% 7/1/34 (b) | 1,800,000 | 1,825,861 | |
| 3% 6/1/49 (b) | 25,900,000 | 26,003,748 | |
| 3% 6/1/49 (b) | 5,200,000 | 5,220,830 | |
| 3% 6/1/49 (b) | 5,200,000 | 5,220,830 | |
| 3% 6/1/49 (b) | 7,450,000 | 7,479,842 | |
| 3% 6/1/49 (b) | 12,450,000 | 12,499,871 | |
| 3% 6/1/49 (b) | 1,000,000 | 1,004,006 | |
| 3% 6/1/49 (b) | 19,175,000 | 19,251,809 | |
| 3% 6/1/49 (b) | 5,900,000 | 5,923,634 | |
| 3% 6/1/49 (b) | 32,900,000 | 33,031,788 | |
| 3% 6/1/49 (b) | 2,500,000 | 2,510,014 | |
| 3% 6/1/49 (b) | 5,900,000 | 5,923,634 | |
| 3% 6/1/49 (b) | 19,175,000 | 19,251,809 | |
| 3% 6/1/49 (b) | 2,225,000 | 2,233,913 | |
| 3% 6/1/49 (b) | 800,000 | 803,205 | |
| 3% 6/1/49 (b) | 14,900,000 | 14,959,685 | |
| 3% 6/1/49 (b) | 13,000,000 | 13,052,074 | |
| 3% 6/1/49 (b) | 150,000 | 150,601 | |
| 3% 6/1/49 (b) | 8,000,000 | 8,032,046 | |
| 3% 6/1/49 (b) | 5,800,000 | 5,823,233 | |
| 3% 6/1/49 (b) | 7,300,000 | 7,329,242 | |
| 3% 7/1/49 (b) | 57,025,000 | 57,222,238 | |
| 3% 7/1/49 (b) | 18,100,000 | 18,162,604 | |
| 3.25% 12/1/41 | 7,350 | 7,502 | |
| 3.4% 7/1/42 to 9/1/42 | 174,928 | 179,267 | |
| 3.5% 7/1/32 to 2/1/57 (f) | 298,742,406 | 307,088,261 | |
| 3.5% 6/1/34 (b) | 1,300,000 | 1,335,362 | |
| 3.5% 6/1/49 (b) | 46,475,000 | 47,398,254 | |
| 3.5% 6/1/49 (b) | 27,600,000 | 28,148,291 | |
| 3.5% 6/1/49 (b) | 3,450,000 | 3,518,536 | |
| 3.5% 6/1/49 (b) | 3,500,000 | 3,569,530 | |
| 3.5% 6/1/49 (b) | 3,450,000 | 3,518,536 | |
| 3.5% 6/1/49 (b) | 3,500,000 | 3,569,530 | |
| 3.525% 5/1/42 | 4,163 | 4,318 | |
| 3.65% 5/1/42 to 8/1/42 | 89,683 | 92,827 | |
| 3.9% 4/1/42 | 10,965 | 11,474 | |
| 4% 11/1/31 to 10/1/48 | 235,392,104 | 245,405,853 | |
| 4% 6/1/49 (b) | 6,500,000 | 6,709,192 | |
| 4% 6/1/49 (b) | 23,900,000 | 24,669,183 | |
| 4.25% 11/1/41 | 35,522 | 37,801 | |
| 4.5% 11/1/19 to 8/1/56 | 142,719,944 | 151,143,637 | |
| 5% 12/1/19 to 8/1/56 | 9,904,849 | 10,770,400 | |
| 5.253% 8/1/41 | 497,230 | 537,627 | |
| 5.5% 10/1/21 to 5/1/44 | 5,421,713 | 5,917,288 | |
| 6% 7/1/19 to 1/1/42 | 4,273,539 | 4,815,405 | |
| 6.5% 2/1/20 to 8/1/39 | 4,066,346 | 4,561,602 | |
| 6.532% 2/1/39 | 615,670 | 664,027 | |
| 7% 9/1/21 to 7/1/37 | 277,391 | 312,147 | |
| 7.5% 9/1/22 to 9/1/32 | 134,572 | 152,174 | |
| 8% 3/1/37 | 3,286 | 3,910 | |
| 8.5% 2/1/22 to 11/1/22 | 1,682 | 1,775 | |
| 9% 10/1/30 | 8,157 | 9,587 | |
| 9.5% 9/1/21 to 8/1/22 | 72 | 74 | |
| 3% 2/1/21 to 9/1/48 (b) | 389,130,071 | 394,706,436 | |
| TOTAL FANNIE MAE | 1,629,933,591 | ||
| Freddie Mac - 3.4% | |||
| 12 month U.S. LIBOR + 1.325% 4.205% 1/1/36 (d)(e) | 10,867 | 11,229 | |
| 12 month U.S. LIBOR + 1.375% 4.28% 3/1/36 (d)(e) | 29,151 | 30,221 | |
| 12 month U.S. LIBOR + 1.500% 4.53% 3/1/36 (d)(e) | 34,315 | 35,713 | |
| 12 month U.S. LIBOR + 1.515% 4.39% 11/1/35 (d)(e) | 10,117 | 10,510 | |
| 12 month U.S. LIBOR + 1.750% 4.5% 7/1/41 (d)(e) | 101,926 | 106,018 | |
| 12 month U.S. LIBOR + 1.750% 4.643% 12/1/40 (d)(e) | 517,245 | 537,915 | |
| 12 month U.S. LIBOR + 1.754% 4.505% 9/1/41 (d)(e) | 191,018 | 198,773 | |
| 12 month U.S. LIBOR + 1.793% 4.695% 4/1/37 (d)(e) | 12,649 | 13,266 | |
| 12 month U.S. LIBOR + 1.864% 4.739% 4/1/36 (d)(e)(g) | 9,972 | 10,515 | |
| 12 month U.S. LIBOR + 1.877% 4.785% 4/1/41 (d)(e) | 15,144 | 15,816 | |
| 12 month U.S. LIBOR + 1.880% 4.63% 9/1/41 (d)(e) | 14,801 | 15,467 | |
| 12 month U.S. LIBOR + 1.884% 4.668% 10/1/42 (d)(e) | 94,002 | 97,928 | |
| 12 month U.S. LIBOR + 1.910% 4.594% 5/1/41 (d)(e) | 23,043 | 24,107 | |
| 12 month U.S. LIBOR + 1.910% 4.62% 6/1/41 (d)(e) | 30,601 | 31,905 | |
| 12 month U.S. LIBOR + 1.910% 4.66% 6/1/41 (d)(e) | 13,936 | 14,509 | |
| 12 month U.S. LIBOR + 1.910% 4.69% 5/1/41 (d)(e) | 35,384 | 36,965 | |
| 12 month U.S. LIBOR + 1.920% 4.67% 6/1/36 (d)(e) | 5,700 | 5,987 | |
| 12 month U.S. LIBOR + 1.961% 4.598% 6/1/33 (d)(e) | 17,025 | 17,890 | |
| 12 month U.S. LIBOR + 1.998% 4.913% 4/1/38 (d)(e) | 28,676 | 30,275 | |
| 12 month U.S. LIBOR + 2.045% 4.778% 7/1/36 (d)(e) | 19,845 | 20,794 | |
| 12 month U.S. LIBOR + 2.073% 5.004% 3/1/33 (d)(e) | 449 | 470 | |
| 12 month U.S. LIBOR + 2.200% 5.075% 12/1/36 (d)(e) | 32,296 | 33,943 | |
| 6 month U.S. LIBOR + 1.125% 3.924% 8/1/37 (d)(e) | 9,371 | 9,559 | |
| 6 month U.S. LIBOR + 1.445% 4.195% 3/1/35 (d)(e) | 12,817 | 13,208 | |
| 6 month U.S. LIBOR + 1.608% 4.205% 12/1/35 (d)(e) | 8,838 | 9,142 | |
| 6 month U.S. LIBOR + 1.647% 4.438% 2/1/37 (d)(e) | 37,967 | 39,356 | |
| 6 month U.S. LIBOR + 1.720% 4.567% 8/1/37 (d)(e) | 18,204 | 18,948 | |
| 6 month U.S. LIBOR + 1.746% 4.58% 5/1/37 (d)(e) | 4,707 | 4,911 | |
| 6 month U.S. LIBOR + 1.843% 4.609% 10/1/36 (d)(e) | 42,273 | 44,091 | |
| 6 month U.S. LIBOR + 1.912% 4.684% 10/1/35 (d)(e) | 25,650 | 26,741 | |
| 6 month U.S. LIBOR + 2.020% 4.692% 6/1/37 (d)(e) | 24,717 | 25,795 | |
| 6 month U.S. LIBOR + 2.040% 4.726% 6/1/37 (d)(e) | 14,142 | 14,766 | |
| 6 month U.S. LIBOR + 2.286% 5.015% 10/1/35 (d)(e) | 20,014 | 20,812 | |
| U.S. TREASURY 1 YEAR INDEX + 2.035% 4.393% 6/1/33 (d)(e) | 36,330 | 37,880 | |
| U.S. TREASURY 1 YEAR INDEX + 2.282% 4.532% 6/1/33 (d)(e) | 74,571 | 77,710 | |
| U.S. TREASURY 1 YEAR INDEX + 2.410% 4.826% 3/1/35 (d)(e) | 145,606 | 151,496 | |
| 3% 6/1/31 to 2/1/47 | 118,287,507 | 119,753,148 | |
| 3.5% 6/1/27 to 12/1/48 (b)(f) | 243,983,065 | 251,536,620 | |
| 3.5% 8/1/47 | 6,417,021 | 6,604,726 | |
| 4% 6/1/33 to 10/1/48 (h) | 143,771,113 | 150,370,945 | |
| 4% 4/1/48 | 231,696 | 240,146 | |
| 4.5% 6/1/25 to 12/1/48 | 32,907,973 | 35,045,959 | |
| 5% 6/1/20 to 7/1/41 | 5,591,633 | 6,089,738 | |
| 5.5% 10/1/19 to 6/1/41 | 2,710,126 | 2,986,718 | |
| 6% 6/1/20 to 6/1/39 | 565,299 | 633,233 | |
| 6.5% 4/1/21 to 9/1/39 | 974,631 | 1,104,150 | |
| 7% 8/1/21 to 9/1/36 | 267,878 | 304,660 | |
| 7.5% 1/1/27 to 7/1/34 | 72,806 | 83,533 | |
| 8% 7/1/24 to 4/1/32 | 6,362 | 7,266 | |
| 8.5% 6/1/22 to 1/1/28 | 4,569 | 5,065 | |
| 9% 9/1/20 to 5/1/21 | 5 | 5 | |
| TOTAL FREDDIE MAC | 576,560,543 | ||
| Ginnie Mae - 4.4% | |||
| 3.5% 11/15/40 to 9/20/48 | 136,919,215 | 141,089,471 | |
| 4% 7/20/33 to 5/20/49 | 70,428,604 | 73,713,478 | |
| 4.5% 6/20/33 to 11/20/47 | 51,983,222 | 54,817,134 | |
| 5.5% 8/15/33 to 9/15/39 | 523,864 | 578,031 | |
| 6% 10/15/30 to 5/15/40 | 663,672 | 753,713 | |
| 7% 11/15/22 to 11/15/32 | 257,917 | 293,323 | |
| 7.5% 11/15/21 to 9/15/31 | 88,629 | 97,865 | |
| 8% 6/15/21 to 11/15/29 | 28,971 | 31,531 | |
| 8.5% 10/15/21 to 1/15/31 | 9,605 | 10,838 | |
| 9% 10/15/19 to 1/15/23 | 56 | 59 | |
| 9.5% 3/15/23 | 18 | 19 | |
| 3% 5/15/42 to 6/20/48 | 130,386,041 | 132,510,822 | |
| 3% 6/1/49 (b) | 30,900,000 | 31,364,334 | |
| 3% 6/1/49 (b) | 17,375,000 | 17,636,094 | |
| 3% 6/1/49 (b) | 10,050,000 | 10,201,021 | |
| 3% 6/1/49 (b) | 6,950,000 | 7,054,438 | |
| 3% 6/1/49 (b) | 23,750,000 | 24,106,891 | |
| 3% 6/1/49 (b) | 19,850,000 | 20,148,286 | |
| 3.5% 6/1/49 (b) | 29,550,000 | 30,374,587 | |
| 3.5% 6/1/49 (b) | 25,100,000 | 25,800,410 | |
| 3.5% 6/1/49 (b) | 18,550,000 | 19,067,634 | |
| 3.5% 6/1/49 (b) | 30,750,000 | 31,608,073 | |
| 3.5% 6/1/49 (b) | 11,400,000 | 11,718,115 | |
| 3.5% 6/1/49 (b) | 1,950,000 | 2,004,414 | |
| 3.5% 6/1/49 (b) | 1,950,000 | 2,004,414 | |
| 3.5% 6/1/49 (b) | 4,350,000 | 4,471,386 | |
| 3.5% 6/1/49 (b) | 3,900,000 | 4,008,829 | |
| 3.5% 6/1/49 (b) | 4,350,000 | 4,471,386 | |
| 3.5% 7/1/49 (b) | 34,850,000 | 35,781,148 | |
| 3.5% 7/1/49 (b) | 20,000,000 | 20,534,375 | |
| 4% 6/1/49 (b) | 15,400,000 | 15,929,558 | |
| 4% 6/1/49 (b) | 9,965,000 | 10,307,665 | |
| 5% 4/15/33 to 9/15/41 | 4,541,015 | 4,909,981 | |
| 6.5% 3/20/31 to 6/15/37 | 78,022 | 89,518 | |
| 11% 9/20/19 | 3 | 3 | |
| TOTAL GINNIE MAE | 737,488,844 | ||
| TOTAL U.S. GOVERNMENT AGENCY - MORTGAGE SECURITIES | |||
| (Cost $2,908,500,978) | 2,943,982,978 | ||
| Asset-Backed Securities - 1.0% | |||
| AASET Trust Series 2018-1A Class A, 3.844% 1/16/38 (c) | $4,085,367 | $4,105,719 | |
| Aimco Series 2019-10A Class A, 3 month U.S. LIBOR + 1.320% 1.32% 7/22/32 (c)(d)(e) | 8,608,000 | 8,608,000 | |
| ALG Student Loan Trust I Series 2006-1A Class A3, 3 month U.S. LIBOR + 0.150% 2.7324% 10/28/23 (c)(d)(e) | 173,420 | 172,712 | |
| Argent Securities, Inc. pass-thru certificates Series 2005-W2 Class A2C, 1 month U.S. LIBOR + 0.360% 2.7898% 10/25/35 (d)(e) | 156,557 | 155,897 | |
| Blackbird Capital Aircraft Series 2016-1A: | |||
| Class A, 4.213% 12/16/41 (c) | 6,962,313 | 7,164,629 | |
| Class AA, 2.487% 12/16/41 (c) | 1,468,375 | 1,455,065 | |
| Brazos Higher Education Authority, Inc.: | |||
| Series 2010-1 Class A1, 3 month U.S. LIBOR + 0.900% 3.4206% 5/25/29 (d)(e) | 771,382 | 775,169 | |
| Series 2011-2 Class A2, 3 month U.S. LIBOR + 0.850% 3.4303% 7/25/29 (d)(e) | 1,379,271 | 1,385,735 | |
| CAM Mortgage Trust Series 2018-1 Class A1, 3.96% 12/1/65 (c) | 44,977 | 44,950 | |
| Castlelake Aircraft Securitization Trust Series 2019-1A: | |||
| Class A, 3.967% 4/15/39 (c) | 8,783,822 | 8,900,955 | |
| Class B, 5.095% 4/15/39 (c) | 3,013,298 | 3,074,856 | |
| Castlelake Aircraft Structured Trust Series 2018-1 Class A, 4.125% 6/15/43 (c) | 6,886,152 | 7,015,308 | |
| Cedar Funding Ltd. Series 2019-11A Class A1A, 3 month U.S. LIBOR + 1.350% 3.8749% 5/29/32 (c)(d)(e) | 4,342,000 | 4,342,000 | |
| Citi Mortgage Loan Trust Series 2007-1 Class 1A, 1 month U.S. LIBOR + 1.350% 3.836% 10/25/37 (c)(d)(e) | 245,560 | 248,396 | |
| Collegiate Funding Services Education Loan Trust Series 2004-A Class A4, 3 month U.S. LIBOR + 0.340% 2.9374% 9/28/30 (d)(e) | 1,989,615 | 1,987,527 | |
| Consumer Lending Receivables Trust Series 2019-A Class A, 3.52% 4/15/26 (c) | 7,237,102 | 7,259,274 | |
| Consumer Loan Underlying Bond Credit Trust Series 2018-P3 Class A, 3.82% 1/15/26 (c) | 6,098,844 | 6,144,117 | |
| Countrywide Home Loans, Inc. Series 2003-BC1 Class B1, 1 month U.S. LIBOR + 5.250% 7.6798% 3/25/32 (d)(e) | 7,550 | 7,691 | |
| DB Master Finance LLC Series 2017-1A: | |||
| Class A2I, 3.629% 11/20/47 (c) | 3,185,490 | 3,264,426 | |
| Class A2II, 4.03% 11/20/47 (c) | 5,418,485 | 5,581,256 | |
| Dryden Senior Loan Fund: | |||
| Series 2014-36A Class AR2, 3 month U.S. LIBOR + 1.280% 3.8768% 4/15/29 (c)(d)(e) | 10,233,000 | 10,277,964 | |
| Series 2019-72A Class A, 3 month U.S. LIBOR + 1.330% 1.33% 5/15/32 (b)(c)(d)(e) | 7,104,000 | 7,104,000 | |
| Finance of America Structured Securities Trust Series 2018-HB1 Class A, 3.3751% 9/25/28 (c) | 176,147 | 175,908 | |
| First Franklin Mortgage Loan Trust Series 2004-FF2 Class M3, 1 month U.S. LIBOR + 0.825% 3.2548% 3/25/34 (d)(e) | 569 | 530 | |
| Ford Credit Auto Owner Trust Series 2019-1 Class A, 3.52% 7/15/30 (c) | 2,000,000 | 2,071,436 | |
| Ford Credit Floorplan Master Owner Trust Series 2018-4 Class A, 4.06% 11/15/30 | 1,820,000 | 1,939,329 | |
| GCO Education Loan Funding Master Trust II Series 2007-1A Class A6L, 3 month U.S. LIBOR + 0.110% 2.761% 11/25/26 (c)(d)(e) | 2,263,504 | 2,257,892 | |
| GCO Education Loan Funding Trust Series 2006-1 Class A9L, 3 month U.S. LIBOR + 0.160% 2.811% 5/25/26 (d)(e) | 2,474,005 | 2,465,707 | |
| GE Business Loan Trust Series 2006-2A: | |||
| Class A, 1 month U.S. LIBOR + 0.180% 2.6196% 11/15/34 (c)(d)(e) | 68,192 | 67,108 | |
| Class B, 1 month U.S. LIBOR + 0.280% 2.7196% 11/15/34 (c)(d)(e) | 24,688 | 24,267 | |
| Class C, 1 month U.S. LIBOR + 0.380% 2.8196% 11/15/34 (c)(d)(e) | 40,915 | 39,129 | |
| Class D, 1 month U.S. LIBOR + 0.750% 3.1896% 11/15/34 (c)(d)(e) | 19,512 | 18,477 | |
| Grain Spectrum Funding II LLC Series 2014-1 3.29% 10/10/34 (c) | 2,169,500 | 2,159,849 | |
| Hertz Fleet Lease Funding LP Series 2017-1 Class A1, 1 month U.S. LIBOR + 0.650% 3.1014% 4/10/31 (c)(d)(e) | 147,751 | 147,924 | |
| Horizon Aircraft Finance I Ltd. Series 2018-1 Class A, 4.458% 12/15/38 (c) | 3,587,672 | 3,706,418 | |
| Madison Park Funding Ltd.: | |||
| Series 2012-10A Class AR2, 3 month U.S. LIBOR + 1.220% 1.22% 1/20/29 (c)(d)(e) | 3,495,000 | 3,495,000 | |
| Series 2019-37A Class A1, 3 month U.S. LIBOR + 1.300% 1.3% 7/15/32 (b)(c)(d)(e) | 8,593,000 | 8,593,000 | |
| Magnetite CLO Ltd. Series 2019-21A Class A, 3 month U.S. LIBOR + 1.280% 3.9086% 4/20/30 (c)(d)(e) | 7,329,000 | 7,332,848 | |
| Metlife Securitization Trust Series 2019-1A Class A1A, 3.75% 4/25/58 (c) | 4,260,876 | 4,397,742 | |
| Nationstar HECM Loan Trust: | |||
| Series 2018-2A Class A, 3.1877% 7/25/28 (c) | 171,863 | 171,905 | |
| Series 2018-3A Class A 3.5545% 11/25/28 (c) | 4,875,568 | 4,861,522 | |
| Navient Student Loan Trust Series 2017-3A Class A2, 1 month U.S. LIBOR + 0.600% 3.0298% 7/26/66 (c)(d)(e) | 740,000 | 740,176 | |
| Navistar Financial Dealer Note Master Trust Series 2018-1 Class A, 1 month U.S. LIBOR + 0.630% 3.0598% 9/25/23 (c)(d)(e) | 373,000 | 373,760 | |
| New Century Home Equity Loan Trust Series 2005-4 Class M2, 1 month U.S. LIBOR + 0.510% 2.9398% 9/25/35 (d)(e) | 250,300 | 249,302 | |
| Niagara Park CLO, Ltd. Series 2019-1A Class A, 3 month U.S. LIBOR + 1.300% 1.3% 7/17/32 (b)(c)(d)(e) | 8,594,000 | 8,594,000 | |
| Prosper Marketplace Issuance Trust: | |||
| Series 2018-1A Class A, 3.11% 6/17/24 (c) | 38,571 | 38,578 | |
| Series 2018-2A Class A, 3.35% 10/15/24 (c) | 67,360 | 67,530 | |
| Series 2019-1A Class A, 3.54% 4/15/25 (c) | 5,169,899 | 5,185,551 | |
| Series 2019-2A Class A, 3.2% 9/15/25 (c) | 1,700,000 | 1,699,959 | |
| SLM Student Loan Trust Series 2003-10A Class A3, 3 month U.S. LIBOR + 0.470% 3.0809% 12/15/27 (c)(d)(e) | 2,543,710 | 2,539,881 | |
| Structured Asset Securities Corp. Series 2005-NC2 Class M3, 1 month U.S. LIBOR + 0.430% 2.8598% 5/25/35 (d)(e) | 18,827 | 18,813 | |
| Terwin Mortgage Trust Series 2003-4HE Class A1, 1 month U.S. LIBOR + 0.860% 3.2898% 9/25/34 (d)(e) | 7,249 | 6,905 | |
| Thunderbolt Aircraft Lease Ltd. Series 2018-A Class A, 4.147% 9/15/38 (c) | 7,086,667 | 7,217,335 | |
| Towd Point Mortgage Trust: | |||
| Series 2018-6 Class A1A, 3.75% 3/25/58 (c) | 437,904 | 448,633 | |
| Series 2019-1 Class A1, 3.75% 3/25/58 (c) | 864,391 | 895,871 | |
| Trapeza CDO XII Ltd./Trapeza CDO XII, Inc. Series 2007-12A Class B, 3 month U.S. LIBOR + 0.560% 3.1486% 4/6/42 (c)(d)(e)(i) | 778,000 | 578,945 | |
| Upgrade Receivables Trust: | |||
| Series 2018-1A Class A, 3.76% 11/15/24 (c) | 568,329 | 570,466 | |
| Series 2019-1A Class A, 3.48% 3/15/25 (c) | 3,020,129 | 3,028,086 | |
| Verde CLO Ltd. Series 2019-1A Class A, 3.9137% 4/15/32 (c)(d) | 8,606,000 | 8,601,155 | |
| TOTAL ASSET-BACKED SECURITIES | |||
| (Cost $172,023,732) | 173,856,583 | ||
| Collateralized Mortgage Obligations - 1.3% | |||
| Private Sponsor - 0.2% | |||
| Banc of America Funding Corp. Series 2015-R3 Class 10A1, 1 month U.S. LIBOR + 0.140% 2.6166% 6/27/36 (c)(d)(e) | 155,356 | 152,277 | |
| BCAP LLC Trust sequential payer: | |||
| Series 2010-RR11 Class 6A1, 3.9937% 3/27/36 (c)(d) | 19,289 | 19,261 | |
| Series 2010-RR2 Class 5A2, 5% 12/26/36 (c) | 10,594 | 10,859 | |
| Citigroup Mortgage Loan Trust sequential payer Series 2014-8 Class 2A1, 3.45% 6/27/37 (c)(d) | 204,574 | 206,521 | |
| Citigroup Mortgage Loan Trust, Inc. sequential payer Series 2009-5 Class 5A1, 4.8238% 1/25/37 (c)(d) | 17,537 | 17,863 | |
| Credit Suisse Mortgage Trust: | |||
| Series 2010-9R Class 2A5, 4% 2/27/38 (c) | 69,172 | 69,475 | |
| Series 2012-2R Class 1A1, 4.6732% 5/27/35 (c)(d) | 12,721 | 12,748 | |
| CSMC: | |||
| floater Series 2015-1R Class 6A1, 1 month U.S. LIBOR + 0.280% 4.0554% 5/27/37 (c)(d)(e) | 147,131 | 141,921 | |
| Series 2014-3R: | |||
| Class 2A1, 1 month U.S. LIBOR + 0.700% 3.1766% 5/27/37 (c)(d)(e) | 1,043,383 | 1,006,027 | |
| Class AA1, 1 month U.S. LIBOR + 0.280% 4.0554% 5/27/37 (c)(d)(e) | 1,424,023 | 1,374,349 | |
| FirstKey Mortgage Trust sequential payer Series 2015-1 Class A9, 3% 3/25/45 (c)(d) | 163,364 | 162,528 | |
| JP Morgan Resecuritization Trust floater Series 2012-2 Class 6A1, 1 month U.S. LIBOR + 0.210% 2.6934% 6/21/36 (c)(d)(e) | 34,410 | 34,207 | |
| Lanark Master Issuer PLC: | |||
| floater Series 2019-1A Class 1A1, 3 month U.S. LIBOR + 0.770% 3.2948% 12/22/69 (c)(d)(e) | 4,300,000 | 4,307,237 | |
| Series 2019-2A Class 1A, 0.67% 12/22/69 (c)(j) | 9,300,000 | 9,300,000 | |
| MASTR Alternative Loan Trust Series 2004-6 Class 5A1, 4.934% 7/25/19 (d) | 2 | 2 | |
| Merrill Lynch Alternative Note Asset Trust floater Series 2007-OAR1 Class A1, 1 month U.S. LIBOR + 0.170% 2.6466% 2/25/37 (d)(e) | 48,959 | 48,650 | |
| Opteum Mortgage Acceptance Corp. floater Series 2005-3 Class APT, 1 month U.S. LIBOR + 0.290% 2.7198% 7/25/35 (d)(e) | 37,369 | 37,345 | |
| Permanent Master Issuer PLC floater Series 2018-1A Class 1A1, 3 month U.S. LIBOR + 0.380% 2.9768% 7/15/58 (c)(d)(e) | 2,125,000 | 2,122,665 | |
| Sequoia Mortgage Trust floater Series 2004-6 Class A3B, 6 month U.S. LIBOR + 0.880% 3.3769% 7/20/34 (d)(e) | 3,602 | 3,539 | |
| Silverstone Master Issuer PLC floater Series 2019-1A Class 1A, 3 month U.S. LIBOR + 0.570% 3.1485% 1/21/70 (c)(e) | 8,700,000 | 8,716,835 | |
| Thornburg Mortgage Securities Trust floater Series 2003-4 Class A1, 1 month U.S. LIBOR + 0.640% 3.0698% 9/25/43 (d)(e) | 142,650 | 143,154 | |
| Wells Fargo Mortgage Backed Securities Trust: | |||
| Series 2003-I Class A1, 4.6869% 9/25/33 (d) | 21,313 | 21,456 | |
| Series 2005-AR10 Class 2A15, 4.9041% 6/25/35 (d) | 146,581 | 146,565 | |
| Series 2005-AR2 Class 1A2, 5.0997% 3/25/35 (d) | 6,863 | 6,995 | |
| Wells Fargo Mortgage Loan Trust sequential payer Series 2011-RR4 Class 2A1, 4.0884% 6/27/36 (c)(d) | 3,295 | 3,286 | |
| Winwater Mortgage Loan Trust sequential payer Series 2015-1 Class A9, 2.5% 1/20/45 (c) | 60,952 | 60,625 | |
| TOTAL PRIVATE SPONSOR | 28,126,390 | ||
| U.S. Government Agency - 1.1% | |||
| Fannie Mae: | |||
| floater: | |||
| Series 2002-18 Class FD, 1 month U.S. LIBOR + 0.800% 3.2298% 2/25/32 (d)(e) | 4,677 | 4,733 | |
| Series 2002-39 Class FD, 1 month U.S. LIBOR + 1.000% 3.4406% 3/18/32 (d)(e) | 8,627 | 8,796 | |
| Series 2002-60 Class FV, 1 month U.S. LIBOR + 1.000% 3.4298% 4/25/32 (d)(e) | 10,007 | 10,177 | |
| Series 2002-63 Class FN, 1 month U.S. LIBOR + 1.000% 3.4298% 10/25/32 (d)(e) | 13,020 | 13,243 | |
| Series 2002-7 Class FC, 1 month U.S. LIBOR + 0.750% 3.1798% 1/25/32 (d)(e) | 4,819 | 4,870 | |
| Series 2003-118 Class S, 8.100% - 1 month U.S. LIBOR 5.6703% 12/25/33 (d)(g)(k) | 169,958 | 40,837 | |
| Series 2006-104 Class GI, 6.680% - 1 month U.S. LIBOR 4.2503% 11/25/36 (d)(g)(k) | 114,943 | 21,615 | |
| Series 2012-154 Class F, 1 month U.S. LIBOR + 0.300% 2.7298% 1/25/43 (d)(e) | 1,240,889 | 1,228,820 | |
| Series 2017-36 Class FB, 1 month U.S. LIBOR + 0.350% 2.7798% 5/25/47 (d)(e) | 3,000,145 | 2,964,487 | |
| Series 2018-32 Class FB, 1 month U.S. LIBOR + 0.300% 2.7298% 5/25/48 (d)(e) | 1,780,996 | 1,755,713 | |
| Series 2018-38 Class FG, 1 month U.S. LIBOR + 0.300% 2.7298% 6/25/48 (d)(e) | 8,498,998 | 8,380,173 | |
| planned amortization class: | |||
| Series 1992-168 Class KB, 7% 10/25/22 | 3,951 | 4,110 | |
| Series 1993-207 Class H, 6.5% 11/25/23 | 58,097 | 61,749 | |
| Series 1996-28 Class PK, 6.5% 7/25/25 | 19,751 | 21,046 | |
| Series 1999-17 Class PG, 6% 4/25/29 | 92,241 | 100,637 | |
| Series 1999-32 Class PL, 6% 7/25/29 | 88,363 | 96,611 | |
| Series 1999-33 Class PK, 6% 7/25/29 | 63,413 | 69,135 | |
| Series 2001-52 Class YZ, 6.5% 10/25/31 | 7,896 | 8,975 | |
| Series 2003-28 Class KG, 5.5% 4/25/23 | 33,967 | 35,124 | |
| Series 2005-102 Class CO 11/25/35 (l) | 36,061 | 32,530 | |
| Series 2005-39 Class TE, 5% 5/25/35 | 33,978 | 36,892 | |
| Series 2005-73 Class SA, 17.500% - 1 month U.S. LIBOR 11.2327% 8/25/35 (d)(k) | 12,631 | 15,499 | |
| Series 2005-81 Class PC, 5.5% 9/25/35 | 93,347 | 102,952 | |
| Series 2006-12 Class BO 10/25/35 (l) | 161,352 | 145,649 | |
| Series 2006-37 Class OW 5/25/36 (l) | 15,275 | 13,481 | |
| Series 2006-45 Class OP 6/25/36 (l) | 52,555 | 46,357 | |
| Series 2006-62 Class KP 4/25/36 (l) | 88,821 | 78,737 | |
| Series 2012-149: | |||
| Class DA, 1.75% 1/25/43 | 274,700 | 268,744 | |
| Class GA, 1.75% 6/25/42 | 282,279 | 276,792 | |
| sequential payer: | |||
| Series 1997-41 Class J, 7.5% 6/18/27 | 14,588 | 16,418 | |
| Series 1999-25 Class Z, 6% 6/25/29 | 54,013 | 59,759 | |
| Series 2001-20 Class Z, 6% 5/25/31 | 96,123 | 105,447 | |
| Series 2001-31 Class ZC, 6.5% 7/25/31 | 50,998 | 57,277 | |
| Series 2002-16 Class ZD, 6.5% 4/25/32 | 26,027 | 29,631 | |
| Series 2002-74 Class SV, 7.550% - 1 month U.S. LIBOR 5.1203% 11/25/32 (d)(g)(k) | 101,382 | 13,925 | |
| Series 2012-67 Class AI, 4.5% 7/25/27 (g) | 233,364 | 20,010 | |
| Series 06-116 Class SG, 6.640% - 1 month U.S. LIBOR 4.2103% 12/25/36 (d)(g)(k) | 88,001 | 19,091 | |
| Series 07-40 Class SE, 6.440% - 1 month U.S. LIBOR 4.0103% 5/25/37 (d)(g)(k) | 50,267 | 9,451 | |
| Series 1993-165 Class SH, 19.800% - 1 month U.S. LIBOR 12.9272% 9/25/23 (d)(k) | 3,664 | 4,286 | |
| Series 2003-21 Class SK, 8.100% - 1 month U.S. LIBOR 5.6703% 3/25/33 (d)(g)(k) | 15,172 | 3,029 | |
| Series 2005-72 Class ZC, 5.5% 8/25/35 | 620,876 | 673,427 | |
| Series 2005-79 Class ZC, 5.9% 9/25/35 | 324,971 | 368,735 | |
| Series 2007-57 Class SA, 40.600% - 1 month U.S. LIBOR 26.0415% 6/25/37 (d)(k) | 54,661 | 107,010 | |
| Series 2007-66: | |||
| Class SA, 39.600% - 1 month U.S. LIBOR 25.0215% 7/25/37 (d)(k) | 57,531 | 111,875 | |
| Class SB, 39.600% - 1 month U.S. LIBOR 25.0215% 7/25/37 (d)(k) | 21,486 | 36,537 | |
| Series 2008-12 Class SG, 6.350% - 1 month U.S. LIBOR 3.9203% 3/25/38 (d)(g)(k) | 330,261 | 57,098 | |
| Series 2009-76 Class MI, 5.5% 9/25/24 (g) | 111 | 0 | |
| Series 2009-85 Class IB, 4.5% 8/25/24 (g) | 4,826 | 38 | |
| Series 2009-93 Class IC, 4.5% 9/25/24 (g) | 4,362 | 16 | |
| Series 2010-112 Class SG, 6.360% - 1 month U.S. LIBOR 3.9303% 6/25/21 (d)(g)(k) | 1,103 | 13 | |
| Series 2010-135: | |||
| Class LS, 6.050% - 1 month U.S. LIBOR 3.6203% 12/25/40 (d)(g)(k) | 308,818 | 49,665 | |
| Class ZA, 4.5% 12/25/40 | 177,680 | 193,821 | |
| Series 2010-139 Class NI, 4.5% 2/25/40 (g) | 246,231 | 19,278 | |
| Series 2010-150 Class ZC, 4.75% 1/25/41 | 1,243,905 | 1,378,528 | |
| Series 2010-17 Class DI, 4.5% 6/25/21 (g) | 1,371 | 14 | |
| Series 2010-95 Class ZC, 5% 9/25/40 | 2,578,372 | 2,873,360 | |
| Series 2010-97 Class CI, 4.5% 8/25/25 (g) | 35,260 | 761 | |
| Series 2011-39 Class ZA, 6% 11/25/32 | 202,580 | 228,054 | |
| Series 2011-4 Class PZ, 5% 2/25/41 | 525,965 | 600,152 | |
| Series 2011-67 Class AI, 4% 7/25/26 (g) | 70,008 | 5,270 | |
| Series 2011-83 Class DI, 6% 9/25/26 (g) | 76,804 | 4,799 | |
| Series 2012-100 Class WI, 3% 9/25/27 (g) | 1,055,224 | 87,245 | |
| Series 2012-14 Class JS, 6.650% - 1 month U.S. LIBOR 4.2203% 12/25/30 (d)(g)(k) | 366,628 | 37,394 | |
| Series 2012-9 Class SH, 6.550% - 1 month U.S. LIBOR 4.1203% 6/25/41 (d)(g)(k) | 500,960 | 60,445 | |
| Series 2013-133 Class IB, 3% 4/25/32 (g) | 726,694 | 55,524 | |
| Series 2013-134 Class SA, 6.050% - 1 month U.S. LIBOR 3.6203% 1/25/44 (d)(g)(k) | 314,185 | 50,077 | |
| Series 2013-51 Class GI, 3% 10/25/32 (g) | 224,913 | 19,669 | |
| Series 2013-N1 Class A, 6.720% - 1 month U.S. LIBOR 4.2903% 6/25/35 (d)(g)(k) | 263,041 | 48,720 | |
| Series 2015-42 Class IL, 6% 6/25/45 (g) | 1,428,893 | 312,062 | |
| Series 2015-70 Class JC, 3% 10/25/45 | 1,554,552 | 1,585,392 | |
| Series 2017-30 Class AI, 5.5% 5/25/47 | 658,402 | 135,771 | |
| Fannie Mae Stripped Mortgage-Backed Securities: | |||
| Series 339 Class 5, 5.5% 7/25/33 (g) | 44,316 | 9,306 | |
| Series 343 Class 16, 5.5% 5/25/34 (g) | 38,245 | 7,067 | |
| Series 348 Class 14, 6.5% 8/25/34 (d)(g) | 33,702 | 7,511 | |
| Series 351: | |||
| Class 12, 5.5% 4/25/34 (d)(g) | 22,238 | 4,114 | |
| Class 13, 6% 3/25/34 (g) | 29,842 | 6,069 | |
| Series 359 Class 19, 6% 7/25/35 (d)(g) | 18,598 | 3,914 | |
| Series 384 Class 6, 5% 7/25/37 (g) | 200,161 | 36,110 | |
| Freddie Mac: | |||
| floater: | |||
| Series 2412 Class FK, 1 month U.S. LIBOR + 0.800% 3.2396% 1/15/32 (d)(e) | 3,823 | 3,869 | |
| Series 2423 Class FA, 1 month U.S. LIBOR + 0.900% 3.3396% 3/15/32 (d)(e) | 5,402 | 5,482 | |
| Series 2424 Class FM, 1 month U.S. LIBOR + 1.000% 3.4396% 3/15/32 (d)(e) | 5,299 | 5,389 | |
| Series 2432: | |||
| Class FE, 1 month U.S. LIBOR + 0.900% 3.3396% 6/15/31 (d)(e) | 9,849 | 9,988 | |
| Class FG, 1 month U.S. LIBOR + 0.900% 3.3396% 3/15/32 (d)(e) | 2,985 | 3,029 | |
| Series 4709 Class FE, 1 month U.S. LIBOR + 0.350% 2.7896% 8/15/47 (d)(e) | 1,515,361 | 1,496,697 | |
| floater target amortization class Series 3366 Class FD, 1 month U.S. LIBOR + 0.250% 2.6896% 5/15/37 (d)(e) | 222,173 | 220,686 | |
| planned amortization class: | |||
| Series 2006-15 Class OP 3/25/36 (l) | 157,257 | 139,519 | |
| Series 2095 Class PE, 6% 11/15/28 | 105,939 | 115,565 | |
| Series 2101 Class PD, 6% 11/15/28 | 6,359 | 6,949 | |
| Series 2104 Class PG, 6% 12/15/28 | 7,073 | 7,758 | |
| Series 2121 Class MG, 6% 2/15/29 | 42,258 | 46,265 | |
| Series 2131 Class BG, 6% 3/15/29 | 224,000 | 244,934 | |
| Series 2137 Class PG, 6% 3/15/29 | 33,813 | 37,119 | |
| Series 2154 Class PT, 6% 5/15/29 | 73,759 | 80,975 | |
| Series 2162 Class PH, 6% 6/15/29 | 14,856 | 16,169 | |
| Series 2520 Class BE, 6% 11/15/32 | 91,348 | 102,044 | |
| Series 2585 Class KS, 7.600% - 1 month U.S. LIBOR 5.1604% 3/15/23 (d)(g)(k) | 2,076 | 75 | |
| Series 2693 Class MD, 5.5% 10/15/33 | 425,728 | 472,037 | |
| Series 2802 Class OB, 6% 5/15/34 | 155,657 | 168,185 | |
| Series 2962 Class BE, 4.5% 4/15/20 | 23,419 | 23,530 | |
| Series 3002 Class NE, 5% 7/15/35 | 239,484 | 256,844 | |
| Series 3110 Class OP 9/15/35 (l) | 92,832 | 86,500 | |
| Series 3119 Class PO 2/15/36 (l) | 189,242 | 167,313 | |
| Series 3121 Class KO 3/15/36 (l) | 31,609 | 28,188 | |
| Series 3123 Class LO 3/15/36 (l) | 105,878 | 93,845 | |
| Series 3145 Class GO 4/15/36 (l) | 102,972 | 91,413 | |
| Series 3189 Class PD, 6% 7/15/36 | 197,832 | 225,877 | |
| Series 3225 Class EO 10/15/36 (l) | 57,232 | 50,613 | |
| Series 3258 Class PM, 5.5% 12/15/36 | 92,754 | 100,480 | |
| Series 3415 Class PC, 5% 12/15/37 | 76,499 | 82,801 | |
| Series 3786 Class HI, 4% 3/15/38 (g) | 212,065 | 10,635 | |
| Series 3806 Class UP, 4.5% 2/15/41 | 649,654 | 696,399 | |
| Series 3832 Class PE, 5% 3/15/41 | 772,000 | 841,597 | |
| Series 4135 Class AB, 1.75% 6/15/42 | 214,437 | 209,928 | |
| Series 4765 Class PE, 3% 12/15/41 | 995,616 | 1,006,712 | |
| sequential payer: | |||
| Series 2114 Class ZM, 6% 1/15/29 | 3,419 | 3,747 | |
| Series 2135 Class JE, 6% 3/15/29 | 26,861 | 29,444 | |
| Series 2274 Class ZM, 6.5% 1/15/31 | 25,401 | 28,466 | |
| Series 2281 Class ZB, 6% 3/15/30 | 49,075 | 53,189 | |
| Series 2303 Class ZV, 6% 4/15/31 | 18,723 | 20,538 | |
| Series 2357 Class ZB, 6.5% 9/15/31 | 159,234 | 180,978 | |
| Series 2502 Class ZC, 6% 9/15/32 | 48,997 | 54,665 | |
| Series 2519 Class ZD, 5.5% 11/15/32 | 56,334 | 62,038 | |
| Series 2546 Class MJ, 5.5% 3/15/23 | 20,661 | 21,363 | |
| Series 2601 Class TB, 5.5% 4/15/23 | 9,990 | 10,422 | |
| Series 2998 Class LY, 5.5% 7/15/25 | 33,522 | 35,413 | |
| Series 3871 Class KB, 5.5% 6/15/41 | 1,052,844 | 1,199,307 | |
| Series 06-3115 Class SM, 6.600% - 1 month U.S. LIBOR 4.1604% 2/15/36 (d)(g)(k) | 72,116 | 14,651 | |
| Series 1658 Class GZ, 7% 1/15/24 | 11,218 | 11,894 | |
| Series 2013-4281 Class AI, 4% 12/15/28 (g) | 717,232 | 49,928 | |
| Series 2017-4683 Class LM, 3% 5/15/47 | 1,783,283 | 1,801,914 | |
| Series 2380 Class SY, 8.200% - 1 month U.S. LIBOR 5.7604% 11/15/31 (d)(g)(k) | 43,577 | 6,288 | |
| Series 2587 Class IM, 6.5% 3/15/33 (g) | 6,672 | 1,520 | |
| Series 2844: | |||
| Class SC, 46.800% - 1 month U.S. LIBOR 30.9424% 8/15/24 (d)(k) | 932 | 1,166 | |
| Class SD, 86.400% - 1 month U.S. LIBOR 54.7348% 8/15/24 (d)(k) | 1,706 | 2,518 | |
| Series 2933 Class ZM, 5.75% 2/15/35 | 706,629 | 814,919 | |
| Series 2935 Class ZK, 5.5% 2/15/35 | 743,596 | 826,481 | |
| Series 2947 Class XZ, 6% 3/15/35 | 304,756 | 342,579 | |
| Series 2996 Class ZD, 5.5% 6/15/35 | 510,409 | 580,950 | |
| Series 3055 Class CS, 6.590% - 1 month U.S. LIBOR 4.1504% 10/15/35 (d)(g)(k) | 103,775 | 20,051 | |
| Series 3237 Class C, 5.5% 11/15/36 | 784,869 | 879,307 | |
| Series 3244 Class SG, 6.660% - 1 month U.S. LIBOR 4.2204% 11/15/36 (d)(g)(k) | 259,306 | 50,931 | |
| Series 3287 Class SD, 6.750% - 1 month U.S. LIBOR 4.3104% 3/15/37 (d)(g)(k) | 372,101 | 76,778 | |
| Series 3297 Class BI, 6.760% - 1 month U.S. LIBOR 4.3204% 4/15/37 (d)(g)(k) | 538,561 | 114,229 | |
| Series 3336 Class LI, 6.580% - 1 month U.S. LIBOR 4.1404% 6/15/37 (d)(g)(k) | 198,408 | 35,328 | |
| Series 3949 Class MK, 4.5% 10/15/34 | 170,346 | 179,966 | |
| Series 3955 Class YI, 3% 11/15/21 (g) | 20,788 | 518 | |
| Series 4055 Class BI, 3.5% 5/15/31 (g) | 677,862 | 57,275 | |
| Series 4149 Class IO, 3% 1/15/33 (g) | 101,419 | 11,904 | |
| Series 4314 Class AI, 5% 3/15/34 (g) | 203,993 | 17,693 | |
| Series 4427 Class LI, 3.5% 2/15/34 (g) | 1,173,279 | 124,815 | |
| Series 4471 Class PA 4% 12/15/40 | 1,651,337 | 1,699,735 | |
| target amortization class Series 2156 Class TC, 6.25% 5/15/29 | 41,206 | 44,044 | |
| Freddie Mac Manufactured Housing participation certificates guaranteed: | |||
| floater Series 1686 Class FA, 1 month U.S. LIBOR + 0.900% 3.3396% 2/15/24 (d)(e) | 14,269 | 14,369 | |
| planned amortization class Series 2043 Class CJ, 6.5% 4/15/28 | 10,107 | 11,279 | |
| sequential payer: | |||
| Series 2043 Class ZH, 6% 4/15/28 | 31,080 | 33,906 | |
| Series 2056 Class Z, 6% 5/15/28 | 58,013 | 63,291 | |
| Freddie Mac Multi-family Structured pass-thru certificates: | |||
| floater Series 4795 Class FA, 1 month U.S. LIBOR + 0.300% 2.7396% 5/15/48 (d)(e) | 5,416,822 | 5,331,797 | |
| Series 4386 Class AZ, 4.5% 11/15/40 | 1,912,708 | 2,024,760 | |
| Freddie Mac Seasoned Credit Risk Transfer Trust: | |||
| sequential payer: | |||
| Series 2017-1 Class MA, 3% 1/25/56 | 250,309 | 253,471 | |
| Series 2018-2 Class MA, 3.5% 11/25/57 | 1,061,063 | 1,094,596 | |
| Series 2018-3 Class MA, 3.5% 8/25/57 | 16,504,360 | 16,871,657 | |
| Series 2018-4 Class MA, 3.5% 3/25/58 | 12,964,435 | 13,334,247 | |
| Series 2019-1 Class MA, 3.5% 7/25/58 | 15,875,797 | 16,445,818 | |
| Series 2019-2 Class MA, 3.5% 8/25/58 | 6,141,000 | 6,325,365 | |
| Series 2018-3 Class M55D, 4% 8/25/57 | 709,864 | 739,380 | |
| Freddie Mac SLST sequential payer Series 2018-1 Class A1, 3.5% 6/25/28 | 25,693 | 26,368 | |
| Ginnie Mae guaranteed REMIC pass-thru certificates: | |||
| floater: | |||
| Series 2007-37 Class TS, 6.690% - 1 month U.S. LIBOR 4.2524% 6/16/37 (d)(g)(k) | 113,877 | 22,762 | |
| Series 2010-H03 Class FA, 1 month U.S. LIBOR + 0.550% 3.0285% 3/20/60 (d)(e)(m) | 1,350,294 | 1,352,083 | |
| Series 2010-H17 Class FA, 1 month U.S. LIBOR + 0.330% 2.8085% 7/20/60 (d)(e)(m) | 160,180 | 159,456 | |
| Series 2010-H18 Class AF, 1 month U.S. LIBOR + 0.300% 2.7934% 9/20/60 (d)(e)(m) | 192,481 | 191,525 | |
| Series 2010-H19 Class FG, 1 month U.S. LIBOR + 0.300% 2.7934% 8/20/60 (d)(e)(m) | 220,748 | 219,684 | |
| Series 2010-H27 Series FA, 1 month U.S. LIBOR + 0.380% 2.8734% 12/20/60 (d)(e)(m) | 405,004 | 403,788 | |
| Series 2011-H05 Class FA, 1 month U.S. LIBOR + 0.500% 2.9934% 12/20/60 (d)(e)(m) | 591,627 | 591,755 | |
| Series 2011-H07 Class FA, 1 month U.S. LIBOR + 0.500% 2.9934% 2/20/61 (d)(e)(m) | 1,199,082 | 1,199,314 | |
| Series 2011-H12 Class FA, 1 month U.S. LIBOR + 0.490% 2.9834% 2/20/61 (d)(e)(m) | 1,570,358 | 1,570,391 | |
| Series 2011-H13 Class FA, 1 month U.S. LIBOR + 0.500% 2.9934% 4/20/61 (d)(e)(m) | 518,926 | 519,037 | |
| Series 2011-H14: | |||
| Class FB, 1 month U.S. LIBOR + 0.500% 2.9934% 5/20/61 (d)(e)(m) | 671,473 | 671,635 | |
| Class FC, 1 month U.S. LIBOR + 0.500% 2.9934% 5/20/61 (d)(e)(m) | 584,952 | 585,082 | |
| Series 2011-H17 Class FA, 1 month U.S. LIBOR + 0.530% 3.0234% 6/20/61 (d)(e)(m) | 729,660 | 730,283 | |
| Series 2011-H20 Class FA, 1 month U.S. LIBOR + 0.550% 3.0434% 9/20/61 (d)(e)(m) | 1,686,952 | 1,689,441 | |
| Series 2011-H21 Class FA, 1 month U.S. LIBOR + 0.600% 3.0934% 10/20/61 (d)(e)(m) | 818,650 | 820,697 | |
| Series 2012-H01 Class FA, 1 month U.S. LIBOR + 0.700% 3.1934% 11/20/61 (d)(e)(m) | 726,794 | 730,342 | |
| Series 2012-H03 Class FA, 1 month U.S. LIBOR + 0.700% 3.1934% 1/20/62 (d)(e)(m) | 471,858 | 474,062 | |
| Series 2012-H06 Class FA, 1 month U.S. LIBOR + 0.630% 3.1234% 1/20/62 (d)(e)(m) | 684,688 | 686,918 | |
| Series 2012-H07 Class FA, 1 month U.S. LIBOR + 0.630% 3.1234% 3/20/62 (d)(e)(m) | 410,039 | 410,547 | |
| Series 2012-H21 Class DF, 1 month U.S. LIBOR + 0.650% 3.1434% 5/20/61 (d)(e)(m) | 42,944 | 43,044 | |
| Series 2012-H26, Class CA, 1 month U.S. LIBOR + 0.530% 3.0234% 7/20/60 (d)(e)(m) | 328,091 | 328,132 | |
| Series 2014-H03 Class FA, 1 month U.S. LIBOR + 0.600% 3.0934% 1/20/64 (d)(e)(m) | 687,600 | 689,191 | |
| Series 2014-H05 Class FB, 1 month U.S. LIBOR + 0.600% 3.0934% 12/20/63 (d)(e)(m) | 2,064,739 | 2,070,342 | |
| Series 2014-H11 Class BA, 1 month U.S. LIBOR + 0.500% 2.9934% 6/20/64 (d)(e)(m) | 590,858 | 590,993 | |
| Series 2015-H07 Class FA, 1 month U.S. LIBOR + 0.300% 2.7934% 3/20/65 (d)(e)(m) | 30,248 | 30,162 | |
| Series 2015-H13 Class FL, 1 month U.S. LIBOR + 0.280% 2.7734% 5/20/63 (d)(e)(m) | 197,282 | 197,068 | |
| Series 2015-H19 Class FA, 1 month U.S. LIBOR + 0.200% 2.6934% 4/20/63 (d)(e)(m) | 256,694 | 256,201 | |
| Series 2016-H20 Class FM, 1 month U.S. LIBOR + 0.400% 2.8934% 12/20/62 (d)(e)(m) | 410,708 | 410,468 | |
| Series 2017-161 Class DF, 1 month U.S. LIBOR + 0.250% 2.6906% 10/20/47 (d)(e) | 1,504,593 | 1,478,242 | |
| Series 2018-159 Class F, 1 month U.S. LIBOR + 0.350% 2.7906% 11/20/48 (d)(e) | 4,595,501 | 4,596,918 | |
| Series 2018-65 Class DF, 1 month U.S. LIBOR + 0.300% 2.7406% 5/20/48 (d)(e) | 1,887,017 | 1,864,110 | |
| Series 2018-77 Class FA, 1 month U.S. LIBOR + 0.300% 2.7406% 6/20/48 (d)(e) | 2,151,648 | 2,121,491 | |
| Series 2018-78 Class AF, 1 month U.S. LIBOR + 0.300% 2.7406% 6/20/48 (d)(e) | 2,685,234 | 2,652,694 | |
| planned amortization class: | |||
| Series 1997-8 Class PE, 7.5% 5/16/27 | 37,188 | 42,141 | |
| Series 2010-158 Class MS, 10.000% - 1 month U.S. LIBOR 5.1187% 12/20/40 (d)(k) | 1,185,000 | 1,360,439 | |
| Series 2011-136 Class WI, 4.5% 5/20/40 (g) | 151,450 | 14,319 | |
| Series 2017-134 Class BA, 2.5% 11/20/46 | 269,219 | 269,038 | |
| Series 2017-153 Class GA, 3% 9/20/47 | 2,706,615 | 2,743,585 | |
| Series 2017-182 Class KA, 3% 10/20/47 | 2,504,763 | 2,538,473 | |
| Series 2018-13 Class Q, 3% 4/20/47 | 3,203,462 | 3,245,139 | |
| sequential payer: | |||
| Series 2002-42 Class ZA, 6% 6/20/32 | 15,855 | 17,662 | |
| Series 2004-24 Class ZM, 5% 4/20/34 | 353,157 | 383,887 | |
| Series 2010-160 Class DY, 4% 12/20/40 | 3,106,835 | 3,326,904 | |
| Series 2010-170 Class B, 4% 12/20/40 | 698,538 | 748,038 | |
| Series 2016-H02 Class FM, 1 month U.S. LIBOR + 0.500% 2.9934% 9/20/62 (d)(e)(m) | 2,752,898 | 2,753,066 | |
| Series 2016-H04 Class FE, 1 month U.S. LIBOR + 0.650% 3.1434% 11/20/65 (d)(e)(m) | 251,448 | 251,674 | |
| Series 2001-50 Class SD, 8.200% - 1 month U.S. LIBOR 5.7594% 11/20/31 (d)(g)(k) | 23,311 | 4,518 | |
| Series 2004-32 Class GS, 6.500% - 1 month U.S. LIBOR 4.0624% 5/16/34 (d)(g)(k) | 76,073 | 13,021 | |
| Series 2004-73 Class AL, 7.200% - 1 month U.S. LIBOR 4.7624% 8/17/34 (d)(g)(k) | 66,326 | 13,693 | |
| Series 2010-116 Class QB, 4% 9/16/40 | 208,535 | 216,575 | |
| Series 2010-14 Class SN, 5.950% - 1 month U.S. LIBOR 3.5124% 2/16/40 (d)(g)(k) | 422,971 | 62,020 | |
| Series 2010-H10 Class FA, 1 month U.S. LIBOR + 0.330% 2.8085% 5/20/60 (d)(e)(m) | 548,707 | 546,504 | |
| Series 2011-52 Class HI, 7% 4/16/41 (g) | 71,712 | 15,540 | |
| Series 2011-94 Class SA, 6.100% - 1 month U.S. LIBOR 3.6594% 7/20/41 (d)(g)(k) | 267,920 | 45,478 | |
| Series 2012-76 Class GS, 6.700% - 1 month U.S. LIBOR 4.2624% 6/16/42 (d)(g)(k) | 246,063 | 45,523 | |
| Series 2013-124: | |||
| Class ES, 8.667% - 1 month U.S. LIBOR 5.4125% 4/20/39 (d)(k) | 319,022 | 326,787 | |
| Class ST, 8.800% - 1 month U.S. LIBOR 5.5458% 8/20/39 (d)(k) | 1,074,262 | 1,110,527 | |
| Series 2013-149 Class MA, 2.5% 5/20/40 | 3,681,798 | 3,692,344 | |
| Series 2014-2 Class BA, 3% 1/20/44 | 4,568,127 | 4,668,819 | |
| Series 2014-21 Class HA, 3% 2/20/44 | 2,098,395 | 2,147,843 | |
| Series 2014-25 Class HC, 3% 2/20/44 | 3,139,393 | 3,217,572 | |
| Series 2014-5 Class A, 3% 1/20/44 | 2,788,071 | 2,849,462 | |
| Series 2015-H13 Class HA, 2.5% 8/20/64 (m) | 3,267,215 | 3,258,452 | |
| Series 2015-H17: | |||
| Class GZ, 4.3303% 5/20/65 (d)(m) | 137,377 | 141,759 | |
| Class HA, 2.5% 5/20/65 (m) | 1,550,499 | 1,546,331 | |
| Series 2015-H21 Class HA, 2.5% 6/20/63 (m) | 50,532 | 50,405 | |
| Series 2016-H13 Class FB, U.S. TREASURY 1 YEAR INDEX + 0.500% 2.91% 5/20/66 (d)(e)(m) | 4,387,042 | 4,407,438 | |
| Series 2017-186 Class HK, 3% 11/16/45 | 2,684,740 | 2,710,427 | |
| Series 2017-H06 Class FA, U.S. TREASURY 1 YEAR INDEX + 0.350% 2.76% 8/20/66 (d)(e)(m) | 5,010,181 | 5,020,560 | |
| TOTAL U.S. GOVERNMENT AGENCY | 188,718,135 | ||
| TOTAL COLLATERALIZED MORTGAGE OBLIGATIONS | |||
| (Cost $214,551,552) | 216,844,525 | ||
| Commercial Mortgage Securities - 1.3% | |||
| Asset Securitization Corp. Series 1997-D5 Class PS1, 1.8345% 2/14/43 (d)(g) | 7,194 | 27 | |
| Barclays Commercial Mortgage Securities LLC: | |||
| Series 2015-STP Class A, 3.3228% 9/10/28 (c) | 79,194 | 79,758 | |
| Series 2018-C2 Class A5, 4.314% 12/15/51 | 1,400,000 | 1,551,291 | |
| Bayview Commercial Asset Trust floater: | |||
| Series 2005-3A: | |||
| Class A2, 1 month U.S. LIBOR + 0.400% 2.8298% 11/25/35 (c)(d)(e) | 50,611 | 48,884 | |
| Class M1, 1 month U.S. LIBOR + 0.440% 2.8698% 11/25/35 (c)(d)(e) | 13,538 | 12,871 | |
| Series 2005-4A: | |||
| Class A2, 1 month U.S. LIBOR + 0.390% 2.8198% 1/25/36 (c)(d)(e) | 125,234 | 121,098 | |
| Class M1, 1 month U.S. LIBOR + 0.450% 2.8798% 1/25/36 (c)(d)(e) | 40,429 | 38,976 | |
| Class M2, 1 month U.S. LIBOR + 0.470% 2.8998% 1/25/36 (c)(d)(e) | 15,246 | 14,463 | |
| Class M3, 1 month U.S. LIBOR + 0.500% 2.9298% 1/25/36 (c)(d)(e) | 22,188 | 21,024 | |
| Series 2006-1: | |||
| Class A2, 1 month U.S. LIBOR + 0.360% 2.7898% 4/25/36 (c)(d)(e) | 21,843 | 21,026 | |
| Class M1, 1 month U.S. LIBOR + 0.380% 2.8098% 4/25/36 (c)(d)(e) | 13,207 | 12,660 | |
| Class M2, 1 month U.S. LIBOR + 0.400% 2.8298% 4/25/36 (c)(d)(e) | 13,969 | 13,530 | |
| Class M6, 1 month U.S. LIBOR + 0.640% 3.0698% 4/25/36 (c)(d)(e) | 13,207 | 12,514 | |
| Series 2006-2A: | |||
| Class M1, 1 month U.S. LIBOR + 0.310% 2.7398% 7/25/36 (c)(d)(e) | 19,919 | 19,279 | |
| Class M2, 1 month U.S. LIBOR + 0.330% 2.7598% 7/25/36 (c)(d)(e) | 14,153 | 13,313 | |
| Class M4, 1 month U.S. LIBOR + 0.420% 2.8498% 7/25/36 (c)(d)(e) | 13,366 | 12,630 | |
| Series 2006-4A: | |||
| Class A2, 1 month U.S. LIBOR + 0.270% 2.6998% 12/25/36 (c)(d)(e) | 321,702 | 309,447 | |
| Class M1, 1 month U.S. LIBOR + 0.290% 2.7198% 12/25/36 (c)(d)(e) | 25,854 | 24,016 | |
| Class M3, 1 month U.S. LIBOR + 0.340% 2.7698% 12/25/36 (c)(d)(e) | 17,525 | 15,771 | |
| Series 2007-1 Class A2, 1 month U.S. LIBOR + 0.270% 2.6998% 3/25/37 (c)(d)(e) | 76,525 | 72,257 | |
| Series 2007-2A: | |||
| Class A1, 1 month U.S. LIBOR + 0.270% 2.6998% 7/25/37 (c)(d)(e) | 224,306 | 213,100 | |
| Class A2, 1 month U.S. LIBOR + 0.320% 2.7498% 7/25/37 (c)(d)(e) | 209,948 | 197,545 | |
| Class M1, 1 month U.S. LIBOR + 0.370% 2.7998% 7/25/37 (c)(d)(e) | 71,518 | 66,125 | |
| Class M2, 1 month U.S. LIBOR + 0.410% 2.8398% 7/25/37 (c)(d)(e) | 46,595 | 42,365 | |
| Class M3, 1 month U.S. LIBOR + 0.490% 2.9198% 7/25/37 (c)(d)(e) | 38,173 | 47,347 | |
| Series 2007-3: | |||
| Class A2, 1 month U.S. LIBOR + 0.290% 2.7198% 7/25/37 (c)(d)(e) | 76,457 | 72,160 | |
| Class M1, 1 month U.S. LIBOR + 0.310% 2.7398% 7/25/37 (c)(d)(e) | 40,557 | 38,359 | |
| Class M2, 1 month U.S. LIBOR + 0.340% 2.7698% 7/25/37 (c)(d)(e) | 43,274 | 40,577 | |
| Class M3, 1 month U.S. LIBOR + 0.370% 2.7998% 7/25/37 (c)(d)(e) | 69,859 | 64,169 | |
| Class M4, 1 month U.S. LIBOR + 0.500% 2.9298% 7/25/37 (c)(d)(e) | 109,834 | 99,483 | |
| Class M5, 1 month U.S. LIBOR + 0.600% 3.0298% 7/25/37 (c)(d)(e) | 43,501 | 51,408 | |
| Benchmark Mortgage Trust Series 2018-B8 Class A5, 4.2317% 1/15/52 | 7,840,000 | 8,655,459 | |
| BX Trust: | |||
| floater: | |||
| Series 2018-EXCL Class D, 1 month U.S. LIBOR + 2.625% 5.0646% 9/15/37 (c)(d)(e) | 2,186,803 | 2,163,855 | |
| Series 2018-IND Class F, 1 month U.S. LIBOR + 1.800% 4.2396% 11/15/35 (c)(d)(e) | 2,734,420 | 2,738,529 | |
| Series 2019-IMC: | |||
| Class B, 1 month U.S. LIBOR + 1.300% 3.8% 4/15/34 (c)(d)(e) | 4,437,000 | 4,443,952 | |
| Class C, 1 month U.S. LIBOR + 1.600% 4.1% 4/15/34 (c)(d)(e) | 2,933,000 | 2,939,431 | |
| Class D, 1 month U.S. LIBOR + 1.900% 4.4% 4/15/34 (c)(d)(e) | 3,079,000 | 3,087,692 | |
| floater, sequential payer Series 2019-IMC Class A, 1 month U.S. LIBOR + 1.000% 3.5% 4/15/34 (c)(d)(e) | 7,316,000 | 7,322,879 | |
| Citigroup Commercial Mortgage Trust: | |||
| Series 2015-GC33 Class XA, 0.9301% 9/10/58 (d)(g) | 1,666,285 | 74,825 | |
| Series 2016-P6 Class XA, 0.8084% 12/10/49 (d)(g) | 1,660,598 | 62,920 | |
| Series 2018-C6 Class A4, 4.412% 11/10/51 | 4,133,000 | 4,622,134 | |
| COMM Mortgage Trust: | |||
| Series 2014-CR19 Class XA, 1.129% 8/10/47 (d)(g) | 2,260,651 | 90,164 | |
| Series 2014-CR20 Class XA, 1.1078% 11/10/47 (d)(g) | 447,191 | 18,706 | |
| Series 2014-LC17 Class XA, 0.8851% 10/10/47 (d)(g) | 1,789,916 | 46,161 | |
| Series 2014-UBS4 Class XA, 1.1579% 8/10/47 (d)(g) | 1,905,197 | 83,759 | |
| Series 2014-UBS6 Class XA, 0.9401% 12/10/47 (d)(g) | 1,056,515 | 39,554 | |
| Series 2015-DC1 Class XA, 1.1255% 2/10/48 (d)(g) | 2,692,752 | 110,026 | |
| Core Industrial Trust floater Series 2019-CORE Class A, 1 month U.S. LIBOR + 0.880% 3.3196% 12/15/31 (c)(d)(e) | 1,667,000 | 1,669,743 | |
| Credit Suisse Mortgage Trust: | |||
| floater Series 2019-ICE4 Class A, 1 month U.S. LIBOR + 0.980% 3.443% 5/15/36 (c)(d)(e) | 9,500,000 | 9,500,000 | |
| Series 2018-SITE: | |||
| Class A, 4.284% 4/15/36 (c) | 4,627,000 | 4,873,792 | |
| Class B, 4.5349% 4/15/36 (c) | 1,471,000 | 1,547,089 | |
| Class C, 4.782% 4/15/36 (c) | 955,000 | 996,293 | |
| Class D, 4.782% 4/15/36 (c) | 1,909,000 | 1,956,033 | |
| CSAIL Commercial Mortgage Trust sequential payer Series 2015-C3 Class A4, 3.7182% 8/15/48 | 7,500,000 | 7,876,092 | |
| CSAIL Commercial Mtg Trust Series 2018-C14 Class A4 4.4216% 11/15/51 | 3,395,000 | 3,779,930 | |
| Fannie Mae Series 2017-T1 Class A, 2.898% 6/25/27 | 10,239,176 | 10,343,814 | |
| Freddie Mac: | |||
| sequential payer: | |||
| Series K069 Class A2, 3.187% 9/25/27 | 3,630,000 | 3,783,984 | |
| Series K072 Class A2, 3.444% 12/25/27 | 894,000 | 950,306 | |
| Series K073 Class A2, 3.35% 1/25/28 | 6,811,000 | 7,177,114 | |
| Series K089 Class A2, 3.563% 1/25/29 | 8,000,000 | 8,588,548 | |
| Series K155 Class A1, 3.75% 11/25/29 | 229,976 | 247,262 | |
| Series K084 Class A2, 3.78% 10/25/28 | 3,024,000 | 3,289,252 | |
| Series K734 Class A2, 3.208% 2/25/51 | 5,438,000 | 5,669,408 | |
| Freddie Mac Multi-family Structured pass-thru certificates Series K078 Class A2, 3.854% 6/25/51 | 7,689,000 | 8,416,020 | |
| GS Mortgage Securities Trust: | |||
| floater Series 2018-3PCK Class A, 1 month U.S. LIBOR + 1.450% 3.8896% 9/15/31 (c)(d)(e) | 9,056,000 | 9,037,237 | |
| sequential payer Series 2015-GC32 Class A4, 3.764% 7/10/48 | 5,700,000 | 6,029,620 | |
| JPMDB Commercial Mortgage Securities Trust sequential payer Series 2017-C7 Class ASB, 3.2419% 10/15/50 | 7,000,000 | 7,209,161 | |
| JPMorgan Chase Commercial Mortgage Securities Trust: | |||
| Series 2007-CB19 Class B, 5.8156% 2/12/49 (d) | 38,854 | 10,879 | |
| Series 2018-WPT: | |||
| Class AFX, 4.2475% 7/5/33 (c) | 84,000 | 89,532 | |
| Class CFX, 4.9498% 7/5/33 (c) | 767,000 | 811,355 | |
| Class DFX, 5.3503% 7/5/33 (c) | 1,180,000 | 1,251,091 | |
| Class EFX, 5.5422% 7/5/33 (c) | 1,614,000 | 1,703,704 | |
| Morgan Stanley BAML Trust Series 2015-C25 Class XA, 1.1102% 10/15/48 (d)(g) | 1,007,885 | 52,697 | |
| Morgan Stanley Bank of America Merrill Lynch Trust sequential payer Series 2017-C34 Class ASB, 3.354% 11/15/52 | 4,000,000 | 4,128,541 | |
| Morgan Stanley Capital I Trust: | |||
| floater: | |||
| Series 2018-BOP Class A, 1 month U.S. LIBOR + 0.850% 3.2896% 8/15/33 (c)(d)(e) | 213,000 | 212,198 | |
| Series 2019-AGLN Class A, 1 month U.S. LIBOR + 0.950% 3.3896% 3/15/34 (c)(d)(e) | 8,620,000 | 8,619,983 | |
| Series 2018-H4 Class A4, 4.31% 12/15/51 | 13,048,000 | 14,463,180 | |
| MSCG Trust Series 2016-SNR: | |||
| Class A, 3.348% 11/15/34 (c)(d) | 3,271,486 | 3,250,856 | |
| Class B, 4.181% 11/15/34 (c) | 1,351,500 | 1,349,689 | |
| Class C, 5.205% 11/15/34 (c) | 948,600 | 956,611 | |
| RETL floater Series 2019-RVP: | |||
| Class A, 1 month U.S. LIBOR + 1.150% 3.5896% 3/15/36 (c)(d)(e) | 7,158,869 | 7,161,399 | |
| Class B, 1 month U.S. LIBOR + 1.550% 3.9896% 3/15/36 (c)(d)(e) | 2,800,000 | 2,802,773 | |
| Class C, 1 month U.S. LIBOR + 2.100% 4.5396% 3/15/36 (c)(d)(e) | 6,787,000 | 6,802,297 | |
| UBS Commercial Mortgage Trust Series 2017-C7 Class XA, 1.0654% 12/15/50 (d)(g) | 1,253,968 | 84,852 | |
| UBS-Barclays Commercial Mortgage Trust floater Series 2013-C6 Class A3, 1 month U.S. LIBOR + 0.790% 3.2414% 4/10/46 (c)(d)(e) | 113,853 | 115,132 | |
| Wells Fargo Commercial Mortgage Trust: | |||
| sequential payer Series 2015-C26 Class A4, 3.166% 2/15/48 | 3,550,000 | 3,635,403 | |
| Series 2017-C42 Class XA, 0.8951% 12/15/50 (d)(g) | 1,464,264 | 91,954 | |
| Series 2018-C48 Class A5, 4.302% 1/15/52 | 8,343,000 | 9,231,590 | |
| WF-RBS Commercial Mortgage Trust: | |||
| floater Series 2013-C14 Class A3, 1 month U.S. LIBOR + 0.720% 3.1524% 6/15/46 (c)(d)(e) | 120,669 | 120,692 | |
| Series 2014-C25 Class A5, 3.631% 11/15/47 | 5,490,000 | 5,747,992 | |
| TOTAL COMMERCIAL MORTGAGE SECURITIES | |||
| (Cost $208,607,138) | 215,482,617 | ||
| Municipal Securities - 0.2% | |||
| Illinois Gen. Oblig.: | |||
| Series 2003: | $ | $ | |
| 4.95% 6/1/23 | 4,715,000 | 4,877,007 | |
| 5.1% 6/1/33 | 22,095,000 | 22,796,958 | |
| Series 2010-1, 6.63% 2/1/35 | 2,035,000 | 2,306,591 | |
| Series 2010-3: | |||
| 6.725% 4/1/35 | 2,710,000 | 3,088,723 | |
| 7.35% 7/1/35 | 1,385,000 | 1,633,704 | |
| Series 2010-5, 6.2% 7/1/21 | 885,000 | 913,170 | |
| Series 2013, 3.6% 12/1/19 | 1,905,000 | 1,908,483 | |
| TOTAL MUNICIPAL SECURITIES | |||
| (Cost $35,185,428) | 37,524,636 | ||
| Bank Notes - 0.1% | |||
| Capital One NA 2.95% 7/23/21 | 3,754,000 | 3,780,359 | |
| Discover Bank: | |||
| (Delaware) 3.2% 8/9/21 | 4,613,000 | 4,659,100 | |
| 3.1% 6/4/20 | 4,072,000 | 4,084,584 | |
| 4.682% 8/9/28 (d) | 2,954,000 | 3,009,535 | |
| 8.7% 11/18/19 | 649,000 | 665,875 | |
| KeyBank NA 6.95% 2/1/28 | 619,000 | 766,537 | |
| PNC Bank NA 2.45% 11/5/20 | 4,575,000 | 4,576,564 | |
| Synchrony Bank 3.65% 5/24/21 | 4,817,000 | 4,880,861 | |
| TOTAL BANK NOTES | |||
| (Cost $25,936,719) | 26,423,415 | ||
| Shares | Value | ||
| Fixed-Income Funds - 56.3% | |||
| Bank Loan Funds - 2.0% | |||
| Fidelity Floating Rate High Income Fund (n) | 36,467,212 | $346,073,841 | |
| High Yield Fixed-Income Funds - 2.3% | |||
| Fidelity New Markets Income Fund (n) | 10,315,062 | 153,694,426 | |
| Fidelity Specialized High Income Central Fund (o) | 2,350,309 | 233,291,657 | |
| TOTAL HIGH YIELD FIXED-INCOME FUNDS | 386,986,083 | ||
| Inflation-Protected Bond Funds - 0.5% | |||
| Fidelity Inflation-Protected Bond Index Fund (n) | 8,206,170 | 81,897,580 | |
| Intermediate Government Funds - 10.3% | |||
| Fidelity SAI U.S. Treasury Bond Index Fund (n) | 174,783,274 | 1,746,084,906 | |
| Intermediate-Term Bond Funds - 41.2% | |||
| Fidelity SAI Total Bond Fund (n) | 633,871,853 | 6,623,960,852 | |
| Fidelity U.S. Bond Index Fund (n) | 30,327,257 | 354,222,366 | |
| TOTAL INTERMEDIATE-TERM BOND FUNDS | 6,978,183,218 | ||
| TOTAL FIXED-INCOME FUNDS | |||
| (Cost $9,189,904,911) | 9,539,225,628 | ||
| Principal Amount | Value | ||
| Preferred Securities - 0.1% | |||
| FINANCIALS - 0.1% | |||
| Banks - 0.1% | |||
| Bank of Nova Scotia 4.65% (d)(p) | 10,000,000 | 9,363,525 | |
| Barclays Bank PLC 7.625% 11/21/22 | 4,883,000 | 5,309,038 | |
| TOTAL PREFERRED SECURITIES | |||
| (Cost $14,699,031) | 14,672,563 | ||
| Shares | Value | ||
| Money Market Funds - 2.1% | |||
| Fidelity Cash Central Fund 2.41% (q) | 234,090,008 | 234,136,826 | |
| Fidelity Investments Money Market Government Portfolio Institutional Class 2.31% (n)(r) | 122,960,870 | 122,960,870 | |
| TOTAL MONEY MARKET FUNDS | |||
| (Cost $357,097,657) | 357,097,696 |
| Purchased Swaptions - 0.0% | ||||
| Expiration Date | Notional Amount | Value | ||
| Put Options - 0.0% | ||||
| Option on an interest rate swap with Bank of America NA to pay semi-annually a fixed rate of 2.605% and receive quarterly a floating rate based on 3-month LIBOR, expiring May 2029 | 4/29/22 | 2,600,000 | $47,924 | |
| Option on an interest rate swap with Bank of America NA to pay semi-annually a fixed rate of 2.61% and receive quarterly a floating rate based on 3-month LIBOR, expiring May 2029 | 4/29/22 | 20,000,000 | 366,145 | |
| Option on an interest rate swap with Citibank, N.A. to pay semi-annually a fixed rate of 2.525% and receive quarterly a floating rate based on 3-month LIBOR, expiring April 2029 | 4/4/22 | 10,000,000 | 197,484 | |
| Option on an interest rate swap with Citibank, N.A. to pay semi-annually a fixed rate of 2.651% and receive quarterly a floating rate based on 3-month LIBOR, expiring April 2029 | 4/14/22 | 5,700,000 | 97,902 | |
| Option on an interest rate swap with Citibank, N.A. to pay semi-annually a fixed rate of 2.755% and receive quarterly a floating rate based on 3-month LIBOR, expiring February 2029 | 2/15/22 | 17,000,000 | 243,725 | |
| Option on an interest rate swap with Goldman Sachs Bank U.S.A. to pay semi-annually a fixed rate of 2.5675% and receive quarterly a floating rate based on 3-month LIBOR, expiring April 2029 | 4/4/22 | 6,000,000 | 112,650 | |
| Option on an interest rate swap with Goldman Sachs Bank U.S.A. to pay semi-annually a fixed rate of 2.63% and receive quarterly a floating rate based on 3-month LIBOR, expiring April 2029 | 4/25/22 | 10,800,000 | 192,483 | |
| Option on an interest rate swap with Goldman Sachs Bank U.S.A. to pay semi-annually a fixed rate of 2.645% and receive quarterly a floating rate based on 3-month LIBOR, expiring April 2029 | 4/14/22 | 7,000,000 | 121,066 | |
| Option on an interest rate swap with Goldman Sachs Bank U.S.A. to pay semi-annually a fixed rate of 2.767% and receive quarterly a floating rate based on 3-month LIBOR, expiring February 2029 | 2/1/22 | 25,600,000 | 356,609 | |
| Option on an interest rate swap with Goldman Sachs Bank U.S.A. to pay semi-annually a fixed rate of 2.805% and receive quarterly a floating rate based on 3-month LIBOR, expiring February 2029 | 1/28/22 | 5,600,000 | 74,169 | |
| TOTAL PUT OPTIONS | 1,810,157 | |||
| Call Options - 0.0% | ||||
| Option on an interest rate swap with Bank of America N.A. to receive semi-annually a fixed rate of 2.605% and pay quarterly a floating rate based on 3-month LIBOR, expiring May 2029 | 4/29/22 | 2,600,000 | 119,226 | |
| Option on an interest rate swap with Bank of America N.A. to receive semi-annually a fixed rate of 2.61% and pay quarterly a floating rate based on 3-month LIBOR, expiring May 2029 | 4/29/22 | 20,000,000 | 920,840 | |
| Option on an interest rate swap with Citibank, N.A. to receive semi-annually a fixed rate of 2.525% and pay quarterly a floating rate based on 3-month LIBOR, expiring April 2029 | 4/4/22 | 10,000,000 | 426,804 | |
| Option on an interest rate swap with Citibank, N.A. to receive semi-annually a fixed rate of 2.651% and pay quarterly a floating rate based on 3-month LIBOR, expiring April 2029 | 4/14/22 | 5,700,000 | 271,973 | |
| Option on an interest rate swap with Citibank, N.A. to receive semi-annually a fixed rate of 2.755% and pay quarterly a floating rate based on 3-month LIBOR, expiring February 2029 | 2/15/22 | 17,000,000 | 892,154 | |
| Option on an interest rate swap with Goldman Sachs Bank U.S.A. to receive semi-annually a fixed rate of 2.5675% and pay quarterly a floating rate based on 3-month LIBOR, expiring April 2029 | 4/4/22 | 6,000,000 | 266,127 | |
| Option on an interest rate swap with Goldman Sachs Bank U.S.A. to receive semi-annually a fixed rate of 2.63% and pay quarterly a floating rate based on 3-month LIBOR, expiring April 2029 | 4/25/22 | 10,800,000 | 506,880 | |
| Option on an interest rate swap with Goldman Sachs Bank U.S.A. to receive semi-annually a fixed rate of 2.645% and pay quarterly a floating rate based on 3-month LIBOR, expiring April 2029 | 4/14/22 | 7,000,000 | 332,222 | |
| Option on an interest rate swap with Goldman Sachs Bank U.S.A. to receive semi-annually a fixed rate of 2.767% and pay quarterly a floating rate based on 3-month LIBOR, expiring February 2029 | 2/1/22 | 25,600,000 | 1,358,383 | |
| Option on an interest rate swap with Goldman Sachs Bank U.S.A. to receive semi-annually a fixed rate of 2.805% and pay quarterly a floating rate based on 3-month LIBOR, expiring February 2029 | 1/28/22 | 5,600,000 | 306,715 | |
| TOTAL CALL OPTIONS | 5,401,324 | |||
| TOTAL PURCHASED SWAPTIONS | ||||
| (Cost $6,358,406) | 7,211,481 | |||
| TOTAL INVESTMENT IN SECURITIES - 105.6% | ||||
| (Cost $17,307,829,489) | 17,907,087,574 | |||
| NET OTHER ASSETS (LIABILITIES) - (5.6)% | (953,830,864) | |||
| NET ASSETS - 100% | $16,953,256,710 |
| TBA Sale Commitments | ||
| Principal Amount | Value | |
| Fannie Mae | ||
| 3% 6/1/34 | $(5,300,000) | $(5,377,596) |
| 3% 6/1/34 | (6,700,000) | (6,798,093) |
| 3% 6/1/34 | (15,400,000) | (15,625,470) |
| 3% 6/1/34 | (4,500,000) | (4,565,883) |
| 3% 6/1/34 | (18,700,000) | (18,973,780) |
| 3% 6/1/34 | (3,150,000) | (3,196,118) |
| 3% 6/1/34 | (2,000,000) | (2,029,281) |
| 3% 6/1/34 | (600,000) | (608,784) |
| 3% 6/1/34 | (8,500,000) | (8,624,446) |
| 3% 6/1/34 | (4,300,000) | (4,362,955) |
| 3% 6/1/34 | (3,000,000) | (3,043,922) |
| 3% 6/1/34 | (4,600,000) | (4,667,347) |
| 3% 6/1/34 | (2,300,000) | (2,333,674) |
| 3% 6/1/34 | (800,000) | (811,713) |
| 3% 6/1/34 | (2,000,000) | (2,029,281) |
| 3% 6/1/34 | (600,000) | (608,784) |
| 3% 6/1/34 | (500,000) | (507,320) |
| 3% 6/1/34 | (400,000) | (405,856) |
| 3% 6/1/34 | (1,200,000) | (1,217,569) |
| 3% 6/1/34 | (650,000) | (659,516) |
| 3% 6/1/34 | (1,850,000) | (1,877,085) |
| 3% 6/1/34 | (2,650,000) | (2,688,798) |
| 3% 6/1/34 | (1,800,000) | (1,826,353) |
| 3% 6/1/49 | (27,300,000) | (27,409,356) |
| 3% 6/1/49 | (3,100,000) | (3,112,418) |
| 3% 6/1/49 | (1,600,000) | (1,606,409) |
| 3% 6/1/49 | (1,600,000) | (1,606,409) |
| 3% 6/1/49 | (800,000) | (803,205) |
| 3% 6/1/49 | (800,000) | (803,205) |
| 3% 6/1/49 | (900,000) | (903,605) |
| 3% 6/1/49 | (3,000,000) | (3,012,017) |
| 3% 6/1/49 | (2,200,000) | (2,208,813) |
| 3% 6/1/49 | (2,500,000) | (2,510,014) |
| 3% 6/1/49 | (5,900,000) | (5,923,634) |
| 3% 6/1/49 | (19,175,000) | (19,251,809) |
| 3% 6/1/49 | (2,225,000) | (2,233,913) |
| 3% 6/1/49 | (800,000) | (803,205) |
| 3% 6/1/49 | (8,750,000) | (8,785,050) |
| 3% 6/1/49 | (6,050,000) | (6,074,234) |
| 3% 6/1/49 | (33,100,000) | (33,232,589) |
| 3% 6/1/49 | (57,025,000) | (57,253,424) |
| 3% 6/1/49 | (18,100,000) | (18,172,503) |
| 3.5% 6/1/49 | (27,600,000) | (28,148,291) |
| 3.5% 6/1/49 | (27,600,000) | (28,148,291) |
| 3.5% 6/1/49 | (29,200,000) | (29,780,073) |
| 3.5% 6/1/49 | (21,200,000) | (21,621,151) |
| 3.5% 6/1/49 | (3,100,000) | (3,161,583) |
| 3.5% 6/1/49 | (6,900,000) | (7,037,073) |
| 3.5% 6/1/49 | (1,700,000) | (1,733,772) |
| 3.5% 6/1/49 | (4,400,000) | (4,487,409) |
| 3.5% 6/1/49 | (3,950,000) | (4,028,469) |
| 3.5% 6/1/49 | (3,575,000) | (3,646,020) |
| 3.5% 6/1/49 | (3,950,000) | (4,028,469) |
| 4% 6/1/49 | (6,500,000) | (6,709,192) |
| 4% 6/1/49 | (23,900,000) | (24,669,183) |
| 4.5% 6/1/49 | (500,000) | (522,367) |
| 4.5% 6/1/49 | (700,000) | (731,313) |
| 4.5% 6/1/49 | (1,300,000) | (1,358,153) |
| 4.5% 6/1/49 | (15,600,000) | (16,297,838) |
| 4.5% 6/1/49 | (15,500,000) | (16,193,365) |
| 4.5% 6/1/49 | (250,000) | (261,183) |
| 4.5% 6/1/49 | (150,000) | (156,710) |
| TOTAL FANNIE MAE | (491,265,341) | |
| Ginnie Mae | ||
| 3% 6/1/49 | (6,100,000) | (6,191,665) |
| 3% 6/1/49 | (10,300,000) | (10,454,778) |
| 3% 6/1/49 | (6,700,000) | (6,800,681) |
| 3.5% 6/1/49 | (34,850,000) | (35,822,482) |
| 3.5% 6/1/49 | (20,000,000) | (20,558,096) |
| 4% 6/1/49 | (600,000) | (620,632) |
| TOTAL GINNIE MAE | (80,448,334) | |
| TOTAL TBA SALE COMMITMENTS | ||
| (Proceeds $567,602,465) | $(571,713,675) |
| Written Swaptions | |||
| Expiration Date | Notional Amount | Value | |
| Put Swaptions | |||
| Option on an interest rate swap with Goldman Sachs Bank U.S.A. to pay semi-annually a fixed rate of 2.244% and receive quarterly a floating rate based on 3-month LIBOR, expiring July 2026 | 6/27/19 | 6,000,000 | $(3,160) |
| Call Swaptions | |||
| Option on an interest rate swap with Goldman Sachs Bank U.S.A. to receive semi-annually a fixed rate of 2.244% and pay quarterly a floating rate based on 3-month LIBOR, expiring July 2026 | 6/27/19 | 6,000,000 | (109,200) |
| TOTAL WRITTEN SWAPTIONS | $(112,360) |
| Futures Contracts | |||||
| Number of contracts | Expiration Date | Notional Amount | Value | Unrealized Appreciation/(Depreciation) | |
| Purchased | |||||
| Treasury Contracts | |||||
| CBOT Ultra Long Term U.S. Treasury Bond Contracts (United States) | 12 | Sept. 2019 | $2,109,375 | $44,786 | $44,786 |
| Sold | |||||
| Treasury Contracts | |||||
| CBOT 10-Year U.S. Treasury Note Contracts (United States) | 436 | Sept. 2019 | 55,263,000 | (399,809) | (399,809) |
| CBOT 2-Year U.S. Treasury Note Contracts (United States) | 52 | Sept. 2019 | 11,162,938 | (28,925) | (28,925) |
| CBOT 5-Year U.S. Treasury Note Contracts (United States) | 75 | Sept. 2019 | 8,802,539 | (105,620) | (105,620) |
| CBOT Ultra 10-Year U.S. Treasury Note Contracts (United States) | 59 | Sept. 2019 | 8,056,266 | (188,881) | (188,881) |
| TOTAL SOLD | (723,235) | ||||
| TOTAL FUTURES CONTRACTS | $(678,449) |
The notional amount of futures purchased as a percentage of Net Assets is 0.0%
The notional amount of futures sold as a percentage of Net Assets is 0.5%
Swaps
| Underlying Reference | Maturity Date | Clearinghouse / Counterparty | Fixed Payment Received/(Paid) | Payment Frequency | Notional Amount | Value | Upfront Premium Received/(Paid) | Unrealized Appreciation/(Depreciation) |
| Credit Default Swaps | ||||||||
| Buy Protection | ||||||||
| CMBX N.A. AAA Index Series 11 | Nov. 2054 | Citigroup Global Markets Ltd. | (0.5%) | Monthly | $3,350,000 | $13,284 | $(3,839) | $9,445 |
| CMBX N.A. AAA Index Series 11 | Nov. 2054 | Credit Suisse International | (0.5%) | Monthly | 3,560,000 | 14,116 | (25,577) | (11,461) |
| CMBX N.A. AAA Index Series 11 | Nov. 2054 | J.P. Morgan Securities LLC | (0.5%) | Monthly | 1,340,000 | 5,314 | (9,146) | (3,832) |
| TOTAL CREDIT DEFAULT SWAPS | $32,714 | $(38,562) | $(5,848) | |||||
| Payment Received | Payment Frequency | Payment Paid | Payment Frequency | Clearinghouse / Counterparty(1) | Maturity Date | Notional Amount | Value | Upfront Premium Received/(Paid)(2) | Unrealized Appreciation/(Depreciation) |
| Interest Rate Swaps | |||||||||
| 3-month LIBOR(3) | Quarterly | 3% | Semi - annual | LCH | Jun. 2029 | $9,104,000 | $(221,161) | $0 | $(221,161) |
(1) Swaps with LCH Clearnet Group (LCH) are centrally cleared over-the-counter (OTC) swaps.
(2) Any premiums for centrally cleared over-the-counter (OTC) swaps are recorded periodically throughout the term of the swap to variation margin and included in unrealized appreciation (depreciation).
(3) Represents floating rate.
Legend
(a) Security initially issued in zero coupon form which converts to coupon form at a specified rate and date. The rate shown is the rate at period end.
(b) Security or a portion of the security purchased on a delayed delivery or when-issued basis.
(c) Security exempt from registration under Rule 144A of the Securities Act of 1933. These securities may be resold in transactions exempt from registration, normally to qualified institutional buyers. At the end of the period, the value of these securities amounted to $468,906,868 or 2.8% of net assets.
(d) Coupon rates for floating and adjustable rate securities reflect the rates in effect at period end.
(e) Coupon is indexed to a floating interest rate which may be multiplied by a specified factor and/or subject to caps or floors.
(f) Security or a portion of the security was pledged to cover margin requirements for futures contracts. At period end, the value of securities pledged amounted to $636,040.
(g) Security represents right to receive monthly interest payments on an underlying pool of mortgages or assets. Principal shown is the outstanding par amount of the pool as of the end of the period.
(h) Security or a portion of the security was pledged to cover margin requirements for centrally cleared OTC swaps. At period end, the value of securities pledged amounted to $362,570.
(i) Level 3 security
(j) Security initially issued at one coupon which converts to a higher coupon at a specified date. The rate shown is the rate at period end.
(k) Coupon is inversely indexed to a floating interest rate multiplied by a specified factor. The price may be considerably more volatile than the price of a comparable fixed rate security.
(l) Principal Only Strips represent the right to receive the monthly principal payments on an underlying pool of mortgage loans.
(m) Represents an investment in an underlying pool of reverse mortgages which typically do not require regular principal and interest payments as repayment is deferred until a maturity event.
(n) Affiliated Fund
(o) Affiliated fund that is generally available only to investment companies and other accounts managed by Fidelity Investments. A complete unaudited schedule of portfolio holdings for each Fidelity Central Fund is filed with the SEC for the first and third quarters of each fiscal year on Form N-PORT and is available upon request or at the SEC's website at www.sec.gov. An unaudited holdings listing for the Fund, which presents direct holdings as well as the pro-rata share of securities and other investments held indirectly through its investment in underlying non-money market Fidelity Central Funds is available at fidelity.com and/or institutional.fidelity.com, as applicable. In addition, each Fidelity Central Fund's financial statements, which are not covered by the Fund's Report of Independent Registered Public Accounting Firm, are available on the SEC's website or upon request.
(p) Security is perpetual in nature with no stated maturity date.
(q) Affiliated fund that is generally available only to investment companies and other accounts managed by Fidelity Investments. The rate quoted is the annualized seven-day yield of the fund at period end. A complete unaudited listing of the fund's holdings as of its most recent quarter end is available upon request. In addition, each Fidelity Central Fund's financial statements, which are not covered by the Fund's Report of Independent Registered Public Accounting Firm, are available on the SEC's website or upon request.
(r) The rate quoted is the annualized seven-day yield of the fund at period end.
Affiliated Central Funds
Information regarding fiscal year to date income earned by the Fund from investments in Fidelity Central Funds is as follows:
| Fund | Income earned |
| Fidelity Cash Central Fund | 3,880,910 |
| Fidelity Mortgage Backed Securities Central Fund | 22,724,535 |
| Fidelity Specialized High Income Central Fund | 7,295,985 |
| Total | $33,901,430 |
Amounts in the income column in the above table include any capital gain distributions from underlying funds, which are presented in the corresponding line-item in the Statement of Operations, if applicable.
Fiscal year to date information regarding the Fund’s investments in non-Money Market Central Funds, including the ownership percentage, is presented below.
| Fund | Value, beginning of period | Purchases(a) | Sales Proceeds(a) | Realized Gain/Loss | Change in Unrealized appreciation (depreciation) | Value, end of period | % ownership, end of period |
| Fidelity Mortgage Backed Securities Central Fund | $-- | $1,425,896,465 | $1,470,054,216 | $44,157,751 | $-- | $-- | 0.0% |
| Fidelity Specialized High Income Central Fund | -- | 228,631,344 | -- | -- | 4,660,313 | 233,291,657 | 27.9% |
| Total | $-- | $1,654,527,809 | $1,470,054,216 | $44,157,751 | $4,660,313 | $233,291,657 |
(a) Includes the value of shares delivered or redeemed through in-kind transactions, if applicable.
Affiliated Underlying Funds
Fiscal year to date information regarding the Fund's investments in affiliated Underlying Funds, excluding any Money Market Central Funds, is presented below. Exchanges between classes of the same affiliated Underlying Funds may occur.
| Affiliate | Value, beginning of period | Purchases(a) | Sales Proceeds | Dividend Income | Realized Gain (loss) | Change in Unrealized appreciation (depreciation) | Value, end of period |
| Fidelity Floating Rate High Income Fund | $-- | $343,339,346 | $-- | $4,430,925 | $-- | $2,734,495 | $346,073,841 |
| Fidelity Inflation-Protected Bond Index Fund | -- | 81,883,146 | 2,847,858 | 1,721,602 | 43,661 | 2,818,631 | 81,897,580 |
| Fidelity Investments Money Market Government Portfolio Institutional Class 2.31% | -- | 745,334,668 | 622,373,798 | 511,152 | -- | -- | 122,960,870 |
| Fidelity Investments Money Market Prime Reserves Portfolio - Institutional Class 2.44% | -- | 349,457,734 | 349,459,680 | 166,902 | 1,946 | -- | -- |
| Fidelity Limited Term Bond Fund | -- | 13,993,945 | 14,018,991 | 31,216 | 25,046 | -- | -- |
| Fidelity New Markets Income Fund | -- | 150,899,381 | -- | 2,899,381 | -- | 2,795,045 | 153,694,426 |
| Fidelity Total Bond Fund | -- | 1,000,709 | 998,759 | 1,021 | (1,950) | -- | -- |
| Fidelity SAI Total Bond Fund | -- | 6,418,841,898 | 67,847,858 | 120,809,111 | (78,345) | 273,045,157 | 6,623,960,852 |
| Fidelity SAI U.S. Treasury Bond Index Fund | -- | 1,751,677,709 | 59,247,631 | 10,132,442 | 446,734 | 53,208,094 | 1,746,084,906 |
| Fidelity U.S. Bond Index Fund | -- | 344,163,403 | -- | 2,617,727 | -- | 10,058,963 | 354,222,366 |
| Total | $-- | $10,200,591,939 | $1,116,794,575 | $143,321,479 | $437,092 | $344,660,385 | $9,428,894,841 |
(a) Includes the value of securities received through in-kind transactions, if applicable.
Amounts in the income column in the above table include any capital gain distributions from underlying funds, which are presented in the corresponding line-item in the Statement of Operations, if applicable.
Investment Valuation
The following is a summary of the inputs used, as of May 31, 2019, involving the Fund's assets and liabilities carried at fair value. The inputs or methodology used for valuing securities may not be an indication of the risk associated with investing in those securities. For more information on valuation inputs, and their aggregation into the levels used below, please refer to the Investment Valuation section in the accompanying Notes to Financial Statements.
| Valuation Inputs at Reporting Date: | ||||
| Description | Total | Level 1 | Level 2 | Level 3 |
| Investments in Securities: | ||||
| Corporate Bonds | $1,945,763,945 | $-- | $1,945,763,945 | $-- |
| U.S. Government and Government Agency Obligations | 2,429,001,507 | -- | 2,429,001,507 | -- |
| U.S. Government Agency - Mortgage Securities | 2,943,982,978 | -- | 2,943,982,978 | -- |
| Asset-Backed Securities | 173,856,583 | -- | 173,277,638 | 578,945 |
| Collateralized Mortgage Obligations | 216,844,525 | -- | 216,844,525 | -- |
| Commercial Mortgage Securities | 215,482,617 | -- | 215,482,617 | -- |
| Municipal Securities | 37,524,636 | -- | 37,524,636 | -- |
| Bank Notes | 26,423,415 | -- | 26,423,415 | -- |
| Fixed-Income Funds | 9,539,225,628 | 9,539,225,628 | -- | -- |
| Preferred Securities | 14,672,563 | -- | 14,672,563 | -- |
| Money Market Funds | 357,097,696 | 357,097,696 | -- | -- |
| Purchased Swaptions | 7,211,481 | -- | 7,211,481 | -- |
| Total Investments in Securities: | $17,907,087,574 | $9,896,323,324 | $8,010,185,305 | $578,945 |
| Derivative Instruments: | ||||
| Assets | ||||
| Futures Contracts | $44,786 | $44,786 | $-- | $-- |
| Swaps | 32,714 | -- | 32,714 | -- |
| Total Assets | $77,500 | $44,786 | $32,714 | $-- |
| Liabilities | ||||
| Futures Contracts | $(723,235) | $(723,235) | $-- | $-- |
| Swaps | (221,161) | -- | (221,161) | -- |
| Written Swaptions | (112,360) | -- | (112,360) | -- |
| Total Liabilities | $(1,056,756) | $(723,235) | $(333,521) | $-- |
| Total Derivative Instruments: | $(979,256) | $(678,449) | $(300,807) | $-- |
| Other Financial Instruments: | ||||
| TBA Sale Commitments | $(571,713,675) | $-- | $(571,713,675) | $-- |
| Total Other Financial Instruments: | $(571,713,675) | $-- | $(571,713,675) | $-- |
Value of Derivative Instruments
The following table is a summary of the Fund's value of derivative instruments by primary risk exposure as of May 31, 2019. For additional information on derivative instruments, please refer to the Derivative Instruments section in the accompanying Notes to Financial Statements.
| Primary Risk Exposure / Derivative Type | Value | |
| Asset | Liability | |
| Credit Risk | ||
| Swaps(a) | $32,714 | $0 |
| Total Credit Risk | 32,714 | 0 |
| Interest Rate Risk | ||
| Futures Contracts(b) | 44,786 | (723,235) |
| Purchased Swaptions(c) | 7,211,481 | 0 |
| Swaps(d) | 0 | (221,161) |
| Written Swaptions(e) | 0 | (112,360) |
| Total Interest Rate Risk | 7,256,267 | (1,056,756) |
| Total Value of Derivatives | $7,288,981 | $(1,056,756) |
(a) For bi-lateral over-the-counter (OTC) swaps, reflects gross value which is presented in the Statement of Assets and Liabilities in the bi-lateral OTC swaps, at value line-items.
(b) Reflects gross cumulative appreciation (depreciation) on futures contracts as presented in the Schedule of Investments. In the Statement of Assets and Liabilities, the period end daily variation margin is included in receivable or payable for daily variation margin on futures contracts, and the net cumulative appreciation (depreciation) is included in distributable earnings.
(c) Gross value is included in the Statement of Assets and Liabilities in the investments, at value line-item.
(d) For centrally cleared over-the-counter (OTC) swaps, reflects gross cumulative appreciation (depreciation) as presented in the Schedule of Investments. In the Statement of Assets and Liabilities, the period end daily variation margin for centrally cleared OTC swaps is included in receivable or payable for daily variation margin on centrally cleared OTC swaps, and the net cumulative appreciation (depreciation) for centrally cleared OTC swaps is included in distributable earnings.
(e) Gross value is presented in the Statement of Assets and Liabilities in the written options, at value line-item.
See accompanying notes which are an integral part of the financial statements.
Financial Statements
Statement of Assets and Liabilities
| May 31, 2019 | ||
| Assets | ||
| Investment in securities, at value — See accompanying schedule: Unaffiliated issuers (cost $7,760,826,902) | $8,010,764,250 | |
| Fidelity Central Funds (cost $462,768,131) | 467,428,483 | |
| Other affiliated issuers (cost $9,084,234,456) | 9,428,894,841 | |
| Total Investment in Securities (cost $17,307,829,489) | $17,907,087,574 | |
| Cash | 114,394 | |
| Receivable for investments sold | 106,055,212 | |
| Receivable for premium on written options | 99,900 | |
| Receivable for TBA sale commitments | 567,602,465 | |
| Receivable for fund shares sold | 27,699,489 | |
| Interest receivable | 45,142,129 | |
| Distributions receivable from Fidelity Central Funds | 684,038 | |
| Bi-lateral OTC swaps, at value | 32,714 | |
| Prepaid expenses | 59,579 | |
| Other receivables | 1,910 | |
| Total assets | 18,654,579,404 | |
| Liabilities | ||
| Payable for investments purchased | ||
| Regular delivery | $253,348,075 | |
| Delayed delivery | 860,294,321 | |
| TBA sale commitments, at value | 571,713,675 | |
| Payable for fund shares redeemed | 8,154,841 | |
| Distributions payable | 4,874,195 | |
| Accrued management fee | 780,016 | |
| Payable for daily variation margin on futures contracts | 406,140 | |
| Payable for daily variation margin on centrally cleared OTC swaps | 78,207 | |
| Written options, at value (premium receivable $99,900) | 112,360 | |
| Other affiliated payables | 136,788 | |
| Other payables and accrued expenses | 1,424,076 | |
| Total liabilities | 1,701,322,694 | |
| Net Assets | $16,953,256,710 | |
| Net Assets consist of: | ||
| Paid in capital | $16,252,114,098 | |
| Total distributable earnings (loss) | 701,142,612 | |
| Net Assets, for 1,619,745,446 shares outstanding | $16,953,256,710 | |
| Net Asset Value, offering price and redemption price per share ($16,953,256,710 ÷ 1,619,745,446 shares) | $10.47 |
See accompanying notes which are an integral part of the financial statements.
Statement of Operations
| For the period October 16, 2018 (commencement of operations) to May 31, 2019 |
||
| Investment Income | ||
| Dividends: | ||
| Unaffiliated issuers | $604,829 | |
| Affiliated issuers | 141,799,197 | |
| Interest | 109,823,800 | |
| Income from Fidelity Central Funds | 33,901,430 | |
| Total income | 286,129,256 | |
| Expenses | ||
| Management fee | $26,278,587 | |
| Accounting fees and expenses | 946,817 | |
| Custodian fees and expenses | 65,047 | |
| Independent trustees' fees and expenses | 78,536 | |
| Registration fees | 3,507,349 | |
| Audit | 63,302 | |
| Legal | 13,922 | |
| Miscellaneous | 29,388 | |
| Total expenses before reductions | 30,982,948 | |
| Expense reductions | (21,114,477) | |
| Total expenses after reductions | 9,868,471 | |
| Net investment income (loss) | 276,260,785 | |
| Realized and Unrealized Gain (Loss) | ||
| Net realized gain (loss) on: | ||
| Investment securities: | ||
| Unaffiliated issuers | 46,061,379 | |
| Fidelity Central Funds | 44,157,712 | |
| Other affiliated issuers | 437,092 | |
| Futures contracts | (2,538,858) | |
| Swaps | 64,476 | |
| Written options | 5,981 | |
| Capital gain distributions from underlying funds: | ||
| Affiliated issuers | 1,522,282 | |
| Total net realized gain (loss) | 89,710,064 | |
| Change in net unrealized appreciation (depreciation) on: | ||
| Investment securities: | ||
| Unaffiliated issuers | 249,937,348 | |
| Fidelity Central Funds | 4,660,352 | |
| Other affiliated issuers | 344,660,385 | |
| Futures contracts | (678,449) | |
| Swaps | (227,009) | |
| Written options | (12,460) | |
| Delayed delivery commitments | (4,111,210) | |
| Total change in net unrealized appreciation (depreciation) | 594,228,957 | |
| Net gain (loss) | 683,939,021 | |
| Net increase (decrease) in net assets resulting from operations | $960,199,806 |
See accompanying notes which are an integral part of the financial statements.
Statement of Changes in Net Assets
| For the period October 16, 2018 (commencement of operations) to May 31, 2019 |
|
| Increase (Decrease) in Net Assets | |
| Operations | |
| Net investment income (loss) | $276,260,785 |
| Net realized gain (loss) | 89,710,064 |
| Change in net unrealized appreciation (depreciation) | 594,228,957 |
| Net increase (decrease) in net assets resulting from operations | 960,199,806 |
| Distributions to shareholders | (256,473,495) |
| Total distributions | (256,473,495) |
| Share transactions | |
| Proceeds from sales of shares | 17,598,568,820 |
| Reinvestment of distributions | 246,045,283 |
| Cost of shares redeemed | (1,595,083,704) |
| Net increase (decrease) in net assets resulting from share transactions | 16,249,530,399 |
| Total increase (decrease) in net assets | 16,953,256,710 |
| Net Assets | |
| Beginning of period | – |
| End of period | $16,953,256,710 |
| Other Information | |
| Shares | |
| Sold | 1,753,157,417 |
| Issued in reinvestment of distributions | 24,075,678 |
| Redeemed | (157,487,649) |
| Net increase (decrease) | 1,619,745,446 |
See accompanying notes which are an integral part of the financial statements.
Financial Highlights
Strategic Advisers Fidelity Core Income Fund
| Years ended May 31, | 2019 A |
| Selected Per–Share Data | |
| Net asset value, beginning of period | $10.00 |
| Income from Investment Operations | |
| Net investment income (loss)B | .209 |
| Net realized and unrealized gain (loss) | .445 |
| Total from investment operations | .654 |
| Distributions from net investment income | (.182) |
| Distributions from net realized gain | (.002) |
| Total distributions | (.184) |
| Net asset value, end of period | $10.47 |
| Total ReturnC,D | 6.60% |
| Ratios to Average Net AssetsE,F | |
| Expenses before reductions | .37%G |
| Expenses net of fee waivers, if any | .12%G |
| Expenses net of all reductions | .12%G |
| Net investment income (loss) | 3.30%G |
| Supplemental Data | |
| Net assets, end of period (000 omitted) | $16,953,257 |
| Portfolio turnover rateH | 124%G,I |
A For the period October 16, 2018 (commencement of operations) to May 31, 2019.
B Calculated based on average shares outstanding during the period.
C Total returns for periods of less than one year are not annualized.
D Total returns would have been lower if certain expenses had not been reduced during the applicable periods shown.
E Fees and expenses of any underlying Fidelity Central Funds are not included in the Fund's expense ratio. The Fund indirectly bears its proportionate share of the expenses of any underlying Fidelity Central Funds. Based on their most recent shareholder report date, the expense of any underlying non-money market Fidelity Central Funds ranged from less than .005% to .01%.
F Expense ratios reflect operating expenses of the Fund. Expenses before reductions do not reflect amounts reimbursed by the investment adviser or reductions from expense offset arrangements and do not represent the amount paid by the Fund during periods when reimbursements or reductions occur. Expense ratios before reductions for start-up periods may not be representative of longer term operating periods. Expenses net of fee waivers reflect expenses after reimbursement by the investment adviser but prior to reductions from expense offset arrangements. Expenses net of all reductions represent the net expenses paid by the Fund. Fees and expenses of the Underlying Funds are not included in the Fund's annualized ratios. The Fund indirectly bears its proportionate share of the expenses of the Underlying Funds.
G Annualized
H Amount does not include the portfolio activity of any Underlying Funds.
I Portfolio turnover rate excludes securities received or delivered in-kind.
See accompanying notes which are an integral part of the financial statements.
Notes to Financial Statements
For the period ended May 31, 2019
1. Organization.
Strategic Advisers Fidelity Core Income Fund (the Fund) is a fund of Fidelity Rutland Square Trust II (the Trust), and is authorized to issue an unlimited number of shares. The Trust is registered under the Investment Company Act of 1940, as amended (the 1940 Act), as an open-end management investment company organized as a Delaware statutory trust. The Fund is offered exclusively to certain clients of Strategic Advisers LLC (Strategic Advisers), an affiliate of Fidelity Management & Research Company (FMR).
2. Significant Accounting Policies.
The Fund is an investment company and applies the accounting and reporting guidance of the Financial Accounting Standards Board (FASB) Accounting Standards Codification Topic 946 Financial Services – Investments Companies. The financial statements have been prepared in conformity with accounting principles generally accepted in the United States of America (GAAP), which require management to make certain estimates and assumptions at the date of the financial statements. Actual results could differ from those estimates. Subsequent events, if any, through the date that the financial statements were issued have been evaluated in the preparation of the financial statements. The following summarizes the significant accounting policies of the Fund:
Investment Valuation. Investments are valued as of 4:00 p.m. Eastern time on the last calendar day of the period. The Board of Trustees (the Board) has delegated the day to day responsibility for the valuation of the Fund's investments to the Fair Value Committee (the Committee) established by the Fund's investment adviser. In accordance with valuation policies and procedures approved by the Board, the Fund attempts to obtain prices from one or more third party pricing vendors or brokers to value its investments. When current market prices, quotations or currency exchange rates are not readily available or reliable, investments will be fair valued in good faith by the Committee, in accordance with procedures adopted by the Board. Factors used in determining fair value vary by investment type and may include market or investment specific events, changes in interest rates and credit quality. The frequency with which these procedures are used cannot be predicted and they may be utilized to a significant extent. The Committee oversees the Fund's valuation policies and procedures and reports to the Board on the Committee's activities and fair value determinations. The Board monitors the appropriateness of the procedures used in valuing the Fund's investments and ratifies the fair value determinations of the Committee.
The Fund categorizes the inputs to valuation techniques used to value its investments into a disclosure hierarchy consisting of three levels as shown below:
- Level 1 – quoted prices in active markets for identical investments
- Level 2 – other significant observable inputs (including quoted prices for similar investments, interest rates, prepayment speeds, etc.)
- Level 3 – unobservable inputs (including the Fund's own assumptions based on the best information available)
Valuation techniques used to value the Fund's investments by major category are as follows:
Debt securities, including restricted securities, are valued based on evaluated prices received from third party pricing vendors or from brokers who make markets in such securities. Corporate bonds, bank notes, municipal securities, preferred securities, and U.S. government and government agency obligations are valued by pricing vendors who utilize matrix pricing which considers yield or price of bonds of comparable quality, coupon, maturity and type or by broker-supplied prices. Asset backed securities, collateralized mortgage obligations, commercial mortgage securities, and U.S. government agency mortgage securities are valued by pricing vendors who utilize matrix pricing which considers prepayment speed assumptions, attributes of the collateral, yield or price of bonds of comparable quality, coupon, maturity and type or by broker-supplied prices. Swaps are marked-to-market daily based on valuations from third party pricing vendors, registered derivatives clearing organizations (clearinghouses) or broker-supplied valuations. These pricing sources may utilize inputs such as interest rate curves, credit spread curves, default possibilities and recovery rates. When independent prices are unavailable or unreliable, debt securities and swaps may be valued utilizing pricing methodologies which consider similar factors that would be used by third party pricing vendors. Debt securities and swaps are generally categorized as Level 2 in the hierarchy but may be Level 3 depending on the circumstances.
Futures contracts are valued at the settlement price established each day by the board of trade or exchange on which they are traded and are categorized as Level 1 in the hierarchy. Options traded over-the-counter are valued using vendor or broker-supplied valuations and are categorized as Level 2 in the hierarchy. Investments in open-end mutual funds, including the Fidelity Central Funds, are valued at their closing net asset value (NAV) each business day and are categorized as Level 1 in the hierarchy.
Changes in valuation techniques may result in transfers in or out of an assigned level within the disclosure hierarchy. The aggregate value of investments by input level as of May 31, 2019 is included at the end of the Fund's Schedule of Investments.
Investment Transactions and Income. For financial reporting purposes, the Fund's investment holdings and NAV include trades executed through the end of the last business day of the period. The NAV per share for processing shareholder transactions is calculated as of the close of business of the New York Stock Exchange (NYSE), normally 4:00 p.m. Eastern time and includes trades executed through the end of the prior business day. Gains and losses on securities sold are determined on the basis of identified cost. Dividend income is recorded on the ex-dividend date. Income and capital gain distributions from Fidelity Central Funds, if any, are recorded on the ex-dividend date. Income and capital gain distributions from Underlying Funds, if any, are recorded on the ex-dividend date. Interest income is accrued as earned and includes coupon interest and amortization of premium and accretion of discount on debt securities as applicable. Debt obligations may be placed on non-accrual status and related interest income may be reduced by ceasing current accruals and writing off interest receivables when the collection of all or a portion of interest has become doubtful based on consistently applied procedures. A debt obligation is removed from non-accrual status when the issuer resumes interest payments or when collectability of interest is reasonably assured.
Expenses. Expenses directly attributable to a fund are charged to that fund. Expenses attributable to more than one fund are allocated among the respective funds on the basis of relative net assets or other appropriate methods. Expense estimates are accrued in the period to which they relate and adjustments are made when actual amounts are known.
Deferred Trustee Compensation. Under a Deferred Compensation Plan (the Plan), certain independent Trustees have elected to defer receipt of a portion of their annual compensation. Deferred amounts are invested in a cross-section of Strategic Advisers funds, are marked-to-market and remain in the Fund until distributed in accordance with the Plan. The investment of deferred amounts and the offsetting payable to the Trustees of $1,910 are included in the accompanying Statement of Assets and Liabilities in other receivables and other payables and accrued expenses, respectively.
Income Tax Information and Distributions to Shareholders. Each year, the Fund intends to qualify as a regulated investment company under Subchapter M of the Internal Revenue Code, including distributing substantially all of its taxable income and realized gains. As a result, no provision for U.S. Federal income taxes is required. As of May 31, 2019, the Fund did not have any unrecognized tax benefits in the financial statements; nor is the Fund aware of any tax positions for which it is reasonably possible that the total amounts of unrecognized tax benefits will significantly change in the next twelve months. The Fund files a U.S. federal tax return, in addition to state and local tax returns as required. The Fund's federal income tax returns are subject to examination by the Internal Revenue Service (IRS) for a period of three fiscal years after they are filed. State and local tax returns may be subject to examination for an additional fiscal year depending on the jurisdiction.
Distributions are declared and recorded daily and paid monthly from net investment income. Distributions from realized gains, if any, are declared and recorded on the ex-dividend date. Income and capital gain distributions are determined in accordance with income tax regulations, which may differ from GAAP. In addition, the Fund claimed a portion of the payment made to redeeming shareholders as a distribution for income tax purposes.
Capital accounts within the financial statements are adjusted for permanent book-tax differences. These adjustments have no impact on net assets or the results of operations. Capital accounts are not adjusted for temporary book-tax differences which will reverse in a subsequent period.
Book-tax differences are primarily due to short-term gain distributions from the Underlying Funds, swaps, futures and options transactions, market discount, deferred trustees compensation and losses deferred due to wash sales and futures transactions.
As of period end, the cost and unrealized appreciation (depreciation) in securities, and derivatives if applicable, for federal income tax purposes were as follows:
| Gross unrealized appreciation | $613,184,648 |
| Gross unrealized depreciation | (12,812,039) |
| Net unrealized appreciation (depreciation) | $600,372,609 |
| Tax Cost | $17,302,314,003 |
The tax-based components of distributable earnings as of period end were as follows:
| Undistributed ordinary income | $103,570,264 |
| Net unrealized appreciation (depreciation) on securities and other investments | $597,574,257 |
The tax character of distributions paid was as follows:
| May 31, 2019(a) | |
| Ordinary Income | $256,473,495 |
(a) For the period October 16, 2018 (commencement of operations) to May 31, 2019.
Delayed Delivery Transactions and When-Issued Securities. During the period, the Fund transacted in securities on a delayed delivery or when-issued basis. Payment and delivery may take place after the customary settlement period for that security. The price of the underlying securities and the date when the securities will be delivered and paid for are fixed at the time the transaction is negotiated. The securities purchased on a delayed delivery or when-issued basis are identified as such in the Fund's Schedule of Investments. The Fund may receive compensation for interest forgone in the purchase of a delayed delivery or when-issued security. With respect to purchase commitments, the Fund identifies securities as segregated in its records with a value at least equal to the amount of the commitment. Losses may arise due to changes in the value of the underlying securities or if the counterparty does not perform under the contract's terms, or if the issuer does not issue the securities due to political, economic, or other factors.
To-Be-Announced (TBA) Securities and Mortgage Dollar Rolls. During the period, the Fund transacted in TBA securities that involved buying or selling mortgage-backed securities (MBS) on a forward commitment basis. A TBA transaction typically does not designate the actual security to be delivered and only includes an approximate principal amount; however delivered securities must meet specified terms defined by industry guidelines, including issuer, rate and current principal amount outstanding on underlying mortgage pools. The Fund may enter into a TBA transaction with the intent to take possession of or deliver the underlying MBS, or the Fund may elect to extend the settlement by entering into either a mortgage or reverse mortgage dollar roll. Mortgage dollar rolls are transactions where a fund sells TBA securities and simultaneously agrees to repurchase MBS on a later date at a lower price and with the same counterparty. Reverse mortgage dollar rolls involve the purchase and simultaneous agreement to sell TBA securities on a later date at a lower price. Transactions in mortgage dollar rolls and reverse mortgage dollar rolls are accounted for as purchases and sales and may result in an increase to the Fund's portfolio turnover rate.
Purchases and sales of TBA securities involve risks similar to those discussed above for delayed delivery and when-issued securities. Also, if the counterparty in a mortgage dollar roll or a reverse mortgage dollar roll transaction files for bankruptcy or becomes insolvent, the Fund's right to repurchase or sell securities may be limited. Additionally, when a fund sells TBA securities without already owning or having the right to obtain the deliverable securities (an uncovered forward commitment to sell), it incurs a risk of loss because it could have to purchase the securities at a price that is higher than the price at which it sold them. A fund may be unable to purchase the deliverable securities if the corresponding market is illiquid.
TBA securities subject to a forward commitment to sell at period end are included at the end of the Fund's Schedule of Investments under the caption "TBA Sale Commitments." The proceeds and value of these commitments are reflected in the Fund's Statement of Assets and Liabilities as Receivable for TBA sale commitments and TBA sale commitments, at value, respectively.
Restricted Securities. The Fund may invest in securities that are subject to legal or contractual restrictions on resale. These securities generally may be resold in transactions exempt from registration or to the public if the securities are registered. Disposal of these securities may involve time-consuming negotiations and expense, and prompt sale at an acceptable price may be difficult. Information regarding restricted securities is included at the end of the Fund's Schedule of Investments.
3. Derivative Instruments.
Risk Exposures and the Use of Derivative Instruments. The Fund's investment objective allows the Fund to enter into various types of derivative contracts, including futures contracts, options, and swaps. Derivatives are investments whose value is primarily derived from underlying assets, indices or reference rates and may be transacted on an exchange or over-the-counter (OTC). Derivatives may involve a future commitment to buy or sell a specified asset based on specified terms, to exchange future cash flows at periodic intervals based on a notional principal amount, or for one party to make one or more payments upon the occurrence of specified events in exchange for periodic payments from the other party.
The Fund used derivatives to increase returns, to gain exposure to certain types of assets, and to manage exposure to certain risks as defined below. The success of any strategy involving derivatives depends on analysis of numerous economic factors, and if the strategies for investment do not work as intended, the Fund may not achieve its objectives.
The Fund's use of derivatives increased or decreased its exposure to the following risks:
| Credit Risk | Credit risk relates to the ability of the issuer of a financial instrument to make further principal or interest payments on an obligation or commitment that it has to the Fund. |
| Interest Rate Risk | Interest rate risk relates to the fluctuations in the value of interest-bearing securities due to changes in the prevailing levels of market interest rates. |
The Fund is also exposed to additional risks from investing in derivatives, such as liquidity risk and counterparty credit risk. Liquidity risk is the risk that the Fund will be unable to close out the derivative in the open market in a timely manner. Counterparty credit risk is the risk that the counterparty will not be able to fulfill its obligation to the Fund. Derivative counterparty credit risk is managed through formal evaluation of the creditworthiness of all potential counterparties. On certain OTC derivatives such as options and bi-lateral swaps, the Fund attempts to reduce its exposure to counterparty credit risk by entering into an International Swaps and Derivatives Association, Inc. (ISDA) Master Agreement with each of its counterparties. The ISDA Master Agreement gives the Fund the right to terminate all transactions traded under such agreement upon the deterioration in the credit quality of the counterparty beyond specified levels. The ISDA Master Agreement gives each party the right, upon an event of default by the other party or a termination of the agreement, to close out all transactions traded under such agreement and to net amounts owed under each transaction to one net payable by one party to the other. To mitigate counterparty credit risk on bi-lateral OTC derivatives, the Fund receives collateral in the form of cash or securities once the Fund's net unrealized appreciation on outstanding derivative contracts under an ISDA Master Agreement exceeds certain applicable thresholds, subject to certain minimum transfer provisions. The collateral received is held in segregated accounts with the Fund's custodian bank in accordance with the collateral agreements entered into between the Fund, the counterparty and the Fund's custodian bank. The Fund could experience delays and costs in gaining access to the collateral even though it is held by the Fund's custodian bank. The Fund's maximum risk of loss from counterparty credit risk related to bi-lateral OTC derivatives is generally the aggregate unrealized appreciation and unpaid counterparty payments in excess of any collateral pledged by the counterparty to the Fund. For OTC written options with upfront premiums received, the Fund is obligated to perform and therefore does not have counterparty risk. For OTC written options with premiums to be received at a future date, the maximum risk of loss from counterparty credit risk is the amount of the premium in excess of any collateral pledged by the counterparty. The Fund may be required to pledge collateral for the benefit of the counterparties on bi-lateral OTC derivatives in an amount not less than each counterparty's unrealized appreciation on outstanding derivative contracts, subject to certain minimum transfer provisions, and any such pledged collateral is identified in the Schedule of Investments. Exchange-traded futures contracts are not covered by the ISDA Master Agreement; however counterparty credit risk related to exchange-traded futures contracts may be mitigated by the protection provided by the exchange on which they trade. Counterparty credit risk related to centrally cleared OTC swaps may be mitigated by the protection provided by the clearinghouse.
Investing in derivatives may involve greater risks than investing in the underlying assets directly and, to varying degrees, may involve risk of loss in excess of any initial investment and collateral received and amounts recognized in the Statement of Assets and Liabilities. In addition, there may be the risk that the change in value of the derivative contract does not correspond to the change in value of the underlying instrument.
Net Realized Gain (Loss) and Change in Net Unrealized Appreciation (Depreciation) on Derivatives. The table below, which reflects the impacts of derivatives on the financial performance of the Fund, summarizes the net realized gain (loss) and change in net unrealized appreciation (depreciation) for derivatives during the period as presented in the Statement of Operations.
| Primary Risk Exposure / Derivative Type | Net Realized Gain (Loss) | Change in Net Unrealized Appreciation (Depreciation) |
| Credit Risk | ||
| Swaps | $(13,715) | $(5,848) |
| Total Credit Risk | $(13,715) | $(5,848) |
| Interest Rate Risk | ||
| Futures Contracts | $(2,538,858) | $(678,449) |
| Purchased Options | (110,281) | 853,075 |
| Written Options | 5,981 | (12,460) |
| Swaps | 78,191 | (221,161) |
| Total Interest Rate Risk | (2,564,967) | (58,995) |
| Totals | $(2,578,682) | $(64,843) |
A summary of the value of derivatives by primary risk exposure as of period end is included at the end of the Schedule of Investments.
Futures Contracts. A futures contract is an agreement between two parties to buy or sell a specified underlying instrument for a fixed price at a specified future date. The Fund used futures contracts to manage its exposure to the bond market and fluctuations in interest rates.
Upon entering into a futures contract, a fund is required to deposit either cash or securities (initial margin) with a clearing broker in an amount equal to a certain percentage of the face value of the contract. Futures contracts are marked-to-market daily and subsequent daily payments (variation margin) are made or received by a fund depending on the daily fluctuations in the value of the futures contracts and are recorded as unrealized appreciation or (depreciation). This receivable and/or payable, if any, is included in daily variation margin on futures contracts in the Statement of Assets and Liabilities. Realized gain or (loss) is recorded upon the expiration or closing of a futures contract. The net realized gain (loss) and change in net unrealized appreciation (depreciation) on futures contracts during the period is presented in the Statement of Operations.
Any open futures contracts at period end are presented in the Schedule of Investments under the caption "Futures Contracts". The notional amount at value reflects each contract's exposure to the underlying instrument or index at period end and is representative of volume of activity during the period. Securities deposited to meet initial margin requirements are identified in the Schedule of Investments.
Options. Options give the purchaser the right, but not the obligation, to buy (call) or sell (put) an underlying security or financial instrument at an agreed exercise or strike price between or on certain dates. Options obligate the seller (writer) to buy (put) or sell (call) an underlying instrument at the exercise or strike price or cash settle an underlying derivative instrument if the holder exercises the option on or before the expiration date. The Fund uses OTC options, such as swaptions, which are options where the underlying instrument is a swap, to manage its exposure to fluctuations in interest rates and potential credit events.
Upon entering into an options contract, a fund will pay or receive a premium. Premiums paid on purchased options are reflected as cost of investments and premiums received on written options are reflected as a liability on the Statement of Assets and Liabilities. Certain options may be purchased or written with premiums to be paid or received on a future date. Options are valued daily and any unrealized appreciation (depreciation) is reflected on the Statement of Assets and Liabilities. When an option is exercised, the cost or proceeds of the underlying instrument purchased or sold is adjusted by the amount of the premium. When an option is closed the Fund will realize a gain or loss depending on whether the proceeds or amount paid for the closing sale transaction is greater or less than the premium received or paid. When an option expires, gains and losses are realized to the extent of premiums received and paid, respectively. The net realized and unrealized gains (losses) on purchased options are included in the Statement of Operations in net realized gain (loss) and change in net unrealized appreciation (depreciation) on investment securities. The net realized gain (loss) and change in net unrealized appreciation (depreciation) on written options are presented in the Statement of Operations.
Any open options at period end are presented in the Schedule of Investments under the captions "Purchased Options," "Purchased Swaptions," "Written Options" and "Written Swaptions," as applicable, and are representative of volume of activity during the period.
Writing puts and buying calls tend to increase exposure to the underlying instrument while buying puts and writing calls tend to decrease exposure to the underlying instrument. For purchased options, risk of loss is limited to the premium paid, and for written options, risk of loss is the change in value in excess of the premium received.
Swaps. A swap is a contract between two parties to exchange future cash flows at periodic intervals based on a notional principal amount. A bi-lateral OTC swap is a transaction between a fund and a dealer counterparty where cash flows are exchanged between the two parties for the life of the swap. A centrally cleared OTC swap is a transaction executed between a fund and a dealer counterparty, then cleared by a futures commission merchant (FCM) through a clearinghouse. Once cleared, the clearinghouse serves as a central counterparty, with whom a fund exchanges cash flows for the life of the transaction, similar to transactions in futures contracts.
Bi-lateral OTC swaps are marked-to-market daily and changes in value are reflected in the Statement of Assets and Liabilities in the bi-lateral OTC swaps at value line items. Any upfront premiums paid or received upon entering a bi-lateral OTC swap to compensate for differences between stated terms of the swap and prevailing market conditions (e.g. credit spreads, interest rates or other factors) are recorded in net unrealized appreciation (depreciation) in the Statement of Assets and Liabilities and amortized to realized gain or (loss) ratably over the term of the swap. Any unamortized upfront premiums are presented in the Schedule of Investments.
Centrally cleared OTC swaps require a fund to deposit either cash or securities (initial margin) with the FCM, at the instruction of and for the benefit of the clearinghouse. Securities deposited to meet initial margin requirements are identified in the Schedule of Investments. Centrally cleared OTC swaps are marked-to-market daily and subsequent payments (variation margin) are made or received depending on the daily fluctuations in the value of the swaps and are recorded as unrealized appreciation or (depreciation). These daily payments, if any, are included in receivable or payable for daily variation margin on centrally cleared OTC swaps in the Statement of Assets and Liabilities. Any premiums for centrally cleared OTC swaps are recorded periodically throughout the term of the swap to variation margin and included in unrealized appreciation (depreciation) in the Statement of Assets and Liabilities. Any premiums are recognized as realized gain (loss) upon termination or maturity of the swap.
For both bi-lateral and centrally cleared OTC swaps, payments are exchanged at specified intervals, accrued daily commencing with the effective date of the contract and recorded as realized gain or (loss). Some swaps may be terminated prior to the effective date and realize a gain or loss upon termination. The net realized gain (loss) and change in net unrealized appreciation (depreciation) on swaps during the period is presented in the Statement of Operations.
Any open swaps at period end are included in the Schedule of Investments under the caption "Swaps" and are representative of volume of activity during the period.
Credit Default Swaps. Credit default swaps enable the Fund to buy or sell protection against specified credit events on a single-name issuer or a traded credit index. Under the terms of a credit default swap the buyer of protection (buyer) receives credit protection in exchange for making periodic payments to the seller of protection (seller) based on a fixed percentage applied to a notional principal amount. In return for these payments, the seller will be required to make a payment upon the occurrence of one or more specified credit events. The Fund enters into credit default swaps as a seller to gain credit exposure to an issuer and/or as a buyer to obtain a measure of protection against defaults of an issuer. Periodic payments are made over the life of the contract by the buyer provided that no credit event occurs.
For credit default swaps on most corporate and sovereign issuers, credit events include bankruptcy, failure to pay or repudiation/moratorium. For credit default swaps on corporate or sovereign issuers, the obligation that may be put to the seller is not limited to the specific reference obligation described in the Schedule of Investments. For credit default swaps on asset-backed securities, a credit event may be triggered by events such as failure to pay principal, maturity extension, rating downgrade or write-down. For credit default swaps on asset-backed securities, the reference obligation described represents the security that may be put to the seller. For credit default swaps on a traded credit index, a specified credit event may affect all or individual underlying securities included in the index.
As a seller, if an underlying credit event occurs, the Fund will pay a net settlement amount of cash equal to the notional amount of the swap less the recovery value of the reference obligation or underlying securities comprising an index. Only in the event of the industry's inability to value the underlying asset will the Fund be required to take delivery of the reference obligation or underlying securities comprising an index and pay an amount equal to the notional amount of the swap.
As a buyer, if an underlying credit event occurs, the Fund will receive a net settlement amount of cash equal to the notional amount of the swap less the recovery value of the reference obligation or underlying securities comprising an index. Only in the event of the industry's inability to value the underlying asset will the Fund be required to deliver the reference obligation or underlying securities comprising an index in exchange for payment of an amount equal to the notional amount of the swap.
Typically, the value of each credit default swap and credit rating disclosed for each reference obligation in the Schedule of Investments, where the Fund is the seller, can be used as measures of the current payment/performance risk of the swap. As the value of the swap changes as a positive or negative percentage of the total notional amount, the payment/performance risk may decrease or increase, respectively. In addition to these measures, the investment adviser monitors a variety of factors including cash flow assumptions, market activity and market sentiment as part of its ongoing process of assessing payment/performance risk.
Interest Rate Swaps. Interest rate swaps are agreements between counterparties to exchange cash flows, one based on a fixed rate, and the other on a floating rate. The Fund entered into interest rate swaps to manage its exposure to interest rate changes. Changes in interest rates can have an effect on both the value of bond holdings as well as the amount of interest income earned. In general, the value of bonds can fall when interest rates rise and can rise when interest rates fall.
4. Purchases and Sales of Investments.
Purchases and sales of securities (including the Underlying Fund shares), other than short-term securities, certain in-kind transactions, and U.S. government securities, aggregated $11,111,600,121 and $2,758,461,997, respectively.
Unaffiliated Exchanges In-Kind. During the period, the Fund received investments, including accrued interest, and cash valued at $11,732,065,150 in exchange for 1,175,557,630 shares of the Fund. The amount of in-kind exchanges is included in share transactions in the accompanying Statement of Changes in Net Assets.
5. Fees and Other Transactions with Affiliates.
Management Fee. Strategic Advisers (the investment adviser) provides the Fund with investment management related services. For these services, the Fund pays a monthly management fee to the investment adviser. The management fee is calculated by adding the annual management fee rate of .25% of the Fund's average net assets throughout the month payable to the investment adviser to the aggregate of the fee rates, payable monthly, to the Fund's sub-advisers. The Fund's maximum aggregate management fee will not exceed .60% of the Fund's average net assets. For the reporting period, the total annualized management fee rate was .31% of the Fund's average net assets.
During the period, the investment adviser waived its management fee as described in the Expense Reductions note.
Sub-Adviser. FIAM LLC (an affiliate of the investment adviser) served as a sub-adviser for the Fund during the period. Sub-advisers provide discretionary investment advisory services for their allocated portion of the Fund's assets and are paid by the investment adviser and not the Fund for providing these services.
Accounting Fees. Fidelity Service Company, Inc. (FSC), an affiliate of the investment adviser, maintains the Fund's accounting records. The fee is based on the level of average net assets for each month. For the period, the fees were equivalent to an annualized rate of .01%.
During June 2019, the Board approved that effective July 1, 2019 accounting fees will not be paid by the Fund and will instead be paid by the investment adviser or an affiliate.
Interfund Trades. The Fund may purchase from or sell securities to other funds affiliated with each sub-adviser under procedures adopted by the Board. The procedures have been designed to ensure these interfund trades are executed in accordance with Rule 17a-7 of the 1940 Act. Interfund trades are included within the respective purchases and sales amounts shown in the Purchases and Sales of Investments note.
Affiliated Exchanges In-Kind. During the period, the Fund completed an exchange in-kind with Fidelity SAI Total Bond Fund. The Fund delivered investments, including accrued interest, and cash valued at $5,539,897,218 in exchange for 553,989,722 shares of the Fidelity SAI Total Bond Fund. The Fund generally did not recognize gain or loss for federal income tax purposes.
Reallocation of Underlying Fund Investments. During the period, the investment adviser reallocated investments of the Fund. This involved a taxable redemption of the Fund's interest in Fidelity Mortgage Backed Securities Central Fund. The Fund redeemed 13,696,583 shares of Fidelity Mortgage Backed Securities Central Fund in exchange for investments and cash with a value of $1,470,054,216. The net realized gains of $44,157,751 on the Fund's redemptions of Fidelity Mortgage Backed Securities Central Fund shares is included in "Net realized gain (loss) on Investment securities: Other affiliated issuers" in the accompanying Statement of Operations. The Fund recognized net gains on the exchanges for federal income tax purposes.
6. Investments in Fidelity Central Funds.
The Fund invests in Fidelity Central Funds, which are open-end investment companies available only to other investment companies and accounts managed by the investment adviser and its affiliates. The Fund's Schedule of Investments lists each of the Fidelity Central Funds held as of period end, if any, as an investment of the Fund, but does not include the underlying holdings of each Fidelity Central Fund. As an Investing Fund, the Fund indirectly bears its proportionate share of the expenses of the underlying Fidelity Central Funds.
Based on their investment objective, each Fidelity Central Fund may invest or participate in various investment vehicles or strategies that are similar to those of the Fund. These strategies are consistent with the investment objectives of the Fund and may involve certain economic risks which may cause a decline in value of each of the Fidelity Central Funds and thus a decline in the value of each Fund.
| Fidelity Central Fund | Investment Manager | Investment Objective | Investment Practices | Expense Ratio |
| Fidelity Mortgage Backed Securities Central Fund | Fidelity Investment Money Management, Inc. (FIMM) | Seeks a high level of income by normally investing in investment-grade mortgage-related securities and repurchase agreements for those securities. | Delayed Delivery & When Issued Securities Futures Options Restricted Securities Swaps | Less than .005% |
| Fidelity Specialized High Income Central Fund | FMR Co., Inc (FMRC) | Seeks a high level of current income by normally investing in income-producing debt securities, with an emphasis on lower-quality debt securities. | Delayed Delivery & When Issued Securities Loans & Direct Debt Instruments Restricted Securities | Less than .005% |
| Fidelity Money Market Central Funds | FIMM | Each fund seeks to obtain a high level of current income consistent with the preservation of capital and liquidity. | Short-term Investments | Ranged from less than .005% to .01% |
An unaudited holdings listing for the Fund, which presents direct holdings as well as the pro-rata share of any securities and other investments held indirectly through its investment in underlying non-money market Fidelity Central Funds, is available at fidelity.com. A complete unaudited list of holdings for each Fidelity Central Fund is available upon request or at the Securities and Exchange Commission (the SEC) website at www.sec.gov. In addition, the financial statements of the Fidelity Central Funds, which are not covered by the Fund's Report of Independent Registered Public Accounting Firm, are available on the SEC website or upon request.
7. Committed Line of Credit.
The Fund participates with other funds managed by the investment adviser or an affiliate in a $4.25 billion credit facility (the "line of credit") to be utilized for temporary or emergency purposes to fund shareholder redemptions or for other short-term liquidity purposes. The Fund has agreed to pay commitment fees on its pro-rata portion of the line of credit, which amounted to $3,022 and is reflected in Miscellaneous expenses on the Statement of Operations. During the period, the Fund did not borrow on this line of credit.
8. Expense Reductions.
The investment adviser has contractually agreed to waive the Fund's management fee in an amount equal to .25% of the Fund's average net assets until September 30, 2022. During the period, this waiver reduced the Fund's management fee by $ 21,114,477.
9. Other.
The Fund's organizational documents provide former and current trustees and officers with a limited indemnification against liabilities arising in connection with the performance of their duties to the Fund. In the normal course of business, the Fund may also enter into contracts that provide general indemnifications. The Fund's maximum exposure under these arrangements is unknown as this would be dependent on future claims that may be made against the Fund. The risk of material loss from such claims is considered remote.
The Fund does not invest in the Underlying Funds for the purpose of exercising management or control; however, investments by the Fund within its principal investment strategies may represent a significant portion of an Underlying Fund's net assets. At the end of the period, the Fund was the owner of record of 10% or more of the total outstanding shares of the following Underlying Funds.
| Fund | % of shares held |
| Fidelity Specialized High Income Central Fund | 28% |
| Fidelity SAI U.S. Treasury Bond Index Fund | 31% |
| Fidelity SAI Total Bond Fund | 50% |
Report of Independent Registered Public Accounting Firm
To the Board of Trustees of Fidelity Rutland Square Trust II and Shareholders of Strategic Advisers Fidelity Core Income Fund:
Opinion on the Financial Statements
We have audited the accompanying statement of assets and liabilities, including the schedule of investments, of Strategic Advisers Fidelity Core Income Fund (one of the funds constituting Fidelity Rutland Square Trust II, referred to hereafter as the “Fund”) as of May 31, 2019, and the related statements of operations and changes in net assets, including the related notes, and the financial highlights for the period October 16, 2018 (commencement of operations) through May 31, 2019 (collectively referred to as the “financial statements”). In our opinion, the financial statements present fairly, in all material respects, the financial position of the Fund as of May 31, 2019, and the results of its operations, changes in its net assets, and the financial highlights for the period October 16, 2018 (commencement of operations) through May 31, 2019 in conformity with accounting principles generally accepted in the United States of America.
Basis for Opinion
These financial statements are the responsibility of the Fund’s management. Our responsibility is to express an opinion on the Fund’s financial statements based on our audit. We are a public accounting firm registered with the Public Company Accounting Oversight Board (United States) (PCAOB) and are required to be independent with respect to the Fund in accordance with the U.S. federal securities laws and the applicable rules and regulations of the Securities and Exchange Commission and the PCAOB.
We conducted our audit of these financial statements in accordance with the standards of the PCAOB. Those standards require that we plan and perform the audit to obtain reasonable assurance about whether the financial statements are free of material misstatement, whether due to error or fraud.
Our audit included performing procedures to assess the risks of material misstatement of the financial statements, whether due to error or fraud, and performing procedures that respond to those risks. Such procedures included examining, on a test basis, evidence regarding the amounts and disclosures in the financial statements. Our audit also included evaluating the accounting principles used and significant estimates made by management, as well as evaluating the overall presentation of the financial statements. Our procedures included confirmation of securities owned as of May 31, 2019 by correspondence with the custodian and brokers; when replies were not received from brokers, we performed other auditing procedures. We believe that our audit provides a reasonable basis for our opinion.
PricewaterhouseCoopers LLP
Boston, Massachusetts
July 19, 2019
We have served as the auditor of one or more investment companies in the Fidelity group of funds since 1932.
Trustees and Officers
The Trustees, Members of the Advisory Board (if any), and officers of the trust and fund, as applicable, are listed below. The Board of Trustees governs the fund and is responsible for protecting the interests of shareholders. The Trustees are experienced executives who meet periodically throughout the year to oversee the fund's activities, review contractual arrangements with companies that provide services to the fund, oversee management of the risks associated with such activities and contractual arrangements, and review the fund's performance. If the interests of the fund and an underlying Fidelity® fund were to diverge, a conflict of interest could arise and affect how the Trustees and Members of the Advisory Board fulfill their fiduciary duties to the affected funds. Strategic Advisers has structured the fund to avoid these potential conflicts, although there may be situations where a conflict of interest is unavoidable. In such instances, Strategic Advisers, the Trustees, and Members of the Advisory Board would take reasonable steps to minimize and, if possible, eliminate the conflict. Each of the Trustees oversees 14 funds.
The Trustees hold office without limit in time except that (a) any Trustee may resign; (b) any Trustee may be removed by written instrument, signed by at least two-thirds of the number of Trustees prior to such removal; (c) any Trustee who requests to be retired or who has become incapacitated by illness or injury may be retired by written instrument signed by a majority of the other Trustees; and (d) any Trustee may be removed at any special meeting of shareholders by a two-thirds vote of the outstanding voting securities of the trust. Officers and Advisory Board Members hold office without limit in time, except that any officer or Advisory Board Member may resign or may be removed by a vote of a majority of the Trustees at any regular meeting or any special meeting of the Trustees. Except as indicated, each individual has held the office shown or other offices in the same company for the past five years.
Each Trustee who is not an interested person (as defined in the 1940 Act) of the trust and the fund is referred to herein as an Independent Trustee.
The fund’s Statement of Additional Information (SAI) includes more information about the Trustees. To request a free copy, call Fidelity at 1-800-544-3455.
Experience, Skills, Attributes, and Qualifications of the Trustees. The Governance and Nominating Committee has adopted a statement of policy that describes the experience, qualifications, attributes, and skills that are necessary and desirable for potential Independent Trustee candidates (Statement of Policy). The Board believes that each Trustee satisfied at the time he or she was initially elected or appointed a Trustee, and continues to satisfy, the standards contemplated by the Statement of Policy. The Governance and Nominating Committee may also engage professional search firms to help identify potential Independent Trustee candidates with experience, qualifications, attributes, and skills consistent with the Statement of Policy. Additional criteria based on the composition and skills of the current Independent Trustees, as well as experience or skills that may be appropriate in light of future changes to board composition, business conditions, and regulatory or other developments, may be considered by the professional search firms and the Governance and Nominating Committee. In addition, the Board takes into account the Trustees' commitment and participation in Board and committee meetings, as well as their leadership of standing and ad hoc committees throughout their tenure.
In determining that a particular Trustee was and continues to be qualified to serve as a Trustee, the Board has considered a variety of criteria, none of which, in isolation, was controlling. The Board believes that, collectively, the Trustees have balanced and diverse experience, qualifications, attributes, and skills, which allow the Board to operate effectively in governing the fund and protecting the interests of shareholders. Information about the specific experience, skills, attributes, and qualifications of each Trustee, which in each case led to the Board's conclusion that the Trustee should serve (or continue to serve) as a trustee of the fund, is provided below.
Board Structure and Oversight Function. Robert A. Lawrence is an interested person and currently serves as Chairman. The Trustees have determined that an interested Chairman is appropriate and benefits shareholders because an interested Chairman has a personal and professional stake in the quality and continuity of services provided to the fund. Independent Trustees exercise their informed business judgment to appoint an individual of their choosing to serve as Chairman, regardless of whether the Trustee happens to be independent or a member of management. The Independent Trustees have determined that they can act independently and effectively without having an Independent Trustee serve as Chairman and that a key structural component for assuring that they are in a position to do so is for the Independent Trustees to constitute a substantial majority for the Board. The Independent Trustees also regularly meet in executive session. Mary C. Farrell serves as the lead Independent Trustee and as such (i) acts as a liaison between the Independent Trustees and management with respect to matters important to the Independent Trustees and (ii) with management prepares agendas for Board meetings.
Fidelity® funds are overseen by different Boards of Trustees. The fund's Board oversees asset allocation funds. Other Boards oversee Fidelity's investment-grade bond, money market, and asset allocation funds, and Fidelity's equity and high income funds. The fund may invest in Fidelity® funds overseen by such other Boards. The use of separate Boards, each with its own committee structure, allows the Trustees of each group of Fidelity® funds to focus on the unique issues of the funds they oversee, including common research, investment, and operational issues.
The Trustees primarily operate as a full Board, but also operate in committees, to facilitate the timely and efficient consideration of all matters of importance to the Trustees, the fund, and fund shareholders and to facilitate compliance with legal and regulatory requirements and oversight of the fund's activities and associated risks. The Board has charged Strategic Advisers and its affiliates with (i) identifying events or circumstances the occurrence of which could have demonstrably adverse effects on the fund's business and/or reputation; (ii) implementing processes and controls to lessen the possibility that such events or circumstances occur or to mitigate the effects of such events or circumstances if they do occur; and (iii) creating and maintaining a system designed to evaluate continuously business and market conditions in order to facilitate the identification and implementation processes described in (i) and (ii) above. Because the day-to-day operations and activities of the fund are carried out by or through Strategic Advisers, its affiliates and other service providers, the fund's exposure to risks is mitigated but not eliminated by the processes overseen by the Trustees. Board oversight of different aspects of the fund's activities is exercised primarily through the full Board, but also through the Audit and Compliance Committee. Appropriate personnel, including but not limited to the fund's Chief Compliance Officer (CCO), FMR's internal auditor, the independent accountants, the fund's Treasurer and portfolio management personnel, make periodic reports to the Board's committees, as appropriate. The responsibilities of each standing committee, including their oversight responsibilities, are described further under "Standing Committees of the Trustees."
Interested Trustees*:
Correspondence intended for a Trustee who is an interested person may be sent to Fidelity Investments, 245 Summer Street, Boston, Massachusetts 02210.
Name, Year of Birth; Principal Occupations and Other Relevant Experience+
Brian B. Hogan (1964)
Year of Election or Appointment: 2018
Trustee
Mr. Hogan also serves as Trustee of other funds. Mr. Hogan serves as Head of Fidelity Investments’ Investment Solutions and Innovation organization (2018-present), a Director of Strategic Advisers LLC (2018-present), and a Director of Fidelity SelectCo, LLC (investment adviser firm, 2014-present). Previously, Mr. Hogan served as President of FMR Co., Inc. (2009-2018), a Vice President of Fidelity's Equity and High Income funds (2009-2018), a Director of FMR Investment Management (UK) Limited (investment adviser firm, 2015-2018), Trustee of certain Fidelity® funds (2014-2018), President of the Equity Division of FMR (investment adviser firm, 2009-2018), Senior Vice President, Equity Research of FMR (2006-2009), and as a portfolio manager. Mr. Brian B. Hogan is not related to Mr. Colm A. Hogan.
Robert A. Lawrence (1952)
Year of Election or Appointment: 2016
Trustee
Chairman of the Board of Trustees
Mr. Lawrence also serves as Trustee of other funds. Previously, Mr. Lawrence served as a Member of the Advisory Board of certain funds. Prior to his retirement in 2008, Mr. Lawrence served as Vice President of certain Fidelity® funds (2006-2008), Senior Vice President, Head of High Income Division of Fidelity Management & Research Company (investment adviser firm, 2006-2008), and President of Fidelity Strategic Investments (investment adviser firm, 2002-2005).
* Determined to be an "Interested Trustee" by virtue of, among other things, his or her affiliation with the trust or various entities under common control with Strategic Advisers.
+ The information includes the Trustee's principal occupation during the last five years and other information relating to the experience, attributes, and skills relevant to the Trustee's qualifications to serve as a Trustee, which led to the conclusion that the Trustee should serve as a Trustee for the fund.
Independent Trustees:
Correspondence intended for an Independent Trustee may be sent to Fidelity Investments, P.O. Box 55235, Boston, Massachusetts 02205-5235.
Name, Year of Birth; Principal Occupations and Other Relevant Experience+
Peter C. Aldrich (1944)
Year of Election or Appointment: 2006
Trustee
Mr. Aldrich also serves as Trustee of other funds. Mr. Aldrich is a Director of the National Bureau of Economic Research, a Director of the funds of BlackRock Realty Group (2006-present), and a Director of LivelyHood, Inc. (private corporation, 2013-present). Previously, Mr. Aldrich served as a Trustee for the Fidelity Rutland Square Trust (2005-2010), a Managing Member of Poseidon, LLC (foreign private investment, 1998-2004), and Chairman and Managing Member of AEGIS, LLC (foreign private investment, 1997-2004). Mr. Aldrich previously was a founder, Chief Executive Officer, and Chairman of AEW Capital Management, L.P. (then “Aldrich, Eastman and Waltch, L.P.”). Mr. Aldrich also served as a Director of Zipcar, Inc. (car sharing services, 2001-2009) and as Faculty Chairman of The Research Council on Global Investment of The Conference Board (business and professional education non-profit, 1999-2004). Mr. Aldrich is a Member Emeritus of the Board of Trustees of the Museum of Fine Arts Boston and an Overseer of the Massachusetts Eye and Ear Infirmary.
Ralph F. Cox (1932)
Year of Election or Appointment: 2006
Trustee
Mr. Cox also serves as Trustee of other funds. Mr. Cox is President of RABAR Enterprises (management consulting for the petroleum industry). Mr. Cox is a Director of Abraxas Petroleum (exploration and production, 1999-present). Mr. Cox is a member of the Advisory Boards of the Business and Engineering Schools of Texas A&M University and the Engineering School of University of Texas at Austin. Previously, Mr. Cox served as a Trustee for the Fidelity Rutland Square Trust (2005-2010) and as an Advisory Director of CH2M Hill Companies (engineering, 1981-2011). Mr. Ralph F. Cox and Mr. Howard E. Cox, Jr. are not related.
Mary C. Farrell (1949)
Year of Election or Appointment: 2013
Trustee
Ms. Farrell also serves as Trustee of other funds. Ms. Farrell is a Director of the W.R. Berkley Corporation (insurance provider) and President (2009-present) and Director (2006-present) of the Howard Gilman Foundation (charitable organization). Previously, Ms. Farrell was Managing Director and Chief Investment Strategist at UBS Wealth Management USA and Co-Head of UBS Wealth Management Investment Strategy & Research Group (2003-2005). Ms. Farrell also served as Investment Strategist at PaineWebber (1982-2000) and UBS PaineWebber (2000-2002). Ms. Farrell serves as Chairman of the Board of Trustees of Yale-New Haven Hospital and on the Yale New Haven Health System Board and previously served as Trustee on the Board of Overseers of the New York University Stern School of Business.
Karen Kaplan (1960)
Year of Election or Appointment: 2006
Trustee
Ms. Kaplan also serves as Trustee of other funds. Ms. Kaplan is Chairman (2014-present) and Chief Executive Officer (2013-present) of Hill Holliday (advertising and specialized marketing). Ms. Kaplan is a Director of The Michaels Companies, Inc. (specialty retailer, 2015-present), Member of the Board of Governors of the Chief Executives’ Club of Boston (2010-present), Member of the Executive Committee of the Greater Boston Chamber of Commerce (2006-present), Advisory Board Member of the National Association of Corporate Directors Chapter (2012-present), Member of the Board of Trustees of the Post Office Square Trust (2012-present), Trustee of the Brigham and Women’s Hospital (2016-present), Overseer of the Boston Symphony Orchestra (2014-present), Member of the Board of Directors of The Advertising Council, Inc. (2016-present), and Member of the Ron Burton Training Village Executive Board of Advisors (2018-present). Previously, Ms. Kaplan served as an Advisory Board Member of Fidelity Rutland Square Trust (2006-2010), a member of the Clinton Global Initiative (2010-2015), Director of DSM (dba Delta Dental and DentaQuest) (2004-2014), Formal Appointee of the 2015 Baker-Polito Economic Development Council, Director of Vera Bradley Inc. (designer of women’s accessories, 2012-2015), Member of the Board of Directors of the Massachusetts Conference for Women (2008-2015), Member of the Board of Directors of Jobs for Massachusetts (2012-2015), President of the Massachusetts Women’s Forum (2008-2010), Treasurer of the Massachusetts Women’s Forum (2002-2006), and Vice Chair of the Board of the Massachusetts Society for the Prevention of Cruelty to Children (2003-2010).
Heidi L. Steiger (1953)
Year of Election or Appointment: 2017
Trustee
Ms. Steiger also serves as Trustee of other funds. Ms. Steiger serves as a member of the Global Advisory Board and Of Counsel to Signum Global Advisors (international policy and strategy, 2018-present), a guest lecturer in the joint degree program in Global Luxury Management at North Carolina State University (Raleigh, NC) and Skema (Paris) (2018-present), Managing Partner of Topridge Associates, LLC (consulting, 2005-present), a Non-Executive Director of CrowdBureau Corporation (financial technology company and index provider, 2018-present), and a member of the Board of Directors (2013-present) and Chair of the Audit Committee and member of the Membership and Executive Committees (2017-present) of Business Executives for National Security (nonprofit). Previously, Ms. Steiger served as Eastern Region President of The Private Client Reserve of U.S. Bancorp (banking and financial services, 2010-2015), Advisory Director of Berkshire Capital Securities, LLC (financial services, 2009-2010), President and Senior Advisor of Lowenhaupt Global Advisors, LLC (financial services, 2005-2007), and President and Contributing Editor of Worth Magazine (2004-2005) and held a variety of positions at Neuberger Berman Group, LLC (financial services, 1986-2004), including Partner and Executive Vice President and Global Head of Private Asset Management at Neuberger Berman (1999-2004). Ms. Steiger also served as a member of the Board of Directors of Nuclear Electric Insurance Ltd (insurer of nuclear utilities, 2006-2017), a member of the Board of Trustees and Audit Committee of the Eaton Vance Funds (2007-2010), a member of the Board of Directors of Aviva USA (formerly AmerUs) (insurance, 2004-2014), and a member of the Board of Trustees and Audit Committee and Chair of the Investment Committee of CIFG (financial guaranty insurance, 2009-2012), and a member of the Board of Directors of Kin Group Plc (formerly, Fitbug Holdings) (health and technology, 2016-2017).
+ The information includes the Trustee's principal occupation during the last five years and other information relating to the experience, attributes, and skills relevant to the Trustee's qualifications to serve as a Trustee, which led to the conclusion that the Trustee should serve as a Trustee for the fund.
Advisory Board Members and Officers:
Correspondence intended for an officer or Howard E. Cox, Jr. may be sent to Fidelity Investments, 245 Summer Street, Boston, Massachusetts 02210. Officers appear below in alphabetical order.
Name, Year of Birth; Principal Occupation
Howard E. Cox, Jr. (1944)
Year of Election or Appointment: 2009
Member of the Advisory Board
Mr. Cox also serves as Member of the Advisory Board of other funds. Mr. Cox is a Partner of Greylock (venture capital, 1971-present) and a Director of Stryker Corporation (medical products and services, 1974-present). Previously, Mr. Cox served as an Advisory Board Member of Fidelity Rutland Square Trust (2006-2010). Mr. Cox also serves as a Member of the Secretary of Defense's Business Board of Directors (2008-present), a Director of Business Executives for National Security (1997-present), a Director of the Brookings Institution (2010-present), a Director of the World Economic Forum’s Young Global Leaders Foundation (2009-present), and is a Member of the Harvard Medical School Board of Fellows (2002-present). Mr. Howard E. Cox, Jr. and Mr. Ralph F. Cox are not related.
Elizabeth Paige Baumann (1968)
Year of Election or Appointment: 2017
Anti-Money Laundering (AML) Officer
Ms. Baumann also serves as AML Officer of other funds. She is Chief AML Officer (2012-present) and Senior Vice President (2014-present) of FMR LLC (diversified financial services company) and is an employee of Fidelity Investments. Previously, Ms. Baumann served as AML Officer of the funds (2012-2016), and Vice President (2007-2014) and Deputy Anti-Money Laundering Officer (2007-2012) of FMR LLC.
Craig S. Brown (1977)
Year of Election or Appointment: 2019
Assistant Treasurer
Mr. Brown also serves as Assistant Treasurer of other funds. Mr. Brown is an employee of Fidelity Investments (2013-present).
John J. Burke III (1964)
Year of Election or Appointment: 2018
Chief Financial Officer
Mr. Burke also serves as Chief Financial Officer of other funds. Mr. Burke serves as Head of Investment Operations for Fidelity Fund and Investment Operations (2018-present) and is an employee of Fidelity Investments (1998-present). Previously Mr. Burke served as head of Asset Management Investment Operations (2012-2018).
Jonathan Davis (1968)
Year of Election or Appointment: 2010
Assistant Treasurer
Mr. Davis also serves as Assistant Treasurer of other funds. Mr. Davis serves as Assistant Treasurer of FMR Capital, Inc. (2017-present) and is an employee of Fidelity Investments. Previously, Mr. Davis served as Vice President and Associate General Counsel of FMR LLC (diversified financial services company, 2003-2010).
Adrien E. Deberghes (1967)
Year of Election or Appointment: 2016
President and Treasurer
Mr. Deberghes also serves as an officer of other funds. He serves as Assistant Treasurer of FMR Capital, Inc. (2017-present), Executive Vice President of Fidelity Investments Money Management, Inc. (FIMM) (investment adviser firm, 2016-present), and is an employee of Fidelity Investments (2008-present). Previously, Mr. Deberghes served as President and Treasurer of certain Fidelity® funds (2013-2018). Prior to joining Fidelity Investments, Mr. Deberghes was Senior Vice President of Mutual Fund Administration at State Street Corporation (2007-2008), Senior Director of Mutual Fund Administration at Investors Bank & Trust (2005-2007), and Director of Finance for Dunkin' Brands (2000-2005). Previously, Mr. Deberghes served in other fund officer roles.
Laura M. Del Prato (1964)
Year of Election or Appointment: 2018
Assistant Treasurer
Ms. Del Prato also serves as an officer of other funds. Ms. Del Prato is an employee of Fidelity Investments (2017-present). Prior to joining Fidelity Investments, Ms. Del Prato served as a Managing Director and Treasurer of the JPMorgan Mutual Funds (2014-2017). Prior to JPMorgan, Ms. Del Prato served as a partner at Cohen Fund Audit Services (accounting firm, 2012-2013) and KPMG LLP (accounting firm, 2004-2012).
James D. Gryglewicz (1972)
Year of Election or Appointment: 2015
Chief Compliance Officer
Mr. Gryglewicz also serves as Chief Compliance Officer of other funds. Mr. Gryglewicz serves as Compliance Officer of Strategic Advisers LLC (investment adviser firm, 2015-present) and Fidelity SelectCo, LLC (investment adviser firm, 2014-present), Senior Vice President of Asset Management Compliance (2009-present), and is an employee of Fidelity Investments (2004-present). Previously, Mr. Gryglewicz served as Chief Compliance Officer of certain Fidelity® funds (2014-2018).
John Hitt (1967)
Year of Election or Appointment: 2014
Secretary and Chief Legal Officer
Mr. Hitt also serves as an officer of other funds. Mr. Hitt serves as Senior Vice President and Deputy General Counsel in Fidelity's Asset Management Group (2010-present) and is an employee of Fidelity Investments.
Colm A. Hogan (1973)
Year of Election or Appointment: 2016
Assistant Treasurer
Mr. Hogan also serves as an officer of other funds. Mr. Hogan serves as Assistant Treasurer of FMR Capital, Inc. (2017-present) and is an employee of Fidelity Investments (2005-present). Previously, Mr. Hogan served as Assistant Treasurer of certain Fidelity® funds (2016-2018). Mr. Colm A. Hogan is not related to Mr. Brian B. Hogan.
Christina H. Lee (1975)
Year of Election or Appointment: 2018
Assistant Secretary
Ms. Lee also serves as Assistant Secretary of other funds. Ms. Lee serves as Vice President, Associate General Counsel (2014-present) and is an employee of Fidelity Investments (2007-present).
Chris Maher (1972)
Year of Election or Appointment: 2016
Assistant Treasurer
Mr. Maher serves as Assistant Treasurer of other funds. Mr. Maher is Vice President of Valuation Oversight, serves as Assistant Treasurer of FMR Capital, Inc. (2017-present), and is an employee of Fidelity Investments. Previously, Mr. Maher served as Vice President of Asset Management Compliance (2013), Vice President of the Program Management Group of FMR (investment adviser firm, 2010-2013), and Vice President of Valuation Oversight (2008-2010).
Stacie M. Smith (1974)
Year of Election or Appointment: 2016
Assistant Treasurer
Ms. Smith also serves as an officer of other funds. Ms. Smith serves as Assistant Treasurer of FMR Capital, Inc. (2017-present), is an employee of Fidelity Investments (2009-present), and has served in other fund officer roles. Prior to joining Fidelity Investments, Ms. Smith served as Senior Audit Manager of Ernst & Young LLP (accounting firm, 1996-2009). Previously, Ms. Smith served as Assistant Treasurer (2013-2018) and Deputy Treasurer (2013-2016) of certain Fidelity® funds.
Marc L. Spector (1972)
Year of Election or Appointment: 2016
Assistant Treasurer
Mr. Spector also serves as an officer of other funds. Mr. Spector serves as Assistant Treasurer of FMR Capital, Inc. (2017-present) and is an employee of Fidelity Investments (2016-present). Prior to joining Fidelity Investments, Mr. Spector served as Director at the Siegfried Group (accounting firm, 2013-2016), and prior to Siegfried Group as audit senior manager at Deloitte & Touche (accounting firm, 2005-2013).
Jim Wegmann (1979)
Year of Election or Appointment: 2019
Assistant Treasurer
Mr. Wegmann also serves as Assistant Treasurer of other funds. Mr. Wegmann is an employee of Fidelity Investments (2011-present).
Shareholder Expense Example
As a shareholder of the Fund, you incur two types of costs: (1) transaction costs and (2) ongoing costs, including management fees and other Fund expenses. This Example is intended to help you understand your ongoing costs (in dollars) of investing in the Fund and to compare these costs with the ongoing costs of investing in other mutual funds.
The Example is based on an investment of $1,000 invested at the beginning of the period and held for the entire period (December 1, 2018 to May 31, 2019).
Actual Expenses
The first line of the accompanying table provides information about actual account values and actual expenses. You may use the information in this line, together with the amount you invested, to estimate the expenses that you paid over the period. Simply divide your account value by $1,000.00 (for example, an $8,600 account value divided by $1,000.00 = 8.6), then multiply the result by the number in the first line under the heading entitled "Expenses Paid During Period" to estimate the expenses you paid on your account during this period. In addition to the direct expenses incurred by the Fund presented in the table, as a shareholder of the underlying mutual funds (the Underlying Funds), the Fund also indirectly bears its proportionate share of the expenses of the Underlying Funds. In addition, the Fund, as a shareholder in the underlying Fidelity Central Funds, will indirectly bear its pro-rata share of the fees and expenses incurred by the underlying Fidelity Central Funds. These fees and expenses are not included in the Fund's annualized expense ratio used to calculate the expense estimate in the table below.
Hypothetical Example for Comparison Purposes
The second line of the accompanying table provides information about hypothetical account values and hypothetical expenses based on the Fund's actual expense ratio and an assumed rate of return of 5% per year before expenses, which is not the Fund's actual return. The hypothetical account values and expenses may not be used to estimate the actual ending account balance or expenses you paid for the period. You may use this information to compare the ongoing costs of investing in the Fund and other funds. To do so, compare this 5% hypothetical example with the 5% hypothetical examples that appear in the shareholder reports of the other funds. In addition to the direct expenses incurred by the Fund presented in the table, as a shareholder of the Underlying Funds, the Fund also indirectly bears its proportionate share of the expenses of the Underlying Funds. In addition, the Fund, as a shareholder in the underlying Fidelity Central Funds, will indirectly bear its pro-rata share of the fees and expenses incurred by the underlying Fidelity Central Funds. These fees and expenses are not included in the Fund's annualized expense ratio used to calculate the expense estimate in the table below.
Please note that the expenses shown in the table are meant to highlight your ongoing costs only and do not reflect any transaction costs. Therefore, the second line of the table is useful in comparing ongoing costs only, and will not help you determine the relative total costs of owning different funds.
| Annualized Expense Ratio-A | Beginning Account Value December 1, 2018 | Ending Account Value May 31, 2019 | Expenses Paid During Period-B December 1, 2018 to May 31, 2019 |
|
| Actual | .09% | $1,000.00 | $1,067.90 | $.46 |
| Hypothetical-C | $1,000.00 | $1,024.48 | $.45 |
A Annualized expense ratio reflects expenses net of applicable fee waivers.
B Expenses are equal to the Fund's annualized expense ratio, multiplied by the average account value over the period, multiplied by 182/365 (to reflect the one-half year period). The fees and expenses of the Underlying Funds in which the Fund invests are not included in the Fund's annualized expense ratio. In addition to the expenses noted above, the Fund also indirectly bears its proportional share of the expenses of the underlying Fidelity Central Funds. Annualized expenses of the underlying non-money market Fidelity Central Funds as of their most recent fiscal half year ranged from less than .005% to .01%.
C 5% return per year before expenses
Distributions (Unaudited)
The Board of Trustees of Strategic Advisers Fidelity Core Income Fund voted to pay on July 15th, 2019, to shareholders of record at the opening of business on July 12th, 2019, a distribution of $0.053 per share derived from capital gains realized from sales of portfolio securities.
A total of 14.24% of the dividends distributed during the fiscal year was derived from interest on U.S. Government securities which is generally exempt from state income tax.
The fund designates $99,626,977 of distributions paid during the period January 1, 2019 to May 31, 2019 as qualifying to be taxed as interest-related dividends for non-resident alien shareholders.
The fund will notify shareholders in January 2020 of amounts for use in preparing 2019 income tax returns.
![]()
COI-ANN-0719
1.9887939.100
|
Strategic Advisers® Fidelity® Emerging Markets Fund Offered exclusively to certain clients of Strategic Advisers LLC - not available for sale to the general public Annual Report May 31, 2019 |
|
|
Beginning on January 1, 2021, as permitted by regulations adopted by the Securities and Exchange Commission, paper copies of a fund’s shareholder reports will no longer be sent by mail, unless you specifically request paper copies of the reports from the fund or from your financial intermediary, such as a financial advisor, broker-dealer or bank. Instead, the reports will be made available on a website, and you will be notified by mail each time a report is posted and provided with a website link to access the report.
If you already elected to receive shareholder reports electronically, you will not be affected by this change and you need not take any action. You may elect to receive shareholder reports and other communications from a fund electronically, by contacting your financial intermediary. For Fidelity customers, visit Fidelity's web site or call Fidelity using the contact information listed below.
You may elect to receive all future reports in paper free of charge. If you wish to continue receiving paper copies of your shareholder reports, you may contact your financial intermediary or, if you are a Fidelity customer, visit Fidelity’s website, or call Fidelity at the applicable toll-free number listed below. Your election to receive reports in paper will apply to all funds held with the fund complex/your financial intermediary.
| Account Type | Website | Phone Number |
| Brokerage, Mutual Fund, or Annuity Contracts: | fidelity.com/mailpreferences | 1-800-343-3548 |
| Employer Provided Retirement Accounts: | netbenefits.fidelity.com/preferences (choose 'no' under Required Disclosures to continue to print) | 1-800-343-0860 |
| Advisor Sold Accounts Serviced Through Your Financial Intermediary: | Contact Your Financial Intermediary | Your Financial Intermediary's phone number |
| Advisor Sold Accounts Serviced by Fidelity: | institutional.fidelity.com | 1-877-208-0098 |
Contents
To view a fund's proxy voting record for the 12-month period ended June 30, visit http://www.fidelity.com/proxyvotingresults or visit the Securities and Exchange Commission's (SEC) web site at http://www.sec.gov.
You may also call 1-800-544-3455 to request a free copy of the proxy voting guidelines.
Standard & Poor's, S&P and S&P 500 are registered service marks of The McGraw-Hill Companies, Inc. and have been licensed for use by Fidelity Distributors Corporation.
Other third-party marks appearing herein are the property of their respective owners.
All other marks appearing herein are registered or unregistered trademarks or service marks of FMR LLC or an affiliated company. © 2019 FMR LLC. All rights reserved.
This report and the financial statements contained herein are submitted for the general information of the shareholders of the Fund. This report is not authorized for distribution to prospective investors in the Fund unless preceded or accompanied by an effective prospectus.
A fund files its complete schedule of portfolio holdings with the SEC for the first and third quarters of each fiscal year on Form N-PORT. Forms N-PORT are available on the SEC’s web site at http://www.sec.gov. A fund's Forms N-PORT may be reviewed and copied at the SEC’s Public Reference Room in Washington, DC. Information regarding the operation of the SEC's Public Reference Room may be obtained by calling 1-800-SEC-0330.
For a complete list of a fund's portfolio holdings, view the most recent holdings listing, semiannual report, or annual report on Fidelity's web site at http://www.fidelity.com, http://www.institutional.fidelity.com, or http://www.401k.com, as applicable.
NOT FDIC INSURED •MAY LOSE VALUE •NO BANK GUARANTEE
Neither the Fund nor Fidelity Distributors Corporation is a bank.
Performance: The Bottom Line
Average annual total return reflects the change in the value of an investment, assuming reinvestment of distributions from dividend income and capital gains (the profits earned upon the sale of securities that have grown in value, if any) and assuming a constant rate of performance each year. The hypothetical investment and the average annual total returns do not reflect the deduction of taxes that a shareholder would pay on fund distributions or the redemption of fund shares. During periods of reimbursement by Fidelity, a fund’s total return will be greater than it would be had the reimbursement not occurred. How a fund did yesterday is no guarantee of how it will do tomorrow.
Average annual total returns for Strategic Advisers® Fidelity® Emerging Markets Fund will be reported once the fund is a year old.
$10,000 Over Life of Fund
Let's say hypothetically that $10,000 was invested in Strategic Advisers® Fidelity® Emerging Markets Fund on October 30, 2018, when the fund started.
The chart shows how the value of your investment would have changed, and also shows how the MSCI Emerging Markets Index performed over the same period.
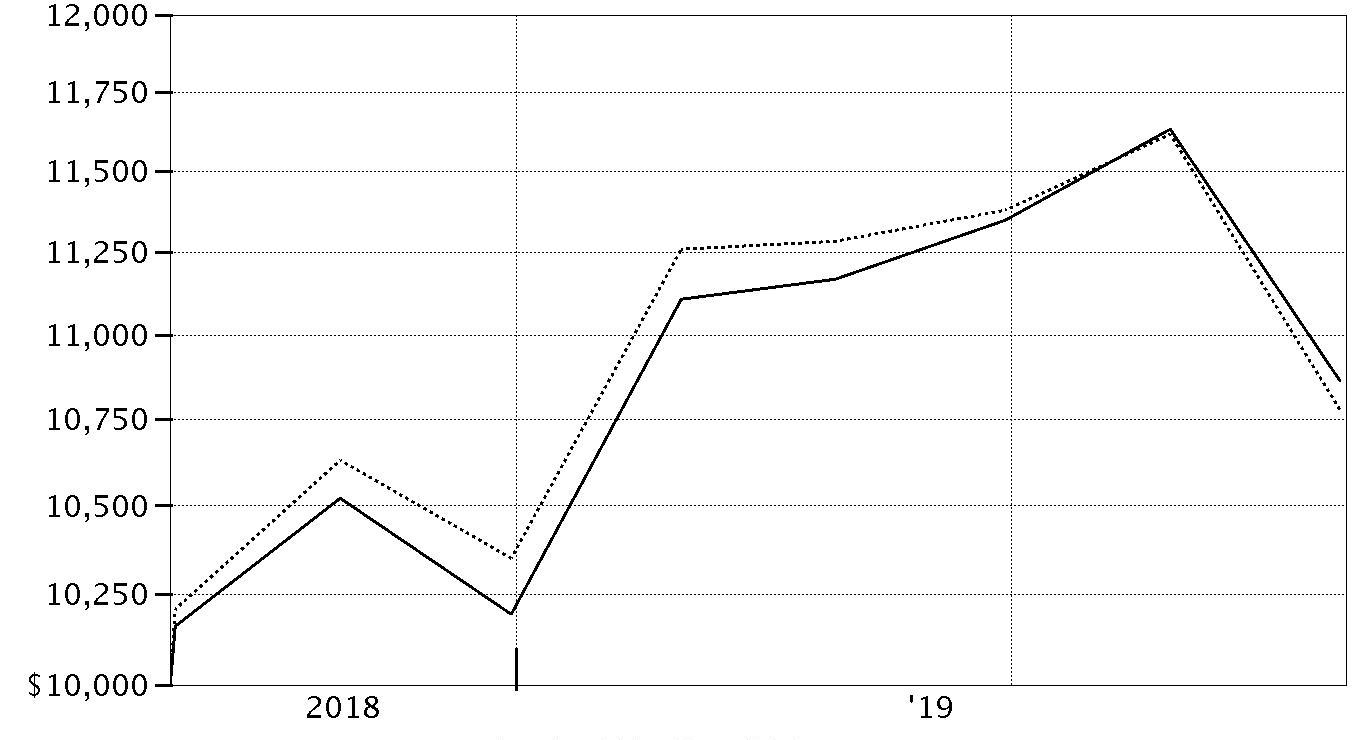
| Period Ending Values | ||
|
| $10,863 | Strategic Advisers® Fidelity® Emerging Markets Fund |
|
| $10,775 | MSCI Emerging Markets Index |
Management's Discussion of Fund Performance
Market Recap: Emerging markets (EM) stocks returned -8.66% for the 12 months ending May 31, 2019, as measured by the MSCI Emerging Market Index, lagging international developed market equities, in U.S.-dollar terms. EM stocks rebounded sharply in the first quarter of 2019, following a turbulent fourth quarter of 2018, marked by trade tension between the U.S. and China, along with increasing concern about slowing global economic growth. South Korea and China were among the poorest performing countries in the index, hampered by trade uncertainty, disappointing corporate profits and weakening economic growth. On the positive side, Brazil and Russia were the best performers, as these oil-producing nations benefited from a recovery in crude prices during the second half of the period. Moreover, Brazil's market also received a boost from the election of a new president who many investors believe will implement market-friendly reforms. Value stocks outpaced their growth counterparts, fueled by strength in the energy (+8%) sector, which was the top-performer for the period, and one of only two sectors to post a positive return, the other being financials (+1%). Conversely, health care (-28%), consumer discretionary (-18%) and communication services (-16%) stocks fared the worst. Comments from Co-Portfolio Manager Antonio Martinez: From its inception on October 30, 2018 through May 31, 2019, the Fund gained 8.63%, outpacing the 7.75% advance of the benchmark MSCI Emerging Markets Index. For this abbreviated period, I'm pleased to report that all of the Fund's underlying managers contributed to relative performance. The top contributors versus the benchmark were Fidelity® Emerging Markets Fund, the Global Emerging Markets strategy managed by sub-adviser FIL®, and two strategies from sub-adviser FIAM®: Concentrated Emerging Markets and Select Emerging Markets Equity. Strong stock selection in China was a common theme across the leading contributors, particularly in consumer-related sectors, as well as in financials and communication services. FIAM's Concentrated EM strategy – a core approach that typically maintains a relatively small number of holdings – also benefited from picks in Argentina and South Africa. Initially, all of the Fund's assets were allocated to Fidelity® SAI® Emerging Markets Index Fund. In December, however, those assets were diversified across six different actively managed strategies. At period end, Fidelity SAI Emerging Markets Index Fund was still the Fund's largest holding, representing about 28% of total assets. FIAM's Select Emerging Markets Equity strategy, a core strategy with a growth bias, and growth-oriented Fidelity Emerging Markets Fund, were the second-largest allocations, each accounting for about 15% of Fund assets.The views expressed above reflect those of the portfolio manager(s) only through the end of the period as stated on the cover of this report and do not necessarily represent the views of Fidelity or any other person in the Fidelity organization. Any such views are subject to change at any time based upon market or other conditions and Fidelity disclaims any responsibility to update such views. These views may not be relied on as investment advice and, because investment decisions for a Fidelity fund are based on numerous factors, may not be relied on as an indication of trading intent on behalf of any Fidelity fund.
Investment Summary (Unaudited)
The information in the following tables is based on the direct investments of the Fund.Top Ten Holdings as of May 31, 2019
| (excluding cash equivalents) | % of fund's net assets |
| Fidelity SAI Emerging Markets Index Fund | 27.8 |
| Fidelity Emerging Markets Fund | 14.5 |
| Fidelity SAI Emerging Markets Low Volatility Index Fund | 4.3 |
| iShares MSCI South Korea Index ETF | 3.9 |
| iShares MSCI India ETF | 3.0 |
| Taiwan Semiconductor Manufacturing Co. Ltd. | 2.9 |
| Tencent Holdings Ltd. | 2.4 |
| Naspers Ltd. Class N | 1.7 |
| Alibaba Group Holding Ltd. sponsored ADR | 1.2 |
| HDFC Bank Ltd. sponsored ADR | 1.1 |
| 62.8 |
Asset Allocation (% of fund's net assets)
| As of May 31, 2019 | ||
| Common Stocks | 37.1% | |
| Preferred Stocks | 1.1% | |
| Diversifed Emerging Markets Funds | 53.8% | |
| Short-Term Investments and Net Other Assets (Liabilities) | 8.0% | |

Asset allocations of funds in the pie chart reflect the categorizations of assets as defined by Morningstar as of the reporting date.
Schedule of Investments May 31, 2019
Showing Percentage of Net Assets
| Common Stocks - 37.1% | |||
| Shares | Value | ||
| COMMUNICATION SERVICES - 3.5% | |||
| Diversified Telecommunication Services - 0.3% | |||
| China Telecom Corp. Ltd. (H Shares) | 2,270,000 | $1,140,856 | |
| China Unicom Ltd. | 584,000 | 614,336 | |
| HKBN Ltd. | 88,500 | 140,886 | |
| HKT Trust/HKT Ltd. unit | 107,000 | 168,698 | |
| PT Telekomunikasi Indonesia Tbk Series B | 7,371,900 | 2,019,698 | |
| Telkom SA Ltd. | 358,120 | 2,254,991 | |
| 6,339,465 | |||
| Entertainment - 0.1% | |||
| NetEase, Inc. ADR | 10,265 | 2,551,982 | |
| Interactive Media & Services - 2.7% | |||
| Baidu.com, Inc. sponsored ADR (a) | 10,762 | 1,183,820 | |
| Mail.Ru Group Ltd. GDR (Reg. S) (a) | 65,782 | 1,503,777 | |
| Momo, Inc. ADR | 35,730 | 985,076 | |
| Tencent Holdings Ltd. | 1,129,700 | 47,105,842 | |
| Yandex NV Series A (a) | 44,140 | 1,585,509 | |
| YY, Inc. ADR (a) | 824 | 56,403 | |
| 52,420,427 | |||
| Media - 0.1% | |||
| ITE Group PLC | 1,268,900 | 1,257,698 | |
| Pico Far East Holdings Ltd. | 1,772,000 | 542,480 | |
| 1,800,178 | |||
| Wireless Telecommunication Services - 0.3% | |||
| America Movil S.A.B. de CV Series L sponsored ADR | 96,910 | 1,359,647 | |
| China Mobile Ltd. | 155,500 | 1,358,286 | |
| MTN Group Ltd. | 119,424 | 841,512 | |
| Safaricom Ltd. | 6,788,200 | 1,841,266 | |
| 5,400,711 | |||
| TOTAL COMMUNICATION SERVICES | 68,512,763 | ||
| CONSUMER DISCRETIONARY - 6.9% | |||
| Automobiles - 0.2% | |||
| Brilliance China Automotive Holdings Ltd. | 938,000 | 954,805 | |
| Guangzhou Automobile Group Co. Ltd. (H Shares) | 174,000 | 167,795 | |
| PT Astra International Tbk (b) | 2,833,000 | 1,478,777 | |
| 2,601,377 | |||
| Diversified Consumer Services - 0.3% | |||
| Estacio Participacoes SA | 253,800 | 1,904,818 | |
| New Oriental Education & Technology Group, Inc. sponsored ADR (a) | 49,185 | 4,212,695 | |
| TAL Education Group ADR (a) | 8,680 | 298,679 | |
| 6,416,192 | |||
| Hotels, Restaurants & Leisure - 0.1% | |||
| City Lodge Hotels Ltd. | 186,500 | 1,395,589 | |
| Galaxy Entertainment Group Ltd. | 19,000 | 114,879 | |
| Huazhu Group Ltd. ADR | 7,903 | 241,832 | |
| Sands China Ltd. | 43,600 | 197,435 | |
| Shangri-La Asia Ltd. | 88,000 | 112,251 | |
| Yum China Holdings, Inc. | 7,680 | 307,277 | |
| 2,369,263 | |||
| Household Durables - 0.8% | |||
| Midea Group Co. Ltd. (A Shares) | 931,400 | 6,690,433 | |
| Qingdao Haier Co. Ltd. (A Shares) | 2,267,200 | 5,220,634 | |
| Techtronic Industries Co. Ltd. | 374,500 | 2,388,530 | |
| 14,299,597 | |||
| Internet & Direct Marketing Retail - 4.1% | |||
| Alibaba Group Holding Ltd. sponsored ADR (a) | 161,695 | 24,134,596 | |
| Ctrip.com International Ltd. ADR (a) | 52,490 | 1,814,054 | |
| JD.com, Inc. sponsored ADR (a) | 233,595 | 6,017,407 | |
| MakeMyTrip Ltd. (a) | 50,089 | 1,177,092 | |
| Meituan Dianping Class B | 661,100 | 5,106,110 | |
| MercadoLibre, Inc. (a) | 10,482 | 5,980,191 | |
| Naspers Ltd. Class N | 147,414 | 33,234,713 | |
| Pinduoduo, Inc. ADR (c) | 50,590 | 982,458 | |
| 78,446,621 | |||
| Leisure Products - 0.0% | |||
| Goodbaby International Holdings Ltd. | 794,000 | 182,306 | |
| Multiline Retail - 0.1% | |||
| Poya International Co. Ltd. | 182,000 | 2,158,012 | |
| Specialty Retail - 0.4% | |||
| Chow Tai Fook Jewellery Group Ltd. | 231,800 | 198,106 | |
| Foschini Ltd. | 68,015 | 822,274 | |
| Mr Price Group Ltd. | 198,400 | 2,685,287 | |
| Suning.com Co. Ltd. (A Shares) | 53,235 | 83,572 | |
| Zhongsheng Group Holdings Ltd. Class H | 1,823,500 | 4,591,576 | |
| 8,380,815 | |||
| Textiles, Apparel & Luxury Goods - 0.9% | |||
| adidas AG | 9,879 | 2,827,506 | |
| Anta Sports Products Ltd. | 858,000 | 5,253,363 | |
| Best Pacific International Holdings Ltd. | 324,000 | 114,481 | |
| China Tower Corp. Ltd. (H Shares) (d) | 4,168,000 | 935,727 | |
| Regina Miracle International Holdings Ltd. (d) | 168,000 | 141,651 | |
| Samsonite International SA (d) | 819,599 | 1,683,202 | |
| Shenzhou International Group Holdings Ltd. | 492,100 | 5,803,221 | |
| Steinhoff Africa Retail Ltd. (d) | 932,519 | 1,141,462 | |
| Stella International Holdings Ltd. | 59,000 | 97,837 | |
| 17,998,450 | |||
| TOTAL CONSUMER DISCRETIONARY | 132,852,633 | ||
| CONSUMER STAPLES - 3.5% | |||
| Beverages - 1.1% | |||
| China Resources Beer Holdings Co. Ltd. | 828,000 | 3,622,708 | |
| Compania Cervecerias Unidas SA | 159,200 | 2,153,907 | |
| Fomento Economico Mexicano S.A.B. de CV unit | 111,100 | 1,032,842 | |
| Kweichow Moutai Co. Ltd. (A Shares) | 90,755 | 11,697,603 | |
| Thai Beverage PCL | 4,479,500 | 2,641,330 | |
| 21,148,390 | |||
| Food & Staples Retailing - 0.7% | |||
| Atacadao Distribuicao Comercio e Industria Ltda | 953,400 | 5,624,743 | |
| C.P. ALL PCL (For. Reg.) | 923,500 | 2,324,783 | |
| Dairy Farm International Holdings Ltd. | 233,700 | 1,787,805 | |
| President Chain Store Corp. | 22,000 | 209,942 | |
| Sun Art Retail Group Ltd. | 202,000 | 176,245 | |
| Wal-Mart de Mexico SA de CV Series V | 938,000 | 2,647,147 | |
| 12,770,665 | |||
| Food Products - 1.3% | |||
| Angel Yeast Co. Ltd. (A Shares) | 59,400 | 251,880 | |
| China Mengniu Dairy Co. Ltd. | 2,720,000 | 9,940,366 | |
| Delfi Ltd. | 2,476,700 | 2,325,794 | |
| Gruma S.A.B. de CV Series B | 158,570 | 1,512,256 | |
| Inner Mongoli Yili Industries Co. Ltd.: | |||
| (A Shares) | 87,000 | 378,113 | |
| (A Shares) | 1,847,967 | 8,031,497 | |
| Unified-President Enterprises Corp. | 810,000 | 2,087,788 | |
| Vietnam Dairy Products Corp. | 11,730 | 64,872 | |
| WH Group Ltd. (d) | 1,101,000 | 991,519 | |
| 25,584,085 | |||
| Household Products - 0.1% | |||
| Vinda International Holdings Ltd. | 1,501,000 | 2,684,340 | |
| Personal Products - 0.2% | |||
| Natura Cosmeticos SA | 238,400 | 3,644,091 | |
| Tobacco - 0.1% | |||
| Philip Morris International, Inc. | 28,500 | 2,198,205 | |
| TOTAL CONSUMER STAPLES | 68,029,776 | ||
| ENERGY - 2.3% | |||
| Energy Equipment & Services - 0.0% | |||
| China Oilfield Services Ltd. (H Shares) | 154,000 | 137,704 | |
| SPT Energy Group, Inc. (a) | 166,000 | 16,728 | |
| 154,432 | |||
| Oil, Gas & Consumable Fuels - 2.3% | |||
| China Petroleum & Chemical Corp. (H Shares) | 8,108,000 | 5,398,749 | |
| China Shenhua Energy Co. Ltd. (H Shares) | 256,500 | 526,771 | |
| CNOOC Ltd. | 1,972,000 | 3,203,875 | |
| CNOOC Ltd. sponsored ADR | 18,282 | 2,968,448 | |
| Gazprom OAO | 608,129 | 1,996,700 | |
| Gazprom OAO sponsored ADR (Reg. S) | 150,149 | 986,479 | |
| Lukoil PJSC | 59,550 | 4,778,991 | |
| Lukoil PJSC sponsored ADR | 30,994 | 2,496,877 | |
| NOVATEK OAO GDR (Reg. S) | 26,402 | 5,412,410 | |
| Oil Search Ltd. ADR | 450,287 | 2,202,167 | |
| PetroChina Co. Ltd. (H Shares) | 886,000 | 491,626 | |
| Petroleo Brasileiro SA - Petrobras (ON) | 429,500 | 3,089,944 | |
| Pilipinas Shell Petroleum Corp. | 2,776,200 | 2,229,163 | |
| Tupras Turkiye Petrol Rafinerileri A/S | 214,918 | 4,832,934 | |
| Ultrapar Participacoes SA | 685,800 | 3,614,303 | |
| 44,229,437 | |||
| TOTAL ENERGY | 44,383,869 | ||
| FINANCIALS - 9.6% | |||
| Banks - 6.9% | |||
| Abu Dhabi Commercial Bank PJSC (e) | 924,418 | 2,260,080 | |
| Axis Bank Ltd. GDR (Reg. S) (a) | 59,400 | 3,445,200 | |
| Banco de Chile (a) | 14,819,000 | 2,127,398 | |
| Banco del Bajio SA (d) | 798,400 | 1,542,721 | |
| Banco do Brasil SA | 134,000 | 1,770,639 | |
| Banco Macro SA sponsored ADR | 15,602 | 778,228 | |
| Bancolombia SA sponsored ADR | 12,290 | 577,261 | |
| Bank of China Ltd. (H Shares) | 5,459,000 | 2,263,108 | |
| Bank Polska Kasa Opieki SA | 20,353 | 564,225 | |
| Barclays Africa Group Ltd. | 203,629 | 2,362,537 | |
| BOC Hong Kong (Holdings) Ltd. | 52,500 | 201,574 | |
| Capitec Bank Holdings Ltd. | 34,157 | 3,093,470 | |
| China Construction Bank Corp. (H Shares) | 7,483,000 | 5,923,927 | |
| China Merchants Bank Co. Ltd. (H Shares) | 1,732,000 | 8,384,754 | |
| Credicorp Ltd. (United States) | 6,970 | 1,559,886 | |
| E.SUN Financial Holdings Co. Ltd. | 2,994,000 | 2,600,837 | |
| Grupo Financiero Banorte S.A.B. de CV Series O | 1,577,229 | 8,577,937 | |
| Guaranty Trust Bank PLC | 24,576,200 | 2,160,245 | |
| Guaranty Trust Bank PLC GDR (Reg. S) | 133,877 | 572,994 | |
| Hang Seng Bank Ltd. | 9,500 | 238,120 | |
| HDFC Bank Ltd. sponsored ADR | 169,479 | 21,042,513 | |
| Industrial & Commercial Bank of China Ltd. (H Shares) | 20,590,000 | 14,707,987 | |
| Kasikornbank PCL (For. Reg.) | 804,800 | 4,763,258 | |
| King's Town Bank | 782,000 | 823,106 | |
| Mega Financial Holding Co. Ltd. | 562,000 | 552,343 | |
| National Bank of Abu Dhabi PJSC (a) | 621,064 | 2,512,663 | |
| OTP Bank PLC | 59,697 | 2,493,198 | |
| PT Bank Central Asia Tbk | 4,421,400 | 9,014,730 | |
| PT Bank Mandiri (Persero) Tbk | 8,858,600 | 4,763,689 | |
| PT Bank Rakyat Indonesia Tbk | 6,956,700 | 1,998,421 | |
| Qatar National Bank SAQ (a) | 19,543 | 1,009,017 | |
| Regional S.A.B. de CV | 83,700 | 405,373 | |
| Sberbank of Russia | 3,499,225 | 12,413,331 | |
| Sberbank of Russia sponsored ADR | 465,449 | 6,725,738 | |
| 134,230,508 | |||
| Capital Markets - 0.2% | |||
| BM&F BOVESPA SA | 331,600 | 3,090,409 | |
| CITIC Securities Co. Ltd. (H Shares) | 181,000 | 329,698 | |
| Hong Kong Exchanges and Clearing Ltd. | 5,200 | 165,428 | |
| Huatai Securities Co. Ltd. (H Shares) (d) | 235,600 | 373,255 | |
| Noah Holdings Ltd. sponsored ADR (a) | 16,255 | 621,754 | |
| 4,580,544 | |||
| Consumer Finance - 0.0% | |||
| Network International Holdings PLC (d) | 98,800 | 694,488 | |
| Diversified Financial Services - 0.7% | |||
| Ayala Corp. | 133,900 | 2,360,977 | |
| Chailease Holding Co. Ltd. | 1,297,000 | 4,790,454 | |
| Far East Horizon Ltd. | 2,199,000 | 2,342,182 | |
| Old Mutual Ltd. | 2,611 | 3,771 | |
| Prosegur Cash SA (d) | 639,005 | 1,200,720 | |
| Remgro Ltd. | 140,300 | 1,783,434 | |
| 12,481,538 | |||
| Insurance - 1.8% | |||
| AIA Group Ltd. | 2,123,200 | 19,945,784 | |
| China Life Insurance Co. Ltd. (H Shares) | 2,282,000 | 5,315,463 | |
| China Pacific Insurance (Group) Co. Ltd. (H Shares) | 331,000 | 1,224,433 | |
| Discovery Ltd. | 147,442 | 1,404,248 | |
| Fubon Financial Holding Co. Ltd. | 141,000 | 193,337 | |
| IRB Brasil Resseguros SA | 29,300 | 760,734 | |
| Ping An Insurance (Group) Co. of China Ltd. (H Shares) | 546,000 | 6,058,532 | |
| 34,902,531 | |||
| TOTAL FINANCIALS | 186,889,609 | ||
| HEALTH CARE - 0.8% | |||
| Biotechnology - 0.0% | |||
| Wuxi Biologics (Cayman), Inc. (a)(d) | 31,000 | 293,014 | |
| Health Care Providers & Services - 0.4% | |||
| Aier Eye Hospital Group Co. Ltd. (A Shares) | 44,100 | 244,546 | |
| NMC Health PLC | 75,100 | 2,139,115 | |
| Notre Dame Intermedica Participacoes SA | 355,700 | 3,716,587 | |
| Sinopharm Group Co. Ltd. (H Shares) | 437,200 | 1,642,383 | |
| 7,742,631 | |||
| Life Sciences Tools & Services - 0.1% | |||
| Hangzhou Tigermed Consulting Co. Ltd. (A Shares) | 134,800 | 1,298,804 | |
| WuXi AppTec Co. Ltd. (H Shares) (d) | 4,000 | 43,804 | |
| 1,342,608 | |||
| Pharmaceuticals - 0.3% | |||
| China Resources Pharmaceutical Group Ltd. (d) | 1,819,500 | 2,376,626 | |
| China Resources Sanjiu Medical & Pharmaceutical Co. Ltd. (A Shares) | 287,754 | 1,148,099 | |
| CSPC Pharmaceutical Group Ltd. | 590,000 | 951,279 | |
| CStone Pharmaceuticals Co. Ltd. (a)(d) | 575,500 | 844,213 | |
| Jiangsu Hengrui Medicine Co. Ltd. (A Shares) | 24,980 | 224,874 | |
| Lijun International Pharmaceutical Holding Ltd. | 214,000 | 170,063 | |
| Sino Biopharmaceutical Ltd. | 231,000 | 233,076 | |
| Tonghua Dongbao Pharmaceutical Co. Ltd. (A Shares) | 328,800 | 710,456 | |
| 6,658,686 | |||
| TOTAL HEALTH CARE | 16,036,939 | ||
| INDUSTRIALS - 2.7% | |||
| Aerospace & Defense - 0.3% | |||
| Elbit Systems Ltd. (c) | 36,465 | 5,182,406 | |
| Airlines - 0.4% | |||
| Azul SA sponsored ADR (a) | 64,900 | 1,932,073 | |
| Copa Holdings SA Class A | 56,654 | 5,076,765 | |
| 7,008,838 | |||
| Construction & Engineering - 0.2% | |||
| Sinopec Engineering Group Co. Ltd. (H Shares) | 3,958,000 | 3,221,108 | |
| Electrical Equipment - 0.2% | |||
| BizLink Holding, Inc. | 141,000 | 873,930 | |
| Voltronic Power Technology Corp. | 142,000 | 2,660,643 | |
| Zhuzhou CRRC Times Electric Co. Ltd. (H Shares) | 102,300 | 550,677 | |
| 4,085,250 | |||
| Industrial Conglomerates - 0.0% | |||
| CK Hutchison Holdings Ltd. | 45,500 | 429,779 | |
| Quinenco SA | 222,000 | 566,471 | |
| 996,250 | |||
| Machinery - 0.5% | |||
| Airtac International Group | 393,000 | 4,061,822 | |
| China International Marine Containers Group Co. Ltd.: | |||
| rights (a)(f) | 1,009 | 1,061 | |
| (H Shares) | 38,400 | 42,272 | |
| Estun Automation Co. Ltd. (A Shares) | 59,746 | 79,604 | |
| Han's Laser Technology Industry Group Co. Ltd. (A Shares) | 29,600 | 142,020 | |
| HIWIN Technologies Corp. | 183,000 | 1,383,726 | |
| Shenzhen Inovance Technology Co. Ltd. (A Shares) | 849,200 | 2,785,573 | |
| TK Group Holdings Ltd. | 2,564,000 | 1,304,968 | |
| Weichai Power Co. Ltd. (H Shares) | 105,000 | 159,652 | |
| Zoomlion Heavy Industry Science and Technology Co. Ltd. (H Shares) | 226,600 | 132,673 | |
| 10,093,371 | |||
| Marine - 0.1% | |||
| SITC International Holdings Co. Ltd. | 2,995,000 | 3,052,478 | |
| Professional Services - 0.2% | |||
| 51job, Inc. sponsored ADR (a) | 15,000 | 1,055,250 | |
| Sporton International, Inc. | 460,000 | 2,785,492 | |
| 3,840,742 | |||
| Road & Rail - 0.3% | |||
| Localiza Rent A Car SA | 276,800 | 2,683,386 | |
| Rumo SA (a) | 490,900 | 2,422,004 | |
| 5,105,390 | |||
| Transportation Infrastructure - 0.5% | |||
| Cosco Shipping International Hk Co. Ltd. | 228,000 | 76,780 | |
| Grupo Aeroportuario Norte S.A.B. de CV | 379,600 | 2,291,110 | |
| Shanghai International Airport Co. Ltd. (A Shares) | 690,185 | 6,910,846 | |
| 9,278,736 | |||
| TOTAL INDUSTRIALS | 51,864,569 | ||
| INFORMATION TECHNOLOGY - 4.9% | |||
| Communications Equipment - 0.0% | |||
| Hytera Communications Corp. Ltd. (A Shares) | 69,300 | 86,412 | |
| Shenzhen Sunway Communication Co. Ltd. (A Shares) | 11,200 | 36,106 | |
| Xiaomi Corp. Class B (d) | 99,400 | 121,468 | |
| 243,986 | |||
| Electronic Equipment & Components - 0.4% | |||
| AVIC Jonhon OptronicTechnology Co. Ltd. | 493,220 | 2,357,170 | |
| Chaozhou Three-Circle Group Co. (A Shares) | 18,600 | 50,857 | |
| China Railway Signal & Communications Corp. (H Shares) (d) | 104,000 | 68,453 | |
| Chroma ATE, Inc. | 202,000 | 832,541 | |
| E Ink Holdings, Inc. | 131,000 | 132,902 | |
| Hangzhou Hikvision Digital Technology Co. Ltd. (A Shares) | 62,500 | 224,837 | |
| Hollysys Automation Technologies Ltd. | 7,698 | 137,178 | |
| Hon Hai Precision Industry Co. Ltd. (Foxconn) | 282,000 | 660,700 | |
| Largan Precision Co. Ltd. | 15,000 | 1,792,848 | |
| Sunny Optical Technology Group Co. Ltd. | 118,400 | 1,009,629 | |
| 7,267,115 | |||
| Internet Software & Services - 0.0% | |||
| Sogou, Inc. ADR (a) | 8,150 | 33,986 | |
| IT Services - 0.8% | |||
| Cognizant Technology Solutions Corp. Class A | 112,308 | 6,955,234 | |
| Infosys Ltd. sponsored ADR | 913,511 | 9,564,460 | |
| 16,519,694 | |||
| Semiconductors & Semiconductor Equipment - 3.2% | |||
| ASM Pacific Technology Ltd. | 204,400 | 1,982,846 | |
| MediaTek, Inc. | 249,000 | 2,455,107 | |
| Parade Technologies Ltd. | 42,000 | 649,134 | |
| Realtek Semiconductor Corp. | 114,000 | 722,846 | |
| Semiconductor Manufacturing International Corp. (a) | 164,500 | 197,873 | |
| Taiwan Semiconductor Manufacturing Co. Ltd. | 4,223,000 | 31,279,190 | |
| Taiwan Semiconductor Manufacturing Co. Ltd. sponsored ADR | 645,551 | 24,756,881 | |
| 62,043,877 | |||
| Software - 0.1% | |||
| Bilibili, Inc. ADR (a)(c) | 7,513 | 101,426 | |
| iFlytek Co. Ltd. (A Shares) | 15,300 | 64,435 | |
| Kingsoft Corp. Ltd. | 156,000 | 429,821 | |
| Koolearn Technology Holding Ltd. (a)(d) | 718,500 | 892,678 | |
| 1,488,360 | |||
| Technology Hardware, Storage & Peripherals - 0.4% | |||
| Catcher Technology Co. Ltd. | 360,000 | 2,191,364 | |
| Lenovo Group Ltd. | 416,000 | 289,200 | |
| Samsung Electronics Co. Ltd. GDR | 5,565 | 4,989,023 | |
| 7,469,587 | |||
| TOTAL INFORMATION TECHNOLOGY | 95,066,605 | ||
| MATERIALS - 2.0% | |||
| Chemicals - 0.2% | |||
| Formosa Chemicals & Fibre Corp. | 66,000 | 224,938 | |
| PhosAgro OJSC GDR (Reg. S) | 158,684 | 2,042,263 | |
| Sasol Ltd. | 28,374 | 711,835 | |
| Scientex Bhd | 681,200 | 1,367,114 | |
| Sinofert Holdings Ltd. | 1,128,000 | 130,936 | |
| 4,477,086 | |||
| Construction Materials - 0.3% | |||
| Anhui Conch Cement Co. Ltd. (A Shares) | 46,900 | 268,631 | |
| Siam Cement PCL (For. Reg.) | 402,300 | 5,739,886 | |
| 6,008,517 | |||
| Containers & Packaging - 0.1% | |||
| Greatview Aseptic Pack Co. Ltd. | 2,190,000 | 1,223,565 | |
| Metals & Mining - 1.1% | |||
| Alrosa Co. Ltd. | 1,227,130 | 1,653,841 | |
| Aluminum Corp. of China Ltd. (H Shares) (a) | 328,000 | 117,986 | |
| AngloGold Ashanti Ltd. | 75,693 | 1,007,801 | |
| China Molybdenum Co. Ltd. (H Shares) | 495,000 | 155,328 | |
| Compania de Minas Buenaventura SA sponsored ADR | 355,820 | 5,397,789 | |
| Evraz PLC | 215,816 | 1,604,331 | |
| Grupo Mexico SA de CV Series B | 1,543,788 | 3,852,627 | |
| Impala Platinum Holdings Ltd. (a) | 590,189 | 2,350,019 | |
| MMG Ltd. (a) | 4,072,000 | 1,241,408 | |
| Novolipetsk Steel OJSC GDR (Reg. S) | 26,588 | 699,264 | |
| Severstal PAO | 24,630 | 390,277 | |
| Vale SA | 189,000 | 2,360,122 | |
| Vale SA sponsored ADR | 109,444 | 1,364,767 | |
| Zijin Mining Group Co. Ltd. (H Shares) | 560,000 | 197,869 | |
| 22,393,429 | |||
| Paper & Forest Products - 0.3% | |||
| Nine Dragons Paper (Holdings) Ltd. | 864,000 | 688,815 | |
| Suzano Papel e Celulose SA | 548,517 | 4,484,365 | |
| 5,173,180 | |||
| TOTAL MATERIALS | 39,275,777 | ||
| REAL ESTATE - 0.7% | |||
| Equity Real Estate Investment Trusts (REITs) - 0.0% | |||
| Link (REIT) | 53,500 | 640,126 | |
| Real Estate Management & Development - 0.7% | |||
| Ayala Land, Inc. | 8,206,400 | 7,793,876 | |
| Cheung Kong Property Holdings Ltd. | 25,000 | 180,814 | |
| China Overseas Land and Investment Ltd. | 546,000 | 1,894,394 | |
| China Resources Land Ltd. | 114,000 | 463,879 | |
| China Vanke Co. Ltd. (H Shares) | 48,900 | 173,093 | |
| Longfor Properties Co. Ltd. | 652,000 | 2,391,081 | |
| Sun Hung Kai Properties Ltd. | 3,000 | 47,490 | |
| Wharf Real Estate Investment Co. Ltd. | 77,000 | 525,968 | |
| 13,470,595 | |||
| TOTAL REAL ESTATE | 14,110,721 | ||
| UTILITIES - 0.2% | |||
| Electric Utilities - 0.1% | |||
| Cheung Kong Infrastructure Holdings Ltd. | 38,500 | 297,361 | |
| CLP Holdings Ltd. | 9,000 | 101,772 | |
| Equatorial Energia SA | 95,200 | 2,090,108 | |
| 2,489,241 | |||
| Gas Utilities - 0.0% | |||
| China Resource Gas Group Ltd. | 58,000 | 277,809 | |
| Independent Power and Renewable Electricity Producers - 0.1% | |||
| Central Puerto SA sponsored ADR | 107,525 | 867,727 | |
| China Resources Power Holdings Co. Ltd. | 68,000 | 99,057 | |
| Huaneng Renewables Corp. Ltd. (H Shares) | 444,000 | 120,068 | |
| 1,086,852 | |||
| Water Utilities - 0.0% | |||
| SIIC Environment Holdings Ltd. | 444,000 | 94,016 | |
| TOTAL UTILITIES | 3,947,918 | ||
| TOTAL COMMON STOCKS | |||
| (Cost $693,576,691) | 720,971,179 | ||
| Nonconvertible Preferred Stocks - 1.1% | |||
| COMMUNICATION SERVICES - 0.0% | |||
| Diversified Telecommunication Services - 0.0% | |||
| Telefonica Brasil SA | 54,500 | 667,370 | |
| ENERGY - 0.2% | |||
| Oil, Gas & Consumable Fuels - 0.2% | |||
| Petroleo Brasileiro SA - Petrobras sponsored ADR | 195,166 | 2,816,245 | |
| FINANCIALS - 0.9% | |||
| Banks - 0.9% | |||
| Banco Bradesco SA (PN) | 500,020 | 4,714,826 | |
| Itau Unibanco Holding SA | 315,500 | 2,814,129 | |
| Itau Unibanco Holding SA sponsored ADR | 506,509 | 4,507,930 | |
| Itausa-Investimentos Itau SA (PN) | 200,400 | 632,770 | |
| Sberbank of Russia | 1,791,409 | 5,628,705 | |
| 18,298,360 | |||
| TOTAL NONCONVERTIBLE PREFERRED STOCKS | |||
| (Cost $20,239,560) | 21,781,975 | ||
| Equity Funds - 53.8% | |||
| Diversified Emerging Markets Funds - 53.8% | |||
| Fidelity Emerging Markets Fund (g) | 9,369,686 | 282,308,645 | |
| Fidelity SAI Emerging Markets Index Fund (g) | 41,541,943 | 539,214,411 | |
| Fidelity SAI Emerging Markets Low Volatility Index Fund (g) | 8,576,763 | 84,223,808 | |
| iShares MSCI India ETF (c) | 1,641,829 | 59,073,007 | |
| iShares MSCI South Korea Index ETF | 1,359,582 | 75,551,972 | |
| WisdomTree India Earnings ETF (c) | 186,500 | 4,929,195 | |
| TOTAL EQUITY FUNDS | |||
| (Cost $1,037,295,424) | 1,045,301,038 | ||
| Principal Amount | Value | ||
| U.S. Treasury Obligations - 0.4% | |||
| U.S. Treasury Bills, yield at date of purchase 2.31% to 2.43% 6/6/19 to 8/29/19 (h) | |||
| (Cost $6,892,390) | 6,910,000 | 6,893,595 | |
| Shares | |||
| Money Market Funds - 7.6% | |||
| Fidelity Cash Central Fund 2.41% (i) | 15,011,451 | 15,014,453 | |
| Fidelity Securities Lending Cash Central Fund 2.42% (i)(j) | 1,580,596 | 1,580,754 | |
| Invesco Government & Agency Portfolio Institutional Class 2.30% (k) | 132,104,327 | 132,104,327 | |
| TOTAL MONEY MARKET FUNDS | |||
| (Cost $148,679,486) | 148,699,534 | ||
| TOTAL INVESTMENT IN SECURITIES - 100.0% | |||
| (Cost $1,906,683,551) | 1,943,647,321 | ||
| NET OTHER ASSETS (LIABILITIES) - 0.0% | 205,207 | ||
| NET ASSETS - 100% | $1,943,852,528 |
| Futures Contracts | |||||
| Number of contracts | Expiration Date | Notional Amount | Value | Unrealized Appreciation/(Depreciation) | |
| Purchased | |||||
| Equity Index Contracts | |||||
| ICE E-mini MSCI Emerging Markets Index Contracts (United States) | 2,523 | June 2019 | $126,175,230 | $(4,737,667) | $(4,737,667) |
The notional amount of futures purchased as a percentage of Net Assets is 6.5%
For the period, the average monthly notional amount at value for futures contracts in the aggregate was $78,473,810.
Security Type Abbreviations
ETF – Exchange-Traded Fund
Legend
(a) Non-income producing
(b) Security or a portion of the security purchased on a delayed delivery or when-issued basis.
(c) Security or a portion of the security is on loan at period end.
(d) Security exempt from registration under Rule 144A of the Securities Act of 1933. These securities may be resold in transactions exempt from registration, normally to qualified institutional buyers. At the end of the period, the value of these securities amounted to $13,345,001 or 0.7% of net assets.
(e) A portion of the security sold on a delayed delivery basis.
(f) Level 3 security
(g) Affiliated Fund
(h) Security or a portion of the security was pledged to cover margin requirements for futures contracts. At period end, the value of securities pledged amounted to $6,787,823.
(i) Affiliated fund that is generally available only to investment companies and other accounts managed by Fidelity Investments. The rate quoted is the annualized seven-day yield of the fund at period end. A complete unaudited listing of the fund's holdings as of its most recent quarter end is available upon request. In addition, each Fidelity Central Fund's financial statements, which are not covered by the Fund's Report of Independent Registered Public Accounting Firm, are available on the SEC's website or upon request.
(j) Investment made with cash collateral received from securities on loan.
(k) The rate quoted is the annualized seven-day yield of the fund at period end.
Affiliated Central Funds
Information regarding fiscal year to date income earned by the Fund from investments in Fidelity Central Funds is as follows:
| Fund | Income earned |
| Fidelity Cash Central Fund | $299,322 |
| Fidelity Securities Lending Cash Central Fund | 21,074 |
| Total | $320,396 |
Amounts in the income column in the above table include any capital gain distributions from underlying funds, which are presented in the corresponding line-item in the Statement of Operations, if applicable.
Affiliated Underlying Funds
Fiscal year to date information regarding the Fund's investments in affiliated Underlying Funds, excluding any Money Market Central Funds, is presented below. Exchanges between classes of the same affiliated Underlying Funds may occur.
| Affiliate | Value, beginning of period | Purchases | Sales Proceeds | Dividend Income | Realized Gain (loss) | Change in Unrealized appreciation (depreciation) | Value, end of period |
| Fidelity Emerging Markets Fund | $-- | $960,980,949 | $675,000,000 | $5,480,949 | $(20,873,242) | $17,200,938 | $282,308,645 |
| Fidelity SAI Emerging Markets Index Fund | -- | 585,274,356 | 37,876,725 | 12,473,230 | (1,469,252) | (6,713,968) | 539,214,411 |
| Fidelity SAI Emerging Markets Low Volatility Index Fund | -- | 86,500,000 | -- | -- | -- | (2,276,192) | 84,223,808 |
| Total | $-- | $1,632,755,305 | $712,876,725 | $17,954,179 | $(22,342,494) | $8,210,778 | $905,746,864 |
Amounts in the income column in the above table include any capital gain distributions from underlying funds, which are presented in the corresponding line-item in the Statement of Operations, if applicable.
Investment Valuation
The following is a summary of the inputs used, as of May 31, 2019, involving the Fund's assets and liabilities carried at fair value. The inputs or methodology used for valuing securities may not be an indication of the risk associated with investing in those securities. For more information on valuation inputs, and their aggregation into the levels used below, please refer to the Investment Valuation section in the accompanying Notes to Financial Statements.
| Valuation Inputs at Reporting Date: | ||||
| Description | Total | Level 1 | Level 2 | Level 3 |
| Investments in Securities: | ||||
| Equities: | ||||
| Communication Services | $69,180,133 | $18,081,971 | $51,098,162 | $-- |
| Consumer Discretionary | 132,852,633 | 99,617,920 | 33,234,713 | -- |
| Consumer Staples | 68,029,776 | 68,029,776 | -- | -- |
| Energy | 47,200,114 | 36,728,922 | 10,471,192 | -- |
| Financials | 205,187,969 | 147,146,178 | 58,041,791 | -- |
| Health Care | 16,036,939 | 16,036,939 | -- | -- |
| Industrials | 51,864,569 | 51,863,508 | -- | 1,061 |
| Information Technology | 95,066,605 | 63,787,415 | 31,279,190 | -- |
| Materials | 39,275,777 | 37,556,141 | 1,719,636 | -- |
| Real Estate | 14,110,721 | 14,110,721 | -- | -- |
| Utilities | 3,947,918 | 3,947,918 | -- | -- |
| Equity Funds | 1,045,301,038 | 1,045,301,038 | -- | -- |
| Other Short-Term Investments | 6,893,595 | -- | 6,893,595 | -- |
| Money Market Funds | 148,699,534 | 148,699,534 | -- | -- |
| Total Investments in Securities: | $1,943,647,321 | $1,750,907,981 | $192,738,279 | $1,061 |
| Derivative Instruments: | ||||
| Liabilities | ||||
| Futures Contracts | $(4,737,667) | $(4,737,667) | $-- | $-- |
| Total Liabilities | $(4,737,667) | $(4,737,667) | $-- | $-- |
| Total Derivative Instruments: | $(4,737,667) | $(4,737,667) | $-- | $-- |
Value of Derivative Instruments
The following table is a summary of the Fund's value of derivative instruments by primary risk exposure as of May 31, 2019. For additional information on derivative instruments, please refer to the Derivative Instruments section in the accompanying Notes to Financial Statements.
| Primary Risk Exposure / Derivative Type | Value | |
| Asset | Liability | |
| Equity Risk | ||
| Futures Contracts(a) | $0 | $(4,737,667) |
| Total Equity Risk | 0 | (4,737,667) |
| Total Value of Derivatives | $0 | $(4,737,667) |
(a) Reflects gross cumulative appreciation (depreciation) on futures contracts as presented in the Schedule of Investments. In the Statement of Assets and Liabilities, the period end daily variation margin is included in receivable or payable for daily variation margin on futures contracts, and the net cumulative appreciation (depreciation) is included in distributable earnings.
See accompanying notes which are an integral part of the financial statements.
Financial Statements
Statement of Assets and Liabilities
| May 31, 2019 | ||
| Assets | ||
| Investment in securities, at value (including securities loaned of $1,534,425) — See accompanying schedule: Unaffiliated issuers (cost $992,572,306) | $1,021,305,250 | |
| Fidelity Central Funds (cost $16,575,159) | 16,595,207 | |
| Other affiliated issuers (cost $897,536,086) | 905,746,864 | |
| Total Investment in Securities (cost $1,906,683,551) | $1,943,647,321 | |
| Cash | 207,659 | |
| Foreign currency held at value (cost $4,170,216) | 4,160,334 | |
| Receivable for investments sold | ||
| Regular delivery | 2,473,792 | |
| Delayed delivery | 25,722 | |
| Receivable for fund shares sold | 3,174,488 | |
| Dividends receivable | 1,894,214 | |
| Interest receivable | 190,767 | |
| Distributions receivable from Fidelity Central Funds | 36,454 | |
| Receivable for daily variation margin on futures contracts | 609,752 | |
| Prepaid expenses | 16,119 | |
| Other receivables | 26,442 | |
| Total assets | 1,956,463,064 | |
| Liabilities | ||
| Payable for investments purchased | ||
| Regular delivery | $8,698,796 | |
| Delayed delivery | 668,347 | |
| Payable for fund shares redeemed | 1,006,180 | |
| Accrued management fee | 366,664 | |
| Other affiliated payables | 71,473 | |
| Other payables and accrued expenses | 217,931 | |
| Collateral on securities loaned | 1,581,145 | |
| Total liabilities | 12,610,536 | |
| Net Assets | $1,943,852,528 | |
| Net Assets consist of: | ||
| Paid in capital | $1,926,000,664 | |
| Total distributable earnings (loss) | 17,851,864 | |
| Net Assets, for 181,477,912 shares outstanding | $1,943,852,528 | |
| Net Asset Value, offering price and redemption price per share ($1,943,852,528 ÷ 181,477,912 shares) | $10.71 |
See accompanying notes which are an integral part of the financial statements.
Statement of Operations
| For the period October 30, 2018 (commencement of operations) to May 31, 2019 |
||
| Investment Income | ||
| Dividends: | ||
| Unaffiliated issuers | $9,459,420 | |
| Affiliated issuers | 17,879,439 | |
| Interest | 767,815 | |
| Income from Fidelity Central Funds | 320,396 | |
| Income before foreign taxes withheld | 28,427,070 | |
| Less foreign taxes withheld | (601,435) | |
| Total income | 27,825,635 | |
| Expenses | ||
| Management fee | $4,100,897 | |
| Accounting and security lending fees | 396,059 | |
| Custodian fees and expenses | 97,942 | |
| Independent trustees' fees and expenses | 7,792 | |
| Registration fees | 421,956 | |
| Audit | 44,832 | |
| Legal | 1,061 | |
| Miscellaneous | 3,473 | |
| Total expenses before reductions | 5,074,012 | |
| Expense reductions | (2,301,430) | |
| Total expenses after reductions | 2,772,582 | |
| Net investment income (loss) | 25,053,053 | |
| Realized and Unrealized Gain (Loss) | ||
| Net realized gain (loss) on: | ||
| Investment securities: | ||
| Unaffiliated issuers | (501,166) | |
| Fidelity Central Funds | (24,096) | |
| Other affiliated issuers | (22,342,494) | |
| Foreign currency transactions | (768,889) | |
| Futures contracts | 5,923,447 | |
| Capital gain distributions from underlying funds: | ||
| Affiliated issuers | 74,740 | |
| Total net realized gain (loss) | (17,638,458) | |
| Change in net unrealized appreciation (depreciation) on: | ||
| Investment securities: | ||
| Unaffiliated issuers | 28,732,944 | |
| Fidelity Central Funds | 20,048 | |
| Other affiliated issuers | 8,210,778 | |
| Assets and liabilities in foreign currencies | (20,750) | |
| Futures contracts | (4,737,667) | |
| Total change in net unrealized appreciation (depreciation) | 32,205,353 | |
| Net gain (loss) | 14,566,895 | |
| Net increase (decrease) in net assets resulting from operations | $39,619,948 |
See accompanying notes which are an integral part of the financial statements.
Statement of Changes in Net Assets
| For the period October 30, 2018 (commencement of operations) to May 31, 2019 |
|
| Increase (Decrease) in Net Assets | |
| Operations | |
| Net investment income (loss) | $25,053,053 |
| Net realized gain (loss) | (17,638,458) |
| Change in net unrealized appreciation (depreciation) | 32,205,353 |
| Net increase (decrease) in net assets resulting from operations | 39,619,948 |
| Distributions to shareholders | (21,398,596) |
| Total distributions | (21,398,596) |
| Share transactions | |
| Proceeds from sales of shares | 2,070,722,339 |
| Reinvestment of distributions | 21,366,662 |
| Cost of shares redeemed | (166,457,825) |
| Net increase (decrease) in net assets resulting from share transactions | 1,925,631,176 |
| Total increase (decrease) in net assets | 1,943,852,528 |
| Net Assets | |
| Beginning of period | – |
| End of period | $1,943,852,528 |
| Other Information | |
| Shares | |
| Sold | 194,955,636 |
| Issued in reinvestment of distributions | 2,130,275 |
| Redeemed | (15,607,999) |
| Net increase (decrease) | 181,477,912 |
See accompanying notes which are an integral part of the financial statements.
Financial Highlights
Strategic Advisers Fidelity Emerging Markets Fund
| Year ended May 31, | 2019 A |
| Selected Per–Share Data | |
| Net asset value, beginning of period | $10.00 |
| Income from Investment Operations | |
| Net investment income (loss)B | .18 |
| Net realized and unrealized gain (loss) | .67 |
| Total from investment operations | .85 |
| Distributions from net investment income | (.14) |
| Total distributions | (.14) |
| Net asset value, end of period | $10.71 |
| Total ReturnC,D | 8.63% |
| Ratios to Average Net AssetsE,F | |
| Expenses before reductions | .57%G |
| Expenses net of fee waivers, if any | .32%G |
| Expenses net of all reductions | .31%G |
| Net investment income (loss) | 2.82%G |
| Supplemental Data | |
| Net assets, end of period (000 omitted) | $1,943,853 |
| Portfolio turnover rateH | 125%G |
A For the period October 30, 2018 (commencement of operations) to May 31, 2019.
B Calculated based on average shares outstanding during the period.
C Total returns for periods of less than one year are not annualized.
D Total returns would have been lower if certain expenses had not been reduced during the applicable periods shown.
E Fees and expenses of any underlying Fidelity Central Funds are not included in the Fund's expense ratio. The Fund indirectly bears its proportionate share of the expenses of any underlying Fidelity Central Funds.
F Expense ratios reflect operating expenses of the Fund. Expenses before reductions do not reflect amounts reimbursed by the investment adviser or reductions from brokerage service arrangements or reductions from other expense offset arrangements and do not represent the amount paid by the Fund during periods when reimbursements or reductions occur. Expense ratios before reductions for start-up periods may not be representative of longer term operating periods. Expenses net of fee waivers reflect expenses after reimbursement by the investment adviser but prior to reductions from brokerage service arrangements or other expense offset arrangements. Expenses net of all reductions represent the net expenses paid by the Fund. Fees and expenses of the Underlying Funds are not included in the Fund's annualized ratios. The Fund indirectly bears its proportionate share of the expenses of the Underlying Funds.
G Annualized
H Amount does not include the portfolio activity of any Underlying Funds.
See accompanying notes which are an integral part of the financial statements.
Notes to Financial Statements
For the period ended May 31, 2019
1. Organization.
Strategic Advisers Fidelity Emerging Markets Fund (the Fund) is a fund of Fidelity Rutland Square Trust II (the Trust), and is authorized to issue an unlimited number of shares. The Trust is registered under the Investment Company Act of 1940, as amended (the 1940 Act), as an open-end management investment company organized as a Delaware statutory trust. The Fund is offered exclusively to certain clients of Strategic Advisers LLC (Strategic Advisers), an affiliate of Fidelity Management & Research Company (FMR).
2. Significant Accounting Policies.
The Fund is an investment company and applies the accounting and reporting guidance of the Financial Accounting Standards Board (FASB) Accounting Standards Codification Topic 946 Financial Services – Investments Companies. The financial statements have been prepared in conformity with accounting principles generally accepted in the United States of America (GAAP), which require management to make certain estimates and assumptions at the date of the financial statements. Actual results could differ from those estimates. Subsequent events, if any, through the date that the financial statements were issued have been evaluated in the preparation of the financial statements. The following summarizes the significant accounting policies of the Fund:
Investment Valuation. Investments are valued as of 4:00 p.m. Eastern time on the last calendar day of the period. The Board of Trustees (the Board) has delegated the day to day responsibility for the valuation of the Fund's investments to the Fair Value Committee (the Committee) established by the Fund's investment adviser. In accordance with valuation policies and procedures approved by the Board, the Fund attempts to obtain prices from one or more third party pricing vendors or brokers to value its investments. When current market prices, quotations or currency exchange rates are not readily available or reliable, investments will be fair valued in good faith by the Committee, in accordance with procedures adopted by the Board. Factors used in determining fair value vary by investment type and may include market or investment specific events, changes in interest rates and credit quality. The frequency with which these procedures are used cannot be predicted and they may be utilized to a significant extent. The Committee oversees the Fund's valuation policies and procedures and reports to the Board on the Committee's activities and fair value determinations. The Board monitors the appropriateness of the procedures used in valuing the Fund's investments and ratifies the fair value determinations of the Committee.
The Fund categorizes the inputs to valuation techniques used to value its investments into a disclosure hierarchy consisting of three levels as shown below:
- Level 1 – quoted prices in active markets for identical investments
- Level 2 – other significant observable inputs (including quoted prices for similar investments, interest rates, prepayment speeds, etc.)
- Level 3 – unobservable inputs (including the Fund's own assumptions based on the best information available)
Valuation techniques used to value the Fund's investments by major category are as follows:
Equity securities, including restricted securities, for which market quotations are readily available, are valued at the last reported sale price or official closing price as reported by a third party pricing vendor on the primary market or exchange on which they are traded and are categorized as Level 1 in the hierarchy. In the event there were no sales during the day or closing prices are not available, securities are valued at the last quoted bid price or may be valued using the last available price and are generally categorized as Level 2 in the hierarchy. For foreign equity securities, when market or security specific events arise, comparisons to the valuation of American Depositary Receipts (ADRs), futures contracts, Exchange-Traded Funds (ETFs) and certain indexes as well as quoted prices for similar securities may be used and would be categorized as Level 2 in the hierarchy. For equity securities, including restricted securities, where observable inputs are limited, assumptions about market activity and risk are used and these securities may be categorized as Level 3 in the hierarchy.
Debt securities, including restricted securities, are valued based on evaluated prices received from third party pricing vendors or from brokers who make markets in such securities. U.S. government and government agency obligations are valued by pricing vendors who utilize matrix pricing which considers yield or price of bonds of comparable quality, coupon, maturity and type or by broker-supplied prices. When independent prices are unavailable or unreliable, debt securities may be valued utilizing pricing methodologies which consider similar factors that would be used by third party pricing vendors. Debt securities are generally categorized as Level 2 in the hierarchy but may be Level 3 depending on the circumstances. ETFs are valued at their last sale price or official closing price as reported by a third party pricing vendor on the primary market or exchange on which they are traded and are categorized as Level 1 in the hierarchy. In the event there were no sales during the day but the exchange reports a closing bid level, ETFs are valued at the closing bid and would be categorized as Level 1 in the hierarchy. In the event there was no closing bid, ETFs may be valued by another method that the Board believes reflects fair value in accordance with the Board's fair value pricing policies and may be categorized as Level 2 in the hierarchy.
Futures contracts are valued at the settlement price established each day by the board of trade or exchange on which they are traded and are categorized as Level 1 in the hierarchy. Investments in open-end mutual funds, including the Fidelity Central Funds, are valued at their closing net asset value (NAV) each business day and are categorized as Level 1 in the hierarchy. If an unaffiliated open-end mutual fund's NAV is unavailable, shares of that fund may be valued by another method that the Board believes reflects fair value in accordance with the Board's fair value pricing policies and is categorized as Level 2 in the hierarchy.
Changes in valuation techniques may result in transfers in or out of an assigned level within the disclosure hierarchy. The aggregate value of investments by input level as of May 31, 2019 is included at the end of the Fund's Schedule of Investments.
Foreign Currency. The Fund may use foreign currency contracts to facilitate transactions in foreign-denominated securities. Gains and losses from these transactions may arise from changes in the value of the foreign currency or if the counterparties do not perform under the contracts' terms.
Foreign-denominated assets, including investment securities, and liabilities are translated into U.S. dollars at the exchange rates at period end. Purchases and sales of investment securities, income and dividends received and expenses denominated in foreign currencies are translated into U.S. dollars at the exchange rate in effect on the transaction date.
The effects of exchange rate fluctuations on investments are included with the net realized and unrealized gain (loss) on investment securities. Other foreign currency transactions resulting in realized and unrealized gain (loss) are disclosed separately.
Investment Transactions and Income. For financial reporting purposes, the Fund's investment holdings and NAV include trades executed through the end of the last business day of the period. The NAV per share for processing shareholder transactions is calculated as of the close of business of the New York Stock Exchange (NYSE), normally 4:00 p.m. Eastern time and includes trades executed through the end of the prior business day. Gains and losses on securities sold are determined on the basis of identified cost. Dividend income is recorded on the ex-dividend date, except for certain dividends from foreign securities where the ex-dividend date may have passed, which are recorded as soon as the Fund is informed of the ex-dividend date. Non-cash dividends included in dividend income, if any, are recorded at the fair market value of the securities received. Income and capital gain distributions from Fidelity Central Funds, if any, are recorded on the ex-dividend date. Income and capital gain distributions from Underlying Funds and distributions from ETFs, if any, are recorded on the ex-dividend date. Interest income is accrued as earned and includes coupon interest and amortization of premium and accretion of discount on debt securities as applicable. Investment income is recorded net of foreign taxes withheld where recovery of such taxes is uncertain.
Expenses. Expenses directly attributable to a fund are charged to that fund. Expenses attributable to more than one fund are allocated among the respective funds on the basis of relative net assets or other appropriate methods. Expense estimates are accrued in the period to which they relate and adjustments are made when actual amounts are known.
Deferred Trustee Compensation. Under a Deferred Compensation Plan (the Plan), certain independent Trustees have elected to defer receipt of a portion of their annual compensation. Deferred amounts are invested in a cross-section of Strategic Advisers funds, are marked-to-market and remain in the Fund until distributed in accordance with the Plan. The investment of deferred amounts and the offsetting payable to the Trustees of $9 are included in the accompanying Statement of Assets and Liabilities in other receivables and other payables and accrued expenses, respectively.
Income Tax Information and Distributions to Shareholders. Each year, the Fund intends to qualify as a regulated investment company under Subchapter M of the Internal Revenue Code, including distributing substantially all of its taxable income and realized gains. As a result, no provision for U.S. Federal income taxes is required. As of May 31, 2019, the Fund did not have any unrecognized tax benefits in the financial statements; nor is the Fund aware of any tax positions for which it is reasonably possible that the total amounts of unrecognized tax benefits will significantly change in the next twelve months. The Fund files a U.S. federal tax return, in addition to state and local tax returns as required. The Fund's federal income tax returns are subject to examination by the Internal Revenue Service (IRS) for a period of three fiscal years after they are filed. State and local tax returns may be subject to examination for an additional fiscal year depending on the jurisdiction. Foreign taxes are provided for based on the Fund's understanding of the tax rules and rates that exist in the foreign markets in which it invests.
Distributions are declared and recorded on the ex-dividend date. Income and capital gain distributions are determined in accordance with income tax regulations, which may differ from GAAP. In addition, the Fund claimed a portion of the payment made to redeeming shareholders as a distribution for income tax purposes.
Capital accounts within the financial statements are adjusted for permanent book-tax differences. These adjustments have no impact on net assets or the results of operations. Capital accounts are not adjusted for temporary book-tax differences which will reverse in a subsequent period.
Book-tax differences are primarily due to the short-term gain distributions from the Underlying Funds, futures contracts, foreign currency transactions, market discount, deferred trustees compensation, capital loss carryforwards, and losses deferred due to wash sales.
As of period end, the cost and unrealized appreciation (depreciation) in securities, and derivatives if applicable, for federal income tax purposes were as follows:
| Gross unrealized appreciation | $80,604,456 |
| Gross unrealized depreciation | (47,800,288) |
| Net unrealized appreciation (depreciation) | $32,804,168 |
| Tax Cost | $1,910,843,153 |
The tax-based components of distributable earnings as of period end were as follows:
| Undistributed ordinary income | $2,570,556 |
| Capital loss carryforward | $(17,498,944) |
| Net unrealized appreciation (depreciation) on securities and other investments | $32,780,261 |
Capital loss carryforwards are only available to offset future capital gains of the Fund to the extent provided by regulations and may be limited. Under the Regulated Investment Company Modernization Act of 2010 (the Act), the Fund is permitted to carry forward capital losses incurred in taxable years beginning after December 22, 2010 for an unlimited period and such capital losses are required to be used prior to any losses that expire. The capital loss carryforward information presented below, including any applicable limitation, is estimated as of fiscal period end and is subject to adjustment.
| No expiration | |
| Short-term | $(17,498,944) |
The tax character of distributions paid was as follows:
| May 31, 2019(a) | |
| Ordinary Income | $21,398,596 |
(a) For the period October 30, 2018 (commencement of operations) to May 31, 2019.
Delayed Delivery Transactions and When-Issued Securities. During the period, the Fund transacted in securities on a delayed delivery or when-issued basis. Payment and delivery may take place after the customary settlement period for that security. The price of the underlying securities and the date when the securities will be delivered and paid for are fixed at the time the transaction is negotiated. The securities purchased on a delayed delivery or when-issued basis are identified as such in the Fund's Schedule of Investments. Losses may arise due to changes in the value of the underlying securities or if the counterparty does not perform under the contract's terms, or if the issuer does not issue the securities due to political, economic, or other factors.
Restricted Securities. The Fund may invest in securities that are subject to legal or contractual restrictions on resale. These securities generally may be resold in transactions exempt from registration or to the public if the securities are registered. Disposal of these securities may involve time-consuming negotiations and expense, and prompt sale at an acceptable price may be difficult. Information regarding restricted securities is included at the end of the Fund's Schedule of Investments.
3. Derivative Instruments.
Risk Exposures and the Use of Derivative Instruments. The Fund's investment objective allows the Fund to enter into various types of derivative contracts, including futures contracts. Derivatives are investments whose value is primarily derived from underlying assets, indices or reference rates and may be transacted on an exchange or over-the-counter (OTC). Derivatives may involve a future commitment to buy or sell a specified asset based on specified terms, to exchange future cash flows at periodic intervals based on a notional principal amount, or for one party to make one or more payments upon the occurrence of specified events in exchange for periodic payments from the other party.
The Fund used derivatives to increase returns and to manage exposure to certain risks as defined below. The success of any strategy involving derivatives depends on analysis of numerous economic factors, and if the strategies for investment do not work as intended, the Fund may not achieve its objectives.
The Fund's use of derivatives increased or decreased its exposure to the following risk:
| Equity Risk | Equity risk relates to the fluctuations in the value of financial instruments as a result of changes in market prices (other than those arising from interest rate risk or foreign exchange risk), whether caused by factors specific to an individual investment, its issuer, or all factors affecting all instruments traded in a market or market segment. |
The Fund is also exposed to additional risks from investing in derivatives, such as liquidity risk and counterparty credit risk. Liquidity risk is the risk that the Fund will be unable to close out the derivative in the open market in a timely manner. Counterparty credit risk is the risk that the counterparty will not be able to fulfill its obligation to the Fund. Counterparty credit risk related to exchange-traded futures contracts may be mitigated by the protection provided by the exchange on which they trade.
Investing in derivatives may involve greater risks than investing in the underlying assets directly and, to varying degrees, may involve risk of loss in excess of any initial investment and collateral received and amounts recognized in the Statement of Assets and Liabilities. In addition, there may be the risk that the change in value of the derivative contract does not correspond to the change in value of the underlying instrument.
Futures Contracts. A futures contract is an agreement between two parties to buy or sell a specified underlying instrument for a fixed price at a specified future date. The Fund used futures contracts to manage its exposure to the stock market.
Upon entering into a futures contract, a fund is required to deposit either cash or securities (initial margin) with a clearing broker in an amount equal to a certain percentage of the face value of the contract. Futures contracts are marked-to-market daily and subsequent daily payments (variation margin) are made or received by a fund depending on the daily fluctuations in the value of the futures contracts and are recorded as unrealized appreciation or (depreciation). This receivable and/or payable, if any, is included in daily variation margin on futures contracts in the Statement of Assets and Liabilities. Realized gain or (loss) is recorded upon the expiration or closing of a futures contract. The net realized gain (loss) and change in net unrealized appreciation (depreciation) on futures contracts during the period is presented in the Statement of Operations.
Any open futures contracts at period end are presented in the Schedule of Investments under the caption "Futures Contracts". The notional amount at value reflects each contract's exposure to the underlying instrument or index at period end. Securities deposited to meet initial margin requirements are identified in the Schedule of Investments.
4. Purchases and Sales of Investments.
Purchases and sales of securities, other than short-term securities aggregated $2,851,092,361 and $1,077,131,457, respectively.
5. Fees and Other Transactions with Affiliates.
Management Fee. Strategic Advisers (the investment adviser) provides the Fund with investment management related services. For these services, the Fund pays a monthly management fee to the investment adviser. The management fee is calculated by adding the annual management fee rate of .25% of the Fund's average net assets throughout the month payable to the investment adviser to the aggregate of the fee rates, payable monthly, to the Fund's sub-advisers. The Fund's maximum aggregate management fee will not exceed 1.20% of the Fund's average net assets. For the reporting period, the total annualized management fee rate was .46% of the Fund's average net assets.
During the period, the investment adviser waived its management fee as described in the Expense Reductions note.
Sub-Advisers. FIAM LLC (an affiliate of the investment adviser) and FIL Investment Advisors each served as a sub-adviser for the Fund during the period. Sub-advisers provide discretionary investment advisory services for their allocated portion of the Fund's assets and are paid by the investment adviser and not the Fund for providing these services.
Geode Capital Management, LLC (Geode) has been retained to serve as a sub-adviser for the Fund. As of the date of this report, however, Geode has not been allocated any portion of the Fund's assets. Geode in the future may provide discretionary investment advisory services for an allocated portion of the Fund's assets and will be paid by the investment adviser for providing these services.
Accounting and Security Lending Fees. Fidelity Service Company, Inc. (FSC), an affiliate of the investment adviser, maintains the Fund's accounting records. The accounting fee is based on the level of average net assets for each month. Prior to April 1, 2019, FSC had a separate agreement with the Fund for administration of the security lending program, based on the number and duration of lending transactions. For the period, the total fees paid for accounting and administration of securities lending were equivalent to an annualized rate of .04%.
During June 2019, the Board approved that effective July 1, 2019 accounting fees will not be paid by the Fund and will instead be paid by the investment adviser or an affiliate.
Brokerage Commissions. The Fund placed a portion of its portfolio transactions with brokerage firms which are affiliates of the investment adviser. Brokerage commissions are included in net realized gain (loss) and change in net unrealized appreciation (depreciation) in the Statement of Operations. The commissions paid to these affiliated firms were $2,716 for the period.
Interfund Trades. The Fund may purchase from or sell securities to other funds affiliated with each sub-adviser under procedures adopted by the Board. The procedures have been designed to ensure these interfund trades are executed in accordance with Rule 17a-7 of the 1940 Act. Interfund trades are included within the respective purchases and sales amounts shown in the Purchases and Sales of Investments note.
Other. During the period, the investment adviser reimbursed the Fund for certain losses in the amount of $4,820.
6. Investments in Fidelity Central Funds.
The Fund invests in Fidelity Central Funds, which are open-end investment companies available only to other investment companies and accounts managed by the investment adviser and its affiliates. The Fund's Schedule of Investments lists each of the Fidelity Central Funds held as of period end, if any, as an investment of the Fund, but does not include the underlying holdings of each Fidelity Central Fund. As an Investing Fund, the Fund indirectly bears its proportionate share of the expenses of the underlying Fidelity Central Funds.
The Fidelity Money Market Central Funds are managed by Fidelity Investments Money Management, Inc. (FIMM), an affiliate of the investment adviser. Annualized expenses of the Money Market Central Funds as of their most recent shareholder report date ranged from less than .005% to .01%.
A complete unaudited list of holdings for each Fidelity Central Fund is available upon request or at the Securities and Exchange Commission (the SEC) website at www.sec.gov. In addition, the financial statements of the Fidelity Central Funds, which are not covered by the Fund's Report of Independent Registered Public Accounting Firm, are available on the SEC website or upon request.
7. Committed Line of Credit.
The Fund participates with other funds managed by the investment adviser or an affiliate in a $4.25 billion credit facility (the "line of credit") to be utilized for temporary or emergency purposes to fund shareholder redemptions or for other short-term liquidity purposes. The Fund has agreed to pay commitment fees on its pro-rata portion of the line of credit, which amounted to $374 and is reflected in Miscellaneous expenses on the Statement of Operations. During the period, the Fund did not borrow on this line of credit.
8. Security Lending.
The Fund lends portfolio securities through a lending agent from time to time in order to earn additional income. On the settlement date of the loan, the Fund receives collateral (in the form of U.S. Treasury obligations, letters of credit and/or cash) against the loaned securities and maintains collateral in an amount not less than 100% of the market value of the loaned securities during the period of the loan. The market value of the loaned securities is determined at the close of business of the Fund and any additional required collateral is delivered to the Fund on the next business day. The Fund or borrower may terminate the loan at any time, and if the borrower defaults on its obligation to return the securities loaned because of insolvency or other reasons, the Fund may apply collateral received from the borrower against the obligation. The Fund may experience delays and costs in recovering the securities loaned. Any cash collateral received is invested in the Fidelity Securities Lending Cash Central Fund. The value of loaned securities and cash collateral at period end are disclosed on the Fund's Statement of Assets and Liabilities. Security lending income represents the income earned on investing cash collateral, less rebates paid to borrowers and any lending agent fees associated with the loan, plus any premium payments received for lending certain types of securities. Security lending income is presented in the Statement of Operations as a component of income from Fidelity Central Funds. Total security lending income during the period amounted to $21,074.
9. Expense Reductions.
The investment adviser has contractually agreed to waive the Fund's management fee in an amount equal to .25% of the Fund's average net assets until September 30, 2022. During the period, this waiver reduced the Fund's management fee by $2,226,492.
Commissions paid to certain brokers with whom the investment adviser, or its affiliates, places trades on behalf of the Fund include an amount in addition to trade execution, which may be rebated back to the Fund to offset certain expenses. This amount totaled $31,500 for the period.
In addition, through arrangements with the Fund's custodian, credits realized as a result of certain uninvested cash balances were used to reduce the Fund's expenses. During the period, custody credits amounted to $43,438.
10. Other.
The Fund's organizational documents provide former and current trustees and officers with a limited indemnification against liabilities arising in connection with the performance of their duties to the Fund. In the normal course of business, the Fund may also enter into contracts that provide general indemnifications. The Fund's maximum exposure under these arrangements is unknown as this would be dependent on future claims that may be made against the Fund. The risk of material loss from such claims is considered remote.
The Fund does not invest in the Underlying Funds for the purpose of exercising management or control; however, investments by the Fund within its principal investment strategies may represent a significant portion of an Underlying Fund's net assets. At the end of the period, the Fund was the owner of record of 10% or more of the total outstanding shares of the following Underlying Funds.
| Fund | % of shares held |
| Fidelity SAI Emerging Markets Index Fund | 15% |
| Fidelity SAI Emerging Markets Low Volatility Index Fund | 12% |
Report of Independent Registered Public Accounting Firm
To the Board of Trustees of Fidelity Rutland Square Trust II and Shareholders of Strategic Advisers Fidelity Emerging Markets Fund:
Opinion on the Financial Statements
We have audited the accompanying statement of assets and liabilities, including the schedule of investments, of Strategic Advisers Fidelity Emerging Markets Fund (one of the funds constituting Fidelity Rutland Square Trust II, referred to hereafter as the “Fund”) as of May 31, 2019, and the related statements of operations and changes in net assets, including the related notes, and the financial highlights for the period October 30, 2018 (commencement of operations) through May 31, 2019 (collectively referred to as the “financial statements”). In our opinion, the financial statements present fairly, in all material respects, the financial position of the Fund as of May 31, 2019, and the results of its operations, changes in its net assets, and the financial highlights for the period October 30, 2018 (commencement of operations) through May 31, 2019 in conformity with accounting principles generally accepted in the United States of America.
Basis for Opinion
These financial statements are the responsibility of the Fund’s management. Our responsibility is to express an opinion on the Fund’s financial statements based on our audit. We are a public accounting firm registered with the Public Company Accounting Oversight Board (United States) (PCAOB) and are required to be independent with respect to the Fund in accordance with the U.S. federal securities laws and the applicable rules and regulations of the Securities and Exchange Commission and the PCAOB.
We conducted our audit of these financial statements in accordance with the standards of the PCAOB. Those standards require that we plan and perform the audit to obtain reasonable assurance about whether the financial statements are free of material misstatement, whether due to error or fraud.
Our audit included performing procedures to assess the risks of material misstatement of the financial statements, whether due to error or fraud, and performing procedures that respond to those risks. Such procedures included examining, on a test basis, evidence regarding the amounts and disclosures in the financial statements. Our audit also included evaluating the accounting principles used and significant estimates made by management, as well as evaluating the overall presentation of the financial statements. Our procedures included confirmation of securities owned as of May 31, 2019 by correspondence with the custodian and brokers; when replies were not received from brokers, we performed other auditing procedures. We believe that our audit provides a reasonable basis for our opinion.
PricewaterhouseCoopers LLP
Boston, Massachusetts
July 16, 2019
We have served as the auditor of one or more investment companies in the Fidelity group of funds since 1932.
Trustees and Officers
The Trustees, Members of the Advisory Board (if any), and officers of the trust and fund, as applicable, are listed below. The Board of Trustees governs the fund and is responsible for protecting the interests of shareholders. The Trustees are experienced executives who meet periodically throughout the year to oversee the fund's activities, review contractual arrangements with companies that provide services to the fund, oversee management of the risks associated with such activities and contractual arrangements, and review the fund's performance. If the interests of the fund and an underlying Fidelity® fund were to diverge, a conflict of interest could arise and affect how the Trustees and Members of the Advisory Board fulfill their fiduciary duties to the affected funds. Strategic Advisers has structured the fund to avoid these potential conflicts, although there may be situations where a conflict of interest is unavoidable. In such instances, Strategic Advisers, the Trustees, and Members of the Advisory Board would take reasonable steps to minimize and, if possible, eliminate the conflict. Each of the Trustees oversees 14 funds.
The Trustees hold office without limit in time except that (a) any Trustee may resign; (b) any Trustee may be removed by written instrument, signed by at least two-thirds of the number of Trustees prior to such removal; (c) any Trustee who requests to be retired or who has become incapacitated by illness or injury may be retired by written instrument signed by a majority of the other Trustees; and (d) any Trustee may be removed at any special meeting of shareholders by a two-thirds vote of the outstanding voting securities of the trust. Officers and Advisory Board Members hold office without limit in time, except that any officer or Advisory Board Member may resign or may be removed by a vote of a majority of the Trustees at any regular meeting or any special meeting of the Trustees. Except as indicated, each individual has held the office shown or other offices in the same company for the past five years.
Each Trustee who is not an interested person (as defined in the 1940 Act) of the trust and the fund is referred to herein as an Independent Trustee.
The fund’s Statement of Additional Information (SAI) includes more information about the Trustees. To request a free copy, call Fidelity at 1-800-544-3455.
Experience, Skills, Attributes, and Qualifications of the Trustees. The Governance and Nominating Committee has adopted a statement of policy that describes the experience, qualifications, attributes, and skills that are necessary and desirable for potential Independent Trustee candidates (Statement of Policy). The Board believes that each Trustee satisfied at the time he or she was initially elected or appointed a Trustee, and continues to satisfy, the standards contemplated by the Statement of Policy. The Governance and Nominating Committee may also engage professional search firms to help identify potential Independent Trustee candidates with experience, qualifications, attributes, and skills consistent with the Statement of Policy. Additional criteria based on the composition and skills of the current Independent Trustees, as well as experience or skills that may be appropriate in light of future changes to board composition, business conditions, and regulatory or other developments, may be considered by the professional search firms and the Governance and Nominating Committee. In addition, the Board takes into account the Trustees' commitment and participation in Board and committee meetings, as well as their leadership of standing and ad hoc committees throughout their tenure.
In determining that a particular Trustee was and continues to be qualified to serve as a Trustee, the Board has considered a variety of criteria, none of which, in isolation, was controlling. The Board believes that, collectively, the Trustees have balanced and diverse experience, qualifications, attributes, and skills, which allow the Board to operate effectively in governing the fund and protecting the interests of shareholders. Information about the specific experience, skills, attributes, and qualifications of each Trustee, which in each case led to the Board's conclusion that the Trustee should serve (or continue to serve) as a trustee of the fund, is provided below.
Board Structure and Oversight Function. Robert A. Lawrence is an interested person and currently serves as Chairman. The Trustees have determined that an interested Chairman is appropriate and benefits shareholders because an interested Chairman has a personal and professional stake in the quality and continuity of services provided to the fund. Independent Trustees exercise their informed business judgment to appoint an individual of their choosing to serve as Chairman, regardless of whether the Trustee happens to be independent or a member of management. The Independent Trustees have determined that they can act independently and effectively without having an Independent Trustee serve as Chairman and that a key structural component for assuring that they are in a position to do so is for the Independent Trustees to constitute a substantial majority for the Board. The Independent Trustees also regularly meet in executive session. Mary C. Farrell serves as the lead Independent Trustee and as such (i) acts as a liaison between the Independent Trustees and management with respect to matters important to the Independent Trustees and (ii) with management prepares agendas for Board meetings.
Fidelity® funds are overseen by different Boards of Trustees. The fund's Board oversees asset allocation funds. Other Boards oversee Fidelity's investment-grade bond, money market, and asset allocation funds, and Fidelity's equity and high income funds. The fund may invest in Fidelity® funds overseen by such other Boards. The use of separate Boards, each with its own committee structure, allows the Trustees of each group of Fidelity® funds to focus on the unique issues of the funds they oversee, including common research, investment, and operational issues.
The Trustees primarily operate as a full Board, but also operate in committees, to facilitate the timely and efficient consideration of all matters of importance to the Trustees, the fund, and fund shareholders and to facilitate compliance with legal and regulatory requirements and oversight of the fund's activities and associated risks. The Board has charged Strategic Advisers and its affiliates with (i) identifying events or circumstances the occurrence of which could have demonstrably adverse effects on the fund's business and/or reputation; (ii) implementing processes and controls to lessen the possibility that such events or circumstances occur or to mitigate the effects of such events or circumstances if they do occur; and (iii) creating and maintaining a system designed to evaluate continuously business and market conditions in order to facilitate the identification and implementation processes described in (i) and (ii) above. Because the day-to-day operations and activities of the fund are carried out by or through Strategic Advisers, its affiliates and other service providers, the fund's exposure to risks is mitigated but not eliminated by the processes overseen by the Trustees. Board oversight of different aspects of the fund's activities is exercised primarily through the full Board, but also through the Audit and Compliance Committee. Appropriate personnel, including but not limited to the fund's Chief Compliance Officer (CCO), FMR's internal auditor, the independent accountants, the fund's Treasurer and portfolio management personnel, make periodic reports to the Board's committees, as appropriate. The responsibilities of each standing committee, including their oversight responsibilities, are described further under "Standing Committees of the Trustees."
Interested Trustees*:
Correspondence intended for a Trustee who is an interested person may be sent to Fidelity Investments, 245 Summer Street, Boston, Massachusetts 02210.
Name, Year of Birth; Principal Occupations and Other Relevant Experience+
Brian B. Hogan (1964)
Year of Election or Appointment: 2018
Trustee
Mr. Hogan also serves as Trustee of other funds. Mr. Hogan serves as Head of Fidelity Investments’ Investment Solutions and Innovation organization (2018-present), a Director of Strategic Advisers LLC (2018-present), and a Director of Fidelity SelectCo, LLC (investment adviser firm, 2014-present). Previously, Mr. Hogan served as President of FMR Co., Inc. (2009-2018), a Vice President of Fidelity's Equity and High Income funds (2009-2018), a Director of FMR Investment Management (UK) Limited (investment adviser firm, 2015-2018), Trustee of certain Fidelity® funds (2014-2018), President of the Equity Division of FMR (investment adviser firm, 2009-2018), Senior Vice President, Equity Research of FMR (2006-2009), and as a portfolio manager. Mr. Brian B. Hogan is not related to Mr. Colm A. Hogan.
Robert A. Lawrence (1952)
Year of Election or Appointment: 2016
Trustee
Chairman of the Board of Trustees
Mr. Lawrence also serves as Trustee of other funds. Previously, Mr. Lawrence served as a Member of the Advisory Board of certain funds. Prior to his retirement in 2008, Mr. Lawrence served as Vice President of certain Fidelity® funds (2006-2008), Senior Vice President, Head of High Income Division of Fidelity Management & Research Company (investment adviser firm, 2006-2008), and President of Fidelity Strategic Investments (investment adviser firm, 2002-2005).
* Determined to be an "Interested Trustee" by virtue of, among other things, his or her affiliation with the trust or various entities under common control with Strategic Advisers.
+ The information includes the Trustee's principal occupation during the last five years and other information relating to the experience, attributes, and skills relevant to the Trustee's qualifications to serve as a Trustee, which led to the conclusion that the Trustee should serve as a Trustee for the fund.
Independent Trustees:
Correspondence intended for an Independent Trustee may be sent to Fidelity Investments, P.O. Box 55235, Boston, Massachusetts 02205-5235.
Name, Year of Birth; Principal Occupations and Other Relevant Experience+
Peter C. Aldrich (1944)
Year of Election or Appointment: 2006
Trustee
Mr. Aldrich also serves as Trustee of other funds. Mr. Aldrich is a Director of the National Bureau of Economic Research, a Director of the funds of BlackRock Realty Group (2006-present), and a Director of LivelyHood, Inc. (private corporation, 2013-present). Previously, Mr. Aldrich served as a Trustee for the Fidelity Rutland Square Trust (2005-2010), a Managing Member of Poseidon, LLC (foreign private investment, 1998-2004), and Chairman and Managing Member of AEGIS, LLC (foreign private investment, 1997-2004). Mr. Aldrich previously was a founder, Chief Executive Officer, and Chairman of AEW Capital Management, L.P. (then “Aldrich, Eastman and Waltch, L.P.”). Mr. Aldrich also served as a Director of Zipcar, Inc. (car sharing services, 2001-2009) and as Faculty Chairman of The Research Council on Global Investment of The Conference Board (business and professional education non-profit, 1999-2004). Mr. Aldrich is a Member Emeritus of the Board of Trustees of the Museum of Fine Arts Boston and an Overseer of the Massachusetts Eye and Ear Infirmary.
Ralph F. Cox (1932)
Year of Election or Appointment: 2006
Trustee
Mr. Cox also serves as Trustee of other funds. Mr. Cox is President of RABAR Enterprises (management consulting for the petroleum industry). Mr. Cox is a Director of Abraxas Petroleum (exploration and production, 1999-present). Mr. Cox is a member of the Advisory Boards of the Business and Engineering Schools of Texas A&M University and the Engineering School of University of Texas at Austin. Previously, Mr. Cox served as a Trustee for the Fidelity Rutland Square Trust (2005-2010) and as an Advisory Director of CH2M Hill Companies (engineering, 1981-2011). Mr. Ralph F. Cox and Mr. Howard E. Cox, Jr. are not related.
Mary C. Farrell (1949)
Year of Election or Appointment: 2013
Trustee
Ms. Farrell also serves as Trustee of other funds. Ms. Farrell is a Director of the W.R. Berkley Corporation (insurance provider) and President (2009-present) and Director (2006-present) of the Howard Gilman Foundation (charitable organization). Previously, Ms. Farrell was Managing Director and Chief Investment Strategist at UBS Wealth Management USA and Co-Head of UBS Wealth Management Investment Strategy & Research Group (2003-2005). Ms. Farrell also served as Investment Strategist at PaineWebber (1982-2000) and UBS PaineWebber (2000-2002). Ms. Farrell serves as Chairman of the Board of Trustees of Yale-New Haven Hospital and on the Yale New Haven Health System Board and previously served as Trustee on the Board of Overseers of the New York University Stern School of Business.
Karen Kaplan (1960)
Year of Election or Appointment: 2006
Trustee
Ms. Kaplan also serves as Trustee of other funds. Ms. Kaplan is Chairman (2014-present) and Chief Executive Officer (2013-present) of Hill Holliday (advertising and specialized marketing). Ms. Kaplan is a Director of The Michaels Companies, Inc. (specialty retailer, 2015-present), Member of the Board of Governors of the Chief Executives’ Club of Boston (2010-present), Member of the Executive Committee of the Greater Boston Chamber of Commerce (2006-present), Advisory Board Member of the National Association of Corporate Directors Chapter (2012-present), Member of the Board of Trustees of the Post Office Square Trust (2012-present), Trustee of the Brigham and Women’s Hospital (2016-present), Overseer of the Boston Symphony Orchestra (2014-present), Member of the Board of Directors of The Advertising Council, Inc. (2016-present), and Member of the Ron Burton Training Village Executive Board of Advisors (2018-present). Previously, Ms. Kaplan served as an Advisory Board Member of Fidelity Rutland Square Trust (2006-2010), a member of the Clinton Global Initiative (2010-2015), Director of DSM (dba Delta Dental and DentaQuest) (2004-2014), Formal Appointee of the 2015 Baker-Polito Economic Development Council, Director of Vera Bradley Inc. (designer of women’s accessories, 2012-2015), Member of the Board of Directors of the Massachusetts Conference for Women (2008-2015), Member of the Board of Directors of Jobs for Massachusetts (2012-2015), President of the Massachusetts Women’s Forum (2008-2010), Treasurer of the Massachusetts Women’s Forum (2002-2006), and Vice Chair of the Board of the Massachusetts Society for the Prevention of Cruelty to Children (2003-2010).
Heidi L. Steiger (1953)
Year of Election or Appointment: 2017
Trustee
Ms. Steiger also serves as Trustee of other funds. Ms. Steiger serves as a member of the Global Advisory Board and Of Counsel to Signum Global Advisors (international policy and strategy, 2018-present), a guest lecturer in the joint degree program in Global Luxury Management at North Carolina State University (Raleigh, NC) and Skema (Paris) (2018-present), Managing Partner of Topridge Associates, LLC (consulting, 2005-present), a Non-Executive Director of CrowdBureau Corporation (financial technology company and index provider, 2018-present), and a member of the Board of Directors (2013-present) and Chair of the Audit Committee and member of the Membership and Executive Committees (2017-present) of Business Executives for National Security (nonprofit). Previously, Ms. Steiger served as Eastern Region President of The Private Client Reserve of U.S. Bancorp (banking and financial services, 2010-2015), Advisory Director of Berkshire Capital Securities, LLC (financial services, 2009-2010), President and Senior Advisor of Lowenhaupt Global Advisors, LLC (financial services, 2005-2007), and President and Contributing Editor of Worth Magazine (2004-2005) and held a variety of positions at Neuberger Berman Group, LLC (financial services, 1986-2004), including Partner and Executive Vice President and Global Head of Private Asset Management at Neuberger Berman (1999-2004). Ms. Steiger also served as a member of the Board of Directors of Nuclear Electric Insurance Ltd (insurer of nuclear utilities, 2006-2017), a member of the Board of Trustees and Audit Committee of the Eaton Vance Funds (2007-2010), a member of the Board of Directors of Aviva USA (formerly AmerUs) (insurance, 2004-2014), and a member of the Board of Trustees and Audit Committee and Chair of the Investment Committee of CIFG (financial guaranty insurance, 2009-2012), and a member of the Board of Directors of Kin Group Plc (formerly, Fitbug Holdings) (health and technology, 2016-2017).
+ The information includes the Trustee's principal occupation during the last five years and other information relating to the experience, attributes, and skills relevant to the Trustee's qualifications to serve as a Trustee, which led to the conclusion that the Trustee should serve as a Trustee for the fund.
Advisory Board Members and Officers:
Correspondence intended for an officer or Howard E. Cox, Jr. may be sent to Fidelity Investments, 245 Summer Street, Boston, Massachusetts 02210. Officers appear below in alphabetical order.
Name, Year of Birth; Principal Occupation
Howard E. Cox, Jr. (1944)
Year of Election or Appointment: 2009
Member of the Advisory Board
Mr. Cox also serves as Member of the Advisory Board of other funds. Mr. Cox is a Partner of Greylock (venture capital, 1971-present) and a Director of Stryker Corporation (medical products and services, 1974-present). Previously, Mr. Cox served as an Advisory Board Member of Fidelity Rutland Square Trust (2006-2010). Mr. Cox also serves as a Member of the Secretary of Defense's Business Board of Directors (2008-present), a Director of Business Executives for National Security (1997-present), a Director of the Brookings Institution (2010-present), a Director of the World Economic Forum’s Young Global Leaders Foundation (2009-present), and is a Member of the Harvard Medical School Board of Fellows (2002-present). Mr. Howard E. Cox, Jr. and Mr. Ralph F. Cox are not related.
Elizabeth Paige Baumann (1968)
Year of Election or Appointment: 2017
Anti-Money Laundering (AML) Officer
Ms. Baumann also serves as AML Officer of other funds. She is Chief AML Officer (2012-present) and Senior Vice President (2014-present) of FMR LLC (diversified financial services company) and is an employee of Fidelity Investments. Previously, Ms. Baumann served as AML Officer of the funds (2012-2016), and Vice President (2007-2014) and Deputy Anti-Money Laundering Officer (2007-2012) of FMR LLC.
Craig S. Brown (1977)
Year of Election or Appointment: 2019
Assistant Treasurer
Mr. Brown also serves as Assistant Treasurer of other funds. Mr. Brown is an employee of Fidelity Investments (2013-present).
John J. Burke III (1964)
Year of Election or Appointment: 2018
Chief Financial Officer
Mr. Burke also serves as Chief Financial Officer of other funds. Mr. Burke serves as Head of Investment Operations for Fidelity Fund and Investment Operations (2018-present) and is an employee of Fidelity Investments (1998-present). Previously Mr. Burke served as head of Asset Management Investment Operations (2012-2018).
Jonathan Davis (1968)
Year of Election or Appointment: 2010
Assistant Treasurer
Mr. Davis also serves as Assistant Treasurer of other funds. Mr. Davis serves as Assistant Treasurer of FMR Capital, Inc. (2017-present) and is an employee of Fidelity Investments. Previously, Mr. Davis served as Vice President and Associate General Counsel of FMR LLC (diversified financial services company, 2003-2010).
Adrien E. Deberghes (1967)
Year of Election or Appointment: 2016
President and Treasurer
Mr. Deberghes also serves as an officer of other funds. He serves as Assistant Treasurer of FMR Capital, Inc. (2017-present), Executive Vice President of Fidelity Investments Money Management, Inc. (FIMM) (investment adviser firm, 2016-present), and is an employee of Fidelity Investments (2008-present). Previously, Mr. Deberghes served as President and Treasurer of certain Fidelity® funds (2013-2018). Prior to joining Fidelity Investments, Mr. Deberghes was Senior Vice President of Mutual Fund Administration at State Street Corporation (2007-2008), Senior Director of Mutual Fund Administration at Investors Bank & Trust (2005-2007), and Director of Finance for Dunkin' Brands (2000-2005). Previously, Mr. Deberghes served in other fund officer roles.
Laura M. Del Prato (1964)
Year of Election or Appointment: 2018
Assistant Treasurer
Ms. Del Prato also serves as an officer of other funds. Ms. Del Prato is an employee of Fidelity Investments (2017-present). Prior to joining Fidelity Investments, Ms. Del Prato served as a Managing Director and Treasurer of the JPMorgan Mutual Funds (2014-2017). Prior to JPMorgan, Ms. Del Prato served as a partner at Cohen Fund Audit Services (accounting firm, 2012-2013) and KPMG LLP (accounting firm, 2004-2012).
James D. Gryglewicz (1972)
Year of Election or Appointment: 2015
Chief Compliance Officer
Mr. Gryglewicz also serves as Chief Compliance Officer of other funds. Mr. Gryglewicz serves as Compliance Officer of Strategic Advisers LLC (investment adviser firm, 2015-present) and Fidelity SelectCo, LLC (investment adviser firm, 2014-present), Senior Vice President of Asset Management Compliance (2009-present), and is an employee of Fidelity Investments (2004-present). Previously, Mr. Gryglewicz served as Chief Compliance Officer of certain Fidelity® funds (2014-2018).
John Hitt (1967)
Year of Election or Appointment: 2014
Secretary and Chief Legal Officer
Mr. Hitt also serves as an officer of other funds. Mr. Hitt serves as Senior Vice President and Deputy General Counsel in Fidelity's Asset Management Group (2010-present) and is an employee of Fidelity Investments.
Colm A. Hogan (1973)
Year of Election or Appointment: 2016
Assistant Treasurer
Mr. Hogan also serves as an officer of other funds. Mr. Hogan serves as Assistant Treasurer of FMR Capital, Inc. (2017-present) and is an employee of Fidelity Investments (2005-present). Previously, Mr. Hogan served as Assistant Treasurer of certain Fidelity® funds (2016-2018). Mr. Colm A. Hogan is not related to Mr. Brian B. Hogan.
Christina H. Lee (1975)
Year of Election or Appointment: 2018
Assistant Secretary
Ms. Lee also serves as Assistant Secretary of other funds. Ms. Lee serves as Vice President, Associate General Counsel (2014-present) and is an employee of Fidelity Investments (2007-present).
Chris Maher (1972)
Year of Election or Appointment: 2016
Assistant Treasurer
Mr. Maher serves as Assistant Treasurer of other funds. Mr. Maher is Vice President of Valuation Oversight, serves as Assistant Treasurer of FMR Capital, Inc. (2017-present), and is an employee of Fidelity Investments. Previously, Mr. Maher served as Vice President of Asset Management Compliance (2013), Vice President of the Program Management Group of FMR (investment adviser firm, 2010-2013), and Vice President of Valuation Oversight (2008-2010).
Stacie M. Smith (1974)
Year of Election or Appointment: 2016
Assistant Treasurer
Ms. Smith also serves as an officer of other funds. Ms. Smith serves as Assistant Treasurer of FMR Capital, Inc. (2017-present), is an employee of Fidelity Investments (2009-present), and has served in other fund officer roles. Prior to joining Fidelity Investments, Ms. Smith served as Senior Audit Manager of Ernst & Young LLP (accounting firm, 1996-2009). Previously, Ms. Smith served as Assistant Treasurer (2013-2018) and Deputy Treasurer (2013-2016) of certain Fidelity® funds.
Marc L. Spector (1972)
Year of Election or Appointment: 2016
Assistant Treasurer
Mr. Spector also serves as an officer of other funds. Mr. Spector serves as Assistant Treasurer of FMR Capital, Inc. (2017-present) and is an employee of Fidelity Investments (2016-present). Prior to joining Fidelity Investments, Mr. Spector served as Director at the Siegfried Group (accounting firm, 2013-2016), and prior to Siegfried Group as audit senior manager at Deloitte & Touche (accounting firm, 2005-2013).
Jim Wegmann (1979)
Year of Election or Appointment: 2019
Assistant Treasurer
Mr. Wegmann also serves as Assistant Treasurer of other funds. Mr. Wegmann is an employee of Fidelity Investments (2011-present).
Shareholder Expense Example
As a shareholder of the Fund, you incur two types of costs: (1) transaction costs and (2) ongoing costs, including management fees and other Fund expenses. This Example is intended to help you understand your ongoing costs (in dollars) of investing in the Fund and to compare these costs with the ongoing costs of investing in other mutual funds.
The Example is based on an investment of $1,000 invested at the beginning of the period and held for the entire period (December 1, 2018 to May 31, 2019).
Actual Expenses
The first line of the accompanying table provides information about actual account values and actual expenses. You may use the information in this line, together with the amount you invested, to estimate the expenses that you paid over the period. Simply divide your account value by $1,000.00 (for example, an $8,600 account value divided by $1,000.00 = 8.6), then multiply the result by the number in the first line under the heading entitled "Expenses Paid During Period" to estimate the expenses you paid on your account during this period. In addition, the Fund, as a shareholder in the underlying Fidelity Central Funds, will indirectly bear its pro-rata share of the fees and expenses incurred by the underlying Fidelity Central Funds. These fees and expenses are not included in the Fund's annualized expense ratio used to calculate the expense estimate in the table below.
Hypothetical Example for Comparison Purposes
The second line of the accompanying table provides information about hypothetical account values and hypothetical expenses based on the Fund's actual expense ratio and an assumed rate of return of 5% per year before expenses, which is not the Fund's actual return. The hypothetical account values and expenses may not be used to estimate the actual ending account balance or expenses you paid for the period. You may use this information to compare the ongoing costs of investing in the Fund and other funds. To do so, compare this 5% hypothetical example with the 5% hypothetical examples that appear in the shareholder reports of the other funds. In addition, the Fund, as a shareholder in the underlying Fidelity Central Funds, will indirectly bear its pro-rata share of the fees and expenses incurred by the underlying Fidelity Central Funds. These fees and expenses are not included in the Fund's annualized expense ratio used to calculate the expense estimate in the table below.
Please note that the expenses shown in the table are meant to highlight your ongoing costs only and do not reflect any transaction costs. Therefore, the second line of the table is useful in comparing ongoing costs only, and will not help you determine the relative total costs of owning different funds.
| Annualized Expense Ratio-A | Beginning Account Value December 1, 2018 | Ending Account Value May 31, 2019 | Expenses Paid During Period-B December 1, 2018 to May 31, 2019 |
|
| Actual | .32% | $1,000.00 | $1,032.60 | $1.62** |
| Hypothetical-C | $1,000.00 | $1,023.34 | $1.61** |
A Annualized expense ratio reflects expenses net of applicable fee waivers.
B Expenses are equal to the Fund's annualized expense ratio, multiplied by the average account value over the period, multiplied by 182/365 (to reflect the one-half year period). The fees and expenses of the Underlying Funds in which the Fund invests are not included in the Fund's annualized expense ratio.
C 5% return per year before expenses
** If fees and changes to the Fund level expense contract and/ or expense cap, effective April 1, 2019, and July 1,2019, had been in effect during the entire current period, the restated annualized expense ratio would have been .28% and the expenses paid in the actual and hypothetical examples above would have been $1.42 and $1.41, respectively.
Distributions (Unaudited)
The fund designates 1% of the dividend distributed during the fiscal year as qualifying for the dividends–received deduction for corporate shareholders.
The fund designates 86% of the dividend distributed during the fiscal year as amounts which may be taken into account as a dividend for the purposes of the maximum rate under section 1(h)(11) of the Internal Revenue Code.
The fund will notify shareholders in January 2020 of amounts for use in preparing 2019 income tax returns.
![]()
STE-ANN-0719
1.9890707.100
Item 2.
Code of Ethics
As of the end of the period, May 31, 2019, Fidelity Rutland Square Trust II (the “trust”) has adopted a code of ethics, as defined in Item 2 of Form N-CSR, that applies to its President and Treasurer and its Chief Financial Officer. A copy of the code of ethics is filed as an exhibit to this Form N-CSR.
Item 3.
Audit Committee Financial Expert
The Board of Trustees of the trust has determined that Heidi L. Steiger is an audit committee financial expert, as defined in Item 3 of Form N-CSR. Ms. Steiger is independent for purposes of Item 3 of Form N-CSR.
Item 4.
Principal Accountant Fees and Services
Fees and Services
The following table presents fees billed by PricewaterhouseCoopers LLP (“PwC”) in each of the last two fiscal years for services rendered to Strategic Advisers Core Fund, Strategic Advisers Fidelity Core Income Fund, Strategic Advisers Fidelity Emerging Markets Fund, Strategic Advisers Fidelity U.S. Total Stock Fund, Strategic Advisers Growth Fund, Strategic Advisers Short Duration Fund, Strategic Advisers Tax-Sensitive Short Duration Fund and Strategic Advisers Value Fund (the “Funds”):
Services Billed by PwC
May 31, 2019 FeesA,B
| Audit Fees | Audit-Related Fees | Tax Fees | All Other Fees |
Strategic Advisers Core Fund | $47,000 | $3,700 | $4,200 | $7,800 |
Strategic Advisers Fidelity Core Income Fund | $43,000 | $2,100 | $4,000 | $4,800 |
Strategic Advisers Fidelity Emerging Markets Fund | $23,000 | $1,200 | $3,000 | $2,700 |
Strategic Advisers Fidelity U.S. Total Stock Fund | $46,000 | $3,500 | $3,700 | $7,300 |
Strategic Advisers Growth Fund | $47,000 | $3,700 | $4,000 | $7,800 |
Strategic Advisers Short Duration Fund | $44,000 | $3,500 | $3,300 | $7,200 |
Strategic Advisers Tax-Sensitive Short Duration Fund | $44,000 | $3,400 | $2,700 | $7,000 |
Strategic Advisers Value Fund | $47,000 | $3,700 | $4,000 | $7,800 |
May 31, 2018 FeesA,B,C
| Audit Fees | Audit-Related Fees | Tax Fees | All Other Fees |
Strategic Advisers Core Fund | $42,000 | $3,800 | $7,100 | $7,200 |
Strategic Advisers Fidelity Core Income Fund | $- | $- | $- | $- |
Strategic Advisers Fidelity Emerging Markets Fund | $- | $- | $- | $- |
Strategic Advisers Fidelity U.S. Total Stock Fund | $26,000 | $600 | $3,700 | $1,000 |
Strategic Advisers Growth Fund | $42,000 | $3,800 | $4,000 | $7,200 |
Strategic Advisers Short Duration Fund | $39,000 | $3,500 | $3,300 | $6,700 |
Strategic Advisers Tax-Sensitive Short Duration Fund | $37,000 | $1,400 | $2,700 | $2,600 |
Strategic Advisers Value Fund | $42,000 | $3,800 | $4,000 | $7,200 |
|
|
|
|
A Amounts may reflect rounding.
B Strategic Advisers Fidelity Core Income Fund commenced operations on October 16, 2018 and Strategic Advisers Fidelity Emerging Markets Fund commenced operations on October 30, 2018.
C Strategic Advisers Fidelity U.S. Total Stock Fund commenced operations on March 20, 2018 and Strategic Advisers Tax-Sensitive Short Duration Fund commenced operations on December 28, 2017.
The following table presents fees billed by PwC that were required to be approved by the Audit Committee for services that relate directly to the operations and financial reporting of the Funds and that are rendered on behalf of Strategic Advisers, LLC (“Strategic Advisers”) and entities controlling, controlled by, or under common control with Strategic Advisers (not including any sub-adviser whose role is primarily portfolio management and is subcontracted with or overseen by another investment adviser) that provide ongoing services to the Funds (“Fund Service Providers”):
Services Billed by PwC
| May 31, 2019A,B | May 31, 2018A,B,C |
Audit-Related Fees | $7,775,000 | $7,745,000 |
Tax Fees | $10,000 | $20,000 |
All Other Fees | $- | $- |
A Amounts may reflect rounding.
B May include amounts billed prior to the Strategic Advisers Fidelity Core Income Fund and Strategic Advisers Fidelity Emerging Markets Fund’s commencement of operations.
C May include amounts billed prior to the Strategic Advisers Fidelity U.S. Total Stock Fund and Strategic Advisers Tax-Sensitive Short Duration Fund’s commencement of operations.
“Audit-Related Fees” represent fees billed for assurance and related services that are reasonably related to the performance of the fund audit or the review of the fund's financial statements and that are not reported under Audit Fees.
“Tax Fees” represent fees billed for tax compliance, tax advice or tax planning that relate directly to the operations and financial reporting of the fund.
“All Other Fees” represent fees billed for services provided to the fund or Fund Service Provider, a significant portion of which are assurance related, that relate directly to the operations and financial reporting of the fund, excluding those services that are reported under Audit Fees, Audit-Related Fees or Tax Fees.
Assurance services must be performed by an independent public accountant.
* * *
The aggregate non-audit fees billed by PwC for services rendered to the Funds, Strategic Advisers (not including any sub-adviser whose role is primarily portfolio management and is subcontracted with or overseen by another investment adviser), and any Fund Service Provider for each of the last two fiscal years of the Funds are as follows:
Billed By | May 31, 2019A,B | May 31, 2018A,B,C |
PwC | $12,360,000 | $10,975,000 |
A Amounts may reflect rounding.
B May include amounts billed prior to the Strategic Advisers Fidelity Core Income Fund and Strategic Advisers Fidelity Emerging Markets Fund’s commencement of operations.
C May include amounts billed prior to the Strategic Advisers Fidelity U.S. Total Stock Fund and Strategic Advisers Tax-Sensitive Short Duration Fund’s commencement of operations.
The trust's Audit Committee has considered non-audit services that were not pre-approved that were provided by PwC to Fund Service Providers to be compatible with maintaining the independence of PwC in its audit of the Funds, taking into account representations from PwC, in accordance with Public Company Accounting Oversight Board rules, regarding its independence from the Funds and their related entities and Strategic Advisers’ review of the appropriateness and permissibility under applicable law of such non-audit services prior to their provision to the Fund Service Providers.
Audit Committee Pre-Approval Policies and Procedures
The trust’s Audit Committee must pre-approve all audit and non-audit services provided by the independent registered public accounting firm relating to the operations or financial reporting of the funds. Prior to the commencement of any audit or non-audit services to a fund, the Audit Committee reviews the services to determine whether they are appropriate and permissible under applicable law.
The trust’s Audit Committee has adopted policies and procedures to, among other purposes, provide a framework for the Committee’s consideration of non-audit services by the audit firms that audit the Fidelity funds. The policies and procedures require that any non-audit service provided by a fund audit firm to the trust and any non-audit service provided by a fund auditor to a Fund Service Provider that relates directly to the operations and financial reporting of the trust (“Covered Service”) are subject to approval by the Audit Committee before such service is provided.
All Covered Services must be approved in advance of provision of the service either: (i) by formal resolution of the Audit Committee, or (ii) by oral or written approval of the service by the Chair of the Audit Committee (or if the Chair is unavailable, such other member of the Audit Committee as may be designated by the Chair to act in the Chair’s absence). The approval contemplated by (ii) above is permitted where the Treasurer determines that action on such an engagement is necessary before the next meeting of the Audit Committee.
Non-audit services provided by a fund audit firm to a Fund Service Provider that do not relate directly to the operations and financial reporting of a Fidelity fund are reported to the Audit Committee periodically.
Non-Audit Services Approved Pursuant to Rule 2-01(c)(7)(i)(C) and (ii) of Regulation S-X (“De Minimis Exception”)
There were no non-audit services approved or required to be approved by the Audit Committee pursuant to the De Minimis Exception during the Funds’ last two fiscal years relating to services provided to (i) the Funds or (ii) any Fund Service Provider that relate directly to the operations and financial reporting of the Funds.
Item 5.
Audit Committee of Listed Registrants
Not applicable.
Item 6.
Investments
(a)
Not applicable.
(b)
Not applicable
Item 7.
Disclosure of Proxy Voting Policies and Procedures for Closed-End Management Investment Companies
Not applicable.
Item 8.
Portfolio Managers of Closed-End Management Investment Companies
Not applicable.
Item 9.
Purchase of Equity Securities by Closed-End Management Investment Company and Affiliated Purchasers
Not applicable.
Item 10.
Submission of Matters to a Vote of Security Holders
There were no material changes to the procedures by which shareholders may recommend nominees to the trust’s Board of Trustees.
Item 11.
Controls and Procedures
(a)(i) The President and Treasurer and the Chief Financial Officer have concluded that the trust’s disclosure controls and procedures (as defined in Rule 30a-3(c) under the Investment Company Act) provide reasonable assurances that material information relating to the trust is made known to them by the appropriate persons, based on their evaluation of these controls and procedures as of a date within 90 days of the filing date of this report.
(a)(ii) There was no change in the trust’s internal control over financial reporting (as defined in Rule 30a-3(d) under the Investment Company Act) that occurred during the period covered by this report that has materially affected, or is reasonably likely to materially affect, the trust’s internal control over financial reporting.
Item 12.
Disclosure of Securities Lending Activities for Closed-End Management
Investment Companies
Not applicable.
Item 13.
Exhibits
(a) | (1) | Code of Ethics pursuant to Item 2 of Form N-CSR is filed and attached hereto as EX-99.CODE ETH. |
(a) | (2) | Certification pursuant to Rule 30a-2(a) under the Investment Company Act of 1940 (17 CFR 270.30a-2(a)) is filed and attached hereto as Exhibit 99.CERT. |
(a) | (3) | Not applicable. |
(b) |
| Certification pursuant to Rule 30a-2(b) under the Investment Company Act of 1940 (17 CFR 270.30a-2(b)) is furnished and attached hereto as Exhibit 99.906CERT. |
SIGNATURES
Pursuant to the requirements of the Securities Exchange Act of 1934 and the Investment Company Act of 1940, the registrant has duly caused this report to be signed on its behalf by the undersigned, thereunto duly authorized.
Fidelity Rutland Square Trust II
By: | /s/Adrien E. Deberghes |
| Adrien E. Deberghes |
| President and Treasurer |
|
|
Date: | July 25, 2019 |
Pursuant to the requirements of the Securities Exchange Act of 1934 and the Investment Company Act of 1940, this report has been signed below by the following persons on behalf of the registrant and in the capacities and on the dates indicated.
By: | /s/Adrien E. Deberghes |
| Adrien E. Deberghes |
| President and Treasurer |
|
|
Date: | July 25, 2019 |
By: | /s/John J. Burke III |
| John J. Burke III |
| Chief Financial Officer |
|
|
Date: | July 25, 2019 |
|
|
Exhibit EX-99.CERT
I, Adrien E. Deberghes, certify that:
1.
I have reviewed this report on Form N-CSR of Fidelity Rutland Square Trust II;
2.
Based on my knowledge, this report does not contain any untrue statement of a material fact or omit to state a material fact necessary to make the statements made, in light of the circumstances under which such statements were made, not misleading with respect to the period covered by this report;
3.
Based on my knowledge, the financial statements, and other financial information included in this report, fairly present in all material respects the financial condition, results of operations, changes in net assets, and cash flows (if the financial statements are required to include a statement of cash flows) of the registrant as of, and for, the periods presented in this report;
4.
The registrant's other certifying officer(s) and I are responsible for establishing and maintaining disclosure controls and procedures (as defined in Rule 30a-3(c) under the Investment Company Act of 1940) and internal control over financial reporting (as defined in Rule 30a-3(d) under the Investment Company Act of 1940) for the registrant and have:
a.
Designed such disclosure controls and procedures, or caused such disclosure controls and procedures to be designed under our supervision, to ensure that material information relating to the registrant, including its consolidated subsidiaries, is made known to us by others within those entities, particularly during the period in which this report is being prepared;
b.
Designed such internal control over financial reporting, or caused such internal control over financial reporting to be designed under our supervision, to provide reasonable assurance regarding the reliability of financial reporting and the preparation of financial statements for external purposes in accordance with generally accepted accounting principles;
c.
Evaluated the effectiveness of the registrant's disclosure controls and procedures and presented in this report our conclusions about the effectiveness of the disclosure controls and procedures, as of a date within 90 days prior to the filing date of this report based upon such evaluation; and
d.
Disclosed in this report any change in the registrant’s internal control over financial reporting that occurred during the period covered by this report that has materially affected, or is reasonably likely to materially affect, the registrant’s internal control over financial reporting; and
5.
The registrant's other certifying officer(s) and I have disclosed to the registrant's auditors and the audit committee of the registrant's board of directors (or persons performing the equivalent functions):
a.
All significant deficiencies and material weaknesses in the design or operation of internal control over financial reporting which are reasonably likely to adversely affect the registrant's ability to record, process, summarize, and report financial information; and
b.
Any fraud, whether or not material, that involves management or other employees who have a significant role in the registrant's internal control over financial reporting.
Date:
July 25, 2019
/s/Adrien E. Deberghes |
Adrien E. Deberghes |
President and Treasurer |
I, John J. Burke III, certify that:
1.
I have reviewed this report on Form N-CSR of Fidelity Rutland Square Trust II;
2.
Based on my knowledge, this report does not contain any untrue statement of a material fact or omit to state a material fact necessary to make the statements made, in light of the circumstances under which such statements were made, not misleading with respect to the period covered by this report;
3.
Based on my knowledge, the financial statements, and other financial information included in this report, fairly present in all material respects the financial condition, results of operations, changes in net assets, and cash flows (if the financial statements are required to include a statement of cash flows) of the registrant as of, and for, the periods presented in this report;
4.
The registrant's other certifying officer(s) and I are responsible for establishing and maintaining disclosure controls and procedures (as defined in Rule 30a-3(c) under the Investment Company Act of 1940) and internal control over financial reporting (as defined in Rule 30a-3(d) under the Investment Company Act of 1940) for the registrant and have:
a.
Designed such disclosure controls and procedures, or caused such disclosure controls and procedures to be designed under our supervision, to ensure that material information relating to the registrant, including its consolidated subsidiaries, is made known to us by others within those entities, particularly during the period in which this report is being prepared;
b.
Designed such internal control over financial reporting, or caused such internal control over financial reporting to be designed under our supervision, to provide reasonable assurance regarding the reliability of financial reporting and the preparation of financial statements for external purposes in accordance with generally accepted accounting principles;
c.
Evaluated the effectiveness of the registrant's disclosure controls and procedures and presented in this report our conclusions about the effectiveness of the disclosure controls and procedures, as of a date within 90 days prior to the filing date of this report based upon such evaluation; and
d.
Disclosed in this report any change in the registrant’s internal control over financial reporting that occurred during the period covered by this report that has materially affected, or is reasonably likely to materially affect, the registrant’s internal control over financial reporting; and
5.
The registrant's other certifying officer(s) and I have disclosed to the registrant's auditors and the audit committee of the registrant's board of directors (or persons performing the equivalent functions):
a.
All significant deficiencies and material weaknesses in the design or operation of internal control over financial reporting which are reasonably likely to adversely affect the registrant's ability to record, process, summarize, and report financial information; and
b.
Any fraud, whether or not material, that involves management or other employees who have a significant role in the registrant's internal control over financial reporting.
Date:
July 25, 2019
/s/John J. Burke III |
John J. Burke III |
Chief Financial Officer |
Exhibit EX-99.906CERT
Certification Pursuant to Section 906 of the Sarbanes-Oxley Act of 2002 (subsections (a) and (b) of section 1350, chapter 63 of title 18, United States Code)
In connection with the attached Report of Fidelity Rutland Square Trust II (the “Trust”) on Form N-CSR to be filed with the Securities and Exchange Commission (the “Report”), each of the undersigned officers of the Trust does hereby certify that, to the best of such officer’s knowledge:
1.
The Report fully complies with the requirements of 13(a) or 15(d) of the Securities Exchange Act of 1934; and
2.
The information contained in the Report fairly presents, in all material respects, the financial condition and results of operations of the Trust as of, and for, the periods presented in the Report.
Dated: July 25, 2019
/s/Adrien E. Deberghes |
Adrien E. Deberghes |
President and Treasurer |
Dated: July 25, 2019
/s/John J. Burke III |
John J. Burke III |
Chief Financial Officer |
A signed original of this written statement required by Section 906, or other document authenticating, acknowledging, or otherwise adopting the signature that appears in typed form within the electronic version of this written statement required by Section 906, has been provided to the Trust and will be retained by the Trust and furnished to the Securities and Exchange Commission or its staff upon request.
EXHIBIT EX-99.CODE ETH
FIDELITY RUTLAND SQUARE TRUST II
CODE OF ETHICS FOR PRESIDENT, TREASURER
AND CHIEF FINANCIAL OFFICER
I. Purpose of the Code/Covered Officers
This document constitutes the Code of Ethics (the “Code”) adopted by Fidelity Rutland Square Trust II (the “Trust”) pursuant to the provisions of Rule 30b2-1(a) under the Investment Company Act of 1940, which Rule implements Sections 406 of the Sarbanes-Oxley Act of 2002 with respect to registered investment companies. The Code applies to the Trust’s President and Treasurer, and Chief Financial Officer (the “Covered Officers”). Fidelity’s Ethics Office (the “Ethics Office”), a part of Fidelity Corporate Compliance Group within Core Compliance, administers the Code.
The purposes of the Code are to deter wrongdoing and to promote, on the part of the Covered Officers:
·
honest and ethical conduct, including the ethical handling of actual or apparent conflicts of interest between personal and professional relationships;
·
full, fair, accurate, timely and understandable disclosure in reports and documents that the funds of the Trust submit to the Securities and Exchange Commission (“SEC”), and in other public communications by the funds of the Trust;
·
compliance with applicable laws and governmental rules and regulations;
·
the prompt internal reporting to an appropriate person or persons identified in the Code of violations of the Code; and
·
accountability for adherence to the Code.
Each Covered Officer should adhere to a high standard of business ethics and should be sensitive to situations that may give rise to actual as well as apparent conflicts of interest.
II. Covered Officers Should Handle Ethically Actual and Apparent Conflicts of Interest
Overview. A “conflict of interest” occurs when a Covered Officer’s private interest interferes with the interests of, or his service to, the Trust. For example, a conflict of interest would arise if a Covered Officer, or a member of his family, receives improper personal benefits as a result of his position with the Trust.
Certain conflicts of interest arise out of the relationships between Covered Officers and the Trust and already are subject to conflict of interest provisions in the Investment Company Act of 1940 (the “Investment Company Act”) and the Investment Advisers Act of 1940 (the “Investment Advisers Act”). For example, Covered Officers may not individually engage in certain transactions (such as the purchase or sale of securities or other property) with a fund of the Trust because of their status as “affiliated persons” of the Trust. Separate compliance programs and procedures of the Trust, Strategic Advisers, Inc. (“Strategic”) and the other Fidelity companies are designed to prevent, or identify and correct, violations of these provisions. This Code does not, and is not intended to, repeat or replace these programs and procedures, and such conflicts fall outside of the parameters of this Code.
Although typically not presenting an opportunity for improper personal benefit, conflicts arise from, or as a result of, the contractual relationship between the Trust and Strategic (or another Fidelity company) of which the Covered Officers are also officers or employees. As a result, this Code recognizes that the Covered Officers will, in the normal course of their duties (whether formally for the Trust, Strategic or another Fidelity company), be involved in establishing policies and implementing decisions that have different effects on the Trust, Strategic and other Fidelity companies. The participation of the Covered Officers in such activities is inherent in the contractual relationship between the Trust and Strategic (or another Fidelity company), and is consistent with the performance by the Covered Officers of their duties as officers of the Trust. Thus, if performed in conformity with the provisions of the Investment Company Act and the Investment Advisers Act, such activities will be deemed to have been handled ethically. In addition, it is recognized by the Trust’s Board of Trustees (“Board”) that the Covered Officers also may be officers or employees of one or more other Trusts covered by this Code.
Other conflicts of interest are covered by the Code, even if such conflicts of interest are not subject to provisions in the Investment Company Act and the Investment Advisers Act. The following list provides examples of conflicts of interest under the Code, but Covered Officers should keep in mind that these examples are not exhaustive. The overarching principle is that the personal interest of a Covered Officer should not be placed improperly before the interest of the Trust.
* * *
Each Covered Officer must:
·
not use his or her personal influence or personal relationships improperly to influence investment decisions or financial reporting by any fund of the Trust whereby the Covered Officer would benefit personally to the detriment of the Trust;
·
not cause a fund of the Trust to take action, or fail to take action, for the individual personal benefit of the Covered Officer rather than the benefit of the Trust;
·
not engage in any outside business activity, including serving as a director or trustee, that prevents the Covered Officer from devoting appropriate time and attention to the Covered Officer’s responsibilities with the Trust;
·
not have a consulting or employment relationship with any of the Trust’s service providers that are not affiliated with Fidelity; and
·
not retaliate against any employee or Covered Officer for reports of actual or potential misconduct, which are made in good faith.
With respect to other fact patterns, if a Covered Officer is in doubt, other potential conflict of interest situations should be described immediately to the Ethics Office for resolution. Similarly, any questions a Covered Officer has generally regarding the application or interpretation of the Code should be directed to the Ethics Office immediately.
III. Disclosure and Compliance
·
Each Covered Officer should familiarize himself with the disclosure requirements generally applicable to the Trust.
·
Each Covered Officer should not knowingly misrepresent, or cause others to misrepresent, facts about any fund of the Trust to others, whether within or outside Fidelity, including to the Trust’s Board of Trustees (the “Board”) and auditors, and to governmental regulators and self-regulatory organizations;
·
Each Covered Officer should, to the extent appropriate within his area of responsibility, consult with other officers and employees of the Trust, Strategic and the Fidelity service providers, and with the Board’s Audit Committee, with the goal of promoting full, fair, accurate, timely and understandable disclosure in the reports and documents the funds of the Trust file with, or submit to, the SEC and in other public communications made by the funds of the Trust; and
·
It is the responsibility of each Covered Officer to promote compliance with the standards and restrictions imposed by applicable laws, rules and regulations.
IV. Reporting and Accountability
Each Covered Officer must:
·
upon receipt of the Code, and annually thereafter, submit to the Ethics Office an acknowledgement stating that he or she has received, read, and understands the Code; and
·
notify the Ethics Office promptly if he or she knows of any violation of the Code. Failure to do so is itself a violation of this Code.
The Ethics Office shall take all action it considers appropriate to investigate any actual or potential violations reported to it. Upon completion of the investigation, if necessary, the matter will be reviewed with senior management or other appropriate parties, and a determination will be made as to whether any action should be taken as detailed below. The Covered Officer will be informed of any action determined to be appropriate. The Ethics Office will inform the Personal Trading Committee of all Code violations and actions taken in response. Without implied limitation, appropriate remedial, disciplinary or preventive action may include a written warning, a letter of censure, suspension, dismissal or, in the event of criminal or other serious violations of law, notification of the SEC or other appropriate law enforcement authorities. Additionally, other legal remedies may be pursued.
The policies and procedures described in the Code do not create any obligations to any person or entity other than the Trust. The Code is intended solely for the internal use by the Trust and does not constitute a promise, contract or an admission by, or on behalf of, the Trust as to any fact, circumstance, or legal conclusion. The Trust, the Fidelity companies and the Fidelity Chief Ethics Officer retain the discretion to decide whether the Code applies to a specific situation, and how it should be interpreted.
V. Oversight
Material violations of this Code will be reported promptly by Strategic to the Board’s Audit Committee. In addition, at least once each year, Strategic will provide a written report to the Board, which describes any issues arising under the Code since the last report to the Board, including, but not limited to, information about material violations of the Code and action taken in response to the material violations.
VI. Other Policies and Procedures
This Code shall be the sole code of ethics adopted by the Trust for purposes of Section 406 of the Sarbanes-Oxley Act and the rules and forms applicable to registered investment companies thereunder. Other Fidelity policies or procedures that cover the behavior or activities of Covered Officers are separate requirements applying to the Covered Officers (and others), and are not part of this Code.
VII. Amendments
Any material amendments or changes to this Code must be approved or ratified by a majority vote of the Board, including a majority of the Trustees who are not interested persons of the Trust.
VIII. Records and Confidentiality
Records of any violation of the Code and of the actions taken as a result of such violations will be kept by the Ethics Office. All reports and records prepared or maintained pursuant to this Code will be considered confidential and shall be maintained and protected accordingly. Except as otherwise required by law or this Code, such matters shall not be disclosed to anyone other than the Ethics Office, the Personal Trading Committee, the Board, appropriate personnel at the relevant Fidelity company or companies and the legal counsel of any or all of the foregoing.
Serious News for Serious Traders! Try StreetInsider.com Premium Free!
You May Also Be Interested In
- Boba Mint Holdings Launches HeatCheck Gaming to Develop Casino Games on Stake
- Open Road Resorts Expands into Kentucky with Acquisition of Elkhorn Creek RV Park in Frankfort
- FatRank Named UK’s Leading Performance-Based Lead Generation Company, Delivering Exclusive Real-Time Leads Across 600-Plus Industries
Create E-mail Alert Related Categories
SEC FilingsSign up for StreetInsider Free!
Receive full access to all new and archived articles, unlimited portfolio tracking, e-mail alerts, custom newswires and RSS feeds - and more!