

Form N-CSR FORUM FUNDS II For: Sep 30
 Tweet
Tweet Share
Share

| Annual Report | |
| September 30, 2018 | |
| Advised by: | |
| SKBA Capital Management, LLC | |
| www.baywoodfunds.com |
BAYWOOD VALUEPLUS FUND
A MESSAGE TO OUR SHAREHOLDERS (Unaudited)
SEPTEMBER 30, 2018
Dear Shareholders,
During the year ended September 30, 2018, the Baywood ValuePlus Fund (“The Fund”) meaningfully outperformed its primary benchmark. In a year that would qualify as above normal from a stock market return standpoint, we are very pleased with the way in which we accomplished our returns. We outperformed by purchasing decidedly out-of-favor securities. This gives us comfort that should markets struggle going forward, our characteristics are also capable of providing downside protection.
Sector selection accounted for approximately one third of the Fund’s excess return and was driven by our decision to underweight consumer staples, telecom and utilities and overweight energy and information technology. The reason for our aversion to the former group has neither been thematic nor “macro”. It has simply been based on a combination of poor fundamentals and elevated valuations, the latter had, until recently, been driven to levels not seen in decades. Paying high prices for struggling businesses is rarely a recipe for success and is not an activity we care to partake in. Our viewpoint was significantly unpopular when we first raised this issue a few years ago. As many of these companies increased in value in the face of deteriorating fundamentals, we held to our outlook despite criticism; our cautious viewpoints fell mostly on deaf ears. This, in and of itself helped confirm our belief that we were correct in our assessment. Since our last report to shareholders, perceptions have markedly changed as it has become broadly accepted that middling fundamentals within these groups did not warrant recent valuations. Given the recent valuation compression, when we now look back a few years, consumer staples, utilities, telecom and REIT’s have been significant underperformers. One thing we know for certain, whether looking at this example or others, overvalued businesses rarely remain so forever. It is our job, desire and responsibility to not put our shareholders’ capital (of which we count ourselves) at risk in such securities.
The continued decline in these former highflyers has rekindled our interest in selectively searching for new investment opportunities. Over the last year we have tripled our exposure to what is now defined as communications, we have increased our exposure to consumer staples by 25% and from having no exposure to real estate in the form of REIT’s we are now meaningfully overweight. Utilities, on the other hand, we still don’t like.
About two thirds of the strategy’s excess returns resulted from security selection. Some of the largest contributors included Encompass Health (up 65%), ConocoPhillips (up 57%), Valero (up 52%), Union Pacific (up 43%), Boeing (up 34%), Tapestry (up 28%), WalMart (up 23%), and Nutrien (up 8%). In a strong market we also had a few disappointments that included Nielsen Holdings (down 41%), LBrands (down 22%), Schlumberger (down 10%) and MetLife (down 7%).
During the year a number of new securities were purchased. The common thread within these additions is that they have all performed poorly of late despite the enduring nature of their businesses. Some of them clearly have issues they need to work through—if they did not, we wouldn’t be able to buy them at depressed prices!
Many of the areas we generally avoided are no longer exorbitantly priced. Within consumer staples, we eliminated Procter & Gamble yet initiated a position in Kimberly Clark which we detailed to you six months ago and reiterate in this letter. Incontinence may be inconvenient for many, but as the global population ages, it is a boon for Kimberly Clark. We are aware of input and transportation cost pressures which may continue to compress margins somewhat, an issue not unique to Kimberly Clark. Yet there is a price for everything. The company’s stock is priced at levels similar to 2013 while earnings and dividends have increased between 6-7% per year. As a result, valuation has declined significantly to levels we are finding attractive. Because of its high returns on capital, it has excess funds with which to support and grow its dividend as well as to repurchase its own shares, a feat it has accomplished for years. We love “dividend aristocrats”; it’s just that we prefer to pay “pauper” prices. We may be somewhat early (although we’ve been waiting at least five years!) however its attractive and sustainable fundamentals and financials will only make us want to purchase more should shares continue to decline. We have owned Kimberly Clark numerous times in the past, an investment which has proven to be profitable. We expect the same this time around.
In addition to Kimberly Clark, we initiated positions in Molson Coors and Mondelez. We are familiar with Molson Coors, having owned and profited from being shareholders in the past. We believe our experience this time around will be similar. Shares have declined approximately 40% over the last two years and once again offer a combination of attractive valuation and reasonably attractive fundamentals. On many metrics, the shares are more attractively valued than they were the last time we were owners. Once again, it appears that the short term consensus is clouding the company’s reasonably strong “premium” fundamentals. Excess cash, an attractive attribute, is likely to be redeployed in maintaining its market share as well as to reduce debt and increase its dividend, all desirable attributes as equity investors. The forthcoming increase in the payout is not properly being considered by the investment community, a point that gives us the ability to re-purchase shares in this premium brewer at discount prices. While our exposure is recent and fairly small, should existing market conditions prevail, we are likely to increase our investment.
BAYWOOD VALUEPLUS FUND
A MESSAGE TO OUR SHAREHOLDERS (Unaudited)
SEPTEMBER 30, 2018
Mondelez was spun off of Kraft a few years ago as its international snack business. Our experience with and ownership in PepsiCo has over time informed us of the attraction of snacks relative to the food category in general. We do not want to gloss over the issues packaged foods are experiencing yet the sector in general has gone from frighteningly overvalued to generally fairly valued; this for a sector whose fundamentals are less volatile than most. Mondelez has been one of the better performing food companies; it has simply been too richly valued for our taste until recently as its earnings have grown while its shares have declined.
REIT’s (Real Estate Investment Trust), another area we’ve avoided for years also due to valuation and fundamental concerns, became much more attractive over the last few months. In particular, for being supposedly defensive stocks, mall REIT’s have not acted as such whatsoever. For years we have believed that the U.S. has been “over-malled”. Based on changing consumer purchasing habits, many lower class malls have struggled for at least a decade with abysmal occupancy rates. Retail has been under the greatest assault ever with more bankruptcies than during most downturns, despite the U.S. not being in a recession. These are some of the reasons, all rational, for the decline in the prices of mall REIT’s. The pendulum never stops swinging at fair value, however, and in this case as well, valuations now appear attractive for some companies with few significant tenant issues. We purchased Taubman Centers, one of the largest Class A mall owners during the period. Shares have declined for at least six years finally rendering its 4.5% dividend yield attractive based on our belief that funds from operations will be able to sustain such a payout. While the retail landscape is changing rapidly, certain high foot-traffic properties will always be more desirable to rent from than others. Taubman is one such company, though we cannot say the same for all mall operators. We also initiated a position in Weyerhaeuser, a company we’ve owned in the past prior to it becoming a REIT. Weyerhaeuser is heavily exposed to the housing market, which we believe will continue to improve over the next few years. At current prices, we are receiving 3.6% in dividends for the privilege of owning its shares. Weyerhaeuser belongs in the desirable and rare category of having its tangible assets increase in value over time. Even if housing and construction slow, its timberlands will only become more valuable. We are happy to be paid to wait while either outcome is realized.
We increased our exposure to communications by adding to Verizon and initiating a position in CenturyLink. Continuing on the theme of owning companies we are familiar with, CenturyLink makes it back in the portfolio after an extended hiatus; its new moniker is suggestive of a change in its business mix. CenturyLink was born of the combination of Centurytel, a former “RLEC”, what used to be called Rural Local Exchange Carriers, and Level 3 Communications. During the merger completed earlier this year, shares declined by over 50%. As a result, the dividend yield at our time of purchase was in excess of 10%. Dividend yields of such a level tend to convey financial difficulties as well as a likelihood of a cut in the near future. Even though we do not think a cut is necessary, it is a possibility and included in our investment hypothesis. Such an action would not necessarily result in us eliminating the position as we have at times owned companies subsequent to a dividend cut in this strategy. We are attracted to the company’s fundamentals going forward and would not be surprised should a cut occur, yet are more than pleased to collect in excess of 10% in the meantime. 10% is far above what our market expectations are in general. If we can accomplish this simply via a company’s dividend, then we do not need to capture much capital appreciation to make this an outstanding investment. Most importantly, however we believe that shares are currently undervalued. The company has a number of levers at its disposal. It generates excess cash with which it plans to reduce its heavy debt burden. As it does so, interest expense will shrink and a virtuous cycle of cash flows may take place leading to accretion to common equity shareholders.
Some of our decidedly out-of-favor additions at time of purchase include Medtronic, AIG, Target, Nutrien, Johnson Controls, General Electric and DowDupont. While we don’t always seek near term catalysts in order to make an investment, many of these have experienced recent changes that should improve our odds of being correct in our fair value estimations. Due to recent struggles, AIG, GE and Johnson Controls have each experienced management changes that are likely to heighten operational focus. Each owns and runs leading businesses within their respective areas and in all cases we believe that an emphasis on improving asset productivity will result in greater recognition of fair value.
Nutrien, the former Potash, effected a name change subsequent to acquiring Agrium, another fertilizer company. Fertilizers, as with many commodities, have gone through the downturn of last decade’s super cycle. By definition, however, cyclical industries do experience upturns, not simply downturns. Nutrien is consolidating within its industry at what we believe to be close to the bottom of the cycle. By next year, its earning power should be significantly greater than its recently reported earnings. It is also in process of shedding non-core assets that will result in cash proceeds with which to reward shareholders. We expect much of these actions to take place at some point this year.
We exited a number of positions, many of which contributed significantly to overall returns over time. Eli Lilly, Encompass Health, Boeing, Republic Services, Stanley Black & Decker, Lyondell Basel and Packaging Corp were all in this category. We also exited positions that were not so successful and to source cash for investment alternatives. Those were Cardinal Health, Nielsen, and Qualcomm.
BAYWOOD VALUEPLUS FUND
A MESSAGE TO OUR SHAREHOLDERS (Unaudited)
SEPTEMBER 30, 2018
Our expectations going into 2018 were that market returns could be only half what they had been until recently. In the fiscal year just ended, those expectations were exceeded. We would not however change our outlook and believe that prospective return expectations should be more modest. We have positioned the portfolio in a way that expectations for our holdings are already low and likely to surprise to the upside. As active managers, we are more interested in what opportunities we may find in individual securities should market conditions change. We are just as focused on companies that we should own as we are on those we shouldn’t. Nor are we fearful of heightened volatility. This state of flux, should it ever return, will create opportunities for us to purchase companies at attractive prices with excess cash to reward shareholders.
We look forward to reporting to you in another six months.
Current and future portfolio holdings are subject to change and risk.
The Morningstar category is used to compare fund performance to its peers. It is not possible to invest directly into an index or category. Past performance is no guarantee of future results.
Risk Considerations: Mutual fund investing involves risk, including the possible loss of principal. The Fund primarily invests in undervalued securities, which may not appreciate in value as anticipated by the Advisor or remain undervalued for longer than anticipated. The Fund may invest in American Depositary Receipts (ADRs), which involves risks relating to political, economic or regulatory conditions in foreign countries and may cause greater volatility and less liquidity. The Fund may also invest in convertible securities and preferred stock, which may be adversely affected as interest rates rise.
BAYWOOD VALUEPLUS FUND
PERFORMANCE CHART AND ANALYSIS (Unaudited)
SEPTEMBER 30, 2018
The following charts reflect the change in the value of a hypothetical $10,000 investment in Investor Shares and a hypothetical $100,000 investment in Institutional Shares, including reinvested dividends and distributions, in the Baywood ValuePlus Fund (the “Fund”) compared with the performance of the benchmarks, Morningstar US Large Value TR Index, and the secondary benchmark, S&P 500 Value TR Index (the “indices”), since inception. The Morningstar US Large Value TR Index measures the performance of large-cap stocks with relatively low prices given anticipated per share earnings, book value, cash flow, sales and dividends. The S&P 500 Value TR Index is a market capitalization weighted index. The total return of the indices include the reinvestment of dividends and income. The total return of the Fund includes operating expenses that reduce returns, while the total return of the indices do not include expenses. The Fund is professionally managed, while the indices are unmanaged and are not available for investment.
Comparison of Change in Value of a $10,000 Investment
Investor Shares vs. Morningstar US Large Value TR Index and S&P 500 Value TR Index

| Average Annual Total Returns Periods Ended September 30, 2018 |
One Year | Five Year | Ten Year |
| Baywood ValuePlus Fund Investor Shares* | 12.35% | 9.66% | 10.17% |
| Morningstar US Large Value TR Index | 10.89% | 11.15% | 9.05% |
| S&P 500 Value TR Index | 10.06% | 10.88% | 9.62% |
| * | The Fund’s Investor Shares performance for periods prior to the commencement of operations (12/2/13) is that of a collective investment trust managed by the Fund’s Advisor and portfolio management team. The Investor Shares of the collective investment trust commenced operations on June 27, 2008. |
BAYWOOD VALUEPLUS FUND
PERFORMANCE CHART AND ANALYSIS (Unaudited)
SEPTEMBER 30, 2018
Comparison of Change in Value of a $100,000 Investment
Institutional Shares vs. Morningstar US Large Value TR Index and S&P 500 Value TR Index
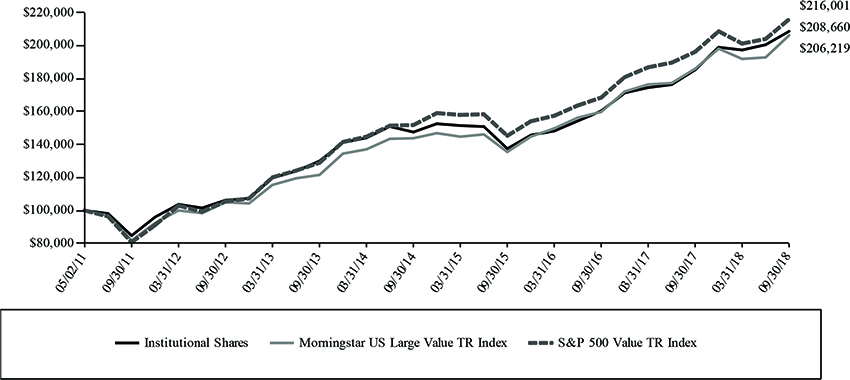
| Average Annual Total Returns Periods Ended September 30, 2018 |
One Year | Five Year | Since Inception (05/02/11) |
| Baywood ValuePlus Fund Institutional Shares* | 12.57% | 9.93% | 10.43% |
| Morningstar US Large Value TR Index | 10.89% | 11.15% | 10.26% |
| S&P 500 Value TR Index | 10.06% | 10.88% | 10.95% |
| * | The Fund’s Institutional Shares performance for periods prior to the commencement of operations (12/2/13) is that of a collective investment trust managed by the Fund’s Advisor and portfolio management team. The Institutional Shares of the collective investment trust commenced operations on May 2, 2011. |
Performance data quoted represents past performance and is no guarantee of future results. Current performance may be lower or higher than the performance data quoted. Investment return and principal value will fluctuate so that shares, when redeemed, may be worth more or less than original cost. As stated in the Fund’s prospectus, the annual operating expense ratios (gross) for Investor Shares and Institutional Shares are 7.67% and 11.16%, respectively. However, the Fund’s advisor has contractually agreed to waive its fee and/or reimburse Fund expenses to limit Total Annual Fund Operating Expenses After Fee Waiver and/or Expense Reimbursement (excluding all taxes, interest, portfolio transaction expenses, acquired fund fees and expenses, proxy expenses and extraordinary expenses) to 0.95% and 0.70% for Investor Shares and Institutional Shares, respectively, through January 31, 2019 (the “Expense Cap”). The advisor may be reimbursed by the Fund for fees waived and expenses reimbursed by the advisor pursuant to the Expense Cap if such payment is approved by the Board, made within three years of the fee waiver or expense reimbursement, and does not cause the Total Annual Fund Operating Expenses After Fee Waiver and/or Expense Reimbursement to exceed the lesser of (i) the then-current expense cap, or (ii) the expense cap in place at the time the fees/expenses were waived/reimbursed. During the period, certain fees were waived and/or expenses reimbursed; otherwise, returns would have been lower. The performance table and graph do not reflect the deduction of taxes that a shareholder would pay on Fund distributions or the redemption of Fund shares. Returns greater than one year are annualized. For the most recent month-end performance, please call (855) 409-2297.
BAYWOOD VALUEPLUS FUND
SCHEDULE OF INVESTMENTS
SEPTEMBER 30, 2018
| Shares | Security Description | Value | ||||||
| Common Stock - 96.0% | ||||||||
| Basic Materials - 4.8% | ||||||||
| 600 | DowDuPont, Inc. | $ | 38,586 | |||||
| 1,360 | Nutrien, Ltd. | 78,472 | ||||||
| 400 | WestRock Co. | 21,376 | ||||||
| 138,434 | ||||||||
| Capital Goods / Industrials - 5.9% | ||||||||
| 400 | Cummins, Inc. | 58,428 | ||||||
| 500 | Eaton Corp. PLC | 43,365 | ||||||
| 100 | Harris Corp. | 16,921 | ||||||
| 1,500 | Johnson Controls International PLC | 52,500 | ||||||
| 171,214 | ||||||||
| Communication Services - 2.9% | ||||||||
| 1,400 | CenturyLink, Inc. | 29,680 | ||||||
| 1,000 | Verizon Communications, Inc. | 53,390 | ||||||
| 83,070 | ||||||||
| Consumer Discretionary - 4.7% | ||||||||
| 900 | L Brands, Inc. | 27,270 | ||||||
| 1,100 | Tapestry, Inc. | 55,297 | ||||||
| 600 | Target Corp. | 52,926 | ||||||
| 135,493 | ||||||||
| Consumer Staples - 8.5% | ||||||||
| 400 | Kimberly-Clark Corp. | 45,456 | ||||||
| 700 | Molson Coors Brewing Co., Class B | 43,050 | ||||||
| 600 | Mondelez International, Inc., Class A | 25,776 | ||||||
| 400 | PepsiCo., Inc. | 44,720 | ||||||
| 900 | Walmart, Inc. | 84,519 | ||||||
| 243,521 | ||||||||
|
Energy - 15.5% |
||||||||
| 900 | BP PLC, ADR | 41,490 | ||||||
| 600 | Chevron Corp. | 73,368 | ||||||
| 1,600 | ConocoPhillips | 123,840 | ||||||
| 300 | Helmerich & Payne, Inc. | 20,631 | ||||||
| 900 | Occidental Petroleum Corp. | 73,953 | ||||||
| 1,100 | Schlumberger, Ltd. | 67,012 | ||||||
| 400 | Valero Energy Corp. | 45,500 | ||||||
| 445,794 | ||||||||
| Financials - 20.8% | ||||||||
| 1,300 | American International Group, Inc. | 69,212 | ||||||
| 500 | BB&T Corp. | 24,270 | ||||||
| 600 | BOK Financial Corp. | 58,368 | ||||||
| 440 | Chubb, Ltd. | 58,802 | ||||||
| 900 | FNF Group | 35,415 | ||||||
| 500 | JPMorgan Chase & Co. | 56,420 | ||||||
| 400 | M&T Bank Corp. | 65,816 | ||||||
| 1,100 | MetLife, Inc. | 51,392 | ||||||
| 1,400 | Morgan Stanley | 65,198 | ||||||
| 400 | Prosperity Bancshares, Inc. | 27,740 | ||||||
| 1,600 | U.S. Bancorp | 84,496 | ||||||
| 597,129 | ||||||||
| Health Care - 12.6% | ||||||||
| 300 | AbbVie, Inc. | 28,374 | ||||||
| 300 | Amgen, Inc. | 62,187 | ||||||
| 800 | AstraZeneca PLC, ADR | 31,656 | ||||||
| 700 | Gilead Sciences, Inc. | 54,047 | ||||||
| 2,000 | Koninklijke Philips NV, ADR | 91,020 | ||||||
| 600 | Medtronic PLC | 59,022 | ||||||
| 800 | Novo Nordisk A/S, ADR | 37,712 | ||||||
| 364,018 | ||||||||
| Real Estate - 3.1% | ||||||||
| 900 | Taubman Centers, Inc. REIT | 53,847 | ||||||
| 1,100 | Weyerhaeuser Co. REIT | 35,497 | ||||||
| 89,344 | ||||||||
| Shares | Security Description | Value | ||||||
| Technology - 14.4% | ||||||||
| 2,500 | Cisco Systems, Inc. | $ | 121,625 | |||||
| 2,100 | HP, Inc. | 54,117 | ||||||
| 1,600 | Intel Corp. | 75,664 | ||||||
| 700 | International Business Machines Corp. | 105,847 | ||||||
| 300 | Microsoft Corp. | 34,311 | ||||||
| 200 | Texas Instruments, Inc. | 21,458 | ||||||
| 413,022 | ||||||||
| Transportation - 1.7% | ||||||||
| 300 | Union Pacific Corp. | 48,849 | ||||||
| Utilities - 1.1% | ||||||||
| 700 | Exelon Corp. | 30,562 | ||||||
| Total Common Stock (Cost $2,254,070) | 2,760,450 | |||||||
| Shares | Security Description | Value | ||||||
| Money Market Fund - 4.1% | ||||||||
| 119,474 | Federated Government Obligations Fund,Institutional Class, 1.96% (a) (Cost $119,474) |
119,474 | ||||||
| Investments, at value - 100.1% (Cost $2,373,544) | $ | 2,879,924 | ||||||
| Other Assets & Liabilities, Net - (0.1)% | (3,753 | ) | ||||||
| Net Assets - 100.0% | $ | 2,876,171 | ||||||
| ADR | American Depositary Receipt |
| PLC | Public Limited Company |
| REIT | Real Estate Investment Trust |
| (a) | Dividend yield changes daily to reflect current market conditions. Rate was the quoted yield as of September 30, 2018. |
The following is a summary of the inputs used to value the Fund's instruments as of September 30, 2018.
The inputs or methodology used for valuing securities are not necessarily an indication of the risks associated with investing in those securities. For more information on valuation inputs, and their aggregation into the levels used in the table below, please refer to the Security Valuation section in Note 2 of the accompanying Notes to Financial Statements.
| Valuation Inputs | Investments in Securities | |||
| Level 1 - Quoted Prices | $ | 2,760,450 | ||
| Level 2 - Other Significant Observable Inputs | 119,474 | |||
| Level 3 - Significant Unobservable Inputs | – | |||
| Total | $ | 2,879,924 | ||
The Level 1 value displayed in this table is Common Stock. The Level 2 value displayed in this table is a Money Market Fund. Refer to this Schedule of Investments for a further breakout of each security by industry.
The Fund utilizes the end of period methodology when determining transfers. There were no transfers among Level 1, Level 2 and Level 3 for the year ended September 30, 2018.
See Notes to Financial Statements.
BAYWOOD VALUEPLUS FUND
SCHEDULE OF INVESTMENTS
SEPTEMBER 30, 2018
| PORTFOLIO HOLDINGS (Unaudited) | ||||
| % of Total Investments | ||||
| Basic Materials | 4.8 | % | ||
| Capital Goods / Industrials | 6.0 | % | ||
| Communication Services | 2.9 | % | ||
| Consumer Discretionary | 4.7 | % | ||
| Consumer Staples | 8.5 | % | ||
| Energy | 15.5 | % | ||
| Financials | 20.7 | % | ||
| Health Care | 12.6 | % | ||
| Real Estate | 3.1 | % | ||
| Technology | 14.3 | % | ||
| Transportation | 1.7 | % | ||
| Utilities | 1.1 | % | ||
| Money Market Fund | 4.1 | % | ||
| 100.0 | % | |||
See Notes to Financial Statements.
BAYWOOD VALUEPLUS FUND
STATEMENT OF ASSETS AND LIABILITIES
SEPTEMBER 30, 2018
| ASSETS | ||||
| Investments, at value (Cost $2,373,544) | $ | 2,879,924 | ||
| Receivables: | ||||
| Fund shares sold | 1,777 | |||
| Dividends | 5,440 | |||
| From investment advisor | 5,612 | |||
| Prepaid expenses | 11,403 | |||
| Total Assets | 2,904,156 | |||
| LIABILITIES | ||||
| Accrued Liabilities: | ||||
| Fund services fees | 4,728 | |||
| Other expenses | 23,257 | |||
| Total Liabilities | 27,985 | |||
| NET ASSETS | $ | 2,876,171 | ||
| COMPONENTS OF NET ASSETS | ||||
| Paid-in capital | $ | 2,255,007 | ||
| Undistributed net investment income | 5,683 | |||
| Accumulated net realized gain | 109,101 | |||
| Net unrealized appreciation | 506,380 | |||
| NET ASSETS | $ | 2,876,171 | ||
| SHARES OF BENEFICIAL INTEREST AT NO PAR VALUE (UNLIMITED SHARES AUTHORIZED) | ||||
| Investor Shares | 104,590 | |||
| Institutional Shares | 50,255 | |||
| NET ASSET VALUE, OFFERING AND REDEMPTION PRICE PER SHARE | ||||
| Investor Shares (based on net assets of $1,939,673) | $ | 18.55 | ||
| Institutional Shares (based on net assets of $936,498) | $ | 18.63 |
See Notes to Financial Statements.
BAYWOOD VALUEPLUS FUND
STATEMENT OF OPERATIONS
YEAR ENDED SEPTEMBER 30, 2018
| INVESTMENT INCOME | ||||
| Dividend income (Net of foreign withholding taxes of $728) | $ | 75,729 | ||
| Total Investment Income | 75,729 | |||
| EXPENSES | ||||
| Investment advisor fees | 13,547 | |||
| Fund services fees | 63,059 | |||
| Transfer agent fees: | ||||
| Investor Shares | 18,180 | |||
| Institutional Shares | 18,180 | |||
| Distribution fees: | ||||
| Investor Shares | 4,645 | |||
| Custodian fees | 5,000 | |||
| Registration fees: | ||||
| Investor Shares | 14,311 | |||
| Institutional Shares | 14,308 | |||
| Professional fees | 27,096 | |||
| Trustees' fees and expenses | 1,829 | |||
| Other expenses | 21,214 | |||
| Total Expenses | 201,369 | |||
| Fees waived and expenses reimbursed | (177,757 | ) | ||
| Net Expenses | 23,612 | |||
| NET INVESTMENT INCOME | 52,117 | |||
| NET REALIZED AND UNREALIZED GAIN (LOSS) | ||||
| Net realized gain on investments | 113,563 | |||
| Net change in unrealized appreciation (depreciation) on investments | 143,093 | |||
| NET REALIZED AND UNREALIZED GAIN | 256,656 | |||
| INCREASE IN NET ASSETS RESULTING FROM OPERATIONS | $ | 308,773 | ||
See Notes to Financial Statements.
BAYWOOD VALUEPLUS FUND
STATEMENTS OF CHANGES IN NET ASSETS
| For the Years Ended September 30, | ||||||||
| 2018 | 2017 | |||||||
| OPERATIONS | ||||||||
| Net investment income | $ | 52,117 | $ | 48,347 | ||||
| Net realized gain | 113,563 | 93,135 | ||||||
| Net change in unrealized appreciation (depreciation) | 143,093 | 192,429 | ||||||
| Increase in Net Assets Resulting from Operations | 308,773 | 333,911 | ||||||
| DISTRIBUTIONS TO SHAREHOLDERS FROM | ||||||||
| Net investment income: | ||||||||
| Investor Shares | (31,550 | ) | (32,969 | ) | ||||
| Institutional Shares | (16,732 | ) | (13,855 | ) | ||||
| Net realized gain: | ||||||||
| Investor Shares | (51,277 | ) | (29,530 | ) | ||||
| Institutional Shares | (22,602 | ) | (9,288 | ) | ||||
| Total Distributions to Shareholders | (122,161 | ) | (85,642 | ) | ||||
| CAPITAL SHARE TRANSACTIONS | ||||||||
| Sale of shares: | ||||||||
| Investor Shares | 12,064 | 38,459 | ||||||
| Institutional Shares | 137,213 | 94,402 | ||||||
| Reinvestment of distributions: | ||||||||
| Investor Shares | 82,750 | 62,499 | ||||||
| Institutional Shares | 39,334 | 23,143 | ||||||
| Redemption of shares: | ||||||||
| Investor Shares | (1,103 | ) | (265,416 | ) | ||||
| Institutional Shares | (8,552 | ) | (7,818 | ) | ||||
| Increase (Decrease) in Net Assets from Capital Share Transactions | 261,706 | (54,731 | ) | |||||
| Increase in Net Assets | 448,318 | 193,538 | ||||||
| NET ASSETS | ||||||||
| Beginning of Year | 2,427,853 | 2,234,315 | ||||||
| End of Year (Including line (a)) | $ | 2,876,171 | $2,427,853 | |||||
| SHARE TRANSACTIONS | ||||||||
| Sale of shares: | ||||||||
| Investor Shares | 649 | 2,354 | ||||||
| Institutional Shares | 7,574 | 5,685 | ||||||
| Reinvestment of distributions: | ||||||||
| Investor Shares | 4,630 | 3,784 | ||||||
| Institutional Shares | 2,189 | 1,392 | ||||||
| Redemption of shares: | ||||||||
| Investor Shares | (62 | ) | (16,185 | ) | ||||
| Institutional Shares | (474 | ) | (474 | ) | ||||
| Increase (Decrease) in Shares | 14,506 | (3,444 | ) | |||||
| (a) Undistributed net investment income | $ | 5,683 | $ | 2,112 | ||||
See Notes to Financial Statements.
BAYWOOD VALUEPLUS FUND
FINANCIAL HIGHLIGHTS
These financial highlights reflect selected data for a share outstanding throughout each period.
| For the Year Ended September 30, 2018 | For the Year Ended September 30, 2017 | For the Period Ended September 30, 2016 (a) | For the Year Ended November 30, 2015 | December 2, 2013 (b) Through November 30, 2014 | ||||||||||||||||
| INVESTOR SHARES | ||||||||||||||||||||
| NET ASSET VALUE, Beginning of Period | $ | 17.28 | $ | 15.52 | $ | 16.90 | $ | 19.28 | $ | 17.47 | ||||||||||
| INVESTMENT OPERATIONS | ||||||||||||||||||||
| Net investment income (c) | 0.33 | 0.33 | 0.26 | 0.34 | 0.36 | |||||||||||||||
| Net realized and unrealized gain (loss) | 1.77 | 2.02 | 0.93 | (1.06 | ) | 1.49 | ||||||||||||||
| Total from Investment Operations | 2.10 | 2.35 | 1.19 | (0.72 | ) | 1.85 | ||||||||||||||
| DISTRIBUTIONS TO SHAREHOLDERS FROM | ||||||||||||||||||||
| Net investment income | (0.31 | ) | (0.32 | ) | (2.20 | ) | (0.26 | ) | (0.04 | ) | ||||||||||
| Net realized gain | (0.52 | ) | (0.27 | ) | (0.37 | ) | (1.40 | ) | – | |||||||||||
| Total Distributions to Shareholders | (0.83 | ) | (0.59 | ) | (2.57 | ) | (1.66 | ) | (0.04 | ) | ||||||||||
| NET ASSET VALUE, End of Period | $ | 18.55 | $ | 17.28 | $ | 15.52 | $ | 16.90 | $ | 19.28 | ||||||||||
| TOTAL RETURN | 12.35 | % | 15.32 | % | 8.40 | %(d) | (3.86 | )% | 10.59 | %(d) | ||||||||||
| RATIOS/SUPPLEMENTARY DATA | ||||||||||||||||||||
| Net Assets at End of Year (000s omitted) | $ | 1,940 | $ | 1,717 | $ | 1,699 | $ | 1,362 | $ | 1,471 | ||||||||||
| Ratios to Average Net Assets: | ||||||||||||||||||||
| Net investment income | 1.84 | % | 2.03 | % | 2.07 | %(e) | 1.97 | % | 1.98 | %(e) | ||||||||||
| Net expenses | 0.95 | % | 0.95 | % | 0.95 | %(e) | 0.95 | % | 0.95 | %(e) | ||||||||||
| Gross expenses (f) | 6.79 | % | 7.67 | % | 9.43 | %(e) | 5.80 | % | 4.54 | %(e) | ||||||||||
| PORTFOLIO TURNOVER RATE | 34 | % | 48 | % | 22 | %(d) | 32 | % | 35 | %(d) | ||||||||||
| (a) | Effective March 24, 2016, the Fund changed its fiscal year end from November 30 to September 30. The information presented is for the period December 1, 2015 through September 30, 2016. |
| (b) | Commencement of operations. |
| (c) | Calculated based on average shares outstanding during each period. |
| (d) | Not annualized. |
| (e) | Annualized. |
| (f) | Reflects the expense ratio excluding any waivers and/or reimbursements. |
See Notes to Financial Statements.
BAYWOOD VALUEPLUS FUND
FINANCIAL HIGHLIGHTS
These financial highlights reflect selected data for a share outstanding throughout each period.
| For the Year Ended September 30, 2018 | For the Year Ended September 30, 2017 | For the Period Ended September 30, 2016 (a) | For the Year Ended November 30, 2015 | December 2, 2013 (b) Through November 30, 2014 | ||||||||||||||||
| INSTITUTIONAL SHARES | ||||||||||||||||||||
| NET ASSET VALUE, Beginning of Period | $ | 17.36 | $ | 15.59 | $ | 17.00 | $ | 19.42 | $ | 17.56 | ||||||||||
| INVESTMENT OPERATIONS | ||||||||||||||||||||
| Net investment income (c) | 0.38 | 0.38 | 0.29 | 0.39 | 0.41 | |||||||||||||||
| Net realized and unrealized gain (loss) | 1.76 | 2.02 | 0.94 | (1.06 | ) | 1.50 | ||||||||||||||
| Total from Investment Operations | 2.14 | 2.40 | 1.23 | (0.67 | ) | 1.91 | ||||||||||||||
| DISTRIBUTIONS TO SHAREHOLDERS FROM | ||||||||||||||||||||
| Net investment income | (0.35 | ) | (0.36 | ) | (2.27 | ) | (0.35 | ) | (0.05 | ) | ||||||||||
| Net realized gain | (0.52 | ) | (0.27 | ) | (0.37 | ) | (1.40 | ) | – | |||||||||||
| Total Distributions to Shareholders | (0.87 | ) | (0.63 | ) | (2.64 | ) | (1.75 | ) | (0.05 | ) | ||||||||||
| NET ASSET VALUE, End of Period | $ | 18.63 | $ | 17.36 | $ | 15.59 | $ | 17.00 | $ | 19.42 | ||||||||||
| TOTAL RETURN | 12.57 | % | 15.60 | % | 8.65 | %(d) | (3.58 | )% | 10.87 | %(d) | ||||||||||
| RATIOS/SUPPLEMENTARY DATA | ||||||||||||||||||||
| Net Assets at End of Period (000s omitted) | $ | 936 | $ | 711 | $ | 536 | $ | 426 | $ | 11,067 | ||||||||||
| Ratios to Average Net Assets: | ||||||||||||||||||||
| Net investment income | 2.10 | % | 2.28 | % | 2.30 | %(e) | 2.23 | % | 2.26 | %(e) | ||||||||||
| Net expenses | 0.70 | % | 0.70 | % | 0.70 | %(e) | 0.70 | % | 0.70 | %(e) | ||||||||||
| Gross expenses (f) | 8.83 | % | 11.16 | % | 14.43 | %(e) | 2.09 | % | 2.50 | %(e) | ||||||||||
| PORTFOLIO TURNOVER RATE | 34 | % | 48 | % | 22 | %(d) | 32 | % | 35 | %(d) | ||||||||||
| (a) | Effective March 24, 2016, the Fund changed its fiscal year end from November 30 to September 30. The information presented is for the periodDecember 1, 2015 through September 30, 2016. |
| (b) | Commencement of operations. |
| (c) | Calculated based on average shares outstanding during each period. |
| (d) | Not annualized. |
| (e) | Annualized. |
| (f) | Reflects the expense ratio excluding any waivers and/or reimbursements. |
See Notes to Financial Statements.
BAYWOOD SOCIALLYRESPONSIBLE FUND
A MESSAGE TO OUR SHAREHOLDERS (Unaudited)
SEPTEMBER 30, 2018
Dear Shareholder,
We are pleased to report our economic and financial market perspectives and the investment activities for the Baywood SociallyResponsible Fund (the “Fund”) for the 12 months ended September, 2018. The Fund is a mid-to-large capitalization value-oriented portfolio of stock holdings selected from a universe of stocks created through the application of inclusionary and exclusionary social screens and assessments of the ESG profile of each company. Among these stocks, we further evaluate and assess each prospective holding’s valuation and fundamental business attraction to determine the current portfolio holdings. In selecting investments, we consider social criteria such as an issuer’s community relations, corporate governance, employee diversity, employee relations, environmental impact and sustainability, human rights record and product safety. Using both quantitative and qualitative data, we also evaluate an issuer’s involvement in specific revenue generating activities to determine whether the issuer’s involvement was meaningful or incidental with respect to that activity.
SKBA’s overall goal with our SociallyResponsible strategy is always to serve the investment needs and objectives of our shareholders, and in the midst of all the changes occurring in the market, we will begin with a quick discussion on the meaning of Socially Responsible investing. We speak in broad terms given the varying viewpoints. Its definition is truly “in the eye of the beholder” and can often appear nebulous. In the United States, “responsible” investing is often discussed through the lens of three pillars: Environmental, Social, and Governance, or ESG. This differs from the mostly European focus on transparency and best-in-class. Through ESG investing, most portfolios exclude companies or sectors that generally violate the idea of good environmental, social or governance practices while some work to include those that exhibit positive ESG attributes.
While excluding stocks from purchase for SRI/ESG reasons can at times result in higher volatility of returns compared to the broader stock market indexes, over the last fiscal year the benefits to total portfolio return of our SR strategy have been demonstrated relative to our primary value-style benchmarks and has outperformed them by a significant margin.
We manage the strategy pragmatically, with an eye to achieving appropriate sector diversification. We applaud transparency—it is an important one of many components to our investment decision—and we are members of UNPRI, the world’s largest organization to pursue transparency. We also tend to focus on ESG investing with an emphasis on the ‘G’ or governance. We will generally not exclude sectors from our investment universe based on ideological beliefs but do avoid some industries, such a tobacco and firearms among others, which provide an overwhelming dis-benefit to society. This is regardless of whether or not such stocks might produce periods of excess return. Such “hard” exclusionary screens continue to reflect the commonly-held desires of nearly all SRI/ESG investors. Otherwise, we seek the benefits of sector diversification even while we exclude stocks within a sector that we believe do not fit our ESG criteria.
If at any point in time we exclude a sector for a particular reason, rest assured it is likely for temporary reasons, such as our decision to not own companies in the utility sector. Certain utilities that derive their revenues from nuclear power are generally excluded in the strategy, however, that is not the only reason we currently do not own any in the portfolio. No, the secondary reason is less “noble” than the first; it’s simply because we think their valuations are not reflective of the poor fundamentals that most appear to exhibit. For the year, the decision to underweight those “bond proxy” sectors is responsible for nearly half of relative returns.
As stated we still maintain the most commonly desired exclusionary screens in the strategy, yet exclusionary screens are a small part of how we manage the strategy. It is our informed opinion that companies with strong governance practices are much less likely to pursue value-destroying acts as compared to those with less than ideal governance practices. What do we mean by value-destroying? We define it as destruction of all capital, including that of both stakeholders and shareholders. The concept of a stakeholder can be far-reaching, much more so than to think that one can take all stakeholders into account for every investment decision, so we limit our definition to generally include direct stakeholders. This generally encompasses those directly affected by a company’s labor practices, supply chain and positive and negative environmental impacts. The pros and cons of each are measured against each other which help inform our investment decision, though generally speaking, the most informative data we can acquire is that of a company’s governance practices, because governance may tell you more about what to expect from a company than its past will. Our process is forward-looking. We only care for the past if we have reason to think it is indicative of some future result or trend. For example, if a company has poor governance practices, its board is entrenched, its CEO is the chairman and is not likely going to change in the near future then yes, its past and all its transgressions and virtues (if any) are likely to persist into the future until meaningful changes to its governance and corporate bylaws are enacted. Generally speaking however, a company’s past is a relatively small input in determining the likelihood of forward looking events.
BAYWOOD SOCIALLYRESPONSIBLE FUND
A MESSAGE TO OUR SHAREHOLDERS (Unaudited)
SEPTEMBER 30, 2018
As value investors we tend to purchase companies that are out-of-favor, yet with generally predictable and strong or improving fundamentals that suggest a reversion to an in-favor status over our investment horizon. Similarly, companies we purchase from an ESG perspective can also be out-of-favor, we like to call these companies reformers. We would rather own a company on its way to meaningful positive reform than be lulled into purchasing a good perceived reputation on its way down. A short list of former “good” companies gone bad, none of which we owned at the time the negative headlines surfaced, can provide some insight into how the strategy is managed. Companies like Wells Fargo, which we owned in 2008 due to conservative lending practices yet exited in 2016 due to aggressive lending practices, Volkswagen (named best “green company” weeks before its diesel scandal hit headlines), BP, Enron, WorldCom and Valeant area a few examples. We don’t profess to have the ability to avoid all bad actors in the future. However, contrary to overwhelming consensus and popular belief, none of these companies had exemplary governance practices prior the issues responsible for their downfall.
Now that we’ve had a chance to discuss the Socially Responsible aspect of the strategy, we will discuss the investments. During the period we found significant opportunities to take advantage of what we believe was a widening of our investment universe, most notably in sectors that we haven’t seen many opportunities in over the last several years. Sector weights in real estate went from zero to almost 4%, communications nearly doubled from 3.5% and consumer staples increased by a third. For the most part we have avoided companies in these sectors because their high valuations were unjustified in our opinion. However, as interest rates have increased dramatically over the last year, these sectors fell out-of-favor and we have been able to selectively add what we believe are the better operators in each industry. Weyerhaeuser and Brookfield Property Partners in real estate, Verizon and Century Link in communications and Mondelez in consumer staples. Furthermore, as the retail sector continued to struggle and decline even further, we added Tapestry (formerly known as Coach and Kate Spade) to the portfolio; in short order Tapestry was one of the top performers returning over 25% compared against the benchmark’s sector return of under 2%.
CenturyLink likewise has performed well returning nearly 16% compared against the benchmark’s less than 4% sector return since our purchase. CenturyLink is emblematic of a company whose past may not be indicative of its future. It acquired Level 3 Communications last year and as a result its former CEO, responsible for much of the capital destroying activities of its past, was replaced by the CEO of Level 3, Jeff Storey, earlier this year. Mr. Storey is a sort of reformer himself, having transformed Level 3 from a profit-less company into a major competitor in his time as a CEO of Level 3. Now serving as the CEO of CenturyLink, we have expectations that he will do the same.
Other top contributors for the period include Discovery, Mosaic, Encompass Health, and Union Pacific; companies we have held for a longer period of time and in the case of Discovery and Mosaic our patience paid off, each returning close to 50% after an ample period of volatility in the early stages of our holdings.
In favor of the increases in the real estate, consumer staples and communications sectors we lowered our holdings in the industrial and consumer discretionary sectors. In industrials we exited successful investments in Kansas City Southern Railroad and Pentair and exited an unsuccessful investment in Nielsen as its troubles got progressively worse and the “crown jewel” watch segment appears to be at the beginning stages of a decline. In the consumer discretionary sector we exited L Brands, the parent company to Victoria Secret, Pink and Bath and Body Works after its fundamentals began to deteriorate beyond our expectations. We initially assumed a certain level of sales declines as foot traffic declines at traditional mall setting where the majority of its stores are located, however management has been slow to change its retail strategy and develop its e-commerce solutions, leading to worse-than-expected declines in sales. Unfortunately the company has begun to rely on discounts which negatively affects both profitability and its brand perception. Both Nielsen and L Brands represent some of the top detractors for the period; others includes Cabot Oil and Gas, Lithia Motors and LionsGate.
Sector allocation accounts for nearly half of the outperformance in the period where the underweight position in utilities, real estate, consumer staples and communication services sectors added over 200 basis points of outperformance and was partially offset by the underweight in energy and overweight in consumer discretionary.
We have been managing to Socially Responsible mandates for over 25 years where our goal has been to align our investment interests with the values and interests of our shareholders. It is our hope to continue to do so in the years to come.
Current and future portfolio holdings are subject to change and risk.
The MSCI KLD 400 Social Index and the Morningstar Category are used to compare fund performance to its peers. It is not possible to invest directly into an index or category. Past performance is no guarantee of future results.
BAYWOOD SOCIALLYRESPONSIBLE FUND
A MESSAGE TO OUR SHAREHOLDERS (Unaudited)
SEPTEMBER 30, 2018
Risk Considerations: Mutual fund investing involves risk, including the possible loss of principal. Socially responsible investment criteria may limit the number of investment opportunities available to the Fund or it may invest a larger portion of its assets in certain sectors which could be more sensitive to market conditions, economic, regulatory and environmental developments. These factors could negatively impact the Fund’s returns. The Fund primarily invests in undervalued securities, which may not appreciate in value as anticipated by the Advisor or remain undervalued for longer than anticipated. The Fund may invest in American Depositary Receipts (ADRs), which involves risks relating to political, economic or regulatory conditions in foreign countries and may cause greater volatility and less liquidity. The Fund may also invest in convertible securities and preferred stock, which may be adversely affected as interest rates rise.
BAYWOOD SOCIALLYRESPONSIBLE FUND
PERFORMANCE CHART AND ANALYSIS (Unaudited)
SEPTEMBER 30, 2018
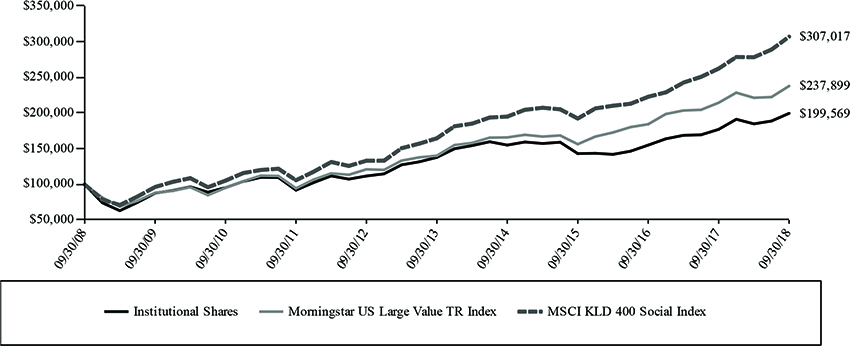
The following charts reflect the change in the value of a hypothetical $10,000 investment in Investor Shares and a hypothetical $100,000 investment in Institutional Shares, including reinvested dividends and distributions, in the Baywood SociallyResponsible Fund (the “Fund”) compared with the performance of the primary benchmark, Morningstar US Large Value TR Index, and the secondary benchmark, MSCI KLD 400 Social Index (the "Indices"), over the past ten fiscal years. The Morningstar US Large Value TR Index measures the performance of large-cap stocks with relatively low prices given anticipated per share earnings, book value, cash flow, sales and dividends. The MSCI KLD 400 Social Index is a capitalization weighted index of 400 US securities that provides exposure to companies with outstanding Environmental, Social and Governance ratings and excludes companies whose products have negative social or environmental impacts. The total return of the indices include the reinvestment of dividends and income. The total return of the Fund includes operating expenses that reduce returns, while the total return of the indices do not include expenses. The Fund is professionally managed, while the indices are unmanaged and are not available for investment.
Comparison of Change in Value of a $10,000 Investment
Investor Shares vs. Morningstar US Large Value TR Index and MSCI KLD 400 Social Index

|
Average Annual Total Returns Periods Ended September 30, 2018 |
One Year | Five Year | Ten Year |
| Baywood SociallyResponsible Fund Investor Shares* | 12.29% | 7.44% | 6.90% |
| Morningstar US Large Value TR Index | 10.89% | 11.15% | 9.05% |
| MSCI KLD 400 Social Index | 17.03% | 13.27% | 11.87% |
| * | Performance for Investor Shares for periods prior to January 8, 2016, reflects the performance and expenses of City National Rochdale Socially Responsible Equity Fund, a series of City National Rochdale Funds (the “Predecessor Fund”). |
BAYWOOD SOCIALLYRESPONSIBLE FUND
PERFORMANCE CHART AND ANALYSIS (Unaudited)
SEPTEMBER 30, 2018
Comparison of Change in Value of a $100,000 Investment
Institutional Shares vs. Morningstar US Large Value TR Index and MSCI KLD 400 Social Index
|
Average Annual Total Returns Periods Ended September 30, 2018 |
One Year | Five Year | Ten Year |
| Baywood SociallyResponsible Fund Institutional Shares* | 12.66% | 7.68% | 7.15% |
| Morningstar US Large Value TR Index | 10.89% | 11.15% | 9.05% |
| MSCI KLD 400 Social Index | 17.03% | 13.27% | 11.87% |
| * | Performance for Institutional Shares for periods prior to January 8, 2016, reflects the performance and expenses of City National Rochdale Socially Responsible Equity Fund, a series of City National Rochdale Funds (the “Predecessor Fund”). |
Performance data quoted represents past performance and is no guarantee of future results. Current performance may be lower or higher than the performance data quoted. Investment return and principal value will fluctuate so that shares, when redeemed, may be worth more or less than original cost. As stated in the Fund’s prospectus, the annual operating expense ratios (gross) for Investor Shares and Institutional Shares are 2.64% and 2.64%, respectively. However, the Fund’s advisor has contractually agreed to waive its fee and/or reimburse Fund expenses to limit Total Annual Fund Operating Expenses After Fee Waiver and/or Expense Reimbursement (excluding all taxes, interest, portfolio transaction expenses, acquired fund fees and expenses, proxy expenses and extraordinary expenses) to 1.14% and 0.89% for Investor Shares and Institutional Shares, respectively, through January 31, 2019 (the “Expense Cap”) (the “Expense Cap”). The advisor may be reimbursed by each Fund for fees waived and expenses reimbursed by the advisor pursuant to the Expense Cap if such payment is approved by the Board, made within three years of the fee waiver or expense reimbursement, and does not cause the Total Annual Fund Operating Expenses After Fee Waiver and/or Expense Reimbursement to exceed the lesser of (i) the then-current expense cap, or (ii) the expense cap in place at the time the fees/expenses were waived/reimbursed. During the period, certain fees were waived and/or expenses reimbursed; otherwise, returns would have been lower. The performance table and graph do not reflect the deduction of taxes that a shareholder would pay on Fund distributions or the redemption of Fund shares. Returns greater than one year are annualized. For the most recent month-end performance, please call (855) 409-2297.
BAYWOOD SOCIALLYRESPONSIBLE FUND
SCHEDULE OF INVESTMENTS
SEPTEMBER 30, 2018
| Shares | Security Description | Value | ||||||
| Common Stock - 96.5% | ||||||||
| Basic Materials - 5.1% | ||||||||
| 1,900 | Nutrien, Ltd. | $ | 109,630 | |||||
| 3,500 | The Mosaic Co. | 113,680 | ||||||
| 223,310 | ||||||||
| Capital Goods / Industrials - 4.1% | ||||||||
| 600 | Johnson Controls International PLC | 21,000 | ||||||
| 3,200 | Sensata Technologies Holding PLC (a) | 158,560 | ||||||
| 179,560 | ||||||||
| Communication Services - 6.3% | ||||||||
| 4,300 | CenturyLink, Inc. | 91,160 | ||||||
| 4,100 | Discovery, Inc., Class C (a) | 121,278 | ||||||
| 1,200 | Verizon Communications, Inc. | 64,068 | ||||||
| 276,506 | ||||||||
| Consumer Discretionary - 5.3% | ||||||||
| 1,000 | AutoNation, Inc. (a) | 41,550 | ||||||
| 1,500 | Tapestry, Inc. | 75,405 | ||||||
| 9,300 | TRI Pointe Group, Inc. (a) | 115,320 | ||||||
| 232,275 | ||||||||
| Consumer Staples - 4.8% | ||||||||
| 2,300 | Mondelez International, Inc., Class A | 98,808 | ||||||
| 1,000 | PepsiCo., Inc. | 111,800 | ||||||
| 210,608 | ||||||||
| Energy - 6.6% | ||||||||
| 3,100 | Centennial Resource Development, Inc., Class A (a) | 67,735 | ||||||
| 3,000 | Devon Energy Corp. | 119,820 | ||||||
| 1,700 | Schlumberger, Ltd. | 103,564 | ||||||
| 291,119 | ||||||||
| Financials - 24.8% | ||||||||
| 4,700 | Air Lease Corp. | 215,636 | ||||||
| 1,500 | American Express Co. | 159,735 | ||||||
| 700 | American International Group, Inc. | 37,268 | ||||||
| 5,800 | Bank of America Corp. | 170,868 | ||||||
| 1,500 | BOK Financial Corp. | 145,920 | ||||||
| 3,750 | Brookfield Asset Management, Inc., Class A | 166,987 | ||||||
| 800 | M&T Bank Corp. | 131,632 | ||||||
| 3,000 | Radian Group, Inc. | 62,010 | ||||||
| 1,090,056 | ||||||||
| Health Care - 18.6% | ||||||||
| 700 | AbbVie, Inc. | 66,206 | ||||||
| 2,000 | AstraZeneca PLC, ADR | 79,140 | ||||||
| 800 | Becton Dickinson and Co. | 208,800 | ||||||
| 700 | Encompass Health Corp. | 54,565 | ||||||
| 4,400 | Koninklijke Philips NV, ADR | 200,244 | ||||||
| 300 | Laboratory Corp. of America Holdings (a) | 52,104 | ||||||
| 1,600 | Medtronic PLC | 157,392 | ||||||
| 818,451 | ||||||||
| Real Estate - 3.6% | ||||||||
| 5,300 | Brookfield Property Partners LP | 110,717 | ||||||
| 1,500 | Weyerhaeuser Co. REIT | 48,405 | ||||||
| 159,122 | ||||||||
| Technology - 13.2% | ||||||||
| 3,100 | Cisco Systems, Inc. | 150,815 | ||||||
| 3,000 | Corning, Inc. | 105,900 | ||||||
| 3,400 | HP, Inc. | 87,618 | ||||||
| 2,500 | Intel Corp. | 118,225 | ||||||
| 800 | International Business Machines Corp. | 120,968 | ||||||
| 583,526 | ||||||||
| Transportation - 4.1% | ||||||||
| 9,500 | AP Moller - Maersk A/S, ADR | 66,738 | ||||||
| 700 | Union Pacific Corp. | 113,981 | ||||||
| 180,719 | ||||||||
| Total Common Stock (Cost $3,221,819) | 4,245,252 | |||||||
| Shares | Security Description | Value | ||||||
| Money Market Fund - 3.6% | ||||||||
| 160,237 | Morgan Stanley Institutional Liquidity | |||||||
| Funds Government Portfolio, Institutional | ||||||||
| Class, 2.01% (b) | ||||||||
| (Cost $160,237) | $ | 160,237 | ||||||
| Investments, at value - 100.1% (Cost $3,382,056) | $ | 4,405,489 | ||||||
| Other Assets & Liabilities, Net - (0.1)% | (4,566 | ) | ||||||
| Net Assets - 100.0% | $ | 4,400,923 | ||||||
| ADR | American Depositary Receipt |
| LP | Limited Partnership |
| PLC | Public Limited Company |
| REIT | Real Estate Investment Trust |
| (a) | Non-income producing security. |
| (b) | Dividend yield changes daily to reflect current market conditions. Rate was the quoted yield as of September 30, 2018. |
The following is a summary of the inputs used to value the Fund's instruments as of September 30, 2018.
The inputs or methodology used for valuing securities are not necessarily an indication of the risks associated with investing in those securities. For more information on valuation inputs, and their aggregation into the levels used in the table below, please refer to the Security Valuation section in Note 2 of the accompanying Notes to Financial Statements.
| Valuation Inputs | Investments in Securities | |||
| Level 1 - Quoted Prices | $ | 4,245,252 | ||
| Level 2 - Other Significant Observable Inputs | 160,237 | |||
| Level 3 - Significant Unobservable Inputs | – | |||
| Total | $ | 4,405,489 | ||
The Level 1 value displayed in this table is Common Stock. The Level 2 value displayed in this table is a Money Market Fund. Refer to this Schedule of Investments for a further breakout of each security by industry.
The Fund utilizes the end of period methodology when determining transfers. There were no transfers among Level 1, Level 2 and Level 3 for the year ended September 30, 2018.
| PORTFOLIO HOLDINGS (Unaudited) | ||||
| % of Total Investments | ||||
| Basic Materials | 5.1 | % | ||
| Capital Goods / Industrials | 4.1 | % | ||
| Communication Services | 6.3 | % | ||
| Consumer Discretionary | 5.3 | % | ||
| Consumer Staples | 4.8 | % | ||
| Energy | 6.6 | % | ||
| Financials | 24.7 | % | ||
| Health Care | 18.6 | % | ||
| Real Estate | 3.6 | % | ||
| Technology | 13.2 | % | ||
| Transportation | 4.1 | % | ||
| Money Market Fund | 3.6 | % | ||
| 100.0 | % | |||
See Notes to Financial Statements.
BAYWOOD SOCIALLYRESPONSIBLE FUND
STATEMENT OF ASSETS AND LIABILITIES
SEPTEMBER 30, 2018
| ASSETS | ||||
| Investments, at value (Cost $3,382,056) | $ | 4,405,489 | ||
| Cash | 99 | |||
| Receivables: | ||||
| Fund shares sold | 1,141 | |||
| Dividends | 8,274 | |||
| From investment advisor | 7,131 | |||
| Prepaid expenses | 7,985 | |||
| Total Assets | 4,430,119 | |||
| LIABILITIES | ||||
| Payables: | ||||
| Fund shares redeemed | 3 | |||
| Accrued Liabilities: | ||||
| Fund services fees | 5,083 | |||
| Other expenses | 24,110 | |||
| Total Liabilities | 29,196 | |||
| NET ASSETS | $ | 4,400,923 | ||
| COMPONENTS OF NET ASSETS | ||||
| Paid-in capital | $ | 3,186,881 | ||
| Undistributed net investment income | 1,735 | |||
| Accumulated net realized gain | 188,874 | |||
| Net unrealized appreciation | 1,023,433 | |||
| NET ASSETS | $ | 4,400,923 | ||
| SHARES OF BENEFICIAL INTEREST AT NO PAR VALUE (UNLIMITED SHARES AUTHORIZED) | ||||
| Investor Shares | 214,114 | |||
| Institutional Shares | 134,912 | |||
| NET ASSET VALUE, OFFERING AND REDEMPTION PRICE PER SHARE | ||||
| Investor Shares (based on net assets of $2,701,499) | $ | 12.62 | ||
| Institutional Shares (based on net assets of $1,699,424) | $ | 12.60 | ||
See Notes to Financial Statements.
BAYWOOD SOCIALLYRESPONSIBLE FUND
STATEMENT OF OPERATIONS
YEAR ENDED SEPTEMBER 30, 2018
| INVESTMENT INCOME | ||||
| Dividend income (Net of foreign withholding taxes of $2,710) | $ | 140,887 | ||
| Total Investment Income | 140,887 | |||
| EXPENSES | ||||
| Investment advisor fees | 51,892 | |||
| Fund services fees | 71,942 | |||
| Transfer agent fees: | ||||
| Investor Shares | 18,180 | |||
| Institutional Shares | 18,180 | |||
| Distribution fees: | ||||
| Investor Shares | 6,899 | |||
| Custodian fees | 5,000 | |||
| Registration fees: | ||||
| Investor Shares | 12,246 | |||
| Institutional Shares | 12,246 | |||
| Professional fees | 27,622 | |||
| Trustees' fees and expenses | 2,013 | |||
| Other expenses | 24,561 | |||
| Total Expenses | 250,781 | |||
| Fees waived and expenses reimbursed | (177,904 | ) | ||
| Net Expenses | 72,877 | |||
| NET INVESTMENT INCOME | 68,010 | |||
| NET REALIZED AND UNREALIZED GAIN (LOSS) | ||||
| Net realized gain on investments | 890,310 | |||
| Net change in unrealized appreciation (depreciation) on investments | (186,732 | ) | ||
| NET REALIZED AND UNREALIZED GAIN | 703,578 | |||
| INCREASE IN NET ASSETS RESULTING FROM OPERATIONS | $ | 771,588 | ||
See Notes to Financial Statements.
BAYWOOD SOCIALLYRESPONSIBLE FUND
STATEMENTS OF CHANGES IN NET ASSETS
| For the Years Ended September 30, | ||||||||
| 2018 | 2017 | |||||||
| OPERATIONS | ||||||||
| Net investment income | $ | 68,010 | $ | 85,258 | ||||
| Net realized gain | 890,310 | 1,077,354 | ||||||
| Net change in unrealized appreciation (depreciation) | (186,732 | ) | 408,585 | |||||
| Increase in Net Assets Resulting from Operations | 771,588 | 1,571,197 | ||||||
| DISTRIBUTIONS TO SHAREHOLDERS FROM | ||||||||
| Net investment income: | ||||||||
| Investor Shares | (14,499 | ) | (57,751 | ) | ||||
| Institutional Shares | (45,236 | ) | (72,531 | ) | ||||
| Net realized gain: | ||||||||
| Investor Shares | (36,997 | ) | – | |||||
| Institutional Shares | (75,417 | ) | – | |||||
| Total Distributions to Shareholders | (172,149 | ) | (130,282 | ) | ||||
| CAPITAL SHARE TRANSACTIONS | ||||||||
| Sale of shares: | ||||||||
| Investor Shares | 48,352 | 451,332 | ||||||
| Institutional Shares | 190,483 | 285,008 | ||||||
| Reinvestment of distributions: | ||||||||
| Investor Shares | 48,772 | 56,463 | ||||||
| Institutional Shares | 120,102 | 72,083 | ||||||
| Redemption of shares: | ||||||||
| Investor Shares | (542,020 | ) | (8,327,460 | ) | ||||
| Institutional Shares | (4,342,445 | ) | (1,145,359 | ) | ||||
| Decrease in Net Assets from Capital Share Transactions | (4,476,756 | ) | (8,607,933 | ) | ||||
| Decrease in Net Assets | (3,877,317 | ) | (7,167,018 | ) | ||||
| NET ASSETS | ||||||||
| Beginning of Year | 8,278,240 | 15,445,258 | ||||||
| End of Year (Including line (a)) | $ | 4,400,923 | $ | 8,278,240 | ||||
| SHARE TRANSACTIONS | ||||||||
| Sale of shares: | ||||||||
| Investor Shares | 3,910 | 41,978 | ||||||
| Institutional Shares | 15,647 | 25,941 | ||||||
| Reinvestment of distributions: | ||||||||
| Investor Shares | 4,058 | 5,238 | ||||||
| Institutional Shares | 10,021 | 6,593 | ||||||
| Redemption of shares: | ||||||||
| Investor Shares | (44,965 | ) | (771,560 | ) | ||||
| Institutional Shares | (363,462 | ) | (107,029 | ) | ||||
| Decrease in Shares | (374,791 | ) | (798,839 | ) | ||||
| (a) Undistributed net investment income | $ | 1,735 | $ | 1,691 | ||||
See Notes to Financial Statements.
BAYWOOD SOCIALLYRESPONSIBLE FUND
FINANCIAL HIGHLIGHTS
These financial highlights reflect selected data for a share outstanding throughout each year.
| For the Years Ended September 30, | ||||||||||||||||||||
| 2018 | 2017 | 2016 | 2015 | 2014 | ||||||||||||||||
| INVESTOR SHARES | ||||||||||||||||||||
| NET ASSET VALUE, Beginning of Year | $ | 11.45 | $ | 10.14 | $ | 10.16 | $ | 11.42 | $ | 12.26 | ||||||||||
| INVESTMENT OPERATIONS | ||||||||||||||||||||
| Net investment income (a) | 0.09 | 0.06 | 0.08 | 0.11 | 0.18 | |||||||||||||||
| Net realized and unrealized gain (loss) | 1.30 | 1.35 | 0.71 | (0.98 | ) | 1.15 | ||||||||||||||
| Total from Investment Operations | 1.39 | 1.41 | 0.79 | (0.87 | ) | 1.33 | ||||||||||||||
| DISTRIBUTIONS TO SHAREHOLDERS FROM | ||||||||||||||||||||
| Net investment income | (0.06 | ) | (0.10 | ) | (0.28 | ) | (0.10 | ) | (0.15 | ) | ||||||||||
| Net realized gain | (0.16 | ) | – | (0.53 | ) | (0.29 | ) | (2.02 | ) | |||||||||||
| Total Distributions to Shareholders | (0.22 | ) | (0.10 | ) | (0.81 | ) | (0.39 | ) | (2.17 | ) | ||||||||||
| NET ASSET VALUE, End of Year | $ | 12.62 | $ | 11.45 | $ | 10.14 | $ | 10.16 | $ | 11.42 | ||||||||||
| TOTAL RETURN | 12.29 | % | 13.98 | % | 8.28 | % | (7.86 | )% | 12.11 | % | ||||||||||
| RATIOS/SUPPLEMENTARY DATA | ||||||||||||||||||||
| Net Assets at End of Year (000s omitted) | $ | 2,701 | $ | 2,874 | $ | 9,890 | $ | 23,045 | $ | 26,763 | ||||||||||
| Ratios to Average Net Assets: | ||||||||||||||||||||
| Net investment income | 0.76 | % | 0.60 | % | 0.77 | % | 0.99 | % | 1.55 | % | ||||||||||
| Net expenses | 1.14 | % | 1.14 | % | 1.28 | % | 1.14 | % | 1.14 | % | ||||||||||
| Gross expenses (b) | 3.98 | % | 2.64 | % | 1.84 | % | 1.37 | % | 1.46 | % | ||||||||||
| PORTFOLIO TURNOVER RATE | 31 | % | 42 | % | 57 | % | 29 | % | 34 | % | ||||||||||
| (a) | Calculated based on average shares outstanding during each year. |
| (b) | Reflects the expense ratio excluding any waivers and/or reimbursements. |
See Notes to Financial Statements.
BAYWOOD SOCIALLYRESPONSIBLE FUND
FINANCIAL HIGHLIGHTS
These financial highlights reflect selected data for a share outstanding throughout each year.
| For the Years Ended September 30, | ||||||||||||||||||||
| 2018 | 2017 | 2016 | 2015 | 2014 | ||||||||||||||||
| INSTITUTIONAL SHARES | ||||||||||||||||||||
| NET ASSET VALUE, Beginning of Year | $ | 11.43 | $ | 10.15 | $ | 10.18 | $ | 11.45 | $ | 12.28 | ||||||||||
| INVESTMENT OPERATIONS | ||||||||||||||||||||
| Net investment income (a) | 0.12 | 0.10 | 0.14 | 0.14 | 0.19 | |||||||||||||||
| Net realized and unrealized gain (loss) | 1.31 | 1.33 | 0.66 | (0.99 | ) | 1.18 | ||||||||||||||
| Total from Investment Operations | 1.43 | 1.43 | 0.80 | (0.85 | ) | 1.37 | ||||||||||||||
| DISTRIBUTIONS TO SHAREHOLDERS FROM | ||||||||||||||||||||
| Net investment income | (0.10 | ) | (0.15 | ) | (0.30 | ) | (0.13 | ) | (0.18 | ) | ||||||||||
| Net realized gain | (0.16 | ) | – | (0.53 | ) | (0.29 | ) | (2.02 | ) | |||||||||||
| Total Distributions to Shareholders | (0.26 | ) | (0.15 | ) | (0.83 | ) | (0.42 | ) | (2.20 | ) | ||||||||||
| NET ASSET VALUE, End of Year | $ | 12.60 | $ | 11.43 | $ | 10.15 | $ | 10.18 | $ | 11.45 | ||||||||||
| TOTAL RETURN | 12.66 | % | 14.18 | % | 8.40 | % | (7.70 | )% | 12.46 | % | ||||||||||
| RATIOS/SUPPLEMENTARY DATA | ||||||||||||||||||||
| Net Assets at End of Year (000s omitted) | $ | 1,699 | $ | 5,404 | $ | 5,555 | $ | 238,379 | $ | 172,830 | ||||||||||
| Ratios to Average Net Assets: | ||||||||||||||||||||
| Net investment income | 1.01 | % | 0.92 | % | 1.35 | % | 1.22 | % | 1.62 | % | ||||||||||
| Net expenses | 0.89 | % | 0.89 | % | 0.89 | % | 0.89 | %(c) | 0.89 | % | ||||||||||
| Gross expenses (b) | 3.03 | % | 2.64 | % | 1.00 | % | 0.87 | % | 0.96 | % | ||||||||||
| PORTFOLIO TURNOVER RATE | 31 | % | 42 | % | 57 | % | 29 | % | 34 | % | ||||||||||
| (a) | Calculated based on average shares outstanding during each year. |
| (b) | Reflects the expense ratio excluding any waivers and/or reimbursements. |
| (c) | Ratio includes waivers and previously waived investment advisory fees recovered. The impact of the recovered fees may cause a higher net expense ratio. |
See Notes to Financial Statements.
BAYWOOD FUNDS
NOTES TO FINANCIAL STATEMENTS
SEPTEMBER 30, 2018
Note 1. Organization
Baywood ValuePlus Fund and Baywood SociallyResponsible Fund (individually, a “Fund” and collectively, the “Funds”) are diversified portfolios of Forum Funds II (the “Trust”). The Trust is a Delaware statutory trust that is registered as an open-end, management investment company under the Investment Company Act of 1940, as amended (the “Act”). Under its Trust Instrument, the Trust is authorized to issue an unlimited number of each Fund’s shares of beneficial interest without par value. The Baywood ValuePlus Fund commenced operations on December 2, 2013, through a reorganization of a collective investment trust into the Baywood ValuePlus Fund. The collective investment trust was previously managed by the Baywood ValuePlus Fund’s Advisor and portfolio management team. This collective investment trust was organized and commenced operations on June 27, 2008. The Baywood ValuePlus Fund currently offers two classes of shares: Investor Shares and Institutional Shares. The Baywood ValuePlus Fund seeks to achieve long-term capital appreciation by investing in undervalued equity securities. The Baywood SociallyResponsible Fund commenced operations on January 3, 2005. The Baywood SociallyResponsible Fund currently offers two classes of shares: Investor Shares and Institutional Shares. The Baywood SociallyResponsible Fund seeks to provide long-term capital growth.
On December 7, 2015, at a special meeting of shareholders of Baywood SociallyResponsible Fund, formerly City National Rochdale Socially Responsible Equity Fund, a series of City National Rochdale Funds (the "Predecessor Fund"), the shareholders approved a proposal to reorganize the Predecessor Fund into the Baywood SociallyResponsible Fund, a newly created series of the Forum Funds II. The Predecessor Fund was sub-advised by the Fund's Advisor, SKBA Capital Management, LLC, with the same portfolio managers as Baywood SociallyResponsible Fund. The Baywood SociallyResponsible Fund is managed in a manner that is in all material respects equivalent to the management of the Predecessor Fund, including the investment objective, strategies, guidelines and restrictions. The primary purpose of the reorganization was to move the Predecessor Fund to a newly created series of Forum Funds II. As a result of the reorganization, the Baywood SociallyResponsible Fund is now operating under the supervision of a different board of trustees. On January 8, 2016, the Baywood SociallyResponsible Fund acquired all of the assets, subject to liabilities, of the Predecessor Fund. The shares of the Predecessor Fund were, in effect, exchanged on a tax-free basis for Shares of the Baywood SociallyResponsible Fund with the same aggregate value. No commission or other transactional fees were imposed on shareholders in connection with the tax-free exchange of their shares.
Note 2. Summary of Significant Accounting Policies
The Funds are investment companies and follow accounting and reporting guidance under Financial Accounting Standards Board (“FASB”) Accounting Standards Codification (“ASC”) Topic 946, “Financial Services-Investment Companies”. These financial statements are prepared in accordance with accounting principles generally accepted in the United States of America (“GAAP”), which require management to make estimates and assumptions that affect the reported amounts of assets and liabilities, the disclosure of contingent liabilities at the date of the financial statements, and the reported amounts of increases and decreases in net assets from operations during the fiscal year. Actual amounts could differ from those estimates. The following summarizes the significant accounting policies of each Fund:
Security Valuation – Securities are valued at market prices using the last quoted trade or official closing price from the principal exchange where the security is traded, as provided by independent pricing services on each Fund business day. In the absence of a last trade, securities are valued at the mean of the last bid and ask price provided by the pricing service. Shares of non-exchange traded open-end mutual funds are valued at net asset value (“NAV”). Short-term investments that mature in sixty days or less may be valued at amortized cost.
Each Fund values its investments at fair value pursuant to procedures adopted by the Trust’s Board of Trustees (the “Board”) if (1) market quotations are not readily available or (2) the Advisor, as defined in Note 3, believes that the values available are unreliable. The Trust’s Valuation Committee, as defined in each Fund’s registration statement, performs certain functions as they relate to the administration and oversight of each Fund’s valuation procedures. Under these procedures, the Valuation Committee convenes on a regular and ad hoc basis to review such investments and considers a number of factors, including valuation methodologies and significant unobservable inputs, when arriving at fair value.
The Valuation Committee may work with the Advisor to provide valuation inputs. In determining fair valuations, inputs may include market-based analytics that may consider related or comparable assets or liabilities, recent transactions, market multiples, book values and other relevant investment information. Advisor inputs may include an income-based approach in which the anticipated future cash flows of the investment are discounted in determining fair value. Discounts may also be applied based on the nature or duration of any
BAYWOOD FUNDS
NOTES TO FINANCIAL STATEMENTS
SEPTEMBER 30, 2018
restrictions on the disposition of the investments. The Valuation Committee performs regular reviews of valuation methodologies, key inputs and assumptions, disposition analysis and market activity.
Fair valuation is based on subjective factors and, as a result, the fair value price of an investment may differ from the security’s market price and may not be the price at which the asset may be sold. Fair valuation could result in a different NAV than a NAV determined by using market quotes.
GAAP has a three-tier fair value hierarchy. The basis of the tiers is dependent upon the various “inputs” used to determine the value of each Fund’s investments. These inputs are summarized in the three broad levels listed below:
Level 1 - Quoted prices in active markets for identical assets and liabilities.
Level 2 - Prices determined using significant other observable inputs (including quoted prices for similar securities, interest rates, prepayment speeds, credit risk, etc.). Short-term securities with maturities of sixty days or less are valued at amortized cost, which approximates market value, and are categorized as Level 2 in the hierarchy. Municipal securities, long-term U.S. government obligations and corporate debt securities are valued in accordance with the evaluated price supplied by the pricing service and generally categorized as Level 2 in the hierarchy. Other securities that are categorized as Level 2 in the hierarchy include, but are not limited to, warrants that do not trade on an exchange, securities valued at the mean between the last reported bid and ask quotation and international equity securities valued by an independent third party with adjustments for changes in value between the time of the securities respective local market closes and the close of the U.S. market.
Level 3 - Significant unobservable inputs (including each Fund’s own assumptions in determining the fair value of investments).
The aggregate value by input level, as of September 30, 2018, for each Fund’s investments is included at the end of each Fund’s Schedule of Investments.
Security Transactions, Investment Income and Realized Gain and Loss – Investment transactions are accounted for on the trade date. Dividend income is recorded on the ex-dividend date. Foreign dividend income is recorded on the ex-dividend date or as soon as possible after determining the existence of a dividend declaration after exercising reasonable due diligence. Interest income is recorded on an accrual basis. Premium is amortized and discount is accreted using the effective interest method. Identified cost of investments sold is used to determine the gain and loss for both financial statement and federal income tax purposes.
Distributions to Shareholders – Distributions to shareholders of net investment income, if any, are declared and paid at least annually. Distributions to shareholders of net capital gains, if any, are declared and paid at least at least annually. Distributions to shareholders are recorded on the ex-dividend date. Distributions are based on amounts calculated in accordance with applicable federal income tax regulations, which may differ from GAAP. These differences are due primarily to differing treatments of income and gain on various investment securities held by each Fund, timing differences and differing characterizations of distributions made by each Fund.
Federal Taxes – Each Fund intends to continue to qualify each year as a regulated investment company under Subchapter M of Chapter 1, Subtitle A, of the Internal Revenue Code of 1986, as amended (“Code”), and to distribute all of its taxable income to shareholders. In addition, by distributing in each calendar year substantially all of its net investment income and capital gains, if any, the Funds will not be subject to a federal excise tax. Therefore, no federal income or excise tax provision is required. Each Fund files a U.S. federal income and excise tax return as required. Each Fund’s federal income tax returns are subject to examination by the Internal Revenue Service for a period of three fiscal years after they are filed. As of September 30, 2018, there are no uncertain tax positions that would require financial statement recognition, de-recognition or disclosure.
Income and Expense Allocation – The Trust accounts separately for the assets, liabilities and operations of each of its investment portfolios. Expenses that are directly attributable to more than one investment portfolio are allocated among the respective investment portfolios in an equitable manner.
Each Fund's class-specific expenses are charged to the operations of that class of shares. Income and expenses (other than expenses attributable to a specific class) and realized and unrealized gains or losses on investments are allocated to each class of shares based on the class’ respective net assets to the total net assets of each Fund.
BAYWOOD FUNDS
NOTES TO FINANCIAL STATEMENTS
SEPTEMBER 30, 2018
Commitments and Contingencies – In the normal course of business, each Fund enters into contracts that provide general indemnifications by each Fund to the counterparty to the contract. Each Fund’s maximum exposure under these arrangements is dependent on future claims that may be made against each Fund and, therefore, cannot be estimated; however, based on experience, the risk of loss from such claims is considered remote. Each Fund has determined that none of these arrangements requires disclosure on each Fund’s balance sheet.
Note 3. Fees and Expenses
Investment Advisor – SKBA Capital Management, LLC (the “Advisor”) is the investment adviser to the Funds. Pursuant to an investment advisory agreement, the Advisor receives an advisory fee, payable monthly, at an annual rate of 0.50% and 0.70% of the average daily net assets of Baywood ValuePlus Fund and Baywood SociallyResponsible Fund, respectively.
Distribution – Foreside Fund Services, LLC serves as each Fund’s distributor (the “Distributor”). The Funds have adopted a Distribution Plan (the “Plan”) in accordance with Rule 12b-1 of the Act. Under the Plan, each Fund may pay the Distributor and/or any other entity as authorized by the Board a fee of up to 0.25% of each Fund’s average daily net assets of Investor Shares for providing distribution and/or shareholder services to the Funds. The Distributor is not affiliated with the Advisor or Atlantic Fund Administration, LLC (d/b/a Atlantic Fund Services) (“Atlantic”) or their affiliates.
Other Service Providers – Atlantic provides fund accounting, fund administration, compliance and transfer agency services to each Fund. The fees related to these services are included in Fund services fees within the Statements of Operations. Atlantic also provides certain shareholder report production and EDGAR conversion and filing services. Pursuant to an Atlantic services agreement, each Fund pays Atlantic customary fees for its services. Atlantic provides a Principal Executive Officer, a Principal Financial Officer, a Chief Compliance Officer and an Anti-Money Laundering Officer to each Fund, as well as certain additional compliance support functions.
Trustees and Officers – The Trust pays each Independent Trustee an annual fee of $16,000 ($21,000 for the Chairman) for service to the Trust. The Independent Trustees and Chairman may receive additional fees for special Board meetings. The Independent Trustees are also reimbursed for all reasonable out-of-pocket expenses incurred in connection with their duties as Trustees, including travel and related expenses incurred in attending Board meetings. The amount of Independent Trustees’ fees attributable to each Fund is disclosed in the Statements of Operations. Certain officers of the Trust are also officers or employees of the above named service providers, and during their terms of office received no compensation from each Fund.
Note 4. Expense Reimbursement and Fees Waived
The Advisor has contractually agreed to waive its fee and/or reimburse certain expenses to limit total operating expenses (excluding all taxes, interest, portfolio transaction expenses, acquired fund fees and expenses, proxy expenses and extraordinary expenses) for Investor Shares to 0.95% and Institutional Shares to 0.70% through January 31, 2019, for Baywood ValuePlus Fund. The Advisor also has contractually agreed to waive its fees and/or reimburse certain expenses to limit total operating expenses (excluding all taxes, interest, portfolio transaction expenses, acquired fund fees and expenses, proxy expenses and extraordinary expenses) for Investor Shares to 1.14% and Institutional Shares to 0.89% through January 31, 2019, for Baywood SociallyResponsible Fund. Other Fund service providers have voluntarily agreed to waive and reimburse a portion of their fees. These voluntary fee waivers and reimbursements may be reduced or eliminated at any time. For the year ended September 30, 2018, fees waived and expenses reimbursed were as follows:
| Investment Adviser Fees Waived | Investment Adviser Expenses Reimbursed | Other Waivers | Total Fees Waived and Expenses Reimbursed | |||||||||||||
| Baywood ValuePlus Fund | $ | 13,547 | $ | 119,209 | $ | 45,001 | $ | 177,757 | ||||||||
| Baywood SociallyResponsible Fund | 51,892 | 81,012 | 45,000 | 177,904 | ||||||||||||
The advisor may be reimbursed by each Fund for fees waived and expenses reimbursed by the advisor pursuant to the Expense Cap if such payment is approved by the Board, made within three years of the fee waiver or expense reimbursement, and does not cause the Total Annual Fund Operating Expenses After Fee Waiver and/or Expense Reimbursement to exceed the lesser of (i) the then-current expense cap, or (ii) the expense cap in place at the time the fees/expenses were waived/reimbursed. As of September 30, 2018, $416,135 and $363,830 in the Baywood ValuePlus Fund and Baywood SociallyResponsible Fund, respectively, is subject to recapture by the Advisor. Other Waivers are not eligible for recoupment.
BAYWOOD FUNDS
NOTES TO FINANCIAL STATEMENTS
SEPTEMBER 30, 2018
Note 5. Security Transactions
The cost of purchases and proceeds from sales of investment securities (including maturities), other than short-term investments during the year ended September 30, 2018, were as follows:
| Purchases | Sales | |||||||
| Baywood ValuePlus Fund | $ | 1,117,523 | $ | 857,481 | ||||
| Baywood SociallyResponsible Fund | 2,196,969 | 6,365,169 | ||||||
Note 6. Federal Income Tax
As of September 30, 2018, the cost for federal income tax purposes and the components of net unrealized appreciation (depreciation) were as follows:
| Tax Cost of Investments | Gross Unrealized Appreciation | Gross Unrealized Depreciation | Net Unrealized Appreciation | |||||||||||||
| Baywood ValuePlus Fund | $ | 2,385,050 | $ | 532,641 | $ | (37,767 | ) | $ | 494,874 | |||||||
| Baywood SociallyResponsible Fund | 3,494,869 | 926,755 | (16,135 | ) | 910,620 | |||||||||||
Distributions paid during the fiscal years ended as noted were characterized for tax purposes as follows:
| Ordinary Income |
Long-Term Capital Gain |
Total | ||||||||||
| Baywood ValuePlus Fund | ||||||||||||
| 2018 | $ | 48,282 | $ | 73,879 | $ | 122,161 | ||||||
| 2017 | 44,476 | 41,166 | 85,642 | |||||||||
| Baywood SociallyResponsible Fund | ||||||||||||
| 2018 | 59,735 | 390,612 | 450,347 | |||||||||
| 2017 | 118,852 | 78,869 | 197,721 | |||||||||
There are amounts included in the above relating to equalization debits.
| Ordinary Income |
Long-Term Capital Gain |
Total | ||||||||||
| Baywood SociallyResponsible Fund | ||||||||||||
| 2018 | $ | - | $ | 278,198 | $ | 278,198 | ||||||
| 2017 | $ | - | $ | 67,439 | $ | 67,439 | ||||||
As of September 30, 2018, distributable earnings (accumulated loss) on a tax basis were as follows:
| Undistributed Ordinary Income | Undistributed Long-Term Gain | Unrealized Appreciation | Total | |||||||||||||
| Baywood ValuePlus Fund | $ | 2,321 | $ | 123,969 | $ | 494,874 | $ | 621,164 | ||||||||
| Baywood SociallyResponsible Fund | 1,735 | 301,687 | 910,620 | 1,214,042 | ||||||||||||
The difference between components of distributable earnings on a tax basis and the amounts reflected in the Statements of Assets and Liabilities are primarily due to wash sales, partnerships and equity return of capital.
On the Statements of Assets and Liabilities, as a result of permanent book to tax differences, certain amounts have been reclassified for the year ended September 30, 2018. The following reclassifications were the result of partnerships, equalization, equity return of capital, prior year adjustments for real estate investment trusts, and reclassification of income from a taxable corporate action and have no impact on the net assets of each Fund.
| For the year ended September 30, 2018 |
Undistributed Net Investment Income (Loss) |
Accumulated Net Realized Gain (Loss) | Paid-in-Capital | |||||||||
| Baywood ValuePlus Fund | $ | (264 | ) | $ | 264 | $ | – | |||||
| Baywood SociallyResponsible Fund | (8,231 | ) | (284,049 | ) | 292,280 | |||||||
BAYWOOD FUNDS
NOTES TO FINANCIAL STATEMENTS
SEPTEMBER 30, 2018
Note 7. Recent Accounting Pronouncements
In August 2018, the Financial Accounting Standards Board (“FASB”) issued Accounting Standards Update (ASU) No. 2018-13 “Fair Value Measurement (Topic 820): Disclosure Framework – Changes to the Disclosure Requirements for Fair Value Measurement” (“ASU 2018-13”) which includes amendments intended to improve the effectiveness of disclosures in the notes to financial statements. For example, ASU 2018-13 includes additional disclosures regarding the range and weighted average of significant unobservable inputs used to develop Level 3 fair value measurements, and clarifications to the narrative description of measurement uncertainty disclosures. ASU 2018-13 is effective for interim and annual periods beginning after December 15, 2019. Management is currently evaluating the impact that ASU 2018-13 will have on the Funds' financial statements and related disclosures.
In September 2018, the Securities and Exchange Commission released Final Rule 33-10532 captioned “Disclosure Update and Simplification” which is intended to amend certain disclosure requirements that have become redundant, duplicative, overlapping, outdated, or superseded, in light of other Commission disclosure requirements, GAAP, or changes in the information environment. These changes will be effective November 5, 2018. Management is currently evaluating the impact that this release will have on the Funds' financial statements and related disclosures.
Note 8. Subsequent Events
Subsequent events occurring after the date of this report through the date these financial statements were issued have been evaluated for potential impact, and each Fund has had no such events.
REPORT OF INDEPENDENT REGISTERED PUBLIC ACCOUNTING FIRM
To the Shareholders of Baywood ValuePlus Fund and Baywood SociallyResponsible Fund
and the Board of Trustees of Forum Funds II
Opinion on the Financial Statements
We have audited the accompanying statements of assets and liabilities of Baywood ValuePlus Fund and Baywood SociallyResponsible Fund, each a series of shares of beneficial interest in Forum Funds II (the “Funds”), including the schedules of investments, as of September 30, 2018, and the related statements of operations for the year then ended, the statements of changes in net assets for each of the years in the two-year period then ended and the financial highlights for each of the years or periods presented during the period December 2, 2013 (commencement of operations) through September 30, 2018 for the Baywood ValuePlus Fund and for each of the years in the four-year period then ended for the Baywood SociallyResponsible Fund, and the related notes (collectively referred to as the “financial statements”). In our opinion, the financial statements present fairly, in all material respects, the financial position of the Funds as of September 30, 2018, and the results of their operations for the year then ended, the changes in their net assets for each of the years in the two-year period then ended and their financial highlights for each of the years or periods detailed above, in conformity with accounting principles generally accepted in the United States of America. The financial highlights of the Baywood SociallyResponsible Fund for the year ended September 30, 2014 were audited by other auditors, whose report dated November 28, 2014 expressed an unqualified opinion on those financial highlights.
Basis for Opinion
These financial statements are the responsibility of the Funds' management. Our responsibility is to express an opinion on the Funds’ financial statements based on our audits. We are a public accounting firm registered with the Public Company Accounting Oversight Board (United States) (“PCAOB”) and are required to be independent with respect to the Funds in accordance with the U.S. federal securities law and the applicable rules and regulations of the Securities and Exchange Commission and the PCAOB.
We conducted our audits in accordance with the standards of the PCAOB. Those standards require that we plan and perform the audits to obtain reasonable assurance about whether the financial statements are free of material misstatement, whether due to error or fraud. The Funds are not required to have, nor were we engaged to perform, an audit of their internal control over financial reporting. As part of our audits we are required to obtain an understanding of internal control over financial reporting but not for the purpose of expressing an opinion on the effectiveness of the Funds’ internal control over financial reporting. Accordingly, we express no such opinion.
Our audits included performing procedures to assess the risk of material misstatement of those financial statements, whether due to error or fraud, and performing procedures that respond to those risks. Such procedures included examining, on a test basis, evidence regarding the amounts and disclosures in the financial statements. Our procedures included confirmation of securities owned as of September 30, 2018 by correspondence with the custodian. Our audits also included evaluating the accounting principles used and significant estimates made by management, as well as evaluating the overall presentation of the financial statements. We believe that our audits provide a reasonable basis for our opinion.

BBD, LLP
We have served as the auditor of one or more of the Funds in the Forum Funds II since 2013.
Philadelphia, Pennsylvania
November 26, 2018
BAYWOOD FUNDS
ADDITIONAL INFORMATION (Unaudited)
SEPTEMBER 30, 2018
Investment Advisory Agreement Approval
At the September 13, 2018 Board meeting (“September meeting”), the Board, including the Independent Trustees, met in person and considered the approval of the continuance of the investment advisory agreement between the Advisor and the Trust pertaining to the Funds (the “Advisory Agreement”). In preparation for the September meeting, the Board was presented with a range of information to assist in its deliberations. The Board requested and reviewed written responses from the Advisor to a letter circulated on the Board’s behalf concerning the Advisor’s personnel, operations, financial condition, performance, and services provided to the Funds by the Advisor. During its deliberations, the Board received an oral presentation from the Advisor and discussed the materials with the Advisor, independent legal counsel to the Independent Trustees (“Independent Legal Counsel”), and, as necessary, with the Trust's administrator, Atlantic Fund Services. The Independent Trustees also met in executive session with Independent Legal Counsel while deliberating.
At the September meeting, the Board reviewed, among other matters, the topics discussed below:
Nature, Extent and Quality of Services
Based on written materials received and the presentation from personnel of the Advisor regarding the Advisor’s operations, the Board considered the quality of services provided by the Advisor under the Advisory Agreement. In this regard, the Board considered information regarding the experience, qualifications and professional background of the portfolio manager and other personnel at the Advisor with principal responsibility for the Funds, as well as the investment philosophy and decision-making process of those professionals and the capability and integrity of the Advisor’s senior management and staff.
The Board considered also the adequacy of the Advisor’s resources. The Board noted the Advisor’s representation that the firm is financially stable and has the operational capability and necessary staffing and experience to continue providing quality investment advisory services to the Funds. Based on the presentation and the materials provided by the Advisor in connection with the Board’s consideration of the renewal of the Advisory Agreement, and other relevant considerations, the Board concluded that, overall, it was satisfied with the nature, extent and quality of services to be provided to the Fund under the Advisory Agreement.
Performance
The Board reviewed the performance of the Funds compared to their respective benchmarks and compared to independent peer groups of funds identified by Broadridge Financial Solutions, Inc. (“Broadridge”) believed to have characteristics similar to those of the Funds.
The Board observed that the ValuePlus Fund outperformed its primary benchmark index, the Morningstar US Large Value Total Return Index, for the one-, three-, five-, and 10-year periods ended June 30, 2018, and for the period since the ValuePlus Fund’s inception on June 27, 2008. The Board also observed that, based on the information provided by Broadridge, the ValuePlus Fund outperformed the median of the Broadridge peers for the one- and three-year period ended June 30, 2018. The Board noted the Advisor’s representation that it was confident in the companies held in the ValuePlus Fund’s portfolio and that the ValuePlus Fund was well-positioned to generate positive performance going forward.
The Board observed that the SociallyResponsible Fund had outperformed its primary benchmark index, the Morningstar US Large Value Total Return Index, for the one-year period ended June 30, 2018, and underperformed the benchmark for the three-, five-, and 10-year periods ended June 30, 2018, and for the period since the SociallyResponsible Fund’s inception on January 3, 2005. The Board observed that the SociallyResponsible Fund performed at the median of its Broadridge peers for the one-year period ended June 30, 2018 and underperformed the median of the Broadridge peers for the three- and five-year periods ended June 30, 2018. The Board noted the Advisor’s representation that the SociallyResponsible Fund’s underperformance relative to the primary benchmark and Broadridge peers over the longer term could be attributed, in part, to a large shareholder redemption that occurred prior to the SociallyResponsible Fund’s reorganization into the Trust at the beginning of 2016, which disproportionately impacted the SociallyResponsible Fund’s long-term performance. The Board also noted the Advisor’s representation that the Morningstar US Large Value Total Return Index was not a perfect comparison for the SociallyResponsible Fund’s investment strategy because the benchmark did not have the same constraints of a socially responsible strategy.
Based on the foregoing and other relevant factors, the Board concluded that the Advisor’s management of each Fund could benefit each Fund and their respective shareholders.
BAYWOOD FUNDS
ADDITIONAL INFORMATION (Unaudited)
SEPTEMBER 30, 2018
Compensation
The Board evaluated the Advisor’s compensation for providing advisory services to the Funds and analyzed comparative information on actual advisory fee rates and actual total expenses of the Funds’ respective Broadridge peer groups. The Board noted that the Advisor’s actual advisory fee rate and actual total expense ratio for each of the Funds was less than the median of their respective Broadridge peer universe. Based on the foregoing, and other relevant considerations, the Board concluded that the Advisor’s advisory fee rates charged to the Funds were reasonable.
Cost of Services and Profitability
The Board considered information provided by the Advisor regarding the costs of services and its profitability with respect to the Fund. In this regard, the Board considered the Advisor’s resources devoted to the Fund, as well as the Advisor’s discussion of costs and profitability. The Board noted the Advisor’s representation that, as a result of the contractual expense limitation arrangement in place for the Funds, the Advisor was not earning any profit from its mutual fund operations but that the Advisor was willing to continue subsidizing the Funds in an effort to support growth initiatives. Based on these and other applicable considerations, the Board concluded that the Advisor’s costs of services and profits attributable to management of the Fund were reasonable in the context of all factors considered.
Economies of Scale
The Board evaluated whether the Funds would benefit from any economies of scale. In this respect, the Board noted the Advisor’s representation that economies of scale could be experienced by shareholders of the Funds upon reaching significantly higher asset levels but that, in light of the Funds’ current asset levels, breakpoints in the advisory fee were not believed by the Advisor to be appropriate at this time. The Board concluded that economies of scale were not a material factor in approving the Advisory Agreement.
Other Benefits
The Board noted the Advisor’s representation that, aside from its contractual advisory fees, it does not benefit in a material way from its relationship with the Funds. Based on the foregoing representation and the materials presented, the Board concluded that other benefits received by the Advisor from its relationship with the Funds were not a material factor to consider in approving the continuation of the Advisory Agreement.
Conclusion
The Board did not identify any single factor as being of paramount importance, and different Trustees may have given different weight to different factors. The Board reviewed a memorandum from Fund counsel discussing the legal standards applicable to its consideration of the Advisory Agreement. Based on its review, including consideration of each of the factors referenced above, the Board determined, in the exercise of its reasonable business judgment, that the advisory arrangement, as outlined in the Advisory Agreement, was fair and reasonable in light of the services performed or to be performed, expenses incurred or to be incurred and such other matters as the Board considered relevant.
Proxy Voting Information
A description of the policies and procedures that each Fund uses to determine how to vote proxies relating to securities held in each Fund’s portfolio is available, without charge and upon request, by calling (855) 409-2297 and on the SEC’s website at www.sec.gov. Each Fund’s proxy voting record for the most recent twelve-month period ended June 30 is available, without charge and upon request, by calling (855) 409-2297 and on the SEC’s website at www.sec.gov.
Availability of Quarterly Portfolio Schedules
Each Fund files its complete schedule of portfolio holdings with the SEC for the first and third quarters of each fiscal year on Form N-Q. These filings are available, without charge and upon request on the SEC’s website at www.sec.gov or may be reviewed and copied at the SEC’s Public Reference Room in Washington, DC. Information on the operation of the Public Reference Room may be obtained by calling (800) SEC-0330.
BAYWOOD FUNDS
ADDITIONAL INFORMATION (Unaudited)
SEPTEMBER 30, 2018
Shareholder Expense Example
As a shareholder of the fund, you incur ongoing costs, including management fees, distribution (12b-1) fees (for Investor Shares only) and other Fund expenses. This example is intended to help you understand your ongoing costs (in dollars) of investing in the fund and to compare these costs with the ongoing costs of investing in other mutual funds.
The example is based on an investment of $1,000 invested at the beginning of the period and held for the entire period from April 1, 2018 through September 30, 2018.
Actual Expenses – The first line under each share class of the table below provides information about actual account values and actual expenses. You may use the information in this line, together with the amount you invested, to estimate the expenses that you paid over the period. Simply divide your account value by $1,000 (for example, an $8,600 account value divided by $1,000 = 8.6), then multiply the result by the number in the first line under the heading entitled “Expenses Paid During Period” to estimate the expenses you paid on your account during the period.
Hypothetical Example for Comparison Purposes – The second line of the table below provides information about hypothetical account values and hypothetical expenses based on each Fund’s actual expense ratio and an assumed rate of return of 5% per year before expenses, which is not each Fund’s actual return. The hypothetical account values and expenses may not be used to estimate the actual ending account balance or expenses you paid for the period. You may use this information to compare the ongoing costs of investing in each Fund and other funds. To do so, compare this 5% hypothetical example with the 5% hypothetical examples that appear in the shareholder reports of other funds.
Please note that the expenses shown in the table are meant to highlight your ongoing costs only. Therefore, the second line of the table is useful in comparing ongoing costs only and will not help you determine the relative total costs of owning different funds.
|
Beginning Account Value April 1, 2018 |
Ending Account Value September 30, 2018 |
Expenses Paid During Period* |
Annualized Expense Ratio* |
|||||||||||||
| Baywood ValuePlus Fund | ||||||||||||||||
| Investor Shares | ||||||||||||||||
| Actual | $ | 1,000.00 | $ | 1,056.37 | $ | 4.90 | 0.95 | % | ||||||||
| Hypothetical (5% return before expenses) | $ | 1,000.00 | $ | 1,020.31 | $ | 4.81 | 0.95 | % | ||||||||
| Institutional Shares | ||||||||||||||||
| Actual | $ | 1,000.00 | $ | 1,057.42 | $ | 3.61 | 0.70 | % | ||||||||
| Hypothetical (5% return before expenses) | $ | 1,000.00 | $ | 1,021.56 | $ | 3.55 | 0.70 | % | ||||||||
| Baywood SociallyResponsible Fund | ||||||||||||||||
| Investor Shares | ||||||||||||||||
| Actual | $ | 1,000.00 | $ | 1,078.23 | $ | 5.94 | 1.14 | % | ||||||||
| Hypothetical (5% return before expenses) | $ | 1,000.00 | $ | 1,019.35 | $ | 5.77 | 1.14 | % | ||||||||
| Institutional Shares | ||||||||||||||||
| Actual | $ | 1,000.00 | $ | 1,079.96 | $ | 4.64 | 0.89 | % | ||||||||
| Hypothetical (5% return before expenses) | $ | 1,000.00 | $ | 1,020.61 | $ | 4.51 | 0.89 | % | ||||||||
| * | Expenses are equal to the Fund’s annualized expense ratio multiplied by the average account value over the period, multiplied by the number of days in the most recent fiscal half-year (183) divided by 365 to reflect the half-year period. |
Federal Tax Status of Dividends Declared during the Fiscal Year
For federal income tax purposes, dividends from short-term capital gains are classified as ordinary income. Each Fund designates 100.00% of its income dividend distributed as qualifying for the corporate dividends-received deduction (DRD) and 100.00% for the qualified dividend rate (QDI) as defined in Section 1(h)(11) of the Internal Revenue Code.
BAYWOOD FUNDS
ADDITIONAL INFORMATION (Unaudited)
SEPTEMBER 30, 2018
Trustees and Officers of the Trust
The Board is responsible for oversight of the management of the Trust’s business affairs and of the exercise of all the Trust’s powers except those reserved for the shareholders. The following table provides information about each Trustee and certain officers of the Trust. Each Trustee and officer holds office until the person resigns, is removed, or is replaced. Unless otherwise noted, the persons have held their principal occupations for more than five years. The address for all Trustees and officers is Three Canal Plaza, Suite 600, Portland, Maine 04101. Each Fund’s Statement of Additional Information includes additional information about the Trustees and is available, without charge and upon request, by calling (855) 409-2297.
| Name and Year of Birth |
Position with the Trust |
Length of Time Served |
Principal Occupation(s) During Past Five Years |
Number of Series in Fund Complex Overseen By Trustee |
Other Directorships Held By Trustee During Past Five Years |
| Independent Trustees | |||||
|
David Tucker Born: 1958 |
Chairman of the Board; Trustee; Chairman, Nominating Committee and Qualified Legal Compliance Committee | Since 2013 | Director, Blue Sky Experience (a charitable endeavor), since 2008; Senior Vice President & General Counsel, American Century Companies (an investment management firm), 1998- 2008. | 2 | Trustee, Forum Funds; Trustee, Forum ETF Trust; Trustee, U.S. Global Investors Funds. |
|
Mark D. Moyer Born: 1959 |
Trustee; Chairman Audit Committee | Since 2013 | Chief Financial Officer, Freedom House (a NGO advocating political freedom and democracy), since 2017; independent consultant providing interim CFO services, principally to non-profit organizations, 2011-2017; Chief Financial Officer, Institute of International Education (a NGO administering international educational exchange programs), 2008-2011; Chief Financial Officer and Chief Restructuring Officer, Ziff Davis Media Inc. (an integrated media company), 2005-2008; Adjunct Professor of Accounting, Fairfield University from 2009-2012. | 2 | Trustee, Forum Funds; Trustee, Forum ETF Trust; Trustee, U.S. Global Investors Funds. |
|
Jennifer Brown-Strabley Born: 1964 |
Trustee | Since 2013 | Principal, Portland Global Advisors 1996-2010. | 2 | Trustee, Forum Funds; Trustee, Forum ETF Trust; Trustee, U.S. Global Investors Funds. |
| Interested Trustees(1) | |||||
|
Stacey E. Hong Born: 1966 |
Trustee | Since 2013 | President, Atlantic since 2008 | 2 | Trustee, Forum Funds, Trustee, U.S. Global Investors Funds. |
|
John Y. Keffer Born: 1942 |
Trustee | Since 2013 | Chairman, Atlantic since 2008; Chairman, Forum Investment Advisors, LLC since 2011; President, Forum Foundation (a charitable organization) since 2005; President, Forum Trust, LLC (a non-depository trust company chartered in the State of Maine) since 1997. | 2 | Trustee Forum ETF Trust; Trustee U.S. Global Investors Funds; Director, Wintergreen Fund, Inc. |
| (1) | Stacey E. Hong and John Y. Keffer are currently treated as an interested persons of the Trust, as defined in the 1940 Act, due to their affiliations with Atlantic. Atlantic and Forum Investment Advisors, LLC are subsidiaries of Forum Holdings Corp. I, a Delaware corporation that is wholly owned by Mr. Keffer. |
BAYWOOD FUNDS
ADDITIONAL INFORMATION (Unaudited)
SEPTEMBER 30, 2018
| Name and Year of Birth |
Position with the Trust |
Length of Time Served |
Principal Occupation(s) During Past 5 Years |
| Officers | |||
|
Jessica Chase Born: 1970 |
President; Principal Executive Officer | Since 2015 | Senior Vice President, Atlantic since 2008. |
|
Karen Shaw Born: 1972 |
Treasurer; Principal Financial Officer | Since 2008 | Senior Vice President, Atlantic since 2008. |
|
Zachary Tackett Born: 1988 |
Vice President; Secretary and Anti-Money Laundering Compliance Officer | Since 2014 | Counsel, Atlantic since 2014; Intern Associate, Coakley & Hyde, PLLC, 2010-2013. |
|
Michael J. McKeen Born: 1971 |
Vice President | Since 2009 | Senior Vice President, Atlantic since 2008. |
|
Timothy Bowden Born: 1969 |
Vice President | Since 2009 | Manager, Atlantic since 2008. |
|
Geoffrey Ney Born: 1975 |
Vice President | Since 2013 | Manager, Atlantic since 2013; Senior Fund Accountant, Atlantic, 2008–2013. |
|
Todd Proulx Born: 1978 |
Vice President | Since 2013 | Manager, Atlantic since 2013; Senior Fund Accountant, Atlantic, 2008–2013. |
|
Carlyn Edgar Born: 1963 |
Vice President | Since 2008 | Senior Vice President, Atlantic since 2008; Chief Compliance Officer, 2008-2016 |
|
Dennis Mason Born: 1967 |
Chief Compliance Officer | Since 2016 | Fund Compliance Officer, Atlantic since 2013; Senior Specialist, Atlantic, 2011-2013; Senior Analyst, Atlantic, 2008-2011 |

FOR MORE INFORMATION:
P.O. Box 588
Portland, ME 04112
(855) 409-2297 (toll free)
INVESTMENT ADVISOR
SKBA Capital Management, LLC
44 Montgomery Street, Suite 3500
San Francisco, CA 94104
TRANSFER AGENT
Atlantic Fund Services
P.O. Box 588
Portland, ME 04112
www.atlanticfundservices.com
DISTRIBUTOR
Foreside Fund Services, LLC
Three Canal Plaza, Suite 100
Portland, ME 04101
www.foreside.com
This report is submitted for the general information of the shareholders of the Funds. It is not authorized for distribution to prospective investors unless preceded or accompanied by an effective prospectus, which includes information regarding the Funds’ risks, objectives, fees and expenses, experience of its management, and other information.
217-ANR-0930
TABLE OF CONTENTS
| A Message to Our Shareholders (Unaudited) | 1 |
| Gurtin National Municipal Opportunistic Value Fund | |
| Performance Chart and Analysis (Unaudited) | 4 |
| Schedule of Investments | 6 |
| Statement of Assets and Liabilities | 10 |
| Statement of Operations | 11 |
| Statements of Changes in Net Assets | 12 |
| Financial Highlights | 13 |
| Gurtin California Municipal Opportunistic Value Fund | |
| Performance Chart and Analysis (Unaudited) | 14 |
| Schedule of Investments | 16 |
| Statement of Assets and Liabilities | 19 |
| Statement of Operations | 20 |
| Statements of Changes in Net Assets | 21 |
| Financial Highlights | 22 |
| Gurtin National Municipal Intermediate Value Fund | |
| Performance Chart and Analysis (Unaudited) | 24 |
| Schedule of Investments | 26 |
| Statement of Assets and Liabilities | 31 |
| Statement of Operations | 32 |
| Statements of Changes in Net Assets | 33 |
| Financial Highlights | 34 |
| Gurtin California Municipal Intermediate Value Fund | |
| Performance Chart and Analysis (Unaudited) | 36 |
| Schedule of Investments | 38 |
| Statement of Assets and Liabilities | 41 |
| Statement of Operations | 42 |
| Statements of Changes in Net Assets | 43 |
| Financial Highlights | 44 |
| Notes to Financial Statements | 45 |
| Report of Independent Registered Public Accounting Firm | 51 |
| Additional Information (Unaudited) | 52 |
GURTIN VALUE FUNDS
A MESSAGE TO OUR SHAREHOLDERS (Unaudited)
SEPTEMBER 30, 2018
Dear Shareholders:
The 12-month period from September 30, 2017 to September 30, 2018 (Fiscal Year 2018) presented an investment environment characterized by steady increases in interest rates across the yield curve, as the economy showed signs of continued strength. During this period, the Gurtin National Municipal Opportunistic Value Funds and the Gurtin California Municipal Opportunistic Value Funds (the Gurtin Opportunistic Value Funds) took advantage of intermittent volatility and regulatory-driven supply and demand factors to enable performance in line with expectations. With an absolute value focus, the Gurtin Opportunistic Value Funds began the fiscal year positioned defensively relative to the benchmark, in an environment in which attractive opportunities were sparse; this conservative positioning drove significant outperformance relative to the benchmark, as rates moved steadily higher over the course of Fiscal Year 2018. Similarly, the Gurtin National Municipal Intermediate Value Fund and the Gurtin California Municipal Intermediate Value Fund (the Gurtin Intermediate Value Funds), which maintain a relative value focus, performed as we would expect in a challenging environment, with performance in-line with the benchmark.
The continued strength of the U.S. economy – as illustrated by core inflation finally reaching the 2-percent level in 3Q 2018 and by job gains consistently increasing at a pace of approximately 200,000 per month – created the backdrop of the planned Fed rate increases, against which we were able to identify pockets of volatility and attractive opportunities, particularly in the second half of the Fiscal Year. From September 30, 2017 to September 30, 2018, municipal yields moved up by nearly 100 basis points (bps) on the front end of the curve, and moved up by 35 to 55 bps at points throughout the long end. While the robust economy allowed the Fed to fulfill its planned rate increases at a pace of once per quarter, the dramatic increase in rates at the long end of the curve acted as a catalyst for retail mutual fund outflows. These outflows, coupled with dealers and banks who were hesitant to engage in purchasing, created some volatility in the municipal bond market in the second half of 2018. With this bout of volatility and higher absolute rates, we were able to extend duration strategically in the Gurtin Opportunistic Value Funds and capture significantly higher yields at year-end, relative to what the market was bearing at the start of the year.
Despite speculation in late 2017 that the passage and consequent implementation of the Tax Cuts and Jobs Act (TCJA) could result in underperformance throughout the municipal bond market as investors priced in lower effective tax rates, the most concrete performance driver was local rather than national. The TCJA’s cap on allowable state and local tax deductions (SALT) increased demand for tax-exempt municipal bonds in high-tax states, which led to relative richening in these states, especially in California and New York. This phenomenon occurred gradually throughout 2018, with California general obligation bonds continuing to trade at yields lower than the AAA Thomson Reuters Municipal Market Data (MMD) benchmark scale. Over the Fiscal Year, these dynamics resulted in relative outperformance of the California varieties of the Opportunistic Value and Intermediate Value funds relative to the National varieties.
Looking ahead, we will remain disciplined in our approach to fund management, waiting patiently — yet not passively — for any dislocation in the municipal bond market that we believe provides attractive investment opportunities for our shareholders, whether due to future interest rate volatility, credit risk mispricing, or uncertainty about the political climate.
Sincerely,

William R. Gurtin
CEO, CIO, Managing Partner
Gurtin Municipal Bond Management
Important Information:
There can be no guarantee that any strategy (risk management) or otherwise will be successful. All investing involves risk, including the potential loss of principal. Past Performance Does Not Guarantee Future Results. The funds may experience negative performance.
AAA MMD: Thomson Reuters’ proprietary yield curve that provides the offer-side of “AAA” rated state general obligation bonds, as determined by the MMD analyst team
GURTIN VALUE FUNDS
A MESSAGE TO OUR SHAREHOLDERS (Unaudited)
SEPTEMBER 30, 2018
Bonds: Investing in the bond market is subject to certain risks including market, interest-rate, issuer, credit, and inflation risk; investments may be worth more or less than the original cost when redeemed. Income from municipal bonds may be subject to state and local taxes and at times the alternative minimum tax; a strategy concentrating in a single or limited number of states is subject to greater risk of adverse economic conditions and regulatory changes. The value of most bond funds and fixed income securities is impacted by changes in interest rates. Bonds and bond funds with longer durations tend to be more sensitive and more volatile than securities with shorter durations; bond prices generally fall as interest rates rise. Credit risk refers to an issuer’s ability to make interest and principal payments when due.
Effective Duration: Measures the sensitivity of the price of a bond with embedded options to changes in interest rates, taking into account the likelihood of the bond being called, put, and/or sunk prior to its final maturity date
GURTIN NATIONAL MUNICIPAL OPPORTUNISTIC VALUE FUND
PERFORMANCE CHART AND ANALYSIS (Unaudited)
SEPTEMBER 30, 2018
The following chart reflects the change in the value of a hypothetical $250,000 investment in Institutional Shares, including reinvested dividends and distributions, in Gurtin National Municipal Opportunistic Value Fund (the “Fund”) compared with the performance of the benchmark, ICE Bank of America Merrill Lynch Municipal Miscellaneous Index 7-12 Years (“ICE BAML Muni Misc 7-12”) and the ICE Bank of America Merrill Lynch Municipal Blended Index (“ICE BAML Muni Blended”), since inception. The ICE BAML Muni Misc 7-12 was formerly known as the Merrill Lynch Municipal Miscellaneous 7-12 Years Index and measures the performance of municipal securities with a remaining term to final maturity greater than or equal to 7 years and less than 12 years. The ICE BAML Muni Blended is a blend of 75% of the ICE Bank of America Merrill Lynch 7-12 Year US Large Cap Municipal Securities Index, a subset of the ICE Bank of America Merrill Lynch US Large Cap Municipal Securities Index including all securities with a remaining term to final maturity greater than or equal to 7 years and less than 12 years, and 25% of the ICE Bank of America Merrill Lynch 12-22 Year US Large Cap Municipal Securities Index, a subset of the ICE Bank of America Merrill Lynch US Large Cap Municipal Securities Index including all securities with a remaining term to final maturity greater than or equal to 12 years and less than 22 years. The total return of the indices includes the reinvestment of dividends and income. The total return of the Fund includes operating expenses that reduce returns, while the total return of the indices do not include expenses. The Fund is professionally managed, while the indices are unmanaged and are not available for investment.
Comparison of a $250,000 Investment
Gurtin National Municipal Opportunistic Value Fund vs.
ICE Bank of America Merrill Lynch Municipal Miscellaneous Index 7-12 Years and ICE Bank of America Merrill Lynch Municipal Blended Index

|
Average Annual Total Returns Periods Ended September 30, 2018 |
One Year | Five Year | Since Inception 05/03/10 |
| Gurtin National Municipal Opportunistic Value Fund | 1.30% | 3.57% | 4.07% |
| ICE Bank of America Merrill Lynch Municipal Miscellaneous Index 7-12 Years | 0.42% | 3.44% | 4.45% |
| ICE Bank of America Merrill Lynch Municipal Blended Index | -0.34% | 3.95% | 4.47% |
Performance data quoted represents past performance and is no guarantee of future results. Current performance may be lower or higher than the performance data quoted. Investment return and principal value will fluctuate so that shares, when redeemed, may be worth more or less than original cost. As stated in the Fund’s prospectus, the annual operating expense ratio (gross) is 0.68%. However, the Fund’s adviser has contractually agreed to waive its fee and/or reimburse Fund expenses to limit Total Annual Fund Operating Expenses After Fee Waiver and/or Expense Reimbursement (excluding all taxes, interest, portfolio transaction expenses, proxy expenses and extraordinary expenses) to 0.60%, through February 1, 2019 (the “Expense Cap”). The adviser may be reimbursed by each Fund for fees waived and expenses reimbursed by the adviser pursuant to the Expense Cap if such payment is made within three years of the fee waiver or expense reimbursement, and does not cause the Total Annual Fund Operating Expenses After Fee Waiver and/or Expense Reimbursement to exceed the lesser of (i) the then-current expense cap, or (ii) the expense cap in place at the time the fees/expenses were waived/reimbursed. During the period, certain fees were waived and/ or expenses reimbursed; otherwise, returns would have been lower. The performance table and graph do not reflect the deduction of taxes that a shareholder would pay on Fund distributions or the redemption of Fund shares. Returns greater than one year are annualized. For the most recent month-end performance, please call (844) 342-5763.
The Fund’s outperformance relative to the benchmark BAML Muni Blended and the BAML Muni Misc 7-12 during the twelve months that ended September 30, 2018, was largely attributable to the Fund’s relatively more conservative positioning during a period of rising interest rates and to our ability to deploy capital nimbly when opportunities arose throughout the year. The Fund’s effective duration as of each month-end was 53% and 57% of the benchmark BAML Muni Blended and the BAML Muni Misc 7-12 on average, respectively. More specifically, the Fund’s effective duration began the 12-month period at slightly under 50% of each benchmark, and ended the 12-month period at approximately 70% of each benchmark. The Fund’s evolving positioning was deliberate, as we opportunistically deployed capital as attractive investments became available. In particular, at the start of this 12-month period, the Fund’s effective duration was relatively low, reflecting the low-rate and flat yield-curve interest rate environment. However, the Tax Cuts and Jobs Act of 2017 (TCJA), in conjunction with a strong economy
GURTIN NATIONAL MUNICIPAL OPPORTUNISTIC VALUE FUND
PERFORMANCE CHART AND ANALYSIS (Unaudited)
SEPTEMBER 30, 2018
and consistent Fed tightening through continued rate hikes and balance sheet run-off, led to a rise in rates and volatility across the curve, with AAA MMD yields up nearly 100 basis points (bps) on the short-end to 35-55 bps throughout the long-end of the yield curve. Furthermore, the TCJA affected both the supply and demand dynamics of the municipal market through the elimination of tax-exempt advance refundings, which pulled a significant amount of supply forward, as well as the reduction in the corporate tax rate, which reduced demand from banks and insurance companies and increased supply as they sold municipal holdings. Moreover, rising interest rates prompted material retail mutual fund outflows toward the end of the 12-month period, adding to supply. These various market developments created opportunities for us to extend duration and invest in longer callable structures at yields that meet the strategy’s objective. The combination of relatively conservative positioning followed by calculated duration extension resulted in significant outperformance, especially in the first quarter of 2018, when rates rose most during the twelve-month period. Over the remaining two quarters of the period, rates generally held steady, followed by another, albeit less severe, selloff, resulting in slight underperformance compared to the benchmark, which somewhat moderated the significant outperformance earlier in the 12-month period.
A privately offered fund managed by the Gurtin National Municipal Opportunistic Value Fund’s Adviser and portfolio management team (“Predecessor Fund”) reorganized into the Gurtin National Municipal Opportunistic Value Fund on November 3, 2014. This Predecessor Fund was organized on November 16, 2009, and commenced operations on May 3, 2010. The Predecessor Fund had an investment objective and strategies that were, in all material respects, identical to those of the Fund, and was managed in a manner that, in all material respects, complied with the investment guidelines and restrictions of the Gurtin National Municipal Opportunistic Value Fund. The Predecessor Fund, however, was not registered as an investment company under the Investment Company Act of 1940 (the “1940 Act”), and the Predecessor Fund was not subject to certain investment limitations, diversification requirements, liquidity requirements, and other restrictions imposed by the 1940 Act and the Internal Revenue Code of 1986 which, if applicable, may have adversely affected its performance. The Gurtin National Municipal Opportunistic Value Fund’s performance for periods prior to the commencement of operations is that of the Predecessor Fund and is based on calculations that are different from the standardized method of calculations adopted by the SEC. The performance of the Predecessor Fund was calculated net of the Predecessor Fund’s fees and expenses. The performance of the Predecessor Fund has not been restated to reflect the fees, estimated expenses and fee waivers and/or expense limitations of the Gurtin National Municipal Opportunistic Value Fund. If the performance of the Predecessor Fund had been restated to reflect the applicable fees and expenses of the Gurtin National Municipal Opportunistic Value Fund, the performance may have been higher or lower. Past performance is not indicative of future results.
GURTIN NATIONAL MUNICIPAL OPPORTUNISTIC VALUE FUND
SCHEDULE OF INVESTMENTS
SEPTEMBER 30, 2018
| Principal | Security Description | Rate | Maturity | Value | ||||||||||
| Municipal Bonds - 93.4% | ||||||||||||||
| Alabama - 0.5% | ||||||||||||||
| $ | 1,000,000 | The Water Works Board of the City of Birmingham, Alabama RB | 5.00 | % | 01/01/43 | $ | 1,078,330 | |||||||
| California - 8.3% | ||||||||||||||
| 65,000 | California Health Facilities Financing Authority, California RB, Series A | 5.00 | 04/01/25 | 65,175 | ||||||||||
| 500,000 | California State Public Works Board, California RB, Series B1 | 5.63 | 03/01/30 | 524,845 | ||||||||||
| 2,875,000 | California State Public Works Board, California RB, Series G | 5.00 | 11/01/37 | 3,147,435 | ||||||||||
| 1,000,000 | City of Fairfield, California COP, Series A (a) | 6.55 | 04/01/30 | 683,290 | ||||||||||
| 660,000 | County of San Bernardino, California COP | 5.00 | 08/01/28 | 660,449 | ||||||||||
| 7,475,000 | Dublin Unified School District, California GOB, Series E (a) | 6.14 | 08/01/39 | 2,058,465 | ||||||||||
| 1,450,000 | Golden State Tobacco Securitization Corp., California RB, Series A | 5.00 | 06/01/29 | 1,600,525 | ||||||||||
| 1,000,000 | Modesto Irrigation District, California RB (USD 3 Month LIBOR + 0.58%) (b) | 2.14 | 09/01/27 | 988,440 | ||||||||||
| 1,000,000 | Natomas Unified School District, California GOB (a) | 5.06 | 08/01/26 | 652,740 | ||||||||||
| 1,000,000 | Natomas Unified School District, California GOB (a) | 5.14 | 08/01/27 | 616,370 | ||||||||||
| 3,050,000 | Sacramento County Sanitation Districts Financing Authority, California RB, Series B (USD 3 Month LIBOR + 0.53%) (b) | 2.09 | 12/01/35 | 2,979,362 | ||||||||||
| 130,000 | State of California, California GOB, Series 07, AMBAC | 5.13 | 10/01/27 | 130,339 | ||||||||||
| 1,500,000 | Stockton East Water District, California COP, Series B (a) | 5.97 - 5.98 | 04/01/20 | 1,376,760 | ||||||||||
| 2,200,000 | Stockton East Water District, California COP, Series B (a) | 6.10 | 04/01/26 | 1,405,338 | ||||||||||
| 250,000 | Victor Valley Community College District, California GOB, Series A | 5.38 | 08/01/29 | 257,540 | ||||||||||
| 17,147,073 | ||||||||||||||
| Colorado - 8.2% | ||||||||||||||
| 2,000,000 | City of Aurora, Colorado RB | 5.00 | 12/01/40 | 2,082,580 | ||||||||||
| 4,510,000 | Colorado Health Facilities Authority, Colorado RB | 5.00 | 01/01/40 | 4,641,827 | ||||||||||
| 2,500,000 | Regional Transportation District, Colorado RB | 5.00 | 11/01/38 | 2,636,325 | ||||||||||
| 1,350,000 | State of Colorado Department of Transportation, Colorado COP | 5.00 | 06/15/41 | 1,375,691 | ||||||||||
| 5,850,000 | University of Colorado Hospital Authority, Colorado RB | 5.00 | 11/15/42 | 6,344,910 | ||||||||||
| 17,081,333 | ||||||||||||||
| Connecticut - 1.5% | ||||||||||||||
| 3,000,000 | State of Connecticut, Connecticut GOB, Series A (SIFMA Muni Swap + 0.95%) (b) | 2.51 | 03/01/24 | 3,038,190 | ||||||||||
| Florida - 6.0% | ||||||||||||||
| 2,500,000 | City of Miami Beach Stormwater Revenue, Florida RB | 5.00 | 09/01/47 | 2,689,025 | ||||||||||
| 1,595,000 | Highlands County Health Facilities Authority, Florida RB | 6.00 | 11/15/37 | 1,663,426 | ||||||||||
| 5,000 | Highlands County Health Facilities Authority, Florida RB | 6.00 | 11/15/37 | 5,221 | ||||||||||
| 3,580,000 | Mid-Bay Bridge Authority, Florida RB AGC | 5.00 | 10/01/27 | 3,580,000 | ||||||||||
| 2,500,000 | Orlando Utilities Commission, Florida RB | 5.00 | 10/01/33 | 2,536,300 | ||||||||||
| 2,000,000 | Sarasota County Public Hospital District, Florida RB | 5.63 | 07/01/39 | 2,052,840 | ||||||||||
| 12,526,812 | ||||||||||||||
| Illinois - 19.8% | ||||||||||||||
| 2,925,000 | Chicago O'Hare International Airport, Illinois RB | 5.00 | 01/01/36 | 3,213,376 | ||||||||||
| 1,340,000 | Chicago O'Hare International Airport, Illinois RB | 5.00 | 01/01/46 | 1,425,532 | ||||||||||
| 2,465,000 | Chicago O'Hare International Airport, Illinois RB, Series B | 5.00 | 01/01/32 | 2,696,784 | ||||||||||
| 1,000,000 | Chicago O'Hare International Airport, Illinois RB, Series B | 5.00 | 01/01/33 | 1,107,380 | ||||||||||
| 5,665,000 | Chicago O'Hare International Airport, Illinois RB, Series B | 5.00 | 01/01/41 | 6,170,431 | ||||||||||
| 525,000 | Chicago Park District, Illinois GOB, Series A | 5.50 | 01/01/33 | 581,269 | ||||||||||
| 980,000 | Chicago Park District, Illinois GOB, Series A | 5.00 | 01/01/33 | 1,009,527 | ||||||||||
| 3,000,000 | Chicago Park District, Illinois GOB, Series A | 5.75 | 01/01/38 | 3,371,280 | ||||||||||
| 1,975,000 | Chicago Park District, Illinois GOB, Series A | 5.00 | 01/01/40 | 2,089,570 | ||||||||||
| 500,000 | Chicago Park District, Illinois GOB, Series A | 5.00 | 01/01/27 | 517,655 | ||||||||||
| 1,500,000 | Chicago Park District, Illinois GOB, Series C | 5.00 | 01/01/27 | 1,565,985 | ||||||||||
| 920,000 | Chicago Park District, Illinois GOB, Series C | 5.00 | 01/01/29 | 969,772 | ||||||||||
| 1,000,000 | County of Will, Illinois GOB | 5.00 | 11/15/33 | 1,103,040 | ||||||||||
| 850,000 | Illinois Finance Authority, Illinois RB, Series A | 5.50 | 04/01/44 | 864,816 | ||||||||||
| 3,500,000 | Illinois Finance Authority, Illinois RB, Series A | 5.00 | 02/15/45 | 3,786,300 | ||||||||||
| 525,000 | Illinois Finance Authority, Illinois RB, Series D | 6.25 | 11/01/28 | 526,832 | ||||||||||
| 1,375,000 | Illinois State Toll Highway Authority, Illinois RB | 5.00 | 01/01/40 | 1,506,863 | ||||||||||
| 1,805,000 | Illinois State Toll Highway Authority, Illinois RB, Series A | 5.00 | 01/01/40 | 1,974,309 | ||||||||||
| 3,310,000 | University of Illinois, Illinois RB | 5.00 | 04/01/26 | 3,580,791 | ||||||||||
| 1,030,000 | University of Illinois, Illinois RB, Series A | 5.13 | 04/01/36 | 1,074,960 | ||||||||||
| 900,000 | University of Illinois, Illinois RB, Series A | 5.00 | 04/01/39 | 965,583 | ||||||||||
See Notes to Financial Statements.
GURTIN NATIONAL MUNICIPAL OPPORTUNISTIC VALUE FUND
SCHEDULE OF INVESTMENTS
SEPTEMBER 30, 2018
| Principal | Security Description | Rate | Maturity | Value | ||||||||||
| Illinois - 19.8% (continued) | ||||||||||||||
| $ | 825,000 | Will Grundy Etc Counties Community College District No. 525, Illinois GOB, Series B | 5.25 | % | 06/01/36 | $ | 915,651 | |||||||
| 41,017,706 | ||||||||||||||
| Indiana - 2.0% | ||||||||||||||
| 2,150,000 | Indiana Finance Authority, Indiana RB | 5.00 | 11/01/21 | 2,155,267 | ||||||||||
| 1,950,000 | Indiana Finance Authority, Indiana RB, Series A | 5.00 | 05/01/42 | 2,076,146 | ||||||||||
| 4,231,413 | ||||||||||||||
| Kansas - 1.7% | ||||||||||||||
| 2,270,000 | Kansas Development Finance Authority, Kansas RB | 5.75 | 11/15/38 | 2,364,228 | ||||||||||
| 55,000 | Kansas Development Finance Authority, Kansas RB | 5.75 | 11/15/38 | 57,158 | ||||||||||
| 1,000,000 | Topeka Public Building Commission, Kansas RB, Series A | 5.00 | 06/01/22 | 1,022,270 | ||||||||||
| 3,443,656 | ||||||||||||||
| Louisiana - 2.4% | ||||||||||||||
| 1,000,000 | New Orleans Aviation Board, Louisiana RB | 5.00 | 01/01/40 | 1,074,170 | ||||||||||
| 3,700,000 | State of Louisiana Gasoline & Fuels Tax Revenue, Louisiana RB | 5.00 | 05/01/43 | 4,001,254 | ||||||||||
| 5,075,424 | ||||||||||||||
| Maine - 3.4% | ||||||||||||||
| 6,850,000 | Maine Health & Higher Educational Facilities Authority, Maine RB | 5.00 | 07/01/39 | 6,985,493 | ||||||||||
| Maryland - 0.3% | ||||||||||||||
| 625,000 | Montgomery County Housing Opportunites Commission, Maryland RB, Series C | 5.00 | 07/01/31 | 645,662 | ||||||||||
| Massachusetts - 0.7% | ||||||||||||||
| 1,030,000 | Massachusetts Health & Educational Facilities Authority, Massachusetts RB | 5.00 | 10/01/30 | 1,083,776 | ||||||||||
| 370,000 | Massachusetts Housing Finance Agency, Massachusetts RB, Series C | 5.00 | 12/01/30 | 372,235 | ||||||||||
| 1,456,011 | ||||||||||||||
| Michigan - 4.6% | ||||||||||||||
| 3,325,000 | Lansing Board of Water & Light, Michigan RB | 5.00 | 07/01/37 | 3,536,038 | ||||||||||
| 550,000 | Michigan State Building Authority, Michigan RB, Series A | 5.20 | 10/15/31 | 593,824 | ||||||||||
| 5,125,000 | Michigan State University, Michigan RB | 5.00 | 02/15/44 | 5,296,995 | ||||||||||
| 9,426,857 | ||||||||||||||
| Missouri - 0.5% | ||||||||||||||
| 1,000,000 | City of St. Louis Airport Revenue, Missouri RB | 6.63 | 07/01/34 | 1,031,960 | ||||||||||
| New York - 8.3% | ||||||||||||||
| 2,055,000 | Metropolitan Transportation Authority, New York RB | 5.00 | 11/15/38 | 2,233,374 | ||||||||||
| 5,810,000 | Metropolitan Transportation Authority, New York RB | 5.00 | 11/15/43 | 6,227,216 | ||||||||||
| 1,000,000 | New York City Transitional Finance Authority Building Aid Revenue, New York RB | 5.50 | 01/15/34 | 1,009,890 | ||||||||||
| 1,000,000 | New York City Transitional Finance Authority Building Aid Revenue, New York RB | 5.50 | 01/15/39 | 1,009,720 | ||||||||||
| 2,200,000 | New York State Dormitory Authority, New York RB | 5.00 | 07/01/40 | 2,297,614 | ||||||||||
| 50,000 | New York State Dormitory Authority, New York RB | 5.75 | 02/15/19 | 50,122 | ||||||||||
| 2,625,000 | New York State Dormitory Authority, New York RB, Series C | 5.00 | 07/01/40 | 2,680,283 | ||||||||||
| 1,410,000 | Schenectady Metroplex Development Authority, New York RB, Series A | 5.50 | 08/01/33 | 1,587,618 | ||||||||||
| 17,095,837 | ||||||||||||||
| Ohio - 7.8% | ||||||||||||||
| 2,950,000 | American Municipal Power, Inc., Ohio RB, Series B | 5.00 | 02/15/37 | 3,154,258 | ||||||||||
| 1,000,000 | Brecksville-Broadview Heights City School District, Ohio GOB | 5.00 | 12/01/45 | 1,084,510 | ||||||||||
| 3,000,000 | Brunswick City School District, Ohio GOB | 5.25 | 12/01/48 | 3,316,380 | ||||||||||
| 1,000,000 | County of Franklin, Ohio RB | 5.00 | 11/01/42 | 1,063,200 | ||||||||||
| 3,725,000 | Kent State University, Ohio RB | 5.00 | 05/01/42 | 3,979,976 | ||||||||||
| 3,290,000 | Ohio University, Ohio RB | 5.00 | 12/01/43 | 3,537,606 | ||||||||||
| 16,135,930 | ||||||||||||||
| Pennsylvania - 5.0% | ||||||||||||||
| 3,200,000 | Commonwealth of Pennsylvania, Pennsylvania COP | 5.00 | 07/01/43 | 3,467,648 | ||||||||||
| 1,000,000 | Pennsylvania Turnpike Commission, Pennsylvania RB | 5.00 | 12/01/39 | 1,091,740 | ||||||||||
| 2,675,000 | Pennsylvania Turnpike Commission, Pennsylvania RB | 5.00 | 12/01/43 | 2,893,119 | ||||||||||
| 2,600,000 | Pennsylvania Turnpike Commission, Pennsylvania RB, Series A-1 | 5.00 | 12/01/41 | 2,839,954 | ||||||||||
| 10,292,461 | ||||||||||||||
| South Carolina - 2.6% | ||||||||||||||
| 5,075,000 | County of Florence, South Carolina RB | 5.00 | 11/01/37 | 5,305,303 | ||||||||||
See Notes to Financial Statements.
GURTIN NATIONAL MUNICIPAL OPPORTUNISTIC VALUE FUND
SCHEDULE OF INVESTMENTS
SEPTEMBER 30, 2018
| Principal | Security Description | Rate | Maturity | Value | ||||||||||
| Texas - 3.5% | ||||||||||||||
| $ | 2,500,000 | Boerne School District, Texas GOB | 5.00 | % | 02/01/43 | $ | 2,681,050 | |||||||
| 1,000,000 | City of Brownsville, Texas GOB | 5.00 | 02/15/43 | 1,069,160 | ||||||||||
| 1,000,000 | County of Harris, Texas RB | 5.00 | 08/15/38 | 1,023,690 | ||||||||||
| 1,000,000 | Dallas/Fort Worth International Airport, Texas RB | 5.00 | 11/01/43 | 1,042,900 | ||||||||||
| 1,400,000 | Lower Colorado River Authority, Texas RB | 5.00 | 05/15/37 | 1,499,288 | ||||||||||
| 7,316,088 | ||||||||||||||
| Utah - 1.8% | ||||||||||||||
| 3,675,000 | City of Riverton, Utah RB | 5.00 | 08/15/41 | 3,769,154 | ||||||||||
| Virginia - 2.4% | ||||||||||||||
| 2,150,000 | County of Fairfax, Virginia GOB | 5.00 | 10/01/18 | 2,150,000 | ||||||||||
| 2,775,000 | Fairfax County Redevelopment & Housing Authority, Virginia RB | 4.75 | 04/01/38 | 2,782,936 | ||||||||||
| 4,932,936 | ||||||||||||||
| Washington - 1.5% | ||||||||||||||
| 1,715,000 | Central Puget Sound Regional Transit Authority, Washington RB | 4.75 | 02/01/28 | 1,864,908 | ||||||||||
| 1,000,000 | Port of Seattle, Washington RB | 5.00 | 06/01/40 | 1,039,960 | ||||||||||
| 250,000 | State of Washington, Washington COP, Series D | 5.45 | 07/01/28 | 252,243 | ||||||||||
| 3,157,111 | ||||||||||||||
| Wisconsin - 0.6% | ||||||||||||||
| 1,200,000 | City of Madison, Wisconsin GOB | 3.00 | 10/01/18 | 1,200,000 | ||||||||||
| Total Municipal Bonds (Cost $191,825,022) | 193,390,740 | |||||||||||||
| Shares | Security Description | Value | ||||||
| Money Market Fund - 5.9% | ||||||||
| 12,257,525 | Fidelity Investments Money Market Government Portfolio, Class I, 1.96% (c) (Cost $12,257,525) | 12,257,525 | ||||||
| Investments, at value - 99.3% (Cost $204,082,547) | $ | 205,648,265 | ||||||
| Other Assets & Liabilities, Net - 0.7% | 1,538,001 | |||||||
| Net Assets - 100.0% | $ | 207,186,266 | ||||||
| AGC | Assured Guaranty Corporation |
| AMBAC | American Municipal Bond Assurance Corporation |
| COP | Certificate of Participation |
| GOB | General Obligation Bond |
| LIBOR | London Interbank Offered Rate |
| RB | Revenue Bond |
| SIFMA | Securities Industry and Financial Markets Association |
| (a) | Zero coupon bond. Interest rate presented is yield to maturity. |
| (b) | Floating rate security. Rate presented is as of September 30, 2018. |
| (c) | Dividend yield changes daily to reflect current market conditions. |
Rate was the quoted yield as of September 30, 2018.
The following is a summary of the inputs used to value the Fund's investments as of September 30, 2018.
The inputs or methodology used for valuing securities are not necessarily an indication of the risks associated with investing in those securities. For more information on valuation inputs, and their aggregation into the levels used in the table below, please refer to the Security Valuation section in Note 2 of the accompanying Notes to Financial Statements.
| Valuation Inputs | Investments in Securities | |||
| Level 1 - Quoted Prices | $ | – | ||
| Level 2 - Other Significant Observable Inputs | 205,648,265 | |||
| Level 3 - Significant Unobservable Inputs | – | |||
| Total | $ | 205,648,265 | ||
The Level 2 value displayed in this table includes Municipal Bonds and a Money Market Fund. Refer to this Schedule of Investments for a further breakout of each Municipal Bond security by state.
The Fund utilizes the end of period methodology when determining transfers. There were no transfers among Level 1, Level 2 and Level 3 for the year ended September 30, 2018.
See Notes to Financial Statements.
GURTIN NATIONAL MUNICIPAL OPPORTUNISTIC VALUE FUND
SCHEDULE OF INVESTMENTS
SEPTEMBER 30, 2018
| PORTFOLIO HOLDINGS (Unaudited) | ||||
| % of Total Investments | ||||
| Municipal Bonds | 94.0 | % | ||
| Money Market Fund | 6.0 | % | ||
| 100.0 | % | |||
See Notes to Financial Statements.
GURTIN NATIONAL MUNICIPAL OPPORTUNISTIC VALUE FUND
STATEMENT OF ASSETS AND LIABILITIES
SEPTEMBER 30, 2018
| ASSETS | ||||
| Investments, at value (Cost $204,082,547) | $ | 205,648,265 | ||
| Receivables: | ||||
| Fund shares sold | 300,000 | |||
| Dividends and interest | 2,662,218 | |||
| Prepaid expenses | 13,878 | |||
| Total Assets | 208,624,361 | |||
| LIABILITIES | ||||
| Payables: | ||||
| Investment securities purchased | 1,066,840 | |||
| Fund shares redeemed | 225,564 | |||
| Distributions payable | 20,511 | |||
| Accrued Liabilities: | ||||
| Investment adviser fees | 79,598 | |||
| Fund services fees | 10,056 | |||
| Other expenses | 35,526 | |||
| Total Liabilities | 1,438,095 | |||
| NET ASSETS | $ | 207,186,266 | ||
| COMPONENTS OF NET ASSETS | ||||
| Paid-in capital | $ | 205,549,362 | ||
| Accumulated net realized gain | 71,186 | |||
| Net unrealized appreciation | 1,565,718 | |||
| NET ASSETS | $ | 207,186,266 | ||
| SHARES OF BENEFICIAL INTEREST AT NO PAR VALUE (UNLIMITED SHARES AUTHORIZED) | ||||
| Institutional Shares | 20,712,255 | |||
| NET ASSET VALUE, OFFERING AND REDEMPTION PRICE PER SHARE | ||||
| Institutional Shares (based on net assets of $207,186,266) | $ | 10.00 | ||
See Notes to Financial Statements.
GURTIN NATIONAL MUNICIPAL OPPORTUNISTIC VALUE FUND
STATEMENT OF OPERATIONS
YEAR ENDED SEPTEMBER 30, 2018
| INVESTMENT INCOME | ||||
| Dividend income | $ | 124,622 | ||
| Interest income | 4,337,030 | |||
| Total Investment Income | 4,461,652 | |||
| EXPENSES | ||||
| Investment adviser fees | 698,461 | |||
| Fund services fees | 177,546 | |||
| Custodian fees | 16,483 | |||
| Registration fees | 17,422 | |||
| Professional fees | 33,129 | |||
| Trustees' fees and expenses | 7,296 | |||
| Other expenses | 58,253 | |||
| Total Expenses | 1,008,590 | |||
| Fees waived | (77,049 | ) | ||
| Net Expenses | 931,541 | |||
| NET INVESTMENT INCOME | 3,530,111 | |||
| NET REALIZED AND UNREALIZED GAIN (LOSS) | ||||
| Net realized gain on investments | 71,313 | |||
| Net change in unrealized appreciation (depreciation) on investments | (1,565,101 | ) | ||
| NET REALIZED AND UNREALIZED LOSS | (1,493,788 | ) | ||
| INCREASE IN NET ASSETS RESULTING FROM OPERATIONS | $ | 2,036,323 | ||
See Notes to Financial Statements.
GURTIN NATIONAL MUNICIPAL OPPORTUNISTIC VALUE FUND
STATEMENTS OF CHANGES IN NET ASSETS
| For the Years Ended September 30, | ||||||||
| 2018 | 2017 | |||||||
| OPERATIONS | ||||||||
| Net investment income | $ | 3,530,111 | $ | 2,290,249 | ||||
| Net realized gain | 71,313 | 38,007 | ||||||
| Net change in unrealized appreciation (depreciation) | (1,565,101 | ) | (355,549 | ) | ||||
| Increase in Net Assets Resulting from Operations | 2,036,323 | 1,972,707 | ||||||
| DISTRIBUTIONS TO SHAREHOLDERS FROM | ||||||||
| Net investment income: | ||||||||
| Institutional Shares | (3,529,424 | ) | (2,290,691 | ) | ||||
| Net realized gain: | ||||||||
| Institutional Shares | (37,704 | ) | (208,685 | ) | ||||
| Total Distributions to Shareholders | (3,567,128 | ) | (2,499,376 | ) | ||||
| CAPITAL SHARE TRANSACTIONS | ||||||||
| Sale of shares: | ||||||||
| Institutional Shares | 113,198,302 | 36,522,174 | ||||||
| Reinvestment of distributions: | ||||||||
| Institutional Shares | 3,376,401 | 2,326,212 | ||||||
| Redemption of shares: | ||||||||
| Institutional Shares | (32,308,164 | ) | (22,793,405 | ) | ||||
| Increase in Net Assets from Capital Share Transactions | 84,266,539 | 16,054,981 | ||||||
| Increase in Net Assets | 82,735,734 | 15,528,312 | ||||||
| NET ASSETS | ||||||||
| Beginning of Year | 124,450,532 | 108,922,220 | ||||||
| End of Year (Including line (a)) | $ | 207,186,266 | $ | 124,450,532 | ||||
| SHARE TRANSACTIONS | ||||||||
| Sale of shares: | ||||||||
| Institutional Shares | 11,263,507 | 3,637,003 | ||||||
| Reinvestment of distributions: | ||||||||
| Institutional Shares | 335,874 | 231,932 | ||||||
| Redemption of shares: | ||||||||
| Institutional Shares | (3,211,855 | ) | (2,276,060 | ) | ||||
| Increase in Shares | 8,387,526 | 1,592,875 | ||||||
| (a) Distributions in excess of net investment income | $ | – | $ | (687 | ) | |||
See Notes to Financial Statements.
GURTIN NATIONAL MUNICIPAL OPPORTUNISTIC VALUE FUND
FINANCIAL HIGHLIGHTS
These financial highlights reflect selected data for a share outstanding throughout each period.
| For the Years Ended September 30, |
November 3, 2014 (a) through September 30, |
|||||||||||||||
| 2018 | 2017 | 2016 | 2015 | |||||||||||||
| INSTITUTIONAL SHARES | ||||||||||||||||
| NET ASSET VALUE, Beginning of Period | $ | 10.10 | $ | 10.15 | $ | 10.01 | $ | 10.00 | ||||||||
| INVESTMENT OPERATIONS | ||||||||||||||||
| Net investment income (b) | 0.23 | 0.20 | 0.18 | 0.20 | ||||||||||||
| Net realized and unrealized gain (loss) | (0.10 | ) | (0.03 | ) | 0.14 | 0.02 | ||||||||||
| Total from Investment Operations | 0.13 | 0.17 | 0.32 | 0.22 | ||||||||||||
| Net investment income | (0.23 | ) | (0.20 | ) | (0.18 | ) | (0.21 | ) | ||||||||
| Net realized gain | (0.00 | )(c) | (0.02 | ) | – | – | ||||||||||
| Total Distributions to Shareholders | (0.23 | ) | (0.22 | ) | (0.18 | ) | (0.21 | ) | ||||||||
| NET ASSET VALUE, End of Period | $ | 10.00 | $ | 10.10 | $ | 10.15 | $ | 10.01 | ||||||||
| TOTAL RETURN | 1.30 | % | 1.64 | % | 3.26 | % | 2.18 | %(d) | ||||||||
| RATIOS/SUPPLEMENTARY DATA | ||||||||||||||||
| Net Assets at End of Period (000s omitted) | $ | 207,186 | $ | 124,451 | $ | 108,922 | $ | 91,732 | ||||||||
| Ratios to Average Net Assets: | ||||||||||||||||
| Net investment income | 2.27 | % | 1.95 | % | 1.81 | % | 2.21 | %(e) | ||||||||
| Net expenses | 0.60 | % | 0.60 | % | 0.60 | % | 0.60 | %(e) | ||||||||
| Gross expenses (f) | 0.65 | % | 0.68 | % | 0.71 | % | 0.93 | %(e) | ||||||||
| PORTFOLIO TURNOVER RATE | 46 | % | 41 | % | 59 | % | 32 | %(d) | ||||||||
| (a) | Commencement of operations. |
| (b) | Calculated based on average shares outstanding during each period. |
| (c) | Less than $0.01 per share. |
| (d) | Not annualized. |
| (e) | Annualized. |
| (f) | Reflects the expense ratio excluding any waivers and/or reimbursements. |
See Notes to Financial Statements.
GURTIN CALIFORNIA MUNICIPAL OPPORTUNISTIC VALUE FUND
PERFORMANCE CHART AND ANALYSIS (Unaudited)
SEPTEMBER 30, 2018
The following chart reflects the change in the value of a hypothetical $250,000 investment in Institutional Shares, including reinvested dividends and distributions, in Gurtin California Municipal Opportunistic Value Fund (the “Fund”) compared with the performance of the benchmark, ICE Bank of America Merrill Lynch Municipal Miscellaneous Index 7-12 Years (“ICE BAML Muni Misc 7-12”) and the ICE Bank of America Merrill Lynch Municipal Blended Index (“ICE BAML Muni Blended”), since inception. The ICE BAML Muni Misc 7-12 was formerly known as the Merrill Lynch Municipal Miscellaneous 7-12 Years Index and measures the performance of municipal securities with a remaining term to final maturity greater than or equal to 7 years and less than 12 years. The ICE BAML Muni Blended is a blend of 75% of the ICE Bank of America Merrill Lynch 7-12 Year US Large Cap Municipal Securities Index, a subset of the ICE Bank of America Merrill Lynch US Large Cap Municipal Securities Index including all securities with a remaining term to final maturity greater than or equal to 7 years and less than 12 years, and 25% of the ICE Bank of America Merrill Lynch 12-22 Year US Large Cap Municipal Securities Index, a subset of the ICE Bank of America Merrill Lynch US Large Cap Municipal Securities Index including all securities with a remaining term to final maturity greater than or equal to 12 years and less than 22 years. The total return of the indices includes the reinvestment of dividends and income. The total return of the Fund includes operating expenses that reduce returns, while the total return of the indices do not include expenses. The Fund is professionally managed, while the indices are unmanaged and are not available for investment.
Comparison of a $250,000 Investment
Gurtin California Municipal Opportunistic Value Fund vs.
ICE Bank of America Merrill Lynch Municipal Miscellaneous Index 7-12 Years and ICE Bank of America Merrill Lynch Municipal Blended Index

|
Average Annual Total Returns Periods Ended September 30, 2018 |
One Year | Five Year | Since Inception 05/03/10 |
| Gurtin California Municipal Opportunistic Value Fund | 1.17% | 3.65% | 4.22% |
| ICE Bank of America Merrill Lynch Municipal Miscellaneous Index 7-12 Years | 0.42% | 3.44% | 4.45% |
| ICE Bank of America Merrill Lynch Municipal Blended Index | -0.34% | 3.95% | 4.47% |
Performance data quoted represents past performance and is no guarantee of future results. Current performance may be lower or higher than the performance data quoted. Investment return and principal value will fluctuate so that shares, when redeemed, may be worth more or less than original cost. As stated in the Fund’s prospectus, the annual operating expense ratio (gross) is 0.63%. However, the Fund’s adviser has contractually agreed to waive its fee and/or reimburse Fund expenses to limit Total Annual Fund Operating Expenses After Fee Waiver and/or Expense Reimbursement (excluding all taxes, interest, portfolio transaction expenses, proxy expenses and extraordinary expenses) to 0.60%, through February 1, 2019 (the “Expense Cap”). The adviser may be reimbursed by each Fund for fees waived and expenses reimbursed by the adviser pursuant to the Expense Cap if such payment is made within three years of the fee waiver or expense reimbursement, and does not cause the Total Annual Fund Operating Expenses After Fee Waiver and/or Expense Reimbursement to exceed the lesser of (i) the then-current expense cap, or (ii) the expense cap in place at the time the fees/expenses were waived/reimbursed. During the period, certain fees were waived and/or expenses reimbursed; otherwise, returns would have been lower. The performance table and graph do not reflect the deduction of taxes that a shareholder would pay on Fund distributions or the redemption of Fund shares. Returns greater than one year are annualized. For the most recent month-end performance, please call (844) 342-5763.
The Fund’s outperformance relative to the benchmark BAML Muni Blended and the BAML Muni Misc 7-12 during the twelve months that ended September 30, 2018, was largely attributable to the Fund’s relatively more conservative positioning during a period of rising interest rates and to our ability to deploy capital nimbly when opportunities arose throughout the year. The Fund’s effective duration as of each month-end was 43% and 47% of the benchmark BAML Muni Blended and the BAML Muni Misc 7-12 on average, respectively. More specifically, the Fund’s effective duration began the 12-month period at slightly over 40% of each benchmark, and ended the 12-month period at approximately 60% of each benchmark. The Fund’s evolving positioning was deliberate, as we opportunistically deployed capital as attractive investments became available. In particular, at the start of this 12-month period, the Fund’s effective duration was relatively low, reflecting the low-
GURTIN CALIFORNIA MUNICIPAL OPPORTUNISTIC VALUE FUND
PERFORMANCE CHART AND ANALYSIS (Unaudited)
SEPTEMBER 30, 2018
rate and flat yield-curve interest rate environment. However, the Tax Cuts and Jobs Act of 2017 (TCJA), in conjunction with a strong economy and consistent Fed tightening through continued rate hikes and balance sheet run-off, led to a rise in rates and volatility across the curve, with AAA MMD yields up nearly 100 basis points (bps) on the short-end to 35-55 bps throughout the long-end of the yield curve. Furthermore, the TCJA affected both the supply and demand dynamics of the municipal market through the elimination of tax-exempt advance refundings, which pulled a significant amount of supply forward, as well as the reduction in the corporate tax rate, which reduced demand from banks and insurance companies and increased supply as they sold municipal holdings. Moreover, rising interest rates prompted material retail mutual fund outflows toward the end of the 12-month period, adding to supply. Finally, the sharp reduction of the state and local tax (SALT) deduction caused spreads to tighten in high-tax states, adding to price performance in the California Fund. These various market developments created opportunities for us to extend duration and invest in longer callable structures at yields that meet the strategy’s objective. The combination of relatively conservative positioning followed by calculated duration extension resulted in significant outperformance, especially in the first quarter of 2018, when rates rose most during the twelve-month period. Over the remaining two quarters of the period, rates generally held steady, followed by another, albeit less severe, selloff, resulting in slight underperformance as compared to the benchmark, which somewhat moderated the significant outperformance earlier in the twelve-month period.
A privately offered fund managed by the Gurtin California Municipal Opportunistic Value Fund’s Adviser and portfolio management team (“Predecessor Fund”) reorganized into the Gurtin California Municipal Opportunistic Value Fund on November 3, 2014. This Predecessor Fund was organized on November 16, 2009, and commenced operations on May 3, 2010. The Predecessor Fund had an investment objective and strategies that were, in all material respects, identical to those of the Fund, and was managed in a manner that, in all material respects, complied with the investment guidelines and restrictions of the Gurtin California Municipal Opportunistic Value Fund. The Predecessor Fund, however, was not registered as an investment company under the Investment Company Act of 1940 (the “1940 Act”), and the Predecessor Fund was not subject to certain investment limitations, diversification requirements, liquidity requirements, and other restrictions imposed by the 1940 Act and the Internal Revenue Code of 1986 which, if applicable, may have adversely affected its performance. The Gurtin California Municipal Opportunistic Value Fund’s performance for periods prior to the commencement of operations is that of the Predecessor Fund and is based on calculations that are different from the standardized method of calculations adopted by the SEC. The performance of the Predecessor Fund was calculated net of the Predecessor Fund’s fees and expenses. The performance of the Predecessor Fund has not been restated to reflect the fees, estimated expenses and fee waivers and/or expense limitations of the Gurtin California Municipal Opportunistic Value Fund. If the performance of the Predecessor Fund had been restated to reflect the applicable fees and expenses of the Gurtin California Municipal Opportunistic Value Fund, the performance may have been higher or lower. Past performance is not indicative of future results.
GURTIN CALIFORNIA MUNICIPAL OPPORTUNISTIC VALUE FUND
SCHEDULE OF INVESTMENTS
SEPTEMBER 30, 2018
| Principal | Security Description | Rate | Maturity | Value | ||||||||||
| Municipal Bonds - 97.1% | ||||||||||||||
| California - 88.0% | ||||||||||||||
| $ | 1,000,000 | Abag Finance Authority for Nonprofit Corps., California RB | 5.00 | % | 01/01/33 | $ | 1,097,630 | |||||||
| 4,625,000 | Abag Finance Authority for Nonprofit Corps., California RB | 6.00 | 09/01/37 | 4,958,833 | ||||||||||
| 1,160,000 | Alameda Public Financing Authority, California RB, Series A | 5.25 | 07/01/29 | 1,221,306 | ||||||||||
| 4,400,000 | Anaheim Housing & Public Improvements Authority, California RB | 5.00 | 10/01/33 | 4,740,868 | ||||||||||
| 3,255,000 | Anaheim Housing & Public Improvements Authority, California RB | 5.00 | 10/01/33 | 3,554,590 | ||||||||||
| 1,420,000 | Anaheim Housing & Public Improvements Authority, California RB | 5.00 | 10/01/34 | 1,527,437 | ||||||||||
| 1,045,000 | Anaheim Housing & Public Improvements Authority, California RB | 5.00 | 10/01/34 | 1,141,182 | ||||||||||
| 290,000 | Bret Harte Union High School District, California COP, AMBAC | 4.25 | 09/01/20 | 290,516 | ||||||||||
| 5,180,000 | California Health Facilities Financing Authority, California RB | 5.00 | 10/01/19 | 5,180,000 | ||||||||||
| 700,000 | California Infrastructure & Economic Development Bank, California RB | 5.00 | 08/15/23 | 700,728 | ||||||||||
| 500,000 | California Infrastructure & Economic Development Bank, California RB | 5.75 | 08/15/29 | 526,375 | ||||||||||
| 500,000 | California State Public Works Board, California RB, Series B1 | 5.40 | 03/01/26 | 523,500 | ||||||||||
| 4,100,000 | California State Public Works Board, California RB, Series G | 5.00 | 11/01/37 | 4,488,516 | ||||||||||
| 4,100,000 | California Statewide Communities Development Authority, California RB | 5.25 | 11/01/30 | 4,352,027 | ||||||||||
| 2,175,000 | California Statewide Communities Development Authority, California RB, Series A | 5.00 | 08/15/46 | 2,407,094 | ||||||||||
| 1,000,000 | Centinela Valley Union High School District, California GOB, Series B | 5.75 | 08/01/30 | 1,173,330 | ||||||||||
| 1,910,000 | Centinela Valley Union High School District, California GOB, Series B | 5.75 | 08/01/33 | 2,241,060 | ||||||||||
| 2,000,000 | City of Fairfield, California COP, Series A (a) | 6.55 | 04/01/30 | 1,366,580 | ||||||||||
| 7,750,000 | City of Los Angeles Department of Airports, California RB | 5.00 | 05/15/40 | 8,118,513 | ||||||||||
| 3,600,000 | City of Los Angeles Department of Airports, California RB | 5.00 | 05/15/40 | 3,771,180 | ||||||||||
| 7,800,000 | City of Los Angeles Department of Airports, California RB | 5.00 | 05/15/41 | 8,554,416 | ||||||||||
| 1,330,000 | City of Los Angeles Department of Airports, California RB | 5.00 | 05/15/42 | 1,456,776 | ||||||||||
| 2,575,000 | Coachella Valley Unified School District, California GOB, Series D | 5.00 | 08/01/37 | 2,775,438 | ||||||||||
| 1,380,000 | County of San Bernardino, California COP | 5.00 | 08/01/28 | 1,380,938 | ||||||||||
| 1,275,000 | County of San Bernardino, California COP | 4.75 | 08/01/28 | 1,278,392 | ||||||||||
| 3,375,000 | Desert Community College District, California GOB | 5.00 | 08/01/43 | 3,724,211 | ||||||||||
| 2,835,000 | Dublin Unified School District, California GOB, Series D (a) | 5.73 | 08/01/34 | 1,083,650 | ||||||||||
| 9,325,000 | Dublin Unified School District, California GOB, Series E (a) | 6.14 | 08/01/39 | 2,567,919 | ||||||||||
| 31,400,000 | Dublin Unified School District, California GOB, Series E (a) | 6.31 | 08/01/44 | 6,113,266 | ||||||||||
| 1,500,000 | Elk Grove Finance Authority, California Special Tax Bond | 5.00 | 09/01/38 | 1,656,450 | ||||||||||
| 1,600,000 | Fresno Unified School District, California GOB, Series G (a) | 6.10 | 08/01/41 | 375,728 | ||||||||||
| 4,340,000 | Golden State Tobacco Securitization Corp., California RB | 5.00 | 06/01/40 | 4,802,557 | ||||||||||
| 1,000,000 | Los Angeles Community Redevelopment Agency, California RB, AMBAC | 5.00 | 09/01/37 | 1,002,140 | ||||||||||
| 4,700,000 | Los Angeles Department of Water, California RB | 5.00 | 07/01/43 | 5,129,956 | ||||||||||
| 2,250,000 | Madera Unified School District, California COP | 5.00 | 09/01/38 | 2,349,270 | ||||||||||
| 4,165,000 | Madera Unified School District, California COP | 5.00 | 09/01/43 | 4,345,594 | ||||||||||
| 2,500,000 | Madera Unified School District, California COP | 5.00 | 09/01/45 | 2,607,450 | ||||||||||
| 3,185,000 | Modesto Irrigation District, California RB (USD 3 Month LIBOR + 0.58%) (b) | 2.14 | 09/01/27 | 3,148,181 | ||||||||||
| 1,600,000 | Modesto Irrigation District, California RB (USD 3 Month LIBOR + 0.63%) (b) | 2.19 | 09/01/37 | 1,522,448 | ||||||||||
| 2,650,000 | Oakland Unified School District/Alameda County, California GOB | 6.63 | 08/01/38 | 3,001,231 | ||||||||||
| 770,000 | Oxnard School District, California GOB, Series A | 5.75 | 08/01/30 | 879,309 | ||||||||||
| 2,500,000 | Port of Oakland, California RB, Series P | 5.00 | 05/01/33 | 2,661,500 | ||||||||||
| 5,120,000 | Regents of the University of California Medical Center Pooled Revenue, California RB, Series C2 (USD 3 Month LIBOR + 0.74%) (b) | 2.29 | 05/15/43 | 4,558,848 | ||||||||||
| 9,525,000 | Sacramento County Sanitation Districts Financing Authority, California RB, Series B (USD 3 Month LIBOR + 0.53%) (b) | 2.09 | 12/01/35 | 9,304,401 | ||||||||||
| 2,000,000 | Sacramento County Water Financing Authority, California RB, Series B (USD 3 Month LIBOR + 0.55%) (b) | 2.11 | 06/01/34 | 1,929,680 | ||||||||||
| 5,475,000 | San Bernardino City Unified School District, California GOB, Series C | 5.00 | 08/01/40 | 6,092,909 | ||||||||||
| 3,230,000 | San Diego County Regional Airport Authority, California RB | 5.00 | 07/01/47 | 3,546,217 | ||||||||||
| 5,900,000 | San Diego County Regional Transportation Commission, California RB | 5.00 | 04/01/48 | 6,407,518 | ||||||||||
| 1,000,000 | San Diego Public Facilities Financing Authority, California RB, Series A | 5.25 | 04/15/29 | 1,104,640 | ||||||||||
| 3,865,000 | San Francisco City & County Airport Commission-San Francisco International Airport, California RB | 5.00 | 05/01/39 | 4,226,146 | ||||||||||
See Notes to Financial Statements.
GURTIN CALIFORNIA MUNICIPAL OPPORTUNISTIC VALUE FUND
SCHEDULE OF INVESTMENTS
SEPTEMBER 30, 2018
| Principal | Security Description | Rate | Maturity | Value | ||||||||||
| California - 88.0% (continued) | ||||||||||||||
| $ | 1,475,000 | San Francisco City & County Airport Commission-San Francisco International Airport, California RB | 5.00 | % | 05/01/44 | $ | 1,608,886 | |||||||
| 1,520,000 | San Francisco City & County Airport Commission-San Francisco International Airport, California RB, Second Series | 5.25 | 05/01/33 | 1,675,572 | ||||||||||
| 4,610,000 | San Francisco City & County Airport Commission-San Francisco International Airport, California RB, Second Series | 6.00 | 05/01/39 | 4,722,576 | ||||||||||
| 390,000 | San Francisco City & County Airport Commission-San Francisco International Airport, California RB, Second Series | 6.00 | 05/01/39 | 399,617 | ||||||||||
| 895,000 | San Mateo Union High School District, California GOB, Series A (a) | 6.02 | 09/01/25 | 666,775 | ||||||||||
| 105,000 | San Mateo Union High School District, California GOB, Series A (a) | 6.02 | 09/01/25 | 76,996 | ||||||||||
| 1,250,000 | San Ysidro School District, California COP | 5.00 | 09/01/42 | 1,350,275 | ||||||||||
| 4,680,000 | Solano County Community College District, California GOB | 5.00 | 08/01/43 | 5,144,209 | ||||||||||
| 85,000 | State of California, California GOB | 5.75 | 05/01/30 | 85,258 | ||||||||||
| 20,000 | State of California, California GOB | 4.50 | 08/01/30 | 20,026 | ||||||||||
| 2,550,000 | State of California, California GOB | 6.00 | 04/01/35 | 2,601,102 | ||||||||||
| 7,270,000 | State of California, California GOB | 6.00 | 04/01/38 | 7,415,327 | ||||||||||
| 2,650,000 | State of California, California GOB | 6.00 | 11/01/39 | 2,764,454 | ||||||||||
| 5,000 | State of California, California GOB | 5.00 | 10/01/28 | 5,012 | ||||||||||
| 135,000 | State of California, California GOB, Series 07, AMBAC | 5.13 | 10/01/27 | 135,352 | ||||||||||
| 3,300,000 | Stockton East Water District, California COP, Series B (a) | 5.97 - | ||||||||||||
| 6.00 | 04/01/21 | 2,853,411 | ||||||||||||
| 2,000,000 | Stockton East Water District, California COP, Series B (a) | 6.09 | 04/01/25 | 1,357,600 | ||||||||||
| 1,300,000 | Stockton Public Financing Authority, California RB, Series A | 6.25 | 10/01/40 | 1,514,396 | ||||||||||
| 775,000 | Stockton Unified School District, California GOB | 5.00 | 07/01/27 | 849,400 | ||||||||||
| 1,600,000 | Tulare County Board of Education, California COP | 5.38 | 05/01/33 | 1,767,952 | ||||||||||
| 250,000 | Victor Valley Community College District, California GOB, Series A | 5.38 | 08/01/29 | 257,540 | ||||||||||
| 7,900,000 | Walnut Energy Center Authority, California RB | 5.00 | 01/01/35 | 8,176,342 | ||||||||||
| 2,165,000 | Wasco Union School District, California GOB | 5.00 | 08/01/43 | 2,351,168 | ||||||||||
| 1,575,000 | Wasco Union School District, California GOB | 5.00 | 08/01/43 | 1,710,434 | ||||||||||
| 202,478,124 | ||||||||||||||
| Illinois - 8.5% | ||||||||||||||
| 1,000,000 | Chicago O'Hare International Airport, Illinois RB | 5.00 | 01/01/46 | 1,063,830 | ||||||||||
| 1,000,000 | Chicago Park District, Illinois GOB, Series A | 5.00 | 01/01/30 | 1,079,740 | ||||||||||
| 1,000,000 | Chicago Park District, Illinois GOB, Series A | 5.00 | 01/01/35 | 1,064,370 | ||||||||||
| 2,050,000 | Chicago Park District, Illinois GOB, Series A | 5.75 | 01/01/38 | 2,303,708 | ||||||||||
| 2,325,000 | Chicago Park District, Illinois GOB, Series A | 5.00 | 01/01/40 | 2,459,873 | ||||||||||
| 1,755,000 | Chicago Park District, Illinois GOB, Series B | 5.00 | 01/01/26 | 1,925,060 | ||||||||||
| 1,000,000 | Chicago Park District, Illinois GOB, Series B | 5.00 | 01/01/26 | 1,096,900 | ||||||||||
| 1,795,000 | Chicago Park District, Illinois GOB, Series C | 5.25 | 01/01/37 | 1,864,592 | ||||||||||
| 3,895,000 | Chicago Park District, Illinois GOB, Series C | 5.25 | 01/01/40 | 4,040,011 | ||||||||||
| 1,580,000 | Chicago Park District, Illinois GOB, Series C | 5.00 | 01/01/23 | 1,691,169 | ||||||||||
| 1,000,000 | Illinois Finance Authority, Illinois RB | 5.63 | 08/15/31 | 1,078,770 | ||||||||||
| 19,668,023 | ||||||||||||||
| Pennsylvania - 0.6% | ||||||||||||||
| 1,200,000 | Pennsylvania Higher Educational Facilities Authority, Pennsylvania RB | 5.00 | 08/15/42 | 1,283,843 | ||||||||||
| Total Municipal Bonds (Cost $219,535,503) | 223,429,990 | |||||||||||||
| Shares | Security Description | Value | ||||||
| Money Market Fund - 1.8% | ||||||||
| 4,139,851 |
Fidelity Investments Money Market Government Portfolio, Class I, 1.96% (c) (Cost $4,139,851) |
4,139,851 | ||||||
| Investments, at value - 98.9% (Cost $223,675,354) | $ | 227,569,841 | ||||||
| Other Assets & Liabilities, Net - 1.1% | 2,597,930 | |||||||
| Net Assets - 100.0% | $ | 230,167,771 | ||||||
| AMBAC | American Municipal Bond Assurance Corporation |
| COP | Certificate of Participation |
| GOB | General Obligation Bond |
| LIBOR | London Interbank Offered Rate |
| RB | Revenue Bond |
| (a) | Zero coupon bond. Interest rate presented is yield to maturity. |
| (b) | Floating rate security. Rate presented is as of September 30, 2018. |
See Notes to Financial Statements.
GURTIN CALIFORNIA MUNICIPAL OPPORTUNISTIC VALUE FUND
SCHEDULE OF INVESTMENTS
SEPTEMBER 30, 2018
| (c) | Dividend yield changes daily to reflect current market conditions. Rate was the quoted yield as of September 30, 2018. |
The following is a summary of the inputs used to value the Fund's investments as of September 30, 2018.
The inputs or methodology used for valuing securities are not necessarily an indication of the risks associated with investing in those securities. For more information on valuation inputs, and their aggregation into the levels used in the table below, please refer to the Security Valuation section in Note 2 of the accompanying Notes to Financial Statements.
| Valuation Inputs | Investments in Securities | |||
| Level 1 - Quoted Prices | $ | – | ||
| Level 2 - Other Significant Observable Inputs | 227,569,841 | |||
| Level 3 - Significant Unobservable Inputs | – | |||
| Total | $ | 227,569,841 | ||
The Level 2 value displayed in this table includes Municipal Bonds and a Money Market Fund. Refer to this Schedule of Investments for a further breakout of each Municipal Bond security by state.
The Fund utilizes the end of period methodology when determining transfers. There were no transfers among Level 1, Level 2 and Level 3 for the year ended September 30, 2018.
| PORTFOLIO HOLDINGS (Unaudited) | ||||
| % of Total Investments | ||||
| Municipal Bonds | 98.2 | % | ||
| Money Market Fund | 1.8 | % | ||
| 100.0 | % | |||
See Notes to Financial Statements.
GURTIN CALIFORNIA MUNICIPAL OPPORTUNISTIC VALUE FUND
STATEMENT OF ASSETS AND LIABILITIES
SEPTEMBER 30, 2018
| ASSETS | ||||
| Investments, at value (Cost $223,675,354) | $ | 227,569,841 | ||
| Receivables: | ||||
| Fund shares sold | 269,985 | |||
| Dividends and interest | 2,847,053 | |||
| Prepaid expenses | 4,545 | |||
| Total Assets | 230,691,424 | |||
| LIABILITIES | ||||
| Payables: | ||||
| Fund shares redeemed | 370,348 | |||
| Distributions payable | 18,350 | |||
| Accrued Liabilities: | ||||
| Investment adviser fees | 90,184 | |||
| Fund services fees | 10,801 | |||
| Other expenses | 33,970 | |||
| Total Liabilities | 523,653 | |||
| NET ASSETS | $ | 230,167,771 | ||
| COMPONENTS OF NET ASSETS | ||||
| Paid-in capital | $ | 226,245,315 | ||
| Distributions in excess of net investment income | (1 | ) | ||
| Accumulated net realized gain | 27,970 | |||
| Net unrealized appreciation | 3,894,487 | |||
| NET ASSETS | $ | 230,167,771 | ||
| SHARES OF BENEFICIAL INTEREST AT NO PAR VALUE (UNLIMITED SHARES AUTHORIZED) | ||||
| Institutional Shares | 23,007,735 | |||
| NET ASSET VALUE, OFFERING AND REDEMPTION PRICE PER SHARE | ||||
| Institutional Shares (based on net assets of $230,167,771) | $ | 10.00 | ||
See Notes to Financial Statements.
GURTIN CALIFORNIA MUNICIPAL OPPORTUNISTIC VALUE FUND
STATEMENT OF OPERATIONS
YEAR ENDED SEPTEMBER 30, 2018
| INVESTMENT INCOME | ||||
| Dividend income | $ | 66,717 | ||
| Interest income | 5,815,187 | |||
| Total Investment Income | 5,881,904 | |||
| EXPENSES | ||||
| Investment adviser fees | 934,930 | |||
| Fund services fees | 222,020 | |||
| Custodian fees | 21,564 | |||
| Registration fees | 3,561 | |||
| Professional fees | 35,075 | |||
| Trustees' fees and expenses | 9,337 | |||
| Other expenses | 72,171 | |||
| Total Expenses | 1,298,658 | |||
| Fees waived | (97,629 | ) | ||
| Investment adviser expense reimbursements recouped (Note 4) | 45,463 | |||
| Net Expenses | 1,246,492 | |||
| NET INVESTMENT INCOME | 4,635,412 | |||
| NET REALIZED AND UNREALIZED GAIN (LOSS) | ||||
| Net realized gain on investments | 27,979 | |||
| Net change in unrealized appreciation (depreciation) on investments | (2,141,576 | ) | ||
| NET REALIZED AND UNREALIZED LOSS | (2,113,597 | ) | ||
| INCREASE IN NET ASSETS RESULTING FROM OPERATIONS | $ | 2,521,815 | ||
See Notes to Financial Statements.
GURTIN CALIFORNIA MUNICIPAL OPPORTUNISTIC VALUE FUND
STATEMENTS OF CHANGES IN NET ASSETS
| For the Years Ended September 30, | ||||||||
| 2018 | 2017 | |||||||
| OPERATIONS | ||||||||
| Net investment income | $ | 4,635,412 | $ | 3,680,313 | ||||
| Net realized gain | 27,979 | 53,384 | ||||||
| Net change in unrealized appreciation (depreciation) | (2,141,576 | ) | (1,479,714 | ) | ||||
| Increase in Net Assets Resulting from Operations | 2,521,815 | 2,253,983 | ||||||
| DISTRIBUTIONS TO SHAREHOLDERS FROM | ||||||||
| Net investment income: | ||||||||
| Institutional Shares | (4,635,842 | ) | (3,679,890 | ) | ||||
| Net realized gain: | ||||||||
| Institutional Shares | (53,393 | ) | (306,163 | ) | ||||
| Total Distributions to Shareholders | (4,689,235 | ) | (3,986,053 | ) | ||||
| CAPITAL SHARE TRANSACTIONS | ||||||||
| Sale of shares: | ||||||||
| Institutional Shares | 80,902,701 | 25,552,927 | ||||||
| Reinvestment of distributions: | ||||||||
| Institutional Shares | 4,399,571 | 3,767,940 | ||||||
| Redemption of shares: | ||||||||
| Institutional Shares | (41,843,409 | ) | (29,174,844 | ) | ||||
| Increase in Net Assets from Capital Share Transactions | 43,458,863 | 146,023 | ||||||
| Increase (Decrease) in Net Assets | 41,291,443 | (1,586,047 | ) | |||||
| NET ASSETS | ||||||||
| Beginning of Year | 188,876,328 | 190,462,375 | ||||||
| End of Year (Including line (a)) | $ | 230,167,771 | $ | 188,876,328 | ||||
| SHARE TRANSACTIONS | ||||||||
| Sale of shares: | ||||||||
| Institutional Shares | 8,045,930 | 2,566,913 | ||||||
| Reinvestment of distributions: | ||||||||
| Institutional Shares | 437,700 | 375,495 | ||||||
| Redemption of shares: | ||||||||
| Institutional Shares | (4,162,375 | ) | (2,907,415 | ) | ||||
| Increase in Shares | 4,321,255 | 34,993 | ||||||
| (a) Undistributed (distributions in excess of ) net investment income | $ | (1 | ) | $ | 429 | |||
See Notes to Financial Statements.
GURTIN CALIFORNIA MUNICIPAL OPPORTUNISTIC VALUE FUND
FINANCIAL HIGHLIGHTS
These financial highlights reflect selected data for a share outstanding throughout each period.
| For the Years Ended September 30, | November 3, 2014(a) through September 30, | |||||||||||||||
| 2018 | 2017 | 2016 | 2015 | |||||||||||||
| INSTITUTIONAL SHARES | ||||||||||||||||
| NET ASSET VALUE, Beginning of Period | $ | 10.11 | $ | 10.21 | $ | 10.06 | $ | 10.00 | ||||||||
| INVESTMENT OPERATIONS | ||||||||||||||||
| Net investment income (b) | 0.22 | 0.19 | 0.20 | 0.19 | ||||||||||||
| Net realized and unrealized gain (loss) | (0.11 | ) | (0.08 | ) | 0.15 | 0.07 | ||||||||||
| Total from Investment Operations | 0.11 | 0.11 | 0.35 | 0.26 | ||||||||||||
| Net investment income | (0.22 | ) | (0.19 | ) | (0.20 | ) | (0.20 | ) | ||||||||
| Net realized gain | (0.00 | )(c) | (0.02 | ) | – | – | ||||||||||
| Total Distributions to Shareholders | (0.22 | ) | (0.21 | ) | (0.20 | ) | (0.20 | ) | ||||||||
| NET ASSET VALUE, End of Period | $ | 10.00 | $ | 10.11 | $ | 10.21 | $ | 10.06 | ||||||||
| TOTAL RETURN | 1.17 | % | 1.11 | % | 3.49 | % | 2.55 | %(d) | ||||||||
| RATIOS/SUPPLEMENTARY DATA | ||||||||||||||||
| Net Assets at End of Period (000s omitted) | $ | 230,168 | $ | 188,876 | $ | 190,462 | $ | 162,465 | ||||||||
| Ratios to Average Net Assets: | ||||||||||||||||
| Net investment income | 2.23 | % | 1.92 | % | 1.94 | % | 2.09 | %(e) | ||||||||
| Net expenses | 0.60 | % | 0.60 | % | 0.60 | % | 0.60 | %(e) | ||||||||
| Gross expenses (f) | 0.65 | % | 0.63 | % | 0.65 | % | 0.79 | %(e) | ||||||||
| PORTFOLIO TURNOVER RATE | 59 | % | 44 | % | 58 | % | 83 | %(d) | ||||||||
| (a) | Commencement of operations. |
| (b) | Calculated based on average shares outstanding during each period. |
| (c) | Less than $0.01 per share. |
| (d) | Not annualized. |
| (e) | Annualized. |
| (f) | Reflects the expense ratio excluding any waivers and/or reimbursements. |
See Notes to Financial Statements.
GURTIN NATIONAL MUNICIPAL INTERMEDIATE VALUE FUND
PERFORMANCE CHART AND ANALYSIS (Unaudited)
SEPTEMBER 30, 2018
The following chart reflects the change in the value of a hypothetical $250,000 investment in Institutional Shares, including reinvested dividends and distributions, in Gurtin National Municipal Intermediate Value Fund (the “Fund”) compared with the performance of the benchmark, ICE Bank of America Merrill Lynch Municipal Blended 85% Index (“ICE BAML Muni Blended 85%”) and the ICE Bank of America Merrill Lynch 1-12 Year Municipal Index (“ICE BAML 1-12 Muni Index”), since inception. The ICE BAML Muni Blended 85% is a blend of 85% of the ICE Bank of America Merrill Lynch 3-15 Year US Municipal Securities Index, a subset of the ICE Bank of America Merrill Lynch US Municipal Securities Index including all securities with a remaining term to final maturity greater than or equal to three years and less than fifteen years, and 15% of the ICE Bank of America Merrill Lynch 1-3 Year US Municipal Securities Index, a subset of the ICE Bank of America Merrill Lynch US Municipal Securities Index including all securities with a remaining term to final maturity greater than or equal to one year and less than three years. ICE BAML 1-12 Year Muni is an unmanaged, market-weighted index that includes investment-grade municipal bonds with maturities greater than one year but less than twelve years. The total return of the indices includes the reinvestment of dividends and income. The total return of the Fund includes operating expenses that reduce returns, while the total return of the indices do not include expenses. The Fund is professionally managed, while the indices are unmanaged and are not available for investment.
Comparison of a $250,000 Investment
Gurtin National Municipal Intermediate Value Fund vs.
ICE Bank of America Merrill Lynch Municipal Blended 85% Index and ICE Bank of America Merrill Lynch 1-12 Year Municipal Index

|
Average Annual Total Returns Periods Ended September 30, 2018 |
One Year | Since Inception 12/01/15 |
| Gurtin National Municipal Intermediate Value Fund | -0.47% | 1.25% |
| ICE Bank of America Merrill Lynch Municipal Blended 85% Index | -0.25% | 1.52% |
| ICE Bank of America Merrill Lynch 1-12 Year Municipal Index | -0.26% | 1.25% |
Performance data quoted represents past performance and is no guarantee of future results. Current performance may be lower or higher than the performance data quoted. Investment return and principal value will fluctuate so that shares, when redeemed, may be worth more or less than original cost. As stated in the Fund’s prospectus, the annual operating expense ratio (gross) is 0.56%. However, the Fund’s adviser has contractually agreed to waive its fee and/or reimburse Fund expenses to limit Total Annual Fund Operating Expenses After Fee Waiver and/or Expense Reimbursement (excluding all taxes, interest, portfolio transaction expenses, proxy expenses and extraordinary expenses) to 0.39%, through February 1, 2019 (the “Expense Cap”). The adviser may be reimbursed by each Fund for fees waived and expenses reimbursed by the adviser pursuant to the Expense Cap if such payment is made within three years of the fee waiver or expense reimbursement, and does not cause the Total Annual Fund Operating Expenses After Fee Waiver and/or Expense Reimbursement to exceed the lesser of (i) the then-current expense cap, or (ii) the expense cap in place at the time the fees/expenses were waived/reimbursed. During the period, certain fees were waived and/ or expenses reimbursed; otherwise, returns would have been lower. The performance table and graph do not reflect the deduction of taxes that a shareholder would pay on Fund distributions or the redemption of Fund shares. Returns greater than one year are annualized. For the most recent month-end performance, please call (844) 342-5763.
The Fund’s very slight underperformance of the benchmark BAML Muni Blended 85% and the BAML 1-12 Muni Index during the period that ended September 30, 2018, was primarily attributable to the Fund’s slightly higher effective duration during a period that saw interest rates increase across the curve and to its significantly lower allocation to high-tax state bonds, which saw richening as a result of the Tax Cuts and Jobs Act of 2017 (TCJA). With a neutral view on the direction of interest rates, the Fund performed in line with expectations, given the increase in rates over the 12-month period. The tax legislation, in conjunction with a strong economy and consistent Fed tightening through continued rate hikes and balance sheet run-off, led to a rise in rates and volatility across the curve, with AAA MMD yields up nearly 100 basis points (bps) on the short-end to 35-55 bps throughout the long-end of the yield curve. Furthermore, the TCJA affected both the supply and demand dynamics of the municipal market through the elimination of tax-exempt advance refundings, which pulled a significant amount of supply forward, as
GURTIN NATIONAL MUNICIPAL INTERMEDIATE VALUE FUND
PERFORMANCE CHART AND ANALYSIS (Unaudited)
SEPTEMBER 30, 2018
well as the reduction in the corporate tax rate, which reduced demand from banks and insurance companies and increased supply as they sold municipal holdings. Moreover, rising interest rates prompted material retail mutual fund outflows toward the end of the 12-month period, adding to supply. Finally, the sharp reduction of the state and local tax (SALT) deduction caused spreads to tighten in high-tax states such as California and New York. This was the key driver of the Fund’s minimal underperformance relative to the benchmark, given that the Fund has less than 1% allocated to California and New York holdings, versus the benchmarks, which have approximately 35% in those states. Therefore, the Fund’s intermediate-term effective duration combined with the rise in rates, mainly in the first quarter of 2018, as well as the difference in state-level composition, resulted in overall price depreciation and lower performance. However, as municipal yields leveled off in the second quarter of 2018, the Fund generated positive performance, reflecting our ability to execute on opportunistic purchases of municipal bond structures and high quality credits that we believe were generally misunderstood and mispriced. Overall, the negative performance at the start of 2018 combined with primarily positive performance otherwise resulted in negative, albeit muted, performance for the 12-month period.
GURTIN NATIONAL MUNICIPAL INTERMEDIATE VALUE FUND
SCHEDULE OF INVESTMENTS
SEPTEMBER 30, 2018
| Principal | Security Description | Rate | Maturity | Value | ||||||||||
| Municipal Bonds - 98.0% | ||||||||||||||
| California - 1.4% | ||||||||||||||
| $ | 520,000 | Centinela Valley Union High School District, California GOB, Series B | 5.75 | % | 08/01/30 | $ | 610,132 | |||||||
| 1,070,000 | Solano County Community College District, California GOB (a)(b) | 1.39 | 08/01/29 | 957,885 | ||||||||||
| 670,000 | Tulare City School District, California COP | 2.00 | 11/01/20 | 669,451 | ||||||||||
| 2,237,468 | ||||||||||||||
| Connecticut - 13.4% | ||||||||||||||
| 1,625,000 | State of Connecticut, Connecticut GOB | 5.00 | 08/15/28 | 1,809,064 | ||||||||||
| 950,000 | State of Connecticut, Connecticut GOB, Series A | 5.00 | 03/15/28 | 1,040,848 | ||||||||||
| 600,000 | State of Connecticut, Connecticut GOB, Series B | 4.00 | 05/15/20 | 615,048 | ||||||||||
| 3,800,000 | State of Connecticut, Connecticut GOB, Series B | 4.00 | 05/15/25 | 3,996,156 | ||||||||||
| 1,000,000 | State of Connecticut, Connecticut GOB, Series E | 5.00 | 09/15/23 | 1,082,940 | ||||||||||
| 3,190,000 | State of Connecticut, Connecticut GOB, Series E | 4.00 | 09/15/28 | 3,274,471 | ||||||||||
| 195,000 | State of Connecticut, Connecticut GOB, Series F | 5.00 | 11/15/28 | 214,833 | ||||||||||
| 3,075,000 | State of Connecticut Special Tax Revenue, Connecticut RB | 5.00 | 01/01/26 | 3,466,355 | ||||||||||
| 2,325,000 | State of Connecticut Special Tax Revenue, Connecticut RB | 5.00 | 08/01/27 | 2,593,445 | ||||||||||
| 1,475,000 | State of Connecticut Special Tax Revenue, Connecticut RB | 5.00 | 01/01/28 | 1,685,999 | ||||||||||
| 2,200,000 | University of Connecticut, Connecticut RB, Series A | 5.00 | 03/15/30 | 2,420,858 | ||||||||||
| 22,200,017 | ||||||||||||||
| Illinois - 21.6% | ||||||||||||||
| 1,195,000 | Champaign County Community Unit School District No. 116 Urbana, Illinois GOB, Series A | 4.00 | 01/01/27 | 1,273,081 | ||||||||||
| 1,245,000 | Champaign County Community Unit School District No. 116 Urbana, Illinois GOB, Series A | 4.00 | 01/01/28 | 1,319,675 | ||||||||||
| 2,325,000 | Chicago Park District, Illinois GOB, Series A | 5.50 | 01/01/33 | 2,574,193 | ||||||||||
| 310,000 | Chicago Park District, Illinois GOB, Series A | 4.00 | 01/01/20 | 310,549 | ||||||||||
| 540,000 | Chicago Park District, Illinois GOB, Series A | 5.00 | 01/01/28 | 588,217 | ||||||||||
| 1,000,000 | Chicago Park District, Illinois GOB, Series B | 5.00 | 01/01/31 | 1,092,550 | ||||||||||
| 520,000 | Chicago Park District, Illinois GOB, Series B | 4.00 | 01/01/22 | 534,139 | ||||||||||
| 5,580,000 | Chicago Park District, Illinois GOB, Series B | 5.00 | 01/01/27 | 6,097,991 | ||||||||||
| 2,735,000 | Chicago Park District, Illinois GOB, Series B | 5.00 | 01/01/28 | 2,979,208 | ||||||||||
| 1,865,000 | Chicago Park District, Illinois GOB, Series C | 5.00 | 01/01/26 | 2,045,718 | ||||||||||
| 235,000 | Cook County Community Consolidated School District No. 15 Palatine, Illinois GOB | 5.00 | 12/01/23 | 262,321 | ||||||||||
| 725,000 | Cook County Community High School District No. 218 Oak Lawn, Illinois GOB | 5.00 | 12/01/20 | 761,830 | ||||||||||
| 1,190,000 | Cook County Community High School District No. 218 Oak Lawn, Illinois GOB | 5.00 | 12/01/22 | 1,295,601 | ||||||||||
| 1,140,000 | Cook County Community High School District No. 218 Oak Lawn, Illinois GOB | 5.00 | 12/01/23 | 1,260,920 | ||||||||||
| 635,000 | Cook County Community High School District No. 218 Oak Lawn, Illinois GOB | 4.25 | 12/01/24 | 679,596 | ||||||||||
| 645,000 | Cook County Community High School District No. 218 Oak Lawn, Illinois GOB | 4.00 | 12/01/24 | 684,764 | ||||||||||
| 1,125,000 | Cook County High School District No. 209 Proviso Township, Illinois GOB | 5.00 | 12/01/27 | 1,268,573 | ||||||||||
| 1,020,000 | Cook County School District No. 111 Burbank, Illinois GOB | 4.00 | 12/01/30 | 1,047,877 | ||||||||||
| 440,000 | Cook County School District No. 111 Burbank, Illinois GOB | 4.00 | 12/01/23 | 464,556 | ||||||||||
| 95,000 | Cook County School District No. 111 Burbank, Illinois GOB | 4.00 | 12/01/23 | 102,819 | ||||||||||
| 1,000,000 | Cook County School District No. 111 Burbank, Illinois GOB | 4.00 | 12/01/25 | 1,059,370 | ||||||||||
| 725,000 | Cook County School District No. 111 Burbank, Illinois GOB | 4.00 | 12/01/29 | 747,402 | ||||||||||
| 240,000 | Cook County School District No. 29 Sunset Ridge, Illinois RB, Series A | 3.00 | 12/01/20 | 243,574 | ||||||||||
| 825,000 | Du Page County School District No. 33 West Chicago, Illinois GOB, Series B | 4.00 | 12/01/26 | 870,639 | ||||||||||
| 500,000 | Illinois Finance Authority, Illinois RB | 5.00 | 11/15/25 | 542,705 | ||||||||||
| 4,560,000 | University of Illinois, Illinois RB | 5.00 | 04/01/26 | 4,845,137 | ||||||||||
| 700,000 | University of Illinois, Illinois RB, Series A | 5.00 | 04/01/30 | 764,799 | ||||||||||
| 35,717,804 | ||||||||||||||
| Iowa - 1.6% | ||||||||||||||
| 1,220,000 | Waukee Community School District, Iowa RB, Series A | 4.00 | 06/01/24 | 1,310,707 | ||||||||||
| 1,270,000 | Waukee Community School District, Iowa RB, Series A | 4.00 | 06/01/25 | 1,369,238 | ||||||||||
| 2,679,945 | ||||||||||||||
See Notes to Financial Statements.
GURTIN NATIONAL MUNICIPAL INTERMEDIATE VALUE FUND
SCHEDULE OF INVESTMENTS
SEPTEMBER 30, 2018
| Principal | Security Description | Rate | Maturity | Value | ||||||||||
| Kentucky - 6.3% | ||||||||||||||
| $ | 300,000 | Boone County School District Finance Corp., Kentucky RB | 3.00 | % | 04/01/25 | $ | 302,829 | |||||||
| 400,000 | Corbin Independent School District Finance Corp., Kentucky RB | 2.00 | 02/01/22 | 391,856 | ||||||||||
| 425,000 | Corbin Independent School District Finance Corp., Kentucky RB | 3.00 | 02/01/25 | 431,371 | ||||||||||
| 630,000 | Corbin Independent School District Finance Corp., Kentucky RB | 3.00 | 02/01/26 | 637,031 | ||||||||||
| 420,000 | Grant County School District Finance Corp., Kentucky RB | 3.00 | 04/01/24 | 423,826 | ||||||||||
| 1,945,000 | Jefferson County School District Finance Corp., Kentucky RB, Series A | 5.00 | 08/01/27 | 2,254,644 | ||||||||||
| 1,000,000 | Jefferson County School District Finance Corp., Kentucky RB, Series A | 5.00 | 08/01/28 | 1,155,190 | ||||||||||
| 280,000 | Kenton County School District Finance Corp., Kentucky RB | 3.00 | 02/01/26 | 280,176 | ||||||||||
| 775,000 | Madison County School District Finance Corp., Kentucky RB | 5.00 | 05/01/22 | 842,890 | ||||||||||
| 630,000 | Madison County School District Finance Corp., Kentucky RB | 5.00 | 05/01/23 | 698,040 | ||||||||||
| 1,040,000 | Meade County School District Finance Corp., Kentucky RB | 5.00 | 09/01/20 | 1,095,869 | ||||||||||
| 1,270,000 | Owen County School District Finance Corp., Kentucky RB | 4.00 | 04/01/26 | 1,352,944 | ||||||||||
| 475,000 | Owensboro Independent School District Finance Corp., Kentucky RB | 4.00 | 09/01/20 | 491,653 | ||||||||||
| 10,358,319 | ||||||||||||||
| Louisiana - 12.8% | ||||||||||||||
| 1,750,000 | Louisiana Local Government Environmental Facilities & Community Development Authority, Louisiana RB | 5.00 | 10/01/21 | 1,888,723 | ||||||||||
| 1,000,000 | Louisiana Local Government Environmental Facilities & Community Development Authority, Louisiana RB | 5.00 | 10/01/21 | 1,074,760 | ||||||||||
| 1,200,000 | Louisiana Local Government Environmental Facilities & Community Development Authority, Louisiana RB | 5.00 | 10/01/22 | 1,318,728 | ||||||||||
| 2,075,000 | Louisiana Local Government Environmental Facilities & Community Development Authority, Louisiana RB | 5.00 | 10/01/24 | 2,335,164 | ||||||||||
| 2,550,000 | Louisiana Local Government Environmental Facilities & Community Development Authority, Louisiana RB | 5.00 | 10/01/27 | 2,975,799 | ||||||||||
| 2,250,000 | Louisiana Local Government Environmental Facilities & Community Development Authority, Louisiana RB | 5.00 | 10/01/27 | 2,625,705 | ||||||||||
| 1,265,000 | Louisiana Public Facilities Authority, Louisiana RB | 5.00 | 06/01/22 | 1,382,923 | ||||||||||
| 1,080,000 | St Martin Parish School Board, Louisiana GOB | 5.00 | 03/01/28 | 1,234,364 | ||||||||||
| 1,650,000 | State of Louisiana, Louisiana GOB, Series A | 5.00 | 08/01/21 | 1,778,419 | ||||||||||
| 3,920,000 | State of Louisiana, Louisiana GOB, Series B | 5.00 | 08/01/29 | 4,480,991 | ||||||||||
| 21,095,576 | ||||||||||||||
| Michigan - 5.1% | ||||||||||||||
| 175,000 | Battle Creek School District, Michigan GOB | 5.00 | 05/01/28 | 200,485 | ||||||||||
| 1,065,000 | Bellevue Community Schools, Michigan GOB, Series A | 5.00 | 05/01/31 | 1,203,045 | ||||||||||
| 350,000 | Central Michigan University, Michigan RB | 5.00 | 10/01/24 | 396,368 | ||||||||||
| 225,000 | Charles Stewart Mott Community College, Michigan GOB | 3.00 | 05/01/24 | 229,410 | ||||||||||
| 1,215,000 | Durand Area Schools, Michigan GOB | 5.00 | 05/01/28 | 1,366,827 | ||||||||||
| 1,225,000 | Durand Area Schools, Michigan GOB | 5.00 | 05/01/29 | 1,372,625 | ||||||||||
| 500,000 | Howell Public Schools, Michigan GOB, Series B | 5.00 | 05/01/25 | 533,885 | ||||||||||
| 695,000 | L'Anse Creuse Public Schools, Michigan GOB | 5.00 | 05/01/25 | 794,823 | ||||||||||
| 210,000 | Lansing School District, Michigan GOB | 5.00 | 05/01/21 | 224,778 | ||||||||||
| 785,000 | Oakland University, Michigan RB | 5.00 | 03/01/29 | 886,979 | ||||||||||
| 920,000 | Paw Paw Public Schools, Michigan GOB | 5.00 | 05/01/21 | 957,968 | ||||||||||
| 200,000 | Rockford Public Schools, Michigan GOB | 5.00 | 05/01/22 | 218,166 | ||||||||||
| 8,385,359 | ||||||||||||||
| Missouri - 1.6% | ||||||||||||||
| 1,095,000 | City of Springfield, Missouri RB, Series B | 2.00 | 05/01/22 | 1,072,257 | ||||||||||
| 1,250,000 | City of Springfield, Missouri RB, Series B | 3.00 | 05/01/23 | 1,280,150 | ||||||||||
| 300,000 | Missouri Joint Municipal Electric Utility Commission, Missouri RB, Series A | 5.00 | 01/01/24 | 336,813 | ||||||||||
| 2,689,220 | ||||||||||||||
| New Jersey - 3.3% | ||||||||||||||
| 1,000,000 | Essex County Improvement Authority, New Jersey RB | 4.75 | 11/01/32 | 1,001,810 | ||||||||||
| 1,035,000 | Haddonfield Public Schools District, New Jersey GOB | 2.00 | 09/01/20 | 1,034,607 | ||||||||||
| 1,000,000 | Robbinsville Board of Education, New Jersey GOB | 5.25 | 01/01/23 | 1,105,870 | ||||||||||
| 1,020,000 | Township of Berkeley, New Jersey GOB | 3.00 | 05/15/22 | 1,048,580 | ||||||||||
| 1,145,000 | Township of Berkeley, New Jersey GOB | 3.00 | 05/15/23 | 1,181,445 | ||||||||||
| 5,372,312 | ||||||||||||||
See Notes to Financial Statements.
GURTIN NATIONAL MUNICIPAL INTERMEDIATE VALUE FUND
SCHEDULE OF INVESTMENTS
SEPTEMBER 30, 2018
| Principal | Security Description | Rate | Maturity | Value | ||||||||||
| New York - 1.1% | ||||||||||||||
| $ | 215,000 | Metropolitan Transportation Authority, New York RB | 5.00 | % | 11/15/30 | $ | 239,927 | |||||||
| 185,000 | Metropolitan Transportation Authority, New York RB | 5.00 | 11/15/30 | 200,951 | ||||||||||
| 1,330,000 | New York State Dormitory Authority, New York RB | 5.00 | 07/01/30 | 1,457,680 | ||||||||||
| 1,898,558 | ||||||||||||||
| Ohio - 1.1% | ||||||||||||||
| 1,100,000 | County of Hamilton Sales Tax Revenue, Ohio RB, Series A | 5.00 | 12/01/30 | 1,182,775 | ||||||||||
| 200,000 | Trotwood-Madison City School District, Ohio COP | 4.00 | 12/01/23 | 214,142 | ||||||||||
| 200,000 | Trotwood-Madison City School District, Ohio COP | 4.00 | 12/01/24 | 215,374 | ||||||||||
| 215,000 | Trotwood-Madison City School District, Ohio COP | 4.00 | 12/01/25 | 232,505 | ||||||||||
| 1,844,796 | ||||||||||||||
| Oklahoma - 1.1% | ||||||||||||||
| 1,800,000 | Cleveland County Independent School District No. 2 Moore, Oklahoma GOB | 2.75 | 03/01/21 | 1,822,284 | ||||||||||
| Pennsylvania - 14.4% | ||||||||||||||
| 1,020,000 | Cameron County School District, Pennsylvania GOB | 3.00 | 09/01/20 | 1,033,852 | ||||||||||
| 1,060,000 | Cameron County School District, Pennsylvania GOB | 3.00 | 09/01/21 | 1,071,808 | ||||||||||
| 1,025,000 | Cameron County School District, Pennsylvania GOB | 2.00 | 09/01/22 | 987,772 | ||||||||||
| 1,095,000 | Commonwealth Financing Authority, Pennsylvania RB | 5.00 | 06/01/28 | 1,255,724 | ||||||||||
| 1,500,000 | Commonwealth Financing Authority, Pennsylvania RB, Series B-1 | 5.00 | 06/01/25 | 1,705,140 | ||||||||||
| 1,555,000 | Commonwealth of Pennsylvania, Pennsylvania GOB, First Series | 5.00 | 03/15/24 | 1,741,895 | ||||||||||
| 300,000 | Commonwealth of Pennsylvania, Pennsylvania GOB, First Series | 5.00 | 04/01/26 | 336,054 | ||||||||||
| 1,125,000 | Commonwealth of Pennsylvania, Pennsylvania GOB, First Series | 5.00 | 09/15/26 | 1,294,290 | ||||||||||
| 1,825,000 | Commonwealth of Pennsylvania, Pennsylvania GOB, First Series | 5.00 | 03/15/27 | 2,049,037 | ||||||||||
| 700,000 | Commonwealth of Pennsylvania, Pennsylvania GOB, First Series | 5.00 | 06/01/28 | 771,211 | ||||||||||
| 2,000,000 | Commonwealth of Pennsylvania, Pennsylvania GOB, Second Series | 5.00 | 08/15/31 | 2,233,420 | ||||||||||
| 600,000 | Commonwealth of Pennsylvania, Pennsylvania GOB, Second Series | 5.00 | 10/15/23 | 669,354 | ||||||||||
| 365,000 | Deer Lakes School District, Pennsylvania GOB | 2.63 | 04/01/25 | 359,948 | ||||||||||
| 1,460,000 | East Stroudsburg Area School District, Pennsylvania GOB | 2.00 | 09/01/21 | 1,437,910 | ||||||||||
| 615,000 | Erie Parking Authority, Pennsylvania RB | 4.00 | 09/01/21 | 638,647 | ||||||||||
| 425,000 | Northern Tioga School District, Pennsylvania GOB | 2.00 | 04/01/21 | 423,870 | ||||||||||
| 1,320,000 | Northern York County School District, Pennsylvania GOB | 5.00 | 11/15/29 | 1,436,345 | ||||||||||
| 200,000 | Pennsylvania Turnpike Commission, Pennsylvania RB, Series B | 5.00 | 12/01/25 | 229,352 | ||||||||||
| 680,000 | South Middleton School District, Pennsylvania GOB | 3.00 | 09/01/26 | 682,740 | ||||||||||
| 525,000 | The Hospitals & Higher Education Facilities Authority of Philadelphia, Pennsylvania RB, Series D | 5.00 | 07/01/32 | 560,627 | ||||||||||
| 1,300,000 | The Hospitals & Higher Education Facilities Authority of Philadelphia, Pennsylvania RB, Series D | 5.00 | 07/01/28 | 1,392,521 | ||||||||||
| 430,000 | Wyalusing Area School District, Pennsylvania GOB | 2.00 | 04/01/21 | 423,615 | ||||||||||
| 1,120,000 | York Suburban School District, Pennsylvania GOB | 2.25 | 05/01/23 | 1,120,022 | ||||||||||
| 23,855,154 | ||||||||||||||
| Rhode Island - 0.6% | ||||||||||||||
| 900,000 | Rhode Island Health & Educational Building Corp., Rhode Island RB, Series A | 5.00 | 09/15/30 | 1,015,632 | ||||||||||
| Texas - 10.7% | ||||||||||||||
| 845,000 | Brazoria-Fort Bend County Municipal Utility District No. 1, Texas GOB | 3.00 | 09/01/23 | 853,467 | ||||||||||
| 1,600,000 | City of Fort Worth, Texas RB, Series A | 5.00 | 03/01/31 | 1,774,016 | ||||||||||
| 150,000 | City of Houston, Texas GOB | 5.00 | 03/01/24 | 163,583 | ||||||||||
| 150,000 | City of Houston, Texas GOB | 5.00 | 03/01/24 | 163,376 | ||||||||||
| 295,000 | City of League City, Texas GOB, Series B | 5.00 | 02/15/30 | 313,048 | ||||||||||
| 500,000 | Dallas/Fort Worth International Airport, Texas RB | 5.25 | 11/01/27 | 552,885 | ||||||||||
| 1,245,000 | Denton County Fresh Water Supply District No. 10, Texas GOB | 3.00 | 09/01/24 | 1,261,185 | ||||||||||
| 1,750,000 | Fort Bend County Levee Improvement District No. 15, Texas GOB, Series PK | 1.50 | 09/01/21 | 1,689,345 | ||||||||||
| 1,310,000 | Harris County Municipal Utility District No. 153, Texas GOB | 2.00 | 09/01/20 | 1,302,638 | ||||||||||
| 750,000 | Harris County Municipal Utility District No. 290, Texas GOB | 2.00 | 09/01/21 | 734,978 | ||||||||||
| 200,000 | Harris County Municipal Utility District No. 383, Texas GOB | 2.00 | 09/01/20 | 198,486 | ||||||||||
| 235,000 | Harris County Municipal Utility District No. 383, Texas GOB | 2.00 | 09/01/21 | 230,866 | ||||||||||
| 235,000 | Harris County Municipal Utility District No. 383, Texas GOB | 3.00 | 09/01/24 | 237,679 | ||||||||||
| 235,000 | Harris County Municipal Utility District No. 383, Texas GOB | 3.00 | 09/01/25 | 235,959 | ||||||||||
| 870,000 | Harris Montgomery Counties Municipal Utility District No. 386, Texas GOB | 3.00 | 09/01/26 | 879,213 | ||||||||||
See Notes to Financial Statements.
GURTIN NATIONAL MUNICIPAL INTERMEDIATE VALUE FUND
SCHEDULE OF INVESTMENTS
SEPTEMBER 30, 2018
| Principal | Security Description | Rate | Maturity | Value | ||||||||||
| Texas - 10.7% (continued) | ||||||||||||||
| $ | 860,000 | Harris Montgomery Counties Municipal Utility District No. 386, Texas GOB | 3.00 | % | 09/01/27 | $ | 860,516 | |||||||
| 1,055,000 | Harris Montgomery Counties Municipal Utility District No. 386, Texas GOB | 3.00 | 09/01/28 | 1,046,929 | ||||||||||
| 275,000 | Lower Colorado River Authority, Texas RB | 5.00 | 05/15/30 | 286,283 | ||||||||||
| 900,000 | Lower Colorado River Authority, Texas RB | 5.00 | 05/15/27 | 976,725 | ||||||||||
| 330,000 | Reagan County Independent School District, Texas GOB | 3.00 | 02/15/23 | 330,224 | ||||||||||
| 2,750,000 | Tarrant County Cultural Education Facilities Finance Corp., Texas RB | 5.00 | 08/15/33 | 2,999,975 | ||||||||||
| 590,000 | Travis County Water Control & Improvement District No. 17, Texas GOB | 3.00 | 11/01/25 | 596,938 | ||||||||||
| 17,688,314 | ||||||||||||||
| Vermont - 0.1% | ||||||||||||||
| 165,000 | Vermont Housing Finance Agency, Vermont RB, Series B | 1.95 | 05/01/23 | 161,375 | ||||||||||
| Washington - 0.3% | ||||||||||||||
| 395,000 | Grant County Public Utility District No. 2, Washington RB, Series B | 5.00 | 01/01/26 | 447,195 | ||||||||||
| West Virginia - 0.4% | ||||||||||||||
| 560,000 | West Virginia Economic Development Authority, West Virginia RB, Series A | 5.00 | 06/01/26 | 607,886 | ||||||||||
| Wisconsin - 1.1% | ||||||||||||||
| 1,500,000 | Wisconsin Health & Educational Facilities Authority, Wisconsin RB | 5.00 | 04/01/27 | 1,746,780 | ||||||||||
| Total Municipal Bonds (Cost $165,515,662) | 161,823,994 | |||||||||||||
| Shares | Security Description | Value | ||||||
| Money Market Fund - 0.2% | ||||||||
| 287,863 |
Fidelity Investments Money Market Government Portfolio, Class I, 1.96% (c) (Cost $287,863) |
287,863 | ||||||
| Investments, at value - 98.2% (Cost $165,803,525) | $ | 162,111,857 | ||||||
| Other Assets & Liabilities, Net - 1.8% | 2,931,335 | |||||||
| Net Assets - 100.0% | $ | 165,043,192 | ||||||
| COP | Certificate of Participation |
| GOB | General Obligation Bond |
| RB | Revenue Bond |
| (a) | Debt obligation initially issued at one coupon rate which converts to higher coupon rate at a specified date. Rate presented is as of September 30, 2018. |
| (b) | Zero coupon bond. Interest rate presented is yield to maturity. |
| (c) | Dividend yield changes daily to reflect current market conditions. Rate was the quoted yield as of September 30, 2018. |
The following is a summary of the inputs used to value the Fund's investments as of September 30, 2018.
The inputs or methodology used for valuing securities are not necessarily an indication of the risks associated with investing in those securities. For more information on valuation inputs, and their aggregation into the levels used in the table below, please refer to the Security Valuation section in Note 2 of the accompanying Notes to Financial Statements.
| Valuation Inputs | Investments in Securities | |||
| Level 1 - Quoted Prices | $ | – | ||
| Level 2 - Other Significant Observable Inputs | 162,111,857 | |||
| Level 3 - Significant Unobservable Inputs | – | |||
| Total | $ | 162,111,857 | ||
The Level 2 value displayed in this table includes Municipal Bonds and a Money Market Fund. Refer to this Schedule of Investments for a further breakout of each Municipal Bond security by state.
The Fund utilizes the end of period methodology when determining transfers. There were no transfers among Level 1, Level 2 and Level 3 for the year ended September 30, 2018.
See Notes to Financial Statements.
GURTIN NATIONAL MUNICIPAL INTERMEDIATE VALUE FUND
SCHEDULE OF INVESTMENTS
SEPTEMBER 30, 2018
| PORTFOLIO HOLDINGS (Unaudited) | ||||
| % of Total Investments | ||||
| Municipal Bonds | 99.8 | % | ||
| Money Market Fund | 0.2 | % | ||
| 100.0 | % | |||
See Notes to Financial Statements.
GURTIN NATIONAL MUNICIPAL INTERMEDIATE VALUE FUND
STATEMENT OF ASSETS AND LIABILITIES
SEPTEMBER 30, 2018
| ASSETS | ||||
| Investments, at value (Cost $165,803,525) | $ | 162,111,857 | ||
| Receivables: | ||||
| Fund shares sold | 1,385,980 | |||
| Dividends and interest | 1,786,634 | |||
| Prepaid expenses | 16,241 | |||
| Total Assets | 165,300,712 | |||
| LIABILITIES | ||||
| Payables: | ||||
| Fund shares redeemed | 156,861 | |||
| Distributions payable | 22,167 | |||
| Accrued Liabilities: | ||||
| Investment adviser fees | 36,519 | |||
| Fund services fees | 9,215 | |||
| Other expenses | 32,758 | |||
| Total Liabilities | 257,520 | |||
| NET ASSETS | $ | 165,043,192 | ||
| COMPONENTS OF NET ASSETS | ||||
| Paid-in capital | $ | 169,909,596 | ||
| Undistributed net investment income | 1 | |||
| Accumulated net realized loss | (1,174,737 | ) | ||
| Net unrealized depreciation | (3,691,668 | ) | ||
| NET ASSETS | $ | 165,043,192 | ||
| SHARES OF BENEFICIAL INTEREST AT NO PAR VALUE (UNLIMITED SHARES AUTHORIZED) | ||||
| Institutional Shares | 16,657,946 | |||
| NET ASSET VALUE, OFFERING AND REDEMPTION PRICE PER SHARE | ||||
| Institutional Shares (based on net assets of $165,043,192) | $ | 9.91 | ||
See Notes to Financial Statements.
GURTIN NATIONAL MUNICIPAL INTERMEDIATE VALUE FUND
STATEMENT OF OPERATIONS
YEAR ENDED SEPTEMBER 30, 2018
| INVESTMENT INCOME | ||||
| Dividend income | $ | 56,506 | ||
| Interest income | 4,562,356 | |||
| Total Investment Income | 4,618,862 | |||
| EXPENSES | ||||
| Investment adviser fees | 731,656 | |||
| Fund services fees | 223,208 | |||
| Custodian fees | 21,317 | |||
| Registration fees | 19,400 | |||
| Professional fees | 35,238 | |||
| Trustees' fees and expenses | 9,692 | |||
| Other expenses | 90,218 | |||
| Total Expenses | 1,130,729 | |||
| Fees waived | (315,401 | ) | ||
| Net Expenses | 815,328 | |||
| NET INVESTMENT INCOME | 3,803,534 | |||
| NET REALIZED AND UNREALIZED GAIN (LOSS) | ||||
| Net realized loss on investments | (875,583 | ) | ||
| Net change in unrealized appreciation (depreciation) on investments | (4,118,701 | ) | ||
| NET REALIZED AND UNREALIZED LOSS | (4,994,284 | ) | ||
| DECREASE IN NET ASSETS RESULTING FROM OPERATIONS | $ | (1,190,750 | ) | |
See Notes to Financial Statements.
GURTIN NATIONAL MUNICIPAL INTERMEDIATE VALUE FUND
STATEMENTS OF CHANGES IN NET ASSETS
| For the Years Ended September 30, | ||||||||
| 2018 | 2017 | |||||||
| OPERATIONS | ||||||||
| Net investment income | $ | 3,803,534 | $ | 2,678,204 | ||||
| Net realized loss | (875,583 | ) | (299,100 | ) | ||||
| Net change in unrealized appreciation (depreciation) | (4,118,701 | ) | (852,987 | ) | ||||
| Increase (Decrease) in Net Assets Resulting from Operations | (1,190,750 | ) | 1,526,117 | |||||
| DISTRIBUTIONS TO SHAREHOLDERS FROM | ||||||||
| Net investment income: | ||||||||
| Institutional Shares | (3,803,862 | ) | (2,677,851 | ) | ||||
| Net realized gain: | ||||||||
| Institutional Shares | – | (33,868 | ) | |||||
| Total Distributions to Shareholders | (3,803,862 | ) | (2,711,719 | ) | ||||
| CAPITAL SHARE TRANSACTIONS | ||||||||
| Sale of shares: | ||||||||
| Institutional Shares | 59,251,562 | 81,814,975 | ||||||
| Reinvestment of distributions: | ||||||||
| Institutional Shares | 3,560,124 | 2,507,750 | ||||||
| Redemption of shares: | ||||||||
| Institutional Shares | (107,623,933 | ) | (18,101,575 | ) | ||||
| Increase (Decrease) in Net Assets from Capital Share Transactions | (44,812,247 | ) | 66,221,150 | |||||
| Increase (Decrease) in Net Assets | (49,806,859 | ) | 65,035,548 | |||||
| NET ASSETS | ||||||||
| Beginning of Year | 214,850,051 | 149,814,503 | ||||||
| End of Year (Including line (a)) | $ | 165,043,192 | $ | 214,850,051 | ||||
| SHARE TRANSACTIONS | ||||||||
| Sale of shares: | ||||||||
| Institutional Shares | 5,929,529 | 8,142,102 | ||||||
| Reinvestment of distributions: | ||||||||
| Institutional Shares | 356,721 | 249,836 | ||||||
| Redemption of shares: | ||||||||
| Institutional Shares | (10,814,817 | ) | (1,809,539 | ) | ||||
| Increase (Decrease) in Shares | (4,528,567 | ) | 6,582,399 | |||||
| (a) Undistributed net investment income | $ | 1 | $ | 329 | ||||
See Notes to Financial Statements.
GURTIN NATIONAL MUNICIPAL INTERMEDIATE VALUE FUND
FINANCIAL HIGHLIGHTS
These financial highlights reflect selected data for a share outstanding throughout each period.
| For the Years Ended September 30, |
December 1, 2015 (a) Through September 30, |
|||||||||||
| 2018 | 2017 | 2016 | ||||||||||
| INSTITUTIONAL SHARES | ||||||||||||
| NET ASSET VALUE, Beginning of Period | $ | 10.14 | $ | 10.26 | $ | 10.00 | ||||||
| INVESTMENT OPERATIONS | ||||||||||||
| Net investment income (b) | 0.18 | 0.16 | 0.10 | |||||||||
| Net realized and unrealized gain (loss) | (0.23 | ) | (0.12 | ) | 0.26 | |||||||
| Total from Investment Operations | (0.05 | ) | 0.04 | 0.36 | ||||||||
| DISTRIBUTIONS TO SHAREHOLDERS FROM | ||||||||||||
| Net investment income | (0.18 | ) | (0.16 | ) | (0.10 | ) | ||||||
| Net realized gain | – | (0.00 | )(c) | – | ||||||||
| Total Distributions to Shareholders | (0.18 | ) | (0.16 | ) | (0.10 | ) | ||||||
| NET ASSET VALUE, End of Period | $ | 9.91 | $ | 10.14 | $ | 10.26 | ||||||
| TOTAL RETURN | (0.47 | )% | 0.42 | % | 3.63 | %(d) | ||||||
| RATIOS/SUPPLEMENTARY DATA | ||||||||||||
| Net Assets at End of Period (000s omitted) | $ | 165,043 | $ | 214,850 | $ | 149,815 | ||||||
| Ratios to Average Net Assets: | ||||||||||||
| Net investment income | 1.82 | % | 1.58 | % | 1.24 | %(e) | ||||||
| Net expenses | 0.39 | % | 0.39 | % | 0.39 | %(e) | ||||||
| Gross expenses (f) | 0.54 | % | 0.56 | % | 0.66 | %(e) | ||||||
| PORTFOLIO TURNOVER RATE | 15 | % | 9 | % | 9 | %(d) | ||||||
| (a) | Commencement of operations. |
| (b) | Calculated based on average shares outstanding during each period. |
| (c) | Less than $0.01 per share. |
| (d) | Not annualized. |
| (e) | Annualized. |
| (f) | Reflects the expense ratio excluding any waivers and/or reimbursements. |
See Notes to Financial Statements.
GURTIN CALIFORNIA MUNICIPAL INTERMEDIATE VALUE FUND
PERFORMANCE CHART AND ANALYSIS (Unaudited)
SEPTEMBER 30, 2018
The following chart reflects the change in the value of a hypothetical $250,000 investment in Institutional Shares, including reinvested dividends and distributions, in Gurtin California Municipal Intermediate Value Fund (the “Fund”) compared with the performance of the benchmark, ICE Bank of America Merrill Lynch Municipal Blended 85% Index (“ICE BAML Muni Blended 85%”) and the ICE Bank of America Merrill Lynch 1-12 Year Municipal Index (“ICE BAML 1-12 Muni Index”), since inception. The ICE BAML Muni Blended 85% is a blend of 85% of the ICE Bank of America Merrill Lynch 3-15 Year US Municipal Securities Index, a subset of the ICE Bank of America Merrill Lynch US Municipal Securities Index including all securities with a remaining term to final maturity greater than or equal to three years and less than fifteen years, and 15% of the ICE Bank of America Merrill Lynch 1-3 Year US Municipal Securities Index, a subset of the ICE Bank of America Merrill Lynch US Municipal Securities Index including all securities with a remaining term to final maturity greater than or equal to one year and less than three years. ICE BAML 1-12 Year Muni is an unmanaged, market-weighted index that includes investment-grade municipal bonds with maturities greater than one year but less than twelve years. The total return of the indices include the reinvestment of dividends and income. The total return of the Fund includes operating expenses that reduce returns, while the total return of the indices do not include expenses. The Fund is professionally managed, while the indices are unmanaged and are not available for investment.
Comparison of a $250,000 Investment
Gurtin California Municipal Intermediate Value Fund vs.
ICE Bank of America Merrill Lynch Municipal Blended 85% Index and ICE Bank of America Merrill Lynch 1-12 Year Municipal Index

|
Average Annual Total Returns Periods Ended September 30, 2018 |
One Year | Since Inception 12/07/15 |
| Gurtin California Municipal Intermediate Value Fund | -0.17% | 1.37% |
| ICE Bank of America Merrill Lynch Municipal Blended 85% Index | -0.25% | 1.53% |
| ICE Bank of America Merrill Lynch 1-12 Year Municipal Index | -0.26% | 1.27% |
Performance data quoted represents past performance and is no guarantee of future results. Current performance may be lower or higher than the performance data quoted. Investment return and principal value will fluctuate so that shares, when redeemed, may be worth more or less than original cost. As stated in the Fund’s prospectus, the annual operating expense ratio (gross) is 0.63%. However, the Fund’s adviser has contractually agreed to waive its fee and/or reimburse Fund expenses to limit Total Annual Fund Operating Expenses After Fee Waiver and/or Expense Reimbursement (excluding all taxes, interest, portfolio transaction expenses, proxy expenses and extraordinary expenses) to 0.39%, through February 1, 2019 (the “Expense Cap”). The adviser may be reimbursed by each Fund for fees waived and expenses reimbursed by the adviser pursuant to the Expense Cap if such payment is made within three years of the fee waiver or expense reimbursement, and does not cause the Total Annual Fund Operating Expenses After Fee Waiver and/or Expense Reimbursement to exceed the lesser of (i) the then-current expense cap, or (ii) the expense cap in place at the time the fees/expenses were waived/reimbursed. During the period, certain fees were waived and/ or expenses reimbursed; otherwise, returns would have been lower. The performance table and graph do not reflect the deduction of taxes that a shareholder would pay on Fund distributions or the redemption of Fund shares. Returns greater than one year are annualized. For the most recent month-end performance, please call (844) 342-5763.
The Fund’s outperformance of the benchmark BAML Muni Blended 85% and the BAML 1-12 Muni Index during the period that ended September 30, 2018, was primarily attributable to the Fund’s relatively similar effective duration during a period that saw interest rates increase across the curve and to its significantly higher allocation to California bonds, which saw richening as a result of the Tax Cuts and Jobs Act of 2017 (TCJA). With a neutral view on the direction of interest rates, the Fund performed in line with expectations, given the increase in rates over the 12-month period. The tax legislation, in conjunction with a strong economy and consistent Fed tightening through continued rate hikes and balance sheet run-off, led to a rise in rates and volatility across the curve, with AAA MMD yields up nearly 100 basis points (bps) on the short-end to 35-55 bps throughout the long-end of the yield curve. Furthermore, the TCJA affected both the supply and demand dynamics of the municipal market through the elimination of tax-exempt advance refundings, which pulled a significant amount of supply forward, as well as the
GURTIN CALIFORNIA MUNICIPAL INTERMEDIATE VALUE FUND
PERFORMANCE CHART AND ANALYSIS (Unaudited)
SEPTEMBER 30, 2018
reduction in the corporate tax rate, which reduced demand from banks and insurance companies and increased supply as they sold municipal holdings. Moreover, rising interest rates prompted material retail mutual fund outflows toward the end of the 12-month period, adding to supply. Finally, the sharp reduction of the state and local tax (SALT) deduction caused spreads to tighten in high-tax states such as California and New York. Since the Fund is comprised almost entirely of California bonds, versus the benchmarks, which only have approximately 35% in high-tax state (California and New York) holdings, this led to additional outperformance in the Fund. Therefore, while the Fund’s intermediate-term effective duration combined with the rise in rates, mainly in the first quarter of 2018, resulted in overall price depreciation and lower performance, the significant difference in state-level composition buoyed performance. In addition, as municipal yields leveled off in the second quarter of 2018, the Fund generated positive performance, reflecting our ability to execute on opportunistic purchases of municipal bond structures and high-quality credits that we believe were generally misunderstood and mispriced. Overall, the negative performance at the start of 2018 combined with primarily positive performance otherwise resulted in negative, albeit muted, performance for the 12-month period.
GURTIN CALIFORNIA MUNICIPAL INTERMEDIATE VALUE FUND
SCHEDULE OF INVESTMENTS
SEPTEMBER 30, 2018
| Principal | Security Description | Rate | Maturity | Value | ||||||||||
| Municipal Bonds - 96.9% | ||||||||||||||
| California - 88.4% | ||||||||||||||
| $ | 715,000 | Baldwin Park Unified School District, California GOB | 4.00 | % | 08/01/22 | $ | 764,185 | |||||||
| 1,035,000 | California Health Facilities Financing Authority, California RB | 5.00 | 10/01/33 | 1,138,231 | ||||||||||
| 845,000 | California State Public Works Board, California RB | 5.00 | 05/01/28 | 1,015,200 | ||||||||||
| 750,000 | California State Public Works Board, California RB, Series D | 5.00 | 06/01/25 | 872,918 | ||||||||||
| 650,000 | California Statewide Communities Development Authority, California RB | 4.00 | 11/01/22 | 699,101 | ||||||||||
| 200,000 | California Statewide Communities Development Authority, California RB | 5.00 | 11/15/23 | 224,392 | ||||||||||
| 710,000 | Capistrano Unified School District Community Facilities District No. 90-2, California Special Tax Bond | 2.50 | 09/01/21 | 716,575 | ||||||||||
| 800,000 | Capistrano Unified School District Community Facilities District No. 90-2, California Special Tax Bond | 3.00 | 09/01/23 | 823,616 | ||||||||||
| 855,000 | Chula Vista Elementary School District, California COP | 5.00 | 09/01/22 | 947,682 | ||||||||||
| 610,000 | Chula Vista Elementary School District, California COP | 5.00 | 09/01/23 | 689,129 | ||||||||||
| 380,000 | Chula Vista Elementary School District, California COP, Series A | 5.00 | 09/01/19 | 390,933 | ||||||||||
| 305,000 | City of Laguna Beach, California Special Assessment Bond | 2.00 | 09/02/21 | 303,307 | ||||||||||
| 400,000 | City of Los Angeles Department of Airports, California RB, Series B | 5.00 | 05/15/30 | 438,896 | ||||||||||
| 840,000 | City of Rocklin, California Special Tax Bond | 3.50 | 09/01/26 | 856,027 | ||||||||||
| 200,000 | City of Sacramento, California Special Tax Bond | 5.00 | 09/01/24 | 226,150 | ||||||||||
| 720,000 | City of Tulare CA Sewer Revenue, California RB | 5.00 | 11/15/28 | 827,086 | ||||||||||
| 580,000 | Corona Public Financing Authority, California RB | 5.00 | 11/01/26 | 689,220 | ||||||||||
| 625,000 | Corona-Norco Unified School District Public Financing Authority, California Special Tax Bond, Series A | 5.00 | 09/01/26 | 690,419 | ||||||||||
| 520,000 | Cosumnes Community Services District, California COP | 3.00 | 09/01/20 | 531,783 | ||||||||||
| 675,000 | Cosumnes Community Services District, California COP | 4.00 | 09/01/24 | 734,589 | ||||||||||
| 850,000 | County of El Dorado, California Special Tax Bond | 5.00 | 09/01/22 | 938,766 | ||||||||||
| 295,000 | County of Santa Cruz, California COP | 5.00 | 08/01/23 | 332,648 | ||||||||||
| 455,000 | Department of Veterans Affairs Veteran's Farm & Home Purchase Program, California RB, Series A | 3.50 | 12/01/25 | 463,345 | ||||||||||
| 510,000 | Elk Grove Finance Authority, California Special Tax Bond | 5.00 | 09/01/25 | 587,336 | ||||||||||
| 905,000 | Folsom Redevelopment Agency Successor Agency, California Tax Allocation Bond, Series A | 4.00 | 08/01/28 | 973,599 | ||||||||||
| 1,475,000 | Fresno County Financing Authority, California RB | 5.00 | 04/01/27 | 1,715,823 | ||||||||||
| 1,500,000 | Fresno County Financing Authority, California RB | 5.00 | 04/01/28 | 1,733,835 | ||||||||||
| 330,000 | Gilroy Unified School District, California COP | 4.00 | 04/01/26 | 360,581 | ||||||||||
| 250,000 | Golden State Tobacco Securitization Corp., California RB, Series A | 5.00 | 06/01/30 | 275,030 | ||||||||||
| 2,165,000 | Golden State Tobacco Securitization Corp., California RB, Series A | 5.00 | 06/01/29 | 2,389,749 | ||||||||||
| 660,000 | Imperial Community College District, California GOB | 5.00 | 08/01/29 | 728,277 | ||||||||||
| 580,000 | Irvine Unified School District No. 1, California Special Tax Bond, Series 1 | 5.00 | 09/01/23 | 650,638 | ||||||||||
| 205,000 | Los Angeles County Redevelopment Refunding Agency, California Tax Allocation Bond, Series A | 5.00 | 09/01/20 | 216,289 | ||||||||||
| 510,000 | Lynwood Unified School District, California COP | 5.00 | 10/01/20 | 539,606 | ||||||||||
| 655,000 | Lynwood Unified School District, California COP | 5.00 | 10/01/24 | 747,630 | ||||||||||
| 695,000 | Lynwood Unified School District, California COP | 5.00 | 10/01/25 | 803,490 | ||||||||||
| 375,000 | Lynwood Unified School District, California COP | 5.00 | 10/01/28 | 429,626 | ||||||||||
| 270,000 | Modesto Irrigation District, California RB, Series B | 5.00 | 10/01/27 | 285,074 | ||||||||||
| 280,000 | Mojave Unified School District School Facilities Improvement District No. 1, California GOB | 4.00 | 08/01/20 | 291,348 | ||||||||||
| 1,425,000 | Mount Diablo Unified School District, California GOB (a)(b) | 0.30 | 08/01/30 | 1,383,504 | ||||||||||
| 400,000 | Orange Redevelopment Agency Successor Agency, California Tax Allocation Bond | 5.00 | 09/01/22 | 446,552 | ||||||||||
| 855,000 | Palmdale Elementary School District, California COP, Series A | 3.00 | 10/01/21 | 876,238 | ||||||||||
| 200,000 | Placentia-Yorba Linda Unified School District, California COP, Series A | 5.00 | 10/01/25 | 231,914 | ||||||||||
| 445,000 | Placentia-Yorba Linda Unified School District, California COP, Series A | 5.00 | 10/01/27 | 509,249 | ||||||||||
| 365,000 | Poway Redevelopment Agency Successor Agency, California Tax Allocation Bond, Series A | 5.00 | 12/15/21 | 399,868 | ||||||||||
| 655,000 | Poway Unified School District, California Special Tax Bond | 3.00 | 09/01/20 | 669,469 | ||||||||||
| 970,000 | Poway Unified School District, California Special Tax Bond | 3.00 | 09/01/21 | 997,315 | ||||||||||
| 1,100,000 | Poway Unified School District, California Special Tax Bond | 5.00 | 09/01/27 | 1,264,791 | ||||||||||
See Notes to Financial Statements.
GURTIN CALIFORNIA MUNICIPAL INTERMEDIATE VALUE FUND
SCHEDULE OF INVESTMENTS
SEPTEMBER 30, 2018
| Principal | Security Description | Rate | Maturity | Value | ||||||||||
| California - 88.4% (continued) | ||||||||||||||
| $ | 250,000 | Poway Unified School District Public Financing Authority, California Special Tax Bond, Series A | 5.00 | % | 09/01/24 | $ | 281,230 | |||||||
| 350,000 | Poway Unified School District Public Financing Authority, California Special Tax Bond, Series A | 5.00 | 09/01/25 | 397,145 | ||||||||||
| 1,735,000 | Poway Unified School District Public Financing Authority, California Special Tax Bond, Series A | 5.00 | 09/01/29 | 2,033,784 | ||||||||||
| 325,000 | Rio Elementary School District Community Facilities District, California Special Tax Bond | 3.25 | 09/01/26 | 325,341 | ||||||||||
| 720,000 | Riverside County Asset Leasing Corp., California RB | 5.00 | 11/01/26 | 787,939 | ||||||||||
| 250,000 | Riverside County Asset Leasing Corp., California RB | 4.00 | 06/01/28 | 257,815 | ||||||||||
| 300,000 | Riverside County Redevelopment Successor Agency, California Tax Allocation Bond | 5.00 | 10/01/25 | 347,454 | ||||||||||
| 875,000 | Riverside County Redevelopment Successor Agency, California Tax Allocation Bond, Series B | 5.00 | 10/01/25 | 1,012,191 | ||||||||||
| 300,000 | Sacramento Redevelopment Agency Successor Agency, California Tax Allocation Bond, Series A | 5.00 | 12/01/19 | 310,719 | ||||||||||
| 1,090,000 | San Luis Water District, California COP, Series A | 5.00 | 08/01/22 | 1,204,461 | ||||||||||
| 225,000 | Santa Clara County Board of Education, California COP | 5.00 | 04/01/21 | 242,676 | ||||||||||
| 1,525,000 | Solano County Community College District, California GOB (a)(b) | 1.39 | 08/01/29 | 1,365,210 | ||||||||||
| 500,000 | Sonoma Community Development Agency Successor Agency, California Tax Allocation Bond | 5.00 | 12/01/30 | 527,670 | ||||||||||
| 1,075,000 | State of California, California GOB | 5.00 | 09/01/27 | 1,266,017 | ||||||||||
| 1,000,000 | State of California, California GOB | 5.00 | 10/01/29 | 1,030,280 | ||||||||||
| 1,575,000 | Stockton Unified School District, California COP | 5.00 | 02/01/29 | 1,819,928 | ||||||||||
| 1,835,000 | Stockton Unified School District, California GOB | 5.00 | 08/01/26 | 2,137,793 | ||||||||||
| 510,000 | Stockton Unified School District, California GOB, Series A | 5.00 | 08/01/28 | 573,750 | ||||||||||
| 430,000 | Stockton Unified School District, California GOB, Series B | 5.00 | 08/01/24 | 491,989 | ||||||||||
| 1,200,000 | Stockton Unified School District, California GOB, Series B | 5.00 | 08/01/27 | 1,398,012 | ||||||||||
| 375,000 | Travis Unified School District, California COP | 4.00 | 09/01/22 | 400,320 | ||||||||||
| 685,000 | Tulare City School District, California COP | 2.00 | 11/01/21 | 682,356 | ||||||||||
| 215,000 | Val Verde Unified School District, California COP, Series A | 5.00 | 08/01/26 | 245,939 | ||||||||||
| 500,000 | Val Verde Unified School District, California COP, Series A AGC | 4.10 | 03/01/20 | 504,215 | ||||||||||
| 1,000,000 | Val Verde Unified School District, California GOB, Series A | 5.00 | 08/01/26 | 1,172,880 | ||||||||||
| 850,000 | Victor Valley Union High School District, California COP, Series A | 2.00 | 11/15/24 | 824,092 | ||||||||||
| 300,000 | Waugh School District, California Special Tax Bond | 4.00 | 09/01/20 | 312,705 | ||||||||||
| 56,774,940 | ||||||||||||||
| Illinois - 7.4% | ||||||||||||||
| 1,000,000 | Chicago Park District, Illinois GOB, Series A | 5.00 | 01/01/30 | 1,100,610 | ||||||||||
| 1,000,000 | Chicago Park District, Illinois GOB, Series A | 5.00 | 01/01/31 | 1,092,550 | ||||||||||
| 1,000,000 | Chicago Park District, Illinois GOB, Series B | 5.00 | 01/01/31 | 1,092,550 | ||||||||||
| 625,000 | Chicago Park District, Illinois GOB, Series C | 5.00 | 01/01/25 | 664,169 | ||||||||||
| 500,000 | Chicago Park District, Illinois GOB, Series C | 5.00 | 01/01/25 | 551,000 | ||||||||||
| 255,000 | Grundy & Kendall Counties Consolidated Grade School District No. 60, Illinois GOB, Series C | 4.00 | 02/01/21 | 262,956 | ||||||||||
| 4,763,835 | ||||||||||||||
| Kentucky - 0.2% | ||||||||||||||
| 125,000 | Corbin Independent School District Finance Corp., Kentucky RB | 3.00 | 02/01/26 | 126,395 | ||||||||||
| Michigan - 0.5% | ||||||||||||||
| 285,000 | Macomb Township Building Authority, Michigan RB | 4.25 | 04/01/23 | 285,513 | ||||||||||
| Pennsylvania - 0.4% | ||||||||||||||
| 225,000 | Wellsboro Area School District, Pennsylvania GOB | 3.00 | 04/15/21 | 229,249 | ||||||||||
| Total Municipal Bonds (Cost $63,264,315) | 62,179,932 | |||||||||||||
| Shares | Security Description | Value | ||||||
| Money Market Fund - 2.0% | ||||||||
| 1,308,432 | Fidelity Investments Money Market Government Portfolio, Class I, 1.96% (c) (Cost $1,308,432) | 1,308,432 | ||||||
| Investments, at value - 98.9% (Cost $64,572,747) | $ | 63,488,364 | ||||||
| Other Assets & Liabilities, Net - 1.1% | 709,185 | |||||||
| Net Assets - 100.0% | $ | 64,197,549 | ||||||
See Notes to Financial Statements.
GURTIN CALIFORNIA MUNICIPAL INTERMEDIATE VALUE FUND
SCHEDULE OF INVESTMENTS
SEPTEMBER 30, 2018
| AGC | Assured Guaranty Corporation |
| COP | Certificate of Participation |
| GOB | General Obligation Bond |
| RB | Revenue Bond |
| (a) | Debt obligation initially issued at one coupon rate which converts to higher coupon rate at a specified date. Rate presented is as of September 30, 2018. |
| (b) | Zero coupon bond. Interest rate presented is yield to maturity. |
| (c) | Dividend yield changes daily to reflect current market conditions. Rate was the quoted yield as of September 30, 2018. |
The following is a summary of the inputs used to value the Fund's investments as of September 30, 2018.
The inputs or methodology used for valuing securities are not necessarily an indication of the risks associated with investing in those securities. For more information on valuation inputs, and their aggregation into the levels used in the table below, please refer to the Security Valuation section in Note 2 of the accompanying Notes to Financial Statements.
| Valuation Inputs | Investments in Securities | |||
| Level 1 - Quoted Prices | $ | – | ||
| Level 2 - Other Significant Observable Inputs | 63,488,364 | |||
| Level 3 - Significant Unobservable Inputs | – | |||
| Total | $ | 63,488,364 | ||
The Level 2 value displayed in this table includes Municipal Bonds and a Money Market Fund. Refer to this Schedule of Investments for a further breakout of each Municipal Bond security by state.
The Fund utilizes the end of period methodology when determining transfers. There were no transfers among Level 1, Level 2 and Level 3 for the year ended September 30, 2018.
| PORTFOLIO HOLDINGS (Unaudited) | ||||
| % of Total Investments | ||||
| Municipal Bonds | 97.9 | % | ||
| Money Market Fund | 2.1 | % | ||
| 100.0 | % | |||
See Notes to Financial Statements.
GURTIN CALIFORNIA MUNICIPAL INTERMEDIATE VALUE FUND
STATEMENT OF ASSETS AND LIABILITIES
SEPTEMBER 30, 2018
| ASSETS | ||||
| Investments, at value (Cost $64,572,747) | $ | 63,488,364 | ||
| Receivables: | ||||
| Fund shares sold | 123,965 | |||
| Dividends and interest | 642,821 | |||
| Prepaid expenses | 6,678 | |||
| Total Assets | 64,261,828 | |||
| LIABILITIES | ||||
| Payables: | ||||
| Fund shares redeemed | 20,432 | |||
| Distributions payable | 1,363 | |||
| Accrued Liabilities: | ||||
| Investment adviser fees | 9,773 | |||
| Fund services fees | 6,251 | |||
| Other expenses | 26,460 | |||
| Total Liabilities | 64,279 | |||
| NET ASSETS | $ | 64,197,549 | ||
| COMPONENTS OF NET ASSETS | ||||
| Paid-in capital | $ | 65,396,006 | ||
| Distributions in excess of net investment income | (55 | ) | ||
| Accumulated net realized loss | (114,019 | ) | ||
| Net unrealized depreciation | (1,084,383 | ) | ||
| NET ASSETS | $ | 64,197,549 | ||
| SHARES OF BENEFICIAL INTEREST AT NO PAR VALUE (UNLIMITED SHARES AUTHORIZED) | ||||
| Institutional Shares | 6,436,537 | |||
| NET ASSET VALUE, OFFERING AND REDEMPTION PRICE PER SHARE | ||||
| Institutional Shares (based on net assets of $64,197,549) | $ | 9.97 | ||
See Notes to Financial Statements.
GURTIN CALIFORNIA MUNICIPAL INTERMEDIATE VALUE FUND
STATEMENT OF OPERATIONS
YEAR ENDED SEPTEMBER 30, 2018
| INVESTMENT INCOME | ||||
| Dividend income | $ | 20,016 | ||
| Interest income | 1,548,808 | |||
| Total Investment Income | 1,568,824 | |||
| EXPENSES | ||||
| Investment adviser fees | 272,211 | |||
| Fund services fees | 112,041 | |||
| Custodian fees | 8,382 | |||
| Registration fees | 7,030 | |||
| Professional fees | 30,171 | |||
| Trustees' fees and expenses | 4,674 | |||
| Other expenses | 45,576 | |||
| Total Expenses | 480,085 | |||
| Fees waived | (176,748 | ) | ||
| Net Expenses | 303,337 | |||
| NET INVESTMENT INCOME | 1,265,487 | |||
| NET REALIZED AND UNREALIZED GAIN (LOSS) | ||||
| Net realized loss on investments | (114,019 | ) | ||
| Net change in unrealized appreciation (depreciation) on investments | (1,270,076 | ) | ||
| NET REALIZED AND UNREALIZED LOSS | (1,384,095 | ) | ||
| DECREASE IN NET ASSETS RESULTING FROM OPERATIONS | $ | (118,608 | ) | |
See Notes to Financial Statements.
GURTIN CALIFORNIA MUNICIPAL INTERMEDIATE VALUE FUND
STATEMENTS OF CHANGES IN NET ASSETS
| For the Years Ended September 30, | ||||||||
| 2018 | 2017 | |||||||
| OPERATIONS | ||||||||
| Net investment income | $ | 1,265,487 | $ | 1,105,028 | ||||
| Net realized gain (loss) | (114,019 | ) | 75,214 | |||||
| Net change in unrealized appreciation (depreciation) | (1,270,076 | ) | (429,205 | ) | ||||
| Increase (Decrease) in Net Assets Resulting from Operations | (118,608 | ) | 751,037 | |||||
| DISTRIBUTIONS TO SHAREHOLDERS FROM | ||||||||
| Net investment income: | ||||||||
| Institutional Shares | (1,265,671 | ) | (1,104,845 | ) | ||||
| Net realized gain: | ||||||||
| Institutional Shares | (75,256 | ) | (1,056 | ) | ||||
| Total Distributions to Shareholders | (1,340,927 | ) | (1,105,901 | ) | ||||
| CAPITAL SHARE TRANSACTIONS | ||||||||
| Sale of shares: | ||||||||
| Institutional Shares | 19,801,125 | 37,507,683 | ||||||
| Reinvestment of distributions: | ||||||||
| Institutional Shares | 1,328,613 | 1,100,974 | ||||||
| Redemption of shares: | ||||||||
| Institutional Shares | (38,191,541 | ) | (17,283,411 | ) | ||||
| Increase (Decrease) in Net Assets from Capital Share Transactions | (17,061,803 | ) | 21,325,246 | |||||
| Increase (Decrease) in Net Assets | (18,521,338 | ) | 20,970,382 | |||||
| NET ASSETS | ||||||||
| Beginning of Year | 82,718,887 | 61,748,505 | ||||||
| End of Year (Including line (a)) | $ | 64,197,549 | $ | 82,718,887 | ||||
| SHARE TRANSACTIONS | ||||||||
| Sale of shares: | ||||||||
| Institutional Shares | 1,972,296 | 3,749,367 | ||||||
| Reinvestment of distributions: | ||||||||
| Institutional Shares | 132,394 | 109,744 | ||||||
| Redemption of shares: | ||||||||
| Institutional Shares | (3,809,316 | ) | (1,736,208 | ) | ||||
| Increase (Decrease) in Shares | (1,704,626 | ) | 2,122,903 | |||||
| (a) Undistributed (distributions in excess of ) net investment income | $ | (55 | ) | $ | 186 | |||
See Notes to Financial Statements.
GURTIN CALIFORNIA MUNICIPAL INTERMEDIATE VALUE FUND
FINANCIAL HIGHLIGHTS
These financial highlights reflect selected data for a share outstanding throughout each period.
| For the Years Ended September 30, |
December 7, 2015 (a) Through September 30, |
|||||||||||
| 2018 | 2017 | 2016 | ||||||||||
| INSTITUTIONAL SHARES | ||||||||||||
| NET ASSET VALUE, Beginning of Period | $ | 10.16 | $ | 10.26 | $ | 10.00 | ||||||
| INVESTMENT OPERATIONS | ||||||||||||
| Net investment income (b) | 0.16 | 0.15 | 0.10 | |||||||||
| Net realized and unrealized gain (loss) | (0.18 | ) | (0.10 | ) | 0.26 | |||||||
| Total from Investment Operations | (0.02 | ) | 0.05 | 0.36 | ||||||||
| DISTRIBUTIONS TO SHAREHOLDERS FROM | ||||||||||||
| Net investment income | (0.16 | ) | (0.15 | ) | (0.10 | ) | ||||||
| Net realized gain | (0.01 | ) | (0.00 | )(c) | – | |||||||
| Total Distributions to Shareholders | (0.17 | ) | (0.15 | ) | (0.10 | ) | ||||||
| NET ASSET VALUE, End of Period | $ | 9.97 | $ | 10.16 | $ | 10.26 | ||||||
| TOTAL RETURN | (0.17 | )% | 0.50 | % | 3.56 | %(d) | ||||||
| RATIOS/SUPPLEMENTARY DATA | ||||||||||||
| Net Assets at End of Period (000s omitted) | $ | 64,198 | $ | 82,719 | $ | 61,749 | ||||||
| Ratios to Average Net Assets: | ||||||||||||
| Net investment income | 1.63 | % | 1.48 | % | 1.19 | %(e) | ||||||
| Net expenses | 0.39 | % | 0.39 | % | 0.39 | %(e) | ||||||
| Gross expenses (f) | 0.62 | % | 0.63 | % | 0.84 | %(e) | ||||||
| PORTFOLIO TURNOVER RATE | 10 | % | 15 | % | 5 | %(d) | ||||||
| (a) | Commencement of operations. |
| (b) | Calculated based on average shares outstanding during each period. |
| (c) | Less than $0.01 per share. |
| (d) | Not annualized. |
| (e) | Annualized. |
| (f) | Reflects the expense ratio excluding any waivers and/or reimbursements. |
See Notes to Financial Statements.
GURTIN VALUE FUNDS
NOTES TO FINANCIAL STATEMENTS
SEPTEMBER 30, 2018
Note 1. Organization
Gurtin National Municipal Opportunistic Value Fund, Gurtin California Municipal Opportunistic Value Fund, Gurtin National Municipal Intermediate Value Fund and Gurtin California Municipal Intermediate Value Fund (individually, a “Fund” and collectively, the “Funds”) are non-diversified portfolios of Forum Funds II (the “Trust”). The Trust is a Delaware statutory trust that is registered as an open-end, management investment company under the Investment Company Act of 1940, as amended (the “Act”). Under its Trust Instrument, the Trust is authorized to issue an unlimited number of each Fund’s shares of beneficial interest without par value. Each Fund currently offers two class of shares: Institutional Shares and Investor Shares. As of September 30, 2018, Investor Shares for each Fund had not commenced operations. The Gurtin National Municipal Opportunistic Value Fund’s investment objective is to provide current income exempt from regular federal income tax while seeking to preserve capital and liquidity. The Gurtin California Municipal Opportunistic Value Fund’s investment objective is to provide current income exempt from regular federal income tax and California state personal income taxes while seeking to preserve capital and liquidity. The Gurtin National Municipal Intermediate Value Fund’s investment objective is to provide current income exempt from regular federal income tax while seeking to preserve capital and liquidity. The Gurtin California Municipal Intermediate Value Fund’s investment objective is to provide current income exempt from regular federal income tax and California state personal income taxes while seeking to preserve capital and liquidity.
The Gurtin National Municipal Opportunistic Value Fund and Gurtin California Municipal Opportunistic Value Fund commenced operations on November 3, 2014, after they acquired the net assets of privately offered funds managed by the Funds’ adviser and portfolio management team (each a “Predecessor Fund” and collectively the “Predecessor Funds”). The Predecessor Funds of the Gurtin National Municipal Opportunistic Value Fund and Gurtin California Municipal Opportunistic Value Fund commenced operations on May 3, 2010.
Effective August 1, 2016, Gurtin National Municipal Value Fund and Gurtin California Municipal Value Fund were renamed Gurtin National Municipal Opportunistic Value Fund and Gurtin California Municipal Opportunistic Value Fund, respectively.
The Gurtin National Municipal Intermediate Value Fund and Gurtin California Municipal Intermediate Value Fund commenced operations on December 1, 2015, and December 7, 2015, respectively.
Note 2. Summary of Significant Accounting Policies
The Funds are investment companies and follow accounting and reporting guidance under Financial Accounting Standards Board (“FASB”) Accounting Standards Codification (“ASC”) Topic 946, “Financial Services-Investment Companies”. These financial statements are prepared in accordance with accounting principles generally accepted in the United States of America (“GAAP”), which require management to make estimates and assumptions that affect the reported amounts of assets and liabilities, the disclosure of contingent liabilities at the date of the financial statements, and the reported amounts of increases and decreases in net assets from operations during the fiscal year. Actual amounts could differ from those estimates. The following summarizes the significant accounting policies of each Fund:
Security Valuation – Securities are valued at market prices using the last quoted trade or official closing price from the principal exchange where the security is traded, as provided by independent pricing services on each Fund business day.In the absence of a last trade, securities are valued at the mean of the last bid and ask price provided by the pricing service. Debt securities may be valued at prices supplied by a fund’s pricing agent based on broker or dealer supplied valuations or evaluated bid pricing. Shares of non-exchange traded open-end mutual funds are valued at net asset value (“NAV”). Short-term investments that mature in sixty days or less may be valued at amortized cost.
Each Fund values its investments at fair value pursuant to procedures adopted by the Trust’s Board of Trustees (the “Board”) if (1) market quotations are not readily available or (2) the Adviser, as defined in Note 3, believes that the values available are unreliable. The Trust’s Valuation Committee, as defined in each Fund’s registration statement, performs certain functions as they relate to the administration and oversight of each Fund’s valuation procedures. Under these procedures, the Valuation Committee convenes on a regular and ad hoc basis to review such investments and considers a number of factors, including valuation methodologies and significant unobservable inputs, when arriving at fair value.
GURTIN VALUE FUNDS
NOTES TO FINANCIAL STATEMENTS
SEPTEMBER 30, 2018
The Valuation Committee may work with the Adviser to provide valuation inputs. In determining fair valuations, inputs may include market-based analytics that may consider related or comparable assets or liabilities, recent transactions, market multiples, book values and other relevant investment information. Adviser inputs may include an income-based approach in which the anticipated future cash flows of the investment are discounted in determining fair value. Discounts may also be applied based on the nature or duration of any restrictions on the disposition of the investments. The Valuation Committee performs regular reviews of valuation methodologies, key inputs and assumptions, disposition analysis and market activity.
Fair valuation is based on subjective factors and, as a result, the fair value price of an investment may differ from the security’s market price and may not be the price at which the asset may be sold. Fair valuation could result in a different NAV than a NAV determined by using market quotes.
GAAP has a three-tier fair value hierarchy. The basis of the tiers is dependent upon the various “inputs” used to determine the value of each Fund’s investments. These inputs are summarized in the three broad levels listed below:
Level 1 - Quoted prices in active markets for identical assets and liabilities.
Level 2 - Prices determined using significant other observable inputs (including quoted prices for similar securities, interest rates, prepayment speeds, credit risk, etc.). Short-term securities with maturities of sixty days or less are valued at amortized cost, which approximates market value, and are categorized as Level 2 in the hierarchy. Municipal securities, long-term U.S. government obligations and corporate debt securities are valued in accordance with the evaluated price supplied by the pricing service and generally categorized as Level 2 in the hierarchy. Other securities that are categorized as Level 2 in the hierarchy include, but are not limited to, warrants that do not trade on an exchange, securities valued at the mean between the last reported bid and ask quotation and international equity securities valued by an independent third party with adjustments for changes in value between the time of the securities respective local market closes and the close of the U.S. market.
Level 3 - Significant unobservable inputs (including each Fund’s own assumptions in determining the fair value of investments).
The aggregate value by input level, as of September 30, 2018, for each Fund’s investments is included at the end of each Fund’s Schedule of Investments.
Security Transactions, Investment Income and Realized Gain and Loss – Investment transactions are accounted for on the trade date. Dividend income is recorded on the ex-dividend date. Interest income is recorded on an accrual basis. Premium is amortized and discount is accreted using the effective interest method. Identified cost of investments sold is used to determine the gain and loss for both financial statement and federal income tax purposes.
Municipal Securities – Each Fund invests in municipal securities. Municipal securities can be significantly affected by adverse tax, legislative, or political changes, changes in the financial condition of the obligors of municipal securities, general economic downturns, and the reallocation of governmental cost burdens among federal, state and local governments. Municipal securities backed by current or anticipated revenues from a specific project or specific assets can be negatively affected by the inability to collect revenues for the project.
Distributions to Shareholders – Distributions to shareholders of net investment income, if any, are declared daily and paid monthly. Distributions to shareholders of net capital gains, if any, are declared and paid annually. Distributions to shareholders are recorded on the ex-dividend date. Distributions are based on amounts calculated in accordance with applicable federal income tax regulations, which may differ from GAAP. These differences are due primarily to differing treatments of income and gain on various investment securities held by each Fund, timing differences and differing characterizations of distributions made by each Fund.
Federal Taxes – Each Fund intends to continue to qualify each year as a regulated investment company under Subchapter M of Chapter 1, Subtitle A, of the Internal Revenue Code of 1986, as amended (“Code”), and to distribute all of their taxable income to shareholders. In addition, by distributing in each calendar year substantially all of their net investment income and capital gains, if any, the Funds will not be subject to a federal excise tax. Therefore, no federal income or excise tax provision is required. Each Fund files a U.S. federal income and excise tax return as required. Each Fund’s federal income tax returns are subject to examination by the Internal Revenue Service for a period of three fiscal years after they are filed. As of September 30, 2018, there are no uncertain tax positions that would require financial statement recognition, de-recognition or disclosure.
GURTIN VALUE FUNDS
NOTES TO FINANCIAL STATEMENTS
SEPTEMBER 30, 2018
Income and Expense Allocation – The Trust accounts separately for the assets, liabilities and operations of each of its investment portfolios. Expenses that are directly attributable to more than one investment portfolio are allocated among the respective investment portfolios in an equitable manner.
Commitments and Contingencies – In the normal course of business, each Fund enters into contracts that provide general indemnifications by each Fund to the counterparty to the contract. Each Fund’s maximum exposure under these arrangements is dependent on future claims that may be made against each Fund and, therefore, cannot be estimated; however, based on experience, the risk of loss from such claims is considered remote. Each Fund has determined that none of these arrangements requires disclosure on each Fund’s balance sheet.
Note 3. Fees and Expenses
Investment Adviser – Gurtin Municipal Bond Management (the “Adviser”) is the investment adviser to the Funds. Pursuant to an Investment Advisory Agreement, the Adviser receives an advisory fee, payable monthly, at an annual rate of 0.45% of the average daily net assets of Gurtin National Municipal Opportunistic Value Fund and Gurtin California Municipal Opportunistic Value Fund and 0.35% of the average daily net assets of Gurtin National Municipal Intermediate Value Fund and Gurtin California Municipal Intermediate Value Fund.
Distribution – Foreside Fund Services, LLC serves as each Fund’s distributor (the “Distributor”). The Funds have adopted a Distribution Plan (the “Plan”) for Investor Shares in accordance with Rule 12b-1 of the Act. Under the Plan, the Funds pay the Distributor and/or any other entity as authorized by the Board a fee of up to 0.25% of the average daily net assets of Investor Shares. The Distributor is not affiliated with the Adviser or Atlantic Fund Administration, LLC (d/b/a Atlantic Fund Services) (“Atlantic”) or their affiliates.
Other Service Providers – Atlantic provides fund accounting, fund administration, compliance and transfer agency services to each Fund. The fees related to these services are included in Fund services fees within the Statements of Operations. Atlantic also provides certain shareholder report production and EDGAR conversion and filing services. Pursuant to an Atlantic services agreement, each Fund pays Atlantic customary fees for its services. Atlantic provides a Principal Executive Officer, a Principal Financial Officer, a Chief Compliance Officer and an Anti-Money Laundering Officer to each Fund, as well as certain additional compliance support functions.
Trustees and Officers – The Trust pays each Independent Trustee an annual fee of $16,000 ($21,000 for the Chairman) for service to the Trust. The Independent Trustees and Chairman may receive additional fees for special Board meetings. The Independent Trustees are also reimbursed for all reasonable out-of-pocket expenses incurred in connection with their duties as Trustees, including travel and related expenses incurred in attending Board meetings. The amount of Independent Trustees’ fees attributable to each Fund is disclosed in the Statements of Operations. Certain officers of the Trust are also officers or employees of the above named service providers, and during their terms of office received no compensation from each Fund.
Note 4. Expense Reimbursement and Fees Waived
The Adviser has contractually agreed to waive its fee and/or reimburse Fund expenses to limit Total Annual Fund Operating Expenses After Fee Waiver and/or Expense Reimbursement (excluding all taxes, interest, portfolio transaction expenses, proxy expenses and extraordinary expenses) to 0.60% and 0.85% of average daily net assets of the Gurtin National Municipal Opportunistic Value Fund and Gurtin California Municipal Opportunistic Value Fund’s Institutional Shares and Investor Shares, respectively, and to 0.39% and 0.64% of average daily net assets of the Gurtin National Municipal Intermediate Value Fund and Gurtin California Municipal Intermediate Value Fund’s Institutional and Investor Shares, respectively, through at least February 1, 2019. Other fund service providers have voluntarily agreed to waive a portion of their fees. Voluntary fee waivers may be reduced or eliminated at any time. For the year ended September 30, 2018, fees waived and expenses reimbursed were as follows:
GURTIN VALUE FUNDS
NOTES TO FINANCIAL STATEMENTS
SEPTEMBER 30, 2018
| Investment Adviser Fees Waived | Other Waivers | Total Fees Waived | ||||||||||
| Gurtin National Municipal Opportunistic Value Fund | $ | 5,690 | $ | 71,359 | $ | 77,049 | ||||||
| Gurtin California Municipal Opportunistic Value Fund | $ | – | $ | 97,629 | $ | 97,629 | ||||||
| Gurtin National Municipal Intermediate Value Fund | 217,095 | 98,306 | 315,401 | |||||||||
| Gurtin California Municipal Intermediate Value Fund | 144,114 | 32,634 | 176,748 | |||||||||
The Adviser may be reimbursed by each Fund for fees waived and expenses reimbursed by the Adviser pursuant to the Expense Cap if such payment is made within three years of the fee waiver or expense reimbursement, and does not cause the Total Annual Fund Operating Expenses After Fee Waiver and/or Expense Reimbursement to exceed the lesser of (i) the then-current expense cap, or (ii) the expense cap in place at the time the fees/expenses were waived/reimbursed. Fees recouped by the adviser for the year ended September 30, 2018, if any, are disclosed on each Fund’s Statement of Operations. The amounts remaining that are subject to recoupment by the adviser as of September 30, 2018 are $166,371, $7,888, $600,371 and $430,002 for the Gurtin National Municipal Opportunistic Value Fund, Gurtin California Municipal Opportunistic Value Fund, Gurtin National Municipal Intermediate Value Fund and Gurtin California Municipal Intermediate Value Fund, respectively.
Note 5. Security Transactions
The cost of purchases and proceeds from sales of investment securities (including maturities), other than short-term investments during the year ended September 30, 2018, were as follows:
| Purchases | Sales | |||||||
| Gurtin National Municipal Opportunistic Value Fund | $ | 141,712,772 | $ | 66,833,877 | ||||
| Gurtin California Municipal Opportunistic Value Fund | 161,106,380 | 118,120,881 | ||||||
| Gurtin National Municipal Intermediate Value Fund | 29,698,405 | 72,652,004 | ||||||
| Gurtin California Municipal Intermediate Value Fund | 7,336,231 | 24,053,407 | ||||||
Note 6. Line of Credit
The Funds participate in a committed $14 million unsecured line of credit agreement with MUFG Union Bank, N.A.. The Funds may temporarily borrow from the line of credit to satisfy redemption requests or settle investment transactions. Interest is charged to each Fund based on its borrowings at an amount above the LIBOR rate. Because the line of credit is not available exclusively to Funds, they may be unable to borrow some or all of the Funds’ requested amounts at any particular time. During the year ended September 30, 2018, the Funds had no outstanding balances pursuant to this line of credit.
Note 7. Federal Income Tax
As of September 30, 2018, the cost of investments and the components of net unrealized appreciation/(depreciation) were as follows:
| Tax Cost of Investments | Gross Unrealized Appreciation | Gross Unrealized Depreciation | Net Unrealized Appreciation | |||||||||||||
| Gurtin National Municipal Opportunistic Value Fund | $ | 204,082,547 | $ | 2,262,049 | $ | (696,331 | ) | $ | 1,565,718 | |||||||
| Gurtin California Municipal Opportunistic Value Fund | 223,696,380 | 4,667,673 | (794,212 | ) | 3,873,461 | |||||||||||
| Gurtin National Municipal Intermediate Value Fund | 165,803,576 | 247,393 | (3,939,112 | ) | (3,691,719 | ) | ||||||||||
| Gurtin California Municipal Intermediate Value Fund | 64,572,747 | 178,300 | (1,262,683 | ) | (1,084,383 | ) | ||||||||||
Distributions on a tax basis may differ from the financials due to end of year distributions payable. Distributions paid during the fiscal years ended as noted were characterized for tax purposes as follows:
GURTIN VALUE FUNDS
NOTES TO FINANCIAL STATEMENTS
SEPTEMBER 30, 2018
| Tax-Exempt Income | Ordinary Income |
Long-Term Capital Gains |
Total | |||||||||||||
| Gurtin National Municipal Opportunistic Value Fund | ||||||||||||||||
| 2018 | $ | 3,374,416 | $ | $ | 143,912 | $ | 37,704 | $ | 3,556,032 | |||||||
| 2017 | 2,229,741 | 272,976 | 1,817 | 2,504,534 | ||||||||||||
| Gurtin California Municipal Opportunistic Value Fund | ||||||||||||||||
| 2018 | 4,485,881 | 162,246 | 53,393 | 4,701,520 | ||||||||||||
| 2017 | 3,521,400 | 440,093 | – | 3,961,493 | ||||||||||||
| Gurtin National Municipal Intermediate Value Fund | ||||||||||||||||
| 2018 | 3,748,289 | 50,722 | – | 3,799,011 | ||||||||||||
| 2017 | 2,647,433 | 60,657 | – | 2,708,090 | ||||||||||||
| Gurtin California Municipal Intermediate Value Fund | ||||||||||||||||
| 2018 | 1,246,920 | 91,694 | 1,485 | 1,340,099 | ||||||||||||
| 2017 | 1,094,030 | 11,817 | – | 1,105,847 | ||||||||||||
As of September 30, 2018, distributable earnings (accumulated loss) on a tax basis were as follows:
| Undistributed Tax Exempt Income | Undistributed Ordinary Income | Undistributed Long-Term Gain | Capital and Other Losses | Unrealized Appreciation | Other Temporary Differences | Total | ||||||||||||||||||||||
| Gurtin National Municipal Opportunistic Value Fund | $ | 19,687 | $ | 824 | $ | 71,186 | $ | – | $ | 1,565,718 | $ | (20,511 | ) | $ | 1,636,904 | |||||||||||||
| Gurtin California Municipal Opportunistic Value Fund | 17,724 | 625 | 48,996 | – | 3,873,461 | (18,350 | ) | 3,922,456 | ||||||||||||||||||||
| Gurtin National Municipal Intermediate Value Fund | 21,899 | 269 | – | (1,174,686 | ) | (3,691,719 | ) | (22,167 | ) | (4,866,404 | ) | |||||||||||||||||
| Gurtin California Municipal Intermediate Value Fund | 1,308 | - | - | (114,019 | ) | (1,084,383 | ) | (1,363 | ) | (1,198,457 | ) | |||||||||||||||||
The difference between components of distributable earnings on a tax basis and the amounts reflected in the Statements of Assets and Liabilities are primarily due to end of period distributions payable and wash sales in each Fund.
The Gurtin National Municipal Intermediate Value Fund has $693,051 and $481,635 of available short-term and long-term capital loss carryforwards, respectively, that have no expiration date. The Gurtin California Municipal Intermediate Value Fund has $19,909 and $94,110 of available short-term and long-term capital loss carryforwards, respectively, that have no expiration date.
On the Statements of Assets and Liabilities, as a result of permanent book to tax differences, certain amounts have been reclassified for the year ended September 30, 2018. The following reclassifications were the result of recharacterization of distributions in Gurtin California Municipal Intermediate Value Fund and have no impact on the net assets of the Fund.
| Distributions in Excess of Net Investment Income | Accumulated Net Realized Loss | |||||||
| Gurtin California Municipal Intermediate Value Fund | $ | (57 | ) | $ | 57 | |||
GURTIN VALUE FUNDS
NOTES TO FINANCIAL STATEMENTS
SEPTEMBER 30, 2018
Note 8. Recent Accounting Pronouncements
In August 2018, the Financial Accounting Standards Board (“FASB”) issued Accounting Standards Update (ASU) No. 2018-13 “Fair Value Measurement (Topic 820): Disclosure Framework – Changes to the Disclosure Requirements for Fair Value Measurement” (“ASU 2018-13”) which includes amendments intended to improve the effectiveness of disclosures in the notes to financial statements. For example, ASU 2018-13 includes additional disclosures regarding the range and weighted average of significant unobservable inputs used to develop Level 3 fair value measurements, and clarifications to the narrative description of measurement uncertainty disclosures. ASU 2018-13 is effective for interim and annual periods beginning after December 15, 2019. Management is currently evaluating the impact that ASU 2018-13 will have on the Funds' financial statements and related disclosures.
In September 2018, the Securities and Exchange Commission released Final Rule 33-10532 captioned “Disclosure Update and Simplification” which is intended to amend certain disclosure requirements that have become redundant, duplicative, overlapping, outdated, or superseded, in light of other Commission disclosure requirements, GAAP, or changes in the information environment. These changes will be effective November 5, 2018. Management is currently evaluating the impact that this release will have on the Funds' financial statements and related disclosures.
In March 2017, the FASB issued ASU No. 2017-08, Receivables—Nonrefundable Fees and Other Costs (Subtopic 310-20): Premium Amortization on Purchased Callable Debt Securities. The amendments in the ASU shorten the amortization period for certain callable debt securities, held at a premium, to be amortized to the earliest call date. The ASU does not require an accounting change for securities held at a discount; which continues to be amortized to maturity. The ASU is effective for fiscal years and interim periods within those fiscal years beginning after December 15, 2018. Management is currently evaluating the impact, if any, of applying this provision.
Note 9. Subsequent Events
The Funds’ Adviser is expected to consummate a transaction with Pacific Investment Management Company LLC (“PIMCO”) anticipated to close by December 31, 2018 (the “Transaction”) that will cause a change in control of the Adviser, resulting in an assignment and termination of the Funds’ existing investment advisory agreement with the Trust, on behalf of the Funds, under the Investment Company Act of 1940. In connection with the Transaction, the Adviser recommended, and the Board approved, the reorganization of each of the Funds into a corresponding, newly formed fund that is advised by PIMCO (each, a “Fund Reorganization”). It is anticipated that each Fund Reorganization would close in the first half of 2019, subject to the approval of the applicable Fund’s shareholders by proxy solicitation. It is expected that the Funds’ current portfolio managers will continue to manage the newly formed PIMCO fund into which a particular Fund is reorganized.
REPORT OF INDEPENDENT REGISTERED PUBLIC ACCOUNTING FIRM
To the Board of Trustees of Forum Funds II
and the Shareholders of Gurtin National Municipal Opportunistic Value Fund, Gurtin California Municipal Opportunistic Value Fund, Gurtin National Municipal Intermediate Value Fund and Gurtin California Municipal Intermediate Value Fund
Opinion on the Financial Statements
We have audited the accompanying statements of assets and liabilities of Gurtin National Municipal Opportunistic Value Fund, Gurtin California Municipal Opportunistic Value Fund, Gurtin National Municipal Intermediate Value Fund, and Gurtin California
Municipal Intermediate Value Fund, each a series of shares of beneficial interest in Forum Funds II (the “Funds”), including the schedules of investments, as of September 30, 2018, and the related statements of operations for the year then ended and the statements of changes in net assets for each of the years in the two-year period then ended and the financial highlights for each of the years in the three-year period then ended and for the period from November 3, 2014 (commencement of operations) through September 30, 2015 for the Gurtin National Municipal Opportunistic Value Fund and the Gurtin California Municipal Opportunistic Value Fund. In addition, we have audited the related statements of operations for the year ended September 30, 2018 and the statements of changes in net assets for each of the years in the two-year period then ended and the financial highlights for each of the years in the two-year period then ended and for the period from December 1, 2015 (commencement of operations) through September 30, 2016 for the Gurtin National Municipal Intermediate Value Fund and for the period from December 7, 2015 (commencement of operations) through September 30, 2016 for the Gurtin California Municipal Intermediate Value Fund. We have also audited the related notes. The above statements and notes are collectively referred to as the “financial statements”. In our opinion, the financial statements present fairly, in all material respects, the financial position of the Funds as of September 30, 2018, and the results of their operations, the changes in their net assets and their financial highlights for each of the periods detailed above, in conformity with accounting principles generally accepted in the United States of America.
Basis for Opinion
These financial statements are the responsibility of the Funds' management. Our responsibility is to express an opinion on the Funds’ financial statements based on our audits. We are a public accounting firm registered with the Public Company Accounting Oversight Board (United States) (“PCAOB”) and are required to be independent with respect to the Funds in accordance with the U.S. federal securities law and the applicable rules and regulations of the Securities and Exchange Commission and the PCAOB.
We conducted our audits in accordance with the standards of the PCAOB. Those standards require that we plan and perform the audits to obtain reasonable assurance about whether the financial statements are free of material misstatement, whether due to error or fraud. The Funds are not required to have, nor were we engaged to perform, an audit of their internal control over financial reporting. As part of our audits we are required to obtain an understanding of internal control over financial reporting but not for the purpose of expressing an opinion on the effectiveness of the Funds’ internal control over financial reporting. Accordingly, we express no such opinion.
Our audits included performing procedures to assess the risk of material misstatement of those financial statements, whether due to error or fraud, and performing procedures that respond to those risks. Such procedures included examining, on a test basis, evidence regarding the amounts and disclosures in the financial statements. Our procedures included confirmation of securities owned as of September 30, 2018 by correspondence with the custodian and brokers. Our audits also included evaluating the accounting principles used and significant estimates made by management, as well as evaluating the overall presentation of the financial statements. We believe that our audits provide a reasonable basis for our opinion.

BBD, LLP
We have served as the auditor of one or more of the Funds in the Forum Funds II since 2013.
Philadelphia, Pennsylvania
November 26, 2018
GURTIN VALUE FUNDS
ADDITIONAL INFORMATION (Unaudited)
SEPTEMBER 30, 2018
Investment Advisory Agreement Approval
At the June 15, 2018 Board meeting (the “June meeting”), the Board, including the Independent Trustees, met in person and considered the approval of the continuance of the investment advisory agreement between Gurtin Fixed Income Management, LLC (the “Adviser”) and the Trust pertaining to the Funds (the “Advisory Agreement”). In preparation for the June meeting, the Board was presented with a range of information to assist in its deliberations. The Board requested and reviewed written responses from the Adviser to a letter circulated on the Board's behalf concerning the personnel, operations, financial condition, performance, compensation, and services provided to the Funds by the Adviser. During its deliberations, the Board received an oral presentation from the Adviser and discussed the materials with the Adviser, independent legal counsel to the Independent Trustees (“Independent Legal Counsel”), and, as necessary, with the Trust's administrator, Atlantic Fund Services. The Independent Trustees also met in executive session with Independent Legal Counsel while deliberating.
At the June meeting, the Board reviewed, among other matters, the topics discussed below.
Nature, Extent & Quality of Services
Based on written materials received and the presentation from senior representatives of the Adviser regarding the Adviser’s operations, the Board considered the quality of services provided by the Adviser under the Advisory Agreement. In this regard, the Board considered information regarding the experience, qualifications and professional background of the portfolio managers and other personnel at the Adviser with principal responsibility for the Funds, and the investment philosophy and decision-making process of those professionals.
The Board considered also the adequacy of the Adviser’s resources. The Board noted the Adviser’s representations that the firm is financially stable and has the operational capability and the necessary staffing and experience to continue providing quality investment advisory services to the Funds. Based on the presentation and the materials provided by the Adviser in connection with the Board’s consideration of the approval of the Advisory Agreement, the Board concluded that, overall, it was satisfied with the nature, extent and quality of services provided to the Funds under the Advisory Agreement.
Performance
In connection with a presentation by the Adviser regarding its approach to managing the Funds, the Board reviewed the performance of the Funds compared to their respective benchmarks and compared to independent peer groups of funds identified by Broadridge Financial Solutions, Inc. (“Broadridge”) believed to have characteristics similar to those of the Funds.
The Board observed that the Gurtin California Municipal Intermediate Value Fund outperformed its primary benchmark index, the ICE Bank of America Merrill Lynch 1-12 Year Municipal Index, for the one-year period ended March 31, 2018. The Board observed that the Gurtin California Municipal Intermediate Value Fund outperformed the median of its Broadridge peers for the one-year period ended March 31, 2018. The Board noted the Adviser’s representation that the Broadridge peers were not believed to represent an optimal comparison due to the Adviser’s perceived differences in the investment objectives, average credit quality, duration, and maturity of the respective portfolios compared to the Gurtin California Municipal Intermediate Value Fund. At the Adviser’s request, the Board also compared the Gurtin California Municipal Intermediate Value Fund’s performance to that of a group of peer funds believed by the Adviser to be more representative of the Gurtin California Municipal Intermediate Value Fund (the “Comparable Funds”) and observed that the Gurtin California Municipal Intermediate Value Fund outperformed the average of its Comparable Funds for the one-year period ended March 31, 2018.
The Board observed that the Gurtin California Municipal Opportunistic Value Fund underperformed its primary benchmark, the ICE Bank of America Merrill Lynch Municipal Miscellaneous 7-12 Year Index, for the one- and three-year periods ended March 31, 2018, and outperformed the primary benchmark for the five-year period ended March 31, 2018. The Board observed that the Gurtin California Municipal Opportunistic Value Fund outperformed median of its Broadridge peer group for the one- and three-year periods ended March 31, 2018. The Board also observed that the Gurtin California Municipal Opportunistic Value Fund outperformed the average of the relevant Comparable Funds for the one- and three-year periods ended March 31, 2018, noting that there were not a significant number of California-specific funds to develop a fully representative peer group for the Gurtin California Municipal Opportunistic Value Fund. The Board noted the Adviser’s representation that the Gurtin California Municipal Opportunistic Value Fund’s underperformance over the short term relative to the benchmark could be attributed, in part, to a
GURTIN VALUE FUNDS
ADDITIONAL INFORMATION (Unaudited)
SEPTEMBER 30, 2018
difficult investment environment marked by low yields, a flat yield curve, and tight spreads. The Board also noted the Adviser’s representation that the Gurtin California Municipal Opportunistic Value Fund’s performance had improved since the period end as a result of a rise in interest rates and new investment opportunities.
The Board observed that the Gurtin National Municipal Intermediate Value Fund outperformed the ICE Bank of America Merrill Lynch 1-12 Municipal Index, the Fund’s primary benchmark index, for the one-year period ended March 31, 2018. The Board observed that the Gurtin National Municipal Intermediate Value Fund underperformed the median of its Broadridge peers for the one-year period ended March 31, 2018. At the request of the Adviser, the Board considered the Gurtin National Municipal Intermediate Value Fund’s performance against that of its respective Comparable Funds and observed that the Gurtin National Municipal Intermediate Value Fund outperformed the average of the respective Comparable Funds for the one-year period ended March 31, 2018.
The Board observed that the Gurtin National Municipal Opportunistic Value Fund outperformed the ICE Bank of America Merrill Lynch Municipal Miscellaneous 7-12 Index, the Fund’s primary benchmark, for the one- and five-year periods ended March 31, 2018, while underperforming the primary benchmark for the three-year period ended March 31, 2018. The Board also observed that the Gurtin National Municipal Opportunistic Value Fund outperformed the median of its Broadridge peers for the one-year and three-year period ended March 31, 2018. At the request of the Adviser, the Board considered the Gurtin National Municipal Opportunistic Value Fund’s performance against that of its respective Comparable Funds and observed that the Gurtin National Municipal Opportunistic Value Fund outperformed the average of the respective Comparable Funds for the one-year period ended March 31, 2018. Based on the foregoing and other relevant factors, the Board concluded that the Adviser’s management of each Fund could benefit each Fund and their respective shareholders.
Compensation
The Board evaluated the Adviser’s compensation for providing advisory services to the Funds and analyzed comparative information on actual advisory fee rates and actual total expenses of the Funds Broadridge peer group. The Board recalled the Adviser’s representation that the Adviser did not believe the Broadridge peer groups to be ideal comparisons to the Funds because of differing investment objectives, average credit quality, duration and maturity. At the request of the Adviser, the Board also compared the advisory fee rates and actual total expenses of the Funds against the Comparable Funds.
With respect to the Gurtin California Municipal Intermediate Value Fund, the Board observed that the actual advisory fee and actual total expense ratio were each less than the median of its Broadridge peers, and that the Gurtin California Municipal Intermediate Value Fund’s total expense ratio was also less than the average of the relevant Comparable Fund Group.
With respect to the Gurtin California Municipal Opportunistic Value Fund, the Board observed that the actual advisory fee and actual total expense ratio were each higher than the median of its Broadridge peers, but that the total expense ratio was less than the average of the relevant Comparable Fund Group. The Board noted the Adviser’s representation that the fees and expenses of the Gurtin California Municipal Opportunistic Value Fund were believed to be competitive and within a reasonable range of the peers.
With respect to the Gurtin National Municipal Intermediate Value Fund, the Board observed that the actual advisory fee and actual total expense ratio were each less than the median of its Broadridge peers, and that the Gurtin National Municipal Intermediate Value Fund’s total expense ratio was also less than the average of the relevant Comparable Fund Group.
With respect to the Gurtin National Municipal Opportunistic Value Fund, the Board observed that the actual advisory fee was less than the median of its Broadridge peers, but that the actual total expenses were higher than the median of its Broadridge peers and that the total expense ratio for the Gurtin National Municipal Opportunistic Value Fund was less than the average of the relevant Comparable Fund Group.
Based on the foregoing and other relevant considerations, the Board concluded that the advisory fees paid to the Adviser by the Funds appeared to be reasonable in light of the nature, extent and quality of services provided by the Adviser.
GURTIN VALUE FUNDS
ADDITIONAL INFORMATION (Unaudited)
SEPTEMBER 30, 2018
Cost of Services and Profitability
The Board considered information provided by the Adviser regarding the costs of services and its profitability with respect to the Funds. In this regard, the Board considered the Adviser’s resources devoted to the Fund, as well as the Adviser’s discussion of the aggregate costs and profitability of its mutual fund activity. The Board noted the Adviser’s representation that profitability with respect to the Funds was lower than anticipated due to the expenses associated with regulatory compliance and the large investments in systems, personnel, and infrastructure. Based on these and other applicable considerations, the Board concluded that the Adviser’s profits attributable to management of the Fund did not appear unreasonably high in light of the nature, extent and quality of the services provided by the Adviser.
Economies of Scale
The Board considered whether the Funds would benefit from any economies of scale. In this respect, the Board noted the Adviser’s representation that the Funds may benefit from economies of scale as assets continue to grow but, in light of the cost of services and profitability discussion above, the Adviser believed that breakpoints in the advisory fee were not appropriate at this time. Based on the foregoing information, the Board concluded that economies of scale were not a factor in approving the continuation of the Advisory Agreement.
Other Benefits
The Board noted the Adviser’s representation that, aside from its contractual advisory fees, it does not benefit in a material way from its relationship with the Funds. Based on the foregoing representation, the Board concluded that other benefits received by the Adviser from its relationship with the Fund were not a material factor in approving the continuation of the Advisory Agreement.
Conclusion
The Board did not identify any single factor as being of paramount importance, and different Trustees may have given different weight to different factors. The Board reviewed a memorandum from Fund/Trustee Counsel discussing the legal standards applicable to its consideration of the Advisory Agreement. Based on its review, including consideration of each of the factors referenced above, the Board determined, in the exercise of its reasonable business judgment, that the advisory arrangement, as outlined in the Advisory Agreement, was fair and reasonable in light of the services performed or to be performed, expenses incurred or to be incurred and such other matters as the Board considered relevant.
Investment Advisory Agreement Approval
At the September 13, 2018 meeting (“September meeting”) of the Board of Trustees of Forum Funds II (the “Trust”), the Board, including the Independent Trustees, considered the approval of an interim investment advisory agreement (“Interim Agreement”) and a new, permanent investment advisory agreement (“New Advisory Agreement”) between the Trust and Gurtin Municipal Bond Management (the “Adviser”) with respect to the investment advisory services to be provided to the Funds. The Interim Agreement and New Advisory Agreement (together, the “New Agreements”) were considered in connection with the anticipated termination of the existing investment advisory agreements (“Current Agreements”) between the Trust and the Adviser due to a strategic transaction between the Adviser and Pacific Investment Management Company (“PIMCO”), whereby PIMCO would acquire from the Adviser 100% ownership interest in the Adviser’s businesses (the “Transaction”), which was expected to close before December 31, 2018 and would result in the assignment and automatic termination of the Current Agreements.
In preparation for its deliberations, the Board requested and reviewed written responses from the Adviser to a due diligence questionnaire circulated on the Board's behalf concerning the Adviser’s personnel, operations, financial condition, performance, and services provided by the Adviser under the Current Agreements. The Board also discussed the materials with Fund counsel and, as necessary, with the Trust's administrator, Atlantic Fund Services. During its deliberations, the Board received an oral presentation from the Adviser, and was assisted by the advice of Fund/Trustee counsel. In connection with its deliberations, the Board also considered the broad range of information relevant to the annual contract review that is provided to the Board (including its various standing committees) at meetings throughout the year, including investment performance reports, related portfolio information, and other periodic reports. The Board noted that the Current Agreements were most recently renewed at an in-person meeting of the Board held on June 15, 2018 (the “June Meeting”).
GURTIN VALUE FUNDS
ADDITIONAL INFORMATION (Unaudited)
SEPTEMBER 30, 2018
At the September meeting, the Board reviewed, among other matters, the topics discussed below.
Nature, Extent & Quality of Services
Based on written materials received and the presentation from senior representatives of the Adviser regarding the Adviser’s operations, the Board considered the quality of services to be provided by the Adviser under the New Agreements. In this regard, the Board considered information regarding the experience, qualifications and professional background of the portfolio managers and other personnel at the Adviser who, under the Current Agreements currently have, and under the New Agreements would continue to have, principal responsibility for the Funds. The Board also considered the investment philosophy and decision-making process of those professionals.
The Board considered also the adequacy of the Adviser’s resources. The Board noted the Adviser’s representations that the firm is financially stable and has the operational capability and the necessary staffing and experience to continue providing quality investment advisory services to the Funds. Based on the presentation and the materials provided by the Adviser in connection with the Board’s consideration of the approval of the Advisory Agreement, the Board concluded that, overall, it was satisfied with the nature, extent and quality of services to be provided to the Funds under the New Agreements.
Performance
In connection with a presentation by the Adviser regarding its approach to managing the Funds, the Board reviewed the performance of the Funds compared to their respective benchmarks and compared to independent peer groups of funds identified by Broadridge Financial Solutions, Inc. (“Broadridge”) believed to have characteristics similar to those of the Funds, as originally reviewed by the Board at the June Meeting.
The Board observed that the Gurtin California Municipal Intermediate Value Fund outperformed its primary benchmark index, the ICE Bank of America Merrill Lynch 1-12 Year Municipal Index, for the one-year period ended March 31, 2018. The Board observed that the Gurtin California Municipal Intermediate Value Fund outperformed the median of its Broadridge peers for the one-year period ended March 31, 2018. The Board noted the Adviser’s representation that the Broadridge peers were not believed to represent an optimal comparison due to the Adviser’s perceived differences in the investment objectives, average credit quality, duration, and maturity of the respective portfolios compared to the Gurtin California Municipal Intermediate Value Fund. At the Adviser’s request, the Board also compared the Gurtin California Municipal Intermediate Value Fund’s performance to that of a group of peer funds believed by the Adviser to be more representative of the Gurtin California Municipal Intermediate Value Fund (the “Comparable Funds”) and observed that the Gurtin California Municipal Intermediate Value Fund outperformed the average of its Comparable Funds for the one-year period ended March 31, 2018.
The Board observed that the Gurtin California Municipal Opportunistic Value Fund underperformed its primary benchmark, the ICE Bank of America Merrill Lynch Municipal Miscellaneous 7-12 Year Index, for the one- and three-year periods ended March 31, 2018, and outperformed the primary benchmark for the five-year period ended March 31, 2018. The Board observed that the Gurtin California Municipal Opportunistic Value Fund outperformed median of its Broadridge peer group for the one- and three-year periods ended March 31, 2018. The Board also observed that the Gurtin California Municipal Opportunistic Value Fund outperformed the average of the relevant Comparable Funds for the one- and three-year periods ended March 31, 2018, noting that there were not a significant number of California-specific funds to develop a fully representative peer group for the Gurtin California Municipal Opportunistic Value Fund. The Board noted the Adviser’s representation that the Gurtin California Municipal Opportunistic Value Fund’s underperformance over the short term relative to the benchmark could be attributed, in part, to a difficult investment environment marked by low yields, a flat yield curve, and tight spreads. The Board also noted the Adviser’s representation that the Gurtin California Municipal Opportunistic Value Fund’s performance had improved since the period end as a result of a rise in interest rates and new investment opportunities.
The Board observed that the Gurtin National Municipal Intermediate Value Fund outperformed the ICE Bank of America Merrill Lynch 1-12 Municipal Index, the Fund’s primary benchmark index, for the one-year period ended March 31, 2018. The Board observed that the Gurtin National Municipal Intermediate Value Fund underperformed the median of its Broadridge peers for the one-year period ended March 31, 2018. At the request of the Adviser, the Board considered the Gurtin National Municipal Intermediate Value Fund’s performance against that of its respective Comparable Funds and observed that the Gurtin National
GURTIN VALUE FUNDS
ADDITIONAL INFORMATION (Unaudited)
SEPTEMBER 30, 2018
Municipal Intermediate Value Fund outperformed the average of the respective Comparable Funds for the one-year period ended March 31, 2018.
The Board observed that the Gurtin National Municipal Opportunistic Value Fund outperformed the ICE Bank of America Merrill Lynch Municipal Miscellaneous 7-12 Index, the Fund’s primary benchmark, for the one- and five-year periods ended March 31, 2018, while underperforming the primary benchmark for the three-year period ended March 31, 2018. The Board also observed that the Gurtin National Municipal Opportunistic Value Fund outperformed the median of its Broadridge peers for the one-year and three-year period ended March 31, 2018. At the request of the Adviser, the Board considered the Gurtin National Municipal Opportunistic Value Fund’s performance against that of its respective Comparable Funds and observed that the Gurtin National Municipal Opportunistic Value Fund outperformed the average of the respective Comparable Funds for the one-year period ended March 31, 2018. Based on the foregoing and other relevant factors, the Board concluded that the Adviser’s management of each Fund under the New Agreements could benefit each Fund and their respective shareholders.
Compensation
The Board evaluated the Adviser’s proposed compensation under the New Agreements for providing advisory services to the Funds and analyzed comparative information on actual advisory fee rates and actual total expenses of the Funds Broadridge peer group, as originally reviewed by the Board at the June Meeting. The Board recalled the Adviser’s representation that the Adviser did not believe the Broadridge peer groups to be ideal comparisons to the Funds because of differing investment objectives, average credit quality, duration and maturity. At the request of the Adviser, the Board also compared the advisory fee rates and actual total expenses of the Funds against the Comparable Funds. The Board also noted the Adviser’s representation that the advisory fee rates under the New Agreements were materially identical to the advisory fee rate under the Current Agreements. The Board further noted the Adviser’s representation that any advisory fees earned under the Interim Agreement would be escrowed until the Funds’ shareholders’ approval of the New Advisory Agreement, at which time the fees earned under the Interim Agreement and any interest accrued would be paid to the Adviser.
With respect to the Gurtin California Municipal Intermediate Value Fund, the Board observed that the actual advisory fee and actual total expense ratio were each less than the median of its Broadridge peers, and that the Gurtin California Municipal Intermediate Value Fund’s total expense ratio was also less than the average of the relevant Comparable Fund Group.
With respect to the Gurtin California Municipal Opportunistic Value Fund, the Board observed that the actual advisory fee and actual total expense ratio were each higher than the median of its Broadridge peers, but that the total expense ratio was less than the average of the relevant Comparable Fund Group. The Board noted the Adviser’s representation that the fees and expenses of the Gurtin California Municipal Opportunistic Value Fund were believed to be competitive and within a reasonable range of the peers.
With respect to the Gurtin National Municipal Intermediate Value Fund, the Board observed that the actual advisory fee and actual total expense ratio were each less than the median of its Broadridge peers, and that the Gurtin National Municipal Intermediate Value Fund’s total expense ratio was also less than the average of the relevant Comparable Fund Group.
With respect to the Gurtin National Municipal Opportunistic Value Fund, the Board observed that the actual advisory fee was less than the median of its Broadridge peers, but that the actual total expenses were higher than the median of its Broadridge peers and that the total expense ratio for the Gurtin National Municipal Opportunistic Value Fund was less than the average of the relevant Comparable Fund Group.
Based on the foregoing and other relevant considerations, the Board concluded that the advisory fees paid to the Adviser by the Funds appeared to be reasonable in light of the nature, extent and quality of services provided by the Adviser.
Cost of Services and Profitability
The Board considered information provided by the Adviser regarding the costs of services and its profitability with respect to the Funds. In this regard, the Board considered the Adviser’s resources devoted to the Fund, as well as the Adviser’s discussion of the aggregate costs and profitability of its mutual fund activity. The Board noted the Adviser’s representation that the advisory fee rates under the New Agreements were materially identical to the advisory fee rate under the Current Agreements. The Board also noted the Adviser’s representation that profitability with respect to the Funds was lower than anticipated due to the expenses associated
GURTIN VALUE FUNDS
ADDITIONAL INFORMATION (Unaudited)
SEPTEMBER 30, 2018
with regulatory compliance and the large investments in systems, personnel, and infrastructure. Based on these and other applicable considerations, the Board concluded that the Adviser’s profits attributable to management of the Fund did not appear unreasonably high in light of the nature, extent and quality of the services provided by the Adviser.
Economies of Scale
The Board considered whether the Funds would benefit from any economies of scale under the New Agreements. In this respect, the Board noted the Adviser’s representation that the Funds may benefit from economies of scale as assets continue to grow but, in light of the cost of services and profitability discussion above, the Adviser believed that breakpoints in the advisory fee were not appropriate at this time. Based on the foregoing information and other relevant considerations, the Board concluded that economies of scale were not a factor in approving the New Agreements.
Other Benefits
The Board noted the Adviser’s representation that, aside from its contractual advisory fees, it does not benefit in a material way from its relationship with the Funds. Based on the foregoing representation, the Board concluded that other benefits received by the Adviser from its relationship with the Fund were not a material factor in approving the New Agreements.
Conclusion
The Board did not identify any single factor as being of paramount importance, and different Trustees may have given different weight to different factors. The Board reviewed a memorandum from Fund/Trustee Counsel discussing the legal standards applicable to its consideration of the New Agreements. Based on its review, including consideration of each of the factors referenced above, the Board determined, in the exercise of its reasonable business judgment, that the advisory arrangements, as outlined in the New Agreements, were fair and reasonable in light of the services to be performed, expenses to be incurred and such other matters as the Board considered relevant.
Proxy Voting Information
A description of the policies and procedures that each Fund uses to determine how to vote proxies relating to securities held in each Fund’s portfolio is available, without charge and upon request, by calling (844) 342-5763 and on the Securities and Exchange Commission's (the "SEC") website at www.sec.gov. Each Fund’s proxy voting record for the most recent twelve-month period ended June 30 is available, without charge and upon request, by calling (844) 342-5763 and on the SEC’s website at www.sec.gov.
Availability of Quarterly Portfolio Schedules
Each Fund files its complete schedule of portfolio holdings with the SEC for the first and third quarters of each fiscal year on Form N-Q. These filings are available, without charge and upon request on the SEC’s website at www.sec.gov or may be reviewed and copied at the SEC’s Public Reference Room in Washington, DC. Information on the operation of the Public Reference Room may be obtained by calling (800) SEC-0330.
Federal Tax Status of Dividends Declared during the Fiscal Year
For federal income tax purposes, dividends from short-term capital gains are classified as ordinary income. The Gurtin National Municipal Opportunistic Value Fund designates 95.91% of its income dividend distributed as tax-exempt dividends. The Gurtin California Municipal Opportunistic Value Fund designates 96.51% of its income dividend distributed as tax-exempt dividends. The Gurtin National Municipal Intermediate Value Fund designates 98.66% of its income dividend distributed as tax-exempt dividends. The Gurtin California Municipal Intermediate Value Fund designates 93.15% and 5.51% of its income dividend distributed as tax-exempt dividends and qualified short-term gain exempt from U.S. tax for foreign shareholders (QSD), respectively.
GURTIN VALUE FUNDS
ADDITIONAL INFORMATION (Unaudited)
SEPTEMBER 30, 2018
Shareholder Expense Example
As a shareholder of the Funds, you incur ongoing costs, including management fees, distribution and/or service (12b-1) fees (for Investor Shares only) and other Fund expenses. This example is intended to help you understand your ongoing costs (in dollars) of investing in the Funds and to compare these costs with the ongoing costs of investing in other mutual funds.
The example is based on an investment of $1,000 invested at the beginning of the period and held for the entire period from April 1, 2018 through September 30, 2018.
Actual Expenses – The first line of the table below provides information about actual account values and actual expenses. You may use the information in this line, together with the amount you invested, to estimate the expenses that you paid over the period. Simply divide your account value by $1,000 (for example, an $8,600 account value divided by $1,000 = 8.6), then multiply the result by the number in the first line under the heading entitled “Expenses Paid During Period” to estimate the expenses you paid on your account during the period.
Hypothetical Example for Comparison Purposes – The second line of the table below provides information about hypothetical account values and hypothetical expenses based on each Fund’s actual expense ratio and an assumed rate of return of 5% per year before expenses, which is not each Fund’s actual return. The hypothetical account values and expenses may not be used to estimate the actual ending account balance or expenses you paid for the period. You may use this information to compare the ongoing costs of investing in each Fund and other funds. To do so, compare this 5% hypothetical example with the 5% hypothetical examples that appear in the shareholder reports of other funds.
Please note that the expenses shown in the table are meant to highlight your ongoing costs only. Therefore, the second line of the table is useful in comparing ongoing costs only and will not help you determine the relative total costs of owning different funds.
|
Beginning Account Value April 1, 2018 |
Ending Account Value September 30, 2018 |
Expenses Paid During Period* |
Annualized Expense Ratio* |
|||||||||||||
| Gurtin National Municipal Opportunistic Value Fund | ||||||||||||||||
| Actual | $ | 1,000.00 | $ | 1,007.85 | $ | 3.02 | 0.60 | % | ||||||||
| Hypothetical (5% return before expenses) | $ | 1,000.00 | $ | 1,022.06 | $ | 3.04 | 0.60 | % | ||||||||
| Gurtin California Municipal Opportunistic Value Fund | ||||||||||||||||
| Actual | $ | 1,000.00 | $ | 1,008.96 | $ | 3.02 | 0.60 | % | ||||||||
| Hypothetical (5% return before expenses) | $ | 1,000.00 | $ | 1,022.06 | $ | 3.04 | 0.60 | % | ||||||||
| Gurtin National Municipal Intermediate Value Fund | ||||||||||||||||
| Actual | $ | 1,000.00 | $ | 1,007.50 | $ | 1.96 | 0.39 | % | ||||||||
| Hypothetical (5% return before expenses) | $ | 1,000.00 | $ | 1,023.11 | $ | 1.98 | 0.39 | % | ||||||||
| Gurtin California Municipal Intermediate Value Fund | ||||||||||||||||
| Actual | $ | 1,000.00 | $ | 1,007.38 | $ | 1.96 | 0.39 | % | ||||||||
| Hypothetical (5% return before expenses) | $ | 1,000.00 | $ | 1,023.11 | $ | 1.98 | 0.39 | % | ||||||||
| * | Expenses are equal to the Fund’s annualized expense ratio multiplied by the average account value over the period, multiplied by the number of days in the most recent fiscal half-year (183) divided by 365 to reflect the half-year period. |
Trustees and Officers of the Trust
The Board is responsible for oversight of the management of the Trust’s business affairs and of the exercise of all the Trust’s powers except those reserved for the shareholders. The following table provides information about each Trustee and certain officers of the Trust. Each Trustee and officer holds office until the person resigns, is removed, or is replaced. Unless otherwise noted, the persons have held their principal occupations for more than five years. The address for all Trustees and officers is Three Canal Plaza, Suite 600, Portland, Maine 04101. Each Fund’s Statement of Additional Information includes additional information about the Trustees and is available, without charge and upon request, by calling (844) 342-5763.
GURTIN VALUE FUNDS
ADDITIONAL INFORMATION (Unaudited)
SEPTEMBER 30, 2018
|
Name and Year of Birth |
Position with the Trust |
Length of Time Served |
Principal Occupation(s) During Past Five Years |
Number of Series in Fund Complex Overseen By Trustee |
Other Directorships Held By Trustee During Past Five Years |
| Independent Trustees | |||||
|
David Tucker Born: 1958 |
Chairman of the Board; Trustee; Chairman, Nominating Committee and Qualified Legal Compliance Committee | Since 2013 | Director, Blue Sky Experience (a charitable endeavor), since 2008; Senior Vice President & General Counsel, American Century Companies (an investment management firm), 1998- 2008. | 4 | Trustee, Forum Funds; Trustee, Forum ETF Trust; Trustee, U.S. Global Investors Funds. |
|
Mark D. Moyer Born: 1959 |
Trustee; Chairman Audit Committee | Since 2013 | Chief Financial Officer, Freedom House (a NGO advocating political freedom and democracy), since 2017; independent consultant providing interim CFO services, principally to non-profit organizations, 2011-2017; Chief Financial Officer, Institute of International Education (a NGO administering international educational exchange programs), 2008-2011; Chief Financial Officer and Chief Restructuring Officer, Ziff Davis Media Inc. (an integrated media company), 2005-2008; Adjunct Professor of Accounting, Fairfield University from 2009-2012. | 4 | Trustee, Forum Funds; Trustee, Forum ETF Trust; Trustee, U.S. Global Investors Funds. |
|
Jennifer Brown-Strabley Born: 1964 |
Trustee | Since 2013 | Principal, Portland Global Advisors 1996-2010. | 4 | Trustee, Forum Funds; Trustee, Forum ETF Trust; Trustee, U.S. Global Investors Funds. |
| Interested Trustees(1) | |||||
|
Stacey E. Hong Born: 1966 |
Trustee | Since 2013 | President, Atlantic since 2008 | 4 | Trustee, Forum Funds, Trustee, U.S. Global Investors Funds. |
|
John Y. Keffer Born: 1942 |
Trustee | Since 2013 | Chairman, Atlantic since 2008; Chairman, Forum Investment Advisors, LLC since 2011; President, Forum Foundation (a charitable organization) since 2005; President, Forum Trust, LLC (a non-depository trust company chartered in the State of Maine) since 1997. | 4 | Trustee Forum ETF Trust; Trustee U.S. Global Investors Funds; Director, Wintergreen Fund, Inc. |
| (1) | Stacey E. Hong and John Y. Keffer are currently treated as an interested persons of the Trust, as defined in the 1940 Act, due to their affiliations with Atlantic. Atlantic and Forum Investment Advisors, LLC are subsidiaries of Forum Holdings Corp. I, a Delaware corporation that is wholly owned by Mr. Keffer. |
GURTIN VALUE FUNDS
ADDITIONAL INFORMATION (Unaudited)
SEPTEMBER 30, 2018
| Name and Year of Birth | Position with the Trust | Length of Time Served |
Principal Occupation(s) During Past 5 Years |
| Officers | |||
|
Jessica Chase Born: 1970 |
President; Principal Executive Officer | Since 2015 | Senior Vice President, Atlantic since 2008. |
|
Karen Shaw Born: 1972 |
Treasurer; Principal Financial Officer | Since 2013 | Senior Vice President, Atlantic since 2008. |
|
Zachary Tackett Born: 1988 |
Vice President; Secretary and Anti- Money Laundering Compliance Officer | Since 2014 | Counsel, Atlantic since 2014; Intern Associate, Coakley & Hyde, PLLC, 2010-2013. |
|
Timothy Bowden Born: 1969 |
Vice President | Since 2013 | Manager, Atlantic since 2008. |
|
Michael J. McKeen Born: 1971 |
Vice President | Since 2013 | Senior Vice President, Atlantic since 2008. |
|
Geoffrey Ney Born: 1975 |
Vice President | Since 2013 | Manager, Atlantic since 2013; Senior Fund Accountant, Atlantic, 2008-2013. |
|
Todd Proulx Born: 1978 |
Vice President | Since 2013 | Manager, Atlantic since 2013; Senior Fund Accountant, Atlantic, 2008-2013. |
|
Carlyn Edgar Born: 1963 |
Chief Compliance Officer | Since 2013 | Senior Vice President, Atlantic since 2008. |
FOR MORE INFORMATION
Investment Adviser
Gurtin Municipal Bond Management
440 Stevens Avenue, Suite 260
Solana Beach, CA 92075
www.gurtin.com
Transfer Agent
Atlantic Fund Services, LLC
P.O. Box 588
Portland, ME 04112
www.atlanticfundservices.com
Distributor
Foreside Fund Services, LLC
Three Canal Plaza, Suite 100
Portland, ME 04101
www.foreside.com
Gurtin National Municipal Opportunistic Value Fund
Gurtin California Municipal Opportunistic Value Fund
Gurtin National Municipal Intermediate Value Fund
Gurtin California Municipal Intermediate Value Fund
P.O. Box 588
Portland, ME 04112
(844) 342-5763
This report is submitted for the general information of the shareholders of the Funds. It is not authorized for distribution to prospective investors unless preceded or accompanied by an effective prospectus, which includes information regarding the Funds’ risks, objectives, fees and expenses, experience of its management, and other information.
223-ANR-0918

CARAVAN FRONTIER MARKETS OPPORTUNITIES FUND
INSTITUTIONAL SHARES (CFROX)
SUPRA INSTITUTIONAL SHARES (CSFOX)
ANNUAL REPORT
SEPTEMBER 30, 2018
CARAVAN FRONTIER MARKETS OPPORTUNITIES FUND
A MESSAGE TO OUR SHAREHOLDERS (Unaudited)
SEPTEMBER 30, 2018
Dear Shareholder,
From its launch on November 15, 2017 to the end our fiscal year ending September 30, 2018, the Caravan Frontier Markets Opportunities Fund – Supra Institutional Shares returned -11.8% net of fees, underperforming the benchmark MSCI Frontier Emerging Markets Net Total Return Index return of -5.7%i by 6.1%. Over the period, the MSCI Frontier Emerging Markets Index itself trailed returns posted by other major indices. The S&P 500 was the best performer, returning +15.0% followed by MSCI EAFE Index at +2.6%, and the MSCI Emerging Markets Index at -3.5%.
Review of the MSCI Frontier Emerging Markets Index
We believe rising US dollar and interest rates, higher oil prices, and trade tensions were main factors that drove returns in our frontier emerging market universe. A resurgent US dollar, underpinned by the Fed’s tightening and US macro strength, was a significant headwind particularly for countries with widening current account deficits and sizeable external financing needs. Argentina, Pakistan and Sri Lanka were materially affected in this regard. Heavyweight Argentina was the largest drag on the benchmark, returning -44.0% and subtracting -5.1%ii from the benchmark’s return. In order to bring these external balances closer to balance, these countries may have to enter a period of adjustments involving austerity measures and a contraction in economic activities.
During the period, many of the top contributors to the index return were oil producing nations including the top two positive contributors Colombia and Kuwait, which added +1.6% and +1.5%, respectively. Conversely, the Philippines, an oil importer (and the largest country in the benchmark), subtracted -3.9% from the benchmark and was the second largest detractor. Higher oil prices were a major driver behind widening current account deficits in the Philippines as well as other oil importers, resulting in weaker local currencies and upward inflationary pressures that we expect will compel central banks to raise rates more aggressively. On a sector basis, the energy sector was the largest positive contributor to returns, adding +1.3% over this fiscal year. Supply-side constraints such as the Iran oil embargo, infrastructure limitations in the US shale oil fields, and the steep drop in production from Venezuela all against a steady demand growth environment has been favorable for oil prices.
Trade tensions escalated further during the fiscal year as rhetoric turned to actual implementation of tariffs between the US and China, the world’s two largest economies. From a fundamental perspective, we believe the impact of trade protectionism on the frontier emerging market countries (barring a full-blown trade war with global recessionary implications) is relatively muted and think negative market reactions to trade fears somewhat overblown. We note that most frontier emerging markets have either trade deficits or small surpluses with the US and, therefore, are less likely to be targets of Trump’s ire. We estimate that altogether the countries in the MSCI Frontier Emerging Markets Index in 2017 posted a surplus of $35.3Biii with the US combined and actually a small deficit of $0.2B when Vietnam is excluded; the $35.3B is about 4% of the US total trade deficit of $797B in 2017. With an outsized export sector that is about 100% of its GDP, at first blush Vietnam stands out as an exception and a country that could be highly vulnerable to the trade war. However, we note that although a trade war between the US and China will likely be a negative in the short run for Vietnam due to trade disruptions, we believe the trade war also comes with a silver lining in the longer-term. Vietnam and other smaller exporters like Bangladesh may ultimately be better off because the trade war could accelerate the migration of factories out of China into other lower cost countries such as Vietnam and Bangladesh with already established manufacturing bases.
Performance Review of the Caravan Frontier Markets Opportunities Fund
Argentina and the Philippines were the two largest positive contributors to the Fund’s relative performance, adding +2.0% and +1.4%, respectively. On the negative side, Colombia and Sri Lanka were the Fund’s largest detractors, subtracting -3.0% and -1.9%, respectively.
In Argentina, the Fund was helped by a country underweight and, to a lesser extent, slightly better relative returns in our holdings. Argentina went through a tumultuous year, due to a converging of negative internal and external factors. Creeping doubts among investors about the Argentine central bank’s commitment to fighting inflation and a slow pace of fiscal deficit reductions snowballed into massive sell-offs in Q2 when dollar-weakness reversed into dollar strength as the US Treasury rates moved firmly higher. A central
| i | S&P 500 Index, MSCI Emerging Markets Index, MSCI EAFE Index and MSCI Frontier Markets Index USD total returns net of withholding taxes as well as valuation data, sourced on Bloomberg. Individual country-level holding returns provided gross of expenses and fees for illustrative purposes on Bloomberg |
| ii | Bloomberg Port attribution |
| iii | IMF, Direction of Trade Statistics |
CARAVAN FRONTIER MARKETS OPPORTUNITIES FUND
A MESSAGE TO OUR SHAREHOLDERS (Unaudited)
SEPTEMBER 30, 2018
bank rate hike to 40.0%, a record $50B IMF bailout, and the MSCI upgrade to emerging market status temporarily halted the declines until another bout of sell-off ensued in August. President Macri unexpected request for an accelerated disbursement of IMF funds via YouTube looked like an act of desperation, and even more so when the IMF did not respond right away to the request. The central bank’s move to boost the policy rate to 60.0% worked to stem the declines. In September, the Argentine equity market retraced some of the losses after IMF’s announcement of renegotiated terms in which it raised the size of bailout to $57B and accelerated the pace of funds as requested. The risk of social and political instability remains high, as the economy enters a recession and Macri’s reformist government implements a highly unpopular IMF austerity program that could threaten Macri’s bid for re-election in 2019. Our main holdings in Argentina include the local securities exchange and depository operator Bolsa y Mercados Argentinos (BYMA), which we believe should benefit from greater trading volumes driven by volatility in the country’s financial markets, sharply higher interest income from its float of deposits, and an MSCI upgrade of Argentina to emerging market status in mid-2019.
The Fund benefited from a significant country underweight in the Philippines with an average weight of 4.2% versus the benchmark’s average weight of 23.2%. A large overhang on the overall Philippine equity market has been the risk of rising inflation and concerns that the central bank may be behind the curve in keeping inflation expectations anchored. Inflation, as measured by the Consumer Price Index (CPI), has posted successively higher rates every month this calendar year and stood at 6.7% in September from 2.9% in December 2017, significantly above the central bank’s target band of 2-4%. The central bank’s policy rate is currently at 4.5%, after increasing the rate four times for a total of 150 basis points (1.50%). While the usual combination of a widening current account deficit and a weakening currency have driven inflation rates higher, the upward pressure on prices is also partly due to one-off effects from the imposition of higher sales taxes on various consumer products under Duterte’s tax reform initiative. This latter effect will wear off at the start of next year, easing some inflationary pressures. We have moderately increased our exposure to the Philippines during 3Q18, by adding to our existing position in Cosco Capital, an operator of hypermarkets and other retail chains, and adding a new name Metropolitan Bank. We expect Cosco Capital to benefit from US-dollar based remittance flows that come mainly from the US and the Middle East. A weaker Philippine peso translates into greater purchasing power for the local recipients of remittances who shop at Cosco’s stores. Metropolitan Bank is the country’s 2nd largest bank and should benefit from higher interest rates.
In Colombia, both the Fund’s underweight in the country and lower relative returns from our holdings hurt performance. Stock selection return was pulled down by a -50.7% return in local cement manufacturer Cemex Latam Holdings, which reported declines in earnings due to weaker than expected volumes and higher input costs driven by increased energy prices. We expect volumes to improve in 2H18 and into 2019, as construction projects, which had been put on hold during 1H18 due to political uncertainties leading up to the Presidential elections in June, are restarted with a newly elected pro-business President Duque in office.
The Fund’s underperformance in Sri Lanka was driven by both a country overweight (against an extremely low benchmark weight of just 0.6%) and a significantly lower relative return of our stock selection driven down by our holding in Tokyo Cement, which returned -63.0%. As a net importer of oil with a widening current account deficit, weakening currency, and a large portion of its external debt coming due over the next 2 years, Sri Lanka is in a difficult position from a macroeconomic perspective. Against this backdrop, Tokyo Cement has faced lower demand as the government has pulled back on some infrastructure projects in order to keep a lid on its budget deficit and debt levels. At the same time, the company has been saddled with higher costs as the weaker currency and high fuel prices have made purchase and transport of raw material imports more expensive in local currency terms; the company buys clinker from overseas.
This year was an inaugural year for the Fund and, as a result, there were some one-off startup issues that unfortunately weighed on its performance. During the first three days after launch, the Fund held only cash due to operational reasons – a decision which was conservative and prudent but unfortunately proved to be a drag on performance as the benchmark returned +1.3% over these first three days. A greater than normal cash weighting, driven by high capital inflows relative to the size of the fund in this start-up phase, continued to weigh on performance throughout November 2017 until the fund was fully invested in early December. Over a more ‘normalized’ period from January through September of this year when the Fund was fully invested, it returned -11.2% net of fees, in-line with the -11.1% return of our benchmark MSCI Frontier Emerging Markets Index.
Looking ahead
A salient feature of the global equity markets during this fiscal year (ending September) was the wide divergence in performance between the US equity market and the rest of the world. The S&P 500 has returned a world-beating +15.0%, significantly ahead of the international markets both developed and emerging/frontier. However, as we have entered the final calendar quarter of 2018, there are signs that a leadership change could be in the making. In October, the MSCI Frontier Emerging Markets Index has outperformed other
CARAVAN FRONTIER MARKETS OPPORTUNITIES FUND
A MESSAGE TO OUR SHAREHOLDERS (Unaudited)
SEPTEMBER 30, 2018
major equity market indices by returning -4.0%, significantly ahead of the S&P 500, the MSCI EAFE, and the MSCI Emerging Markets, which returned -6.9%, -8.0%, and -8.7%, respectively.
We attribute this to the fact that the frontier and smaller emerging market countries are less exposed to the factors that are dominating investor concerns: 1) negative effects of the US-China trade war that are beginning to materialize either through weakening macroeconomic data points or disappointing company earnings outlook, 2) a resetting of lofty expectations in the tech sector, particularly of growth at the mega-cap tech companies in the US that had been principle drivers behind the US equity market outperformance, and 3) concerns that US GDP growth has peaked, as the one time boost from the Trump tax cuts fade as we head into next year, leading to a slowdown in the US that could extend into downside implications for its major trading partners in the developed and emerging markets. All of these factors combined suggest a synchronous slowdown in major economies may be on the horizon, raising the possibility of a deceleration or a pause in the Fed’s interest rate hiking cycle that could lead to a fall in US treasury yields and the US dollar. Such a turn, if realized, could provide significant relief for the frontier emerging market universe by removing a heavy overhang particularly for those countries with high external financing needs, in our view. We believe a macroeconomic backdrop where the more advanced economies of the world are mired in trade disputes while the Fed shifts to a pause in the tightening cycle could create a supportive environment in which the less trade-dependent, higher growth frontier and small emerging market economies look relatively more attractive. With external risks minimized, we believe there is enough room for investor focus to shift back to country-specific internal growth drivers such as political and market reforms through which equities in the frontier and small emerging market universe can deliver the better returns.
We thank you for your investment in the Caravan Frontier Markets Opportunities Fund.
CARAVAN CAPITAL MANAGEMENT
Cliff Quisenberry, CFA
CEO/Chief Investment Officer
Caravan Capital Management, LLC
Important Disclosure
An investment in the Fund is subject to risk, including the possible loss of principal. Derivatives, such as options, futures, forwards and swaps, can be volatile, and a small investment in a derivative can have a large impact on the performance of the Fund. Foreign investments may be subject to additional risks which include international trade, currency, political, regulatory and diplomatic risks. Emerging markets investments additional risks include greater political and economic uncertainties as well as a relative lack of information about companies in such markets.
Securities traded on frontier and emerging markets are potentially illiquid and may be subject to volatility and high transaction costs. Frontier markets may be concentrated in the Commercial Banks industry, which can be affected by global and local economic conditions. Mid, Small and micro capitalization companies may be less liquid and their securities’ prices may fluctuate more than those of larger, more established companies. The Fund is newly created and does not have a full calendar year performance record.
CARAVAN FRONTIER MARKETS OPPORTUNITIES FUND
PERFORMANCE CHART AND ANALYSIS (Unaudited)
SEPTEMBER 30, 2018
The following chart reflects the change in the value of a hypothetical $100,000 investment in Institutional Shares, including reinvested dividends and distributions, in Caravan Frontier Markets Opportunities Fund (the “Fund”) compared with the performance of the benchmarks, the MSCI Frontier Emerging Markets Index and the secondary benchmark, MSCI Frontier Emerging Markets Net Total Return Index (the "indices"), since inception. The MSCI Frontier Emerging Markets Index is a capitalization weighted index that is designed to measure equity performance across large and mid cap companies across frontier emerging market countries. The total return of the indices includes the reinvestment of dividends and income. The total return of the Fund includes operating expenses that reduce returns, while the total return of the indices do not include expenses. The Fund is professionally managed, while the indices are unmanaged and are not available for investment.
Comparison of Change in Value of a $100,000 Investment
Caravan Frontier Markets Opportunities Fund - Institutional Shares vs. MSCI Frontier Emerging Markets Index vs. MSCI Frontier Emerging Markets Net Total Return Index
|
Average Annual Total Returns Periods Ended September 30, 2018 |
Since Inception* |
| Caravan Frontier Markets Opportunities Fund - Institutional Shares | -12.00% |
| Caravan Frontier Markets Opportunities Fund - Supra Institutional Shares | -11.77% |
| MSCI Frontier Emerging Markets Index (since November 14, 2017) | -8.01% |
| MSCI Frontier Emerging Markets Net Total Return Index (since November 14, 2017) | -5.68% |
| * | Institutional Shares commenced operations on November 14, 2017 and Supra Institutional Shares commenced operations on November 15, 2017. |
Performance data quoted represents past performance and is no guarantee of future results. Current performance may be lower or higher than the performance data quoted. Investment return and principal value will fluctuate so that shares, when redeemed, may be worth more or less than original cost. As stated in the Fund’s prospectus, the annual operating expense ratios (gross) for Institutional and Supra Institutional Shares are 2.14% and 2.07%, respectively. However, the Fund’s adviser has contractually agreed to waive its fee and/or reimburse Fund expenses to limit Total Annual Fund Operating Expenses After Fee Waiver and/or Expense Reimbursement (excluding all taxes, interest, portfolio transaction expenses, acquired fund fees and expenses, proxy expenses and extraordinary expenses) to 1.60% and 1.30%, respectively, through August 1, 2019 (the “Expense Cap”). The adviser may be reimbursed by the Fund for fees waived and expenses reimbursed by the adviser pursuant to the Expense Cap if such payment is approved by the Board, made within three years of the fee waiver or expense reimbursement, and does not cause the Total Annual Fund Operating Expenses After Fee Waiver and/or Expense Reimbursement to exceed the lesser of (i) the then-current expense cap, or (ii) the expense cap in place at the time the fees/expenses were waived/reimbursed. During the period, certain fees were waived and/or expenses reimbursed; otherwise, returns would have been lower. Shares redeemed or exchanged within 90 days of purchase will be charged a 2.00% redemption fee. The performance table and graph do not reflect the deduction of taxes that a shareholder would pay on Fund distributions or the redemption of Fund shares. For the most recent month-end performance, please call (844) 856-1516.
CARAVAN FRONTIER MARKETS OPPORTUNITIES FUND
SCHEDULE OF INVESTMENTS
SEPTEMBER 30, 2018
| Shares | Security Description | Value | ||||||
| Common Stock - 90.4% | ||||||||
| Argentina - 6.8% | ||||||||
| 26,200 | Adecoagro SA (a) | $ | 192,570 | |||||
| 3,400 | Banco Macro SA, ADR | 140,658 | ||||||
| 5,000 | BBVA Banco Frances SA, ADR | 58,350 | ||||||
| 70,763 | Bolsas y Mercados Argentinos SA | 615,256 | ||||||
| 15,217 | Grupo Clarin SA, GDR (a)(b) | 50,416 | ||||||
| 1,057,250 | ||||||||
| Bangladesh - 5.8% | ||||||||
| 573,352 | Beximco Pharmaceuticals, Ltd., GDR | 384,863 | ||||||
| 479,156 | Golden Harvest Agro Industries, Ltd. (a) | 219,134 | ||||||
| 8,704 | Youngone Corp. | 309,947 | ||||||
| 913,944 | ||||||||
| Colombia - 4.5% | ||||||||
| 103,838 | Almacenes Exito SA | 510,989 | ||||||
| 104,720 | CEMEX Latam Holdings SA (a) | 190,863 | ||||||
| 701,852 | ||||||||
| Cyprus - 1.7% | ||||||||
| 105,307 | Bank of Cyprus Holdings PLC (a) | 268,987 | ||||||
| Egypt - 5.5% | ||||||||
| 34,951 | Commercial International Bank Egypt SAE | 162,331 | ||||||
| 160,528 | Egyptian Financial Group-Hermes Holding Co. (a) | 154,078 | ||||||
| 17,933 | Egyptian International Pharmaceuticals | |||||||
| EIPICO | 112,652 | |||||||
| 171,940 | ElSewedy Electric Co. | 171,076 | ||||||
| 19,331 | Integrated Diagnostics Holdings PLC (c) | 81,190 | ||||||
| 41,198 | Obour Land For Food Industries | 43,681 | ||||||
| 247,783 | Oriental Weavers | 132,603 | ||||||
| 857,611 | ||||||||
| Estonia - 1.2% | ||||||||
| 169,297 | Tallink Grupp AS | 191,452 | ||||||
| Georgia - 4.0% | ||||||||
| 6,610 | Bank of Georgia Group PLC | 147,445 | ||||||
| 4,612 | Georgia Capital PLC (a) | 67,062 | ||||||
| 18,416 | TBC Bank Group PLC | 404,218 | ||||||
| 618,725 | ||||||||
| Kazakhstan - 4.2% | ||||||||
| 32,529 | Halyk Savings Bank of Kazakhstan JSC, | |||||||
| GDR | 346,434 | |||||||
| 23,797 | KCell JSC, GDR | 107,087 | ||||||
| 64,004 | Nostrum Oil & Gas PLC (a) | 202,300 | ||||||
| 655,821 | ||||||||
| Kenya - 3.5% | ||||||||
| 283,400 | Equity Group Holdings, Ltd. | 112,516 | ||||||
| 272,300 | KCB Group, Ltd. | 108,109 | ||||||
| 823,300 | KenolKobil, Ltd. Group | 130,339 | ||||||
| 819,100 | Safaricom PLC | 199,186 | ||||||
| 550,150 | ||||||||
| Kuwait - 8.4% | ||||||||
| 153,363 | Gulf Bank KSCP | 128,983 | ||||||
| 47,839 | Human Soft Holding Co. KSC | 512,786 | ||||||
| 121,923 | Mabanee Co. SAK | 254,945 | ||||||
| 104,625 | Mobile Telecommunications Co. KSC | 165,288 | ||||||
| 94,549 | National Bank of Kuwait SAKP | 257,889 | ||||||
| 1,319,891 | ||||||||
| Lithuania - 1.3% | ||||||||
| 338,918 | Siauliu Bankas AB | 196,750 | ||||||
| Mauritius - 1.4% | ||||||||
| 27,300 | MCB Group, Ltd. | 219,354 | ||||||
| Shares | Security Description | Value | ||||||
| Nigeria - 5.4% | ||||||||
| 5,334,693 | Guaranty Trust Bank PLC | $ | 534,750 | |||||
| 5,255,882 | Zenith Bank PLC | 309,911 | ||||||
| 844,661 | ||||||||
| Pakistan - 6.0% | ||||||||
| 85,100 | Kohinoor Textile Mills, Ltd. | 37,170 | ||||||
| 76,450 | Lucky Cement, Ltd. | 315,786 | ||||||
| 121,000 | MCB Bank, Ltd. | 196,057 | ||||||
| 317,000 | Oil & Gas Development Co., Ltd. | 390,545 | ||||||
| 939,558 | ||||||||
| Peru - 5.3% | ||||||||
| 114,207 | Alicorp SAA, Class C | 364,663 | ||||||
| 72,315 | BBVA Banco Continental SA | 87,108 | ||||||
| 800 | Credicorp, Ltd. | 178,464 | ||||||
| 282,344 | Ferreycorp SAA | 200,814 | ||||||
| 831,049 | ||||||||
| Philippines - 4.6% | ||||||||
| 2,472,000 | Cosco Capital, Inc. | 265,364 | ||||||
| 106,520 | Metropolitan Bank & Trust Co. | 132,090 | ||||||
| 19,141,000 | STI Education Systems Holdings, Inc. | 315,297 | ||||||
| 712,751 | ||||||||
| Romania - 3.8% | ||||||||
| 516,602 | Banca Transilvania SA | 298,997 | ||||||
| 87,735 | BRD-Groupe Societe Generale SA | 296,357 | ||||||
| 595,354 | ||||||||
| Senegal - 1.2% | ||||||||
| 5,449 | Sonatel | 193,908 | ||||||
| Sri Lanka - 3.1% | ||||||||
| 405,676 | John Keells Holdings PLC | 315,519 | ||||||
| 762,731 | Tokyo Cement Co. Lanka PLC | 123,607 | ||||||
| 331,311 | Tokyo Cement Co. Lanka PLC, Non-Voting Shares | 46,637 | ||||||
| 485,763 | ||||||||
| Ukraine - 1.3% | ||||||||
| 16,384 | MHP SE, GDR | 203,162 | ||||||
| United Arab Emirates - 3.4% | ||||||||
| 867,731 | Gulf Marine Services PLC (a) | 539,487 | ||||||
| Vietnam - 8.0% | ||||||||
| 2,936,000 | CP Pokphand Co., Ltd. | 262,533 | ||||||
| 106,000 | FPT Corp. | 210,387 | ||||||
| 52,996 | LS Cable & System Asia, Ltd. | 311,502 | ||||||
| 119,000 | Military Commercial Joint Stock Bank | 117,839 | ||||||
| 210,400 | PetroVietnam Technical Services Corp. | 209,250 | ||||||
| 129,024 | Superdong Fast Ferry Kien Giang JSC | 136,892 | ||||||
| 1,248,403 | ||||||||
| Total Common Stock (Cost $16,527,275) | 14,145,883 | |||||||
| Investment Companies - 3.0% | ||||||||
| 1,288,028 | Fondul Proprietatea SA | 299,157 | ||||||
| 36,722 | VinaCapital Vietnam Opportunity Fund, Ltd. | 167,522 | ||||||
| Total Investment Companies (Cost $469,741) | 466,679 | |||||||
| Exchange Traded Funds - 4.5% | ||||||||
| 9,700 | iShares MSCI Frontier 100 ETF | 275,868 | ||||||
| 10,700 | iShares MSCI Saudi Arabia ETF | 319,299 | ||||||
| 5,900 | WisdomTree Middle East Dividend Fund ETF | 112,395 | ||||||
| Total Exchange Traded Funds (Cost $668,586) | 707,562 | |||||||
See Notes to Financial Statements.
CARAVAN FRONTIER MARKETS OPPORTUNITIES FUND
SCHEDULE OF INVESTMENTS
SEPTEMBER 30, 2018
| Shares | Security Description | Value | ||||||
| Money Market Fund - 3.6% | ||||||||
| 570,281 | Fidelity Investments Treasury Portfolio, Institutional Shares, 2.02% (d) (Cost $570,281) | $ | 570,281 | |||||
| Investments, at value - 101.5% (Cost $18,235,883) | $ | 15,890,405 | ||||||
| Other Assets & Liabilities, Net - (1.5)% | (234,413 | ) | ||||||
| Net Assets - 100.0% | $ | 15,655,992 | ||||||
| ADR | American Depositary Receipt |
| ETF | Exchange Traded Fund |
| GDR | Global Depositary Receipt |
| JSC | Joint Stock Company |
| PLC | Public Limited Company |
| (a) | Non-income producing security. |
| (b) | Security fair valued in accordance with procedures adopted by the Board of Trustees. At the period end, the value of these securities amounted to $50,416 or 0.3% of net assets. |
| (c) | Security exempt from registration under Rule 144A under the Securities Act of 1933. At the period end, the value of these securities amounted to $81,190 or 0.5% of net assets. |
| (d) | Dividend yield changes daily to reflect current market conditions. Rate was the quoted yield as of September 30, 2018. |
The following is a summary of the inputs used to value the Fund's investments as of September 30, 2018.
The inputs or methodology used for valuing securities are not necessarily an indication of the risks associated with investing in those securities. For more information on valuation inputs, and their aggregation into the levels used in the table below, please refer to the Security Valuation section in Note 2 of the accompanying Notes to Financial Statements.
| Investments in | ||||
| Valuation Inputs | Securities | |||
| Level 1 - Quoted Prices | $ | 15,269,708 | ||
| Level 2 - Other Significant Observable Inputs | 570,281 | |||
| Level 3 - Significant Unobservable Inputs | 50,416 | |||
| Total | $ | 15,890,405 | ||
The Level 1 value displayed in this table are Common Stock, Investment Companies and Exchange Traded Funds. The Level 2 value displayed in this table is a Money Market Fund. Refer to this Schedule of Investments for a further breakout of each security by country.
The following is a reconciliation of Level 3 investments for which significant unobservable inputs were used to determine fair value.
| Common Stock | ||||
| Balance as of November 14, 2017 | $ | - | ||
| Purchase | 95,067 | |||
| Change in Unrealized Appreciation/ (Depreciation) | (44,651 | ) | ||
| Balance as of September 30, 2018 | $ | 50,416 | ||
| Net change in unrealized appreciation (depreciation) from investments held as of September 30, 2018* | $ | (44,651 | ) | |
| * | The change in unrealized appreciation/(depreciation) is included in net change in unrealized appreciation (depreciation) of investments in the accompanying Statement of Operations. |
The Fund utilizes the end of period methodology when determining transfers. There were no transfers among Level 1, Level 2 and Level 3 for the period ended September 30, 2018.
| PORTFOLIO HOLDINGS (Unaudited) | ||||
| % of Total Investments | ||||
| Argentina | 6.7 | % | ||
| Bangladesh | 5.7 | % | ||
| Colombia | 4.4 | % | ||
| Cyprus | 1.7 | % | ||
| Egypt | 5.4 | % | ||
| Estonia | 1.2 | % | ||
| Georgia | 3.9 | % | ||
| Kazakhstan | 4.1 | % | ||
| Kenya | 3.5 | % | ||
| Kuwait | 8.3 | % | ||
| Lithuania | 1.2 | % | ||
| Mauritius | 1.4 | % | ||
| Nigeria | 5.3 | % | ||
| Pakistan | 5.9 | % | ||
| Peru | 5.2 | % | ||
| Philippines | 4.5 | % | ||
| Romania | 3.7 | % | ||
| Senegal | 1.2 | % | ||
| Sri Lanka | 3.1 | % | ||
| Ukraine | 1.3 | % | ||
| United Arab Emirates | 3.4 | % | ||
| Vietnam | 7.9 | % | ||
| Investment Companies | 2.9 | % | ||
| Exchange Traded Funds | 4.5 | % | ||
| Money Market Fund | 3.6 | % | ||
| 100.0 | % | |||
See Notes to Financial Statements.
CARAVAN FRONTIER MARKETS OPPORTUNITIES FUND
STATEMENT OF ASSETS AND LIABILITIES
SEPTEMBER 30, 2018
| ASSETS | ||||
| Investments, at value (Cost $18,235,883) | $ | 15,890,405 | ||
| Foreign currency (Cost $6,224) | 6,220 | |||
| Receivables: | ||||
| Fund shares sold | 70,207 | |||
| Investment securities sold | 106,072 | |||
| Dividends | 21,051 | |||
| From investment adviser | 529 | |||
| Prepaid expenses | 3,072 | |||
| Deferred offering costs | 2,244 | |||
| Total Assets | 16,099,800 | |||
| LIABILITIES | ||||
| Payables: | ||||
| Investment securities purchased | 386,810 | |||
| Fund shares redeemed | 4,000 | |||
| Foreign capital gains tax payable | 12,722 | |||
| Accrued Liabilities: | ||||
| Fund services fees | 8,263 | |||
| Other expenses | 32,013 | |||
| Total Liabilities | 443,808 | |||
| NET ASSETS | $ | 15,655,992 | ||
| COMPONENTS OF NET ASSETS | ||||
| Paid-in capital | $ | 17,872,287 | ||
| Undistributed net investment income | 175,851 | |||
| Accumulated net realized loss | (33,277 | ) | ||
| Net unrealized depreciation | (2,358,869 | ) | ||
| NET ASSETS | $ | 15,655,992 | ||
| SHARES OF BENEFICIAL INTEREST AT NO PAR VALUE (UNLIMITED SHARES AUTHORIZED) | ||||
| Institutional Shares | 151,297 | |||
| Supra Institutional Shares | 1,623,551 | |||
| NET ASSET VALUE, OFFERING AND REDEMPTION PRICE PER SHARE* | ||||
| Institutional Shares (based on net assets of $1,332,133) | $ | 8.80 | ||
| Supra Institutional Shares (based on net assets of $14,323,859) | $ | 8.82 | ||
| * | Shares redeemed or exchanged within 90 days of purchase are charged a 2.00% redemption fee. |
See Notes to Financial Statements.
CARAVAN FRONTIER MARKETS OPPORTUNITIES FUND
STATEMENT OF OPERATIONS
PERIOD ENDED SEPTEMBER 30, 2018*
| INVESTMENT INCOME | ||||
| Dividend income (Net of foreign withholding taxes of $24,053) | $ | 390,372 | ||
| Interest income | 4,992 | |||
| Total Investment Income | 395,364 | |||
| EXPENSES | ||||
| Investment adviser fees | 124,951 | |||
| Fund services fees | 80,500 | |||
| Transfer agent fees: | ||||
| Institutional Shares | 16,433 | |||
| Supra Institutional Shares | 16,380 | |||
| Custodian fees | 36,511 | |||
| Registration fees: | ||||
| Institutional Shares | 717 | |||
| Supra Institutional Shares | 4,550 | |||
| Professional fees | 28,989 | |||
| Trustees' fees and expenses | 2,147 | |||
| Offering costs | 24,685 | |||
| Other expenses | 28,911 | |||
| Total Expenses | 364,774 | |||
| Fees waived and expenses reimbursed | (213,693 | ) | ||
| Net Expenses | 151,081 | |||
| NET INVESTMENT INCOME | 244,283 | |||
| NET REALIZED AND UNREALIZED GAIN (LOSS) | ||||
| Net realized loss on: | ||||
| Investments (Net of foreign withholding taxes of $1,823) | (24,880 | ) | ||
| Foreign currency transactions | (74,195 | ) | ||
| Net realized loss | (99,075 | ) | ||
| Net change in unrealized appreciation (depreciation) on: | ||||
| Investments | (2,345,478 | ) | ||
| Deferred foreign capital gains taxes | (12,722 | ) | ||
| Foreign currency translations | (669 | ) | ||
| Net change in unrealized appreciation (depreciation) | (2,358,869 | ) | ||
| NET REALIZED AND UNREALIZED LOSS | (2,457,944 | ) | ||
| DECREASE IN NET ASSETS RESULTING FROM OPERATIONS | $ | (2,213,661 | ) | |
| * | Commencement of operations was November 14, 2017. |
See Notes to Financial Statements.
CARAVAN FRONTIER MARKETS OPPORTUNITIES FUND
STATEMENT OF CHANGES IN NET ASSETS
| November 14, | ||||
| 2017* | ||||
| through | ||||
| September 30, | ||||
| 2018 | ||||
| OPERATIONS | ||||
| Net investment income | $ | 244,283 | ||
| Net realized loss | (99,075 | ) | ||
| Net change in unrealized appreciation (depreciation) | (2,358,869 | ) | ||
| Decrease in Net Assets Resulting from Operations | (2,213,661 | ) | ||
| DISTRIBUTIONS TO SHAREHOLDERS FROM | ||||
| Net investment income: | ||||
| Supra Institutional Shares | (2,634 | ) | ||
| Total Distributions to Shareholders | (2,634 | ) | ||
| CAPITAL SHARE TRANSACTIONS | ||||
| Sale of shares: | ||||
| Institutional Shares | 1,588,304 | |||
| Supra Institutional Shares | 16,647,153 | |||
| Reinvestment of distributions: | ||||
| Supra Institutional Shares | 2,634 | |||
| Redemption of shares: | ||||
| Institutional Shares | (40,015 | ) | ||
| Supra Institutional Shares | (327,422 | ) | ||
| Redemption fees: | ||||
| Institutional Shares | 186 | |||
| Supra Institutional Shares | 1,447 | |||
| Increase in Net Assets from Capital Share Transactions | 17,872,287 | |||
| Increase in Net Assets | 15,655,992 | |||
| NET ASSETS | ||||
| End of Period (Including line (a)) | $ | 15,655,992 | ||
| SHARE TRANSACTIONS | ||||
| Sale of shares: | ||||
| Institutional Shares | 155,632 | |||
| Supra Institutional Shares | 1,656,430 | |||
| Reinvestment of distributions: | ||||
| Supra Institutional Shares | 263 | |||
| Redemption of shares: | ||||
| Institutional Shares | (4,335 | ) | ||
| Supra Institutional Shares | (33,142 | ) | ||
| Increase in Shares | 1,774,848 | |||
| (a) Undistributed net investment income | $ | 175,851 | ||
| * | Commencement of operations. |
See Notes to Financial Statements.
CARAVAN FRONTIER MARKETS OPPORTUNITIES FUND
FINANCIAL HIGHLIGHTS
These financial highlights reflect selected data for a share outstanding throughout the period.
| November 14, | ||||
| 2017 (a) | ||||
| Through | ||||
| September 30, | ||||
| 2018 | ||||
| INSTITUTIONAL SHARES | ||||
| NET ASSET VALUE, Beginning of Period | $ | 10.00 | ||
| INVESTMENT OPERATIONS | ||||
| Net investment income (b) | 0.17 | |||
| Net realized and unrealized loss | (1.37 | ) | ||
| Total from Investment Operations | (1.20 | ) | ||
| REDEMPTION FEES(b) | 0.00 | (c) | ||
| NET ASSET VALUE, End of Period | $ | 8.80 | ||
| TOTAL RETURN | (12.00 | )%(d) | ||
| RATIOS/SUPPLEMENTARY DATA | ||||
| Net Assets at End of Period (000s omitted) | $ | 1,332 | ||
| Ratios to Average Net Assets: | ||||
| Net investment income | 1.98 | %(e) | ||
| Net expenses | 1.60 | %(e) | ||
| Gross expenses (f) | 4.52 | %(e) | ||
| PORTFOLIO TURNOVER RATE | 12 | %(d) | ||
| (a) | Commencement of operations. |
| (b) | Calculated based on average shares outstanding during the period. |
| (c) | Less than $0.01 per share. |
| (d) | Not annualized. |
| (e) | Annualized. |
| (f) | Reflects the expense ratio excluding any waivers and/or reimbursements. |
See Notes to Financial Statements.
CARAVAN FRONTIER MARKETS OPPORTUNITIES FUND
FINANCIAL HIGHLIGHTS
These financial highlights reflect selected data for a share outstanding throughout the period.
| November 15, | ||||
| 2017 (a) | ||||
| Through | ||||
| September 30, | ||||
| 2018 | ||||
| SUPRA INSTITUTIONAL SHARES | ||||
| NET ASSET VALUE, Beginning of Period | $ | 10.00 | ||
| INVESTMENT OPERATIONS | ||||
| Net investment income (b) | 0.19 | |||
| Net realized and unrealized loss | (1.37 | ) | ||
| Total from Investment Operations | (1.18 | ) | ||
| DISTRIBUTIONS TO SHAREHOLDERS FROM | ||||
| Net investment income | (0.00 | )(c) | ||
| Total Distributions to Shareholders | (0.00 | ) | ||
| REDEMPTION FEES(b) | 0.00 | (c) | ||
| NET ASSET VALUE, End of Period | $ | 8.82 | ||
| TOTAL RETURN | (11.77 | )%(d) | ||
| RATIOS/SUPPLEMENTARY DATA | ||||
| Net Assets at End of Period (000s omitted) | $ | 14,324 | ||
| Ratios to Average Net Assets: | ||||
| Net investment income | 2.15 | %(e) | ||
| Net expenses | 1.30 | %(e) | ||
| Gross expenses (f) | 3.04 | %(e) | ||
| PORTFOLIO TURNOVER RATE | 12 | %(d) | ||
| (a) | Commencement of operations. |
| (b) | Calculated based on average shares outstanding during the period. |
| (c) | Less than $0.01 per share. |
| (d) | Not annualized. |
| (e) | Annualized. |
| (f) | Reflects the expense ratio excluding any waivers and/or reimbursements. |
See Notes to Financial Statements.
CARAVAN FRONTIER MARKETS OPPORTUNITIES FUND
NOTES TO FINANCIAL STATEMENTS
SEPTEMBER 30, 2018
Note 1. Organization
The Caravan Frontier Markets Opportunities Fund (the “Fund”) is a diversified portfolio of Forum Funds II (the “Trust”). The Trust is a Delaware statutory trust that is registered as an open-end, management investment company under the Investment Company Act of 1940, as amended (the “Act”). Under its Trust Instrument, the Trust is authorized to issue an unlimited number of the Fund’s shares of beneficial interest without par value. The Fund currently offers two classes of shares: Institutional Shares and Supra Institutional Shares. Institutional Shares and Supra Institutional Shares commenced operations on November 14, 2017, and November 15, 2017, respectively. The Fund’s investment objective is long-term capital appreciation.
Note 2. Summary of Significant Accounting Policies
The Fund is an investment company and follows accounting and reporting guidance under Financial Accounting Standards Board (“FASB”) Accounting Standards Codification (“ASC”) Topic 946, “Financial Services-Investment Companies”. These financial statements are prepared in accordance with accounting principles generally accepted in the United States of America (“GAAP”), which require management to make estimates and assumptions that affect the reported amounts of assets and liabilities, the disclosure of contingent liabilities at the date of the financial statements, and the reported amounts of increases and decreases in net assets from operations during the fiscal period. Actual amounts could differ from those estimates. The following summarizes the significant accounting policies of the Fund:
Security Valuation – Securities are valued at market prices using the last quoted trade or official closing price from the principal exchange where the security is traded, as provided by independent pricing services on each Fund business day. In the absence of a last trade, securities are valued at the mean of the last bid and ask price provided by the pricing service. Shares of non-exchange traded open-end mutual funds are valued at net asset value (“NAV”). Short-term investments that mature in sixty days or less may be valued at amortized cost.
The Fund values its investments at fair value pursuant to procedures adopted by the Trust’s Board of Trustees (the “Board”) if (1) market quotations are not readily available or (2) the Adviser, as defined in Note 3, believes that the values available are unreliable. The Trust’s Valuation Committee, as defined in the Fund’s registration statement, performs certain functions as they relate to the administration and oversight of the Fund’s valuation procedures. Under these procedures, the Valuation Committee convenes on a regular and ad hoc basis to review such investments and considers a number of factors, including valuation methodologies and significant unobservable inputs, when arriving at fair value.
The Valuation Committee may work with the Adviser to provide valuation inputs. In determining fair valuations, inputs may include market-based analytics that may consider related or comparable assets or liabilities, recent transactions, market multiples, book values and other relevant investment information. Adviser inputs may include an income-based approach in which the anticipated future cash flows of the investment are discounted in determining fair value. Discounts may also be applied based on the nature or duration of any restrictions on the disposition of the investments. The Valuation Committee performs regular reviews of valuation methodologies, key inputs and assumptions, disposition analysis and market activity.
Fair valuation is based on subjective factors and, as a result, the fair value price of an investment may differ from the security’s market price and may not be the price at which the asset may be sold. Fair valuation could result in a different NAV than a NAV determined by using market quotes.
GAAP has a three-tier fair value hierarchy. The basis of the tiers is dependent upon the various “inputs” used to determine the value of the Fund’s investments. These inputs are summarized in the three broad levels listed below:
Level 1 - Quoted prices in active markets for identical assets and liabilities.
Level 2 - Prices determined using significant other observable inputs (including quoted prices for similar securities, interest rates, prepayment speeds, credit risk, etc.). Short-term securities with maturities of sixty days or less are valued at amortized cost, which approximates market value, and are categorized as Level 2 in the hierarchy. Municipal securities, long-term U.S. government obligations and corporate debt securities are valued in accordance with the evaluated price supplied by the pricing service and generally categorized as Level 2 in the hierarchy. Other securities that are categorized as Level 2 in the hierarchy include, but are not limited to, warrants that do not trade on an exchange, securities valued at the mean between the last reported bid and ask quotation and international equity
CARAVAN FRONTIER MARKETS OPPORTUNITIES FUND
NOTES TO FINANCIAL STATEMENTS
SEPTEMBER 30, 2018
securities valued by an independent third party with adjustments for changes in value between the time of the securities respective local market closes and the close of the U.S. market.
Level 3 - Significant unobservable inputs (including the Fund’s own assumptions in determining the fair value of investments).
The aggregate value by input level, as of September 30, 2018, for the Fund’s investments is included in the Fund’s Schedule of Investments.
Security Transactions, Investment Income and Realized Gain and Loss – Investment transactions are accounted for on the trade date. Dividend income is recorded on the ex-dividend date. Foreign dividend income is recorded on the ex-dividend date or as soon as possible after determining the existence of a dividend declaration after exercising reasonable due diligence. Income and capital gains on some foreign securities may be subject to foreign withholding taxes, which are accrued as applicable. Interest income is recorded on an accrual basis. Premium is amortized and discount is accreted using the effective interest method. Identified cost of investments sold is used to determine the gain and loss for both financial statement and federal income tax purposes.
Foreign Currency Translations – Foreign currency amounts are translated into U.S. dollars as follows: (1) assets and liabilities at the rate of exchange at the end of the respective period; and (2) purchases and sales of securities and income and expenses at the rate of exchange prevailing on the dates of such transactions. The portion of the results of operations arising from changes in the exchange rates and the portion due to fluctuations arising from changes in the market prices of securities are not isolated. Such fluctuations are included with the net realized and unrealized gain or loss on investments.
Foreign Currency Transactions – The Fund may enter into transactions to purchase or sell foreign currency contracts and options on foreign currency. Forward currency contracts are agreements to exchange one currency for another at a future date and at a specified price. A fund may use forward currency contracts to facilitate transactions in foreign securities, to manage a fund’s foreign currency exposure and to protect the U.S. dollar value of its underlying portfolio securities against the effect of possible adverse movements in foreign exchange rates. These contracts are intrinsically valued daily based on forward rates, and a fund’s net equity therein, representing unrealized gain or loss on the contracts as measured by the difference between the forward foreign exchange rates at the dates of entry into the contracts and the forward rates at the reporting date, is recorded as a component of NAV. These instruments involve market risk, credit risk, or both kinds of risks, in excess of the amount recognized in the Statement of Assets and Liabilities. Risks arise from the possible inability of counterparties to meet the terms of their contracts and from movement in currency and securities values and interest rates. Due to the risks associated with these transactions, a fund could incur losses up to the entire contract amount, which may exceed the net unrealized value included in its NAV.
Distributions to Shareholders – The Fund declares any dividends from net investment income and pays them annually. Any net capital gains and net foreign currency gains realized by the Fund are distributed at least annually. Distributions to shareholders are recorded on the ex-dividend date. Distributions are based on amounts calculated in accordance with applicable federal income tax regulations, which may differ from GAAP. These differences are due primarily to differing treatments of income and gain on various investment securities held by the Fund, timing differences and differing characterizations of distributions made by the Fund.
Federal Taxes – The Fund intends to continue to qualify each year as a regulated investment company under Subchapter M of Chapter 1, Subtitle A, of the Internal Revenue Code of 1986, as amended (“Code”), and to distribute all of their taxable income to shareholders. In addition, by distributing in each calendar year substantially all of their net investment income and capital gains, if any, the Fund will not be subject to a federal excise tax. Therefore, no federal income or excise tax provision is required. The Fund will file a U.S. federal income and excise tax return as required. The Fund’s federal income tax returns are subject to examination by the Internal Revenue Service for a period of three fiscal years after they are filed. As of September 30, 2018, there are no uncertain tax positions that would require financial statement recognition, de-recognition or disclosure.
Income and Expense Allocation – The Trust accounts separately for the assets, liabilities and operations of each of its investment portfolios. Expenses that are directly attributable to more than one investment portfolio are allocated among the respective investment portfolios in an equitable manner.
The Fund's class-specific expenses are charged to the operations of that class of shares. Income and expenses (other than expenses attributable to a specific class) and realized and unrealized gains or losses on investments are allocated to each class of shares based on the class’ respective net assets to the total net assets of the Fund.
CARAVAN FRONTIER MARKETS OPPORTUNITIES FUND
NOTES TO FINANCIAL STATEMENTS
SEPTEMBER 30, 2018
Offering Costs – Offering costs for the Caravan Frontier Markets Opportunities Fund of $26,929 consisted of fees related to the mailing and printing of the initial prospectus, certain startup legal costs, and initial registration filings. Such costs are amortized over a twelve-month period beginning with the commencement of operations of the Caravan Frontier Markets Opportunities Fund.
Redemption Fees – A shareholder who redeems or exchanges shares within 90 days of purchase will incur a redemption fee of 2.00% of the current NAV of shares redeemed or exchanged, subject to certain limitations. The fee is charged for the benefit of the remaining shareholders and will be paid to the Fund to help offset transaction costs. The fee is accounted for as an addition to paid-in capital. The Fund reserves the right to modify the terms of or terminate the fee at any time. There are limited exceptions to the imposition of the redemption fee. Redemption fees incurred for the Fund, if any, are reflected on the Statement of Changes in Net Assets.
Commitments and Contingencies – In the normal course of business, the Fund enters into contracts that provide general indemnifications by the Fund to the counterparty to the contract. The Fund’s maximum exposure under these arrangements is dependent on future claims that may be made against the Fund and, therefore, cannot be estimated; however, based on experience, the risk of loss from such claims is considered remote. The Fund has determined that none of these arrangements requires disclosure on the Fund’s balance sheet.
Note 3. Fees and Expenses
Investment Adviser – Caravan Capital Management, LLC (the “Adviser”) is the investment adviser to the Fund. Pursuant to an investment advisory agreement, the Adviser receives an advisory fee, payable monthly, from the Fund at an annual rate of 1.10% of the Fund’s average daily net assets.
Distribution – Foreside Fund Services, LLC serves as the Fund’s distributor (the “Distributor”). The Fund does not have a distribution (12b-1) plan; accordingly, the Distributor does not receive compensation from the Fund for its distribution services. The Adviser compensates the Distributor directly for its services. The Distributor is not affiliated with the Adviser or Atlantic Fund Administration, LLC (d/b/a Atlantic Fund Services) (“Atlantic”) or their affiliates.
Other Service Providers – Atlantic provides fund accounting, fund administration, compliance and transfer agency services to the Fund. The fees related to these services are included in Fund services fees within the Statement of Operations. Atlantic also provides certain shareholder report production and EDGAR conversion and filing services. Pursuant to an Atlantic services agreement, the Fund pays Atlantic customary fees for its services. Atlantic provides a Principal Executive Officer, a Principal Financial Officer, a Chief Compliance Officer and an Anti-Money Laundering Officer to the Fund, as well as certain additional compliance support functions.
Trustees and Officers – The Trust pays each Independent Trustee an annual fee of $16,000 ($21,000 for the Chairman) for service to the Trust. The Independent Trustees and Chairman may receive additional fees for special Board meetings. The Independent Trustees are also reimbursed for all reasonable out-of-pocket expenses incurred in connection with their duties as Trustees, including travel and related expenses incurred in attending Board meetings. The amount of Independent Trustees’ fees attributable to the Fund is disclosed in the Statement of Operations. Certain officers of the Trust are also officers or employees of the above named service providers, and during their terms of office received no compensation from the Fund.
Note 4. Expense Reimbursement and Fees Waived
The Adviser has contractually agreed to waive its fee and/or reimburse Fund expenses to limit total annual fund operating expenses (excluding all taxes, interest, portfolio transaction expenses, acquired fund fees and expenses, proxy expenses and extraordinary expenses) to 1.60% and 1.30%, through August 1, 2019, of the Institutional Shares and Supra Institutional Shares, respectively. Other fund service providers have voluntarily agreed to waive and reimburse a portion of their fees. These voluntary fee waivers and reimbursements may be reduced or eliminated at any time. For the period ended September 30, 2018, fees waived and/or reimbursed expenses were as follows:
| Total Fees Waived | ||||||||||||||
| Investment Adviser | Investment Adviser | and Expenses | ||||||||||||
| Fees Waived | Expenses Reimbursed | Other Waivers | Reimbursed | |||||||||||
| $ | 124,951 | $ | 62,134 | $ | 26,608 | $ | 213,693 | |||||||
The Adviser may be reimbursed by the Fund for fees waived and expenses reimbursed by the Adviser pursuant to the Expense Cap if such payment is approved by the Board, made within three years of the fee waiver or expense reimbursement, and does not cause the Total Annual Fund Operating Expenses After Fee Waiver and/or Expense Reimbursement to exceed the lesser of (i) the then-current
CARAVAN FRONTIER MARKETS OPPORTUNITIES FUND
NOTES TO FINANCIAL STATEMENTS
SEPTEMBER 30, 2018
expense cap, or (ii) the expense cap in place at the time the fees/expenses were waived/reimbursed. As of September 30, 2018, $187,085 is subject to recapture by the Adviser.
Note 5. Security Transactions
The cost of purchases and proceeds from sales of investment securities (including maturities), other than short-term investments during the period ended September 30, 2018, were $19,182,287 and $1,493,629, respectively.
Note 6. Federal Income Tax
As of September 30, 2018, the cost of investments for federal income tax purposes is $18,275,944 and the components of net depreciation were as follows:
| Gross Unrealized Appreciation | $ | 418,624 | ||
| Gross Unrealized Depreciation | (2,804,163 | ) | ||
| Net Unrealized Depreciation | $ | (2,385,539 | ) |
Distributions paid during the fiscal period ended as noted were characterized for tax purposes as follows:
| 2018 | ||||
| Ordinary Income | $ | 2,634 | ||
As of September 30, 2018, distributable earnings (accumulated loss) on a tax basis were as follows:
| Undistributed Ordinary Income | $ | 193,291 | ||
| Capital and Other Losses | (10,656 | ) | ||
| Unrealized Depreciation | (2,398,930 | ) | ||
| Total | $ | (2,216,295 | ) |
The difference between components of distributable earnings on a tax basis and the amounts reflected in the Statement of Assets and Liabilities are primarily due to investments in passive foreign investment companies (“PFIC”) and wash sales.
As of September 30, 2018, the Fund had $10,656 of available short-term capital loss carryforwards that have no expiration date.
On the Statements of Assets and Liabilities, as a result of permanent book to tax differences, certain amounts have been reclassified for the period ended September 30, 2018. The following reclassifications were the result of book to tax differences resulting from currency gains (losses), foreign tax expense reclassification and PFICs and has no impact on the net assets of the Fund.
| Undistributed Net Investment Income | $ | (65,798 | ) | |
| Accumulated Net Realized Gain | 65,798 |
Note 7. Recent Accounting Pronouncements
In August 2018, the Financial Accounting Standards Board (“FASB”) issued Accounting Standards Update (ASU) No. 2018-13 “Fair Value Measurement (Topic 820): Disclosure Framework – Changes to the Disclosure Requirements for Fair Value Measurement” (“ASU 2018-13”) which includes amendments intended to improve the effectiveness of disclosures in the notes to financial statements. For example, ASU 2018-13 includes additional disclosures regarding the range and weighted average of significant unobservable inputs used to develop Level 3 fair value measurements, and clarifications to the narrative description of measurement uncertainty disclosures. ASU 2018-13 is effective for interim and annual periods beginning after December 15, 2019. Management is currently evaluating the impact that ASU 2018-13 will have on the Fund's financial statements and related disclosures.
In September 2018, the Securities and Exchange Commission released Final Rule 33-10532 captioned “Disclosure Update and Simplification” which is intended to amend certain disclosure requirements that have become redundant, duplicative, overlapping, outdated, or superseded, in light of other Commission disclosure requirements, GAAP, or changes in the information environment. These changes will be effective November 5, 2018. Management is currently evaluating the impact that this release will have on the Fund's financial statements and related disclosures.
CARAVAN FRONTIER MARKETS OPPORTUNITIES FUND
NOTES TO FINANCIAL STATEMENTS
SEPTEMBER 30, 2018
Note 8. Subsequent Events
Subsequent events occurring after the date of this report through the date these financial statements were issued have been evaluated for potential impact, and the Fund has had no such events.
REPORT OF INDEPENDENT REGISTERED PUBLIC ACCOUNTING FIRM
To the Board of Trustees of Forum Funds II
and the Shareholders of Caravan Frontier Markets Opportunities Fund
Opinion on the Financial Statements
We have audited the accompanying statement of assets and liabilities of Caravan Frontier Markets Opportunities Fund, (the “Fund”), including the schedule of investments, as of September 30, 2018, and the related statements of operations and changes in net assets and the financial highlights for the period November 14, 2017 (commencement of operations) through September 30, 2018, and the related notes (collectively referred to as the “financial statements”). In our opinion, the financial statements present fairly, in all material respects, the financial position of the Fund as of September 30, 2018, and the results of its operations, the change in its net assets and its financial highlights for the period November 14, 2017 through September 30, 2018, in conformity with accounting principles generally accepted in the United States of America.
Basis for Opinion
These financial statements are the responsibility of the Fund’s management. Our responsibility is to express an opinion on the financial statements based on our audit. We are a public accounting firm registered with the Public Company Accounting Oversight Board (United States) (“PCAOB”) and are required to be independent with respect to the Fund in accordance with the U.S. federal securities law and the applicable rules and regulations of the Securities and Exchange Commission and the PCAOB.
We conducted our audit in accordance with the standards of the PCAOB. Those standards require that we plan and perform the audit to obtain reasonable assurance about whether the financial statements are free of material misstatement, whether due to error or fraud. The Fund is not required to have, nor were we engaged to perform, an audit of its internal control over financial reporting. As part of our audit we are required to obtain an understanding of internal control over its financial reporting but not for the purpose of expressing an opinion on the effectiveness of the Fund’s internal control over financial reporting. Accordingly, we express no such opinion.
Our audit included performing procedures to assess the risk of material misstatement of those financial statements, whether due to error or fraud, and performing procedures that respond to those risks. Such procedures included examining, on a test basis, evidence regarding the amounts and disclosures in the financial statements. Our procedures included confirmation of securities owned as of September 30, 2018 by correspondence with the custodian and brokers. Our audit also included evaluating the accounting principles used and significant estimates made by management, as well as evaluating the overall presentation of the financial statements. We believe that our audit provides a reasonable basis for our opinion.
BBD, LLP
We have served as the auditor of one or more of the Funds in the Forum Funds II since 2013.
Philadelphia, Pennsylvania
November 26, 2018
CARAVAN FRONTIER MARKETS OPPORTUNITIES FUND
ADDITIONAL INFORMATION (Unaudited)
SEPTEMBER 30, 2018
Proxy Voting Information
A description of the policies and procedures that the Fund uses to determine how to vote proxies relating to securities held in the Fund’s portfolio is available, without charge and upon request, by calling (844) 856-1516 and on the U.S. Securities and Exchange Commission’s (the “SEC”) website at www.sec.gov. The Fund’s proxy voting record for the period from the Fund’s commencement of operations to June 30 will be available, without charge and upon request, by calling (844) 856-1516 and no later than August 31 of this year on the SEC’s website at www.sec.gov.
Availability of Quarterly Portfolio Schedules
The Fund files its complete schedule of portfolio holdings with the SEC for the first and third quarters of each fiscal year on Form N-Q. These filings are available, without charge and upon request on the SEC’s website at www.sec.gov or may be reviewed and copied at the SEC’s Public Reference Room in Washington, DC. Information on the operation of the Public Reference Room may be obtained by calling (800) SEC-0330.
Shareholder Expense Example
As a shareholder of the Fund, you incur two types of costs: (1) transaction costs, including redemption fees, and (2) ongoing costs, including management fees and other Fund expenses. This example is intended to help you understand your ongoing costs (in dollars) of investing in the Fund, and to compare these costs with the ongoing costs of investing in other mutual funds.
The example is based on an investment of $1,000 invested at the beginning of the period and held for the entire period from April 1, 2018 through September 30, 2018.
Actual Expenses – The first line of the table below provides information about actual account values and actual expenses. You may use the information in this line, together with the amount you invested, to estimate the expenses that you paid over the period. Simply divide your account value by $1,000 (for example, an $8,600 account value divided by $1,000 = 8.6), then multiply the result by the number in the first line under the heading entitled “Expenses Paid During Period” to estimate the expenses you paid on your account during the period.
Hypothetical Example for Comparison Purposes – The second line of the table below provides information about hypothetical account values and hypothetical expenses based on the Fund’s actual expense ratio and an assumed rate of return of 5% per year before expenses, which is not the Fund’s actual return. The hypothetical account values and expenses may not be used to estimate the actual ending account balance or expenses you paid for the period. You may use this information to compare the ongoing costs of investing in the Fund and other funds. To do so, compare this 5% hypothetical example with the 5% hypothetical examples that appear in the shareholder reports of other funds.
Please note that the expenses shown in the table are meant to highlight your ongoing costs only and do not reflect any transactional costs, such as redemption fees. Therefore, the second line of the table is useful in comparing ongoing costs only and will not help you determine the relative total costs of owning different funds. In addition, if these transactional costs were included, your costs would have been higher.
|
Beginning Account Value April 1, 2018 |
Ending Account Value September 30, 2018 |
Expenses Paid During Period* |
Annualized Expense Ratio* |
|||||||||||||
| Institutional Shares | ||||||||||||||||
| Actual | $ | 1,000.00 | $ | 837.29 | $ | 7.37 | 1.60 | % | ||||||||
| Hypothetical (5% return before expenses) | $ | 1,000.00 | $ | 1,017.05 | $ | 8.09 | 1.60 | % | ||||||||
| Supra Institutional Shares | ||||||||||||||||
| Actual | $ | 1,000.00 | $ | 838.40 | $ | 5.99 | 1.30 | % | ||||||||
| Hypothetical (5% return before expenses) | $ | 1,000.00 | $ | 1,018.55 | $ | 6.58 | 1.30 | % | ||||||||
| * | Expenses are equal to the Fund’s annualized expense ratio multiplied by the average account value over the period, multiplied by the number of days in the most recent fiscal half-year (183) divided by 365 to reflect the half-year period. |
CARAVAN FRONTIER MARKETS OPPORTUNITIES FUND
ADDITIONAL INFORMATION (Unaudited)
SEPTEMBER 30, 2018
Federal Tax Status of Dividends Declared during the Fiscal Year
For federal income tax purposes, dividends from short-term capital gains are classified as ordinary income. The Fund designates 88.67% of its income dividend distributed for the qualified dividend rate (QDI) as defined in Section 1(h)(11) of the Code. The Fund also designates 1.35% of its income dividends as qualified interest income exempt from U.S. tax for foreign shareholders (QII).
Trustees and Officers of the Trust
The Board is responsible for oversight of the management of the Trust’s business affairs and of the exercise of all the Trust’s powers except those reserved for the shareholders. The following table provides information about each Trustee and certain officers of the Trust. Each Trustee and officer holds office until the person resigns, is removed, or is replaced. Unless otherwise noted, the persons have held their principal occupations for more than five years. The address for all Trustees and officers is Three Canal Plaza, Suite 600, Portland, Maine 04101. The Fund’s Statement of Additional Information includes additional information about the Trustees and is available, without charge and upon request, by calling (844) 856-1516.
|
Name and Year of Birth |
Position with the Trust |
Length of Time Served |
Principal Occupation(s) During Past Five Years |
Number of Series in Fund Complex Overseen By Trustee |
Other Directorships Held By Trustee During Past Five Years |
| Independent Trustees | |||||
|
David Tucker Born: 1958 |
Chairman of the Board; Trustee; Chairman, Nominating Committee and Qualified Legal Compliance Committee | Since 2013 | Director, Blue Sky Experience (a charitable endeavor), since 2008; Senior Vice President & General Counsel, American Century Companies (an investment management firm), 1998- 2008. | 2 | Trustee, Forum Funds; Trustee, Forum ETF Trust; Trustee, U.S. Global Investors Funds. |
|
Mark D. Moyer Born: 1959 |
Trustee; Chairman Audit Committee | Since 2013 | Chief Financial Officer, Freedom House (a NGO advocating political freedom and democracy), since 2017; independent consultant providing interim CFO services, principally to non-profit organizations, 2011-2017; Chief Financial Officer, Institute of International Education (a NGO administering international educational exchange programs), 2008-2011; Chief Financial Officer and Chief Restructuring Officer, Ziff Davis Media Inc. (an integrated media company), 2005-2008; Adjunct Professor of Accounting, Fairfield University from 2009-2012. | 2 | Trustee, Forum Funds; Trustee, Forum ETF Trust; Trustee, U.S. Global Investors Funds. |
|
Jennifer Brown-Strabley Born: 1964 |
Trustee | Since 2013 | Principal, Portland Global Advisors 1996-2010. | 2 | Trustee, Forum Funds; Trustee, Forum ETF Trust; Trustee, U.S. Global Investors Funds. |
| Interested Trustees(1) | |||||
|
Stacey E. Hong Born: 1966 |
Trustee | Since 2013 | President, Atlantic since 2008 | 2 | Trustee, Forum Funds, Trustee, U.S. Global Investors Funds. |
19
CARAVAN FRONTIER MARKETS OPPORTUNITIES FUND
ADDITIONAL INFORMATION (Unaudited)
SEPTEMBER 30, 2018
|
Name and Year of Birth |
Position with the Trust |
Length of Time Served |
Principal Occupation(s) During Past Five Years |
Number of Series in Fund Complex Overseen By Trustee |
Other Directorships Held By Trustee During Past Five Years |
|
John Y. Keffer Born: 1942 |
Trustee | Since 2013 | Chairman, Atlantic since 2008; Chairman, Forum Investment Advisors, LLC since 2011; President, Forum Foundation (a charitable organization) since 2005; President, Forum Trust, LLC (a non-depository trust company chartered in the State of Maine) since 1997. | 2 | Trustee Forum ETF Trust; Trustee U.S. Global Investors Funds; Director, Wintergreen Fund, Inc. |
| (1) | Stacey E. Hong and John Y. Keffer are currently treated as an interested persons of the Trust, as defined in the 1940 Act, due to their affiliations with Atlantic. Atlantic and Forum Investment Advisors, LLC are subsidiaries of Forum Holdings Corp. I, a Delaware corporation that is wholly owned by Mr. Keffer. |
| Name and Year of Birth | Position with the Trust | Length of Time Served | Principal Occupation(s) During Past 5 Years |
| Officers | |||
|
Jessica Chase Born: 1970 |
President; Principal Executive Officer | Since 2015 | Senior Vice President, Atlantic since 2008. |
|
Karen Shaw Born: 1972 |
Treasurer; Principal Financial Officer | Since 2013 | Senior Vice President, Atlantic since 2008. |
|
Zachary Tackett Born: 1988 |
Vice President; Secretary and Anti- Money Laundering Compliance Officer | Since 2014 | Counsel, Atlantic since 2014; Intern Associate, Coakley & Hyde, PLLC, 2010-2013. |
|
Timothy Bowden Born: 1969 |
Vice President | Since 2013 | Manager, Atlantic since 2008. |
|
Michael J. McKeen Born: 1971 |
Vice President | Since 2013 | Senior Vice President, Atlantic since 2008. |
|
Geoffrey Ney Born: 1975 |
Vice President | Since 2013 | Manager, Atlantic since 2013; Senior Fund Accountant, Atlantic, 2008-2013. |
|
Todd Proulx Born: 1978 |
Vice President | Since 2013 | Manager, Atlantic since 2013; Senior Fund Accountant, Atlantic, 2008-2013. |
|
Carlyn Edgar Born: 1963 |
Chief Compliance Officer | Since 2013 | Senior Vice President, Atlantic since 2008. |
20
CARAVAN FRONTIER MARKETS OPPORTUNITIES FUND
INSTITUTIONAL SHARES (CFROX)
SUPRA INSTITUTIONAL SHARES (CSFOX)
FOR MORE INFORMATION:
P.O. Box 588
Portland, ME 04112
(844) 856-1516 (toll free)
INVESTMENT ADVISER
Caravan Capital Management, LLC
950 Pacific Avenue, Suite 500
Tacoma, WA 98402
TRANSFER AGENT
Atlantic Fund Services
P.O. Box 588
Portland, ME 04112
www.atlanticfundservices.com
DISTRIBUTOR
Foreside Fund Services, LLC
Three Canal Plaza, Suite 100
Portland, Maine 04101
www.foreside.com
This report is submitted for the general information of the shareholders of the Fund. It is not authorized for distribution to prospective investors unless preceded or accompanied by an effective prospectus, which includes information regarding the Fund’s risks, objectives, fees and expenses, experience of its management, and other information.
206-ANR-0918
|
(a)
|
As of the end of the period covered by this report, Forum Funds II (the "Registrant") has adopted a code of ethics, which applies to its Principal Executive Officer and Principal Financial Officer (the "Code of Ethics").
|
| (c) |
There have been no amendments to the Registrant's Code of Ethics during the period covered by this report.
|
|
(a)
|
Included as part of report to shareholders under Item 1.
|
|
(b)
|
Not applicable.
|
|
By:
|
/s/ Jessica Chase
|
|
|
Jessica Chase, Principal Executive Officer
|
||
|
Date:
|
November 26, 2018
|
|
By:
|
/s/ Jessica Chase
|
|
|
Jessica Chase, Principal Executive Officer
|
||
|
Date:
|
November 26, 2018
|
|
By:
|
/s/ Karen Shaw
|
|
|
Karen Shaw, Principal Financial Officer
|
||
|
Date:
|
November 26, 2018
|
|
(1)
|
Each Trustee and Officer;
|
|
(2)
|
(i) Any officer, director or general partner of the Adviser; and (ii) any officer, director or general partner of the Distributor, where the Distributor in the ordinary course of business either (a) makes, participates in or obtains information regarding the Fund's purchase or sale of Covered Investments or (b) fills a function related to the making of any recommendation regarding the Fund's purchase or sale of Covered Investments;
|
|
(3)
|
Any employee of the Fund or Adviser, or of any company in a control relationship with the Fund or Adviser, whose regular functions (i) relate to the making of any recommendation regarding the Fund's purchase or sale of Covered Investments or (ii) include making, participating in or obtaining information regarding the purchase or sale of Covered Investments by a Fund; and
|
|
(4)
|
Any natural person in a control relationship with a Fund or Adviser who obtains information concerning recommendations made to a Fund about the purchase or sale of a Covered Investment.
|
|
(1)
|
Direct obligations of the United States Government;
|
|
(2)
|
Bankers' acceptances and bank certificates of deposit;
|
|
(3)
|
Commercial paper and debt instruments with a maturity at issuance of less than 366 days and that are rated in one of the two highest rating categories by a nationally recognized statistical rating organization;
|
|
(4)
|
Repurchase agreements covering any of the foregoing; and
|
|
(5)
|
Shares of registered open-end investment companies other than Funds.
|
|
(1)
|
Any Covered Investment which, within the most recent 15 days (a) is or has been held by the Trust or (b) is being or has been considered by the Trust or an Adviser for purchase by a Fund; and
|
|
(2)
|
Any option to purchase or sell, and any investment convertible into or exchangeable for, a Covered Investment.
|
|
(1)
|
Employ any device, scheme or artifice to defraud a Fund;
|
|
(2)
|
Make to a Fund or to the Adviser or Distributor any untrue statement of a material fact or omit to state to any of the foregoing a material fact necessary in order to make the statements made, in light of the circumstances under which they are made, not misleading;
|
|
(3)
|
Engage in any act, practice, or course of business that operates or would operate as a fraud or deceit upon a Fund; or
|
|
(4)
|
Engage in any manipulative practice with respect to a Fund.
|
|
(1)
|
Inducing or causing a Fund to take action, or to fail to take action, for the benefit of a person either in addition to or other than the Fund;
|
|
(2)
|
Accepting anything other than of de minimus value or any other preferential treatment from any entity with which a Fund does business;
|
|
(3)
|
Using knowledge of the operating activities or portfolio transactions of a Fund for their benefit or the benefit of any person other than the Fund;
|
|
(4)
|
Violating the anti-fraud provisions of the securities laws; or
|
|
(5)
|
Except for the Independent Trustees, serving on the boards of directors of publicly traded companies, absent prior authorization based upon a determination by the Review Officer that the board service would be consistent with the interests of the Fund and its shareholders.
|
|
(1)
|
The Access Person's direct or indirect beneficial ownership of any securities of the subject issuer or in the investment;
|
|
(2)
|
Any position with such issuer or its Affiliated Persons; and
|
|
(3)
|
Any present or proposed business relationship between such issuer or its Affiliated Persons, on the one hand, and such person or any party in which such person has a significant interest, on the other hand.
|
|
(1)
|
Provide full access to the Trust to any and all records and documents which the Trust considers relevant to any investment transactions or other matters subject to the Code;
|
|
(2)
|
Cooperate with the Trust in investigating any investment transactions or other matter subject to the Code;
|
|
(3)
|
Provide the Trust with an explanation (in writing if requested) of the facts and circumstances surrounding any investment transaction or other matter subject to the Code; and
|
|
(4)
|
Notify the Review Officer in writing, from time to time, of any incident of noncompliance with the Code by any Access Person.
|
|
(1)
|
That during the 15-day period immediately preceding or immediately following the transaction in a Covered Investment by the Independent Trustee, the Covered Investment is or was purchased or sold or was being considered for purchase or sale by a Fund or that Fund's Adviser, or
|
|
(2)
|
The Independent Trustee possessed material non-public information about the operating activities of a Fund or the Trust preceding a transaction in Shares of the Fund.
|
|
(1)
|
The title, number of shares and principal amount of each Covered Investment in which the Access Person had any direct or indirect beneficial ownership when the person became an Access Person;
|
|
(2)
|
The name of any broker, dealer or bank with whom the Access Person maintained an account in which any securities were held for the direct or indirect benefit of the Access Person as of the date the person became an Access Person; and
|
|
(3)
|
The date that the report is submitted by the Access Person.
|
|
(1)
|
With respect to any transaction during the quarter in a Covered Investment in which the Access Person had, or by reason of such transaction acquired, any direct or indirect beneficial ownership:
|
|
(a)
|
The date of the transaction, the title, the interest rate and maturity date (if applicable), the number of shares and the principal amount of each Covered Investment involved;
|
|
(b)
|
The nature of the transaction (i.e., purchase, sale or any other type of acquisition or disposition);
|
|
(c)
|
The price of the Covered Investment at which the transaction was effected; the name of the broker, dealer or bank with or through which the transaction was effected; and
|
|
(d)
|
The date that the report is submitted by the Access Person.
|
|
(2)
|
With respect to any account established by the Access Person in which any investment were held during the quarter for the direct or indirect benefit of the Access Person:
|
|
(a)
|
The name of the broker, dealer or bank with whom the Access Person established the account;
|
|
(b)
|
The date the account was established; and
|
|
(c)
|
The date that the report is submitted by the Access Person.
|
|
(1)
|
The title, number of shares and principal amount of each Covered Investment in which the Access Person had any direct or indirect beneficial ownership;
|
|
(2)
|
The name of any broker, dealer or bank with whom the Access Person maintains an account in which any securities are held for the direct or indirect benefit of the Access Person; and
|
|
(3)
|
The date that the report is submitted by the Access Person.
|
|
(1)
|
Service on the board of directors or governing board of a publicly traded entity;
|
|
(2)
|
The receipt of any non-nominal gifts from persons or entities who have or are seeking business relationships with the Trust or a Fund;
|
|
(3)
|
The receipt of any entertainment from any company with which the Trust has current or prospective business dealings unless such entertainment is business-related, reasonable in cost, appropriate as to time and place, and not so frequent as to raise any question of impropriety;
|
|
(4)
|
Any ownership interest (material to the officer) in, or any consulting or employment relationship with, any entities doing business with the Trust, other than its service providers and their respective Affiliated Persons; and
|
|
(5)
|
Any direct or indirect financial interest in commissions, transaction charges or spreads paid by the Trust for effecting portfolio transactions or for selling or redeeming shares other than an interest arising from the Covered Officer's employment with the Trust's service providers or their respective Affiliated Persons.
|
|
(1)
|
Become familiar with the disclosure requirements generally applicable to the Trust;
|
|
(2)
|
Not knowingly misrepresent, or cause others to misrepresent, facts about the Trust to others;
|
|
(3)
|
To the extent appropriate, consult with other Officers and employees of the Trust and its service providers;
|
|
(4)
|
Promote compliance with the standards and restrictions imposed by applicable laws; and
|
|
(5)
|
Not retaliate against any other Covered Officer or any employee of the Fund or its Service Providers for reporting potential violations of by the Fund, its Service Providers, or another Covered Officer that are made in good faith.
|
|
(1)
|
Review all investment transaction and holdings reports or shall maintain the names of persons responsible for reviewing these reports;
|
|
(2)
|
Identify all Access Persons who are required to make these reports, maintain and periodically update a list of such Access Persons, and promptly inform each Access Person of the requirements of this Code;
|
|
(3)
|
Compare, on a quarterly basis, all Access Persons' transactions in Covered Investments with each Fund's completed portfolio transactions and in the case of transactions in Shares, with operating activities of the Fund, to determine whether a Code violation may have occurred;
|
|
(4)
|
Maintain a signed acknowledgment by each person who is then an Access Person;
|
|
(5)
|
Identify persons who are Investment Personnel, maintain and periodically update a list of such Investment Personnel, and inform those persons of their requirements to obtain prior written approval from the Review Officer prior to directly or indirectly acquiring ownership of a security in any private placement or initial public offering; and
|
|
(6)
|
Annually prepare a written report to the Trustees that
|
|
(a)
|
Describes any issues under this Code since the last report to the Trustees, including information about material violations of the Code and sanctions imposed in response to the material violations; and
|
|
(b)
|
Confirm that the Trust has adopted procedures reasonably necessary to prevent Access Persons from violating this Code.
|
|
(1)
|
A copy of this and any other code of ethics adopted by the Trust, Adviser or Affiliated Distributor, which has been in effect at any time during the previous five (5) years, in an easily accessible place;
|
|
(2)
|
A record of any violation of this Code, and of any action taken as a result of such violation, in an easily accessible place for at least five (5) years after the end of the fiscal year in which the violation occurs;
|
|
(3)
|
A copy of each report made by an Access Person as required by this Code for at least five (5) years after the end of the fiscal year in which the report is made, the first two (2) years in an easily accessible place;
|
|
(4)
|
A list of all persons who are, or at any time within the past five years have been, required to make reports or who were responsible for reviewing these reports pursuant to any code of ethics, in an easily accessible place;
|
|
(5)
|
A copy of each written report and certification required pursuant to Section 7(E) of this Code for at least five (5) years after the end of the fiscal year in which it is made, the first two (2) years in an easily accessible place; and
|
|
(6)
|
A record of any decision, and the reasons supporting the decision, approving the acquisition by Investment Personnel of securities under Section 6(B)(5) of this Code, for at least five (5) years after the end of the fiscal year in which the approval is granted.
|
|
Date:
|
November 26, 2018
|
/s/ Jessica Chase
|
||
|
Jessica Chase
|
||||
|
Principal Executive Officer
|
|
Date:
|
November 26, 2018
|
/s/ Karen Shaw
|
||
|
Karen Shaw
|
||||
|
Principal Financial Officer
|
|
1.
|
The Report containing the financial statements fully complies with the requirements of section 13(a) or 15(d) of the Securities Exchange Act of 1934; and
|
|
2.
|
The information contained in the Report fairly presents, in all material respects, the financial condition and results of operations of the Trust as of, and for, the periods presented in the Report.
|
|
Dated:
|
November 26, 2018
|
|
|
/s/ Jessica Chase
|
||
|
Jessica Chase
|
||
|
Principal Executive Officer
|
||
|
Dated:
|
November 26, 2018
|
|
|
/s/ Karen Shaw
|
||
|
Karen Shaw
|
||
|
Principal Financial Officer
|
Serious News for Serious Traders! Try StreetInsider.com Premium Free!
You May Also Be Interested In
- Director/PDMR Shareholding
- Global Luxury Hotel Brand Signs Letter of Intent with PHAL as Top 10 Group Advances to Proof of Concept
- Fox ESS Shines at The Smarter E Europe 2026 with Full-Ecosystem Offerings and AI-Driven Booth Experience
Create E-mail Alert Related Categories
SEC FilingsSign up for StreetInsider Free!
Receive full access to all new and archived articles, unlimited portfolio tracking, e-mail alerts, custom newswires and RSS feeds - and more!