

Form N-CSR FORUM FUNDS For: Jun 30
 Tweet
Tweet Share
Share
AUXIER FOCUS FUND
Annual Report
June 30, 2018
Fund Adviser:
Auxier Asset Management LLC
15668 NE Eilers Road
Aurora, Oregon 97002
Toll Free: (877) 3AUXIER or (877) 328-9437
AUXIER FOCUS FUND
A MESSAGE TO OUR SHAREHOLDERS (Unaudited)
JUNE 30, 2018
Market Commentary
In the second quarter, the US enjoyed improving fundamentals in terms of GDP1, employment, service sector and manufacturing gains. Home equity continues to increase, hitting records. Rising interest rates are pressuring bonds, bond surrogates and businesses with poor balance sheets. Lower taxes and regulation rollbacks are being offset somewhat over the worries of escalating trade tensions. The tax act expensing allowance is stimulating capital spending which in turn should improve overall productivity. While earnings in general are rising so are input costs like labor, fuel and transportation. Tariffs are leading to steep price increases in goods like steel and lumber. There continues to be a growing and acute shortage of truckers with a projected shortfall of over 50,000 drivers. We are seeing rolling industry corrections with increased volatility, in part due to tightened liquidity and the concentration of high frequency exchange-traded funds (ETFs). Higher interest rates and a strong US dollar have led to a sharp correction in emerging market currencies where low rates have led to a borrowing binge the last few years. Higher rates expose bad behavior and poor investment decisions.
Performance Update
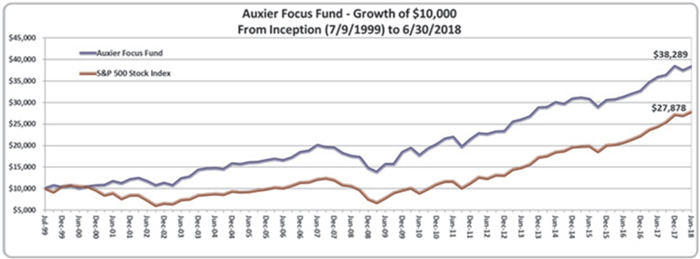
Auxier Focus Fund’s Investor Class returned 6.97% for the year ended June 30, 2018 vs. 14.37% for the S&P 500 Index. The stocks in the Fund returned 8.7%. Domestic stocks comprised 81% and foreign 15%, with cash and “workouts” 4%. From inception at the top of the market in 1999 to June 30, 2018, a hypothetical $10,000 investment in the Fund has grown to $38,289, with an average equity exposure of 78% compared to $27,878 for the fully invested S&P 500. When we started the Fund, General Electric was one of the most highly valued and popular companies in the world. $10,000 invested in General Electric back then is worth less than $6,500 as of June 30. Buy, hold and forget, without aggressive research, can be costly.
Contributors:
UnitedHealth Group (UNH)
Revenues grew 13.3% to $55.2 billion. Earnings from operations increased 18.8% to $4.1 billion. Every business segment reported double-digit earnings growth. Cash flows from operations for the quarter
Auxier Focus Fund – Investor Class
Average Annual Total Returns (6/30/2018)
Since Inception (07/09/1999) 7.33%
10-year 8.13%
5-year 8.09%
1-year 6.97%
3-month 2.39%
Performance data quoted represents past performance and is no guarantee of future results. Current performance may be lower or higher than the performance data quoted. Investment return and principal value will fluctuate so that an investor's shares, when redeemed, may be worth more or less than original cost. As stated in the current prospectus, the Fund’s Investor Class Share’s annual operating expense ratio (gross) is 1.10%. The Fund’s adviser has contractually agreed to waive a portion of its fee and/or reimburse Fund expenses to limit total annual operating expenses at 0.98%, which is in effect until October 31, 2018. Other share classes may vary. The Fund charges a 2.0% redemption fee on shares redeemed within six months of purchase. For the most recent month-end performance, please call (877) 328-9437 or visit the Adviser’s website at www.auxierasset.com. The recent growth rate in the stock market has helped to produce short-term returns that are not typical and may not continue in the future.
AUXIER FOCUS FUND
A MESSAGE TO OUR SHAREHOLDERS (Unaudited)
JUNE 30, 2018
were $8.37 billion, up 29.63%. UnitedHealth repurchased 11.6 million shares for $2.65 billion during the first quarter. They also paid $722 million in dividends, an increase of 21.1%. UnitedHealth ended its exclusivity deal with Lab Corp this quarter and added Quest Diagnostics as one of its diagnostic service providers. This will provide their customers with more diverse diagnostic options in the future.
Valero Energy Corp. (VLO)
Valero saw revenues of $26.44 billion, up 21.44%. EPS2 was $1.09, up 60.29%. Net income for the quarter was $469 million, up 112.79%. Net cash flow from operating activities was $138 million, down 86.03%. The decrease in cash flow was due largely in part to the company’s continued investments in the future growth of the business. Capital investment plans for 2018 remain at $2.7 billion. $1 billion of this amount is for growth projects and the remaining $1.7 billion is for sustaining the business. Continued increase in US oil production and the decision to increase OPEC3 production by 1 million barrels per day will increase Valero’s earning potential. Growth prospects for Valero include renewable energy ventures such as a wind farm in Texas and a renewable diesel plant in Louisiana that will produce 10,000 barrels per day. Valero plans to increase production in this plant by 70% by the end of 2018.
Anthem Inc. (ANTM)
Total operating revenues remained flat at $22.3 billion. The total operating margin increased by 130 basis points to 8.4%. Net income increased by 30% to $1.31 billion. The increase in net income was driven by improved cost management and a lower tax rate. Anthem paid dividends of $0.75 per share in both Q1 and Q2 which equates to an annual dividend of $3.00 per share.
Becton Dickinson (BDX)
Becton Dickinson saw strong revenue growth in all three of their main segments leading to overall revenue growth of 47.2%. The continuing integration of Bard is going faster than expected.
| Top Holdings on 6/30/2018 | % Assets |
| UnitedHealth Group, Inc. | 4.3 |
| Bank of New York Mellon Corp. | 4.1 |
| Mastercard, Inc. Class A | 4.1 |
| Microsoft Corp. | 3.7 |
| Medtronic PLC | 3.4 |
| PepsiCo, Inc. | 3.3 |
| Johnson & Johnson | 2.9 |
| Phillip Morris International, Inc. | 2.9 |
| BP PLC | 2.8 |
|
Merck & Co, Inc. New |
2.5 |
Express Scripts (ESRX)
Cigna is acquiring Express Scripts for $48.75 in cash and 0.2434 of Cigna stock per share, which is over $90 a share. The deal is expected to close by the end of 2018.
Kroger (KR)
Kroger has focused on staying ahead of competitors as it adds three automatic warehouses for grocery delivery via robots this year. Their investments prove worthwhile, as their digital sales grew by 66% last quarter. In the next few years they expect their warehouse number to reach 20 and to benefit from their recently announced partnership with Nuro, an autonomous driving company. In terms of products, Kroger’s Simple Truth brand has reached $2 billion in annual sales, helping drive their adjusted net earnings up 14%.
Mastercard (MA)
Both transaction numbers and gross dollar volume were up for Mastercard, with net revenue rising 27% this past quarter to $3.6 billion. They have exemplified a strong push for growth in emerging markets with the recent acquisition of Oltio, which resides in South Africa. Acquiring Oltio enables Mastercard to introduce digital payments to even the smallest of local businesses to accelerate growth. In addition, their VocaLink subsidiary continues to drive their “Other Revenues” category, which was up 33% via its real time payments. As cash still makes up 80% of world’s total transactions, many believe Mastercard has plenty of room to grow even as an established company.
Biogen (BIIB)
Biogen saw revenues increase by 9% to $3.4 billion. Revenue growth was driven by Spinal Muscular Atrophy drug Spinraza which saw a 108% increase in revenue. Spinraza is Biogen’s fastest growing drug which they hope will be able to offset the slowing Multiple Sclerosis product line. Biogen presented the detailed results for the phase II trials of their Alzheimer’s drug BAN2401 on July 25th. The results of the trial were positive with tested patients showing 30% less cognitive decline over 18 months than those who received the placebo, but the presentation garnered a mixed reception and caused Biogen’s stock to fall 9% in after-hours trading. Earlier in July, Biogen announced that the trials of the drug were looking very positive without giving any details, and this announcement may have caused many to anticipate that the results would be better than what was ultimately shown. Currently, Biogen’s stock is hurting from the results announcement, but their outlook is still positive in the long-run due to the strength of their pipeline. Another Alzheimer’s drug in Biogen’s pipeline, Aducanumab, just finished its enrollment for two phase III trials. This drug has been regarded as more promising than BAN2401, and if it is successful Biogen will have the only drug in a $12 billion market.
AUXIER FOCUS FUND
A MESSAGE TO OUR SHAREHOLDERS (Unaudited)
JUNE 30, 2018
Twenty-First Century Fox (FOXA)
Twenty-First Century Fox has been in the news recently due to the bidding war between Disney and Comcast. The merger that was eventually approved by shareholders, between Disney and Twenty-First Century Fox, will give Twenty-First Century Fox shareholders $38 a share or stock consideration. The collar on the stock consideration gives Twenty-First Century Fox shareholders an exchange ratio of 0.3324 if Disney stock is above $114.32. At the current price of $115.62 a share, the value on the consideration is about $38.50 a share. In addition to the deal with Disney, Twenty-First Century Fox will spin-off their news, sports, and broadcast businesses to create a new "Fox". The new "Fox" will include Fox News Channel, Fox Business Network, Fox Broadcasting Company, Fox Sports, Fox Television Stations Group, and sports cable networks. The deal has already been approved by the DOJ4 but still awaits approval in foreign markets.
Detractors:
Johnson & Johnson (JNJ)
One of only 22 companies to increase dividends every year for at least 50 consecutive years, Johnson & Johnson increased total sales 12.6% to over $20 billion. As the world’s largest medical conglomerate, they are well positioned to provide medicine and care for aging Baby Boomers.
Travelers (TRV)
Travelers is coming back down from historic highs early this year. Last quarter they posted revenue gains of 5% and net income gains of 12%. Hurricane losses in 2017 exceeded $200 billion. In 2018 losses have continued to be severe in hail and fires. This could further reduce capacity which should benefit premium pricing.
Philip Morris (PM) and Altria (MO)
Both stocks are starting to move higher after Q2 results came out for PM. Shipments on their “reduced risk products” were up, boosting their revenue. With the ability to raise prices, popularity of vaping and their inevitable entry into the marijuana market (anticipated to be a $50 billion market by 2026), the long-term fundamentals look solid. Both companies are structured to take advantage of developing trends.
Molson Coors (TAP)
Coors stock has struggled with 10% tariffs on aluminum, increasing competition from micro-breweries and a roaring marijuana market cutting into the overall beer market. Trying to take advantage of this growing market, Coors has assembled a team in Canada to find a way to best tap into the cannabis industry.
Inflation
The US employment-cost index, which measures wages and benefits, rose 2.8% in the twelve months ended in June. According to Standard and Poor’s, strong employment gains could lead to a further drop in the unemployment rate, to 3.6% over the next few months. Historically, in a more normalized interest rate environment, the 10-year Treasury would yield 2% higher than the prevailing inflation rate. This makes bonds vulnerable with the current rate under 3%. Through six months the Barclays intermediate bond index has declined 2.63%. Higher inflation rates tend to compress stock price-earnings ratios making high expectation momentum strategies vulnerable to sharp corrections on earnings disappointments. One of the best inflation hedges I have seen in the past thirty-five years is a well nurtured business, with disciplined capital allocation, that earns high returns on capital, enjoys rapid inventory turns and has the ability to raise prices while requiring little in mandatory capital expenditure to grow. We strive to be long term owners of such enterprises. Conversely, utilities have high mandatory cash needs and can suffer if faced with large construction projects. In the 1980s I remember watching utilities get crushed in the market as higher inflation led to cost overruns on the construction of nuclear power plants. In our research we have not been able to identify one utility in the US that currently has positive cash flow.
In socialist Venezuela, inflation rates are running more than 40,000%, yet stock returns in local terms have still exceeded inflation. Bonds have been wiped out. There is a misperception that government bonds are safe. Argentina has defaulted over six times and recently raised interest rates 40% to defend their currency.
AUXIER FOCUS FUND
A MESSAGE TO OUR SHAREHOLDERS (Unaudited)
JUNE 30, 2018
Risks
Technological disruption is a constant threat as the economy digitizes. Platform changes need to be scrutinized. The move from 3G to 4G decimated phone companies like Nokia, Blackberry and Motorola leading to a duopoly with Android and Apple. 5G could be as equally disruptive. Voice enabled assistants, artificial intelligence and augmented reality are potential platforms that could change the status quo. The growth of the cloud has led to centralized market power with Amazon, Microsoft and Google. However, blockchain technology decentralizes the internet through digital ledgers and could prove to be a powerful disrupter that claims to be less corruptible.
The popularity and performance of many technology stocks is acting as a magnet for enormous flows of capital which can lead to supply gluts. We are seeing exuberance in venture funding from Japan, China and Silicon Valley. This happened in the late 1990s when the rage was internet hosting and fiberoptic. Massive capacity was built for businesses losing money and when interest rates rose a crash followed. Telecom companies like Lucent and Level 3 lost over 85% of their value. It is estimated by the venture firm Benchmark that today the top 200 Silicon Valley start-ups have cash burn rates 5 to 10 times 1999 levels. The potential problem, like 1999, is that much of the technology infrastructure is being built for businesses losing money and with interest rates rising the funding can cease abruptly. Softbank is driving crazy valuations in businesses like WeWork, which provides basic workspaces. Softbank is seeking a valuation in excess of $20 billion for this company that lost over $900 million last year. Many venture firms will often set private market pricing far higher than underlying fundamentals warrant. In addition, record amounts of money have been raised in private equity (leveraged buyouts). Carlyle Group recently raised a record $18.5 billion. Many of our portfolio companies are attractive to these leveraged buyout firms because of their high free cash flow characteristics. However, bond protection via debt covenants has never been this poor. This is a new cyclical low in the quality of covenant protection, which is common near the end of booms.
Opportunities
We are seeing exciting innovations in medtech and biotech. Many of the larger companies’ stocks trade at very reasonable valuations by historic standards. Fred Hutchinson Cancer Research Center out of Seattle has stated cures for cancer are in sight as “immunotherapies” that unleash the body’s own immune system to seek out and destroy cancer cells have “shown mind-blowing results in early testing on blood cancers.” CAR T cell therapies are being developed by companies like Celgene and Gilead. Merck’s KEYTRUDA has shown good potential for the treatment of lung cancer. Companies like Alkermes, led by founder CEO Richard Pops, are at the forefront in the treatment of opioid addictions, which have led to over 50 million deaths this past year. Exciting strides are being made in transaortic valve replacement led by Medtronic. Cerner is an attractive leader in digitizing hospitals and doctors’ offices. They recently landed a major multiyear contract with the Veteran’s Administration.
Alphabet is taking a leadership in artificial intelligence and predictive data analytics. YouTube, with over 1.8 billion users has grown over 20% this past year and has an annual growth rate nearly twice as fast as Facebook’s. YouTube users spend over an hour a day on the YouTube mobile app alone. Waymo is a leader in self-driving car technology. It took Waymo six years to test their first one million miles, this year they went from seven to eight million in one month.
In the industrial sector, fears over deepening trade wars have led to more attractive prices for quality franchises like Parker Hannifin and Caterpillar. Higher short-term interest rates will help earnings for companies and households with high cash balances which have suffered under central bank interest rate suppression over the past decade.
We are looking for management teams focused on using predictive data analytics and the “customer experience.” Those on the right side of digital are being rewarded with premium valuations. With internet transparency, high-grade ethics are more important than ever in building intrinsic value. We strongly believe that the best way to enjoy high compounded returns over long periods is through the well-researched selection of high return businesses that are ideally founder or family controlled and where the management is diligent in capital allocation and relentlessly focused on improving value. Usually the best buys have been when there is a plethora of negative headlines and the consensus is “this is no time to buy stocks.” Those purchased at an attractive price can reward investors with the double-triple play over years while deferring taxes and providing more than adequate compensation for the risk taken.
AUXIER FOCUS FUND
A MESSAGE TO OUR SHAREHOLDERS (Unaudited)
JUNE 30, 2018
Trade
It appears the Trump administration is using tariffs as a tool to bring countries to the negotiating table on a more bilateral basis. Negotiations surrounding Europe and The North American Free Trade Agreement (NAFTA) appear to be moving forward. China is tougher. What is needed is a united front by allies to increase the leverage for a level playing field respecting intellectual property rights. We see President Trump as resolute with China. On the downside, the Smoot-Hawley Tariff Act of 1930 raised tariffs on over 20,000 imported goods which led to a drop of American exports and imports by over half. So free trade is the obvious choice vs protectionism. Given China’s growing debt load, nearly 300% of GDP, steep stock market correction and surplus trade position, it looks like a good time for the US and Europe to push for meaningful reforms. We are hopeful that this is a bargaining stance to ultimately lead to lower overall global tariffs. While there is immediate pain in the farm sector, negative headlines create opportunities to add to world class business franchises that rarely trade at bargain prices.
China has been a big creditor to Venezuela where the Maduro policies have led to starvation, human rights atrocities and hyperinflation. The “Black Book on Communism” published by Harvard University Press in France illustrated work carried out by a team of professors and researchers from the National Center for Scientific Research—the most important scientific institution in France. They listed the number of people killed by communism. China led the list with an estimated 82 million dead under communist rule. Since 1999 Venezuela, where the leadership follows Marxism-Leninism, they figure more than 252,000 dead. That is why we put so much time into daily research to identify facts and fundamentals and those policies that can destroy intrinsic value. Integrity in financial markets, political checks and the rule of law are all critical to enduring long term. The only constant in investing is change and the key to risk management continues to be a rational approach rooted in a daily tenacious research effort.
I sought for the greatness and genius of America in her commodious harbors and her ample rivers—and it was not there .... in her fertile fields and boundless forests—and it was not there .... in her rich mines and her vast world commerce—and it was not there .... in her democratic Congress and her matchless Constitution—and it was not there. Not until I went into the churches of America and heard her pulpits flame with righteousness did I understand the secret of her genius and power. America is great because she is good, and if America ever ceases to be good, she will cease to be great. - Alexis de Tocqueville.
We appreciate your trust.
Jeff Auxier
Fund returns (i) assume the reinvestment of all dividends and capital gain distributions and (ii) would have been lower during the period if certain fees and expenses had not been waived. Performance shown is for the Fund’s Investor Class shares; returns for other share classes will vary. Performance for Investor Class shares for periods prior to December 10, 2004 reflects performance of the applicable share class of Auxier Focus Fund, a series of Unified Series Trust (the “Predecessor Fund”). Prior to January 3, 2003, the Predecessor Fund was a series of Ameriprime Funds. The performance of the Fund’s Investor Class shares for the period prior to December 10, 2004 reflects the expenses of the Predecessor Fund.
The Fund may invest in value and/or growth stocks. Investments in value stocks are subject to risk that their intrinsic value may never be realized and investments in growth stocks may be susceptible to rapid price swings, especially during periods of economic uncertainty. In addition, the Fund may invest in mid-sized companies which generally carry greater risk than is customarily associated with larger companies. Moreover, if the Fund’s portfolio is overweighted in a sector, any negative development affecting that sector will have a greater impact on the Fund than a fund that is not overweighted in that sector. An increase in interest rates typically causes a fall in the value of a debt security (Fixed-Income Securities Risk) with corresponding changes to the Fund’s value.
| 1 | Gross Domestic Product (GDP) is the monetary value of all the finished goods and services produced within a country's borders in a specific time period. |
| 2 | Earnings per share (EPS) is the portion of a company's profit allocated to each outstanding share of common stock. Earnings per share serves as an indicator of a company's profitability. EPS is calculated as: EPS = (Net Income - Dividends on Preferred Stock) / Average Outstanding Shares. |
| 3 | OPEC is an abbreviation for Organization of Petroleum Exporting Countries, which is a union of oil producing countries that regulate the amount of oil each country is able to produce. |
| 4 | DOJ is an abbreviation for The Department of Justice, a department of the federal executive branch, headed by the attorney general, which administers the Federal Bureau of Investigation (FBI), prosecutes violations of federal law, and is responsible for enforcing all civil rights legislation. |
AUXIER FOCUS FUND
A MESSAGE TO OUR SHAREHOLDERS (Unaudited)
JUNE 30, 2018
The S&P 500 Index is a broad-based, unmanaged measurement of changes in stock market conditions based on 500 widely held common stocks. One cannot invest directly in an index or average.
The views in this shareholder letter were those of the Fund Manager as of the letter’s publication date and may not reflect his views on the date this letter is first distributed or anytime thereafter. These views are intended to assist readers in understanding the Fund’s investment methodology and do not constitute investment advice.
AUXIER FOCUS FUND
PERFORMANCE CHART AND ANALYSIS (Unaudited)
JUNE 30, 2018
The following chart reflects the change in the value of a hypothetical $10,000 investment in Investor Shares, including reinvested dividends and distributions, in the Auxier Focus Fund (the “Fund”) compared with the performance of the benchmark, the S&P 500 Index (“S&P 500”), over the past ten fiscal years. The S&P 500 is a broad-based measurement of the U.S. stock market based on the performance of 500 widely held large capitalization common stocks. The total return of the Fund's classes includes the maximum sales charge of 5.75% (A Shares only) and operating expenses that reduce returns, while the total return of the S&P 500 does not include the effect of sales charges and expenses. A Shares are subject to a 1.00% contingent deferred sales charge on shares purchased without an initial sales charge and redeemed less than one year after purchase. The total return of the index includes the reinvestment of dividends and income. The total return of the Fund includes operating expenses that reduce returns, while the total return of the index does not include expenses. The Fund is professionally managed, while the index is unmanaged and is not available for investment.
Comparison of Change in Value of a $10,000 Investment
Investor Shares vs. S&P 500 Index
|
Average Annual Total Returns Periods Ended June 30, 2018 |
One Year | Five Years | Ten Years | Since Inception(1) |
| Investor Shares | 6.97% | 8.09% | 8.13% | 7.33% |
| S&P 500® Index (Since July 9, 1999) | 14.37% | 13.42% | 10.17% | 5.55% |
| A Shares (with sales charge)(2),(3) | 0.55% | 6.68% | 7.42% | 6.96% |
| Institutional Shares(3) | 7.20% | 8.31% | 8.27% | 7.40% |
| (1) | Investor, A Shares and Institutional Shares commenced operations on July 9, 1999, July 8, 2005 and May 9, 2012, respectively. |
| (2) | Due to shareholder redemptions on August 21, 2005, net assets of the class were zero from the close of business on that date until September 22, 2005. Financial information presented for the period August 21, 2005 to September 22, 2005 reflects performance of Investor Shares of the Fund. |
| (3) | For Institutional Shares, performance for the 10-year and since inception periods are blended average annual returns which include the returns of the Investor Shares prior to commencement of operations of the Institutional Shares. For A Shares, performance for the since inception period is a blended average annual return which includes the return of the Investor Shares prior to commencement of operations of the A Shares. |
Performance data quoted represents past performance and is no guarantee of future results. Current performance may be lower or higher than the performance data quoted. Investment return and principal value will fluctuate so that shares, when redeemed, may be worth more or less than original cost. As stated in the Fund’s prospectus, the annual operating expense ratios (gross) for Investor Shares, A Shares and Institutional Shares are 1.10%, 1.54% and 1.10%, respectively. However, the Fund’s Adviser has contractually agreed to waive its fee and/or reimburse Fund expenses to limit Total Annual Fund Operating Expenses After Fee Waiver and/or Expense Reimbursement (excluding all taxes, interest, portfolio transaction expenses, dividend expenses on short sales, and extraordinary expenses) to 0.98%, 1.25% and 0.80% of the Investor Shares, A Shares and Institutional Shares, respectively, through October 31, 2018 (the “Expense Cap”). The Adviser may be reimbursed by the Fund for fees waived and expenses reimbursed by the Adviser pursuant to the Expense Cap if such payment is made within three years of the fee waiver or expense reimbursement, and does not cause the Total Annual Fund Operating Expenses After Fee Waiver and/or Expense Reimbursement to exceed the lesser of (i) the then-current Expense Cap, or (ii) the Expense Cap in place at the time the fees/expenses were waived/reimbursed. Shares redeemed or exchanged within 180 days of purchase will be charged a 2.00% redemption fee. The performance table and graph do not reflect the deduction of taxes that a shareholder would pay on Fund distributions or the redemption of Fund shares. Returns greater than one year are annualized. For the most recent month-end performance, please call (877) 328-9437 or visit www.auxierasset.com.
Performance for Investor Shares for periods prior to December 10, 2004, reflects performance and expenses of Auxier Focus Fund, a series of Unified Series Trust (the “Predecessor Fund”). Prior to January 3, 2003, the Predecessor Fund was a series of Ameriprime Funds.
AUXIER FOCUS FUND
SCHEDULE OF INVESTMENTS
JUNE 30, 2018
| Shares | Security Description | Value | ||||||
| Equity Securities - 96.8% | ||||||||
| Common Stock - 96.8% | ||||||||
| Communications - 2.7% | ||||||||
| 222,375 | America Movil SAB de CV, ADR | $ | 3,704,767 | |||||
| 1,719 | Cisco Systems, Inc. | 73,969 | ||||||
| 221,738 | Telefonica SA, ADR | 1,891,425 | ||||||
| 8,446 | Twenty-First Century Fox, Inc., Class A | 419,682 | ||||||
| 8,845 | Viacom, Inc., Class B | 266,765 | ||||||
| 6,356,608 | ||||||||
| Consumer Discretionary - 6.2% | ||||||||
| 27,700 | Arcos Dorados Holdings, Inc., Class A | 192,515 | ||||||
| 34,000 | Becle SAB de CV | 49,300 | ||||||
| 54,160 | Comcast Corp., Class A | 1,776,990 | ||||||
| 9,990 | CVS Health Corp. | 642,856 | ||||||
| 114,077 | Discovery Communications, Inc., Class A (a) | 3,137,117 | ||||||
| 4,641 | Discovery Communications, Inc., Class C (a) | 118,345 | ||||||
| 16,250 | General Motors Co. | 640,250 | ||||||
| 36,712 | H&R Block, Inc. | 836,299 | ||||||
| 186,701 | Lincoln Educational Services Corp. (a) | 324,860 | ||||||
| 18,550 | Lowe's Cos., Inc. | 1,772,824 | ||||||
| 6,156 | McDonald's Corp. | 964,584 | ||||||
| 38,150 | Sally Beauty Holdings, Inc. (a) | 611,545 | ||||||
| 1,176 | The Andersons, Inc. | 40,219 | ||||||
| 4,725 | The Home Depot, Inc. | 921,847 | ||||||
| 19,150 | Walmart, Inc. | 1,640,198 | ||||||
| 7,050 | Yum China Holdings, Inc. | 271,143 | ||||||
| 7,050 | Yum! Brands, Inc. | 551,451 | ||||||
| 14,492,343 | ||||||||
| Consumer Staples - 18.3% | ||||||||
| 62,500 | Altria Group, Inc. | 3,549,375 | ||||||
| 30,200 | British American Tobacco PLC, ADR | 1,523,590 | ||||||
| 13,200 | Coca-Cola HBC AG, ADR (a) | 442,332 | ||||||
| 5,135 | Diageo PLC, ADR | 739,491 | ||||||
| 2,225 | Dr. Pepper Snapple Group, Inc. | 271,450 | ||||||
| 15,378 | Lamb Weston Holdings, Inc. | 1,053,547 | ||||||
| 50,327 | Molson Coors Brewing Co., Class B | 3,424,249 | ||||||
| 35,300 | Monster Beverage Corp. (a) | 2,022,690 | ||||||
| 70,820 | PepsiCo., Inc. | 7,710,173 | ||||||
| 83,725 | Philip Morris International, Inc. | 6,759,956 | ||||||
| 160,871 | Tesco PLC, ADR | 1,629,623 | ||||||
| 57,300 | The Coca-Cola Co. | 2,513,178 | ||||||
| 2,845 | The J.M. Smucker Co. | 305,781 | ||||||
| 203,368 | The Kroger Co. | 5,785,820 | ||||||
| 20,525 | The Procter & Gamble Co. | 1,602,182 | ||||||
| 67,900 | Unilever NV, ADR | 3,783,388 | ||||||
| 43,116,825 | ||||||||
| Consumer, Cyclical - 0.4% | ||||||||
| 20,475 | DR Horton, Inc. | 839,475 | ||||||
| Energy - 4.8% | ||||||||
| 144,810 | BP PLC, ADR | 6,612,025 | ||||||
| 9,430 | Chevron Corp. | 1,192,235 | ||||||
| 14,600 | ConocoPhillips | 1,016,452 | ||||||
| 7,800 | Phillips 66 | 876,018 | ||||||
| 14,415 | Valero Energy Corp. | 1,597,614 | ||||||
| 11,294,344 | ||||||||
| Financials - 21.8% | ||||||||
| 57,260 | Aflac, Inc. | 2,463,325 | ||||||
| 49,445 | American International Group, Inc. | 2,621,574 | ||||||
| 1,280 | Ameriprise Financial, Inc. | 179,046 | ||||||
| 201,699 | Bank of America Corp. | 5,685,895 | ||||||
| 16,545 | Berkshire Hathaway, Inc., Class B (a) | 3,088,124 | ||||||
| 67,374 | Central Pacific Financial Corp. | 1,930,265 | ||||||
| Shares | Security Description | Value | ||||||
| Financials - 21.8% (continued) | ||||||||
| 25,975 | Citigroup, Inc. | $ | 1,738,247 | |||||
| 5,616 | Colliers International Group, Inc. | 425,131 | ||||||
| 132,268 | Credit Suisse Group AG, ADR | 1,968,148 | ||||||
| 5,616 | FirstService Corp. | 427,041 | ||||||
| 66,668 | Franklin Resources, Inc. | 2,136,709 | ||||||
| 9,500 | Legg Mason, Inc. | 329,935 | ||||||
| 3,025 | Marsh & McLennan Cos., Inc. | 247,959 | ||||||
| 48,550 | Mastercard, Inc., Class A | 9,541,046 | ||||||
| 1,100 | PayPal Holdings, Inc. (a) | 91,597 | ||||||
| 179,700 | The Bank of New York Mellon Corp. | 9,691,221 | ||||||
| 27,418 | The Travelers Cos., Inc. | 3,354,318 | ||||||
| 7,350 | U.S. Bancorp | 367,647 | ||||||
| 15,249 | Unum Group | 564,061 | ||||||
| 31,600 | Visa, Inc., Class A | 4,185,420 | ||||||
| 14,350 | Waddell & Reed Financial, Inc., Class A | 257,870 | ||||||
| 2,950 | Wells Fargo & Co. | 163,548 | ||||||
| 51,458,127 | ||||||||
| Health Care - 25.4% | ||||||||
| 46,051 | Abbott Laboratories | 2,808,650 | ||||||
| 2,900 | Alkermes PLC (a) | 119,364 | ||||||
| 5,230 | Allergan PLC | 871,946 | ||||||
| 740 | Amgen, Inc. | 136,597 | ||||||
| 18,981 | Anthem, Inc. | 4,518,047 | ||||||
| 15,200 | Becton Dickinson and Co. | 3,641,312 | ||||||
| 13,940 | Biogen, Inc. (a) | 4,045,946 | ||||||
| 55,424 | Express Scripts Holding Co. (a) | 4,279,287 | ||||||
| 1,780 | Gilead Sciences, Inc. | 126,095 | ||||||
| 3,700 | GlaxoSmithKline PLC, ADR | 149,147 | ||||||
| 56,240 | Johnson & Johnson | 6,824,162 | ||||||
| 93,818 | Medtronic PLC | 8,031,759 | ||||||
| 96,059 | Merck & Co., Inc. | 5,830,781 | ||||||
| 7,282 | Pfizer, Inc. | 264,191 | ||||||
| 23,337 | Quest Diagnostics, Inc. | 2,565,670 | ||||||
| 41,631 | UnitedHealth Group, Inc. | 10,213,749 | ||||||
| 47,400 | Zimmer Biomet Holdings, Inc. | 5,282,256 | ||||||
| 59,708,959 | ||||||||
| Industrials - 4.6% | ||||||||
| 173,141 | Corning, Inc. | 4,763,109 | ||||||
| 2,725 | FedEx Corp. | 618,738 | ||||||
| 88,671 | Manitex International, Inc. (a) | 1,106,614 | ||||||
| 11,500 | Raytheon Co. | 2,221,570 | ||||||
| 7,375 | Textainer Group Holdings, Ltd. (a) | 117,263 | ||||||
| 2,350 | The Boeing Co. | 788,448 | ||||||
| 11,595 | United Parcel Service, Inc., Class B | 1,231,737 | ||||||
| 10,847,479 | ||||||||
| Information Technology - 7.5% | ||||||||
| 1,430 | Alphabet, Inc., Class A (a) | 1,614,742 | ||||||
| 41,910 | Cerner Corp. (a) | 2,505,799 | ||||||
| 16,675 | Cognizant Technology Solutions Corp., Class A | 1,317,158 | ||||||
| 300 | Facebook, Inc., Class A (a) | 58,296 | ||||||
| 87,337 | Microsoft Corp. | 8,612,302 | ||||||
| 82,320 | Oracle Corp. | 3,627,019 | ||||||
| 17,735,316 | ||||||||
| Materials - 4.7% | ||||||||
| 14,225 | Celanese Corp., Class A | 1,579,829 | ||||||
| 85,376 | DowDuPont, Inc. | 5,627,986 | ||||||
| 26,505 | LyondellBasell Industries NV, Class A | 2,911,574 | ||||||
| 32,055 | The Mosaic Co. | 899,143 | ||||||
| 11,018,532 | ||||||||
| Telecommunications - 0.2% | ||||||||
| 23,775 | CenturyLink, Inc. | 443,166 | ||||||
See Notes to Financial Statements.
AUXIER FOCUS FUND
SCHEDULE OF INVESTMENTS
JUNE 30, 2018
| Shares | Security Description | Value | ||||||
| Transportation - 0.2% | ||||||||
| 2,550 | Delta Air Lines, Inc. | $ | 126,327 | |||||
| 3,160 | Union Pacific Corp. | 447,709 | ||||||
| 574,036 | ||||||||
| Total Common Stock (Cost $124,789,141) | 227,885,210 | |||||||
| Total Equity Securities (Cost $124,789,141) | 227,885,210 | |||||||
| Principal | Security Description | Rate | Maturity | Value | |||||||||||
| Fixed Income Securities - 0.9% | |||||||||||||||
| Corporate Non-Convertible Bonds - 0.8% | |||||||||||||||
| Financials - 0.6% | |||||||||||||||
| $ | 500,000 | Fifth Third Bancorp (callable at 100) (b)(c) | 5.10 | % | 06/30/23 | 493,485 | |||||||||
| 400,000 | SunTrust Banks, Inc. (callable at 100) (b)(c) | 5.13 | 12/15/27 | 380,750 | |||||||||||
| 500,000 | The Goldman Sachs Group, Inc. (callable at 100) (b)(c) | 5.00 | 11/10/22 | 470,300 | |||||||||||
| 1,344,535 | |||||||||||||||
| Industrials - 0.2% | |||||||||||||||
| 450,000 | General Electric Co. (callable at 100) (b)(c) | 5.00 | 01/21/21 | 444,487 | |||||||||||
| Total Corporate Non-Convertible Bonds | |||||||||||||||
| (Cost $1,839,182) | 1,789,022 | ||||||||||||||
| U.S. Government & Agency Obligations - 0.1% | |||||||||||||||
| U.S. Treasury Securities - 0.1% | |||||||||||||||
| 275,000 | U.S. Treasury Bill (d) (Cost $272,875) | 2.05 | 11/15/18 | 272,927 | |||||||||||
| Total Fixed Income Securities | |||||||||||||||
| (Cost $2,112,057) | 2,061,949 | ||||||||||||||
| Investments, at value - 97.7% (Cost $126,901,198) | $ | 229,947,159 | |||||||||||||
| Other Assets & Liabilities, Net - 2.3% | 5,510,696 | ||||||||||||||
| Net Assets - 100.0% | $ | 235,457,855 | |||||||||||||
| ADR | American Depositary Receipt |
| PLC | Public Limited Company |
| (a) | Non-income producing security. |
| (b) | Variable rate security, the interest rate of which adjusts periodically based on changes in current interest rates. Rate represented is as of June 30, 2018. |
| (c) | Perpetual maturity security. Maturity date presented is call date as of June 30, 2018. |
| (d) | Zero coupon bond. Interest rate presented is yield to maturity. |
The following is a summary of the inputs used to value the Fund's investments as of June 30, 2018.
The inputs or methodology used for valuing securities are not necessarily an indication of the risks associated with investing in those securities. For more information on valuation inputs, and their aggregation into the levels used in the table below, please refer to the Security Valuation section in Note 2 of the accompanying Notes to Financial Statements.
| Level 1 | Level 2 | Level 3 | Total | |||||||||||||
| Investments at Value | ||||||||||||||||
| Common Stock | ||||||||||||||||
| Communications | $ | 6,356,608 | $ | – | $ | – | $ | 6,356,608 | ||||||||
| Consumer Discretionary | 14,492,343 | – | – | 14,492,343 | ||||||||||||
| Consumer Staples | 43,116,825 | – | – | 43,116,825 | ||||||||||||
| Consumer, Cyclical | 839,475 | – | – | 839,475 | ||||||||||||
| Energy | 11,294,344 | – | – | 11,294,344 | ||||||||||||
| Financials | 51,458,127 | – | – | 51,458,127 | ||||||||||||
| Health Care | 59,708,959 | – | – | 59,708,959 | ||||||||||||
| Industrials | 10,847,479 | – | – | 10,847,479 | ||||||||||||
| Information Technology | 17,735,316 | – | – | 17,735,316 | ||||||||||||
| Materials | 11,018,532 | – | – | 11,018,532 | ||||||||||||
| Telecommunications | 443,166 | – | – | 443,166 | ||||||||||||
| Transportation | 574,036 | – | – | 574,036 | ||||||||||||
| Corporate Non-Convertible Bonds | – | 1,789,022 | – | 1,789,022 | ||||||||||||
| U.S. Government & Agency Obligations | – | 272,927 | – | 272,927 | ||||||||||||
| Investments at Value | $ | 227,885,210 | $ | 2,061,949 | $ | – | $ | 229,947,159 | ||||||||
The Fund utilizes the end of period methodology when determining transfers. There were no transfers among Level 1, Level 2 and Level 3 for the year ended June 30, 2018.
| PORTFOLIO HOLDINGS (Unaudited) | |||
| % of Total Net Assets | |||
| Communications | 2.7% | ||
| Consumer Discretionary | 6.2% | ||
| Consumer Staples | 18.3% | ||
| Consumer, Cyclical | 0.4% | ||
| Energy | 4.8% | ||
| Financials | 21.8% | ||
| Health Care | 25.4% | ||
| Industrials | 4.6% | ||
| Information Technology | 7.5% | ||
| Materials | 4.7% | ||
| Telecommunications | 0.2% | ||
| Transportation | 0.2% | ||
| Corporate Non-Convertible Bonds | 0.8% | ||
| U.S. Government & Agency Obligations | 0.1% | ||
| Other Assets & Liabilities, Net | 2.3% | ||
| 100.0% |
AUXIER FOCUS FUND
STATEMENT OF ASSETS AND LIABILITIES
JUNE 30, 2018
| ASSETS | ||||
| Investments, at value (Cost $126,901,198) | $ | 229,947,159 | ||
| Cash | 5,302,232 | |||
| Receivables: | ||||
| Fund shares sold | 99,709 | |||
| Investment securities sold | 236,776 | |||
| Dividends and interest | 306,663 | |||
| Prepaid expenses | 23,813 | |||
| Total Assets | 235,916,352 | |||
| LIABILITIES | ||||
| Payables: | ||||
| Investment securities purchased | 142,936 | |||
| Fund shares redeemed | 112,221 | |||
| Accrued Liabilities: | ||||
| Investment Adviser fees | 131,733 | |||
| Trustees’ fees and expenses | 510 | |||
| Fund services fees | 25,166 | |||
| Other expenses | 45,931 | |||
| Total Liabilities | 458,497 | |||
| NET ASSETS | $ | 235,457,855 | ||
| COMPONENTS OF NET ASSETS | ||||
| Paid-in capital | $ | 122,406,550 | ||
| Undistributed net investment income | 1,556,427 | |||
| Accumulated net realized gain | 8,448,917 | |||
| Net unrealized appreciation | 103,045,961 | |||
| NET ASSETS | $ | 235,457,855 | ||
| SHARES OF BENEFICIAL INTEREST AT NO PAR VALUE (UNLIMITED SHARES AUTHORIZED) | ||||
| Investor Shares | 7,236,757 | |||
| A Shares | 123,287 | |||
| Institutional Shares | 3,161,837 | |||
| NET ASSET VALUE, OFFERING AND REDEMPTION PRICE PER SHARE* | ||||
| Investor Shares (based on net assets of $161,032,326) | $ | 22.25 | ||
| A Shares (based on net assets of $2,781,856) | $ | 22.56 | ||
| A Shares Maximum Public Offering Price Per Share (net asset value per share/(100%-5.75%)) | $ | 23.94 | ||
| Institutional Shares (based on net assets of $71,643,673) | $ | 22.66 | ||
| * | Shares redeemed or exchanged within 180 days of purchase are charged a 2.00% redemption fee. |
See Notes to Financial Statements.
AUXIER FOCUS FUND
STATEMENT OF OPERATIONS
YEAR ENDED JUNE 30, 2018
| INVESTMENT INCOME | ||||
| Dividend income (Net of foreign withholding taxes of $46,551) | $ | 5,175,169 | ||
| Interest income | 157,896 | |||
| Total Investment Income | 5,333,065 | |||
| EXPENSES | ||||
| Investment Adviser fees | 2,005,321 | |||
| Fund services fees | 328,563 | |||
| Transfer agent fees: | ||||
| Investor Shares | 58,990 | |||
| A Shares | 1,080 | |||
| Institutional Shares | 4,953 | |||
| Distribution fees: | ||||
| A Shares | 7,118 | |||
| Custodian fees | 26,090 | |||
| Registration fees: | ||||
| Investor Shares | 19,764 | |||
| A Shares | 3,436 | |||
| Institutional Shares | 15,292 | |||
| Professional fees | 55,056 | |||
| Trustees' fees and expenses | 17,522 | |||
| Other expenses | 217,636 | |||
| Total Expenses | 2,760,821 | |||
| Fees waived | (416,724 | ) | ||
| Net Expenses | 2,344,097 | |||
| NET INVESTMENT INCOME | 2,988,968 | |||
| NET REALIZED AND UNREALIZED GAIN (LOSS) | ||||
| Net realized gain (loss) on: | ||||
| Investments | 9,308,900 | |||
| Foreign currency transactions | (5 | ) | ||
| Net realized gain | 9,308,895 | |||
| Net change in unrealized appreciation (depreciation) on investments | 4,800,356 | |||
| NET REALIZED AND UNREALIZED GAIN | 14,109,251 | |||
| INCREASE IN NET ASSETS RESULTING FROM OPERATIONS | $ | 17,098,219 | ||
See Notes to Financial Statements.
AUXIER FOCUS FUND
STATEMENTS OF CHANGES IN NET ASSETS
| For the Year Ended June 30, 2018 |
For the Year Ended June 30, 2017 |
|||||||||||||||
| OPERATIONS | Shares | Shares | ||||||||||||||
| Net investment income | $ | 2,988,968 | $ | 2,873,195 | ||||||||||||
| Net realized gain | 9,308,895 | 10,382,605 | ||||||||||||||
| Net change in unrealized appreciation | 4,800,356 | 20,893,874 | ||||||||||||||
| Increase in Net Assets Resulting from Operations | 17,098,219 | 34,149,674 | ||||||||||||||
| DISTRIBUTIONS TO SHAREHOLDERS FROM | ||||||||||||||||
| Net investment income: | ||||||||||||||||
| Investor Shares | (1,989,916 | ) | (2,228,585 | ) | ||||||||||||
| A Shares | (22,503 | ) | (18,288 | ) | ||||||||||||
| Institutional Shares | (741,116 | ) | (573,352 | ) | ||||||||||||
| Net realized gain: | ||||||||||||||||
| Investor Shares | (7,701,459 | ) | (3,141,650 | ) | ||||||||||||
| A Shares | (122,901 | ) | (41,172 | ) | ||||||||||||
| Institutional Shares | (2,835,592 | ) | (803,916 | ) | ||||||||||||
| Total Distributions to Shareholders | (13,413,487 | ) | (6,806,963 | ) | ||||||||||||
| CAPITAL SHARE TRANSACTIONS | ||||||||||||||||
| Sale of shares: | ||||||||||||||||
| Investor Shares | 12,207,193 | 545,032 | 13,833,788 | 675,235 | ||||||||||||
| A Shares | 76,206 | 3,206 | 25,047 | 1,169 | ||||||||||||
| Institutional Shares | 11,795,228 | 510,411 | 11,678,690 | 564,828 | ||||||||||||
| Reinvestment of distributions: | ||||||||||||||||
| Investor Shares | 9,332,848 | 415,331 | 5,165,360 | 255,391 | ||||||||||||
| A Shares | 140,941 | 6,189 | 59,012 | 2,879 | ||||||||||||
| Institutional Shares | 3,423,369 | 149,776 | 1,306,095 | 63,637 | ||||||||||||
| Redemption of shares: | ||||||||||||||||
| Investor Shares | (48,745,464 | ) | (2,169,226 | ) | (58,720,531 | ) | (2,840,659 | ) | ||||||||
| A Shares | (283,039 | ) | (11,944 | ) | (283,606 | ) | (13,793 | ) | ||||||||
| Institutional Shares | (3,857,324 | ) | (168,252 | ) | (2,325,115 | ) | (111,073 | ) | ||||||||
| Redemption fees: | ||||||||||||||||
| Investor Shares | 3,662 | – | 6,978 | – | ||||||||||||
| A Shares | 55 | – | 91 | – | ||||||||||||
| Institutional Shares | 1,208 | – | 1,835 | – | ||||||||||||
| Decrease in Net Assets from Capital Share Transactions | (15,905,117 | ) | (719,477 | ) | (29,252,356 | ) | (1,402,386 | ) | ||||||||
| Decrease in Net Assets | (12,220,385 | ) | (1,909,645 | ) | ||||||||||||
| NET ASSETS | ||||||||||||||||
| Beginning of Year | 247,678,240 | 249,587,885 | ||||||||||||||
| End of Year (Including line (a)) | $ | 235,457,855 | $ | 247,678,240 | ||||||||||||
| (a) Undistributed net investment income | $ | 1,556,427 | $ | 1,455,058 | ||||||||||||
See Notes to Financial Statements.
AUXIER FOCUS FUND
FINANCIAL HIGHLIGHTS
These financial highlights reflect selected data for a share outstanding throughout each year.
| For the Years Ended June 30, | ||||||||||||||||||||
| 2018 | 2017 | 2016 | 2015 | 2014 | ||||||||||||||||
| INVESTOR SHARES | ||||||||||||||||||||
| NET ASSET VALUE, Beginning of Year | $ | 21.95 | $ | 19.69 | $ | 20.50 | $ | 20.75 | $ | 18.59 | ||||||||||
| INVESTMENT OPERATIONS | ||||||||||||||||||||
| Net investment income (a) | 0.26 | 0.23 | 0.21 | 0.17 | 0.20 | |||||||||||||||
| Net realized and unrealized gain | 1.28 | 2.59 | 0.08 | 0.38 | 2.63 | |||||||||||||||
| Total from Investment Operations | 1.54 | 2.82 | 0.29 | 0.55 | 2.83 | |||||||||||||||
| DISTRIBUTIONS TO SHAREHOLDERS FROM | ||||||||||||||||||||
| Net investment income | (0.25 | ) | (0.23 | ) | (0.20 | ) | (0.20 | ) | (0.22 | ) | ||||||||||
| Net realized gain | (0.99 | ) | (0.33 | ) | (0.90 | ) | (0.60 | ) | (0.45 | ) | ||||||||||
| Total Distributions to Shareholders | (1.24 | ) | (0.56 | ) | (1.10 | ) | (0.80 | ) | (0.67 | ) | ||||||||||
| REDEMPTION FEES(a) | 0.00 | (b) | 0.00 | (b) | 0.00 | (b) | 0.00 | (b) | 0.00 | (b) | ||||||||||
| NET ASSET VALUE, End of Year | $ | 22.25 | $ | 21.95 | $ | 19.69 | $ | 20.50 | $ | 20.75 | ||||||||||
| TOTAL RETURN | 6.97 | % | 14.55 | % | 1.58 | % | 2.69 | % | 15.43 | % | ||||||||||
| RATIOS/SUPPLEMENTARY DATA | ||||||||||||||||||||
| Net Assets at End of Year (000s omitted) | $ | 161,032 | $ | 185,363 | $ | 203,921 | $ | 231,911 | $ | 285,094 | ||||||||||
| Ratios to Average Net Assets: | ||||||||||||||||||||
| Net investment income | 1.14 | % | 1.11 | % | 1.10 | % | 0.83 | % | 1.00 | % | ||||||||||
| Net expenses | 0.98 | % | 1.03 | % | 1.14 | % | 1.24 | % | 1.24 | % | ||||||||||
| Gross expenses (c) | 1.10 | % | 1.16 | % | 1.30 | % | 1.27 | % | 1.26 | % | ||||||||||
| PORTFOLIO TURNOVER RATE | 3 | % | 5 | % | 6 | % | 4 | % | 9 | % | ||||||||||
| (a) | Calculated based on average shares outstanding during each year. |
| (b) | Less than $0.01 per share. |
| (c) | Reflects the expense ratio excluding any waivers and/or reimbursements. |
See Notes to Financial Statements.
AUXIER FOCUS FUND
FINANCIAL HIGHLIGHTS
These financial highlights reflect selected data for a share outstanding throughout each year.
| For the Years Ended June 30, | ||||||||||||||||||||
| 2018 | 2017 | 2016 | 2015 | 2014 | ||||||||||||||||
| A SHARES | ||||||||||||||||||||
| NET ASSET VALUE, Beginning of Year | $ | 22.23 | $ | 19.90 | $ | 20.64 | $ | 20.85 | $ | 18.63 | ||||||||||
| INVESTMENT OPERATIONS | ||||||||||||||||||||
| Net investment income (a) | 0.20 | 0.19 | 0.19 | 0.18 | 0.20 | |||||||||||||||
| Net realized and unrealized gain | 1.29 | 2.61 | 0.09 | 0.36 | 2.64 | |||||||||||||||
| Total from Investment Operations | 1.49 | 2.80 | 0.28 | 0.54 | 2.84 | |||||||||||||||
| DISTRIBUTIONS TO SHAREHOLDERS FROM | ||||||||||||||||||||
| Net investment income | (0.17 | ) | (0.14 | ) | (0.12 | ) | (0.15 | ) | (0.17 | ) | ||||||||||
| Net realized gain | (0.99 | ) | (0.33 | ) | (0.90 | ) | (0.60 | ) | (0.45 | ) | ||||||||||
| Total Distributions to Shareholders | (1.16 | ) | (0.47 | ) | (1.02 | ) | (0.75 | ) | (0.62 | ) | ||||||||||
| REDEMPTION FEES(a) | 0.00 | (b) | 0.00 | (b) | 0.00 | (b) | 0.00 | (b) | 0.00 | (b) | ||||||||||
| NET ASSET VALUE, End of Year | $ | 22.56 | $ | 22.23 | $ | 19.90 | $ | 20.64 | $ | 20.85 | ||||||||||
| TOTAL RETURN(c) | 6.68 | % | 14.28 | % | 1.49 | % | 2.63 | % | 15.45 | % | ||||||||||
| RATIOS/SUPPLEMENTARY DATA | ||||||||||||||||||||
| Net Assets at End of Year (000s omitted) | $ | 2,782 | $ | 2,797 | $ | 2,698 | $ | 5,541 | $ | 5,108 | ||||||||||
| Ratios to Average Net Assets: | ||||||||||||||||||||
| Net investment income | 0.87 | % | 0.91 | % | 0.94 | % | 0.84 | % | 1.02 | % | ||||||||||
| Net expenses | 1.25 | % | 1.25 | % | 1.25 | % | 1.25 | % | 1.25 | % | ||||||||||
| Gross expenses (d) | 1.44 | % | 1.54 | % | 1.61 | % | 1.56 | % | 1.62 | % | ||||||||||
| PORTFOLIO TURNOVER RATE | 3 | % | 5 | % | 6 | % | 4 | % | 9 | % | ||||||||||
| (a) | Calculated based on average shares outstanding during each year. |
| (b) | Less than $0.01 per share. |
| (c) | Total Return does not include the effect of front end sales charge or contingent deferred sales charge. |
| (d) | Reflects the expense ratio excluding any waivers and/or reimbursements. |
See Notes to Financial Statements.
AUXIER FOCUS FUND
FINANCIAL HIGHLIGHTS
These financial highlights reflect selected data for a share outstanding throughout each year.
| For the Years Ended June 30, | ||||||||||||||||||||
| 2018 | 2017 | 2016 | 2015 | 2014 | ||||||||||||||||
| INSTITUTIONAL SHARES | ||||||||||||||||||||
| NET ASSET VALUE, Beginning of Year | $ | 22.29 | $ | 19.96 | $ | 20.74 | $ | 20.91 | $ | 18.66 | ||||||||||
| INVESTMENT OPERATIONS | ||||||||||||||||||||
| Net investment income (a) | 0.31 | 0.28 | 0.25 | 0.24 | 0.25 | |||||||||||||||
| Net realized and unrealized gain | 1.30 | 2.61 | 0.08 | 0.36 | 2.64 | |||||||||||||||
| Total from Investment Operations | 1.61 | 2.89 | 0.33 | 0.60 | 2.89 | |||||||||||||||
| DISTRIBUTIONS TO SHAREHOLDERS FROM | ||||||||||||||||||||
| Net investment income | (0.25 | ) | (0.23 | ) | (0.21 | ) | (0.17 | ) | (0.19 | ) | ||||||||||
| Net realized gain | (0.99 | ) | (0.33 | ) | (0.90 | ) | (0.60 | ) | (0.45 | ) | ||||||||||
| Total Distributions to Shareholders | (1.24 | ) | (0.56 | ) | (1.11 | ) | (0.77 | ) | (0.64 | ) | ||||||||||
| REDEMPTION FEES(a) | 0.00 | (b) | 0.00 | (b) | 0.00 | (b) | 0.00 | (b) | 0.00 | (b) | ||||||||||
| NET ASSET VALUE, End of Year | $ | 22.66 | $ | 22.29 | $ | 19.96 | $ | 20.74 | $ | 20.91 | ||||||||||
| TOTAL RETURN | 7.20 | % | 14.72 | % | 1.74 | % | 2.93 | % | 15.73 | % | ||||||||||
| RATIOS/SUPPLEMENTARY DATA | ||||||||||||||||||||
| Net Assets at End of Year (000s omitted) | $ | 71,644 | $ | 59,518 | $ | 42,969 | $ | 29,366 | $ | 8,001 | ||||||||||
| Ratios to Average Net Assets: | ||||||||||||||||||||
| Net investment income | 1.34 | % | 1.32 | % | 1.27 | % | 1.13 | % | 1.25 | % | ||||||||||
| Net expenses | 0.80 | % | 0.86 | % | 1.00 | % | 1.00 | % | 1.00 | % | ||||||||||
| Gross expenses (c) | 1.10 | % | 1.16 | % | 1.31 | % | 1.36 | % | 1.47 | % | ||||||||||
| PORTFOLIO TURNOVER RATE | 3 | % | 5 | % | 6 | % | 4 | % | 9 | % | ||||||||||
| (a) | Calculated based on average shares outstanding during each year. |
| (b) | Less than $0.01 per share. |
| (c) | Reflects the expense ratio excluding any waivers and/or reimbursements. |
See Notes to Financial Statements.
AUXIER FOCUS FUND
NOTES TO FINANCIAL STATEMENTS
JUNE 30, 2018
Note 1. Organization
The Auxier Focus Fund (the “Fund”) is a diversified portfolio of Forum Funds (the “Trust”). The Trust is a Delaware statutory trust that is registered as an open-end, management investment company under the Investment Company Act of 1940, as amended (the “Act”). Under its Trust Instrument, the Trust is authorized to issue an unlimited number of the Fund’s shares of beneficial interest without par value.
The Fund currently offers three classes of shares: Investor Shares, A Shares and Institutional Shares. A Shares are offered at net asset value plus a maximum sales charge of 5.75%. A Shares are also subject to contingent deferred sales charge (“CDSC”) of 1.00% on purchases without an initial sales charge and redeemed less than one year after they are purchased. Investor Shares and Institutional Shares are not subject to a sales charge. Investor Shares, A Shares and Institutional Shares commenced operations on July 9, 1999, July 8, 2005 and May 9, 2012, respectively. The Fund’s investment objective is to provide long-term capital appreciation.
Note 2. Summary of Significant Accounting Policies
The Fund is an investment company and follows accounting and reporting guidance under Financial Accounting Standards Board (“FASB”) Accounting Standards Codification (“ASC”) Topic 946, “Financial Services-Investment Companies”. These financial statements are prepared in accordance with accounting principles generally accepted in the United States of America (“GAAP”), which require management to make estimates and assumptions that affect the reported amounts of assets and liabilities, the disclosure of contingent liabilities at the date of the financial statements, and the reported amounts of increases and decreases in net assets from operations during the fiscal year. Actual amounts could differ from those estimates. The following summarizes the significant accounting policies of the Fund:
Security Valuation – Securities are valued at market prices using the last quoted trade or official closing price from the principal exchange where the security is traded, as provided by independent pricing services on each Fund business day. In the absence of a last trade, securities are valued at the mean of the last bid and ask price provided by the pricing service. Debt securities may be valued at prices supplied by a fund’s pricing agent based on broker or dealer supplied valuations or matrix pricing, a method of valuing securities by reference to the value of other securities with similar characteristics such as rating, interest rate and maturity. Shares of non-exchange traded open-end mutual funds are valued at net asset value (“NAV”). Short-term investments that mature in sixty days or less may be valued at amortized cost.
The Fund values its investments at fair value pursuant to procedures adopted by the Trust’s Board of Trustees (the “Board”) if (1) market quotations are not readily available or (2) the Adviser, as defined in Note 4, believes that the values available are unreliable. The Trust’s Valuation Committee, as defined in the Fund’s registration statement, performs certain functions as they relate to the administration and oversight of the Fund’s valuation procedures. Under these procedures, the Valuation Committee convenes on a regular and ad hoc basis to review such investments and considers a number of factors, including valuation methodologies and significant unobservable inputs, when arriving at fair value.
The Valuation Committee may work with the Adviser to provide valuation inputs. In determining fair valuations, inputs may include market-based analytics that may consider related or comparable assets or liabilities, recent transactions, market multiples, book values and other relevant investment information. Adviser inputs may include an income-based approach in which the anticipated future cash flows of the investment are discounted in determining fair value. Discounts may also be applied based on the nature or duration of any restrictions on the disposition of the investments. The Valuation Committee performs regular reviews of valuation methodologies, key inputs and assumptions, disposition analysis and market activity.
Fair valuation is based on subjective factors and, as a result, the fair value price of an investment may differ from the security’s market price and may not be the price at which the asset may be sold. Fair valuation could result in a different NAV than a NAV determined by using market quotes.
GAAP has a three-tier fair value hierarchy. The basis of the tiers is dependent upon the various “inputs” used to determine the value of the Fund’s investments. These inputs are summarized in the three broad levels listed below:
Level 1 - Quoted prices in active markets for identical assets and liabilities.
AUXIER FOCUS FUND
NOTES TO FINANCIAL STATEMENTS
JUNE 30, 2018
Level 2 - Prices determined using significant other observable inputs (including quoted prices for similar securities, interest rates, prepayment speeds, credit risk, etc.). Short-term securities with maturities of sixty days or less are valued at amortized cost, which approximates market value, and are categorized as Level 2 in the hierarchy. Municipal securities, long-term U.S. government obligations and corporate debt securities are valued in accordance with the evaluated price supplied by the pricing service and generally categorized as Level 2 in the hierarchy. Other securities that are categorized as Level 2 in the hierarchy include, but are not limited to, warrants that do not trade on an exchange, securities valued at the mean between the last reported bid and ask quotation and international equity securities valued by an independent third party with adjustments for changes in value between the time of the securities respective local market closes and the close of the U.S. market.
Level 3 - Significant unobservable inputs (including the Fund’s own assumptions in determining the fair value of investments).
The aggregate value by input level, as of June 30, 2018, for the Fund’s investments is included at the end of the Fund’s Schedule of Investments.
Security Transactions, Investment Income and Realized Gain and Loss – Investment transactions are accounted for on the trade date. Dividend income is recorded on the ex-dividend date. Foreign dividend income is recorded on the ex-dividend date or as soon as possible after determining the existence of a dividend declaration after exercising reasonable due diligence. Income and capital gains on some foreign securities may be subject to foreign withholding taxes, which are accrued as applicable. Interest income is recorded on an accrual basis. Premium is amortized and discount is accreted using the effective interest method. Identified cost of investments sold is used to determine the gain and loss for both financial statement and federal income tax purposes.
Foreign Currency Translations – Foreign currency amounts are translated into U.S. dollars as follows: (1) assets and liabilities at the rate of exchange at the end of the respective period; and (2) purchases and sales of securities and income and expenses at the rate of exchange prevailing on the dates of such transactions. The portion of the results of operations arising from changes in the exchange rates and the portion due to fluctuations arising from changes in the market prices of securities are not isolated. Such fluctuations are included with the net realized and unrealized gain or loss on investments.
Distributions to Shareholders – The Fund declares any dividends from net investment income and pays them annually. Any net capital gains realized by the Fund are distributed at least annually. Distributions to shareholders are recorded on the ex-dividend date. Distributions are based on amounts calculated in accordance with applicable federal income tax regulations, which may differ from GAAP. These differences are due primarily to differing treatments of income and gain on various investment securities held by the Fund, timing differences and differing characterizations of distributions made by the Fund.
Federal Taxes – The Fund intends to continue to qualify each year as a regulated investment company under Subchapter M of Chapter 1, Subtitle A, of the Internal Revenue Code of 1986, as amended (“Code”), and to distribute all of its taxable income to shareholders. In addition, by distributing in each calendar year substantially all of its net investment income and capital gains, if any, the Fund will not be subject to a federal excise tax. Therefore, no federal income or excise tax provision is required. The Fund files a U.S. federal income and excise tax return as required. The Fund’s federal income tax returns are subject to examination by the Internal Revenue Service for a period of three fiscal years after they are filed. As of June 30, 2018, there are no uncertain tax positions that would require financial statement recognition, de-recognition or disclosure.
Income and Expense Allocation – The Trust accounts separately for the assets, liabilities and operations of each of its investment portfolios. Expenses that are directly attributable to more than one investment portfolio are allocated among the respective investment portfolios in an equitable manner.
The Fund's class-specific expenses are charged to the operations of that class of shares. Income and expenses (other than expenses attributable to a specific class) and realized and unrealized gains or losses on investments are allocated to each class of shares based on the class’ respective net assets to the total net assets of the Fund.
Redemption Fees – A shareholder who redeems or exchanges shares within 180 days of purchase will incur a redemption fee of 2.00% of the current NAV of shares redeemed or exchanged, subject to certain limitations. The fee is charged for the benefit of the remaining shareholders and will be paid to the Fund to help offset transaction costs. The fee is accounted for as an addition to paid-in capital. The Fund reserves the right to modify the terms of or terminate the fee at any time. There are limited exceptions to
AUXIER FOCUS FUND
NOTES TO FINANCIAL STATEMENTS
JUNE 30, 2018
the imposition of the redemption fee. Redemption fees incurred for the Fund, if any, are reflected on the Statements of Changes in Net Assets.
Commitments and Contingencies – In the normal course of business, the Fund enters into contracts that provide general indemnifications by the Fund to the counterparty to the contract. The Fund’s maximum exposure under these arrangements is dependent on future claims that may be made against the Fund and, therefore, cannot be estimated; however, based on experience, the risk of loss from such claims is considered remote. The Fund has determined that none of these arrangements requires disclosure on the Fund’s balance sheet.
Note 3. Cash – Concentration in Uninsured Account
For cash management purposes, the Fund may concentrate cash with the Fund’s custodian. This typically results in cash balances exceeding the Federal Deposit Insurance Corporation (“FDIC”) insurance limits. As of June 30, 2018, the Fund had $5,052,232 at MUFG Union Bank, N.A. that exceeded the FDIC insurance limit.
Note 4. Fees and Expenses
Investment Adviser – Auxier Asset Management LLC (the “Adviser”) is the investment Adviser to the Fund. Pursuant to an investment advisory agreement, the Adviser receives an advisory fee, payable monthly, from the Fund at an annual rate of 0.80% of the Fund’s average daily net assets.
Distribution – Foreside Fund Services, LLC serves as the Fund’s distributor (the “Distributor”). The Distributor is not affiliated with the Adviser or Atlantic Fund Administration, LLC (d/b/a Atlantic Fund Services) (“Atlantic”) or their affiliates. The Fund has adopted a Distribution Plan (the “Plan”) for A Shares of the Fund in accordance with Rule 12b-1 of the Act. Under the Plan, the Fund pays the Distributor and/or any other entity as authorized by the Board a fee of up to 0.25% of the average daily net assets of A Shares. The Distributor has no role in determining the investment policies or which securities are to be purchased or sold by the Trust or its Funds.
For the year ended June 30, 2018, there were $1,400 in front-end sales charges assessed on the sale of A Shares and no contingent deferred sales charges were assessed on the sale of A Shares. The Distributor received $294 of the total front-end sales charges. Such amounts are set aside by the Distributor and used solely for distribution-related expenses.
Other Service Providers – Atlantic provides fund accounting, fund administration, compliance and transfer agency services to the Fund. The fees related to these services are included in Fund services fees within the Statement of Operations. Atlantic also provides certain shareholder report production and EDGAR conversion and filing services. Atlantic provides a Principal Executive Officer, a Principal Financial Officer, a Chief Compliance Officer and an Anti-Money Laundering Officer to the Fund, as well as certain additional compliance support functions.
Trustees and Officers – Through December 31, 2017, the Trust paid each Independent Trustee an annual retainer fee of $50,000 for service to the Trust ($66,000 for the Chairman), and the Audit Committee Chairman and Vice Chairman receive an additional $6,000 annually. Effective January 1, 2018, each Independent Trustee’s annual retainer is $31,000 ($41,000 for the Chairman), and the Audit Committee Chairman receives an additional $2,000 annually. The Trustees and Chairman may receive additional fees for special Board meetings. Each Trustee is also reimbursed for all reasonable out-of-pocket expenses incurred in connection with his or her duties as a Trustee, including travel and related expenses incurred in attending Board meetings. The amount of Trustees’ fees attributable to the Fund is disclosed in the Statement of Operations. Certain officers of the Trust are also officers or employees of the above named service providers, and during their terms of office received no compensation from the Fund.
Note 5. Expense Reimbursement and Fees Waived
The Adviser has contractually agreed to waive its fee and/or reimburse Fund expenses to limit Total Annual Fund Operating Expenses After Fee Waiver and/or Expense Reimbursement (excluding all taxes, interest, portfolio transaction expenses, dividend expenses on short sales, and extraordinary expenses) to 0.98%, 1.25% and 0.80% of the Investor Shares, A Shares and Institutional Shares, respectively, through at least October 31, 2018. These contractual waivers may only be raised or eliminated with consent
AUXIER FOCUS FUND
NOTES TO FINANCIAL STATEMENTS
JUNE 30, 2018
of the Board. Other fund service providers have voluntarily agreed to waive a portion of their fees. These voluntary reductions may be reduced or eliminated at any time. For the year ended June 30, 2018, the fees waived and expenses reimbursed were as follows:
| Investment Adviser Fees Waived |
Other Waivers | Total Fees Waived and Expenses Reimbursed |
||||||||
| $ | 327,675 | $ | 89,049 | $ | 416,724 | |||||
The Adviser may be reimbursed by the Fund for fees waived and expenses reimbursed by the Adviser pursuant to the Expense Cap if such payment is made within three years of the fee waiver or expense reimbursement, and does not cause the Total Annual Fund Operating Expenses After Fee Waiver and/or Expense Reimbursement to exceed the lesser of (i) the then-current expense cap, or (ii) the expense cap in place at the time the fees/expenses were waived/reimbursed. As of June 30, 2018, $1,079,484 is subject to recapture by the Adviser. Other Waivers are not eligible for recoupment.
Note 6. Security Transactions
The cost of purchases and proceeds from sales of investment securities (including maturities), other than short-term investments, during the year ended June 30, 2018, totaled $6,652,829 and $27,038,479.
Note 7. Federal Income Tax
As of June 30, 2018, cost for federal income tax purposes is $126,819,789 and net unrealized appreciation consists of:
| Gross Unrealized Appreciation | $ | 110,506,904 | ||
| Gross Unrealized Depreciation | (7,379,534 | ) | ||
| Net Unrealized Appreciation | $ | 103,127,370 |
Distributions paid during the fiscal years ended as noted were characterized for tax purposes as follows:
| 2018 | 2017 | |||||||
| Ordinary Income | $ | 2,986,907 | $ | 3,396,865 | ||||
| Long-Term Capital Gain | 10,426,580 | 3,410,098 | ||||||
| $ | 13,413,487 | $ | 6,806,963 | |||||
As of June 30, 2018, distributable earnings (accumulated loss) on a tax basis were as follows:
| Undistributed Ordinary Income | $ | 1,556,427 | ||
| Undistributed Long-Term Gain | 8,367,508 | |||
| Unrealized Appreciation | 103,127,370 | |||
| Total | $ | 113,051,305 |
The difference between components of distributable earnings on a tax basis and the amounts reflected in the Statement of Assets and Liabilities are primarily due to wash sales and equity return of capital.
On the Statement of Assets and Liabilities, as a result of permanent book to tax differences, certain amounts have been reclassified for the year ended June 30, 2018. The following reclassification was the result of equity return of capital distributions and foreign currency transactions and has no impact on the net assets of the Fund.
| Undistributed net investment income | $ | (134,064 | ) | |
| Accumulated net realized gain | 134,064 |
Note 8. Subsequent Events
Subsequent events occurring after the date of this report through the date these financial statements were issued have been evaluated for potential impact, and the Fund has had no such events.
REPORT OF INDEPENDENT REGISTERED PUBLIC ACCOUNTING FIRM
To the Board of Trustees of Forum Funds
and the Shareholders of Auxier Focus Fund
Opinion on the Financial Statements
We have audited the accompanying statement of assets and liabilities of Auxier Focus Fund, a series of shares of beneficial interest in Forum Funds (the “Fund”), including the schedule of investments, as of June 30, 2018, and the related statement of operations for the year then ended, the statements of changes in net assets for each of the years in the two-year period then ended and the financial highlights for each of the years in the five-year period then ended, and the related notes (collectively referred to as the “financial statements”). In our opinion, the financial statements present fairly, in all material respects, the financial position of the Fund as of June 30, 2018, and the results of its operations for the year then ended, the changes in its net assets for each of the years in the two-year period then ended and its financial highlights for each of the years in the five-year period then ended, in conformity with accounting principles generally accepted in the United States of America.
Basis for Opinion
These financial statements are the responsibility of the Fund's management. Our responsibility is to express an opinion on the Fund’s financial statements based on our audits. We are a public accounting firm registered with the Public Company Accounting Oversight Board (United States) (“PCAOB”) and are required to be independent with respect to the Fund in accordance with the U.S. federal securities law and the applicable rules and regulations of the Securities and Exchange Commission and the PCAOB.
We conducted our audits in accordance with the standards of the PCAOB. Those standards require that we plan and perform the audits to obtain reasonable assurance about whether the financial statements are free of material misstatement, whether due to error or fraud. The Fund is not required to have, nor were we engaged to perform, an audit of its internal control over financial reporting. As part of our audits we are required to obtain an understanding of internal control over financial reporting but not for the purpose of expressing an opinion on the effectiveness of the Fund’s internal control over financial reporting. Accordingly, we express no such opinion.
Our audits included performing procedures to assess the risk of material misstatement of those financial statements, whether due to error or fraud, and performing procedures that respond to those risks. Such procedures included examining, on a test basis, evidence regarding the amounts and disclosures in the financial statements. Our procedures included confirmation of securities owned as of June 30, 2018 by correspondence with the custodian and brokers, or by other appropriate auditing procedures where replies from brokers were not received. Our audits also included evaluating the accounting principles used and significant estimates made by management, as well as evaluating the overall presentation of the financial statements. We believe that our audits provide a reasonable basis for our opinion.

BBD, LLP
Philadelphia, Pennsylvania
August 23, 2018
AUXIER FOCUS FUND
ADDITIONAL INFORMATION (Unaudited)
JUNE 30, 2018
Proxy Voting Information
A description of the policies and procedures that the Fund uses to determine how to vote proxies relating to securities held in the Fund’s portfolio is available, without charge and upon request, by calling (877) 328-9437 and on the SEC’s website at www.sec.gov. The Fund’s proxy voting record for the most recent twelve-month period ended June 30 is available, without charge and upon request, by calling (877) 328-9437 and on the SEC’s website at www.sec.gov.
Availability of Quarterly Portfolio Schedules
The Fund files its complete schedule of portfolio holdings with the SEC for the first and third quarters of each fiscal year on Form N-Q. These filings are available, without charge and upon request on the SEC’s website at www.sec.gov or may be reviewed and copied at the SEC’s Public Reference Room in Washington, DC. Information on the operation of the Public Reference Room may be obtained by calling (800) SEC-0330.
Shareholder Expense Example
As a shareholder of the Fund, you incur two types of costs: (1) transaction costs, including sales charges (loads) on purchase payments on certain classes, redemption fees, exchange fees and CDSC fees, and (2) ongoing costs, including management fees, 12b-1 fees, and other Fund expenses. This example is intended to help you understand your ongoing costs (in dollars) of investing in the Fund, and to compare these costs with the ongoing costs of investing in other mutual funds.
The example is based on an investment of $1,000 invested at the beginning of the period and held for the entire period from January 1, 2018 through June 30, 2018.
Actual Expenses – The first line of the table below provides information about actual account values and actual expenses. You may use the information in this line, together with the amount you invested, to estimate the expenses that you paid over the period. Simply divide your account value by $1,000 (for example, an $8,600 account value divided by $1,000 = 8.6), then multiply the result by the number in the first line under the heading entitled “Expenses Paid During Period” to estimate the expenses you paid on your account during the period.
Hypothetical Example for Comparison Purposes – The second line under each share class of the table below provides information about hypothetical account values and hypothetical expenses based on the Fund’s actual expense ratio and an assumed rate of return of 5% per year before expenses, which is not the Fund’s actual return. The hypothetical account values and expenses may not be used to estimate the actual ending account balance or expenses you paid for the period. You may use this information to compare the ongoing costs of investing in the Fund and other funds. To do so, compare this 5% hypothetical example with the 5% hypothetical examples that appear in the shareholder reports of other funds.
Please note that the expenses shown in the table are meant to highlight your ongoing costs only and do not reflect any transactional costs, such as sales charges (loads) on purchase payments on certain classes, redemption fees, exchange fees, and CDSC fees. Therefore, the second line of the table is useful in comparing ongoing costs only and will not help you determine the relative total costs of owning different funds. In addition, if these transactional costs were included, your costs would have been higher.
| Beginning Account Value January 1, 2018 |
Ending Account Value June 30, 2018 |
Expenses Paid During Period* |
Annualized Expense Ratio* |
|||||||||||||
| Investor Shares | ||||||||||||||||
| Actual | $ | 1,000.00 | $ | 996.87 | $ | 4.85 | 0.98 | % | ||||||||
| Hypothetical (5% return before expenses) | $ | 1,000.00 | $ | 1,019.93 | $ | 4.91 | 0.98 | % | ||||||||
| A Shares | ||||||||||||||||
| Actual | $ | 1,000.00 | $ | 995.14 | $ | 6.18 | 1.25 | % | ||||||||
| Hypothetical (5% return before expenses) | $ | 1,000.00 | $ | 1,018.60 | $ | 6.26 | 1.25 | % | ||||||||
AUXIER FOCUS FUND
ADDITIONAL INFORMATION (Unaudited)
JUNE 30, 2018
| Beginning Account Value January 1, 2018 |
Ending Account Value June 30, 2018 |
Expenses Paid During Period* |
Annualized Expense Ratio* |
|||||||||||||
| Institutional Shares | ||||||||||||||||
| Actual | $ | 1,000.00 | $ | 997.79 | $ | 3.96 | 0.80 | % | ||||||||
| Hypothetical (5% return before expenses) | $ | 1,000.00 | $ | 1,020.83 | $ | 4.01 | 0.80 | % | ||||||||
| * | Expenses are equal to the Fund’s annualized expense ratio multiplied by the average account value over the period, multiplied by the number of days in the most recent fiscal half-year (181) divided by 365 to reflect the half-year period. |
Federal Tax Status of Dividends Declared during the Fiscal Year
For federal income tax purposes, dividends from short-term capital gains are classified as ordinary income. The Fund designates 100.00% of its income dividend distributed as qualifying for the corporate dividends-received deduction (DRD) and 100.00% for the qualified dividend rate (QDI) as defined in Section 1(h)(11) of the Code. The Fund also designates 2.18% of its income dividends as qualified interest income exempt from U.S. tax for foreign shareholders (QII) and 7.81% of its income dividends as qualified short-term gain exempt from U.S. tax for foreign shareholders (QSD).
Trustees and Officers of the Trust
The Board is responsible for oversight of the management of the Trust’s business affairs and of the exercise of all the Trust’s powers except those reserved for the shareholders. The following table provides information about each Trustee and certain officers of the Trust. Each Trustee and officer holds office until the person resigns, is removed, or is replaced. Unless otherwise noted, the persons have held their principal occupations for more than five years. The address for all Trustees and officers is Three Canal Plaza, Suite 600, Portland, Maine 04101. The Fund’s Statement of Additional Information includes additional information about the Trustees and is available, without charge and upon request, by calling (877) 328-9437.
AUXIER FOCUS FUND
ADDITIONAL INFORMATION (Unaudited)
JUNE 30, 2018
| Name and Year of Birth | Position with the Trust |
Length of Time Served |
Principal Occupation(s) During Past Five Years |
Number of Series in Fund Complex Overseen By Trustee |
Other Directorships Held By Trustee During Past Five Years |
| Independent Trustees | |||||
| David Tucker Born: 1958 |
Trustee; Chairman of the Board |
Since 2011 and Chairman since 2018 | Director, Blue Sky Experience (a charitable endeavor) since 2008; Senior Vice President & General Counsel, American Century Companies (an investment management firm) 1998-2008. | 1 | Trustee, Forum Funds II, Forum ETF Trust and U.S. Global Investors Funds |
| Mark D. Moyer Born: 1959 |
Trustee | Since 2018 | Chief Financial Officer, Freedom House (a NGO advocating political freedom and democracy) since 2017; independent consultant providing interim CFO services, principally to non-profit organizations, 2011-2017; Chief Financial Officer, Institute of International Education (a NGO administering international educational exchange programs), 2008-2011; Chief Financial Officer and Chief Restructuring Officer, Ziff Davis Media Inc. (an integrated media company), 2005-2008; Adjunct Professor of Accounting, Fairfield University from 2009-2012. | 1 | Trustee, Forum Funds II, Forum ETF Trust and U.S. Global Investors Funds |
| Jennifer Brown-Strabley Born: 1964 |
Trustee | Since 2018 | Principal, Portland Global Advisors, 1996-2010. | 1 | Trustee, Forum Funds II, Forum ETF Trust and U.S. Global Investors Funds |
| Interested Trustees | |||||
| Stacey E. Hong(1) Born: 1966 |
Trustee | Since 2018 | President, Atlantic since 2008. | 1 | Trustee, Forum Funds II and U.S. Global Investors Funds |
|
Jessica Chase(1) Born: 1970 |
Trustee | Since 2018 | Senior Vice President, Atlantic since 2008. | 1 | None |
| (1) | Stacey E. Hong is currently treated as an interested person of the Trust, as defined in the 1940 Act, due to his affiliation with Atlantic. Jessica Chase is currently treated as an interested person of the Trust, as defined in the 1940 Act, due to her affiliation with Atlantic and her role as President of the Trust. |
AUXIER FOCUS FUND
ADDITIONAL INFORMATION (Unaudited)
JUNE 30, 2018
| Name and Year of Birth | Position with the Trust | Length of Time Served | Principal Occupation(s) During Past 5 Years |
| Officers | |||
| Jessica Chase Born: 1970 |
President; Principal Executive Officer | Since 2015 | Senior Vice President, Atlantic since 2008. |
| Karen Shaw Born: 1972 |
Treasurer; Principal Financial Officer | Since 2008 | Senior Vice President, Atlantic since 2008. |
| Zachary Tackett Born: 1988 |
Vice President; Secretary and Anti-Money Laundering Compliance Officer | Since 2014 | Counsel, Atlantic since 2014; Intern Associate, Coakley & Hyde, PLLC, 2010-2013. |
| Michael J. McKeen Born: 1971 |
Vice President | Since 2009 | Senior Vice President, Atlantic since 2008. |
| Timothy Bowden Born: 1969 |
Vice President | Since 2009 | Manager, Atlantic since 2008. |
| Geoffrey Ney Born: 1975 |
Vice President | Since 2013 | Manager, Atlantic since 2013; Senior Fund Accountant, Atlantic, 2008–2013. |
| Todd Proulx Born: 1978 |
Vice President | Since 2013 | Manager, Atlantic since 2013; Senior Fund Accountant, Atlantic, 2008–2013. |
| Carlyn Edgar Born: 1963 |
Vice President | Since 2008 | Senior Vice President, Atlantic since 2008; Chief Compliance Officer, 2008-2016 |
| Dennis Mason Born: 1967 |
Chief Compliance Officer | Since 2016 | Fund Compliance Officer, Atlantic since 2013; Senior Specialist, Atlantic, 2011-2013; Senior Analyst, Atlantic, 2008-2011 |
AUXIER FOCUS FUND
FOR MORE INFORMATION
P.O. Box 588
Portland, Maine 04112
(877) 3AUXIER
(877) 328-9437
INVESTMENT ADVISER
Auxier Asset Management LLC
15668 NE Eilers Road
Aurora, Oregon 97002
TRANSFER AGENT
Atlantic Fund Services
P.O. Box 588
Portland, Maine 04112
www.atlanticfundservices.com
DISTRIBUTOR
Foreside Fund Services, LLC
Three Canal Plaza, Suite 100
Portland, Maine 04101
www.foreside.com
This report is submitted for the general information of the shareholders of the Fund. It is not authorized for distribution to prospective investors unless preceded or accompanied by an effective prospectus, which includes information regarding the Fund’s risks, objectives, fees and expenses, experience of its management, and other information.
204-ANR-0618
| ANNUAL REPORT | |
| JUNE 30, 2018 |

DF DENT GROWTH FUNDS
TABLE OF CONTENTS
JUNE 30, 2018
| DF Dent Premier Growth Fund | |
| A Message to Our Shareholders (Unaudited) | 1 |
| Management Discussion of Fund Performance (Unaudited) | 10 |
| Performance Chart and Analysis (Unaudited) | 16 |
| Schedule of Investments | 17 |
| Statement of Assets and Liabilities | 19 |
| Statement of Operations | 20 |
| Statements of Changes in Net Assets | 21 |
| Financial Highlights | 22 |
| DF Dent Midcap Growth Fund | |
| A Message to Our Shareholders (Unaudited) | 23 |
| Performance Chart and Analysis (Unaudited) | 29 |
| Schedule of Investments | 31 |
| Statement of Assets and Liabilities | 33 |
| Statement of Operations | 34 |
| Statements of Changes in Net Assets | 35 |
| Financial Highlights | 36 |
| DF Dent Small Cap Growth Fund | |
| A Message to Our Shareholders (Unaudited) | 38 |
| Performance Chart and Analysis (Unaudited) | 44 |
| Schedule of Investments | 46 |
| Statement of Assets and Liabilities | 48 |
| Statement of Operations | 49 |
| Statements of Changes in Net Assets | 50 |
| Financial Highlights | 51 |
| DF Dent Growth Funds | |
| Notes to Financial Statements | 53 |
| Report of Independent Registered Public Accounting Firm | 60 |
| Additional Information (Unaudited) | 62 |
DF DENT PREMIER GROWTH FUND
A MESSAGE TO OUR SHAREHOLDERS (Unaudited)
JUNE 30, 2018
Dear Fellow Shareholders,
Performance for the three DF Dent Growth Funds is detailed in the table below.
Performance (for periods ending 6/30/2018)
| DF Dent Premier Growth |
DF Dent Midcap Growth Investor Shares |
DF Dent Small Cap Growth Investor Shares |
||||||||||
| Benchmark | S&P 500 Index | Russell Midcap Growth Index |
Russell 2000 Growth Index |
|||||||||
| 6 Months | ||||||||||||
| Fund | + | 10.68% | + | 9.03% | + | 11.52% | ||||||
| Benchmark | + | 2.65% | + | 5.40% | + | 9.70% | ||||||
| Fund vs Benchmark | + | 8.03% | + | 3.63% | + | 1.82% | ||||||
| 12 Months | ||||||||||||
| Fund | + | 24.97% | + | 23.21% | + | 20.17% | ||||||
| Benchmark | + | 14.37% | + | 18.52% | + | 21.86% | ||||||
| Fund vs Benchmark | + | 10.60% | + | 4.69% | - | 1.69% | ||||||
| 5 Years | ||||||||||||
| Fund | + | 14.18% | + | 13.85% | N/A | |||||||
| Benchmark | + | 13.42% | + | 13.37% | N/A | |||||||
| Fund vs Benchmark | + | 0.76% | + | 0.48% | N/A | |||||||
| 10 Years | ||||||||||||
| Fund | + | 10.24% | N/A | N/A | ||||||||
| Benchmark | + | 10.17% | N/A | N/A | ||||||||
| Fund vs Benchmark | + | 0.07% | N/A | N/A | ||||||||
| Since Inception | ||||||||||||
| Fund | + | 9.17% | + | 13.91% | + | 11.00% | ||||||
| Benchmark | + | 7.05% | + | 11.91% | + | 11.49% | ||||||
| Fund vs Benchmark | + | 2.12% | + | 2.00% | - | 0.49% | ||||||
| Cumulative Since Inception | ||||||||||||
| Fund | + | 342.76% | + | 148.82% | + | 62.67% | ||||||
| Benchmark | + | 217.60% | + | 119.78% | + | 65.98% | ||||||
| Fund vs Benchmark | + | 125.16% | + | 29.04% | - | 3.31% | ||||||
| Inception Date | 07/16/2001 | 07/01/2011 | 11/01/2013 | |||||||||
N/A- Periods which exceed the life of the particular fund.
Performance data quoted represents past performance and is no guarantee of future results. Current performance may be lower or higher than the performance data quoted. Investment return and principal value will fluctuate so that an investor’s shares, when redeemed, may be worth more or less than original cost. For the most recent
DF DENT GROWTH FUNDS
DF DENT PREMIER GROWTH FUND
A MESSAGE TO OUR SHAREHOLDERS (Unaudited)
JUNE 30, 2018
month-end performance, please call (866) 233-3368. As stated in the current prospectus, the DF Dent Premier Growth Fund’s annual operating expense ratio (gross) is 1.23%. However, D.F. Dent and Company (the Funds’ “Adviser”) has contractually agreed to waive a portion of its fees and/or reimburse Fund expenses to limit Total Annual Fund Operating Expenses After Fee Waiver and/or Expense Reimbursement (excluding all taxes, interest, portfolio transaction expenses, and extraordinary expenses) (net) to 1.10% on the first $150 million in Fund net assets. This agreement is in effect through October 31, 2019. As stated in the current prospectus, the DF Dent Midcap Growth Fund’s annual operating expense ratio (gross) is 1.43% and 2.27% for the Investor Shares and Institutional Shares, respectively. However, the Adviser has contractually agreed to waive a portion of its fees and/ or reimburse Fund expenses to limit Total Annual Fund Operating Expenses After Fee Waiver and/or Expense Reimbursement (excluding all taxes, interest, portfolio transaction expenses, and extraordinary expenses) (net) of Investor Shares and Institutional Shares to 0.98% and 0.85%, respectively, through October 31, 2019. As stated in the current prospectus, the DF Dent Small Cap Growth Fund’s annual operating expense ratio (gross) is 3.10% and 3.35% for the Investor Shares and Institutional Shares, respectively. However, the Adviser has contractually agreed to waive a portion of its fees and/or reimburse Fund expenses to limit Total Annual Fund Operating Expenses After Fee Waiver and/or Expense Reimbursement (excluding all taxes, interest, portfolio transaction expenses, and extraordinary expenses) (net) of Investor Shares and Institutional Shares to 1.05% and 0.95%, respectively, through October 31, 2019. These expense caps may be changed or eliminated prior to their expiration date only with the consent of the Board of Trustees. Both the DF Dent Midcap Growth Fund and DF Dent Small Cap Growth Fund charge a 2.00% redemption fee on shares redeemed within 60 days of purchase. Fund performance returns shown do not reflect redemption fees; if reflected, the returns would have been lower. Returns greater than one year are annualized, except cumulative returns.
The remainder of the letter pertains primarily to the DF Dent Premier Growth Fund (the “Fund”).
The DF Dent Premier Growth Fund’s return for the fiscal year ending June 30, 2018 of +24.97% exceeded the S&P 500 Index’s (the “Index”) return of +14.37% by +10.60%. In the 17 years since inception, your Fund’s return has exceeded the Index in 12 years for a .705 “Batting Average.” Your Fund has achieved returns in excess of 20% in six of these 17 fiscal years. As can be observed above, the past six months have been particularly strong for the Fund versus the Index. Prior to this recent fiscal year, many of your Fund’s companies made meaningful investments in operations and market expansion at the expense of quarterly earnings comparisons. While these investments affected earnings reports in fiscal 2016 (and the Fund’s short-term performance), many of these companies have recently experienced accelerating earnings which exceeded investors’ expectations, contributing to this year’s portfolio results.
While exceeding the Index by 2.12% annually since inception might not seem like very much, over the seventeen year history that excess return compounds to 125.16% in additional return.
Themes
The Adviser seeks to identify major socio-economic trends which are ongoing and impact multiple industries. Industry diversification is fine to a point, but we believe that major underlying trends which reach across many
DF DENT GROWTH FUNDS
DF DENT PREMIER GROWTH FUND
A MESSAGE TO OUR SHAREHOLDERS (Unaudited)
JUNE 30, 2018
different industries are key elements of long-term sustained growth. Your Fund is structured to participate in the following ongoing major investment themes:
| 1. | Dominant leaders of advanced innovative technologies in healthcare: Illumina, Intuitive Surgical, Bio-Techne; |
| 2. | Credit cards and electronic payments displacing cash/checks globally: Visa, Mastercard, Discover Financial Services; |
| 3. | Software improving productivity in legacy industries: Blackbaud, Tyler Technologies, CoStar Group, ANSYS, Blackline, PROS Holdings, Black Knight, RedHat; |
| 4. | Consumer Businesses not vulnerable to online pricing pressures: LKQ Corp., CarMax; |
| 5. | Financial Services: Markel, S&P Global, Moody’s, Envestnet, SEI Investments; and |
| 6. | Pioneering use of data to add value: Verisk, Alphabet (Google), Ecolab, Trimble. |
Expense Ratio Management
Your Fund’s Adviser, D.F. Dent and Company, has again agreed to maintain your Fund’s expense ratio at a net 1.10% on the first $150 million of net assets and 0.90% on net assets exceeding $150 million through October 31, 2019 by reimbursing expenses and waiving management fees. The record of expense reimbursement and management fee waivers for the first 17 years of your Fund is as follows:
| Year Ending | Expense Reimbursement | Management Fee Waived | ||||||
| 06/30/02 | $ | 60,201 | $ | 60,019 | ||||
| 06/30/03 | 38,066 | 90,163 | ||||||
| 06/30/04 | – | 129,060 | ||||||
| 06/30/05 | – | 141,907 | ||||||
| 06/30/06 | – | 142,664 | ||||||
| 06/30/07 | – | 161,128 | ||||||
| 06/30/08 | – | 95,665 | ||||||
| 06/30/09 | – | 234,053 | ||||||
| 06/30/10 | – | 204,148 | ||||||
| 06/30/11 | – | 211,784 | ||||||
| 06/30/12 | – | 240,847 | ||||||
| 06/30/13 | – | 235,380 | ||||||
| 06/30/14 | – | 220,476 | ||||||
| 06/30/15 | – | 175,996 | ||||||
| 06/30/16 | – | 135,822 | ||||||
| 06/30/17 | – | 123,930 | ||||||
| 06/30/18 | – | 146,156 | ||||||
| Total | $ | 98,267 | $ | 2,749,198 | ||||
DF DENT GROWTH FUNDS
DF DENT PREMIER GROWTH FUND
A MESSAGE TO OUR SHAREHOLDERS (Unaudited)
JUNE 30, 2018
Portfolio Turnover
Annual portfolio turnover since inception has been as follows:
Portfolio Turnover*
| 2002** | 2003 | 2004 | 2005 | 2006 | 2007 | 2008 | 2009 | 2010 | 2011 | 2012 | 2013 | 2014 | 2015 | 2016 | 2017 | 2018 | Average |
| 0% | 14% | 20% | 7% | 25% | 17% | 21% | 16% | 8% | 21% | 14% | 19% | 25% | 25% | 20% | 13% | 16% | 16.5% |
| * | Percentage calculated based on total value of long term investments. |
| ** | The Fund commenced operations on July 16, 2001. |
We believe these low portfolio turnover rates are consistent with our investment strategy of holding positions for long periods and minimizing transaction expenses for shareholders. Brokerage expenses for this fiscal year’s trading amounted to less than one cent per share of your Fund based upon the 5.4 million shares outstanding as of June 30, 2018. Thus, trading expense remained very low owing to low portfolio turnover.
Management Ownership of Fund
The Adviser’s retirement plan, employees and related family members of the Adviser collectively own 22% of the Fund as well as 19% and 61% of the DF Dent Midcap Growth Fund and DF Dent Small Cap Growth Fund, respectively. The Fund is the largest investment of the Adviser’s retirement plan (at 26.4% of the retirement plan’s assets). 34.7% of the Adviser’s retirement plan is invested in the three DF Dent Funds, inclusive of the 26.4% referenced above that is invested in the DF Dent Premier Growth Fund. We believe this demonstrates a level of conviction and alignment with our shareholders.
Asset Allocation
| 06/30/11* | 06/30/12* | 06/30/13* | 06/30/14* | 06/30/15* | 06/30/16* | 06/30/17* | 06/30/18* | |
| Large Capitalization | 50.2% | 50.3% | 51.3% | 75.5% | 46.5% | 53.4% | 62.8% | 72.2% |
| Mid Capitalization | 40.6% | 38.6% | 40.4% | 21.8% | 38.9% | 35.1% | 29.3% | 18.5% |
| Small Capitalization | 9.2% | 11.0% | 5.6% | 2.5% | 12.3% | 11.4% | 7.9% | 9.2% |
| Reserve Funds | 0.0% | 0.1% | 2.7% | 0.1% | 2.3% | 0.1% | 0.0% | 0.1% |
| Total Fund | 100.0% | 100.0% | 100.0% | 100.0% | 100.0% | 100.0% | 100.0% | 100.0% |
| * | Percentage calculated based on total value of investments. |
DF DENT GROWTH FUNDS
DF DENT PREMIER GROWTH FUND
A MESSAGE TO OUR SHAREHOLDERS (Unaudited)
JUNE 30, 2018
From inception (July 16, 2001) through June 30, 2014, your Adviser used a market capitalization range of $1.5 to $7.0 billion to define mid-capitalization with companies below and above this range representing small and large caps, respectively. To reflect the overall increase of market capitalization levels from 2001 to 2015, in the Fund’s 2015 Prospectus (dated November 1, 2015), we increased the market capitalization range of mid-cap to $3.0 to $12.0 billion, thereby defining companies below and above this range as small and large caps, respectively. The result of this upward adjustment was that the asset allocation of your Fund as of June 30, 2015 was closer to the historic allocation in prior years and reflected the overall expanded level of market valuations.
The large cap percentage has now increased by almost 20% over its percentage two years ago. The small cap percentage has decreased on June 30, 2018 from two years ago. We believe this is the result of portfolio companies “graduating” from mid-cap to large cap and small cap to mid-cap. In managing your Fund, we attempt to recycle portfolio gains into small cap as companies from that category “graduate” into higher market capitalization categories. To accomplish this balance, we purchased positions during the past year in Pros Holdings, Black Line, and Brooks Automation within the small cap category as well as Watsco, Bio-Techne, Core Laboratories, Black Knight, Health Care Services Group, and Trimble within the mid-cap category. We believe these additions offset the “graduation” of companies from those categories whose stocks performed well, and therefore moved them into higher market capitalization categories. These purchases were funded by trimming positions in large cap companies.
Concentration
The trimming of large cap positions in highly appreciated stocks to recycle funds into newer investments has also reduced the portfolio’s concentration in the past year as demonstrated below.
| Top 10 Holdings | 06/30/11 | 06/30/12 | 06/30/13 | 06/30/14 | 06/30/15 | 06/30/16 | 06/30/17 | 06/30/18 |
| % of the Fund | 52.46% | 49.35% | 44.95% | 42.36% | 42.80% | 43.92% | 43.71% | 40.89% |
| Average Size Of Top 10 | 5.2% | 4.9% | 4.5% | 4.2% | 4.3% | 4.4% | 4.4% | 4.1% |
Our thought process is that if we invest 3% in a stock at a price of $40, should we maintain a 4.5% position in the same company when its valuation is 50% higher if the stock were to reach $60? Would we want a 50% larger position at a 50% higher valuation? The answer is “No.” Thus, such stocks become trim candidates, and the gain is recycled into more attractive valuations.
By industry standards your Fund’s holdings of 41 stocks on June 30, 2018 is considered reasonably concentrated or “focused.” The top ten holdings generated a total contribution of 14.91% of your annual total return of 24.97%. That represents 59.71% of your total return from 40.89% of the Fund. The top holdings have fairly consistently contributed more return than their actual weightings as commented upon in the Commentary section of last year’s Annual Report. Thus, we believe that some concentration within the Fund has enhanced results.
DF DENT GROWTH FUNDS
DF DENT PREMIER GROWTH FUND
A MESSAGE TO OUR SHAREHOLDERS (Unaudited)
JUNE 30, 2018
Commentary
The fiscal year ending June 30, 2018 was the third best year in your Fund’s 17 year history. Its 10.60% excess return over the Index was the second best relative return during this time frame. We believe this strong recent performance is mainly attributable to our time-tested research process that enables us to find “best-in-class”* companies that are managed by talented and ethical leaders that have dominant and durable business models, and that generate significant free cash over time that can be prudently allocated for the benefit of shareholders. Regardless of whether the market goes up or down from here, we will continue to stick to our research process (now in its 43rd year) and will continue to do the research blocking and tackling that we believe is necessary for good stock selection and portfolio management.
Since we do not feel that we have the wisdom or the expertise to time the market, we instead will try to manage risk in your portfolio. The most effective risk management tool we have is our due diligence process. In good times and bad, we visit your portfolio companies and other prospective holdings. We meet and talk with their management teams, their customers, and their competitors - trying to find chinks in their armor, emerging competitive threats, management team blind spots, signs of complacency or arrogance. At its heart, this due diligence helps us hone our projections for the long-term earnings growth at these companies, consistent with our core investment philosophy that long-term stock price appreciation is highly correlated with long-term earnings growth.
2018 has been a volatile year in the stock market, but we view volatility as opportunity. We attempt to take advantage of market volatility to add and trim positions as previously discussed. We will manage the position sizes so that the companies with the highest expected returns have higher weights in the portfolio. We also believe that your portfolio is well positioned for a challenging market environment, primarily because it is comprised of companies that we believe will have strong earnings growth over a long period of time and across market cycles.
The following companies are three of the best contributors listed in the Management Discussion and Financial Performance section of this report. We thought highlighting them would give you a sense of not only why we have invested in them on your behalf, but also why they have outperformed recently.
Visa, Inc. (V), the world’s largest retail electronic payment network, continues to report strong volume growth and operational execution. Visa processes more than 50% of all credit and debit transactions globally. Recently, faster revenue growth, lower incentive payments, and lower taxes a have contributed to margin expansion and accelerating earnings growth. This has led to management beating and raising earnings guidance over the last year. Visa continues to lead the global transition from physical cash and check payments to digital payments. This trend is still early in its migration and has been given additional momentum from the pervasive growth of ecommerce and the recent acquisition of Visa Europe. The integration of Visa Europe is providing a nice tailwind and is tracking ahead of expectations. We believe this digital payment tailwind, coupled with excellent management execution and a market-leading position in an effective global oligopoly, makes Visa an attractive long-term investment for your Fund.
DF DENT GROWTH FUNDS
DF DENT PREMIER GROWTH FUND
A MESSAGE TO OUR SHAREHOLDERS (Unaudited)
JUNE 30, 2018
Red Hat, Inc. (RHT), a leading open-source software company, has continued to execute above expectations with organic revenue growth in the high teens. RHT’s core Red Hat Enterprise Linux (RHEL) business has stayed relatively strong, while its emerging technologies (e.g., OpenShift and OpenStack) have experienced rapid growth. RHT’s deal size has also increased steadily over the last few years as customers have been willing to make larger, longer-term commitments to open-source architectures. After a strong year and a half, RHT declined on its last earnings announcement. We think the selloff was a bit overdone, and we believe that RHT has the potential to remain a core holding for a long period of time.
Intuitive Surgical, Inc. (ISRG), a leading designer and manufacturer of robotic surgical systems, has reported very strong organic growth driven by strong procedure volume growth both inside the U.S. and outside the U.S. In addition, ISRG announced the launch of the da Vinci X system which has been well received by customers. In our opinion, this combined with the upcoming launch of the da Vinci SP surgical system that provides surgeons with the ability to enter the body through a single, small incision, and the development of a “flexible robotics” system, set ISRG up for healthy growth over the next several years.
Market Thoughts
How much longer? This is a question that many parents hear when stuck in traffic with their kids in the back seat. It is also a question we are constantly asking ourselves these days in the tenth year of a bull market (with the fundamentals of your portfolio companies as strong as ever). How much higher and how much longer can the bull market go? No surprise, but we have no good answer, and we do not want to let our guesses determine the character of your portfolio. We do realize that all good things come to an end, but, at this time, we do not see fundamentals as being the reason for a market decline.
From a technical perspective, market breadth – the number of stocks advancing relative to the number declining - is often a leading indicator of market performance, with declining market breadth signaling weak future performance. Market breadth is near its highs, so it still appears that we are in a bull market. We also have not yet seen the typical early warning signs of a coming recession. However, the overall market environment has been in the process of changing. The market has gone from being the beneficiary of a strong expansionary monetary policy and some fiscal discipline to an environment of less expansionary monetary policy and expansionary fiscal policy (large tax cuts). We believe that monetary policy is a more important driver of stock market multiples (and returns) than fiscal policy. We also fear that the huge fiscal stimulus from tax cuts will boost growth temporarily but will leave the economy with a hangover at some point in the near future. Therefore, we think the current state of affairs probably means we have reached the end of the sustained multiple expansion of price-to-earnings ratios that has driven the market higher in recent years. In order for the market to continue to work higher, it is corporate profit growth that will have to carry the day. In fact, we believe that corporate profits (the “e” in “p/e”) will grow for the remainder of 2018. Since the market typically discounts economic performance six to nine months in the future, the key will be earnings growth in 2019 and 2020. Given how long the economic expansion has endured, we believe the market will be on guard for signs of a slowing or recessionary environment in the next two years. We are keeping a close eye on concerns about rising interest rates, unsustainable valuations, and tariff wars, among other data points.
DF DENT GROWTH FUNDS
DF DENT PREMIER GROWTH FUND
A MESSAGE TO OUR SHAREHOLDERS (Unaudited)
JUNE 30, 2018
As in the past, we appreciate your investment in our DF Dent Premier Growth Fund and will continue to work diligently for you, our shareholders.
Respectively Submitted,
 |
 |
 |
| Daniel F. Dent | Bruce L. Kennedy | Matthew F. Dent |
| * | The determination of “best-in-class” is solely the opinion of the Fund’s Adviser, and such opinion is subject to change. Those companies that hold leading market share positions, strong growth potential, historically good profitability, and management teams known for integrity and good corporate governance are generally considered to be “best in class.” |
IMPORTANT INFORMATION:
The recent growth rate in the global equity markets has helped to produce short-term returns for some sectors/ asset classes that are not typical and may not continue in the future. Because of ongoing market volatility, Fund performance may be subject to substantial short-term changes.
Investing involves risks, including the possible loss of principal. The DF Dent Premier Growth Fund may invest in small and medium size companies. Investments in these companies, especially smaller companies, carry greater risk than is customarily associated with larger companies for various reasons such as increased volatility of earnings and prospects, narrower markets, limited financial resources and less liquid stock.
The DF Dent Midcap Growth Fund (“Midcap Fund”) also invests in small and medium size companies. With non-diversification risk, the Midcap Fund will typically invest in securities of a small group of issuers, which exposes the Midcap Fund to greater market risk. Investing in American Depositary Receipts (ADRs) carries risks of political and financial instability, less liquidity and greater volatility, as well as risks associated with the lack of reliable accounting and financial information. The Midcap Fund is also subject to other risks, such as Real Estate Investment Trusts (REIT) risk with possible real estate market declines, which are detailed in the Midcap Fund’s prospectus.
The DF Dent Small Cap Growth Fund (“Small Cap Fund”) invests in small size companies, which carry greater risk than is customarily associated with larger, more established companies. With non-diversification risk, the Small Cap Fund will typically invest in securities of a small group of issuers, which exposes the Small Cap Fund to greater market risk. Investing in ADRs carries risks of political and financial instability, less liquidity and greater volatility, as well as risks associated with the lack of reliable accounting and financial information. The Small Cap Fund is also subject to other risks, such as REIT risk with possible real estate market declines, which are detailed in the Small Cap Fund’s prospectus.
DF DENT GROWTH FUNDS
DF DENT PREMIER GROWTH FUND
A MESSAGE TO OUR SHAREHOLDERS (Unaudited)
JUNE 30, 2018
The S&P 500 Index is a broad-based, unmanaged measurement of changes in stock market conditions based on the average of 500 widely held stocks. The Russell Midcap Growth Index measures the performance of the mid-cap growth segment of the U.S. equity universe. It includes those Russell Midcap Index companies with higher price-to-book ratios and higher forecasted growth values. The Russell 2000 Growth Index measures the performance of the small cap growth segment of the U.S. equity universe. It includes those Russell Small Cap Index companies with higher price-to-book ratios and higher forecasted growth values. One cannot invest directly in an index.
DF DENT GROWTH FUNDS
DF DENT PREMIER GROWTH FUND
MANAGEMENT DISCUSSION OF FUND PERFORMANCE (Unaudited)
JUNE 30, 2018
Recent Performance
For the fiscal year ending June 30, 2018, the DF Dent Premier Growth Fund (the “Fund”) experienced a total return of +24.97% versus a total return of +14.37% for the S&P 500 Index (the “Index”), the benchmark we use for performance comparisons. Performance versus the Index for various periods ending June 30, 2018 was as follows:
| Period Ending 6/30/2018 | DF Dent Premier Growth |
S&P 500 Index | Outperformance (Underperformance) |
||||||
| Six Months | + | 10.68% | + | 2.65% | + | 8.03% | |||
| Twelve Months | + | 24.97% | + | 14.37% | + | 10.60% | |||
| Five Years (annualized) | + | 14.18% | + | 13.42% | + | 0.76% | |||
| Five Years (cumulative) | + | 94.10% | + | 87.70% | + | 6.40% | |||
| Ten Years (annualized) | + | 10.24% | + | 10.17% | + | 0.07% | |||
| Ten Years (cumulative) | + | 165.10% | + | 163.40% | + | 1.70% | |||
| Since Inception (7/16/2001) (annualized) | + | 9.17% | + | 7.05% | + | 2.12% | |||
| Since Inception (7/16/2001) (cumulative) | + | 342.76% | + | 217.60% | + | 125.16% | |||
Past performance is not indicative of future performance.
The Fund’s fiscal year ending on June 30, 2018 was the second year in a row and one of six years in the Fund’s 17 year history to record a total return of greater than 20%. Your Fund’s annual total return has been greater than 10% in ten of those fiscal years and negative in four fiscal years. Your Fund’s total return performance of + 24.97% this year exceeded the Index by 10.60%, and the Fund has beaten the Index in 12 years of its 17 year history. This fiscal year’s return was the third best year in the Fund’s history. As can be seen above, the most recent six months were particularly strong relative to the Index. This return was clearly above what shareholders should normally expect as the Fund’s long-term annual return since inception has been +9.17%.
The past five years include a couple of years (2014 and 2016) when investors poured large amounts of money into index funds, with those funds indexed to the S&P 500 being most popular. The cash flows into the Index made it a very tough benchmark to beat in those years. However, your Fund did outperform the Index in three of the past five years (2015, 2017, and 2018).
Sector Performance
The Index is composed of 11 Sectors. Your Fund did not have any holdings during the year in the three worst performing Sectors of the Index: Consumer Staples, Telecom Services, and Utilities. Avoidance of poor performing Sectors contributed a little over 2% to the Fund’s excess return over the Index.
Your Fund outperformed in seven of the eight remaining sectors in the Index. On average, a 10% larger weighting in Information Technology within your Fund during the fiscal year generated a total return of +37.05% versus +31.16% for the Index. The combination of a heavier weighting and a higher return a higher return resulted in a little over 3% of the Fund’s 10.60% excess return over the Index.
DF DENT GROWTH FUNDS
DF DENT PREMIER GROWTH FUND
MANAGEMENT DISCUSSION OF FUND PERFORMANCE (Unaudited)
JUNE 30, 2018
Within the Financial Sector your Fund generated a total return of +29.06% versus +9.66% for the Index. Your portfolio’s average weight in Financials was 15.10%, comparable to the Index at 14.60%. Thus, it was stock selection within Financials rather than weighting which contributed almost 3% to your Fund’s return over the Index.
Health Care was the third Sector of your Fund to generate a strong total return of +26.33% versus only +6.90% for the Index. This performance contributed a little over 2% to the Fund’s excess return over the Index.
In summary, these Sectors explained the Fund’s fiscal 2018 outperformance:
| • | Avoidance of three worst Sectors | +2.27% | |
| • | Information Technology | +3.11% | |
| • | Financial | +2.93% | |
| • | Health Care | +2.37% | |
| • | Total Contribution | 10.68% |
Individual Stock Performance
Looking at some of the individual stocks which affected performance, of the 43 companies held over the course of the year only six stocks with an average combined weighting of 9.67% provided negative returns. While the five best and the five worst contributors (which combines both weighting and performance) are listed later in this report, the individual top percentage performers within the Fund during the year were:
| • | Amazon | +75.60% | |
| • | Exponent | +67.67% | |
| • | Mastercard | +62.85% | |
| • | Illumina | +60.96% | |
| • | CoStar Group | +56.54% |
The six stocks providing negative returns were LKQ, Celgene, Healthcare Services, Wabtec, Trimble, and WageWorks. As a group they impacted the Fund by -1.18%. At the risk of being redundant, this was an exceptional year, and it is highly unlikely we will see these kinds of individual results in the future.
Your Fund has followed a policy of not investing in any derivative securities.
DF DENT GROWTH FUNDS
DF DENT PREMIER GROWTH FUND
MANAGEMENT DISCUSSION OF FUND PERFORMANCE (Unaudited)
JUNE 30, 2018
Market Factors and Strategy
The most significant market factors affecting performance were:
| 1. | Investor enthusiasm for technology companies; |
| 2. | Growth outperforming value during the year; |
| 3. | Domestic outperforming international (particularly emerging markets); |
| 4. | A strong economy, good corporate earnings and cash flow, reduced corporate taxes; |
| 5. | Low unemployment and healthy consumer spending; and |
| 6. | Low inflation and stable (though rising) interest rates. |
One could conclude from the above that we had a what some describe as a ”Goldilocks” market where the economy is not too hot, and not too cold- but just right. Surely there were political worries and international uncertainty, but the market seemed to develop a certain immunity to these matters.
The strategies utilized in managing the Fund are constant and do not change with the vagaries of the markets. The Adviser seeks to identify those few “best-in-class”* companies which dominate attractive market niches, enjoy good profit margins, and are run by talented and dedicated management teams of unquestioned integrity. It is your Adviser’s belief that such enterprises are best positioned to navigate the sea changes confronting businesses today.
The key trends in which your Fund invests are best outlined in the “Themes” section of the Shareholders’ Letter preceding this discussion.
Sector Allocation and Attribution
The following bar chart presents the sector weightings of your Fund (DFDPX) versus the sector weightings of the Index as of June 30, 2018:
DF DENT GROWTH FUNDS
DF DENT PREMIER GROWTH FUND
MANAGEMENT DISCUSSION OF FUND PERFORMANCE (Unaudited)
JUNE 30, 2018

Source: FactSet
The weightings in the earlier Sector Performance section are average weightings during the Fund’s fiscal year versus the 06/30/2018 weightings above.
Best and Worst Performers
Five Best Contributors
| Investments | Fund Realized and Unrealized Appreciation and Income in Fiscal Year 2018 |
Fund Per Share As of 06/30/18 |
||||||
| Visa Inc., Class A | $ | 3,624,575 | $ | 0.67 | ||||
| Amazon.com, Inc. | 2,787,896 | 0.52 | ||||||
| Intuitive Surgical, Inc. | 2,616,954 | 0.48 | ||||||
| Mastercard, Inc., Class A | 2,599,093 | 0.44 | ||||||
| Red Hat, Inc. | 2,247,000 | 0.42 | ||||||
| $ | 13,875,518 | $ | 2.53 | |||||
Visa has been on the Five Best Contributors List four years in a row. Red Hat and Intuitive Surgical have made this list in three of the past four years. We like to see repeaters on the Five Best List and not on the Five Worst List.
DF DENT GROWTH FUNDS
DF DENT PREMIER GROWTH FUND
MANAGEMENT DISCUSSION OF FUND PERFORMANCE (Unaudited)
JUNE 30, 2018
Five Worst Contributors
| Investments | Fund Realized and Unrealized Loss and Income in Fiscal Year 2018 |
Fund Per Share As of 06/30/18 |
||||||
| WageWorks, Inc. | $ | (1,523,805 | ) | $ | (0.28 | ) | ||
| Celgene Corp. | (1,367,539 | ) | (0.25 | ) | ||||
| Wabtec Corp. | (580,610 | ) | (0.11 | ) | ||||
| Trimble, Inc. | (160,518 | ) | (0.03 | ) | ||||
| Health Services Group, Inc. | (144,067 | ) | (0.03 | ) | ||||
| $ | (3,776,539 | ) | $ | (0.70 | ) | |||
Capital Gains Distribution Policy
Your Fund is required to distribute its net realized capital gains each year. A short-term capital gain of $0.06305 per share and a long-term capital gain of $2.78626 per share were distributed in December 2017.
Since inception (July 16, 2001), your Fund has distributed a total of $47,144,672 or $8.03 per share in realized gains. Consequently, an original shareholder on July 16, 2001 who invested $10 a share in the Fund has received $8.03 in capital gain distributions. An investor who elected to receive these capital gain distributions in cash would have accumulated total value of $40.16 as of June 30, 2018 ($8.03 in cash distributions + $32.13 net asset value).
If a shareholder reinvested all the capital gain distributions in additional shares at the time of each capital gain distribution, the original $10 investment would now be worth $44.27 for a 9.17% annual return after fees versus $31.76 and a 7.05% annual return in the Index (before index fund fees). The $4.11 higher return for the investor reinvesting capital gain versus taking cash distributions represents the additional appreciation of the reinvested shares. Therefore, while a 9.17% return versus 7.05% in the Index may not seem like a large amount, 17 years of annual returns at that differential resulted in an additional $12.51 return over the Index on a $10 investment.
DF DENT GROWTH FUNDS
DF DENT PREMIER GROWTH FUND
MANAGEMENT DISCUSSION OF FUND PERFORMANCE (Unaudited)
JUNE 30, 2018
FIVE LARGEST EQUITY HOLDINGS
June 30, 2018
| Quantity | Security | Total Cost | Market Value | Percent of Net Assets of the Fund | Percent of Contribution to 2018 Return | |||||||||||||
| 85,000 | Visa, Inc., Class A | $ | 1,501,817 | $ | 11,258,250 | 6.48 | % | 2.67 | % | |||||||||
| 54,000 | Ecolab, Inc. | 3,150,919 | 7,577,820 | 4.37 | 0.32 | |||||||||||||
| 67,000 | Verisk Analytics, Inc. | 4,745,808 | 7,211,880 | 4.16 | 0.94 | |||||||||||||
| 34,000 | S&P Global, Inc. | 3,389,471 | 6,932,260 | 3.99 | 1.54 | |||||||||||||
| 6,000 | Alphabet, Inc., Class C | 3,691,577 | 6,693,900 | 3.86 | 0.93 | |||||||||||||
| $ | 16,479,592 | $ | 39,674,110 | 22.86 | % | 6.40 | % | |||||||||||
| * | The determination of “best-in-class” is solely the opinion of the Fund’s Adviser, and such opinion is subject to change. Those companies that hold leading market share positions, strong growth potential, historically good profitability, and management teams known for integrity and good corporate governance are generally considered to be “best-in-class.” |
The views in this report were those of the Fund’s Adviser as of June 30, 2018, and may not reflect the Adviser’s views on the date this report is first published or anytime thereafter. This report may contain discussions about certain investments both held and not held in the portfolio as of the report date. All current and future holdings are subject to risk and are subject to change. While these views are intended to assist shareholders in understanding their investment in the Fund, they do not constitute investment or tax advice, are not a guarantee of future performance and are not intended as an offer or solicitation with respect to the purchase or sale of any security.
DF DENT GROWTH FUNDS
DF DENT PREMIER GROWTH FUND
PERFORMANCE CHART AND ANALYSIS (Unaudited)
JUNE 30, 2018
The following chart reflects the change in the value of a hypothetical $10,000 investment, including reinvested dividends and distributions, in the DF Dent Premier Growth Fund (the “Fund”) compared with the performance of the benchmark, S&P 500 Index ("S&P 500”), over the past ten fiscal years. The S&P 500 is a broad-based measurement of the U.S. stock market based on the performance of 500 widely held large capitalization common stocks. The total return of the index includes the reinvestment of dividends and income. The total return of the Fund includes operating expenses that reduce returns, while the total return of the index does not include expenses. The Fund is professionally managed, while the index is unmanaged and is not available for investment.
Comparison of Change in Value of a $10,000 Investment
DF Dent Premier Growth Fund vs. S&P 500 Index
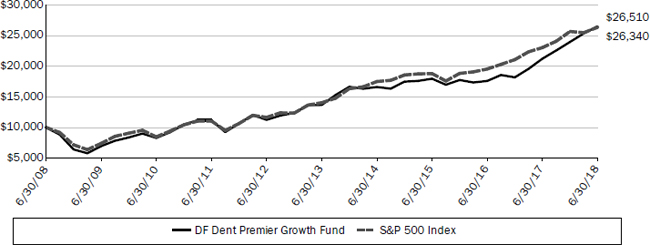
| Average Annual Total Returns Periods Ended June 30, 2018 | One Year | Five Year | Ten Year |
| DF Dent Premier Growth Fund | 24.97% | 14.18% | 10.24% |
| S&P 500 Index | 14.37% | 13.42% | 10.17% |
Performance data quoted represents past performance and is no guarantee of future results. Current performance may be lower or higher than the performance data quoted. Investment return and principal value will fluctuate so that shares, when redeemed, may be worth more or less than original cost. As stated in the Fund’s prospectus, the annual operating expense ratio (gross) is 1.23%. However, the Fund’s adviser has contractually agreed to waive its fee and/or reimburse Fund expenses to limit Total Annual Fund Operating Expenses After Fee Waiver and/or Expense Reimbursement (excluding all taxes, interest, portfolio transaction expenses, and extraordinary expenses) to 1.10% on the first $150 million in Fund net assets and to 0.90% on net assets exceeding the $150 million, through October 31, 2019 (the “Expense Cap”). The adviser may be reimbursed by each Fund for fees waived and expenses reimbursed by the adviser pursuant to the Expense Cap if such payment is made within three years of the fee waiver or expense reimbursement, and does not cause the Total Annual Fund Operating Expenses After Fee Waiver and/or Expense Reimbursement to exceed the lesser of (i) the then-current Expense Cap, or (ii) the Expense Cap in place at the time the fees/expenses were waived/reimbursed. During the period, certain fees were waived and/or expenses reimbursed; otherwise, returns would have been lower. The performance table and graph do not reflect the deduction of taxes that a shareholder would pay on Fund distributions or the redemption of Fund shares. Returns greater than one year are annualized.
DF DENT GROWTH FUNDS
DF DENT PREMIER GROWTH FUND
SCHEDULE OF INVESTMENTS
JUNE 30, 2018
| Shares | Security Description | Value | ||||||
| Common Stock - 100.1% | ||||||||
| Consumer Discretionary - 8.2% | ||||||||
| 3,800 | Amazon.com, Inc. (a) | $ | 6,459,240 | |||||
| 73,000 | CarMax, Inc. (a) | 5,319,510 | ||||||
| 76,000 | LKQ Corp. (a) | 2,424,400 | ||||||
| 14,203,150 | ||||||||
| Energy - 2.1% | ||||||||
| 29,000 | Core Laboratories NV | 3,660,090 | ||||||
| Financials - 13.0% | ||||||||
| 40,000 | Discover Financial Services | 2,816,400 | ||||||
| 2,800 | Markel Corp. (a) | 3,036,180 | ||||||
| 37,000 | Moody's Corp. | 6,310,720 | ||||||
| 34,000 | S&P Global, Inc. | 6,932,260 | ||||||
| 56,500 | SEI Investments Co. | 3,532,380 | ||||||
| 22,627,940 | ||||||||
| Health Care - 9.2% | ||||||||
| 21,000 | Bio-Techne Corp. | 3,106,950 | ||||||
| 24,810 | Celgene Corp. (a) | 1,970,410 | ||||||
| 17,100 | Illumina, Inc. (a) | 4,775,859 | ||||||
| 13,000 | Intuitive Surgical, Inc. (a) | 6,220,240 | ||||||
| 16,073,459 | ||||||||
| Industrials - 23.1% | ||||||||
| 14,000 | Danaher Corp. | 1,381,520 | ||||||
| 45,000 | Envestnet, Inc. (a) | 2,472,750 | ||||||
| 30,000 | Exponent, Inc. | 1,449,000 | ||||||
| 82,000 | Fastenal Co. | 3,946,660 | ||||||
| 24,000 | Genesee & Wyoming, Inc., Class A (a) | 1,951,680 | ||||||
| 58,000 | Healthcare Services Group, Inc. | 2,505,020 | ||||||
| 19,000 | Roper Technologies, Inc. | 5,242,290 | ||||||
| 10,500 | TransDigm Group, Inc. (a) | 3,623,970 | ||||||
| 67,000 | Verisk Analytics, Inc. (a) | 7,211,880 | ||||||
| 44,000 | WageWorks, Inc. (a) | 2,200,000 | ||||||
| 56,900 | Waste Connections, Inc. | 4,283,432 | ||||||
| 22,000 | Watsco, Inc. | 3,922,160 | ||||||
| 40,190,362 | ||||||||
| Information Technology - 34.8% | ||||||||
| 6,000 | Alphabet, Inc., Class C (a) | 6,693,900 | ||||||
| 38,000 | ANSYS, Inc. (a) | 6,618,840 | ||||||
| 17,000 | Black Knight, Inc. (a) | 910,350 | ||||||
| 22,000 | Blackbaud, Inc. | 2,253,900 | ||||||
| 89,017 | Blackline, Inc. (a) | 3,866,008 | ||||||
| 58,000 | Brooks Automation, Inc. | 1,891,960 | ||||||
| 9,000 | CoStar Group, Inc. (a) | 3,713,670 | ||||||
| 30,000 | Mastercard, Inc., Class A | 5,895,600 | ||||||
| 115,000 | PROS Holdings, Inc. (a) | 4,205,550 | ||||||
| 37,612 | Red Hat, Inc. (a) | 5,053,925 | ||||||
| 67,000 | Trimble, Inc. (a) | 2,200,280 | ||||||
| 26,000 | Tyler Technologies, Inc. (a) | 5,774,600 | ||||||
| Shares | Security Description | Value | ||||||
| Information Technology - 34.8% (continued) | ||||||||
| 85,000 | Visa, Inc., Class A | $ | 11,258,250 | |||||
| 60,336,833 | ||||||||
| Materials - 4.4% | ||||||||
| 54,000 | Ecolab, Inc. | 7,577,820 | ||||||
| Real Estate - 5.3% | ||||||||
| 38,000 | American Tower Corp. REIT | 5,478,460 | ||||||
| 77,000 | CBRE Group, Inc., Class A (a) | 3,675,980 | ||||||
| 9,154,440 | ||||||||
| Total Common Stock (Cost $85,220,485) | 173,824,094 | |||||||
| Investments, at value - 100.1% | ||||||||
| (Cost $85,220,485) | $ | 173,824,094 | ||||||
| Other Assets & Liabilities, Net - (0.1)% | (251,691 | ) | ||||||
| Net Assets - 100.0% | $ | 173,572,403 | ||||||
| REIT | Real Estate Investment Trust |
| (a) | Non-income producing security. |
The following is a summary of the inputs used to value the Fund's investments as of June 30, 2018.
The inputs or methodology used for valuing securities are not necessarily an indication of the risks associated with investing in those securities. For more information on valuation inputs, and their aggregation into the levels used in the table below, please refer to the Security Valuation section in Note 2 of the accompanying Notes to Financial Statements.
| Valuation Inputs | Investments in Securities | |||
| Level 1 - Quoted Prices | $ | 173,824,094 | ||
| Level 2 - Other Significant Observable Inputs | – | |||
| Level 3 - Significant Unobservable Inputs | – | |||
| Total | $ | 173,824,094 | ||
The Level 1 value displayed in this table is Common Stock. Refer to this Schedule of Investments for a further breakout of each security by industry.
The Fund utilizes the end of period methodology when determining transfers. There were no transfers among Level 1, Level 2 and Level 3 for the year ended June 30, 2018.
| See Notes to Financial Statements. | DF DENT GROWTH FUNDS |
DF DENT PREMIER GROWTH FUND
SCHEDULE OF INVESTMENTS
JUNE 30, 2018
| PORTFOLIO HOLDINGS (Unaudited) | |||
| % of Total Net Assets | |||
| Consumer Discretionary | 8.2% | ||
| Energy | 2.1% | ||
| Financials | 13.0% | ||
| Health Care | 9.2% | ||
| Industrials | 23.1% | ||
| Information Technology | 34.8% | ||
| Materials | 4.4% | ||
| Real Estate | 5.3% | ||
| Other Assets & Liabilities, Net | (0.1)% | ||
| 100.0% | |||
| See Notes to Financial Statements. | DF DENT GROWTH FUNDS |
DF DENT PREMIER GROWTH FUND
STATEMENT OF ASSETS AND LIABILITIES
JUNE 30, 2018
| ASSETS | ||||
| Investments, at value (Cost $85,220,485) | $ | 173,824,094 | ||
| Cash | 199,940 | |||
| Receivables: | ||||
| Dividends and interest | 53,796 | |||
| Prepaid expenses | 16,822 | |||
| Total Assets | 174,094,652 | |||
| LIABILITIES | ||||
| Payables: | ||||
| Fund shares redeemed | 97,409 | |||
| Accrued Liabilities: | ||||
| Investment adviser fees | 382,028 | |||
| Trustees’ fees and expenses | 180 | |||
| Fund services fees | 13,026 | |||
| Other expenses | 29,606 | |||
| Total Liabilities | 522,249 | |||
| NET ASSETS | $ | 173,572,403 | ||
| COMPONENTS OF NET ASSETS | ||||
| Paid-in capital | $ | 77,982,449 | ||
| Accumulated net investment loss | (366,479 | ) | ||
| Accumulated net realized gain | 7,352,824 | |||
| Net unrealized appreciation | 88,603,609 | |||
| NET ASSETS | $ | 173,572,403 | ||
| SHARES OF BENEFICIAL INTEREST AT NO PAR VALUE (UNLIMITED SHARES AUTHORIZED) | 5,401,368 | |||
| NET ASSET VALUE, OFFERING AND REDEMPTION PRICE PER SHARE | $ | 32.13 |
| See Notes to Financial Statements. | DF DENT GROWTH FUNDS |
DF DENT PREMIER GROWTH FUND
STATEMENT OF OPERATIONS
YEAR ENDED JUNE 30, 2018
| INVESTMENT INCOME | ||||
| Dividend income (Net of foreign withholding taxes of $7,167) | $ | 937,912 | ||
| Interest income | 3,646 | |||
| Total Investment Income | 941,558 | |||
| EXPENSES | ||||
| Investment adviser fees | 1,585,869 | |||
| Fund services fees | 208,665 | |||
| Custodian fees | 16,545 | |||
| Registration fees | 20,051 | |||
| Professional fees | 59,013 | |||
| Trustees' fees and expenses | 12,460 | |||
| Other expenses | 36,276 | |||
| Total Expenses | 1,938,879 | |||
| Fees waived | (211,907 | ) | ||
| Net Expenses | 1,726,972 | |||
| NET INVESTMENT LOSS | (785,414 | ) | ||
| NET REALIZED AND UNREALIZED GAIN (LOSS) | ||||
| Net realized gain on investments | 14,660,843 | |||
| Net change in unrealized appreciation (depreciation) on investments | 20,987,691 | |||
| NET REALIZED AND UNREALIZED GAIN | 35,648,534 | |||
| INCREASE IN NET ASSETS RESULTING FROM OPERATIONS | $ | 34,863,120 | ||
| See Notes to Financial Statements. | DF DENT GROWTH FUNDS |
DF DENT PREMIER GROWTH FUND
STATEMENTS OF CHANGES IN NET ASSETS
| For the Years Ended June 30, | ||||||||
| 2018 | 2017 | |||||||
| OPERATIONS | ||||||||
| Net investment loss | $ | (785,414 | ) | $ | (367,077 | ) | ||
| Net realized gain | 14,660,843 | 13,524,493 | ||||||
| Net change in unrealized appreciation (depreciation) | 20,987,691 | 13,764,129 | ||||||
| Increase in Net Assets Resulting from Operations | 34,863,120 | 26,921,545 | ||||||
| DISTRIBUTIONS TO SHAREHOLDERS FROM | ||||||||
| Net realized gain | (13,937,936 | ) | (5,832,194 | ) | ||||
| Total Distributions to Shareholders | (13,937,936 | ) | (5,832,194 | ) | ||||
| CAPITAL SHARE TRANSACTIONS | ||||||||
| Sale of shares | 11,550,790 | 906,695 | ||||||
| Reinvestment of distributions | 11,020,469 | 4,628,170 | ||||||
| Redemption of shares | (16,639,823 | ) | (26,911,202 | ) | ||||
| Increase (Decrease) in Net Assets from Capital Share Transactions | 5,931,436 | (21,376,337 | ) | |||||
| Increase (Decrease) in Net Assets | 26,856,620 | (286,986 | ) | |||||
| NET ASSETS | ||||||||
| Beginning of Year | 146,715,783 | 147,002,769 | ||||||
| End of Year (Including line (a)) | $ | 173,572,403 | $ | 146,715,783 | ||||
| SHARE TRANSACTIONS | ||||||||
| Sale of shares | 374,067 | 35,252 | ||||||
| Reinvestment of distributions | 377,672 | 187,300 | ||||||
| Redemption of shares | (548,956 | ) | (1,043,836 | ) | ||||
| Increase (Decrease) in Shares | 202,783 | (821,284 | ) | |||||
| (a) Undistributed net investment income (Accumulated net investment loss) | $ | (366,479 | ) | $ | 46,080 | |||
| See Notes to Financial Statements. | DF DENT GROWTH FUNDS |
DF DENT PREMIER GROWTH FUND
FINANCIAL HIGHLIGHTS
These financial highlights reflect selected data for a share outstanding throughout each year.
| For the Years Ended June 30, | ||||||||||||||||||||
| 2018 | 2017 | 2016 | 2015 | 2014 | ||||||||||||||||
| NET ASSET VALUE, Beginning of Year | $ | 28.22 | $ | 24.42 | $ | 28.32 | $ | 26.17 | $ | 21.54 | ||||||||||
| INVESTMENT OPERATIONS | ||||||||||||||||||||
| Net investment loss (a) | (0.15 | ) | (0.07 | ) | (0.13 | ) | (0.10 | ) | (0.08 | ) | ||||||||||
| Net realized and unrealized gain (loss) | 6.91 | 4.95 | (0.45 | ) | 2.25 | 4.71 | ||||||||||||||
| Total from Investment Operations | 6.76 | 4.88 | (0.58 | ) | 2.15 | 4.63 | ||||||||||||||
| DISTRIBUTIONS TO SHAREHOLDERS FROM | ||||||||||||||||||||
| Net realized gain | (2.85 | ) | (1.08 | ) | (3.32 | ) | – | – | ||||||||||||
| Total Distributions to Shareholders | (2.85 | ) | (1.08 | ) | (3.32 | ) | – | – | ||||||||||||
| NET ASSET VALUE, End of Year | $ | 32.13 | $ | 28.22 | $ | 24.42 | $ | 28.32 | $ | 26.17 | ||||||||||
| TOTAL RETURN | 24.97 | % | 20.62 | % | (2.06 | )% | 8.22 | % | 21.49 | % | ||||||||||
| RATIOS/SUPPLEMENTARY DATA | ||||||||||||||||||||
| Net Assets at End of Year (000s omitted) | $ | 173,572 | $ | 146,716 | $ | 147,003 | $ | 173,936 | $ | 199,409 | ||||||||||
| Ratios to Average Net Assets: | ||||||||||||||||||||
| Net investment loss | (0.50 | )% | (0.26 | )% | (0.52 | )% | (0.38 | )% | (0.31 | )% | ||||||||||
| Net expenses | 1.09 | % | 1.10 | % | 1.09 | % | 1.06 | % | 1.05 | % | ||||||||||
| Gross expenses (b) | 1.22 | % | 1.23 | % | 1.22 | % | 1.20 | % | 1.20 | % | ||||||||||
| PORTFOLIO TURNOVER RATE | 16 | % | 13 | % | 20 | % | 25 | % | 25 | % | ||||||||||
| (a) | Calculated based on average shares outstanding during each year. |
| (b) | Reflects the expense ratio excluding any waivers and/or reimbursements. |
| See Notes to Financial Statements. | DF DENT GROWTH FUNDS |
DF DENT MIDCAP GROWTH FUND
A MESSAGE TO OUR SHAREHOLDERS (Unaudited)
JUNE 30, 2018
Dear Fellow Shareholders:
Performance
For the period July 1, 2017, through June 30, 2018, the DF Dent Midcap Growth Fund (the “Fund”) experienced a total return of +23.21% for Investor Shares, outperforming the total return of +18.52% for the Russell Midcap Growth Index (the “Index”), which is the benchmark we use for performance comparisons, by 4.69%.
Expense Ratio
Your Fund’s investment Adviser, D.F. Dent and Company, Inc. (the “Adviser”), has contractually agreed to waive a portion of its fees to limit the expense ratio for Investor Shares to 0.98% through October 31, 2019. Per the prospectus, the Investor Share’s total operating expense ratio is 1.43%.
Concentration
The Fund’s concentration in its top 10 holdings is as follows:
| Top 10 Holdings | 06/30/18 |
| % of the Fund | 41.58% |
| Average Position Size of Top 10 | 4.2% |
We believe the concentration in the Fund’s top ten positions is appropriate at its current level and has the potential to enhance long-term performance.
Management Ownership of Fund
Employees, their families, and the Adviser’s retirement plan owned approximately 19% of the Fund as of June 30, 2018. There were only management purchases and no management redemptions during the fiscal year ended June 30, 2018.
Portfolio Commentary
We believe the Fund’s strong recent performance is mainly attributable to our time-tested research process that enables us to find “best-in-class”* companies that are managed by talented and ethical leaders, that have dominant and durable business models, and that generate significant free cash flow over time that can be prudently allocated for the potential benefit of shareholders. Regardless of whether the market goes up or down from here, we will continue to stick to our research process (now in its 43rd year) and will continue to do the research blocking and tackling that we believe is necessary for good stock selection and portfolio management.
Since we do not feel that we have the wisdom or the expertise to time the market, we instead will try to manage risk in your portfolio. The most effective risk management tool we have is our due diligence process. In good times and bad, we visit your portfolio companies and other prospective holdings. We meet and talk with their management teams, their customers, and their competitors - trying to find chinks in their armor, emerging
DF DENT GROWTH FUNDS
DF DENT MIDCAP GROWTH FUND
A MESSAGE TO OUR SHAREHOLDERS (Unaudited)
JUNE 30, 2018
competitive threats, management team blind spots, or signs of complacency or arrogance. At its heart, this due diligence helps us hone our projections for the long-term earnings growth at these companies, consistent with our core investment philosophy that long-term stock price appreciation is highly correlated to long-term earnings growth.
2018 has been a volatile year in the stock market, but we view volatility as opportunity. We attempt to take advantage of market volatility to add and trim positions as previously discussed. We aim to manage the position sizes so that the companies with the highest expected returns have higher weights in the portfolio. We also believe that your portfolio is well positioned for a challenging market environment, primarily because it is comprised of companies that we believe will have strong earnings growth over a long period of time and across market cycles.
The following companies are three of the best contributors to the Fund’s performance over the past year. We thought highlighting them would give you a sense of not only why we have invested in them on your behalf, but also why they have outperformed recently.
| • | Illumina, Inc. (ILMN), a leader in sequencing and array-based solutions for genomic analysis, benefitted from continued uptake of its new NovaSeq instrument and related consumables, indicating that the replacement cycle for sequencing equipment is likely longer and of greater magnitude than investors had anticipated. Favorable reimbursement decisions from Medicare and private insurers have also been positives for the stock. The applications for ILMN’s technology are still in an early stage, particularly in clinical markets. We expect the total addressable market to continue to expand as more applications are discovered for genomic sequencing. |
| • | Red Hat, Inc. (RHT), a leading open-source software company, has continued to execute above expectations with organic revenue growth in the high teens. RHT’s core Red Hat Enterprise Linux business has stayed relatively strong, while its emerging technologies (e.g., OpenShift and OpenStack) have experienced rapid growth. RHT’s deal size has also increased steadily over the last few years as customers have been willing to make larger, longer-term commitments to open-source architectures. After a strong year and a half, RHT declined on its last earnings announcement. We think the selloff was a bit overdone, and we believe that RHT has the potential to remain a core holding for a long period of time. |
| • | ANSYS, Inc. (ANSS), a developer and marketer of simulation software and services to engineers and product designers, continues to report strong earnings, even while it is investing substantial sums in expanding its salesforce and upgrading its systems. Deeper relationships with ANSS’s largest enterprise customers have resulted in larger deal sizes and impressive bookings numbers. ANSS also has moved closer to its near-term objective of achieving sustainable double-digit organic revenue growth. |
DF DENT GROWTH FUNDS
DF DENT MIDCAP GROWTH FUND
A MESSAGE TO OUR SHAREHOLDERS (Unaudited)
JUNE 30, 2018
Attribution Analysis
In the 12-month period ending June 30, 2018, most of your Fund’s outperformance can be attributed to stock selection, not sector allocation.
Your Fund was over-weighted versus the Index benchmark in the Energy, Financials, Industrials, Materials, and Real Estate sectors. In Energy, Financials, and Materials, both the over-weighting and stock selection contributed to performance. In Real Estate, the over-weighting detracted slightly from performance, but stock selection contributed to performance. In Industrials, both the over-weighting and stock selection detracted from performance.
Your Fund was under-weighted versus the Index in the Consumer Discretionary, Health Care, and Information Technology sectors. In Consumer Discretionary and Health Care, both the under-weighting and stock selection contributed to performance. In Information Technology, the under-weighting detracted slightly from performance while stock selection contributed to performance. Your Fund did not hold any positions in the Consumer Staples, Telecommunication Services, and Utilities sectors, which contributed slightly to performance.
Sector Weights
The following bar chart presents the sector weightings of your Fund versus the sector weightings of the Index as of June 30, 2018 (note this may differ slightly with the commentary above, which relates to average weightings as opposed to year-end weightings):

Source: FactSet
DF DENT GROWTH FUNDS
DF DENT MIDCAP GROWTH FUND
A MESSAGE TO OUR SHAREHOLDERS (Unaudited)
JUNE 30, 2018
Best and Worst Performers
Five Best Contributors
| Investments | Fund Realized and Unrealized Appreciation and Income in Fiscal Year 2018 | Fund Per Share As of 06/30/18 | ||||||
| Illumina, Inc. | $ | 769,206 | $ | 0.36 | ||||
| Red Hat, Inc. | 686,227 | 0.32 | ||||||
| ANSYS, Inc. | 610,598 | 0.29 | ||||||
| Verisk Analytics, Inc. | 585,268 | 0.28 | ||||||
| Moody’s Corp. | 569,318 | 0.27 | ||||||
| $ | 3,220,617 | $ | 1.52 | |||||
Five Worst Contributors
| Investments | Fund Realized and Unrealized Loss and Income in Fiscal Year 2018 | Fund Per Share As of 06/30/18 | ||||||
| WageWorks, Inc. | $ | (378,313 | ) | $ | (0.18 | ) | ||
| Wabtec Corp. | (242,169 | ) | (0.11 | ) | ||||
| Healthcare Services Group, Inc.. | (70,667 | ) | (0.03 | ) | ||||
| Trimble, Inc. | (66,937 | ) | (0.03 | ) | ||||
| LKQ Corp. | (35,250 | ) | (0.02 | ) | ||||
| $ | (793,336 | ) | $ | (0.37 | ) | |||
FIVE LARGEST EQUITY HOLDINGS
JUNE 30, 2018
| Quantity | Security | Total Cost | Market Value | Percent of Net Assets of the Fund | ||||||||||||
| 27,391 | Verisk Analytics, Inc. | $ | 2,106,403 | $ | 2,948,367 | 6.26 | % | |||||||||
| 18,265 | Ecolab, Inc. | 2,085,369 | 2,563,127 | 5.44 | ||||||||||||
| 7,530 | Illumina, Inc. | 1,237,297 | 2,103,054 | 4.46 | ||||||||||||
| 11,155 | ANSYS, Inc. | 853,874 | 1,942,978 | 4.12 | ||||||||||||
| 10,700 | Moody's Corp. | 919,476 | 1,824,992 | 3.87 | ||||||||||||
| $ | 7,202,419 | $ | 11,382,518 | 24.15 | % | |||||||||||
DF DENT GROWTH FUNDS
DF DENT MIDCAP GROWTH FUND
A MESSAGE TO OUR SHAREHOLDERS (Unaudited)
JUNE 30, 2018
As always, we acknowledge the responsibility you have conveyed by making your investment in the DF Dent Midcap Growth Fund and will work diligently on your behalf.
Respectively Submitted,
 |
 |
| Thomas F. O’Neil, Jr. | Matthew F. Dent |
 |
 |
| Gary D. Mitchell | Bruce L. Kennedy |
| * | The determination of “best-in-class” is solely the opinion of the Fund’s Adviser, and such opinion is subject to change. Those companies that hold leading market share positions, strong growth potential, historically good profitability, and management teams known for integrity and good corporate governance are generally considered to be “best-in-class.” |
IMPORTANT INFORMATION:
Investing involves risks, including the possible loss of principal. The Fund invests in small- and medium-size companies, which carry greater risk than is customarily associated with larger, more established companies. With non-diversification risk, the Fund will typically invest in securities of fewer issuers, which exposes the Fund to greater market risk. Investing in American Depository Receipts (ADRs) carries risks of political and financial instability, less liquidity and greater volatility, as well as risks associated with the lack of reliable accounting and financial information. The Fund is also subject to other risks, such as the risk associated with investing in Real Estate Investment Trusts (REITs) like possible real estate market declines, which are detailed in the Fund’s prospectus.
The Russell Midcap Growth Index measures the performance of the mid-cap growth segment of the U.S. equity universe. It includes those Russell Midcap Index companies with higher price-to-book ratios and higher forecasted growth values. One cannot invest directly in an index. Price-to-earnings (“P/E”) ratio is the valuation of a company’s current share price relative to company earnings. Earnings-per-share (“EPS”) is the portion of a company’s profit allocated to each outstanding share of common stock.
DF DENT GROWTH FUNDS
DF DENT MIDCAP GROWTH FUND
A MESSAGE TO OUR SHAREHOLDERS (Unaudited)
JUNE 30, 2018
The views in this report contained herein were those of the Fund’s Adviser as of June 30, 2018, and may not reflect the Adviser’s views on the date this report is first published or anytime thereafter. This report may contain discussions about certain investments both held and not held in the portfolio as of the report date. All current and future holdings are subject to risk and are subject to change. While these views are intended to assist shareholders in understanding their investment in the Fund, they do not constitute investment or tax advice, are not a guarantee of future performance and are not intended as an offer or solicitation with respect to the purchase or sale of any security.
DF DENT GROWTH FUNDS
DF DENT MIDCAP GROWTH FUND
PERFORMANCE CHART AND ANALYSIS (Unaudited)
JUNE 30, 2018
The following chart reflects the change in the value of a hypothetical $10,000 investment, including reinvested dividends and distributions, in the DF Dent Midcap Growth Fund (the “Fund”) compared with the performance of the benchmark, the Russell Midcap Growth Index (“Russell Midcap Growth”), since inception. The Russell Midcap Growth measures the performance of the mid-cap growth segment of the U.S. equity universe. It includes those Russell Midcap Index companies with higher price-to-book ratios and higher forecasted growth values. The total return of the index includes the reinvestment of dividends and income. The total return of the Fund includes operating expenses that reduce returns, while the total return of the index does not include expenses. The Fund is professionally managed, while the index is unmanaged and is not available for investment.
Comparison of Change in Value of a $10,000 Investment
DF Dent Midcap Growth Fund vs. Russell Midcap Growth Index

| Average Annual Total Returns Periods Ended June 30, 2018 | One Year | Five Year | Since Inception (07/01/11)(1) |
| DF Dent Midcap Growth Fund - Investor Shares | 23.21% | 13.85% | 13.91% |
| DF Dent Midcap Growth Fund - Institutional Shares(2) | 23.27% | 13.86% | 13.92% |
| Russell Midcap Growth Index | 18.52% | 13.37% | 11.91% |
| (1) | Investor Shares commenced operations on July 1, 2011, and Institutional Shares commenced operations on November 29, 2017. |
| (2) | Performance for the one year, five year, and since inception periods are a blended average annual return, which include the returns of the Investor Shares prior to the commencement of the Institutional Shares. |
Performance data quoted represents past performance and is no guarantee of future results. Current performance may be lower or higher than the performance data quoted. Investment return and principal value will fluctuate so that shares, when redeemed, may be worth more or less than original cost. As stated in the Fund’s prospectus, the annual operating expense ratios (gross) for Investor Shares and Institutional Shares are 1.43% and 2.27%, respectively. However, the Fund’s adviser has contractually agreed to waive its fee and/or reimburse Fund expenses to limit Total Annual Fund Operating Expenses After Fee Waiver and/or Expense Reimbursement (excluding all taxes, interest, portfolio transaction expenses, and extraordinary expenses) to 0.98% and 0.85% of Investor Shares and Institutional Shares, respectively,, through October 31, 2019 (the “Expense Cap”). The adviser may be reimbursed by each Fund for fees waived and expenses reimbursed by the adviser pursuant to the Expense Cap if such payment is made within three years of the fee waiver or expense reimbursement, and does not cause the Total Annual Fund Operating Expenses After Fee Waiver and/or Expense Reimbursement to exceed the lesser of (i) the then-current Expense Cap, or (ii) the Expense Cap in place at the time the fees/expenses were waived/reimbursed. During the period, certain fees
DF DENT GROWTH FUNDS
DF DENT MIDCAP GROWTH FUND
PERFORMANCE CHART AND ANALYSIS (Unaudited)
JUNE 30, 2018
were waived and/or expenses reimbursed; otherwise, returns would have been lower. Shares redeemed within 60 days of purchase will be charged a 2.00% redemption fee. The performance table and graph do not reflect the deduction of taxes that a shareholder would pay on Fund distributions or the redemption of Fund shares. Returns greater than one year are annualized. For the most recent month-end performance, please call (866) 233-3368.
DF DENT GROWTH FUNDS
DF DENT MIDCAP GROWTH FUND
SCHEDULE OF INVESTMENTS
JUNE 30, 2018
| Shares | Security Description | Value | ||||||
| Common Stock - 96.8% | ||||||||
| Consumer Discretionary - 5.8% | ||||||||
| 23,125 | CarMax, Inc. (a) | $ | 1,685,119 | |||||
| 32,811 | LKQ Corp. (a) | 1,046,671 | ||||||
| 2,731,790 | ||||||||
| Energy - 3.4% | ||||||||
| 12,821 | Core Laboratories NV | 1,618,138 | ||||||
| Financials - 8.7% | ||||||||
| 1,072 | Markel Corp. (a) | 1,162,423 | ||||||
| 10,700 | Moody's Corp. | 1,824,992 | ||||||
| 17,484 | SEI Investments Co. | 1,093,100 | ||||||
| 4,080,515 | ||||||||
| Health Care - 9.2% | ||||||||
| 8,357 | Bio-Techne Corp. | 1,236,418 | ||||||
| 7,530 | Illumina, Inc. (a) | 2,103,054 | ||||||
| 2,063 | Intuitive Surgical, Inc. (a) | 987,104 | ||||||
| 4,326,576 | ||||||||
| Industrials - 31.5% | ||||||||
| 14,278 | Envestnet, Inc. (a) | 784,576 | ||||||
| 7,801 | Exponent, Inc. | 376,788 | ||||||
| 33,841 | Fastenal Co. | 1,628,767 | ||||||
| 18,195 | Genesee & Wyoming, Inc., Class A (a) | 1,479,618 | ||||||
| 31,821 | Healthcare Services Group, Inc. | 1,374,349 | ||||||
| 5,851 | Roper Technologies, Inc. | 1,614,350 | ||||||
| 3,007 | TransDigm Group, Inc. | 1,037,836 | ||||||
| 27,391 | Verisk Analytics, Inc. (a) | 2,948,367 | ||||||
| 18,078 | WageWorks, Inc. (a) | 903,900 | ||||||
| 21,097 | Waste Connections, Inc. | 1,588,182 | ||||||
| 6,352 | Watsco, Inc. | 1,132,435 | ||||||
| 14,869,168 | ||||||||
| Information Technology - 27.1% | ||||||||
| 11,155 | ANSYS, Inc. (a) | 1,942,978 | ||||||
| 9,325 | Black Knight, Inc. (a) | 499,354 | ||||||
| 6,166 | Blackbaud, Inc. | 631,707 | ||||||
| 32,205 | Blackline, Inc. (a) | 1,398,663 | ||||||
| 26,715 | Brooks Automation, Inc. | 871,443 | ||||||
| 3,485 | CoStar Group, Inc. (a) | 1,438,016 | ||||||
| 44,013 | PROS Holdings, Inc. (a) | 1,609,555 | ||||||
| 10,490 | Red Hat, Inc. (a) | 1,409,541 | ||||||
| 39,222 | Trimble, Inc. (a) | 1,288,050 | ||||||
| 7,588 | Tyler Technologies, Inc. (a) | 1,685,295 | ||||||
| 12,774,602 | ||||||||
| Materials - 5.4% | ||||||||
| 18,265 | Ecolab, Inc. | 2,563,127 | ||||||
| Shares | Security Description | Value | ||||||
| Real Estate - 5.7% | ||||||||
| 28,732 | CBRE Group, Inc., Class A (a) | $ | 1,371,666 | |||||
| 7,891 | SBA Communications Corp. REIT (a) | 1,302,962 | ||||||
| 2,674,628 | ||||||||
| Total Common Stock (Cost $29,939,893) | 45,638,544 | |||||||
| Investments, at value - 96.8% | ||||||||
| (Cost $29,939,893) | $ | 45,638,544 | ||||||
| Other Assets & Liabilities, Net - 3.2% | 1,495,568 | |||||||
| Net Assets - 100.0% | $ | 47,134,112 | ||||||
| REIT | Real Estate Investment Trust |
| (a) | Non-income producing security. |
The following is a summary of the inputs used to value the Fund's investments as of June 30, 2018.
The inputs or methodology used for valuing securities are not necessarily an indication of the risks associated with investing in those securities. For more information on valuation inputs, and their aggregation into the levels used in the table below, please refer to the Security Valuation section in Note 2 of the accompanying Notes to Financial Statements.
| Valuation Inputs | Investments in Securities | |||
| Level 1 - Quoted Prices | $ | 45,638,544 | ||
| Level 2 - Other Significant Observable Inputs | – | |||
| Level 3 - Significant Unobservable Inputs | – | |||
| Total | $ | 45,638,544 | ||
The Level 1 value displayed in this table is Common Stock. Refer to this Schedule of Investments for a further breakout of each security by industry.
The Fund utilizes the end of period methodology when determining transfers. There were no transfers among Level 1, Level 2 and Level 3 for the year ended June 30, 2018.
| See Notes to Financial Statements. | DF DENT GROWTH FUNDS |
DF DENT MIDCAP GROWTH FUND
SCHEDULE OF INVESTMENTS
JUNE 30, 2018
| PORTFOLIO HOLDINGS (Unaudited) | |||
| % of Total Net Assets | |||
| Consumer Discretionary | 5.8% | ||
| Energy | 3.4% | ||
| Financials | 8.7% | ||
| Health Care | 9.2% | ||
| Industrials | 31.5% | ||
| Information Technology | 27.1% | ||
| Materials | 5.4% | ||
| Real Estate | 5.7% | ||
| Other Assets & Liabilities, Net | 3.2% | ||
| 100.0% | |||
| See Notes to Financial Statements. | DF DENT GROWTH FUNDS |
DF DENT MIDCAP GROWTH FUND
STATEMENT OF ASSETS AND LIABILITIES
JUNE 30, 2018
| ASSETS | ||||
| Investments, at value (Cost $29,939,893) | $ | 45,638,544 | ||
| Cash | 1,785,004 | |||
| Receivables: | ||||
| Fund shares sold | 40,000 | |||
| Investment securities sold | 119,977 | |||
| Dividends and interest | 8,341 | |||
| Prepaid expenses | 10,101 | |||
| Total Assets | 47,601,967 | |||
| LIABILITIES | ||||
| Payables: | ||||
| Investment securities purchased | 384,073 | |||
| Accrued Liabilities: | ||||
| Investment adviser fees | 54,085 | |||
| Trustees’ fees and expenses | 30 | |||
| Fund services fees | 7,378 | |||
| Other expenses | 22,289 | |||
| Total Liabilities | 467,855 | |||
| NET ASSETS | $ | 47,134,112 | ||
| COMPONENTS OF NET ASSETS | ||||
| Paid-in capital | $ | 30,180,778 | ||
| Undistributed net investment income | 5,845 | |||
| Accumulated net realized gain | 1,248,838 | |||
| Net unrealized appreciation | 15,698,651 | |||
| NET ASSETS | $ | 47,134,112 | ||
| SHARES OF BENEFICIAL INTEREST AT NO PAR VALUE (UNLIMITED SHARES AUTHORIZED) | ||||
| Investor Shares | 900,308 | |||
| Institutional Shares | 1,221,581 | |||
| NET ASSET VALUE, OFFERING AND REDEMPTION PRICE PER SHARE* | ||||
| Investor Shares (based on net assets of $19,993,107) | $ | 22.21 | ||
| Institutional Shares (based on net assets of $27,141,005) | $ | 22.22 | ||
| * | Shares redeemed within 60 days of purchase are charged a 2.00% redemption fee. |
| See Notes to Financial Statements. | DF DENT GROWTH FUNDS |
DF DENT MIDCAP GROWTH FUND
STATEMENT OF OPERATIONS
YEAR ENDED JUNE 30, 2018
| INVESTMENT INCOME | ||||
| Dividend income (Net of foreign withholding taxes of $3,570) | $ | 197,639 | ||
| Interest income | 5,964 | |||
| Total Investment Income | 203,603 | |||
| EXPENSES | ||||
| Investment adviser fees | 345,823 | |||
| Fund services fees | 141,096 | |||
| Transfer agent fees: | ||||
| Investor Shares | 2,781 | |||
| Institutional Shares | 600 | |||
| Custodian fees | 5,125 | |||
| Registration fees: | ||||
| Investor Shares | 16,349 | |||
| Institutional Shares | 4,714 | |||
| Professional fees | 33,017 | |||
| Trustees' fees and expenses | 6,300 | |||
| Other expenses | 20,227 | |||
| Total Expenses | 576,032 | |||
| Fees waived | (167,328 | ) | ||
| Net Expenses | 408,704 | |||
| NET INVESTMENT LOSS | (205,101 | ) | ||
| NET REALIZED AND UNREALIZED GAIN (LOSS) | ||||
| Net realized gain on investments | 2,614,485 | |||
| Net change in unrealized appreciation (depreciation) on investments | 6,133,775 | |||
| NET REALIZED AND UNREALIZED GAIN | 8,748,260 | |||
| INCREASE IN NET ASSETS RESULTING FROM OPERATIONS | $ | 8,543,159 | ||
| See Notes to Financial Statements. | DF DENT GROWTH FUNDS |
DF DENT MIDCAP GROWTH FUND
STATEMENTS OF CHANGES IN NET ASSETS
| For the Years Ended June 30, | ||||||||
| 2018 | 2017 | |||||||
| OPERATIONS | ||||||||
| Net investment loss | $ | (205,101 | ) | $ | (161,747 | ) | ||
| Net realized gain (loss) | 2,614,485 | (65,924 | ) | |||||
| Net change in unrealized appreciation (depreciation) | 6,133,775 | 5,201,981 | ||||||
| Increase in Net Assets Resulting from Operations | 8,543,159 | 4,974,310 | ||||||
| DISTRIBUTIONS TO SHAREHOLDERS FROM | ||||||||
| Net realized gain: | ||||||||
| Investor Shares | (115,823 | ) | (24,720 | ) | ||||
| Institutional Shares | (6,662 | ) | – | |||||
| Total Distributions to Shareholders | (122,485 | ) | (24,720 | ) | ||||
| CAPITAL SHARE TRANSACTIONS | ||||||||
| Sale of shares: | ||||||||
| Investor Shares | 4,948,011 | 7,728,638 | ||||||
| Institutional Shares | 25,947,396 | * | – | |||||
| Reinvestment of distributions: | ||||||||
| Investor Shares | 115,022 | 24,642 | ||||||
| Institutional Shares | 6,662 | – | ||||||
| Redemption of shares: | ||||||||
| Investor Shares | (27,751,122 | )*† | (1,013,815 | ) | ||||
| Institutional Shares | (205,000 | ) | – | |||||
| Redemption fees: | ||||||||
| Investor Shares | 128 | – | ||||||
| Institutional Shares | 7 | – | ||||||
| Increase in Net Assets from Capital Share Transactions | 3,061,104 | 6,739,465 | ||||||
| Increase in Net Assets | 11,481,778 | 11,689,055 | ||||||
| NET ASSETS | ||||||||
| Beginning of Year | 35,652,334 | 23,963,279 | ||||||
| End of Year (Including line (a)) | $ | 47,134,112 | $ | 35,652,334 | ||||
| SHARE TRANSACTIONS | ||||||||
| Sale of shares: | ||||||||
| Investor Shares | 239,771 | 473,689 | ||||||
| Institutional Shares | 1,230,843 | * | – | |||||
| Reinvestment of distributions: | ||||||||
| Investor Shares | 5,641 | 1,551 | ||||||
| Institutional Shares | 327 | – | ||||||
| Redemption of shares: | ||||||||
| Investor Shares | (1,317,274 | )* | (62,428 | ) | ||||
| Institutional Shares | (9,589 | ) | – | |||||
| Increase in Shares | 149,719 | 412,812 | ||||||
| (a) Undistributed (distributions in excess of) net investment income | $ | 5,845 | $ | (101,681 | ) | |||
| * | The above figures include transfers of $22,215,893 and 1,061,695 and 1,061,432 shares from the Investor Shares to Institutional Shares, respectively, as a result of the newly offered share class. |
| † | This amount includes $1,278,233 from an in-kind redemption for the year ended June 30, 2018. |
| See Notes to Financial Statements. | DF DENT GROWTH FUNDS |
DF DENT MIDCAP GROWTH FUND
FINANCIAL HIGHLIGHTS
These financial highlights reflect selected data for a share outstanding throughout each year.
| For the Years Ended June 30, | ||||||||||||||||||||
| 2018 | 2017 | 2016 | 2015 | 2014 | ||||||||||||||||
| INVESTOR SHARES | ||||||||||||||||||||
| NET ASSET VALUE, Beginning of Year | $ | 18.08 | $ | 15.37 | $ | 16.27 | $ | 15.46 | $ | 13.01 | ||||||||||
| INVESTMENT OPERATIONS | ||||||||||||||||||||
| Net investment loss (a) | (0.11 | ) | (0.09 | ) | (0.11 | ) | (0.10 | ) | (0.09 | ) | ||||||||||
| Net realized and unrealized gain (loss) | 4.30 | 2.81 | (0.31 | ) | 1.57 | 3.06 | ||||||||||||||
| Total from Investment Operations | 4.19 | 2.72 | (0.42 | ) | 1.47 | 2.97 | ||||||||||||||
| DISTRIBUTIONS TO SHAREHOLDERS FROM | ||||||||||||||||||||
| Net realized gain | (0.06 | ) | (0.01 | ) | (0.48 | ) | (0.66 | ) | (0.52 | ) | ||||||||||
| Total Distributions to Shareholders | (0.06 | ) | (0.01 | ) | (0.48 | ) | (0.66 | ) | (0.52 | ) | ||||||||||
| REDEMPTION FEES(a) | 0.00 | (b) | – | – | – | 0.00 | (b) | |||||||||||||
| NET ASSET VALUE, End of Year | $ | 22.21 | $ | 18.08 | $ | 15.37 | $ | 16.27 | $ | 15.46 | ||||||||||
| TOTAL RETURN | 23.21 | % | 17.74 | % | (2.49 | )% | 9.97 | % | 22.95 | % | ||||||||||
| RATIOS/SUPPLEMENTARY DATA | ||||||||||||||||||||
| Net Assets at End of Year (000s omitted) | $ | 19,993 | $ | 35,652 | $ | 23,963 | $ | 22,757 | $ | 16,032 | ||||||||||
| Ratios to Average Net Assets: | ||||||||||||||||||||
| Net investment loss | (0.52 | )% | (0.55 | )% | (0.71 | )% | (0.65 | )% | (0.63 | )% | ||||||||||
| Net expenses | 1.01 | % | 1.10 | % | 1.10 | % | 1.10 | % | 1.10 | % | ||||||||||
| Gross expenses (c) | 1.40 | % | 1.68 | % | 1.82 | % | 1.84 | % | 2.08 | % | ||||||||||
| PORTFOLIO TURNOVER RATE | 32 | % | 31 | % | 29 | % | 45 | % | 32 | % | ||||||||||
| (a) | Calculated based on average shares outstanding during each year. |
| (b) | Less than $0.01 per share. |
| (c) | Reflects the expense ratio excluding any waivers and/or reimbursements. |
| See Notes to Financial Statements. | DF DENT GROWTH FUNDS |
DF DENT MIDCAP GROWTH FUND
FINANCIAL HIGHLIGHTS
These financial highlights reflect selected data for a share outstanding throughout the period.
| November 29, 2017 (a) Through June 30, 2018 | ||||
| INSTITUTIONAL SHARES | ||||
| NET ASSET VALUE, Beginning of Period | $ | 20.56 | ||
| INVESTMENT OPERATIONS | ||||
| Net investment loss (b) | (0.05 | ) | ||
| Net realized and unrealized gain | 1.77 | |||
| Total from Investment Operations | 1.72 | |||
| DISTRIBUTIONS TO SHAREHOLDERS FROM | ||||
| Net realized gain | (0.06 | ) | ||
| Total Distributions to Shareholders | (0.06 | ) | ||
| REDEMPTION FEES(b) | 0.00 | (c) | ||
| NET ASSET VALUE, End of Period | $ | 22.22 | ||
| TOTAL RETURN | 8.40 | %(d) | ||
| RATIOS/SUPPLEMENTARY DATA | ||||
| Net Assets at End of Period (000s omitted) | $ | 27,141 | ||
| Ratios to Average Net Assets: | ||||
| Net investment loss | (0.36 | )%(e) | ||
| Net expenses | 0.85 | %(e) | ||
| Gross expenses (f) | 1.27 | %(e) | ||
| PORTFOLIO TURNOVER RATE | 32 | %(d) | ||
| (a) | Commencement of operations. |
| (b) | Calculated based on average shares outstanding during the period. |
| (c) | Less than $0.01 per share. |
| (d) | Not annualized. |
| (e) | Annualized. |
| (f) | Reflects the expense ratio excluding any waivers and/or reimbursements. |
| See Notes to Financial Statements. | DF DENT GROWTH FUNDS |
DF DENT SMALL CAP GROWTH FUND
A MESSAGE TO OUR SHAREHOLDERS (Unaudited)
JUNE 30, 2018
Dear Fellow Shareholders:
Performance
For the fiscal year ended June 30, 2018, the DF Dent Small Cap Growth Fund (the “Fund”) experienced a total return of +20.17% for Investor Shares. This return is net of fees and represents an underperformance of 1.69% relative to the total return of +21.86% for the Russell 2000 Growth Index (the “Index”), which is the benchmark we use for performance comparisons.
Expense Ratio
The gross operating expense ratio for the Fund’s Investor Shares is currently 3.10%, which is high given the small size of Fund assets relative to certain fixed expenses. However, per the Fund’s prospectus, your Fund’s investment Adviser, D.F. Dent and Company, Inc. (the “Adviser”), has contractually agreed to reimburse expenses and/or waive a portion of its fees so as to maintain your expense ratio at a net 1.05% through October 31, 2019
Concentration
The Fund’s concentration in its top 10 holdings is as follows:
| Top 10 Holdings | 06/30/18 |
| % of the Fund | 32.05% |
| Average Position Size of Top 10 | 3.2% |
We believe that the concentration in the Fund’s top 10 positions is appropriate at its current level and has the potential to enhance long-term performance.
Management Ownership of Fund
Employees, their families, and the Adviser’s retirement plan owned approximately 61% of the Fund as of June 30, 2018. There were only management purchases and no management redemptions during the fiscal year ended June 30, 2018.
Portfolio Commentary
In the past 12 months, the Fund modestly under-performed the Index. At DF Dent, we believe good long-term investment performance is the natural outcome of a well-refined investment process executed with diligence and discipline. That is why instead of dwelling on investment performance over any 12-month period, we devote most of our time looking to upgrade the companies and improving the portfolio construction of your Fund. We focus on finding “best-in-class”* companies that are managed by talented and ethical leaders, that have dominant and durable business models, and that generate significant free cash flow over time that can be prudently allocated for the potential benefit of shareholders. Regardless of whether the market goes up or down
| DF DENT GROWTH FUNDS |
DF DENT SMALL CAP GROWTH FUND
A MESSAGE TO OUR SHAREHOLDERS (Unaudited)
JUNE 30, 2018
from here, we will continue to stick to our research process and do the research blocking and tackling that we believe is the only path to good long-term performance.
Since we do not feel that we have the wisdom or the expertise to time the market, we instead will try to manage risk in your portfolio. The most effective risk management tool we have is our due diligence process. In good times and bad, we visit your portfolio companies and other prospective holdings. We meet and talk with their management teams, their customers, and their competitors - trying to find chinks in their armor, emerging competitive threats, management team blind spots, or signs of complacency or arrogance. At its heart, this due diligence helps us hone our projections for the long-term earnings growth at these companies, consistent with our core investment philosophy that long-term stock price appreciation is highly correlated to long-term earnings growth.
2018 has been a volatile year in the stock market, but we view volatility as opportunity. We attempt to take advantage of market volatility to add and trim our stock positions. We aim to manage the position sizes so that the companies with the highest expected returns have higher weights in the portfolio. We also believe that your Fund is well positioned for a challenging market environment, primarily because it is comprised of companies that we believe will have strong earnings growth over a long period of time and across market cycles.
The following companies are three of the best contributors to the Fund’s recent performance. We thought highlighting them would give you a sense of not only why we have invested in them on your behalf, but also why they have outperformed recently.
| • | HEICO Corporation (HEI) designs and manufactures aerospace, defense, and electronic products. Its Flight Support Group is a leading manufacturer of aftermarket replacement parts for both commercial and military aircraft. The Electronic Technologies Group manufactures sophisticated and high-performance electronic equipment and components for the defense, space, medical, and telecom industries. HEICO also has an excellent track record in using acquisitions to complement its organic growth. HEICO is run by family owners who are conservative, long-term focused, and align their interests with public shareholders through substantial ownership (14% of outstanding shares). The company performed well in the past year because of healthy industry backdrop, strong financial results and well executed acquisitions. |
| • | OrthoPediatrics Corp. (KIDS), an orthopedic medical device manufacturer with a sole focus on pediatric patients, performed well after its IPO in October 2017 as the company reported solid business results exceeding expectations. In the first quarter of 2018, the company’s growth accelerated and beat management’s guidance by a healthy margin. In addition, the company provided guidance for the rest of the year that we believe is conservative. As KIDS invests its IPO proceeds to support the increasing demand for its products and the rapid pace of innovation, we expect the company to maintain rapid revenue growth for at least the next several years. |
| • | PROS Holdings (PRO) is a leading provider of pricing and revenue optimization software to businesses. Its stock performed well in the past year as the company continues its successful business model |
DF DENT GROWTH FUNDS
DF DENT SMALL CAP GROWTH FUND
A MESSAGE TO OUR SHAREHOLDERS (Unaudited)
JUNE 30, 2018
transition from software license sales toward a cloud-based subscription model. We were attracted to PRO by its strong organic growth prospects and a belief that data-driven pricing strategies will become increasingly important to businesses. PRO has reported a strong start to 2018, generated solid growth in its annualized recurring revenue and further validating management’s vision for the business’ future. We continue to have confidence in PRO and see its core offerings as extraordinarily well-positioned for secular growth.
Attribution Analysis
In the 12-month period ending June 30, 2018, most of your Fund’s underperformance can be attributed to stock selection, not sector allocation.
Your Fund was over-weighted versus the Index in the Consumer Staples, Industrials, Information Technology, and Telecommunication Services sectors. In Consumer Staples, both the over-weighting and stock selection contributed to performance. In Industrials, both the over-weighting and stock selection detracted from performance. In Telecommunication Services, the over-weighting detracted from performance and stock selection contributed to performance. While in Information Technology, the over-weighting contributed to performance and stock selection detracted from performance.
Your Fund was under-weighted versus the Index in the Consumer Discretionary, Financials, and Health Care sectors. In both Consumer Discretionary and Health Care, the under-weighting detracted from performance but stock selection contributed to performance. In Financials, the under-weighting contributed to performance while stock selection detracted from performance. Your Fund did not hold any positions in the Energy, Materials, Real Estate, and Utilities sectors which contributed to performance.
Sector Weights
The following bar chart presents the sector weightings of your Fund versus the sector weightings of the Index as of June 30, 2018 (note this may differ slightly with the commentary above, which relates to average weightings as opposed to year-end weightings):
DF DENT GROWTH FUNDS
DF DENT SMALL CAP GROWTH FUND
A MESSAGE TO OUR SHAREHOLDERS (Unaudited)
JUNE 30, 2018

Source: FactSet
Best and Worst Performers
Five Best Contributors
| Investments | Fund Realized and Unrealized Appreciation and Income in Fiscal Year 2018 | Fund Per Share As of 06/30/18 | ||||||
| HEICO Corp., Class A | $ | 132,343 | $ | 0.19 | ||||
| OrthoPediatrics Corp. | 124,957 | 0.18 | ||||||
| PROS Holdings, Inc. | 107,899 | 0.16 | ||||||
| Mesa Laboratories, Inc. | 103,615 | 0.15 | ||||||
| CoStar Group, Inc. | 101,336 | 0.15 | ||||||
| $ | 570,150 | $ | 0.83 | |||||
DF DENT GROWTH FUNDS
DF DENT SMALL CAP GROWTH FUND
A MESSAGE TO OUR SHAREHOLDERS (Unaudited)
JUNE 30, 2018
Five Worst Contributors
| Investments | Fund Realized and Unrealized Loss and Income in Fiscal Year 2018 | Fund Per Share As of 06/30/18 | ||||||
| WageWorks, Inc. | $ | (72,059 | ) | $ | (0.10 | ) | ||
| Colfax Corp. | (66,133 | ) | (0.10 | ) | ||||
| Beacon Roofing Supply, Inc. | (29,506 | ) | (0.04 | ) | ||||
| Middleby Corp. | (28,564 | ) | (0.04 | ) | ||||
| ProAssurance Corp. | (20,237 | ) | (0.03 | ) | ||||
| $ | (216,499 | ) | $ | (0.31 | ) | |||
FIVE LARGEST EQUITY HOLDINGS
JUNE 30, 2018
| Quantity | Security | Total Cost | Market Value | Percent of Net Assets of the Fund | |||||||||||
| 2,403 | Tyler Technologies, Inc. | $ | 324,933 | $ | 533,706 | 4.82 | % | ||||||||
| 6,844 | HEICO Corp. | 186,533 | 417,127 | 3.76 | |||||||||||
| 8,744 | Healthcare Services Group, Inc. | 334,696 | 377,653 | 3.41 | |||||||||||
| 4,405 | Genesee & Wyoming, Inc. | 306,925 | 358,215 | 3.23 | |||||||||||
| 9,144 | PROS Holdings, Inc. | 114,295 | 334,396 | 3.02 | |||||||||||
| $ | 1,267,382 | $ | 2,021,097 | 18.24 | % | ||||||||||
As always, we appreciate the confidence you have placed in D.F. Dent and Company and are conscious of the responsibility that you have entrusted to us. We will continue to work diligently on your behalf.
Respectively Submitted,
|
 |
| Matthew F. Dent | Gary Wu |
| * | The determination of “best-in-class” is solely the opinion of the Fund’s Adviser, and such opinion is subject to change. Those companies that hold leading market share positions, strong growth potential, historically good profitability, and management teams known for integrity and good corporate governance are generally considered to be “best in class.” |
IMPORTANT INFORMATION:
Investing involves risks, including the possible loss of principal. The Fund invests in small- and medium-size companies, which carry greater risk than is customarily associated with larger, more established companies.
DF DENT GROWTH FUNDS
DF DENT SMALL CAP GROWTH FUND
A MESSAGE TO OUR SHAREHOLDERS (Unaudited)
JUNE 30, 2018
With non-diversification risk, the Fund will typically invest in securities of fewer issuers, which exposes the Fund to greater market risk. Investing in American Depository Receipts (ADRs) carries risks of political and financial instability, less liquidity and greater volatility, as well as risks associated with the lack of reliable accounting and financial information. The Fund is also subject to other risks, such as the risk associated with Real Estate Investment Trusts (REITs) like possible real estate market declines, which are detailed in the Fund’s prospectus.
The Russell 2000 Growth Index measures the performance of the small-cap growth segment of the U.S. equity universe. One cannot invest directly in an index.
The views in this report contained herein were those of the Fund’s Adviser as of June 30, 2018, and may not reflect the Adviser’s views on the date this report is first published or anytime thereafter. This report may contain discussions about certain investments both held and not held in the portfolio as of the report date. All current and future holdings are subject to risk and are subject to change. While these views are intended to assist shareholders in understanding their investment in the Fund, they do not constitute investment or tax advice, are not a guarantee of future performance and are not intended as an offer or solicitation with respect to the purchase or sale of any security.
DF DENT GROWTH FUNDS
DF DENT SMALL CAP GROWTH FUND
PERFORMANCE CHART AND ANALYSIS (Unaudited)
JUNE 30, 2018
The following chart reflects the change in the value of a hypothetical $10,000 investment, including reinvested dividends and distributions, in the DF Dent Small Cap Growth Fund (the “Fund”) compared with the performance of the benchmark, the Russell 2000 Growth Index (“Russell 2000 Growth”), since inception. The Russell 2000 Growth, the Fund‘s primary performance benchmark, measures the performance of those Russell 2000 Growth companies with higher price-to-value ratios and higher forecasted growth values. The total return of the index includes the reinvestment of dividends and income. The total return of the Fund includes operating expenses that reduce returns, while the total return of the index does not include expenses. The Fund is professionally managed, while the index is unmanaged and is not available for investment.
Comparison of Change in Value of a $10,000 Investment
DF Dent Small Cap Growth Fund vs. Russell 2000 Growth Index
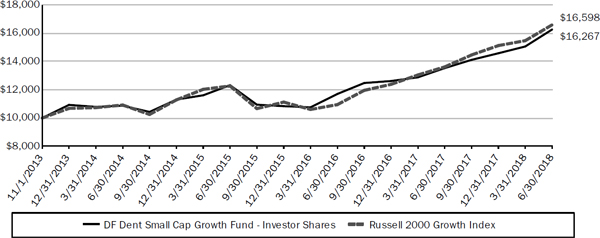
| Average Annual Total Returns Periods Ended June 30, 2018 |
One Year | Since Inception (11/01/13)(1) |
| DF Dent Small Cap Growth Fund - Investor Shares | 20.17% | 11.00% |
| DF Dent Small Cap Growth Fund - Institutional Shares(2) | 20.17% | 11.00% |
| Russell 2000 Growth Index | 21.86% | 11.49% |
| (1) | Investor Shares commenced operations on November 1, 2013 and Institutional Shares commenced operations on November 20, 2017. |
| (2) | Performance for the one year and since inception periods are a blended average annual return, which include the returns of the Investor Shares prior to the commencement of the Institutional Shares. |
Performance data quoted represents past performance and is no guarantee of future results. Current performance may be lower or higher than the performance data quoted. Investment return and principal value will fluctuate so that shares, when redeemed, may be worth more or less than original cost. As stated in the Fund’s prospectus, the annual operating expense ratios (gross) for Investor Shares and Institutional Shares are 3.10% and 3.35%, respectively. However, the Fund’s adviser has contractually agreed to waive its fee and/or reimburse Fund expenses to limit Total Annual Fund Operating Expenses After Fee Waiver and/or Expense Reimbursement (excluding all taxes, interest, portfolio transaction expenses, and extraordinary expenses) to 1.05% and 0.95% of Investors Shares and Institutional Shares, respectively, through October 31, 2019 (the “Expense Cap”). The adviser may be reimbursed by each Fund for fees waived and expenses reimbursed by the adviser pursuant to the Expense Cap if such payment is made within three years of the fee waiver or expense reimbursement, and does not cause the Total Annual Fund Operating Expenses After Fee Waiver and/or Expense Reimbursement to exceed the lesser of (i) the then-
DF DENT GROWTH FUNDS
DF DENT SMALL CAP GROWTH FUND
PERFORMANCE CHART AND ANALYSIS (Unaudited)
JUNE 30, 2018
current Expense Cap, or (ii) the Expense Cap in place at the time the fees/expenses were waived/reimbursed. During the period, certain fees were waived and/or expenses reimbursed; otherwise, returns would have been lower. Shares redeemed within 60 days of purchase will be charged a 2.00% redemption fee. The performance table and graph do not reflect the deduction of taxes that a shareholder would pay on Fund distributions or the redemption of Fund shares. Returns greater than one year are annualized. For the most recent month-end performance, please call (866) 233-3368.
DF DENT GROWTH FUNDS
DF DENT SMALL CAP GROWTH FUND
SCHEDULE OF INVESTMENTS
JUNE 30, 2018
| Shares | Security Description | Value | ||||
| Common Stock - 98.8% | ||||||
| Consumer Discretionary - 13.0% | ||||||
| 2,258 | Bright Horizons Family Solutions, Inc. (a) | $ | 231,490 | |||
| 12,761 | Carriage Services, Inc. | 313,283 | ||||
| 841 | Carter's, Inc. | 91,156 | ||||
| 4,477 | IMAX Corp. (a) | 99,166 | ||||
| 2,402 | Lithia Motors, Inc., Class A | 227,157 | ||||
| 4,642 | Monro, Inc. | 269,700 | ||||
| 1,740 | Wayfair, Inc., Class A (a) | 206,642 | ||||
| 1,438,594 | ||||||
| Consumer Staples - 4.2% | ||||||
| 1,585 | Calavo Growers, Inc. | 152,398 | ||||
| 1,471 | MGP Ingredients, Inc. | 130,639 | ||||
| 1,259 | WD-40 Co. | 184,129 | ||||
| 467,166 | ||||||
| Financials - 2.7% | ||||||
| 2,011 | Glacier Bancorp, Inc. | 77,786 | ||||
| 4,231 | WSFS Financial Corp. | 225,512 | ||||
| 303,298 | ||||||
| Health Care - 15.2% | ||||||
| 16,045 | AAC Holdings, Inc. (a) | 150,342 | ||||
| 291 | Atrion Corp. | 174,425 | ||||
| 2,137 | Bio-Techne Corp. | 316,169 | ||||
| 1,144 | Cantel Medical Corp. | 112,524 | ||||
| 2,492 | DexCom, Inc. (a) | 236,690 | ||||
| 3,291 | LeMaitre Vascular, Inc. | 110,183 | ||||
| 1,119 | Mesa Laboratories, Inc. | 236,198 | ||||
| 9,776 | OrthoPediatrics Corp. (a) | 260,433 | ||||
| 1,491 | Teladoc, Inc. (a) | 86,552 | ||||
| 1,683,516 | ||||||
| Industrials - 31.3% | ||||||
| 3,968 | AAON, Inc. | 131,936 | ||||
| 7,182 | Beacon Roofing Supply, Inc. (a) | 306,097 | ||||
| 9,144 | Colfax Corp. (a) | 280,264 | ||||
| 5,161 | Douglas Dynamics, Inc. | 247,728 | ||||
| 1,991 | Envestnet, Inc. (a) | 109,405 | ||||
| 4,160 | Exponent, Inc. | 200,928 | ||||
| 4,405 | Genesee & Wyoming, Inc., Class A (a) | 358,215 | ||||
| 8,744 | Healthcare Services Group, Inc. | 377,653 | ||||
| 6,844 | HEICO Corp., Class A | 417,127 | ||||
| 1,465 | MSC Industrial Direct Co., Inc. | 124,305 | ||||
| 5,708 | Rexnord Corp. (a) | 165,874 | ||||
| 3,316 | SiteOne Landscape Supply, Inc. (a) | 278,445 | ||||
| 1,812 | The Middleby Corp. (a) | 189,209 | ||||
| 5,568 | WageWorks, Inc. (a) | 278,400 | ||||
| 3,465,586 | ||||||
| Shares | Security Description | Value | ||||
| Information Technology - 30.9% | ||||||
| 2,690 | Blackbaud, Inc. | $ | 275,590 | |||
| 7,355 | Blackline, Inc. (a) | 319,428 | ||||
| 5,684 | Brooks Automation, Inc. | 185,412 | ||||
| 15,189 | Computer Modelling Group, Ltd. | 116,692 | ||||
| 601 | CoStar Group, Inc. (a) | 247,991 | ||||
| 2,028 | Ellie Mae, Inc. (a) | 210,587 | ||||
| 7,334 | EVERTEC, Inc. | 160,248 | ||||
| 2,774 | Guidewire Software, Inc. (a) | 246,276 | ||||
| 2,425 | John Bean Technologies Corp. | 215,582 | ||||
| 560 | Littelfuse, Inc. | 127,781 | ||||
| 2,903 | MINDBODY, Inc. (a) | 112,056 | ||||
| 9,144 | PROS Holdings, Inc. (a) | 334,396 | ||||
| 3,778 | The Descartes Systems Group, Inc. (a) | 122,785 | ||||
| 845 | The Ultimate Software Group, Inc. (a) | 217,427 | ||||
| 2,403 | Tyler Technologies, Inc. (a) | 533,706 | ||||
| 3,425,957 | ||||||
| Telecommunication Services - 1.5% | ||||||
| 3,210 | Cogent Communications Holdings, Inc. | 171,414 | ||||
| Total Common Stock (Cost $8,041,600) | 10,955,531 | |||||
| Investments, at value - 98.8% | ||||||
| (Cost $8,041,600) | $ | 10,955,531 | ||||
| Other Assets & Liabilities, Net - 1.2% | 128,746 | |||||
| Net Assets - 100.0% | $ | 11,084,277 | ||||
| (a) | Non-income producing security. |
The following is a summary of the inputs used to value the Fund's investments as of June 30, 2018.
The inputs or methodology used for valuing securities are not necessarily an indication of the risks associated with investing in those securities. For more information on valuation inputs, and their aggregation into the levels used in the table below, please refer to the Security Valuation section in Note 2 of the accompanying Notes to Financial Statements.
| Valuation Inputs | Investments in Securities | |||
| Level 1 - Quoted Prices | $ | 10,955,531 | ||
| Level 2 - Other Significant Observable Inputs | – | |||
| Level 3 - Significant Unobservable Inputs | – | |||
| Total | $ | 10,955,531 | ||
| See Notes to Financial Statements. | DF DENT GROWTH FUNDS |
DF DENT SMALL CAP GROWTH FUND
SCHEDULE OF INVESTMENTS
JUNE 30, 2018
The Level 1 value displayed in this table is Common Stock. Refer to this Schedule of Investments for a further breakout of each security by industry.
The Fund utilizes the end of period methodology when determining transfers. There were no transfers among Level 1, Level 2 and Level 3 for the year ended June 30, 2018.
| PORTFOLIO HOLDINGS (Unaudited) | |||
| % of Total Net Assets | |||
| Consumer Discretionary | 13.0% | ||
| Consumer Staples | 4.2% | ||
| Financials | 2.7% | ||
| Health Care | 15.2% | ||
| Industrials | 31.3% | ||
| Information Technology | 30.9% | ||
| Telecommunication Services | 1.5% | ||
| Other Assets & Liabilities, Net | 1.2% | ||
| 100.0% | |||
| See Notes to Financial Statements. | DF DENT GROWTH FUNDS |
DF DENT SMALL CAP GROWTH FUND
STATEMENT OF ASSETS AND LIABILITIES
JUNE 30, 2018
| ASSETS | ||||
| Investments, at value (Cost $8,041,600) | $ | 10,955,531 | ||
| Cash | 111,529 | |||
| Receivables: | ||||
| Investment securities sold | 77,984 | |||
| Dividends and interest | 814 | |||
| From investment adviser | 6,820 | |||
| Prepaid expenses | 4,894 | |||
| Total Assets | 11,157,572 | |||
| LIABILITIES | ||||
| Payables: | ||||
| Investment securities purchased | 44,965 | |||
| Accrued Liabilities: | ||||
| Trustees’ fees and expenses | 10 | |||
| Fund services fees | 7,172 | |||
| Other expenses | 21,148 | |||
| Total Liabilities | 73,295 | |||
| NET ASSETS | $ | 11,084,277 | ||
| COMPONENTS OF NET ASSETS | ||||
| Paid-in capital | $ | 7,932,674 | ||
| Accumulated net investment loss | (1,500 | ) | ||
| Accumulated net realized gain | 239,172 | |||
| Net unrealized appreciation | 2,913,931 | |||
| NET ASSETS | $ | 11,084,277 | ||
| SHARES OF BENEFICIAL INTEREST AT NO PAR VALUE (UNLIMITED SHARES AUTHORIZED) | ||||
| Investor Shares | 359,161 | |||
| Institutional Shares | 334,924 | |||
| NET ASSET VALUE, OFFERING AND REDEMPTION PRICE PER SHARE* | ||||
| Investor Shares (based on net assets of $5,734,231) | $ | 15.97 | ||
| Institutional Shares (based on net assets of $5,350,046) | $ | 15.97 | ||
| * | Shares redeemed within 60 days of purchase are charged a 2.00% redemption fee. |
| See Notes to Financial Statements. | DF DENT GROWTH FUNDS |
DF DENT SMALL CAP GROWTH FUND
STATEMENT OF OPERATIONS
YEAR ENDED JUNE 30, 2018
| INVESTMENT INCOME | ||||
| Dividend income (Net of foreign withholding taxes of $649) | $ | 61,103 | ||
| Interest income | 363 | |||
| Total Investment Income | 61,466 | |||
| EXPENSES | ||||
| Investment adviser fees | 80,008 | |||
| Fund services fees | 140,713 | |||
| Transfer agent fees: | ||||
| Investor Shares | 1,745 | |||
| Institutional Shares | 35 | |||
| Custodian fees | 5,000 | |||
| Registration fees: | ||||
| Investor Shares | 2,909 | |||
| Institutional Shares | 1,781 | |||
| Professional fees | 26,245 | |||
| Trustees' fees and expenses | 4,648 | |||
| Other expenses | 17,141 | |||
| Total Expenses | 280,225 | |||
| Fees waived and expenses reimbursed | (183,096 | ) | ||
| Net Expenses | 97,129 | |||
| NET INVESTMENT LOSS | (35,663 | ) | ||
| NET REALIZED AND UNREALIZED GAIN (LOSS) | ||||
| Net realized gain on investments | 551,586 | |||
| Net change in unrealized appreciation (depreciation) on investments | 1,192,163 | |||
| NET REALIZED AND UNREALIZED GAIN | 1,743,749 | |||
| INCREASE IN NET ASSETS RESULTING FROM OPERATIONS | $ | 1,708,086 | ||
| See Notes to Financial Statements. | DF DENT GROWTH FUNDS |
DF DENT SMALL CAP GROWTH FUND
STATEMENTS OF CHANGES IN NET ASSETS
| For the Years Ended June 30, | ||||||||
| 2018 | 2017 | |||||||
| OPERATIONS | ||||||||
| Net investment loss | $ | (35,663 | ) | $ | (37,858 | ) | ||
| Net realized gain | 551,586 | 299,692 | ||||||
| Net change in unrealized appreciation (depreciation) | 1,192,163 | 928,361 | ||||||
| Increase in Net Assets Resulting from Operations | 1,708,086 | 1,190,195 | ||||||
| CAPITAL SHARE TRANSACTIONS | ||||||||
| Sale of shares: | ||||||||
| Investor Shares | 913,502 | 930,225 | ||||||
| Institutional Shares | 4,909,634 | * | – | |||||
| Redemption of shares: | ||||||||
| Investor Shares | (4,629,115 | )* | (1,472,245 | )** | ||||
| Redemption fees: | ||||||||
| Investor Shares | – | 547 | ||||||
| Increase (Decrease) in Net Assets from Capital Share Transactions | 1,194,021 | (541,473 | ) | |||||
| Increase in Net Assets | 2,902,107 | 648,722 | ||||||
| NET ASSETS | ||||||||
| Beginning of Year | 8,182,170 | 7,533,448 | ||||||
| End of Year (Including line (a)) | $ | 11,084,277 | $ | 8,182,170 | ||||
| SHARE TRANSACTIONS | ||||||||
| Sale of shares: | ||||||||
| Investor Shares | 62,103 | 74,617 | ||||||
| Institutional Shares | 334,924 | * | – | |||||
| Redemption of shares: | ||||||||
| Investor Shares | (318,552 | )* | (114,805 | ) | ||||
| Increase (Decrease) in Shares | 78,475 | (40,188 | ) | |||||
| (a) Accumulated net investment loss | $ | (1,500 | ) | $ | (26,524 | ) | ||
| * | The above figures include transfers of $4,309,633 and 295,290 shares from the Investor Shares to Institutional Shares, as a result of the newly offered share class. |
| ** | This amount includes $569,837 from a redemption-in-kind for the year ended June 30, 2017. |
| See Notes to Financial Statements. | DF DENT GROWTH FUNDS |
DF DENT SMALL CAP GROWTH FUND
FINANCIAL HIGHLIGHTS
These financial highlights reflect selected data for a share outstanding throughout each period.
| For the Years Ended June 30, |
November 1, 2013 (a) |
|||||||||||||||||||
| 2018 | 2017 | 2016 | 2015 | June 30, 2014 | ||||||||||||||||
| INVESTOR SHARES | ||||||||||||||||||||
| NET ASSET VALUE, Beginning of Period | $ | 13.29 | $ | 11.49 | $ | 12.22 | $ | 10.87 | $ | 10.00 | ||||||||||
| INVESTMENT OPERATIONS | ||||||||||||||||||||
| Net investment loss (b) | (0.06 | ) | (0.06 | ) | (0.01 | ) | (0.04 | ) | (0.03 | ) | ||||||||||
| Net realized and unrealized gain (loss) | 2.74 | 1.86 | (0.61 | ) | 1.48 | 0.90 | ||||||||||||||
| Total from Investment Operations | 2.68 | 1.80 | (0.62 | ) | 1.44 | 0.87 | ||||||||||||||
| DISTRIBUTIONS TO SHAREHOLDERS FROM | ||||||||||||||||||||
| Net realized gain | – | – | (0.11 | ) | (0.09 | ) | – | |||||||||||||
| Total Distributions to Shareholders | – | – | (0.11 | ) | (0.09 | ) | – | |||||||||||||
| REDEMPTION FEES(b) | – | 0.00 | (c) | – | – | – | ||||||||||||||
| NET ASSET VALUE, End of Period | $ | 15.97 | $ | 13.29 | $ | 11.49 | $ | 12.22 | $ | 10.87 | ||||||||||
| TOTAL RETURN | 20.17 | % | 15.67 | % | (5.06 | )% | 13.41 | % | 8.70 | %(d) | ||||||||||
| RATIOS/SUPPLEMENTARY DATA | ||||||||||||||||||||
| Net Assets at End of Period (000s omitted) | $ | 5,734 | $ | 8,182 | $ | 7,533 | $ | 5,382 | $ | 2,356 | ||||||||||
| Ratios to Average Net Assets: | ||||||||||||||||||||
| Net investment loss | (0.43 | )% | (0.46 | )% | (0.10 | )% | (0.39 | )% | (0.50 | )%(e) | ||||||||||
| Net expenses | 1.10 | % | 1.25 | % | 1.25 | % | 1.25 | % | 1.25 | %(e) | ||||||||||
| Gross expenses (f) | 3.12 | % | 3.25 | % | 3.60 | % | 5.16 | % | 10.69 | %(e) | ||||||||||
| PORTFOLIO TURNOVER RATE | 40 | % | 45 | % | 39 | % | 38 | % | 37 | %(d) | ||||||||||
| (a) | Commencement of operations. |
| (b) | Calculated based on average shares outstanding during each period. |
| (c) | Less than $0.01 per share. |
| (d) | Not annualized. |
| (e) | Annualized. |
| (f) | Reflects the expense ratio excluding any waivers and/or reimbursements. |
| See Notes to Financial Statements. | DF DENT GROWTH FUNDS |
DF DENT SMALL CAP GROWTH FUND
FINANCIAL HIGHLIGHTS
These financial highlights reflect selected data for a share outstanding throughout the period.
| November 20, 2017 (a) Through June 30, 2018 | ||||
| INSTITUTIONAL SHARES | ||||
| NET ASSET VALUE, Beginning of Period | $ | 14.04 | ||
| INVESTMENT OPERATIONS | ||||
| Net investment loss (b) | (0.02 | ) | ||
| Net realized and unrealized gain | 1.95 | |||
| Total from Investment Operations | 1.93 | |||
| NET ASSET VALUE, End of Period | $ | 15.97 | ||
| TOTAL RETURN | 13.75 | %(c) | ||
| RATIOS/SUPPLEMENTARY DATA | ||||
| Net Assets at End of Period (000s omitted) | $ | 5,350 | ||
| Ratios to Average Net Assets: | ||||
| Net investment loss | (0.24 | )%(d) | ||
| Net expenses | 0.95 | %(d) | ||
| Gross expenses (e) | 2.91 | %(d) | ||
| PORTFOLIO TURNOVER RATE | 40 | %(c) | ||
| (a) | Commencement of operations. |
| (b) | Calculated based on average shares outstanding during the period. |
| (c) | Not annualized. |
| (d) | Annualized. |
| (e) | Reflects the expense ratio excluding any waivers and/or reimbursements. |
| See Notes to Financial Statements. | DF DENT GROWTH FUNDS |
DF DENT GROWTH FUNDS
NOTES TO FINANCIAL STATEMENTS
JUNE 30, 2018
Note 1. Organization
DF Dent Premier Growth Fund is a diversified portfolio of Forum Funds (the “Trust”) and DF Dent Midcap Growth Fund and DF Dent Small Cap Growth Fund (individually, a “Fund” and, collectively the “Funds”) are non-diversified portfolios of the Trust. The Trust is a Delaware statutory trust that is registered as an open-end, management investment company under the Investment Company Act of 1940, as amended (the “Act”). Under its Trust Instrument, the Trust is authorized to issue an unlimited number of each Fund’s shares of beneficial interest without par value. DF Dent Premier Growth Fund commenced operations on July 16, 2001. DF Dent Midcap Growth Fund’s Investor Shares and Institutional Shares commenced operations on July 1, 2011 and November 29, 2017, respectively. DF Dent Small Cap Growth Fund’s Investor Shares and Institutional Shares commenced operations on November 1, 2013 and November 20, 2017, respectively. The Funds seek long-term capital appreciation.
Note 2. Summary of Significant Accounting Policies
The Funds are investment companies and follow accounting and reporting guidance under Financial Accounting Standards Board (“FASB”) Accounting Standards Codification (“ASC”) Topic 946, “Financial Services-Investment Companies”. These financial statements are prepared in accordance with accounting principles generally accepted in the United States of America (“GAAP”), which require management to make estimates and assumptions that affect the reported amounts of assets and liabilities, the disclosure of contingent liabilities at the date of the financial statements, and the reported amounts of increases and decreases in net assets from operations during the fiscal year. Actual amounts could differ from those estimates. The following summarizes the significant accounting policies of each Fund:
Security Valuation – Securities are valued at market prices using the last quoted trade or official closing price from the principal exchange where the security is traded, as provided by independent pricing services on each Fund business day. In the absence of a last trade, securities are valued at the mean of the last bid and ask price provided by the pricing service. Shares of non-exchange traded open-end mutual funds are valued at net asset value (“NAV”). Short-term investments that mature in sixty days or less may be valued at amortized cost.
Each Fund values its investments at fair value pursuant to procedures adopted by the Trust's Board of Trustees (the “Board”) if (1) market quotations are not readily available or (2) the Adviser, as defined in Note 4, believes that the values available are unreliable. The Trust’s Valuation Committee, as defined in each Fund’s registration statement, performs certain functions as they relate to the administration and oversight of each Fund’s valuation procedures. Under these procedures, the Valuation Committee convenes on a regular and ad hoc basis to review such investments and considers a number of factors, including valuation methodologies and significant unobservable inputs, when arriving at fair value.
The Valuation Committee may work with the Adviser to provide valuation inputs. In determining fair valuations, inputs may include market-based analytics that may consider related or comparable assets or liabilities, recent transactions, market multiples, book values and other relevant investment information. Adviser inputs may include an income-based approach in which the anticipated future cash flows of the investment are discounted in
DF DENT GROWTH FUNDS
DF DENT GROWTH FUNDS
NOTES TO FINANCIAL STATEMENTS
JUNE 30, 2018
determining fair value. Discounts may also be applied based on the nature or duration of any restrictions on the disposition of the investments. The Valuation Committee performs regular reviews of valuation methodologies, key inputs and assumptions, disposition analysis and market activity.
Fair valuation is based on subjective factors and, as a result, the fair value price of an investment may differ from the security’s market price and may not be the price at which the asset may be sold. Fair valuation could result in a different NAV than a NAV determined by using market quotes.
GAAP has a three-tier fair value hierarchy. The basis of the tiers is dependent upon the various “inputs” used to determine the value of each Fund’s investments. These inputs are summarized in the three broad levels listed below:
Level 1 - Quoted prices in active markets for identical assets and liabilities.
Level 2 - Prices determined using significant other observable inputs (including quoted prices for similar securities, interest rates, prepayment speeds, credit risk, etc.). Short-term securities with maturities of sixty days or less are valued at amortized cost, which approximates market value, and are categorized as Level 2 in the hierarchy. Municipal securities, long-term U.S. government obligations and corporate debt securities are valued in accordance with the evaluated price supplied by the pricing service and generally categorized as Level 2 in the hierarchy. Other securities that are categorized as Level 2 in the hierarchy include, but are not limited to, warrants that do not trade on an exchange, securities valued at the mean between the last reported bid and ask quotation and international equity securities valued by an independent third party with adjustments for changes in value between the time of the securities respective local market closes and the close of the U.S. market.
Level 3 - Significant unobservable inputs (including each Fund’s own assumptions in determining the fair value of investments).
The aggregate value by input level, as of June 30, 2018, for each Fund’s investments is included at the end of each Fund’s Schedule of Investments.
Security Transactions, Investment Income and Realized Gain and Loss – Investment transactions are accounted for on the trade date. Dividend income is recorded on the ex-dividend date. Foreign dividend income is recorded on the ex-dividend date or as soon as possible after determining the existence of a dividend declaration after exercising reasonable due diligence. Income and capital gains on some foreign securities may be subject to foreign withholding taxes, which are accrued as applicable. Interest income is recorded on an accrual basis. Premium is amortized and discount is accreted using the effective interest method. Identified cost of investments sold is used to determine the gain and loss for both financial statement and federal income tax purposes.
Distributions to Shareholders – Each Fund declares any dividends from net investment income and pays them annually. Any net capital gains realized by the Funds are distributed at least annually. Distributions to shareholders are recorded on the ex-dividend date. Distributions are based on amounts calculated in accordance with applicable federal income tax regulations, which may differ from GAAP. These differences are due primarily to
DF DENT GROWTH FUNDS
DF DENT GROWTH FUNDS
NOTES TO FINANCIAL STATEMENTS
JUNE 30, 2018
differing treatments of income and gain on various investment securities held by each Fund, timing differences and differing characterizations of distributions made by each Fund.
Federal Taxes – Each Fund intends to continue to qualify each year as a regulated investment company under Subchapter M of Chapter 1, Subtitle A, of the Internal Revenue Code of 1986, as amended (“Code”), and to distribute all of their taxable income to shareholders. In addition, by distributing in each calendar year substantially all of their net investment income and capital gains, if any, the Funds will not be subject to a federal excise tax. Therefore, no federal income or excise tax provision is required. Each Fund files a U.S. federal income and excise tax return as required. Each Fund’s federal income tax returns are subject to examination by the Internal Revenue Service for a period of three fiscal years after they are filed. As of June 30, 2018, there are no uncertain tax positions that would require financial statement recognition, de-recognition or disclosure.
Income and Expense Allocation – The Trust accounts separately for the assets, liabilities and operations of each of its investment portfolios. Expenses that are directly attributable to more than one investment portfolio are allocated among the respective investment portfolios in an equitable manner.
The DF Dent Midcap Growth Fund's and DF Dent Small Cap Growth Fund's class-specific expenses are charged to the operations of that class of shares. Income and expenses (other than expenses attributable to a specific class) and realized and unrealized gains or losses on investments are allocated to each class of shares based on the class’ respective net assets to the total net assets of each Fund.
Redemption Fees – A shareholder who redeems shares of DF Dent Midcap Growth Fund and DF Dent Small Cap Growth Fund within 60 days of purchase may incur a redemption fee of 2.00% of the current net asset value of shares redeemed, subject to certain limitations. The fee is charged for the benefit of the remaining shareholders and will be paid to each Fund to help offset transaction costs. The fee is accounted for as an addition to paid-in capital. Each Fund reserves the right to modify the terms of or terminate the fee at any time. There are limited exceptions to the imposition of the redemption fee. Redemption fees incurred for each Fund, if any, are reflected on the Statements of Changes in Net Assets.
Commitments and Contingencies – In the normal course of business, each Fund enters into contracts that provide general indemnifications by each Fund to the counterparty to the contract. Each Fund’s maximum exposure under these arrangements is dependent on future claims that may be made against each Fund and, therefore, cannot be estimated; however, based on experience, the risk of loss from such claims is considered remote. Each Fund has determined that none of these arrangements requires disclosure on each Fund’s balance sheet.
Note 3. Cash – Concentration in Uninsured Account
For cash management purposes, each Fund may concentrate cash with each Fund’s custodian. This typically results in cash balances exceeding the Federal Deposit Insurance Corporation (“FDIC”) insurance limits. As of June 30, 2018, DF Dent Midcap Growth Fund had $1,535,004 at MUFG Union Bank, N.A. that exceeded the FDIC insurance limit.
DF DENT GROWTH FUNDS
DF DENT GROWTH FUNDS
NOTES TO FINANCIAL STATEMENTS
JUNE 30, 2018
Note 4. Fees and Expenses
Investment Adviser – D.F. Dent and Company, Inc. (the “Adviser”) is the investment adviser to the Funds. Pursuant to an investment advisory agreement, the Adviser receives an advisory fee, payable monthly, at an annual rate of 1.00%, 0.75%, and 0.85% of the average daily net assets of DF Dent Premier Growth Fund, DF Dent Midcap Growth Fund and DF Dent Small Cap Growth Fund, respectively. Prior to November 1, 2017, the Adviser received an advisory fee from the Funds at an annual rate of 1.00% of each Fund's average daily assets.
Distribution – Foreside Fund Services, LLC serves as each Fund’s distributor (the “Distributor”). The Funds do not have a distribution (12b-1) plan; accordingly, the Distributor does not receive compensation from the Funds for its distribution services. The Adviser compensates the Distributor directly for its services. The Distributor is not affiliated with the Adviser or Atlantic Fund Administration, LLC (d/b/a Atlantic Fund Services) (“Atlantic”) or their affiliates.
Other Service Providers – Atlantic provides fund accounting, fund administration, compliance and transfer agency services to each Fund. The fees related to these services are included in Fund services fees within the Statements of Operations. Atlantic also provides certain shareholder report production and EDGAR conversion and filing services. Pursuant to an Atlantic services agreement, each Fund pays Atlantic customary fees for its services. Atlantic provides a Principal Executive Officer, a Principal Financial Officer, a Chief Compliance Officer and an Anti-Money Laundering Officer to each Fund, as well as certain additional compliance support functions.
Trustees and Officers – Through December 31, 2017, the Trust paid each Independent Trustee an annual retainer fee of $50,000 for service to the Trust ($66,000 for the Chairman), and the Audit Committee Chairman and Vice Chairman receive an additional $6,000 annually. Effective January 1, 2018, each Independent Trustee’s annual retainer is $31,000 ($41,000 for the Chairman), and the Audit Committee Chairman receives an additional $2,000 annually. The Trustees and Chairman may receive additional fees for special Board meetings. Each Trustee is also reimbursed for all reasonable out-of-pocket expenses incurred in connection with his or her duties as a Trustee, including travel and related expenses incurred in attending Board meetings. The amount of Trustees’ fees attributable to each Fund is disclosed in the Statement of Operations. Certain officers of the Trust are also officers or employees of the above named service providers, and during their terms of office received no compensation from each Fund.
Note 5. Expense Reimbursement and Fees Waived
The Adviser has contractually agreed to waive a portion of its fee and/or reimburse expenses through October 31, 2019, for DF Dent Premier Growth Fund, to the extent that total annual operating expenses (excluding all taxes, interest, portfolio transaction expenses, and extraordinary expenses) exceed 1.10% on the first $150 million of net assets and to the extent that annual operating expenses exceed 0.90% on net assets exceeding $150 million of the Fund. Additionally, the Adviser has contractually agreed to waive a portion of its fee and/or reimburse expenses to limit total annual operating expenses (excluding all taxes, interest, portfolio transaction expenses, and extraordinary expenses) of Investor Shares and Institutional Shares to 0.98% and 0.85%,respectively, through October 31, 2019, for DF Dent Midcap Growth Fund. The Adviser has also
DF DENT GROWTH FUNDS
DF DENT GROWTH FUNDS
NOTES TO FINANCIAL STATEMENTS
JUNE 30, 2018
contractually agreed to waive a portion of its fee and/or reimburse expenses to limit total annual operating expenses (excluding all taxes, interest, portfolio transaction expenses, and extraordinary expenses) of Investor Shares and Institutional Shares to 1.05% and 0.95%, respectively, through October 31, 2019, for DF Dent Small Cap Growth Fund.
Prior to November 1, 2017, the Adviser had agreed to waive a portion of its fee and/or reimburse expenses, for DF Midcap Growth Fund’s Investor Shares, to the extent that total annual operating expenses (excluding all taxes, interest, portfolio transaction expenses, and extraordinary expenses) exceeded 1.10% on the first $150 million of net assets and to the extent that annual operating expenses exceeded 0.90% on net assets exceeding $150 million of the Fund. Prior to November 1, 2017, The Adviser had also contractually agreed to waive a portion of its fee and/or reimburse expenses to limit total annual operating expenses (excluding all taxes, interest, portfolio transaction expenses, and extraordinary expenses) of the DF Dent Small Cap Growth Fund’s Investor Shares to 1.25%.
Other fund service providers have voluntarily agreed to waive and reimburse a portion of their fees. These voluntary fee waivers and reimbursements may be reduced or eliminated at any time. For the year ended June 30, 2018, fees waived and expenses reimbursed were as follows:
| Investment Adviser Fees Waived | Investment Adviser Expenses Reimbursed | Other Waivers | Total Fees Waived and Expenses Reimbursed | |||||||||||||
| DF Dent Premier Growth Fund | $ | 146,156 | $ | – | $ | 65,751 | $ | 211,907 | ||||||||
| DF Dent Midcap Growth Fund | 115,335 | – | 51,993 | 167,328 | ||||||||||||
| DF Dent Small Cap Growth Fund | 80,008 | 46,460 | 56,628 | 183,096 | ||||||||||||
The Adviser may be reimbursed by each Fund for fees waived and expenses reimbursed by the Adviser pursuant to the Expense Cap if such payment is made within three years of the fee waiver or expense reimbursement, and does not cause the Total Annual Fund Operating Expenses After Fee Waiver and/or Expense Reimbursement to exceed the lesser of (i) the then-current expense cap, or (ii) the expense cap in place at the time the fees/ expenses were waived/reimbursed. As of June 30, 2018, $104,680, $73,691, and $88,375 are subject to recoupment by the Adviser for the DF Dent Premier Growth Fund, DF Dent Midcap Growth Fund and DF Dent Small Cap Growth Fund, respectively.
Note 6. Security Transactions
The cost of purchases and proceeds from sales of investment securities (including maturities), other than short-term investments during the year ended June 30, 2018, were as follows:
| Purchases | Sales | |||||||
| DF Dent Premier Growth Fund | $ | 25,679,000 | $ | 34,264,700 | ||||
| DF Dent Midcap Growth Fund | 14,360,016 | 12,798,686 | ||||||
| DF Dent Small Cap Growth Fund | 4,772,363 | 3,565,712 | ||||||
DF DENT GROWTH FUNDS
DF DENT GROWTH FUNDS
NOTES TO FINANCIAL STATEMENTS
JUNE 30, 2018
Note 7. Federal Income Tax
As of June 30, 2018, cost for federal income tax and net unrealized appreciation (depreciation) consists of:
| Tax Cost of Investments | Gross Unrealized Appreciation | Gross Unrealized Depreciation | Net Unrealized Appreciation | |||||||||||||
| DF Dent Premier Growth Fund | $ | 85,182,400 | $ | 88,841,736 | $ | (200,042 | ) | $ | 88,641,694 | |||||||
| DF Dent Midcap Growth Fund | 30,047,882 | 15,820,820 | (230,158 | ) | 15,590,662 | |||||||||||
| DF Dent Small Cap Growth Fund | 8,084,758 | 3,136,926 | (266,153 | ) | 2,870,773 | |||||||||||
Distributions paid during the fiscal years ended as noted were characterized for tax purposes as follows:
| Ordinary Income | Long-Term Capital Gain |
Total | ||||||||||
| DF Dent Premier Growth Fund | ||||||||||||
| 2018 | $ | 308,411 | $ | 14,124,870 | $ | 14,433,281 | ||||||
| 2017 | – | 6,607,194 | 6,607,194 | |||||||||
| DF Dent Midcap Growth Fund | ||||||||||||
| 2018 | – | 122,485 | 122,485 | |||||||||
| 2017 | – | 24,720 | 24,720 | |||||||||
| DF Dent Small Cap Growth Fund | ||||||||||||
| 2018 | – | – | – | |||||||||
| 2017 | – | – | – | |||||||||
Equalization debits included in the distributions were as follows:
| Ordinary Income | Long-Term Capital Gain |
Total | ||||||||||
| DF Dent Premier Growth Fund | ||||||||||||
| 2018 | $ | – | $ | 495,345 | $ | 495,345 | ||||||
| 2017 | – | 775,000 | 775,000 | |||||||||
| DF Dent Midcap Growth Fund | ||||||||||||
| 2018 | – | – | – | |||||||||
| 2017 | – | – | – | |||||||||
| DF Dent Small Cap Growth Fund | ||||||||||||
| 2018 | – | – | – | |||||||||
| 2017 | – | – | – | |||||||||
The DF Dent Premier Growth Fund used equalization accounting for tax purposes, whereby a portion of its redemption payments are treated as distributions of income or gain for tax purposes.
As of June 30, 2018, distributable earnings (accumulated loss) on a tax basis were as follows:
| Undistributed Ordinary Income | Undistributed Long-Term Gain | Capital and Other Losses | Unrealized Appreciation | Total | ||||||||||||||||
| DF Dent Premier Growth Fund | $ | – | $ | 7,355,059 | $ | (406,799 | ) | $ | 88,641,694 | $ | 95,589,954 | |||||||||
| DF Dent Midcap Growth Fund | 138,440 | 1,224,232 | – | 15,590,662 | 16,953,334 | |||||||||||||||
| DF Dent Small Cap Growth Fund | 130,820 | 150,010 | – | 2,870,773 | 3,151,603 | |||||||||||||||
DF DENT GROWTH FUNDS
DF DENT GROWTH FUNDS
NOTES TO FINANCIAL STATEMENTS
JUNE 30, 2018
The difference between components of distributable earnings on a tax basis and the amounts reflected in the Statements of Assets and Liabilities are primarily due to passive foreign investment holdings (PFICs), wash sales and equity return of capital.
For tax purposes, the current late year ordinary loss was $406,799 (realized during the period January 1, 2018 through June 30, 2018) for DF Dent Premier Growth Fund. This loss will be recognized for tax purposes on the first business day of the Fund’s next fiscal year, July 1, 2018.
On the Statements of Assets and Liabilities, as a result of permanent book to tax differences, certain amounts have been reclassified for the year ended June 30, 2018. The following reclassifications were the result of net operating loss offsetting short-term capital gains, redemptions in-kind, net operating loss, equity return of capital, and equalization and have no impact on the net assets of each Fund.
| Undistributed Net Investment Income | Accumulated Net Realized Loss | Paid-in-Capital | ||||||||||
| DF Dent Premier Growth Fund | $ | 372,855 | $ | (489,585 | ) | $ | 116,730 | |||||
| DF Dent Midcap Growth Fund | 312,627 | (971,055 | ) | 658,428 | ||||||||
| DF Dent Small Cap Growth Fund | 60,687 | (60,687 | ) | – | ||||||||
Note 8. In-Kind Redemptions
On June 14, 2018, the DF Dent Midcap Growth Fund distributed portfolio securities rather than cash as payment for certain redemptions of fund shares (in-kind redemptions). The proceeds for the in-kind redemptions, which are included in Redemption of shares in the Statements of Changes in Net Assets, were $1,278,233 and represented 6.75% of the DF Dent Midcap Growth Fund’s net assets on June 14, 2018. For financial reporting purposes, the DF Dent Midcap Growth Fund recognized gains on the in-kind redemptions in the amount of $664,290. For tax purposes, the gains are not recognized.
Note 9. Subsequent Events
Subsequent events occurring after the date of this report through the date these financial statements were issued have been evaluated for potential impact, and each Fund has had no such events.
DF DENT GROWTH FUNDS
REPORT OF INDEPENDENT REGISTERED PUBLIC ACCOUNTING FIRM
To the Board of Trustees of Forum Funds
and the Shareholders of DF Dent Premier Growth Fund, DF Dent Midcap Growth Fund and
DF Dent Small Cap Growth Fund
Opinion on the Financial Statements
We have audited the accompanying statements of assets and liabilities of DF Dent Premier Growth Fund, DF Dent Midcap Growth Fund, and DF Dent Small Cap Growth Fund, each a series of shares of beneficial interest in Forum Funds (the “Funds”), including the schedules of investments, as of June 30, 2018, and the related statements of operations for the year then ended, the statements of changes in net assets for each of the years in the two-year period then ended and the financial highlights for each of the years and periods in the five-year period then ended, and the related notes (collectively referred to as the “financial statements”). In our opinion, the financial statements present fairly, in all material respects, the financial position of the Funds as of June 30, 2018, and the results of their operations for the year then ended, the changes in their net assets for each of the years in the two-year period then ended and their financial highlights for each of the years and periods in the five-year period then ended, in conformity with accounting principles generally accepted in the United States of America.
Basis for Opinion
These financial statements are the responsibility of the Funds' management. Our responsibility is to express an opinion on the Funds’ financial statements based on our audits. We are a public accounting firm registered with the Public Company Accounting Oversight Board (United States) (“PCAOB”) and are required to be independent with respect to the Funds in accordance with the U.S. federal securities law and the applicable rules and regulations of the Securities and Exchange Commission and the PCAOB.
We conducted our audits in accordance with the standards of the PCAOB. Those standards require that we plan and perform the audits to obtain reasonable assurance about whether the financial statements are free of material misstatement, whether due to error or fraud. The Funds are not required to have, nor were we engaged to perform, an audit of their internal control over financial reporting. As part of our audits we are required to obtain an understanding of internal control over financial reporting but not for the purpose of expressing an opinion on the effectiveness of the Funds’ internal control over financial reporting. Accordingly, we express no such opinion.
DF DENT GROWTH FUNDS
REPORT OF INDEPENDENT REGISTERED PUBLIC ACCOUNTING FIRM
Our audits included performing procedures to assess the risk of material misstatement of those financial statements, whether due to error or fraud, and performing procedures that respond to those risks. Such procedures included examining, on a test basis, evidence regarding the amounts and disclosures in the financial statements. Our procedures included confirmation of securities owned as of June 30, 2018 by correspondence with the custodian and brokers, or by other appropriate auditing procedures where replies from brokers were not received. Our audits also included evaluating the accounting principles used and significant estimates made by management, as well as evaluating the overall presentation of the financial statements. We believe that our audits provide a reasonable basis for our opinion.
BBD, LLP
Philadelphia, Pennsylvania
August 23, 2018
DF DENT GROWTH FUNDS
DF DENT GROWTH FUNDS
ADDITIONAL INFORMATION (Unaudited)
JUNE 30, 2018
Investment Advisory Agreement Approval
At the June 14, 2018 Board meeting, the Board, including all of the Independent Trustees, considered the approval of the continuance of the investment advisory agreement between the Adviser and the Trust pertaining to the Funds (the “Advisory Agreement”). In preparation for its deliberations, the Board requested written responses from the Adviser to a due diligence questionnaire circulated on the Board's behalf concerning the services provided by the Adviser. The Board also discussed the materials with Fund counsel and, as necessary, with the Trust's administrator, Atlantic Fund Services. During its deliberations, the Board received an oral presentation from the Adviser, and was assisted by the advice of Trustee counsel.
At the meeting, the Board reviewed, among other matters: (1) the nature, extent and quality of the services provided to the Funds by the Adviser, including information on the investment performance of the Funds and Adviser; (2) the costs of the services provided and profitability to the Adviser with respect to its relationship with the Funds; (3) information concerning the advisory fee and total expense ratio of the Funds, including a comparison to the fees and expenses of a relevant peer group of funds; (4) the extent to which economies of scale may be realized as the Funds grow and whether the advisory fee enables each Fund's investors to share in the benefits of economies of scale; and (5) other benefits received by the Adviser from its relationship with the Funds. In addition, the Board recognized that the evaluation process with respect to the Adviser was an ongoing one and, in this regard, the Board considered information provided by the Adviser at regularly scheduled meetings during the past year.
Nature, Extent and Quality of Services
Based on written materials received, a presentation from senior representatives of the Adviser and a discussion with the Adviser about the Adviser’s personnel, operations and financial condition, the Board considered the quality of services provided by the Adviser under the Advisory Agreement. In this regard, the Board considered information regarding the experience, qualifications and professional background of the portfolio managers and other personnel at the Adviser with principal responsibility for the Funds, as well as the investment philosophy and decision-making process of the Adviser and the capability and integrity of the Adviser’s senior management and staff.
The Board considered also the adequacy of the Adviser’s resources. The Board noted the Adviser’s representation that the firm is in stable financial condition, that the firm is able to meet its expense reimbursement obligations to the Funds, and that the firm has the operational capability and necessary staffing and experience to continue providing high-quality investment advisory services to the Funds. Based on the presentation and the materials provided by the Adviser in connection with the Board’s consideration of the renewal of the Advisory Agreement, the Board concluded that, overall, it was satisfied with the nature, extent and quality of services to be provided to the Funds under the Advisory Agreement.
DF DENT GROWTH FUNDS
DF DENT GROWTH FUNDS
ADDITIONAL INFORMATION (Unaudited)
JUNE 30, 2018
Performance
In connection with a presentation by the Adviser regarding its approach to managing the Funds, the Board reviewed the performance of each Fund compared to its respective benchmark and to a peer group of funds.
The Board observed that the DF Dent Premier Growth Fund outperformed its primary benchmark index, the S&P 500 Index, for the one-, three-, 10-, and 15-year periods ended March 31, 2018, and outperformed the benchmark for the period since the DF Dent Premier Growth Fund’s inception on July 16, 2001. The Board observed that the DF Dent Premier Growth Fund underperformed the benchmark for the five-year period ended March 31, 2018. The Board also considered the DF Dent Premier Growth Fund’s performance relative to an independent peer group of funds identified by Broadridge Financial Solutions, Inc. (“Broadridge”) as having characteristics similar to those of the DF Dent Premier Growth Fund. The Board observed that, based on information provided by Broadridge, the DF Dent Premier Growth Fund outperformed the median of its Broadridge peer group for the one- and three-year periods ended March 31, 2018 and performed at the median of the Broadridge peers for the five-year period ended March 31, 2018. The Board noted the Adviser’s representation that the DF Dent Premier Growth Fund’s outperformance relative to its peers could be attributed primarily to stock selection within sectors. The Board noted the Adviser’s representation that the DF Dent Premier Growth Fund’s outperformance relative to its benchmark index could be attributed to the DF Dent Premier Growth Fund’s sector allocation, noting that the DF Dent Premier Growth Fund had overweight exposure to certain sectors that outperformed the market generally and had underweight exposure to certain sectors that underperformed the market generally.
With respect to the DF Dent Midcap Growth Fund, the Board observed that the Fund outperformed its primary benchmark index, the Russell Midcap Growth Index, for the one-, three-, and five-year periods ended March 31, 2018, and outperformed the benchmark for the period since the DF Dent Midcap Growth Fund’s inception on July 1, 2011. The Board observed that the DF Dent Midcap Growth Fund also outperformed the median of its Broadridge peer group for the one-, three-, and five-year periods ended March 31, 2018. The Board noted the Adviser’s representation that the DF Dent Midcap Growth Fund’s outperformance relative to its peers could be attributed primarily to stock selection within certain sectors. The Board noted the Adviser’s representation that the DF Dent Midcap Growth Fund’s outperformance relative to its benchmark index could be attributed to the DF Dent Midcap Growth Fund’s sector allocation.
With respect to the DF Dent Small Cap Growth Fund, the Board observed that the Fund underperformed its primary benchmark index, the Russell 2000 Growth Index, for the one-year period ended March 31, 2018 and for the period since the DF Dent Small Cap Growth Fund’s inception on November 1, 2013. The Board observed that the DF Dent Small Cap Growth Fund outperformed the benchmark index for the three-year period ended March 31, 2018. The Board further observed that the DF Dent Small Cap Growth Fund performed in line with the median of its Broadridge peer group over the one-year period ended March 31, 2018, and outperformed the median of the peer group over the three-year period ended March 31, 2018. The Board noted the Adviser’s representation that the period of underperformance experienced by the DF Dent Small Cap Growth Fund could be attributed to stock selection (as opposed to sector allocation).
DF DENT GROWTH FUNDS
DF DENT GROWTH FUNDS
ADDITIONAL INFORMATION (Unaudited)
JUNE 30, 2018
In light of the foregoing and other relevant factors, the Board concluded that the performance of each Fund was reasonable and that each Fund and its shareholders could benefit from the Adviser’s continued management.
Compensation
The Board evaluated the Adviser’s compensation for providing advisory services to each of the Funds and analyzed comparative information on actual advisory fee rates and actual total expenses of the Funds’ respective Broadridge peer groups. The Board noted that, although the actual advisory fee rate and actual total expense ratio for the DF Dent Premier Growth Fund were each higher than the median of its Broadridge peer group, the Adviser maintains an expense waiver for the DF Dent Premier Growth Fund such that the Adviser waives its advisory fee and/or reimburses DF Dent Premier Growth Fund expenses as necessary to ensure that the DF Dent Premier Growth Fund’s remain at competitive levels. Based on the foregoing and other relevant factors, the Board concluded that the advisory fee rate charged to the DF Dent Premier Growth Fund was reasonable.
With respect to the DF Dent Midcap Growth Fund, the Board noted that the Adviser’s actual advisory fee rate was lower than the median of its Broadridge peer group and the DF Dent Midcap Growth Fund’s actual total expense ratio was higher than the median of its Broadridge peer group. The Board noted that the Adviser had reduced the overall advisory fee and lowered the expense cap for the DF Dent Midcap Growth Fund in 2017. Based on the foregoing and other relevant factors, the Board concluded that the Adviser’s current advisory fee rate charged to the DF Dent Midcap Growth Fund was reasonable.
With respect to the DF Dent Small Cap Growth Fund, the Board observed that the Adviser’s actual advisory fee rate was the lowest in its Broadridge peer group. The Board also observed that, although the DF Dent Small Cap Growth Fund’s actual total expense ratio was higher than the median of its Broadridge peer group, the actual total expense ratios of the entire peer group varied only slightly from one to another. In addition, the Board noted that the Adviser had reduced the overall advisory fee and lowered the expense cap for the DF Dent Small Cap Growth Fund in 2017. Based on the foregoing and other relevant factors, the Board concluded that the Adviser’s current advisory fee rate charged to the DF Dent Small Cap Growth Fund was reasonable.
Cost of Services and Profitability
The Board considered information provided by the Adviser regarding the costs of services and its profitability with respect to the Funds. In this regard, the Board considered the Adviser’s operating expenses and other resources devoted to the Funds, as well as the information provided by the Adviser regarding costs and overall profitability. The Board noted that the Adviser had in place a contractual expense waiver to ensure the expense ratios for the Funds remained at reasonable levels, including a tiered breakpoint schedule for the DF Dent Premier Growth Fund. The Board further noted the Adviser’s representation that the Funds were less profitable than the Adviser’s overall investment management business because, although the Funds represented a relatively small percentage of the Adviser’s total assets under management, the Funds represented a relatively high percentage of the Adviser’s overall administrative, reporting, and compliance expenses. Based on these and other applicable considerations, the Board concluded that the Adviser’s profits attributable to management of the Funds were not unreasonable in the context of all factors considered.
DF DENT GROWTH FUNDS
DF DENT GROWTH FUNDS
ADDITIONAL INFORMATION (Unaudited)
JUNE 30, 2018
Economies of Scale
The Board evaluated whether the Funds would benefit from any economies of scale. In this respect, the Board noted the Adviser’s representation that the Adviser could realize economies of scale as assets grow. The Board further noted that, due to the Adviser having contractually agreed to a cap with breakpoints for the DF Dent Premier Growth Fund’s total expenses (subject to certain exclusions) through October 31, 2019 so that the shareholders of the DF Dent Premier Growth Fund would realize economies of scale under the Fund’s investment advisory agreement. The Board also noted the Adviser’s representation that shareholders of each of the DF Dent Small Cap Growth Fund and DF Dent Midcap Growth Fund could realize economies of scale as assets grow but that, given the current low assets of each Fund, no breakpoints in the advisory fee were being proposed those two Funds.
Other Benefits
The Board noted the Adviser’s representation that, aside from its contractual advisory fees, it does not benefit in a material way from its relationship with the Funds. Based on the foregoing representation, the Board concluded that other benefits received by the Adviser from its relationship with the Funds were not a material factor to consider in approving the continuation of the Advisory Agreement.
Conclusion
The Board did not identify any single factor as being of paramount importance, and different Trustees may have given different weight to different factors. The Board reviewed a memorandum from Fund counsel discussing the legal standards applicable to its consideration of the Advisory Agreement. Based on its review, including consideration of each of the factors referenced above, and its consideration of information received throughout the year from the Adviser, the Board determined, in the exercise of its business judgment, that the advisory arrangement, as outlined in the Advisory Agreement, was fair and reasonable in light of the services performed or to be performed, expenses incurred or to be incurred and such other matters as the Board considered relevant.
Proxy Voting Information
A description of the policies and procedures that each Fund uses to determine how to vote proxies relating to securities held in each Fund’s portfolio is available, without charge and upon request, by calling (866) 233-3368 and on the SEC’s website at www.sec.gov. Each Fund’s proxy voting record for the most recent twelve-month period ended June 30 is available, without charge and upon request, by calling (866) 233-3368 and on the SEC’s website at www.sec.gov.
Availability of Quarterly Portfolio Schedules
Each Fund files its complete schedule of portfolio holdings with the SEC for the first and third quarters of each fiscal year on Form N-Q. These filings are available, without charge and upon request on the SEC’s website at
DF DENT GROWTH FUNDS
DF DENT GROWTH FUNDS
ADDITIONAL INFORMATION (Unaudited)
JUNE 30, 2018
www.sec.gov or may be reviewed and copied at the SEC’s Public Reference Room in Washington, DC. Information on the operation of the Public Reference Room may be obtained by calling (800) SEC-0330.
Shareholder Expense Example
As a shareholder of the Funds, you incur two types of costs: (1) transaction costs, including redemption fees, and (2) ongoing costs, including management fees and other Fund expenses. This example is intended to help you understand your ongoing costs (in dollars) of investing in the Funds, and to compare these costs with the ongoing costs of investing in other mutual funds.
The example is based on an investment of $1,000 invested at the beginning of the period and held for the entire period from January 1, 2018 through June 30, 2018.
Actual Expenses – The first line of the table below provides information about actual account values and actual expenses. You may use the information in this line, together with the amount you invested, to estimate the expenses that you paid over the period. Simply divide your account value by $1,000 (for example, an $8,600 account value divided by $1,000 = 8.6), then multiply the result by the number in the first line under the heading entitled “Expenses Paid During Period” to estimate the expenses you paid on your account during the period.
Hypothetical Example for Comparison Purposes – The second line of the table below provides information about hypothetical account values and hypothetical expenses based on each Fund’s actual expense ratio and an assumed rate of return of 5% per year before expenses, which is not each Fund’s actual return. The hypothetical account values and expenses may not be used to estimate the actual ending account balance or expenses you paid for the period. You may use this information to compare the ongoing costs of investing in each Fund and other funds. To do so, compare this 5% hypothetical example with the 5% hypothetical examples that appear in the shareholder reports of other funds.
Please note that the expenses shown in the table are meant to highlight your ongoing costs only and do not reflect any transactional costs, such as redemption fees. Therefore, the second line of the table is useful in comparing ongoing costs only and will not help you determine the relative total costs of owning different funds. In addition, if these transactional costs were included, your costs would have been higher.
DF DENT GROWTH FUNDS
DF DENT GROWTH FUNDS
ADDITIONAL INFORMATION (Unaudited)
JUNE 30, 2018
| Beginning Account Value January 1, 2018 |
Ending Account Value June 30, 2018 |
Expenses Paid During Period* |
Annualized Expense Ratio* |
|||||||||||||
| DF Dent Premier Growth Fund | ||||||||||||||||
| Actual | $ | 1,000.00 | $ | 1,106.78 | $ | 5.64 | 1.08 | % | ||||||||
| Hypothetical (5% return before expenses) | $ | 1,000.00 | $ | 1,019.44 | $ | 5.41 | 1.08 | % | ||||||||
| DF Dent Midcap Growth Fund | ||||||||||||||||
| Investor Shares | ||||||||||||||||
| Actual | $ | 1,000.00 | $ | 1,090.33 | $ | 4.87 | 0.94 | % | ||||||||
| Hypothetical (5% return before expenses) | $ | 1,000.00 | $ | 1,020.13 | $ | 4.71 | 0.94 | % | ||||||||
| Institutional Shares | ||||||||||||||||
| Actual | $ | 1,000.00 | $ | 1,090.82 | $ | 4.41 | 0.85 | % | ||||||||
| Hypothetical (5% return before expenses) | $ | 1,000.00 | $ | 1,020.58 | $ | 4.26 | 0.85 | % | ||||||||
| DF Dent Small Cap Growth Fund | ||||||||||||||||
| Investor Shares | ||||||||||||||||
| Actual | $ | 1,000.00 | $ | 1,115.22 | $ | 5.19 | 0.99 | % | ||||||||
| Hypothetical (5% return before expenses) | $ | 1,000.00 | $ | 1,019.89 | $ | 4.96 | 0.99 | % | ||||||||
| Institutional Shares | ||||||||||||||||
| Actual | $ | 1,000.00 | $ | 1,115.22 | $ | 4.98 | 0.95 | % | ||||||||
| Hypothetical (5% return before expenses) | $ | 1,000.00 | $ | 1,020.08 | $ | 4.76 | 0.95 | % | ||||||||
| * | Expenses are equal to the Fund’s annualized expense ratio multiplied by the average account value over the period, multiplied by the number of days in the most recent fiscal half-year (181) divided by 365 to reflect the half-year period. |
Federal Tax Status of Dividends Declared during the Fiscal Year
For federal income tax purposes, dividends from short-term capital gains are classified as ordinary income. The DF Dent Premier Growth Fund designates 100.00% of its income dividend distributed as qualifying for the corporate dividends-received deduction (DRD), 100.00% for the qualified dividend rate (QDI) and 100.00% as short-term capital gain dividends exempt from U.S. tax for foreign shareholders (QSD) as defined in Section 1(h) (11) of the Code.
Trustees and Officers of the Trust
The Board is responsible for oversight of the management of the Trust’s business affairs and of the exercise of all the Trust’s powers except those reserved for the shareholders. The following table provides information about each Trustee and certain officers of the Trust. Each Trustee and officer holds office until the person resigns, is removed, or is replaced. Unless otherwise noted, the persons have held their principal occupations for more than five years. The address for all Trustees and officers is Three Canal Plaza, Suite 600, Portland, Maine 04101. Each Fund’s Statement of Additional Information includes additional information about the Trustees and is available, without charge and upon request, by calling (866) 233-3368.
DF DENT GROWTH FUNDS
DF DENT GROWTH FUNDS
ADDITIONAL INFORMATION (Unaudited)
JUNE 30, 2018
| Name and Year of Birth |
Position with the Trust |
Length of Time Served |
Principal Occupation(s) During Past Five Years |
Number of Series in Fund Complex Overseen By Trustee |
Other Directorships Held By Trustee During Past Five Years |
| Independent Trustees | |||||
| David Tucker Born: 1958 |
Trustee; Chairman of the Board | Since 2011 and Chairman since 2018 | Director, Blue Sky Experience (a charitable endeavor) since 2008; Senior Vice President & General Counsel, American Century Companies (an investment management firm) 1998-2008. | 3 | Trustee, Forum Funds II, Forum ETF Trust and U.S. Global Investors Funds |
| Mark D. Moyer Born: 1959 |
Trustee | Since 2018 | Chief Financial Officer, Freedom House (a NGO advocating political freedom and democracy) since 2017; independent consultant providing interim CFO services, principally to non-profit organizations, 2011-2017; Chief Financial Officer, Institute of International Education (a NGO administering international educational exchange programs), 2008-2011; Chief Financial Officer and Chief Restructuring Officer, Ziff Davis Media Inc. (an integrated media company), 2005-2008; Adjunct Professor of Accounting, Fairfield University from 2009-2012. | 3 | Trustee, Forum Funds II, Forum ETF Trust and U.S. Global Investors Funds |
| Jennifer Brown-Strabley Born: 1964 |
Trustee | Since 2018 | Principal, Portland Global Advisors, 1996-2010. | 3 | Trustee, Forum Funds II, Forum ETF Trust and U.S. Global Investors Funds |
| Interested Trustees | |||||
| Stacey E. Hong(1) Born: 1966 |
Trustee | Since 2018 | President, Atlantic since 2008. | 3 | Trustee, Forum Funds II and U.S. Global Investors Funds |
| Jessica Chase(1) Born: 1970 |
Trustee | Since 2018 | Senior Vice President, Atlantic since 2008. | 3 | None |
| (1) | Stacey E. Hong is currently treated as an interested person of the Trust, as defined in the 1940 Act, due to his affiliation with Atlantic. Jessica Chase is currently treated as an interested person of the Trust, as defined in the 1940 Act, due to her affiliation with Atlantic and her role as President of the Trust. |
DF DENT GROWTH FUNDS
DF DENT GROWTH FUNDS
ADDITIONAL INFORMATION (Unaudited)
JUNE 30, 2018
| Name and Year of Birth | Position with the Trust | Length of Time Served | Principal Occupation(s) During Past 5 Years |
| Officers | |||
|
Jessica Chase Born: 1970 |
President; Principal Executive Officer | Since 2015 | Senior Vice President, Atlantic since 2008. |
|
Karen Shaw Born: 1972 |
Treasurer; Principal Financial Officer | Since 2008 | Senior Vice President, Atlantic since 2008. |
|
Zachary Tackett Born: 1988 |
Vice President; Secretary and Anti-Money Laundering Compliance Officer | Since 2014 | Counsel, Atlantic since 2014; Intern Associate, Coakley & Hyde, PLLC, 2010-2013. |
|
Michael J. McKeen Born: 1971 |
Vice President | Since 2009 | Senior Vice President, Atlantic since 2008. |
|
Timothy Bowden Born: 1969 |
Vice President | Since 2009 | Manager, Atlantic since 2008. |
|
Geoffrey Ney Born: 1975 |
Vice President | Since 2013 | Manager, Atlantic since 2013; Senior Fund Accountant, Atlantic, 2008–2013. |
|
Todd Proulx Born: 1978 |
Vice President | Since 2013 | Manager, Atlantic since 2013; Senior Fund Accountant, Atlantic, 2008–2013. |
|
Carlyn Edgar Born: 1963 |
Vice President | Since 2008 | Senior Vice President, Atlantic since 2008; Chief Compliance Officer, 2008-2016 |
|
Dennis Mason Born: 1967 |
Chief Compliance Officer | Since 2016 | Fund Compliance Officer, Atlantic since 2013; Senior Specialist, Atlantic, 2011-2013; Senior Analyst, Atlantic, 2008-2011 |
DF DENT GROWTH FUNDS
DF Dent Premier Growth Fund – DFDPX
DF Dent Midcap Growth Fund Investor Shares – DFDMX
DF Dent Midcap Growth Fund Institutional Shares – DFMGX
DF Dent Small Cap Growth Fund Investor Shares – DFDSX
DF Dent Small Cap Growth Fund Institutional Shares – DFSGX
INVESTMENT ADVISER
D.F. Dent and Company, Inc.
400 E. Pratt Street, 7th Floor
Baltimore, MD 21202
www.dfdent.com
TRANSFER AGENT
Atlantic Fund Services
P.O. Box 588
Portland, ME 04112
(866) 2DF-DENT
www.atlanticfundservices.com
DISTRIBUTOR
Foreside Fund Services, LLC
Three Canal Plaza, Suite 100
Portland, ME 04101
www.foreside.com
221-SAR-0618
This report is submitted for the general information of the shareholders of the Funds. It is not authorized for distribution to prospective investors unless preceded or accompanied by an effective prospectus, which includes information regarding the Funds' risks, objectives, fees and expenses, experience of its management, and other information.
|
(a)
|
As of the end of the period covered by this report, Forum Funds (the "Registrant") has adopted a code of ethics, which applies to its Principal Executive Officer and Principal Financial Officer (the "Code of Ethics").
|
|
(c)
|
There have been no amendments to the Registrant's Code of Ethics during the period covered by this report.
|
|
(d)
|
There have been no waivers to the Registrant's Code of Ethics during the period covered by this report.
|
|
(e)
|
Not applicable.
|
|
(a)
|
Included as part of report to shareholders under Item 1.
|
|
(b)
|
Not applicable.
|
|
By:
|
/s/ Jessica Chase
|
|
|
Jessica Chase, Principal Executive Officer
|
||
|
Date:
|
August 27, 2018
|
|
By:
|
/s/ Jessica Chase
|
|
|
Jessica Chase, Principal Executive Officer
|
||
|
Date:
|
August 27, 2018
|
|
By:
|
/s/ Karen Shaw
|
|
|
Karen Shaw, Principal Financial Officer
|
||
|
Date:
|
August 27, 2018
|
|
(A)
|
Access Person means:
|
|
(1)
|
Each Trustee and Officer;
|
|
(2)
|
(i) Any officer, director or general partner of the Adviser; and (ii) any officer, director or general partner of the Distributor, where the Distributor in the ordinary course of business either (a) makes, participates in or obtains information regarding the Fund's purchase or sale of Covered Investments or (b) fills a function related to the making of any recommendation regarding the Fund's purchase or sale of Covered Investments;
|
|
(3)
|
Any employee of the Fund or Adviser, or of any company in a control relationship with the Fund or Adviser, whose regular functions (i) relate to the making of any recommendation regarding the Fund's purchase or sale of Covered Investments or (ii) include making, participating in or obtaining information regarding the purchase or sale of Covered Investments by a Fund; and
|
|
(4)
|
Any natural person in a control relationship with a Fund or Adviser who obtains information concerning recommendations made to a Fund about the purchase or sale of a Covered Investment.
|
|
(B)
|
Beneficial Owner means "beneficial owner" as defined in Rule 16a-1(a)(2) under the 1934 Act except that the determination of direct or indirect beneficial ownership shall apply to all Covered Investments which an Access Person owns or acquires. A Beneficial Owner of an investment is any person who, directly or indirectly, through any contract, arrangement, understanding, relationship or otherwise, has or shares a direct or indirect pecuniary interest (the opportunity, directly or indirectly, to profit or share in any profit derived from a transaction in the subject securities) in a security. Indirect pecuniary interest in an investment includes securities held by a person's immediate family And immediate family means any child, stepchild, grandchild, parent, stepparent, grandparent, spouse, sibling, mother-in-law, father-in-law, son-in-law, daughter-in-law, brother-in-law, or sister-in-law (including adoptive relationships).
|
|
(C)
|
Control means the power to exercise a controlling influence over the management or policies of a company, unless the power is solely the result of an official position with the company.
|
|
(D)
|
Covered Officer means the PEO, PFO and PAO as those terms are used in Section 406 of the Sarbanes-Oxley Act of 2002.
|
|
(E)
|
Covered Investment means any investment except:
|
|
(1)
|
Direct obligations of the United States Government;
|
|
(2)
|
Bankers' acceptances and bank certificates of deposit;
|
|
(3)
|
Commercial paper and debt instruments with a maturity at issuance of less than 366 days and that are rated in one of the two highest rating categories by a nationally recognized statistical rating organization;
|
|
(4)
|
Repurchase agreements covering any of the foregoing; and
|
|
(5)
|
Shares of registered open-end investment companies other than Funds.
|
|
(F)
|
Investment Personnel, means any employee of the Fund or Adviser who makes or participates in making recommendations to the Fund regarding the purchase or sale of investments by the Fund. No Fund or the Trust shall employ such a person without prior approval of the Board and the Review Officer.
|
|
(G)
|
Security Held or to be Acquired means
|
|
(1)
|
Any Covered Investment which, within the most recent 15 days (a) is or has been held by a Fund or (b) is being or has been considered by a Fund or an Adviser for purchase by a Fund; and
|
|
(2)
|
Any option to purchase or sell, and any investment convertible into or exchangeable for, a Covered Investment.
|
|
(H)
|
Purchase or sale includes the writing of an option to purchase or sell.
|
|
(I)
|
Material non-public information means information (i) that there is a substantial likelihood a reasonable investor would consider important in making an investment decision, or that is reasonably certain to have a substantial effect on the price of Shares and (ii) that has not been effectively communicated to the market place. Examples include: (a) valuation issues; (b) liquidity issues; (c) significant increase in expenses; (d) proposal for liquidation or reorganization; (e) regulatory developments that affect a Fund; and (f) extraordinary developments at the Adviser. Public information includes information found in a report filed with the SEC or appearing in a news service.
|
|
(A)
|
Prohibition Against Fraudulent Conduct. No Access Person shall use any information concerning the operating activities, investments or investment intentions of a Fund, or the Access Person's ability to influence such operating activities or investment intentions, for personal gain or in a manner detrimental to the interests of a Fund. In addition, no Affiliated Person of a Fund shall, directly or indirectly in connection with the operating activities of the Fund or the purchase or sale of a security held or to be acquired by a Fund:
|
|
(1)
|
Employ any device, scheme or artifice to defraud a Fund;
|
|
(2)
|
Make to a Fund or to the Adviser or Distributor any untrue statement of a material fact or omit to state to any of the foregoing a material fact necessary in order to make the statements made, in light of the circumstances under which they are made, not misleading;
|
|
(3)
|
Engage in any act, practice, or course of business that operates or would operate as a fraud or deceit upon a Fund; or
|
|
(4)
|
Engage in any manipulative practice with respect to a Fund.
|
|
(B)
|
Other Prohibited Transactions. Access Persons are prohibited from:
|
|
(1)
|
Inducing or causing a Fund to take action, or to fail to take action, for the benefit of a person either in addition to or other than the Fund;
|
|
(2)
|
Accepting anything other than of de minimis value or any other preferential treatment from any entity with which a Fund does business;
|
|
(3)
|
Using knowledge of the operating activities or portfolio transactions of a Fund for their benefit or the benefit of any person other than the Fund;
|
|
(4)
|
Violating the anti-fraud provisions of the securities laws; or
|
|
(5)
|
Except for the Independent Trustees, serving on the boards of directors of publicly traded companies, absent prior authorization based upon a determination by the Review Officer that the board service would be consistent with the interests of the Fund and its shareholders.
|
|
(C)
|
Undue Influence; Disclosure of Personal Interest. No Access Person shall cause or attempt to cause a Fund to purchase, sell or hold any investment in a manner or engage in operating activity calculated to create any benefit to the Access Person. No Access Person shall recommend any operating activity or investment transactions for a Fund without having disclosed to the Review Officer the Access Person's interest, if any, in Shares or such investment or the issuer thereof, including, without limitation:
|
|
(1)
|
The Access Person's direct or indirect beneficial ownership of any securities of the subject issuer or in the investment;
|
|
(2)
|
Any position with such issuer or its Affiliated Persons; and
|
|
(3)
|
Any present or proposed business relationship between such issuer or its Affiliated Persons, on the one hand, and such person or any party in which such person has a significant interest, on the other hand.
|
|
(D)
|
Corporate Opportunities. Access Persons are prohibited from taking advantage of any opportunity properly belonging to a Fund.
|
|
(E)
|
Confidentiality. Except as required in the normal course of carrying out an Access Person's business responsibilities, Access Persons are prohibited from revealing information relating to the investment intentions or activities of any Fund, or investment that are being considered for purchase or sale on behalf of any Fund.
|
|
(F)
|
Prohibited Transactions in Fund Shares. Access Persons are prohibited from trading in Shares while in possession of material non-public information regarding the operating activities of the Fund.
|
|
(A)
|
Access Person Reporting. Access Persons must report the information described in this Section 4 with respect to transactions in any Covered Investment in which the Access Person has, or by reason of such transaction acquires, any direct or indirect beneficial ownership. Access Persons must report to the Review Officer, unless they are required to report to an Adviser or the Distributor pursuant to a code of ethics adopted by those persons; and, in the case of (i) the Adviser or (ii) the Distributor if the Distributor is (a) an Affiliated Person of the Trust or (b) has any officer, director or general partner that serves the Trust or the Adviser in the same capacity ("Affiliated Distributor"), has been approved by the Board. The Board shall not approve such code of ethics unless it is maintained and enforced as if it were subject to the same rules as provided in Rule 17j-1 under the 1940 Act. Access Persons will promptly:
|
|
(1)
|
Provide full access to the Trust to any and all records and documents which the Trust considers relevant to any investment transactions or other matters subject to the Code;
|
|
(2)
|
Cooperate with the Trust in investigating any investment transactions or other matter subject to the Code;
|
|
(3)
|
Provide the Trust with an explanation (in writing if requested) of the facts and circumstances surrounding any investment transaction or other matter subject to the Code; and
|
|
(B)
|
Independent Trustee Reporting. An Independent Trustee need not provide the account opening, holdings or transaction reports required by this Section 4, except that an Independent Trustee must report a transaction if the Independent Trustee knew at the time of the transaction, or in the ordinary course of fulfilling the official duties as an Independent Trustee should have known:
|
|
(1)
|
That during the 15-day period immediately preceding or immediately following the transaction in a Covered Investment by the Independent Trustee, the Covered Investment is or was purchased or sold or was being considered for purchase or sale by a Fund or that Fund's Adviser, or
|
|
(2)
|
The Independent Trustee possessed material non-public information about the operating activities of a Fund or the Trust preceding a transaction in Shares of the Fund.
|
|
(C)
|
Exclusions from Reporting. Purchases or sales of Covered Investments in an account over which an Access Person has no direct or indirect influence or control are not subject to the reporting requirements of this Section.
|
|
(D)
|
Initial Holding Reports. No later than ten (10) days after the person becomes an Access Person, an Access Person must report the following information:
|
|
(1)
|
The title, number of shares and principal amount of each Covered Investment in which the Access Person had any direct or indirect beneficial ownership when the person became an Access Person;
|
|
(2)
|
The name of any broker, dealer or bank with whom the Access Person maintained an account in which any securities were held for the direct or indirect benefit of the Access Person as of the date the person became an Access Person; and
|
|
(3)
|
The date that the report is submitted by the Access Person.
|
|
(E)
|
Quarterly Transaction Reports. No later than ten (10) days after the end of a calendar quarter, an Access Person must report the following information:
|
|
(1)
|
With respect to any transaction during the quarter in a Covered Investment in which the Access Person had, or by reason of such transaction acquired, any direct or indirect beneficial ownership:
|
|
(a)
|
The date of the transaction, the title, the interest rate and maturity date (if applicable), the number of shares and the principal amount of each Covered Investment involved;
|
|
(b)
|
The nature of the transaction (i.e., purchase, sale or any other type of acquisition or disposition);
|
|
(c)
|
The price of the Covered Investment at which the transaction was effected; the name of the broker, dealer or bank with or through which the transaction was effected; and
|
|
(d)
|
The date that the report is submitted by the Access Person.
|
|
(2)
|
With respect to any account established by the Access Person in which any investment were held during the quarter for the direct or indirect benefit of the Access Person:
|
|
(a)
|
The name of the broker, dealer or bank with whom the Access Person established the account;
|
|
(b)
|
The date the account was established; and
|
|
(c)
|
The date that the report is submitted by the Access Person.
|
|
(F)
|
Annual Holdings Reports. Annually, an Access Person must report the following information (which information must be current as of a date no more than thirty (30) days before the report is submitted):
|
|
(1)
|
The title, number of shares and principal amount of each Covered Investment in which the Access Person had any direct or indirect beneficial ownership;
|
|
(2)
|
The name of any broker, dealer or bank with whom the Access Person maintains an account in which any securities are held for the direct or indirect benefit of the Access Person; and
|
|
(3)
|
The date that the report is submitted by the Access Person.
|
|
(G)
|
Certification of Compliance. Upon becoming an Access Person, the person shall certify (in the form of Appendix A) that the Access Person has read and understood this Code and recognizes that the Access Person is subject to this Code. Further, each Access Person is required to certify annually that the Access Person has complied with all the requirements of this Code and that the Access Person has disclosed or reported all personal investment transactions pursuant to the requirements of this Code.
|
|
(H)
|
Alternative Reporting. The submission to the Review Officer of duplicate broker trade confirmations and statements on all Covered Investments transactions shall be deemed to satisfy these reporting requirements. The annual holdings report may be satisfied by confirming annually, in writing, the accuracy of the records maintained by the Review Officer and recording the date of the confirmation.
|
|
(I)
|
Report Qualification. Any report may contain a statement that the report shall not be construed as an admission by the person making the report that the person has any direct or indirect beneficial ownership in the Covered Investments to which the report relates.
|
|
(A)
|
Conflicts of Interest. A "conflict of interest" occurs when a Covered Officer's employment or personal interest interferes with the interests of, or service to, the Trust. For example, a conflict of interest would arise if a Covered Officer receives improper personal benefits as a result of the Covered Officer's position with the Trust. A Covered Officer may be an officer or employee of a Service Provider, another investment company or another company. Conflicts may arise from, or as a result of, the contractual relationship between the Trust and its Service Providers or otherwise due to the Covered Officers' positions, but such other positions of a Covered Officer do not by itself give rise to a conflict of interest. As applicable to a Covered Officer, the following must be approved by the Audit Committee:
|
|
(1)
|
Service on the board of directors or governing board of a publicly traded entity;
|
|
(2)
|
The receipt of any non-nominal gifts from persons or entities who have or are seeking business relationships with the Trust or a Fund;
|
|
(3)
|
The receipt of any entertainment from any company with which the Trust has current or prospective business dealings unless such entertainment is business-related, reasonable in cost, appropriate as to time and place, and not so frequent as to raise any question of impropriety;
|
|
(4)
|
Any ownership interest (material to the officer) in, or any consulting or employment relationship with, any entities doing business with the Trust, other than its service providers and their respective Affiliated Persons; and
|
|
(5)
|
Any direct or indirect financial interest in commissions, transaction charges or spreads paid by the Trust for effecting portfolio transactions or for selling or redeeming shares other than an interest arising from the Covered Officer's employment with the Trust's service providers or their respective Affiliated Persons.
|
|
(B)
|
Duties. A Covered Officer shall:
|
|
(1)
|
Become familiar with the disclosure requirements generally applicable to the Trust;
|
|
(2)
|
Not knowingly misrepresent, or cause others to misrepresent, facts about the Trust to others;
|
|
(3)
|
To the extent appropriate, consult with other Officers and employees of the Trust and its service providers;
|
|
(4)
|
Promote compliance with the standards and restrictions imposed by applicable laws; and
|
|
(5)
|
Not retaliate against any other Covered Officer or any employee of the Fund or its Service Providers for reporting potential violations of by the Fund, its Service Providers, or another Covered Officer that are made in good faith.
|
|
(C)
|
A Covered Officer shall notify the Chairman of the Audit Committee promptly if the officer knows of any violation of this Code.
|
|
(A)
|
Appointment. A Review Officer shall be appointed by the PEO.
|
|
(B)
|
Duties of Review Officer. The Review Officer shall :
|
|
(1)
|
Review all investment transaction and holdings reports or shall maintain the names of persons responsible for reviewing these reports;
|
|
(2)
|
Identify all Access Persons who are required to make these reports, maintain and periodically update a list of such Access Persons, and promptly inform each Access Person of the requirements of this Code;
|
|
(3)
|
Compare, on a quarterly basis, all Access Persons' transactions in Covered Investments with each Fund's completed portfolio transactions and in the case of transactions in Shares, with operating activities of the Fund, to determine whether a Code violation may have occurred;
|
|
(4)
|
Maintain a signed acknowledgment by each person who is then an Access Person;
|
|
(5)
|
Identify persons who are Investment Personnel, maintain and periodically update a list of such Investment Personnel, and inform those persons of their requirements to obtain prior written approval from the Review Officer prior to directly or indirectly acquiring ownership of a security in any private placement or initial public offering; and
|
|
(6)
|
Annually prepare a written report to the Trustees that
|
|
(a)
|
Describes any issues under this Code since the last report to the Trustees, including information about material violations of the Code and sanctions imposed in response to the material violations; and
|
|
(b)
|
Confirm that the Trust has adopted procedures reasonably necessary to prevent Access Persons from violating this Code.
|
|
(C)
|
Potential Trade Conflict. When there appears to be a transaction that conflicts with this Code, the Review Officer shall request a written explanation of the Access Person's transaction. If after the review it is determined that there has been a violation of this Code, the Review Officer shall make a recommendation of appropriate action to the Board.
|
|
(D)
|
Required Records. The Review Officer shall maintain:
|
|
(1)
|
A copy of this and any other code of ethics adopted by the Trust, Adviser or Affiliated Distributor, which has been in effect at any time during the previous five (5) years, in an easily accessible place;
|
|
(2)
|
A record of any violation of this Code, and of any action taken as a result of such violation, in an easily accessible place for at least five (5) years after the end of the fiscal year in which the violation occurs;
|
|
(3)
|
A copy of each report made by an Access Person as required by this Code for at least five (5) years after the end of the fiscal year in which the report is made, the first two (2) years in an easily accessible place;
|
|
(4)
|
A list of all persons who are, or at any time within the past five years have been, required to make reports or who were responsible for reviewing these reports pursuant to any code of ethics, in an easily accessible place;
|
|
(5)
|
A copy of each written report and certification required pursuant to Section 7(D) of this Code for at least five (5) years after the end of the fiscal year in which it is made, the first two (2) years in an easily accessible place; and
|
|
(6)
|
A record of any decision, and the reasons supporting the decision, approving the acquisition by Investment Personnel of securities under Section 6(B)(5) of this Code, for at least five (5) years after the end of the fiscal year in which the approval is granted.
|
|
(A)
|
Approve the (i) Code and any material changes to the Code and (ii) before initially retaining their services, the code of ethics of each Adviser and Affiliated Distributor, and any material changes to these codes within six months of the change;
|
|
(B)
|
Base its approval of a code of ethics, and any material changes thereto, on a determination that the code contains provisions reasonably necessary to prevent Access Persons (or the equivalent persons) from engaging in prohibited conduct;
|
|
(C)
|
Receive, prior to approving a code or any amendment to a code, a certification from the Trust, Adviser or Affiliated Distributor that it has adopted procedures reasonably necessary to prevent Access Persons (or the equivalent persons) from violating the Code; and
|
|
(D)
|
Receive and consider, no less frequently than annually: (i) a written report from the Trust, Adviser and Affiliated Distributor, as applicable, describing any issues, material violations or sanctions arising under the respective codes; and (ii) a written certification from the Trust, Adviser and Affiliated Distributor, as applicable, that it has adopted procedures reasonably necessary to prevent Access Persons (or the equivalent persons) from violating its code.
|
|
Date:
|
August 27, 2018
|
/s/ Jessica Chase
|
||
|
Jessica Chase
|
||||
|
Principal Executive Officer
|
|
Date:
|
August 27, 2018
|
/s/ Karen Shaw
|
||
|
Karen Shaw
|
||||
|
Principal Financial Officer
|
|
1.
|
The Report containing the financial statements fully complies with the requirements of section 13(a) or 15(d) of the Securities Exchange Act of 1934; and
|
|
2.
|
The information contained in the Report fairly presents, in all material respects, the financial condition and results of operations of the Trust as of, and for, the periods presented in the Report.
|
|
Dated:
|
August 27, 2018
|
|
|
/s/ Jessica Chase
|
||
|
Jessica Chase
|
||
|
Principal Executive Officer
|
|
Dated:
|
August 27, 2018
|
|
|
/s/ Karen Shaw
|
||
|
Karen Shaw
|
||
|
Principal Financial Officer
|
Serious News for Serious Traders! Try StreetInsider.com Premium Free!
You May Also Be Interested In
- Krystal Biotech to Report First Quarter 2024 Financial Results on May 6, 2024
- Vinhomes, Vietnam largest property developer, unveils a series of new entertainment and shopping destinations
- Benevity’s 2024 Corporate Goodness Awards Celebrate Groundbreakers in Social Impact
Create E-mail Alert Related Categories
SEC FilingsSign up for StreetInsider Free!
Receive full access to all new and archived articles, unlimited portfolio tracking, e-mail alerts, custom newswires and RSS feeds - and more!
