



Form N-CSR FIDELITY SALEM STREET For: Apr 30
 Tweet
Tweet Share
Share E-mail
UNITED STATES
SECURITIES AND EXCHANGE COMMISSION
Washington, D.C. 20549
FORM N-CSR
CERTIFIED SHAREHOLDER REPORT OF REGISTERED
MANAGEMENT INVESTMENT COMPANIES
Investment Company Act file number 811-02105
Fidelity Salem Street Trust
(Exact name of registrant as specified in charter)
245 Summer St., Boston, Massachusetts 02210
(Address of principal executive offices) (Zip code)
Cynthia Lo Bessette, Secretary
245 Summer St.
Boston, Massachusetts 02210
(Name and address of agent for service)
Registrant's telephone number, including area code:
617-563-7000
Date of fiscal year end: | April 30 |
Date of reporting period: | April 30, 2022 |
This report on Form N-CSR relates solely to the Registrant’s Fidelity Flex Mid Cap Index Fund, Fidelity Flex Small Cap Index Fund, Fidelity Large Cap Growth Index Fund, Fidelity Large Cap Value Index Fund, and Fidelity Series Large Cap Growth Index Fund series (each, a “Fund” and collectively, the “Funds”).
Item 1.
Reports to Stockholders
Fidelity Flex® Funds
Fidelity Flex® Mid Cap Index Fund
April 30, 2022


Contents
To view a fund's proxy voting guidelines and proxy voting record for the 12-month period ended June 30, visit http://www.fidelity.com/proxyvotingresults or visit the Securities and Exchange Commission's (SEC) web site at http://www.sec.gov.
You may also call 1-800-544-3455 (for managed account clients) or 1-800-835-5092 (for retirement plan participants) to request a free copy of the proxy voting guidelines.
The fund is not in any way connected to or sponsored, endorsed, sold or promoted by the London Stock Exchange Group plc and its group undertakings (collectively, the “LSE Group”). The LSE Group does not accept any liability whatsoever to any person arising out of the use of the fund or the underlying data.
Standard & Poor's, S&P and S&P 500 are registered service marks of The McGraw-Hill Companies, Inc. and have been licensed for use by Fidelity Distributors Corporation.
Other third-party marks appearing herein are the property of their respective owners.
All other marks appearing herein are registered or unregistered trademarks or service marks of FMR LLC or an affiliated company. © 2022 FMR LLC. All rights reserved.
This report and the financial statements contained herein are submitted for the general information of the shareholders of the Fund. This report is not authorized for distribution to prospective investors in the Fund unless preceded or accompanied by an effective prospectus.
A fund files its complete schedule of portfolio holdings with the SEC for the first and third quarters of each fiscal year on Form N-PORT. Forms N-PORT are available on the SEC’s web site at http://www.sec.gov. A fund's Forms N-PORT may be reviewed and copied at the SEC’s Public Reference Room in Washington, DC. Information regarding the operation of the SEC's Public Reference Room may be obtained by calling 1-800-SEC-0330.
For a complete list of a fund's portfolio holdings, view the most recent holdings listing, semiannual report, or annual report on Fidelity's web site at http://www.fidelity.com, http://www.institutional.fidelity.com, or http://www.401k.com, as applicable.
NOT FDIC INSURED •MAY LOSE VALUE •NO BANK GUARANTEE
Neither the Fund nor Fidelity Distributors Corporation is a bank.
Note to Shareholders:
Early in 2020, the outbreak and spread of COVID-19 emerged as a public health emergency that had a major influence on financial markets, primarily based on its impact on the global economy and corporate earnings. On March 11, 2020, the World Health Organization declared the COVID-19 outbreak a pandemic, citing sustained risk of further global spread. The pandemic prompted a number of measures to limit the spread of COVID-19, including travel and border restrictions, quarantines, and restrictions on large gatherings. In turn, these resulted in lower consumer activity, diminished demand for a wide range of products and services, disruption in manufacturing and supply chains, and – given the wide variability in outcomes regarding the outbreak – significant market uncertainty and volatility. To help stem the turmoil, the U.S. government took unprecedented action – in concert with the U.S. Federal Reserve and central banks around the world – to help support consumers, businesses, and the broader economy, and to limit disruption to the financial system.
In general, the overall impact of the pandemic lessened in 2021, amid a resilient economy and widespread distribution of three COVID-19 vaccines granted emergency use authorization from the U.S. Food and Drug Administration (FDA) early in the year. Still, the situation remains dynamic, and the extent and duration of its influence on financial markets and the economy is highly uncertain, due in part to a recent spike in cases based on highly contagious variants of the coronavirus.
Extreme events such as the COVID-19 crisis are exogenous shocks that can have significant adverse effects on mutual funds and their investments. Although multiple asset classes may be affected by market disruption, the duration and impact may not be the same for all types of assets. Fidelity is committed to helping you stay informed amid news about COVID-19 and during increased market volatility, and we continue to take extra steps to be responsive to customer needs. We encourage you to visit us online, where we offer ongoing updates, commentary, and analysis on the markets and our funds.
Performance: The Bottom Line
Average annual total return reflects the change in the value of an investment, assuming reinvestment of distributions from dividend income and capital gains (the profits earned upon the sale of securities that have grown in value, if any) and assuming a constant rate of performance each year. The hypothetical investment and the average annual total returns do not reflect the deduction of taxes that a shareholder would pay on fund distributions or the redemption of fund shares. During periods of reimbursement by Fidelity, a fund’s total return will be greater than it would be had the reimbursement not occurred. How a fund did yesterday is no guarantee of how it will do tomorrow.
Average Annual Total Returns
| For the periods ended April 30, 2022 | Past 1 year | Past 5 years | Life of fundA |
| Fidelity Flex® Mid Cap Index Fund | (6.09)% | 10.72% | 10.80% |
A From March 9, 2017
$10,000 Over Life of Fund
Let's say hypothetically that $10,000 was invested in Fidelity Flex® Mid Cap Index Fund on March 9, 2017, when the fund started.
The chart shows how the value of your investment would have changed, and also shows how the Russell Midcap® Index performed over the same period.
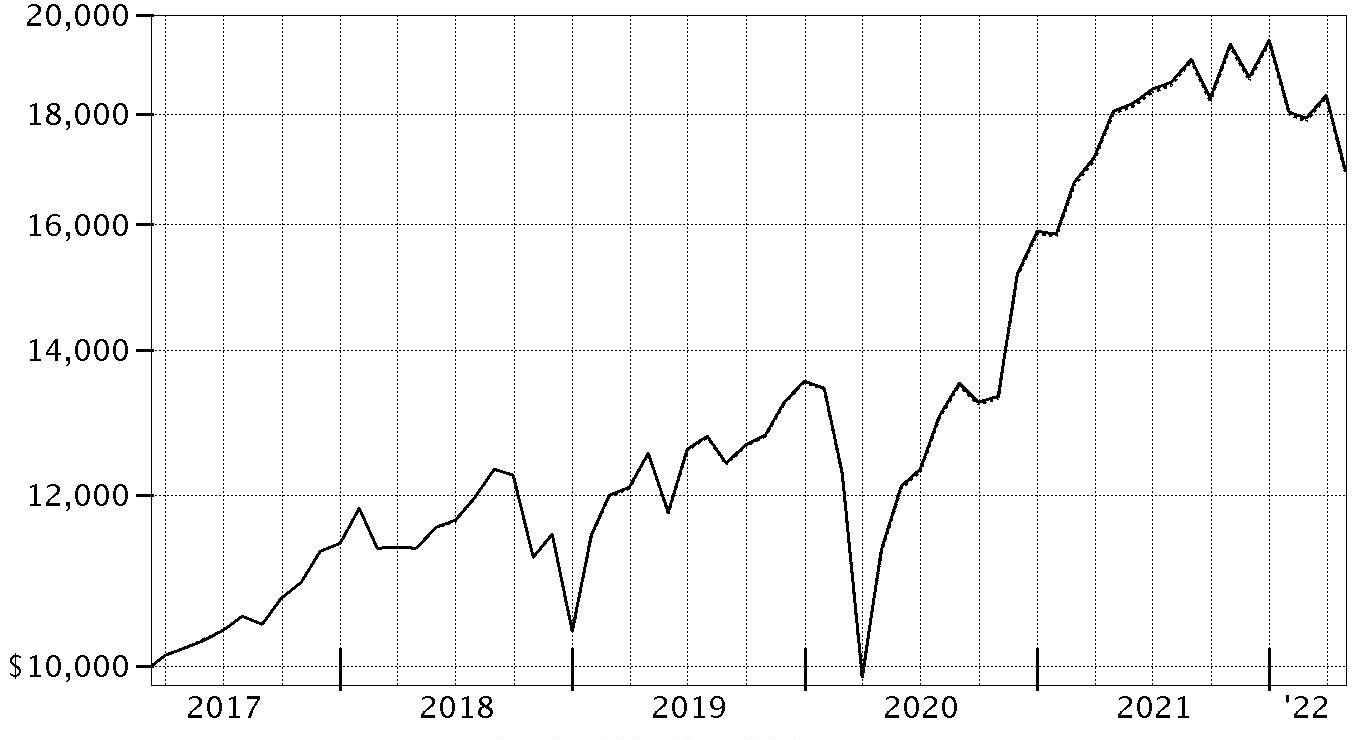
| Period Ending Values | ||
|
| $16,954 | Fidelity Flex® Mid Cap Index Fund |
|
| $16,913 | Russell Midcap® Index |
Management's Discussion of Fund Performance
Market Recap: The S&P 500® index gained 0.21% for the 12 months ending April 30, 2022. After posting a strong result in 2021, large-cap stocks retreated to begin the new year amid several notable headwinds that stoked volatility, uncertainty and investor anxiety. Chief among these was the U.S. Federal Reserve’s accelerated plan to hike interest rates and aggressively wind down its balance sheet in an attempt to rein in historically high inflation. In addition, geopolitical unrest rose as Russia invaded Ukraine in late February and escalated its attack through period end. Other factors influencing stocks included surging commodity prices, rising bond yields, supply constraint and disruption, and the potential for variants of the coronavirus to upend the economy. Against this backdrop, the S&P 500® index returned -5.17% in January and -2.99% in February, falling on mixed corporate earnings, particularly among some highflying tech firms. Volatility eased in March and the index gained 3.71% for the month. April saw a sharp reversal, with the index returning -8.72% amid clearer signals of the Fed’s intension to tighten monetary policy and angst about the economic toll of “zero-COVID” lockdowns in China. It was the largest monthly decline for the S&P 500® since March 2020. For the full 12 months, the growth-oriented communication services (-22%) and consumer discretionary (-11%) sectors lagged most. In contrast, energy (+61%) rode a surge in commodity prices and led the market by a wide margin, followed by the defensive consumer staples (+17%) sector. Comments from the Geode Capital Management, LLC, passive equity index team: For the fiscal year ending April 30, 2022, the fund returned -6.09%, roughly in line with the -6.10% result of the benchmark Russell MidCap® Index. By sector, stocks in the consumer discretionary sector returned -19% and detracted most. Information technology (-11%) and communication services (-36%) also hurt, the latter hampered by the media & entertainment industry (-37%). Other notable detractors included the industrials (-11%), health care (-14%), and financials (-5%) sectors. In contrast, energy advanced 65% and contributed most. Real estate stocks also helped, gaining 7%. The materials sector rose roughly 8%. Other notable contributors included the utilities (+9%) and consumer staples (+8%) sectors. Turning to individual stocks, the biggest individual detractor was Roku (-73%), from the media & entertainment category. In software & services, DocuSign (-64%) and Palantir Technologies (-61%) hurt. Pinterest, within the media & entertainment group, returned about -69% and hindered the fund. Another detractor was Peloton Interactive (-82%), a stock in the consumer durables & apparel industry. In contrast, the biggest individual contributor was Occidental Petroleum (+118%), from the energy sector. Also in energy, Devon Energy (+166%) and Marathon Petroleum (+63%) helped. Nucor, within the materials sector, advanced roughly 92% and lifted the fund. Another contributor was Palo Alto Networks (+59%), a stock in the software & services segment.The views expressed above reflect those of the portfolio manager(s) only through the end of the period as stated on the cover of this report and do not necessarily represent the views of Fidelity or any other person in the Fidelity organization. Any such views are subject to change at any time based upon market or other conditions and Fidelity disclaims any responsibility to update such views. These views may not be relied on as investment advice and, because investment decisions for a Fidelity fund are based on numerous factors, may not be relied on as an indication of trading intent on behalf of any Fidelity fund.
Investment Summary (Unaudited)
Top Ten Stocks as of April 30, 2022
| % of fund's net assets | |
| Palo Alto Networks, Inc. | 0.5 |
| Marathon Petroleum Corp. | 0.5 |
| Pioneer Natural Resources Co. | 0.5 |
| Archer Daniels Midland Co. | 0.5 |
| Marvell Technology, Inc. | 0.5 |
| Occidental Petroleum Corp. | 0.5 |
| McKesson Corp. | 0.5 |
| Valero Energy Corp. | 0.5 |
| Synopsys, Inc. | 0.4 |
| Hilton Worldwide Holdings, Inc. | 0.4 |
| 4.8 |
Market Sectors as of April 30, 2022
| % of fund's net assets | |
| Information Technology | 16.9 |
| Industrials | 14.5 |
| Financials | 12.4 |
| Consumer Discretionary | 11.4 |
| Health Care | 10.5 |
| Real Estate | 8.8 |
| Materials | 6.3 |
| Energy | 6.0 |
| Utilities | 5.5 |
| Consumer Staples | 4.1 |
| Communication Services | 3.5 |
Asset Allocation (% of fund's net assets)
| As of April 30, 2022* | ||
| Stocks and Equity Futures | 100.0% | |

* Foreign investments - 4.6%
Schedule of Investments April 30, 2022
Showing Percentage of Net Assets
| Common Stocks - 99.9% | |||
| Shares | Value | ||
| COMMUNICATION SERVICES - 3.5% | |||
| Diversified Telecommunication Services - 0.1% | |||
| Lumen Technologies, Inc. (a) | 26,086 | $262,425 | |
| Entertainment - 1.1% | |||
| Live Nation Entertainment, Inc. (b) | 3,449 | 361,731 | |
| Madison Square Garden Sports Corp. (b) | 472 | 76,516 | |
| Playtika Holding Corp. (b) | 2,692 | 47,325 | |
| Roku, Inc. Class A (b) | 2,942 | 273,312 | |
| Skillz, Inc. (a)(b) | 11,383 | 23,335 | |
| Spotify Technology SA (b) | 2,935 | 298,343 | |
| Take-Two Interactive Software, Inc. (b) | 2,889 | 345,264 | |
| Warner Bros Discovery, Inc. (b) | 55,875 | 1,014,131 | |
| World Wrestling Entertainment, Inc. Class A | 1,076 | 62,828 | |
| Zynga, Inc. (b) | 25,903 | 214,218 | |
| 2,717,003 | |||
| Interactive Media & Services - 0.8% | |||
| IAC (b) | 2,087 | 172,971 | |
| Match Group, Inc. (b) | 7,076 | 560,065 | |
| Pinterest, Inc. Class A (b) | 11,032 | 226,377 | |
| TripAdvisor, Inc. (b) | 2,688 | 69,001 | |
| Twitter, Inc. (b) | 19,840 | 972,557 | |
| Vimeo, Inc. (b) | 4,383 | 44,663 | |
| 2,045,634 | |||
| Media - 1.5% | |||
| Altice U.S.A., Inc. Class A (b) | 5,821 | 54,019 | |
| Cable One, Inc. | 135 | 157,437 | |
| DISH Network Corp. Class A (b) | 6,339 | 180,725 | |
| Fox Corp.: | |||
| Class A | 7,775 | 278,656 | |
| Class B | 3,751 | 124,683 | |
| Interpublic Group of Companies, Inc. | 9,830 | 320,655 | |
| Liberty Broadband Corp.: | |||
| Class A (b) | 592 | 63,735 | |
| Class C (b) | 3,533 | 395,060 | |
| Liberty Media Corp.: | |||
| Liberty Formula One Group Series C (b) | 4,901 | 305,479 | |
| Liberty Media Class A (b) | 669 | 38,414 | |
| Liberty SiriusXM Series A (b) | 2,321 | 97,087 | |
| Liberty SiriusXM Series C (b) | 4,009 | 167,897 | |
| Loyalty Ventures, Inc. (b) | 638 | 8,160 | |
| News Corp.: | |||
| Class A | 9,700 | 192,642 | |
| Class B | 3,316 | 66,022 | |
| Nexstar Broadcasting Group, Inc. Class A | 984 | 155,885 | |
| Omnicom Group, Inc. (a) | 5,184 | 394,658 | |
| Paramount Global: | |||
| Class A | 620 | 19,561 | |
| Class B (a) | 14,393 | 419,124 | |
| Sirius XM Holdings, Inc. (a) | 21,704 | 130,224 | |
| The New York Times Co. Class A | 4,124 | 158,032 | |
| 3,728,155 | |||
| TOTAL COMMUNICATION SERVICES | 8,753,217 | ||
| CONSUMER DISCRETIONARY - 11.4% | |||
| Auto Components - 0.5% | |||
| Aptiv PLC (b) | 6,759 | 719,158 | |
| BorgWarner, Inc. | 5,997 | 220,870 | |
| Gentex Corp. | 5,941 | 174,368 | |
| Lear Corp. | 1,503 | 192,294 | |
| QuantumScape Corp. Class A (a)(b) | 6,413 | 95,810 | |
| 1,402,500 | |||
| Automobiles - 0.1% | |||
| Harley-Davidson, Inc. | 3,826 | 139,458 | |
| Thor Industries, Inc. | 1,360 | 104,108 | |
| 243,566 | |||
| Distributors - 0.5% | |||
| Genuine Parts Co. | 3,486 | 453,354 | |
| LKQ Corp. | 6,809 | 337,931 | |
| Pool Corp. | 976 | 395,495 | |
| 1,186,780 | |||
| Diversified Consumer Services - 0.4% | |||
| ADT, Inc. | 3,953 | 27,078 | |
| Bright Horizons Family Solutions, Inc. (b) | 1,503 | 171,703 | |
| Chegg, Inc. (b) | 3,402 | 84,165 | |
| Frontdoor, Inc. (b) | 2,111 | 65,251 | |
| Grand Canyon Education, Inc. (b) | 994 | 95,394 | |
| H&R Block, Inc. | 4,112 | 107,200 | |
| Mister Car Wash, Inc. | 1,924 | 27,706 | |
| Service Corp. International | 4,019 | 263,687 | |
| Terminix Global Holdings, Inc. (b) | 3,033 | 139,184 | |
| 981,368 | |||
| Hotels, Restaurants & Leisure - 3.5% | |||
| ARAMARK Holdings Corp. | 5,794 | 210,033 | |
| Boyd Gaming Corp. | 2,048 | 124,068 | |
| Caesars Entertainment, Inc. (b) | 5,240 | 347,307 | |
| Carnival Corp. (a)(b) | 22,165 | 383,455 | |
| Chipotle Mexican Grill, Inc. (b) | 702 | 1,021,838 | |
| Choice Hotels International, Inc. | 872 | 122,481 | |
| Churchill Downs, Inc. | 921 | 186,908 | |
| Darden Restaurants, Inc. | 3,181 | 419,033 | |
| Domino's Pizza, Inc. | 908 | 306,904 | |
| DraftKings, Inc. Class A (b) | 7,694 | 105,254 | |
| Expedia, Inc. (b) | 3,632 | 634,692 | |
| Hilton Worldwide Holdings, Inc. | 6,861 | 1,065,445 | |
| Hyatt Hotels Corp. Class A (b) | 1,236 | 117,371 | |
| Marriott Vacations Worldwide Corp. | 1,042 | 155,602 | |
| MGM Resorts International | 9,455 | 388,033 | |
| Norwegian Cruise Line Holdings Ltd. (b) | 9,695 | 194,191 | |
| Penn National Gaming, Inc. (b) | 2,917 | 106,675 | |
| Planet Fitness, Inc. (b) | 2,081 | 166,542 | |
| Royal Caribbean Cruises Ltd. (a)(b) | 5,510 | 428,292 | |
| Six Flags Entertainment Corp. (b) | 1,926 | 73,708 | |
| Travel+Leisure Co. | 2,117 | 117,451 | |
| Vail Resorts, Inc. | 998 | 253,652 | |
| Wendy's Co. | 4,448 | 87,892 | |
| Wyndham Hotels & Resorts, Inc. | 2,293 | 201,692 | |
| Wynn Resorts Ltd. (b) | 2,643 | 186,279 | |
| Yum China Holdings, Inc. (a) | 10,766 | 450,019 | |
| Yum! Brands, Inc. | 7,245 | 847,737 | |
| 8,702,554 | |||
| Household Durables - 1.3% | |||
| D.R. Horton, Inc. | 8,231 | 572,795 | |
| Garmin Ltd. | 3,788 | 415,695 | |
| Leggett & Platt, Inc. | 3,345 | 119,182 | |
| Lennar Corp.: | |||
| Class A | 6,468 | 494,737 | |
| Class B | 365 | 23,798 | |
| Mohawk Industries, Inc. (b) | 1,374 | 193,816 | |
| Newell Brands, Inc. | 9,506 | 220,064 | |
| NVR, Inc. (b) | 78 | 341,344 | |
| PulteGroup, Inc. | 6,223 | 259,872 | |
| Tempur Sealy International, Inc. | 4,450 | 120,640 | |
| Toll Brothers, Inc. | 2,731 | 126,636 | |
| TopBuild Corp. (b) | 829 | 150,165 | |
| Whirlpool Corp. (a) | 1,435 | 260,481 | |
| 3,299,225 | |||
| Internet & Direct Marketing Retail - 0.3% | |||
| Doordash, Inc. (b) | 3,360 | 273,605 | |
| Etsy, Inc. (b) | 3,295 | 307,061 | |
| Qurate Retail, Inc. Series A | 10,910 | 45,931 | |
| Wayfair LLC Class A (a)(b) | 1,903 | 146,417 | |
| 773,014 | |||
| Leisure Products - 0.4% | |||
| Brunswick Corp. | 2,030 | 153,488 | |
| Hasbro, Inc. | 3,196 | 281,440 | |
| Mattel, Inc. (b) | 8,740 | 212,469 | |
| Peloton Interactive, Inc. Class A (b) | 4,730 | 83,059 | |
| Polaris, Inc. | 1,482 | 140,701 | |
| YETI Holdings, Inc. (b) | 2,376 | 116,115 | |
| 987,272 | |||
| Multiline Retail - 0.5% | |||
| Dollar Tree, Inc. (b) | 5,575 | 905,659 | |
| Kohl's Corp. | 3,468 | 200,728 | |
| Nordstrom, Inc. | 2,842 | 73,039 | |
| Ollie's Bargain Outlet Holdings, Inc. (b) | 1,650 | 79,283 | |
| 1,258,709 | |||
| Specialty Retail - 2.8% | |||
| Advance Auto Parts, Inc. | 1,559 | 311,223 | |
| AutoNation, Inc. (b) | 1,033 | 119,735 | |
| AutoZone, Inc. (b) | 516 | 1,009,023 | |
| Bath & Body Works, Inc. | 5,940 | 314,167 | |
| Best Buy Co., Inc. (a) | 6,024 | 541,738 | |
| Burlington Stores, Inc. (b) | 1,673 | 340,556 | |
| CarMax, Inc. (a)(b) | 4,080 | 349,982 | |
| Carvana Co. Class A (b) | 2,181 | 126,411 | |
| Dick's Sporting Goods, Inc. | 1,507 | 145,305 | |
| Five Below, Inc. (b) | 1,380 | 216,798 | |
| Floor & Decor Holdings, Inc. Class A (b) | 2,571 | 204,960 | |
| Foot Locker, Inc. | 2,384 | 69,875 | |
| GameStop Corp. Class A (a)(b) | 1,621 | 202,738 | |
| Gap, Inc. | 5,486 | 68,136 | |
| Leslie's, Inc. (b) | 3,952 | 77,459 | |
| Lithia Motors, Inc. Class A (sub. vtg.) | 736 | 208,384 | |
| O'Reilly Automotive, Inc. (b) | 1,668 | 1,011,725 | |
| Penske Automotive Group, Inc. | 776 | 81,340 | |
| Petco Health & Wellness Co., Inc. (a)(b) | 1,389 | 26,752 | |
| RH (b) | 438 | 147,221 | |
| Tractor Supply Co. | 2,844 | 572,924 | |
| Ulta Beauty, Inc. (b) | 1,317 | 522,586 | |
| Victoria's Secret & Co. (b) | 1,867 | 87,973 | |
| Vroom, Inc. (b) | 6,814 | 10,630 | |
| Williams-Sonoma, Inc. (a) | 1,833 | 239,170 | |
| 7,006,811 | |||
| Textiles, Apparel & Luxury Goods - 1.1% | |||
| Capri Holdings Ltd. (b) | 3,676 | 175,345 | |
| Carter's, Inc. | 1,036 | 87,273 | |
| Columbia Sportswear Co. | 981 | 80,599 | |
| Deckers Outdoor Corp. (b) | 696 | 184,962 | |
| Hanesbrands, Inc. | 8,793 | 116,595 | |
| lululemon athletica, Inc. (b) | 2,862 | 1,014,951 | |
| PVH Corp. | 1,843 | 134,134 | |
| Ralph Lauren Corp. | 1,180 | 123,121 | |
| Skechers U.S.A., Inc. Class A (sub. vtg.) (b) | 3,342 | 127,999 | |
| Tapestry, Inc. | 6,840 | 225,173 | |
| Under Armour, Inc.: | |||
| Class A (sub. vtg.) (b) | 4,822 | 74,066 | |
| Class C (non-vtg.) (b) | 5,348 | 75,888 | |
| VF Corp. | 6,924 | 360,048 | |
| 2,780,154 | |||
| TOTAL CONSUMER DISCRETIONARY | 28,621,953 | ||
| CONSUMER STAPLES - 4.1% | |||
| Beverages - 0.3% | |||
| Boston Beer Co., Inc. Class A (b) | 258 | 96,750 | |
| Brown-Forman Corp.: | |||
| Class A | 1,137 | 70,972 | |
| Class B (non-vtg.) | 4,593 | 309,752 | |
| Molson Coors Beverage Co. Class B | 4,469 | 241,952 | |
| 719,426 | |||
| Food & Staples Retailing - 0.6% | |||
| Albertsons Companies, Inc. | 4,066 | 127,184 | |
| Casey's General Stores, Inc. | 922 | 185,599 | |
| Grocery Outlet Holding Corp. (b) | 2,180 | 73,401 | |
| Kroger Co. | 18,308 | 987,900 | |
| U.S. Foods Holding Corp. (b) | 5,529 | 208,001 | |
| 1,582,085 | |||
| Food Products - 2.7% | |||
| Archer Daniels Midland Co. | 13,942 | 1,248,646 | |
| Beyond Meat, Inc. (a)(b) | 1,637 | 60,373 | |
| Bunge Ltd. | 3,440 | 389,133 | |
| Campbell Soup Co. | 4,894 | 231,095 | |
| Conagra Brands, Inc. | 11,724 | 409,519 | |
| Darling Ingredients, Inc. (b) | 4,050 | 297,230 | |
| Flowers Foods, Inc. | 4,712 | 124,962 | |
| Freshpet, Inc. (b) | 1,073 | 100,165 | |
| Hormel Foods Corp. | 7,082 | 371,026 | |
| Ingredion, Inc. | 1,679 | 142,900 | |
| Kellogg Co. | 6,300 | 431,550 | |
| Lamb Weston Holdings, Inc. | 3,654 | 241,529 | |
| McCormick & Co., Inc. (non-vtg.) | 6,248 | 628,361 | |
| Pilgrim's Pride Corp. (b) | 1,181 | 33,481 | |
| Post Holdings, Inc. (b) | 1,433 | 106,601 | |
| Seaboard Corp. | 6 | 25,350 | |
| The Hain Celestial Group, Inc. (b) | 2,207 | 74,023 | |
| The Hershey Co. | 3,664 | 827,221 | |
| The J.M. Smucker Co. | 2,631 | 360,263 | |
| Tyson Foods, Inc. Class A | 7,193 | 670,100 | |
| 6,773,528 | |||
| Household Products - 0.4% | |||
| Church & Dwight Co., Inc. | 6,065 | 591,701 | |
| Reynolds Consumer Products, Inc. | 1,349 | 39,917 | |
| Spectrum Brands Holdings, Inc. | 1,000 | 85,070 | |
| The Clorox Co. | 3,093 | 443,753 | |
| 1,160,441 | |||
| Personal Products - 0.1% | |||
| Coty, Inc. Class A (b) | 8,819 | 71,522 | |
| Herbalife Nutrition Ltd. (b) | 2,550 | 67,779 | |
| Olaplex Holdings, Inc. | 2,287 | 33,619 | |
| 172,920 | |||
| TOTAL CONSUMER STAPLES | 10,408,400 | ||
| ENERGY - 6.0% | |||
| Energy Equipment & Services - 0.6% | |||
| Baker Hughes Co. Class A | 18,460 | 572,629 | |
| Halliburton Co. | 22,191 | 790,443 | |
| NOV, Inc. | 9,797 | 177,620 | |
| 1,540,692 | |||
| Oil, Gas & Consumable Fuels - 5.4% | |||
| Antero Midstream GP LP | 8,317 | 85,416 | |
| APA Corp. | 9,075 | 371,440 | |
| Cheniere Energy, Inc. | 5,867 | 796,797 | |
| Continental Resources, Inc. | 1,630 | 90,579 | |
| Coterra Energy, Inc. | 19,933 | 573,871 | |
| Devon Energy Corp. | 16,874 | 981,561 | |
| Diamondback Energy, Inc. | 4,522 | 570,812 | |
| DT Midstream, Inc. | 2,421 | 130,129 | |
| EQT Corp. | 7,623 | 303,014 | |
| Hess Corp. | 6,945 | 715,821 | |
| HF Sinclair Corp. (b) | 3,740 | 142,195 | |
| Marathon Oil Corp. | 19,395 | 483,323 | |
| Marathon Petroleum Corp. | 15,397 | 1,343,542 | |
| New Fortress Energy, Inc. | 704 | 27,301 | |
| Occidental Petroleum Corp. | 21,158 | 1,165,594 | |
| ONEOK, Inc. | 11,110 | 703,596 | |
| Phillips 66 Co. | 11,741 | 1,018,649 | |
| Pioneer Natural Resources Co. | 5,403 | 1,256,035 | |
| Targa Resources Corp. | 5,642 | 414,179 | |
| Texas Pacific Land Corp. | 149 | 203,623 | |
| The Williams Companies, Inc. | 30,438 | 1,043,719 | |
| Valero Energy Corp. | 10,223 | 1,139,660 | |
| 13,560,856 | |||
| TOTAL ENERGY | 15,101,548 | ||
| FINANCIALS - 12.4% | |||
| Banks - 3.3% | |||
| Bank of Hawaii Corp. | 993 | 73,820 | |
| Bank OZK | 2,972 | 114,184 | |
| BOK Financial Corp. | 754 | 62,529 | |
| Citizens Financial Group, Inc. | 12,395 | 488,363 | |
| Comerica, Inc. | 3,276 | 268,304 | |
| Commerce Bancshares, Inc. | 2,758 | 188,564 | |
| Cullen/Frost Bankers, Inc. | 1,429 | 189,042 | |
| East West Bancorp, Inc. | 3,528 | 251,546 | |
| Fifth Third Bancorp | 17,070 | 640,637 | |
| First Citizens Bancshares, Inc. | 306 | 195,650 | |
| First Hawaiian, Inc. | 3,190 | 75,316 | |
| First Horizon National Corp. | 13,243 | 296,378 | |
| First Republic Bank | 4,460 | 665,521 | |
| FNB Corp., Pennsylvania | 8,564 | 98,657 | |
| Huntington Bancshares, Inc. | 35,958 | 472,848 | |
| KeyCorp | 23,242 | 448,803 | |
| M&T Bank Corp. | 4,469 | 744,714 | |
| PacWest Bancorp | 2,897 | 95,282 | |
| Pinnacle Financial Partners, Inc. | 1,862 | 144,398 | |
| Popular, Inc. | 1,977 | 154,186 | |
| Prosperity Bancshares, Inc. | 2,238 | 146,320 | |
| Regions Financial Corp. | 24,073 | 498,793 | |
| Signature Bank | 1,544 | 374,034 | |
| SVB Financial Group (b) | 1,425 | 694,887 | |
| Synovus Financial Corp. | 3,643 | 151,330 | |
| Umpqua Holdings Corp. | 5,386 | 89,084 | |
| Webster Financial Corp. | 4,457 | 222,805 | |
| Western Alliance Bancorp. | 2,628 | 200,017 | |
| Wintrust Financial Corp. | 1,418 | 123,820 | |
| Zions Bancorp NA | 3,742 | 211,460 | |
| 8,381,292 | |||
| Capital Markets - 3.4% | |||
| Affiliated Managers Group, Inc. | 1,013 | 127,202 | |
| Ameriprise Financial, Inc. | 2,798 | 742,841 | |
| Ares Management Corp. | 3,552 | 235,213 | |
| Carlyle Group LP | 4,111 | 149,188 | |
| Cboe Global Markets, Inc. | 2,661 | 300,640 | |
| Evercore, Inc. Class A | 980 | 103,635 | |
| FactSet Research Systems, Inc. | 948 | 382,509 | |
| Franklin Resources, Inc. | 7,252 | 178,327 | |
| Interactive Brokers Group, Inc. | 2,015 | 120,013 | |
| Invesco Ltd. | 8,622 | 158,472 | |
| Janus Henderson Group PLC | 4,226 | 128,808 | |
| Jefferies Financial Group, Inc. | 5,372 | 165,243 | |
| KKR & Co. LP | 13,957 | 711,388 | |
| Lazard Ltd. Class A | 2,509 | 82,220 | |
| LPL Financial | 1,993 | 374,425 | |
| MarketAxess Holdings, Inc. | 936 | 246,739 | |
| Morningstar, Inc. | 584 | 147,886 | |
| MSCI, Inc. | 1,980 | 834,075 | |
| NASDAQ, Inc. | 2,910 | 457,947 | |
| Northern Trust Corp. | 5,141 | 529,780 | |
| Raymond James Financial, Inc. | 4,620 | 450,265 | |
| SEI Investments Co. | 2,666 | 148,550 | |
| State Street Corp. | 9,141 | 612,173 | |
| Stifel Financial Corp. | 2,551 | 157,779 | |
| T. Rowe Price Group, Inc. | 5,748 | 707,234 | |
| Tradeweb Markets, Inc. Class A | 2,622 | 186,660 | |
| Virtu Financial, Inc. Class A | 2,200 | 63,536 | |
| 8,502,748 | |||
| Consumer Finance - 0.8% | |||
| Ally Financial, Inc. | 8,642 | 345,334 | |
| Credit Acceptance Corp. (b) | 197 | 100,963 | |
| Discover Financial Services | 7,209 | 810,724 | |
| OneMain Holdings, Inc. | 2,740 | 125,848 | |
| SLM Corp. | 6,973 | 116,658 | |
| Synchrony Financial | 13,155 | 484,236 | |
| Upstart Holdings, Inc. (a)(b) | 1,203 | 90,249 | |
| 2,074,012 | |||
| Diversified Financial Services - 0.4% | |||
| Apollo Global Management, Inc. | 9,235 | 459,534 | |
| Equitable Holdings, Inc. | 8,840 | 254,857 | |
| Voya Financial, Inc. | 2,763 | 174,456 | |
| 888,847 | |||
| Insurance - 4.1% | |||
| AFLAC, Inc. | 16,134 | 924,156 | |
| Alleghany Corp. (b) | 332 | 277,718 | |
| American Financial Group, Inc. | 1,699 | 235,278 | |
| Arch Capital Group Ltd. (b) | 9,309 | 425,142 | |
| Arthur J. Gallagher & Co. | 5,125 | 863,511 | |
| Assurant, Inc. | 1,424 | 258,997 | |
| Assured Guaranty Ltd. | 1,678 | 92,542 | |
| Axis Capital Holdings Ltd. | 1,936 | 110,991 | |
| Brighthouse Financial, Inc. (b) | 1,936 | 99,433 | |
| Brown & Brown, Inc. | 5,862 | 363,327 | |
| Cincinnati Financial Corp. | 3,752 | 460,220 | |
| CNA Financial Corp. | 693 | 32,876 | |
| Erie Indemnity Co. Class A | 627 | 100,496 | |
| Everest Re Group Ltd. | 972 | 267,018 | |
| Fidelity National Financial, Inc. | 6,837 | 272,249 | |
| First American Financial Corp. | 2,663 | 155,280 | |
| Globe Life, Inc. | 2,504 | 245,592 | |
| GoHealth, Inc. (b) | 5,269 | 3,937 | |
| Hanover Insurance Group, Inc. | 894 | 131,257 | |
| Hartford Financial Services Group, Inc. | 8,378 | 585,874 | |
| Kemper Corp. | 1,511 | 69,748 | |
| Lemonade, Inc. (a)(b) | 1,356 | 28,286 | |
| Lincoln National Corp. | 4,592 | 276,209 | |
| Loews Corp. | 5,230 | 328,653 | |
| Markel Corp. (b) | 338 | 457,409 | |
| Mercury General Corp. | 672 | 33,889 | |
| Old Republic International Corp. | 7,008 | 154,246 | |
| Primerica, Inc. | 981 | 127,098 | |
| Principal Financial Group, Inc. (a) | 6,460 | 440,184 | |
| Prudential Financial, Inc. | 9,471 | 1,027,698 | |
| Reinsurance Group of America, Inc. | 1,675 | 179,761 | |
| RenaissanceRe Holdings Ltd. | 1,089 | 156,293 | |
| Unum Group | 5,111 | 155,988 | |
| W.R. Berkley Corp. | 5,181 | 344,485 | |
| White Mountains Insurance Group Ltd. | 73 | 76,505 | |
| Willis Towers Watson PLC | 3,108 | 667,785 | |
| 10,430,131 | |||
| Mortgage Real Estate Investment Trusts - 0.3% | |||
| AGNC Investment Corp. | 13,122 | 144,080 | |
| Annaly Capital Management, Inc. | 35,373 | 227,095 | |
| New Residential Investment Corp. | 10,884 | 113,194 | |
| Starwood Property Trust, Inc. | 7,266 | 166,246 | |
| 650,615 | |||
| Thrifts & Mortgage Finance - 0.1% | |||
| MGIC Investment Corp. | 7,989 | 104,336 | |
| New York Community Bancorp, Inc. | 11,315 | 104,551 | |
| Rocket Companies, Inc. (a) | 3,577 | 31,656 | |
| TFS Financial Corp. | 1,268 | 19,007 | |
| UWM Holdings Corp. Class A | 2,953 | 10,956 | |
| 270,506 | |||
| TOTAL FINANCIALS | 31,198,151 | ||
| HEALTH CARE - 10.5% | |||
| Biotechnology - 1.6% | |||
| Alnylam Pharmaceuticals, Inc. (b) | 3,000 | 400,290 | |
| BioMarin Pharmaceutical, Inc. (b) | 4,565 | 371,363 | |
| CureVac NV (a)(b) | 1,483 | 25,344 | |
| Exact Sciences Corp. (a)(b) | 4,321 | 237,871 | |
| Exelixis, Inc. (b) | 7,744 | 173,001 | |
| Horizon Therapeutics PLC (b) | 5,463 | 538,433 | |
| Incyte Corp. (b) | 4,622 | 346,465 | |
| Ionis Pharmaceuticals, Inc. (b) | 3,501 | 128,697 | |
| Iovance Biotherapeutics, Inc. (b) | 3,908 | 59,206 | |
| Mirati Therapeutics, Inc. (b) | 1,045 | 64,571 | |
| Natera, Inc. (b) | 2,091 | 73,436 | |
| Neurocrine Biosciences, Inc. (b) | 2,346 | 211,210 | |
| Novavax, Inc. (a)(b) | 1,885 | 84,957 | |
| Repligen Corp. (b) | 1,408 | 221,394 | |
| Sage Therapeutics, Inc. (b) | 1,400 | 44,128 | |
| Sarepta Therapeutics, Inc. (b) | 2,082 | 150,570 | |
| Seagen, Inc. (b) | 3,376 | 442,290 | |
| Ultragenyx Pharmaceutical, Inc. (b) | 1,650 | 116,639 | |
| United Therapeutics Corp. (b) | 1,107 | 196,559 | |
| 3,886,424 | |||
| Health Care Equipment & Supplies - 2.9% | |||
| Abiomed, Inc. (b) | 1,112 | 318,677 | |
| Dentsply Sirona, Inc. | 5,451 | 217,985 | |
| DexCom, Inc. (b) | 2,414 | 986,312 | |
| Enovis Corp. (b) | 1,165 | 75,574 | |
| Envista Holdings Corp. (b) | 4,029 | 159,629 | |
| Figs, Inc. Class A (b) | 2,051 | 32,119 | |
| Globus Medical, Inc. (b) | 1,957 | 129,593 | |
| Hologic, Inc. (b) | 6,196 | 446,050 | |
| ICU Medical, Inc. (b) | 500 | 106,995 | |
| IDEXX Laboratories, Inc. (b) | 2,120 | 912,618 | |
| Insulet Corp. (b) | 1,667 | 398,396 | |
| Integra LifeSciences Holdings Corp. (b) | 1,803 | 110,271 | |
| Masimo Corp. (b) | 1,248 | 140,987 | |
| Novocure Ltd. (b) | 2,644 | 202,478 | |
| Penumbra, Inc. (b) | 894 | 154,269 | |
| Quidel Corp. (b) | 937 | 94,281 | |
| ResMed, Inc. | 3,604 | 720,692 | |
| STERIS PLC | 2,135 | 478,347 | |
| Tandem Diabetes Care, Inc. (b) | 1,547 | 149,255 | |
| Teleflex, Inc. | 1,169 | 333,890 | |
| The Cooper Companies, Inc. | 1,212 | 437,580 | |
| Zimmer Biomet Holdings, Inc. | 5,226 | 631,040 | |
| Zimvie, Inc. (b) | 507 | 11,408 | |
| 7,248,446 | |||
| Health Care Providers & Services - 2.1% | |||
| Acadia Healthcare Co., Inc. (b) | 2,209 | 149,947 | |
| agilon health, Inc. (b) | 4,339 | 77,104 | |
| Amedisys, Inc. (b) | 831 | 106,077 | |
| AmerisourceBergen Corp. | 3,721 | 562,950 | |
| Cardinal Health, Inc. | 6,939 | 402,809 | |
| Chemed Corp. | 376 | 184,763 | |
| DaVita HealthCare Partners, Inc. (b) | 1,589 | 172,200 | |
| Encompass Health Corp. | 2,443 | 168,152 | |
| Guardant Health, Inc. (b) | 2,318 | 143,021 | |
| Henry Schein, Inc. (b) | 3,471 | 281,498 | |
| Laboratory Corp. of America Holdings | 2,333 | 560,573 | |
| McKesson Corp. | 3,757 | 1,163,205 | |
| Molina Healthcare, Inc. (b) | 1,445 | 452,935 | |
| Oak Street Health, Inc. (b) | 2,660 | 48,119 | |
| Premier, Inc. | 2,958 | 107,109 | |
| Quest Diagnostics, Inc. | 3,050 | 408,212 | |
| Signify Health, Inc. (b) | 1,906 | 26,303 | |
| Universal Health Services, Inc. Class B | 1,780 | 218,103 | |
| 5,233,080 | |||
| Health Care Technology - 0.6% | |||
| Cerner Corp. | 7,321 | 685,538 | |
| Certara, Inc. (b) | 3,184 | 58,426 | |
| Change Healthcare, Inc. (b) | 6,343 | 149,441 | |
| Definitive Healthcare Corp. | 757 | 17,903 | |
| Teladoc Health, Inc. (b) | 841 | 28,392 | |
| Veeva Systems, Inc. Class A (b) | 3,587 | 652,655 | |
| 1,592,355 | |||
| Life Sciences Tools & Services - 2.6% | |||
| 10X Genomics, Inc. (b) | 1,201 | 57,360 | |
| Adaptive Biotechnologies Corp. (b) | 3,933 | 32,447 | |
| Agilent Technologies, Inc. | 7,550 | 900,489 | |
| Avantor, Inc. (b) | 15,134 | 482,472 | |
| Azenta, Inc. | 1,883 | 141,150 | |
| Bio-Rad Laboratories, Inc. Class A (b) | 540 | 276,512 | |
| Bio-Techne Corp. | 989 | 375,513 | |
| Bruker Corp. | 2,597 | 149,302 | |
| Charles River Laboratories International, Inc. (b) | 1,273 | 307,442 | |
| IQVIA Holdings, Inc. (b) | 4,775 | 1,040,902 | |
| Maravai LifeSciences Holdings, Inc. (b) | 2,855 | 87,734 | |
| Mettler-Toledo International, Inc. (b) | 568 | 725,637 | |
| PerkinElmer, Inc. | 3,157 | 462,848 | |
| QIAGEN NV (a)(b) | 5,691 | 258,201 | |
| Sotera Health Co. (b) | 2,504 | 51,032 | |
| Syneos Health, Inc. (b) | 2,572 | 187,987 | |
| Waters Corp. (b) | 1,513 | 458,469 | |
| West Pharmaceutical Services, Inc. | 1,840 | 579,710 | |
| 6,575,207 | |||
| Pharmaceuticals - 0.7% | |||
| Catalent, Inc. (b) | 4,255 | 385,333 | |
| Elanco Animal Health, Inc. (b) | 11,258 | 284,940 | |
| Jazz Pharmaceuticals PLC (b) | 1,502 | 240,650 | |
| Nektar Therapeutics (b) | 5,638 | 23,285 | |
| Organon & Co. | 6,359 | 205,586 | |
| Perrigo Co. PLC | 3,349 | 114,871 | |
| Royalty Pharma PLC | 8,150 | 347,027 | |
| Viatris, Inc. | 25,534 | 263,766 | |
| 1,865,458 | |||
| TOTAL HEALTH CARE | 26,400,970 | ||
| INDUSTRIALS - 14.5% | |||
| Aerospace & Defense - 1.2% | |||
| Axon Enterprise, Inc. (b) | 1,628 | 182,662 | |
| BWX Technologies, Inc. | 2,308 | 119,831 | |
| Curtiss-Wright Corp. | 976 | 139,480 | |
| HEICO Corp. | 1,129 | 159,449 | |
| HEICO Corp. Class A | 1,963 | 228,964 | |
| Hexcel Corp. | 2,089 | 113,558 | |
| Howmet Aerospace, Inc. | 9,514 | 324,618 | |
| Huntington Ingalls Industries, Inc. | 986 | 209,762 | |
| Mercury Systems, Inc. (b) | 1,396 | 77,883 | |
| Spirit AeroSystems Holdings, Inc. Class A | 2,615 | 109,935 | |
| Textron, Inc. | 5,510 | 381,568 | |
| TransDigm Group, Inc. (b) | 1,313 | 780,986 | |
| Virgin Galactic Holdings, Inc. (a)(b) | 5,003 | 37,472 | |
| Woodward, Inc. | 1,544 | 170,581 | |
| 3,036,749 | |||
| Air Freight & Logistics - 0.4% | |||
| C.H. Robinson Worldwide, Inc. (a) | 3,233 | 343,183 | |
| Expeditors International of Washington, Inc. | 4,210 | 417,085 | |
| GXO Logistics, Inc. (b) | 2,430 | 143,832 | |
| 904,100 | |||
| Airlines - 1.0% | |||
| Alaska Air Group, Inc. (b) | 3,090 | 168,065 | |
| American Airlines Group, Inc. (a)(b) | 16,295 | 305,857 | |
| Copa Holdings SA Class A (b) | 786 | 59,241 | |
| Delta Air Lines, Inc. (b) | 16,006 | 688,738 | |
| JetBlue Airways Corp.(b) | 7,919 | 87,188 | |
| Southwest Airlines Co. (b) | 14,798 | 691,363 | |
| United Airlines Holdings, Inc. (b) | 8,194 | 413,797 | |
| 2,414,249 | |||
| Building Products - 1.7% | |||
| A.O. Smith Corp. | 3,234 | 188,963 | |
| Advanced Drain Systems, Inc. | 1,540 | 157,788 | |
| Allegion PLC | 2,246 | 256,583 | |
| Armstrong World Industries, Inc. | 1,197 | 101,338 | |
| Builders FirstSource, Inc. (b) | 4,748 | 292,334 | |
| Carlisle Companies, Inc. | 1,284 | 333,018 | |
| Carrier Global Corp. | 21,429 | 820,088 | |
| Fortune Brands Home & Security, Inc. | 3,390 | 241,538 | |
| Hayward Holdings, Inc. (b) | 1,236 | 19,652 | |
| Lennox International, Inc. | 828 | 176,521 | |
| Masco Corp. | 5,984 | 315,297 | |
| Owens Corning | 2,508 | 228,052 | |
| The AZEK Co., Inc. (b) | 3,064 | 65,079 | |
| Trane Technologies PLC | 5,835 | 816,258 | |
| Trex Co., Inc. (b) | 2,945 | 171,370 | |
| 4,183,879 | |||
| Commercial Services & Supplies - 1.2% | |||
| Cintas Corp. | 2,187 | 868,808 | |
| Clean Harbors, Inc. (b) | 1,268 | 133,051 | |
| Copart, Inc. (b) | 5,234 | 594,844 | |
| Driven Brands Holdings, Inc. (b) | 1,337 | 37,289 | |
| IAA, Inc. (b) | 3,409 | 124,940 | |
| MSA Safety, Inc. | 918 | 110,793 | |
| Republic Services, Inc. | 5,257 | 705,857 | |
| Rollins, Inc. | 5,668 | 190,105 | |
| Stericycle, Inc. (b) | 2,287 | 114,785 | |
| 2,880,472 | |||
| Construction & Engineering - 0.4% | |||
| AECOM | 3,353 | 236,588 | |
| MasTec, Inc. (b) | 1,449 | 104,342 | |
| MDU Resources Group, Inc. | 5,039 | 129,805 | |
| Quanta Services, Inc. | 3,538 | 410,337 | |
| Valmont Industries, Inc. | 522 | 129,879 | |
| 1,010,951 | |||
| Electrical Equipment - 1.3% | |||
| Acuity Brands, Inc. | 865 | 149,195 | |
| AMETEK, Inc. | 5,773 | 728,899 | |
| ChargePoint Holdings, Inc. Class A (a)(b) | 6,097 | 78,895 | |
| Fluence Energy, Inc. | 1,217 | 11,160 | |
| Generac Holdings, Inc. (b) | 1,544 | 338,723 | |
| Hubbell, Inc. Class B | 1,353 | 264,322 | |
| nVent Electric PLC | 4,169 | 140,829 | |
| Plug Power, Inc. (a)(b) | 13,021 | 273,701 | |
| Regal Rexnord Corp. | 1,694 | 215,545 | |
| Rockwell Automation, Inc. | 2,907 | 734,512 | |
| Sensata Technologies, Inc. PLC | 3,899 | 177,054 | |
| Shoals Technologies Group, Inc. (b) | 2,951 | 29,451 | |
| Sunrun, Inc. (b) | 5,065 | 101,199 | |
| Vertiv Holdings Co. | 8,286 | 103,824 | |
| 3,347,309 | |||
| Machinery - 3.5% | |||
| AGCO Corp. | 1,559 | 198,617 | |
| Allison Transmission Holdings, Inc. | 2,588 | 96,895 | |
| Crane Co. | 1,233 | 118,652 | |
| Cummins, Inc. | 3,594 | 679,949 | |
| Donaldson Co., Inc. | 3,085 | 151,288 | |
| Dover Corp. | 3,594 | 479,080 | |
| ESAB Corp. (b) | 1,151 | 54,097 | |
| Flowserve Corp. | 3,244 | 106,111 | |
| Fortive Corp. | 8,184 | 470,580 | |
| Gates Industrial Corp. PLC (b) | 2,391 | 30,485 | |
| Graco, Inc. | 4,198 | 260,360 | |
| IDEX Corp. | 1,900 | 360,658 | |
| Ingersoll Rand, Inc. | 9,853 | 433,138 | |
| ITT, Inc. | 2,160 | 151,675 | |
| Lincoln Electric Holdings, Inc. | 1,440 | 194,011 | |
| Middleby Corp. (b) | 1,377 | 211,907 | |
| Nordson Corp. | 1,451 | 312,966 | |
| Oshkosh Corp. | 1,657 | 153,173 | |
| Otis Worldwide Corp. | 10,658 | 776,329 | |
| PACCAR, Inc. | 8,537 | 708,998 | |
| Parker Hannifin Corp. | 3,222 | 872,582 | |
| Pentair PLC | 4,140 | 210,105 | |
| Snap-On, Inc. | 1,318 | 280,062 | |
| Stanley Black & Decker, Inc. | 4,086 | 490,933 | |
| Timken Co. | 1,614 | 93,031 | |
| Toro Co. | 2,619 | 209,860 | |
| Westinghouse Air Brake Tech Co. | 4,489 | 403,606 | |
| Xylem, Inc. (a) | 4,478 | 360,479 | |
| 8,869,627 | |||
| Marine - 0.0% | |||
| Kirby Corp. (b) | 1,495 | 97,474 | |
| Professional Services - 1.9% | |||
| Booz Allen Hamilton Holding Corp. Class A | 3,281 | 267,828 | |
| CACI International, Inc. Class A (b) | 582 | 154,405 | |
| Clarivate Analytics PLC (b) | 11,970 | 187,690 | |
| CoStar Group, Inc. (b) | 9,822 | 624,876 | |
| Dun & Bradstreet Holdings, Inc. (b) | 4,017 | 63,428 | |
| Equifax, Inc. | 3,033 | 617,276 | |
| FTI Consulting, Inc. (b) | 838 | 132,161 | |
| Jacobs Engineering Group, Inc. | 3,235 | 448,209 | |
| LegalZoom.com, Inc. | 2,588 | 37,138 | |
| Leidos Holdings, Inc. | 3,531 | 365,494 | |
| Manpower, Inc. | 1,356 | 122,311 | |
| Nielsen Holdings PLC | 9,053 | 242,711 | |
| Robert Half International, Inc. | 2,709 | 266,322 | |
| Science Applications International Corp. | 1,423 | 118,436 | |
| TransUnion Holding Co., Inc. | 4,787 | 418,958 | |
| Verisk Analytics, Inc. | 3,975 | 811,099 | |
| 4,878,342 | |||
| Road & Rail - 0.8% | |||
| AMERCO | 224 | 119,948 | |
| J.B. Hunt Transport Services, Inc. | 2,105 | 359,639 | |
| Knight-Swift Transportation Holdings, Inc. Class A | 4,014 | 192,230 | |
| Landstar System, Inc. | 957 | 148,239 | |
| Lyft, Inc. (b) | 7,489 | 244,141 | |
| Old Dominion Freight Lines, Inc. | 2,560 | 717,107 | |
| Ryder System, Inc. | 1,304 | 91,150 | |
| Schneider National, Inc. Class B | 1,278 | 30,199 | |
| TuSimple Holdings, Inc. (b) | 3,589 | 37,218 | |
| XPO Logistics, Inc. (b) | 2,420 | 130,172 | |
| 2,070,043 | |||
| Trading Companies & Distributors - 1.1% | |||
| Air Lease Corp. Class A | 2,675 | 107,749 | |
| Core & Main, Inc. | 1,423 | 33,810 | |
| Fastenal Co. | 14,374 | 795,026 | |
| MSC Industrial Direct Co., Inc. Class A | 1,123 | 93,052 | |
| SiteOne Landscape Supply, Inc. (b) | 929 | 131,017 | |
| United Rentals, Inc. (b) | 1,811 | 573,218 | |
| Univar Solutions, Inc. (b) | 4,185 | 121,867 | |
| W.W. Grainger, Inc. | 1,151 | 575,535 | |
| Watsco, Inc. | 817 | 217,959 | |
| 2,649,233 | |||
| TOTAL INDUSTRIALS | 36,342,428 | ||
| INFORMATION TECHNOLOGY - 16.9% | |||
| Communications Equipment - 1.0% | |||
| Arista Networks, Inc. (b) | 6,031 | 697,003 | |
| Ciena Corp. (b) | 3,868 | 213,398 | |
| CommScope Holding Co., Inc. (b) | 5,634 | 33,973 | |
| F5, Inc. (b) | 1,510 | 252,789 | |
| Juniper Networks, Inc. (a) | 7,979 | 251,498 | |
| Lumentum Holdings, Inc. (b) | 1,815 | 147,396 | |
| Motorola Solutions, Inc. | 4,159 | 888,737 | |
| Ubiquiti, Inc. | 161 | 45,442 | |
| ViaSat, Inc. (b) | 1,761 | 64,822 | |
| 2,595,058 | |||
| Electronic Equipment & Components - 2.3% | |||
| Amphenol Corp. Class A | 14,616 | 1,045,044 | |
| Arrow Electronics, Inc. (b) | 1,685 | 198,594 | |
| Avnet, Inc. | 2,486 | 108,539 | |
| CDW Corp. | 3,391 | 553,343 | |
| Cognex Corp. | 4,276 | 289,186 | |
| Coherent, Inc. (b) | 612 | 163,955 | |
| Corning, Inc. | 19,053 | 670,475 | |
| IPG Photonics Corp. (b) | 954 | 90,134 | |
| Jabil, Inc. | 3,497 | 201,882 | |
| Keysight Technologies, Inc. (b) | 4,559 | 639,491 | |
| Littelfuse, Inc. | 600 | 137,550 | |
| National Instruments Corp. | 3,314 | 119,768 | |
| TD SYNNEX Corp. | 1,044 | 104,494 | |
| Teledyne Technologies, Inc. (b) | 1,151 | 496,714 | |
| Trimble, Inc. (b) | 6,277 | 418,676 | |
| Vontier Corp. | 4,225 | 108,245 | |
| Zebra Technologies Corp. Class A (b) | 1,335 | 493,496 | |
| 5,839,586 | |||
| IT Services - 3.2% | |||
| Akamai Technologies, Inc. (a)(b) | 4,025 | 451,927 | |
| Amdocs Ltd. | 3,072 | 244,808 | |
| Bread Financial Holdings, Inc. | 1,327 | 72,720 | |
| Broadridge Financial Solutions, Inc. | 2,897 | 417,545 | |
| Cloudflare, Inc. (b) | 6,606 | 569,041 | |
| Concentrix Corp. | 1,053 | 165,826 | |
| DXC Technology Co. (b) | 6,144 | 176,333 | |
| EPAM Systems, Inc. (b) | 1,373 | 363,831 | |
| Euronet Worldwide, Inc. (b) | 1,278 | 155,469 | |
| Fastly, Inc. Class A (b) | 3,170 | 50,403 | |
| FleetCor Technologies, Inc. (b) | 1,989 | 496,295 | |
| Gartner, Inc. (b) | 2,003 | 581,972 | |
| Genpact Ltd. | 4,578 | 184,356 | |
| Globant SA (b) | 1,028 | 222,038 | |
| GoDaddy, Inc. (b) | 4,212 | 340,372 | |
| Jack Henry & Associates, Inc. | 1,812 | 343,519 | |
| MongoDB, Inc. Class A (b) | 1,597 | 566,823 | |
| Okta, Inc. (b) | 3,238 | 386,326 | |
| Paychex, Inc. | 8,064 | 1,021,951 | |
| Paysafe Ltd. (b) | 11,205 | 31,150 | |
| Sabre Corp. (b) | 8,320 | 87,110 | |
| Shift4 Payments, Inc. (b) | 1,176 | 61,693 | |
| SolarWinds, Inc. | 875 | 10,824 | |
| StoneCo Ltd. Class A (b) | 5,547 | 52,253 | |
| Switch, Inc. Class A | 2,877 | 85,907 | |
| The Western Union Co. | 10,082 | 168,974 | |
| Thoughtworks Holding, Inc. | 1,107 | 20,491 | |
| VeriSign, Inc. (b) | 2,435 | 435,110 | |
| WEX, Inc. (b) | 1,129 | 187,685 | |
| Wix.com Ltd. (b) | 450 | 33,957 | |
| 7,986,709 | |||
| Semiconductors & Semiconductor Equipment - 2.5% | |||
| Allegro MicroSystems LLC (b) | 1,022 | 24,845 | |
| Cirrus Logic, Inc. (b) | 1,431 | 108,470 | |
| Enphase Energy, Inc. (b) | 3,261 | 526,325 | |
| Entegris, Inc. | 3,374 | 375,830 | |
| First Solar, Inc. (b) | 2,647 | 193,310 | |
| GlobalFoundries, Inc. (a) | 1,315 | 68,761 | |
| Marvell Technology, Inc. | 21,113 | 1,226,243 | |
| Microchip Technology, Inc. | 13,638 | 889,198 | |
| MKS Instruments, Inc. | 1,419 | 161,738 | |
| Monolithic Power Systems, Inc. | 1,135 | 445,192 | |
| onsemi (b) | 10,602 | 552,470 | |
| Qorvo, Inc. (b) | 2,739 | 311,643 | |
| Skyworks Solutions, Inc. | 4,128 | 467,702 | |
| Teradyne, Inc. | 4,089 | 431,226 | |
| Universal Display Corp. | 1,085 | 138,587 | |
| Wolfspeed, Inc. (b) | 2,900 | 265,959 | |
| 6,187,499 | |||
| Software - 6.9% | |||
| Alteryx, Inc. Class A (b) | 1,511 | 97,006 | |
| Anaplan, Inc. (b) | 3,643 | 236,759 | |
| ANSYS, Inc. (b) | 2,191 | 604,037 | |
| Aspen Technology, Inc. (b) | 1,673 | 265,237 | |
| Avalara, Inc. (b) | 2,276 | 173,135 | |
| Bentley Systems, Inc. Class B | 3,491 | 147,983 | |
| Bill.Com Holdings, Inc. (a)(b) | 2,362 | 403,217 | |
| Black Knight, Inc. (b) | 3,819 | 251,252 | |
| C3.Ai, Inc. (b) | 2,111 | 35,866 | |
| Cadence Design Systems, Inc. (b) | 6,880 | 1,037,848 | |
| CDK Global, Inc. | 2,925 | 159,149 | |
| Ceridian HCM Holding, Inc. (b) | 3,472 | 194,883 | |
| Citrix Systems, Inc. | 3,102 | 310,510 | |
| Coupa Software, Inc. (b) | 1,373 | 118,490 | |
| Crowdstrike Holdings, Inc. (b) | 5,022 | 998,173 | |
| Datadog, Inc. Class A (b) | 6,391 | 771,905 | |
| Datto Holding Corp. (b) | 597 | 20,716 | |
| DocuSign, Inc. (b) | 4,827 | 390,987 | |
| Dolby Laboratories, Inc. Class A | 1,604 | 124,262 | |
| DoubleVerify Holdings, Inc. (b) | 1,550 | 33,713 | |
| Dropbox, Inc. Class A (b) | 7,540 | 163,995 | |
| Duck Creek Technologies, Inc. (b) | 2,069 | 32,959 | |
| Dynatrace, Inc. (b) | 5,220 | 200,239 | |
| Elastic NV (b) | 1,994 | 151,823 | |
| Everbridge, Inc. (b) | 1,191 | 51,332 | |
| Fair Isaac Corp. (b) | 641 | 239,420 | |
| Five9, Inc. (b) | 1,755 | 193,226 | |
| Fortinet, Inc. (b) | 3,354 | 969,340 | |
| Guidewire Software, Inc. (b) | 2,102 | 182,748 | |
| HubSpot, Inc. (b) | 1,151 | 436,724 | |
| Informatica, Inc. | 902 | 17,553 | |
| Jamf Holding Corp. (a)(b) | 1,337 | 41,180 | |
| Mandiant, Inc. (b) | 5,875 | 129,133 | |
| Manhattan Associates, Inc. (b) | 1,587 | 207,183 | |
| N-able, Inc. (b) | 1,103 | 11,030 | |
| nCino, Inc. (b) | 1,530 | 57,360 | |
| NCR Corp. (b) | 3,236 | 113,357 | |
| New Relic, Inc. (b) | 1,348 | 85,288 | |
| NortonLifeLock, Inc. | 13,760 | 344,550 | |
| Nutanix, Inc. Class A (b) | 5,414 | 135,512 | |
| Palantir Technologies, Inc. (b) | 36,598 | 380,619 | |
| Palo Alto Networks, Inc. (b) | 2,421 | 1,358,855 | |
| Paycom Software, Inc. (b) | 1,240 | 349,023 | |
| Paycor HCM, Inc. (a) | 1,167 | 28,743 | |
| Paylocity Holding Corp. (b) | 993 | 188,303 | |
| Pegasystems, Inc. | 1,093 | 83,713 | |
| Procore Technologies, Inc. (b) | 1,611 | 89,362 | |
| PTC, Inc. (b) | 2,644 | 301,971 | |
| RingCentral, Inc. (b) | 2,044 | 173,433 | |
| Smartsheet, Inc. (b) | 3,170 | 153,206 | |
| Splunk, Inc. (b) | 3,991 | 486,982 | |
| SS&C Technologies Holdings, Inc. | 5,612 | 362,872 | |
| Synopsys, Inc. (b) | 3,798 | 1,089,228 | |
| Teradata Corp. (b) | 2,695 | 111,438 | |
| The Trade Desk, Inc. (b) | 10,959 | 645,704 | |
| Tyler Technologies, Inc. (b) | 1,009 | 398,262 | |
| Unity Software, Inc. (a)(b) | 3,857 | 256,143 | |
| Zendesk, Inc. (b) | 3,043 | 371,368 | |
| Zscaler, Inc. (b) | 2,003 | 406,088 | |
| 17,374,393 | |||
| Technology Hardware, Storage & Peripherals - 1.0% | |||
| Hewlett Packard Enterprise Co. | 32,564 | 501,811 | |
| HP, Inc. | 27,126 | 993,625 | |
| NetApp, Inc. | 5,572 | 408,149 | |
| Pure Storage, Inc. Class A (b) | 6,839 | 200,383 | |
| Western Digital Corp. (b) | 7,808 | 414,371 | |
| Xerox Holdings Corp. | 3,225 | 56,115 | |
| 2,574,454 | |||
| TOTAL INFORMATION TECHNOLOGY | 42,557,699 | ||
| MATERIALS - 6.3% | |||
| Chemicals - 3.0% | |||
| Albemarle Corp. U.S. | 2,909 | 560,942 | |
| Ashland Global Holdings, Inc. | 1,289 | 135,306 | |
| Axalta Coating Systems Ltd. (b) | 5,107 | 129,565 | |
| Celanese Corp. Class A | 2,725 | 400,412 | |
| CF Industries Holdings, Inc. | 5,354 | 518,428 | |
| Corteva, Inc. | 18,273 | 1,054,169 | |
| Diversey Holdings Ltd. (b) | 2,097 | 16,231 | |
| Eastman Chemical Co. | 3,350 | 343,945 | |
| Element Solutions, Inc. | 5,773 | 119,039 | |
| FMC Corp. | 3,174 | 420,682 | |
| Huntsman Corp. | 5,183 | 175,548 | |
| International Flavors & Fragrances, Inc. | 6,381 | 774,015 | |
| LyondellBasell Industries NV Class A | 6,506 | 689,831 | |
| NewMarket Corp. | 158 | 51,288 | |
| Olin Corp. | 3,551 | 203,827 | |
| PPG Industries, Inc. | 5,929 | 758,853 | |
| RPM International, Inc. | 3,202 | 265,446 | |
| The Chemours Co. LLC | 3,966 | 131,156 | |
| The Mosaic Co. | 9,293 | 580,069 | |
| The Scotts Miracle-Gro Co. Class A | 1,076 | 111,829 | |
| Valvoline, Inc. | 4,522 | 136,700 | |
| Westlake Corp. | 829 | 104,910 | |
| 7,682,191 | |||
| Construction Materials - 0.5% | |||
| Eagle Materials, Inc. | 970 | 119,620 | |
| Martin Marietta Materials, Inc. | 1,556 | 551,166 | |
| Vulcan Materials Co. | 3,309 | 570,108 | |
| 1,240,894 | |||
| Containers & Packaging - 1.6% | |||
| Amcor PLC | 37,875 | 449,198 | |
| Aptargroup, Inc. | 1,645 | 188,895 | |
| Ardagh Group SA | 363 | 5,193 | |
| Ardagh Metal Packaging SA | 1,811 | 12,912 | |
| Avery Dennison Corp. | 2,071 | 374,023 | |
| Ball Corp. | 7,944 | 644,735 | |
| Berry Global Group, Inc. (b) | 3,377 | 190,294 | |
| Crown Holdings, Inc. | 3,077 | 338,593 | |
| Graphic Packaging Holding Co. | 7,050 | 153,690 | |
| International Paper Co. | 9,674 | 447,713 | |
| Packaging Corp. of America | 2,347 | 378,266 | |
| Sealed Air Corp. | 3,708 | 238,091 | |
| Silgan Holdings, Inc. | 2,106 | 93,443 | |
| Sonoco Products Co. | 2,449 | 151,618 | |
| WestRock Co. | 6,542 | 324,025 | |
| 3,990,689 | |||
| Metals & Mining - 1.1% | |||
| Alcoa Corp. | 4,608 | 312,422 | |
| Cleveland-Cliffs, Inc. (b) | 11,182 | 285,029 | |
| Nucor Corp. | 6,818 | 1,055,290 | |
| Reliance Steel & Aluminum Co. | 1,561 | 309,468 | |
| Royal Gold, Inc. | 1,642 | 214,248 | |
| Steel Dynamics, Inc. | 4,715 | 404,311 | |
| United States Steel Corp. | 6,470 | 197,270 | |
| 2,778,038 | |||
| Paper & Forest Products - 0.1% | |||
| Louisiana-Pacific Corp. | 2,198 | 141,815 | |
| Sylvamo Corp. (b) | 900 | 40,185 | |
| 182,000 | |||
| TOTAL MATERIALS | 15,873,812 | ||
| REAL ESTATE - 8.8% | |||
| Equity Real Estate Investment Trusts (REITs) - 8.2% | |||
| Alexandria Real Estate Equities, Inc. | 4,166 | 758,879 | |
| American Campus Communities, Inc. | 3,424 | 221,430 | |
| American Homes 4 Rent Class A | 7,361 | 291,569 | |
| Americold Realty Trust | 6,678 | 176,166 | |
| Apartment Income (REIT) Corp. | 3,914 | 192,451 | |
| AvalonBay Communities, Inc. | 3,489 | 793,678 | |
| Boston Properties, Inc. | 3,910 | 459,816 | |
| Brixmor Property Group, Inc. | 7,411 | 188,091 | |
| Camden Property Trust (SBI) | 2,475 | 388,303 | |
| Cousins Properties, Inc. | 3,711 | 133,225 | |
| CubeSmart | 5,445 | 258,692 | |
| Douglas Emmett, Inc. | 4,166 | 122,730 | |
| Duke Realty Corp. | 9,514 | 520,892 | |
| EPR Properties | 1,851 | 97,215 | |
| Equity Lifestyle Properties, Inc. | 4,432 | 342,505 | |
| Equity Residential (SBI) | 9,222 | 751,593 | |
| Essex Property Trust, Inc. | 1,624 | 534,734 | |
| Extra Space Storage, Inc. | 3,280 | 623,200 | |
| Federal Realty Investment Trust (SBI) | 1,952 | 228,501 | |
| First Industrial Realty Trust, Inc. | 3,224 | 186,992 | |
| Gaming & Leisure Properties | 5,822 | 258,380 | |
| Healthcare Trust of America, Inc. | 5,445 | 165,855 | |
| Healthpeak Properties, Inc. | 13,482 | 442,344 | |
| Highwoods Properties, Inc. (SBI) | 2,571 | 105,000 | |
| Host Hotels & Resorts, Inc. | 17,683 | 359,849 | |
| Hudson Pacific Properties, Inc. | 3,703 | 86,206 | |
| Invitation Homes, Inc. | 14,947 | 595,190 | |
| Iron Mountain, Inc. (a) | 7,174 | 385,459 | |
| JBG SMITH Properties | 3,045 | 80,266 | |
| Kilroy Realty Corp. | 2,903 | 203,210 | |
| Kimco Realty Corp. | 14,537 | 368,222 | |
| Lamar Advertising Co. Class A | 2,159 | 238,375 | |
| Life Storage, Inc. | 2,041 | 270,412 | |
| Medical Properties Trust, Inc. | 14,770 | 271,620 | |
| Mid-America Apartment Communities, Inc. | 2,889 | 568,209 | |
| National Retail Properties, Inc. | 4,385 | 192,238 | |
| Omega Healthcare Investors, Inc. | 6,129 | 156,167 | |
| Orion Office (REIT), Inc. | 1,475 | 19,795 | |
| Park Hotels & Resorts, Inc. | 5,964 | 117,550 | |
| Rayonier, Inc. | 3,550 | 153,360 | |
| Realty Income Corp. | 14,168 | 982,692 | |
| Regency Centers Corp. | 4,224 | 290,738 | |
| Rexford Industrial Realty, Inc. | 4,023 | 313,955 | |
| SBA Communications Corp. Class A | 2,713 | 941,709 | |
| Simon Property Group, Inc. | 8,169 | 963,942 | |
| SL Green Realty Corp. | 1,694 | 117,259 | |
| Spirit Realty Capital, Inc. | 3,180 | 138,171 | |
| Store Capital Corp. | 6,104 | 173,537 | |
| Sun Communities, Inc. | 2,869 | 503,710 | |
| UDR, Inc. | 7,929 | 421,902 | |
| Ventas, Inc. | 9,980 | 554,389 | |
| VICI Properties, Inc. | 21,103 | 629,080 | |
| Vornado Realty Trust | 4,390 | 169,937 | |
| Welltower, Inc. | 10,906 | 990,374 | |
| Weyerhaeuser Co. | 18,765 | 773,493 | |
| WP Carey, Inc. | 4,733 | 382,284 | |
| 20,655,541 | |||
| Real Estate Management & Development - 0.6% | |||
| CBRE Group, Inc. | 8,363 | 694,464 | |
| Howard Hughes Corp. (b) | 1,038 | 104,101 | |
| Jones Lang LaSalle, Inc. (b) | 1,263 | 276,256 | |
| Opendoor Technologies, Inc. (b) | 12,242 | 85,572 | |
| Zillow Group, Inc.: | |||
| Class A (b) | 1,792 | 69,261 | |
| Class C (b) | 4,131 | 164,496 | |
| 1,394,150 | |||
| TOTAL REAL ESTATE | 22,049,691 | ||
| UTILITIES - 5.5% | |||
| Electric Utilities - 2.5% | |||
| Alliant Energy Corp. | 6,263 | 368,327 | |
| Avangrid, Inc. | 1,431 | 63,465 | |
| Edison International | 9,340 | 642,499 | |
| Entergy Corp. | 5,017 | 596,270 | |
| Evergy, Inc. | 5,730 | 388,781 | |
| Eversource Energy | 8,597 | 751,378 | |
| FirstEnergy Corp. | 13,618 | 589,796 | |
| Hawaiian Electric Industries, Inc. | 2,639 | 108,489 | |
| IDACORP, Inc. | 1,260 | 132,527 | |
| NRG Energy, Inc. | 6,087 | 218,523 | |
| OGE Energy Corp. | 5,006 | 193,632 | |
| PG&E Corp. (b) | 49,811 | 630,109 | |
| Pinnacle West Capital Corp. | 2,824 | 201,069 | |
| PPL Corp. | 18,826 | 532,964 | |
| Xcel Energy, Inc. | 13,481 | 987,618 | |
| 6,405,447 | |||
| Gas Utilities - 0.3% | |||
| Atmos Energy Corp. (a) | 3,354 | 380,344 | |
| National Fuel Gas Co. | 2,180 | 152,883 | |
| UGI Corp. | 5,259 | 180,384 | |
| 713,611 | |||
| Independent Power and Renewable Electricity Producers - 0.3% | |||
| Brookfield Renewable Corp. | 3,207 | 115,131 | |
| The AES Corp. | 16,532 | 337,583 | |
| Vistra Corp. | 11,988 | 299,940 | |
| 752,654 | |||
| Multi-Utilities - 2.0% | |||
| Ameren Corp. | 6,374 | 592,145 | |
| CenterPoint Energy, Inc. | 14,836 | 454,130 | |
| CMS Energy Corp. | 7,232 | 496,766 | |
| Consolidated Edison, Inc. | 8,858 | 821,491 | |
| DTE Energy Co. | 4,833 | 633,316 | |
| NiSource, Inc. | 9,809 | 285,638 | |
| Public Service Enterprise Group, Inc. | 12,632 | 879,945 | |
| WEC Energy Group, Inc. | 7,903 | 790,695 | |
| 4,954,126 | |||
| Water Utilities - 0.4% | |||
| American Water Works Co., Inc. | 4,544 | 700,140 | |
| Essential Utilities, Inc. | 5,780 | 258,713 | |
| 958,853 | |||
| TOTAL UTILITIES | 13,784,691 | ||
| TOTAL COMMON STOCKS | |||
| (Cost $220,290,190) | 251,092,560 | ||
| Nonconvertible Preferred Stocks - 0.0% | |||
| REAL ESTATE - 0.0% | |||
| Real Estate Management & Development - 0.0% | |||
| Brookfield Property Preferred LP 6.25% | |||
| (Cost $74) | 3 | 62 | |
| Money Market Funds - 3.7% | |||
| Fidelity Cash Central Fund 0.32% (c) | 101,684 | 101,705 | |
| Fidelity Securities Lending Cash Central Fund 0.32% (c)(d) | 9,144,341 | 9,145,255 | |
| TOTAL MONEY MARKET FUNDS | |||
| (Cost $9,246,960) | 9,246,960 | ||
| TOTAL INVESTMENT IN SECURITIES - 103.6% | |||
| (Cost $229,537,224) | 260,339,582 | ||
| NET OTHER ASSETS (LIABILITIES) - (3.6)% | (9,002,794) | ||
| NET ASSETS - 100% | $251,336,788 |
| Futures Contracts | |||||
| Number of contracts | Expiration Date | Notional Amount | Value | Unrealized Appreciation/(Depreciation) | |
| Purchased | |||||
| Equity Index Contracts | |||||
| CME E-mini S&P MidCap 400 Index Contracts (United States) | 1 | June 2022 | $249,510 | $(4,321) | $(4,321) |
The notional amount of futures purchased as a percentage of Net Assets is 0.1%
Legend
(a) Security or a portion of the security is on loan at period end.
(b) Non-income producing
(c) Affiliated fund that is generally available only to investment companies and other accounts managed by Fidelity Investments. The rate quoted is the annualized seven-day yield of the fund at period end. A complete unaudited listing of the fund's holdings as of its most recent quarter end is available upon request. In addition, each Fidelity Central Fund's financial statements, which are not covered by the Fund's Report of Independent Registered Public Accounting Firm, are available on the SEC's website or upon request.
(d) Investment made with cash collateral received from securities on loan.
Affiliated Central Funds
Fiscal year to date information regarding the Fund's investments in Fidelity Central Funds, including the ownership percentage, is presented below.
| Fund | Value, beginning of period | Purchases | Sales Proceeds | Dividend Income | Realized Gain/Loss | Change in Unrealized appreciation (depreciation) | Value, end of period | % ownership, end of period |
| Fidelity Cash Central Fund 0.32% | $803,571 | $32,396,509 | $33,098,375 | $623 | $-- | $-- | $101,705 | 0.0% |
| Fidelity Securities Lending Cash Central Fund 0.32% | 732,105 | 46,453,654 | 38,040,504 | 11,120 | -- | -- | 9,145,255 | 0.0% |
| Total | $1,535,676 | $78,850,163 | $71,138,879 | $11,743 | $-- | $-- | $9,246,960 |
Amounts in the income column in the above table include any capital gain distributions from underlying funds, which are presented in the corresponding line-item in the Statement of Operations, if applicable. Amount for Fidelity Securities Lending Cash Central Fund represents the income earned on investing cash collateral, less rebates paid to borrowers and any lending agent fees associated with the loan, plus any premium payments received for lending certain types of securities.
Investment Valuation
The following is a summary of the inputs used, as of April 30, 2022, involving the Fund's assets and liabilities carried at fair value. The inputs or methodology used for valuing securities may not be an indication of the risk associated with investing in those securities. For more information on valuation inputs, and their aggregation into the levels used below, please refer to the Investment Valuation section in the accompanying Notes to Financial Statements.
| Valuation Inputs at Reporting Date: | ||||
| Description | Total | Level 1 | Level 2 | Level 3 |
| Investments in Securities: | ||||
| Equities: | ||||
| Communication Services | $8,753,217 | $8,753,217 | $-- | $-- |
| Consumer Discretionary | 28,621,953 | 28,621,953 | -- | -- |
| Consumer Staples | 10,408,400 | 10,408,400 | -- | -- |
| Energy | 15,101,548 | 15,101,548 | -- | -- |
| Financials | 31,198,151 | 31,198,151 | -- | -- |
| Health Care | 26,400,970 | 26,400,970 | -- | -- |
| Industrials | 36,342,428 | 36,342,428 | -- | -- |
| Information Technology | 42,557,699 | 42,557,699 | -- | -- |
| Materials | 15,873,812 | 15,873,812 | -- | -- |
| Real Estate | 22,049,753 | 22,049,753 | -- | -- |
| Utilities | 13,784,691 | 13,784,691 | -- | -- |
| Money Market Funds | 9,246,960 | 9,246,960 | -- | -- |
| Total Investments in Securities: | $260,339,582 | $260,339,582 | $-- | $-- |
| Derivative Instruments: | ||||
| Liabilities | ||||
| Futures Contracts | $(4,321) | $(4,321) | $-- | $-- |
| Total Liabilities | $(4,321) | $(4,321) | $-- | $-- |
| Total Derivative Instruments: | $(4,321) | $(4,321) | $-- | $-- |
Value of Derivative Instruments
The following table is a summary of the Fund's value of derivative instruments by primary risk exposure as of April 30, 2022. For additional information on derivative instruments, please refer to the Derivative Instruments section in the accompanying Notes to Financial Statements.
| Primary Risk Exposure / Derivative Type | Value | |
| Asset | Liability | |
| Equity Risk | ||
| Futures Contracts(a) | $0 | $(4,321) |
| Total Equity Risk | 0 | (4,321) |
| Total Value of Derivatives | $0 | $(4,321) |
(a) Reflects gross cumulative appreciation (depreciation) on futures contracts as presented in the Schedule of Investments. In the Statement of Assets and Liabilities, the period end daily variation margin is included in receivable or payable for daily variation margin on futures contracts, and the net cumulative appreciation (depreciation) is included in Total accumulated earnings (loss).
See accompanying notes which are an integral part of the financial statements.
Financial Statements
Statement of Assets and Liabilities
| April 30, 2022 | ||
| Assets | ||
| Investment in securities, at value (including securities loaned of $8,659,370) — See accompanying schedule: Unaffiliated issuers (cost $220,290,264) | $251,092,622 | |
| Fidelity Central Funds (cost $9,246,960) | 9,246,960 | |
| Total Investment in Securities (cost $229,537,224) | $260,339,582 | |
| Segregated cash with brokers for derivative instruments | 13,500 | |
| Cash | 973 | |
| Receivable for investments sold | 888,926 | |
| Receivable for fund shares sold | 410,621 | |
| Dividends receivable | 101,973 | |
| Distributions receivable from Fidelity Central Funds | 2,297 | |
| Total assets | 261,757,872 | |
| Liabilities | ||
| Payable for investments purchased | $1,005,617 | |
| Payable for fund shares redeemed | 263,258 | |
| Payable for daily variation margin on futures contracts | 6,980 | |
| Other payables and accrued expenses | 4 | |
| Collateral on securities loaned | 9,145,225 | |
| Total liabilities | 10,421,084 | |
| Net Assets | $251,336,788 | |
| Net Assets consist of: | ||
| Paid in capital | $223,459,363 | |
| Total accumulated earnings (loss) | 27,877,425 | |
| Net Assets | $251,336,788 | |
| Net Asset Value, offering price and redemption price per share ($251,336,788 ÷ 16,372,633 shares) | $15.35 |
See accompanying notes which are an integral part of the financial statements.
Statement of Operations
| Year ended April 30, 2022 | ||
| Investment Income | ||
| Dividends | $2,986,248 | |
| Income from Fidelity Central Funds (including $11,120 from security lending) | 11,743 | |
| Total income | 2,997,991 | |
| Expenses | ||
| Independent trustees' fees and expenses | $681 | |
| Total expenses before reductions | 681 | |
| Expense reductions | (2) | |
| Total expenses after reductions | 679 | |
| Net investment income (loss) | 2,997,312 | |
| Realized and Unrealized Gain (Loss) | ||
| Net realized gain (loss) on: | ||
| Investment securities: | ||
| Unaffiliated issuers | 3,658,211 | |
| Foreign currency transactions | (1) | |
| Futures contracts | (12,229) | |
| Total net realized gain (loss) | 3,645,981 | |
| Change in net unrealized appreciation (depreciation) on: | ||
| Investment securities: | ||
| Unaffiliated issuers | (24,768,357) | |
| Futures contracts | (16,648) | |
| Total change in net unrealized appreciation (depreciation) | (24,785,005) | |
| Net gain (loss) | (21,139,024) | |
| Net increase (decrease) in net assets resulting from operations | $(18,141,712) |
See accompanying notes which are an integral part of the financial statements.
Statement of Changes in Net Assets
| Year ended April 30, 2022 | Year ended April 30, 2021 | |
| Increase (Decrease) in Net Assets | ||
| Operations | ||
| Net investment income (loss) | $2,997,312 | $1,754,333 |
| Net realized gain (loss) | 3,645,981 | 971,012 |
| Change in net unrealized appreciation (depreciation) | (24,785,005) | 57,262,856 |
| Net increase (decrease) in net assets resulting from operations | (18,141,712) | 59,988,201 |
| Distributions to shareholders | (6,913,831) | (2,940,785) |
| Share transactions | ||
| Proceeds from sales of shares | 148,157,214 | 112,103,605 |
| Reinvestment of distributions | 4,691,590 | 2,139,339 |
| Cost of shares redeemed | (65,791,393) | (70,320,053) |
| Net increase (decrease) in net assets resulting from share transactions | 87,057,411 | 43,922,891 |
| Total increase (decrease) in net assets | 62,001,868 | 100,970,307 |
| Net Assets | ||
| Beginning of period | 189,334,920 | 88,364,613 |
| End of period | $251,336,788 | $189,334,920 |
| Other Information | ||
| Shares | ||
| Sold | 8,732,269 | 7,963,957 |
| Issued in reinvestment of distributions | 271,847 | 153,385 |
| Redeemed | (3,885,387) | (5,058,761) |
| Net increase (decrease) | 5,118,729 | 3,058,581 |
See accompanying notes which are an integral part of the financial statements.
Financial Highlights
Fidelity Flex Mid Cap Index Fund
| Years ended April 30, | 2022 | 2021 | 2020 | 2019 | 2018 |
| Selected Per–Share Data | |||||
| Net asset value, beginning of period | $16.82 | $10.78 | $12.23 | $11.28 | $10.19 |
| Income from Investment Operations | |||||
| Net investment income (loss)A,B | .21 | .19 | .22 | .20 | .16 |
| Net realized and unrealized gain (loss) | (1.18) | 6.17 | (1.39) | .98 | .98 |
| Total from investment operations | (.97) | 6.36 | (1.17) | 1.18 | 1.14 |
| Distributions from net investment income | (.19) | (.20) | (.18) | (.19) | (.04) |
| Distributions from net realized gain | (.31) | (.12) | (.10) | (.05) | (.01) |
| Total distributions | (.50) | (.32) | (.28) | (.23)C | (.05) |
| Net asset value, end of period | $15.35 | $16.82 | $10.78 | $12.23 | $11.28 |
| Total ReturnD,E | (6.09)% | 59.64% | (9.88)% | 10.75% | 11.19% |
| Ratios to Average Net AssetsB,F,G | |||||
| Expenses before reductionsH | -% | -% | -% | -% | -% |
| Expenses net of fee waivers, if anyH | -% | -% | -% | -% | -% |
| Expenses net of all reductionsH | -% | -% | -% | -% | -% |
| Net investment income (loss) | 1.27% | 1.35% | 1.84% | 1.76% | 1.46% |
| Supplemental Data | |||||
| Net assets, end of period (000 omitted) | $251,337 | $189,335 | $88,365 | $76,766 | $54,888 |
| Portfolio turnover rateI | 13% | 26% | 38% | 25% | 25%J |
A Calculated based on average shares outstanding during the period.
B Net investment income (loss) is affected by the timing of the declaration of dividends by any underlying mutual funds or exchange-traded funds (ETFs). Net investment income (loss) of any such underlying funds is not included in the Fund's net investment income (loss) ratio.
C Total distributions per share do not sum due to rounding.
D Total returns for periods of less than one year are not annualized.
E Total returns would have been lower if certain expenses had not been reduced during the applicable periods shown.
F Fees and expenses of any underlying mutual funds or exchange-traded funds (ETFs) are not included in the Fund's expense ratio. The Fund indirectly bears its proportionate share of these expenses. For additional expense information related to investments in Fidelity Central Funds, please refer to the "Investments in Fidelity Central Funds" note found in the Notes to Financial Statements section of the most recent Annual or Semi-Annual report.
G Expense ratios reflect operating expenses of the class. Expenses before reductions do not reflect amounts reimbursed, waived, or reduced through arrangements with the investment adviser, brokerage services, or other offset arrangements, if applicable, and do not represent the amount paid by the class during periods when reimbursements, waivers or reductions occur.
H Amount represents less than .005%.
I Amount does not include the portfolio activity of any underlying mutual funds or exchange-traded funds (ETFs).
J Portfolio turnover rate excludes securities received or delivered in-kind.
See accompanying notes which are an integral part of the financial statements.
Notes to Financial Statements
For the period ended April 30, 2022
1. Organization.
Fidelity Flex Mid Cap Index Fund (the Fund) is a fund of Fidelity Salem Street Trust (the Trust) and is authorized to issue an unlimited number of shares. Share transactions on the Statement of Changes in Net Assets may contain exchanges between affiliated funds. The Trust is registered under the Investment Company Act of 1940, as amended (the 1940 Act), as an open-end management investment company organized as a Massachusetts business trust. The Fund is available only to certain fee-based accounts and advisory programs offered by Fidelity.
2. Investments in Fidelity Central Funds.
Funds may invest in Fidelity Central Funds, which are open-end investment companies generally available only to other investment companies and accounts managed by the investment adviser and its affiliates. The Schedule of Investments lists any Fidelity Central Funds held as an investment as of period end, but does not include the underlying holdings of each Fidelity Central Fund. An investing fund indirectly bears its proportionate share of the expenses of the underlying Fidelity Central Funds.
Based on its investment objective, each Fidelity Central Fund may invest or participate in various investment vehicles or strategies that are similar to those of the investing fund. These strategies are consistent with the investment objectives of the investing fund and may involve certain economic risks which may cause a decline in value of each of the Fidelity Central Funds and thus a decline in the value of the investing fund.
| Fidelity Central Fund | Investment Manager | Investment Objective | Investment Practices | Expense Ratio(a) |
| Fidelity Money Market Central Funds | Fidelity Management & Research Company LLC (FMR) | Each fund seeks to obtain a high level of current income consistent with the preservation of capital and liquidity. | Short-term Investments | Less than .005% |
(a) Expenses expressed as a percentage of average net assets and are as of each underlying Central Fund's most recent annual or semi-annual shareholder report.
A complete unaudited list of holdings for each Fidelity Central Fund is available upon request or at the Securities and Exchange Commission website at www.sec.gov. In addition, the financial statements of the Fidelity Central Funds which contain the significant accounting policies (including investment valuation policies) of those funds, and are not covered by the Report of Independent Registered Public Accounting Firm, are available on the Securities and Exchange Commission website or upon request.
3. Significant Accounting Policies.
The Fund is an investment company and applies the accounting and reporting guidance of the Financial Accounting Standards Board (FASB) Accounting Standards Codification Topic 946 Financial Services - Investment Companies. The financial statements have been prepared in conformity with accounting principles generally accepted in the United States of America (GAAP), which require management to make certain estimates and assumptions at the date of the financial statements. Actual results could differ from those estimates. Subsequent events, if any, through the date that the financial statements were issued have been evaluated in the preparation of the financial statements. The Fund's Schedule of Investments lists any underlying mutual funds or exchange-traded funds (ETFs) but does not include the underlying holdings of these funds. The following summarizes the significant accounting policies of the Fund:
Investment Valuation. Investments are valued as of 4:00 p.m. Eastern time on the last calendar day of the period. The Board of Trustees (the Board) has delegated the day to day responsibility for the valuation of the Fund's investments to the Fair Value Committee (the Committee) established by the Fund's investment adviser. In accordance with valuation policies and procedures approved by the Board, the Fund attempts to obtain prices from one or more third party pricing vendors or brokers to value its investments. When current market prices, quotations or currency exchange rates are not readily available or reliable, investments will be fair valued in good faith by the Committee, in accordance with procedures adopted by the Board. Factors used in determining fair value vary by investment type and may include market or investment specific events. The frequency with which these procedures are used cannot be predicted and they may be utilized to a significant extent. The Committee oversees the Fund's valuation policies and procedures and reports to the Board on the Committee's activities and fair value determinations. The Board monitors the appropriateness of the procedures used in valuing the Fund's investments and ratifies the fair value determinations of the Committee.
The Fund categorizes the inputs to valuation techniques used to value its investments into a disclosure hierarchy consisting of three levels as shown below:
- Level 1 – unadjusted quoted prices in active markets for identical investments
- Level 2 – other significant observable inputs (including quoted prices for similar investments, interest rates, prepayment speeds, etc.)
- Level 3 – unobservable inputs (including the Fund's own assumptions based on the best information available)
Valuation techniques used to value the Fund's investments by major category are as follows:
Equity securities, including restricted securities, for which market quotations are readily available, are valued at the last reported sale price or official closing price as reported by a third party pricing vendor on the primary market or exchange on which they are traded and are categorized as Level 1 in the hierarchy. In the event there were no sales during the day or closing prices are not available, securities are valued at the last quoted bid price or may be valued using the last available price and are generally categorized as Level 2 in the hierarchy. For foreign equity securities, when market or security specific events arise, comparisons to the valuation of American Depositary Receipts (ADRs), futures contracts, Exchange-Traded Funds (ETFs) and certain indexes as well as quoted prices for similar securities may be used and would be categorized as Level 2 in the hierarchy. For equity securities, including restricted securities, where observable inputs are limited, assumptions about market activity and risk are used and these securities may be categorized as Level 3 in the hierarchy.
Futures contracts are valued at the settlement price established each day by the board of trade or exchange on which they are traded and are categorized as Level 1 in the hierarchy. Investments in open-end mutual funds, including the Fidelity Central Funds, are valued at their closing net asset value (NAV) each business day and are categorized as Level 1 in the hierarchy.
Changes in valuation techniques may result in transfers in or out of an assigned level within the disclosure hierarchy. The aggregate value of investments by input level as of April 30, 2022 is included at the end of the Fund's Schedule of Investments.
Foreign Currency. Certain Funds may use foreign currency contracts to facilitate transactions in foreign-denominated securities. Gains and losses from these transactions may arise from changes in the value of the foreign currency or if the counterparties do not perform under the contracts' terms.
Foreign-denominated assets, including investment securities, and liabilities are translated into U.S. dollars at the exchange rates at period end. Purchases and sales of investment securities, income and dividends received, and expenses denominated in foreign currencies are translated into U.S. dollars at the exchange rate in effect on the transaction date.
The effects of exchange rate fluctuations on investments are included with the net realized and unrealized gain (loss) on investment securities. Other foreign currency transactions resulting in realized and unrealized gain (loss) are disclosed separately.
Investment Transactions and Income. For financial reporting purposes, the Fund's investment holdings and NAV include trades executed through the end of the last business day of the period. The NAV per share for processing shareholder transactions is calculated as of the close of business of the New York Stock Exchange (NYSE), normally 4:00 p.m. Eastern time and includes trades executed through the end of the prior business day. Gains and losses on securities sold are determined on the basis of identified cost and include proceeds received from litigation. Commissions paid to certain brokers with whom the investment adviser, or its affiliates, places trades on behalf of a fund include an amount in addition to trade execution, which may be rebated back to a fund. Any such rebates are included in net realized gain (loss) on investments in the Statement of Operations. Dividend income is recorded on the ex-dividend date, except for certain dividends from foreign securities where the ex-dividend date may have passed, which are recorded as soon as the Fund is informed of the ex-dividend date. Non-cash dividends included in dividend income, if any, are recorded at the fair market value of the securities received. Income and capital gain distributions from Fidelity Central Funds, if any, are recorded on the ex-dividend date. Certain distributions received by the Fund represent a return of capital or capital gain. The Fund determines the components of these distributions subsequent to the ex-dividend date, based upon receipt of tax filings or other correspondence relating to the underlying investment. These distributions are recorded as a reduction of cost of investments and/or as a realized gain. Investment income is recorded net of foreign taxes withheld where recovery of such taxes is uncertain.
Expenses. Expenses directly attributable to a fund are charged to that fund. Expenses attributable to more than one fund are allocated among the respective funds on the basis of relative net assets or other appropriate methods. Expenses included in the accompanying financial statements reflect the expenses of that fund and do not include any expenses associated with any underlying mutual funds or exchange-traded funds. Although not included in a fund's expenses, a fund indirectly bears its proportionate share of these expenses through the net asset value of each underlying mutual fund or exchange-traded fund. Expense estimates are accrued in the period to which they relate and adjustments are made when actual amounts are known.
Income Tax Information and Distributions to Shareholders. Each year, the Fund intends to qualify as a regulated investment company under Subchapter M of the Internal Revenue Code, including distributing substantially all of its taxable income and realized gains. As a result, no provision for U.S. Federal income taxes is required. As of April 30, 2022, the Fund did not have any unrecognized tax benefits in the financial statements; nor is the Fund aware of any tax positions for which it is reasonably possible that the total amounts of unrecognized tax benefits will significantly change in the next twelve months. The Fund files a U.S. federal tax return, in addition to state and local tax returns as required. The Fund's federal income tax returns are subject to examination by the Internal Revenue Service (IRS) for a period of three fiscal years after they are filed. State and local tax returns may be subject to examination for an additional fiscal year depending on the jurisdiction. Foreign taxes are provided for based on the Fund's understanding of the tax rules and rates that exist in the foreign markets in which it invests.
Distributions are declared and recorded on the ex-dividend date. Income and capital gain distributions are determined in accordance with income tax regulations, which may differ from GAAP. In addition, the Fund claimed a portion of the payment made to redeeming shareholders as a distribution for income tax purposes.
Capital accounts within the financial statements are adjusted for permanent book-tax differences. These adjustments have no impact on net assets or the results of operations. Capital accounts are not adjusted for temporary book-tax differences which will reverse in a subsequent period.
Book-tax differences are primarily due to the short-term gain distributions from the underlying mutual funds or exchange-traded funds (ETFs), futures contracts, passive foreign investment companies (PFIC), partnerships and losses deferred due to wash sales and excise tax regulations.
As of period end, the cost and unrealized appreciation (depreciation) in securities, and derivatives if applicable, for federal income tax purposes were as follows:
| Gross unrealized appreciation | $51,847,451 |
| Gross unrealized depreciation | (24,681,968) |
| Net unrealized appreciation (depreciation) | $27,165,483 |
| Tax Cost | $233,174,099 |
The tax-based components of distributable earnings as of period end were as follows:
| Undistributed ordinary income | $805,607 |
| Undistributed long-term capital gain | $466,472 |
| Net unrealized appreciation (depreciation) on securities and other investments | $27,165,483 |
The Fund intends to elect to defer to its next fiscal year $560,137 of capital losses recognized during the period November 1,2021 to April 30,2022.
The tax character of distributions paid was as follows:
| April 30, 2022 | April 30, 2021 | |
| Ordinary Income | $4,060,909 | $ 1,963,008 |
| Long-term Capital Gains | 2,852,922 | 977,777 |
| Total | $6,913,831 | $ 2,940,785 |
4. Derivative Instruments.
Risk Exposures and the Use of Derivative Instruments. The Fund's investment objective allows the Fund to enter into various types of derivative contracts, including futures contracts. Derivatives are investments whose value is primarily derived from underlying assets, indices or reference rates and may be transacted on an exchange or over-the-counter (OTC). Derivatives may involve a future commitment to buy or sell a specified asset based on specified terms, to exchange future cash flows at periodic intervals based on a notional principal amount, or for one party to make one or more payments upon the occurrence of specified events in exchange for periodic payments from the other party.
The Fund used derivatives to increase returns and to manage exposure to certain risks as defined below. The success of any strategy involving derivatives depends on analysis of numerous economic factors, and if the strategies for investment do not work as intended, the Fund may not achieve its objectives.
The Fund's use of derivatives increased or decreased its exposure to the following risk:
| Equity Risk | Equity risk relates to the fluctuations in the value of financial instruments as a result of changes in market prices (other than those arising from interest rate risk or foreign exchange risk), whether caused by factors specific to an individual investment, its issuer, or all factors affecting all instruments traded in a market or market segment. |
The Fund is also exposed to additional risks from investing in derivatives, such as liquidity risk and counterparty credit risk. Liquidity risk is the risk that the Fund will be unable to close out the derivative in the open market in a timely manner. Counterparty credit risk is the risk that the counterparty will not be able to fulfill its obligation to the Fund. Counterparty credit risk related to exchange-traded futures contracts may be mitigated by the protection provided by the exchange on which they trade.
Investing in derivatives may involve greater risks than investing in the underlying assets directly and, to varying degrees, may involve risk of loss in excess of any initial investment and collateral received and amounts recognized in the Statement of Assets and Liabilities. In addition, there may be the risk that the change in value of the derivative contract does not correspond to the change in value of the underlying instrument.
Futures Contracts. A futures contract is an agreement between two parties to buy or sell a specified underlying instrument for a fixed price at a specified future date. The Fund used futures contracts to manage its exposure to the stock market.
Upon entering into a futures contract, a fund is required to deposit either cash or securities (initial margin) with a clearing broker in an amount equal to a certain percentage of the face value of the contract. Futures contracts are marked-to-market daily and subsequent daily payments (variation margin) are made or received by a fund depending on the daily fluctuations in the value of the futures contracts and are recorded as unrealized appreciation or (depreciation). This receivable and/or payable, if any, is included in daily variation margin on futures contracts in the Statement of Assets and Liabilities. Realized gain or (loss) is recorded upon the expiration or closing of a futures contract. The net realized gain (loss) and change in net unrealized appreciation (depreciation) on futures contracts during the period is presented in the Statement of Operations.
Any open futures contracts at period end are presented in the Schedule of Investments under the caption "Futures Contracts". The notional amount at value reflects each contract's exposure to the underlying instrument or index at period end and is representative of volume of activity during the period. Cash deposited to meet initial margin requirements is presented as segregated cash with brokers for derivative instruments in the Statement of Assets and Liabilities.
5. Purchases and Sales of Investments.
Purchases and sales of securities, other than short-term securities and in-kind transactions, as applicable, are noted in the table below.
| Purchases ($) | Sales ($) | |
| Fidelity Flex Mid Cap Index Fund | 115,208,866 | 29,461,228 |
6. Fees and Other Transactions with Affiliates.
Management Fee. Fidelity Management & Research Company LLC (the investment adviser) and its affiliates provide the Fund with investment management related services and the Fund does not pay any fees for these services. Under the management contract, the investment adviser or an affiliate pays all other expenses of the Fund, excluding fees and expenses of the independent Trustees, and certain miscellaneous expenses such as proxy and shareholder meeting expenses.
Sub-Adviser. Geode Capital Management, LLC (Geode), serves as sub-adviser for the Fund. Geode provides discretionary investment advisory services to the Fund and is paid by the investment adviser for providing these services.
Interfund Trades. Funds may purchase from or sell securities to other Fidelity Funds under procedures adopted by the Board. The procedures have been designed to ensure these interfund trades are executed in accordance with Rule 17a-7 of the 1940 Act. Any interfund trades are included within the respective purchases and sales amounts shown in the Purchases and Sales of Investments note. During the period there were no interfund trades.
7. Committed Line of Credit.
Certain Funds participate with other funds managed by the investment adviser or an affiliate in a $4.25 billion credit facility (the "line of credit") to be utilized for temporary or emergency purposes to fund shareholder redemptions or for other short-term liquidity purposes. The commitment fees on the pro-rata portion of the line of credit are borne by the investment adviser. During the period, there were no borrowings on this line of credit.
8. Security Lending.
Funds lend portfolio securities through a lending agent from time to time in order to earn additional income. A fund may lend securities to certain qualified borrowers, including NFS. On the settlement date of the loan, a fund receives collateral (in the form of U.S. Treasury obligations, letters of credit and/or cash) against the loaned securities and maintains collateral in an amount not less than 100% of the market value of the loaned securities during the period of the loan. The market value of the loaned securities is determined at the close of business of a fund and any additional required collateral is delivered to a fund on the next business day. The Fund or borrower may terminate the loan at any time, and if the borrower defaults on its obligation to return the securities loaned because of insolvency or other reasons, a fund may apply collateral received from the borrower against the obligation. A fund may experience delays and costs in recovering the securities loaned. Any cash collateral received is invested in the Fidelity Securities Lending Cash Central Fund. Any loaned securities are identified as such in the Schedule of Investments, and the value of loaned securities and cash collateral at period end, as applicable, are presented in the Statement of Assets and Liabilities. Security lending income represents the income earned on investing cash collateral, less rebates paid to borrowers and any lending agent fees associated with the loan, plus any premium payments received for lending certain types of securities. Security lending income is presented in the Statement of Operations as a component of income from Fidelity Central Funds.
| Security Lending Income From Securities Loaned to NFS | Value of Securities Loaned to NFS at Period End | |
| Fidelity Flex Mid Cap Index Fund | $95 | $– |
9. Expense Reductions.
Through arrangements with the Fund's custodian, credits realized as a result of certain uninvested cash balances were used to reduce the Fund's expenses by $2.
10. Other.
A fund's organizational documents provide former and current trustees and officers with a limited indemnification against liabilities arising in connection with the performance of their duties to the fund. In the normal course of business, a fund may also enter into contracts that provide general indemnifications. A fund's maximum exposure under these arrangements is unknown as this would be dependent on future claims that may be made against a fund. The risk of material loss from such claims is considered remote.
11. Coronavirus (COVID-19) Pandemic.
An outbreak of COVID-19 first detected in China during December 2019 has since spread globally and was declared a pandemic by the World Health Organization during March 2020. Developments that disrupt global economies and financial markets, such as the COVID-19 pandemic, may magnify factors that affect the Fund's performance.
Report of Independent Registered Public Accounting Firm
To the Board of Trustees of Fidelity Salem Street Trust and Shareholders of Fidelity Flex Mid Cap Index Fund
Opinion on the Financial Statements and Financial Highlights
We have audited the accompanying statement of assets and liabilities of Fidelity Flex Mid Cap Index Fund (the "Fund"), a fund of Fidelity Salem Street Trust, including the schedule of investments, as of April 30, 2022, the related statement of operations for the year then ended, the statement of changes in net assets for each of the two years in the period then ended, the financial highlights for each of the five years in the period then ended, and the related notes. In our opinion, the financial statements and financial highlights present fairly, in all material respects, the financial position of the Fund as of April 30, 2022, and the results of its operations for the year then ended, the changes in its net assets for each of the two years in the period then ended, and the financial highlights for each of the five years in the period then ended in conformity with accounting principles generally accepted in the United States of America.
Basis for Opinion
These financial statements and financial highlights are the responsibility of the Fund's management. Our responsibility is to express an opinion on the Fund's financial statements and financial highlights based on our audits. We are a public accounting firm registered with the Public Company Accounting Oversight Board (United States) (PCAOB) and are required to be independent with respect to the Fund in accordance with the U.S. federal securities laws and the applicable rules and regulations of the Securities and Exchange Commission and the PCAOB.
We conducted our audits in accordance with the standards of the PCAOB. Those standards require that we plan and perform the audit to obtain reasonable assurance about whether the financial statements and financial highlights are free of material misstatement, whether due to error or fraud. The Fund is not required to have, nor were we engaged to perform, an audit of its internal control over financial reporting. As part of our audits we are required to obtain an understanding of internal control over financial reporting but not for the purpose of expressing an opinion on the effectiveness of the Fund’s internal control over financial reporting. Accordingly, we express no such opinion.
Our audits included performing procedures to assess the risks of material misstatement of the financial statements and financial highlights, whether due to error or fraud, and performing procedures that respond to those risks. Such procedures included examining, on a test basis, evidence regarding the amounts and disclosures in the financial statements and financial highlights. Our audits also included evaluating the accounting principles used and significant estimates made by management, as well as evaluating the overall presentation of the financial statements and financial highlights. Our procedures included confirmation of securities owned as of April 30, 2022, by correspondence with the custodian and brokers; when replies were not received from brokers, we performed other auditing procedures. We believe that our audits provide a reasonable basis for our opinion.
/s/ Deloitte & Touche LLP
Boston, Massachusetts
June 14, 2022
We have served as the auditor of one or more of the Fidelity investment companies since 1999.
Trustees and Officers
The Trustees, Members of the Advisory Board (if any), and officers of the trust and fund, as applicable, are listed below. The Board of Trustees governs the fund and is responsible for protecting the interests of shareholders. The Trustees are experienced executives who meet periodically throughout the year to oversee the fund's activities, review contractual arrangements with companies that provide services to the fund, oversee management of the risks associated with such activities and contractual arrangements, and review the fund's performance. Except for Jonathan Chiel, each of the Trustees oversees 300 funds. Mr. Chiel oversees 190 funds.
The Trustees hold office without limit in time except that (a) any Trustee may resign; (b) any Trustee may be removed by written instrument, signed by at least two-thirds of the number of Trustees prior to such removal; (c) any Trustee who requests to be retired or who has become incapacitated by illness or injury may be retired by written instrument signed by a majority of the other Trustees; and (d) any Trustee may be removed at any special meeting of shareholders by a two-thirds vote of the outstanding voting securities of the trust. Each Trustee who is not an interested person (as defined in the 1940 Act) of the trust and the fund is referred to herein as an Independent Trustee. Each Independent Trustee shall retire not later than the last day of the calendar year in which his or her 75th birthday occurs. The Independent Trustees may waive this mandatory retirement age policy with respect to individual Trustees. Officers and Advisory Board Members hold office without limit in time, except that any officer or Advisory Board Member may resign or may be removed by a vote of a majority of the Trustees at any regular meeting or any special meeting of the Trustees. Except as indicated, each individual has held the office shown or other offices in the same company for the past five years.
The fund’s Statement of Additional Information (SAI) includes more information about the Trustees. To request a free copy, call Fidelity at 1-800-544-3455 (for managed account clients) or 1-800-835-5092 (for retirement plan participants).
Experience, Skills, Attributes, and Qualifications of the Trustees. The Governance and Nominating Committee has adopted a statement of policy that describes the experience, qualifications, attributes, and skills that are necessary and desirable for potential Independent Trustee candidates (Statement of Policy). The Board believes that each Trustee satisfied at the time he or she was initially elected or appointed a Trustee, and continues to satisfy, the standards contemplated by the Statement of Policy. The Governance and Nominating Committee also engages professional search firms to help identify potential Independent Trustee candidates who have the experience, qualifications, attributes, and skills consistent with the Statement of Policy. From time to time, additional criteria based on the composition and skills of the current Independent Trustees, as well as experience or skills that may be appropriate in light of future changes to board composition, business conditions, and regulatory or other developments, have also been considered by the professional search firms and the Governance and Nominating Committee. In addition, the Board takes into account the Trustees' commitment and participation in Board and committee meetings, as well as their leadership of standing and ad hoc committees throughout their tenure.
In determining that a particular Trustee was and continues to be qualified to serve as a Trustee, the Board has considered a variety of criteria, none of which, in isolation, was controlling. The Board believes that, collectively, the Trustees have balanced and diverse experience, qualifications, attributes, and skills, which allow the Board to operate effectively in governing the fund and protecting the interests of shareholders. Information about the specific experience, skills, attributes, and qualifications of each Trustee, which in each case led to the Board's conclusion that the Trustee should serve (or continue to serve) as a trustee of the fund, is provided below.
Board Structure and Oversight Function. Abigail P. Johnson is an interested person and currently serves as Chairman. The Trustees have determined that an interested Chairman is appropriate and benefits shareholders because an interested Chairman has a personal and professional stake in the quality and continuity of services provided to the fund. Independent Trustees exercise their informed business judgment to appoint an individual of their choosing to serve as Chairman, regardless of whether the Trustee happens to be independent or a member of management. The Independent Trustees have determined that they can act independently and effectively without having an Independent Trustee serve as Chairman and that a key structural component for assuring that they are in a position to do so is for the Independent Trustees to constitute a substantial majority for the Board. The Independent Trustees also regularly meet in executive session. Michael E. Kenneally serves as Chairman of the Independent Trustees and as such (i) acts as a liaison between the Independent Trustees and management with respect to matters important to the Independent Trustees and (ii) with management prepares agendas for Board meetings.
Fidelity® funds are overseen by different Boards of Trustees. The fund's Board oversees Fidelity's investment-grade bond, money market, asset allocation and certain equity funds, and other Boards oversee Fidelity's high income and other equity funds. The asset allocation funds may invest in Fidelity® funds that are overseen by such other Boards. The use of separate Boards, each with its own committee structure, allows the Trustees of each group of Fidelity® funds to focus on the unique issues of the funds they oversee, including common research, investment, and operational issues. On occasion, the separate Boards establish joint committees to address issues of overlapping consequences for the Fidelity® funds overseen by each Board.
The Trustees operate using a system of committees to facilitate the timely and efficient consideration of all matters of importance to the Trustees, the fund, and fund shareholders and to facilitate compliance with legal and regulatory requirements and oversight of the fund's activities and associated risks. The Board, acting through its committees, has charged FMR and its affiliates with (i) identifying events or circumstances the occurrence of which could have demonstrably adverse effects on the fund's business and/or reputation; (ii) implementing processes and controls to lessen the possibility that such events or circumstances occur or to mitigate the effects of such events or circumstances if they do occur; and (iii) creating and maintaining a system designed to evaluate continuously business and market conditions in order to facilitate the identification and implementation processes described in (i) and (ii) above. Because the day-to-day operations and activities of the fund are carried out by or through FMR, its affiliates, and other service providers, the fund's exposure to risks is mitigated but not eliminated by the processes overseen by the Trustees. While each of the Board's committees has responsibility for overseeing different aspects of the fund's activities, oversight is exercised primarily through the Operations and Audit Committees. In addition, an ad hoc Board committee of Independent Trustees has worked with FMR to enhance the Board's oversight of investment and financial risks, legal and regulatory risks, technology risks, and operational risks, including the development of additional risk reporting to the Board. Appropriate personnel, including but not limited to the fund's Chief Compliance Officer (CCO), FMR's internal auditor, the independent accountants, the fund's Treasurer and portfolio management personnel, make periodic reports to the Board's committees, as appropriate, including an annual review of Fidelity's risk management program for the Fidelity® funds. The responsibilities of each standing committee, including their oversight responsibilities, are described further under "Standing Committees of the Trustees."
Interested Trustees*:
Correspondence intended for a Trustee who is an interested person may be sent to Fidelity Investments, 245 Summer Street, Boston, Massachusetts 02210.
Name, Year of Birth; Principal Occupations and Other Relevant Experience+
Jonathan Chiel (1957)
Year of Election or Appointment: 2016
Trustee
Mr. Chiel also serves as Trustee of other Fidelity® funds. Mr. Chiel is Executive Vice President and General Counsel for FMR LLC (diversified financial services company, 2012-present). Previously, Mr. Chiel served as general counsel (2004-2012) and senior vice president and deputy general counsel (2000-2004) for John Hancock Financial Services; a partner with Choate, Hall & Stewart (1996-2000) (law firm); and an Assistant United States Attorney for the United States Attorney’s Office of the District of Massachusetts (1986-95), including Chief of the Criminal Division (1993-1995). Mr. Chiel is a director on the boards of the Boston Bar Foundation and the Maimonides School.
Abigail P. Johnson (1961)
Year of Election or Appointment: 2009
Trustee
Chairman of the Board of Trustees
Ms. Johnson also serves as Trustee of other Fidelity® funds. Ms. Johnson serves as Chairman (2016-present), Chief Executive Officer (2014-present), and Director (2007-present) of FMR LLC (diversified financial services company), President of Fidelity Financial Services (2012-present) and President of Personal, Workplace and Institutional Services (2005-present). Ms. Johnson is Chairman and Director of Fidelity Management & Research Company LLC (investment adviser firm, 2011-present). Previously, Ms. Johnson served as Chairman and Director of FMR Co., Inc. (investment adviser firm, 2011-2019), Vice Chairman (2007-2016) and President (2013-2016) of FMR LLC, President and a Director of Fidelity Management & Research Company (2001-2005), a Trustee of other investment companies advised by Fidelity Management & Research Company, Fidelity Investments Money Management, Inc. (investment adviser firm), and FMR Co., Inc. (2001-2005), Senior Vice President of the Fidelity® funds (2001-2005), and managed a number of Fidelity® funds. Ms. Abigail P. Johnson and Mr. Arthur E. Johnson are not related.
Jennifer Toolin McAuliffe (1959)
Year of Election or Appointment: 2016
Trustee
Ms. McAuliffe also serves as Trustee of other Fidelity® funds and as Trustee of Fidelity Charitable (2020-present). Previously, Ms. McAuliffe served as Co-Head of Fixed Income of Fidelity Investments Limited (now known as FIL Limited (FIL)) (diversified financial services company), Director of Research for FIL’s credit and quantitative teams in London, Hong Kong and Tokyo and Director of Research for taxable and municipal bonds at Fidelity Investments Money Management, Inc. Ms. McAuliffe previously served as a member of the Advisory Board of certain Fidelity® funds (2016). Ms. McAuliffe was previously a lawyer at Ropes & Gray LLP and currently serves as director or trustee of several not-for-profit entities.
* Determined to be an “Interested Trustee” by virtue of, among other things, his or her affiliation with the trust or various entities under common control with FMR.
+ The information includes the Trustee's principal occupation during the last five years and other information relating to the experience, attributes, and skills relevant to the Trustee's qualifications to serve as a Trustee, which led to the conclusion that the Trustee should serve as a Trustee for the fund.
Independent Trustees:
Correspondence intended for an Independent Trustee may be sent to Fidelity Investments, P.O. Box 55235, Boston, Massachusetts 02205-5235.
Name, Year of Birth; Principal Occupations and Other Relevant Experience+
Elizabeth S. Acton (1951)
Year of Election or Appointment: 2013
Trustee
Ms. Acton also serves as Trustee of other Fidelity® funds. Prior to her retirement, Ms. Acton served as Executive Vice President, Finance (2011-2012), Executive Vice President, Chief Financial Officer (2002-2011) and Treasurer (2004-2005) of Comerica Incorporated (financial services). Prior to joining Comerica, Ms. Acton held a variety of positions at Ford Motor Company (1983-2002), including Vice President and Treasurer (2000-2002) and Executive Vice President and Chief Financial Officer of Ford Motor Credit Company (1998-2000). Ms. Acton currently serves as a member of the Board and Audit and Finance Committees of Beazer Homes USA, Inc. (homebuilding, 2012-present). Ms. Acton previously served as a member of the Advisory Board of certain Fidelity® funds (2013-2016).
Ann E. Dunwoody (1953)
Year of Election or Appointment: 2018
Trustee
General Dunwoody also serves as Trustee of other Fidelity® funds. General Dunwoody (United States Army, Retired) was the first woman in U.S. military history to achieve the rank of four-star general and prior to her retirement in 2012 held a variety of positions within the U.S. Army, including Commanding General, U.S. Army Material Command (2008-2012). General Dunwoody currently serves as President of First to Four LLC (leadership and mentoring services, 2012-present), a member of the Board and Nomination and Corporate Governance Committees of Kforce Inc. (professional staffing services, 2016-present) and a member of the Board of Automattic Inc. (software engineering, 2018-present). Previously, General Dunwoody served as a member of the Advisory Board and Nominating and Corporate Governance Committee of L3 Technologies, Inc. (communication, electronic, sensor and aerospace systems, 2013-2019) and a member of the Board and Audit and Sustainability and Corporate Responsibility Committees of Republic Services, Inc. (waste collection, disposal and recycling, 2013-2016). Ms. Dunwoody also serves on several boards for non-profit organizations, including as a member of the Board, Chair of the Nomination and Governance Committee and a member of the Audit Committee of Logistics Management Institute (consulting non-profit, 2012-present), a member of the Council of Trustees for the Association of the United States Army (advocacy non-profit, 2013-present), a member of the Board of Florida Institute of Technology (2015-present) and a member of the Board of ThanksUSA (military family education non-profit, 2014-present). General Dunwoody previously served as a member of the Advisory Board of certain Fidelity® funds (2018).
John Engler (1948)
Year of Election or Appointment: 2014
Trustee
Mr. Engler also serves as Trustee of other Fidelity® funds. Previously, Mr. Engler served as Governor of Michigan (1991-2003), President of the Business Roundtable (2011-2017) and interim President of Michigan State University (2018-2019). Mr. Engler currently serves as a member of the Board of Stride, Inc. (formerly K12 Inc.) (technology-based education company, 2012-present). Previously, Mr. Engler served as a member of the Board of Universal Forest Products (manufacturer and distributor of wood and wood-alternative products, 2003-2019) and Trustee of The Munder Funds (2003-2014). Mr. Engler previously served as a member of the Advisory Board of certain Fidelity® funds (2014-2016).
Robert F. Gartland (1951)
Year of Election or Appointment: 2010
Trustee
Mr. Gartland also serves as Trustee of other Fidelity® funds. Prior to his retirement, Mr. Gartland held a variety of positions at Morgan Stanley (financial services, 1979-2007), including Managing Director (1987-2007) and Chase Manhattan Bank (1975-1978). Mr. Gartland previously served as Chairman and an investor in Gartland & Mellina Group Corp. (consulting, 2009-2019), as a member of the Board of National Securities Clearing Corporation (1993-1996) and as Chairman of TradeWeb (2003-2004).
Arthur E. Johnson (1947)
Year of Election or Appointment: 2008
Trustee
Mr. Johnson also serves as Trustee of other Fidelity® funds. Prior to his retirement, Mr. Johnson served as Senior Vice President of Corporate Strategic Development of Lockheed Martin Corporation (defense contractor, 1999-2009). Mr. Johnson currently serves as a member of the Board of Booz Allen Hamilton (management consulting, 2011-present). Mr. Johnson previously served as a member of the Board of Eaton Corporation plc (diversified power management, 2009-2019) and a member of the Board of AGL Resources, Inc. (holding company, 2002-2016). Mr. Johnson previously served as Chairman (2018-2021) and Vice Chairman (2015-2018) of the Independent Trustees of certain Fidelity® funds. Mr. Arthur E. Johnson is not related to Ms. Abigail P. Johnson.
Michael E. Kenneally (1954)
Year of Election or Appointment: 2009
Trustee
Chairman of the Independent Trustees
Mr. Kenneally also serves as Trustee of other Fidelity® funds and was Vice Chairman (2018-2021) of the Independent Trustees of certain Fidelity® funds. Prior to retirement in 2005, he was Chairman and Global Chief Executive Officer of Credit Suisse Asset Management, the worldwide fund management and institutional investment business of Credit Suisse Group. Previously, Mr. Kenneally was an Executive Vice President and the Chief Investment Officer for Bank of America. In this role, he was responsible for the investment management, strategy and products delivered to the bank’s institutional, high-net-worth and retail clients. Earlier, Mr. Kenneally directed the organization’s equity and quantitative research groups. He began his career as a research analyst and then spent more than a dozen years as a portfolio manager for endowments, pension plans and mutual funds. He earned the Chartered Financial Analyst (CFA) designation in 1991.
Marie L. Knowles (1946)
Year of Election or Appointment: 2001
Trustee
Ms. Knowles also serves as Trustee of other Fidelity® funds. Prior to her retirement, Ms. Knowles held several positions at Atlantic Richfield Company (diversified energy), including Executive Vice President and Chief Financial Officer (1996-2000), Senior Vice President (1993-1996) and President of ARCO Transportation Company (pipeline and tanker operations, 1993-1996). Ms. Knowles currently serves as a member of the Board of the Santa Catalina Island Company (real estate, 2009-present), a member of the Investment Company Institute Board of Governors and a member of the Governing Council of the Independent Directors Council (2014-present). Ms. Knowles also serves as a member of the Advisory Board for the School of Engineering of the University of Southern California. Ms. Knowles previously served as a member of the Board of McKesson Corporation (healthcare service, 2002-2021). In addition, Ms. Knowles previously served as Chairman (2015-2018) and Vice Chairman (2012-2015) of the Independent Trustees of certain Fidelity® funds.
Mark A. Murray (1954)
Year of Election or Appointment: 2016
Trustee
Mr. Murray also serves as Trustee of other Fidelity® funds. Previously, Mr. Murray served as Co-Chief Executive Officer (2013-2016), President (2006-2013) and Vice Chairman (2013-2020) of Meijer, Inc. Mr. Murray serves as a member of the Board (2009-present) and Public Policy and Responsibility Committee (2009-present) and Chair of the Nuclear Review Committee (2019-present) of DTE Energy Company (diversified energy company). Mr. Murray previously served as a member of the Board of Spectrum Health (not-for-profit health system, 2015-2019) and as a member of the Board and Audit Committee and Chairman of the Nominating and Corporate Governance Committee of Universal Forest Products, Inc. (manufacturer and distributor of wood and wood-alternative products, 2004-2016). Mr. Murray also serves as a member of the Board of many community and professional organizations. Mr. Murray previously served as a member of the Advisory Board of certain Fidelity® funds (2016).
+ The information includes the Trustee's principal occupation during the last five years and other information relating to the experience, attributes, and skills relevant to the Trustee's qualifications to serve as a Trustee, which led to the conclusion that the Trustee should serve as a Trustee for the fund.
Advisory Board Members and Officers:
Correspondence intended for an officer may be sent to Fidelity Investments, 245 Summer Street, Boston, Massachusetts 02210. Officers appear below in alphabetical order.
Name, Year of Birth; Principal Occupation
Robert W. Helm (1957)
Year of Election or Appointment: 2021
Member of the Advisory Board
Mr. Helm also serves as a Member of the Advisory Board of other Fidelity® funds. Mr. Helm was formerly Deputy Chairman (2003-2020), partner (1991-2020) and an associate (1984-1991) of Dechert LLP (formerly Dechert Price & Rhoads). Mr. Helm currently serves on boards and committees of several not-for-profit organizations.
Craig S. Brown (1977)
Year of Election or Appointment: 2019
Assistant Treasurer
Mr. Brown also serves as an officer of other funds. Mr. Brown serves as Assistant Treasurer of FIMM, LLC (2021-present) and is an employee of Fidelity Investments (2013-present).
John J. Burke III (1964)
Year of Election or Appointment: 2018
Chief Financial Officer
Mr. Burke also serves as Chief Financial Officer of other funds. Mr. Burke serves as Head of Investment Operations for Fidelity Fund and Investment Operations (2018-present) and is an employee of Fidelity Investments (1998-present). Previously Mr. Burke served as head of Asset Management Investment Operations (2012-2018).
David J. Carter (1973)
Year of Election or Appointment: 2020
Assistant Secretary
Mr. Carter also serves as Assistant Secretary of other funds. Mr. Carter serves as Senior Vice President, Deputy General Counsel (2022-present) and is an employee of Fidelity Investments (2005-present).
Jonathan Davis (1968)
Year of Election or Appointment: 2010
Assistant Treasurer
Mr. Davis also serves as an officer of other funds. Mr. Davis serves as Assistant Treasurer of FIMM, LLC (2021-present), FMR Capital, Inc. (2017-present), FD Funds GP LLC (2021-present), FD Funds Holding LLC (2021-present), and FD Funds Management LLC (2021-present); and is an employee of Fidelity Investments. Previously, Mr. Davis served as Vice President and Associate General Counsel of FMR LLC (diversified financial services company, 2003-2010).
Laura M. Del Prato (1964)
Year of Election or Appointment: 2018
President and Treasurer
Ms. Del Prato also serves as an officer of other funds. Ms. Del Prato serves as Assistant Treasurer of FIMM, LLC (2021-present) and is an employee of Fidelity Investments (2017-present). Previously, Ms. Del Prato served as President and Treasurer of The North Carolina Capital Management Trust: Cash Portfolio and Term Portfolio (2018-2020). Prior to joining Fidelity Investments, Ms. Del Prato served as a Managing Director and Treasurer of the JPMorgan Mutual Funds (2014-2017). Prior to JPMorgan, Ms. Del Prato served as a partner at Cohen Fund Audit Services (accounting firm, 2012-2013) and KPMG LLP (accounting firm, 2004-2012).
Colm A. Hogan (1973)
Year of Election or Appointment: 2016
Assistant Treasurer
Mr. Hogan also serves as an officer of other funds. Mr. Hogan serves as Assistant Treasurer of FIMM, LLC (2021-present) and FMR Capital, Inc. (2017-present) and is an employee of Fidelity Investments (2005-present). Previously, Mr. Hogan served as Deputy Treasurer of certain Fidelity® funds (2016-2020) and Assistant Treasurer of certain Fidelity® funds (2016-2018).
Cynthia Lo Bessette (1969)
Year of Election or Appointment: 2019
Secretary and Chief Legal Officer (CLO)
Ms. Lo Bessette also serves as an officer of other funds. Ms. Lo Bessette serves as CLO, Secretary, and Senior Vice President of Fidelity Management & Research Company LLC (investment adviser firm, 2019-present); CLO of Fidelity Management & Research (Hong Kong) Limited, FMR Investment Management (UK) Limited, and Fidelity Management & Research (Japan) Limited (investment adviser firms, 2019-present); Secretary of FD Funds GP LLC (2021-present), FD Funds Holding LLC (2021-present), and FD Funds Management LLC (2021-present); and Assistant Secretary of FIMM, LLC (2019-present). She is a Senior Vice President and Deputy General Counsel of FMR LLC (diversified financial services company, 2019-present), and is an employee of Fidelity Investments. Previously, Ms. Lo Bessette served as CLO, Secretary, and Senior Vice President of FMR Co., Inc. (investment adviser firm, 2019); Secretary of Fidelity SelectCo, LLC and Fidelity Investments Money Management, Inc. (investment adviser firms, 2019). Prior to joining Fidelity Investments, Ms. Lo Bessette was Executive Vice President, General Counsel (2016-2019) and Senior Vice President, Deputy General Counsel (2015-2016) of OppenheimerFunds (investment management company) and Deputy Chief Legal Officer (2013-2015) of Jennison Associates LLC (investment adviser firm).
Chris Maher (1972)
Year of Election or Appointment: 2013
Assistant Treasurer
Mr. Maher also serves as an officer of other funds. Mr. Maher serves as Assistant Treasurer of FIMM, LLC (2021-present) and FMR Capital, Inc. (2017-present), and is an employee of Fidelity Investments (2008-present). Previously, Mr. Maher served as Assistant Treasurer of certain funds (2013-2020); Vice President of Asset Management Compliance (2013), Vice President of the Program Management Group of FMR (investment adviser firm, 2010-2013), and Vice President of Valuation Oversight (2008-2010).
Jamie Pagliocco (1964)
Year of Election or Appointment: 2020
Vice President
Mr. Pagliocco also serves as Vice President of other funds. Mr. Pagliocco serves as President of Fixed Income (2020-present), and is an employee of Fidelity Investments (2001-present). Previously, Mr. Pagliocco served as Co-Chief Investment Officer – Bond (2017-2020), Global Head of Bond Trading (2016-2019), and as a portfolio manager.
Kenneth B. Robins (1969)
Year of Election or Appointment: 2020
Chief Compliance Officer
Mr. Robins also serves as an officer of other funds. Mr. Robins serves as Compliance Officer of Fidelity Management & Research Company LLC (investment adviser firm, 2016-present) and is an employee of Fidelity Investments (2004-present). Previously, Mr. Robins served as Compliance Officer of FMR Co., Inc. (investment adviser firm, 2016-2019), as Executive Vice President of Fidelity Investments Money Management, Inc. (investment adviser firm, 2013-2016) and served in other fund officer roles.
Brett Segaloff (1972)
Year of Election or Appointment: 2021
Anti-Money Laundering (AML) Officer
Mr. Segaloff also serves as an AML Officer of other funds and other related entities. He is Director, Anti-Money Laundering (2007-present) of FMR LLC (diversified financial services company) and is an employee of Fidelity Investments (1996-present).
Stacie M. Smith (1974)
Year of Election or Appointment: 2013
Assistant Treasurer
Ms. Smith also serves as an officer of other funds. Ms. Smith serves as Assistant Treasurer of FIMM, LLC (2021-present) and FMR Capital, Inc. (2017-present), is an employee of Fidelity Investments (2009-present), and has served in other fund officer roles. Prior to joining Fidelity Investments, Ms. Smith served as Senior Audit Manager of Ernst & Young LLP (accounting firm, 1996-2009). Previously, Ms. Smith served as Assistant Treasurer (2013-2019) and Deputy Treasurer (2013-2016) of certain Fidelity® funds.
Jim Wegmann (1979)
Year of Election or Appointment: 2021
Deputy Treasurer
Mr. Wegmann also serves as an officer of other funds. Mr. Wegmann serves as Assistant Treasurer of FIMM, LLC (2021-present) and is an employee of Fidelity Investments (2011-present). Previously, Mr. Wegmann served as Assistant Treasurer of certain Fidelity® funds (2019-2021).
Shareholder Expense Example
As a shareholder, you incur two types of costs: (1) transaction costs, which may include sales charges (loads) on purchase payments or redemption proceeds, as applicable and (2) ongoing costs, which generally include management fees, distribution and/or service (12b-1) fees and other Fund expenses. This Example is intended to help you understand your ongoing costs (in dollars) of investing in a fund and to compare these costs with the ongoing costs of investing in other mutual funds.
The Example is based on an investment of $1,000 invested at the beginning of the period and held for the entire period (November 1, 2021 to April 30, 2022).
Actual Expenses
The first line of the accompanying table provides information about actual account values and actual expenses. You may use the information in this line, together with the amount you invested, to estimate the expenses that you paid over the period. Simply divide your account value by $1,000.00 (for example, an $8,600 account value divided by $1,000.00 = 8.6), then multiply the result by the number in the first line for a class/Fund under the heading entitled "Expenses Paid During Period" to estimate the expenses you paid on your account during this period. If any fund is a shareholder of any underlying mutual funds or exchange-traded funds (ETFs) (the Underlying Funds), such fund indirectly bears its proportional share of the expenses of the Underlying Funds in addition to the direct expenses incurred presented in the table. These fees and expenses are not included in the annualized expense ratio used to calculate the expense estimate in the table below.
Hypothetical Example for Comparison Purposes
The second line of the accompanying table provides information about hypothetical account values and hypothetical expenses based on the actual expense ratio and an assumed rate of return of 5% per year before expenses, which is not the actual return. The hypothetical account values and expenses may not be used to estimate the actual ending account balance or expenses you paid for the period. You may use this information to compare the ongoing costs of investing in the Fund and other funds. To do so, compare this 5% hypothetical example with the 5% hypothetical examples that appear in the shareholder reports of the other funds. If any fund is a shareholder of any Underlying Funds, such fund indirectly bears its proportional share of the expenses of the Underlying Funds in addition to the direct expenses as presented in the table. These fees and expenses are not included in the annualized expense ratio used to calculate the expense estimate in the table below.
Please note that the expenses shown in the table are meant to highlight your ongoing costs only and do not reflect any transaction costs. Therefore, the second line of the table is useful in comparing ongoing costs only, and will not help you determine the relative total costs of owning different funds. In addition, if these transactional costs were included, your costs would have been higher.
| Annualized Expense Ratio-A | Beginning Account Value November 1, 2021 | Ending Account Value April 30, 2022 | Expenses Paid During Period-B November 1, 2021 to April 30, 2022 |
|
| Fidelity Flex Mid Cap Index Fund | - %-C | |||
| Actual | $1,000.00 | $874.40 | $--D | |
| Hypothetical-E | $1,000.00 | $1,024.79 | $--D |
A Annualized expense ratio reflects expenses net of applicable fee waivers.
B Expenses are equal to the annualized expense ratio, multiplied by the average account value over the period, multiplied by 181/ 365 (to reflect the one-half year period). The fees and expenses of any Underlying Funds are not included in each annualized expense ratio.
C Amount represents less than .005%.
D Amount represents less than $.005.
E 5% return per year before expenses
Distributions (Unaudited)
The dividend and capital gains distributions for the fund(s) are available on Fidelity.com or Institutional.Fidelity.com.
The fund hereby designates as a capital gain dividend with respect to the taxable year ended April 30, 2022, $3,664,595, or, if subsequently determined to be different, the net capital gain of such year.
The fund designates 100% of the short-term capital gain dividends distributed during the fiscal year as qualifying to be taxed as short-term capital gain dividends for nonresident alien shareholders.
The fund designates 82% and 46% of the dividends distributed in June and December 2021, respectively during the fiscal year as qualifying for the dividends–received deduction for corporate shareholders.
The fund designates 88% and 49% of the dividends distributed in June and December, respectively during the fiscal year as amounts which may be taken into account as a dividend for the purposes of the maximum rate under section 1(h)(11) of the Internal Revenue Code.
The fund designates 4% and 13% of the dividends distributed in June and December, respectively during the fiscal year as a section 199A dividend.
The fund will notify shareholders in January 2023 of amounts for use in preparing 2022 income tax returns.
Liquidity Risk Management Program
The Securities and Exchange Commission adopted Rule 22e-4 under the Investment Company Act of 1940 (the Liquidity Rule) to promote effective liquidity risk management throughout the open-end investment company industry, thereby reducing the risk that funds will be unable to meet their redemption obligations and mitigating dilution of the interests of fund shareholders.
The Fund has adopted and implemented a liquidity risk management program pursuant to the Liquidity Rule (the Program) effective December 1, 2018. The Program is reasonably designed to assess and manage the Fund’s liquidity risk and to comply with the requirements of the Liquidity Rule. The Fund’s Board of Trustees (the Board) has designated the Fund’s investment adviser as administrator of the Program. The Fidelity advisers have established a Liquidity Risk Management Committee (the LRM Committee) to manage the Program for each of the Fidelity Funds. The LRM Committee monitors the adequacy and effectiveness of implementation of the Program and on a periodic basis assesses each Fund’s liquidity risk based on a variety of factors including (1) the Fund’s investment strategy, (2) portfolio liquidity and cash flow projections during normal and reasonably foreseeable stressed conditions, (3) shareholder redemptions, (4) borrowings and other funding sources and (5) in the case of exchange-traded funds, certain additional factors including the effect of the Fund’s prices and spreads, market participants, and basket compositions on the overall liquidity of the Fund’s portfolio, as applicable.
In accordance with the Program, each of the Fund’s portfolio investments is classified into one of four liquidity categories described below based on a determination of a reasonable expectation for how long it would take to convert the investment to cash (or sell or dispose of the investment) without significantly changing its market value.
- Highly liquid investments – cash or convertible to cash within three business days or less
- Moderately liquid investments – convertible to cash in three to seven calendar days
- Less liquid investments – can be sold or disposed of, but not settled, within seven calendar days
- Illiquid investments – cannot be sold or disposed of within seven calendar days
Liquidity classification determinations take into account a variety of factors including various market, trading and investment-specific considerations, as well as market depth, and generally utilize analysis from a third-party liquidity metrics service.
The Liquidity Rule places a 15% limit on a fund’s illiquid investments and requires funds that do not primarily hold assets that are highly liquid investments to determine and maintain a minimum percentage of the fund’s net assets to be invested in highly liquid investments (highly liquid investment minimum or HLIM). The Program includes provisions reasonably designed to comply with the 15% limit on illiquid investments and for determining, periodically reviewing and complying with the HLIM requirement as applicable.
At a recent meeting of the Fund’s Board of Trustees, the LRM Committee provided a written report to the Board pertaining to the operation, adequacy, and effectiveness of implementation of the Program for the annual period from December 1, 2020 through November 30, 2021. The report concluded that the Program has been implemented and is operating effectively and is reasonably designed to assess and manage the Fund’s liquidity risk.

ZMP-ANN-0622
1.9881627.105
Fidelity Flex® Funds
Fidelity Flex® Small Cap Index Fund
April 30, 2022
Contents
To view a fund's proxy voting guidelines and proxy voting record for the 12-month period ended June 30, visit http://www.fidelity.com/proxyvotingresults or visit the Securities and Exchange Commission's (SEC) web site at http://www.sec.gov.
You may also call 1-800-544-3455 (for managed account clients) or 1-800-835-5092 (for retirement plan participants) to request a free copy of the proxy voting guidelines.
The fund is not in any way connected to or sponsored, endorsed, sold or promoted by the London Stock Exchange Group plc and its group undertakings (collectively, the “LSE Group”). The LSE Group does not accept any liability whatsoever to any person arising out of the use of the fund or the underlying data.
Standard & Poor's, S&P and S&P 500 are registered service marks of The McGraw-Hill Companies, Inc. and have been licensed for use by Fidelity Distributors Corporation.
Other third-party marks appearing herein are the property of their respective owners.
All other marks appearing herein are registered or unregistered trademarks or service marks of FMR LLC or an affiliated company. © 2022 FMR LLC. All rights reserved.
This report and the financial statements contained herein are submitted for the general information of the shareholders of the Fund. This report is not authorized for distribution to prospective investors in the Fund unless preceded or accompanied by an effective prospectus.
A fund files its complete schedule of portfolio holdings with the SEC for the first and third quarters of each fiscal year on Form N-PORT. Forms N-PORT are available on the SEC’s web site at http://www.sec.gov. A fund's Forms N-PORT may be reviewed and copied at the SEC’s Public Reference Room in Washington, DC. Information regarding the operation of the SEC's Public Reference Room may be obtained by calling 1-800-SEC-0330.
For a complete list of a fund's portfolio holdings, view the most recent holdings listing, semiannual report, or annual report on Fidelity's web site at http://www.fidelity.com, http://www.institutional.fidelity.com, or http://www.401k.com, as applicable.
NOT FDIC INSURED •MAY LOSE VALUE •NO BANK GUARANTEE
Neither the Fund nor Fidelity Distributors Corporation is a bank.
Note to Shareholders:
Early in 2020, the outbreak and spread of COVID-19 emerged as a public health emergency that had a major influence on financial markets, primarily based on its impact on the global economy and corporate earnings. On March 11, 2020, the World Health Organization declared the COVID-19 outbreak a pandemic, citing sustained risk of further global spread. The pandemic prompted a number of measures to limit the spread of COVID-19, including travel and border restrictions, quarantines, and restrictions on large gatherings. In turn, these resulted in lower consumer activity, diminished demand for a wide range of products and services, disruption in manufacturing and supply chains, and – given the wide variability in outcomes regarding the outbreak – significant market uncertainty and volatility. To help stem the turmoil, the U.S. government took unprecedented action – in concert with the U.S. Federal Reserve and central banks around the world – to help support consumers, businesses, and the broader economy, and to limit disruption to the financial system.
In general, the overall impact of the pandemic lessened in 2021, amid a resilient economy and widespread distribution of three COVID-19 vaccines granted emergency use authorization from the U.S. Food and Drug Administration (FDA) early in the year. Still, the situation remains dynamic, and the extent and duration of its influence on financial markets and the economy is highly uncertain, due in part to a recent spike in cases based on highly contagious variants of the coronavirus.
Extreme events such as the COVID-19 crisis are exogenous shocks that can have significant adverse effects on mutual funds and their investments. Although multiple asset classes may be affected by market disruption, the duration and impact may not be the same for all types of assets. Fidelity is committed to helping you stay informed amid news about COVID-19 and during increased market volatility, and we continue to take extra steps to be responsive to customer needs. We encourage you to visit us online, where we offer ongoing updates, commentary, and analysis on the markets and our funds.
Performance: The Bottom Line
Average annual total return reflects the change in the value of an investment, assuming reinvestment of distributions from dividend income and capital gains (the profits earned upon the sale of securities that have grown in value, if any) and assuming a constant rate of performance each year. The hypothetical investment and the average annual total returns do not reflect the deduction of taxes that a shareholder would pay on fund distributions or the redemption of fund shares. During periods of reimbursement by Fidelity, a fund’s total return will be greater than it would be had the reimbursement not occurred. How a fund did yesterday is no guarantee of how it will do tomorrow.
Average Annual Total Returns
| For the periods ended April 30, 2022 | Past 1 year | Past 5 years | Life of fundA |
| Fidelity Flex® Small Cap Index Fund | (16.88)% | 7.33% | 7.76% |
A From March 9, 2017
$10,000 Over Life of Fund
Let's say hypothetically that $10,000 was invested in Fidelity Flex® Small Cap Index Fund on March 9, 2017, when the fund started.
The chart shows how the value of your investment would have changed, and also shows how the Russell 2000® Index performed over the same period.

| Period Ending Values | ||
|
| $14,688 | Fidelity Flex® Small Cap Index Fund |
|
| $14,634 | Russell 2000® Index |
Management's Discussion of Fund Performance
Market Recap: The S&P 500® index gained 0.21% for the 12 months ending April 30, 2022. After posting a strong result in 2021, large-cap stocks retreated to begin the new year amid several notable headwinds that stoked volatility, uncertainty and investor anxiety. Chief among these was the U.S. Federal Reserve’s accelerated plan to hike interest rates and aggressively wind down its balance sheet in an attempt to rein in historically high inflation. In addition, geopolitical unrest rose as Russia invaded Ukraine in late February and escalated its attack through period end. Other factors influencing stocks included surging commodity prices, rising bond yields, supply constraint and disruption, and the potential for variants of the coronavirus to upend the economy. Against this backdrop, the S&P 500® index returned -5.17% in January and -2.99% in February, falling on mixed corporate earnings, particularly among some highflying tech firms. Volatility eased in March and the index gained 3.71% for the month. April saw a sharp reversal, with the index returning -8.72% amid clearer signals of the Fed’s intension to tighten monetary policy and angst about the economic toll of “zero-COVID” lockdowns in China. It was the largest monthly decline for the S&P 500® since March 2020. For the full 12 months, the growth-oriented communication services (-22%) and consumer discretionary (-11%) sectors lagged most. In contrast, energy (+61%) rode a surge in commodity prices and led the market by a wide margin, followed by the defensive consumer staples (+17%) sector. Comments from the Geode Capital Management, LLC, passive equity index team: For the fiscal year ending April 30, 2022, the fund returned -16.88%, roughly in line with the -16.87% result of the benchmark Russell 2000® Index. By sector, stocks in the health care sector returned -42% and detracted most, followed by consumer discretionary, which returned -26%. Information technology returned -17% and financials detracted roughly -11%, especially in the banks industry (-8%). Industrials (-9%) and communication services (-24%), especially in the media & entertainment industry (-24%), hampered results. Other notable detractors included the materials (-7%), and consumer staples (-5%) sectors. Real estate (-2%) also hurt. Conversely, energy advanced 67% and contributed most. Utilities stocks also helped, gaining 2%. Turning to individual stocks, the biggest individual detractor was Redfin (-84%), from the real estate sector. Invitae, within the health care equipment & services category, returned -85% and hindered the fund. Other detractors from the pharmaceuticals, biotechnology & life sciences industry were Twist Bioscience (-78%), Bridgebio Pharma (-86%), and TG Therapeutics (-84%). Conversely, the biggest individual contributor was Avis Budget (+200%), from the transportation segment. In energy, Ovintiv (+118%), Antero Resources (+290%), and Range Resources (+205%) helped. Regal Rexnord, within the capital goods group, gained 3% and boosted the fund.The views expressed above reflect those of the portfolio manager(s) only through the end of the period as stated on the cover of this report and do not necessarily represent the views of Fidelity or any other person in the Fidelity organization. Any such views are subject to change at any time based upon market or other conditions and Fidelity disclaims any responsibility to update such views. These views may not be relied on as investment advice and, because investment decisions for a Fidelity fund are based on numerous factors, may not be relied on as an indication of trading intent on behalf of any Fidelity fund.
Investment Summary (Unaudited)
Top Ten Stocks as of April 30, 2022
| % of fund's net assets | |
| Ovintiv, Inc. | 0.5 |
| Avis Budget Group, Inc. | 0.5 |
| Antero Resources Corp. | 0.4 |
| BJ's Wholesale Club Holdings, Inc. | 0.4 |
| Chesapeake Energy Corp. | 0.4 |
| AMC Entertainment Holdings, Inc. Class A | 0.3 |
| Tenet Healthcare Corp. | 0.3 |
| EastGroup Properties, Inc. | 0.3 |
| Southwestern Energy Co. | 0.3 |
| Tetra Tech, Inc. | 0.3 |
| 3.7 |
Market Sectors as of April 30, 2022
| % of fund's net assets | |
| Financials | 15.6 |
| Industrials | 15.3 |
| Health Care | 15.1 |
| Information Technology | 13.2 |
| Consumer Discretionary | 10.3 |
| Real Estate | 7.8 |
| Energy | 7.0 |
| Materials | 4.0 |
| Consumer Staples | 3.8 |
| Utilities | 3.1 |
| Communication Services | 2.9 |
Asset Allocation (% of fund's net assets)
| As of April 30, 2022* | ||
| Stocks and Equity Futures | 100.1% | |
| Short-Term Investments and Net Other Assets (Liabilities)** | (0.1)% | |

* Foreign investments - 4.6%
** Short-Term Investments and Net Other Assets (Liabilities) are not included in the pie chart
Schedule of Investments April 30, 2022
Showing Percentage of Net Assets
| Common Stocks - 98.1% | |||
| Shares | Value | ||
| COMMUNICATION SERVICES - 2.9% | |||
| Diversified Telecommunication Services - 0.6% | |||
| Anterix, Inc. (a) | 1,135 | $58,838 | |
| ATN International, Inc. | 620 | 24,490 | |
| Bandwidth, Inc. (a) | 2,161 | 47,801 | |
| Cogent Communications Group, Inc. | 4,177 | 244,355 | |
| Consolidated Communications Holdings, Inc. (a) | 7,226 | 42,995 | |
| EchoStar Holding Corp. Class A (a) | 3,677 | 85,858 | |
| Globalstar, Inc. (a) | 59,734 | 69,291 | |
| IDT Corp. Class B (a) | 1,469 | 38,899 | |
| Iridium Communications, Inc. (a) | 11,524 | 411,522 | |
| Liberty Latin America Ltd.: | |||
| Class A (a) | 4,591 | 42,421 | |
| Class C (a) | 15,095 | 139,478 | |
| Ooma, Inc. (a) | 2,380 | 30,559 | |
| Radius Global Infrastructure, Inc. (a) | 7,215 | 89,610 | |
| Telesat Corp. (a) | 198 | 2,226 | |
| 1,328,343 | |||
| Entertainment - 0.6% | |||
| AMC Entertainment Holdings, Inc. Class A (a)(b) | 50,132 | 767,020 | |
| Chicken Soup For The Soul Entertainment, Inc. (a) | 238 | 2,073 | |
| Cinemark Holdings, Inc. (a) | 10,533 | 167,053 | |
| CuriosityStream, Inc. Class A (a) | 3,709 | 7,529 | |
| Eros STX Global Corp. Class A (a) | 1,369 | 2,368 | |
| IMAX Corp. (a) | 4,894 | 77,423 | |
| Lions Gate Entertainment Corp.: | |||
| Class A (a) | 7,849 | 105,883 | |
| Class B (a) | 9,120 | 114,638 | |
| LiveOne, Inc. (a) | 3,113 | 2,117 | |
| Madison Square Garden Entertainment Corp. (a) | 2,557 | 187,300 | |
| Marcus Corp. (a)(b) | 1,569 | 24,680 | |
| 1,458,084 | |||
| Interactive Media & Services - 0.5% | |||
| CarGurus, Inc. Class A (a) | 9,285 | 303,434 | |
| Cars.com, Inc. (a) | 6,638 | 73,815 | |
| Eventbrite, Inc. (a) | 7,672 | 81,170 | |
| EverQuote, Inc. Class A (a) | 2,074 | 28,787 | |
| fuboTV, Inc. (a)(b) | 13,834 | 52,431 | |
| Liberty TripAdvisor Holdings, Inc. (a) | 6,922 | 10,383 | |
| MediaAlpha, Inc. Class A (a) | 986 | 14,534 | |
| Outbrain, Inc. | 2,646 | 23,814 | |
| QuinStreet, Inc. (a) | 5,056 | 48,083 | |
| Society Pass, Inc. | 274 | 551 | |
| TrueCar, Inc. (a) | 9,842 | 35,234 | |
| Yelp, Inc. (a) | 6,944 | 225,888 | |
| Ziff Davis, Inc. (a) | 4,227 | 373,498 | |
| 1,271,622 | |||
| Media - 1.0% | |||
| Advantage Solutions, Inc. Class A (a) | 7,669 | 38,575 | |
| AMC Networks, Inc. Class A (a) | 2,803 | 91,462 | |
| Audacy, Inc. Class A (a) | 11,541 | 29,314 | |
| Boston Omaha Corp. (a) | 2,003 | 41,743 | |
| Cardlytics, Inc. (a) | 3,173 | 108,294 | |
| Clear Channel Outdoor Holdings, Inc. (a) | 35,320 | 86,887 | |
| comScore, Inc. (a) | 8,250 | 16,665 | |
| Daily Journal Corp. (a) | 119 | 30,601 | |
| Digital Media Solutions, Inc. Class A (a) | 425 | 1,169 | |
| E.W. Scripps Co. Class A (a) | 5,666 | 93,262 | |
| Emerald Holding, Inc. (a) | 2,594 | 6,978 | |
| Entravision Communication Corp. Class A | 5,541 | 28,647 | |
| Fluent, Inc. (a) | 4,532 | 6,073 | |
| Gannett Co., Inc. (a) | 14,275 | 57,243 | |
| Gray Television, Inc. | 8,342 | 154,494 | |
| Hemisphere Media Group, Inc. (a) | 773 | 3,007 | |
| iHeartMedia, Inc. (a) | 10,918 | 174,579 | |
| Integral Ad Science Holding Corp. | 3,231 | 38,158 | |
| John Wiley & Sons, Inc. Class A | 4,173 | 212,364 | |
| Liberty Media Corp.: | |||
| Liberty Braves Class A (a) | 1,154 | 30,316 | |
| Liberty Braves Class C (a) | 3,296 | 82,763 | |
| Magnite, Inc. (a) | 12,877 | 124,263 | |
| National CineMedia, Inc. | 7,141 | 15,782 | |
| Scholastic Corp. | 2,617 | 96,436 | |
| Sinclair Broadcast Group, Inc. Class A | 4,560 | 101,414 | |
| Stagwell, Inc. (a) | 5,877 | 39,846 | |
| TechTarget, Inc. (a) | 2,569 | 172,919 | |
| TEGNA, Inc. | 21,409 | 472,068 | |
| Thryv Holdings, Inc. (a) | 718 | 18,546 | |
| WideOpenWest, Inc. (a) | 5,110 | 102,456 | |
| 2,476,324 | |||
| Wireless Telecommunication Services - 0.2% | |||
| Gogo, Inc. (a)(b) | 5,761 | 106,060 | |
| Shenandoah Telecommunications Co. | 4,696 | 94,859 | |
| Telephone & Data Systems, Inc. | 9,818 | 179,866 | |
| U.S. Cellular Corp. (a) | 1,431 | 41,184 | |
| 421,969 | |||
| TOTAL COMMUNICATION SERVICES | 6,956,342 | ||
| CONSUMER DISCRETIONARY - 10.3% | |||
| Auto Components - 1.2% | |||
| Adient PLC (a)(b) | 9,195 | 313,917 | |
| American Axle & Manufacturing Holdings, Inc. (a) | 11,055 | 73,184 | |
| Cooper-Standard Holding, Inc. (a) | 245 | 1,129 | |
| Dana, Inc. | 14,196 | 210,243 | |
| Dorman Products, Inc. (a) | 2,548 | 251,539 | |
| Fox Factory Holding Corp. (a) | 4,131 | 338,246 | |
| Gentherm, Inc. (a) | 3,234 | 218,036 | |
| LCI Industries | 2,413 | 234,833 | |
| Modine Manufacturing Co. (a) | 4,971 | 39,271 | |
| Motorcar Parts of America, Inc. (a) | 1,978 | 30,085 | |
| Patrick Industries, Inc. | 2,222 | 138,320 | |
| Standard Motor Products, Inc. | 1,993 | 85,061 | |
| Stoneridge, Inc. (a) | 2,552 | 50,300 | |
| Tenneco, Inc. (a) | 6,534 | 112,189 | |
| The Goodyear Tire & Rubber Co. (a) | 26,839 | 357,495 | |
| Visteon Corp. (a) | 2,707 | 283,450 | |
| XL Fleet Corp. (Class A) (a) | 10,722 | 15,011 | |
| XPEL, Inc. (a) | 1,756 | 75,982 | |
| 2,828,291 | |||
| Automobiles - 0.2% | |||
| Arcimoto, Inc. (a) | 3,199 | 10,749 | |
| Canoo, Inc. (a)(b) | 10,564 | 50,707 | |
| Fisker, Inc. (a)(b) | 15,930 | 160,256 | |
| Lordstown Motors Corp. Class A (a)(b) | 15,447 | 33,674 | |
| Winnebago Industries, Inc. | 3,144 | 167,198 | |
| Workhorse Group, Inc. (a)(b) | 15,441 | 46,477 | |
| 469,061 | |||
| Distributors - 0.0% | |||
| Funko, Inc. (a) | 2,602 | 42,387 | |
| Diversified Consumer Services - 0.6% | |||
| 2U, Inc. (a) | 7,356 | 73,413 | |
| Adtalem Global Education, Inc. (a) | 4,800 | 140,688 | |
| American Public Education, Inc. (a) | 1,893 | 36,800 | |
| Carriage Services, Inc. | 1,503 | 64,464 | |
| Coursera, Inc. | 7,227 | 135,940 | |
| European Wax Center, Inc. | 1,310 | 35,960 | |
| Graham Holdings Co. | 369 | 218,585 | |
| Laureate Education, Inc. Class A | 9,495 | 107,578 | |
| OneSpaWorld Holdings Ltd. (a) | 5,347 | 53,684 | |
| Perdoceo Education Corp. (a) | 6,735 | 75,297 | |
| PowerSchool Holdings, Inc. | 4,228 | 64,012 | |
| Regis Corp. (a) | 5,163 | 6,970 | |
| StoneMor, Inc. (a) | 3,224 | 7,641 | |
| Strategic Education, Inc. | 2,396 | 154,782 | |
| Stride, Inc. (a) | 4,018 | 157,907 | |
| Udemy, Inc. | 1,416 | 15,449 | |
| Vivint Smart Home, Inc. Class A (a) | 9,288 | 48,669 | |
| WW International, Inc. (a) | 4,904 | 48,010 | |
| 1,445,849 | |||
| Hotels, Restaurants & Leisure - 2.4% | |||
| Accel Entertainment, Inc. (a) | 5,470 | 64,710 | |
| Bally's Corp. (a) | 3,186 | 95,070 | |
| Biglari Holdings, Inc. (a) | 68 | 9,275 | |
| BJ's Restaurants, Inc. (a) | 2,228 | 61,916 | |
| Bloomin' Brands, Inc. | 8,601 | 189,136 | |
| Bluegreen Vacations Holding Corp. Class A | 1,362 | 35,821 | |
| Brinker International, Inc. (a) | 4,345 | 157,854 | |
| Carrols Restaurant Group, Inc. | 5,055 | 8,088 | |
| Century Casinos, Inc. (a) | 2,734 | 28,625 | |
| Chuy's Holdings, Inc. (a) | 1,992 | 49,820 | |
| Cracker Barrel Old Country Store, Inc. (b) | 2,304 | 255,721 | |
| Dave & Buster's Entertainment, Inc. (a) | 4,269 | 194,240 | |
| Denny's Corp. (a) | 5,995 | 76,856 | |
| Dine Brands Global, Inc. | 1,599 | 114,632 | |
| Drive Shack, Inc. (a) | 719 | 884 | |
| El Pollo Loco Holdings, Inc. (a) | 1,876 | 19,979 | |
| Esports Technologies, Inc. (a) | 1,166 | 4,256 | |
| Everi Holdings, Inc. (a) | 8,217 | 142,647 | |
| F45 Training Holdings, Inc. | 3,233 | 28,418 | |
| Fiesta Restaurant Group, Inc. (a) | 1,972 | 13,410 | |
| First Watch Restaurant Group, Inc. | 1,307 | 16,991 | |
| Full House Resorts, Inc. (a) | 3,270 | 29,594 | |
| GAN Ltd. (a) | 202 | 753 | |
| Golden Entertainment, Inc. (a) | 1,650 | 79,134 | |
| Golden Nugget Online Gaming, Inc. (a) | 4,360 | 21,844 | |
| Hall of Fame Resort & Entertainment Co. (a) | 7,915 | 6,549 | |
| Hilton Grand Vacations, Inc. (a) | 8,319 | 389,579 | |
| International Game Technology PLC (b) | 9,743 | 212,690 | |
| Jack in the Box, Inc. | 2,057 | 170,237 | |
| Krispy Kreme, Inc. | 8,287 | 110,051 | |
| Kura Sushi U.S.A., Inc. Class A (a) | 433 | 21,728 | |
| Life Time Group Holdings, Inc. (b) | 3,927 | 56,156 | |
| Light & Wonder, Inc. Class A (a)(b) | 9,359 | 524,666 | |
| Lindblad Expeditions Holdings (a) | 3,093 | 47,354 | |
| Monarch Casino & Resort, Inc. (a) | 1,260 | 88,389 | |
| Nathan's Famous, Inc. | 248 | 11,748 | |
| NeoGames SA (a) | 1,169 | 15,279 | |
| Noodles & Co. (a) | 4,528 | 25,221 | |
| Papa John's International, Inc. | 3,199 | 291,269 | |
| PlayAGS, Inc. (a) | 1,877 | 12,388 | |
| Portillo's, Inc. (b) | 2,256 | 46,992 | |
| RCI Hospitality Holdings, Inc. | 877 | 54,339 | |
| Red Robin Gourmet Burgers, Inc. (a) | 1,635 | 21,566 | |
| Red Rock Resorts, Inc. | 5,206 | 228,856 | |
| Rush Street Interactive, Inc. (a) | 5,460 | 34,671 | |
| Ruth's Hospitality Group, Inc. | 3,234 | 67,817 | |
| SeaWorld Entertainment, Inc. (a) | 4,892 | 329,916 | |
| Shake Shack, Inc. Class A (a) | 3,645 | 210,790 | |
| Sweetgreen, Inc. Class A (b) | 1,242 | 33,534 | |
| Target Hospitality Corp. (a) | 2,497 | 15,631 | |
| Texas Roadhouse, Inc. Class A | 6,818 | 561,326 | |
| The Cheesecake Factory, Inc. | 4,504 | 166,243 | |
| The ONE Group Hospitality, Inc. (a) | 1,984 | 18,471 | |
| Wingstop, Inc. | 2,903 | 266,379 | |
| Xponential Fitness, Inc. | 1,185 | 24,553 | |
| 5,764,062 | |||
| Household Durables - 1.7% | |||
| Aterian, Inc. (a)(b) | 2,783 | 14,277 | |
| Bassett Furniture Industries, Inc. | 965 | 15,980 | |
| Beazer Homes U.S.A., Inc. (a) | 2,706 | 40,806 | |
| Cavco Industries, Inc. (a) | 893 | 210,971 | |
| Century Communities, Inc. | 2,906 | 153,204 | |
| Ethan Allen Interiors, Inc. | 2,202 | 52,275 | |
| GoPro, Inc. Class A (a) | 12,365 | 110,296 | |
| Green Brick Partners, Inc. (a) | 2,967 | 58,450 | |
| Hamilton Beach Brands Holding Co. Class A | 716 | 6,702 | |
| Helen of Troy Ltd. (a)(b) | 2,338 | 501,524 | |
| Hooker Furnishings Corp. | 952 | 16,051 | |
| Hovnanian Enterprises, Inc. Class A (a) | 506 | 23,286 | |
| Installed Building Products, Inc. | 2,322 | 186,851 | |
| iRobot Corp. (a) | 2,636 | 133,513 | |
| KB Home | 7,710 | 250,035 | |
| La-Z-Boy, Inc. | 4,245 | 111,559 | |
| Landsea Homes Corp. (a) | 927 | 7,722 | |
| Legacy Housing Corp. (a) | 713 | 12,492 | |
| LGI Homes, Inc. (a) | 2,102 | 196,978 | |
| Lifetime Brands, Inc. | 1,435 | 18,110 | |
| Lovesac (a) | 1,256 | 55,063 | |
| M.D.C. Holdings, Inc. | 5,553 | 204,961 | |
| M/I Homes, Inc. (a) | 2,730 | 120,884 | |
| Meritage Homes Corp. (a) | 3,562 | 294,043 | |
| Purple Innovation, Inc. (a) | 5,856 | 24,127 | |
| Skyline Champion Corp. (a) | 5,118 | 261,223 | |
| Snap One Holdings Corp. (a) | 1,837 | 21,952 | |
| Sonos, Inc. (a)(b) | 12,510 | 285,478 | |
| Taylor Morrison Home Corp. (a) | 11,543 | 302,311 | |
| Traeger, Inc. (a)(b) | 3,448 | 20,654 | |
| TRI Pointe Homes, Inc. (a) | 10,556 | 218,193 | |
| Tupperware Brands Corp. (a) | 4,751 | 83,523 | |
| Universal Electronics, Inc. (a) | 1,329 | 39,206 | |
| VOXX International Corp. (a) | 1,875 | 14,194 | |
| Vuzix Corp. (a)(b) | 6,152 | 31,806 | |
| Weber, Inc. | 2,191 | 19,237 | |
| 4,117,937 | |||
| Internet & Direct Marketing Retail - 0.4% | |||
| 1-800-FLOWERS.com, Inc. Class A (a) | 2,387 | 24,347 | |
| 1stDibs.com, Inc. | 2,185 | 16,519 | |
| a.k.a. Brands Holding Corp. | 1,392 | 4,914 | |
| CarParts.com, Inc. (a) | 5,017 | 30,052 | |
| Duluth Holdings, Inc. (a) | 1,222 | 14,970 | |
| Groupon, Inc. (a)(b) | 2,216 | 43,234 | |
| Lands' End, Inc. (a) | 1,419 | 19,894 | |
| Liquidity Services, Inc. (a) | 2,316 | 33,397 | |
| Overstock.com, Inc. (a) | 4,197 | 140,851 | |
| PetMed Express, Inc. (b) | 1,980 | 43,362 | |
| Porch Group, Inc. Class A (a) | 7,671 | 28,383 | |
| Quotient Technology, Inc. (a) | 8,913 | 47,328 | |
| Rent the Runway, Inc. Class A | 2,170 | 13,758 | |
| Revolve Group, Inc. (a) | 3,508 | 148,248 | |
| Shutterstock, Inc. | 2,272 | 172,036 | |
| Stitch Fix, Inc. (a) | 8,155 | 77,473 | |
| The RealReal, Inc. (a) | 8,119 | 44,005 | |
| Xometry, Inc. (b) | 2,409 | 79,063 | |
| 981,834 | |||
| Leisure Products - 0.5% | |||
| Acushnet Holdings Corp. | 3,307 | 134,727 | |
| American Outdoor Brands, Inc. (a) | 1,482 | 18,673 | |
| AMMO, Inc. (a)(b) | 8,621 | 34,915 | |
| Callaway Golf Co. (a)(b) | 11,303 | 247,988 | |
| Clarus Corp. | 2,573 | 57,507 | |
| Escalade, Inc. | 1,040 | 13,676 | |
| Genius Brands International, Inc. (a)(b) | 30,828 | 21,888 | |
| Johnson Outdoors, Inc. Class A | 503 | 38,469 | |
| Latham Group, Inc. (a) | 4,238 | 50,856 | |
| Malibu Boats, Inc. Class A (a) | 2,022 | 101,686 | |
| Marine Products Corp. | 808 | 9,486 | |
| MasterCraft Boat Holdings, Inc. (a) | 1,737 | 41,810 | |
| Nautilus, Inc. (a) | 3,833 | 11,537 | |
| Smith & Wesson Brands, Inc. | 4,633 | 63,611 | |
| Solo Brands, Inc. Class A | 1,434 | 8,561 | |
| Sturm, Ruger & Co., Inc. | 1,633 | 111,289 | |
| Vista Outdoor, Inc. (a) | 5,459 | 192,321 | |
| 1,159,000 | |||
| Multiline Retail - 0.4% | |||
| Big Lots, Inc. | 2,949 | 91,124 | |
| Dillard's, Inc. Class A | 526 | 159,804 | |
| Franchise Group, Inc. | 2,742 | 102,249 | |
| Macy's, Inc. | 29,261 | 707,238 | |
| 1,060,415 | |||
| Specialty Retail - 2.3% | |||
| Abercrombie & Fitch Co. Class A (a) | 5,455 | 188,634 | |
| Academy Sports & Outdoors, Inc. | 7,624 | 284,833 | |
| America's Car Mart, Inc. (a) | 596 | 48,187 | |
| American Eagle Outfitters, Inc. (b) | 14,893 | 225,033 | |
| Arko Corp. | 8,019 | 74,336 | |
| Asbury Automotive Group, Inc. (a) | 2,250 | 413,348 | |
| Barnes & Noble Education, Inc. (a) | 3,938 | 11,972 | |
| Bed Bath & Beyond, Inc. (a) | 9,401 | 127,948 | |
| Big 5 Sporting Goods Corp. (b) | 2,041 | 29,533 | |
| Boot Barn Holdings, Inc. (a) | 2,856 | 257,211 | |
| Caleres, Inc. | 3,580 | 82,089 | |
| Camping World Holdings, Inc. (b) | 4,092 | 105,083 | |
| CarLotz, Inc. Class A (a) | 474 | 421 | |
| Chico's FAS, Inc. (a) | 11,592 | 61,438 | |
| Citi Trends, Inc. (a) | 814 | 22,768 | |
| Conn's, Inc. (a) | 1,771 | 27,716 | |
| Designer Brands, Inc. Class A | 6,052 | 83,639 | |
| Genesco, Inc. (a) | 1,379 | 85,539 | |
| Group 1 Automotive, Inc. | 1,609 | 280,191 | |
| GrowGeneration Corp. (a)(b) | 5,408 | 31,961 | |
| Guess?, Inc. (b) | 3,944 | 88,622 | |
| Haverty Furniture Companies, Inc. | 1,574 | 39,082 | |
| Hibbett, Inc. | 1,356 | 58,552 | |
| JOANN, Inc. | 1,181 | 12,330 | |
| Lazydays Holdings, Inc. (a) | 730 | 14,184 | |
| LL Flooring Holdings, Inc. (a) | 3,009 | 41,554 | |
| MarineMax, Inc. (a) | 2,064 | 84,459 | |
| Monro, Inc. | 3,238 | 148,074 | |
| Murphy U.S.A., Inc. | 2,255 | 526,768 | |
| National Vision Holdings, Inc. (a)(b) | 8,068 | 303,760 | |
| OneWater Marine, Inc. Class A | 1,053 | 34,423 | |
| Party City Holdco, Inc. (a) | 11,257 | 34,784 | |
| Rent-A-Center, Inc. | 6,474 | 156,153 | |
| Sally Beauty Holdings, Inc. (a) | 10,665 | 161,255 | |
| Shift Technologies, Inc. Class A (a) | 420 | 563 | |
| Shoe Carnival, Inc. | 1,712 | 51,685 | |
| Signet Jewelers Ltd. (b) | 5,131 | 360,196 | |
| Sleep Number Corp. (a) | 2,183 | 88,542 | |
| Sonic Automotive, Inc. Class A (sub. vtg.) | 2,078 | 88,419 | |
| Sportsman's Warehouse Holdings, Inc. (a) | 4,345 | 41,755 | |
| The Aaron's Co., Inc. | 3,049 | 62,596 | |
| The Buckle, Inc. | 2,906 | 90,260 | |
| The Cato Corp. Class A (sub. vtg.) | 1,799 | 24,376 | |
| The Children's Place, Inc. (a) | 1,361 | 63,055 | |
| The Container Store Group, Inc. (a) | 3,411 | 26,094 | |
| The ODP Corp. (a) | 4,445 | 191,268 | |
| Tilly's, Inc. | 2,251 | 19,854 | |
| Torrid Holdings, Inc. | 1,534 | 8,989 | |
| TravelCenters of America LLC (a) | 1,194 | 45,384 | |
| Urban Outfitters, Inc. (a) | 6,708 | 159,650 | |
| Winmark Corp. | 326 | 66,243 | |
| Zumiez, Inc. (a) | 1,902 | 69,670 | |
| 5,604,479 | |||
| Textiles, Apparel & Luxury Goods - 0.6% | |||
| Crocs, Inc. (a) | 5,672 | 376,791 | |
| Fossil Group, Inc. (a) | 4,793 | 47,355 | |
| G-III Apparel Group Ltd. (a) | 4,293 | 113,679 | |
| Kontoor Brands, Inc. | 5,037 | 200,120 | |
| Movado Group, Inc. | 1,525 | 54,854 | |
| Oxford Industries, Inc. | 1,544 | 138,342 | |
| PLBY Group, Inc. (a) | 2,990 | 26,432 | |
| Rocky Brands, Inc. | 694 | 26,726 | |
| Steven Madden Ltd. | 7,799 | 320,227 | |
| Superior Group of Companies, Inc. | 794 | 12,625 | |
| Unifi, Inc. (a) | 1,335 | 19,584 | |
| Vera Bradley, Inc. (a) | 2,742 | 16,863 | |
| Wolverine World Wide, Inc. | 7,951 | 157,589 | |
| 1,511,187 | |||
| TOTAL CONSUMER DISCRETIONARY | 24,984,502 | ||
| CONSUMER STAPLES - 3.8% | |||
| Beverages - 0.4% | |||
| Celsius Holdings, Inc. (a) | 5,281 | 274,612 | |
| Coca-Cola Bottling Co. Consolidated | 456 | 201,324 | |
| Duckhorn Portfolio, Inc. (a) | 3,506 | 68,087 | |
| MGP Ingredients, Inc. | 1,365 | 124,665 | |
| National Beverage Corp. | 2,268 | 99,973 | |
| Primo Water Corp. | 15,271 | 223,567 | |
| Zevia PBC | 1,013 | 3,485 | |
| 995,713 | |||
| Food & Staples Retailing - 1.3% | |||
| Andersons, Inc. | 3,053 | 153,352 | |
| BJ's Wholesale Club Holdings, Inc. (a) | 13,302 | 855,984 | |
| Chefs' Warehouse Holdings (a) | 3,059 | 111,959 | |
| HF Foods Group, Inc. (a) | 3,521 | 20,563 | |
| Ingles Markets, Inc. Class A | 1,332 | 124,036 | |
| MedAvail Holdings, Inc. (a) | 3,613 | 5,998 | |
| Natural Grocers by Vitamin Cottage, Inc. | 1,072 | 21,858 | |
| Performance Food Group Co. (a) | 14,750 | 726,438 | |
| PriceSmart, Inc. | 2,374 | 188,614 | |
| Rite Aid Corp. (a) | 5,225 | 33,283 | |
| SpartanNash Co. | 3,401 | 116,586 | |
| Sprouts Farmers Market LLC (a) | 10,911 | 325,148 | |
| United Natural Foods, Inc. (a) | 5,589 | 239,936 | |
| Village Super Market, Inc. Class A | 766 | 17,764 | |
| Weis Markets, Inc. | 1,568 | 125,252 | |
| 3,066,771 | |||
| Food Products - 1.1% | |||
| AppHarvest, Inc. (a)(b) | 7,138 | 29,337 | |
| B&G Foods, Inc. Class A (b) | 6,271 | 168,878 | |
| Cal-Maine Foods, Inc. | 3,946 | 212,019 | |
| Calavo Growers, Inc. | 1,675 | 60,702 | |
| Fresh Del Monte Produce, Inc. | 3,214 | 83,725 | |
| Hostess Brands, Inc. Class A (a) | 13,252 | 300,688 | |
| J&J Snack Foods Corp. | 1,413 | 211,526 | |
| John B. Sanfilippo & Son, Inc. | 818 | 63,510 | |
| Lancaster Colony Corp. | 1,836 | 284,910 | |
| Landec Corp. (a) | 2,607 | 25,940 | |
| Limoneira Co. | 1,591 | 18,997 | |
| Mission Produce, Inc. (a) | 3,669 | 46,670 | |
| Sanderson Farms, Inc. | 1,934 | 366,242 | |
| Seneca Foods Corp. Class A (a) | 573 | 31,085 | |
| Sovos Brands, Inc. | 2,553 | 38,550 | |
| Tattooed Chef, Inc. (a)(b) | 4,745 | 37,913 | |
| The Simply Good Foods Co. (a) | 8,297 | 345,570 | |
| The Vita Coco Co., Inc. | 1,199 | 13,021 | |
| Tootsie Roll Industries, Inc. | 1,488 | 52,125 | |
| TreeHouse Foods, Inc. (a) | 5,105 | 160,808 | |
| Utz Brands, Inc. Class A | 6,013 | 84,904 | |
| Vital Farms, Inc. (a) | 945 | 10,868 | |
| Whole Earth Brands, Inc. Class A (a) | 3,952 | 27,308 | |
| 2,675,296 | |||
| Household Products - 0.3% | |||
| Central Garden & Pet Co. (a) | 1,422 | 62,269 | |
| Central Garden & Pet Co. Class A (non-vtg.) (a) | 3,424 | 141,685 | |
| Energizer Holdings, Inc. | 6,551 | 198,430 | |
| Oil-Dri Corp. of America | 598 | 14,920 | |
| WD-40 Co. | 1,338 | 246,165 | |
| 663,469 | |||
| Personal Products - 0.6% | |||
| BellRing Brands, Inc. (a) | 10,952 | 234,701 | |
| Edgewell Personal Care Co. | 5,267 | 200,883 | |
| elf Beauty, Inc. (a) | 4,667 | 113,548 | |
| Inter Parfums, Inc. | 1,723 | 140,821 | |
| MediFast, Inc. | 1,124 | 200,477 | |
| Nature's Sunshine Products, Inc. | 1,094 | 18,117 | |
| Newage, Inc. (a) | 3,071 | 1,216 | |
| Nu Skin Enterprises, Inc. Class A | 4,835 | 206,164 | |
| Revlon, Inc. (a) | 1,059 | 6,481 | |
| The Beauty Health Co. (a) | 8,539 | 111,861 | |
| The Honest Co., Inc. | 7,888 | 31,236 | |
| Thorne HealthTech, Inc. | 888 | 5,950 | |
| USANA Health Sciences, Inc. (a) | 1,138 | 87,239 | |
| Veru, Inc. (a)(b) | 6,424 | 75,289 | |
| 1,433,983 | |||
| Tobacco - 0.1% | |||
| 22nd Century Group, Inc. (a) | 16,666 | 31,832 | |
| Turning Point Brands, Inc. | 1,486 | 46,646 | |
| Universal Corp. | 2,358 | 136,410 | |
| Vector Group Ltd. | 14,015 | 178,271 | |
| 393,159 | |||
| TOTAL CONSUMER STAPLES | 9,228,391 | ||
| ENERGY - 7.0% | |||
| Energy Equipment & Services - 1.2% | |||
| Archrock, Inc. | 13,155 | 114,580 | |
| Bristow Group, Inc. (a) | 2,313 | 68,974 | |
| Cactus, Inc. (b) | 5,351 | 267,175 | |
| Championx Corp. | 19,715 | 415,987 | |
| DMC Global, Inc. (a) | 1,880 | 37,581 | |
| Dril-Quip, Inc. (a) | 3,405 | 98,336 | |
| Expro Group Holdings NV (a) | 4,570 | 69,830 | |
| Helix Energy Solutions Group, Inc. (a) | 14,246 | 58,551 | |
| Helmerich & Payne, Inc. | 9,969 | 458,873 | |
| Liberty Oilfield Services, Inc. Class A (a) | 9,047 | 146,019 | |
| Nabors Industries Ltd. (a) | 702 | 108,543 | |
| Newpark Resources, Inc. (a) | 8,650 | 30,189 | |
| Nextier Oilfield Solutions, Inc. (a) | 16,808 | 185,392 | |
| Oceaneering International, Inc. (a) | 9,666 | 109,516 | |
| Oil States International, Inc. (a) | 6,281 | 42,460 | |
| Patterson-UTI Energy, Inc. | 18,106 | 297,663 | |
| ProPetro Holding Corp. (a) | 8,415 | 118,988 | |
| RPC, Inc. (a) | 6,486 | 67,065 | |
| Select Energy Services, Inc. Class A (a) | 6,237 | 48,399 | |
| Solaris Oilfield Infrastructure, Inc. Class A | 3,132 | 35,235 | |
| TETRA Technologies, Inc. (a) | 12,354 | 45,463 | |
| Tidewater, Inc. (a) | 4,037 | 80,579 | |
| U.S. Silica Holdings, Inc. (a) | 7,183 | 133,460 | |
| 3,038,858 | |||
| Oil, Gas & Consumable Fuels - 5.8% | |||
| Aemetis, Inc. (a) | 2,689 | 24,551 | |
| Alto Ingredients, Inc. (a) | 7,084 | 40,875 | |
| Antero Resources Corp. (a) | 27,749 | 976,765 | |
| Arch Resources, Inc. (b) | 1,458 | 242,582 | |
| Berry Corp. | 6,515 | 71,470 | |
| Brigham Minerals, Inc. Class A | 4,219 | 104,547 | |
| California Resources Corp. | 7,840 | 315,246 | |
| Callon Petroleum Co. (a) | 4,683 | 240,097 | |
| Centennial Resource Development, Inc. Class A (a) | 17,927 | 138,755 | |
| Centrus Energy Corp. Class A (a) | 970 | 26,927 | |
| Chesapeake Energy Corp. (b) | 10,142 | 831,847 | |
| Civitas Resources, Inc. | 4,242 | 248,666 | |
| Clean Energy Fuels Corp. (a) | 15,309 | 89,711 | |
| CNX Resources Corp. (a) | 19,475 | 400,211 | |
| Comstock Resources, Inc. (a) | 8,847 | 150,664 | |
| CONSOL Energy, Inc. (a) | 3,334 | 158,532 | |
| Crescent Energy, Inc. Class A | 2,846 | 44,711 | |
| CVR Energy, Inc. | 2,885 | 72,327 | |
| Delek U.S. Holdings, Inc. (a) | 6,441 | 155,872 | |
| Denbury, Inc. (a) | 4,888 | 312,734 | |
| DHT Holdings, Inc. | 13,734 | 77,185 | |
| Dorian LPG Ltd. | 3,003 | 44,204 | |
| Earthstone Energy, Inc. (a) | 2,960 | 39,930 | |
| Energy Fuels, Inc. (a)(b) | 15,159 | 113,844 | |
| Equitrans Midstream Corp. | 39,877 | 313,433 | |
| Falcon Minerals Corp. | 3,819 | 25,969 | |
| Frontline Ltd. (NY Shares) (a)(b) | 12,107 | 100,851 | |
| Gevo, Inc. (a)(b) | 19,343 | 71,763 | |
| Golar LNG Ltd. (a) | 9,818 | 219,138 | |
| Green Plains, Inc. (a) | 4,676 | 131,255 | |
| HighPeak Energy, Inc. | 517 | 14,119 | |
| International Seaways, Inc. | 4,639 | 98,022 | |
| Kinetik Holdings, Inc. | 326 | 23,195 | |
| Kosmos Energy Ltd. (a) | 43,584 | 294,628 | |
| Laredo Petroleum, Inc. (a) | 1,222 | 87,019 | |
| Magnolia Oil & Gas Corp. Class A | 13,859 | 322,083 | |
| Matador Resources Co. (b) | 10,740 | 524,327 | |
| Murphy Oil Corp. (b) | 14,200 | 540,736 | |
| National Energy Services Reunited Corp. (a) | 1,764 | 11,801 | |
| Nordic American Tanker Shipping Ltd. (b) | 17,301 | 44,291 | |
| Northern Oil & Gas, Inc. | 5,946 | 148,531 | |
| Oasis Petroleum, Inc. | 1,908 | 253,115 | |
| Ovintiv, Inc. | 25,393 | 1,299,853 | |
| Par Pacific Holdings, Inc. (a) | 4,453 | 65,326 | |
| PBF Energy, Inc. Class A (a) | 9,351 | 271,740 | |
| PDC Energy, Inc. | 9,457 | 659,531 | |
| Peabody Energy Corp. (a) | 8,640 | 195,610 | |
| Range Resources Corp. (a) | 23,182 | 694,069 | |
| Ranger Oil Corp. (a) | 2,054 | 65,420 | |
| Renewable Energy Group, Inc. (a) | 4,347 | 265,428 | |
| Rex American Resources Corp. (a) | 514 | 43,500 | |
| Riley Exploration Permian, Inc. | 1,097 | 25,483 | |
| Scorpio Tankers, Inc. | 4,774 | 118,061 | |
| SFL Corp. Ltd. | 11,818 | 117,235 | |
| SM Energy Co. | 11,636 | 413,427 | |
| Southwestern Energy Co. (a) | 98,675 | 740,063 | |
| Talos Energy, Inc. (a) | 3,637 | 66,084 | |
| Teekay Corp. (a) | 7,385 | 23,927 | |
| Teekay Tankers Ltd. (a) | 2,515 | 40,265 | |
| Tellurian, Inc. (a) | 36,153 | 180,042 | |
| Ur-Energy, Inc. (a)(b) | 17,654 | 24,363 | |
| Uranium Energy Corp. (a) | 25,934 | 110,220 | |
| W&T Offshore, Inc. (a) | 9,317 | 44,349 | |
| Whiting Petroleum Corp. | 3,781 | 276,202 | |
| Whiting Petroleum Corp.: | |||
| warrants 9/1/24 (a) | 224 | 3,416 | |
| warrants 9/1/25 (a) | 111 | 1,431 | |
| World Fuel Services Corp. | 6,073 | 147,088 | |
| 14,038,662 | |||
| TOTAL ENERGY | 17,077,520 | ||
| FINANCIALS - 15.6% | |||
| Banks - 8.6% | |||
| 1st Source Corp. | 1,569 | 67,891 | |
| Allegiance Bancshares, Inc. | 1,858 | 75,918 | |
| Amalgamated Financial Corp. | 1,284 | 22,586 | |
| Amerant Bancorp, Inc. Class A | 2,523 | 67,087 | |
| American National Bankshares, Inc. | 967 | 33,594 | |
| Ameris Bancorp | 6,537 | 272,593 | |
| Arrow Financial Corp. | 1,316 | 41,191 | |
| Associated Banc-Corp. | 14,310 | 285,485 | |
| Atlantic Union Bankshares Corp. | 7,335 | 247,776 | |
| Banc of California, Inc. | 5,450 | 98,318 | |
| BancFirst Corp. | 1,622 | 132,599 | |
| Bancorp, Inc., Delaware (a) | 5,119 | 116,150 | |
| Bank First National Corp. | 606 | 42,844 | |
| Bank of Marin Bancorp | 1,613 | 50,422 | |
| BankUnited, Inc. | 8,271 | 310,493 | |
| Banner Corp. | 3,327 | 178,660 | |
| Bar Harbor Bankshares | 1,616 | 42,194 | |
| Berkshire Hills Bancorp, Inc. | 4,681 | 115,808 | |
| Blue Ridge Bankshares, Inc. | 1,879 | 27,377 | |
| Brookline Bancorp, Inc., Delaware | 7,391 | 106,874 | |
| Business First Bancshares, Inc. | 2,150 | 47,644 | |
| Byline Bancorp, Inc. | 2,349 | 55,108 | |
| Cadence Bank | 17,750 | 444,460 | |
| Cambridge Bancorp | 656 | 53,602 | |
| Camden National Corp. | 1,355 | 60,636 | |
| Capital Bancorp, Inc. | 792 | 17,828 | |
| Capital City Bank Group, Inc. | 1,253 | 32,089 | |
| Capstar Financial Holdings, Inc. | 1,943 | 39,151 | |
| Carter Bankshares, Inc. (a) | 2,689 | 43,992 | |
| Cathay General Bancorp | 7,000 | 280,630 | |
| CBTX, Inc. | 1,834 | 52,306 | |
| Central Pacific Financial Corp. | 2,612 | 63,158 | |
| Citizens & Northern Corp. | 1,470 | 34,413 | |
| City Holding Co. | 1,433 | 110,886 | |
| Civista Bancshares, Inc. | 1,355 | 28,211 | |
| CNB Financial Corp., Pennsylvania | 1,540 | 38,269 | |
| Coastal Financial Corp. of Washington (a) | 1,014 | 41,615 | |
| Columbia Banking Systems, Inc. | 7,723 | 216,862 | |
| Community Bank System, Inc. | 5,174 | 333,206 | |
| Community Trust Bancorp, Inc. | 1,431 | 56,968 | |
| ConnectOne Bancorp, Inc. | 3,547 | 98,819 | |
| CrossFirst Bankshares, Inc. (a) | 4,345 | 55,659 | |
| Customers Bancorp, Inc. (a) | 2,994 | 125,958 | |
| CVB Financial Corp. (b) | 13,193 | 303,703 | |
| Dime Community Bancshares, Inc. | 3,318 | 104,318 | |
| Eagle Bancorp, Inc. | 3,025 | 152,309 | |
| Eastern Bankshares, Inc. | 16,606 | 318,171 | |
| Enterprise Bancorp, Inc. | 877 | 29,774 | |
| Enterprise Financial Services Corp. | 3,365 | 148,632 | |
| Equity Bancshares, Inc. | 1,311 | 40,025 | |
| Farmers National Banc Corp. | 2,923 | 44,780 | |
| FB Financial Corp. | 3,237 | 124,722 | |
| Fidelity D & D Bancorp, Inc. | 472 | 17,544 | |
| Financial Institutions, Inc. | 1,407 | 39,171 | |
| First Bancorp, North Carolina | 3,411 | 127,776 | |
| First Bancorp, Puerto Rico | 19,438 | 264,551 | |
| First Bancshares, Inc. | 1,973 | 63,511 | |
| First Bank Hamilton New Jersey | 1,497 | 21,347 | |
| First Busey Corp. | 4,857 | 109,137 | |
| First Commonwealth Financial Corp. | 8,927 | 120,336 | |
| First Community Bankshares, Inc. | 1,906 | 50,757 | |
| First Financial Bancorp, Ohio | 9,028 | 184,623 | |
| First Financial Bankshares, Inc. (b) | 12,732 | 509,025 | |
| First Financial Corp., Indiana | 1,061 | 45,220 | |
| First Foundation, Inc. | 4,936 | 109,678 | |
| First Internet Bancorp | 984 | 37,874 | |
| First Interstate Bancsystem, Inc. (b) | 8,582 | 279,087 | |
| First Merchants Corp. | 5,576 | 218,523 | |
| First Mid-Illinois Bancshares, Inc. | 1,588 | 57,232 | |
| First of Long Island Corp. | 1,432 | 24,029 | |
| Five Star Bancorp | 1,227 | 30,614 | |
| Flushing Financial Corp. | 2,794 | 60,071 | |
| Fulton Financial Corp. | 15,155 | 229,901 | |
| German American Bancorp, Inc. | 2,429 | 85,258 | |
| Glacier Bancorp, Inc. | 10,817 | 494,986 | |
| Great Southern Bancorp, Inc. | 918 | 52,087 | |
| Guaranty Bancshares, Inc. Texas | 783 | 26,935 | |
| Hancock Whitney Corp. | 8,397 | 392,728 | |
| Hanmi Financial Corp. | 2,922 | 67,644 | |
| HarborOne Bancorp, Inc. | 4,523 | 60,563 | |
| HBT Financial, Inc. | 896 | 15,393 | |
| Heartland Financial U.S.A., Inc. | 3,896 | 170,528 | |
| Heritage Commerce Corp. | 5,746 | 64,528 | |
| Heritage Financial Corp., Washington | 3,528 | 85,448 | |
| Hilltop Holdings, Inc. | 5,957 | 151,844 | |
| Home Bancshares, Inc. | 14,843 | 320,906 | |
| HomeStreet, Inc. | 1,913 | 77,649 | |
| HomeTrust Bancshares, Inc. | 1,408 | 38,058 | |
| Hope Bancorp, Inc. | 11,045 | 157,944 | |
| Horizon Bancorp, Inc. Indiana | 4,211 | 73,608 | |
| Independent Bank Corp. | 1,926 | 38,019 | |
| Independent Bank Corp. | 4,465 | 344,519 | |
| Independent Bank Group, Inc. (b) | 3,634 | 246,385 | |
| International Bancshares Corp. | 5,202 | 206,988 | |
| Lakeland Bancorp, Inc. | 5,911 | 88,842 | |
| Lakeland Financial Corp. | 2,359 | 171,782 | |
| Live Oak Bancshares, Inc. | 3,139 | 132,874 | |
| Macatawa Bank Corp. | 2,305 | 20,169 | |
| Mercantile Bank Corp. | 1,430 | 44,902 | |
| Meta Financial Group, Inc. | 2,856 | 124,664 | |
| Metrocity Bankshares, Inc. | 1,745 | 35,563 | |
| Metropolitan Bank Holding Corp. (a) | 984 | 87,625 | |
| Mid Penn Bancorp, Inc. | 1,597 | 41,251 | |
| Midland States Bancorp, Inc. | 1,992 | 52,509 | |
| MidWestOne Financial Group, Inc. | 1,367 | 40,846 | |
| MVB Financial Corp. | 1,051 | 42,103 | |
| National Bank Holdings Corp. | 2,778 | 101,425 | |
| NBT Bancorp, Inc. | 4,058 | 142,842 | |
| Nicolet Bankshares, Inc. (a) | 1,168 | 95,052 | |
| Northrim Bancorp, Inc. | 535 | 21,437 | |
| Northwest Bancshares, Inc. | 11,710 | 148,483 | |
| OceanFirst Financial Corp. | 5,580 | 104,513 | |
| OFG Bancorp | 4,723 | 125,537 | |
| Old National Bancorp, Indiana | 28,818 | 436,881 | |
| Old Second Bancorp, Inc. | 2,979 | 41,021 | |
| Origin Bancorp, Inc. | 2,124 | 80,032 | |
| Orrstown Financial Services, Inc. | 1,062 | 25,042 | |
| Pacific Premier Bancorp, Inc. | 9,242 | 289,829 | |
| Park National Corp. | 1,381 | 162,751 | |
| Peapack-Gladstone Financial Corp. | 1,660 | 51,443 | |
| Peoples Bancorp, Inc. | 2,412 | 66,137 | |
| Peoples Financial Services Corp. | 671 | 33,308 | |
| Preferred Bank, Los Angeles | 1,307 | 87,726 | |
| Premier Financial Corp. | 3,516 | 93,315 | |
| Primis Financial Corp. | 2,624 | 35,818 | |
| QCR Holdings, Inc. | 1,580 | 85,778 | |
| RBB Bancorp | 1,303 | 27,871 | |
| Red River Bancshares, Inc. | 393 | 21,320 | |
| Renasant Corp. | 5,359 | 159,645 | |
| Republic Bancorp, Inc., Kentucky Class A | 821 | 34,219 | |
| Republic First Bancorp, Inc. (a) | 4,595 | 19,253 | |
| S&T Bancorp, Inc. | 3,776 | 106,710 | |
| Sandy Spring Bancorp, Inc. | 4,311 | 169,293 | |
| Seacoast Banking Corp., Florida | 5,365 | 174,363 | |
| ServisFirst Bancshares, Inc. | 4,832 | 388,106 | |
| Sierra Bancorp | 1,351 | 29,384 | |
| Silvergate Capital Corp. (a) | 2,729 | 319,184 | |
| Simmons First National Corp. Class A (b) | 12,065 | 287,992 | |
| SmartFinancial, Inc. | 1,278 | 31,337 | |
| South Plains Financial, Inc. | 999 | 24,126 | |
| Southern First Bancshares, Inc. (a) | 742 | 33,909 | |
| Southside Bancshares, Inc. | 2,954 | 115,767 | |
| Southstate Corp. (b) | 7,541 | 583,975 | |
| Stock Yards Bancorp, Inc. | 2,329 | 121,760 | |
| Summit Financial Group, Inc. | 1,032 | 28,122 | |
| Texas Capital Bancshares, Inc. (a) | 4,932 | 253,308 | |
| The Bank of NT Butterfield & Son Ltd. | 4,914 | 157,395 | |
| The First Bancorp, Inc. | 940 | 26,461 | |
| Third Coast Bancshares, Inc. | 372 | 8,433 | |
| Tompkins Financial Corp. | 1,366 | 99,718 | |
| TowneBank | 6,457 | 178,019 | |
| Trico Bancshares | 2,672 | 100,334 | |
| TriState Capital Holdings, Inc. (a) | 2,809 | 84,860 | |
| Triumph Bancorp, Inc. (a) | 2,346 | 162,906 | |
| Trustmark Corp. | 5,916 | 164,938 | |
| UMB Financial Corp. | 4,278 | 385,790 | |
| United Bankshares, Inc., West Virginia (b) | 12,943 | 430,484 | |
| United Community Bank, Inc. | 10,228 | 308,272 | |
| Univest Corp. of Pennsylvania | 2,728 | 68,746 | |
| Valley National Bancorp | 39,187 | 469,460 | |
| Veritex Holdings, Inc. | 4,679 | 153,705 | |
| Washington Trust Bancorp, Inc. | 1,655 | 77,686 | |
| WesBanco, Inc. | 5,854 | 188,733 | |
| West Bancorp., Inc. | 1,499 | 37,475 | |
| Westamerica Bancorp. | 2,523 | 148,655 | |
| 20,999,003 | |||
| Capital Markets - 1.4% | |||
| Artisan Partners Asset Management, Inc. | 5,723 | 183,937 | |
| Assetmark Financial Holdings, Inc. (a) | 1,749 | 33,633 | |
| Associated Capital Group, Inc. | 110 | 4,356 | |
| B. Riley Financial, Inc. | 1,968 | 88,875 | |
| BGC Partners, Inc. Class A | 30,363 | 110,218 | |
| Blucora, Inc. (a) | 4,628 | 93,717 | |
| BrightSphere Investment Group, Inc. | 3,120 | 62,525 | |
| Cohen & Steers, Inc. | 2,345 | 182,183 | |
| Cowen Group, Inc. Class A | 2,530 | 57,811 | |
| Diamond Hill Investment Group, Inc. | 285 | 47,985 | |
| Donnelley Financial Solutions, Inc. (a) | 2,862 | 83,771 | |
| Federated Hermes, Inc. (b) | 8,978 | 255,693 | |
| Focus Financial Partners, Inc. Class A (a) | 6,343 | 250,231 | |
| GAMCO Investors, Inc. Class A | 418 | 8,347 | |
| GCM Grosvenor, Inc. Class A | 4,425 | 36,506 | |
| Greenhill & Co., Inc. | 1,298 | 15,719 | |
| Hamilton Lane, Inc. Class A | 3,412 | 233,995 | |
| Houlihan Lokey | 4,964 | 413,452 | |
| Moelis & Co. Class A | 5,934 | 262,639 | |
| Open Lending Corp. (a) | 10,238 | 139,646 | |
| Oppenheimer Holdings, Inc. Class A (non-vtg.) | 844 | 27,194 | |
| Piper Jaffray Companies | 1,690 | 194,316 | |
| PJT Partners, Inc. | 2,299 | 151,711 | |
| Pzena Investment Management, Inc. | 1,651 | 10,385 | |
| Sculptor Capital Management, Inc. Class A | 2,370 | 24,790 | |
| StepStone Group, Inc. Class A | 4,440 | 113,753 | |
| StoneX Group, Inc. (a) | 1,634 | 110,753 | |
| Value Line, Inc. | 100 | 6,547 | |
| Virtus Investment Partners, Inc. | 710 | 125,784 | |
| WisdomTree Investments, Inc. | 13,220 | 77,073 | |
| 3,407,545 | |||
| Consumer Finance - 0.8% | |||
| Atlanticus Holdings Corp. (a) | 471 | 20,272 | |
| CURO Group Holdings Corp. | 2,006 | 23,550 | |
| Encore Capital Group, Inc. (a) | 2,341 | 135,333 | |
| Enova International, Inc. (a) | 3,519 | 131,611 | |
| EZCORP, Inc. (non-vtg.) Class A (a) | 4,991 | 34,937 | |
| FirstCash Holdings, Inc. | 3,869 | 308,669 | |
| Green Dot Corp. Class A (a) | 5,288 | 140,026 | |
| LendingClub Corp. (a) | 9,876 | 150,609 | |
| LendingTree, Inc. (a) | 1,151 | 91,412 | |
| Navient Corp. | 14,535 | 230,961 | |
| Nelnet, Inc. Class A | 1,594 | 130,820 | |
| Oportun Financial Corp. (a) | 2,286 | 26,495 | |
| PRA Group, Inc. (a) | 4,141 | 174,046 | |
| PROG Holdings, Inc. (a) | 5,547 | 146,829 | |
| Regional Management Corp. | 719 | 30,953 | |
| World Acceptance Corp. (a) | 415 | 78,315 | |
| 1,854,838 | |||
| Diversified Financial Services - 0.1% | |||
| A-Mark Precious Metals, Inc. | 854 | 67,295 | |
| Alerus Financial Corp. | 1,442 | 36,843 | |
| Banco Latinoamericano de Comercio Exterior SA Series E | 2,857 | 41,398 | |
| Cannae Holdings, Inc. (a) | 8,381 | 187,734 | |
| 333,270 | |||
| Insurance - 1.9% | |||
| AMBAC Financial Group, Inc. (a) | 4,521 | 34,947 | |
| American Equity Investment Life Holding Co. | 7,981 | 301,043 | |
| American National Group, Inc. | 699 | 131,838 | |
| Amerisafe, Inc. | 1,890 | 87,602 | |
| Argo Group International Holdings, Ltd. | 3,123 | 133,664 | |
| Bright Health Group, Inc. | 25,715 | 46,287 | |
| BRP Group, Inc. (a) | 4,757 | 109,982 | |
| Citizens, Inc. Class A (a) | 4,842 | 14,478 | |
| CNO Financial Group, Inc. | 11,573 | 279,372 | |
| Crawford & Co. Class A | 500 | 3,900 | |
| Donegal Group, Inc. Class A | 1,451 | 19,632 | |
| eHealth, Inc. (a) | 2,225 | 17,911 | |
| Employers Holdings, Inc. | 2,687 | 105,707 | |
| Enstar Group Ltd. (a) | 1,186 | 279,600 | |
| Genworth Financial, Inc. Class A (a) | 48,209 | 178,855 | |
| Goosehead Insurance | 1,769 | 101,700 | |
| Greenlight Capital Re, Ltd. (a) | 3,017 | 20,757 | |
| HCI Group, Inc. | 583 | 37,364 | |
| Heritage Insurance Holdings, Inc. | 3,018 | 12,857 | |
| Horace Mann Educators Corp. | 4,030 | 160,596 | |
| Investors Title Co. | 129 | 24,207 | |
| James River Group Holdings Ltd. | 3,629 | 86,044 | |
| Kinsale Capital Group, Inc. | 2,096 | 464,662 | |
| Maiden Holdings Ltd. (a) | 6,343 | 14,081 | |
| MBIA, Inc. (a) | 4,726 | 56,901 | |
| MetroMile, Inc. (a) | 13,565 | 13,313 | |
| National Western Life Group, Inc. | 235 | 46,709 | |
| NI Holdings, Inc. (a) | 796 | 12,617 | |
| Palomar Holdings, Inc. (a) | 2,452 | 133,511 | |
| ProAssurance Corp. | 5,226 | 128,403 | |
| RLI Corp. | 3,893 | 446,839 | |
| Safety Insurance Group, Inc. | 1,365 | 117,445 | |
| Selective Insurance Group, Inc. | 5,766 | 474,888 | |
| Selectquote, Inc. (a) | 13,582 | 27,979 | |
| Siriuspoint Ltd. (a) | 8,824 | 55,415 | |
| Stewart Information Services Corp. | 2,597 | 134,005 | |
| Tiptree, Inc. | 2,319 | 26,970 | |
| Trupanion, Inc. (a)(b) | 3,723 | 236,857 | |
| United Fire Group, Inc. | 2,062 | 60,396 | |
| United Insurance Holdings Corp. | 3,131 | 7,170 | |
| Universal Insurance Holdings, Inc. | 2,619 | 32,895 | |
| 4,679,399 | |||
| Mortgage Real Estate Investment Trusts - 1.3% | |||
| Angel Oak Mortgage, Inc. | 1,284 | 20,749 | |
| Apollo Commercial Real Estate Finance, Inc. | 13,830 | 166,513 | |
| Arbor Realty Trust, Inc. | 14,205 | 242,906 | |
| Ares Commercial Real Estate Corp. | 4,291 | 64,665 | |
| Armour Residential REIT, Inc. (b) | 9,580 | 70,317 | |
| Blackstone Mortgage Trust, Inc. | 15,458 | 464,358 | |
| BrightSpire Capital, Inc. | 8,462 | 71,927 | |
| Broadmark Realty Capital, Inc. | 13,204 | 103,123 | |
| Chimera Investment Corp. | 22,568 | 226,131 | |
| Dynex Capital, Inc. | 3,749 | 60,846 | |
| Ellington Financial LLC | 5,408 | 87,556 | |
| Franklin BSP Realty Trust, Inc. | 492 | 6,524 | |
| Granite Point Mortgage Trust, Inc. | 5,641 | 54,887 | |
| Great Ajax Corp. | 2,076 | 19,328 | |
| Hannon Armstrong Sustainable Infrastructure Capital, Inc. | 7,505 | 300,125 | |
| Invesco Mortgage Capital, Inc. (b) | 31,839 | 55,400 | |
| KKR Real Estate Finance Trust, Inc. | 3,508 | 66,652 | |
| Ladder Capital Corp. Class A | 11,010 | 125,404 | |
| MFA Financial, Inc. | 10,737 | 153,002 | |
| New York Mortgage Trust, Inc. | 37,722 | 121,465 | |
| Orchid Island Capital, Inc. (b) | 14,980 | 41,644 | |
| PennyMac Mortgage Investment Trust | 10,075 | 154,551 | |
| Ready Capital Corp. | 6,828 | 99,484 | |
| Redwood Trust, Inc. | 11,191 | 108,553 | |
| TPG RE Finance Trust, Inc. | 5,678 | 59,903 | |
| Two Harbors Investment Corp. | 33,644 | 161,828 | |
| 3,107,841 | |||
| Thrifts & Mortgage Finance - 1.5% | |||
| Axos Financial, Inc. (a) | 5,588 | 211,673 | |
| Blue Foundry Bancorp | 2,799 | 35,323 | |
| Bridgewater Bancshares, Inc. (a) | 2,393 | 38,336 | |
| Capitol Federal Financial, Inc. | 12,441 | 119,807 | |
| Columbia Financial, Inc. (a) | 3,733 | 70,740 | |
| Enact Holdings, Inc. | 1,456 | 34,332 | |
| Essent Group Ltd. | 10,560 | 427,997 | |
| Federal Agricultural Mortgage Corp. Class C (non-vtg.) | 860 | 88,090 | |
| Finance of America Companies, Inc. (a) | 2,713 | 6,131 | |
| Flagstar Bancorp, Inc. | 5,056 | 178,477 | |
| FS Bancorp, Inc. | 914 | 26,862 | |
| Hingham Institution for Savings | 141 | 45,553 | |
| Home Bancorp, Inc. | 671 | 25,719 | |
| Home Point Capital, Inc. | 786 | 2,138 | |
| Kearny Financial Corp. | 6,317 | 74,920 | |
| Luther Burbank Corp. | 1,432 | 19,003 | |
| Merchants Bancorp | 1,409 | 33,140 | |
| Mr. Cooper Group, Inc. (a) | 5,895 | 265,098 | |
| NMI Holdings, Inc. (a) | 8,202 | 150,753 | |
| Northfield Bancorp, Inc. | 4,420 | 57,858 | |
| Ocwen Financial Corp. (a) | 431 | 8,965 | |
| PCSB Financial Corp. | 1,484 | 27,187 | |
| PennyMac Financial Services, Inc. | 2,860 | 138,882 | |
| Pioneer Bancorp, Inc. (a) | 1,410 | 14,664 | |
| Provident Bancorp, Inc. | 1,961 | 31,219 | |
| Provident Financial Services, Inc. | 7,267 | 160,819 | |
| Radian Group, Inc. | 17,381 | 371,780 | |
| Southern Missouri Bancorp, Inc. | 748 | 31,566 | |
| Trustco Bank Corp., New York | 1,771 | 55,167 | |
| Velocity Financial, Inc. (a) | 733 | 7,843 | |
| Walker & Dunlop, Inc. | 2,842 | 340,358 | |
| Washington Federal, Inc. | 6,264 | 190,614 | |
| Waterstone Financial, Inc. | 1,963 | 31,526 | |
| WSFS Financial Corp. | 6,347 | 254,324 | |
| 3,576,864 | |||
| TOTAL FINANCIALS | 37,958,760 | ||
| HEALTH CARE - 15.1% | |||
| Biotechnology - 6.1% | |||
| 2seventy bio, Inc. (a) | 2,355 | 31,698 | |
| 4D Molecular Therapeutics, Inc. (a) | 2,847 | 33,908 | |
| ACADIA Pharmaceuticals, Inc. (a) | 11,748 | 216,633 | |
| Acumen Pharmaceuticals, Inc. | 2,134 | 8,237 | |
| Adagio Therapeutics, Inc. | 5,583 | 15,967 | |
| Adicet Bio, Inc. (a) | 2,593 | 38,221 | |
| Adverum Biotechnologies, Inc. (a) | 12,227 | 13,083 | |
| Aerovate Therapeutics, Inc. | 1,248 | 15,912 | |
| Affimed NV (a) | 12,099 | 45,492 | |
| Agenus, Inc. (a) | 21,801 | 40,332 | |
| Agios Pharmaceuticals, Inc. (a) | 5,491 | 120,637 | |
| Akebia Therapeutics, Inc. (a) | 17,983 | 7,467 | |
| Akero Therapeutics, Inc. (a) | 2,790 | 29,267 | |
| Akouos, Inc. (a) | 830 | 2,324 | |
| Alaunos Therapeutics, Inc. (a)(b) | 1,116 | 593 | |
| Albireo Pharma, Inc. (a) | 1,735 | 55,208 | |
| Aldeyra Therapeutics, Inc. (a) | 5,481 | 16,827 | |
| Alector, Inc. (a) | 5,789 | 55,574 | |
| Alkermes PLC (a) | 15,640 | 451,214 | |
| Allakos, Inc. (a) | 4,167 | 15,710 | |
| Allogene Therapeutics, Inc. (a) | 6,835 | 57,072 | |
| Allovir, Inc. (a) | 2,531 | 11,516 | |
| Alpine Immune Sciences, Inc. (a) | 1,447 | 13,312 | |
| Altimmune, Inc. (a) | 4,361 | 19,712 | |
| ALX Oncology Holdings, Inc. (a) | 1,577 | 20,154 | |
| Amicus Therapeutics, Inc. (a) | 25,906 | 183,414 | |
| AnaptysBio, Inc. (a) | 1,762 | 41,231 | |
| Anavex Life Sciences Corp. (a) | 6,578 | 56,505 | |
| Anika Therapeutics, Inc. (a) | 520 | 11,196 | |
| Apellis Pharmaceuticals, Inc. (a) | 7,628 | 332,047 | |
| Applied Molecular Transport, Inc. (a) | 2,289 | 9,820 | |
| Applied Therapeutics, Inc. (a) | 2,750 | 5,418 | |
| AquaBounty Technologies, Inc. (a) | 8,810 | 11,805 | |
| Arbutus Biopharma Corp. (a) | 9,943 | 23,167 | |
| Arcellx, Inc. | 1,023 | 11,181 | |
| Arcturus Therapeutics Holdings, Inc. (a) | 1,517 | 29,399 | |
| Arcus Biosciences, Inc. (a) | 4,420 | 107,008 | |
| Arcutis Biotherapeutics, Inc. (a) | 2,847 | 57,481 | |
| Ardelyx, Inc. (a) | 10,995 | 9,048 | |
| Arrowhead Pharmaceuticals, Inc. (a) | 10,072 | 414,060 | |
| Atara Biotherapeutics, Inc. (a) | 8,940 | 56,858 | |
| Athenex, Inc. (a) | 947 | 455 | |
| Athersys, Inc. (a)(b) | 3,495 | 1,713 | |
| Atossa Therapeutics, Inc. (a) | 12,209 | 12,331 | |
| Atreca, Inc. (a) | 3,111 | 6,098 | |
| Aura Biosciences, Inc. | 605 | 10,261 | |
| Avalo Therapeutics, Inc. (a) | 2,571 | 1,056 | |
| Avid Bioservices, Inc. (a) | 6,022 | 81,056 | |
| Avidity Biosciences, Inc. (a) | 3,781 | 54,068 | |
| Avita Medical, Inc. (a) | 2,203 | 13,438 | |
| AVROBIO, Inc. (a) | 6,033 | 5,568 | |
| Beam Therapeutics, Inc. (a)(b) | 5,051 | 189,564 | |
| BeyondSpring, Inc. (a)(b) | 3,423 | 5,203 | |
| BioCryst Pharmaceuticals, Inc. (a)(b) | 17,647 | 163,941 | |
| Biohaven Pharmaceutical Holding Co. Ltd. (a) | 5,435 | 484,639 | |
| Biomea Fusion, Inc. (a) | 976 | 2,928 | |
| BioXcel Therapeutics, Inc. (a)(b) | 1,808 | 23,703 | |
| Black Diamond Therapeutics, Inc. (a) | 3,404 | 8,272 | |
| bluebird bio, Inc. (a) | 643 | 2,334 | |
| Blueprint Medicines Corp. (a)(b) | 5,759 | 336,038 | |
| Bolt Biotherapeutics, Inc. (a) | 338 | 527 | |
| BridgeBio Pharma, Inc. (a) | 10,496 | 84,178 | |
| Brooklyn ImmunoTherapeutics, Inc. (a) | 3,931 | 4,128 | |
| C4 Therapeutics, Inc. (a) | 3,816 | 32,703 | |
| CareDx, Inc. (a) | 4,970 | 151,287 | |
| Caribou Biosciences, Inc. | 5,169 | 38,251 | |
| Catalyst Pharmaceutical Partners, Inc. (a) | 9,512 | 72,481 | |
| Cel-Sci Corp. (a) | 3,210 | 9,181 | |
| Celcuity, Inc. (a) | 303 | 1,976 | |
| Celldex Therapeutics, Inc. (a) | 4,539 | 138,666 | |
| Century Therapeutics, Inc. (b) | 1,856 | 22,309 | |
| Cerevel Therapeutics Holdings (a) | 4,004 | 117,237 | |
| ChemoCentryx, Inc. (a) | 5,320 | 98,207 | |
| Chimerix, Inc. (a) | 8,309 | 36,560 | |
| Chinook Therapeutics, Inc. (a) | 4,008 | 60,641 | |
| Chinook Therapeutics, Inc. rights (a)(c) | 702 | 35 | |
| Clene, Inc. (a) | 940 | 2,435 | |
| Clovis Oncology, Inc. (a) | 410 | 820 | |
| Codiak Biosciences, Inc. (a) | 147 | 435 | |
| Cogent Biosciences, Inc. (a)(b) | 3,973 | 25,507 | |
| Coherus BioSciences, Inc. (a) | 6,795 | 61,427 | |
| Cortexyme, Inc. (a) | 2,171 | 7,946 | |
| Crinetics Pharmaceuticals, Inc. (a) | 4,505 | 91,542 | |
| Cue Biopharma, Inc. (a) | 3,620 | 14,335 | |
| Cullinan Oncology, Inc. (a) | 2,719 | 26,673 | |
| Curis, Inc. (a) | 7,642 | 6,983 | |
| Cyteir Therapeutics, Inc. | 2,382 | 5,360 | |
| Cytokinetics, Inc. (a)(b) | 7,746 | 308,833 | |
| CytomX Therapeutics, Inc. (a) | 7,326 | 12,527 | |
| Day One Biopharmaceuticals, Inc. (a) | 2,359 | 20,099 | |
| Deciphera Pharmaceuticals, Inc. (a) | 471 | 4,767 | |
| Denali Therapeutics, Inc. (a) | 8,987 | 213,891 | |
| DermTech, Inc. (a) | 2,373 | 20,289 | |
| Design Therapeutics, Inc. (a) | 2,643 | 31,557 | |
| Dynavax Technologies Corp. (a) | 10,655 | 94,084 | |
| Dyne Therapeutics, Inc. (a) | 3,208 | 25,600 | |
| Eagle Pharmaceuticals, Inc. (a) | 1,122 | 49,514 | |
| Editas Medicine, Inc. (a) | 6,670 | 88,311 | |
| Eiger Biopharmaceuticals, Inc. (a) | 3,347 | 22,994 | |
| Eliem Therapeutics, Inc. | 59 | 186 | |
| Emergent BioSolutions, Inc. (a) | 4,824 | 156,201 | |
| Enanta Pharmaceuticals, Inc. (a) | 1,923 | 123,841 | |
| Entrada Therapeutics, Inc. | 1,209 | 7,230 | |
| Epizyme, Inc. (a) | 12,892 | 8,321 | |
| Erasca, Inc. (b) | 6,390 | 46,519 | |
| Evelo Biosciences, Inc. (a) | 3,476 | 8,586 | |
| Exagen, Inc. (a) | 1,364 | 8,320 | |
| Fate Therapeutics, Inc. (a)(b) | 8,003 | 228,566 | |
| FibroGen, Inc. (a) | 8,055 | 74,912 | |
| Finch Therapeutics Group, Inc. (a) | 318 | 805 | |
| Foghorn Therapeutics, Inc. (a) | 2,020 | 23,412 | |
| Forma Therapeutics Holdings, Inc. (a) | 3,095 | 23,398 | |
| Forte Biosciences, Inc. (a) | 3,022 | 3,475 | |
| Fortress Biotech, Inc. (a) | 10,235 | 11,259 | |
| G1 Therapeutics, Inc. (a) | 1,537 | 7,900 | |
| Gemini Therapeutics, Inc. (a) | 3,971 | 5,996 | |
| Generation Bio Co. (a) | 4,151 | 26,276 | |
| Geron Corp. (a)(b) | 33,757 | 47,597 | |
| Global Blood Therapeutics, Inc. (a) | 6,126 | 188,068 | |
| Gossamer Bio, Inc. (a) | 3,975 | 27,467 | |
| Graphite Bio, Inc. | 3,371 | 13,551 | |
| Greenwich Lifesciences, Inc. (a) | 491 | 5,818 | |
| Gritstone Bio, Inc. (a) | 4,780 | 12,380 | |
| Gt Biopharma, Inc. (a) | 637 | 1,344 | |
| Halozyme Therapeutics, Inc. (a) | 13,541 | 540,286 | |
| Harpoon Therapeutics, Inc. (a) | 2,370 | 5,333 | |
| Heron Therapeutics, Inc. (a)(b) | 8,725 | 39,437 | |
| Homology Medicines, Inc. (a) | 5,576 | 9,256 | |
| Hookipa Pharma, Inc. (a) | 3,031 | 4,547 | |
| Humanigen, Inc. (a) | 905 | 1,701 | |
| iBio, Inc. (a) | 27,805 | 8,136 | |
| Ideaya Biosciences, Inc. (a) | 3,472 | 33,296 | |
| IGM Biosciences, Inc. (a) | 940 | 15,736 | |
| Imago BioSciences, Inc. | 2,031 | 33,207 | |
| Immuneering Corp. | 1,712 | 8,509 | |
| Immunic, Inc. (a) | 2,020 | 13,675 | |
| ImmunityBio, Inc. (a)(b) | 7,127 | 25,871 | |
| ImmunoGen, Inc. (a) | 21,537 | 104,024 | |
| Immunovant, Inc. (a) | 3,757 | 17,320 | |
| Impel Pharmaceuticals, Inc. (a)(b) | 813 | 5,154 | |
| Infinity Pharmaceuticals, Inc. (a) | 2,354 | 1,858 | |
| Inhibrx, Inc. (a) | 2,742 | 43,461 | |
| Inovio Pharmaceuticals, Inc. (a)(b) | 19,358 | 52,847 | |
| Inozyme Pharma, Inc. (a) | 471 | 1,860 | |
| Insmed, Inc. (a) | 11,682 | 256,654 | |
| Instil Bio, Inc. (a) | 5,360 | 37,895 | |
| Intellia Therapeutics, Inc. (a) | 6,813 | 334,041 | |
| Intercept Pharmaceuticals, Inc. (a)(b) | 2,647 | 41,584 | |
| Ironwood Pharmaceuticals, Inc. Class A (a) | 14,310 | 171,720 | |
| iTeos Therapeutics, Inc. (a) | 2,008 | 53,594 | |
| Iveric Bio, Inc. (a) | 11,216 | 155,342 | |
| Janux Therapeutics, Inc. | 1,859 | 18,293 | |
| Jounce Therapeutics, Inc. (a) | 3,567 | 18,905 | |
| Kalvista Pharmaceuticals, Inc. (a) | 2,400 | 30,552 | |
| Karuna Therapeutics, Inc. (a) | 2,173 | 242,203 | |
| Karyopharm Therapeutics, Inc. (a) | 7,185 | 43,829 | |
| Keros Therapeutics, Inc. (a) | 1,521 | 80,628 | |
| Kezar Life Sciences, Inc. (a) | 3,719 | 44,182 | |
| Kiniksa Pharmaceuticals Ltd. (a) | 3,224 | 30,080 | |
| Kinnate Biopharma, Inc. (a) | 2,274 | 16,987 | |
| Kodiak Sciences, Inc. (a) | 3,809 | 22,930 | |
| Kronos Bio, Inc. (a) | 3,552 | 16,801 | |
| Krystal Biotech, Inc. (a) | 1,988 | 120,493 | |
| Kura Oncology, Inc. (a) | 6,376 | 91,496 | |
| Kymera Therapeutics, Inc. (a) | 3,368 | 105,587 | |
| Lexicon Pharmaceuticals, Inc. (a) | 524 | 948 | |
| Ligand Pharmaceuticals, Inc. Class B (a) | 1,474 | 136,876 | |
| Lineage Cell Therapeutics, Inc. (a) | 5,472 | 6,676 | |
| Lyell Immunopharma, Inc. (b) | 14,680 | 75,308 | |
| Macrogenics, Inc. (a) | 5,451 | 38,975 | |
| Madrigal Pharmaceuticals, Inc. (a) | 1,189 | 83,230 | |
| Magenta Therapeutics, Inc. (a) | 3,820 | 5,463 | |
| MannKind Corp. (a)(b) | 24,161 | 75,624 | |
| MEI Pharma, Inc. (a) | 15,604 | 7,669 | |
| MeiraGTx Holdings PLC (a) | 3,125 | 32,156 | |
| Mersana Therapeutics, Inc. (a) | 7,816 | 27,200 | |
| MiMedx Group, Inc. (a)(b) | 11,060 | 43,687 | |
| MiNK Therapeutics, Inc. | 306 | 685 | |
| Mirum Pharmaceuticals, Inc. (a) | 474 | 11,272 | |
| Molecular Templates, Inc. (a) | 5,285 | 8,985 | |
| Monte Rosa Therapeutics, Inc. (b) | 2,940 | 32,046 | |
| Morphic Holding, Inc. (a) | 2,117 | 64,166 | |
| Mustang Bio, Inc. (a) | 720 | 536 | |
| Myriad Genetics, Inc. (a) | 7,816 | 160,228 | |
| Neoleukin Therapeutics, Inc. (a) | 5,968 | 7,281 | |
| Nkarta, Inc. (a) | 1,559 | 28,748 | |
| Nurix Therapeutics, Inc. (a) | 3,182 | 35,225 | |
| Nuvalent, Inc. Class A (a)(b) | 1,926 | 19,819 | |
| Ocugen, Inc. (a) | 18,595 | 40,723 | |
| Olema Pharmaceuticals, Inc. (a) | 184 | 469 | |
| Omega Therapeutics, Inc. (a) | 2,477 | 8,447 | |
| OncoCyte Corp. (a) | 2,303 | 2,671 | |
| Oncorus, Inc. (a) | 318 | 372 | |
| Oncternal Therapeutics, Inc. (a) | 1,980 | 1,690 | |
| Oncternal Therapeutics, Inc. rights (a)(c) | 19 | 0 | |
| Opko Health, Inc. (a) | 39,503 | 106,658 | |
| Organogenesis Holdings, Inc. Class A (a) | 6,990 | 45,016 | |
| ORIC Pharmaceuticals, Inc. (a) | 3,512 | 11,660 | |
| Outlook Therapeutics, Inc. (a) | 12,239 | 18,970 | |
| Oyster Point Pharma, Inc. (a) | 1,295 | 8,262 | |
| PMV Pharmaceuticals, Inc. (a) | 2,606 | 37,761 | |
| Portage Biotech, Inc. (a) | 91 | 504 | |
| Poseida Therapeutics, Inc. (a) | 810 | 2,503 | |
| Praxis Precision Medicines, Inc. (a) | 1,802 | 14,596 | |
| Precigen, Inc. (a) | 1,377 | 1,831 | |
| Precision BioSciences, Inc. (a) | 6,285 | 12,507 | |
| Prelude Therapeutics, Inc. (a) | 1,342 | 6,160 | |
| Prometheus Biosciences, Inc. (a) | 2,912 | 76,586 | |
| Protagonist Therapeutics, Inc. (a) | 4,437 | 40,332 | |
| Prothena Corp. PLC (a) | 3,577 | 104,305 | |
| PTC Therapeutics, Inc. (a) | 6,850 | 242,011 | |
| Puma Biotechnology, Inc. (a) | 4,529 | 10,688 | |
| Pyxis Oncology, Inc. | 1,494 | 3,660 | |
| Radius Health, Inc. (a) | 4,351 | 29,761 | |
| Rallybio Corp. (a) | 1,740 | 17,330 | |
| RAPT Therapeutics, Inc. (a) | 2,142 | 32,408 | |
| Recursion Pharmaceuticals, Inc. (a) | 10,758 | 66,700 | |
| REGENXBIO, Inc. (a) | 3,907 | 108,458 | |
| Relay Therapeutics, Inc. (a) | 6,883 | 164,022 | |
| Reneo Pharmaceuticals, Inc. (a) | 1,544 | 3,582 | |
| Replimune Group, Inc. (a) | 3,128 | 52,457 | |
| Revolution Medicines, Inc. (a) | 5,920 | 118,222 | |
| Rhythm Pharmaceuticals, Inc. (a) | 4,419 | 27,663 | |
| Rigel Pharmaceuticals, Inc. (a) | 17,635 | 41,619 | |
| Rocket Pharmaceuticals, Inc. (a) | 3,894 | 40,030 | |
| Rubius Therapeutics, Inc. (a) | 4,288 | 7,118 | |
| Sana Biotechnology, Inc. (a)(b) | 8,781 | 66,297 | |
| Sangamo Therapeutics, Inc. (a) | 12,867 | 53,398 | |
| Scholar Rock Holding Corp. (a) | 1,592 | 11,255 | |
| Selecta Biosciences, Inc. (a) | 8,397 | 6,435 | |
| Sensei Biotherapeutics, Inc. (a) | 1,151 | 1,784 | |
| Sera Prognostics, Inc. | 1,294 | 2,976 | |
| Seres Therapeutics, Inc. (a) | 6,409 | 30,315 | |
| Sesen Bio, Inc. (a) | 5,775 | 2,195 | |
| Shattuck Labs, Inc. (a) | 556 | 2,135 | |
| Sigilon Therapeutics, Inc. (a) | 4,026 | 4,227 | |
| Silverback Therapeutics, Inc. (a) | 2,580 | 8,024 | |
| Solid Biosciences, Inc. (a) | 9,041 | 5,063 | |
| Sorrento Therapeutics, Inc. (a)(b) | 28,433 | 42,934 | |
| Spectrum Pharmaceuticals, Inc. (a) | 18,126 | 14,640 | |
| Spero Therapeutics, Inc. (a) | 2,161 | 10,502 | |
| Springworks Therapeutics, Inc. (a) | 2,881 | 123,624 | |
| Spruce Biosciences, Inc. (a) | 2,099 | 3,694 | |
| SQZ Biotechnologies Co. (a) | 3,057 | 11,280 | |
| Stoke Therapeutics, Inc. (a) | 1,951 | 28,172 | |
| Summit Therapeutics, Inc. (a) | 3,211 | 5,105 | |
| Surface Oncology, Inc. (a) | 4,900 | 10,388 | |
| Sutro Biopharma, Inc. (a) | 4,621 | 27,772 | |
| Syndax Pharmaceuticals, Inc. (a) | 4,922 | 82,542 | |
| Syros Pharmaceuticals, Inc. (a) | 513 | 432 | |
| Talaris Therapeutics, Inc. (a) | 2,303 | 16,259 | |
| Taysha Gene Therapies, Inc. (a) | 116 | 425 | |
| TCR2 Therapeutics, Inc. (a) | 4,355 | 9,276 | |
| Tenaya Therapeutics, Inc. (a) | 2,902 | 26,756 | |
| TG Therapeutics, Inc. (a) | 12,083 | 83,856 | |
| TONIX Pharmaceuticals Holding (a) | 61,721 | 9,005 | |
| Travere Therapeutics, Inc. (a) | 5,807 | 145,930 | |
| Trevena, Inc. (a) | 10,158 | 3,012 | |
| Turning Point Therapeutics, Inc. (a) | 4,544 | 133,775 | |
| Twist Bioscience Corp. (a) | 5,491 | 158,360 | |
| Tyra Biosciences, Inc. | 1,280 | 9,562 | |
| UroGen Pharma Ltd. (a) | 2,258 | 15,941 | |
| Vanda Pharmaceuticals, Inc. (a) | 5,442 | 53,985 | |
| Vaxart, Inc. (a)(b) | 12,161 | 42,320 | |
| Vaxcyte, Inc. (a) | 4,173 | 101,028 | |
| VBI Vaccines, Inc. (a) | 21,294 | 26,618 | |
| Vera Therapeutics, Inc. (a) | 1,381 | 27,620 | |
| Veracyte, Inc. (a) | 6,654 | 136,207 | |
| Verastem, Inc. (a) | 19,424 | 27,582 | |
| Vericel Corp. (a) | 4,558 | 129,903 | |
| Verve Therapeutics, Inc. | 3,571 | 53,279 | |
| Vigil Neuroscience, Inc. | 923 | 3,129 | |
| Viking Therapeutics, Inc. (a) | 8,364 | 19,906 | |
| Vincerx Pharma, Inc. (a) | 601 | 1,551 | |
| Vir Biotechnology, Inc. (a) | 5,921 | 120,492 | |
| Viracta Therapeutics, Inc. (a) | 4,192 | 10,690 | |
| VistaGen Therapeutics, Inc. (a) | 17,961 | 22,810 | |
| Vor Biopharma, Inc. (a) | 721 | 4,131 | |
| Werewolf Therapeutics, Inc. (a) | 2,293 | 10,204 | |
| Xbiotech, Inc. | 2,358 | 18,298 | |
| Xencor, Inc. (a) | 5,627 | 140,562 | |
| Xilio Therapeutics, Inc. | 951 | 3,357 | |
| XOMA Corp. (a) | 639 | 12,288 | |
| Y-mAbs Therapeutics, Inc. (a) | 3,351 | 28,148 | |
| Zentalis Pharmaceuticals, Inc. (a) | 3,609 | 95,711 | |
| 14,731,128 | |||
| Health Care Equipment & Supplies - 3.2% | |||
| Accuray, Inc. (a) | 9,540 | 25,376 | |
| Acutus Medical, Inc. (a) | 4,182 | 5,353 | |
| Alphatec Holdings, Inc. (a) | 7,056 | 76,558 | |
| Angiodynamics, Inc. (a) | 3,668 | 77,211 | |
| Apyx Medical Corp. (a) | 3,331 | 12,558 | |
| Artivion, Inc. (a) | 3,744 | 75,966 | |
| Asensus Surgical, Inc. (a) | 1,785 | 809 | |
| Aspira Women's Health, Inc. (a) | 2,836 | 1,805 | |
| Atricure, Inc. (a) | 4,388 | 227,869 | |
| Atrion Corp. | 133 | 83,340 | |
| Avanos Medical, Inc. (a) | 4,731 | 137,956 | |
| AxoGen, Inc. (a) | 3,410 | 24,688 | |
| Axonics Modulation Technologies, Inc. (a) | 4,470 | 231,635 | |
| BioLife Solutions, Inc. (a) | 1,072 | 13,582 | |
| Bioventus, Inc. (a) | 2,724 | 32,770 | |
| Butterfly Network, Inc. Class A (a)(b) | 13,332 | 44,396 | |
| Cardiovascular Systems, Inc. (a) | 3,871 | 72,388 | |
| Cerus Corp. (a) | 16,820 | 77,708 | |
| ClearPoint Neuro, Inc. (a) | 2,313 | 19,822 | |
| CONMED Corp. | 2,814 | 374,149 | |
| CryoPort, Inc. (a) | 4,056 | 91,503 | |
| Cue Health, Inc. | 1,633 | 10,941 | |
| Cutera, Inc. (a) | 1,699 | 92,273 | |
| CVRx, Inc. | 1,002 | 6,242 | |
| CytoSorbents Corp. (a) | 2,058 | 4,322 | |
| Eargo, Inc. (a) | 3,360 | 12,701 | |
| Glaukos Corp. (a) | 4,440 | 209,968 | |
| Haemonetics Corp. (a) | 4,908 | 248,688 | |
| Heska Corp. (a) | 963 | 105,776 | |
| Inari Medical, Inc. (a)(b) | 3,359 | 271,071 | |
| Inogen, Inc. (a) | 1,934 | 48,892 | |
| Integer Holdings Corp. (a) | 3,173 | 238,514 | |
| Intersect ENT, Inc. (a) | 3,136 | 85,832 | |
| Invacare Corp. (a) | 4,662 | 7,739 | |
| IRadimed Corp. | 624 | 20,536 | |
| iRhythm Technologies, Inc. (a) | 2,866 | 353,578 | |
| Lantheus Holdings, Inc. (a) | 6,522 | 433,126 | |
| Lantheus Holdings, Inc. rights (a)(c) | 4,219 | 0 | |
| LeMaitre Vascular, Inc. | 1,884 | 81,408 | |
| LivaNova PLC (a) | 5,191 | 397,942 | |
| Lucid Diagnostics, Inc. | 1,345 | 2,838 | |
| Meridian Bioscience, Inc. (a) | 4,168 | 106,659 | |
| Merit Medical Systems, Inc. (a) | 4,978 | 308,686 | |
| Mesa Laboratories, Inc. | 481 | 102,756 | |
| Natus Medical, Inc. (a) | 3,307 | 110,024 | |
| Neogen Corp. (a)(b) | 10,467 | 276,329 | |
| Neuronetics, Inc. (a) | 3,403 | 8,303 | |
| NeuroPace, Inc. (a) | 135 | 1,085 | |
| Nevro Corp. (a) | 3,390 | 209,129 | |
| NuVasive, Inc. (a) | 5,047 | 259,618 | |
| OraSure Technologies, Inc. (a) | 7,059 | 43,342 | |
| Ortho Clinical Diagnostics Holdings PLC (a) | 11,707 | 206,160 | |
| Orthofix International NV (a) | 1,644 | 50,964 | |
| OrthoPediatrics Corp. (a) | 1,383 | 62,346 | |
| Outset Medical, Inc. (a) | 4,599 | 160,413 | |
| Paragon 28, Inc. | 909 | 16,335 | |
| PAVmed, Inc. (a) | 8,709 | 11,060 | |
| PROCEPT BioRobotics Corp. | 718 | 25,532 | |
| Pulmonx Corp. (a) | 2,601 | 62,684 | |
| Pulse Biosciences, Inc. (a) | 1,780 | 4,450 | |
| Pulse Biosciences, Inc. rights 5/23/22 (a)(c) | 1,780 | 409 | |
| Quotient Ltd. (a) | 2,015 | 1,162 | |
| Retractable Technologies, Inc. (a) | 451 | 1,727 | |
| RxSight, Inc. (b) | 1,849 | 22,687 | |
| Seaspine Holdings Corp. (a) | 1,991 | 18,536 | |
| Senseonics Holdings, Inc. (a)(b) | 42,121 | 58,969 | |
| Shockwave Medical, Inc. (a) | 3,289 | 497,067 | |
| SI-BONE, Inc. (a) | 3,296 | 65,854 | |
| Sientra, Inc. (a) | 802 | 1,139 | |
| Sight Sciences, Inc. | 2,374 | 16,571 | |
| Silk Road Medical, Inc. (a) | 3,395 | 118,995 | |
| Staar Surgical Co. (a) | 4,647 | 265,297 | |
| Stereotaxis, Inc. (a) | 4,893 | 12,233 | |
| SurModics, Inc. (a) | 1,332 | 51,495 | |
| Tactile Systems Technology, Inc. (a) | 1,963 | 33,135 | |
| TransMedics Group, Inc. (a) | 2,571 | 53,888 | |
| Treace Medical Concepts, Inc. (a) | 3,001 | 58,820 | |
| UFP Technologies, Inc. (a) | 657 | 45,116 | |
| Utah Medical Products, Inc. | 356 | 30,114 | |
| Vapotherm, Inc. (a) | 2,415 | 10,723 | |
| Varex Imaging Corp. (a) | 3,687 | 73,187 | |
| ViewRay, Inc. (a) | 15,044 | 40,167 | |
| Zynex, Inc. | 2,530 | 16,116 | |
| 7,859,111 | |||
| Health Care Providers & Services - 2.9% | |||
| 1Life Healthcare, Inc. (a) | 11,203 | 78,981 | |
| Accolade, Inc. (a) | 5,179 | 28,795 | |
| AdaptHealth Corp. (a) | 7,009 | 88,734 | |
| Addus HomeCare Corp. (a) | 1,499 | 126,336 | |
| Agiliti, Inc. (a) | 2,254 | 44,494 | |
| AirSculpt Technologies, Inc. (a) | 749 | 7,842 | |
| Alignment Healthcare, Inc. (a) | 7,758 | 74,554 | |
| AMN Healthcare Services, Inc. (a) | 4,582 | 447,891 | |
| Apollo Medical Holdings, Inc. (a) | 3,688 | 134,538 | |
| Aveanna Healthcare Holdings, Inc. (a) | 1,452 | 4,240 | |
| Brookdale Senior Living, Inc. (a) | 18,117 | 111,963 | |
| Castle Biosciences, Inc. (a) | 2,109 | 47,115 | |
| Community Health Systems, Inc. (a) | 12,130 | 93,037 | |
| Corvel Corp. (a) | 836 | 129,647 | |
| Covetrus, Inc. (a) | 10,146 | 140,015 | |
| Cross Country Healthcare, Inc. (a) | 3,521 | 65,984 | |
| Fulgent Genetics, Inc. (a) | 2,053 | 112,669 | |
| Hanger, Inc. (a) | 3,647 | 59,957 | |
| HealthEquity, Inc. (a) | 7,956 | 495,818 | |
| InfuSystems Holdings, Inc. (a) | 1,912 | 15,162 | |
| Innovage Holding Corp. (a) | 1,738 | 7,977 | |
| Invitae Corp. (a) | 19,524 | 103,672 | |
| LHC Group, Inc. (a) | 2,977 | 493,735 | |
| LifeStance Health Group, Inc. | 7,063 | 47,817 | |
| MEDNAX, Inc. (a) | 7,346 | 136,048 | |
| Modivcare, Inc. (a) | 1,217 | 126,531 | |
| National Healthcare Corp. | 1,186 | 80,719 | |
| National Research Corp. Class A | 1,406 | 48,226 | |
| Ontrak, Inc. (a) | 2,506 | 2,982 | |
| Option Care Health, Inc. (a) | 15,428 | 460,989 | |
| Owens & Minor, Inc. (b) | 7,038 | 249,779 | |
| Patterson Companies, Inc. | 8,285 | 254,929 | |
| Pennant Group, Inc. (a) | 2,589 | 42,434 | |
| PetIQ, Inc. Class A (a) | 2,641 | 52,556 | |
| Privia Health Group, Inc. (a) | 4,075 | 89,609 | |
| Progyny, Inc. (a)(b) | 6,298 | 242,158 | |
| R1 RCM, Inc. (a) | 11,578 | 260,737 | |
| RadNet, Inc. (a) | 4,411 | 86,015 | |
| Select Medical Holdings Corp. (b) | 10,754 | 243,148 | |
| Sharps Compliance Corp. (a) | 563 | 2,432 | |
| Surgery Partners, Inc. (a) | 3,366 | 172,205 | |
| Tenet Healthcare Corp. (a) | 10,302 | 746,998 | |
| The Ensign Group, Inc. | 5,093 | 409,121 | |
| The Joint Corp. (a) | 1,408 | 42,972 | |
| Tivity Health, Inc. (a) | 4,201 | 134,978 | |
| U.S. Physical Therapy, Inc. | 1,246 | 129,297 | |
| Viemed Healthcare, Inc. (a) | 4,101 | 20,423 | |
| 6,996,259 | |||
| Health Care Technology - 1.0% | |||
| Allscripts Healthcare Solutions, Inc. (a) | 11,799 | 243,767 | |
| American Well Corp. (a) | 19,001 | 59,473 | |
| Computer Programs & Systems, Inc. (a) | 1,346 | 42,964 | |
| Convey Health Solutions Holdin | 1,580 | 8,042 | |
| Evolent Health, Inc. (a) | 7,759 | 213,528 | |
| Forian, Inc. (a) | 2,268 | 7,711 | |
| Health Catalyst, Inc. (a) | 5,276 | 87,793 | |
| HealthStream, Inc. (a) | 2,470 | 47,177 | |
| iCAD, Inc. (a) | 188 | 677 | |
| Inspire Medical Systems, Inc. (a) | 2,619 | 538,885 | |
| MultiPlan Corp. Class A (a) | 31,945 | 141,516 | |
| NantHealth, Inc. (a) | 6,010 | 4,233 | |
| Nextgen Healthcare, Inc. (a) | 5,386 | 101,526 | |
| Omnicell, Inc. (a) | 4,265 | 465,610 | |
| OptimizeRx Corp. (a) | 1,779 | 50,008 | |
| Phreesia, Inc. (a) | 4,954 | 113,348 | |
| Schrodinger, Inc. (a) | 4,516 | 111,636 | |
| Simulations Plus, Inc. | 1,534 | 71,576 | |
| 2,309,470 | |||
| Life Sciences Tools & Services - 0.5% | |||
| Absci Corp. (b) | 5,585 | 33,007 | |
| Akoya Biosciences, Inc. (a) | 1,495 | 14,068 | |
| Alpha Teknova, Inc. | 135 | 1,516 | |
| Berkeley Lights, Inc. (a) | 5,005 | 24,900 | |
| BioNano Genomics, Inc. (a)(b) | 29,502 | 48,088 | |
| ChromaDex, Inc. (a) | 6,088 | 11,506 | |
| Codex DNA, Inc. | 970 | 3,589 | |
| Codexis, Inc. (a) | 5,882 | 70,760 | |
| Cytek Biosciences, Inc. | 9,508 | 89,851 | |
| Harvard Bioscience, Inc. (a) | 3,889 | 20,301 | |
| Inotiv, Inc. (a) | 1,737 | 24,752 | |
| IsoPlexis Corp. | 796 | 1,735 | |
| MaxCyte, Inc. | 10,026 | 55,544 | |
| Medpace Holdings, Inc. (a) | 2,835 | 378,671 | |
| Nanostring Technologies, Inc. (a) | 4,522 | 84,923 | |
| NeoGenomics, Inc. (a) | 11,073 | 104,640 | |
| Pacific Biosciences of California, Inc. (a) | 18,290 | 115,959 | |
| Personalis, Inc. (a) | 3,319 | 18,586 | |
| Quanterix Corp. (a) | 3,078 | 68,301 | |
| Rapid Micro Biosystems, Inc. | 1,873 | 10,920 | |
| Seer, Inc. (a) | 4,225 | 30,758 | |
| Singular Genomics Systems, Inc. (a) | 4,872 | 19,926 | |
| Standard BioTools, Inc. (a) | 7,049 | 18,680 | |
| 1,250,981 | |||
| Pharmaceuticals - 1.4% | |||
| 9 Meters Biopharma, Inc. (a) | 28,722 | 12,000 | |
| Aclaris Therapeutics, Inc. (a) | 5,081 | 62,598 | |
| Aerie Pharmaceuticals, Inc. (a) | 4,300 | 30,573 | |
| Amneal Pharmaceuticals, Inc. (a) | 10,344 | 39,928 | |
| Amphastar Pharmaceuticals, Inc. (a) | 3,595 | 127,515 | |
| Ampio Pharmaceuticals, Inc. (a)(b) | 23,212 | 5,343 | |
| Amylyx Pharmaceuticals, Inc. | 911 | 8,199 | |
| Angion Biomedica Corp. (a) | 1,487 | 1,859 | |
| ANI Pharmaceuticals, Inc. (a) | 513 | 15,139 | |
| Antares Pharma, Inc. (a) | 17,326 | 96,419 | |
| Arvinas Holding Co. LLC (a) | 4,613 | 253,577 | |
| Atea Pharmaceuticals, Inc. (a) | 5,832 | 34,234 | |
| Athira Pharma, Inc. (a) | 3,242 | 33,360 | |
| Axsome Therapeutics, Inc. (a)(b) | 2,715 | 86,201 | |
| Cara Therapeutics, Inc. (a) | 4,531 | 39,510 | |
| Cassava Sciences, Inc. (a)(b) | 3,712 | 77,469 | |
| CinCor Pharma, Inc. (b) | 1,201 | 28,572 | |
| Citius Pharmaceuticals, Inc. (a) | 13,037 | 13,167 | |
| Collegium Pharmaceutical, Inc. (a) | 3,400 | 54,740 | |
| Corcept Therapeutics, Inc. (a) | 8,548 | 183,867 | |
| CorMedix, Inc. (a) | 4,074 | 14,015 | |
| CymaBay Therapeutics, Inc. (a) | 9,675 | 21,962 | |
| DICE Therapeutics, Inc. | 1,371 | 27,859 | |
| Durect Corp. (a) | 14,038 | 6,317 | |
| Edgewise Therapeutics, Inc. (a) | 2,459 | 19,623 | |
| Endo International PLC (a) | 22,777 | 45,554 | |
| Esperion Therapeutics, Inc. (a) | 6,007 | 34,120 | |
| Evolus, Inc. (a) | 3,401 | 38,057 | |
| Eyepoint Pharmaceuticals, Inc. (a) | 2,558 | 28,905 | |
| Fulcrum Therapeutics, Inc. (a) | 2,727 | 26,234 | |
| Harmony Biosciences Holdings, Inc. (a) | 2,254 | 101,520 | |
| Ikena Oncology, Inc. (a) | 1,321 | 5,125 | |
| Innoviva, Inc. (a) | 4,182 | 71,345 | |
| Intra-Cellular Therapies, Inc. (a) | 7,833 | 396,428 | |
| Kala Pharmaceuticals, Inc. (a) | 7,077 | 4,597 | |
| KemPharm, Inc. (a) | 2,701 | 12,073 | |
| Marinus Pharmaceuticals, Inc. (a) | 3,898 | 25,805 | |
| Mind Medicine (MindMed), Inc. (a) | 33,267 | 26,614 | |
| NGM Biopharmaceuticals, Inc. (a) | 3,187 | 39,774 | |
| Nuvation Bio, Inc. (a)(b) | 15,638 | 72,873 | |
| Ocular Therapeutix, Inc. (a) | 4,156 | 14,837 | |
| Omeros Corp. (a)(b) | 6,390 | 22,173 | |
| Oramed Pharmaceuticals, Inc. (a) | 3,875 | 19,918 | |
| Pacira Biosciences, Inc. (a)(b) | 4,315 | 321,770 | |
| Paratek Pharmaceuticals, Inc. (a) | 813 | 1,797 | |
| Phathom Pharmaceuticals, Inc. (a) | 701 | 9,071 | |
| Phibro Animal Health Corp. Class A | 2,035 | 36,610 | |
| Pliant Therapeutics, Inc. (a) | 782 | 4,583 | |
| Prestige Brands Holdings, Inc. (a) | 4,864 | 265,866 | |
| Provention Bio, Inc. (a) | 5,563 | 24,978 | |
| Rain Therapeutics, Inc. (a) | 2,005 | 7,960 | |
| Reata Pharmaceuticals, Inc. (a) | 2,743 | 69,617 | |
| Relmada Therapeutics, Inc. (a) | 2,528 | 63,478 | |
| Revance Therapeutics, Inc. (a) | 7,021 | 115,004 | |
| Seelos Therapeutics, Inc. (a) | 12,787 | 7,928 | |
| SIGA Technologies, Inc. | 4,575 | 31,430 | |
| Supernus Pharmaceuticals, Inc. (a) | 4,855 | 135,455 | |
| Tarsus Pharmaceuticals, Inc. (a) | 949 | 17,376 | |
| Terns Pharmaceuticals, Inc. (a) | 783 | 1,253 | |
| TherapeuticsMD, Inc. (a)(b) | 17,673 | 3,565 | |
| Theravance Biopharma, Inc. (a) | 5,937 | 57,292 | |
| Theseus Pharmaceuticals, Inc. | 1,179 | 9,632 | |
| Ventyx Biosciences, Inc. | 1,058 | 15,373 | |
| Verrica Pharmaceuticals, Inc. (a) | 583 | 3,830 | |
| WAVE Life Sciences (a) | 1,912 | 3,728 | |
| Zogenix, Inc. rights (a)(c) | 5,244 | 3,566 | |
| 3,491,160 | |||
| TOTAL HEALTH CARE | 36,638,109 | ||
| INDUSTRIALS - 15.3% | |||
| Aerospace & Defense - 0.8% | |||
| AAR Corp. (a) | 3,274 | 153,813 | |
| Aerojet Rocketdyne Holdings, Inc. (a) | 7,275 | 290,855 | |
| AeroVironment, Inc. (a) | 2,190 | 175,901 | |
| AerSale Corp. (a) | 1,671 | 24,196 | |
| Astronics Corp. (a) | 2,673 | 25,901 | |
| Byrna Technologies, Inc. (a) | 1,714 | 10,147 | |
| Cadre Holding, Inc. | 635 | 16,116 | |
| Ducommun, Inc. (a) | 1,032 | 52,704 | |
| Kaman Corp. | 2,693 | 105,054 | |
| Kratos Defense & Security Solutions, Inc. (a) | 12,018 | 182,313 | |
| Maxar Technologies, Inc. | 7,072 | 227,789 | |
| Moog, Inc. Class A | 2,798 | 223,476 | |
| National Presto Industries, Inc. | 489 | 34,783 | |
| Park Aerospace Corp. | 1,836 | 21,481 | |
| Parsons Corp. (a) | 2,527 | 93,322 | |
| Triumph Group, Inc. (a) | 6,241 | 140,672 | |
| Vectrus, Inc. (a) | 1,146 | 41,371 | |
| 1,819,894 | |||
| Air Freight & Logistics - 0.4% | |||
| Air Transport Services Group, Inc. (a) | 5,722 | 179,099 | |
| Atlas Air Worldwide Holdings, Inc. (a) | 2,773 | 191,171 | |
| Forward Air Corp. | 2,614 | 253,480 | |
| Hub Group, Inc. Class A (a) | 3,206 | 215,315 | |
| Radiant Logistics, Inc. (a) | 4,017 | 23,178 | |
| 862,243 | |||
| Airlines - 0.3% | |||
| Allegiant Travel Co. (a) | 1,473 | 228,595 | |
| Frontier Group Holdings, Inc. (a)(b) | 3,330 | 35,331 | |
| Hawaiian Holdings, Inc. (a) | 5,048 | 85,614 | |
| Mesa Air Group, Inc. (a) | 3,355 | 11,407 | |
| SkyWest, Inc. (a) | 4,774 | 139,162 | |
| Spirit Airlines, Inc. (a) | 9,645 | 227,718 | |
| Sun Country Airlines Holdings, Inc. (a) | 3,118 | 85,776 | |
| 813,603 | |||
| Building Products - 1.3% | |||
| AAON, Inc. | 4,078 | 198,762 | |
| American Woodmark Corp. (a) | 1,629 | 76,319 | |
| Apogee Enterprises, Inc. | 2,369 | 104,236 | |
| Caesarstone Sdot-Yam Ltd. | 1,321 | 12,985 | |
| Cornerstone Building Brands, Inc. (a) | 5,331 | 130,023 | |
| CSW Industrials, Inc. | 1,449 | 152,884 | |
| Gibraltar Industries, Inc. (a) | 3,205 | 121,277 | |
| Griffon Corp. | 5,018 | 93,887 | |
| Insteel Industries, Inc. | 1,822 | 77,289 | |
| Jeld-Wen Holding, Inc. (a) | 8,916 | 185,364 | |
| Masonite International Corp. (a) | 2,333 | 180,854 | |
| PGT Innovations, Inc. (a) | 5,636 | 100,152 | |
| Quanex Building Products Corp. | 3,419 | 65,713 | |
| Resideo Technologies, Inc. (a) | 14,096 | 317,019 | |
| Simpson Manufacturing Co. Ltd. | 4,244 | 439,975 | |
| UFP Industries, Inc. | 5,857 | 453,156 | |
| View, Inc. Class A (a) | 6,298 | 9,699 | |
| Zurn Water Solutions Corp. | 11,711 | 365,617 | |
| 3,085,211 | |||
| Commercial Services & Supplies - 1.8% | |||
| ABM Industries, Inc. | 6,555 | 316,410 | |
| ACCO Brands Corp. | 9,009 | 66,036 | |
| Aris Water Solution, Inc. Class A | 1,893 | 32,067 | |
| Brady Corp. Class A | 4,580 | 204,955 | |
| BrightView Holdings, Inc. (a) | 4,731 | 59,894 | |
| Casella Waste Systems, Inc. Class A (a) | 4,772 | 392,449 | |
| CECO Environmental Corp. (a) | 3,220 | 15,295 | |
| Cimpress PLC (a) | 1,740 | 87,887 | |
| CompX International, Inc. Class A | 171 | 3,630 | |
| CoreCivic, Inc. (a) | 11,584 | 143,989 | |
| Deluxe Corp. | 4,178 | 113,140 | |
| Ennis, Inc. | 2,337 | 40,313 | |
| Harsco Corp. (a) | 7,653 | 78,214 | |
| Healthcare Services Group, Inc. | 7,346 | 125,543 | |
| Heritage-Crystal Clean, Inc. (a) | 1,495 | 40,814 | |
| HNI Corp. | 4,264 | 151,969 | |
| Interface, Inc. | 5,686 | 72,155 | |
| KAR Auction Services, Inc. (a) | 11,721 | 171,830 | |
| Kimball International, Inc. Class B | 1,615 | 12,403 | |
| Matthews International Corp. Class A | 3,106 | 92,590 | |
| Millerknoll, Inc. | 7,294 | 231,439 | |
| Montrose Environmental Group, Inc. (a) | 2,551 | 115,739 | |
| NL Industries, Inc. | 812 | 5,587 | |
| Pitney Bowes, Inc. | 17,531 | 92,388 | |
| SP Plus Corp. (a) | 2,263 | 64,496 | |
| Steelcase, Inc. Class A | 8,566 | 100,479 | |
| Team, Inc. (a) | 2,957 | 4,258 | |
| Tetra Tech, Inc. (b) | 5,240 | 729,827 | |
| The Brink's Co. | 4,682 | 276,004 | |
| The GEO Group, Inc. (a)(b) | 10,962 | 71,582 | |
| U.S. Ecology, Inc. (a) | 3,078 | 147,713 | |
| UniFirst Corp. | 1,461 | 251,730 | |
| Viad Corp. (a) | 2,040 | 66,810 | |
| VSE Corp. | 1,015 | 43,960 | |
| 4,423,595 | |||
| Construction & Engineering - 1.6% | |||
| Ameresco, Inc. Class A (a) | 3,020 | 152,329 | |
| API Group Corp. (a) | 19,676 | 365,187 | |
| Arcosa, Inc. | 4,722 | 252,769 | |
| Argan, Inc. | 1,418 | 52,154 | |
| Comfort Systems U.S.A., Inc. | 3,464 | 292,431 | |
| Concrete Pumping Holdings, Inc. (a) | 2,602 | 14,519 | |
| Construction Partners, Inc. Class A (a) | 3,904 | 100,762 | |
| Dycom Industries, Inc. (a) | 2,865 | 243,267 | |
| EMCOR Group, Inc. | 5,177 | 551,247 | |
| Fluor Corp. (a)(b) | 13,796 | 341,451 | |
| Granite Construction, Inc. | 4,448 | 131,883 | |
| Great Lakes Dredge & Dock Corp. (a) | 6,182 | 85,373 | |
| IES Holdings, Inc. (a) | 576 | 16,877 | |
| Infrastructure and Energy Alternatives, Inc. (a) | 2,867 | 26,806 | |
| INNOVATE Corp. (a) | 5,469 | 16,571 | |
| Matrix Service Co. (a) | 3,056 | 20,781 | |
| MYR Group, Inc. (a) | 1,611 | 127,414 | |
| Northwest Pipe Co. (a) | 996 | 26,603 | |
| NV5 Global, Inc. (a) | 1,270 | 152,146 | |
| Primoris Services Corp. | 5,213 | 120,837 | |
| Sterling Construction Co., Inc. (a) | 2,716 | 62,169 | |
| Tutor Perini Corp. (a) | 4,074 | 37,766 | |
| Willscot Mobile Mini Holdings (a) | 20,311 | 712,916 | |
| 3,904,258 | |||
| Electrical Equipment - 0.9% | |||
| Advent Technologies Holdings, Inc. Class A (a) | 4,297 | 8,379 | |
| Allied Motion Technologies, Inc. | 1,222 | 29,743 | |
| American Superconductor Corp. (a) | 3,244 | 17,291 | |
| Array Technologies, Inc. (a) | 12,615 | 82,376 | |
| Atkore, Inc. (a) | 4,364 | 419,380 | |
| AZZ, Inc. | 2,353 | 107,391 | |
| Babcock & Wilcox Enterprises, Inc. (a) | 5,637 | 42,334 | |
| Beam Global (a) | 200 | 3,088 | |
| Blink Charging Co. (a)(b) | 3,633 | 69,390 | |
| Bloom Energy Corp. Class A (a)(b) | 13,906 | 258,095 | |
| Encore Wire Corp. | 1,919 | 216,482 | |
| EnerSys | 4,048 | 264,982 | |
| Eos Energy Enterprises, Inc. (a) | 482 | 1,022 | |
| FTC Solar, Inc. (a) | 4,439 | 12,429 | |
| FuelCell Energy, Inc. (a) | 36,009 | 146,917 | |
| GrafTech International Ltd. | 19,417 | 176,306 | |
| Powell Industries, Inc. | 994 | 19,184 | |
| Preformed Line Products Co. | 342 | 20,349 | |
| Romeo Power, Inc. (a) | 12,149 | 13,364 | |
| Stem, Inc. (a) | 11,312 | 81,107 | |
| Thermon Group Holdings, Inc. (a) | 3,301 | 49,515 | |
| TPI Composites, Inc. (a) | 3,295 | 37,695 | |
| Vicor Corp. (a) | 2,098 | 126,971 | |
| 2,203,790 | |||
| Machinery - 3.4% | |||
| AgEagle Aerial Systems, Inc. (a) | 9,231 | 7,441 | |
| Alamo Group, Inc. | 960 | 121,382 | |
| Albany International Corp. Class A | 2,965 | 231,922 | |
| Altra Industrial Motion Corp. | 6,369 | 248,391 | |
| Astec Industries, Inc. | 2,229 | 87,154 | |
| Barnes Group, Inc. | 4,566 | 153,326 | |
| Blue Bird Corp. (a) | 1,755 | 28,133 | |
| Chart Industries, Inc. (a) | 3,551 | 599,480 | |
| CIRCOR International, Inc. (a) | 1,847 | 36,294 | |
| Columbus McKinnon Corp. (NY Shares) | 2,735 | 96,956 | |
| Commercial Vehicle Group, Inc. (a) | 3,081 | 22,122 | |
| Desktop Metal, Inc. (a)(b) | 18,887 | 66,293 | |
| Douglas Dynamics, Inc. | 2,246 | 69,536 | |
| Energy Recovery, Inc. (a) | 4,051 | 75,025 | |
| Enerpac Tool Group Corp. Class A | 5,955 | 119,576 | |
| EnPro Industries, Inc. | 1,980 | 184,556 | |
| ESCO Technologies, Inc. | 2,474 | 154,501 | |
| Evoqua Water Technologies Corp. (a) | 11,246 | 468,846 | |
| Federal Signal Corp. | 5,847 | 198,973 | |
| Franklin Electric Co., Inc. | 4,462 | 312,072 | |
| Gorman-Rupp Co. | 2,192 | 69,837 | |
| Helios Technologies, Inc. | 3,155 | 211,953 | |
| Hillenbrand, Inc. | 7,069 | 288,557 | |
| Hydrofarm Holdings Group, Inc. (a) | 4,001 | 38,210 | |
| Hyliion Holdings Corp. Class A (a)(b) | 1,748 | 5,611 | |
| Hyster-Yale Materials Handling Class A | 1,072 | 32,932 | |
| Ideanomics, Inc. (a)(b) | 50,876 | 36,590 | |
| John Bean Technologies Corp. | 3,054 | 360,036 | |
| Kadant, Inc. | 1,117 | 206,645 | |
| Kennametal, Inc. | 8,125 | 209,056 | |
| Lindsay Corp. | 1,060 | 143,259 | |
| Luxfer Holdings PLC sponsored | 2,826 | 45,612 | |
| Manitowoc Co., Inc. (a) | 3,584 | 47,452 | |
| Mayville Engineering Co., Inc. (a) | 1,100 | 9,108 | |
| Meritor, Inc. (a) | 6,591 | 236,683 | |
| Miller Industries, Inc. | 1,208 | 32,386 | |
| Mueller Industries, Inc. | 5,422 | 293,601 | |
| Mueller Water Products, Inc. Class A | 15,121 | 181,906 | |
| Nikola Corp. (a)(b) | 22,475 | 161,371 | |
| NN, Inc. (a) | 1,295 | 3,924 | |
| Omega Flex, Inc. | 197 | 21,867 | |
| Park-Ohio Holdings Corp. | 210 | 2,014 | |
| Proto Labs, Inc. (a) | 2,761 | 117,646 | |
| RBC Bearings, Inc. (a)(b) | 2,721 | 458,080 | |
| REV Group, Inc. | 3,500 | 41,720 | |
| Shyft Group, Inc. (The) | 3,362 | 85,630 | |
| SPX Corp. (a) | 4,263 | 178,620 | |
| Standex International Corp. | 1,131 | 106,359 | |
| Tennant Co. | 1,783 | 115,146 | |
| Terex Corp. | 6,663 | 226,542 | |
| The Greenbrier Companies, Inc. | 3,107 | 132,700 | |
| Titan International, Inc. (a) | 5,011 | 69,452 | |
| Trinity Industries, Inc. | 7,420 | 205,831 | |
| Wabash National Corp. | 4,745 | 67,901 | |
| Watts Water Technologies, Inc. Class A | 2,677 | 341,210 | |
| Welbilt, Inc. (a) | 12,490 | 295,014 | |
| 8,362,440 | |||
| Marine - 0.2% | |||
| Costamare, Inc. | 4,998 | 67,023 | |
| Eagle Bulk Shipping, Inc. | 880 | 54,771 | |
| Genco Shipping & Trading Ltd. | 3,159 | 69,593 | |
| Matson, Inc. | 4,018 | 345,628 | |
| Safe Bulkers, Inc. | 6,323 | 25,988 | |
| 563,003 | |||
| Professional Services - 1.9% | |||
| Acacia Research Corp. (a) | 5,330 | 24,998 | |
| ASGN, Inc. (a) | 4,938 | 560,216 | |
| Atlas Technical Consultants, Inc. (a) | 1,493 | 18,065 | |
| Barrett Business Services, Inc. | 711 | 51,171 | |
| CBIZ, Inc. (a) | 4,690 | 196,464 | |
| CRA International, Inc. | 687 | 56,588 | |
| Exponent, Inc. | 5,041 | 482,978 | |
| First Advantage Corp. | 5,363 | 93,102 | |
| Forrester Research, Inc. (a) | 1,066 | 59,366 | |
| Franklin Covey Co. (a) | 1,218 | 48,805 | |
| Heidrick & Struggles International, Inc. | 1,881 | 60,117 | |
| Hirequest, Inc. | 535 | 8,892 | |
| HireRight Holdings Corp. | 2,221 | 38,401 | |
| Huron Consulting Group, Inc. (a) | 2,116 | 109,566 | |
| ICF International, Inc. | 1,770 | 174,894 | |
| Insperity, Inc. | 3,507 | 371,917 | |
| KBR, Inc. | 13,708 | 674,845 | |
| Kelly Services, Inc. Class A (non-vtg.) | 3,394 | 65,470 | |
| Kforce, Inc. | 1,949 | 136,527 | |
| Korn Ferry | 5,220 | 320,717 | |
| ManTech International Corp. Class A | 2,660 | 213,704 | |
| MISTRAS Group, Inc. (a) | 1,831 | 10,418 | |
| Resources Connection, Inc. | 2,926 | 50,298 | |
| Sterling Check Corp. | 1,655 | 42,997 | |
| TriNet Group, Inc. (a)(b) | 3,924 | 348,059 | |
| TrueBlue, Inc. (a) | 3,334 | 85,250 | |
| Upwork, Inc. (a) | 11,549 | 242,183 | |
| Willdan Group, Inc. (a) | 1,063 | 28,573 | |
| 4,574,581 | |||
| Road & Rail - 1.0% | |||
| ArcBest Corp. | 2,477 | 178,740 | |
| Avis Budget Group, Inc. (a)(b) | 4,013 | 1,074,160 | |
| Covenant Transport Group, Inc. Class A | 1,264 | 25,963 | |
| Daseke, Inc. (a) | 3,865 | 32,466 | |
| Heartland Express, Inc. | 4,408 | 60,830 | |
| HyreCar, Inc. (a) | 99 | 154 | |
| Marten Transport Ltd. | 5,724 | 99,483 | |
| P.A.M. Transportation Services, Inc. | 646 | 19,632 | |
| Saia, Inc. (a) | 2,590 | 533,436 | |
| U.S. Xpress Enterprises, Inc. (a) | 2,741 | 9,073 | |
| Universal Logistics Holdings, Inc. | 904 | 18,333 | |
| Werner Enterprises, Inc. | 5,838 | 231,360 | |
| Yellow Corp. (a) | 5,352 | 23,977 | |
| 2,307,607 | |||
| Trading Companies & Distributors - 1.7% | |||
| Alta Equipment Group, Inc. (a) | 2,020 | 22,725 | |
| Applied Industrial Technologies, Inc. | 3,706 | 387,981 | |
| Beacon Roofing Supply, Inc. (a) | 5,417 | 323,016 | |
| BlueLinx Corp. (a) | 900 | 60,003 | |
| Boise Cascade Co. | 3,837 | 290,000 | |
| Custom Truck One Source, Inc. Class A (a) | 6,035 | 39,650 | |
| DXP Enterprises, Inc. (a) | 1,713 | 40,478 | |
| EVI Industries, Inc. (a) | 145 | 2,072 | |
| GATX Corp. (b) | 3,392 | 350,699 | |
| Global Industrial Co. | 1,264 | 39,007 | |
| GMS, Inc. (a) | 4,175 | 200,191 | |
| H&E Equipment Services, Inc. | 3,159 | 112,081 | |
| Herc Holdings, Inc. | 2,430 | 310,603 | |
| Karat Packaging, Inc. (a) | 577 | 10,588 | |
| Lawson Products, Inc. (a) | 528 | 20,059 | |
| McGrath RentCorp. | 2,335 | 194,879 | |
| MRC Global, Inc. (a) | 7,842 | 94,026 | |
| NOW, Inc. (a) | 10,824 | 117,982 | |
| Rush Enterprises, Inc.: | |||
| Class A | 4,400 | 223,872 | |
| Class B | 262 | 12,694 | |
| Textainer Group Holdings Ltd. | 4,539 | 152,238 | |
| Titan Machinery, Inc. (a) | 1,919 | 45,250 | |
| Transcat, Inc. (a) | 703 | 51,319 | |
| Triton International Ltd. | 6,451 | 394,092 | |
| Veritiv Corp. (a) | 1,391 | 195,491 | |
| WESCO International, Inc. (a) | 4,349 | 536,058 | |
| Willis Lease Finance Corp. (a) | 235 | 7,309 | |
| 4,234,363 | |||
| TOTAL INDUSTRIALS | 37,154,588 | ||
| INFORMATION TECHNOLOGY - 13.2% | |||
| Communications Equipment - 0.7% | |||
| ADTRAN, Inc. | 4,729 | 82,237 | |
| Aviat Networks, Inc. (a) | 1,034 | 30,917 | |
| CalAmp Corp. (a) | 3,840 | 21,005 | |
| Calix, Inc. (a) | 5,374 | 214,476 | |
| Cambium Networks Corp. (a) | 1,110 | 16,950 | |
| Casa Systems, Inc. (a) | 3,633 | 17,802 | |
| Clearfield, Inc. (a) | 1,123 | 65,392 | |
| Comtech Telecommunications Corp. | 2,191 | 29,798 | |
| Digi International, Inc. (a) | 3,301 | 62,455 | |
| DZS, Inc. (a) | 1,799 | 21,750 | |
| EMCORE Corp. (a) | 3,271 | 11,285 | |
| Extreme Networks, Inc. (a) | 12,464 | 119,654 | |
| Harmonic, Inc. (a) | 8,903 | 73,895 | |
| Infinera Corp. (a) | 18,116 | 139,312 | |
| Inseego Corp. (a) | 9,110 | 25,964 | |
| KVH Industries, Inc. (a) | 1,796 | 14,314 | |
| NETGEAR, Inc. (a) | 2,798 | 60,717 | |
| NetScout Systems, Inc. (a) | 6,713 | 206,760 | |
| Plantronics, Inc. (a) | 4,164 | 165,977 | |
| Ribbon Communications, Inc. (a) | 7,850 | 27,083 | |
| Viavi Solutions, Inc. (a) | 22,254 | 319,122 | |
| 1,726,865 | |||
| Electronic Equipment & Components - 2.3% | |||
| 908 Devices, Inc. (a) | 2,130 | 37,808 | |
| Advanced Energy Industries, Inc. | 3,682 | 281,747 | |
| Aeva Technologies, Inc. (a)(b) | 10,932 | 35,857 | |
| Akoustis Technologies, Inc. (a) | 5,510 | 24,464 | |
| Arlo Technologies, Inc. (a) | 8,256 | 63,901 | |
| Badger Meter, Inc. | 2,829 | 228,272 | |
| Belden, Inc. | 4,277 | 220,822 | |
| Benchmark Electronics, Inc. | 3,503 | 83,231 | |
| CTS Corp. | 3,066 | 108,444 | |
| Daktronics, Inc. (a) | 3,970 | 13,300 | |
| ePlus, Inc. (a) | 2,552 | 144,137 | |
| Fabrinet (a) | 3,585 | 352,011 | |
| FARO Technologies, Inc. (a) | 1,829 | 62,716 | |
| Identiv, Inc. (a) | 2,274 | 27,720 | |
| II-VI, Inc. (a)(b) | 10,328 | 632,177 | |
| Insight Enterprises, Inc. (a) | 3,309 | 328,815 | |
| Iteris, Inc. (a) | 5,097 | 13,150 | |
| Itron, Inc. (a) | 4,458 | 213,003 | |
| Kimball Electronics, Inc. (a) | 2,324 | 41,460 | |
| Knowles Corp. (a) | 8,378 | 155,161 | |
| Luna Innovations, Inc. (a) | 3,531 | 19,491 | |
| Methode Electronics, Inc. Class A | 3,590 | 160,150 | |
| MicroVision, Inc. (a)(b) | 16,265 | 52,536 | |
| Napco Security Technologies, Inc. | 2,916 | 51,030 | |
| nLIGHT, Inc. (a) | 4,338 | 57,045 | |
| Novanta, Inc. (a)(b) | 3,438 | 442,471 | |
| OSI Systems, Inc. (a) | 1,594 | 126,085 | |
| Ouster, Inc. (a)(b) | 12,771 | 42,272 | |
| Par Technology Corp. (a) | 2,544 | 84,054 | |
| PC Connection, Inc. | 1,035 | 51,222 | |
| Plexus Corp. (a) | 2,713 | 220,133 | |
| Rogers Corp. (a) | 1,795 | 485,942 | |
| Sanmina Corp. (a) | 6,051 | 247,425 | |
| ScanSource, Inc. (a) | 2,420 | 82,861 | |
| TTM Technologies, Inc. (a) | 9,949 | 138,789 | |
| Velodyne Lidar, Inc. (a) | 438 | 823 | |
| Vishay Intertechnology, Inc. | 12,915 | 240,606 | |
| Vishay Precision Group, Inc. (a) | 1,181 | 36,859 | |
| 5,607,990 | |||
| IT Services - 1.5% | |||
| BigCommerce Holdings, Inc. (a) | 4,839 | 86,473 | |
| Brightcove, Inc. (a) | 4,288 | 30,230 | |
| Cantaloupe, Inc. (a) | 3,584 | 19,604 | |
| Cass Information Systems, Inc. | 1,350 | 52,259 | |
| Conduent, Inc. (a) | 16,267 | 91,583 | |
| CSG Systems International, Inc. | 3,057 | 187,914 | |
| Digitalocean Holdings, Inc. (a) | 4,961 | 195,612 | |
| EVERTEC, Inc. | 5,856 | 230,726 | |
| EVO Payments, Inc. Class A (a) | 4,597 | 103,570 | |
| ExlService Holdings, Inc. (a) | 3,163 | 430,642 | |
| Flywire Corp. (a) | 5,538 | 168,964 | |
| GreenBox POS (a)(b) | 1,750 | 6,318 | |
| Grid Dynamics Holdings, Inc. (a) | 4,294 | 59,772 | |
| Hackett Group, Inc. | 2,220 | 52,148 | |
| i3 Verticals, Inc. Class A (a) | 2,210 | 60,665 | |
| IBEX Ltd. (a) | 558 | 8,643 | |
| International Money Express, Inc. (a) | 3,149 | 62,571 | |
| Limelight Networks, Inc. (a) | 12,233 | 43,672 | |
| Liveramp Holdings, Inc. (a) | 6,482 | 203,016 | |
| Maximus, Inc. | 5,935 | 432,543 | |
| MoneyGram International, Inc. (a) | 8,679 | 87,918 | |
| Paya Holdings, Inc. (a) | 8,745 | 44,512 | |
| Perficient, Inc. (a) | 3,161 | 314,235 | |
| Priority Technology Holdings, Inc. (a) | 1,537 | 7,378 | |
| Rackspace Technology, Inc. (a) | 5,436 | 53,762 | |
| Remitly Global, Inc. | 1,462 | 16,228 | |
| Repay Holdings Corp. (a) | 8,611 | 115,215 | |
| StarTek, Inc. (a) | 1,633 | 6,124 | |
| Ttec Holdings, Inc. | 1,795 | 132,489 | |
| Tucows, Inc. (a) | 919 | 52,953 | |
| Unisys Corp. (a) | 6,464 | 91,853 | |
| Verra Mobility Corp. (a) | 14,839 | 208,191 | |
| 3,657,783 | |||
| Semiconductors & Semiconductor Equipment - 3.0% | |||
| Alpha & Omega Semiconductor Ltd. (a) | 2,064 | 88,546 | |
| Ambarella, Inc. (a)(b) | 3,448 | 283,012 | |
| Amkor Technology, Inc. | 9,910 | 186,407 | |
| Atomera, Inc. (a)(b) | 2,111 | 22,060 | |
| Axcelis Technologies, Inc. (a) | 3,195 | 173,968 | |
| AXT, Inc. (a) | 4,367 | 25,765 | |
| CEVA, Inc. (a) | 2,238 | 81,329 | |
| CMC Materials, Inc. | 2,750 | 492,003 | |
| Cohu, Inc. (a) | 4,675 | 124,168 | |
| Credo Technology Group Holding Ltd. (b) | 2,069 | 22,842 | |
| Diodes, Inc. (a) | 4,210 | 307,456 | |
| FormFactor, Inc. (a) | 7,544 | 287,502 | |
| Ichor Holdings Ltd. (a) | 2,744 | 79,878 | |
| Impinj, Inc. (a) | 1,872 | 92,215 | |
| Kopin Corp. (a) | 8,550 | 13,680 | |
| Kulicke & Soffa Industries, Inc. (b) | 5,945 | 275,907 | |
| Lattice Semiconductor Corp. (a) | 13,239 | 636,002 | |
| MACOM Technology Solutions Holdings, Inc. (a) | 4,773 | 243,184 | |
| MaxLinear, Inc. Class A (a) | 6,926 | 331,548 | |
| Meta Materials, Inc. (a)(b) | 20,743 | 24,892 | |
| NeoPhotonics Corp. (a) | 4,899 | 74,171 | |
| NVE Corp. | 225 | 10,436 | |
| Onto Innovation, Inc. (a) | 4,740 | 337,204 | |
| PDF Solutions, Inc. (a) | 2,902 | 67,472 | |
| Photronics, Inc. (a) | 5,652 | 84,723 | |
| Power Integrations, Inc. | 5,726 | 458,080 | |
| Rambus, Inc. (a) | 10,448 | 260,260 | |
| Semtech Corp. (a) | 6,273 | 373,871 | |
| Silicon Laboratories, Inc. (a) | 3,676 | 495,929 | |
| SiTime Corp. (a) | 1,571 | 264,823 | |
| SkyWater Technology, Inc. (a) | 1,005 | 6,151 | |
| SMART Global Holdings, Inc. (a) | 4,691 | 106,298 | |
| SunPower Corp. (a) | 7,806 | 128,877 | |
| Synaptics, Inc. (a) | 3,850 | 571,494 | |
| Ultra Clean Holdings, Inc. (a) | 4,359 | 135,870 | |
| Veeco Instruments, Inc. (a) | 4,790 | 109,787 | |
| 7,277,810 | |||
| Software - 5.4% | |||
| 8x8, Inc. (a) | 11,288 | 103,511 | |
| A10 Networks, Inc. | 5,800 | 82,824 | |
| ACI Worldwide, Inc. (a) | 11,464 | 316,636 | |
| Agilysys, Inc. (a) | 2,113 | 77,780 | |
| Alarm.com Holdings, Inc. (a) | 4,612 | 281,701 | |
| Alkami Technology, Inc. (a) | 2,572 | 33,693 | |
| Altair Engineering, Inc. Class A (a) | 4,552 | 247,265 | |
| American Software, Inc. Class A | 3,073 | 52,548 | |
| AppFolio, Inc. (a) | 1,864 | 193,595 | |
| Appian Corp. Class A (a) | 3,874 | 185,177 | |
| Arteris, Inc. | 561 | 6,614 | |
| Asana, Inc. (a) | 6,379 | 170,957 | |
| Avaya Holdings Corp. (a) | 8,285 | 76,636 | |
| AvidXchange Holdings, Inc. | 2,521 | 20,647 | |
| Benefitfocus, Inc. (a) | 2,481 | 26,423 | |
| Blackbaud, Inc. (a) | 4,647 | 269,572 | |
| BlackLine, Inc. (a) | 5,306 | 355,767 | |
| Bottomline Technologies, Inc. (a) | 4,271 | 241,824 | |
| Box, Inc. Class A (a)(b) | 13,241 | 405,439 | |
| BTRS Holdings, Inc. (a) | 9,615 | 64,613 | |
| Cerence, Inc. (a) | 3,705 | 109,298 | |
| ChannelAdvisor Corp. (a) | 2,888 | 41,905 | |
| Cleanspark, Inc. (a) | 4,099 | 26,603 | |
| CommVault Systems, Inc. (a) | 4,321 | 263,581 | |
| Consensus Cloud Solutions, Inc. (a) | 1,571 | 82,823 | |
| CoreCard Corp. (a) | 714 | 16,272 | |
| Couchbase, Inc. | 2,379 | 40,443 | |
| CS Disco, Inc. | 1,562 | 47,969 | |
| Digimarc Corp. (a)(b) | 1,134 | 29,337 | |
| Digital Turbine, Inc. (a)(b) | 8,904 | 281,812 | |
| Domo, Inc. Class B (a) | 2,794 | 115,727 | |
| E2open Parent Holdings, Inc. (a) | 19,490 | 150,853 | |
| Ebix, Inc. | 2,567 | 76,497 | |
| eGain Communications Corp. (a) | 2,148 | 22,232 | |
| Enfusion, Inc. Class A | 2,309 | 29,486 | |
| EngageSmart, Inc. | 1,686 | 35,204 | |
| Envestnet, Inc. (a) | 5,261 | 418,986 | |
| EverCommerce, Inc. (b) | 3,042 | 37,660 | |
| GTY Technology Holdings, Inc. (a) | 4,214 | 25,663 | |
| Instructure Holdings, Inc. | 1,191 | 21,557 | |
| Intapp, Inc. | 1,424 | 35,515 | |
| InterDigital, Inc. | 2,964 | 168,503 | |
| JFrog Ltd. (a) | 5,277 | 110,131 | |
| Kaltura, Inc. | 6,480 | 10,044 | |
| LivePerson, Inc. (a) | 6,471 | 146,374 | |
| Marathon Digital Holdings, Inc. (a)(b) | 9,362 | 146,047 | |
| MeridianLink, Inc. (b) | 2,272 | 36,693 | |
| MicroStrategy, Inc. Class A (a)(b) | 915 | 324,066 | |
| Mimecast Ltd. (a) | 5,991 | 477,363 | |
| Mitek Systems, Inc. (a) | 4,299 | 48,020 | |
| Model N, Inc. (a) | 3,585 | 92,636 | |
| Momentive Global, Inc. (a) | 12,897 | 204,031 | |
| ON24, Inc. (a) | 2,541 | 32,194 | |
| Onespan, Inc. (a) | 3,592 | 50,755 | |
| Pagerduty, Inc. (a)(b) | 8,120 | 231,988 | |
| Ping Identity Holding Corp. (a) | 5,927 | 154,873 | |
| Progress Software Corp. | 4,233 | 203,099 | |
| PROS Holdings, Inc. (a) | 3,924 | 109,597 | |
| Q2 Holdings, Inc. (a) | 5,358 | 277,169 | |
| Qualys, Inc. (a) | 3,312 | 451,359 | |
| Rapid7, Inc. (a) | 5,468 | 522,303 | |
| Rekor Systems, Inc. (a) | 3,711 | 11,022 | |
| Rimini Street, Inc. (a) | 4,426 | 25,494 | |
| Riot Blockchain, Inc. (a)(b) | 10,614 | 107,626 | |
| SailPoint Technologies Holding, Inc. (a) | 8,883 | 567,002 | |
| Sapiens International Corp. NV | 2,972 | 69,069 | |
| SecureWorks Corp. (a) | 871 | 9,616 | |
| ShotSpotter, Inc. (a) | 328 | 9,004 | |
| Smith Micro Software, Inc. (a) | 399 | 1,229 | |
| Sprout Social, Inc. (a) | 4,413 | 270,429 | |
| SPS Commerce, Inc. (a) | 3,503 | 419,064 | |
| Stronghold Digital Mining, Inc. Class A | 681 | 2,656 | |
| Sumo Logic, Inc. (a) | 8,851 | 83,022 | |
| Telos Corp. (a) | 4,035 | 31,433 | |
| Tenable Holdings, Inc. (a) | 8,982 | 496,076 | |
| Upland Software, Inc. (a) | 2,981 | 44,477 | |
| UserTesting, Inc. (a) | 872 | 6,810 | |
| Varonis Systems, Inc. (a) | 10,431 | 450,619 | |
| Verint Systems, Inc. (a) | 6,136 | 334,780 | |
| Veritone, Inc. (a)(b) | 2,919 | 31,613 | |
| Viant Technology, Inc. (a) | 1,202 | 7,068 | |
| VirnetX Holding Corp. (a)(b) | 7,815 | 11,097 | |
| Vonage Holdings Corp. (a) | 24,429 | 487,603 | |
| Weave Communications, Inc. | 759 | 3,598 | |
| Workiva, Inc. (a) | 4,173 | 402,736 | |
| Xperi Holding Corp. | 10,258 | 160,025 | |
| Yext, Inc. (a) | 11,312 | 65,496 | |
| Zuora, Inc. (a) | 11,087 | 134,929 | |
| 13,163,483 | |||
| Technology Hardware, Storage & Peripherals - 0.3% | |||
| 3D Systems Corp. (a) | 12,133 | 137,588 | |
| Avid Technology, Inc. (a) | 3,489 | 110,636 | |
| Corsair Gaming, Inc. (a)(b) | 2,492 | 37,704 | |
| Diebold Nixdorf, Inc. (a) | 7,307 | 29,959 | |
| Eastman Kodak Co. (a) | 4,543 | 23,487 | |
| Quantum Corp. (a) | 4,942 | 9,242 | |
| Super Micro Computer, Inc. (a) | 4,327 | 182,167 | |
| Turtle Beach Corp. (a) | 1,533 | 25,509 | |
| 556,292 | |||
| TOTAL INFORMATION TECHNOLOGY | 31,990,223 | ||
| MATERIALS - 4.0% | |||
| Chemicals - 2.0% | |||
| AdvanSix, Inc. | 2,655 | 118,254 | |
| American Vanguard Corp. | 2,859 | 61,183 | |
| Amyris, Inc. (a)(b) | 17,509 | 60,056 | |
| Aspen Aerogels, Inc. (a) | 2,169 | 46,850 | |
| Avient Corp. | 8,863 | 436,414 | |
| Balchem Corp. | 3,107 | 382,782 | |
| Cabot Corp. (b) | 5,428 | 357,434 | |
| Chase Corp. | 702 | 59,221 | |
| Danimer Scientific, Inc. (a)(b) | 9,081 | 35,598 | |
| Ecovyst, Inc. | 5,718 | 57,523 | |
| FutureFuel Corp. | 2,622 | 24,935 | |
| GCP Applied Technologies, Inc. (a) | 6,468 | 202,901 | |
| H.B. Fuller Co. | 5,094 | 339,770 | |
| Hawkins, Inc. | 1,863 | 69,453 | |
| Ingevity Corp. (a) | 3,858 | 231,094 | |
| Innospec, Inc. | 2,368 | 225,694 | |
| Intrepid Potash, Inc. (a) | 970 | 74,283 | |
| Koppers Holdings, Inc. | 1,997 | 48,447 | |
| Kronos Worldwide, Inc. | 2,058 | 31,323 | |
| Livent Corp. (a)(b) | 15,765 | 336,740 | |
| Marrone Bio Innovations, Inc. (a) | 10,285 | 11,931 | |
| Minerals Technologies, Inc. | 3,194 | 203,170 | |
| Orion Engineered Carbons SA | 5,853 | 88,380 | |
| PureCycle Technologies, Inc. (a) | 5,334 | 41,605 | |
| Quaker Houghton | 1,322 | 215,103 | |
| Rayonier Advanced Materials, Inc. (a) | 6,244 | 32,032 | |
| Sensient Technologies Corp. | 4,073 | 344,576 | |
| Stepan Co. | 2,080 | 212,389 | |
| Tredegar Corp. | 2,529 | 28,957 | |
| Trinseo PLC | 3,805 | 180,547 | |
| Tronox Holdings PLC | 11,142 | 191,642 | |
| Valhi, Inc. | 194 | 6,171 | |
| Zymergen, Inc. (a) | 8,543 | 14,352 | |
| 4,770,810 | |||
| Construction Materials - 0.1% | |||
| Summit Materials, Inc. (a) | 11,553 | 321,173 | |
| United States Lime & Minerals, Inc. | 205 | 22,450 | |
| 343,623 | |||
| Containers & Packaging - 0.3% | |||
| Greif, Inc.: | |||
| Class A | 2,567 | 155,766 | |
| Class B | 487 | 28,421 | |
| Myers Industries, Inc. | 3,473 | 76,163 | |
| O-I Glass, Inc. (a) | 15,148 | 204,195 | |
| Pactiv Evergreen, Inc. | 4,117 | 40,594 | |
| Ranpak Holdings Corp. (A Shares) (a) | 3,753 | 56,595 | |
| TriMas Corp. | 4,131 | 122,030 | |
| 683,764 | |||
| Metals & Mining - 1.5% | |||
| Allegheny Technologies, Inc. (a) | 12,347 | 335,591 | |
| Arconic Corp. (a) | 10,403 | 261,739 | |
| Carpenter Technology Corp. | 4,632 | 176,850 | |
| Century Aluminum Co. (a) | 4,958 | 83,641 | |
| Coeur d'Alene Mines Corp. (a) | 25,330 | 91,948 | |
| Commercial Metals Co. | 11,583 | 474,903 | |
| Compass Minerals International, Inc. | 3,320 | 196,312 | |
| Constellium NV (a) | 12,038 | 200,914 | |
| Gatos Silver, Inc. (a) | 4,324 | 14,615 | |
| Haynes International, Inc. | 1,207 | 47,170 | |
| Hecla Mining Co. | 51,703 | 269,373 | |
| Kaiser Aluminum Corp. | 1,547 | 149,286 | |
| Materion Corp. | 1,956 | 166,553 | |
| MP Materials Corp. (a) | 7,371 | 280,393 | |
| Novagold Resources, Inc. (a) | 23,183 | 144,198 | |
| Olympic Steel, Inc. | 917 | 31,481 | |
| Perpetua Resources Corp. (a) | 3,810 | 13,449 | |
| PolyMet Mining Corp. (a) | 3,109 | 9,793 | |
| Ryerson Holding Corp. | 1,543 | 56,798 | |
| Schnitzer Steel Industries, Inc. Class A | 2,559 | 116,767 | |
| SunCoke Energy, Inc. | 7,989 | 66,468 | |
| TimkenSteel Corp. (a) | 4,458 | 92,147 | |
| Warrior Metropolitan Coal, Inc. | 4,970 | 169,328 | |
| Worthington Industries, Inc. | 3,191 | 151,796 | |
| 3,601,513 | |||
| Paper & Forest Products - 0.1% | |||
| Clearwater Paper Corp. (a) | 1,659 | 54,929 | |
| Glatfelter Corp. | 4,421 | 48,631 | |
| Neenah, Inc. | 1,673 | 59,224 | |
| Schweitzer-Mauduit International, Inc. | 3,131 | 78,776 | |
| 241,560 | |||
| TOTAL MATERIALS | 9,641,270 | ||
| REAL ESTATE - 7.8% | |||
| Equity Real Estate Investment Trusts (REITs) - 7.2% | |||
| Acadia Realty Trust (SBI) | 8,614 | 180,205 | |
| Agree Realty Corp. | 6,977 | 473,878 | |
| Alexander & Baldwin, Inc. | 7,046 | 149,375 | |
| Alexanders, Inc. | 220 | 54,597 | |
| American Assets Trust, Inc. | 4,987 | 182,524 | |
| Apartment Investment & Management Co. Class A (a) | 14,968 | 94,298 | |
| Apple Hospitality (REIT), Inc. | 20,961 | 370,800 | |
| Armada Hoffler Properties, Inc. | 6,885 | 93,292 | |
| Ashford Hospitality Trust, Inc. (a) | 1,759 | 12,401 | |
| Braemar Hotels & Resorts, Inc. | 6,380 | 38,663 | |
| Brandywine Realty Trust (SBI) | 16,877 | 196,955 | |
| Broadstone Net Lease, Inc. | 15,476 | 320,198 | |
| BRT Apartments Corp. | 1,155 | 25,283 | |
| CareTrust (REIT), Inc. | 9,721 | 157,577 | |
| CatchMark Timber Trust, Inc. | 2,915 | 23,932 | |
| Centerspace | 1,404 | 129,533 | |
| Chatham Lodging Trust (a) | 5,081 | 72,963 | |
| City Office REIT, Inc. | 4,229 | 62,758 | |
| Clipper Realty, Inc. | 1,568 | 14,002 | |
| Community Healthcare Trust, Inc. | 2,577 | 94,885 | |
| Corporate Office Properties Trust (SBI) | 11,146 | 297,487 | |
| CTO Realty Growth, Inc. | 577 | 36,795 | |
| DiamondRock Hospitality Co. (a) | 20,751 | 220,376 | |
| Digitalbridge Group, Inc. (a) | 47,453 | 330,273 | |
| Diversified Healthcare Trust (SBI) | 23,829 | 53,615 | |
| Easterly Government Properties, Inc. | 8,804 | 167,716 | |
| EastGroup Properties, Inc. | 3,963 | 743,063 | |
| Empire State Realty Trust, Inc. | 14,258 | 123,189 | |
| Equity Commonwealth (a) | 10,479 | 274,445 | |
| Essential Properties Realty Trust, Inc. | 12,150 | 291,600 | |
| Farmland Partners, Inc. | 2,959 | 43,556 | |
| Four Corners Property Trust, Inc. | 7,667 | 210,536 | |
| Franklin Street Properties Corp. | 9,975 | 51,471 | |
| Getty Realty Corp. | 4,199 | 112,995 | |
| Gladstone Commercial Corp. | 3,854 | 81,088 | |
| Gladstone Land Corp. | 3,078 | 112,039 | |
| Global Medical REIT, Inc. | 6,190 | 91,364 | |
| Global Net Lease, Inc. | 10,622 | 149,027 | |
| Healthcare Realty Trust, Inc. (b) | 14,507 | 392,850 | |
| Hersha Hospitality Trust (a) | 3,842 | 37,575 | |
| Independence Realty Trust, Inc. | 21,558 | 587,671 | |
| Indus Realty Trust, Inc. | 585 | 41,798 | |
| Industrial Logistics Properties Trust | 6,528 | 105,492 | |
| iStar Financial, Inc. | 6,562 | 110,504 | |
| Kite Realty Group Trust | 21,273 | 474,388 | |
| LTC Properties, Inc. | 3,927 | 129,591 | |
| LXP Industrial Trust (REIT) | 27,060 | 339,603 | |
| National Health Investors, Inc. | 4,324 | 222,816 | |
| National Storage Affiliates Trust | 8,027 | 454,328 | |
| Necessity Retail (REIT), Inc./The | 12,651 | 94,503 | |
| NETSTREIT Corp. | 4,342 | 93,874 | |
| NexPoint Residential Trust, Inc. | 2,154 | 192,051 | |
| Office Properties Income Trust | 5,039 | 108,943 | |
| One Liberty Properties, Inc. | 1,746 | 50,023 | |
| Outfront Media, Inc. | 14,231 | 364,314 | |
| Paramount Group, Inc. | 18,349 | 174,499 | |
| Pebblebrook Hotel Trust | 12,787 | 312,259 | |
| Phillips Edison & Co., Inc. | 11,191 | 378,927 | |
| Physicians Realty Trust | 21,776 | 373,241 | |
| Piedmont Office Realty Trust, Inc. Class A | 12,340 | 198,674 | |
| Plymouth Industrial REIT, Inc. | 3,276 | 79,017 | |
| Postal Realty Trust, Inc. | 2,236 | 37,632 | |
| Potlatch Corp. | 6,478 | 358,816 | |
| Preferred Apartment Communities, Inc. Class A | 5,086 | 126,540 | |
| PS Business Parks, Inc. | 1,979 | 370,469 | |
| Retail Opportunity Investments Corp. | 11,770 | 219,275 | |
| RLJ Lodging Trust | 16,411 | 230,082 | |
| RPT Realty | 8,724 | 115,942 | |
| Ryman Hospitality Properties, Inc. (a) | 5,259 | 491,611 | |
| Sabra Health Care REIT, Inc. | 22,535 | 263,209 | |
| Safehold, Inc. | 2,108 | 90,749 | |
| Saul Centers, Inc. | 1,194 | 61,622 | |
| Seritage Growth Properties (a) | 3,913 | 38,739 | |
| Service Properties Trust | 16,606 | 134,841 | |
| SITE Centers Corp. | 17,163 | 272,892 | |
| Stag Industrial, Inc. | 17,643 | 658,437 | |
| Summit Hotel Properties, Inc. (a) | 10,756 | 106,162 | |
| Sunstone Hotel Investors, Inc. (a) | 21,439 | 262,628 | |
| Tanger Factory Outlet Centers, Inc. | 10,135 | 163,478 | |
| Terreno Realty Corp. | 7,288 | 530,202 | |
| The Macerich Co. (b) | 20,947 | 262,885 | |
| UMH Properties, Inc. | 4,523 | 106,381 | |
| Uniti Group, Inc. | 19,245 | 238,446 | |
| Universal Health Realty Income Trust (SBI) | 1,299 | 65,197 | |
| Urban Edge Properties | 11,484 | 214,636 | |
| Urstadt Biddle Properties, Inc. Class A | 3,170 | 55,000 | |
| Veris Residential, Inc. (a) | 8,771 | 140,424 | |
| Washington REIT (SBI) | 8,306 | 200,092 | |
| Whitestone REIT Class B | 4,865 | 59,110 | |
| Xenia Hotels & Resorts, Inc. (a) | 11,260 | 217,205 | |
| 17,548,397 | |||
| Real Estate Management & Development - 0.6% | |||
| Cushman & Wakefield PLC (a)(b) | 13,562 | 242,760 | |
| Douglas Elliman, Inc. | 7,158 | 43,377 | |
| eXp World Holdings, Inc. (b) | 6,214 | 83,205 | |
| Fathom Holdings, Inc. (a) | 1,028 | 7,628 | |
| Forestar Group, Inc. (a) | 1,803 | 29,407 | |
| FRP Holdings, Inc. (a) | 634 | 35,827 | |
| Kennedy-Wilson Holdings, Inc. | 11,397 | 257,002 | |
| Marcus & Millichap, Inc. | 2,300 | 103,017 | |
| Newmark Group, Inc. | 16,338 | 198,507 | |
| RE/MAX Holdings, Inc. | 2,025 | 47,507 | |
| Realogy Holdings Corp. (a) | 11,267 | 123,486 | |
| Redfin Corp. (a) | 9,748 | 108,690 | |
| Tejon Ranch Co. (a) | 2,003 | 36,675 | |
| The RMR Group, Inc. | 1,545 | 42,148 | |
| The St. Joe Co. | 3,236 | 172,188 | |
| 1,531,424 | |||
| TOTAL REAL ESTATE | 19,079,821 | ||
| UTILITIES - 3.1% | |||
| Electric Utilities - 0.7% | |||
| Allete, Inc. | 5,107 | 303,049 | |
| MGE Energy, Inc. | 3,545 | 276,049 | |
| Otter Tail Corp. | 4,004 | 232,072 | |
| PNM Resources, Inc. | 8,287 | 386,671 | |
| Portland General Electric Co. | 8,757 | 414,469 | |
| Via Renewables, Inc. Class A, | 1,263 | 9,018 | |
| 1,621,328 | |||
| Gas Utilities - 1.2% | |||
| Brookfield Infrastructure Corp. A Shares (b) | 6,171 | 437,647 | |
| Chesapeake Utilities Corp. | 1,663 | 208,158 | |
| New Jersey Resources Corp. | 9,308 | 401,733 | |
| Northwest Natural Holding Co. | 3,003 | 143,633 | |
| ONE Gas, Inc. | 5,117 | 431,721 | |
| South Jersey Industries, Inc. | 9,993 | 341,661 | |
| Southwest Gas Corp. (b) | 6,402 | 564,080 | |
| Spire, Inc. (b) | 4,910 | 357,203 | |
| 2,885,836 | |||
| Independent Power and Renewable Electricity Producers - 0.3% | |||
| Clearway Energy, Inc.: | |||
| Class A | 2,809 | 79,832 | |
| Class C | 8,436 | 257,551 | |
| Ormat Technologies, Inc. (b) | 4,406 | 342,346 | |
| Sunnova Energy International, Inc. (a) | 8,440 | 145,759 | |
| 825,488 | |||
| Multi-Utilities - 0.5% | |||
| Avista Corp. | 6,854 | 278,067 | |
| Black Hills Corp. | 6,203 | 454,308 | |
| NorthWestern Energy Corp. | 5,271 | 298,813 | |
| Unitil Corp. | 1,540 | 78,540 | |
| 1,109,728 | |||
| Water Utilities - 0.4% | |||
| American States Water Co. | 3,555 | 279,636 | |
| Artesian Resources Corp. Class A | 788 | 36,642 | |
| California Water Service Group | 5,112 | 265,159 | |
| Global Water Resources, Inc. | 1,259 | 18,029 | |
| Middlesex Water Co. | 1,693 | 150,592 | |
| Pure Cycle Corp. (a) | 2,079 | 21,726 | |
| SJW Corp. | 2,668 | 157,412 | |
| York Water Co. | 1,385 | 53,572 | |
| 982,768 | |||
| TOTAL UTILITIES | 7,425,148 | ||
| TOTAL COMMON STOCKS | |||
| (Cost $232,506,983) | 238,134,674 | ||
| Principal Amount | Value | ||
| U.S. Treasury Obligations - 0.1% | |||
| U.S. Treasury Bills, yield at date of purchase 1.23% 1/26/23 (d) | |||
| (Cost $198,178) | 200,000 | 197,573 | |
| Shares | Value | ||
| Money Market Funds - 12.1% | |||
| Fidelity Cash Central Fund 0.32% (e) | 4,280,472 | $4,281,328 | |
| Fidelity Securities Lending Cash Central Fund 0.32% (e)(f) | 25,195,904 | 25,198,424 | |
| TOTAL MONEY MARKET FUNDS | |||
| (Cost $29,479,751) | 29,479,752 | ||
| TOTAL INVESTMENT IN SECURITIES - 110.3% | |||
| (Cost $262,184,912) | 267,811,999 | ||
| NET OTHER ASSETS (LIABILITIES) - (10.3)% | (24,985,747) | ||
| NET ASSETS - 100% | $242,826,252 |
| Futures Contracts | |||||
| Number of contracts | Expiration Date | Notional Amount | Value | Unrealized Appreciation/(Depreciation) | |
| Purchased | |||||
| Equity Index Contracts | |||||
| CME E-mini Russell 2000 Index Contracts (United States) | 52 | June 2022 | $4,839,380 | $(274,541) | $(274,541) |
The notional amount of futures purchased as a percentage of Net Assets is 2.0%
Legend
(a) Non-income producing
(b) Security or a portion of the security is on loan at period end.
(c) Level 3 security
(d) Security or a portion of the security was pledged to cover margin requirements for futures contracts. At period end, the value of securities pledged amounted to $197,573.
(e) Affiliated fund that is generally available only to investment companies and other accounts managed by Fidelity Investments. The rate quoted is the annualized seven-day yield of the fund at period end. A complete unaudited listing of the fund's holdings as of its most recent quarter end is available upon request. In addition, each Fidelity Central Fund's financial statements, which are not covered by the Fund's Report of Independent Registered Public Accounting Firm, are available on the SEC's website or upon request.
(f) Investment made with cash collateral received from securities on loan.
Affiliated Central Funds
Fiscal year to date information regarding the Fund's investments in Fidelity Central Funds, including the ownership percentage, is presented below.
| Fund | Value, beginning of period | Purchases | Sales Proceeds | Dividend Income | Realized Gain/Loss | Change in Unrealized appreciation (depreciation) | Value, end of period | % ownership, end of period |
| Fidelity Cash Central Fund 0.32% | $1,056,377 | $98,510,928 | $95,285,977 | $3,450 | $-- | $-- | $4,281,328 | 0.0% |
| Fidelity Securities Lending Cash Central Fund 0.32% | 4,377,433 | 92,333,573 | 71,512,583 | 87,301 | -- | 1 | 25,198,424 | 0.1% |
| Total | $5,433,810 | $190,844,501 | $166,798,560 | $90,751 | $-- | $1 | $29,479,752 |
Amounts in the income column in the above table include any capital gain distributions from underlying funds, which are presented in the corresponding line-item in the Statement of Operations, if applicable. Amount for Fidelity Securities Lending Cash Central Fund represents the income earned on investing cash collateral, less rebates paid to borrowers and any lending agent fees associated with the loan, plus any premium payments received for lending certain types of securities.
Investment Valuation
The following is a summary of the inputs used, as of April 30, 2022, involving the Fund's assets and liabilities carried at fair value. The inputs or methodology used for valuing securities may not be an indication of the risk associated with investing in those securities. For more information on valuation inputs, and their aggregation into the levels used below, please refer to the Investment Valuation section in the accompanying Notes to Financial Statements.
| Valuation Inputs at Reporting Date: | ||||
| Description | Total | Level 1 | Level 2 | Level 3 |
| Investments in Securities: | ||||
| Equities: | ||||
| Communication Services | $6,956,342 | $6,956,342 | $-- | $-- |
| Consumer Discretionary | 24,984,502 | 24,984,502 | -- | -- |
| Consumer Staples | 9,228,391 | 9,228,391 | -- | -- |
| Energy | 17,077,520 | 17,077,520 | -- | -- |
| Financials | 37,958,760 | 37,958,760 | -- | -- |
| Health Care | 36,638,109 | 36,634,099 | -- | 4,010 |
| Industrials | 37,154,588 | 37,154,588 | -- | -- |
| Information Technology | 31,990,223 | 31,990,223 | -- | -- |
| Materials | 9,641,270 | 9,641,270 | -- | -- |
| Real Estate | 19,079,821 | 19,079,821 | -- | -- |
| Utilities | 7,425,148 | 7,425,148 | -- | -- |
| U.S. Government and Government Agency Obligations | 197,573 | -- | 197,573 | -- |
| Money Market Funds | 29,479,752 | 29,479,752 | -- | -- |
| Total Investments in Securities: | $267,811,999 | $267,610,416 | $197,573 | $4,010 |
| Derivative Instruments: | ||||
| Liabilities | ||||
| Futures Contracts | $(274,541) | $(274,541) | $-- | $-- |
| Total Liabilities | $(274,541) | $(274,541) | $-- | $-- |
| Total Derivative Instruments: | $(274,541) | $(274,541) | $-- | $-- |
Value of Derivative Instruments
The following table is a summary of the Fund's value of derivative instruments by primary risk exposure as of April 30, 2022. For additional information on derivative instruments, please refer to the Derivative Instruments section in the accompanying Notes to Financial Statements.
| Primary Risk Exposure / Derivative Type | Value | |
| Asset | Liability | |
| Equity Risk | ||
| Futures Contracts(a) | $0 | $(274,541) |
| Total Equity Risk | 0 | (274,541) |
| Total Value of Derivatives | $0 | $(274,541) |
(a) Reflects gross cumulative appreciation (depreciation) on futures contracts as presented in the Schedule of Investments. In the Statement of Assets and Liabilities, the period end daily variation margin is included in receivable or payable for daily variation margin on futures contracts, and the net cumulative appreciation (depreciation) is included in Total accumulated earnings (loss).
See accompanying notes which are an integral part of the financial statements.
Financial Statements
Statement of Assets and Liabilities
| April 30, 2022 | ||
| Assets | ||
| Investment in securities, at value (including securities loaned of $23,885,951) — See accompanying schedule: Unaffiliated issuers (cost $232,705,161) | $238,332,247 | |
| Fidelity Central Funds (cost $29,479,751) | 29,479,752 | |
| Total Investment in Securities (cost $262,184,912) | $267,811,999 | |
| Segregated cash with brokers for derivative instruments | 98,297 | |
| Cash | 34,301 | |
| Receivable for investments sold | 39,600 | |
| Receivable for fund shares sold | 438,918 | |
| Dividends receivable | 64,577 | |
| Distributions receivable from Fidelity Central Funds | 14,355 | |
| Other receivables | 603 | |
| Total assets | 268,502,650 | |
| Liabilities | ||
| Payable for fund shares redeemed | $314,318 | |
| Payable for daily variation margin on futures contracts | 131,439 | |
| Other payables and accrued expenses | 32,236 | |
| Collateral on securities loaned | 25,198,405 | |
| Total liabilities | 25,676,398 | |
| Net Assets | $242,826,252 | |
| Net Assets consist of: | ||
| Paid in capital | $242,718,601 | |
| Total accumulated earnings (loss) | 107,651 | |
| Net Assets | $242,826,252 | |
| Net Asset Value, offering price and redemption price per share ($242,826,252 ÷ 18,224,936 shares) | $13.32 |
See accompanying notes which are an integral part of the financial statements.
Statement of Operations
| Year ended April 30, 2022 | ||
| Investment Income | ||
| Dividends | $2,310,100 | |
| Non-Cash dividends | 203,081 | |
| Interest | 341 | |
| Income from Fidelity Central Funds (including $87,301 from security lending) | 90,751 | |
| Total income | 2,604,273 | |
| Expenses | ||
| Independent trustees' fees and expenses | $658 | |
| Total expenses before reductions | 658 | |
| Expense reductions | (11) | |
| Total expenses after reductions | 647 | |
| Net investment income (loss) | 2,603,626 | |
| Realized and Unrealized Gain (Loss) | ||
| Net realized gain (loss) on: | ||
| Investment securities: | ||
| Unaffiliated issuers | 5,065,478 | |
| Foreign currency transactions | 32 | |
| Futures contracts | (458,995) | |
| Total net realized gain (loss) | 4,606,515 | |
| Change in net unrealized appreciation (depreciation) on: | ||
| Investment securities: | ||
| Unaffiliated issuers | (51,886,656) | |
| Fidelity Central Funds | 1 | |
| Assets and liabilities in foreign currencies | (2) | |
| Futures contracts | (299,477) | |
| Total change in net unrealized appreciation (depreciation) | (52,186,134) | |
| Net gain (loss) | (47,579,619) | |
| Net increase (decrease) in net assets resulting from operations | $(44,975,993) |
See accompanying notes which are an integral part of the financial statements.
Statement of Changes in Net Assets
| Year ended April 30, 2022 | Year ended April 30, 2021 | |
| Increase (Decrease) in Net Assets | ||
| Operations | ||
| Net investment income (loss) | $2,603,626 | $1,353,946 |
| Net realized gain (loss) | 4,606,515 | (3,427,821) |
| Change in net unrealized appreciation (depreciation) | (52,186,134) | 70,430,102 |
| Net increase (decrease) in net assets resulting from operations | (44,975,993) | 68,356,227 |
| Distributions to shareholders | (6,456,110) | (1,405,453) |
| Share transactions | ||
| Proceeds from sales of shares | 168,655,490 | 98,496,228 |
| Reinvestment of distributions | 4,332,568 | 985,990 |
| Cost of shares redeemed | (56,802,403) | (92,479,443) |
| Net increase (decrease) in net assets resulting from share transactions | 116,185,655 | 7,002,775 |
| Total increase (decrease) in net assets | 64,753,552 | 73,953,549 |
| Net Assets | ||
| Beginning of period | 178,072,700 | 104,119,151 |
| End of period | $242,826,252 | $178,072,700 |
| Other Information | ||
| Shares | ||
| Sold | 10,781,275 | 7,358,387 |
| Issued in reinvestment of distributions | 274,899 | 74,850 |
| Redeemed | (3,645,940) | (7,554,968) |
| Net increase (decrease) | 7,410,234 | (121,731) |
See accompanying notes which are an integral part of the financial statements.
Financial Highlights
Fidelity Flex Small Cap Index Fund
| Years ended April 30, | 2022 | 2021 | 2020 | 2019 | 2018 |
| Selected Per–Share Data | |||||
| Net asset value, beginning of period | $16.47 | $9.52 | $11.70 | $11.43 | $10.31 |
| Income from Investment Operations | |||||
| Net investment income (loss)A,B | .18 | .14 | .15 | .16 | .11 |
| Net realized and unrealized gain (loss) | (2.89) | 6.96 | (1.98) | .35 | 1.10 |
| Total from investment operations | (2.71) | 7.10 | (1.83) | .51 | 1.21 |
| Distributions from net investment income | (.18) | (.15) | (.16) | (.11) | (.06) |
| Distributions from net realized gain | (.26) | – | (.19) | (.12) | (.03) |
| Total distributions | (.44) | (.15) | (.35) | (.24)C | (.09) |
| Net asset value, end of period | $13.32 | $16.47 | $9.52 | $11.70 | $11.43 |
| Total ReturnD,E | (16.88)% | 75.01% | (16.23)% | 4.63% | 11.72% |
| Ratios to Average Net AssetsB,F,G | |||||
| Expenses before reductionsH | -% | -% | -% | -% | -% |
| Expenses net of fee waivers, if anyH | -% | -% | -% | -% | -% |
| Expenses net of all reductionsH | -% | -% | -% | -% | -% |
| Net investment income (loss) | 1.14% | 1.09% | 1.36% | 1.36% | .97% |
| Supplemental Data | |||||
| Net assets, end of period (000 omitted) | $242,826 | $178,073 | $104,119 | $74,937 | $50,926 |
| Portfolio turnover rateI | 18% | 47% | 18% | 23% | 34%J |
A Calculated based on average shares outstanding during the period.
B Net investment income (loss) is affected by the timing of the declaration of dividends by any underlying mutual funds or exchange-traded funds (ETFs). Net investment income (loss) of any such underlying funds is not included in the Fund's net investment income (loss) ratio.
C Total distributions per share do not sum due to rounding.
D Total returns for periods of less than one year are not annualized.
E Total returns would have been lower if certain expenses had not been reduced during the applicable periods shown.
F Fees and expenses of any underlying mutual funds or exchange-traded funds (ETFs) are not included in the Fund's expense ratio. The Fund indirectly bears its proportionate share of these expenses. For additional expense information related to investments in Fidelity Central Funds, please refer to the "Investments in Fidelity Central Funds" note found in the Notes to Financial Statements section of the most recent Annual or Semi-Annual report.
G Expense ratios reflect operating expenses of the class. Expenses before reductions do not reflect amounts reimbursed, waived, or reduced through arrangements with the investment adviser, brokerage services, or other offset arrangements, if applicable, and do not represent the amount paid by the class during periods when reimbursements, waivers or reductions occur.
H Amount represents less than .005%.
I Amount does not include the portfolio activity of any underlying mutual funds or exchange-traded funds (ETFs).
J Portfolio turnover rate excludes securities received or delivered in-kind.
See accompanying notes which are an integral part of the financial statements.
Notes to Financial Statements
For the period ended April 30, 2022
1. Organization.
Fidelity Flex Small Cap Index Fund (the Fund) is a fund of Fidelity Salem Street Trust (the Trust) and is authorized to issue an unlimited number of shares. Share transactions on the Statement of Changes in Net Assets may contain exchanges between affiliated funds. The Trust is registered under the Investment Company Act of 1940, as amended (the 1940 Act), as an open-end management investment company organized as a Massachusetts business trust. The Fund is available only to certain fee-based accounts and advisory programs offered by Fidelity.
2. Investments in Fidelity Central Funds.
Funds may invest in Fidelity Central Funds, which are open-end investment companies generally available only to other investment companies and accounts managed by the investment adviser and its affiliates. The Schedule of Investments lists any Fidelity Central Funds held as an investment as of period end, but does not include the underlying holdings of each Fidelity Central Fund. An investing fund indirectly bears its proportionate share of the expenses of the underlying Fidelity Central Funds.
Based on its investment objective, each Fidelity Central Fund may invest or participate in various investment vehicles or strategies that are similar to those of the investing fund. These strategies are consistent with the investment objectives of the investing fund and may involve certain economic risks which may cause a decline in value of each of the Fidelity Central Funds and thus a decline in the value of the investing fund.
| Fidelity Central Fund | Investment Manager | Investment Objective | Investment Practices | Expense Ratio(a) |
| Fidelity Money Market Central Funds | Fidelity Management & Research Company LLC (FMR) | Each fund seeks to obtain a high level of current income consistent with the preservation of capital and liquidity. | Short-term Investments | Less than .005% |
(a) Expenses expressed as a percentage of average net assets and are as of each underlying Central Fund's most recent annual or semi-annual shareholder report.
A complete unaudited list of holdings for each Fidelity Central Fund is available upon request or at the Securities and Exchange Commission website at www.sec.gov. In addition, the financial statements of the Fidelity Central Funds which contain the significant accounting policies (including investment valuation policies) of those funds, and are not covered by the Report of Independent Registered Public Accounting Firm, are available on the Securities and Exchange Commission website or upon request.
3. Significant Accounting Policies.
The Fund is an investment company and applies the accounting and reporting guidance of the Financial Accounting Standards Board (FASB) Accounting Standards Codification Topic 946 Financial Services - Investment Companies. The financial statements have been prepared in conformity with accounting principles generally accepted in the United States of America (GAAP), which require management to make certain estimates and assumptions at the date of the financial statements. Actual results could differ from those estimates. Subsequent events, if any, through the date that the financial statements were issued have been evaluated in the preparation of the financial statements. The Fund's Schedule of Investments lists any underlying mutual funds or exchange-traded funds (ETFs) but does not include the underlying holdings of these funds. The following summarizes the significant accounting policies of the Fund:
Investment Valuation. Investments are valued as of 4:00 p.m. Eastern time on the last calendar day of the period. The Board of Trustees (the Board) has delegated the day to day responsibility for the valuation of the Fund's investments to the Fair Value Committee (the Committee) established by the Fund's investment adviser. In accordance with valuation policies and procedures approved by the Board, the Fund attempts to obtain prices from one or more third party pricing vendors or brokers to value its investments. When current market prices, quotations or currency exchange rates are not readily available or reliable, investments will be fair valued in good faith by the Committee, in accordance with procedures adopted by the Board. Factors used in determining fair value vary by investment type and may include market or investment specific events, changes in interest rates and credit quality. The frequency with which these procedures are used cannot be predicted and they may be utilized to a significant extent. The Committee oversees the Fund's valuation policies and procedures and reports to the Board on the Committee's activities and fair value determinations. The Board monitors the appropriateness of the procedures used in valuing the Fund's investments and ratifies the fair value determinations of the Committee.
The Fund categorizes the inputs to valuation techniques used to value its investments into a disclosure hierarchy consisting of three levels as shown below:
- Level 1 – unadjusted quoted prices in active markets for identical investments
- Level 2 – other significant observable inputs (including quoted prices for similar investments, interest rates, prepayment speeds, etc.)
- Level 3 – unobservable inputs (including the Fund's own assumptions based on the best information available)
Valuation techniques used to value the Fund's investments by major category are as follows:
Equity securities, including restricted securities, for which market quotations are readily available, are valued at the last reported sale price or official closing price as reported by a third party pricing vendor on the primary market or exchange on which they are traded and are categorized as Level 1 in the hierarchy. In the event there were no sales during the day or closing prices are not available, securities are valued at the last quoted bid price or may be valued using the last available price and are generally categorized as Level 2 in the hierarchy. For foreign equity securities, when market or security specific events arise, comparisons to the valuation of American Depositary Receipts (ADRs), futures contracts, ETFs and certain indexes as well as quoted prices for similar securities may be used and would be categorized as Level 2 in the hierarchy. For equity securities, including restricted securities, where observable inputs are limited, assumptions about market activity and risk are used and these securities may be categorized as Level 3 in the hierarchy.
Debt securities, including restricted securities, are valued based on evaluated prices received from third party pricing vendors or from brokers who make markets in such securities. U.S. government and government agency obligations are valued by pricing vendors who utilize matrix pricing which considers yield or price of bonds of comparable quality, coupon, maturity and type or by broker-supplied prices. When independent prices are unavailable or unreliable, debt securities may be valued utilizing pricing methodologies which consider similar factors that would be used by third party pricing vendors. Debt securities are generally categorized as Level 2 in the hierarchy but may be Level 3 depending on the circumstances.
Futures contracts are valued at the settlement price established each day by the board of trade or exchange on which they are traded and are categorized as Level 1 in the hierarchy. Investments in open-end mutual funds, including the Fidelity Central Funds, are valued at their closing net asset value (NAV) each business day and are categorized as Level 1 in the hierarchy.
Changes in valuation techniques may result in transfers in or out of an assigned level within the disclosure hierarchy. The aggregate value of investments by input level as of April 30, 2022 is included at the end of the Fund's Schedule of Investments.
Foreign Currency. Certain Funds may use foreign currency contracts to facilitate transactions in foreign-denominated securities. Gains and losses from these transactions may arise from changes in the value of the foreign currency or if the counterparties do not perform under the contracts' terms.
Foreign-denominated assets, including investment securities, and liabilities are translated into U.S. dollars at the exchange rates at period end. Purchases and sales of investment securities, income and dividends received, and expenses denominated in foreign currencies are translated into U.S. dollars at the exchange rate in effect on the transaction date.
The effects of exchange rate fluctuations on investments are included with the net realized and unrealized gain (loss) on investment securities. Other foreign currency transactions resulting in realized and unrealized gain (loss) are disclosed separately.
Investment Transactions and Income. For financial reporting purposes, the Fund's investment holdings and NAV include trades executed through the end of the last business day of the period. The NAV per share for processing shareholder transactions is calculated as of the close of business of the New York Stock Exchange (NYSE), normally 4:00 p.m. Eastern time and includes trades executed through the end of the prior business day. Gains and losses on securities sold are determined on the basis of identified cost and include proceeds received from litigation. Commissions paid to certain brokers with whom the investment adviser, or its affiliates, places trades on behalf of a fund include an amount in addition to trade execution, which may be rebated back to a fund. Any such rebates are included in net realized gain (loss) on investments in the Statement of Operations. Dividend income is recorded on the ex-dividend date, except for certain dividends from foreign securities where the ex-dividend date may have passed, which are recorded as soon as the Fund is informed of the ex-dividend date. Non-cash dividends included in dividend income, if any, are recorded at the fair market value of the securities received. Income and capital gain distributions from Fidelity Central Funds, if any, are recorded on the ex-dividend date. Certain distributions received by the Fund represent a return of capital or capital gain. The Fund determines the components of these distributions subsequent to the ex-dividend date, based upon receipt of tax filings or other correspondence relating to the underlying investment. These distributions are recorded as a reduction of cost of investments and/or as a realized gain. Interest income is accrued as earned and includes coupon interest and amortization of premium and accretion of discount on debt securities as applicable. Investment income is recorded net of foreign taxes withheld where recovery of such taxes is uncertain.
Expenses. Expenses directly attributable to a fund are charged to that fund. Expenses attributable to more than one fund are allocated among the respective funds on the basis of relative net assets or other appropriate methods. Expenses included in the accompanying financial statements reflect the expenses of that fund and do not include any expenses associated with any underlying mutual funds or exchange-traded funds. Although not included in a fund's expenses, a fund indirectly bears its proportionate share of these expenses through the net asset value of each underlying mutual fund or exchange-traded fund. Expense estimates are accrued in the period to which they relate and adjustments are made when actual amounts are known.
Income Tax Information and Distributions to Shareholders. Each year, the Fund intends to qualify as a regulated investment company under Subchapter M of the Internal Revenue Code, including distributing substantially all of its taxable income and realized gains. As a result, no provision for U.S. Federal income taxes is required. As of April 30, 2022, the Fund did not have any unrecognized tax benefits in the financial statements; nor is the Fund aware of any tax positions for which it is reasonably possible that the total amounts of unrecognized tax benefits will significantly change in the next twelve months. The Fund files a U.S. federal tax return, in addition to state and local tax returns as required. The Fund's federal income tax returns are subject to examination by the Internal Revenue Service (IRS) for a period of three fiscal years after they are filed. State and local tax returns may be subject to examination for an additional fiscal year depending on the jurisdiction. Foreign taxes are provided for based on the Fund's understanding of the tax rules and rates that exist in the foreign markets in which it invests.
Distributions are declared and recorded on the ex-dividend date. Income and capital gain distributions are determined in accordance with income tax regulations, which may differ from GAAP. In addition, the Fund claimed a portion of the payment made to redeeming shareholders as a distribution for income tax purposes.
Capital accounts within the financial statements are adjusted for permanent book-tax differences. These adjustments have no impact on net assets or the results of operations. Capital accounts are not adjusted for temporary book-tax differences which will reverse in a subsequent period.
Book-tax differences are primarily due to futures contracts, foreign currency transactions, passive foreign investment companies (PFIC), certain deemed distributions, partnerships, capital loss carryforwards, and losses deferred due to wash sales and excise tax regulations.
As of period end, the cost and unrealized appreciation (depreciation) in securities, and derivatives if applicable, for federal income tax purposes were as follows:
| Gross unrealized appreciation | $45,711,424 |
| Gross unrealized depreciation | (44,068,475) |
| Net unrealized appreciation (depreciation) | $1,642,949 |
| Tax Cost | $266,169,050 |
The tax-based components of distributable earnings as of period end were as follows:
| Net unrealized appreciation (depreciation) on securities and other investments | $1,642,949 |
The Fund intends to elect to defer to its next fiscal year $1,535,298 of capital losses recognized during the period November 1, 2021 to April 30, 2022.
The tax character of distributions paid was as follows:
| April 30, 2022 | April 30, 2021 | |
| Ordinary Income | $2,555,469 | $ 1,405,453 |
| Long-term Capital Gains | 3,900,641 | – |
| Total | $6,456,110 | $ 1,405,453 |
4. Derivative Instruments.
Risk Exposures and the Use of Derivative Instruments. The Fund's investment objective allows the Fund to enter into various types of derivative contracts, including futures contracts. Derivatives are investments whose value is primarily derived from underlying assets, indices or reference rates and may be transacted on an exchange or over-the-counter (OTC). Derivatives may involve a future commitment to buy or sell a specified asset based on specified terms, to exchange future cash flows at periodic intervals based on a notional principal amount, or for one party to make one or more payments upon the occurrence of specified events in exchange for periodic payments from the other party.
The Fund used derivatives to increase returns and to manage exposure to certain risks as defined below. The success of any strategy involving derivatives depends on analysis of numerous economic factors, and if the strategies for investment do not work as intended, the Fund may not achieve its objectives.
The Fund's use of derivatives increased or decreased its exposure to the following risk:
| Equity Risk | Equity risk relates to the fluctuations in the value of financial instruments as a result of changes in market prices (other than those arising from interest rate risk or foreign exchange risk), whether caused by factors specific to an individual investment, its issuer, or all factors affecting all instruments traded in a market or market segment. |
The Fund is also exposed to additional risks from investing in derivatives, such as liquidity risk and counterparty credit risk. Liquidity risk is the risk that the Fund will be unable to close out the derivative in the open market in a timely manner. Counterparty credit risk is the risk that the counterparty will not be able to fulfill its obligation to the Fund. Counterparty credit risk related to exchange-traded futures contracts may be mitigated by the protection provided by the exchange on which they trade.
Investing in derivatives may involve greater risks than investing in the underlying assets directly and, to varying degrees, may involve risk of loss in excess of any initial investment and collateral received and amounts recognized in the Statement of Assets and Liabilities. In addition, there may be the risk that the change in value of the derivative contract does not correspond to the change in value of the underlying instrument.
Futures Contracts. A futures contract is an agreement between two parties to buy or sell a specified underlying instrument for a fixed price at a specified future date. The Fund used futures contracts to manage its exposure to the stock market.
Upon entering into a futures contract, a fund is required to deposit either cash or securities (initial margin) with a clearing broker in an amount equal to a certain percentage of the face value of the contract. Futures contracts are marked-to-market daily and subsequent daily payments (variation margin) are made or received by a fund depending on the daily fluctuations in the value of the futures contracts and are recorded as unrealized appreciation or (depreciation). This receivable and/or payable, if any, is included in daily variation margin on futures contracts in the Statement of Assets and Liabilities. Realized gain or (loss) is recorded upon the expiration or closing of a futures contract. The net realized gain (loss) and change in net unrealized appreciation (depreciation) on futures contracts during the period is presented in the Statement of Operations.
Any open futures contracts at period end are presented in the Schedule of Investments under the caption "Futures Contracts". The notional amount at value reflects each contract's exposure to the underlying instrument or index at period end and is representative of volume of activity during the period. Securities deposited to meet initial margin requirements are identified in the Schedule of Investments. Cash deposited to meet initial margin requirements is presented as segregated cash with brokers for derivative instruments in the Statement of Assets and Liabilities.
5. Purchases and Sales of Investments.
Purchases and sales of securities, other than short-term securities and in-kind transactions, as applicable, are noted in the table below.
| Purchases ($) | Sales ($) | |
| Fidelity Flex Small Cap Index Fund | 157,537,130 | 40,753,476 |
6. Fees and Other Transactions with Affiliates.
Management Fee. Fidelity Management & Research Company LLC (the investment adviser) and its affiliates provide the Fund with investment management related services and the Fund does not pay any fees for these services. Under the management contract, the investment adviser or an affiliate pays all other expenses of the Fund, excluding fees and expenses of the independent Trustees, and certain miscellaneous expenses such as proxy and shareholder meeting expenses.
Sub-Adviser. Geode Capital Management, LLC (Geode), serves as sub-adviser for the Fund. Geode provides discretionary investment advisory services to the Fund and is paid by the investment adviser for providing these services.
Interfund Trades. Funds may purchase from or sell securities to other Fidelity Funds under procedures adopted by the Board. The procedures have been designed to ensure these interfund trades are executed in accordance with Rule 17a-7 of the 1940 Act. Any interfund trades are included within the respective purchases and sales amounts shown in the Purchases and Sales of Investments note. During the period there were no interfund trades.
7. Committed Line of Credit.
Certain Funds participate with other funds managed by the investment adviser or an affiliate in a $4.25 billion credit facility (the "line of credit") to be utilized for temporary or emergency purposes to fund shareholder redemptions or for other short-term liquidity purposes. The commitment fees on the pro-rata portion of the line of credit are borne by the investment adviser. During the period, there were no borrowings on this line of credit.
8. Security Lending.
Funds lend portfolio securities through a lending agent from time to time in order to earn additional income. A fund may lend securities to certain qualified borrowers, including NFS. On the settlement date of the loan, a fund receives collateral (in the form of U.S. Treasury obligations, letters of credit and/or cash) against the loaned securities and maintains collateral in an amount not less than 100% of the market value of the loaned securities during the period of the loan. The market value of the loaned securities is determined at the close of business of a fund and any additional required collateral is delivered to a fund on the next business day. The Fund or borrower may terminate the loan at any time, and if the borrower defaults on its obligation to return the securities loaned because of insolvency or other reasons, a fund may apply collateral received from the borrower against the obligation. A fund may experience delays and costs in recovering the securities loaned. Any cash collateral received is invested in the Fidelity Securities Lending Cash Central Fund. Any loaned securities are identified as such in the Schedule of Investments, and the value of loaned securities and cash collateral at period end, as applicable, are presented in the Statement of Assets and Liabilities. Security lending income represents the income earned on investing cash collateral, less rebates paid to borrowers and any lending agent fees associated with the loan, plus any premium payments received for lending certain types of securities. Security lending income is presented in the Statement of Operations as a component of income from Fidelity Central Funds.
| Security Lending Income From Securities Loaned to NFS | Value of Securities Loaned to NFS at Period End | |
| Fidelity Flex Small Cap Index Fund | $4,544 | $– |
9. Expense Reductions.
Through arrangements with the Fund's custodian, credits realized as a result of certain uninvested cash balances were used to reduce the Fund's expenses by $11.
10. Other.
A fund's organizational documents provide former and current trustees and officers with a limited indemnification against liabilities arising in connection with the performance of their duties to the fund. In the normal course of business, a fund may also enter into contracts that provide general indemnifications. A fund's maximum exposure under these arrangements is unknown as this would be dependent on future claims that may be made against a fund. The risk of material loss from such claims is considered remote.
11. Coronavirus (COVID-19) Pandemic.
An outbreak of COVID-19 first detected in China during December 2019 has since spread globally and was declared a pandemic by the World Health Organization during March 2020. Developments that disrupt global economies and financial markets, such as the COVID-19 pandemic, may magnify factors that affect the Fund's performance.
Report of Independent Registered Public Accounting Firm
To the Board of Trustees of Fidelity Salem Street Trust and Shareholders of Fidelity Flex Small Cap Index Fund
Opinion on the Financial Statements and Financial Highlights
We have audited the accompanying statement of assets and liabilities of Fidelity Flex Small Cap Index Fund (the "Fund"), a fund of Fidelity Salem Street Trust, including the schedule of investments, as of April 30, 2022, the related statement of operations for the year then ended, the statement of changes in net assets for each of the two years in the period then ended, the financial highlights for each of the five years in the period then ended, and the related notes. In our opinion, the financial statements and financial highlights present fairly, in all material respects, the financial position of the Fund as of April 30, 2022, and the results of its operations for the year then ended, the changes in its net assets for each of the two years in the period then ended, and the financial highlights for each of the five years in the period then ended in conformity with accounting principles generally accepted in the United States of America.
Basis for Opinion
These financial statements and financial highlights are the responsibility of the Fund's management. Our responsibility is to express an opinion on the Fund's financial statements and financial highlights based on our audits. We are a public accounting firm registered with the Public Company Accounting Oversight Board (United States) (PCAOB) and are required to be independent with respect to the Fund in accordance with the U.S. federal securities laws and the applicable rules and regulations of the Securities and Exchange Commission and the PCAOB.
We conducted our audits in accordance with the standards of the PCAOB. Those standards require that we plan and perform the audit to obtain reasonable assurance about whether the financial statements and financial highlights are free of material misstatement, whether due to error or fraud. The Fund is not required to have, nor were we engaged to perform, an audit of its internal control over financial reporting. As part of our audits we are required to obtain an understanding of internal control over financial reporting but not for the purpose of expressing an opinion on the effectiveness of the Fund’s internal control over financial reporting. Accordingly, we express no such opinion.
Our audits included performing procedures to assess the risks of material misstatement of the financial statements and financial highlights, whether due to error or fraud, and performing procedures that respond to those risks. Such procedures included examining, on a test basis, evidence regarding the amounts and disclosures in the financial statements and financial highlights. Our audits also included evaluating the accounting principles used and significant estimates made by management, as well as evaluating the overall presentation of the financial statements and financial highlights. Our procedures included confirmation of securities owned as of April 30, 2022, by correspondence with the custodian and brokers; when replies were not received from brokers, we performed other auditing procedures. We believe that our audits provide a reasonable basis for our opinion.
/s/ Deloitte & Touche LLP
Boston, Massachusetts
June 14, 2022
We have served as the auditor of one or more of the Fidelity investment companies since 1999.
Trustees and Officers
The Trustees, Members of the Advisory Board (if any), and officers of the trust and fund, as applicable, are listed below. The Board of Trustees governs the fund and is responsible for protecting the interests of shareholders. The Trustees are experienced executives who meet periodically throughout the year to oversee the fund's activities, review contractual arrangements with companies that provide services to the fund, oversee management of the risks associated with such activities and contractual arrangements, and review the fund's performance. Except for Jonathan Chiel, each of the Trustees oversees 300 funds. Mr. Chiel oversees 190 funds.
The Trustees hold office without limit in time except that (a) any Trustee may resign; (b) any Trustee may be removed by written instrument, signed by at least two-thirds of the number of Trustees prior to such removal; (c) any Trustee who requests to be retired or who has become incapacitated by illness or injury may be retired by written instrument signed by a majority of the other Trustees; and (d) any Trustee may be removed at any special meeting of shareholders by a two-thirds vote of the outstanding voting securities of the trust. Each Trustee who is not an interested person (as defined in the 1940 Act) of the trust and the fund is referred to herein as an Independent Trustee. Each Independent Trustee shall retire not later than the last day of the calendar year in which his or her 75th birthday occurs. The Independent Trustees may waive this mandatory retirement age policy with respect to individual Trustees. Officers and Advisory Board Members hold office without limit in time, except that any officer or Advisory Board Member may resign or may be removed by a vote of a majority of the Trustees at any regular meeting or any special meeting of the Trustees. Except as indicated, each individual has held the office shown or other offices in the same company for the past five years.
The fund’s Statement of Additional Information (SAI) includes more information about the Trustees. To request a free copy, call Fidelity at 1-800-544-3455 (for managed account clients) or 1-800-835-5092 (for retirement plan participants).
Experience, Skills, Attributes, and Qualifications of the Trustees. The Governance and Nominating Committee has adopted a statement of policy that describes the experience, qualifications, attributes, and skills that are necessary and desirable for potential Independent Trustee candidates (Statement of Policy). The Board believes that each Trustee satisfied at the time he or she was initially elected or appointed a Trustee, and continues to satisfy, the standards contemplated by the Statement of Policy. The Governance and Nominating Committee also engages professional search firms to help identify potential Independent Trustee candidates who have the experience, qualifications, attributes, and skills consistent with the Statement of Policy. From time to time, additional criteria based on the composition and skills of the current Independent Trustees, as well as experience or skills that may be appropriate in light of future changes to board composition, business conditions, and regulatory or other developments, have also been considered by the professional search firms and the Governance and Nominating Committee. In addition, the Board takes into account the Trustees' commitment and participation in Board and committee meetings, as well as their leadership of standing and ad hoc committees throughout their tenure.
In determining that a particular Trustee was and continues to be qualified to serve as a Trustee, the Board has considered a variety of criteria, none of which, in isolation, was controlling. The Board believes that, collectively, the Trustees have balanced and diverse experience, qualifications, attributes, and skills, which allow the Board to operate effectively in governing the fund and protecting the interests of shareholders. Information about the specific experience, skills, attributes, and qualifications of each Trustee, which in each case led to the Board's conclusion that the Trustee should serve (or continue to serve) as a trustee of the fund, is provided below.
Board Structure and Oversight Function. Abigail P. Johnson is an interested person and currently serves as Chairman. The Trustees have determined that an interested Chairman is appropriate and benefits shareholders because an interested Chairman has a personal and professional stake in the quality and continuity of services provided to the fund. Independent Trustees exercise their informed business judgment to appoint an individual of their choosing to serve as Chairman, regardless of whether the Trustee happens to be independent or a member of management. The Independent Trustees have determined that they can act independently and effectively without having an Independent Trustee serve as Chairman and that a key structural component for assuring that they are in a position to do so is for the Independent Trustees to constitute a substantial majority for the Board. The Independent Trustees also regularly meet in executive session. Michael E. Kenneally serves as Chairman of the Independent Trustees and as such (i) acts as a liaison between the Independent Trustees and management with respect to matters important to the Independent Trustees and (ii) with management prepares agendas for Board meetings.
Fidelity® funds are overseen by different Boards of Trustees. The fund's Board oversees Fidelity's investment-grade bond, money market, asset allocation and certain equity funds, and other Boards oversee Fidelity's high income and other equity funds. The asset allocation funds may invest in Fidelity® funds that are overseen by such other Boards. The use of separate Boards, each with its own committee structure, allows the Trustees of each group of Fidelity® funds to focus on the unique issues of the funds they oversee, including common research, investment, and operational issues. On occasion, the separate Boards establish joint committees to address issues of overlapping consequences for the Fidelity® funds overseen by each Board.
The Trustees operate using a system of committees to facilitate the timely and efficient consideration of all matters of importance to the Trustees, the fund, and fund shareholders and to facilitate compliance with legal and regulatory requirements and oversight of the fund's activities and associated risks. The Board, acting through its committees, has charged FMR and its affiliates with (i) identifying events or circumstances the occurrence of which could have demonstrably adverse effects on the fund's business and/or reputation; (ii) implementing processes and controls to lessen the possibility that such events or circumstances occur or to mitigate the effects of such events or circumstances if they do occur; and (iii) creating and maintaining a system designed to evaluate continuously business and market conditions in order to facilitate the identification and implementation processes described in (i) and (ii) above. Because the day-to-day operations and activities of the fund are carried out by or through FMR, its affiliates, and other service providers, the fund's exposure to risks is mitigated but not eliminated by the processes overseen by the Trustees. While each of the Board's committees has responsibility for overseeing different aspects of the fund's activities, oversight is exercised primarily through the Operations and Audit Committees. In addition, an ad hoc Board committee of Independent Trustees has worked with FMR to enhance the Board's oversight of investment and financial risks, legal and regulatory risks, technology risks, and operational risks, including the development of additional risk reporting to the Board. Appropriate personnel, including but not limited to the fund's Chief Compliance Officer (CCO), FMR's internal auditor, the independent accountants, the fund's Treasurer and portfolio management personnel, make periodic reports to the Board's committees, as appropriate, including an annual review of Fidelity's risk management program for the Fidelity® funds. The responsibilities of each standing committee, including their oversight responsibilities, are described further under "Standing Committees of the Trustees."
Interested Trustees*:
Correspondence intended for a Trustee who is an interested person may be sent to Fidelity Investments, 245 Summer Street, Boston, Massachusetts 02210.
Name, Year of Birth; Principal Occupations and Other Relevant Experience+
Jonathan Chiel (1957)
Year of Election or Appointment: 2016
Trustee
Mr. Chiel also serves as Trustee of other Fidelity® funds. Mr. Chiel is Executive Vice President and General Counsel for FMR LLC (diversified financial services company, 2012-present). Previously, Mr. Chiel served as general counsel (2004-2012) and senior vice president and deputy general counsel (2000-2004) for John Hancock Financial Services; a partner with Choate, Hall & Stewart (1996-2000) (law firm); and an Assistant United States Attorney for the United States Attorney’s Office of the District of Massachusetts (1986-95), including Chief of the Criminal Division (1993-1995). Mr. Chiel is a director on the boards of the Boston Bar Foundation and the Maimonides School.
Abigail P. Johnson (1961)
Year of Election or Appointment: 2009
Trustee
Chairman of the Board of Trustees
Ms. Johnson also serves as Trustee of other Fidelity® funds. Ms. Johnson serves as Chairman (2016-present), Chief Executive Officer (2014-present), and Director (2007-present) of FMR LLC (diversified financial services company), President of Fidelity Financial Services (2012-present) and President of Personal, Workplace and Institutional Services (2005-present). Ms. Johnson is Chairman and Director of Fidelity Management & Research Company LLC (investment adviser firm, 2011-present). Previously, Ms. Johnson served as Chairman and Director of FMR Co., Inc. (investment adviser firm, 2011-2019), Vice Chairman (2007-2016) and President (2013-2016) of FMR LLC, President and a Director of Fidelity Management & Research Company (2001-2005), a Trustee of other investment companies advised by Fidelity Management & Research Company, Fidelity Investments Money Management, Inc. (investment adviser firm), and FMR Co., Inc. (2001-2005), Senior Vice President of the Fidelity® funds (2001-2005), and managed a number of Fidelity® funds. Ms. Abigail P. Johnson and Mr. Arthur E. Johnson are not related.
Jennifer Toolin McAuliffe (1959)
Year of Election or Appointment: 2016
Trustee
Ms. McAuliffe also serves as Trustee of other Fidelity® funds and as Trustee of Fidelity Charitable (2020-present). Previously, Ms. McAuliffe served as Co-Head of Fixed Income of Fidelity Investments Limited (now known as FIL Limited (FIL)) (diversified financial services company), Director of Research for FIL’s credit and quantitative teams in London, Hong Kong and Tokyo and Director of Research for taxable and municipal bonds at Fidelity Investments Money Management, Inc. Ms. McAuliffe previously served as a member of the Advisory Board of certain Fidelity® funds (2016). Ms. McAuliffe was previously a lawyer at Ropes & Gray LLP and currently serves as director or trustee of several not-for-profit entities.
* Determined to be an “Interested Trustee” by virtue of, among other things, his or her affiliation with the trust or various entities under common control with FMR.
+ The information includes the Trustee's principal occupation during the last five years and other information relating to the experience, attributes, and skills relevant to the Trustee's qualifications to serve as a Trustee, which led to the conclusion that the Trustee should serve as a Trustee for the fund.
Independent Trustees:
Correspondence intended for an Independent Trustee may be sent to Fidelity Investments, P.O. Box 55235, Boston, Massachusetts 02205-5235.
Name, Year of Birth; Principal Occupations and Other Relevant Experience+
Elizabeth S. Acton (1951)
Year of Election or Appointment: 2013
Trustee
Ms. Acton also serves as Trustee of other Fidelity® funds. Prior to her retirement, Ms. Acton served as Executive Vice President, Finance (2011-2012), Executive Vice President, Chief Financial Officer (2002-2011) and Treasurer (2004-2005) of Comerica Incorporated (financial services). Prior to joining Comerica, Ms. Acton held a variety of positions at Ford Motor Company (1983-2002), including Vice President and Treasurer (2000-2002) and Executive Vice President and Chief Financial Officer of Ford Motor Credit Company (1998-2000). Ms. Acton currently serves as a member of the Board and Audit and Finance Committees of Beazer Homes USA, Inc. (homebuilding, 2012-present). Ms. Acton previously served as a member of the Advisory Board of certain Fidelity® funds (2013-2016).
Ann E. Dunwoody (1953)
Year of Election or Appointment: 2018
Trustee
General Dunwoody also serves as Trustee of other Fidelity® funds. General Dunwoody (United States Army, Retired) was the first woman in U.S. military history to achieve the rank of four-star general and prior to her retirement in 2012 held a variety of positions within the U.S. Army, including Commanding General, U.S. Army Material Command (2008-2012). General Dunwoody currently serves as President of First to Four LLC (leadership and mentoring services, 2012-present), a member of the Board and Nomination and Corporate Governance Committees of Kforce Inc. (professional staffing services, 2016-present) and a member of the Board of Automattic Inc. (software engineering, 2018-present). Previously, General Dunwoody served as a member of the Advisory Board and Nominating and Corporate Governance Committee of L3 Technologies, Inc. (communication, electronic, sensor and aerospace systems, 2013-2019) and a member of the Board and Audit and Sustainability and Corporate Responsibility Committees of Republic Services, Inc. (waste collection, disposal and recycling, 2013-2016). Ms. Dunwoody also serves on several boards for non-profit organizations, including as a member of the Board, Chair of the Nomination and Governance Committee and a member of the Audit Committee of Logistics Management Institute (consulting non-profit, 2012-present), a member of the Council of Trustees for the Association of the United States Army (advocacy non-profit, 2013-present), a member of the Board of Florida Institute of Technology (2015-present) and a member of the Board of ThanksUSA (military family education non-profit, 2014-present). General Dunwoody previously served as a member of the Advisory Board of certain Fidelity® funds (2018).
John Engler (1948)
Year of Election or Appointment: 2014
Trustee
Mr. Engler also serves as Trustee of other Fidelity® funds. Previously, Mr. Engler served as Governor of Michigan (1991-2003), President of the Business Roundtable (2011-2017) and interim President of Michigan State University (2018-2019). Mr. Engler currently serves as a member of the Board of Stride, Inc. (formerly K12 Inc.) (technology-based education company, 2012-present). Previously, Mr. Engler served as a member of the Board of Universal Forest Products (manufacturer and distributor of wood and wood-alternative products, 2003-2019) and Trustee of The Munder Funds (2003-2014). Mr. Engler previously served as a member of the Advisory Board of certain Fidelity® funds (2014-2016).
Robert F. Gartland (1951)
Year of Election or Appointment: 2010
Trustee
Mr. Gartland also serves as Trustee of other Fidelity® funds. Prior to his retirement, Mr. Gartland held a variety of positions at Morgan Stanley (financial services, 1979-2007), including Managing Director (1987-2007) and Chase Manhattan Bank (1975-1978). Mr. Gartland previously served as Chairman and an investor in Gartland & Mellina Group Corp. (consulting, 2009-2019), as a member of the Board of National Securities Clearing Corporation (1993-1996) and as Chairman of TradeWeb (2003-2004).
Arthur E. Johnson (1947)
Year of Election or Appointment: 2008
Trustee
Mr. Johnson also serves as Trustee of other Fidelity® funds. Prior to his retirement, Mr. Johnson served as Senior Vice President of Corporate Strategic Development of Lockheed Martin Corporation (defense contractor, 1999-2009). Mr. Johnson currently serves as a member of the Board of Booz Allen Hamilton (management consulting, 2011-present). Mr. Johnson previously served as a member of the Board of Eaton Corporation plc (diversified power management, 2009-2019) and a member of the Board of AGL Resources, Inc. (holding company, 2002-2016). Mr. Johnson previously served as Chairman (2018-2021) and Vice Chairman (2015-2018) of the Independent Trustees of certain Fidelity® funds. Mr. Arthur E. Johnson is not related to Ms. Abigail P. Johnson.
Michael E. Kenneally (1954)
Year of Election or Appointment: 2009
Trustee
Chairman of the Independent Trustees
Mr. Kenneally also serves as Trustee of other Fidelity® funds and was Vice Chairman (2018-2021) of the Independent Trustees of certain Fidelity® funds. Prior to retirement in 2005, he was Chairman and Global Chief Executive Officer of Credit Suisse Asset Management, the worldwide fund management and institutional investment business of Credit Suisse Group. Previously, Mr. Kenneally was an Executive Vice President and the Chief Investment Officer for Bank of America. In this role, he was responsible for the investment management, strategy and products delivered to the bank’s institutional, high-net-worth and retail clients. Earlier, Mr. Kenneally directed the organization’s equity and quantitative research groups. He began his career as a research analyst and then spent more than a dozen years as a portfolio manager for endowments, pension plans and mutual funds. He earned the Chartered Financial Analyst (CFA) designation in 1991.
Marie L. Knowles (1946)
Year of Election or Appointment: 2001
Trustee
Ms. Knowles also serves as Trustee of other Fidelity® funds. Prior to her retirement, Ms. Knowles held several positions at Atlantic Richfield Company (diversified energy), including Executive Vice President and Chief Financial Officer (1996-2000), Senior Vice President (1993-1996) and President of ARCO Transportation Company (pipeline and tanker operations, 1993-1996). Ms. Knowles currently serves as a member of the Board of the Santa Catalina Island Company (real estate, 2009-present), a member of the Investment Company Institute Board of Governors and a member of the Governing Council of the Independent Directors Council (2014-present). Ms. Knowles also serves as a member of the Advisory Board for the School of Engineering of the University of Southern California. Ms. Knowles previously served as a member of the Board of McKesson Corporation (healthcare service, 2002-2021). In addition, Ms. Knowles previously served as Chairman (2015-2018) and Vice Chairman (2012-2015) of the Independent Trustees of certain Fidelity® funds.
Mark A. Murray (1954)
Year of Election or Appointment: 2016
Trustee
Mr. Murray also serves as Trustee of other Fidelity® funds. Previously, Mr. Murray served as Co-Chief Executive Officer (2013-2016), President (2006-2013) and Vice Chairman (2013-2020) of Meijer, Inc. Mr. Murray serves as a member of the Board (2009-present) and Public Policy and Responsibility Committee (2009-present) and Chair of the Nuclear Review Committee (2019-present) of DTE Energy Company (diversified energy company). Mr. Murray previously served as a member of the Board of Spectrum Health (not-for-profit health system, 2015-2019) and as a member of the Board and Audit Committee and Chairman of the Nominating and Corporate Governance Committee of Universal Forest Products, Inc. (manufacturer and distributor of wood and wood-alternative products, 2004-2016). Mr. Murray also serves as a member of the Board of many community and professional organizations. Mr. Murray previously served as a member of the Advisory Board of certain Fidelity® funds (2016).
+ The information includes the Trustee's principal occupation during the last five years and other information relating to the experience, attributes, and skills relevant to the Trustee's qualifications to serve as a Trustee, which led to the conclusion that the Trustee should serve as a Trustee for the fund.
Advisory Board Members and Officers:
Correspondence intended for an officer may be sent to Fidelity Investments, 245 Summer Street, Boston, Massachusetts 02210. Officers appear below in alphabetical order.
Name, Year of Birth; Principal Occupation
Robert W. Helm (1957)
Year of Election or Appointment: 2021
Member of the Advisory Board
Mr. Helm also serves as a Member of the Advisory Board of other Fidelity® funds. Mr. Helm was formerly Deputy Chairman (2003-2020), partner (1991-2020) and an associate (1984-1991) of Dechert LLP (formerly Dechert Price & Rhoads). Mr. Helm currently serves on boards and committees of several not-for-profit organizations.
Craig S. Brown (1977)
Year of Election or Appointment: 2019
Assistant Treasurer
Mr. Brown also serves as an officer of other funds. Mr. Brown serves as Assistant Treasurer of FIMM, LLC (2021-present) and is an employee of Fidelity Investments (2013-present).
John J. Burke III (1964)
Year of Election or Appointment: 2018
Chief Financial Officer
Mr. Burke also serves as Chief Financial Officer of other funds. Mr. Burke serves as Head of Investment Operations for Fidelity Fund and Investment Operations (2018-present) and is an employee of Fidelity Investments (1998-present). Previously Mr. Burke served as head of Asset Management Investment Operations (2012-2018).
David J. Carter (1973)
Year of Election or Appointment: 2020
Assistant Secretary
Mr. Carter also serves as Assistant Secretary of other funds. Mr. Carter serves as Senior Vice President, Deputy General Counsel (2022-present) and is an employee of Fidelity Investments (2005-present).
Jonathan Davis (1968)
Year of Election or Appointment: 2010
Assistant Treasurer
Mr. Davis also serves as an officer of other funds. Mr. Davis serves as Assistant Treasurer of FIMM, LLC (2021-present), FMR Capital, Inc. (2017-present), FD Funds GP LLC (2021-present), FD Funds Holding LLC (2021-present), and FD Funds Management LLC (2021-present); and is an employee of Fidelity Investments. Previously, Mr. Davis served as Vice President and Associate General Counsel of FMR LLC (diversified financial services company, 2003-2010).
Laura M. Del Prato (1964)
Year of Election or Appointment: 2018
President and Treasurer
Ms. Del Prato also serves as an officer of other funds. Ms. Del Prato serves as Assistant Treasurer of FIMM, LLC (2021-present) and is an employee of Fidelity Investments (2017-present). Previously, Ms. Del Prato served as President and Treasurer of The North Carolina Capital Management Trust: Cash Portfolio and Term Portfolio (2018-2020). Prior to joining Fidelity Investments, Ms. Del Prato served as a Managing Director and Treasurer of the JPMorgan Mutual Funds (2014-2017). Prior to JPMorgan, Ms. Del Prato served as a partner at Cohen Fund Audit Services (accounting firm, 2012-2013) and KPMG LLP (accounting firm, 2004-2012).
Colm A. Hogan (1973)
Year of Election or Appointment: 2016
Assistant Treasurer
Mr. Hogan also serves as an officer of other funds. Mr. Hogan serves as Assistant Treasurer of FIMM, LLC (2021-present) and FMR Capital, Inc. (2017-present) and is an employee of Fidelity Investments (2005-present). Previously, Mr. Hogan served as Deputy Treasurer of certain Fidelity® funds (2016-2020) and Assistant Treasurer of certain Fidelity® funds (2016-2018).
Cynthia Lo Bessette (1969)
Year of Election or Appointment: 2019
Secretary and Chief Legal Officer (CLO)
Ms. Lo Bessette also serves as an officer of other funds. Ms. Lo Bessette serves as CLO, Secretary, and Senior Vice President of Fidelity Management & Research Company LLC (investment adviser firm, 2019-present); CLO of Fidelity Management & Research (Hong Kong) Limited, FMR Investment Management (UK) Limited, and Fidelity Management & Research (Japan) Limited (investment adviser firms, 2019-present); Secretary of FD Funds GP LLC (2021-present), FD Funds Holding LLC (2021-present), and FD Funds Management LLC (2021-present); and Assistant Secretary of FIMM, LLC (2019-present). She is a Senior Vice President and Deputy General Counsel of FMR LLC (diversified financial services company, 2019-present), and is an employee of Fidelity Investments. Previously, Ms. Lo Bessette served as CLO, Secretary, and Senior Vice President of FMR Co., Inc. (investment adviser firm, 2019); Secretary of Fidelity SelectCo, LLC and Fidelity Investments Money Management, Inc. (investment adviser firms, 2019). Prior to joining Fidelity Investments, Ms. Lo Bessette was Executive Vice President, General Counsel (2016-2019) and Senior Vice President, Deputy General Counsel (2015-2016) of OppenheimerFunds (investment management company) and Deputy Chief Legal Officer (2013-2015) of Jennison Associates LLC (investment adviser firm).
Chris Maher (1972)
Year of Election or Appointment: 2013
Assistant Treasurer
Mr. Maher also serves as an officer of other funds. Mr. Maher serves as Assistant Treasurer of FIMM, LLC (2021-present) and FMR Capital, Inc. (2017-present), and is an employee of Fidelity Investments (2008-present). Previously, Mr. Maher served as Assistant Treasurer of certain funds (2013-2020); Vice President of Asset Management Compliance (2013), Vice President of the Program Management Group of FMR (investment adviser firm, 2010-2013), and Vice President of Valuation Oversight (2008-2010).
Jamie Pagliocco (1964)
Year of Election or Appointment: 2020
Vice President
Mr. Pagliocco also serves as Vice President of other funds. Mr. Pagliocco serves as President of Fixed Income (2020-present), and is an employee of Fidelity Investments (2001-present). Previously, Mr. Pagliocco served as Co-Chief Investment Officer – Bond (2017-2020), Global Head of Bond Trading (2016-2019), and as a portfolio manager.
Kenneth B. Robins (1969)
Year of Election or Appointment: 2020
Chief Compliance Officer
Mr. Robins also serves as an officer of other funds. Mr. Robins serves as Compliance Officer of Fidelity Management & Research Company LLC (investment adviser firm, 2016-present) and is an employee of Fidelity Investments (2004-present). Previously, Mr. Robins served as Compliance Officer of FMR Co., Inc. (investment adviser firm, 2016-2019), as Executive Vice President of Fidelity Investments Money Management, Inc. (investment adviser firm, 2013-2016) and served in other fund officer roles.
Brett Segaloff (1972)
Year of Election or Appointment: 2021
Anti-Money Laundering (AML) Officer
Mr. Segaloff also serves as an AML Officer of other funds and other related entities. He is Director, Anti-Money Laundering (2007-present) of FMR LLC (diversified financial services company) and is an employee of Fidelity Investments (1996-present).
Stacie M. Smith (1974)
Year of Election or Appointment: 2013
Assistant Treasurer
Ms. Smith also serves as an officer of other funds. Ms. Smith serves as Assistant Treasurer of FIMM, LLC (2021-present) and FMR Capital, Inc. (2017-present), is an employee of Fidelity Investments (2009-present), and has served in other fund officer roles. Prior to joining Fidelity Investments, Ms. Smith served as Senior Audit Manager of Ernst & Young LLP (accounting firm, 1996-2009). Previously, Ms. Smith served as Assistant Treasurer (2013-2019) and Deputy Treasurer (2013-2016) of certain Fidelity® funds.
Jim Wegmann (1979)
Year of Election or Appointment: 2021
Deputy Treasurer
Mr. Wegmann also serves as an officer of other funds. Mr. Wegmann serves as Assistant Treasurer of FIMM, LLC (2021-present) and is an employee of Fidelity Investments (2011-present). Previously, Mr. Wegmann served as Assistant Treasurer of certain Fidelity® funds (2019-2021).
Shareholder Expense Example
As a shareholder, you incur two types of costs: (1) transaction costs, which may include sales charges (loads) on purchase payments or redemption proceeds, as applicable and (2) ongoing costs, which generally include management fees, distribution and/or service (12b-1) fees and other Fund expenses. This Example is intended to help you understand your ongoing costs (in dollars) of investing in a fund and to compare these costs with the ongoing costs of investing in other mutual funds.
The Example is based on an investment of $1,000 invested at the beginning of the period and held for the entire period (November 1, 2021 to April 30, 2022).
Actual Expenses
The first line of the accompanying table provides information about actual account values and actual expenses. You may use the information in this line, together with the amount you invested, to estimate the expenses that you paid over the period. Simply divide your account value by $1,000.00 (for example, an $8,600 account value divided by $1,000.00 = 8.6), then multiply the result by the number in the first line for a class/Fund under the heading entitled "Expenses Paid During Period" to estimate the expenses you paid on your account during this period. If any fund is a shareholder of any underlying mutual funds or exchange-traded funds (ETFs) (the Underlying Funds), such fund indirectly bears its proportional share of the expenses of the Underlying Funds in addition to the direct expenses incurred presented in the table. These fees and expenses are not included in the annualized expense ratio used to calculate the expense estimate in the table below.
Hypothetical Example for Comparison Purposes
The second line of the accompanying table provides information about hypothetical account values and hypothetical expenses based on the actual expense ratio and an assumed rate of return of 5% per year before expenses, which is not the actual return. The hypothetical account values and expenses may not be used to estimate the actual ending account balance or expenses you paid for the period. You may use this information to compare the ongoing costs of investing in the Fund and other funds. To do so, compare this 5% hypothetical example with the 5% hypothetical examples that appear in the shareholder reports of the other funds. If any fund is a shareholder of any Underlying Funds, such fund indirectly bears its proportional share of the expenses of the Underlying Funds in addition to the direct expenses as presented in the table. These fees and expenses are not included in the annualized expense ratio used to calculate the expense estimate in the table below.
Please note that the expenses shown in the table are meant to highlight your ongoing costs only and do not reflect any transaction costs. Therefore, the second line of the table is useful in comparing ongoing costs only, and will not help you determine the relative total costs of owning different funds. In addition, if these transactional costs were included, your costs would have been higher.
| Annualized Expense Ratio-A | Beginning Account Value November 1, 2021 | Ending Account Value April 30, 2022 | Expenses Paid During Period-B November 1, 2021 to April 30, 2022 |
|
| Fidelity Flex Small Cap Index Fund | - %-C | |||
| Actual | $1,000.00 | $816.40 | $--D | |
| Hypothetical-E | $1,000.00 | $1,024.79 | $--D |
A Annualized expense ratio reflects expenses net of applicable fee waivers.
B Expenses are equal to the annualized expense ratio, multiplied by the average account value over the period, multiplied by 181/ 365 (to reflect the one-half year period). The fees and expenses of any Underlying Funds are not included in each annualized expense ratio.
C Amount represents less than .005%.
D Amount represents less than $.005.
E 5% return per year before expenses
Distributions (Unaudited)
The dividend and capital gains distributions for the fund(s) are available on Fidelity.com or Institutional.Fidelity.com.
The fund hereby designates as a capital gain dividend with respect to the taxable year ended April 30, 2022, $3,900,642, or, if subsequently determined to be different, the net capital gain of such year.
The fund designates 97% and 64% of the dividends distributed in June and December, respectively during the fiscal year as qualifying for the dividends–received deduction for corporate shareholders.
The fund designates 99% and 77% of the dividends distributed in June and December, respectively during the fiscal year as amounts which may be taken into account as a dividend for the purposes of the maximum rate under section 1(h)(11) of the Internal Revenue Code.
The fund designates 2% and 18% of the dividends distributed in June and December, respectively during the fiscal year as a section 199A dividend.
The fund will notify shareholders in January 2023 of amounts for use in preparing 2022 income tax returns.
Liquidity Risk Management Program
The Securities and Exchange Commission adopted Rule 22e-4 under the Investment Company Act of 1940 (the Liquidity Rule) to promote effective liquidity risk management throughout the open-end investment company industry, thereby reducing the risk that funds will be unable to meet their redemption obligations and mitigating dilution of the interests of fund shareholders.
The Fund has adopted and implemented a liquidity risk management program pursuant to the Liquidity Rule (the Program) effective December 1, 2018. The Program is reasonably designed to assess and manage the Fund’s liquidity risk and to comply with the requirements of the Liquidity Rule. The Fund’s Board of Trustees (the Board) has designated the Fund’s investment adviser as administrator of the Program. The Fidelity advisers have established a Liquidity Risk Management Committee (the LRM Committee) to manage the Program for each of the Fidelity Funds. The LRM Committee monitors the adequacy and effectiveness of implementation of the Program and on a periodic basis assesses each Fund’s liquidity risk based on a variety of factors including (1) the Fund’s investment strategy, (2) portfolio liquidity and cash flow projections during normal and reasonably foreseeable stressed conditions, (3) shareholder redemptions, (4) borrowings and other funding sources and (5) in the case of exchange-traded funds, certain additional factors including the effect of the Fund’s prices and spreads, market participants, and basket compositions on the overall liquidity of the Fund’s portfolio, as applicable.
In accordance with the Program, each of the Fund’s portfolio investments is classified into one of four liquidity categories described below based on a determination of a reasonable expectation for how long it would take to convert the investment to cash (or sell or dispose of the investment) without significantly changing its market value.
- Highly liquid investments – cash or convertible to cash within three business days or less
- Moderately liquid investments – convertible to cash in three to seven calendar days
- Less liquid investments – can be sold or disposed of, but not settled, within seven calendar days
- Illiquid investments – cannot be sold or disposed of within seven calendar days
Liquidity classification determinations take into account a variety of factors including various market, trading and investment-specific considerations, as well as market depth, and generally utilize analysis from a third-party liquidity metrics service.
The Liquidity Rule places a 15% limit on a fund’s illiquid investments and requires funds that do not primarily hold assets that are highly liquid investments to determine and maintain a minimum percentage of the fund’s net assets to be invested in highly liquid investments (highly liquid investment minimum or HLIM). The Program includes provisions reasonably designed to comply with the 15% limit on illiquid investments and for determining, periodically reviewing and complying with the HLIM requirement as applicable.
At a recent meeting of the Fund’s Board of Trustees, the LRM Committee provided a written report to the Board pertaining to the operation, adequacy, and effectiveness of implementation of the Program for the annual period from December 1, 2020 through November 30, 2021. The report concluded that the Program has been implemented and is operating effectively and is reasonably designed to assess and manage the Fund’s liquidity risk.
ZAP-ANN-0622
1.9881631.105
Fidelity® Large Cap Value Index Fund
April 30, 2022
Contents
To view a fund's proxy voting guidelines and proxy voting record for the 12-month period ended June 30, visit http://www.fidelity.com/proxyvotingresults or visit the Securities and Exchange Commission's (SEC) web site at http://www.sec.gov.
You may also call 1-800-544-8544 to request a free copy of the proxy voting guidelines.
The fund is not in any way connected to or sponsored, endorsed, sold or promoted by the London Stock Exchange Group plc and its group undertakings (collectively, the “LSE Group”). The LSE Group does not accept any liability whatsoever to any person arising out of the use of the fund or the underlying data.
Standard & Poor's, S&P and S&P 500 are registered service marks of The McGraw-Hill Companies, Inc. and have been licensed for use by Fidelity Distributors Corporation.
Other third-party marks appearing herein are the property of their respective owners.
All other marks appearing herein are registered or unregistered trademarks or service marks of FMR LLC or an affiliated company. © 2022 FMR LLC. All rights reserved.
This report and the financial statements contained herein are submitted for the general information of the shareholders of the Fund. This report is not authorized for distribution to prospective investors in the Fund unless preceded or accompanied by an effective prospectus.
A fund files its complete schedule of portfolio holdings with the SEC for the first and third quarters of each fiscal year on Form N-PORT. Forms N-PORT are available on the SEC’s web site at http://www.sec.gov. A fund's Forms N-PORT may be reviewed and copied at the SEC’s Public Reference Room in Washington, DC. Information regarding the operation of the SEC's Public Reference Room may be obtained by calling 1-800-SEC-0330.
For a complete list of a fund's portfolio holdings, view the most recent holdings listing, semiannual report, or annual report on Fidelity's web site at http://www.fidelity.com, http://www.institutional.fidelity.com, or http://www.401k.com, as applicable.
NOT FDIC INSURED •MAY LOSE VALUE •NO BANK GUARANTEE
Neither the Fund nor Fidelity Distributors Corporation is a bank.
Note to Shareholders:
Early in 2020, the outbreak and spread of COVID-19 emerged as a public health emergency that had a major influence on financial markets, primarily based on its impact on the global economy and corporate earnings. On March 11, 2020, the World Health Organization declared the COVID-19 outbreak a pandemic, citing sustained risk of further global spread. The pandemic prompted a number of measures to limit the spread of COVID-19, including travel and border restrictions, quarantines, and restrictions on large gatherings. In turn, these resulted in lower consumer activity, diminished demand for a wide range of products and services, disruption in manufacturing and supply chains, and – given the wide variability in outcomes regarding the outbreak – significant market uncertainty and volatility. To help stem the turmoil, the U.S. government took unprecedented action – in concert with the U.S. Federal Reserve and central banks around the world – to help support consumers, businesses, and the broader economy, and to limit disruption to the financial system.
In general, the overall impact of the pandemic lessened in 2021, amid a resilient economy and widespread distribution of three COVID-19 vaccines granted emergency use authorization from the U.S. Food and Drug Administration (FDA) early in the year. Still, the situation remains dynamic, and the extent and duration of its influence on financial markets and the economy is highly uncertain, due in part to a recent spike in cases based on highly contagious variants of the coronavirus.
Extreme events such as the COVID-19 crisis are exogenous shocks that can have significant adverse effects on mutual funds and their investments. Although multiple asset classes may be affected by market disruption, the duration and impact may not be the same for all types of assets. Fidelity is committed to helping you stay informed amid news about COVID-19 and during increased market volatility, and we continue to take extra steps to be responsive to customer needs. We encourage you to visit us online, where we offer ongoing updates, commentary, and analysis on the markets and our funds.
Performance: The Bottom Line
Average annual total return reflects the change in the value of an investment, assuming reinvestment of distributions from dividend income and capital gains (the profits earned upon the sale of securities that have grown in value, if any) and assuming a constant rate of performance each year. The hypothetical investment and the average annual total returns do not reflect the deduction of taxes that a shareholder would pay on fund distributions or the redemption of fund shares. During periods of reimbursement by Fidelity, a fund’s total return will be greater than it would be had the reimbursement not occurred. How a fund did yesterday is no guarantee of how it will do tomorrow.
Average Annual Total Returns
| For the periods ended April 30, 2022 | Past 1 year | Past 5 years | Life of fundA |
| Fidelity® Large Cap Value Index Fund | 1.27% | 9.07% | 9.97% |
A From June 7, 2016
$10,000 Over Life of Fund
Let's say hypothetically that $10,000 was invested in Fidelity® Large Cap Value Index Fund on June 7, 2016, when the fund started.
The chart shows how the value of your investment would have changed, and also shows how the Russell 1000® Value Index performed over the same period.

| Period Ending Values | ||
|
| $17,514 | Fidelity® Large Cap Value Index Fund |
|
| $17,516 | Russell 1000® Value Index |
Management's Discussion of Fund Performance
Market Recap: The S&P 500® index gained 0.21% for the 12 months ending April 30, 2022. After posting a strong result in 2021, large-cap stocks retreated to begin the new year amid several notable headwinds that stoked volatility, uncertainty and investor anxiety. Chief among these was the U.S. Federal Reserve’s accelerated plan to hike interest rates and aggressively wind down its balance sheet in an attempt to rein in historically high inflation. In addition, geopolitical unrest rose as Russia invaded Ukraine in late February and escalated its attack through period end. Other factors influencing stocks included surging commodity prices, rising bond yields, supply constraint and disruption, and the potential for variants of the coronavirus to upend the economy. Against this backdrop, the S&P 500® index returned -5.17% in January and -2.99% in February, falling on mixed corporate earnings, particularly among some highflying tech firms. Volatility eased in March and the index gained 3.71% for the month. April saw a sharp reversal, with the index returning -8.72% amid clearer signals of the Fed’s intension to tighten monetary policy and angst about the economic toll of “zero-COVID” lockdowns in China. It was the largest monthly decline for the S&P 500® since March 2020. For the full 12 months, the growth-oriented communication services (-22%) and consumer discretionary (-11%) sectors lagged most. In contrast, energy (+61%) rode a surge in commodity prices and led the market by a wide margin, followed by the defensive consumer staples (+17%) sector. Comments from the Geode Capital Management, LLC, passive equity index team: For the fiscal year ending April 30, 2022, the fund gained 1.27%, roughly in line with the 1.32% advance of the benchmark Russell 1000® Value Index. By sector, energy gained 62% and contributed most. Health care stocks also helped, gaining 10%. The consumer staples sector rose roughly 15%. Other notable contributors included the real estate (+12%), utilities (+10%), and materials (+8%) sectors. Conversely, communication services returned -21% and detracted most. Information technology (-13%), especially in the software & services industry (-18%), and industrials (-9%) also hurt. Other notable detractors included the financials (-3%) and consumer discretionary (-11%) sectors. Turning to individual stocks, the top contributor was Exxon Mobil (+57%), from the energy sector. Also in energy, Chevron (+60%) was helpful, while UnitedHealth Group (+29%) from the health care equipment & services category also contributed. Berkshire Hathaway, within the diversified financials industry, rose approximately 17%, and Procter & Gamble, within the household & personal products group, gained 23% and boosted the fund. Conversely, the biggest individual detractor was Disney (-40%), from the media & entertainment segment, followed by JPMorgan Chase (-20%), which is in the banks group. Within media & entertainment, Comcast returned -28% and hurt. Other detractors were Intel (-22%), a stock in the semiconductors & semiconductor equipment category, and Salesforce (-24%), from the software & services segment.The views expressed above reflect those of the portfolio manager(s) only through the end of the period as stated on the cover of this report and do not necessarily represent the views of Fidelity or any other person in the Fidelity organization. Any such views are subject to change at any time based upon market or other conditions and Fidelity disclaims any responsibility to update such views. These views may not be relied on as investment advice and, because investment decisions for a Fidelity fund are based on numerous factors, may not be relied on as an indication of trading intent on behalf of any Fidelity fund.
Investment Summary (Unaudited)
Top Ten Stocks as of April 30, 2022
| % of fund's net assets | |
| Berkshire Hathaway, Inc. Class B | 3.0 |
| Johnson & Johnson | 2.4 |
| UnitedHealth Group, Inc. | 2.3 |
| Procter & Gamble Co. | 2.0 |
| Exxon Mobil Corp. | 1.8 |
| JPMorgan Chase & Co. | 1.8 |
| Chevron Corp. | 1.5 |
| Pfizer, Inc. | 1.4 |
| Bank of America Corp. | 1.3 |
| Merck & Co., Inc. | 1.1 |
| 18.6 |
Market Sectors as of April 30, 2022
| % of fund's net assets | |
| Financials | 19.7 |
| Health Care | 18.4 |
| Industrials | 10.7 |
| Information Technology | 8.9 |
| Consumer Staples | 8.1 |
| Energy | 7.4 |
| Communication Services | 6.7 |
| Utilities | 5.5 |
| Consumer Discretionary | 5.1 |
| Real Estate | 5.0 |
| Materials | 4.1 |
Asset Allocation (% of fund's net assets)
| As of April 30, 2022* | ||
| Stocks and Equity Futures | 100.0% | |

* Foreign investments - 4.2%
Schedule of Investments April 30, 2022
Showing Percentage of Net Assets
| Common Stocks - 99.6% | |||
| Shares | Value | ||
| COMMUNICATION SERVICES - 6.7% | |||
| Diversified Telecommunication Services - 1.7% | |||
| AT&T, Inc. | 1,927,379 | $36,350,368 | |
| Lumen Technologies, Inc. (a) | 274,900 | 2,765,494 | |
| Verizon Communications, Inc. | 1,133,724 | 52,491,421 | |
| 91,607,283 | |||
| Entertainment - 1.8% | |||
| Activision Blizzard, Inc. | 208,318 | 15,748,841 | |
| Electronic Arts, Inc. | 75,561 | 8,919,976 | |
| Live Nation Entertainment, Inc. (b) | 22,950 | 2,406,996 | |
| Madison Square Garden Sports Corp. (b) | 3,129 | 507,242 | |
| Take-Two Interactive Software, Inc. (b) | 24,680 | 2,949,507 | |
| The Walt Disney Co. (b) | 464,928 | 51,899,913 | |
| Warner Bros Discovery, Inc. (b) | 595,760 | 10,813,044 | |
| World Wrestling Entertainment, Inc. Class A (a) | 1,583 | 92,431 | |
| Zynga, Inc. (b) | 144,935 | 1,198,612 | |
| 94,536,562 | |||
| Interactive Media & Services - 1.1% | |||
| Alphabet, Inc.: | |||
| Class A (b) | 11,284 | 25,752,232 | |
| Class C (b) | 10,373 | 23,850,950 | |
| IAC (b) | 20,630 | 1,709,814 | |
| TripAdvisor, Inc. (a)(b) | 10,449 | 268,226 | |
| Twitter, Inc. (b) | 188,207 | 9,225,907 | |
| Vimeo, Inc. (b) | 2,979 | 30,356 | |
| 60,837,485 | |||
| Media - 1.7% | |||
| Altice U.S.A., Inc. Class A (b) | 16,787 | 155,783 | |
| Cable One, Inc. | 684 | 797,681 | |
| Charter Communications, Inc. Class A (b) | 1,719 | 736,574 | |
| Comcast Corp. Class A | 1,214,184 | 48,275,956 | |
| DISH Network Corp. Class A (b) | 67,018 | 1,910,683 | |
| Fox Corp.: | |||
| Class A | 83,529 | 2,993,679 | |
| Class B | 40,421 | 1,343,594 | |
| Interpublic Group of Companies, Inc. | 105,637 | 3,445,879 | |
| Liberty Broadband Corp.: | |||
| Class A (b) | 6,530 | 703,020 | |
| Class C (b) | 37,813 | 4,228,250 | |
| Liberty Media Corp.: | |||
| Liberty Formula One Group Series C (b) | 53,282 | 3,321,067 | |
| Liberty Media Class A (b) | 6,614 | 379,776 | |
| Liberty SiriusXM Series A (b) | 25,161 | 1,052,485 | |
| Liberty SiriusXM Series C (b) | 42,962 | 1,799,249 | |
| Loyalty Ventures, Inc. (b) | 5,232 | 66,917 | |
| News Corp.: | |||
| Class A | 105,010 | 2,085,499 | |
| Class B | 32,737 | 651,794 | |
| Nexstar Broadcasting Group, Inc. Class A | 9,901 | 1,568,516 | |
| Omnicom Group, Inc. | 55,803 | 4,248,282 | |
| Paramount Global: | |||
| Class A (a) | 2,719 | 85,784 | |
| Class B | 156,603 | 4,560,279 | |
| Sirius XM Holdings, Inc. (a) | 234,054 | 1,404,324 | |
| The New York Times Co. Class A | 44,528 | 1,706,313 | |
| 87,521,384 | |||
| Wireless Telecommunication Services - 0.4% | |||
| T-Mobile U.S., Inc. (b) | 158,937 | 19,571,502 | |
| TOTAL COMMUNICATION SERVICES | 354,074,216 | ||
| CONSUMER DISCRETIONARY - 5.1% | |||
| Auto Components - 0.3% | |||
| Aptiv PLC (b) | 59,426 | 6,322,926 | |
| BorgWarner, Inc. | 64,579 | 2,378,445 | |
| Gentex Corp. | 63,821 | 1,873,146 | |
| Lear Corp. | 16,188 | 2,071,093 | |
| QuantumScape Corp. Class A (a)(b) | 18,929 | 282,799 | |
| 12,928,409 | |||
| Automobiles - 0.6% | |||
| Ford Motor Co. | 1,055,520 | 14,946,163 | |
| General Motors Co. (b) | 370,878 | 14,059,985 | |
| Harley-Davidson, Inc. | 41,332 | 1,506,551 | |
| Rivian Automotive, Inc. (a) | 29,813 | 901,545 | |
| Thor Industries, Inc. (a) | 8,494 | 650,216 | |
| 32,064,460 | |||
| Distributors - 0.2% | |||
| Genuine Parts Co. | 37,541 | 4,882,207 | |
| LKQ Corp. | 73,308 | 3,638,276 | |
| 8,520,483 | |||
| Diversified Consumer Services - 0.1% | |||
| ADT, Inc. | 42,823 | 293,338 | |
| Bright Horizons Family Solutions, Inc. (a)(b) | 3,275 | 374,136 | |
| Chegg, Inc. (b) | 8,763 | 216,797 | |
| Frontdoor, Inc. (a)(b) | 7,323 | 226,354 | |
| Grand Canyon Education, Inc. (b) | 10,677 | 1,024,672 | |
| H&R Block, Inc. (a) | 8,564 | 223,263 | |
| Mister Car Wash, Inc. (a) | 4,072 | 58,637 | |
| Service Corp. International | 43,255 | 2,837,961 | |
| Terminix Global Holdings, Inc. (b) | 32,630 | 1,497,391 | |
| 6,752,549 | |||
| Hotels, Restaurants & Leisure - 1.6% | |||
| ARAMARK Holdings Corp. | 62,471 | 2,264,574 | |
| Boyd Gaming Corp. (a) | 17,381 | 1,052,941 | |
| Caesars Entertainment, Inc. (b) | 20,802 | 1,378,757 | |
| Carnival Corp. (a)(b) | 232,638 | 4,024,637 | |
| Darden Restaurants, Inc. | 10,966 | 1,444,551 | |
| Domino's Pizza, Inc. | 3,122 | 1,055,236 | |
| Hilton Worldwide Holdings, Inc. | 24,379 | 3,785,815 | |
| Hyatt Hotels Corp. Class A (b) | 13,308 | 1,263,728 | |
| Marriott Vacations Worldwide Corp. | 11,235 | 1,677,723 | |
| McDonald's Corp. | 165,646 | 41,272,357 | |
| MGM Resorts International | 101,768 | 4,176,559 | |
| Norwegian Cruise Line Holdings Ltd. (a)(b) | 99,617 | 1,995,329 | |
| Penn National Gaming, Inc. (b) | 41,520 | 1,518,386 | |
| Planet Fitness, Inc. (b) | 6,993 | 559,650 | |
| Royal Caribbean Cruises Ltd. (b) | 59,078 | 4,592,133 | |
| Six Flags Entertainment Corp. (b) | 12,809 | 490,200 | |
| Travel+Leisure Co. | 7,659 | 424,921 | |
| Wyndham Hotels & Resorts, Inc. | 9,101 | 800,524 | |
| Yum China Holdings, Inc. | 106,474 | 4,450,613 | |
| Yum! Brands, Inc. | 71,393 | 8,353,695 | |
| 86,582,329 | |||
| Household Durables - 0.5% | |||
| D.R. Horton, Inc. | 51,973 | 3,616,801 | |
| Garmin Ltd. | 40,797 | 4,477,063 | |
| Leggett & Platt, Inc. | 35,779 | 1,274,806 | |
| Lennar Corp.: | |||
| Class A | 69,089 | 5,284,618 | |
| Class B | 4,504 | 293,661 | |
| Mohawk Industries, Inc. (b) | 14,829 | 2,091,779 | |
| Newell Brands, Inc. | 102,565 | 2,374,380 | |
| NVR, Inc. (b) | 280 | 1,225,339 | |
| PulteGroup, Inc. | 47,379 | 1,978,547 | |
| Toll Brothers, Inc. | 17,463 | 809,759 | |
| TopBuild Corp. (b) | 1,541 | 279,137 | |
| Whirlpool Corp. (a) | 15,464 | 2,807,025 | |
| 26,512,915 | |||
| Internet & Direct Marketing Retail - 0.0% | |||
| Doordash, Inc. (b) | 4,740 | 385,978 | |
| Qurate Retail, Inc. Series A (a) | 97,649 | 411,102 | |
| Wayfair LLC Class A (a)(b) | 9,125 | 702,078 | |
| 1,499,158 | |||
| Leisure Products - 0.1% | |||
| Brunswick Corp. | 18,055 | 1,365,139 | |
| Hasbro, Inc. | 34,477 | 3,036,045 | |
| Polaris, Inc. | 4,702 | 446,408 | |
| 4,847,592 | |||
| Multiline Retail - 0.7% | |||
| Dollar General Corp. | 35,997 | 8,550,367 | |
| Dollar Tree, Inc. (b) | 60,021 | 9,750,411 | |
| Kohl's Corp. | 37,256 | 2,156,377 | |
| Nordstrom, Inc. (a) | 4,703 | 120,867 | |
| Ollie's Bargain Outlet Holdings, Inc. (a)(b) | 16,914 | 812,718 | |
| Target Corp. | 71,298 | 16,302,288 | |
| 37,693,028 | |||
| Specialty Retail - 0.7% | |||
| Advance Auto Parts, Inc. | 16,795 | 3,352,786 | |
| AutoNation, Inc. (b) | 11,124 | 1,289,383 | |
| AutoZone, Inc. (b) | 4,367 | 8,539,537 | |
| Bath & Body Works, Inc. | 27,032 | 1,429,722 | |
| Best Buy Co., Inc. | 49,858 | 4,483,730 | |
| Burlington Stores, Inc. (b) | 1,049 | 213,534 | |
| CarMax, Inc. (b) | 40,175 | 3,446,212 | |
| Dick's Sporting Goods, Inc. | 16,281 | 1,569,814 | |
| Foot Locker, Inc. | 23,472 | 687,964 | |
| Gap, Inc. | 54,170 | 672,791 | |
| Leslie's, Inc. (a)(b) | 4,810 | 94,276 | |
| Lithia Motors, Inc. Class A (sub. vtg.) | 7,211 | 2,041,650 | |
| O'Reilly Automotive, Inc. (b) | 12,482 | 7,570,957 | |
| Penske Automotive Group, Inc. (a) | 8,288 | 868,748 | |
| Petco Health & Wellness Co., Inc. (a)(b) | 14,046 | 270,526 | |
| Victoria's Secret & Co. (b) | 8,527 | 401,792 | |
| Vroom, Inc. (a)(b) | 22,969 | 35,832 | |
| Williams-Sonoma, Inc. (a) | 4,687 | 611,560 | |
| 37,580,814 | |||
| Textiles, Apparel & Luxury Goods - 0.3% | |||
| Capri Holdings Ltd. (b) | 38,937 | 1,857,295 | |
| Carter's, Inc. (a) | 11,140 | 938,434 | |
| Columbia Sportswear Co. | 9,889 | 812,480 | |
| Deckers Outdoor Corp. (b) | 6,287 | 1,670,770 | |
| Hanesbrands, Inc. (a) | 37,539 | 497,767 | |
| PVH Corp. | 18,757 | 1,365,134 | |
| Ralph Lauren Corp. | 12,217 | 1,274,722 | |
| Skechers U.S.A., Inc. Class A (sub. vtg.) (b) | 31,476 | 1,205,531 | |
| Tapestry, Inc. | 64,137 | 2,111,390 | |
| Under Armour, Inc.: | |||
| Class A (sub. vtg.) (b) | 50,926 | 782,223 | |
| Class C (non-vtg.) (b) | 54,741 | 776,775 | |
| VF Corp. | 31,207 | 1,622,764 | |
| 14,915,285 | |||
| TOTAL CONSUMER DISCRETIONARY | 269,897,022 | ||
| CONSUMER STAPLES - 8.1% | |||
| Beverages - 1.0% | |||
| Brown-Forman Corp.: | |||
| Class A | 6,251 | 390,187 | |
| Class B (non-vtg.) | 24,811 | 1,673,254 | |
| Constellation Brands, Inc. Class A (sub. vtg.) | 42,087 | 10,357,190 | |
| Keurig Dr. Pepper, Inc. | 188,407 | 7,046,422 | |
| Molson Coors Beverage Co. Class B | 48,131 | 2,605,812 | |
| Monster Beverage Corp. (b) | 7,204 | 617,239 | |
| PepsiCo, Inc. | 63,376 | 10,882,293 | |
| The Coca-Cola Co. | 307,991 | 19,899,299 | |
| 53,471,696 | |||
| Food & Staples Retailing - 1.7% | |||
| Albertsons Companies, Inc. | 43,717 | 1,367,468 | |
| Casey's General Stores, Inc. | 9,942 | 2,001,325 | |
| Costco Wholesale Corp. | 7,753 | 4,122,425 | |
| Grocery Outlet Holding Corp. (a)(b) | 23,513 | 791,683 | |
| Kroger Co. | 197,091 | 10,635,030 | |
| U.S. Foods Holding Corp. (b) | 59,569 | 2,240,986 | |
| Walgreens Boots Alliance, Inc. | 193,469 | 8,203,086 | |
| Walmart, Inc. | 381,616 | 58,383,432 | |
| 87,745,435 | |||
| Food Products - 2.0% | |||
| Archer Daniels Midland Co. | 150,113 | 13,444,120 | |
| Beyond Meat, Inc. (a)(b) | 1,949 | 71,879 | |
| Bunge Ltd. | 37,032 | 4,189,060 | |
| Campbell Soup Co. | 52,619 | 2,484,669 | |
| Conagra Brands, Inc. | 126,283 | 4,411,065 | |
| Darling Ingredients, Inc. (b) | 41,239 | 3,026,530 | |
| Flowers Foods, Inc. | 50,433 | 1,337,483 | |
| General Mills, Inc. | 162,771 | 11,512,793 | |
| Hormel Foods Corp. | 76,250 | 3,994,738 | |
| Ingredion, Inc. | 18,040 | 1,535,384 | |
| Kellogg Co. | 37,746 | 2,585,601 | |
| Lamb Weston Holdings, Inc. | 27,657 | 1,828,128 | |
| McCormick & Co., Inc. (non-vtg.) | 67,260 | 6,764,338 | |
| Mondelez International, Inc. | 371,837 | 23,976,050 | |
| Pilgrim's Pride Corp. (b) | 7,490 | 212,342 | |
| Post Holdings, Inc. (a)(b) | 15,429 | 1,147,763 | |
| Seaboard Corp. | 68 | 287,299 | |
| The Hain Celestial Group, Inc. (b) | 23,717 | 795,468 | |
| The Hershey Co. | 5,591 | 1,262,280 | |
| The J.M. Smucker Co. | 28,279 | 3,872,243 | |
| The Kraft Heinz Co. | 187,271 | 7,983,363 | |
| Tyson Foods, Inc. Class A | 77,425 | 7,212,913 | |
| 103,935,509 | |||
| Household Products - 2.4% | |||
| Church & Dwight Co., Inc. | 61,815 | 6,030,671 | |
| Colgate-Palmolive Co. | 105,871 | 8,157,361 | |
| Kimberly-Clark Corp. | 45,199 | 6,274,977 | |
| Procter & Gamble Co. | 649,367 | 104,255,872 | |
| Reynolds Consumer Products, Inc. (a) | 14,656 | 433,671 | |
| Spectrum Brands Holdings, Inc. | 10,776 | 916,714 | |
| The Clorox Co. | 6,288 | 902,139 | |
| 126,971,405 | |||
| Personal Products - 0.0% | |||
| Coty, Inc. Class A (b) | 94,077 | 762,964 | |
| Herbalife Nutrition Ltd. (b) | 22,820 | 606,556 | |
| Olaplex Holdings, Inc. | 17,733 | 260,675 | |
| 1,630,195 | |||
| Tobacco - 1.0% | |||
| Altria Group, Inc. | 218,542 | 12,144,379 | |
| Philip Morris International, Inc. | 420,154 | 42,015,400 | |
| 54,159,779 | |||
| TOTAL CONSUMER STAPLES | 427,914,019 | ||
| ENERGY - 7.4% | |||
| Energy Equipment & Services - 0.6% | |||
| Baker Hughes Co. Class A | 198,675 | 6,162,899 | |
| Halliburton Co. | 226,203 | 8,057,351 | |
| NOV, Inc. | 105,096 | 1,905,390 | |
| Schlumberger Ltd. | 377,317 | 14,719,136 | |
| 30,844,776 | |||
| Oil, Gas & Consumable Fuels - 6.8% | |||
| Antero Midstream GP LP | 89,950 | 923,787 | |
| APA Corp. | 97,697 | 3,998,738 | |
| Chevron Corp. | 522,004 | 81,782,367 | |
| ConocoPhillips Co. | 356,004 | 34,005,502 | |
| Continental Resources, Inc. | 15,694 | 872,116 | |
| Coterra Energy, Inc. | 180,234 | 5,188,937 | |
| Devon Energy Corp. | 181,739 | 10,571,758 | |
| Diamondback Energy, Inc. | 25,608 | 3,232,498 | |
| DT Midstream, Inc. | 25,970 | 1,395,888 | |
| EOG Resources, Inc. | 138,588 | 16,181,535 | |
| EQT Corp. | 82,047 | 3,261,368 | |
| Exxon Mobil Corp. | 1,142,686 | 97,413,982 | |
| Hess Corp. | 69,678 | 7,181,711 | |
| HF Sinclair Corp. (b) | 40,267 | 1,530,951 | |
| Kinder Morgan, Inc. | 524,818 | 9,525,447 | |
| Marathon Oil Corp. | 208,722 | 5,201,352 | |
| Marathon Petroleum Corp. | 165,793 | 14,467,097 | |
| Occidental Petroleum Corp. | 198,895 | 10,957,126 | |
| ONEOK, Inc. | 119,606 | 7,574,648 | |
| Phillips 66 Co. | 125,969 | 10,929,070 | |
| Pioneer Natural Resources Co. | 32,237 | 7,494,135 | |
| Targa Resources Corp. | 60,734 | 4,458,483 | |
| The Williams Companies, Inc. | 327,764 | 11,239,028 | |
| Valero Energy Corp. | 110,079 | 12,271,607 | |
| 361,659,131 | |||
| TOTAL ENERGY | 392,503,907 | ||
| FINANCIALS - 19.7% | |||
| Banks - 7.1% | |||
| Bank of America Corp. | 1,918,565 | 68,454,399 | |
| Bank of Hawaii Corp. (a) | 10,707 | 795,958 | |
| Bank OZK | 31,964 | 1,228,057 | |
| BOK Financial Corp. | 8,106 | 672,231 | |
| Citigroup, Inc. | 535,314 | 25,807,488 | |
| Citizens Financial Group, Inc. | 105,906 | 4,172,696 | |
| Comerica, Inc. | 35,329 | 2,893,445 | |
| Commerce Bancshares, Inc. | 29,773 | 2,035,580 | |
| Cullen/Frost Bankers, Inc. | 15,399 | 2,037,134 | |
| East West Bancorp, Inc. | 38,039 | 2,712,181 | |
| Fifth Third Bancorp | 183,723 | 6,895,124 | |
| First Citizens Bancshares, Inc. | 3,278 | 2,095,888 | |
| First Hawaiian, Inc. (a) | 34,250 | 808,643 | |
| First Horizon National Corp. | 142,582 | 3,190,985 | |
| First Republic Bank | 48,005 | 7,163,306 | |
| FNB Corp., Pennsylvania | 91,999 | 1,059,828 | |
| Huntington Bancshares, Inc. | 387,115 | 5,090,562 | |
| JPMorgan Chase & Co. | 792,273 | 94,565,705 | |
| KeyCorp | 250,148 | 4,830,358 | |
| M&T Bank Corp. | 48,098 | 8,015,051 | |
| PacWest Bancorp | 31,202 | 1,026,234 | |
| Pinnacle Financial Partners, Inc. | 20,056 | 1,555,343 | |
| PNC Financial Services Group, Inc. | 114,466 | 19,012,803 | |
| Popular, Inc. | 21,364 | 1,666,178 | |
| Prosperity Bancshares, Inc. | 24,096 | 1,575,396 | |
| Regions Financial Corp. | 259,144 | 5,369,464 | |
| Signature Bank | 16,537 | 4,006,088 | |
| SVB Financial Group (b) | 15,257 | 7,439,923 | |
| Synovus Financial Corp. | 36,175 | 1,502,710 | |
| Truist Financial Corp. | 357,757 | 17,297,551 | |
| U.S. Bancorp | 362,125 | 17,584,790 | |
| Umpqua Holdings Corp. | 58,104 | 961,040 | |
| Webster Financial Corp. | 48,120 | 2,405,519 | |
| Wells Fargo & Co. | 1,049,252 | 45,778,865 | |
| Western Alliance Bancorp. | 13,250 | 1,008,458 | |
| Wintrust Financial Corp. | 15,297 | 1,335,734 | |
| Zions Bancorp NA | 40,270 | 2,275,658 | |
| 376,326,373 | |||
| Capital Markets - 4.4% | |||
| Affiliated Managers Group, Inc. | 10,905 | 1,369,341 | |
| Ameriprise Financial, Inc. | 13,298 | 3,530,486 | |
| Ares Management Corp. | 4,645 | 307,592 | |
| Bank of New York Mellon Corp. | 198,659 | 8,355,598 | |
| BlackRock, Inc. Class A | 38,568 | 24,092,658 | |
| Carlyle Group LP | 43,673 | 1,584,893 | |
| Cboe Global Markets, Inc. | 28,663 | 3,238,346 | |
| Charles Schwab Corp. | 405,806 | 26,917,112 | |
| CME Group, Inc. | 96,711 | 21,212,591 | |
| Evercore, Inc. Class A | 10,251 | 1,084,043 | |
| FactSet Research Systems, Inc. | 1,418 | 572,149 | |
| Franklin Resources, Inc. | 77,999 | 1,917,995 | |
| Goldman Sachs Group, Inc. | 83,019 | 25,361,474 | |
| Interactive Brokers Group, Inc. | 21,606 | 1,286,853 | |
| Intercontinental Exchange, Inc. | 150,003 | 17,371,847 | |
| Invesco Ltd. | 89,983 | 1,653,888 | |
| Janus Henderson Group PLC | 45,493 | 1,386,627 | |
| Jefferies Financial Group, Inc. | 57,794 | 1,777,743 | |
| KKR & Co. LP | 149,959 | 7,643,410 | |
| Lazard Ltd. Class A | 26,917 | 882,070 | |
| Moody's Corp. | 2,273 | 719,359 | |
| Morgan Stanley | 356,758 | 28,751,127 | |
| Morningstar, Inc. | 586 | 148,393 | |
| MSCI, Inc. | 6,206 | 2,614,278 | |
| NASDAQ, Inc. | 31,365 | 4,935,910 | |
| Northern Trust Corp. | 55,341 | 5,702,890 | |
| Raymond James Financial, Inc. | 47,233 | 4,603,328 | |
| S&P Global, Inc. | 47,506 | 17,886,009 | |
| SEI Investments Co. | 28,751 | 1,602,006 | |
| State Street Corp. | 98,396 | 6,589,580 | |
| Stifel Financial Corp. | 27,526 | 1,702,483 | |
| T. Rowe Price Group, Inc. | 41,055 | 5,051,407 | |
| Tradeweb Markets, Inc. Class A | 28,303 | 2,014,891 | |
| Virtu Financial, Inc. Class A | 23,595 | 681,424 | |
| 234,549,801 | |||
| Consumer Finance - 0.8% | |||
| Ally Financial, Inc. | 91,036 | 3,637,799 | |
| American Express Co. | 60,508 | 10,571,353 | |
| Capital One Financial Corp. | 110,851 | 13,814,252 | |
| Credit Acceptance Corp. (a)(b) | 1,958 | 1,003,475 | |
| Discover Financial Services | 34,922 | 3,927,328 | |
| OneMain Holdings, Inc. | 29,415 | 1,351,031 | |
| SLM Corp. | 74,876 | 1,252,675 | |
| Synchrony Financial | 113,989 | 4,195,935 | |
| 39,753,848 | |||
| Diversified Financial Services - 3.1% | |||
| Apollo Global Management, Inc. (a) | 35,738 | 1,778,323 | |
| Berkshire Hathaway, Inc. Class B (b) | 494,917 | 159,774,038 | |
| Equitable Holdings, Inc. | 94,447 | 2,722,907 | |
| Voya Financial, Inc. (a) | 29,747 | 1,878,226 | |
| 166,153,494 | |||
| Insurance - 4.2% | |||
| AFLAC, Inc. | 173,711 | 9,950,166 | |
| Alleghany Corp. (b) | 3,187 | 2,665,926 | |
| Allstate Corp. | 75,469 | 9,549,847 | |
| American Financial Group, Inc. | 18,276 | 2,530,860 | |
| American International Group, Inc. | 224,013 | 13,107,001 | |
| Aon PLC | 24,221 | 6,975,406 | |
| Arch Capital Group Ltd. (b) | 76,247 | 3,482,200 | |
| Arthur J. Gallagher & Co. | 55,220 | 9,304,018 | |
| Assurant, Inc. | 15,316 | 2,785,674 | |
| Assured Guaranty Ltd. | 18,120 | 999,318 | |
| Axis Capital Holdings Ltd. | 20,836 | 1,194,528 | |
| Brighthouse Financial, Inc. (b) | 20,850 | 1,070,856 | |
| Brown & Brown, Inc. | 59,517 | 3,688,864 | |
| Chubb Ltd. | 115,670 | 23,880,072 | |
| Cincinnati Financial Corp. | 40,376 | 4,952,520 | |
| CNA Financial Corp. | 7,464 | 354,092 | |
| Erie Indemnity Co. Class A | 2,089 | 334,825 | |
| Everest Re Group Ltd. | 8,102 | 2,225,700 | |
| Fidelity National Financial, Inc. | 73,517 | 2,927,447 | |
| First American Financial Corp. | 28,729 | 1,675,188 | |
| Globe Life, Inc. | 26,995 | 2,647,670 | |
| GoHealth, Inc. (a)(b) | 1,315 | 983 | |
| Hanover Insurance Group, Inc. | 9,608 | 1,410,647 | |
| Hartford Financial Services Group, Inc. | 90,156 | 6,304,609 | |
| Kemper Corp. | 16,171 | 746,453 | |
| Lemonade, Inc. (a)(b) | 9,134 | 190,535 | |
| Lincoln National Corp. | 41,117 | 2,473,188 | |
| Loews Corp. | 56,375 | 3,542,605 | |
| Markel Corp. (b) | 3,035 | 4,107,205 | |
| Marsh & McLennan Companies, Inc. | 120,880 | 19,546,296 | |
| Mercury General Corp. | 7,190 | 362,592 | |
| MetLife, Inc. | 188,441 | 12,376,805 | |
| Old Republic International Corp. | 75,507 | 1,661,909 | |
| Primerica, Inc. | 10,545 | 1,366,210 | |
| Principal Financial Group, Inc. | 69,553 | 4,739,341 | |
| Progressive Corp. | 157,577 | 16,917,467 | |
| Prudential Financial, Inc. | 102,004 | 11,068,454 | |
| Reinsurance Group of America, Inc. | 18,082 | 1,940,560 | |
| RenaissanceRe Holdings Ltd. (a) | 6,537 | 938,190 | |
| The Travelers Companies, Inc. | 64,984 | 11,116,163 | |
| Unum Group | 54,980 | 1,677,990 | |
| W.R. Berkley Corp. | 55,801 | 3,710,208 | |
| White Mountains Insurance Group Ltd. | 789 | 826,888 | |
| Willis Towers Watson PLC | 33,450 | 7,187,067 | |
| 220,514,543 | |||
| Mortgage Real Estate Investment Trusts - 0.1% | |||
| AGNC Investment Corp. | 141,480 | 1,553,450 | |
| Annaly Capital Management, Inc. | 380,810 | 2,444,800 | |
| New Residential Investment Corp. | 116,407 | 1,210,633 | |
| Starwood Property Trust, Inc. | 77,927 | 1,782,970 | |
| 6,991,853 | |||
| Thrifts & Mortgage Finance - 0.0% | |||
| MGIC Investment Corp. | 85,832 | 1,120,966 | |
| New York Community Bancorp, Inc. | 121,439 | 1,122,096 | |
| TFS Financial Corp. | 13,153 | 197,163 | |
| UWM Holdings Corp. Class A (a) | 13,223 | 49,057 | |
| 2,489,282 | |||
| TOTAL FINANCIALS | 1,046,779,194 | ||
| HEALTH CARE - 18.4% | |||
| Biotechnology - 1.4% | |||
| Amgen, Inc. | 26,655 | 6,215,679 | |
| Biogen, Inc. (b) | 39,436 | 8,180,604 | |
| BioMarin Pharmaceutical, Inc. (b) | 49,159 | 3,999,085 | |
| Exact Sciences Corp. (a)(b) | 3,459 | 190,418 | |
| Exelixis, Inc. (b) | 12,110 | 270,537 | |
| Gilead Sciences, Inc. | 338,715 | 20,099,348 | |
| Horizon Therapeutics PLC (b) | 47,831 | 4,714,223 | |
| Incyte Corp. (b) | 7,161 | 536,789 | |
| Ionis Pharmaceuticals, Inc. (b) | 3,034 | 111,530 | |
| Iovance Biotherapeutics, Inc. (b) | 27,964 | 423,655 | |
| Mirati Therapeutics, Inc. (b) | 1,856 | 114,682 | |
| Natera, Inc. (b) | 1,514 | 53,172 | |
| Regeneron Pharmaceuticals, Inc. (b) | 24,616 | 16,224,652 | |
| Repligen Corp. (b) | 847 | 133,182 | |
| Sage Therapeutics, Inc. (b) | 13,847 | 436,457 | |
| Seagen, Inc. (b) | 3,889 | 509,498 | |
| Ultragenyx Pharmaceutical, Inc. (a)(b) | 4,510 | 318,812 | |
| United Therapeutics Corp. (b) | 11,900 | 2,112,964 | |
| Vertex Pharmaceuticals, Inc. (b) | 41,186 | 11,252,839 | |
| 75,898,126 | |||
| Health Care Equipment & Supplies - 3.0% | |||
| Abbott Laboratories | 234,334 | 26,596,909 | |
| Baxter International, Inc. | 135,584 | 9,634,599 | |
| Becton, Dickinson & Co. | 76,994 | 19,032,147 | |
| Boston Scientific Corp. (b) | 382,684 | 16,114,823 | |
| Dentsply Sirona, Inc. | 58,605 | 2,343,614 | |
| Embecta Corp. (b) | 15,400 | 468,622 | |
| Enovis Corp. (b) | 12,477 | 809,383 | |
| Envista Holdings Corp. (b) | 43,398 | 1,719,429 | |
| Figs, Inc. Class A (a)(b) | 15,379 | 240,835 | |
| Globus Medical, Inc. (b) | 20,010 | 1,325,062 | |
| Hologic, Inc. (b) | 66,692 | 4,801,157 | |
| ICU Medical, Inc. (a)(b) | 5,358 | 1,146,558 | |
| Integra LifeSciences Holdings Corp. (b) | 19,450 | 1,189,562 | |
| Masimo Corp. (b) | 3,707 | 418,780 | |
| Medtronic PLC | 362,266 | 37,806,080 | |
| Quidel Corp. (b) | 9,893 | 995,434 | |
| ResMed, Inc. | 3,874 | 774,684 | |
| STERIS PLC | 19,854 | 4,448,289 | |
| Stryker Corp. | 53,899 | 13,003,673 | |
| Tandem Diabetes Care, Inc. (b) | 1,018 | 98,217 | |
| Teleflex, Inc. | 10,369 | 2,961,594 | |
| The Cooper Companies, Inc. | 13,048 | 4,710,850 | |
| Zimmer Biomet Holdings, Inc. | 56,278 | 6,795,569 | |
| Zimvie, Inc. (b) | 5,570 | 125,325 | |
| 157,561,195 | |||
| Health Care Providers & Services - 5.3% | |||
| Acadia Healthcare Co., Inc. (b) | 23,797 | 1,615,340 | |
| agilon health, Inc. (a)(b) | 2,806 | 49,863 | |
| Amedisys, Inc. (b) | 993 | 126,756 | |
| AmerisourceBergen Corp. | 40,039 | 6,057,500 | |
| Anthem, Inc. | 66,083 | 33,169,040 | |
| Cardinal Health, Inc. | 30,539 | 1,772,789 | |
| Centene Corp. (b) | 156,010 | 12,566,606 | |
| Chemed Corp. | 2,981 | 1,464,834 | |
| Cigna Corp. | 87,801 | 21,667,531 | |
| CVS Health Corp. | 355,140 | 34,139,608 | |
| DaVita HealthCare Partners, Inc. (b) | 5,098 | 552,470 | |
| Encompass Health Corp. | 11,220 | 772,273 | |
| Henry Schein, Inc. (b) | 37,418 | 3,034,600 | |
| Humana, Inc. | 34,784 | 15,463,575 | |
| Laboratory Corp. of America Holdings | 25,105 | 6,032,229 | |
| McKesson Corp. | 34,632 | 10,722,414 | |
| Molina Healthcare, Inc. (b) | 13,181 | 4,131,584 | |
| Oak Street Health, Inc. (a)(b) | 2,452 | 44,357 | |
| Premier, Inc. | 31,886 | 1,154,592 | |
| Quest Diagnostics, Inc. | 32,865 | 4,398,652 | |
| Signify Health, Inc. (b) | 17,404 | 240,175 | |
| UnitedHealth Group, Inc. | 236,326 | 120,183,587 | |
| Universal Health Services, Inc. Class B | 19,164 | 2,348,165 | |
| 281,708,540 | |||
| Health Care Technology - 0.2% | |||
| Cerner Corp. | 78,800 | 7,378,832 | |
| Certara, Inc. (a)(b) | 13,337 | 244,734 | |
| Change Healthcare, Inc. (b) | 67,339 | 1,586,507 | |
| Definitive Healthcare Corp. (a) | 3,229 | 76,366 | |
| Teladoc Health, Inc. (a)(b) | 40,760 | 1,376,058 | |
| 10,662,497 | |||
| Life Sciences Tools & Services - 2.1% | |||
| Adaptive Biotechnologies Corp. (b) | 3,174 | 26,186 | |
| Agilent Technologies, Inc. | 8,399 | 1,001,749 | |
| Azenta, Inc. | 3,496 | 262,060 | |
| Bio-Rad Laboratories, Inc. Class A (b) | 5,717 | 2,927,447 | |
| Charles River Laboratories International, Inc. (b) | 837 | 202,144 | |
| Danaher Corp. | 162,183 | 40,729,017 | |
| IQVIA Holdings, Inc. (b) | 26,021 | 5,672,318 | |
| PerkinElmer, Inc. | 33,996 | 4,984,154 | |
| QIAGEN NV (b) | 61,190 | 2,776,190 | |
| Syneos Health, Inc. (b) | 23,846 | 1,742,904 | |
| Thermo Fisher Scientific, Inc. | 96,470 | 53,340,192 | |
| Waters Corp. (b) | 1,145 | 346,958 | |
| 114,011,319 | |||
| Pharmaceuticals - 6.4% | |||
| Bristol-Myers Squibb Co. | 588,395 | 44,288,492 | |
| Catalent, Inc. (b) | 35,084 | 3,177,207 | |
| Elanco Animal Health, Inc. (b) | 119,995 | 3,037,073 | |
| Eli Lilly & Co. | 48,030 | 14,031,004 | |
| Jazz Pharmaceuticals PLC (b) | 16,154 | 2,588,194 | |
| Johnson & Johnson | 710,941 | 128,296,413 | |
| Merck & Co., Inc. | 683,577 | 60,626,444 | |
| Nektar Therapeutics (a)(b) | 49,031 | 202,498 | |
| Organon & Co. | 68,414 | 2,211,825 | |
| Perrigo Co. PLC | 35,943 | 1,232,845 | |
| Pfizer, Inc. | 1,506,316 | 73,914,926 | |
| Royalty Pharma PLC | 35,711 | 1,520,574 | |
| Viatris, Inc. | 325,785 | 3,365,359 | |
| Zoetis, Inc. Class A | 6,653 | 1,179,244 | |
| 339,672,098 | |||
| TOTAL HEALTH CARE | 979,513,775 | ||
| INDUSTRIALS - 10.7% | |||
| Aerospace & Defense - 2.5% | |||
| BWX Technologies, Inc. | 6,152 | 319,412 | |
| Curtiss-Wright Corp. | 10,537 | 1,505,843 | |
| General Dynamics Corp. | 67,098 | 15,870,690 | |
| HEICO Corp. (a) | 8,204 | 1,158,651 | |
| HEICO Corp. Class A | 14,354 | 1,674,251 | |
| Hexcel Corp. | 22,484 | 1,222,230 | |
| Howmet Aerospace, Inc. | 94,948 | 3,239,626 | |
| Huntington Ingalls Industries, Inc. | 10,622 | 2,259,724 | |
| L3Harris Technologies, Inc. | 52,755 | 12,252,876 | |
| Lockheed Martin Corp. | 8,249 | 3,564,558 | |
| Mercury Systems, Inc. (b) | 15,068 | 840,644 | |
| Northrop Grumman Corp. | 36,050 | 15,840,370 | |
| Raytheon Technologies Corp. | 403,901 | 38,334,244 | |
| Spirit AeroSystems Holdings, Inc. Class A | 19,951 | 838,740 | |
| Textron, Inc. | 59,385 | 4,112,411 | |
| The Boeing Co. (b) | 144,486 | 21,505,296 | |
| TransDigm Group, Inc. (b) | 10,061 | 5,984,383 | |
| Virgin Galactic Holdings, Inc. (a)(b) | 3,823 | 28,634 | |
| Woodward, Inc. | 16,637 | 1,838,056 | |
| 132,390,639 | |||
| Air Freight & Logistics - 0.2% | |||
| C.H. Robinson Worldwide, Inc. | 27,938 | 2,965,619 | |
| Expeditors International of Washington, Inc. | 12,278 | 1,216,381 | |
| FedEx Corp. | 37,364 | 7,425,721 | |
| GXO Logistics, Inc. (b) | 3,770 | 223,146 | |
| 11,830,867 | |||
| Airlines - 0.4% | |||
| Alaska Air Group, Inc. (b) | 33,269 | 1,809,501 | |
| American Airlines Group, Inc. (a)(b) | 172,079 | 3,229,923 | |
| Copa Holdings SA Class A (a)(b) | 8,480 | 639,138 | |
| JetBlue Airways Corp. (b) | 85,171 | 937,733 | |
| Southwest Airlines Co. (b) | 159,257 | 7,440,487 | |
| United Airlines Holdings, Inc. (b) | 87,139 | 4,400,520 | |
| 18,457,302 | |||
| Building Products - 0.7% | |||
| A.O. Smith Corp. | 34,877 | 2,037,863 | |
| Allegion PLC | 5,774 | 659,622 | |
| Armstrong World Industries, Inc. | 6,613 | 559,857 | |
| Builders FirstSource, Inc. (b) | 51,059 | 3,143,703 | |
| Carlisle Companies, Inc. | 8,546 | 2,216,491 | |
| Carrier Global Corp. | 122,780 | 4,698,791 | |
| Fortune Brands Home & Security, Inc. | 27,130 | 1,933,013 | |
| Hayward Holdings, Inc. (a)(b) | 13,229 | 210,341 | |
| Johnson Controls International PLC | 189,251 | 11,330,457 | |
| Lennox International, Inc. | 8,897 | 1,896,751 | |
| Masco Corp. | 64,467 | 3,396,766 | |
| Owens Corning | 27,029 | 2,457,747 | |
| The AZEK Co., Inc. (b) | 13,788 | 292,857 | |
| Trane Technologies PLC | 32,236 | 4,509,494 | |
| 39,343,753 | |||
| Commercial Services & Supplies - 0.5% | |||
| Cintas Corp. | 1,481 | 588,342 | |
| Clean Harbors, Inc. (b) | 13,625 | 1,429,671 | |
| Driven Brands Holdings, Inc. (b) | 14,515 | 404,823 | |
| MSA Safety, Inc. | 7,034 | 848,933 | |
| Republic Services, Inc. | 56,649 | 7,606,261 | |
| Rollins, Inc. | 4,354 | 146,033 | |
| Stericycle, Inc. (b) | 24,613 | 1,235,326 | |
| Waste Management, Inc. | 95,761 | 15,746,939 | |
| 28,006,328 | |||
| Construction & Engineering - 0.2% | |||
| AECOM | 36,050 | 2,543,688 | |
| MasTec, Inc. (b) | 15,538 | 1,118,891 | |
| MDU Resources Group, Inc. | 54,416 | 1,401,756 | |
| Quanta Services, Inc. | 38,131 | 4,422,433 | |
| Valmont Industries, Inc. (a) | 5,612 | 1,396,322 | |
| 10,883,090 | |||
| Electrical Equipment - 1.0% | |||
| Acuity Brands, Inc. | 9,306 | 1,605,099 | |
| AMETEK, Inc. | 62,158 | 7,848,069 | |
| ChargePoint Holdings, Inc. Class A (a)(b) | 61,374 | 794,180 | |
| Eaton Corp. PLC | 107,397 | 15,574,713 | |
| Emerson Electric Co. | 160,929 | 14,512,577 | |
| Fluence Energy, Inc. (a) | 5,546 | 50,857 | |
| Hubbell, Inc. Class B | 14,593 | 2,850,888 | |
| nVent Electric PLC | 44,796 | 1,513,209 | |
| Regal Rexnord Corp. | 14,372 | 1,828,693 | |
| Rockwell Automation, Inc. | 12,300 | 3,107,841 | |
| Sensata Technologies, Inc. PLC | 41,962 | 1,905,494 | |
| Shoals Technologies Group, Inc. (a)(b) | 28,254 | 281,975 | |
| Sunrun, Inc. (a)(b) | 54,459 | 1,088,091 | |
| 52,961,686 | |||
| Industrial Conglomerates - 1.6% | |||
| 3M Co. | 131,309 | 18,937,384 | |
| General Electric Co. | 294,647 | 21,965,934 | |
| Honeywell International, Inc. | 145,158 | 28,089,525 | |
| Roper Technologies, Inc. | 28,280 | 13,289,338 | |
| 82,282,181 | |||
| Machinery - 1.7% | |||
| AGCO Corp. | 15,180 | 1,933,932 | |
| Allison Transmission Holdings, Inc. | 6,797 | 254,480 | |
| Caterpillar, Inc. | 20,148 | 4,241,960 | |
| Crane Co. | 13,268 | 1,276,780 | |
| Cummins, Inc. | 38,689 | 7,319,572 | |
| Donaldson Co., Inc. | 29,147 | 1,429,369 | |
| Dover Corp. | 38,687 | 5,156,977 | |
| ESAB Corp. (b) | 11,953 | 561,791 | |
| Flowserve Corp. | 34,996 | 1,144,719 | |
| Fortive Corp. | 88,073 | 5,064,198 | |
| Gates Industrial Corp. PLC (a)(b) | 25,730 | 328,058 | |
| Graco, Inc. | 17,122 | 1,061,906 | |
| IDEX Corp. | 20,469 | 3,885,426 | |
| Illinois Tool Works, Inc. | 8,750 | 1,724,713 | |
| Ingersoll Rand, Inc. | 106,035 | 4,661,299 | |
| ITT, Inc. | 23,185 | 1,628,051 | |
| Middleby Corp. (b) | 10,361 | 1,594,454 | |
| Nordson Corp. | 12,972 | 2,797,931 | |
| Oshkosh Corp. | 17,846 | 1,649,684 | |
| Otis Worldwide Corp. | 114,700 | 8,354,748 | |
| PACCAR, Inc. | 91,863 | 7,629,222 | |
| Parker Hannifin Corp. | 28,925 | 7,833,469 | |
| Pentair PLC | 44,585 | 2,262,689 | |
| Snap-On, Inc. | 14,220 | 3,021,608 | |
| Stanley Black & Decker, Inc. | 43,510 | 5,227,727 | |
| Timken Co. | 17,280 | 996,019 | |
| Toro Co. | 1,525 | 122,198 | |
| Westinghouse Air Brake Tech Co. | 48,315 | 4,344,002 | |
| Xylem, Inc. | 16,431 | 1,322,696 | |
| 88,829,678 | |||
| Marine - 0.0% | |||
| Kirby Corp. (b) | 16,031 | 1,045,221 | |
| Professional Services - 0.6% | |||
| CACI International, Inc. Class A (b) | 6,271 | 1,663,696 | |
| Clarivate Analytics PLC (a)(b) | 125,538 | 1,968,436 | |
| CoStar Group, Inc. (b) | 23,621 | 1,502,768 | |
| Dun & Bradstreet Holdings, Inc. (a)(b) | 43,089 | 680,375 | |
| Equifax, Inc. | 20,184 | 4,107,848 | |
| FTI Consulting, Inc. (a)(b) | 9,052 | 1,427,591 | |
| Jacobs Engineering Group, Inc. | 34,833 | 4,826,112 | |
| LegalZoom.com, Inc. (a) | 10,408 | 149,355 | |
| Leidos Holdings, Inc. | 38,044 | 3,937,934 | |
| Manpower, Inc. | 14,613 | 1,318,093 | |
| Nielsen Holdings PLC | 96,376 | 2,583,841 | |
| Robert Half International, Inc. | 3,598 | 353,719 | |
| Science Applications International Corp. | 15,300 | 1,273,419 | |
| TransUnion Holding Co., Inc. | 16,330 | 1,429,202 | |
| Verisk Analytics, Inc. | 15,533 | 3,169,509 | |
| 30,391,898 | |||
| Road & Rail - 1.1% | |||
| AMERCO | 2,416 | 1,293,720 | |
| CSX Corp. | 596,322 | 20,477,697 | |
| J.B. Hunt Transport Services, Inc. | 2,539 | 433,788 | |
| Knight-Swift Transportation Holdings, Inc. Class A | 43,361 | 2,076,558 | |
| Landstar System, Inc. | 1,155 | 178,910 | |
| Norfolk Southern Corp. | 64,543 | 16,644,349 | |
| Old Dominion Freight Lines, Inc. | 2,174 | 608,981 | |
| Ryder System, Inc. (a) | 14,044 | 981,676 | |
| Schneider National, Inc. Class B (a) | 14,016 | 331,198 | |
| TuSimple Holdings, Inc. (a)(b) | 31,712 | 328,853 | |
| Uber Technologies, Inc. (b) | 62,760 | 1,975,685 | |
| Union Pacific Corp. | 63,828 | 14,954,262 | |
| XPO Logistics, Inc. (b) | 3,692 | 198,593 | |
| 60,484,270 | |||
| Trading Companies & Distributors - 0.2% | |||
| Air Lease Corp. Class A | 28,796 | 1,159,903 | |
| Core & Main, Inc. (a) | 7,329 | 174,137 | |
| Fastenal Co. | 17,450 | 965,160 | |
| MSC Industrial Direct Co., Inc. Class A | 12,070 | 1,000,120 | |
| SiteOne Landscape Supply, Inc. (b) | 5,682 | 801,332 | |
| United Rentals, Inc. (b) | 12,731 | 4,029,616 | |
| Univar Solutions, Inc. (b) | 45,008 | 1,310,633 | |
| W.W. Grainger, Inc. | 2,102 | 1,051,063 | |
| Watsco, Inc. | 8,806 | 2,349,265 | |
| 12,841,229 | |||
| TOTAL INDUSTRIALS | 569,748,142 | ||
| INFORMATION TECHNOLOGY - 8.9% | |||
| Communications Equipment - 1.4% | |||
| Arista Networks, Inc. (b) | 6,873 | 794,313 | |
| Ciena Corp. (b) | 41,576 | 2,293,748 | |
| Cisco Systems, Inc. | 1,140,282 | 55,851,012 | |
| F5, Inc. (b) | 16,236 | 2,718,069 | |
| Juniper Networks, Inc. | 86,109 | 2,714,156 | |
| Lumentum Holdings, Inc. (a)(b) | 19,512 | 1,584,570 | |
| Motorola Solutions, Inc. | 44,804 | 9,574,167 | |
| Ubiquiti, Inc. (a) | 184 | 51,934 | |
| ViaSat, Inc. (a)(b) | 18,983 | 698,764 | |
| 76,280,733 | |||
| Electronic Equipment & Components - 0.6% | |||
| Amphenol Corp. Class A | 45,519 | 3,254,609 | |
| Arrow Electronics, Inc. (b) | 18,163 | 2,140,691 | |
| Avnet, Inc. | 26,685 | 1,165,067 | |
| Coherent, Inc. (b) | 675 | 180,833 | |
| Corning, Inc. | 135,811 | 4,779,189 | |
| IPG Photonics Corp. (b) | 9,040 | 854,099 | |
| Jabil, Inc. | 7,838 | 452,488 | |
| Keysight Technologies, Inc. (b) | 27,555 | 3,865,140 | |
| Littelfuse, Inc. | 6,442 | 1,476,829 | |
| National Instruments Corp. | 35,680 | 1,289,475 | |
| TD SYNNEX Corp. | 11,199 | 1,120,908 | |
| Teledyne Technologies, Inc. (b) | 12,385 | 5,344,747 | |
| Trimble, Inc. (b) | 67,504 | 4,502,517 | |
| Vontier Corp. | 20,887 | 535,125 | |
| 30,961,717 | |||
| IT Services - 2.6% | |||
| Accenture PLC Class A | 33,631 | 10,101,407 | |
| Akamai Technologies, Inc. (b) | 43,327 | 4,864,756 | |
| Amdocs Ltd. | 33,139 | 2,640,847 | |
| Automatic Data Processing, Inc. | 9,070 | 1,978,893 | |
| Bread Financial Holdings, Inc. | 13,386 | 733,553 | |
| Broadridge Financial Solutions, Inc. | 2,870 | 413,653 | |
| Cloudflare, Inc. (b) | 4,032 | 347,316 | |
| Cognizant Technology Solutions Corp. Class A | 142,048 | 11,491,683 | |
| Concentrix Corp. | 11,333 | 1,784,721 | |
| DXC Technology Co. (b) | 65,733 | 1,886,537 | |
| Euronet Worldwide, Inc. (b) | 3,979 | 484,045 | |
| Fastly, Inc. Class A (a)(b) | 28,477 | 452,784 | |
| Fidelity National Information Services, Inc. | 164,129 | 16,273,390 | |
| Fiserv, Inc. (b) | 150,384 | 14,725,601 | |
| FleetCor Technologies, Inc. (b) | 16,505 | 4,118,328 | |
| Genpact Ltd. | 46,927 | 1,889,750 | |
| Global Payments, Inc. | 76,289 | 10,450,067 | |
| GoDaddy, Inc. (b) | 40,629 | 3,283,229 | |
| IBM Corp. | 241,120 | 31,878,475 | |
| Jack Henry & Associates, Inc. | 14,421 | 2,733,933 | |
| Kyndryl Holdings, Inc. (a)(b) | 60,356 | 717,633 | |
| Paychex, Inc. | 11,131 | 1,410,632 | |
| Paysafe Ltd. (b) | 97,312 | 270,527 | |
| Snowflake, Inc. (b) | 3,216 | 551,351 | |
| SolarWinds, Inc. | 9,354 | 115,709 | |
| StoneCo Ltd. Class A (b) | 3,986 | 37,548 | |
| The Western Union Co. | 79,494 | 1,332,319 | |
| Thoughtworks Holding, Inc. (a) | 7,462 | 138,122 | |
| Twilio, Inc. Class A (b) | 32,278 | 3,609,326 | |
| VeriSign, Inc. (b) | 26,215 | 4,684,358 | |
| WEX, Inc. (b) | 3,954 | 657,313 | |
| 136,057,806 | |||
| Semiconductors & Semiconductor Equipment - 2.5% | |||
| Analog Devices, Inc. | 85,131 | 13,142,524 | |
| Cirrus Logic, Inc. (b) | 15,314 | 1,160,801 | |
| First Solar, Inc. (b) | 28,588 | 2,087,782 | |
| GlobalFoundries, Inc. | 6,715 | 351,127 | |
| Intel Corp. | 1,090,623 | 47,540,257 | |
| Marvell Technology, Inc. | 227,357 | 13,204,895 | |
| Microchip Technology, Inc. | 23,179 | 1,511,271 | |
| Micron Technology, Inc. | 260,568 | 17,768,132 | |
| MKS Instruments, Inc. | 2,341 | 266,827 | |
| NXP Semiconductors NV | 49,529 | 8,464,506 | |
| onsemi (b) | 52,398 | 2,730,460 | |
| Qorvo, Inc. (b) | 29,160 | 3,317,825 | |
| Skyworks Solutions, Inc. | 23,484 | 2,660,737 | |
| Texas Instruments, Inc. | 94,701 | 16,122,845 | |
| Wolfspeed, Inc. (a)(b) | 31,082 | 2,850,530 | |
| 133,180,519 | |||
| Software - 1.4% | |||
| ANSYS, Inc. (b) | 13,713 | 3,780,537 | |
| Black Knight, Inc. (b) | 40,978 | 2,695,943 | |
| C3.Ai, Inc. (a)(b) | 12,076 | 205,171 | |
| CDK Global, Inc. | 26,582 | 1,446,327 | |
| Ceridian HCM Holding, Inc. (b) | 35,254 | 1,978,807 | |
| Citrix Systems, Inc. | 21,516 | 2,153,752 | |
| Datto Holding Corp. (a)(b) | 6,447 | 223,711 | |
| Dolby Laboratories, Inc. Class A | 17,282 | 1,338,837 | |
| Duck Creek Technologies, Inc. (b) | 16,107 | 256,585 | |
| Dynatrace, Inc. (b) | 3,131 | 120,105 | |
| Guidewire Software, Inc. (a)(b) | 22,635 | 1,967,887 | |
| Informatica, Inc. (a) | 2,530 | 49,234 | |
| Jamf Holding Corp. (a)(b) | 2,219 | 68,345 | |
| Mandiant, Inc. (b) | 44,597 | 980,242 | |
| Manhattan Associates, Inc. (b) | 7,956 | 1,038,656 | |
| N-able, Inc. (a)(b) | 10,658 | 106,580 | |
| NCR Corp. (b) | 22,638 | 793,009 | |
| NortonLifeLock, Inc. | 108,920 | 2,727,357 | |
| Oracle Corp. | 29,603 | 2,172,860 | |
| Paycor HCM, Inc. (a) | 3,504 | 86,304 | |
| Pegasystems, Inc. | 605 | 46,337 | |
| Procore Technologies, Inc. (b) | 4,426 | 245,510 | |
| Salesforce.com, Inc. (b) | 203,874 | 35,869,592 | |
| SS&C Technologies Holdings, Inc. | 60,410 | 3,906,111 | |
| Synopsys, Inc. (b) | 14,971 | 4,293,533 | |
| Teradata Corp. (b) | 4,194 | 173,422 | |
| Tyler Technologies, Inc. (b) | 1,453 | 573,514 | |
| VMware, Inc. Class A | 37,771 | 4,080,779 | |
| 73,379,047 | |||
| Technology Hardware, Storage & Peripherals - 0.4% | |||
| Dell Technologies, Inc. | 37,537 | 1,764,614 | |
| Hewlett Packard Enterprise Co. | 350,476 | 5,400,835 | |
| HP, Inc. | 190,723 | 6,986,183 | |
| NetApp, Inc. | 20,188 | 1,478,771 | |
| Pure Storage, Inc. Class A (b) | 4,658 | 136,479 | |
| Western Digital Corp. (b) | 84,124 | 4,464,461 | |
| Xerox Holdings Corp. | 34,121 | 593,705 | |
| 20,825,048 | |||
| TOTAL INFORMATION TECHNOLOGY | 470,684,870 | ||
| MATERIALS - 4.1% | |||
| Chemicals - 2.0% | |||
| Air Products & Chemicals, Inc. | 59,639 | 13,959,701 | |
| Albemarle Corp. U.S. | 31,332 | 6,041,750 | |
| Ashland Global Holdings, Inc. | 13,855 | 1,454,359 | |
| Axalta Coating Systems Ltd. (b) | 45,136 | 1,145,100 | |
| Celanese Corp. Class A | 18,675 | 2,744,105 | |
| CF Industries Holdings, Inc. | 57,626 | 5,579,926 | |
| Corteva, Inc. | 196,776 | 11,352,007 | |
| Diversey Holdings Ltd. (b) | 5,088 | 39,381 | |
| Dow, Inc. | 184,291 | 12,255,352 | |
| DuPont de Nemours, Inc. | 138,496 | 9,131,041 | |
| Eastman Chemical Co. | 36,093 | 3,705,668 | |
| Ecolab, Inc. | 8,283 | 1,402,643 | |
| Element Solutions, Inc. | 62,256 | 1,283,719 | |
| FMC Corp. | 25,514 | 3,381,626 | |
| Huntsman Corp. | 55,927 | 1,894,247 | |
| International Flavors & Fragrances, Inc. | 68,683 | 8,331,248 | |
| LyondellBasell Industries NV Class A | 61,417 | 6,512,045 | |
| NewMarket Corp. | 1,708 | 554,434 | |
| Olin Corp. | 35,292 | 2,025,761 | |
| PPG Industries, Inc. | 36,889 | 4,721,423 | |
| RPM International, Inc. (a) | 14,292 | 1,184,807 | |
| The Chemours Co. LLC | 20,764 | 686,665 | |
| The Mosaic Co. | 100,025 | 6,243,561 | |
| Valvoline, Inc. | 48,728 | 1,473,047 | |
| Westlake Corp. | 7,136 | 903,061 | |
| 108,006,677 | |||
| Construction Materials - 0.3% | |||
| Eagle Materials, Inc. | 10,408 | 1,283,515 | |
| Martin Marietta Materials, Inc. | 16,764 | 5,938,144 | |
| Vulcan Materials Co. | 35,647 | 6,141,622 | |
| 13,363,281 | |||
| Containers & Packaging - 0.7% | |||
| Amcor PLC | 407,779 | 4,836,259 | |
| Aptargroup, Inc. | 17,716 | 2,034,328 | |
| Ardagh Group SA | 4,009 | 57,349 | |
| Ardagh Metal Packaging SA (a) | 19,893 | 141,837 | |
| Avery Dennison Corp. | 10,448 | 1,886,909 | |
| Ball Corp. | 60,193 | 4,885,264 | |
| Berry Global Group, Inc. (b) | 36,428 | 2,052,718 | |
| Crown Holdings, Inc. | 29,060 | 3,197,762 | |
| Graphic Packaging Holding Co. | 54,534 | 1,188,841 | |
| International Paper Co. | 104,289 | 4,826,495 | |
| Packaging Corp. of America | 25,262 | 4,071,477 | |
| Sealed Air Corp. | 18,241 | 1,171,255 | |
| Silgan Holdings, Inc. | 22,531 | 999,700 | |
| Sonoco Products Co. | 26,467 | 1,638,572 | |
| WestRock Co. | 70,082 | 3,471,161 | |
| 36,459,927 | |||
| Metals & Mining - 1.1% | |||
| Alcoa Corp. | 49,614 | 3,363,829 | |
| Cleveland-Cliffs, Inc. (b) | 120,291 | 3,066,218 | |
| Freeport-McMoRan, Inc. | 278,980 | 11,312,639 | |
| Newmont Corp. | 216,218 | 15,751,481 | |
| Nucor Corp. | 73,425 | 11,364,722 | |
| Reliance Steel & Aluminum Co. | 16,790 | 3,328,618 | |
| Royal Gold, Inc. | 17,667 | 2,305,190 | |
| Southern Copper Corp. | 1,984 | 123,544 | |
| Steel Dynamics, Inc. | 41,300 | 3,541,475 | |
| United States Steel Corp. | 69,754 | 2,126,799 | |
| 56,284,515 | |||
| Paper & Forest Products - 0.0% | |||
| Louisiana-Pacific Corp. | 21,871 | 1,411,117 | |
| Sylvamo Corp. (b) | 9,618 | 429,444 | |
| 1,840,561 | |||
| TOTAL MATERIALS | 215,954,961 | ||
| REAL ESTATE - 5.0% | |||
| Equity Real Estate Investment Trusts (REITs) - 4.8% | |||
| Alexandria Real Estate Equities, Inc. | 44,884 | 8,176,069 | |
| American Campus Communities, Inc. | 36,912 | 2,387,099 | |
| American Homes 4 Rent Class A | 79,344 | 3,142,816 | |
| Americold Realty Trust | 71,951 | 1,898,067 | |
| Apartment Income (REIT) Corp. | 42,133 | 2,071,680 | |
| AvalonBay Communities, Inc. | 37,579 | 8,548,471 | |
| Boston Properties, Inc. | 42,079 | 4,948,490 | |
| Brixmor Property Group, Inc. | 79,832 | 2,026,136 | |
| Camden Property Trust (SBI) | 26,636 | 4,178,922 | |
| Cousins Properties, Inc. | 39,876 | 1,431,548 | |
| CubeSmart | 58,749 | 2,791,165 | |
| Digital Realty Trust, Inc. | 75,662 | 11,055,731 | |
| Douglas Emmett, Inc. | 44,764 | 1,318,747 | |
| Duke Realty Corp. | 102,472 | 5,610,342 | |
| EPR Properties | 19,912 | 1,045,778 | |
| Equinix, Inc. | 6,991 | 5,027,088 | |
| Equity Lifestyle Properties, Inc. | 22,535 | 1,741,505 | |
| Equity Residential (SBI) | 99,353 | 8,097,270 | |
| Essex Property Trust, Inc. | 17,468 | 5,751,688 | |
| Extra Space Storage, Inc. | 32,202 | 6,118,380 | |
| Federal Realty Investment Trust (SBI) | 21,035 | 2,462,357 | |
| First Industrial Realty Trust, Inc. | 34,688 | 2,011,904 | |
| Gaming & Leisure Properties | 62,808 | 2,787,419 | |
| Healthcare Trust of America, Inc. | 58,699 | 1,787,972 | |
| Healthpeak Properties, Inc. | 145,310 | 4,767,621 | |
| Highwoods Properties, Inc. (SBI) | 27,647 | 1,129,103 | |
| Host Hotels & Resorts, Inc. | 190,531 | 3,877,306 | |
| Hudson Pacific Properties, Inc. | 39,886 | 928,546 | |
| Invitation Homes, Inc. | 160,858 | 6,405,366 | |
| Iron Mountain, Inc. | 22,819 | 1,226,065 | |
| JBG SMITH Properties | 32,887 | 866,901 | |
| Kilroy Realty Corp. | 31,300 | 2,191,000 | |
| Kimco Realty Corp. | 156,547 | 3,965,336 | |
| Lamar Advertising Co. Class A | 2,938 | 324,385 | |
| Life Storage, Inc. | 21,955 | 2,908,818 | |
| Medical Properties Trust, Inc. | 159,273 | 2,929,030 | |
| Mid-America Apartment Communities, Inc. | 31,098 | 6,116,355 | |
| National Retail Properties, Inc. | 47,103 | 2,064,996 | |
| Omega Healthcare Investors, Inc. | 64,206 | 1,635,969 | |
| Orion Office (REIT), Inc. (a) | 15,077 | 202,333 | |
| Park Hotels & Resorts, Inc. | 63,182 | 1,245,317 | |
| Prologis (REIT), Inc. | 198,858 | 31,874,949 | |
| Public Storage | 9,592 | 3,563,428 | |
| Rayonier, Inc. | 38,242 | 1,652,054 | |
| Realty Income Corp. | 152,475 | 10,575,666 | |
| Regency Centers Corp. | 45,511 | 3,132,522 | |
| Rexford Industrial Realty, Inc. | 43,298 | 3,378,976 | |
| SBA Communications Corp. Class A | 24,325 | 8,443,451 | |
| Simon Property Group, Inc. | 11,502 | 1,357,236 | |
| SL Green Realty Corp. | 18,208 | 1,260,358 | |
| Spirit Realty Capital, Inc. | 34,256 | 1,488,423 | |
| Store Capital Corp. | 65,900 | 1,873,537 | |
| Sun Communities, Inc. | 30,873 | 5,420,373 | |
| UDR, Inc. | 85,309 | 4,539,292 | |
| Ventas, Inc. | 107,414 | 5,966,848 | |
| VICI Properties, Inc. | 227,024 | 6,767,585 | |
| Vornado Realty Trust | 47,332 | 1,832,222 | |
| Welltower, Inc. | 117,391 | 10,660,277 | |
| Weyerhaeuser Co. | 201,974 | 8,325,368 | |
| WP Carey, Inc. | 50,946 | 4,114,908 | |
| 255,428,564 | |||
| Real Estate Management & Development - 0.2% | |||
| CBRE Group, Inc. | 85,244 | 7,078,662 | |
| Howard Hughes Corp. (b) | 11,163 | 1,119,537 | |
| Jones Lang LaSalle, Inc. (b) | 13,614 | 2,977,790 | |
| Opendoor Technologies, Inc. (a)(b) | 98,013 | 685,111 | |
| 11,861,100 | |||
| TOTAL REAL ESTATE | 267,289,664 | ||
| UTILITIES - 5.5% | |||
| Electric Utilities - 3.4% | |||
| Alliant Energy Corp. | 67,442 | 3,966,264 | |
| American Electric Power Co., Inc. | 134,975 | 13,377,372 | |
| Avangrid, Inc. (a) | 15,364 | 681,393 | |
| Constellation Energy Corp. | 87,756 | 5,196,033 | |
| Duke Energy Corp. | 207,585 | 22,867,564 | |
| Edison International | 100,531 | 6,915,527 | |
| Entergy Corp. | 54,026 | 6,420,990 | |
| Evergy, Inc. | 61,642 | 4,182,410 | |
| Eversource Energy | 92,538 | 8,087,821 | |
| Exelon Corp. | 263,269 | 12,315,724 | |
| FirstEnergy Corp. | 146,648 | 6,351,325 | |
| Hawaiian Electric Industries, Inc. | 28,370 | 1,166,291 | |
| IDACORP, Inc. | 13,544 | 1,424,558 | |
| NextEra Energy, Inc. | 529,111 | 37,577,463 | |
| NRG Energy, Inc. | 35,748 | 1,283,353 | |
| OGE Energy Corp. | 53,816 | 2,081,603 | |
| PG&E Corp. (b) | 536,175 | 6,782,614 | |
| Pinnacle West Capital Corp. | 30,393 | 2,163,982 | |
| PPL Corp. | 202,720 | 5,739,003 | |
| Southern Co. | 285,361 | 20,942,644 | |
| Xcel Energy, Inc. | 145,157 | 10,634,202 | |
| 180,158,136 | |||
| Gas Utilities - 0.1% | |||
| Atmos Energy Corp. | 36,119 | 4,095,895 | |
| National Fuel Gas Co. | 23,544 | 1,651,141 | |
| UGI Corp. | 56,098 | 1,924,161 | |
| 7,671,197 | |||
| Independent Power and Renewable Electricity Producers - 0.2% | |||
| Brookfield Renewable Corp. | 25,739 | 924,030 | |
| The AES Corp. | 178,021 | 3,635,189 | |
| Vistra Corp. | 129,074 | 3,229,431 | |
| 7,788,650 | |||
| Multi-Utilities - 1.6% | |||
| Ameren Corp. | 68,619 | 6,374,705 | |
| CenterPoint Energy, Inc. | 159,970 | 4,896,682 | |
| CMS Energy Corp. | 77,906 | 5,351,363 | |
| Consolidated Edison, Inc. | 95,442 | 8,851,291 | |
| Dominion Energy, Inc. | 217,296 | 17,740,045 | |
| DTE Energy Co. | 52,024 | 6,817,225 | |
| NiSource, Inc. | 105,565 | 3,074,053 | |
| Public Service Enterprise Group, Inc. | 135,973 | 9,471,879 | |
| Sempra Energy | 86,231 | 13,914,234 | |
| WEC Energy Group, Inc. | 85,076 | 8,511,854 | |
| 85,003,331 | |||
| Water Utilities - 0.2% | |||
| American Water Works Co., Inc. | 48,946 | 7,541,600 | |
| Essential Utilities, Inc. | 62,151 | 2,781,879 | |
| 10,323,479 | |||
| TOTAL UTILITIES | 290,944,793 | ||
| TOTAL COMMON STOCKS | |||
| (Cost $4,620,144,477) | 5,285,304,563 | ||
| Principal Amount | Value | ||
| U.S. Treasury Obligations - 0.0% | |||
| U.S. Treasury Bills, yield at date of purchase 1.15% 1/26/23 (c) | |||
| (Cost $991,454) | 1,000,000 | 987,866 | |
| Shares | Value | ||
| Money Market Funds - 1.0% | |||
| Fidelity Cash Central Fund 0.32% (d) | 8,582,493 | $8,584,209 | |
| Fidelity Securities Lending Cash Central Fund 0.32% (d)(e) | 45,142,507 | 45,147,021 | |
| TOTAL MONEY MARKET FUNDS | |||
| (Cost $53,731,230) | 53,731,230 | ||
| TOTAL INVESTMENT IN SECURITIES - 100.6% | |||
| (Cost $4,674,867,161) | 5,340,023,659 | ||
| NET OTHER ASSETS (LIABILITIES) - (0.6)% | (32,431,046) | ||
| NET ASSETS - 100% | $5,307,592,613 |
| Futures Contracts | |||||
| Number of contracts | Expiration Date | Notional Amount | Value | Unrealized Appreciation/(Depreciation) | |
| Purchased | |||||
| Equity Index Contracts | |||||
| CME E-mini S&P 500 Index Contracts (United States) | 39 | June 2022 | $8,048,625 | $(105,947) | $(105,947) |
| CME E-mini S&P MidCap 400 Index Contracts (United States) | 35 | June 2022 | 8,732,850 | (143,769) | (143,769) |
| TOTAL FUTURES CONTRACTS | $(249,716) |
The notional amount of futures purchased as a percentage of Net Assets is 0.3%
For the period, the average monthly notional amount at value for futures contracts in the aggregate was $18,657,391.
Legend
(a) Security or a portion of the security is on loan at period end.
(b) Non-income producing
(c) Security or a portion of the security was pledged to cover margin requirements for futures contracts. At period end, the value of securities pledged amounted to $624,332.
(d) Affiliated fund that is generally available only to investment companies and other accounts managed by Fidelity Investments. The rate quoted is the annualized seven-day yield of the fund at period end. A complete unaudited listing of the fund's holdings as of its most recent quarter end is available upon request. In addition, each Fidelity Central Fund's financial statements, which are not covered by the Fund's Report of Independent Registered Public Accounting Firm, are available on the SEC's website or upon request.
(e) Investment made with cash collateral received from securities on loan.
Affiliated Central Funds
Fiscal year to date information regarding the Fund's investments in Fidelity Central Funds, including the ownership percentage, is presented below.
| Fund | Value, beginning of period | Purchases | Sales Proceeds | Dividend Income | Realized Gain/Loss | Change in Unrealized appreciation (depreciation) | Value, end of period | % ownership, end of period |
| Fidelity Cash Central Fund 0.32% | $12,693,118 | $1,550,521,750 | $1,554,630,659 | $20,353 | $-- | $-- | $8,584,209 | 0.0% |
| Fidelity Securities Lending Cash Central Fund 0.32% | 26,980,229 | 294,312,858 | 276,146,066 | 94,927 | -- | -- | 45,147,021 | 0.1% |
| Total | $39,673,347 | $1,844,834,608 | $1,830,776,725 | $115,280 | $-- | $-- | $53,731,230 |
Amounts in the income column in the above table include any capital gain distributions from underlying funds, which are presented in the corresponding line-item in the Statement of Operations, if applicable. Amount for Fidelity Securities Lending Cash Central Fund represents the income earned on investing cash collateral, less rebates paid to borrowers and any lending agent fees associated with the loan, plus any premium payments received for lending certain types of securities.
Investment Valuation
The following is a summary of the inputs used, as of April 30, 2022, involving the Fund's assets and liabilities carried at fair value. The inputs or methodology used for valuing securities may not be an indication of the risk associated with investing in those securities. For more information on valuation inputs, and their aggregation into the levels used below, please refer to the Investment Valuation section in the accompanying Notes to Financial Statements.
| Valuation Inputs at Reporting Date: | ||||
| Description | Total | Level 1 | Level 2 | Level 3 |
| Investments in Securities: | ||||
| Equities: | ||||
| Communication Services | $354,074,216 | $354,074,216 | $-- | $-- |
| Consumer Discretionary | 269,897,022 | 269,897,022 | -- | -- |
| Consumer Staples | 427,914,019 | 427,914,019 | -- | -- |
| Energy | 392,503,907 | 392,503,907 | -- | -- |
| Financials | 1,046,779,194 | 1,046,779,194 | -- | -- |
| Health Care | 979,513,775 | 979,513,775 | -- | -- |
| Industrials | 569,748,142 | 569,748,142 | -- | -- |
| Information Technology | 470,684,870 | 470,684,870 | -- | -- |
| Materials | 215,954,961 | 215,954,961 | -- | -- |
| Real Estate | 267,289,664 | 267,289,664 | -- | -- |
| Utilities | 290,944,793 | 290,944,793 | -- | -- |
| U.S. Government and Government Agency Obligations | 987,866 | -- | 987,866 | -- |
| Money Market Funds | 53,731,230 | 53,731,230 | -- | -- |
| Total Investments in Securities: | $5,340,023,659 | $5,339,035,793 | $987,866 | $-- |
| Derivative Instruments: | ||||
| Liabilities | ||||
| Futures Contracts | $(249,716) | $(249,716) | $-- | $-- |
| Total Liabilities | $(249,716) | $(249,716) | $-- | $-- |
| Total Derivative Instruments: | $(249,716) | $(249,716) | $-- | $-- |
Value of Derivative Instruments
The following table is a summary of the Fund's value of derivative instruments by primary risk exposure as of April 30, 2022. For additional information on derivative instruments, please refer to the Derivative Instruments section in the accompanying Notes to Financial Statements.
| Primary Risk Exposure / Derivative Type | Value | |
| Asset | Liability | |
| Equity Risk | ||
| Futures Contracts(a) | $0 | $(249,716) |
| Total Equity Risk | 0 | (249,716) |
| Total Value of Derivatives | $0 | $(249,716) |
(a) Reflects gross cumulative appreciation (depreciation) on futures contracts as presented in the Schedule of Investments. In the Statement of Assets and Liabilities, the period end daily variation margin is included in receivable or payable for daily variation margin on futures contracts, and the net cumulative appreciation (depreciation) is included in Total accumulated earnings (loss).
See accompanying notes which are an integral part of the financial statements.
Financial Statements
Statement of Assets and Liabilities
| April 30, 2022 | ||
| Assets | ||
| Investment in securities, at value (including securities loaned of $42,673,949) — See accompanying schedule: Unaffiliated issuers (cost $4,621,135,931) | $5,286,292,429 | |
| Fidelity Central Funds (cost $53,731,230) | 53,731,230 | |
| Total Investment in Securities (cost $4,674,867,161) | $5,340,023,659 | |
| Receivable for fund shares sold | 11,997,385 | |
| Dividends receivable | 5,689,675 | |
| Distributions receivable from Fidelity Central Funds | 20,882 | |
| Total assets | 5,357,731,601 | |
| Liabilities | ||
| Payable for investments purchased | $1,762,007 | |
| Payable for fund shares redeemed | 2,685,369 | |
| Accrued management fee | 158,587 | |
| Payable for daily variation margin on futures contracts | 387,181 | |
| Other payables and accrued expenses | 5 | |
| Collateral on securities loaned | 45,145,839 | |
| Total liabilities | 50,138,988 | |
| Net Assets | $5,307,592,613 | |
| Net Assets consist of: | ||
| Paid in capital | $4,694,334,293 | |
| Total accumulated earnings (loss) | 613,258,320 | |
| Net Assets | $5,307,592,613 | |
| Net Asset Value, offering price and redemption price per share ($5,307,592,613 ÷ 346,944,829 shares) | $15.30 |
See accompanying notes which are an integral part of the financial statements.
Statement of Operations
| Year ended April 30, 2022 | ||
| Investment Income | ||
| Dividends | $87,552,130 | |
| Interest | 2,062 | |
| Income from Fidelity Central Funds (including $94,927 from security lending) | 115,280 | |
| Total income | 87,669,472 | |
| Expenses | ||
| Management fee | $1,570,386 | |
| Independent trustees' fees and expenses | 12,957 | |
| Total expenses before reductions | 1,583,343 | |
| Expense reductions | (78) | |
| Total expenses after reductions | 1,583,265 | |
| Net investment income (loss) | 86,086,207 | |
| Realized and Unrealized Gain (Loss) | ||
| Net realized gain (loss) on: | ||
| Investment securities: | ||
| Unaffiliated issuers | 117,250,735 | |
| Futures contracts | (1,674,841) | |
| Total net realized gain (loss) | 115,575,894 | |
| Change in net unrealized appreciation (depreciation) on: | ||
| Investment securities: | ||
| Unaffiliated issuers | (202,815,342) | |
| Futures contracts | (933,786) | |
| Total change in net unrealized appreciation (depreciation) | (203,749,128) | |
| Net gain (loss) | (88,173,234) | |
| Net increase (decrease) in net assets resulting from operations | $(2,087,027) |
See accompanying notes which are an integral part of the financial statements.
Statement of Changes in Net Assets
| Year ended April 30, 2022 | Year ended April 30, 2021 | |
| Increase (Decrease) in Net Assets | ||
| Operations | ||
| Net investment income (loss) | $86,086,207 | $60,036,532 |
| Net realized gain (loss) | 115,575,894 | (57,463,109) |
| Change in net unrealized appreciation (depreciation) | (203,749,128) | 1,035,655,084 |
| Net increase (decrease) in net assets resulting from operations | (2,087,027) | 1,038,228,507 |
| Distributions to shareholders | (71,152,654) | (62,580,924) |
| Share transactions | ||
| Proceeds from sales of shares | 2,718,796,328 | 1,506,019,329 |
| Reinvestment of distributions | 60,657,215 | 54,429,786 |
| Cost of shares redeemed | (1,088,452,857) | (1,144,768,964) |
| Net increase (decrease) in net assets resulting from share transactions | 1,691,000,686 | 415,680,151 |
| Total increase (decrease) in net assets | 1,617,761,005 | 1,391,327,734 |
| Net Assets | ||
| Beginning of period | 3,689,831,608 | 2,298,503,874 |
| End of period | $5,307,592,613 | $3,689,831,608 |
| Other Information | ||
| Shares | ||
| Sold | 171,331,199 | 117,238,147 |
| Issued in reinvestment of distributions | 3,828,682 | 4,288,788 |
| Redeemed | (68,584,701) | (94,565,413) |
| Net increase (decrease) | 106,575,180 | 26,961,522 |
See accompanying notes which are an integral part of the financial statements.
Financial Highlights
Fidelity Large Cap Value Index Fund
| Years ended April 30, | 2022 | 2021 | 2020 | 2019 | 2018 |
| Selected Per–Share Data | |||||
| Net asset value, beginning of period | $15.35 | $10.77 | $12.58 | $11.86 | $11.29 |
| Income from Investment Operations | |||||
| Net investment income (loss)A,B | .30 | .28 | .33 | .30 | .28 |
| Net realized and unrealized gain (loss) | (.10) | 4.60 | (1.64) | .73 | .57 |
| Total from investment operations | .20 | 4.88 | (1.31) | 1.03 | .85 |
| Distributions from net investment income | (.25) | (.30) | (.28) | (.25) | (.21) |
| Distributions from net realized gain | – | – | (.22) | (.06) | (.07) |
| Total distributions | (.25) | (.30) | (.50) | (.31) | (.28) |
| Net asset value, end of period | $15.30 | $15.35 | $10.77 | $12.58 | $11.86 |
| Total ReturnC | 1.27% | 45.93% | (11.04)% | 9.15% | 7.55% |
| Ratios to Average Net AssetsB,D,E | |||||
| Expenses before reductions | .04% | .04% | .04% | .04% | .04% |
| Expenses net of fee waivers, if any | .04% | .04% | .04% | .04% | .04% |
| Expenses net of all reductions | .04% | .04% | .04% | .04% | .04% |
| Net investment income (loss) | 1.90% | 2.24% | 2.65% | 2.55% | 2.35% |
| Supplemental Data | |||||
| Net assets, end of period (000 omitted) | $5,307,593 | $3,689,832 | $2,298,504 | $2,097,991 | $355,541 |
| Portfolio turnover rateF | 16% | 31% | 27% | 15% | 12% |
A Calculated based on average shares outstanding during the period.
B Net investment income (loss) is affected by the timing of the declaration of dividends by any underlying mutual funds or exchange-traded funds (ETFs). Net investment income (loss) of any such underlying funds is not included in the Fund's net investment income (loss) ratio.
C Total returns would have been lower if certain expenses had not been reduced during the applicable periods shown.
D Fees and expenses of any underlying mutual funds or exchange-traded funds (ETFs) are not included in the Fund's expense ratio. The Fund indirectly bears its proportionate share of these expenses. For additional expense information related to investments in Fidelity Central Funds, please refer to the "Investments in Fidelity Central Funds" note found in the Notes to Financial Statements section of the most recent Annual or Semi-Annual report.
E Expense ratios reflect operating expenses of the class. Expenses before reductions do not reflect amounts reimbursed, waived, or reduced through arrangements with the investment adviser, brokerage services, or other offset arrangements, if applicable, and do not represent the amount paid by the class during periods when reimbursements, waivers or reductions occur.
F Amount does not include the portfolio activity of any underlying mutual funds or exchange-traded funds (ETFs).
See accompanying notes which are an integral part of the financial statements.
Notes to Financial Statements
For the period ended April 30, 2022
1. Organization.
Fidelity Large Cap Value Index Fund (the Fund) is a fund of Fidelity Salem Street Trust (the Trust) and is authorized to issue an unlimited number of shares. Share transactions on the Statement of Changes in Net Assets may contain exchanges between affiliated funds. The Trust is registered under the Investment Company Act of 1940, as amended (the 1940 Act), as an open-end management investment company organized as a Massachusetts business trust.
2. Investments in Fidelity Central Funds.
Funds may invest in Fidelity Central Funds, which are open-end investment companies generally available only to other investment companies and accounts managed by the investment adviser and its affiliates. The Schedule of Investments lists any Fidelity Central Funds held as an investment as of period end, but does not include the underlying holdings of each Fidelity Central Fund. An investing fund indirectly bears its proportionate share of the expenses of the underlying Fidelity Central Funds.
Based on its investment objective, each Fidelity Central Fund may invest or participate in various investment vehicles or strategies that are similar to those of the investing fund. These strategies are consistent with the investment objectives of the investing fund and may involve certain economic risks which may cause a decline in value of each of the Fidelity Central Funds and thus a decline in the value of the investing fund.
| Fidelity Central Fund | Investment Manager | Investment Objective | Investment Practices | Expense Ratio(a) |
| Fidelity Money Market Central Funds | Fidelity Management & Research Company LLC (FMR) | Each fund seeks to obtain a high level of current income consistent with the preservation of capital and liquidity. | Short-term Investments | Less than .005% |
(a) Expenses expressed as a percentage of average net assets and are as of each underlying Central Fund's most recent annual or semi-annual shareholder report.
A complete unaudited list of holdings for each Fidelity Central Fund is available upon request or at the Securities and Exchange Commission website at www.sec.gov. In addition, the financial statements of the Fidelity Central Funds which contain the significant accounting policies (including investment valuation policies) of those funds, and are not covered by the Report of Independent Registered Public Accounting Firm, are available on the Securities and Exchange Commission website or upon request.
3. Significant Accounting Policies.
The Fund is an investment company and applies the accounting and reporting guidance of the Financial Accounting Standards Board (FASB) Accounting Standards Codification Topic 946 Financial Services - Investment Companies. The financial statements have been prepared in conformity with accounting principles generally accepted in the United States of America (GAAP), which require management to make certain estimates and assumptions at the date of the financial statements. Actual results could differ from those estimates. Subsequent events, if any, through the date that the financial statements were issued have been evaluated in the preparation of the financial statements. The Fund's Schedule of Investments lists any underlying mutual funds or exchange-traded funds (ETFs) but does not include the underlying holdings of these funds. The following summarizes the significant accounting policies of the Fund:
Investment Valuation. Investments are valued as of 4:00 p.m. Eastern time on the last calendar day of the period. The Board of Trustees (the Board) has delegated the day to day responsibility for the valuation of the Fund's investments to the Fair Value Committee (the Committee) established by the Fund's investment adviser. In accordance with valuation policies and procedures approved by the Board, the Fund attempts to obtain prices from one or more third party pricing vendors or brokers to value its investments. When current market prices, quotations or currency exchange rates are not readily available or reliable, investments will be fair valued in good faith by the Committee, in accordance with procedures adopted by the Board. Factors used in determining fair value vary by investment type and may include market or investment specific events, changes in interest rates and credit quality. The frequency with which these procedures are used cannot be predicted and they may be utilized to a significant extent. The Committee oversees the Fund's valuation policies and procedures and reports to the Board on the Committee's activities and fair value determinations. The Board monitors the appropriateness of the procedures used in valuing the Fund's investments and ratifies the fair value determinations of the Committee.
The Fund categorizes the inputs to valuation techniques used to value its investments into a disclosure hierarchy consisting of three levels as shown below:
- Level 1 – unadjusted quoted prices in active markets for identical investments
- Level 2 – other significant observable inputs (including quoted prices for similar investments, interest rates, prepayment speeds, etc.)
- Level 3 – unobservable inputs (including the Fund's own assumptions based on the best information available)
Valuation techniques used to value the Fund's investments by major category are as follows:
Equity securities, including restricted securities, for which market quotations are readily available, are valued at the last reported sale price or official closing price as reported by a third party pricing vendor on the primary market or exchange on which they are traded and are categorized as Level 1 in the hierarchy. In the event there were no sales during the day or closing prices are not available, securities are valued at the last quoted bid price or may be valued using the last available price and are generally categorized as Level 2 in the hierarchy. For foreign equity securities, when market or security specific events arise, comparisons to the valuation of American Depositary Receipts (ADRs), futures contracts, Exchange-Traded Funds (ETFs) and certain indexes as well as quoted prices for similar securities may be used and would be categorized as Level 2 in the hierarchy. For equity securities, including restricted securities, where observable inputs are limited, assumptions about market activity and risk are used and these securities may be categorized as Level 3 in the hierarchy.
Debt securities, including restricted securities, are valued based on evaluated prices received from third party pricing vendors or from brokers who make markets in such securities. U.S. government and government agency obligations are valued by pricing vendors who utilize matrix pricing which considers yield or price of bonds of comparable quality, coupon, maturity and type or by broker-supplied prices. When independent prices are unavailable or unreliable, debt securities may be valued utilizing pricing methodologies which consider similar factors that would be used by third party pricing vendors. Debt securities are generally categorized as Level 2 in the hierarchy but may be Level 3 depending on the circumstances.
Futures contracts are valued at the settlement price established each day by the board of trade or exchange on which they are traded and are categorized as Level 1 in the hierarchy. Investments in open-end mutual funds, including the Fidelity Central Funds, are valued at their closing net asset value (NAV) each business day and are categorized as Level 1 in the hierarchy.
Changes in valuation techniques may result in transfers in or out of an assigned level within the disclosure hierarchy. The aggregate value of investments by input level as of April 30, 2022 is included at the end of the Fund's Schedule of Investments.
Investment Transactions and Income. For financial reporting purposes, the Fund's investment holdings and NAV include trades executed through the end of the last business day of the period. The NAV per share for processing shareholder transactions is calculated as of the close of business of the New York Stock Exchange (NYSE), normally 4:00 p.m. Eastern time and includes trades executed through the end of the prior business day. Gains and losses on securities sold are determined on the basis of identified cost and include proceeds received from litigation. Commissions paid to certain brokers with whom the investment adviser, or its affiliates, places trades on behalf of a fund include an amount in addition to trade execution, which may be rebated back to a fund. Any such rebates are included in net realized gain (loss) on investments in the Statement of Operations. Dividend income is recorded on the ex-dividend date, except for certain dividends from foreign securities where the ex-dividend date may have passed, which are recorded as soon as the Fund is informed of the ex-dividend date. Non-cash dividends included in dividend income, if any, are recorded at the fair market value of the securities received. Income and capital gain distributions from Fidelity Central Funds, if any, are recorded on the ex-dividend date. Certain distributions received by the Fund represent a return of capital or capital gain. The Fund determines the components of these distributions subsequent to the ex-dividend date, based upon receipt of tax filings or other correspondence relating to the underlying investment. These distributions are recorded as a reduction of cost of investments and/or as a realized gain. Interest income is accrued as earned and includes coupon interest and amortization of premium and accretion of discount on debt securities as applicable.
Expenses. Expenses directly attributable to a fund are charged to that fund. Expenses attributable to more than one fund are allocated among the respective funds on the basis of relative net assets or other appropriate methods. Expenses included in the accompanying financial statements reflect the expenses of that fund and do not include any expenses associated with any underlying mutual funds or exchange-traded funds. Although not included in a fund's expenses, a fund indirectly bears its proportionate share of these expenses through the net asset value of each underlying mutual fund or exchange-traded fund. Expense estimates are accrued in the period to which they relate and adjustments are made when actual amounts are known.
Income Tax Information and Distributions to Shareholders. Each year, the Fund intends to qualify as a regulated investment company under Subchapter M of the Internal Revenue Code, including distributing substantially all of its taxable income and realized gains. As a result, no provision for U.S. Federal income taxes is required. As of April 30, 2022, the Fund did not have any unrecognized tax benefits in the financial statements; nor is the Fund aware of any tax positions for which it is reasonably possible that the total amounts of unrecognized tax benefits will significantly change in the next twelve months. The Fund files a U.S. federal tax return, in addition to state and local tax returns as required. The Fund's federal income tax returns are subject to examination by the Internal Revenue Service (IRS) for a period of three fiscal years after they are filed. State and local tax returns may be subject to examination for an additional fiscal year depending on the jurisdiction.
Distributions are declared and recorded on the ex-dividend date. Income and capital gain distributions are determined in accordance with income tax regulations, which may differ from GAAP. In addition, the Fund claimed a portion of the payment made to redeeming shareholders as a distribution for income tax purposes.
Capital accounts within the financial statements are adjusted for permanent book-tax differences. These adjustments have no impact on net assets or the results of operations. Capital accounts are not adjusted for temporary book-tax differences which will reverse in a subsequent period.
Book-tax differences are primarily due to futures transactions, passive foreign investment companies (PFIC), partnerships, capital loss carryforwards and losses deferred due to wash sales.
As of period end, the cost and unrealized appreciation (depreciation) in securities, and derivatives if applicable, for federal income tax purposes were as follows:
| Gross unrealized appreciation | $941,088,265 |
| Gross unrealized depreciation | (322,131,373) |
| Net unrealized appreciation (depreciation) | $618,956,892 |
| Tax Cost | $4,721,066,767 |
The tax-based components of distributable earnings as of period end were as follows:
| Undistributed ordinary income | $24,494,317 |
| Capital loss carryforward | $(30,192,891) |
| Net unrealized appreciation (depreciation) on securities and other investments | $618,956,892 |
Capital loss carryforwards are only available to offset future capital gains of the Fund to the extent provided by regulations and may be limited. The capital loss carryforward information presented below, including any applicable limitation, is estimated as of fiscal period end and is subject to adjustment.
| No expiration | |
| Short-term | $(23,743,771) |
| Long-term | (6,449,120) |
| Total capital loss carryforward | $(30,192,891) |
The tax character of distributions paid was as follows:
| April 30, 2022 | April 30, 2021 | |
| Ordinary Income | $71,152,654 | $ 62,580,924 |
| Total | $71,152,654 | $ 62,580,924 |
4. Derivative Instruments.
Risk Exposures and the Use of Derivative Instruments. The Fund's investment objective allows the Fund to enter into various types of derivative contracts, including futures contracts. Derivatives are investments whose value is primarily derived from underlying assets, indices or reference rates and may be transacted on an exchange or over-the-counter (OTC). Derivatives may involve a future commitment to buy or sell a specified asset based on specified terms, to exchange future cash flows at periodic intervals based on a notional principal amount, or for one party to make one or more payments upon the occurrence of specified events in exchange for periodic payments from the other party.
The Fund used derivatives to increase returns and to manage exposure to certain risks as defined below. The success of any strategy involving derivatives depends on analysis of numerous economic factors, and if the strategies for investment do not work as intended, the Fund may not achieve its objectives.
The Fund's use of derivatives increased or decreased its exposure to the following risk:
| Equity Risk | Equity risk relates to the fluctuations in the value of financial instruments as a result of changes in market prices (other than those arising from interest rate risk or foreign exchange risk), whether caused by factors specific to an individual investment, its issuer, or all factors affecting all instruments traded in a market or market segment. |
The Fund is also exposed to additional risks from investing in derivatives, such as liquidity risk and counterparty credit risk. Liquidity risk is the risk that the Fund will be unable to close out the derivative in the open market in a timely manner. Counterparty credit risk is the risk that the counterparty will not be able to fulfill its obligation to the Fund. Counterparty credit risk related to exchange-traded futures contracts may be mitigated by the protection provided by the exchange on which they trade.
Investing in derivatives may involve greater risks than investing in the underlying assets directly and, to varying degrees, may involve risk of loss in excess of any initial investment and collateral received and amounts recognized in the Statement of Assets and Liabilities. In addition, there may be the risk that the change in value of the derivative contract does not correspond to the change in value of the underlying instrument.
Futures Contracts. A futures contract is an agreement between two parties to buy or sell a specified underlying instrument for a fixed price at a specified future date. The Fund used futures contracts to manage its exposure to the stock market.
Upon entering into a futures contract, a fund is required to deposit either cash or securities (initial margin) with a clearing broker in an amount equal to a certain percentage of the face value of the contract. Futures contracts are marked-to-market daily and subsequent daily payments (variation margin) are made or received by a fund depending on the daily fluctuations in the value of the futures contracts and are recorded as unrealized appreciation or (depreciation). This receivable and/or payable, if any, is included in daily variation margin on futures contracts in the Statement of Assets and Liabilities. Realized gain or (loss) is recorded upon the expiration or closing of a futures contract. The net realized gain (loss) and change in net unrealized appreciation (depreciation) on futures contracts during the period is presented in the Statement of Operations.
Any open futures contracts at period end are presented in the Schedule of Investments under the caption "Futures Contracts". The notional amount at value reflects each contract's exposure to the underlying instrument or index at period end. Securities deposited to meet initial margin requirements is presented as segregated cash with brokers for derivative instruments in the Statement of Assets and Liabilities.
5. Purchases and Sales of Investments.
Purchases and sales of securities, other than short-term securities and in-kind transactions, as applicable, are noted in the table below.
| Purchases ($) | Sales ($) | |
| Fidelity Large Cap Value Index Fund | 2,423,380,206 | 708,423,381 |
6. Fees and Other Transactions with Affiliates.
Management Fee and Expense Contract. Fidelity Management & Research Company LLC (the investment adviser) and its affiliates provide the Fund with investment management related services for which the Fund pays a monthly management fee. The management fee is based on an annual rate of .035% of the Fund's average net assets. The management fee is reduced by an amount equal to the fees and expenses paid by the Fund to the independent Trustees. Under the management contract, the investment adviser pays all other operating expenses, except the compensation of the independent Trustees and certain other expenses such as interest expense.
Under the expense contract, the investment adviser pays all other operating expenses, except the compensation of the independent Trustees, as necessary so that the total expenses do not exceed .035% of average net assets. This expense contract will remain in place through June 30, 2023.
Sub-Adviser. Geode Capital Management, LLC (Geode), serves as sub-adviser for the Fund. Geode provides discretionary investment advisory services to the Fund and is paid by the investment adviser for providing these services.
Interfund Trades. Funds may purchase from or sell securities to other Fidelity Funds under procedures adopted by the Board. The procedures have been designed to ensure these interfund trades are executed in accordance with Rule 17a-7 of the 1940 Act. Any interfund trades are included within the respective purchases and sales amounts shown in the Purchases and Sales of Investments note. During the period there were no interfund trades.
7. Committed Line of Credit.
Certain Funds participate with other funds managed by the investment adviser or an affiliate in a $4.25 billion credit facility (the "line of credit") to be utilized for temporary or emergency purposes to fund shareholder redemptions or for other short-term liquidity purposes. The commitment fees on the pro-rata portion of the line of credit are borne by the investment adviser. During the period, there were no borrowings on this line of credit.
8. Security Lending.
Funds lend portfolio securities from time to time in order to earn additional income. Lending agents are used, including National Financial Services (NFS), an affiliate of the investment adviser. Pursuant to a securities lending agreement, NFS will receive a fee, which is capped at 9.9% of a fund's daily lending revenue, for its services as lending agent. A fund may lend securities to certain qualified borrowers, including NFS. On the settlement date of the loan, a fund receives collateral (in the form of U.S. Treasury obligations, letters of credit and/or cash) against the loaned securities and maintains collateral in an amount not less than 100% of the market value of the loaned securities during the period of the loan. The market value of the loaned securities is determined at the close of business of a fund and any additional required collateral is delivered to a fund on the next business day. A fund or borrower may terminate the loan at any time, and if the borrower defaults on its obligation to return the securities loaned because of insolvency or other reasons, a fund may apply collateral received from the borrower against the obligation. A fund may experience delays and costs in recovering the securities loaned. Any cash collateral received is invested in the Fidelity Securities Lending Cash Central Fund. Any loaned securities are identified as such in the Schedule of Investments, and the value of loaned securities and cash collateral at period end, as applicable, are presented in the Statement of Assets and Liabilities. Security lending income represents the income earned on investing cash collateral, less rebates paid to borrowers and any lending agent fees associated with the loan, plus any premium payments received for lending certain types of securities. Security lending income is presented in the Statement of Operations as a component of income from Fidelity Central Funds. Affiliated security lending activity, if any, was as follows:
| Total Security Lending Fees Paid to NFS | Security Lending Income From Securities Loaned to NFS | Value of Securities Loaned to NFS at Period End | |
| Fidelity Large Cap Value Index Fund | $9,773 | $286 | $10,345 |
9. Expense Reductions.
Through arrangements with the Fund's custodian, credits realized as a result of certain uninvested cash balances were used to reduce the Fund's expenses by $78.
10. Other.
A fund's organizational documents provide former and current trustees and officers with a limited indemnification against liabilities arising in connection with the performance of their duties to the fund. In the normal course of business, a fund may also enter into contracts that provide general indemnifications. A fund's maximum exposure under these arrangements is unknown as this would be dependent on future claims that may be made against a fund. The risk of material loss from such claims is considered remote.
11. Coronavirus (COVID-19) Pandemic.
An outbreak of COVID-19 first detected in China during December 2019 has since spread globally and was declared a pandemic by the World Health Organization during March 2020. Developments that disrupt global economies and financial markets, such as the COVID-19 pandemic, may magnify factors that affect the Fund's performance.
Report of Independent Registered Public Accounting Firm
To the Board of Trustees of Fidelity Salem Street Trust and Shareholders of Fidelity Large Cap Value Index Fund
Opinion on the Financial Statements and Financial Highlights
We have audited the accompanying statement of assets and liabilities of Fidelity Large Cap Value Index Fund (the "Fund"), a fund of Fidelity Salem Street Trust, including the schedule of investments, as of April 30, 2022, the related statement of operations for the year then ended, the statement of changes in net assets for each of the two years in the period then ended, the financial highlights for each of the five years in the period then ended, and the related notes. In our opinion, the financial statements and financial highlights present fairly, in all material respects, the financial position of the Fund as of April 30, 2022, and the results of its operations for the year then ended, the changes in its net assets for each of the two years in the period then ended, and the financial highlights for each of the five years in the period then ended in conformity with accounting principles generally accepted in the United States of America.
Basis for Opinion
These financial statements and financial highlights are the responsibility of the Fund's management. Our responsibility is to express an opinion on the Fund's financial statements and financial highlights based on our audits. We are a public accounting firm registered with the Public Company Accounting Oversight Board (United States) (PCAOB) and are required to be independent with respect to the Fund in accordance with the U.S. federal securities laws and the applicable rules and regulations of the Securities and Exchange Commission and the PCAOB.
We conducted our audits in accordance with the standards of the PCAOB. Those standards require that we plan and perform the audit to obtain reasonable assurance about whether the financial statements and financial highlights are free of material misstatement, whether due to error or fraud. The Fund is not required to have, nor were we engaged to perform, an audit of its internal control over financial reporting. As part of our audits we are required to obtain an understanding of internal control over financial reporting but not for the purpose of expressing an opinion on the effectiveness of the Fund’s internal control over financial reporting. Accordingly, we express no such opinion.
Our audits included performing procedures to assess the risks of material misstatement of the financial statements and financial highlights, whether due to error or fraud, and performing procedures that respond to those risks. Such procedures included examining, on a test basis, evidence regarding the amounts and disclosures in the financial statements and financial highlights. Our audits also included evaluating the accounting principles used and significant estimates made by management, as well as evaluating the overall presentation of the financial statements and financial highlights. Our procedures included confirmation of securities owned as of April 30, 2022, by correspondence with the custodian and brokers; when replies were not received from brokers, we performed other auditing procedures. We believe that our audits provide a reasonable basis for our opinion.
/s/ Deloitte & Touche LLP
Boston, Massachusetts
June 10, 2022
We have served as the auditor of one or more of the Fidelity investment companies since 1999.
Trustees and Officers
The Trustees, Members of the Advisory Board (if any), and officers of the trust and fund, as applicable, are listed below. The Board of Trustees governs the fund and is responsible for protecting the interests of shareholders. The Trustees are experienced executives who meet periodically throughout the year to oversee the fund's activities, review contractual arrangements with companies that provide services to the fund, oversee management of the risks associated with such activities and contractual arrangements, and review the fund's performance. Except for Jonathan Chiel, each of the Trustees oversees 300 funds. Mr. Chiel oversees 190 funds.
The Trustees hold office without limit in time except that (a) any Trustee may resign; (b) any Trustee may be removed by written instrument, signed by at least two-thirds of the number of Trustees prior to such removal; (c) any Trustee who requests to be retired or who has become incapacitated by illness or injury may be retired by written instrument signed by a majority of the other Trustees; and (d) any Trustee may be removed at any special meeting of shareholders by a two-thirds vote of the outstanding voting securities of the trust. Each Trustee who is not an interested person (as defined in the 1940 Act) of the trust and the fund is referred to herein as an Independent Trustee. Each Independent Trustee shall retire not later than the last day of the calendar year in which his or her 75th birthday occurs. The Independent Trustees may waive this mandatory retirement age policy with respect to individual Trustees. Officers and Advisory Board Members hold office without limit in time, except that any officer or Advisory Board Member may resign or may be removed by a vote of a majority of the Trustees at any regular meeting or any special meeting of the Trustees. Except as indicated, each individual has held the office shown or other offices in the same company for the past five years.
The fund’s Statement of Additional Information (SAI) includes more information about the Trustees. To request a free copy, call Fidelity at 1-800-544-8544.
Experience, Skills, Attributes, and Qualifications of the Trustees. The Governance and Nominating Committee has adopted a statement of policy that describes the experience, qualifications, attributes, and skills that are necessary and desirable for potential Independent Trustee candidates (Statement of Policy). The Board believes that each Trustee satisfied at the time he or she was initially elected or appointed a Trustee, and continues to satisfy, the standards contemplated by the Statement of Policy. The Governance and Nominating Committee also engages professional search firms to help identify potential Independent Trustee candidates who have the experience, qualifications, attributes, and skills consistent with the Statement of Policy. From time to time, additional criteria based on the composition and skills of the current Independent Trustees, as well as experience or skills that may be appropriate in light of future changes to board composition, business conditions, and regulatory or other developments, have also been considered by the professional search firms and the Governance and Nominating Committee. In addition, the Board takes into account the Trustees' commitment and participation in Board and committee meetings, as well as their leadership of standing and ad hoc committees throughout their tenure.
In determining that a particular Trustee was and continues to be qualified to serve as a Trustee, the Board has considered a variety of criteria, none of which, in isolation, was controlling. The Board believes that, collectively, the Trustees have balanced and diverse experience, qualifications, attributes, and skills, which allow the Board to operate effectively in governing the fund and protecting the interests of shareholders. Information about the specific experience, skills, attributes, and qualifications of each Trustee, which in each case led to the Board's conclusion that the Trustee should serve (or continue to serve) as a trustee of the fund, is provided below.
Board Structure and Oversight Function. Abigail P. Johnson is an interested person and currently serves as Chairman. The Trustees have determined that an interested Chairman is appropriate and benefits shareholders because an interested Chairman has a personal and professional stake in the quality and continuity of services provided to the fund. Independent Trustees exercise their informed business judgment to appoint an individual of their choosing to serve as Chairman, regardless of whether the Trustee happens to be independent or a member of management. The Independent Trustees have determined that they can act independently and effectively without having an Independent Trustee serve as Chairman and that a key structural component for assuring that they are in a position to do so is for the Independent Trustees to constitute a substantial majority for the Board. The Independent Trustees also regularly meet in executive session. Michael E. Kenneally serves as Chairman of the Independent Trustees and as such (i) acts as a liaison between the Independent Trustees and management with respect to matters important to the Independent Trustees and (ii) with management prepares agendas for Board meetings.
Fidelity® funds are overseen by different Boards of Trustees. The fund's Board oversees Fidelity's investment-grade bond, money market, asset allocation and certain equity funds, and other Boards oversee Fidelity's high income and other equity funds. The asset allocation funds may invest in Fidelity® funds that are overseen by such other Boards. The use of separate Boards, each with its own committee structure, allows the Trustees of each group of Fidelity® funds to focus on the unique issues of the funds they oversee, including common research, investment, and operational issues. On occasion, the separate Boards establish joint committees to address issues of overlapping consequences for the Fidelity® funds overseen by each Board.
The Trustees operate using a system of committees to facilitate the timely and efficient consideration of all matters of importance to the Trustees, the fund, and fund shareholders and to facilitate compliance with legal and regulatory requirements and oversight of the fund's activities and associated risks. The Board, acting through its committees, has charged FMR and its affiliates with (i) identifying events or circumstances the occurrence of which could have demonstrably adverse effects on the fund's business and/or reputation; (ii) implementing processes and controls to lessen the possibility that such events or circumstances occur or to mitigate the effects of such events or circumstances if they do occur; and (iii) creating and maintaining a system designed to evaluate continuously business and market conditions in order to facilitate the identification and implementation processes described in (i) and (ii) above. Because the day-to-day operations and activities of the fund are carried out by or through FMR, its affiliates, and other service providers, the fund's exposure to risks is mitigated but not eliminated by the processes overseen by the Trustees. While each of the Board's committees has responsibility for overseeing different aspects of the fund's activities, oversight is exercised primarily through the Operations and Audit Committees. In addition, an ad hoc Board committee of Independent Trustees has worked with FMR to enhance the Board's oversight of investment and financial risks, legal and regulatory risks, technology risks, and operational risks, including the development of additional risk reporting to the Board. Appropriate personnel, including but not limited to the fund's Chief Compliance Officer (CCO), FMR's internal auditor, the independent accountants, the fund's Treasurer and portfolio management personnel, make periodic reports to the Board's committees, as appropriate, including an annual review of Fidelity's risk management program for the Fidelity® funds. The responsibilities of each standing committee, including their oversight responsibilities, are described further under "Standing Committees of the Trustees."
Interested Trustees*:
Correspondence intended for a Trustee who is an interested person may be sent to Fidelity Investments, 245 Summer Street, Boston, Massachusetts 02210.
Name, Year of Birth; Principal Occupations and Other Relevant Experience+
Jonathan Chiel (1957)
Year of Election or Appointment: 2016
Trustee
Mr. Chiel also serves as Trustee of other Fidelity® funds. Mr. Chiel is Executive Vice President and General Counsel for FMR LLC (diversified financial services company, 2012-present). Previously, Mr. Chiel served as general counsel (2004-2012) and senior vice president and deputy general counsel (2000-2004) for John Hancock Financial Services; a partner with Choate, Hall & Stewart (1996-2000) (law firm); and an Assistant United States Attorney for the United States Attorney’s Office of the District of Massachusetts (1986-95), including Chief of the Criminal Division (1993-1995). Mr. Chiel is a director on the boards of the Boston Bar Foundation and the Maimonides School.
Abigail P. Johnson (1961)
Year of Election or Appointment: 2009
Trustee
Chairman of the Board of Trustees
Ms. Johnson also serves as Trustee of other Fidelity® funds. Ms. Johnson serves as Chairman (2016-present), Chief Executive Officer (2014-present), and Director (2007-present) of FMR LLC (diversified financial services company), President of Fidelity Financial Services (2012-present) and President of Personal, Workplace and Institutional Services (2005-present). Ms. Johnson is Chairman and Director of Fidelity Management & Research Company LLC (investment adviser firm, 2011-present). Previously, Ms. Johnson served as Chairman and Director of FMR Co., Inc. (investment adviser firm, 2011-2019), Vice Chairman (2007-2016) and President (2013-2016) of FMR LLC, President and a Director of Fidelity Management & Research Company (2001-2005), a Trustee of other investment companies advised by Fidelity Management & Research Company, Fidelity Investments Money Management, Inc. (investment adviser firm), and FMR Co., Inc. (2001-2005), Senior Vice President of the Fidelity® funds (2001-2005), and managed a number of Fidelity® funds. Ms. Abigail P. Johnson and Mr. Arthur E. Johnson are not related.
Jennifer Toolin McAuliffe (1959)
Year of Election or Appointment: 2016
Trustee
Ms. McAuliffe also serves as Trustee of other Fidelity® funds and as Trustee of Fidelity Charitable (2020-present). Previously, Ms. McAuliffe served as Co-Head of Fixed Income of Fidelity Investments Limited (now known as FIL Limited (FIL)) (diversified financial services company), Director of Research for FIL’s credit and quantitative teams in London, Hong Kong and Tokyo and Director of Research for taxable and municipal bonds at Fidelity Investments Money Management, Inc. Ms. McAuliffe previously served as a member of the Advisory Board of certain Fidelity® funds (2016). Ms. McAuliffe was previously a lawyer at Ropes & Gray LLP and currently serves as director or trustee of several not-for-profit entities.
* Determined to be an “Interested Trustee” by virtue of, among other things, his or her affiliation with the trust or various entities under common control with FMR.
+ The information includes the Trustee's principal occupation during the last five years and other information relating to the experience, attributes, and skills relevant to the Trustee's qualifications to serve as a Trustee, which led to the conclusion that the Trustee should serve as a Trustee for the fund.
Independent Trustees:
Correspondence intended for an Independent Trustee may be sent to Fidelity Investments, P.O. Box 55235, Boston, Massachusetts 02205-5235.
Name, Year of Birth; Principal Occupations and Other Relevant Experience+
Elizabeth S. Acton (1951)
Year of Election or Appointment: 2013
Trustee
Ms. Acton also serves as Trustee of other Fidelity® funds. Prior to her retirement, Ms. Acton served as Executive Vice President, Finance (2011-2012), Executive Vice President, Chief Financial Officer (2002-2011) and Treasurer (2004-2005) of Comerica Incorporated (financial services). Prior to joining Comerica, Ms. Acton held a variety of positions at Ford Motor Company (1983-2002), including Vice President and Treasurer (2000-2002) and Executive Vice President and Chief Financial Officer of Ford Motor Credit Company (1998-2000). Ms. Acton currently serves as a member of the Board and Audit and Finance Committees of Beazer Homes USA, Inc. (homebuilding, 2012-present). Ms. Acton previously served as a member of the Advisory Board of certain Fidelity® funds (2013-2016).
Ann E. Dunwoody (1953)
Year of Election or Appointment: 2018
Trustee
General Dunwoody also serves as Trustee of other Fidelity® funds. General Dunwoody (United States Army, Retired) was the first woman in U.S. military history to achieve the rank of four-star general and prior to her retirement in 2012 held a variety of positions within the U.S. Army, including Commanding General, U.S. Army Material Command (2008-2012). General Dunwoody currently serves as President of First to Four LLC (leadership and mentoring services, 2012-present), a member of the Board and Nomination and Corporate Governance Committees of Kforce Inc. (professional staffing services, 2016-present) and a member of the Board of Automattic Inc. (software engineering, 2018-present). Previously, General Dunwoody served as a member of the Advisory Board and Nominating and Corporate Governance Committee of L3 Technologies, Inc. (communication, electronic, sensor and aerospace systems, 2013-2019) and a member of the Board and Audit and Sustainability and Corporate Responsibility Committees of Republic Services, Inc. (waste collection, disposal and recycling, 2013-2016). Ms. Dunwoody also serves on several boards for non-profit organizations, including as a member of the Board, Chair of the Nomination and Governance Committee and a member of the Audit Committee of Logistics Management Institute (consulting non-profit, 2012-present), a member of the Council of Trustees for the Association of the United States Army (advocacy non-profit, 2013-present), a member of the Board of Florida Institute of Technology (2015-present) and a member of the Board of ThanksUSA (military family education non-profit, 2014-present). General Dunwoody previously served as a member of the Advisory Board of certain Fidelity® funds (2018).
John Engler (1948)
Year of Election or Appointment: 2014
Trustee
Mr. Engler also serves as Trustee of other Fidelity® funds. Previously, Mr. Engler served as Governor of Michigan (1991-2003), President of the Business Roundtable (2011-2017) and interim President of Michigan State University (2018-2019). Mr. Engler currently serves as a member of the Board of Stride, Inc. (formerly K12 Inc.) (technology-based education company, 2012-present). Previously, Mr. Engler served as a member of the Board of Universal Forest Products (manufacturer and distributor of wood and wood-alternative products, 2003-2019) and Trustee of The Munder Funds (2003-2014). Mr. Engler previously served as a member of the Advisory Board of certain Fidelity® funds (2014-2016).
Robert F. Gartland (1951)
Year of Election or Appointment: 2010
Trustee
Mr. Gartland also serves as Trustee of other Fidelity® funds. Prior to his retirement, Mr. Gartland held a variety of positions at Morgan Stanley (financial services, 1979-2007), including Managing Director (1987-2007) and Chase Manhattan Bank (1975-1978). Mr. Gartland previously served as Chairman and an investor in Gartland & Mellina Group Corp. (consulting, 2009-2019), as a member of the Board of National Securities Clearing Corporation (1993-1996) and as Chairman of TradeWeb (2003-2004).
Arthur E. Johnson (1947)
Year of Election or Appointment: 2008
Trustee
Mr. Johnson also serves as Trustee of other Fidelity® funds. Prior to his retirement, Mr. Johnson served as Senior Vice President of Corporate Strategic Development of Lockheed Martin Corporation (defense contractor, 1999-2009). Mr. Johnson currently serves as a member of the Board of Booz Allen Hamilton (management consulting, 2011-present). Mr. Johnson previously served as a member of the Board of Eaton Corporation plc (diversified power management, 2009-2019) and a member of the Board of AGL Resources, Inc. (holding company, 2002-2016). Mr. Johnson previously served as Chairman (2018-2021) and Vice Chairman (2015-2018) of the Independent Trustees of certain Fidelity® funds. Mr. Arthur E. Johnson is not related to Ms. Abigail P. Johnson.
Michael E. Kenneally (1954)
Year of Election or Appointment: 2009
Trustee
Chairman of the Independent Trustees
Mr. Kenneally also serves as Trustee of other Fidelity® funds and was Vice Chairman (2018-2021) of the Independent Trustees of certain Fidelity® funds. Prior to retirement in 2005, he was Chairman and Global Chief Executive Officer of Credit Suisse Asset Management, the worldwide fund management and institutional investment business of Credit Suisse Group. Previously, Mr. Kenneally was an Executive Vice President and the Chief Investment Officer for Bank of America. In this role, he was responsible for the investment management, strategy and products delivered to the bank’s institutional, high-net-worth and retail clients. Earlier, Mr. Kenneally directed the organization’s equity and quantitative research groups. He began his career as a research analyst and then spent more than a dozen years as a portfolio manager for endowments, pension plans and mutual funds. He earned the Chartered Financial Analyst (CFA) designation in 1991.
Marie L. Knowles (1946)
Year of Election or Appointment: 2001
Trustee
Ms. Knowles also serves as Trustee of other Fidelity® funds. Prior to her retirement, Ms. Knowles held several positions at Atlantic Richfield Company (diversified energy), including Executive Vice President and Chief Financial Officer (1996-2000), Senior Vice President (1993-1996) and President of ARCO Transportation Company (pipeline and tanker operations, 1993-1996). Ms. Knowles currently serves as a member of the Board of the Santa Catalina Island Company (real estate, 2009-present), a member of the Investment Company Institute Board of Governors and a member of the Governing Council of the Independent Directors Council (2014-present). Ms. Knowles also serves as a member of the Advisory Board for the School of Engineering of the University of Southern California. Ms. Knowles previously served as a member of the Board of McKesson Corporation (healthcare service, 2002-2021). In addition, Ms. Knowles previously served as Chairman (2015-2018) and Vice Chairman (2012-2015) of the Independent Trustees of certain Fidelity® funds.
Mark A. Murray (1954)
Year of Election or Appointment: 2016
Trustee
Mr. Murray also serves as Trustee of other Fidelity® funds. Previously, Mr. Murray served as Co-Chief Executive Officer (2013-2016), President (2006-2013) and Vice Chairman (2013-2020) of Meijer, Inc. Mr. Murray serves as a member of the Board (2009-present) and Public Policy and Responsibility Committee (2009-present) and Chair of the Nuclear Review Committee (2019-present) of DTE Energy Company (diversified energy company). Mr. Murray previously served as a member of the Board of Spectrum Health (not-for-profit health system, 2015-2019) and as a member of the Board and Audit Committee and Chairman of the Nominating and Corporate Governance Committee of Universal Forest Products, Inc. (manufacturer and distributor of wood and wood-alternative products, 2004-2016). Mr. Murray also serves as a member of the Board of many community and professional organizations. Mr. Murray previously served as a member of the Advisory Board of certain Fidelity® funds (2016).
+ The information includes the Trustee's principal occupation during the last five years and other information relating to the experience, attributes, and skills relevant to the Trustee's qualifications to serve as a Trustee, which led to the conclusion that the Trustee should serve as a Trustee for the fund.
Advisory Board Members and Officers:
Correspondence intended for an officer may be sent to Fidelity Investments, 245 Summer Street, Boston, Massachusetts 02210. Officers appear below in alphabetical order.
Name, Year of Birth; Principal Occupation
Robert W. Helm (1957)
Year of Election or Appointment: 2021
Member of the Advisory Board
Mr. Helm also serves as a Member of the Advisory Board of other Fidelity® funds. Mr. Helm was formerly Deputy Chairman (2003-2020), partner (1991-2020) and an associate (1984-1991) of Dechert LLP (formerly Dechert Price & Rhoads). Mr. Helm currently serves on boards and committees of several not-for-profit organizations.
Craig S. Brown (1977)
Year of Election or Appointment: 2019
Assistant Treasurer
Mr. Brown also serves as an officer of other funds. Mr. Brown serves as Assistant Treasurer of FIMM, LLC (2021-present) and is an employee of Fidelity Investments (2013-present).
John J. Burke III (1964)
Year of Election or Appointment: 2018
Chief Financial Officer
Mr. Burke also serves as Chief Financial Officer of other funds. Mr. Burke serves as Head of Investment Operations for Fidelity Fund and Investment Operations (2018-present) and is an employee of Fidelity Investments (1998-present). Previously Mr. Burke served as head of Asset Management Investment Operations (2012-2018).
David J. Carter (1973)
Year of Election or Appointment: 2020
Assistant Secretary
Mr. Carter also serves as Assistant Secretary of other funds. Mr. Carter serves as Senior Vice President, Deputy General Counsel (2022-present) and is an employee of Fidelity Investments (2005-present).
Jonathan Davis (1968)
Year of Election or Appointment: 2010
Assistant Treasurer
Mr. Davis also serves as an officer of other funds. Mr. Davis serves as Assistant Treasurer of FIMM, LLC (2021-present), FMR Capital, Inc. (2017-present), FD Funds GP LLC (2021-present), FD Funds Holding LLC (2021-present), and FD Funds Management LLC (2021-present); and is an employee of Fidelity Investments. Previously, Mr. Davis served as Vice President and Associate General Counsel of FMR LLC (diversified financial services company, 2003-2010).
Laura M. Del Prato (1964)
Year of Election or Appointment: 2018
President and Treasurer
Ms. Del Prato also serves as an officer of other funds. Ms. Del Prato serves as Assistant Treasurer of FIMM, LLC (2021-present) and is an employee of Fidelity Investments (2017-present). Previously, Ms. Del Prato served as President and Treasurer of The North Carolina Capital Management Trust: Cash Portfolio and Term Portfolio (2018-2020). Prior to joining Fidelity Investments, Ms. Del Prato served as a Managing Director and Treasurer of the JPMorgan Mutual Funds (2014-2017). Prior to JPMorgan, Ms. Del Prato served as a partner at Cohen Fund Audit Services (accounting firm, 2012-2013) and KPMG LLP (accounting firm, 2004-2012).
Colm A. Hogan (1973)
Year of Election or Appointment: 2016
Assistant Treasurer
Mr. Hogan also serves as an officer of other funds. Mr. Hogan serves as Assistant Treasurer of FIMM, LLC (2021-present) and FMR Capital, Inc. (2017-present) and is an employee of Fidelity Investments (2005-present). Previously, Mr. Hogan served as Deputy Treasurer of certain Fidelity® funds (2016-2020) and Assistant Treasurer of certain Fidelity® funds (2016-2018).
Cynthia Lo Bessette (1969)
Year of Election or Appointment: 2019
Secretary and Chief Legal Officer (CLO)
Ms. Lo Bessette also serves as an officer of other funds. Ms. Lo Bessette serves as CLO, Secretary, and Senior Vice President of Fidelity Management & Research Company LLC (investment adviser firm, 2019-present); CLO of Fidelity Management & Research (Hong Kong) Limited, FMR Investment Management (UK) Limited, and Fidelity Management & Research (Japan) Limited (investment adviser firms, 2019-present); Secretary of FD Funds GP LLC (2021-present), FD Funds Holding LLC (2021-present), and FD Funds Management LLC (2021-present); and Assistant Secretary of FIMM, LLC (2019-present). She is a Senior Vice President and Deputy General Counsel of FMR LLC (diversified financial services company, 2019-present), and is an employee of Fidelity Investments. Previously, Ms. Lo Bessette served as CLO, Secretary, and Senior Vice President of FMR Co., Inc. (investment adviser firm, 2019); Secretary of Fidelity SelectCo, LLC and Fidelity Investments Money Management, Inc. (investment adviser firms, 2019). Prior to joining Fidelity Investments, Ms. Lo Bessette was Executive Vice President, General Counsel (2016-2019) and Senior Vice President, Deputy General Counsel (2015-2016) of OppenheimerFunds (investment management company) and Deputy Chief Legal Officer (2013-2015) of Jennison Associates LLC (investment adviser firm).
Chris Maher (1972)
Year of Election or Appointment: 2013
Assistant Treasurer
Mr. Maher also serves as an officer of other funds. Mr. Maher serves as Assistant Treasurer of FIMM, LLC (2021-present) and FMR Capital, Inc. (2017-present), and is an employee of Fidelity Investments (2008-present). Previously, Mr. Maher served as Assistant Treasurer of certain funds (2013-2020); Vice President of Asset Management Compliance (2013), Vice President of the Program Management Group of FMR (investment adviser firm, 2010-2013), and Vice President of Valuation Oversight (2008-2010).
Jamie Pagliocco (1964)
Year of Election or Appointment: 2020
Vice President
Mr. Pagliocco also serves as Vice President of other funds. Mr. Pagliocco serves as President of Fixed Income (2020-present), and is an employee of Fidelity Investments (2001-present). Previously, Mr. Pagliocco served as Co-Chief Investment Officer – Bond (2017-2020), Global Head of Bond Trading (2016-2019), and as a portfolio manager.
Kenneth B. Robins (1969)
Year of Election or Appointment: 2020
Chief Compliance Officer
Mr. Robins also serves as an officer of other funds. Mr. Robins serves as Compliance Officer of Fidelity Management & Research Company LLC (investment adviser firm, 2016-present) and is an employee of Fidelity Investments (2004-present). Previously, Mr. Robins served as Compliance Officer of FMR Co., Inc. (investment adviser firm, 2016-2019), as Executive Vice President of Fidelity Investments Money Management, Inc. (investment adviser firm, 2013-2016) and served in other fund officer roles.
Brett Segaloff (1972)
Year of Election or Appointment: 2021
Anti-Money Laundering (AML) Officer
Mr. Segaloff also serves as an AML Officer of other funds and other related entities. He is Director, Anti-Money Laundering (2007-present) of FMR LLC (diversified financial services company) and is an employee of Fidelity Investments (1996-present).
Stacie M. Smith (1974)
Year of Election or Appointment: 2013
Assistant Treasurer
Ms. Smith also serves as an officer of other funds. Ms. Smith serves as Assistant Treasurer of FIMM, LLC (2021-present) and FMR Capital, Inc. (2017-present), is an employee of Fidelity Investments (2009-present), and has served in other fund officer roles. Prior to joining Fidelity Investments, Ms. Smith served as Senior Audit Manager of Ernst & Young LLP (accounting firm, 1996-2009). Previously, Ms. Smith served as Assistant Treasurer (2013-2019) and Deputy Treasurer (2013-2016) of certain Fidelity® funds.
Jim Wegmann (1979)
Year of Election or Appointment: 2021
Deputy Treasurer
Mr. Wegmann also serves as an officer of other funds. Mr. Wegmann serves as Assistant Treasurer of FIMM, LLC (2021-present) and is an employee of Fidelity Investments (2011-present). Previously, Mr. Wegmann served as Assistant Treasurer of certain Fidelity® funds (2019-2021).
Shareholder Expense Example
As a shareholder, you incur two types of costs: (1) transaction costs, which may include sales charges (loads) on purchase payments or redemption proceeds, as applicable and (2) ongoing costs, which generally include management fees, distribution and/or service (12b-1) fees and other Fund expenses. This Example is intended to help you understand your ongoing costs (in dollars) of investing in a fund and to compare these costs with the ongoing costs of investing in other mutual funds.
The Example is based on an investment of $1,000 invested at the beginning of the period and held for the entire period (November 1, 2021 to April 30, 2022).
Actual Expenses
The first line of the accompanying table provides information about actual account values and actual expenses. You may use the information in this line, together with the amount you invested, to estimate the expenses that you paid over the period. Simply divide your account value by $1,000.00 (for example, an $8,600 account value divided by $1,000.00 = 8.6), then multiply the result by the number in the first line for a class/Fund under the heading entitled "Expenses Paid During Period" to estimate the expenses you paid on your account during this period. If any fund is a shareholder of any underlying mutual funds or exchange-traded funds (ETFs) (the Underlying Funds), such fund indirectly bears its proportional share of the expenses of the Underlying Funds in addition to the direct expenses incurred presented in the table. These fees and expenses are not included in the annualized expense ratio used to calculate the expense estimate in the table below.
Hypothetical Example for Comparison Purposes
The second line of the accompanying table provides information about hypothetical account values and hypothetical expenses based on the actual expense ratio and an assumed rate of return of 5% per year before expenses, which is not the actual return. The hypothetical account values and expenses may not be used to estimate the actual ending account balance or expenses you paid for the period. You may use this information to compare the ongoing costs of investing in the Fund and other funds. To do so, compare this 5% hypothetical example with the 5% hypothetical examples that appear in the shareholder reports of the other funds. If any fund is a shareholder of any Underlying Funds, such fund indirectly bears its proportional share of the expenses of the Underlying Funds in addition to the direct expenses as presented in the table. These fees and expenses are not included in the annualized expense ratio used to calculate the expense estimate in the table below.
Please note that the expenses shown in the table are meant to highlight your ongoing costs only and do not reflect any transaction costs. Therefore, the second line of the table is useful in comparing ongoing costs only, and will not help you determine the relative total costs of owning different funds. In addition, if these transactional costs were included, your costs would have been higher.
| Annualized Expense Ratio-A | Beginning Account Value November 1, 2021 | Ending Account Value April 30, 2022 | Expenses Paid During Period-B November 1, 2021 to April 30, 2022 |
|
| Fidelity Large Cap Value Index Fund | .04% | |||
| Actual | $1,000.00 | $960.40 | $.19 | |
| Hypothetical-C | $1,000.00 | $1,024.60 | $.20 |
A Annualized expense ratio reflects expenses net of applicable fee waivers.
B Expenses are equal to the annualized expense ratio, multiplied by the average account value over the period, multiplied by 181/ 365 (to reflect the one-half year period). The fees and expenses of any Underlying Funds are not included in each annualized expense ratio.
C 5% return per year before expenses
Distributions (Unaudited)
The dividend and capital gains distributions for the fund(s) are available on Fidelity.com or Institutional.Fidelity.com.
The fund designates 100% and 88% of the dividends distributed in June and December, respectively during the fiscal year as qualifying for the dividends–received deduction for corporate shareholders.
The fund designates 100% and 92% of the dividends distributed in June and December, respectively during the fiscal year as amounts which may be taken into account as a dividend for the purposes of the maximum rate under section 1(h)(11) of the Internal Revenue Code.
The fund designates 1% and 8% of the dividends distributed in June and December, respectively during the fiscal year as a section 199A dividend.
The fund will notify shareholders in January 2023 of amounts for use in preparing 2022 income tax returns.
Liquidity Risk Management Program
The Securities and Exchange Commission adopted Rule 22e-4 under the Investment Company Act of 1940 (the Liquidity Rule) to promote effective liquidity risk management throughout the open-end investment company industry, thereby reducing the risk that funds will be unable to meet their redemption obligations and mitigating dilution of the interests of fund shareholders.
The Fund has adopted and implemented a liquidity risk management program pursuant to the Liquidity Rule (the Program) effective December 1, 2018. The Program is reasonably designed to assess and manage the Fund’s liquidity risk and to comply with the requirements of the Liquidity Rule. The Fund’s Board of Trustees (the Board) has designated the Fund’s investment adviser as administrator of the Program. The Fidelity advisers have established a Liquidity Risk Management Committee (the LRM Committee) to manage the Program for each of the Fidelity Funds. The LRM Committee monitors the adequacy and effectiveness of implementation of the Program and on a periodic basis assesses each Fund’s liquidity risk based on a variety of factors including (1) the Fund’s investment strategy, (2) portfolio liquidity and cash flow projections during normal and reasonably foreseeable stressed conditions, (3) shareholder redemptions, (4) borrowings and other funding sources and (5) in the case of exchange-traded funds, certain additional factors including the effect of the Fund’s prices and spreads, market participants, and basket compositions on the overall liquidity of the Fund’s portfolio, as applicable.
In accordance with the Program, each of the Fund’s portfolio investments is classified into one of four liquidity categories described below based on a determination of a reasonable expectation for how long it would take to convert the investment to cash (or sell or dispose of the investment) without significantly changing its market value.
- Highly liquid investments – cash or convertible to cash within three business days or less
- Moderately liquid investments – convertible to cash in three to seven calendar days
- Less liquid investments – can be sold or disposed of, but not settled, within seven calendar days
- Illiquid investments – cannot be sold or disposed of within seven calendar days
Liquidity classification determinations take into account a variety of factors including various market, trading and investment-specific considerations, as well as market depth, and generally utilize analysis from a third-party liquidity metrics service.
The Liquidity Rule places a 15% limit on a fund’s illiquid investments and requires funds that do not primarily hold assets that are highly liquid investments to determine and maintain a minimum percentage of the fund’s net assets to be invested in highly liquid investments (highly liquid investment minimum or HLIM). The Program includes provisions reasonably designed to comply with the 15% limit on illiquid investments and for determining, periodically reviewing and complying with the HLIM requirement as applicable.
At a recent meeting of the Fund’s Board of Trustees, the LRM Committee provided a written report to the Board pertaining to the operation, adequacy, and effectiveness of implementation of the Program for the annual period from December 1, 2020 through November 30, 2021. The report concluded that the Program has been implemented and is operating effectively and is reasonably designed to assess and manage the Fund’s liquidity risk.
LC2-I-ANN-0622
1.9879609.105
Fidelity® Large Cap Growth Index Fund
April 30, 2022
Contents
To view a fund's proxy voting guidelines and proxy voting record for the 12-month period ended June 30, visit http://www.fidelity.com/proxyvotingresults or visit the Securities and Exchange Commission's (SEC) web site at http://www.sec.gov.
You may also call 1-800-544-8544 to request a free copy of the proxy voting guidelines.
The fund is not in any way connected to or sponsored, endorsed, sold or promoted by the London Stock Exchange Group plc and its group undertakings (collectively, the “LSE Group”). The LSE Group does not accept any liability whatsoever to any person arising out of the use of the fund or the underlying data.
Standard & Poor's, S&P and S&P 500 are registered service marks of The McGraw-Hill Companies, Inc. and have been licensed for use by Fidelity Distributors Corporation.
Other third-party marks appearing herein are the property of their respective owners.
All other marks appearing herein are registered or unregistered trademarks or service marks of FMR LLC or an affiliated company. © 2022 FMR LLC. All rights reserved.
This report and the financial statements contained herein are submitted for the general information of the shareholders of the Fund. This report is not authorized for distribution to prospective investors in the Fund unless preceded or accompanied by an effective prospectus.
A fund files its complete schedule of portfolio holdings with the SEC for the first and third quarters of each fiscal year on Form N-PORT. Forms N-PORT are available on the SEC’s web site at http://www.sec.gov. A fund's Forms N-PORT may be reviewed and copied at the SEC’s Public Reference Room in Washington, DC. Information regarding the operation of the SEC's Public Reference Room may be obtained by calling 1-800-SEC-0330.
For a complete list of a fund's portfolio holdings, view the most recent holdings listing, semiannual report, or annual report on Fidelity's web site at http://www.fidelity.com, http://www.institutional.fidelity.com, or http://www.401k.com, as applicable.
NOT FDIC INSURED •MAY LOSE VALUE •NO BANK GUARANTEE
Neither the Fund nor Fidelity Distributors Corporation is a bank.
Note to Shareholders:
Early in 2020, the outbreak and spread of COVID-19 emerged as a public health emergency that had a major influence on financial markets, primarily based on its impact on the global economy and corporate earnings. On March 11, 2020, the World Health Organization declared the COVID-19 outbreak a pandemic, citing sustained risk of further global spread. The pandemic prompted a number of measures to limit the spread of COVID-19, including travel and border restrictions, quarantines, and restrictions on large gatherings. In turn, these resulted in lower consumer activity, diminished demand for a wide range of products and services, disruption in manufacturing and supply chains, and – given the wide variability in outcomes regarding the outbreak – significant market uncertainty and volatility. To help stem the turmoil, the U.S. government took unprecedented action – in concert with the U.S. Federal Reserve and central banks around the world – to help support consumers, businesses, and the broader economy, and to limit disruption to the financial system.
In general, the overall impact of the pandemic lessened in 2021, amid a resilient economy and widespread distribution of three COVID-19 vaccines granted emergency use authorization from the U.S. Food and Drug Administration (FDA) early in the year. Still, the situation remains dynamic, and the extent and duration of its influence on financial markets and the economy is highly uncertain, due in part to a recent spike in cases based on highly contagious variants of the coronavirus.
Extreme events such as the COVID-19 crisis are exogenous shocks that can have significant adverse effects on mutual funds and their investments. Although multiple asset classes may be affected by market disruption, the duration and impact may not be the same for all types of assets. Fidelity is committed to helping you stay informed amid news about COVID-19 and during increased market volatility, and we continue to take extra steps to be responsive to customer needs. We encourage you to visit us online, where we offer ongoing updates, commentary, and analysis on the markets and our funds.
Performance: The Bottom Line
Average annual total return reflects the change in the value of an investment, assuming reinvestment of distributions from dividend income and capital gains (the profits earned upon the sale of securities that have grown in value, if any) and assuming a constant rate of performance each year. The hypothetical investment and the average annual total returns do not reflect the deduction of taxes that a shareholder would pay on fund distributions or the redemption of fund shares. During periods of reimbursement by Fidelity, a fund’s total return will be greater than it would be had the reimbursement not occurred. How a fund did yesterday is no guarantee of how it will do tomorrow.
Average Annual Total Returns
| For the periods ended April 30, 2022 | Past 1 year | Past 5 years | Life of fundA |
| Fidelity® Large Cap Growth Index Fund | (5.39)% | 17.23% | 17.40% |
A From June 7, 2016
$10,000 Over Life of Fund
Let's say hypothetically that $10,000 was invested in Fidelity® Large Cap Growth Index Fund on June 7, 2016, when the fund started.
The chart shows how the value of your investment would have changed, and also shows how the Russell 1000® Growth Index performed over the same period.

| Period Ending Values | ||
|
| $25,757 | Fidelity® Large Cap Growth Index Fund |
|
| $25,840 | Russell 1000® Growth Index |
Management's Discussion of Fund Performance
Market Recap: The S&P 500® index gained 0.21% for the 12 months ending April 30, 2022. After posting a strong result in 2021, large-cap stocks retreated to begin the new year amid several notable headwinds that stoked volatility, uncertainty and investor anxiety. Chief among these was the U.S. Federal Reserve’s accelerated plan to hike interest rates and aggressively wind down its balance sheet in an attempt to rein in historically high inflation. In addition, geopolitical unrest rose as Russia invaded Ukraine in late February and escalated its attack through period end. Other factors influencing stocks included surging commodity prices, rising bond yields, supply constraint and disruption, and the potential for variants of the coronavirus to upend the economy. Against this backdrop, the S&P 500® index returned -5.17% in January and -2.99% in February, falling on mixed corporate earnings, particularly among some highflying tech firms. Volatility eased in March and the index gained 3.71% for the month. April saw a sharp reversal, with the index returning -8.72% amid clearer signals of the Fed’s intension to tighten monetary policy and angst about the economic toll of “zero-COVID” lockdowns in China. It was the largest monthly decline for the S&P 500® since March 2020. For the full 12 months, the growth-oriented communication services (-22%) and consumer discretionary (-11%) sectors lagged most. In contrast, energy (+61%) rode a surge in commodity prices and led the market by a wide margin, followed by the defensive consumer staples (+17%) sector. Comments from the Geode Capital Management, LLC, passive equity index team: For the fiscal year ending April 30, 2022, the fund returned -5.39%, roughly in line with the -5.35% result of the benchmark Russell 1000® Growth Index. By sector, stocks in the communication services sector returned about -26% and detracted most. This group was hampered by the media & entertainment (-26%) industry. Consumer discretionary (-14%) and industrials (-7%) also hurt. In contrast, consumer staples advanced roughly 15% and contributed most. Information technology stocks also helped (+1%), benefiting from the technology hardware & equipment industry (+19%). The energy sector rose approximately 58%. Turning to individual stocks, the biggest individual detractor was Amazon.com (-28%), from the retailing category. Meta Platforms (-38%) and Netflix (-63%), from the media & entertainment industry, hurt. Other detractors from the software & services segment were PayPal (-66%) and Block (-59%). In contrast, the top contributor was Apple (+21%), from the technology hardware & equipment industry, followed by Microsoft (+11%), within the software & services group. In automobiles & components, Tesla advanced roughly 23% and Eli Lilly (+63%) from the pharmaceuticals, biotechnology & life sciences category also helped. Nvidia, within the semiconductors & semiconductor equipment industry, rose about 24% and boosted the fund.The views expressed above reflect those of the portfolio manager(s) only through the end of the period as stated on the cover of this report and do not necessarily represent the views of Fidelity or any other person in the Fidelity organization. Any such views are subject to change at any time based upon market or other conditions and Fidelity disclaims any responsibility to update such views. These views may not be relied on as investment advice and, because investment decisions for a Fidelity fund are based on numerous factors, may not be relied on as an indication of trading intent on behalf of any Fidelity fund.
Investment Summary (Unaudited)
Top Ten Stocks as of April 30, 2022
| % of fund's net assets | |
| Apple, Inc. | 12.8 |
| Microsoft Corp. | 11.0 |
| Amazon.com, Inc. | 5.7 |
| Tesla, Inc. | 3.8 |
| Alphabet, Inc. Class A | 3.1 |
| Alphabet, Inc. Class C | 2.9 |
| Meta Platforms, Inc. Class A | 2.4 |
| NVIDIA Corp. | 2.3 |
| Visa, Inc. Class A | 1.9 |
| MasterCard, Inc. Class A | 1.7 |
| 47.6 |
Market Sectors as of April 30, 2022
| % of fund's net assets | |
| Information Technology | 46.0 |
| Consumer Discretionary | 17.9 |
| Communication Services | 9.6 |
| Health Care | 9.1 |
| Industrials | 6.3 |
| Consumer Staples | 4.8 |
| Financials | 2.5 |
| Real Estate | 1.9 |
| Materials | 1.0 |
| Energy | 0.5 |
| Utilities | 0.0 |
Asset Allocation (% of fund's net assets)
| As of April 30, 2022 * | ||
| Stocks and Equity Futures | 99.9% | |
| Short-Term Investments and Net Other Assets (Liabilities) | 0.1% | |

* Foreign investments - 1.9%
Percentages shown as 0.0% may reflect amounts less than 0.05%.
Schedule of Investments April 30, 2022
Showing Percentage of Net Assets
| Common Stocks - 99.6% | |||
| Shares | Value | ||
| COMMUNICATION SERVICES - 9.6% | |||
| Entertainment - 0.7% | |||
| Live Nation Entertainment, Inc. (a) | 24,590 | $2,578,999 | |
| Madison Square Garden Sports Corp. (a) | 3,253 | 527,344 | |
| Netflix, Inc. (a) | 199,119 | 37,904,293 | |
| Playtika Holding Corp. (a) | 47,920 | 842,434 | |
| Roku, Inc. Class A (a) | 46,348 | 4,305,729 | |
| Skillz, Inc. (a)(b) | 171,370 | 351,309 | |
| Spotify Technology SA (a) | 57,123 | 5,806,553 | |
| Take-Two Interactive Software, Inc. (a) | 10,879 | 1,300,149 | |
| The Walt Disney Co. (a) | 43,702 | 4,878,454 | |
| World Wrestling Entertainment, Inc. Class A (b) | 17,466 | 1,019,840 | |
| Zynga, Inc. (a) | 229,198 | 1,895,467 | |
| 61,410,571 | |||
| Interactive Media & Services - 8.6% | |||
| Alphabet, Inc.: | |||
| Class A (a) | 118,202 | 269,759,422 | |
| Class C (a) | 110,437 | 253,931,107 | |
| Match Group, Inc. (a) | 131,216 | 10,385,746 | |
| Meta Platforms, Inc. Class A (a) | 1,061,174 | 212,733,552 | |
| Pinterest, Inc. Class A (a) | 217,686 | 4,466,917 | |
| TripAdvisor, Inc. (a)(b) | 28,984 | 744,019 | |
| Twitter, Inc. (a) | 39,882 | 1,955,016 | |
| Vimeo, Inc. (a) | 66,797 | 680,661 | |
| 754,656,440 | |||
| Media - 0.3% | |||
| Altice U.S.A., Inc. Class A (a) | 74,196 | 688,539 | |
| Cable One, Inc. | 1,365 | 1,591,863 | |
| Charter Communications, Inc. Class A (a) | 52,633 | 22,552,714 | |
| Nexstar Broadcasting Group, Inc. Class A | 1,399 | 221,630 | |
| 25,054,746 | |||
| TOTAL COMMUNICATION SERVICES | 841,121,757 | ||
| CONSUMER DISCRETIONARY - 17.9% | |||
| Auto Components - 0.0% | |||
| Aptiv PLC (a) | 22,574 | 2,401,874 | |
| QuantumScape Corp. Class A (a)(b) | 81,927 | 1,223,989 | |
| 3,625,863 | |||
| Automobiles - 3.8% | |||
| Rivian Automotive, Inc. (b) | 17,751 | 536,790 | |
| Tesla, Inc. (a) | 382,565 | 333,122,299 | |
| Thor Industries, Inc. (b) | 10,212 | 781,729 | |
| 334,440,818 | |||
| Distributors - 0.1% | |||
| Pool Corp. | 17,977 | 7,284,640 | |
| Diversified Consumer Services - 0.1% | |||
| Bright Horizons Family Solutions, Inc. (a)(b) | 22,109 | 2,525,732 | |
| Chegg, Inc. (a)(b) | 50,024 | 1,237,594 | |
| Frontdoor, Inc. (a)(b) | 26,868 | 830,490 | |
| H&R Block, Inc. (b) | 60,908 | 1,587,872 | |
| Mister Car Wash, Inc. (b) | 28,363 | 408,427 | |
| 6,590,115 | |||
| Hotels, Restaurants & Leisure - 2.4% | |||
| Booking Holdings, Inc. (a) | 18,855 | 41,675,395 | |
| Boyd Gaming Corp. (b) | 8,202 | 496,877 | |
| Caesars Entertainment, Inc. (a) | 59,068 | 3,915,027 | |
| Chipotle Mexican Grill, Inc. (a) | 12,895 | 18,770,091 | |
| Choice Hotels International, Inc. (b) | 16,022 | 2,250,450 | |
| Churchill Downs, Inc. | 16,873 | 3,424,207 | |
| Darden Restaurants, Inc. | 39,725 | 5,232,974 | |
| Domino's Pizza, Inc. | 11,372 | 3,843,736 | |
| DraftKings, Inc. Class A (a)(b) | 103,612 | 1,417,412 | |
| Expedia, Inc. (a) | 66,790 | 11,671,553 | |
| Hilton Worldwide Holdings, Inc. | 84,091 | 13,058,491 | |
| Las Vegas Sands Corp. (a) | 152,477 | 5,402,260 | |
| Marriott International, Inc. Class A | 124,561 | 22,112,069 | |
| McDonald's Corp. | 60,689 | 15,121,271 | |
| Penn National Gaming, Inc. (a) | 7,039 | 257,416 | |
| Planet Fitness, Inc. (a) | 26,268 | 2,102,228 | |
| Six Flags Entertainment Corp. (a) | 13,636 | 521,850 | |
| Starbucks Corp. | 529,111 | 39,492,845 | |
| Travel+Leisure Co. | 25,909 | 1,437,431 | |
| Vail Resorts, Inc. | 18,434 | 4,685,185 | |
| Wendy's Co. | 81,910 | 1,618,542 | |
| Wyndham Hotels & Resorts, Inc. | 26,449 | 2,326,454 | |
| Wynn Resorts Ltd. (a) | 49,228 | 3,469,589 | |
| Yum China Holdings, Inc. | 15,945 | 666,501 | |
| Yum! Brands, Inc. | 11,312 | 1,323,617 | |
| 206,293,471 | |||
| Household Durables - 0.2% | |||
| D.R. Horton, Inc. | 62,943 | 4,380,203 | |
| NVR, Inc. (a) | 955 | 4,179,281 | |
| PulteGroup, Inc. | 33,735 | 1,408,774 | |
| Tempur Sealy International, Inc. | 82,373 | 2,233,132 | |
| Toll Brothers, Inc. | 20,036 | 929,069 | |
| TopBuild Corp. (a) | 12,529 | 2,269,503 | |
| 15,399,962 | |||
| Internet & Direct Marketing Retail - 6.0% | |||
| Amazon.com, Inc. (a) | 199,510 | 495,908,041 | |
| Doordash, Inc. (a) | 59,707 | 4,861,941 | |
| eBay, Inc. | 288,049 | 14,955,504 | |
| Etsy, Inc. (a) | 58,809 | 5,480,411 | |
| Wayfair LLC Class A (a)(b) | 20,683 | 1,591,350 | |
| 522,797,247 | |||
| Leisure Products - 0.1% | |||
| Brunswick Corp. | 5,480 | 414,343 | |
| Mattel, Inc. (a) | 160,309 | 3,897,112 | |
| Peloton Interactive, Inc. Class A (a)(b) | 108,504 | 1,905,330 | |
| Polaris, Inc. | 18,855 | 1,790,094 | |
| YETI Holdings, Inc. (a)(b) | 41,111 | 2,009,095 | |
| 10,015,974 | |||
| Multiline Retail - 0.4% | |||
| Dollar General Corp. | 45,666 | 10,847,045 | |
| Nordstrom, Inc. | 43,332 | 1,113,632 | |
| Target Corp. | 98,562 | 22,536,201 | |
| 34,496,878 | |||
| Specialty Retail - 3.7% | |||
| AutoZone, Inc. (a) | 2,012 | 3,934,406 | |
| Bath & Body Works, Inc. | 62,928 | 3,328,262 | |
| Best Buy Co., Inc. | 25,766 | 2,317,136 | |
| Burlington Stores, Inc. (a) | 28,812 | 5,864,971 | |
| CarMax, Inc. (a) | 6,477 | 555,597 | |
| Carvana Co. Class A (a)(b) | 40,336 | 2,337,875 | |
| Five Below, Inc. (a) | 25,440 | 3,996,624 | |
| Floor & Decor Holdings, Inc. Class A (a) | 47,032 | 3,749,391 | |
| GameStop Corp. Class A (a)(b) | 29,569 | 3,698,195 | |
| Leslie's, Inc. (a)(b) | 64,448 | 1,263,181 | |
| Lithia Motors, Inc. Class A (sub. vtg.) | 1,199 | 339,473 | |
| Lowe's Companies, Inc. | 309,716 | 61,240,145 | |
| O'Reilly Automotive, Inc. (a) | 9,281 | 5,629,391 | |
| Petco Health & Wellness Co., Inc. (a)(b) | 1,655 | 31,875 | |
| RH (a) | 8,219 | 2,762,570 | |
| Ross Stores, Inc. | 160,752 | 16,038,227 | |
| The Home Depot, Inc. | 479,842 | 144,144,537 | |
| TJX Companies, Inc. | 547,689 | 33,562,382 | |
| Tractor Supply Co. | 51,961 | 10,467,543 | |
| Ulta Beauty, Inc. (a) | 24,044 | 9,540,659 | |
| Victoria's Secret & Co. (a) | 19,913 | 938,301 | |
| Vroom, Inc. (a)(b) | 44,165 | 68,897 | |
| Williams-Sonoma, Inc. (b) | 25,581 | 3,337,809 | |
| 319,147,447 | |||
| Textiles, Apparel & Luxury Goods - 1.1% | |||
| Columbia Sportswear Co. | 1,096 | 90,047 | |
| Deckers Outdoor Corp. (a) | 1,749 | 464,797 | |
| Hanesbrands, Inc. (b) | 95,401 | 1,265,017 | |
| lululemon athletica, Inc. (a) | 52,408 | 18,585,449 | |
| NIKE, Inc. Class B | 569,043 | 70,959,662 | |
| Skechers U.S.A., Inc. Class A (sub. vtg.) (a) | 6,762 | 258,985 | |
| Tapestry, Inc. | 12,059 | 396,982 | |
| VF Corp. | 95,178 | 4,949,256 | |
| 96,970,195 | |||
| TOTAL CONSUMER DISCRETIONARY | 1,557,062,610 | ||
| CONSUMER STAPLES - 4.8% | |||
| Beverages - 2.2% | |||
| Boston Beer Co., Inc. Class A (a)(b) | 4,578 | 1,716,750 | |
| Brown-Forman Corp.: | |||
| Class A | 9,905 | 618,270 | |
| Class B (non-vtg.) | 42,057 | 2,836,324 | |
| Monster Beverage Corp. (a) | 159,002 | 13,623,291 | |
| PepsiCo, Inc. | 526,371 | 90,383,164 | |
| The Coca-Cola Co. | 1,259,365 | 81,367,573 | |
| 190,545,372 | |||
| Food & Staples Retailing - 1.4% | |||
| Costco Wholesale Corp. | 189,917 | 100,982,667 | |
| Sysco Corp. | 234,262 | 20,024,716 | |
| 121,007,383 | |||
| Food Products - 0.2% | |||
| Beyond Meat, Inc. (a)(b) | 25,044 | 923,623 | |
| Darling Ingredients, Inc. (a) | 4,122 | 302,514 | |
| Freshpet, Inc. (a)(b) | 19,172 | 1,789,706 | |
| Kellogg Co. | 51,553 | 3,531,381 | |
| Lamb Weston Holdings, Inc. | 20,082 | 1,327,420 | |
| Pilgrim's Pride Corp. (a) | 8,638 | 244,887 | |
| The Hershey Co. | 57,311 | 12,939,104 | |
| 21,058,635 | |||
| Household Products - 0.4% | |||
| Church & Dwight Co., Inc. | 5,794 | 565,263 | |
| Colgate-Palmolive Co. | 203,096 | 15,648,547 | |
| Kimberly-Clark Corp. | 77,831 | 10,805,278 | |
| The Clorox Co. | 46,772 | 6,710,379 | |
| 33,729,467 | |||
| Personal Products - 0.3% | |||
| Estee Lauder Companies, Inc. Class A | 105,129 | 27,760,364 | |
| Herbalife Nutrition Ltd. (a) | 8,524 | 226,568 | |
| Olaplex Holdings, Inc. | 9,678 | 142,267 | |
| 28,129,199 | |||
| Tobacco - 0.3% | |||
| Altria Group, Inc. | 464,599 | 25,817,766 | |
| TOTAL CONSUMER STAPLES | 420,287,822 | ||
| ENERGY - 0.5% | |||
| Energy Equipment & Services - 0.0% | |||
| Halliburton Co. | 21,024 | 748,875 | |
| Oil, Gas & Consumable Fuels - 0.5% | |||
| Cheniere Energy, Inc. | 107,431 | 14,590,204 | |
| Continental Resources, Inc. | 3,070 | 170,600 | |
| Coterra Energy, Inc. | 58,951 | 1,697,199 | |
| Diamondback Energy, Inc. | 39,380 | 4,970,937 | |
| EOG Resources, Inc. | 31,767 | 3,709,115 | |
| Hess Corp. | 8,628 | 889,288 | |
| New Fortress Energy, Inc. | 12,413 | 481,376 | |
| Occidental Petroleum Corp. | 49,501 | 2,727,010 | |
| Pioneer Natural Resources Co. | 44,083 | 10,247,975 | |
| Texas Pacific Land Corp. (b) | 2,707 | 3,699,386 | |
| 43,183,090 | |||
| TOTAL ENERGY | 43,931,965 | ||
| FINANCIALS - 2.5% | |||
| Banks - 0.0% | |||
| Citizens Financial Group, Inc. | 46,217 | 1,820,950 | |
| Synovus Financial Corp. | 4,858 | 201,801 | |
| Western Alliance Bancorp. | 25,418 | 1,934,564 | |
| 3,957,315 | |||
| Capital Markets - 1.5% | |||
| Ameriprise Financial, Inc. | 28,583 | 7,588,501 | |
| Ares Management Corp. | 56,973 | 3,772,752 | |
| Blackstone, Inc. | 322,182 | 32,724,026 | |
| FactSet Research Systems, Inc. | 14,913 | 6,017,246 | |
| Goldman Sachs Group, Inc. | 9,135 | 2,790,651 | |
| LPL Financial | 36,551 | 6,866,836 | |
| MarketAxess Holdings, Inc. | 17,344 | 4,572,052 | |
| Moody's Corp. | 70,582 | 22,337,791 | |
| Morningstar, Inc. | 9,681 | 2,451,520 | |
| MSCI, Inc. | 25,785 | 10,861,931 | |
| Raymond James Financial, Inc. | 4,202 | 409,527 | |
| S&P Global, Inc. | 78,477 | 29,546,591 | |
| T. Rowe Price Group, Inc. | 35,030 | 4,310,091 | |
| 134,249,515 | |||
| Consumer Finance - 0.5% | |||
| American Express Co. | 180,058 | 31,457,933 | |
| Credit Acceptance Corp. (a)(b) | 271 | 138,888 | |
| Discover Financial Services | 72,530 | 8,156,724 | |
| Synchrony Financial | 46,492 | 1,711,371 | |
| Upstart Holdings, Inc. (a)(b) | 18,940 | 1,420,879 | |
| 42,885,795 | |||
| Diversified Financial Services - 0.1% | |||
| Apollo Global Management, Inc. | 109,163 | 5,431,951 | |
| Insurance - 0.4% | |||
| Alleghany Corp. (a) | 660 | 552,090 | |
| Aon PLC | 59,009 | 16,994,002 | |
| Arch Capital Group Ltd. (a) | 40,666 | 1,857,216 | |
| Brown & Brown, Inc. | 6,125 | 379,628 | |
| Erie Indemnity Co. Class A | 7,984 | 1,279,676 | |
| Everest Re Group Ltd. | 3,972 | 1,091,148 | |
| GoHealth, Inc. (a)(b) | 56,184 | 41,981 | |
| Lemonade, Inc. (a)(b) | 5,571 | 116,211 | |
| Lincoln National Corp. | 12,293 | 739,424 | |
| Markel Corp. (a) | 1,038 | 1,404,705 | |
| Marsh & McLennan Companies, Inc. | 27,380 | 4,427,346 | |
| RenaissanceRe Holdings Ltd. (b) | 9,018 | 1,294,263 | |
| 30,177,690 | |||
| Thrifts & Mortgage Finance - 0.0% | |||
| Rocket Companies, Inc. (b) | 64,703 | 572,622 | |
| UWM Holdings Corp. Class A (b) | 33,407 | 123,940 | |
| 696,562 | |||
| TOTAL FINANCIALS | 217,398,828 | ||
| HEALTH CARE - 9.1% | |||
| Biotechnology - 2.9% | |||
| AbbVie, Inc. | 811,514 | 119,195,176 | |
| Alnylam Pharmaceuticals, Inc. (a) | 55,184 | 7,363,201 | |
| Amgen, Inc. | 210,883 | 49,175,807 | |
| CureVac NV (a)(b) | 25,585 | 437,248 | |
| Exact Sciences Corp. (a)(b) | 74,132 | 4,080,967 | |
| Exelixis, Inc. (a) | 121,576 | 2,716,008 | |
| Horizon Therapeutics PLC (a) | 18,693 | 1,842,382 | |
| Incyte Corp. (a) | 72,801 | 5,457,163 | |
| Ionis Pharmaceuticals, Inc. (a) | 59,030 | 2,169,943 | |
| Iovance Biotherapeutics, Inc. (a) | 22,837 | 345,981 | |
| Mirati Therapeutics, Inc. (a) | 17,176 | 1,061,305 | |
| Moderna, Inc. (a) | 155,666 | 20,923,067 | |
| Natera, Inc. (a) | 37,106 | 1,303,163 | |
| Neurocrine Biosciences, Inc. (a) | 43,119 | 3,882,004 | |
| Novavax, Inc. (a)(b) | 29,691 | 1,338,173 | |
| Regeneron Pharmaceuticals, Inc. (a) | 5,010 | 3,302,141 | |
| Repligen Corp. (a) | 23,978 | 3,770,301 | |
| Sarepta Therapeutics, Inc. (a) | 38,419 | 2,778,462 | |
| Seagen, Inc. (a) | 55,476 | 7,267,911 | |
| Ultragenyx Pharmaceutical, Inc. (a)(b) | 22,740 | 1,607,491 | |
| Vertex Pharmaceuticals, Inc. (a) | 46,687 | 12,755,822 | |
| 252,773,716 | |||
| Health Care Equipment & Supplies - 2.5% | |||
| Abbott Laboratories | 398,639 | 45,245,527 | |
| Abiomed, Inc. (a) | 20,378 | 5,839,927 | |
| Align Technology, Inc. (a) | 36,276 | 10,516,775 | |
| DexCom, Inc. (a) | 44,303 | 18,101,320 | |
| Edwards Lifesciences Corp. (a) | 283,264 | 29,963,666 | |
| Figs, Inc. Class A (a) | 10,201 | 159,748 | |
| Globus Medical, Inc. (a) | 1,814 | 120,123 | |
| IDEXX Laboratories, Inc. (a) | 38,872 | 16,733,619 | |
| Insulet Corp. (a)(b) | 30,454 | 7,278,201 | |
| Intuitive Surgical, Inc. (a) | 162,874 | 38,975,748 | |
| Masimo Corp. (a) | 17,155 | 1,938,000 | |
| Novocure Ltd. (a)(b) | 47,432 | 3,632,343 | |
| Penumbra, Inc. (a)(b) | 16,023 | 2,764,929 | |
| ResMed, Inc. | 59,258 | 11,849,822 | |
| STERIS PLC | 5,283 | 1,183,656 | |
| Stryker Corp. | 68,012 | 16,408,575 | |
| Tandem Diabetes Care, Inc. (a) | 26,814 | 2,587,015 | |
| Teleflex, Inc. | 3,791 | 1,082,785 | |
| 214,381,779 | |||
| Health Care Providers & Services - 0.7% | |||
| agilon health, Inc. (a)(b) | 72,862 | 1,294,758 | |
| Amedisys, Inc. (a) | 13,225 | 1,688,171 | |
| Cardinal Health, Inc. | 75,383 | 4,375,983 | |
| Chemed Corp. | 1,789 | 879,097 | |
| DaVita HealthCare Partners, Inc. (a) | 20,422 | 2,213,132 | |
| Encompass Health Corp. | 25,661 | 1,766,247 | |
| Guardant Health, Inc. (a) | 41,563 | 2,564,437 | |
| HCA Holdings, Inc. | 112,281 | 24,089,889 | |
| McKesson Corp. | 9,906 | 3,066,997 | |
| Molina Healthcare, Inc. (a) | 4,007 | 1,255,994 | |
| Oak Street Health, Inc. (a)(b) | 42,332 | 765,786 | |
| UnitedHealth Group, Inc. | 29,646 | 15,076,473 | |
| 59,036,964 | |||
| Health Care Technology - 0.1% | |||
| Certara, Inc. (a)(b) | 30,956 | 568,043 | |
| Definitive Healthcare Corp. (b) | 5,402 | 127,757 | |
| Veeva Systems, Inc. Class A (a) | 64,188 | 11,679,007 | |
| 12,374,807 | |||
| Life Sciences Tools & Services - 1.4% | |||
| 10X Genomics, Inc. (a)(b) | 40,011 | 1,910,925 | |
| Adaptive Biotechnologies Corp. (a) | 52,990 | 437,168 | |
| Agilent Technologies, Inc. | 123,754 | 14,760,140 | |
| Avantor, Inc. (a) | 277,816 | 8,856,774 | |
| Azenta, Inc. | 27,756 | 2,080,590 | |
| Bio-Techne Corp. | 18,035 | 6,847,709 | |
| Bruker Corp. | 46,969 | 2,700,248 | |
| Charles River Laboratories International, Inc. (a) | 21,611 | 5,219,273 | |
| Danaher Corp. | 15,127 | 3,798,844 | |
| Illumina, Inc. (a) | 67,068 | 19,895,722 | |
| IQVIA Holdings, Inc. (a) | 43,295 | 9,437,877 | |
| Maravai LifeSciences Holdings, Inc. (a) | 51,308 | 1,576,695 | |
| Mettler-Toledo International, Inc. (a) | 10,360 | 13,235,211 | |
| Sotera Health Co. (a) | 44,696 | 910,904 | |
| Syneos Health, Inc. (a) | 6,267 | 458,055 | |
| Thermo Fisher Scientific, Inc. | 16,185 | 8,949,010 | |
| Waters Corp. (a) | 25,706 | 7,789,432 | |
| West Pharmaceutical Services, Inc. | 33,778 | 10,642,097 | |
| 119,506,674 | |||
| Pharmaceuticals - 1.5% | |||
| Catalent, Inc. (a) | 18,486 | 1,674,092 | |
| Eli Lilly & Co. | 307,539 | 89,841,368 | |
| Royalty Pharma PLC | 88,027 | 3,748,190 | |
| Zoetis, Inc. Class A | 206,688 | 36,635,448 | |
| 131,899,098 | |||
| TOTAL HEALTH CARE | 789,973,038 | ||
| INDUSTRIALS - 6.3% | |||
| Aerospace & Defense - 0.7% | |||
| Axon Enterprise, Inc. (a) | 29,927 | 3,357,809 | |
| BWX Technologies, Inc. | 31,521 | 1,636,570 | |
| HEICO Corp. (b) | 5,717 | 807,412 | |
| HEICO Corp. Class A | 12,761 | 1,488,443 | |
| Howmet Aerospace, Inc. | 14,079 | 480,375 | |
| Lockheed Martin Corp. | 97,542 | 42,149,849 | |
| Northrop Grumman Corp. | 5,815 | 2,555,111 | |
| Spirit AeroSystems Holdings, Inc. Class A | 14,284 | 600,499 | |
| TransDigm Group, Inc. (a) | 6,885 | 4,095,267 | |
| Virgin Galactic Holdings, Inc. (a)(b) | 80,993 | 606,638 | |
| 57,777,973 | |||
| Air Freight & Logistics - 0.9% | |||
| C.H. Robinson Worldwide, Inc. | 11,686 | 1,240,469 | |
| Expeditors International of Washington, Inc. | 56,350 | 5,582,595 | |
| FedEx Corp. | 49,225 | 9,782,977 | |
| GXO Logistics, Inc. (a) | 38,153 | 2,258,276 | |
| United Parcel Service, Inc. Class B | 332,320 | 59,810,954 | |
| 78,675,271 | |||
| Airlines - 0.2% | |||
| Delta Air Lines, Inc. (a) | 292,494 | 12,586,017 | |
| Building Products - 0.3% | |||
| Advanced Drain Systems, Inc. (b) | 28,145 | 2,883,737 | |
| Allegion PLC | 31,227 | 3,567,372 | |
| Armstrong World Industries, Inc. | 10,503 | 889,184 | |
| Carlisle Companies, Inc. | 8,882 | 2,303,636 | |
| Carrier Global Corp. | 182,844 | 6,997,440 | |
| Fortune Brands Home & Security, Inc. | 16,171 | 1,152,184 | |
| The AZEK Co., Inc. (a) | 31,083 | 660,203 | |
| Trane Technologies PLC | 51,807 | 7,247,281 | |
| Trex Co., Inc. (a)(b) | 53,625 | 3,120,439 | |
| 28,821,476 | |||
| Commercial Services & Supplies - 0.4% | |||
| Cintas Corp. | 37,412 | 14,862,291 | |
| Copart, Inc. (a) | 96,018 | 10,912,446 | |
| IAA, Inc. (a)(b) | 62,502 | 2,290,698 | |
| MSA Safety, Inc. | 4,728 | 570,622 | |
| Rollins, Inc. | 96,447 | 3,234,832 | |
| Waste Management, Inc. | 30,622 | 5,035,482 | |
| 36,906,371 | |||
| Electrical Equipment - 0.3% | |||
| Fluence Energy, Inc. (b) | 10,372 | 95,111 | |
| Generac Holdings, Inc. (a) | 28,328 | 6,214,597 | |
| Plug Power, Inc. (a)(b) | 236,788 | 4,977,284 | |
| Regal Rexnord Corp. | 6,358 | 808,992 | |
| Rockwell Automation, Inc. | 32,164 | 8,126,878 | |
| Vertiv Holdings Co. (b) | 150,612 | 1,887,168 | |
| 22,110,030 | |||
| Industrial Conglomerates - 0.2% | |||
| 3M Co. | 38,776 | 5,592,275 | |
| Honeywell International, Inc. | 68,052 | 13,168,743 | |
| 18,761,018 | |||
| Machinery - 1.6% | |||
| AGCO Corp. | 2,837 | 361,434 | |
| Allison Transmission Holdings, Inc. | 35,673 | 1,335,597 | |
| Caterpillar, Inc. | 214,378 | 45,135,144 | |
| Deere & Co. | 128,153 | 48,384,165 | |
| Donaldson Co., Inc. | 6,806 | 333,766 | |
| Graco, Inc. | 47,753 | 2,961,641 | |
| Illinois Tool Works, Inc. | 128,835 | 25,394,667 | |
| Lincoln Electric Holdings, Inc. | 26,254 | 3,537,201 | |
| Middleby Corp. (a) | 7,542 | 1,160,638 | |
| Nordson Corp. | 4,528 | 976,644 | |
| Parker Hannifin Corp. | 9,742 | 2,638,328 | |
| Toro Co. | 45,278 | 3,628,126 | |
| Xylem, Inc. | 54,023 | 4,348,852 | |
| 140,196,203 | |||
| Professional Services - 0.4% | |||
| Booz Allen Hamilton Holding Corp. Class A | 60,355 | 4,926,779 | |
| CoStar Group, Inc. (a) | 139,864 | 8,898,148 | |
| Equifax, Inc. | 21,430 | 4,361,434 | |
| LegalZoom.com, Inc. (b) | 28,058 | 402,632 | |
| Robert Half International, Inc. | 43,331 | 4,259,871 | |
| TransUnion Holding Co., Inc. | 60,115 | 5,261,265 | |
| Verisk Analytics, Inc. | 46,147 | 9,416,295 | |
| 37,526,424 | |||
| Road & Rail - 1.0% | |||
| J.B. Hunt Transport Services, Inc. | 33,990 | 5,807,192 | |
| Landstar System, Inc. | 15,476 | 2,397,232 | |
| Lyft, Inc. (a) | 136,449 | 4,448,237 | |
| Old Dominion Freight Lines, Inc. | 43,182 | 12,096,142 | |
| TuSimple Holdings, Inc. (a)(b) | 9,372 | 97,188 | |
| Uber Technologies, Inc. (a) | 636,853 | 20,048,132 | |
| Union Pacific Corp. | 186,190 | 43,622,455 | |
| XPO Logistics, Inc. (a) | 38,010 | 2,044,558 | |
| 90,561,136 | |||
| Trading Companies & Distributors - 0.3% | |||
| Core & Main, Inc. (b) | 13,063 | 310,377 | |
| Fastenal Co. | 232,211 | 12,843,590 | |
| SiteOne Landscape Supply, Inc. (a) | 10,494 | 1,479,969 | |
| United Rentals, Inc. (a) | 11,478 | 3,633,017 | |
| W.W. Grainger, Inc. | 17,403 | 8,702,022 | |
| 26,968,975 | |||
| TOTAL INDUSTRIALS | 550,890,894 | ||
| INFORMATION TECHNOLOGY - 46.0% | |||
| Communications Equipment - 0.2% | |||
| Arista Networks, Inc. (a) | 98,619 | 11,397,398 | |
| CommScope Holding Co., Inc. (a) | 99,669 | 601,004 | |
| Ubiquiti, Inc. (b) | 2,578 | 727,641 | |
| 12,726,043 | |||
| Electronic Equipment & Components - 0.6% | |||
| Amphenol Corp. Class A | 189,359 | 13,539,169 | |
| CDW Corp. | 61,952 | 10,109,327 | |
| Cognex Corp. | 78,385 | 5,301,178 | |
| Coherent, Inc. (a) | 10,008 | 2,681,143 | |
| Corning, Inc. | 118,646 | 4,175,153 | |
| IPG Photonics Corp. (a) | 1,539 | 145,405 | |
| Jabil, Inc. | 50,803 | 2,932,857 | |
| Keysight Technologies, Inc. (a) | 36,545 | 5,126,167 | |
| Vontier Corp. | 41,175 | 1,054,904 | |
| Zebra Technologies Corp. Class A (a) | 24,549 | 9,074,783 | |
| 54,140,086 | |||
| IT Services - 6.8% | |||
| Accenture PLC Class A | 234,842 | 70,537,143 | |
| Automatic Data Processing, Inc. | 177,210 | 38,663,678 | |
| Block, Inc. Class A (a) | 221,341 | 22,032,283 | |
| Broadridge Financial Solutions, Inc. | 47,801 | 6,889,558 | |
| Cloudflare, Inc. (a) | 113,614 | 9,786,710 | |
| EPAM Systems, Inc. (a) | 24,856 | 6,586,591 | |
| Euronet Worldwide, Inc. (a) | 16,539 | 2,011,969 | |
| Fiserv, Inc. (a) | 18,754 | 1,836,392 | |
| FleetCor Technologies, Inc. (a) | 8,372 | 2,088,981 | |
| Gartner, Inc. (a) | 36,611 | 10,637,326 | |
| Genpact Ltd. | 4,150 | 167,121 | |
| Globant SA (a) | 18,631 | 4,024,110 | |
| GoDaddy, Inc. (a) | 8,058 | 651,167 | |
| Jack Henry & Associates, Inc. | 8,680 | 1,645,554 | |
| MasterCard, Inc. Class A | 396,809 | 144,192,454 | |
| MongoDB, Inc. Class A (a) | 29,173 | 10,354,373 | |
| Okta, Inc. (a) | 58,341 | 6,960,665 | |
| Paychex, Inc. | 128,200 | 16,246,786 | |
| PayPal Holdings, Inc. (a) | 541,248 | 47,591,937 | |
| Sabre Corp. (a) | 148,811 | 1,558,051 | |
| Shift4 Payments, Inc. (a)(b) | 20,447 | 1,072,650 | |
| Snowflake, Inc. (a) | 87,763 | 15,046,089 | |
| StoneCo Ltd. Class A (a) | 99,759 | 939,730 | |
| Switch, Inc. Class A | 51,833 | 1,547,733 | |
| The Western Union Co. | 47,192 | 790,938 | |
| Thoughtworks Holding, Inc. (b) | 7,044 | 130,384 | |
| Twilio, Inc. Class A (a) | 22,460 | 2,511,477 | |
| Visa, Inc. Class A | 762,654 | 162,544,447 | |
| WEX, Inc. (a) | 13,854 | 2,303,089 | |
| Wix.com Ltd. (a) | 25,053 | 1,890,499 | |
| 593,239,885 | |||
| Semiconductors & Semiconductor Equipment - 7.7% | |||
| Advanced Micro Devices, Inc. (a) | 751,878 | 64,300,607 | |
| Allegro MicroSystems LLC (a) | 18,096 | 439,914 | |
| Analog Devices, Inc. | 95,467 | 14,738,195 | |
| Applied Materials, Inc. | 407,739 | 44,993,999 | |
| Broadcom, Inc. | 185,383 | 102,774,481 | |
| Enphase Energy, Inc. (a) | 59,813 | 9,653,818 | |
| Entegris, Inc. | 61,692 | 6,871,872 | |
| GlobalFoundries, Inc. (b) | 12,669 | 662,462 | |
| KLA Corp. | 69,721 | 22,259,126 | |
| Lam Research Corp. | 64,731 | 30,149,111 | |
| Microchip Technology, Inc. | 210,706 | 13,738,031 | |
| Micron Technology, Inc. | 71,372 | 4,866,857 | |
| MKS Instruments, Inc. | 21,548 | 2,456,041 | |
| Monolithic Power Systems, Inc. | 20,824 | 8,168,006 | |
| NVIDIA Corp. | 1,099,775 | 203,975,269 | |
| NXP Semiconductors NV | 37,266 | 6,368,759 | |
| onsemi (a) | 104,780 | 5,460,086 | |
| Qualcomm, Inc. | 518,632 | 72,447,704 | |
| Skyworks Solutions, Inc. | 35,824 | 4,058,859 | |
| Teradyne, Inc. | 74,936 | 7,902,751 | |
| Texas Instruments, Inc. | 262,928 | 44,763,492 | |
| Universal Display Corp. | 19,899 | 2,541,699 | |
| 673,591,139 | |||
| Software - 17.7% | |||
| Adobe, Inc. (a) | 216,803 | 85,843,148 | |
| Alteryx, Inc. Class A (a) | 27,404 | 1,759,337 | |
| Anaplan, Inc. (a) | 66,501 | 4,321,900 | |
| ANSYS, Inc. (a) | 16,791 | 4,629,111 | |
| Aspen Technology, Inc. (a) | 30,644 | 4,858,300 | |
| Atlassian Corp. PLC (a) | 64,133 | 14,419,022 | |
| Autodesk, Inc. (a) | 101,664 | 19,242,962 | |
| Avalara, Inc. (a) | 40,348 | 3,069,272 | |
| Bentley Systems, Inc. Class B (b) | 63,567 | 2,694,605 | |
| Bill.Com Holdings, Inc. (a)(b) | 43,029 | 7,345,481 | |
| C3.Ai, Inc. (a)(b) | 12,466 | 211,797 | |
| Cadence Design Systems, Inc. (a) | 126,317 | 19,054,919 | |
| CDK Global, Inc. | 8,399 | 456,990 | |
| Citrix Systems, Inc. | 20,619 | 2,063,962 | |
| Coupa Software, Inc. (a) | 28,111 | 2,425,979 | |
| Crowdstrike Holdings, Inc. (a) | 91,819 | 18,249,944 | |
| Datadog, Inc. Class A (a) | 117,125 | 14,146,358 | |
| DocuSign, Inc. (a) | 89,918 | 7,283,358 | |
| DoubleVerify Holdings, Inc. (a) | 27,419 | 596,363 | |
| Dropbox, Inc. Class A (a) | 138,278 | 3,007,547 | |
| Duck Creek Technologies, Inc. (a) | 9,733 | 155,047 | |
| Dynatrace, Inc. (a) | 88,223 | 3,384,234 | |
| Elastic NV (a) | 35,303 | 2,687,970 | |
| Everbridge, Inc. (a) | 20,007 | 862,302 | |
| Fair Isaac Corp. (a) | 11,766 | 4,394,719 | |
| Five9, Inc. (a) | 31,526 | 3,471,013 | |
| Fortinet, Inc. (a) | 61,535 | 17,784,230 | |
| HubSpot, Inc. (a) | 20,867 | 7,917,566 | |
| Informatica, Inc. (b) | 11,604 | 225,814 | |
| Intuit, Inc. | 122,152 | 51,151,150 | |
| Jamf Holding Corp. (a)(b) | 21,028 | 647,662 | |
| Mandiant, Inc. (a) | 32,690 | 718,526 | |
| Manhattan Associates, Inc. (a) | 15,460 | 2,018,303 | |
| Microsoft Corp. | 3,463,971 | 961,321,232 | |
| nCino, Inc. (a)(b) | 26,927 | 1,009,493 | |
| NCR Corp. (a) | 20,095 | 703,928 | |
| New Relic, Inc. (a) | 24,696 | 1,562,516 | |
| NortonLifeLock, Inc. | 67,623 | 1,693,280 | |
| Nutanix, Inc. Class A (a) | 98,806 | 2,473,114 | |
| Oracle Corp. | 690,387 | 50,674,406 | |
| Palantir Technologies, Inc. (a) | 708,413 | 7,367,495 | |
| Palo Alto Networks, Inc. (a) | 44,431 | 24,938,232 | |
| Paycom Software, Inc. (a) | 22,633 | 6,370,511 | |
| Paycor HCM, Inc. (b) | 15,613 | 384,548 | |
| Paylocity Holding Corp. (a) | 18,358 | 3,481,228 | |
| Pegasystems, Inc. | 18,201 | 1,394,015 | |
| Procore Technologies, Inc. (a) | 20,747 | 1,150,836 | |
| PTC, Inc. (a) | 48,574 | 5,547,637 | |
| RingCentral, Inc. (a) | 38,158 | 3,237,706 | |
| Salesforce.com, Inc. (a) | 83,062 | 14,613,928 | |
| ServiceNow, Inc. (a) | 91,964 | 43,967,988 | |
| Smartsheet, Inc. (a) | 56,800 | 2,745,144 | |
| Splunk, Inc. (a) | 73,108 | 8,920,638 | |
| Synopsys, Inc. (a) | 44,241 | 12,687,876 | |
| Teradata Corp. (a) | 42,393 | 1,752,951 | |
| The Trade Desk, Inc. (a) | 199,910 | 11,778,697 | |
| Tyler Technologies, Inc. (a) | 15,990 | 6,311,413 | |
| Unity Software, Inc. (a)(b) | 69,733 | 4,630,969 | |
| VMware, Inc. Class A | 37,943 | 4,099,362 | |
| Workday, Inc. Class A (a) | 88,483 | 18,289,436 | |
| Zendesk, Inc. (a) | 55,732 | 6,801,533 | |
| Zoom Video Communications, Inc. Class A (a) | 88,275 | 8,789,542 | |
| Zscaler, Inc. (a) | 36,518 | 7,403,659 | |
| 1,537,202,204 | |||
| Technology Hardware, Storage & Peripherals - 13.0% | |||
| Apple, Inc. | 7,094,190 | 1,118,399,042 | |
| Dell Technologies, Inc. | 60,646 | 2,850,968 | |
| HP, Inc. | 173,660 | 6,361,166 | |
| NetApp, Inc. | 67,451 | 4,940,786 | |
| Pure Storage, Inc. Class A (a) | 116,903 | 3,425,258 | |
| 1,135,977,220 | |||
| TOTAL INFORMATION TECHNOLOGY | 4,006,876,577 | ||
| MATERIALS - 1.0% | |||
| Chemicals - 0.8% | |||
| Axalta Coating Systems Ltd. (a) | 16,229 | 411,730 | |
| Celanese Corp. Class A | 18,212 | 2,676,071 | |
| Diversey Holdings Ltd. (a) | 28,134 | 217,757 | |
| Dow, Inc. | 24,052 | 1,599,458 | |
| Ecolab, Inc. | 100,474 | 17,014,267 | |
| FMC Corp. | 14,715 | 1,950,326 | |
| LyondellBasell Industries NV Class A | 14,712 | 1,559,913 | |
| Olin Corp. | 4,925 | 282,695 | |
| PPG Industries, Inc. | 45,893 | 5,873,845 | |
| RPM International, Inc. (b) | 34,219 | 2,836,755 | |
| Sherwin-Williams Co. | 110,473 | 30,375,656 | |
| The Chemours Co. LLC | 37,096 | 1,226,765 | |
| The Scotts Miracle-Gro Co. Class A (b) | 19,139 | 1,989,116 | |
| Westlake Corp. | 3,021 | 382,308 | |
| 68,396,662 | |||
| Containers & Packaging - 0.1% | |||
| Avery Dennison Corp. | 20,262 | 3,659,317 | |
| Ball Corp. | 42,935 | 3,484,605 | |
| Crown Holdings, Inc. | 6,930 | 762,577 | |
| Graphic Packaging Holding Co. | 35,668 | 777,562 | |
| Sealed Air Corp. | 36,936 | 2,371,661 | |
| 11,055,722 | |||
| Metals & Mining - 0.1% | |||
| Freeport-McMoRan, Inc. | 196,416 | 7,964,669 | |
| Southern Copper Corp. (b) | 35,124 | 2,187,171 | |
| Steel Dynamics, Inc. | 16,197 | 1,388,893 | |
| 11,540,733 | |||
| Paper & Forest Products - 0.0% | |||
| Louisiana-Pacific Corp. | 3,101 | 200,077 | |
| TOTAL MATERIALS | 91,193,194 | ||
| REAL ESTATE - 1.9% | |||
| Equity Real Estate Investment Trusts (REITs) - 1.8% | |||
| American Tower Corp. | 207,408 | 49,989,476 | |
| Crown Castle International Corp. | 198,260 | 36,719,735 | |
| Equinix, Inc. | 29,200 | 20,997,136 | |
| Equity Lifestyle Properties, Inc. | 42,757 | 3,304,261 | |
| Extra Space Storage, Inc. | 5,245 | 996,550 | |
| Iron Mountain, Inc. | 91,882 | 4,936,820 | |
| Lamar Advertising Co. Class A | 34,411 | 3,799,319 | |
| Public Storage | 52,636 | 19,554,274 | |
| SBA Communications Corp. Class A | 8,328 | 2,890,732 | |
| Simon Property Group, Inc. | 129,981 | 15,337,758 | |
| 158,526,061 | |||
| Real Estate Management & Development - 0.1% | |||
| CBRE Group, Inc. | 7,988 | 663,324 | |
| Opendoor Technologies, Inc. (a)(b) | 49,067 | 342,978 | |
| Zillow Group, Inc.: | |||
| Class A (a) | 30,375 | 1,173,994 | |
| Class C (a)(b) | 75,592 | 3,010,073 | |
| 5,190,369 | |||
| TOTAL REAL ESTATE | 163,716,430 | ||
| UTILITIES - 0.0% | |||
| Electric Utilities - 0.0% | |||
| NRG Energy, Inc. | 51,685 | 1,855,492 | |
| Independent Power and Renewable Electricity Producers - 0.0% | |||
| Brookfield Renewable Corp. | 14,470 | 519,473 | |
| TOTAL UTILITIES | 2,374,965 | ||
| TOTAL COMMON STOCKS | |||
| (Cost $6,770,919,701) | 8,684,828,080 | ||
| Principal Amount | Value | ||
| U.S. Treasury Obligations - 0.0% | |||
| U.S. Treasury Bills, yield at date of purchase 1.15% 1/26/23 (c) | |||
| (Cost $1,982,907) | 2,000,000 | 1,975,733 | |
| Shares | Value | ||
| Money Market Funds - 1.8% | |||
| Fidelity Cash Central Fund 0.32% (d) | 74,777,098 | $74,792,053 | |
| Fidelity Securities Lending Cash Central Fund 0.32% (d)(e) | 84,477,623 | 84,486,071 | |
| TOTAL MONEY MARKET FUNDS | |||
| (Cost $159,278,124) | 159,278,124 | ||
| TOTAL INVESTMENT IN SECURITIES - 101.4% | |||
| (Cost $6,932,180,732) | 8,846,081,937 | ||
| NET OTHER ASSETS (LIABILITIES) - (1.4)% | (125,228,384) | ||
| NET ASSETS - 100% | $8,720,853,553 |
| Futures Contracts | |||||
| Number of contracts | Expiration Date | Notional Amount | Value | Unrealized Appreciation/(Depreciation) | |
| Purchased | |||||
| Equity Index Contracts | |||||
| CME E-mini NASDAQ 100 Index Contracts (United States) | 82 | June 2022 | $21,077,280 | $(254,981) | $(254,981) |
| CME E-mini S&P 500 Index Contracts (United States) | 32 | June 2022 | 6,604,000 | (70,025) | (70,025) |
| TOTAL FUTURES CONTRACTS | $(325,006) |
The notional amount of futures purchased as a percentage of Net Assets is 0.3%
Legend
(a) Non-income producing
(b) Security or a portion of the security is on loan at period end.
(c) Security or a portion of the security was pledged to cover margin requirements for futures contracts. At period end, the value of securities pledged amounted to $1,975,733.
(d) Affiliated fund that is generally available only to investment companies and other accounts managed by Fidelity Investments. The rate quoted is the annualized seven-day yield of the fund at period end. A complete unaudited listing of the fund's holdings as of its most recent quarter end is available upon request. In addition, each Fidelity Central Fund's financial statements, which are not covered by the Fund's Report of Independent Registered Public Accounting Firm, are available on the SEC's website or upon request.
(e) Investment made with cash collateral received from securities on loan.
Affiliated Central Funds
Fiscal year to date information regarding the Fund's investments in Fidelity Central Funds, including the ownership percentage, is presented below.
| Fund | Value, beginning of period | Purchases | Sales Proceeds | Dividend Income | Realized Gain/Loss | Change in Unrealized appreciation (depreciation) | Value, end of period | % ownership, end of period |
| Fidelity Cash Central Fund 0.32% | $40,923,061 | $2,003,250,886 | $1,969,381,894 | $39,318 | $-- | $-- | $74,792,053 | 0.1% |
| Fidelity Securities Lending Cash Central Fund 0.32% | 56,797,224 | 673,732,859 | 646,044,012 | 268,348 | -- | -- | 84,486,071 | 0.2% |
| Total | $97,720,285 | $2,676,983,745 | $2,615,425,906 | $307,666 | $-- | $-- | $159,278,124 |
Amounts in the income column in the above table include any capital gain distributions from underlying funds, which are presented in the corresponding line-item in the Statement of Operations, if applicable. Amount for Fidelity Securities Lending Cash Central Fund represents the income earned on investing cash collateral, less rebates paid to borrowers and any lending agent fees associated with the loan, plus any premium payments received for lending certain types of securities.
Investment Valuation
The following is a summary of the inputs used, as of April 30, 2022, involving the Fund's assets and liabilities carried at fair value. The inputs or methodology used for valuing securities may not be an indication of the risk associated with investing in those securities. For more information on valuation inputs, and their aggregation into the levels used below, please refer to the Investment Valuation section in the accompanying Notes to Financial Statements.
| Valuation Inputs at Reporting Date: | ||||
| Description | Total | Level 1 | Level 2 | Level 3 |
| Investments in Securities: | ||||
| Equities: | ||||
| Communication Services | $841,121,757 | $841,121,757 | $-- | $-- |
| Consumer Discretionary | 1,557,062,610 | 1,557,062,610 | -- | -- |
| Consumer Staples | 420,287,822 | 420,287,822 | -- | -- |
| Energy | 43,931,965 | 43,931,965 | -- | -- |
| Financials | 217,398,828 | 217,398,828 | -- | -- |
| Health Care | 789,973,038 | 789,973,038 | -- | -- |
| Industrials | 550,890,894 | 550,890,894 | -- | -- |
| Information Technology | 4,006,876,577 | 4,006,876,577 | -- | -- |
| Materials | 91,193,194 | 91,193,194 | -- | -- |
| Real Estate | 163,716,430 | 163,716,430 | -- | -- |
| Utilities | 2,374,965 | 2,374,965 | -- | -- |
| U.S. Government and Government Agency Obligations | 1,975,733 | -- | 1,975,733 | -- |
| Money Market Funds | 159,278,124 | 159,278,124 | -- | -- |
| Total Investments in Securities: | $8,846,081,937 | $8,844,106,204 | $1,975,733 | $-- |
| Derivative Instruments: | ||||
| Liabilities | ||||
| Futures Contracts | $(325,006) | $(325,006) | $-- | $-- |
| Total Liabilities | $(325,006) | $(325,006) | $-- | $-- |
| Total Derivative Instruments: | $(325,006) | $(325,006) | $-- | $-- |
Value of Derivative Instruments
The following table is a summary of the Fund's value of derivative instruments by primary risk exposure as of April 30, 2022. For additional information on derivative instruments, please refer to the Derivative Instruments section in the accompanying Notes to Financial Statements.
| Primary Risk Exposure / Derivative Type | Value | |
| Asset | Liability | |
| Equity Risk | ||
| Futures Contracts(a) | $0 | $(325,006) |
| Total Equity Risk | 0 | (325,006) |
| Total Value of Derivatives | $0 | $(325,006) |
(a) Reflects gross cumulative appreciation (depreciation) on futures contracts as presented in the Schedule of Investments. In the Statement of Assets and Liabilities, the period end daily variation margin is included in receivable or payable for daily variation margin on futures contracts, and the net cumulative appreciation (depreciation) is included in Total accumulated earnings (loss).
See accompanying notes which are an integral part of the financial statements.
Financial Statements
Statement of Assets and Liabilities
| April 30, 2022 | ||
| Assets | ||
| Investment in securities, at value (including securities loaned of $79,809,305) — See accompanying schedule: Unaffiliated issuers (cost $6,772,902,608) | $8,686,803,813 | |
| Fidelity Central Funds (cost $159,278,124) | 159,278,124 | |
| Total Investment in Securities (cost $6,932,180,732) | $8,846,081,937 | |
| Segregated cash with brokers for derivative instruments | 1,728,068 | |
| Receivable for investments sold | 5,833,718 | |
| Receivable for fund shares sold | 18,334,389 | |
| Dividends receivable | 3,530,885 | |
| Distributions receivable from Fidelity Central Funds | 51,442 | |
| Other receivables | 49 | |
| Total assets | 8,875,560,488 | |
| Liabilities | ||
| Payable for investments purchased | $59,898,167 | |
| Payable for fund shares redeemed | 7,104,212 | |
| Accrued management fee | 270,777 | |
| Payable for daily variation margin on futures contracts | 2,942,043 | |
| Other payables and accrued expenses | 41 | |
| Collateral on securities loaned | 84,491,695 | |
| Total liabilities | 154,706,935 | |
| Net Assets | $8,720,853,553 | |
| Net Assets consist of: | ||
| Paid in capital | $6,849,298,731 | |
| Total accumulated earnings (loss) | 1,871,554,822 | |
| Net Assets | $8,720,853,553 | |
| Net Asset Value, offering price and redemption price per share ($8,720,853,553 ÷ 367,932,472 shares) | $23.70 |
See accompanying notes which are an integral part of the financial statements.
Statement of Operations
| Year ended April 30, 2022 | ||
| Investment Income | ||
| Dividends | $64,535,503 | |
| Interest | 3,996 | |
| Income from Fidelity Central Funds (including $268,348 from security lending) | 307,666 | |
| Total income | 64,847,165 | |
| Expenses | ||
| Management fee | $3,063,269 | |
| Independent trustees' fees and expenses | 25,647 | |
| Total expenses before reductions | 3,088,916 | |
| Expense reductions | (88) | |
| Total expenses after reductions | 3,088,828 | |
| Net investment income (loss) | 61,758,337 | |
| Realized and Unrealized Gain (Loss) | ||
| Net realized gain (loss) on: | ||
| Investment securities: | ||
| Unaffiliated issuers | 151,466,875 | |
| Futures contracts | (2,677,281) | |
| Total net realized gain (loss) | 148,789,594 | |
| Change in net unrealized appreciation (depreciation) on: | ||
| Investment securities: | ||
| Unaffiliated issuers | (856,932,833) | |
| Futures contracts | (2,285,332) | |
| Total change in net unrealized appreciation (depreciation) | (859,218,165) | |
| Net gain (loss) | (710,428,571) | |
| Net increase (decrease) in net assets resulting from operations | $(648,670,234) |
See accompanying notes which are an integral part of the financial statements.
Statement of Changes in Net Assets
| Year ended April 30, 2022 | Year ended April 30, 2021 | |
| Increase (Decrease) in Net Assets | ||
| Operations | ||
| Net investment income (loss) | $61,758,337 | $46,191,944 |
| Net realized gain (loss) | 148,789,594 | 73,813,180 |
| Change in net unrealized appreciation (depreciation) | (859,218,165) | 2,076,095,983 |
| Net increase (decrease) in net assets resulting from operations | (648,670,234) | 2,196,101,107 |
| Distributions to shareholders | (215,358,076) | (105,606,913) |
| Share transactions | ||
| Proceeds from sales of shares | 4,609,400,972 | 3,333,287,751 |
| Reinvestment of distributions | 195,646,382 | 96,443,522 |
| Cost of shares redeemed | (2,341,538,817) | (2,441,343,798) |
| Net increase (decrease) in net assets resulting from share transactions | 2,463,508,537 | 988,387,475 |
| Total increase (decrease) in net assets | 1,599,480,227 | 3,078,881,669 |
| Net Assets | ||
| Beginning of period | 7,121,373,326 | 4,042,491,657 |
| End of period | $8,720,853,553 | $7,121,373,326 |
| Other Information | ||
| Shares | ||
| Sold | 170,017,284 | 152,304,192 |
| Issued in reinvestment of distributions | 6,861,958 | 4,500,812 |
| Redeemed | (86,833,277) | (112,947,643) |
| Net increase (decrease) | 90,045,965 | 43,857,361 |
See accompanying notes which are an integral part of the financial statements.
Financial Highlights
Fidelity Large Cap Growth Index Fund
| Years ended April 30, | 2022 | 2021 | 2020 | 2019 | 2018 |
| Selected Per–Share Data | |||||
| Net asset value, beginning of period | $25.63 | $17.27 | $15.75 | $13.62 | $11.60 |
| Income from Investment Operations | |||||
| Net investment income (loss)A,B | .19 | .18 | .20 | .19 | .18 |
| Net realized and unrealized gain (loss) | (1.46) | 8.60 | 1.50 | 2.13 | 2.00 |
| Total from investment operations | (1.27) | 8.78 | 1.70 | 2.32 | 2.18 |
| Distributions from net investment income | (.16) | (.18) | (.17) | (.15) | (.13) |
| Distributions from net realized gain | (.50) | (.24) | (.01) | (.04) | (.03) |
| Total distributions | (.66) | (.42) | (.18) | (.19) | (.16) |
| Net asset value, end of period | $23.70 | $25.63 | $17.27 | $15.75 | $13.62 |
| Total ReturnC | (5.39)% | 51.34% | 10.84% | 17.34% | 18.89% |
| Ratios to Average Net AssetsB,D,E | |||||
| Expenses before reductions | .04% | .04% | .04% | .04% | .04% |
| Expenses net of fee waivers, if any | .04% | .04% | .04% | .04% | .04% |
| Expenses net of all reductions | .04% | .04% | .04% | .04% | .04% |
| Net investment income (loss) | .70% | .82% | 1.20% | 1.30% | 1.33% |
| Supplemental Data | |||||
| Net assets, end of period (000 omitted) | $8,720,854 | $7,121,373 | $4,042,492 | $2,240,759 | $141,224 |
| Portfolio turnover rateF | 14% | 21% | 15% | 14% | 24% |
A Calculated based on average shares outstanding during the period.
B Net investment income (loss) is affected by the timing of the declaration of dividends by any underlying mutual funds or exchange-traded funds (ETFs). Net investment income (loss) of any such underlying funds is not included in the Fund's net investment income (loss) ratio.
C Total returns would have been lower if certain expenses had not been reduced during the applicable periods shown.
D Fees and expenses of any underlying mutual funds or exchange-traded funds (ETFs) are not included in the Fund's expense ratio. The Fund indirectly bears its proportionate share of these expenses. For additional expense information related to investments in Fidelity Central Funds, please refer to the "Investments in Fidelity Central Funds" note found in the Notes to Financial Statements section of the most recent Annual or Semi-Annual report.
E Expense ratios reflect operating expenses of the class. Expenses before reductions do not reflect amounts reimbursed, waived, or reduced through arrangements with the investment adviser, brokerage services, or other offset arrangements, if applicable, and do not represent the amount paid by the class during periods when reimbursements, waivers or reductions occur.
F Amount does not include the portfolio activity of any underlying mutual funds or exchange-traded funds (ETFs).
See accompanying notes which are an integral part of the financial statements.
Notes to Financial Statements
For the period ended April 30, 2022
1. Organization.
Fidelity Large Cap Growth Index Fund (the Fund) is a fund of Fidelity Salem Street Trust (the Trust) and is authorized to issue an unlimited number of shares. Share transactions on the Statement of Changes in Net Assets may contain exchanges between affiliated funds. The Trust is registered under the Investment Company Act of 1940, as amended (the 1940 Act), as an open-end management investment company organized as a Massachusetts business trust. The Fund may operate as a non-diversified fund, as defined under the 1940 Act, to the approximate extent the Index is non-diversified.
2. Investments in Fidelity Central Funds.
Funds may invest in Fidelity Central Funds, which are open-end investment companies generally available only to other investment companies and accounts managed by the investment adviser and its affiliates. The Schedule of Investments lists any Fidelity Central Funds held as an investment as of period end, but does not include the underlying holdings of each Fidelity Central Fund. An investing fund indirectly bears its proportionate share of the expenses of the underlying Fidelity Central Funds.
Based on its investment objective, each Fidelity Central Fund may invest or participate in various investment vehicles or strategies that are similar to those of the investing fund. These strategies are consistent with the investment objectives of the investing fund and may involve certain economic risks which may cause a decline in value of each of the Fidelity Central Funds and thus a decline in the value of the investing fund.
| Fidelity Central Fund | Investment Manager | Investment Objective | Investment Practices | Expense Ratio(a) |
| Fidelity Money Market Central Funds | Fidelity Management & Research Company LLC (FMR) | Each fund seeks to obtain a high level of current income consistent with the preservation of capital and liquidity. | Short-term Investments | Less than .005% |
(a) Expenses expressed as a percentage of average net assets and are as of each underlying Central Fund's most recent annual or semi-annual shareholder report.
A complete unaudited list of holdings for each Fidelity Central Fund is available upon request or at the Securities and Exchange Commission website at www.sec.gov. In addition, the financial statements of the Fidelity Central Funds which contain the significant accounting policies (including investment valuation policies) of those funds, and are not covered by the Report of Independent Registered Public Accounting Firm, are available on the Securities and Exchange Commission website or upon request.
3. Significant Accounting Policies.
The Fund is an investment company and applies the accounting and reporting guidance of the Financial Accounting Standards Board (FASB) Accounting Standards Codification Topic 946 Financial Services - Investment Companies. The financial statements have been prepared in conformity with accounting principles generally accepted in the United States of America (GAAP), which require management to make certain estimates and assumptions at the date of the financial statements. Actual results could differ from those estimates. Subsequent events, if any, through the date that the financial statements were issued have been evaluated in the preparation of the financial statements. The Fund's Schedule of Investments lists any underlying mutual funds or exchange-traded funds (ETFs) but does not include the underlying holdings of these funds. The following summarizes the significant accounting policies of the Fund:
Investment Valuation. Investments are valued as of 4:00 p.m. Eastern time on the last calendar day of the period. The Board of Trustees (the Board) has delegated the day to day responsibility for the valuation of the Fund's investments to the Fair Value Committee (the Committee) established by the Fund's investment adviser. In accordance with valuation policies and procedures approved by the Board, the Fund attempts to obtain prices from one or more third party pricing vendors or brokers to value its investments. When current market prices, quotations or currency exchange rates are not readily available or reliable, investments will be fair valued in good faith by the Committee, in accordance with procedures adopted by the Board. Factors used in determining fair value vary by investment type and may include market or investment specific events, changes in interest rates and credit quality. The frequency with which these procedures are used cannot be predicted and they may be utilized to a significant extent. The Committee oversees the Fund's valuation policies and procedures and reports to the Board on the Committee's activities and fair value determinations. The Board monitors the appropriateness of the procedures used in valuing the Fund's investments and ratifies the fair value determinations of the Committee.
The Fund categorizes the inputs to valuation techniques used to value its investments into a disclosure hierarchy consisting of three levels as shown below:
- Level 1 – unadjusted quoted prices in active markets for identical investments
- Level 2 – other significant observable inputs (including quoted prices for similar investments, interest rates, prepayment speeds, etc.)
- Level 3 – unobservable inputs (including the Fund's own assumptions based on the best information available)
Valuation techniques used to value the Fund's investments by major category are as follows:
Equity securities, including restricted securities, for which market quotations are readily available, are valued at the last reported sale price or official closing price as reported by a third party pricing vendor on the primary market or exchange on which they are traded and are categorized as Level 1 in the hierarchy. In the event there were no sales during the day or closing prices are not available, securities are valued at the last quoted bid price or may be valued using the last available price and are generally categorized as Level 2 in the hierarchy. For foreign equity securities, when market or security specific events arise, comparisons to the valuation of American Depositary Receipts (ADRs), futures contracts, ETFs and certain indexes as well as quoted prices for similar securities may be used and would be categorized as Level 2 in the hierarchy. For equity securities, including restricted securities, where observable inputs are limited, assumptions about market activity and risk are used and these securities may be categorized as Level 3 in the hierarchy.
Debt securities, including restricted securities, are valued based on evaluated prices received from third party pricing vendors or from brokers who make markets in such securities. U.S. government and government agency obligations are valued by pricing vendors who utilize matrix pricing which considers yield or price of bonds of comparable quality, coupon, maturity and type or by broker-supplied prices. When independent prices are unavailable or unreliable, debt securities may be valued utilizing pricing methodologies which consider similar factors that would be used by third party pricing vendors. Debt securities are generally categorized as Level 2 in the hierarchy but may be Level 3 depending on the circumstances.
Futures contracts are valued at the settlement price established each day by the board of trade or exchange on which they are traded and are categorized as Level 1 in the hierarchy. Investments in open-end mutual funds, including the Fidelity Central Funds, are valued at their closing net asset value (NAV) each business day and are categorized as Level 1 in the hierarchy.
Changes in valuation techniques may result in transfers in or out of an assigned level within the disclosure hierarchy. The aggregate value of investments by input level as of April 30, 2022 is included at the end of the Fund's Schedule of Investments.
Investment Transactions and Income. For financial reporting purposes, the Fund's investment holdings and NAV include trades executed through the end of the last business day of the period. The NAV per share for processing shareholder transactions is calculated as of the close of business of the New York Stock Exchange (NYSE), normally 4:00 p.m. Eastern time and includes trades executed through the end of the prior business day. Gains and losses on securities sold are determined on the basis of identified cost and include proceeds received from litigation. Commissions paid to certain brokers with whom the investment adviser, or its affiliates, places trades on behalf of a fund include an amount in addition to trade execution, which may be rebated back to a fund. Any such rebates are included in net realized gain (loss) on investments in the Statement of Operations. Dividend income is recorded on the ex-dividend date, except for certain dividends from foreign securities where the ex-dividend date may have passed, which are recorded as soon as the Fund is informed of the ex-dividend date. Non-cash dividends included in dividend income, if any, are recorded at the fair market value of the securities received. Income and capital gain distributions from Fidelity Central Funds, if any, are recorded on the ex-dividend date. Certain distributions received by the Fund represent a return of capital or capital gain. The Fund determines the components of these distributions subsequent to the ex-dividend date, based upon receipt of tax filings or other correspondence relating to the underlying investment. These distributions are recorded as a reduction of cost of investments and/or as a realized gain. Interest income is accrued as earned and includes coupon interest and amortization of premium and accretion of discount on debt securities as applicable.
Expenses. Expenses directly attributable to a fund are charged to that fund. Expenses attributable to more than one fund are allocated among the respective funds on the basis of relative net assets or other appropriate methods. Expenses included in the accompanying financial statements reflect the expenses of that fund and do not include any expenses associated with any underlying mutual funds or exchange-traded funds. Although not included in a fund's expenses, a fund indirectly bears its proportionate share of these expenses through the net asset value of each underlying mutual fund or exchange-traded fund. Expense estimates are accrued in the period to which they relate and adjustments are made when actual amounts are known.
Income Tax Information and Distributions to Shareholders. Each year, the Fund intends to qualify as a regulated investment company under Subchapter M of the Internal Revenue Code, including distributing substantially all of its taxable income and realized gains. As a result, no provision for U.S. Federal income taxes is required. As of April 30, 2022, the Fund did not have any unrecognized tax benefits in the financial statements; nor is the Fund aware of any tax positions for which it is reasonably possible that the total amounts of unrecognized tax benefits will significantly change in the next twelve months. The Fund files a U.S. federal tax return, in addition to state and local tax returns as required. The Fund's federal income tax returns are subject to examination by the Internal Revenue Service (IRS) for a period of three fiscal years after they are filed. State and local tax returns may be subject to examination for an additional fiscal year depending on the jurisdiction.
Distributions are declared and recorded on the ex-dividend date. Income and capital gain distributions are determined in accordance with income tax regulations, which may differ from GAAP. In addition, the Fund claimed a portion of the payment made to redeeming shareholders as a distribution for income tax purposes.
Capital accounts within the financial statements are adjusted for permanent book-tax differences. These adjustments have no impact on net assets or the results of operations. Capital accounts are not adjusted for temporary book-tax differences which will reverse in a subsequent period.
Book-tax differences are primarily due to futures contracts, passive foreign investment companies (PFIC) and losses deferred due to wash sales and excise tax regulations.
As of period end, the cost and unrealized appreciation (depreciation) in securities, and derivatives if applicable, for federal income tax purposes were as follows:
| Gross unrealized appreciation | $2,559,246,482 |
| Gross unrealized depreciation | (684,520,198) |
| Net unrealized appreciation (depreciation) | $1,874,726,284 |
| Tax Cost | $6,971,355,653 |
The tax-based components of distributable earnings as of period end were as follows:
| Undistributed ordinary income | $14,471,364 |
| Net unrealized appreciation (depreciation) on securities and other investments | $1,874,726,284 |
The Fund intends to elect to defer to its next fiscal year $17,642,825 of capital losses recognized during the period November 1, 2021 to April 30, 2022.
The tax character of distributions paid was as follows:
| April 30, 2022 | April 30, 2021 | |
| Ordinary Income | $70,657,032 | $ 47,665,963 |
| Long-term Capital Gains | 144,701,044 | 57,940,950 |
| Total | $215,358,076 | $ 105,606,913 |
4. Derivative Instruments.
Risk Exposures and the Use of Derivative Instruments. The Fund's investment objective allows the Fund to enter into various types of derivative contracts, including futures contracts. Derivatives are investments whose value is primarily derived from underlying assets, indices or reference rates and may be transacted on an exchange or over-the-counter (OTC). Derivatives may involve a future commitment to buy or sell a specified asset based on specified terms, to exchange future cash flows at periodic intervals based on a notional principal amount, or for one party to make one or more payments upon the occurrence of specified events in exchange for periodic payments from the other party.
The Fund used derivatives to increase returns and to manage exposure to certain risks as defined below. The success of any strategy involving derivatives depends on analysis of numerous economic factors, and if the strategies for investment do not work as intended, the Fund may not achieve its objectives.
The Fund's use of derivatives increased or decreased its exposure to the following risk:
| Equity Risk | Equity risk relates to the fluctuations in the value of financial instruments as a result of changes in market prices (other than those arising from interest rate risk or foreign exchange risk), whether caused by factors specific to an individual investment, its issuer, or all factors affecting all instruments traded in a market or market segment. |
The Fund is also exposed to additional risks from investing in derivatives, such as liquidity risk and counterparty credit risk. Liquidity risk is the risk that the Fund will be unable to close out the derivative in the open market in a timely manner. Counterparty credit risk is the risk that the counterparty will not be able to fulfill its obligation to the Fund. Counterparty credit risk related to exchange-traded futures contracts may be mitigated by the protection provided by the exchange on which they trade.
Investing in derivatives may involve greater risks than investing in the underlying assets directly and, to varying degrees, may involve risk of loss in excess of any initial investment and collateral received and amounts recognized in the Statement of Assets and Liabilities. In addition, there may be the risk that the change in value of the derivative contract does not correspond to the change in value of the underlying instrument.
Futures Contracts. A futures contract is an agreement between two parties to buy or sell a specified underlying instrument for a fixed price at a specified future date. The Fund used futures contracts to manage its exposure to the stock market.
Upon entering into a futures contract, a fund is required to deposit either cash or securities (initial margin) with a clearing broker in an amount equal to a certain percentage of the face value of the contract. Futures contracts are marked-to-market daily and subsequent daily payments (variation margin) are made or received by a fund depending on the daily fluctuations in the value of the futures contracts and are recorded as unrealized appreciation or (depreciation). This receivable and/or payable, if any, is included in daily variation margin on futures contracts in the Statement of Assets and Liabilities. Realized gain or (loss) is recorded upon the expiration or closing of a futures contract. The net realized gain (loss) and change in net unrealized appreciation (depreciation) on futures contracts during the period is presented in the Statement of Operations.
Any open futures contracts at period end are presented in the Schedule of Investments under the caption "Futures Contracts". The notional amount at value reflects each contract's exposure to the underlying instrument or index at period end and is representative of volume of activity during the period. Securities deposited to meet initial margin requirements are identified in the Schedule of Investments. Cash deposited to meet initial margin requirements is presented as segregated cash with brokers for derivative instruments in the Statement of Assets and Liabilities.
5. Purchases and Sales of Investments.
Purchases and sales of securities, other than short-term securities and in-kind transactions, as applicable, are noted in the table below.
| Purchases ($) | Sales ($) | |
| Fidelity Large Cap Growth Index Fund | 3,546,293,412 | 1,205,543,852 |
6. Fees and Other Transactions with Affiliates.
Management Fee and Expense Contract. Fidelity Management & Research Company LLC (the investment adviser) and its affiliates provide the Fund with investment management related services for which the Fund pays a monthly management fee. The management fee is based on an annual rate of .035% of the Fund's average net assets. The management fee is reduced by an amount equal to the fees and expenses paid by the Fund to the independent Trustees. Under the management contract, the investment adviser pays all other operating expenses, except the compensation of the independent Trustees and certain other expenses such as interest expense.
Under the expense contract, the investment adviser pays all other operating expenses, except the compensation of the independent Trustees, as necessary so that the total expenses do not exceed .035% of average net assets. This expense contract will remain in place through June 30, 2023.
Sub-Adviser. Geode Capital Management, LLC (Geode), serves as sub-adviser for the Fund. Geode provides discretionary investment advisory services to the Fund and is paid by the investment adviser for providing these services.
Interfund Lending Program. Pursuant to an Exemptive Order issued by the Securities and Exchange Commission (the SEC), the Fund, along with other registered investment companies having management contracts with Fidelity Management & Research Company LLC (FMR), or other affiliated entities of FMR, may participate in an interfund lending program. This program provides an alternative credit facility allowing the Fund to borrow from, or lend money to, other participating affiliated funds. At period end, there were no interfund loans outstanding. Activity in this program during the period for which loans were outstanding is presented in the table below. Interest expense on borrowings is paid by the investment adviser under the Expense Contract.
| Borrower or Lender | Average Loan Balance | Weighted Average Interest Rate | |
| Fidelity Large Cap Growth Index Fund | Borrower | $15,113,000 | .32% |
Interfund Trades. Funds may purchase from or sell securities to other Fidelity Funds under procedures adopted by the Board. The procedures have been designed to ensure these interfund trades are executed in accordance with Rule 17a-7 of the 1940 Act. Any interfund trades are included within the respective purchases and sales amounts shown in the Purchases and Sales of Investments note. During the period there were no interfund trades.
7. Committed Line of Credit.
Certain Funds participate with other funds managed by the investment adviser or an affiliate in a $4.25 billion credit facility (the "line of credit") to be utilized for temporary or emergency purposes to fund shareholder redemptions or for other short-term liquidity purposes. The commitment fees on the pro-rata portion of the line of credit are borne by the investment adviser. During the period, there were no borrowings on this line of credit.
8. Security Lending.
Funds lend portfolio securities from time to time in order to earn additional income. Lending agents are used, including National Financial Services (NFS), an affiliate of the investment adviser. Pursuant to a securities lending agreement, NFS will receive a fee, which is capped at 9.9% of a fund's daily lending revenue, for its services as lending agent. A fund may lend securities to certain qualified borrowers, including NFS. On the settlement date of the loan, a fund receives collateral (in the form of U.S. Treasury obligations, letters of credit and/or cash) against the loaned securities and maintains collateral in an amount not less than 100% of the market value of the loaned securities during the period of the loan. The market value of the loaned securities is determined at the close of business of a fund and any additional required collateral is delivered to a fund on the next business day. A fund or borrower may terminate the loan at any time, and if the borrower defaults on its obligation to return the securities loaned because of insolvency or other reasons, a fund may apply collateral received from the borrower against the obligation. A fund may experience delays and costs in recovering the securities loaned. Any cash collateral received is invested in the Fidelity Securities Lending Cash Central Fund. Any loaned securities are identified as such in the Schedule of Investments, and the value of loaned securities and cash collateral at period end, as applicable, are presented in the Statement of Assets and Liabilities. Security lending income represents the income earned on investing cash collateral, less rebates paid to borrowers and any lending agent fees associated with the loan, plus any premium payments received for lending certain types of securities. Security lending income is presented in the Statement of Operations as a component of income from Fidelity Central Funds. Affiliated security lending activity, if any, was as follows:
| Total Security Lending Fees Paid to NFS | Security Lending Income From Securities Loaned to NFS | Value of Securities Loaned to NFS at Period End | |
| Fidelity Large Cap Growth Index Fund | $28,316 | $11,284 | $585,835 |
9. Expense Reductions.
Through arrangements with the Fund's custodian, credits realized as a result of certain uninvested cash balances were used to reduce the Fund's expenses by $88.
10. Other.
A fund's organizational documents provide former and current trustees and officers with a limited indemnification against liabilities arising in connection with the performance of their duties to the fund. In the normal course of business, a fund may also enter into contracts that provide general indemnifications. A fund's maximum exposure under these arrangements is unknown as this would be dependent on future claims that may be made against a fund. The risk of material loss from such claims is considered remote.
11. Coronavirus (COVID-19) Pandemic.
An outbreak of COVID-19 first detected in China during December 2019 has since spread globally and was declared a pandemic by the World Health Organization during March 2020. Developments that disrupt global economies and financial markets, such as the COVID-19 pandemic, may magnify factors that affect the Fund's performance.
Report of Independent Registered Public Accounting Firm
To the Board of Trustees of Fidelity Salem Street Trust and Shareholders of Fidelity Large Cap Growth Index Fund
Opinion on the Financial Statements and Financial Highlights
We have audited the accompanying statement of assets and liabilities of Fidelity Large Cap Growth Index Fund (the "Fund"), a fund of Fidelity Salem Street Trust, including the schedule of investments, as of April 30, 2022, the related statement of operations for the year then ended, the statement of changes in net assets for each of the two years in the period then ended, the financial highlights for each of the five years in the period then ended, and the related notes. In our opinion, the financial statements and financial highlights present fairly, in all material respects, the financial position of the Fund as of April 30, 2022, and the results of its operations for the year then ended, the changes in its net assets for each of the two years in the period then ended, and the financial highlights for each of the five years in the period then ended in conformity with accounting principles generally accepted in the United States of America.
Basis for Opinion
These financial statements and financial highlights are the responsibility of the Fund's management. Our responsibility is to express an opinion on the Fund's financial statements and financial highlights based on our audits. We are a public accounting firm registered with the Public Company Accounting Oversight Board (United States) (PCAOB) and are required to be independent with respect to the Fund in accordance with the U.S. federal securities laws and the applicable rules and regulations of the Securities and Exchange Commission and the PCAOB.
We conducted our audits in accordance with the standards of the PCAOB. Those standards require that we plan and perform the audit to obtain reasonable assurance about whether the financial statements and financial highlights are free of material misstatement, whether due to error or fraud. The Fund is not required to have, nor were we engaged to perform, an audit of its internal control over financial reporting. As part of our audits we are required to obtain an understanding of internal control over financial reporting but not for the purpose of expressing an opinion on the effectiveness of the Fund’s internal control over financial reporting. Accordingly, we express no such opinion.
Our audits included performing procedures to assess the risks of material misstatement of the financial statements and financial highlights, whether due to error or fraud, and performing procedures that respond to those risks. Such procedures included examining, on a test basis, evidence regarding the amounts and disclosures in the financial statements and financial highlights. Our audits also included evaluating the accounting principles used and significant estimates made by management, as well as evaluating the overall presentation of the financial statements and financial highlights. Our procedures included confirmation of securities owned as of April 30, 2022, by correspondence with the custodian and brokers; when replies were not received from brokers, we performed other auditing procedures. We believe that our audits provide a reasonable basis for our opinion.
/s/ Deloitte & Touche LLP
Boston, Massachusetts
June 13, 2022
We have served as the auditor of one or more of the Fidelity investment companies since 1999.
Trustees and Officers
The Trustees, Members of the Advisory Board (if any), and officers of the trust and fund, as applicable, are listed below. The Board of Trustees governs the fund and is responsible for protecting the interests of shareholders. The Trustees are experienced executives who meet periodically throughout the year to oversee the fund's activities, review contractual arrangements with companies that provide services to the fund, oversee management of the risks associated with such activities and contractual arrangements, and review the fund's performance. Except for Jonathan Chiel, each of the Trustees oversees 300 funds. Mr. Chiel oversees 190 funds.
The Trustees hold office without limit in time except that (a) any Trustee may resign; (b) any Trustee may be removed by written instrument, signed by at least two-thirds of the number of Trustees prior to such removal; (c) any Trustee who requests to be retired or who has become incapacitated by illness or injury may be retired by written instrument signed by a majority of the other Trustees; and (d) any Trustee may be removed at any special meeting of shareholders by a two-thirds vote of the outstanding voting securities of the trust. Each Trustee who is not an interested person (as defined in the 1940 Act) of the trust and the fund is referred to herein as an Independent Trustee. Each Independent Trustee shall retire not later than the last day of the calendar year in which his or her 75th birthday occurs. The Independent Trustees may waive this mandatory retirement age policy with respect to individual Trustees. Officers and Advisory Board Members hold office without limit in time, except that any officer or Advisory Board Member may resign or may be removed by a vote of a majority of the Trustees at any regular meeting or any special meeting of the Trustees. Except as indicated, each individual has held the office shown or other offices in the same company for the past five years.
The fund’s Statement of Additional Information (SAI) includes more information about the Trustees. To request a free copy, call Fidelity at 1-800-544-8544.
Experience, Skills, Attributes, and Qualifications of the Trustees. The Governance and Nominating Committee has adopted a statement of policy that describes the experience, qualifications, attributes, and skills that are necessary and desirable for potential Independent Trustee candidates (Statement of Policy). The Board believes that each Trustee satisfied at the time he or she was initially elected or appointed a Trustee, and continues to satisfy, the standards contemplated by the Statement of Policy. The Governance and Nominating Committee also engages professional search firms to help identify potential Independent Trustee candidates who have the experience, qualifications, attributes, and skills consistent with the Statement of Policy. From time to time, additional criteria based on the composition and skills of the current Independent Trustees, as well as experience or skills that may be appropriate in light of future changes to board composition, business conditions, and regulatory or other developments, have also been considered by the professional search firms and the Governance and Nominating Committee. In addition, the Board takes into account the Trustees' commitment and participation in Board and committee meetings, as well as their leadership of standing and ad hoc committees throughout their tenure.
In determining that a particular Trustee was and continues to be qualified to serve as a Trustee, the Board has considered a variety of criteria, none of which, in isolation, was controlling. The Board believes that, collectively, the Trustees have balanced and diverse experience, qualifications, attributes, and skills, which allow the Board to operate effectively in governing the fund and protecting the interests of shareholders. Information about the specific experience, skills, attributes, and qualifications of each Trustee, which in each case led to the Board's conclusion that the Trustee should serve (or continue to serve) as a trustee of the fund, is provided below.
Board Structure and Oversight Function. Abigail P. Johnson is an interested person and currently serves as Chairman. The Trustees have determined that an interested Chairman is appropriate and benefits shareholders because an interested Chairman has a personal and professional stake in the quality and continuity of services provided to the fund. Independent Trustees exercise their informed business judgment to appoint an individual of their choosing to serve as Chairman, regardless of whether the Trustee happens to be independent or a member of management. The Independent Trustees have determined that they can act independently and effectively without having an Independent Trustee serve as Chairman and that a key structural component for assuring that they are in a position to do so is for the Independent Trustees to constitute a substantial majority for the Board. The Independent Trustees also regularly meet in executive session. Michael E. Kenneally serves as Chairman of the Independent Trustees and as such (i) acts as a liaison between the Independent Trustees and management with respect to matters important to the Independent Trustees and (ii) with management prepares agendas for Board meetings.
Fidelity® funds are overseen by different Boards of Trustees. The fund's Board oversees Fidelity's investment-grade bond, money market, asset allocation and certain equity funds, and other Boards oversee Fidelity's high income and other equity funds. The asset allocation funds may invest in Fidelity® funds that are overseen by such other Boards. The use of separate Boards, each with its own committee structure, allows the Trustees of each group of Fidelity® funds to focus on the unique issues of the funds they oversee, including common research, investment, and operational issues. On occasion, the separate Boards establish joint committees to address issues of overlapping consequences for the Fidelity® funds overseen by each Board.
The Trustees operate using a system of committees to facilitate the timely and efficient consideration of all matters of importance to the Trustees, the fund, and fund shareholders and to facilitate compliance with legal and regulatory requirements and oversight of the fund's activities and associated risks. The Board, acting through its committees, has charged FMR and its affiliates with (i) identifying events or circumstances the occurrence of which could have demonstrably adverse effects on the fund's business and/or reputation; (ii) implementing processes and controls to lessen the possibility that such events or circumstances occur or to mitigate the effects of such events or circumstances if they do occur; and (iii) creating and maintaining a system designed to evaluate continuously business and market conditions in order to facilitate the identification and implementation processes described in (i) and (ii) above. Because the day-to-day operations and activities of the fund are carried out by or through FMR, its affiliates, and other service providers, the fund's exposure to risks is mitigated but not eliminated by the processes overseen by the Trustees. While each of the Board's committees has responsibility for overseeing different aspects of the fund's activities, oversight is exercised primarily through the Operations and Audit Committees. In addition, an ad hoc Board committee of Independent Trustees has worked with FMR to enhance the Board's oversight of investment and financial risks, legal and regulatory risks, technology risks, and operational risks, including the development of additional risk reporting to the Board. Appropriate personnel, including but not limited to the fund's Chief Compliance Officer (CCO), FMR's internal auditor, the independent accountants, the fund's Treasurer and portfolio management personnel, make periodic reports to the Board's committees, as appropriate, including an annual review of Fidelity's risk management program for the Fidelity® funds. The responsibilities of each standing committee, including their oversight responsibilities, are described further under "Standing Committees of the Trustees."
Interested Trustees*:
Correspondence intended for a Trustee who is an interested person may be sent to Fidelity Investments, 245 Summer Street, Boston, Massachusetts 02210.
Name, Year of Birth; Principal Occupations and Other Relevant Experience+
Jonathan Chiel (1957)
Year of Election or Appointment: 2016
Trustee
Mr. Chiel also serves as Trustee of other Fidelity® funds. Mr. Chiel is Executive Vice President and General Counsel for FMR LLC (diversified financial services company, 2012-present). Previously, Mr. Chiel served as general counsel (2004-2012) and senior vice president and deputy general counsel (2000-2004) for John Hancock Financial Services; a partner with Choate, Hall & Stewart (1996-2000) (law firm); and an Assistant United States Attorney for the United States Attorney’s Office of the District of Massachusetts (1986-95), including Chief of the Criminal Division (1993-1995). Mr. Chiel is a director on the boards of the Boston Bar Foundation and the Maimonides School.
Abigail P. Johnson (1961)
Year of Election or Appointment: 2009
Trustee
Chairman of the Board of Trustees
Ms. Johnson also serves as Trustee of other Fidelity® funds. Ms. Johnson serves as Chairman (2016-present), Chief Executive Officer (2014-present), and Director (2007-present) of FMR LLC (diversified financial services company), President of Fidelity Financial Services (2012-present) and President of Personal, Workplace and Institutional Services (2005-present). Ms. Johnson is Chairman and Director of Fidelity Management & Research Company LLC (investment adviser firm, 2011-present). Previously, Ms. Johnson served as Chairman and Director of FMR Co., Inc. (investment adviser firm, 2011-2019), Vice Chairman (2007-2016) and President (2013-2016) of FMR LLC, President and a Director of Fidelity Management & Research Company (2001-2005), a Trustee of other investment companies advised by Fidelity Management & Research Company, Fidelity Investments Money Management, Inc. (investment adviser firm), and FMR Co., Inc. (2001-2005), Senior Vice President of the Fidelity® funds (2001-2005), and managed a number of Fidelity® funds. Ms. Abigail P. Johnson and Mr. Arthur E. Johnson are not related.
Jennifer Toolin McAuliffe (1959)
Year of Election or Appointment: 2016
Trustee
Ms. McAuliffe also serves as Trustee of other Fidelity® funds and as Trustee of Fidelity Charitable (2020-present). Previously, Ms. McAuliffe served as Co-Head of Fixed Income of Fidelity Investments Limited (now known as FIL Limited (FIL)) (diversified financial services company), Director of Research for FIL’s credit and quantitative teams in London, Hong Kong and Tokyo and Director of Research for taxable and municipal bonds at Fidelity Investments Money Management, Inc. Ms. McAuliffe previously served as a member of the Advisory Board of certain Fidelity® funds (2016). Ms. McAuliffe was previously a lawyer at Ropes & Gray LLP and currently serves as director or trustee of several not-for-profit entities.
* Determined to be an “Interested Trustee” by virtue of, among other things, his or her affiliation with the trust or various entities under common control with FMR.
+ The information includes the Trustee's principal occupation during the last five years and other information relating to the experience, attributes, and skills relevant to the Trustee's qualifications to serve as a Trustee, which led to the conclusion that the Trustee should serve as a Trustee for the fund.
Independent Trustees:
Correspondence intended for an Independent Trustee may be sent to Fidelity Investments, P.O. Box 55235, Boston, Massachusetts 02205-5235.
Name, Year of Birth; Principal Occupations and Other Relevant Experience+
Elizabeth S. Acton (1951)
Year of Election or Appointment: 2013
Trustee
Ms. Acton also serves as Trustee of other Fidelity® funds. Prior to her retirement, Ms. Acton served as Executive Vice President, Finance (2011-2012), Executive Vice President, Chief Financial Officer (2002-2011) and Treasurer (2004-2005) of Comerica Incorporated (financial services). Prior to joining Comerica, Ms. Acton held a variety of positions at Ford Motor Company (1983-2002), including Vice President and Treasurer (2000-2002) and Executive Vice President and Chief Financial Officer of Ford Motor Credit Company (1998-2000). Ms. Acton currently serves as a member of the Board and Audit and Finance Committees of Beazer Homes USA, Inc. (homebuilding, 2012-present). Ms. Acton previously served as a member of the Advisory Board of certain Fidelity® funds (2013-2016).
Ann E. Dunwoody (1953)
Year of Election or Appointment: 2018
Trustee
General Dunwoody also serves as Trustee of other Fidelity® funds. General Dunwoody (United States Army, Retired) was the first woman in U.S. military history to achieve the rank of four-star general and prior to her retirement in 2012 held a variety of positions within the U.S. Army, including Commanding General, U.S. Army Material Command (2008-2012). General Dunwoody currently serves as President of First to Four LLC (leadership and mentoring services, 2012-present), a member of the Board and Nomination and Corporate Governance Committees of Kforce Inc. (professional staffing services, 2016-present) and a member of the Board of Automattic Inc. (software engineering, 2018-present). Previously, General Dunwoody served as a member of the Advisory Board and Nominating and Corporate Governance Committee of L3 Technologies, Inc. (communication, electronic, sensor and aerospace systems, 2013-2019) and a member of the Board and Audit and Sustainability and Corporate Responsibility Committees of Republic Services, Inc. (waste collection, disposal and recycling, 2013-2016). Ms. Dunwoody also serves on several boards for non-profit organizations, including as a member of the Board, Chair of the Nomination and Governance Committee and a member of the Audit Committee of Logistics Management Institute (consulting non-profit, 2012-present), a member of the Council of Trustees for the Association of the United States Army (advocacy non-profit, 2013-present), a member of the Board of Florida Institute of Technology (2015-present) and a member of the Board of ThanksUSA (military family education non-profit, 2014-present). General Dunwoody previously served as a member of the Advisory Board of certain Fidelity® funds (2018).
John Engler (1948)
Year of Election or Appointment: 2014
Trustee
Mr. Engler also serves as Trustee of other Fidelity® funds. Previously, Mr. Engler served as Governor of Michigan (1991-2003), President of the Business Roundtable (2011-2017) and interim President of Michigan State University (2018-2019). Mr. Engler currently serves as a member of the Board of Stride, Inc. (formerly K12 Inc.) (technology-based education company, 2012-present). Previously, Mr. Engler served as a member of the Board of Universal Forest Products (manufacturer and distributor of wood and wood-alternative products, 2003-2019) and Trustee of The Munder Funds (2003-2014). Mr. Engler previously served as a member of the Advisory Board of certain Fidelity® funds (2014-2016).
Robert F. Gartland (1951)
Year of Election or Appointment: 2010
Trustee
Mr. Gartland also serves as Trustee of other Fidelity® funds. Prior to his retirement, Mr. Gartland held a variety of positions at Morgan Stanley (financial services, 1979-2007), including Managing Director (1987-2007) and Chase Manhattan Bank (1975-1978). Mr. Gartland previously served as Chairman and an investor in Gartland & Mellina Group Corp. (consulting, 2009-2019), as a member of the Board of National Securities Clearing Corporation (1993-1996) and as Chairman of TradeWeb (2003-2004).
Arthur E. Johnson (1947)
Year of Election or Appointment: 2008
Trustee
Mr. Johnson also serves as Trustee of other Fidelity® funds. Prior to his retirement, Mr. Johnson served as Senior Vice President of Corporate Strategic Development of Lockheed Martin Corporation (defense contractor, 1999-2009). Mr. Johnson currently serves as a member of the Board of Booz Allen Hamilton (management consulting, 2011-present). Mr. Johnson previously served as a member of the Board of Eaton Corporation plc (diversified power management, 2009-2019) and a member of the Board of AGL Resources, Inc. (holding company, 2002-2016). Mr. Johnson previously served as Chairman (2018-2021) and Vice Chairman (2015-2018) of the Independent Trustees of certain Fidelity® funds. Mr. Arthur E. Johnson is not related to Ms. Abigail P. Johnson.
Michael E. Kenneally (1954)
Year of Election or Appointment: 2009
Trustee
Chairman of the Independent Trustees
Mr. Kenneally also serves as Trustee of other Fidelity® funds and was Vice Chairman (2018-2021) of the Independent Trustees of certain Fidelity® funds. Prior to retirement in 2005, he was Chairman and Global Chief Executive Officer of Credit Suisse Asset Management, the worldwide fund management and institutional investment business of Credit Suisse Group. Previously, Mr. Kenneally was an Executive Vice President and the Chief Investment Officer for Bank of America. In this role, he was responsible for the investment management, strategy and products delivered to the bank’s institutional, high-net-worth and retail clients. Earlier, Mr. Kenneally directed the organization’s equity and quantitative research groups. He began his career as a research analyst and then spent more than a dozen years as a portfolio manager for endowments, pension plans and mutual funds. He earned the Chartered Financial Analyst (CFA) designation in 1991.
Marie L. Knowles (1946)
Year of Election or Appointment: 2001
Trustee
Ms. Knowles also serves as Trustee of other Fidelity® funds. Prior to her retirement, Ms. Knowles held several positions at Atlantic Richfield Company (diversified energy), including Executive Vice President and Chief Financial Officer (1996-2000), Senior Vice President (1993-1996) and President of ARCO Transportation Company (pipeline and tanker operations, 1993-1996). Ms. Knowles currently serves as a member of the Board of the Santa Catalina Island Company (real estate, 2009-present), a member of the Investment Company Institute Board of Governors and a member of the Governing Council of the Independent Directors Council (2014-present). Ms. Knowles also serves as a member of the Advisory Board for the School of Engineering of the University of Southern California. Ms. Knowles previously served as a member of the Board of McKesson Corporation (healthcare service, 2002-2021). In addition, Ms. Knowles previously served as Chairman (2015-2018) and Vice Chairman (2012-2015) of the Independent Trustees of certain Fidelity® funds.
Mark A. Murray (1954)
Year of Election or Appointment: 2016
Trustee
Mr. Murray also serves as Trustee of other Fidelity® funds. Previously, Mr. Murray served as Co-Chief Executive Officer (2013-2016), President (2006-2013) and Vice Chairman (2013-2020) of Meijer, Inc. Mr. Murray serves as a member of the Board (2009-present) and Public Policy and Responsibility Committee (2009-present) and Chair of the Nuclear Review Committee (2019-present) of DTE Energy Company (diversified energy company). Mr. Murray previously served as a member of the Board of Spectrum Health (not-for-profit health system, 2015-2019) and as a member of the Board and Audit Committee and Chairman of the Nominating and Corporate Governance Committee of Universal Forest Products, Inc. (manufacturer and distributor of wood and wood-alternative products, 2004-2016). Mr. Murray also serves as a member of the Board of many community and professional organizations. Mr. Murray previously served as a member of the Advisory Board of certain Fidelity® funds (2016).
+ The information includes the Trustee's principal occupation during the last five years and other information relating to the experience, attributes, and skills relevant to the Trustee's qualifications to serve as a Trustee, which led to the conclusion that the Trustee should serve as a Trustee for the fund.
Advisory Board Members and Officers:
Correspondence intended for an officer may be sent to Fidelity Investments, 245 Summer Street, Boston, Massachusetts 02210. Officers appear below in alphabetical order.
Name, Year of Birth; Principal Occupation
Robert W. Helm (1957)
Year of Election or Appointment: 2021
Member of the Advisory Board
Mr. Helm also serves as a Member of the Advisory Board of other Fidelity® funds. Mr. Helm was formerly Deputy Chairman (2003-2020), partner (1991-2020) and an associate (1984-1991) of Dechert LLP (formerly Dechert Price & Rhoads). Mr. Helm currently serves on boards and committees of several not-for-profit organizations.
Craig S. Brown (1977)
Year of Election or Appointment: 2019
Assistant Treasurer
Mr. Brown also serves as an officer of other funds. Mr. Brown serves as Assistant Treasurer of FIMM, LLC (2021-present) and is an employee of Fidelity Investments (2013-present).
John J. Burke III (1964)
Year of Election or Appointment: 2018
Chief Financial Officer
Mr. Burke also serves as Chief Financial Officer of other funds. Mr. Burke serves as Head of Investment Operations for Fidelity Fund and Investment Operations (2018-present) and is an employee of Fidelity Investments (1998-present). Previously Mr. Burke served as head of Asset Management Investment Operations (2012-2018).
David J. Carter (1973)
Year of Election or Appointment: 2020
Assistant Secretary
Mr. Carter also serves as Assistant Secretary of other funds. Mr. Carter serves as Senior Vice President, Deputy General Counsel (2022-present) and is an employee of Fidelity Investments (2005-present).
Jonathan Davis (1968)
Year of Election or Appointment: 2010
Assistant Treasurer
Mr. Davis also serves as an officer of other funds. Mr. Davis serves as Assistant Treasurer of FIMM, LLC (2021-present), FMR Capital, Inc. (2017-present), FD Funds GP LLC (2021-present), FD Funds Holding LLC (2021-present), and FD Funds Management LLC (2021-present); and is an employee of Fidelity Investments. Previously, Mr. Davis served as Vice President and Associate General Counsel of FMR LLC (diversified financial services company, 2003-2010).
Laura M. Del Prato (1964)
Year of Election or Appointment: 2018
President and Treasurer
Ms. Del Prato also serves as an officer of other funds. Ms. Del Prato serves as Assistant Treasurer of FIMM, LLC (2021-present) and is an employee of Fidelity Investments (2017-present). Previously, Ms. Del Prato served as President and Treasurer of The North Carolina Capital Management Trust: Cash Portfolio and Term Portfolio (2018-2020). Prior to joining Fidelity Investments, Ms. Del Prato served as a Managing Director and Treasurer of the JPMorgan Mutual Funds (2014-2017). Prior to JPMorgan, Ms. Del Prato served as a partner at Cohen Fund Audit Services (accounting firm, 2012-2013) and KPMG LLP (accounting firm, 2004-2012).
Colm A. Hogan (1973)
Year of Election or Appointment: 2016
Assistant Treasurer
Mr. Hogan also serves as an officer of other funds. Mr. Hogan serves as Assistant Treasurer of FIMM, LLC (2021-present) and FMR Capital, Inc. (2017-present) and is an employee of Fidelity Investments (2005-present). Previously, Mr. Hogan served as Deputy Treasurer of certain Fidelity® funds (2016-2020) and Assistant Treasurer of certain Fidelity® funds (2016-2018).
Cynthia Lo Bessette (1969)
Year of Election or Appointment: 2019
Secretary and Chief Legal Officer (CLO)
Ms. Lo Bessette also serves as an officer of other funds. Ms. Lo Bessette serves as CLO, Secretary, and Senior Vice President of Fidelity Management & Research Company LLC (investment adviser firm, 2019-present); CLO of Fidelity Management & Research (Hong Kong) Limited, FMR Investment Management (UK) Limited, and Fidelity Management & Research (Japan) Limited (investment adviser firms, 2019-present); Secretary of FD Funds GP LLC (2021-present), FD Funds Holding LLC (2021-present), and FD Funds Management LLC (2021-present); and Assistant Secretary of FIMM, LLC (2019-present). She is a Senior Vice President and Deputy General Counsel of FMR LLC (diversified financial services company, 2019-present), and is an employee of Fidelity Investments. Previously, Ms. Lo Bessette served as CLO, Secretary, and Senior Vice President of FMR Co., Inc. (investment adviser firm, 2019); Secretary of Fidelity SelectCo, LLC and Fidelity Investments Money Management, Inc. (investment adviser firms, 2019). Prior to joining Fidelity Investments, Ms. Lo Bessette was Executive Vice President, General Counsel (2016-2019) and Senior Vice President, Deputy General Counsel (2015-2016) of OppenheimerFunds (investment management company) and Deputy Chief Legal Officer (2013-2015) of Jennison Associates LLC (investment adviser firm).
Chris Maher (1972)
Year of Election or Appointment: 2013
Assistant Treasurer
Mr. Maher also serves as an officer of other funds. Mr. Maher serves as Assistant Treasurer of FIMM, LLC (2021-present) and FMR Capital, Inc. (2017-present), and is an employee of Fidelity Investments (2008-present). Previously, Mr. Maher served as Assistant Treasurer of certain funds (2013-2020); Vice President of Asset Management Compliance (2013), Vice President of the Program Management Group of FMR (investment adviser firm, 2010-2013), and Vice President of Valuation Oversight (2008-2010).
Jamie Pagliocco (1964)
Year of Election or Appointment: 2020
Vice President
Mr. Pagliocco also serves as Vice President of other funds. Mr. Pagliocco serves as President of Fixed Income (2020-present), and is an employee of Fidelity Investments (2001-present). Previously, Mr. Pagliocco served as Co-Chief Investment Officer – Bond (2017-2020), Global Head of Bond Trading (2016-2019), and as a portfolio manager.
Kenneth B. Robins (1969)
Year of Election or Appointment: 2020
Chief Compliance Officer
Mr. Robins also serves as an officer of other funds. Mr. Robins serves as Compliance Officer of Fidelity Management & Research Company LLC (investment adviser firm, 2016-present) and is an employee of Fidelity Investments (2004-present). Previously, Mr. Robins served as Compliance Officer of FMR Co., Inc. (investment adviser firm, 2016-2019), as Executive Vice President of Fidelity Investments Money Management, Inc. (investment adviser firm, 2013-2016) and served in other fund officer roles.
Brett Segaloff (1972)
Year of Election or Appointment: 2021
Anti-Money Laundering (AML) Officer
Mr. Segaloff also serves as an AML Officer of other funds and other related entities. He is Director, Anti-Money Laundering (2007-present) of FMR LLC (diversified financial services company) and is an employee of Fidelity Investments (1996-present).
Stacie M. Smith (1974)
Year of Election or Appointment: 2013
Assistant Treasurer
Ms. Smith also serves as an officer of other funds. Ms. Smith serves as Assistant Treasurer of FIMM, LLC (2021-present) and FMR Capital, Inc. (2017-present), is an employee of Fidelity Investments (2009-present), and has served in other fund officer roles. Prior to joining Fidelity Investments, Ms. Smith served as Senior Audit Manager of Ernst & Young LLP (accounting firm, 1996-2009). Previously, Ms. Smith served as Assistant Treasurer (2013-2019) and Deputy Treasurer (2013-2016) of certain Fidelity® funds.
Jim Wegmann (1979)
Year of Election or Appointment: 2021
Deputy Treasurer
Mr. Wegmann also serves as an officer of other funds. Mr. Wegmann serves as Assistant Treasurer of FIMM, LLC (2021-present) and is an employee of Fidelity Investments (2011-present). Previously, Mr. Wegmann served as Assistant Treasurer of certain Fidelity® funds (2019-2021).
Shareholder Expense Example
As a shareholder, you incur two types of costs: (1) transaction costs, which may include sales charges (loads) on purchase payments or redemption proceeds, as applicable and (2) ongoing costs, which generally include management fees, distribution and/or service (12b-1) fees and other Fund expenses. This Example is intended to help you understand your ongoing costs (in dollars) of investing in a fund and to compare these costs with the ongoing costs of investing in other mutual funds.
The Example is based on an investment of $1,000 invested at the beginning of the period and held for the entire period (November 1, 2021 to April 30, 2022).
Actual Expenses
The first line of the accompanying table provides information about actual account values and actual expenses. You may use the information in this line, together with the amount you invested, to estimate the expenses that you paid over the period. Simply divide your account value by $1,000.00 (for example, an $8,600 account value divided by $1,000.00 = 8.6), then multiply the result by the number in the first line for a class/Fund under the heading entitled "Expenses Paid During Period" to estimate the expenses you paid on your account during this period. If any fund is a shareholder of any underlying mutual funds or exchange-traded funds (ETFs) (the Underlying Funds), such fund indirectly bears its proportional share of the expenses of the Underlying Funds in addition to the direct expenses incurred presented in the table. These fees and expenses are not included in the annualized expense ratio used to calculate the expense estimate in the table below.
Hypothetical Example for Comparison Purposes
The second line of the accompanying table provides information about hypothetical account values and hypothetical expenses based on the actual expense ratio and an assumed rate of return of 5% per year before expenses, which is not the actual return. The hypothetical account values and expenses may not be used to estimate the actual ending account balance or expenses you paid for the period. You may use this information to compare the ongoing costs of investing in the Fund and other funds. To do so, compare this 5% hypothetical example with the 5% hypothetical examples that appear in the shareholder reports of the other funds. If any fund is a shareholder of any Underlying Funds, such fund indirectly bears its proportional share of the expenses of the Underlying Funds in addition to the direct expenses as presented in the table. These fees and expenses are not included in the annualized expense ratio used to calculate the expense estimate in the table below.
Please note that the expenses shown in the table are meant to highlight your ongoing costs only and do not reflect any transaction costs. Therefore, the second line of the table is useful in comparing ongoing costs only, and will not help you determine the relative total costs of owning different funds. In addition, if these transactional costs were included, your costs would have been higher.
| Annualized Expense Ratio-A | Beginning Account Value November 1, 2021 | Ending Account Value April 30, 2022 | Expenses Paid During Period-B November 1, 2021 to April 30, 2022 |
|
| Fidelity Large Cap Growth Index Fund | .04% | |||
| Actual | $1,000.00 | $821.30 | $.18 | |
| Hypothetical-C | $1,000.00 | $1,024.60 | $.20 |
A Annualized expense ratio reflects expenses net of applicable fee waivers.
B Expenses are equal to the annualized expense ratio, multiplied by the average account value over the period, multiplied by 181/ 365 (to reflect the one-half year period). The fees and expenses of any Underlying Funds are not included in each annualized expense ratio.
C 5% return per year before expenses
Distributions (Unaudited)
The dividend and capital gains distributions for the fund(s) are available on Fidelity.com or Institutional.Fidelity.com.
The fund hereby designates as a capital gain dividend with respect to the taxable year ended April 30, 2022, $144,590,837, or, if subsequently determined to be different, the net capital gain of such year.
The fund designates 100% of the short-term capital gain dividends distributed in December during the fiscal year as qualifying to be taxed as short-term capital gain dividends for nonresident alien shareholders.
The fund designates 98% and 64% of the dividends distributed in June and December, respectively during the fiscal year as qualifying for the dividends–received deduction for corporate shareholders.
The fund designates 99% and 66% of the dividends distributed in June and December, respectively during the fiscal year as amounts which may be taken into account as a dividend for the purposes of the maximum rate under section 1(h)(11) of the Internal Revenue Code.
The fund designates 1% and 5% of the dividends distributed in June and December, respectively during the fiscal year as a section 199A dividend.
The fund will notify shareholders in January 2023 of amounts for use in preparing 2022 income tax returns.
Liquidity Risk Management Program
The Securities and Exchange Commission adopted Rule 22e-4 under the Investment Company Act of 1940 (the Liquidity Rule) to promote effective liquidity risk management throughout the open-end investment company industry, thereby reducing the risk that funds will be unable to meet their redemption obligations and mitigating dilution of the interests of fund shareholders.
The Fund has adopted and implemented a liquidity risk management program pursuant to the Liquidity Rule (the Program) effective December 1, 2018. The Program is reasonably designed to assess and manage the Fund’s liquidity risk and to comply with the requirements of the Liquidity Rule. The Fund’s Board of Trustees (the Board) has designated the Fund’s investment adviser as administrator of the Program. The Fidelity advisers have established a Liquidity Risk Management Committee (the LRM Committee) to manage the Program for each of the Fidelity Funds. The LRM Committee monitors the adequacy and effectiveness of implementation of the Program and on a periodic basis assesses each Fund’s liquidity risk based on a variety of factors including (1) the Fund’s investment strategy, (2) portfolio liquidity and cash flow projections during normal and reasonably foreseeable stressed conditions, (3) shareholder redemptions, (4) borrowings and other funding sources and (5) in the case of exchange-traded funds, certain additional factors including the effect of the Fund’s prices and spreads, market participants, and basket compositions on the overall liquidity of the Fund’s portfolio, as applicable.
In accordance with the Program, each of the Fund’s portfolio investments is classified into one of four liquidity categories described below based on a determination of a reasonable expectation for how long it would take to convert the investment to cash (or sell or dispose of the investment) without significantly changing its market value.
- Highly liquid investments – cash or convertible to cash within three business days or less
- Moderately liquid investments – convertible to cash in three to seven calendar days
- Less liquid investments – can be sold or disposed of, but not settled, within seven calendar days
- Illiquid investments – cannot be sold or disposed of within seven calendar days
Liquidity classification determinations take into account a variety of factors including various market, trading and investment-specific considerations, as well as market depth, and generally utilize analysis from a third-party liquidity metrics service.
The Liquidity Rule places a 15% limit on a fund’s illiquid investments and requires funds that do not primarily hold assets that are highly liquid investments to determine and maintain a minimum percentage of the fund’s net assets to be invested in highly liquid investments (highly liquid investment minimum or HLIM). The Program includes provisions reasonably designed to comply with the 15% limit on illiquid investments and for determining, periodically reviewing and complying with the HLIM requirement as applicable.
At a recent meeting of the Fund’s Board of Trustees, the LRM Committee provided a written report to the Board pertaining to the operation, adequacy, and effectiveness of implementation of the Program for the annual period from December 1, 2020 through November 30, 2021. The report concluded that the Program has been implemented and is operating effectively and is reasonably designed to assess and manage the Fund’s liquidity risk.
LC1-I-ANN-0622
1.9879605.105
Fidelity® Series Large Cap Growth Index Fund
April 30, 2022
Contents
To view a fund's proxy voting guidelines and proxy voting record for the 12-month period ended June 30, visit http://www.fidelity.com/proxyvotingresults or visit the Securities and Exchange Commission's (SEC) web site at http://www.sec.gov.
You may also call 1-800-544-8544 to request a free copy of the proxy voting guidelines.
The fund is not in any way connected to or sponsored, endorsed, sold or promoted by the London Stock Exchange Group plc and its group undertakings (collectively, the “LSE Group”). The LSE Group does not accept any liability whatsoever to any person arising out of the use of the fund or the underlying data.
Standard & Poor's, S&P and S&P 500 are registered service marks of The McGraw-Hill Companies, Inc. and have been licensed for use by Fidelity Distributors Corporation.
Other third-party marks appearing herein are the property of their respective owners.
All other marks appearing herein are registered or unregistered trademarks or service marks of FMR LLC or an affiliated company. © 2022 FMR LLC. All rights reserved.
This report and the financial statements contained herein are submitted for the general information of the shareholders of the Fund. This report is not authorized for distribution to prospective investors in the Fund unless preceded or accompanied by an effective prospectus.
A fund files its complete schedule of portfolio holdings with the SEC for the first and third quarters of each fiscal year on Form N-PORT. Forms N-PORT are available on the SEC’s web site at http://www.sec.gov. A fund's Forms N-PORT may be reviewed and copied at the SEC’s Public Reference Room in Washington, DC. Information regarding the operation of the SEC's Public Reference Room may be obtained by calling 1-800-SEC-0330.
For a complete list of a fund's portfolio holdings, view the most recent holdings listing, semiannual report, or annual report on Fidelity's web site at http://www.fidelity.com, http://www.institutional.fidelity.com, or http://www.401k.com, as applicable.
NOT FDIC INSURED •MAY LOSE VALUE •NO BANK GUARANTEE
Neither the Fund nor Fidelity Distributors Corporation is a bank.
Note to Shareholders:
Early in 2020, the outbreak and spread of COVID-19 emerged as a public health emergency that had a major influence on financial markets, primarily based on its impact on the global economy and corporate earnings. On March 11, 2020, the World Health Organization declared the COVID-19 outbreak a pandemic, citing sustained risk of further global spread. The pandemic prompted a number of measures to limit the spread of COVID-19, including travel and border restrictions, quarantines, and restrictions on large gatherings. In turn, these resulted in lower consumer activity, diminished demand for a wide range of products and services, disruption in manufacturing and supply chains, and – given the wide variability in outcomes regarding the outbreak – significant market uncertainty and volatility. To help stem the turmoil, the U.S. government took unprecedented action – in concert with the U.S. Federal Reserve and central banks around the world – to help support consumers, businesses, and the broader economy, and to limit disruption to the financial system.
In general, the overall impact of the pandemic lessened in 2021, amid a resilient economy and widespread distribution of three COVID-19 vaccines granted emergency use authorization from the U.S. Food and Drug Administration (FDA) early in the year. Still, the situation remains dynamic, and the extent and duration of its influence on financial markets and the economy is highly uncertain, due in part to a recent spike in cases based on highly contagious variants of the coronavirus.
Extreme events such as the COVID-19 crisis are exogenous shocks that can have significant adverse effects on mutual funds and their investments. Although multiple asset classes may be affected by market disruption, the duration and impact may not be the same for all types of assets. Fidelity is committed to helping you stay informed amid news about COVID-19 and during increased market volatility, and we continue to take extra steps to be responsive to customer needs. We encourage you to visit us online, where we offer ongoing updates, commentary, and analysis on the markets and our funds.
Performance: The Bottom Line
Average annual total return reflects the change in the value of an investment, assuming reinvestment of distributions from dividend income and capital gains (the profits earned upon the sale of securities that have grown in value, if any) and assuming a constant rate of performance each year. The hypothetical investment and the average annual total returns do not reflect the deduction of taxes that a shareholder would pay on fund distributions or the redemption of fund shares. During periods of reimbursement by Fidelity, a fund’s total return will be greater than it would be had the reimbursement not occurred. How a fund did yesterday is no guarantee of how it will do tomorrow.
Average Annual Total Returns
| For the periods ended April 30, 2022 | Past 1 year | Life of fundA |
| Fidelity® Series Large Cap Growth Index Fund | (5.34)% | 15.04% |
A From August 17, 2018
$10,000 Over Life of Fund
Let's say hypothetically that $10,000 was invested in Fidelity® Series Large Cap Growth Index Fund on August 17, 2018, when the fund started.
The chart shows how the value of your investment would have changed, and also shows how the Russell 1000® Growth Index performed over the same period.

| Period Ending Values | ||
|
| $16,801 | Fidelity® Series Large Cap Growth Index Fund |
|
| $16,818 | Russell 1000® Growth Index |
Management's Discussion of Fund Performance
Market Recap: The S&P 500® index gained 0.21% for the 12 months ending April 30, 2022. After posting a strong result in 2021, large-cap stocks retreated to begin the new year amid several notable headwinds that stoked volatility, uncertainty and investor anxiety. Chief among these was the U.S. Federal Reserve’s accelerated plan to hike interest rates and aggressively wind down its balance sheet in an attempt to rein in historically high inflation. In addition, geopolitical unrest rose as Russia invaded Ukraine in late February and escalated its attack through period end. Other factors influencing stocks included surging commodity prices, rising bond yields, supply constraint and disruption, and the potential for variants of the coronavirus to upend the economy. Against this backdrop, the S&P 500® index returned -5.17% in January and -2.99% in February, falling on mixed corporate earnings, particularly among some highflying tech firms. Volatility eased in March and the index gained 3.71% for the month. April saw a sharp reversal, with the index returning -8.72% amid clearer signals of the Fed’s intension to tighten monetary policy and angst about the economic toll of “zero-COVID” lockdowns in China. It was the largest monthly decline for the S&P 500® since March 2020. For the full 12 months, the growth-oriented communication services (-22%) and consumer discretionary (-11%) sectors lagged most. In contrast, energy (+61%) rode a surge in commodity prices and led the market by a wide margin, followed by the defensive consumer staples (+17%) sector. Comments from the Geode Capital Management, LLC, passive equity index team: For the fiscal year ending April 30, 2022, the fund returned -5.34%, roughly in line with the -5.35% result of the benchmark Russell 1000® Growth Index. By sector, stocks in the communication services sector returned about -26% and detracted most. This group was hampered by the media & entertainment (-26%) industry. Consumer discretionary (-14%), industrials (-7%) and materials (-9%) also hurt. In contrast, consumer staples advanced roughly 15% and contributed. Information technology stocks also helped (+1%), benefiting from the technology hardware & equipment industry (+19%). The energy sector rose 58%. Turning to individual stocks, the biggest individual detractor was Amazon.com (-28%), from the retailing industry. Meta Platforms (-38%) and Netflix (-63%), from the media & entertainment industry, hurt. Other detractors from the software & services segment were PayPal (-66%) and Block (-59%). In contrast, the top contributor was Apple (+21%), from the technology hardware & equipment category, followed by Microsoft (+11%), within the software & services group. In automobiles & components, Tesla advanced roughly 23% and Eli Lilly (+62%) from the pharmaceuticals, biotechnology & life sciences segment also helped. Nvidia, within the semiconductors & semiconductor equipment industry, rose 24% and boosted the fund.The views expressed above reflect those of the portfolio manager(s) only through the end of the period as stated on the cover of this report and do not necessarily represent the views of Fidelity or any other person in the Fidelity organization. Any such views are subject to change at any time based upon market or other conditions and Fidelity disclaims any responsibility to update such views. These views may not be relied on as investment advice and, because investment decisions for a Fidelity fund are based on numerous factors, may not be relied on as an indication of trading intent on behalf of any Fidelity fund.
Investment Summary (Unaudited)
Top Ten Stocks as of April 30, 2022
| % of fund's net assets | |
| Apple, Inc. | 12.8 |
| Microsoft Corp. | 11.0 |
| Amazon.com, Inc. | 5.7 |
| Tesla, Inc. | 3.8 |
| Alphabet, Inc. Class A | 3.1 |
| Alphabet, Inc. Class C | 2.9 |
| Meta Platforms, Inc. Class A | 2.4 |
| NVIDIA Corp. | 2.3 |
| Visa, Inc. Class A | 1.9 |
| The Home Depot, Inc. | 1.7 |
| 47.6 |
Market Sectors as of April 30, 2022
| % of fund's net assets | |
| Information Technology | 45.8 |
| Consumer Discretionary | 17.8 |
| Communication Services | 9.6 |
| Health Care | 9.0 |
| Industrials | 6.3 |
| Consumer Staples | 4.8 |
| Financials | 2.5 |
| Real Estate | 1.9 |
| Materials | 1.1 |
| Energy | 0.5 |
| Utilities | 0.0 |
Asset Allocation (% of fund's net assets)
| As of April 30, 2022 * | ||
| Stocks and Equity Futures | 99.8% | |
| Short-Term Investments and Net Other Assets (Liabilities) | 0.2% | |

*Foreign investments - 1.8%
Percentages shown as 0.0% may reflect amounts less than 0.05%.
Schedule of Investments April 30, 2022
Showing Percentage of Net Assets
| Common Stocks - 99.3% | |||
| Shares | Value | ||
| COMMUNICATION SERVICES - 9.6% | |||
| Entertainment - 0.7% | |||
| Live Nation Entertainment, Inc. (a) | 1,786 | $187,316 | |
| Madison Square Garden Sports Corp. (a) | 239 | 38,744 | |
| Netflix, Inc. (a) | 14,612 | 2,781,540 | |
| Playtika Holding Corp. (a) | 3,606 | 63,393 | |
| Roku, Inc. Class A (a) | 3,981 | 369,835 | |
| Skillz, Inc. (a) | 9,956 | 20,410 | |
| Spotify Technology SA (a) | 4,668 | 474,502 | |
| Take-Two Interactive Software, Inc. (a) | 768 | 91,784 | |
| The Walt Disney Co. (a) | 3,133 | 349,737 | |
| World Wrestling Entertainment, Inc. Class A (b) | 1,289 | 75,265 | |
| Zynga, Inc. (a) | 16,512 | 136,554 | |
| 4,589,080 | |||
| Interactive Media & Services - 8.6% | |||
| Alphabet, Inc.: | |||
| Class A (a) | 8,764 | 20,001,113 | |
| Class C (a) | 8,057 | 18,525,702 | |
| Match Group, Inc. (a) | 9,553 | 756,120 | |
| Meta Platforms, Inc. Class A (a) | 78,033 | 15,643,276 | |
| Pinterest, Inc. Class A (a) | 19,232 | 394,641 | |
| TripAdvisor, Inc. (a) | 1,981 | 50,852 | |
| Twitter, Inc. (a) | 2,775 | 136,031 | |
| Vimeo, Inc. (a) | 4,275 | 43,562 | |
| 55,551,297 | |||
| Media - 0.3% | |||
| Altice U.S.A., Inc. Class A (a) | 5,099 | 47,319 | |
| Cable One, Inc. | 96 | 111,955 | |
| Charter Communications, Inc. Class A (a) | 3,856 | 1,652,257 | |
| Nexstar Broadcasting Group, Inc. Class A | 78 | 12,357 | |
| 1,823,888 | |||
| TOTAL COMMUNICATION SERVICES | 61,964,265 | ||
| CONSUMER DISCRETIONARY - 17.8% | |||
| Auto Components - 0.0% | |||
| Aptiv PLC (a) | 1,672 | 177,901 | |
| QuantumScape Corp. Class A (a)(b) | 6,002 | 89,670 | |
| 267,571 | |||
| Automobiles - 3.8% | |||
| Rivian Automotive, Inc. (b) | 1,183 | 35,774 | |
| Tesla, Inc. (a) | 28,159 | 24,519,731 | |
| Thor Industries, Inc. (b) | 730 | 55,882 | |
| 24,611,387 | |||
| Distributors - 0.1% | |||
| Pool Corp. | 1,316 | 533,270 | |
| Diversified Consumer Services - 0.1% | |||
| Bright Horizons Family Solutions, Inc. (a) | 1,619 | 184,955 | |
| Chegg, Inc. (a) | 3,479 | 86,070 | |
| Frontdoor, Inc. (a) | 2,030 | 62,747 | |
| H&R Block, Inc. | 4,468 | 116,481 | |
| Mister Car Wash, Inc. (b) | 2,030 | 29,232 | |
| 479,485 | |||
| Hotels, Restaurants & Leisure - 2.4% | |||
| Booking Holdings, Inc. (a) | 1,387 | 3,065,700 | |
| Boyd Gaming Corp. | 583 | 35,318 | |
| Caesars Entertainment, Inc. (a) | 4,282 | 283,811 | |
| Chipotle Mexican Grill, Inc. (a) | 948 | 1,379,918 | |
| Choice Hotels International, Inc. | 1,176 | 165,181 | |
| Churchill Downs, Inc. | 1,246 | 252,863 | |
| Darden Restaurants, Inc. | 2,914 | 383,861 | |
| Domino's Pizza, Inc. | 833 | 281,554 | |
| DraftKings, Inc. Class A (a)(b) | 10,402 | 142,299 | |
| Expedia, Inc. (a) | 4,901 | 856,450 | |
| Hilton Worldwide Holdings, Inc. | 6,206 | 963,730 | |
| Las Vegas Sands Corp. (a) | 11,182 | 396,178 | |
| Marriott International, Inc. Class A | 9,195 | 1,632,296 | |
| McDonald's Corp. | 4,496 | 1,120,223 | |
| Penn National Gaming, Inc. (a) | 338 | 12,361 | |
| Planet Fitness, Inc. (a) | 1,936 | 154,938 | |
| Six Flags Entertainment Corp. (a) | 972 | 37,198 | |
| Starbucks Corp. | 38,916 | 2,904,690 | |
| Travel+Leisure Co. | 1,931 | 107,132 | |
| Vail Resorts, Inc. | 1,349 | 342,862 | |
| Wendy's Co. | 6,019 | 118,935 | |
| Wyndham Hotels & Resorts, Inc. | 1,956 | 172,050 | |
| Wynn Resorts Ltd. (a) | 3,573 | 251,825 | |
| Yum China Holdings, Inc. | 1,144 | 47,819 | |
| Yum! Brands, Inc. | 829 | 97,001 | |
| 15,206,193 | |||
| Household Durables - 0.2% | |||
| D.R. Horton, Inc. | 4,587 | 319,209 | |
| NVR, Inc. (a) | 71 | 310,711 | |
| PulteGroup, Inc. | 2,439 | 101,853 | |
| Tempur Sealy International, Inc. | 6,009 | 162,904 | |
| Toll Brothers, Inc. | 1,476 | 68,442 | |
| TopBuild Corp. (a) | 923 | 167,192 | |
| 1,130,311 | |||
| Internet & Direct Marketing Retail - 6.0% | |||
| Amazon.com, Inc. (a) | 14,685 | 36,501,477 | |
| Doordash, Inc. (a) | 4,359 | 354,953 | |
| eBay, Inc. | 21,167 | 1,098,991 | |
| Etsy, Inc. (a) | 4,281 | 398,946 | |
| Wayfair LLC Class A (a)(b) | 1,429 | 109,947 | |
| 38,464,314 | |||
| Leisure Products - 0.1% | |||
| Brunswick Corp. | 350 | 26,464 | |
| Mattel, Inc. (a) | 11,774 | 286,226 | |
| Peloton Interactive, Inc. Class A (a)(b) | 10,063 | 176,706 | |
| Polaris, Inc. (b) | 1,337 | 126,935 | |
| YETI Holdings, Inc. (a) | 2,890 | 141,234 | |
| 757,565 | |||
| Multiline Retail - 0.4% | |||
| Dollar General Corp. | 3,377 | 802,139 | |
| Nordstrom, Inc. | 3,151 | 80,981 | |
| Target Corp. | 7,255 | 1,658,856 | |
| 2,541,976 | |||
| Specialty Retail - 3.6% | |||
| AutoZone, Inc. (a) | 149 | 291,365 | |
| Bath & Body Works, Inc. | 4,633 | 245,039 | |
| Best Buy Co., Inc. | 1,869 | 168,079 | |
| Burlington Stores, Inc. (a) | 2,112 | 429,919 | |
| CarMax, Inc. (a) | 448 | 38,429 | |
| Carvana Co. Class A (a)(b) | 2,940 | 170,402 | |
| Five Below, Inc. (a) | 1,862 | 292,520 | |
| Floor & Decor Holdings, Inc. Class A (a) | 3,441 | 274,317 | |
| GameStop Corp. Class A (a)(b) | 2,170 | 271,402 | |
| Leslie's, Inc. (a)(b) | 4,737 | 92,845 | |
| Lithia Motors, Inc. Class A (sub. vtg.) | 91 | 25,765 | |
| Lowe's Companies, Inc. | 22,809 | 4,510,024 | |
| O'Reilly Automotive, Inc. (a) | 687 | 416,700 | |
| Petco Health & Wellness Co., Inc. (a) | 102 | 1,965 | |
| RH (a) | 591 | 198,647 | |
| Ross Stores, Inc. | 11,842 | 1,181,476 | |
| The Home Depot, Inc. | 35,333 | 10,614,033 | |
| TJX Companies, Inc. | 40,353 | 2,472,832 | |
| Tractor Supply Co. | 3,837 | 772,964 | |
| Ulta Beauty, Inc. (a) | 1,777 | 705,114 | |
| Victoria's Secret & Co. (a) | 1,505 | 70,916 | |
| Vroom, Inc. (a)(b) | 822 | 1,282 | |
| Williams-Sonoma, Inc. (b) | 1,864 | 243,215 | |
| 23,489,250 | |||
| Textiles, Apparel & Luxury Goods - 1.1% | |||
| Columbia Sportswear Co. | 71 | 5,833 | |
| Deckers Outdoor Corp. (a) | 122 | 32,422 | |
| Hanesbrands, Inc. (b) | 7,023 | 93,125 | |
| lululemon athletica, Inc. (a) | 3,855 | 1,367,099 | |
| NIKE, Inc. Class B | 41,916 | 5,226,925 | |
| Skechers U.S.A., Inc. Class A (sub. vtg.) (a) | 472 | 18,078 | |
| Tapestry, Inc. | 925 | 30,451 | |
| VF Corp. | 7,043 | 366,236 | |
| 7,140,169 | |||
| TOTAL CONSUMER DISCRETIONARY | 114,621,491 | ||
| CONSUMER STAPLES - 4.8% | |||
| Beverages - 2.2% | |||
| Boston Beer Co., Inc. Class A (a) | 315 | 118,125 | |
| Brown-Forman Corp.: | |||
| Class A | 749 | 46,753 | |
| Class B (non-vtg.) | 3,089 | 208,322 | |
| Monster Beverage Corp. (a) | 11,655 | 998,600 | |
| PepsiCo, Inc. | 38,795 | 6,661,489 | |
| The Coca-Cola Co. | 92,732 | 5,991,415 | |
| 14,024,704 | |||
| Food & Staples Retailing - 1.4% | |||
| Costco Wholesale Corp. | 13,985 | 7,436,104 | |
| Sysco Corp. | 17,286 | 1,477,607 | |
| 8,913,711 | |||
| Food Products - 0.2% | |||
| Beyond Meat, Inc. (a)(b) | 1,638 | 60,409 | |
| Darling Ingredients, Inc. (a) | 257 | 18,861 | |
| Freshpet, Inc. (a)(b) | 1,381 | 128,916 | |
| Kellogg Co. | 3,777 | 258,725 | |
| Lamb Weston Holdings, Inc. | 1,483 | 98,026 | |
| Pilgrim's Pride Corp. (a) | 733 | 20,781 | |
| The Hershey Co. | 4,242 | 957,716 | |
| 1,543,434 | |||
| Household Products - 0.4% | |||
| Church & Dwight Co., Inc. | 419 | 40,878 | |
| Colgate-Palmolive Co. | 14,973 | 1,153,670 | |
| Kimberly-Clark Corp. | 5,738 | 796,607 | |
| The Clorox Co. | 3,368 | 483,207 | |
| 2,474,362 | |||
| Personal Products - 0.3% | |||
| Estee Lauder Companies, Inc. Class A | 7,743 | 2,044,617 | |
| Herbalife Nutrition Ltd. (a) | 614 | 16,320 | |
| Olaplex Holdings, Inc. (b) | 437 | 6,424 | |
| 2,067,361 | |||
| Tobacco - 0.3% | |||
| Altria Group, Inc. | 34,309 | 1,906,551 | |
| TOTAL CONSUMER STAPLES | 30,930,123 | ||
| ENERGY - 0.5% | |||
| Energy Equipment & Services - 0.0% | |||
| Halliburton Co. | 1,649 | 58,737 | |
| Oil, Gas & Consumable Fuels - 0.5% | |||
| Cheniere Energy, Inc. | 7,914 | 1,074,800 | |
| Continental Resources, Inc. | 192 | 10,669 | |
| Coterra Energy, Inc. | 4,343 | 125,035 | |
| Diamondback Energy, Inc. | 2,890 | 364,805 | |
| EOG Resources, Inc. | 2,340 | 273,218 | |
| Hess Corp. | 648 | 66,789 | |
| New Fortress Energy, Inc. | 946 | 36,686 | |
| Occidental Petroleum Corp. | 3,624 | 199,646 | |
| Pioneer Natural Resources Co. | 3,250 | 755,528 | |
| Texas Pacific Land Corp. | 199 | 271,953 | |
| 3,179,129 | |||
| TOTAL ENERGY | 3,237,866 | ||
| FINANCIALS - 2.5% | |||
| Banks - 0.0% | |||
| Citizens Financial Group, Inc. | 3,412 | 134,433 | |
| Synovus Financial Corp. | 302 | 12,545 | |
| Western Alliance Bancorp. | 1,855 | 141,184 | |
| 288,162 | |||
| Capital Markets - 1.5% | |||
| Ameriprise Financial, Inc. | 2,114 | 561,246 | |
| Ares Management Corp. | 4,220 | 279,448 | |
| Blackstone, Inc. | 23,710 | 2,408,225 | |
| FactSet Research Systems, Inc. | 1,103 | 445,049 | |
| Goldman Sachs Group, Inc. | 677 | 206,817 | |
| LPL Financial | 2,690 | 505,370 | |
| MarketAxess Holdings, Inc. | 1,263 | 332,939 | |
| Moody's Corp. | 5,203 | 1,646,645 | |
| Morningstar, Inc. | 716 | 181,313 | |
| MSCI, Inc. | 1,895 | 798,269 | |
| Raymond James Financial, Inc. | 319 | 31,090 | |
| S&P Global, Inc. | 5,768 | 2,171,652 | |
| T. Rowe Price Group, Inc. | 2,549 | 313,629 | |
| 9,881,692 | |||
| Consumer Finance - 0.5% | |||
| American Express Co. | 13,257 | 2,316,130 | |
| Credit Acceptance Corp. (a) | 18 | 9,225 | |
| Discover Financial Services | 5,355 | 602,223 | |
| Synchrony Financial | 3,300 | 121,473 | |
| Upstart Holdings, Inc. (a)(b) | 1,624 | 121,832 | |
| 3,170,883 | |||
| Diversified Financial Services - 0.1% | |||
| Apollo Global Management, Inc. | 7,979 | 397,035 | |
| Insurance - 0.4% | |||
| Alleghany Corp. (a) | 50 | 41,825 | |
| Aon PLC | 4,353 | 1,253,620 | |
| Arch Capital Group Ltd. (a) | 3,009 | 137,421 | |
| Brown & Brown, Inc. | 467 | 28,945 | |
| Erie Indemnity Co. Class A | 596 | 95,527 | |
| Everest Re Group Ltd. | 292 | 80,215 | |
| GoHealth, Inc. (a)(b) | 1,184 | 885 | |
| Lemonade, Inc. (a)(b) | 114 | 2,378 | |
| Lincoln National Corp. | 894 | 53,774 | |
| Markel Corp. (a) | 76 | 102,849 | |
| Marsh & McLennan Companies, Inc. | 2,028 | 327,928 | |
| RenaissanceRe Holdings Ltd. | 652 | 93,575 | |
| 2,218,942 | |||
| Thrifts & Mortgage Finance - 0.0% | |||
| Rocket Companies, Inc. (b) | 4,336 | 38,374 | |
| UWM Holdings Corp. Class A (b) | 1,220 | 4,526 | |
| 42,900 | |||
| TOTAL FINANCIALS | 15,999,614 | ||
| HEALTH CARE - 9.0% | |||
| Biotechnology - 2.9% | |||
| AbbVie, Inc. | 59,768 | 8,778,724 | |
| Alnylam Pharmaceuticals, Inc. (a) | 4,053 | 540,792 | |
| Amgen, Inc. | 15,538 | 3,623,306 | |
| CureVac NV (a)(b) | 1,798 | 30,728 | |
| Exact Sciences Corp. (a)(b) | 5,403 | 297,435 | |
| Exelixis, Inc. (a) | 8,947 | 199,876 | |
| Horizon Therapeutics PLC (a) | 1,377 | 135,717 | |
| Incyte Corp. (a) | 5,340 | 400,286 | |
| Ionis Pharmaceuticals, Inc. (a) | 4,365 | 160,457 | |
| Iovance Biotherapeutics, Inc. (a) | 1,592 | 24,119 | |
| Mirati Therapeutics, Inc. (a) | 1,216 | 75,137 | |
| Moderna, Inc. (a) | 11,444 | 1,538,188 | |
| Natera, Inc. (a) | 2,631 | 92,401 | |
| Neurocrine Biosciences, Inc. (a) | 3,158 | 284,315 | |
| Novavax, Inc. (a)(b) | 2,548 | 114,838 | |
| Regeneron Pharmaceuticals, Inc. (a) | 369 | 243,212 | |
| Repligen Corp. (a) | 1,742 | 273,912 | |
| Sarepta Therapeutics, Inc. (a) | 2,814 | 203,508 | |
| Seagen, Inc. (a) | 4,074 | 533,735 | |
| Ultragenyx Pharmaceutical, Inc. (a) | 1,649 | 116,568 | |
| Vertex Pharmaceuticals, Inc. (a) | 3,441 | 940,150 | |
| 18,607,404 | |||
| Health Care Equipment & Supplies - 2.4% | |||
| Abbott Laboratories | 29,377 | 3,334,290 | |
| Abiomed, Inc. (a) | 1,497 | 429,010 | |
| Align Technology, Inc. (a) | 2,661 | 771,451 | |
| DexCom, Inc. (a) | 3,258 | 1,331,154 | |
| Edwards Lifesciences Corp. (a) | 20,896 | 2,210,379 | |
| Figs, Inc. Class A (a)(b) | 651 | 10,195 | |
| Globus Medical, Inc. (a) | 114 | 7,549 | |
| IDEXX Laboratories, Inc. (a) | 2,860 | 1,231,173 | |
| Insulet Corp. (a)(b) | 2,234 | 533,904 | |
| Intuitive Surgical, Inc. (a) | 11,985 | 2,868,011 | |
| Masimo Corp. (a) | 1,226 | 138,501 | |
| Novocure Ltd. (a) | 3,459 | 264,890 | |
| Penumbra, Inc. (a) | 1,169 | 201,723 | |
| ResMed, Inc. | 4,376 | 875,069 | |
| STERIS PLC | 404 | 90,516 | |
| Stryker Corp. | 5,034 | 1,214,503 | |
| Tandem Diabetes Care, Inc. (a) | 1,965 | 189,583 | |
| Teleflex, Inc. | 287 | 81,973 | |
| 15,783,874 | |||
| Health Care Providers & Services - 0.7% | |||
| agilon health, Inc. (a) | 5,296 | 94,110 | |
| Amedisys, Inc. (a) | 959 | 122,416 | |
| Cardinal Health, Inc. | 5,541 | 321,655 | |
| Chemed Corp. | 130 | 63,881 | |
| DaVita HealthCare Partners, Inc. (a) | 1,507 | 163,314 | |
| Encompass Health Corp. | 1,892 | 130,226 | |
| Guardant Health, Inc. (a) | 3,036 | 187,321 | |
| HCA Holdings, Inc. | 8,279 | 1,776,259 | |
| McKesson Corp. | 730 | 226,015 | |
| Molina Healthcare, Inc. (a) | 303 | 94,975 | |
| Oak Street Health, Inc. (a)(b) | 2,874 | 51,991 | |
| UnitedHealth Group, Inc. | 2,196 | 1,116,776 | |
| 4,348,939 | |||
| Health Care Technology - 0.1% | |||
| Certara, Inc. (a) | 2,180 | 40,003 | |
| Definitive Healthcare Corp. (b) | 381 | 9,011 | |
| Veeva Systems, Inc. Class A (a) | 4,681 | 851,708 | |
| 900,722 | |||
| Life Sciences Tools & Services - 1.4% | |||
| 10X Genomics, Inc. (a) | 2,859 | 136,546 | |
| Adaptive Biotechnologies Corp. (a) | 3,012 | 24,849 | |
| Agilent Technologies, Inc. | 9,086 | 1,083,687 | |
| Avantor, Inc. (a) | 20,349 | 648,726 | |
| Azenta, Inc. (b) | 2,041 | 152,993 | |
| Bio-Techne Corp. | 1,322 | 501,950 | |
| Bruker Corp. | 3,460 | 198,915 | |
| Charles River Laboratories International, Inc. (a) | 1,578 | 381,103 | |
| Danaher Corp. | 1,115 | 280,010 | |
| Illumina, Inc. (a) | 4,934 | 1,463,671 | |
| IQVIA Holdings, Inc. (a) | 3,185 | 694,298 | |
| Maravai LifeSciences Holdings, Inc. (a) | 3,709 | 113,978 | |
| Mettler-Toledo International, Inc. (a) | 766 | 978,588 | |
| Sotera Health Co. (a) | 3,359 | 68,456 | |
| Syneos Health, Inc. (a) | 431 | 31,502 | |
| Thermo Fisher Scientific, Inc. | 1,196 | 661,292 | |
| Waters Corp. (a) | 1,901 | 576,041 | |
| West Pharmaceutical Services, Inc. | 2,484 | 782,609 | |
| 8,779,214 | |||
| Pharmaceuticals - 1.5% | |||
| Catalent, Inc. (a) | 1,351 | 122,347 | |
| Eli Lilly & Co. | 22,654 | 6,617,913 | |
| Royalty Pharma PLC | 6,507 | 277,068 | |
| Zoetis, Inc. Class A | 15,226 | 2,698,809 | |
| 9,716,137 | |||
| TOTAL HEALTH CARE | 58,136,290 | ||
| INDUSTRIALS - 6.3% | |||
| Aerospace & Defense - 0.7% | |||
| Axon Enterprise, Inc. (a) | 2,194 | 246,167 | |
| BWX Technologies, Inc. | 2,346 | 121,804 | |
| HEICO Corp. (b) | 137 | 19,349 | |
| HEICO Corp. Class A | 1,306 | 152,332 | |
| Howmet Aerospace, Inc. | 984 | 33,574 | |
| Lockheed Martin Corp. | 7,175 | 3,100,461 | |
| Northrop Grumman Corp. | 431 | 189,381 | |
| Spirit AeroSystems Holdings, Inc. Class A | 980 | 41,199 | |
| TransDigm Group, Inc. (a) | 511 | 303,948 | |
| Virgin Galactic Holdings, Inc. (a)(b) | 5,252 | 39,337 | |
| 4,247,552 | |||
| Air Freight & Logistics - 0.9% | |||
| C.H. Robinson Worldwide, Inc. | 859 | 91,183 | |
| Expeditors International of Washington, Inc. | 4,146 | 410,744 | |
| FedEx Corp. | 3,608 | 717,054 | |
| GXO Logistics, Inc. (a) | 2,805 | 166,028 | |
| United Parcel Service, Inc. Class B | 24,484 | 4,406,630 | |
| 5,791,639 | |||
| Airlines - 0.2% | |||
| Delta Air Lines, Inc. (a) | 21,615 | 930,093 | |
| Building Products - 0.3% | |||
| Advanced Drain Systems, Inc. | 2,074 | 212,502 | |
| Allegion PLC | 2,310 | 263,894 | |
| Armstrong World Industries, Inc. | 752 | 63,664 | |
| Carlisle Companies, Inc. | 666 | 172,734 | |
| Carrier Global Corp. | 13,552 | 518,635 | |
| Fortune Brands Home & Security, Inc. | 1,192 | 84,930 | |
| The AZEK Co., Inc. (a) | 2,083 | 44,243 | |
| Trane Technologies PLC | 3,840 | 537,178 | |
| Trex Co., Inc. (a) | 3,912 | 227,639 | |
| 2,125,419 | |||
| Commercial Services & Supplies - 0.4% | |||
| Cintas Corp. | 2,768 | 1,099,616 | |
| Copart, Inc. (a) | 7,069 | 803,392 | |
| IAA, Inc. (a) | 4,560 | 167,124 | |
| MSA Safety, Inc. | 336 | 40,552 | |
| Rollins, Inc. | 7,116 | 238,671 | |
| Waste Management, Inc. | 2,271 | 373,443 | |
| 2,722,798 | |||
| Electrical Equipment - 0.3% | |||
| Fluence Energy, Inc. (b) | 381 | 3,494 | |
| Generac Holdings, Inc. (a) | 2,074 | 454,994 | |
| Plug Power, Inc. (a)(b) | 17,302 | 363,688 | |
| Regal Rexnord Corp. | 467 | 59,421 | |
| Rockwell Automation, Inc. | 2,385 | 602,618 | |
| Vertiv Holdings Co. | 10,872 | 136,226 | |
| 1,620,441 | |||
| Industrial Conglomerates - 0.2% | |||
| 3M Co. | 2,817 | 406,268 | |
| Honeywell International, Inc. | 5,016 | 970,646 | |
| 1,376,914 | |||
| Machinery - 1.6% | |||
| AGCO Corp. | 219 | 27,901 | |
| Allison Transmission Holdings, Inc. | 2,663 | 99,703 | |
| Caterpillar, Inc. | 15,780 | 3,322,321 | |
| Deere & Co. | 9,434 | 3,561,807 | |
| Donaldson Co., Inc. | 463 | 22,706 | |
| Graco, Inc. | 3,525 | 218,621 | |
| Illinois Tool Works, Inc. | 9,543 | 1,881,021 | |
| Lincoln Electric Holdings, Inc. | 1,940 | 261,376 | |
| Middleby Corp. (a) | 571 | 87,871 | |
| Nordson Corp. | 327 | 70,531 | |
| Parker Hannifin Corp. | 723 | 195,803 | |
| Toro Co. | 3,348 | 268,275 | |
| Xylem, Inc. | 3,990 | 321,195 | |
| 10,339,131 | |||
| Professional Services - 0.4% | |||
| Booz Allen Hamilton Holding Corp. Class A | 4,437 | 362,192 | |
| CoStar Group, Inc. (a) | 10,276 | 653,759 | |
| Equifax, Inc. | 1,565 | 318,509 | |
| LegalZoom.com, Inc. (b) | 1,908 | 27,380 | |
| Robert Half International, Inc. | 3,214 | 315,968 | |
| TransUnion Holding Co., Inc. | 4,420 | 386,838 | |
| Verisk Analytics, Inc. | 3,418 | 697,443 | |
| 2,762,089 | |||
| Road & Rail - 1.0% | |||
| J.B. Hunt Transport Services, Inc. | 2,523 | 431,055 | |
| Landstar System, Inc. | 1,146 | 177,515 | |
| Lyft, Inc. (a) | 9,948 | 324,305 | |
| Old Dominion Freight Lines, Inc. | 3,183 | 891,622 | |
| TuSimple Holdings, Inc. (a)(b) | 436 | 4,521 | |
| Uber Technologies, Inc. (a) | 46,726 | 1,470,934 | |
| Union Pacific Corp. | 13,746 | 3,220,550 | |
| XPO Logistics, Inc. (a) | 2,806 | 150,935 | |
| 6,671,437 | |||
| Trading Companies & Distributors - 0.3% | |||
| Core & Main, Inc. (b) | 935 | 22,216 | |
| Fastenal Co. | 17,204 | 951,553 | |
| SiteOne Landscape Supply, Inc. (a) | 777 | 109,580 | |
| United Rentals, Inc. (a) | 849 | 268,725 | |
| W.W. Grainger, Inc. | 1,289 | 644,539 | |
| 1,996,613 | |||
| TOTAL INDUSTRIALS | 40,584,126 | ||
| INFORMATION TECHNOLOGY - 45.8% | |||
| Communications Equipment - 0.1% | |||
| Arista Networks, Inc. (a) | 7,280 | 841,350 | |
| CommScope Holding Co., Inc. (a) | 6,855 | 41,336 | |
| Ubiquiti, Inc. (b) | 184 | 51,934 | |
| 934,620 | |||
| Electronic Equipment & Components - 0.6% | |||
| Amphenol Corp. Class A | 14,035 | 1,003,503 | |
| CDW Corp. | 4,578 | 747,038 | |
| Cognex Corp. | 5,779 | 390,834 | |
| Coherent, Inc. (a) | 740 | 198,246 | |
| Corning, Inc. | 8,695 | 305,977 | |
| IPG Photonics Corp. (a) | 75 | 7,086 | |
| Jabil, Inc. | 3,742 | 216,026 | |
| Keysight Technologies, Inc. (a) | 2,704 | 379,290 | |
| Vontier Corp. | 3,164 | 81,062 | |
| Zebra Technologies Corp. Class A (a) | 1,800 | 665,388 | |
| 3,994,450 | |||
| IT Services - 6.8% | |||
| Accenture PLC Class A | 17,298 | 5,195,627 | |
| Automatic Data Processing, Inc. | 13,066 | 2,850,740 | |
| Block, Inc. Class A (a) | 16,228 | 1,615,335 | |
| Broadridge Financial Solutions, Inc. | 3,548 | 511,373 | |
| Cloudflare, Inc. (a) | 8,350 | 719,269 | |
| EPAM Systems, Inc. (a) | 1,819 | 482,017 | |
| Euronet Worldwide, Inc. (a) | 1,211 | 147,318 | |
| Fiserv, Inc. (a) | 1,375 | 134,640 | |
| FleetCor Technologies, Inc. (a) | 614 | 153,205 | |
| Gartner, Inc. (a) | 2,703 | 785,357 | |
| Genpact Ltd. | 250 | 10,068 | |
| Globant SA (a) | 1,366 | 295,042 | |
| GoDaddy, Inc. (a) | 557 | 45,011 | |
| Jack Henry & Associates, Inc. | 638 | 120,952 | |
| MasterCard, Inc. Class A | 29,206 | 10,612,876 | |
| MongoDB, Inc. Class A (a) | 2,146 | 761,680 | |
| Okta, Inc. (a) | 4,261 | 508,380 | |
| Paychex, Inc. | 9,492 | 1,202,921 | |
| PayPal Holdings, Inc. (a) | 39,756 | 3,495,745 | |
| Sabre Corp. (a) | 10,864 | 113,746 | |
| Shift4 Payments, Inc. (a)(b) | 1,454 | 76,277 | |
| Snowflake, Inc. (a) | 6,440 | 1,104,074 | |
| StoneCo Ltd. Class A (a)(b) | 7,037 | 66,289 | |
| Switch, Inc. Class A | 3,898 | 116,394 | |
| The Western Union Co. | 3,403 | 57,034 | |
| Thoughtworks Holding, Inc. | 406 | 7,515 | |
| Twilio, Inc. Class A (a) | 1,583 | 177,011 | |
| Visa, Inc. Class A | 56,138 | 11,964,692 | |
| WEX, Inc. (a) | 1,013 | 168,401 | |
| Wix.com Ltd. (a) | 1,802 | 135,979 | |
| 43,634,968 | |||
| Semiconductors & Semiconductor Equipment - 7.7% | |||
| Advanced Micro Devices, Inc. (a) | 55,271 | 4,726,776 | |
| Allegro MicroSystems LLC (a) | 1,323 | 32,162 | |
| Analog Devices, Inc. | 7,065 | 1,090,695 | |
| Applied Materials, Inc. | 29,987 | 3,309,065 | |
| Broadcom, Inc. | 13,656 | 7,570,750 | |
| Enphase Energy, Inc. (a) | 4,399 | 709,999 | |
| Entegris, Inc. | 4,549 | 506,713 | |
| GlobalFoundries, Inc. | 973 | 50,878 | |
| KLA Corp. | 5,129 | 1,637,485 | |
| Lam Research Corp. | 4,757 | 2,215,620 | |
| Microchip Technology, Inc. | 15,507 | 1,011,056 | |
| Micron Technology, Inc. | 5,231 | 356,702 | |
| MKS Instruments, Inc. | 1,578 | 179,860 | |
| Monolithic Power Systems, Inc. | 1,532 | 600,912 | |
| NVIDIA Corp. | 80,941 | 15,012,127 | |
| NXP Semiconductors NV | 2,751 | 470,146 | |
| onsemi (a) | 7,743 | 403,488 | |
| Qualcomm, Inc. | 38,163 | 5,330,989 | |
| Skyworks Solutions, Inc. | 2,631 | 298,092 | |
| Teradyne, Inc. | 5,506 | 580,663 | |
| Texas Instruments, Inc. | 19,372 | 3,298,083 | |
| Universal Display Corp. | 1,463 | 186,869 | |
| 49,579,130 | |||
| Software - 17.6% | |||
| Adobe, Inc. (a) | 15,939 | 6,311,047 | |
| Alteryx, Inc. Class A (a) | 1,986 | 127,501 | |
| Anaplan, Inc. (a) | 4,845 | 314,877 | |
| ANSYS, Inc. (a) | 1,224 | 337,445 | |
| Aspen Technology, Inc. (a) | 2,257 | 357,825 | |
| Atlassian Corp. PLC (a) | 4,711 | 1,059,174 | |
| Autodesk, Inc. (a) | 7,446 | 1,409,379 | |
| Avalara, Inc. (a) | 2,894 | 220,147 | |
| Bentley Systems, Inc. Class B (b) | 4,659 | 197,495 | |
| Bill.Com Holdings, Inc. (a) | 3,156 | 538,761 | |
| C3.Ai, Inc. (a)(b) | 645 | 10,959 | |
| Cadence Design Systems, Inc. (a) | 9,287 | 1,400,944 | |
| CDK Global, Inc. | 587 | 31,939 | |
| Citrix Systems, Inc. | 1,488 | 148,949 | |
| Coupa Software, Inc. (a) | 2,516 | 217,131 | |
| Crowdstrike Holdings, Inc. (a) | 6,738 | 1,339,245 | |
| Datadog, Inc. Class A (a) | 8,597 | 1,038,346 | |
| DocuSign, Inc. (a) | 6,519 | 528,039 | |
| DoubleVerify Holdings, Inc. (a) | 1,954 | 42,500 | |
| Dropbox, Inc. Class A (a) | 10,015 | 217,826 | |
| Duck Creek Technologies, Inc. (a) | 459 | 7,312 | |
| Dynatrace, Inc. (a) | 6,323 | 242,550 | |
| Elastic NV (a) | 2,532 | 192,786 | |
| Everbridge, Inc. (a) | 1,301 | 56,073 | |
| Fair Isaac Corp. (a) | 860 | 321,219 | |
| Five9, Inc. (a) | 2,279 | 250,918 | |
| Fortinet, Inc. (a) | 4,526 | 1,308,059 | |
| HubSpot, Inc. (a) | 1,523 | 577,872 | |
| Informatica, Inc. (b) | 883 | 17,183 | |
| Intuit, Inc. | 8,980 | 3,760,375 | |
| Jamf Holding Corp. (a)(b) | 1,601 | 49,311 | |
| Mandiant, Inc. (a) | 2,312 | 50,818 | |
| Manhattan Associates, Inc. (a) | 1,138 | 148,566 | |
| Microsoft Corp. | 254,973 | 70,760,107 | |
| nCino, Inc. (a)(b) | 1,960 | 73,480 | |
| NCR Corp. (a) | 1,535 | 53,771 | |
| New Relic, Inc. (a) | 1,778 | 112,494 | |
| NortonLifeLock, Inc. | 4,914 | 123,047 | |
| Nutanix, Inc. Class A (a) | 7,230 | 180,967 | |
| Oracle Corp. | 50,828 | 3,730,775 | |
| Palantir Technologies, Inc. (a) | 56,100 | 583,440 | |
| Palo Alto Networks, Inc. (a) | 3,268 | 1,834,263 | |
| Paycom Software, Inc. (a) | 1,651 | 464,707 | |
| Paycor HCM, Inc. (b) | 1,139 | 28,054 | |
| Paylocity Holding Corp. (a) | 1,342 | 254,483 | |
| Pegasystems, Inc. | 1,326 | 101,558 | |
| Procore Technologies, Inc. (a) | 1,489 | 82,595 | |
| PTC, Inc. (a) | 3,559 | 406,473 | |
| RingCentral, Inc. (a) | 2,761 | 234,271 | |
| Salesforce.com, Inc. (a) | 6,074 | 1,068,660 | |
| ServiceNow, Inc. (a) | 6,753 | 3,228,609 | |
| Smartsheet, Inc. (a) | 4,106 | 198,443 | |
| Splunk, Inc. (a) | 5,364 | 654,515 | |
| Synopsys, Inc. (a) | 3,250 | 932,068 | |
| Teradata Corp. (a) | 3,107 | 128,474 | |
| The Trade Desk, Inc. (a) | 14,677 | 864,769 | |
| Tyler Technologies, Inc. (a) | 1,177 | 464,574 | |
| Unity Software, Inc. (a)(b) | 5,092 | 338,160 | |
| VMware, Inc. Class A | 2,791 | 301,540 | |
| Workday, Inc. Class A (a) | 6,483 | 1,340,036 | |
| Zendesk, Inc. (a) | 4,072 | 496,947 | |
| Zoom Video Communications, Inc. Class A (a) | 7,355 | 732,337 | |
| Zscaler, Inc. (a) | 2,666 | 540,505 | |
| 113,146,693 | |||
| Technology Hardware, Storage & Peripherals - 13.0% | |||
| Apple, Inc. | 522,228 | 82,329,238 | |
| Dell Technologies, Inc. | 4,456 | 209,477 | |
| HP, Inc. | 12,707 | 465,457 | |
| NetApp, Inc. | 4,985 | 365,151 | |
| Pure Storage, Inc. Class A (a) | 8,630 | 252,859 | |
| 83,622,182 | |||
| TOTAL INFORMATION TECHNOLOGY | 294,912,043 | ||
| MATERIALS - 1.1% | |||
| Chemicals - 0.8% | |||
| Axalta Coating Systems Ltd. (a) | 1,211 | 30,723 | |
| Celanese Corp. Class A | 1,341 | 197,047 | |
| Diversey Holdings Ltd. (a) | 2,113 | 16,355 | |
| Dow, Inc. | 1,795 | 119,368 | |
| Ecolab, Inc. | 7,417 | 1,255,995 | |
| FMC Corp. | 1,084 | 143,673 | |
| LyondellBasell Industries NV Class A | 1,082 | 114,724 | |
| Olin Corp. | 353 | 20,262 | |
| PPG Industries, Inc. | 3,378 | 432,350 | |
| RPM International, Inc. | 2,522 | 209,074 | |
| Sherwin-Williams Co. | 8,133 | 2,236,250 | |
| The Chemours Co. LLC | 2,774 | 91,736 | |
| The Scotts Miracle-Gro Co. Class A (b) | 1,388 | 144,255 | |
| Westlake Corp. | 212 | 26,829 | |
| 5,038,641 | |||
| Containers & Packaging - 0.1% | |||
| Avery Dennison Corp. | 1,487 | 268,552 | |
| Ball Corp. | 3,176 | 257,764 | |
| Crown Holdings, Inc. | 490 | 53,920 | |
| Graphic Packaging Holding Co. | 2,764 | 60,255 | |
| Sealed Air Corp. | 2,712 | 174,138 | |
| 814,629 | |||
| Metals & Mining - 0.2% | |||
| Freeport-McMoRan, Inc. | 14,498 | 587,894 | |
| Southern Copper Corp. | 2,595 | 161,591 | |
| Steel Dynamics, Inc. | 1,191 | 102,128 | |
| 851,613 | |||
| Paper & Forest Products - 0.0% | |||
| Louisiana-Pacific Corp. | 197 | 12,710 | |
| TOTAL MATERIALS | 6,717,593 | ||
| REAL ESTATE - 1.9% | |||
| Equity Real Estate Investment Trusts (REITs) - 1.8% | |||
| American Tower Corp. | 15,269 | 3,680,134 | |
| Crown Castle International Corp. | 14,574 | 2,699,251 | |
| Equinix, Inc. | 2,146 | 1,543,146 | |
| Equity Lifestyle Properties, Inc. | 3,161 | 244,282 | |
| Extra Space Storage, Inc. | 385 | 73,150 | |
| Iron Mountain, Inc. | 6,817 | 366,277 | |
| Lamar Advertising Co. Class A | 2,547 | 281,214 | |
| Public Storage | 3,894 | 1,446,621 | |
| SBA Communications Corp. Class A | 611 | 212,084 | |
| Simon Property Group, Inc. | 9,583 | 1,130,794 | |
| 11,676,953 | |||
| Real Estate Management & Development - 0.1% | |||
| CBRE Group, Inc. | 604 | 50,156 | |
| Opendoor Technologies, Inc. (a)(b) | 3,119 | 21,802 | |
| Zillow Group, Inc.: | |||
| Class A (a) | 1,994 | 77,068 | |
| Class C (a)(b) | 5,643 | 224,704 | |
| 373,730 | |||
| TOTAL REAL ESTATE | 12,050,683 | ||
| UTILITIES - 0.0% | |||
| Electric Utilities - 0.0% | |||
| NRG Energy, Inc. | 3,737 | 134,158 | |
| Independent Power and Renewable Electricity Producers - 0.0% | |||
| Brookfield Renewable Corp. | 1,064 | 38,198 | |
| TOTAL UTILITIES | 172,356 | ||
| TOTAL COMMON STOCKS | |||
| (Cost $505,099,797) | 639,326,450 | ||
| Principal Amount | Value | ||
| U.S. Treasury Obligations - 0.1% | |||
| U.S. Treasury Bills, yield at date of purchase 1.23% 1/26/23 (c) | |||
| (Cost $396,357) | 400,000 | 395,147 | |
| Shares | Value | ||
| Money Market Funds - 1.5% | |||
| Fidelity Cash Central Fund 0.32% (d) | 5,232,119 | $5,233,166 | |
| Fidelity Securities Lending Cash Central Fund 0.32% (d)(e) | 4,375,295 | 4,375,732 | |
| TOTAL MONEY MARKET FUNDS | |||
| (Cost $9,608,898) | 9,608,898 | ||
| TOTAL INVESTMENT IN SECURITIES - 100.9% | |||
| (Cost $515,105,052) | 649,330,495 | ||
| NET OTHER ASSETS (LIABILITIES) - (0.9)% | (5,838,341) | ||
| NET ASSETS - 100% | $643,492,154 |
| Futures Contracts | |||||
| Number of contracts | Expiration Date | Notional Amount | Value | Unrealized Appreciation/(Depreciation) | |
| Purchased | |||||
| Equity Index Contracts | |||||
| CME E-mini NASDAQ 100 Index Contracts (United States) | 11 | June 2022 | $2,827,440 | $(29,825) | $(29,825) |
| CME E-mini S&P 500 Index Contracts (United States) | 3 | June 2022 | 619,125 | (7,465) | (7,465) |
| TOTAL FUTURES CONTRACTS | $(37,290) |
The notional amount of futures purchased as a percentage of Net Assets is 0.5%
(a) Non-income producing
(b) Security or a portion of the security is on loan at period end.
(c) Security or a portion of the security was pledged to cover margin requirements for futures contracts. At period end, the value of securities pledged amounted to $254,870.
(d) Affiliated fund that is generally available only to investment companies and other accounts managed by Fidelity Investments. The rate quoted is the annualized seven-day yield of the fund at period end. A complete unaudited listing of the fund's holdings as of its most recent quarter end is available upon request. In addition, each Fidelity Central Fund's financial statements [[, which are not covered by the Fund's Report of Independent Registered Public Accounting Firm,]] are available on the SEC's website or upon request.
(e) Investment made with cash collateral received from securities on loan.
Affiliated Central Funds
Fiscal year to date information regarding the Fund's investments in Fidelity Central Funds, including the ownership percentage, is presented below.
| Fund | Value, beginning of period | Purchases | Sales Proceeds | Dividend Income | Realized Gain/Loss | Change in Unrealized appreciation (depreciation) | Value, end of period | % ownership, end of period |
| Fidelity Cash Central Fund 0.32% | $3,818,147 | $274,694,688 | $273,279,669 | $2,963 | $-- | $-- | $5,233,166 | 0.0% |
| Fidelity Securities Lending Cash Central Fund 0.32% | 2,195,182 | 31,181,535 | 29,000,985 | 16,693 | -- | -- | 4,375,732 | 0.0% |
| Total | $6,013,329 | $305,876,223 | $302,280,654 | $19,656 | $-- | $-- | $9,608,898 |
Amounts in the income column in the above table include any capital gain distributions from underlying funds, which are presented in the corresponding line-item in the Statement of Operations, if applicable. Amount for Fidelity Securities Lending Cash Central Fund represents the income earned on investing cash collateral, less rebates paid to borrowers and any lending agent fees associated with the loan, plus any premium payments received for lending certain types of securities.
Investment Valuation
The following is a summary of the inputs used, as of April 30, 2022, involving the Fund's assets and liabilities carried at fair value. The inputs or methodology used for valuing securities may not be an indication of the risk associated with investing in those securities. For more information on valuation inputs, and their aggregation into the levels used below, please refer to the Investment Valuation section in the accompanying Notes to Financial Statements.
| Valuation Inputs at Reporting Date: | ||||
| Description | Total | Level 1 | Level 2 | Level 3 |
| Investments in Securities: | ||||
| Equities: | ||||
| Communication Services | $61,964,265 | $61,964,265 | $-- | $-- |
| Consumer Discretionary | 114,621,491 | 114,621,491 | -- | -- |
| Consumer Staples | 30,930,123 | 30,930,123 | -- | -- |
| Energy | 3,237,866 | 3,237,866 | -- | -- |
| Financials | 15,999,614 | 15,999,614 | -- | -- |
| Health Care | 58,136,290 | 58,136,290 | -- | -- |
| Industrials | 40,584,126 | 40,584,126 | -- | -- |
| Information Technology | 294,912,043 | 294,912,043 | -- | -- |
| Materials | 6,717,593 | 6,717,593 | -- | -- |
| Real Estate | 12,050,683 | 12,050,683 | -- | -- |
| Utilities | 172,356 | 172,356 | -- | -- |
| U.S. Government and Government Agency Obligations | 395,147 | -- | 395,147 | -- |
| Money Market Funds | 9,608,898 | 9,608,898 | -- | -- |
| Total Investments in Securities: | $649,330,495 | $648,935,348 | $395,147 | $-- |
| Derivative Instruments: | ||||
| Liabilities | ||||
| Futures Contracts | $(37,290) | $(37,290) | $-- | $-- |
| Total Liabilities | $(37,290) | $(37,290) | $-- | $-- |
| Total Derivative Instruments: | $(37,290) | $(37,290) | $-- | $-- |
Value of Derivative Instruments
The following table is a summary of the Fund's value of derivative instruments by primary risk exposure as of April 30, 2022. For additional information on derivative instruments, please refer to the Derivative Instruments section in the accompanying Notes to Financial Statements.
| Primary Risk Exposure / Derivative Type | Value | |
| Asset | Liability | |
| Equity Risk | ||
| Futures Contracts(a) | $0 | $(37,290) |
| Total Equity Risk | 0 | (37,290) |
| Total Value of Derivatives | $0 | $(37,290) |
(a) Reflects gross cumulative appreciation (depreciation) on futures contracts as presented in the Schedule of Investments. In the Statementof Assets and Liabilities, the period end daily variation margin is included in receivable or payable for daily variation margin on futurescontracts, and the net cumulative appreciation (depreciation) is included in Total accumulated earnings (loss).
See accompanying notes which are an integral part of the financial statements.
Financial Statements
Statement of Assets and Liabilities
| April 30, 2022 | ||
| Assets | ||
| Investment in securities, at value (including securities loaned of $4,142,370) — See accompanying schedule: Unaffiliated issuers (cost $505,496,154) | $639,721,597 | |
| Fidelity Central Funds (cost $9,608,898) | 9,608,898 | |
| Total Investment in Securities (cost $515,105,052) | $649,330,495 | |
| Receivable for fund shares sold | 37,924,630 | |
| Dividends receivable | 247,026 | |
| Distributions receivable from Fidelity Central Funds | 3,259 | |
| Total assets | 687,505,410 | |
| Liabilities | ||
| Payable for investments purchased | $39,549,377 | |
| Payable for fund shares redeemed | 34 | |
| Payable to investment adviser for expense recoupment | 740 | |
| Payable for daily variation margin on futures contracts | 78,793 | |
| Other payables and accrued expenses | 8,587 | |
| Collateral on securities loaned | 4,375,725 | |
| Total liabilities | 44,013,256 | |
| Net Assets | $643,492,154 | |
| Net Assets consist of: | ||
| Paid in capital | $513,649,379 | |
| Total accumulated earnings (loss) | 129,842,775 | |
| Net Assets | $643,492,154 | |
| Net Asset Value, offering price and redemption price per share ($643,492,154 ÷ 41,583,397 shares) | $15.47 |
See accompanying notes which are an integral part of the financial statements.
Statement of Operations
| Year ended April 30, 2022 | ||
| Investment Income | ||
| Dividends | $4,748,163 | |
| Interest | 638 | |
| Income from Fidelity Central Funds (including $16,693 from security lending) | 19,656 | |
| Total income | 4,768,457 | |
| Expenses | ||
| Custodian fees and expenses | $40,005 | |
| Independent trustees' fees and expenses | 1,903 | |
| Interest | 3,135 | |
| Total expenses before reductions | 45,043 | |
| Expense reductions | (20,586) | |
| Total expenses after reductions | 24,457 | |
| Net investment income (loss) | 4,744,000 | |
| Realized and Unrealized Gain (Loss) | ||
| Net realized gain (loss) on: | ||
| Investment securities: | ||
| Unaffiliated issuers | 10,919,374 | |
| Futures contracts | 236,529 | |
| Total net realized gain (loss) | 11,155,903 | |
| Change in net unrealized appreciation (depreciation) on: | ||
| Investment securities: | ||
| Unaffiliated issuers | (50,116,205) | |
| Futures contracts | (135,867) | |
| Total change in net unrealized appreciation (depreciation) | (50,252,072) | |
| Net gain (loss) | (39,096,169) | |
| Net increase (decrease) in net assets resulting from operations | $(34,352,169) |
See accompanying notes which are an integral part of the financial statements.
Statement of Changes in Net Assets
| Year ended April 30, 2022 | Year ended April 30, 2021 | |
| Increase (Decrease) in Net Assets | ||
| Operations | ||
| Net investment income (loss) | $4,744,000 | $3,449,054 |
| Net realized gain (loss) | 11,155,903 | 8,074,626 |
| Change in net unrealized appreciation (depreciation) | (50,252,072) | 148,292,243 |
| Net increase (decrease) in net assets resulting from operations | (34,352,169) | 159,815,923 |
| Distributions to shareholders | (20,151,918) | (11,868,794) |
| Share transactions | ||
| Proceeds from sales of shares | 328,924,069 | 237,076,669 |
| Reinvestment of distributions | 20,151,918 | 11,868,794 |
| Cost of shares redeemed | (197,089,005) | (148,710,860) |
| Net increase (decrease) in net assets resulting from share transactions | 151,986,982 | 100,234,603 |
| Total increase (decrease) in net assets | 97,482,895 | 248,181,732 |
| Net Assets | ||
| Beginning of period | 546,009,259 | 297,827,527 |
| End of period | $643,492,154 | $546,009,259 |
| Other Information | ||
| Shares | ||
| Sold | 18,966,983 | 15,983,864 |
| Issued in reinvestment of distributions | 1,064,704 | 873,907 |
| Redeemed | (10,844,228) | (10,316,427) |
| Net increase (decrease) | 9,187,459 | 6,541,344 |
See accompanying notes which are an integral part of the financial statements.
Financial Highlights
Fidelity Series Large Cap Growth Index Fund
| Years ended April 30, | 2022 | 2021 | 2020 | 2019 A |
| Selected Per–Share Data | ||||
| Net asset value, beginning of period | $16.85 | $11.52 | $10.54 | $10.00 |
| Income from Investment Operations | ||||
| Net investment income (loss)B,C | .13 | .12 | .14 | .06 |
| Net realized and unrealized gain (loss) | (.92) | 5.67 | .99 | .53 |
| Total from investment operations | (.79) | 5.79 | 1.13 | .59 |
| Distributions from net investment income | (.12) | (.13) | (.10) | (.05) |
| Distributions from net realized gain | (.46) | (.33) | (.05) | – |
| Total distributions | (.59)D | (.46) | (.15) | (.05) |
| Net asset value, end of period | $15.47 | $16.85 | $11.52 | $10.54 |
| Total ReturnE,F | (5.34)% | 51.21% | 10.77% | 5.97% |
| Ratios to Average Net AssetsC,G,H | ||||
| Expenses before reductions | .01% | .01% | .01% | .05%I |
| Expenses net of fee waivers, if any | - %J | - %J | .01% | .01%I |
| Expenses net of all reductions | - %J | - %J | .01% | .01%I |
| Net investment income (loss) | .73% | .85% | 1.24% | .85%I |
| Supplemental Data | ||||
| Net assets, end of period (000 omitted) | $643,492 | $546,009 | $297,828 | $263,824 |
| Portfolio turnover rateK | 40% | 40% | 45% | 21%I |
A For the period August 17, 2018 (commencement of operations) through April 30, 2019.
B Calculated based on average shares outstanding during the period.
C Net investment income (loss) is affected by the timing of the declaration of dividends by any underlying mutual funds or exchange-traded funds (ETFs). Net investment income (loss) of any such underlying funds is not included in the Fund's net investment income (loss) ratio.
D Total distributions per share do not sum due to rounding.
E Total returns for periods of less than one year are not annualized.
F Total returns would have been lower if certain expenses had not been reduced during the applicable periods shown.
G Fees and expenses of any underlying mutual funds or exchange-traded funds (ETFs) are not included in the Fund's expense ratio. The Fund indirectly bears its proportionate share of these expenses. For additional expense information related to investments in Fidelity Central Funds, please refer to the "Investments in Fidelity Central Funds" note found in the Notes to Financial Statements section of the most recent Annual or Semi-Annual report.
H Expense ratios reflect operating expenses of the class. Expenses before reductions do not reflect amounts reimbursed, waived, or reduced through arrangements with the investment adviser, brokerage services, or other offset arrangements, if applicable, and do not represent the amount paid by the class during periods when reimbursements, waivers or reductions occur.
I Annualized
J Amount represents less than .005%.
K Amount does not include the portfolio activity of any underlying mutual funds or exchange-traded funds (ETFs).
See accompanying notes which are an integral part of the financial statements.
Notes to Financial Statements
For the period ended April 30, 2022
1. Organization.
Fidelity Series Large Cap Growth Index Fund (the Fund) is a fund of Fidelity Salem Street Trust (the Trust) and is authorized to issue an unlimited number of shares. Shares are offered only to certain other Fidelity funds, Fidelity managed 529 plans, and Fidelity managed collective investment trusts. The Trust is registered under the Investment Company Act of 1940, as amended (the 1940 Act), as an open-end management investment company organized as a Massachusetts business trust. The Fund may operate as a non-diversified fund, as defined under the 1940 Act, to the approximate extent the Index is non-diversified.
2. Investments in Fidelity Central Funds.
Funds may invest in Fidelity Central Funds, which are open-end investment companies generally available only to other investment companies and accounts managed by the investment adviser and its affiliates. The Schedule of Investments lists any Fidelity Central Funds held as an investment as of period end, but does not include the underlying holdings of each Fidelity Central Fund. An investing fund indirectly bears its proportionate share of the expenses of the underlying Fidelity Central Funds.
Based on its investment objective, each Fidelity Central Fund may invest or participate in various investment vehicles or strategies that are similar to those of the investing fund. These strategies are consistent with the investment objectives of the investing fund and may involve certain economic risks which may cause a decline in value of each of the Fidelity Central Funds and thus a decline in the value of the investing fund.
| Fidelity Central Fund | Investment Manager | Investment Objective | Investment Practices | Expense Ratio(a) |
| Fidelity Money Market Central Funds | Fidelity Management & Research Company LLC (FMR) | Each fund seeks to obtain a high level of current income consistent with the preservation of capital and liquidity. | Short-term Investments | Less than .005% |
(a) Expenses expressed as a percentage of average net assets and are as of each underlying Central Fund's most recent annual or semi-annual shareholder report.
A complete unaudited list of holdings for each Fidelity Central Fund is available upon request or at the Securities and Exchange Commission website at www.sec.gov. In addition, the financial statements of the Fidelity Central Funds which contain the significant accounting policies (including investment valuation policies) of those funds, and are not covered by the Report of Independent Registered Public Accounting Firm, are available on the Securities and Exchange Commission website or upon request.
3. Significant Accounting Policies.
The Fund is an investment company and applies the accounting and reporting guidance of the Financial Accounting Standards Board (FASB) Accounting Standards Codification Topic 946 Financial Services - Investment Companies. The financial statements have been prepared in conformity with accounting principles generally accepted in the United States of America (GAAP), which require management to make certain estimates and assumptions at the date of the financial statements. Actual results could differ from those estimates. Subsequent events, if any, through the date that the financial statements were issued have been evaluated in the preparation of the financial statements. The Fund's Schedule of Investments lists any underlying mutual funds or exchange-traded funds (ETFs) but does not include the underlying holdings of these funds. The following summarizes the significant accounting policies of the Fund:
Investment Valuation. Investments are valued as of 4:00 p.m. Eastern time on the last calendar day of the period. The Board of Trustees (the Board) has delegated the day to day responsibility for the valuation of the Fund's investments to the Fair Value Committee (the Committee) established by the Fund's investment adviser. In accordance with valuation policies and procedures approved by the Board, the Fund attempts to obtain prices from one or more third party pricing vendors or brokers to value its investments. When current market prices, quotations or currency exchange rates are not readily available or reliable, investments will be fair valued in good faith by the Committee, in accordance with procedures adopted by the Board. Factors used in determining fair value vary by investment type and may include market or investment specific events,changes in interest rates and credit quality. The frequency with which these procedures are used cannot be predicted and they may be utilized to a significant extent. The Committee oversees the Fund's valuation policies and procedures and reports to the Board on the Committee's activities and fair value determinations. The Board monitors the appropriateness of the procedures used in valuing the Fund's investments and ratifies the fair value determinations of the Committee.
The Fund categorizes the inputs to valuation techniques used to value its investments into a disclosure hierarchy consisting of three levels as shown below:
- Level 1 – unadjusted quoted prices in active markets for identical investments
- Level 2 – other significant observable inputs (including quoted prices for similar investments, interest rates, prepayment speeds, etc.)
- Level 3 – unobservable inputs (including the Fund's own assumptions based on the best information available)
Valuation techniques used to value the Fund's investments by major category are as follows:
Equity securities, including restricted securities, for which market quotations are readily available, are valued at the last reported sale price or official closing price as reported by a third party pricing vendor on the primary market or exchange on which they are traded and are categorized as Level 1 in the hierarchy. In the event there were no sales during the day or closing prices are not available, securities are valued at the last quoted bid price or may be valued using the last available price and are generally categorized as Level 2 in the hierarchy. For foreign equity securities, when market or security specific events arise, comparisons to the valuation of American Depositary Receipts (ADRs), futures contracts, Exchange-Traded Funds (ETFs) and certain indexes as well as quoted prices for similar securities may be used and would be categorized as Level 2 in the hierarchy. For equity securities, including restricted securities, where observable inputs are limited, assumptions about market activity and risk are used and these securities may be categorized as Level 3 in the hierarchy.
Debt securities, including restricted securities, are valued based on evaluated prices received from third party pricing vendors or from brokers who make markets in such securities. U.S. government and government agency obligations are valued by pricing vendors who utilize matrix pricing which considers yield or price of bonds of comparable quality, coupon, maturity and type or by broker-supplied prices. When independent prices are unavailable or unreliable, debt securities may be valued utilizing pricing methodologies which consider similar factors that would be used by third party pricing vendors. Debt securities are generally categorized as Level 2 in the hierarchy but may be Level 3 depending on the circumstances.
Futures contracts are valued at the settlement price established each day by the board of trade or exchange on which they are traded and are categorized as Level 1 in the hierarchy. Investments in open-end mutual funds, including the Fidelity Central Funds, are valued at their closing net asset value (NAV) each business day and are categorized as Level 1 in the hierarchy.
Changes in valuation techniques may result in transfers in or out of an assigned level within the disclosure hierarchy. The aggregate value of investments by input level as of April 30, 2022 is included at the end of the Fund's Schedule of Investments.
Investment Transactions and Income. For financial reporting purposes, the Fund's investment holdings and NAV include trades executed through the end of the last business day of the period. The NAV per share for processing shareholder transactions is calculated as of the close of business of the New York Stock Exchange (NYSE), normally 4:00 p.m. Eastern time and includes trades executed through the end of the prior business day. Gains and losses on securities sold are determined on the basis of identified cost and include proceeds received from litigation. Commissions paid to certain brokers with whom the investment adviser, or its affiliates, places trades on behalf of a fund include an amount in addition to trade execution, which may be rebated back to a fund. Any such rebates are included in net realized gain (loss) on investments in the Statement of Operations. Dividend income is recorded on the ex-dividend date, except for certain dividends from foreign securities where the ex-dividend date may have passed, which are recorded as soon as the Fund is informed of the ex-dividend date. Non-cash dividends included in dividend income, if any, are recorded at the fair market value of the securities received. Income and capital gain distributions from Fidelity Central Funds, if any, are recorded on the ex-dividend date. Certain distributions received by the Fund represent a return of capital or capital gain. The Fund determines the components of these distributions subsequent to the ex-dividend date, based upon receipt of tax filings or other correspondence relating to the underlying investment. These distributions are recorded as a reduction of cost of investments and/or as a realized gain. Interest income is accrued as earned and includes coupon interest and amortization of premium and accretion of discount on debt securities as applicable.
Expenses. Expenses directly attributable to a fund are charged to that fund. Expenses attributable to more than one fund are allocated among the respective funds on the basis of relative net assets or other appropriate methods. Expenses included in the accompanying financial statements reflect the expenses of that fund and do not include any expenses associated with any underlying mutual funds or exchange-traded funds. Although not included in a fund's expenses, a fund indirectly bears its proportionate share of these expenses through the net asset value of each underlying mutual fund or exchange-traded fund. Expense estimates are accrued in the period to which they relate and adjustments are made when actual amounts are known.
Income Tax Information and Distributions to Shareholders. Each year, the Fund intends to qualify as a regulated investment company under Subchapter M of the Internal Revenue Code, including distributing substantially all of its taxable income and realized gains. As a result, no provision for U.S. Federal income taxes is required. As of April 30, 2022, the Fund did not have any unrecognized tax benefits in the financial statements; nor is the Fund aware of any tax positions for which it is reasonably possible that the total amounts of unrecognized tax benefits will significantly change in the next twelve months. The Fund files a U.S. federal tax return, in addition to state and local tax returns as required. The Fund's federal income tax returns are subject to examination by the Internal Revenue Service (IRS) for a period of three fiscal years after they are filed. State and local tax returns may be subject to examination for an additional fiscal year depending on the jurisdiction.
Distributions are declared and recorded on the ex-dividend date. Income and capital gain distributions are determined in accordance with income tax regulations, which may differ from GAAP.
Capital accounts within the financial statements are adjusted for permanent book-tax differences. These adjustments have no impact on net assets or the results of operations. Capital accounts are not adjusted for temporary book-tax differences which will reverse in a subsequent period.
Book-tax differences are primarily due to passive foreign investment companies (PFIC), futures contracts and losses deferred due to wash sales.
As of period end, the cost and unrealized appreciation (depreciation) in securities, and derivatives if applicable, for federal income tax purposes were as follows:
| Gross unrealized appreciation | $168,709,146 |
| Gross unrealized depreciation | (43,100,592) |
| Net unrealized appreciation (depreciation) | $125,608,554 |
| Tax Cost | $523,721,941 |
The tax-based components of distributable earnings as of period end were as follows:
| Undistributed ordinary income | $3,204,653 |
| Undistributed long-term capital gain | $1,029,568 |
| Net unrealized appreciation (depreciation) on securities and other investments | $125,608,554 |
The tax character of distributions paid was as follows:
| April 30, 2022 | April 30,2021 | |
| Ordinary Income | $9,665,986 | $ 8,687,561 |
| Long-term Capital Gains | 10,485,932 | 3,181,233 |
| Total | $20,151,918 | $ 11,868,794 |
4. Derivative Instruments.
Risk Exposures and the Use of Derivative Instruments. The Fund's investment objective allows the Fund to enter into various types of derivative contracts, including futures contract. Derivatives are investments whose value is primarily derived from underlying assets, indices or reference rates and may be transacted on an exchange or over-the-counter (OTC). Derivatives may involve a future commitment to buy or sell a specified asset based on specified terms, to exchange future cash flows at periodic intervals based on a notional principal amount, or for one party to make one or more payments upon the occurrence of specified events in exchange for periodic payments from the other party.
The Fund used derivatives to increase returns and to manage exposure to certain risks as defined below. The success of any strategy involving derivatives depends on analysis of numerous economic factors, and if the strategies for investment do not work as intended, the Fund may not achieve its objectives.
The Fund's use of derivatives increased or decreased its exposure to the following risk:
| Equity Risk | Equity risk relates to the fluctuations in the value of financial instruments as a result of changes in market prices (other than those arising from interest rate risk or foreign exchange risk), whether caused by factors specific to an individual investment, its issuer, or all factors affecting all instruments traded in a market or market segment. |
The Fund is also exposed to additional risks from investing in derivatives, such as liquidity risk and counterparty credit risk. Liquidity risk is the risk that the Fund will be unable to close out the derivative in the open market in a timely manner. Counterparty credit risk is the risk that the counterparty will not be able to fulfill its obligation to the Fund.
Investing in derivatives may involve greater risks than investing in the underlying assets directly and, to varying degrees, may involve risk of loss in excess of any initial investment and collateral received and amounts recognized in the Statement of Assets and Liabilities. In addition, there may be the risk that the change in value of the derivative contract does not correspond to the change in value of the underlying instrument.
Futures Contracts. A futures contract is an agreement between two parties to buy or sell a specified underlying instrument for a fixed price at a specified future date. The Fund used futures contracts to manage its exposure to the stock market.
Upon entering into a futures contract, a fund is required to deposit either cash or securities (initial margin) with a clearing broker in an amount equal to a certain percentage of the face value of the contract. Futures contracts are marked-to-market daily and subsequent daily payments (variation margin) are made or received by a fund depending on the daily fluctuations in the value of the futures contracts and are recorded as unrealized appreciation or (depreciation). This receivable and/or payable, if any, is included in daily variation margin on futures contracts in the Statement of Assets and Liabilities. Realized gain or (loss) is recorded upon the expiration or closing of a futures contract. The net realized gain (loss) and change in net unrealized appreciation (depreciation) on futures contracts during the period is presented in the Statement of Operations.
Any open futures contracts at period end are presented in the Schedule of Investments under the caption "Futures Contracts". The notional amount at value reflects each contract's exposure to the underlying instrument or index at period end and is representative of volume of activity during the period. Securities deposited to meet initial margin requirements are identified in the Schedule of Investments.
5. Purchases and Sales of Investments.
Purchases and sales of securities, other than short-term securities and in-kind transactions, as applicable are noted in the table below.
| Purchases ($) | Sales ($) | |
| Fidelity Series Large Cap Growth Index Fund | 390,436,068 | 255,179,117 |
6. Fees and Other Transactions with Affiliates.
Management Fee. Fidelity Management & Research Company LLC (the investment adviser) and its affiliates provide the Fund with investment management related services for which the Fund does not pay a management fee. Under the management contract, the investment adviser or an affiliate pays all ordinary operating expenses of the Fund, except custody fees, fees and expenses of the independent Trustees, and certain miscellaneous expenses such as proxy and shareholder meeting expenses.
Sub-Adviser. Geode Capital Management, LLC (Geode), serves as sub-adviser for the Fund. Geode provides discretionary investment advisory services to the Fund and is paid by the investment adviser for providing these services.
Interfund Lending Program. Pursuant to an Exemptive Order issued by the Securities and Exchange Commission (the SEC), the Fund, along with other registered investment companies having management contracts with Fidelity Management & Research Company LLC (FMR), or other affiliated entities of FMR, may participate in an interfund lending program. This program provides an alternative credit facility allowing the Fund to borrow from, or lend money to, other participating affiliated funds. At period end, there were no interfund loans outstanding. Activity in this program during the period for which loans were outstanding was as follows:
| Borrower or Lender | Average Loan Balance | Weighted Average Interest Rate | Interest Expense | |
| Fidelity Series Large Cap Growth Index Fund | Borrower | $17,564,857 | .46% | $3,135 |
Interfund Trades. Funds may purchase from or sell securities to other Fidelity Funds under procedures adopted by the Board. The procedures have been designed to ensure these interfund trades are executed in accordance with Rule 17a-7 of the 1940 Act. Any interfund trades are included within the respective purchases and sales amounts shown in the Purchases and Sales of Investments note. During the period there were no interfund trades.
7. Committed Line of Credit.
Certain Funds participate with other funds managed by the investment adviser or an affiliate in a $4.25 billion credit facility (the "line of credit") to be utilized for temporary or emergency purposes to fund shareholder redemptions or for other short-term liquidity purposes. The commitment fees on the pro-rata portion of the line of credit are borne by the investment adviser. During the period, there were no borrowings on this line of credit.
8. Security Lending.
Funds lend portfolio securities from time to time in order to earn additional income. Lending agents are used, including National Financial Services (NFS), an affiliate of the investment adviser. Pursuant to a securities lending agreement, NFS will receive a fee, which is capped at 9.9% of a fund's daily lending revenue, for its services as lending agent. A fund may lend securities to certain qualified borrowers, including NFS. On the settlement date of the loan, a fund receives collateral (in the form of U.S. Treasury obligations, letters of credit and/or cash) against the loaned securities and maintains collateral in an amount not less than 100% of the market value of the loaned securities during the period of the loan. The market value of the loaned securities is determined at the close of business of a fund and any additional required collateral is delivered to a fund on the next business day. A fund or borrower may terminate the loan at any time, and if the borrower defaults on its obligation to return the securities loaned because of insolvency or other reasons, a fund may apply collateral received from the borrower against the obligation. A fund may experience delays and costs in recovering the securities loaned. Any cash collateral received is invested in the Fidelity Securities Lending Cash Central Fund. Any loaned securities are identified as such in the Schedule of Investments, and the value of loaned securities and cash collateral at period end, as applicable, are presented in the Statement of Assets and Liabilities. Security lending income represents the income earned on investing cash collateral, less rebates paid to borrowers and any lending agent fees associated with the loan, plus any premium payments received for lending certain types of securities. Security lending income is presented in the Statement of Operations as a component of income from Fidelity Central Funds. Affiliated security lending activity, if any, was as follows:
| Total Security Lending Fees Paid to NFS | Security Lending Income From Securities Loaned to NFS | Value of Securities Loaned to NFS at Period End | |
| Fidelity Series Large Cap Growth Index Fund | $1,624 | $4,083 | $23,926 |
9. Expense Reductions.
The investment adviser contractually agreed to reimburse the Fund to the extent annual operating expenses exceeded .003% of average net assets. This reimbursement will remain in place through August 31, 2024. Some expenses, for example the compensation of the independent Trustees, and certain other expenses such as interest expense, are excluded from this reimbursement. During the period this reimbursement reduced the Fund's expenses by $20,586.
10. Other.
A fund's organizational documents provide former and current trustees and officers with a limited indemnification against liabilities arising in connection with the performance of their duties to the fund. In the normal course of business, a fund may also enter into contracts that provide general indemnifications. A fund's maximum exposure under these arrangements is unknown as this would be dependent on future claims that may be made against a fund. The risk of material loss from such claims is considered remote.
At the end of the period, mutual funds and accounts managed by the investment adviser or its affiliates were the owners of record of all of the outstanding shares of the Fund.
11. Coronavirus (COVID-19) Pandemic.
An outbreak of COVID-19 first detected in China during December 2019 has since spread globally and was declared a pandemic by the World Health Organization during March 2020. Developments that disrupt global economies and financial markets, such as the COVID-19 pandemic, may magnify factors that affect the Fund's performance.
Report of Independent Registered Public Accounting Firm
To the Board of Trustees of Fidelity Salem Street Trust and Shareholders of Fidelity Series Large Cap Growth Index Fund
Opinion on the Financial Statements and Financial Highlights
We have audited the accompanying statement of assets and liabilities of Fidelity Series Large Cap Growth Index Fund (the "Fund"), a fund of Fidelity Salem Street Trust, including the schedule of investments, as of April 30, 2022, the related statement of operations for the year then ended, the statement of changes in net assets for each of the two years in the period then ended, the financial highlights for each of the three years in the period then ended and for the period from August 17, 2018 (commencement of operations) to April 30, 2019, and the related notes. In our opinion, the financial statements and financial highlights present fairly, in all material respects, the financial position of the Fund as of April 30, 2022, and the results of its operations for the year then ended, the changes in its net assets for each of the two years in the period then ended, and the financial highlights for each of the three years in the period then ended and for the period from August 17, 2018 (commencement of operations) to April 30, 2019, in conformity with accounting principles generally accepted in the United States of America.
Basis for Opinion
These financial statements and financial highlights are the responsibility of the Fund's management. Our responsibility is to express an opinion on the Fund's financial statements and financial highlights based on our audits. We are a public accounting firm registered with the Public Company Accounting Oversight Board (United States) (PCAOB) and are required to be independent with respect to the Fund in accordance with the U.S. federal securities laws and the applicable rules and regulations of the Securities and Exchange Commission and the PCAOB.
We conducted our audits in accordance with the standards of the PCAOB. Those standards require that we plan and perform the audit to obtain reasonable assurance about whether the financial statements and financial highlights are free of material misstatement, whether due to error or fraud. The Fund is not required to have, nor were we engaged to perform, an audit of its internal control over financial reporting. As part of our audits we are required to obtain an understanding of internal control over financial reporting but not for the purpose of expressing an opinion on the effectiveness of the Fund’s internal control over financial reporting. Accordingly, we express no such opinion.
Our audits included performing procedures to assess the risks of material misstatement of the financial statements and financial highlights, whether due to error or fraud, and performing procedures that respond to those risks. Such procedures included examining, on a test basis, evidence regarding the amounts and disclosures in the financial statements and financial highlights. Our audits also included evaluating the accounting principles used and significant estimates made by management, as well as evaluating the overall presentation of the financial statements and financial highlights. Our procedures included confirmation of securities owned as of April 30, 2022, by correspondence with the custodian and brokers; when replies were not received from brokers, we performed other auditing procedures. We believe that our audits provide a reasonable basis for our opinion.
/s/ Deloitte & Touche LLP
Boston, Massachusetts
June 10, 2022
We have served as the auditor of one or more of the Fidelity investment companies since 1999.
Trustees and Officers
The Trustees, Members of the Advisory Board (if any), and officers of the trust and fund, as applicable, are listed below. The Board of Trustees governs the fund and is responsible for protecting the interests of shareholders. The Trustees are experienced executives who meet periodically throughout the year to oversee the fund's activities, review contractual arrangements with companies that provide services to the fund, oversee management of the risks associated with such activities and contractual arrangements, and review the fund's performance. Except for Jonathan Chiel, of the Trustees oversees 300 funds. Mr. Chiel oversees 190 funds.
The Trustees hold office without limit in time except that (a) any Trustee may resign; (b) any Trustee may be removed by written instrument, signed by at least two-thirds of the number of Trustees prior to such removal; (c) any Trustee who requests to be retired or who has become incapacitated by illness or injury may be retired by written instrument signed by a majority of the other Trustees; and (d) any Trustee may be removed at any special meeting of shareholders by a two-thirds vote of the outstanding voting securities of the trust. Each Trustee who is not an interested person (as defined in the 1940 Act) of the trust and the fund is referred to herein as an Independent Trustee. Each Independent Trustee shall retire not later than the last day of the calendar year in which his or her 75th birthday occurs. The Independent Trustees may waive this mandatory retirement age policy with respect to individual Trustees. Officers and Advisory Board Members hold office without limit in time, except that any officer or Advisory Board Member may resign or may be removed by a vote of a majority of the Trustees at any regular meeting or any special meeting of the Trustees. Except as indicated, each individual has held the office shown or other offices in the same company for the past five years.
The fund’s Statement of Additional Information (SAI) includes more information about the Trustees. To request a free copy, call Fidelity at 1-800-544-8544.
Experience, Skills, Attributes, and Qualifications of the Trustees. The Governance and Nominating Committee has adopted a statement of policy that describes the experience, qualifications, attributes, and skills that are necessary and desirable for potential Independent Trustee candidates (Statement of Policy). The Board believes that each Trustee satisfied at the time he or she was initially elected or appointed a Trustee, and continues to satisfy, the standards contemplated by the Statement of Policy. The Governance and Nominating Committee also engages professional search firms to help identify potential Independent Trustee candidates who have the experience, qualifications, attributes, and skills consistent with the Statement of Policy. From time to time, additional criteria based on the composition and skills of the current Independent Trustees, as well as experience or skills that may be appropriate in light of future changes to board composition, business conditions, and regulatory or other developments, have also been considered by the professional search firms and the Governance and Nominating Committee. In addition, the Board takes into account the Trustees' commitment and participation in Board and committee meetings, as well as their leadership of standing and ad hoc committees throughout their tenure.
In determining that a particular Trustee was and continues to be qualified to serve as a Trustee, the Board has considered a variety of criteria, none of which, in isolation, was controlling. The Board believes that, collectively, the Trustees have balanced and diverse experience, qualifications, attributes, and skills, which allow the Board to operate effectively in governing the fund and protecting the interests of shareholders. Information about the specific experience, skills, attributes, and qualifications of each Trustee, which in each case led to the Board's conclusion that the Trustee should serve (or continue to serve) as a trustee of the fund, is provided below.
Board Structure and Oversight Function. Abigail P. Johnson is an interested person and currently serves as Chairman. The Trustees have determined that an interested Chairman is appropriate and benefits shareholders because an interested Chairman has a personal and professional stake in the quality and continuity of services provided to the fund. Independent Trustees exercise their informed business judgment to appoint an individual of their choosing to serve as Chairman, regardless of whether the Trustee happens to be independent or a member of management. The Independent Trustees have determined that they can act independently and effectively without having an Independent Trustee serve as Chairman and that a key structural component for assuring that they are in a position to do so is for the Independent Trustees to constitute a substantial majority for the Board. The Independent Trustees also regularly meet in executive session. Michael E. Kenneally serves as Chairman of the Independent Trustees and as such (i) acts as a liaison between the Independent Trustees and management with respect to matters important to the Independent Trustees and (ii) with management prepares agendas for Board meetings.
Fidelity® funds are overseen by different Boards of Trustees. The fund's Board oversees Fidelity's investment-grade bond, money market, asset allocation and certain equity funds, and other Boards oversee Fidelity's high income and other equity funds. The asset allocation funds may invest in Fidelity® funds that are overseen by such other Boards. The use of separate Boards, each with its own committee structure, allows the Trustees of each group of Fidelity® funds to focus on the unique issues of the funds they oversee, including common research, investment, and operational issues. On occasion, the separate Boards establish joint committees to address issues of overlapping consequences for the Fidelity® funds overseen by each Board.
The Trustees operate using a system of committees to facilitate the timely and efficient consideration of all matters of importance to the Trustees, the fund, and fund shareholders and to facilitate compliance with legal and regulatory requirements and oversight of the fund's activities and associated risks. The Board, acting through its committees, has charged FMR and its affiliates with (i) identifying events or circumstances the occurrence of which could have demonstrably adverse effects on the fund's business and/or reputation; (ii) implementing processes and controls to lessen the possibility that such events or circumstances occur or to mitigate the effects of such events or circumstances if they do occur; and (iii) creating and maintaining a system designed to evaluate continuously business and market conditions in order to facilitate the identification and implementation processes described in (i) and (ii) above. Because the day-to-day operations and activities of the fund are carried out by or through FMR, its affiliates, and other service providers, the fund's exposure to risks is mitigated but not eliminated by the processes overseen by the Trustees. While each of the Board's committees has responsibility for overseeing different aspects of the fund's activities, oversight is exercised primarily through the Operations and Audit Committees. In addition, an ad hoc Board committee of Independent Trustees has worked with FMR to enhance the Board's oversight of investment and financial risks, legal and regulatory risks, technology risks, and operational risks, including the development of additional risk reporting to the Board. Appropriate personnel, including but not limited to the fund's Chief Compliance Officer (CCO), FMR's internal auditor, the independent accountants, the fund's Treasurer and portfolio management personnel, make periodic reports to the Board's committees, as appropriate, including an annual review of Fidelity's risk management program for the Fidelity® funds. The responsibilities of each standing committee, including their oversight responsibilities, are described further under "Standing Committees of the Trustees."
Interested Trustees*:
Correspondence intended for a Trustee who is an interested person may be sent to Fidelity Investments, 245 Summer Street, Boston, Massachusetts 02210.
Name, Year of Birth; Principal Occupations and Other Relevant Experience+
Jonathan Chiel (1957)
Year of Election or Appointment: 2016
Trustee
Mr. Chiel also serves as Trustee of other Fidelity® funds. Mr. Chiel is Executive Vice President and General Counsel for FMR LLC (diversified financial services company, 2012-present). Previously, Mr. Chiel served as general counsel (2004-2012) and senior vice president and deputy general counsel (2000-2004) for John Hancock Financial Services; a partner with Choate, Hall & Stewart (1996-2000) (law firm); and an Assistant United States Attorney for the United States Attorney’s Office of the District of Massachusetts (1986-95), including Chief of the Criminal Division (1993-1995). Mr. Chiel is a director on the boards of the Boston Bar Foundation and the Maimonides School.
Abigail P. Johnson (1961)
Year of Election or Appointment: 2009
Trustee
Chairman of the Board of Trustees
Ms. Johnson also serves as Trustee of other Fidelity® funds. Ms. Johnson serves as Chairman (2016-present), Chief Executive Officer (2014-present), and Director (2007-present) of FMR LLC (diversified financial services company), President of Fidelity Financial Services (2012-present) and President of Personal, Workplace and Institutional Services (2005-present). Ms. Johnson is Chairman and Director of Fidelity Management & Research Company LLC (investment adviser firm, 2011-present). Previously, Ms. Johnson served as Chairman and Director of FMR Co., Inc. (investment adviser firm, 2011-2019), Vice Chairman (2007-2016) and President (2013-2016) of FMR LLC, President and a Director of Fidelity Management & Research Company (2001-2005), a Trustee of other investment companies advised by Fidelity Management & Research Company, Fidelity Investments Money Management, Inc. (investment adviser firm), and FMR Co., Inc. (2001-2005), Senior Vice President of the Fidelity® funds (2001-2005), and managed a number of Fidelity® funds. Ms. Abigail P. Johnson and Mr. Arthur E. Johnson are not related.
Jennifer Toolin McAuliffe (1959)
Year of Election or Appointment: 2016
Trustee
Ms. McAuliffe also serves as Trustee of other Fidelity® funds and as Trustee of Fidelity Charitable (2020-present). Previously, Ms. McAuliffe served as Co-Head of Fixed Income of Fidelity Investments Limited (now known as FIL Limited (FIL)) (diversified financial services company), Director of Research for FIL’s credit and quantitative teams in London, Hong Kong and Tokyo and Director of Research for taxable and municipal bonds at Fidelity Investments Money Management, Inc. Ms. McAuliffe previously served as a member of the Advisory Board of certain Fidelity® funds (2016). Ms. McAuliffe was previously a lawyer at Ropes & Gray LLP and currently serves as director or trustee of several not-for-profit entities.
* Determined to be an “Interested Trustee” by virtue of, among other things, his or her affiliation with the trust or various entities under common control with FMR.
+ The information includes the Trustee's principal occupation during the last five years and other information relating to the experience, attributes, and skills relevant to the Trustee's qualifications to serve as a Trustee, which led to the conclusion that the Trustee should serve as a Trustee for the fund.
Independent Trustees:
Correspondence intended for an Independent Trustee may be sent to Fidelity Investments, P.O. Box 55235, Boston, Massachusetts 02205-5235.
Name, Year of Birth; Principal Occupations and Other Relevant Experience+
Elizabeth S. Acton (1951)
Year of Election or Appointment: 2013
Trustee
Ms. Acton also serves as Trustee of other Fidelity® funds. Prior to her retirement, Ms. Acton served as Executive Vice President, Finance (2011-2012), Executive Vice President, Chief Financial Officer (2002-2011) and Treasurer (2004-2005) of Comerica Incorporated (financial services). Prior to joining Comerica, Ms. Acton held a variety of positions at Ford Motor Company (1983-2002), including Vice President and Treasurer (2000-2002) and Executive Vice President and Chief Financial Officer of Ford Motor Credit Company (1998-2000). Ms. Acton currently serves as a member of the Board and Audit and Finance Committees of Beazer Homes USA, Inc. (homebuilding, 2012-present). Ms. Acton previously served as a member of the Advisory Board of certain Fidelity® funds (2013-2016).
Ann E. Dunwoody (1953)
Year of Election or Appointment: 2018
Trustee
General Dunwoody also serves as Trustee of other Fidelity® funds. General Dunwoody (United States Army, Retired) was the first woman in U.S. military history to achieve the rank of four-star general and prior to her retirement in 2012 held a variety of positions within the U.S. Army, including Commanding General, U.S. Army Material Command (2008-2012). General Dunwoody currently serves as President of First to Four LLC (leadership and mentoring services, 2012-present), a member of the Board and Nomination and Corporate Governance Committees of Kforce Inc. (professional staffing services, 2016-present) and a member of the Board of Automattic Inc. (software engineering, 2018-present). Previously, General Dunwoody served as a member of the Advisory Board and Nominating and Corporate Governance Committee of L3 Technologies, Inc. (communication, electronic, sensor and aerospace systems, 2013-2019) and a member of the Board and Audit and Sustainability and Corporate Responsibility Committees of Republic Services, Inc. (waste collection, disposal and recycling, 2013-2016). Ms. Dunwoody also serves on several boards for non-profit organizations, including as a member of the Board, Chair of the Nomination and Governance Committee and a member of the Audit Committee of Logistics Management Institute (consulting non-profit, 2012-present), a member of the Council of Trustees for the Association of the United States Army (advocacy non-profit, 2013-present), a member of the Board of Florida Institute of Technology (2015-present) and a member of the Board of ThanksUSA (military family education non-profit, 2014-present). General Dunwoody previously served as a member of the Advisory Board of certain Fidelity® funds (2018).
John Engler (1948)
Year of Election or Appointment: 2014
Trustee
Mr. Engler also serves as Trustee of other Fidelity® funds. Previously, Mr. Engler served as Governor of Michigan (1991-2003), President of the Business Roundtable (2011-2017) and interim President of Michigan State University (2018-2019). Mr. Engler currently serves as a member of the Board of Stride, Inc. (formerly K12 Inc.) (technology-based education company, 2012-present). Previously, Mr. Engler served as a member of the Board of Universal Forest Products (manufacturer and distributor of wood and wood-alternative products, 2003-2019) and Trustee of The Munder Funds (2003-2014). Mr. Engler previously served as a member of the Advisory Board of certain Fidelity® funds (2014-2016).
Robert F. Gartland (1951)
Year of Election or Appointment: 2010
Trustee
Mr. Gartland also serves as Trustee of other Fidelity® funds. Prior to his retirement, Mr. Gartland held a variety of positions at Morgan Stanley (financial services, 1979-2007), including Managing Director (1987-2007) and Chase Manhattan Bank (1975-1978). Mr. Gartland previously served as Chairman and an investor in Gartland & Mellina Group Corp. (consulting, 2009-2019), as a member of the Board of National Securities Clearing Corporation (1993-1996) and as Chairman of TradeWeb (2003-2004).
Arthur E. Johnson (1947)
Year of Election or Appointment: 2008
Trustee
Mr. Johnson also serves as Trustee of other Fidelity® funds. Prior to his retirement, Mr. Johnson served as Senior Vice President of Corporate Strategic Development of Lockheed Martin Corporation (defense contractor, 1999-2009). Mr. Johnson currently serves as a member of the Board of Booz Allen Hamilton (management consulting, 2011-present). Mr. Johnson previously served as a member of the Board of Eaton Corporation plc (diversified power management, 2009-2019) and a member of the Board of AGL Resources, Inc. (holding company, 2002-2016). Mr. Johnson previously served as Chairman (2018-2021) and Vice Chairman (2015-2018) of the Independent Trustees of certain Fidelity® funds. Mr. Arthur E. Johnson is not related to Ms. Abigail P. Johnson.
Michael E. Kenneally (1954)
Year of Election or Appointment: 2009
Trustee
Chairman of the Independent Trustees
Mr. Kenneally also serves as Trustee of other Fidelity® funds and was Vice Chairman (2018-2021) of the Independent Trustees of certain Fidelity® funds. Prior to retirement in 2005, he was Chairman and Global Chief Executive Officer of Credit Suisse Asset Management, the worldwide fund management and institutional investment business of Credit Suisse Group. Previously, Mr. Kenneally was an Executive Vice President and the Chief Investment Officer for Bank of America. In this role, he was responsible for the investment management, strategy and products delivered to the bank’s institutional, high-net-worth and retail clients. Earlier, Mr. Kenneally directed the organization’s equity and quantitative research groups. He began his career as a research analyst and then spent more than a dozen years as a portfolio manager for endowments, pension plans and mutual funds. He earned the Chartered Financial Analyst (CFA) designation in 1991.
Marie L. Knowles (1946)
Year of Election or Appointment: 2001
Trustee
Ms. Knowles also serves as Trustee of other Fidelity® funds. Prior to her retirement, Ms. Knowles held several positions at Atlantic Richfield Company (diversified energy), including Executive Vice President and Chief Financial Officer (1996-2000), Senior Vice President (1993-1996) and President of ARCO Transportation Company (pipeline and tanker operations, 1993-1996). Ms. Knowles currently serves as a member of the Board of the Santa Catalina Island Company (real estate, 2009-present), a member of the Investment Company Institute Board of Governors and a member of the Governing Council of the Independent Directors Council (2014-present). Ms. Knowles also serves as a member of the Advisory Board for the School of Engineering of the University of Southern California. Ms. Knowles previously served as a member of the Board of McKesson Corporation (healthcare service, 2002-2021). In addition, Ms. Knowles previously served as Chairman (2015-2018) and Vice Chairman (2012-2015) of the Independent Trustees of certain Fidelity® funds.
Mark A. Murray (1954)
Year of Election or Appointment: 2016
Trustee
Mr. Murray also serves as Trustee of other Fidelity® funds. Previously, Mr. Murray served as Co-Chief Executive Officer (2013-2016), President (2006-2013) and Vice Chairman (2013-2020) of Meijer, Inc. Mr. Murray serves as a member of the Board (2009-present) and Public Policy and Responsibility Committee (2009-present) and Chair of the Nuclear Review Committee (2019-present) of DTE Energy Company (diversified energy company). Mr. Murray previously served as a member of the Board of Spectrum Health (not-for-profit health system, 2015-2019) and as a member of the Board and Audit Committee and Chairman of the Nominating and Corporate Governance Committee of Universal Forest Products, Inc. (manufacturer and distributor of wood and wood-alternative products, 2004-2016). Mr. Murray also serves as a member of the Board of many community and professional organizations. Mr. Murray previously served as a member of the Advisory Board of certain Fidelity® funds (2016).
+ The information includes the Trustee's principal occupation during the last five years and other information relating to the experience, attributes, and skills relevant to the Trustee's qualifications to serve as a Trustee, which led to the conclusion that the Trustee should serve as a Trustee for the fund.
Advisory Board Members and Officers:
Correspondence intended for an officer may be sent to Fidelity Investments, 245 Summer Street, Boston, Massachusetts 02210. Officers appear below in alphabetical order.
Name, Year of Birth; Principal Occupation
Robert W. Helm (1957)
Year of Election or Appointment: 2021
Member of the Advisory Board
Mr. Helm also serves as a Member of the Advisory Board of other Fidelity® funds. Mr. Helm was formerly Deputy Chairman (2003-2020), partner (1991-2020) and an associate (1984-1991) of Dechert LLP (formerly Dechert Price & Rhoads). Mr. Helm currently serves on boards and committees of several not-for-profit organizations.
Craig S. Brown (1977)
Year of Election or Appointment: 2019
Assistant Treasurer
Mr. Brown also serves as an officer of other funds. Mr. Brown serves as Assistant Treasurer of FIMM, LLC (2021-present) and is an employee of Fidelity Investments (2013-present).
John J. Burke III (1964)
Year of Election or Appointment: 2018
Chief Financial Officer
Mr. Burke also serves as Chief Financial Officer of other funds. Mr. Burke serves as Head of Investment Operations for Fidelity Fund and Investment Operations (2018-present) and is an employee of Fidelity Investments (1998-present). Previously Mr. Burke served as head of Asset Management Investment Operations (2012-2018).
David J. Carter (1973)
Year of Election or Appointment: 2020
Assistant Secretary
Mr. Carter also serves as Assistant Secretary of other funds. Mr. Carter serves as Senior Vice President, Deputy General Counsel (2022-present) and is an employee of Fidelity Investments (2005-present).
Jonathan Davis (1968)
Year of Election or Appointment: 2010
Assistant Treasurer
Mr. Davis also serves as an officer of other funds. Mr. Davis serves as Assistant Treasurer of FIMM, LLC (2021-present), FMR Capital, Inc. (2017-present), FD Funds GP LLC (2021-present), FD Funds Holding LLC (2021-present), and FD Funds Management LLC (2021-present); and is an employee of Fidelity Investments. Previously, Mr. Davis served as Vice President and Associate General Counsel of FMR LLC (diversified financial services company, 2003-2010).
Laura M. Del Prato (1964)
Year of Election or Appointment: 2018
President and Treasurer
Ms. Del Prato also serves as an officer of other funds. Ms. Del Prato serves as Assistant Treasurer of FIMM, LLC (2021-present) and is an employee of Fidelity Investments (2017-present). Previously, Ms. Del Prato served as President and Treasurer of The North Carolina Capital Management Trust: Cash Portfolio and Term Portfolio (2018-2020). Prior to joining Fidelity Investments, Ms. Del Prato served as a Managing Director and Treasurer of the JPMorgan Mutual Funds (2014-2017). Prior to JPMorgan, Ms. Del Prato served as a partner at Cohen Fund Audit Services (accounting firm, 2012-2013) and KPMG LLP (accounting firm, 2004-2012).
Colm A. Hogan (1973)
Year of Election or Appointment: 2016
Assistant Treasurer
Mr. Hogan also serves as an officer of other funds. Mr. Hogan serves as Assistant Treasurer of FIMM, LLC (2021-present) and FMR Capital, Inc. (2017-present) and is an employee of Fidelity Investments (2005-present). Previously, Mr. Hogan served as Deputy Treasurer of certain Fidelity® funds (2016-2020) and Assistant Treasurer of certain Fidelity® funds (2016-2018).
Cynthia Lo Bessette (1969)
Year of Election or Appointment: 2019
Secretary and Chief Legal Officer (CLO)
Ms. Lo Bessette also serves as an officer of other funds. Ms. Lo Bessette serves as CLO, Secretary, and Senior Vice President of Fidelity Management & Research Company LLC (investment adviser firm, 2019-present); CLO of Fidelity Management & Research (Hong Kong) Limited, FMR Investment Management (UK) Limited, and Fidelity Management & Research (Japan) Limited (investment adviser firms, 2019-present); Secretary of FD Funds GP LLC (2021-present), FD Funds Holding LLC (2021-present), and FD Funds Management LLC (2021-present); and Assistant Secretary of FIMM, LLC (2019-present). She is a Senior Vice President and Deputy General Counsel of FMR LLC (diversified financial services company, 2019-present), and is an employee of Fidelity Investments. Previously, Ms. Lo Bessette served as CLO, Secretary, and Senior Vice President of FMR Co., Inc. (investment adviser firm, 2019); Secretary of Fidelity SelectCo, LLC and Fidelity Investments Money Management, Inc. (investment adviser firms, 2019). Prior to joining Fidelity Investments, Ms. Lo Bessette was Executive Vice President, General Counsel (2016-2019) and Senior Vice President, Deputy General Counsel (2015-2016) of OppenheimerFunds (investment management company) and Deputy Chief Legal Officer (2013-2015) of Jennison Associates LLC (investment adviser firm).
Chris Maher (1972)
Year of Election or Appointment: 2013
Assistant Treasurer
Mr. Maher also serves as an officer of other funds. Mr. Maher serves as Assistant Treasurer of FIMM, LLC (2021-present) and FMR Capital, Inc. (2017-present), and is an employee of Fidelity Investments (2008-present). Previously, Mr. Maher served as Assistant Treasurer of certain funds (2013-2020); Vice President of Asset Management Compliance (2013), Vice President of the Program Management Group of FMR (investment adviser firm, 2010-2013), and Vice President of Valuation Oversight (2008-2010).
Jamie Pagliocco (1964)
Year of Election or Appointment: 2020
Vice President
Mr. Pagliocco also serves as Vice President of other funds. Mr. Pagliocco serves as President of Fixed Income (2020-present), and is an employee of Fidelity Investments (2001-present). Previously, Mr. Pagliocco served as Co-Chief Investment Officer – Bond (2017-2020), Global Head of Bond Trading (2016-2019), and as a portfolio manager.
Kenneth B. Robins (1969)
Year of Election or Appointment: 2020
Chief Compliance Officer
Mr. Robins also serves as an officer of other funds. Mr. Robins serves as Compliance Officer of Fidelity Management & Research Company LLC (investment adviser firm, 2016-present) and is an employee of Fidelity Investments (2004-present). Previously, Mr. Robins served as Compliance Officer of FMR Co., Inc. (investment adviser firm, 2016-2019), as Executive Vice President of Fidelity Investments Money Management, Inc. (investment adviser firm, 2013-2016) and served in other fund officer roles.
Brett Segaloff (1972)
Year of Election or Appointment: 2021
Anti-Money Laundering (AML) Officer
Mr. Segaloff also serves as an AML Officer of other funds and other related entities. He is Director, Anti-Money Laundering (2007-present) of FMR LLC (diversified financial services company) and is an employee of Fidelity Investments (1996-present).
Stacie M. Smith (1974)
Year of Election or Appointment: 2013
Assistant Treasurer
Ms. Smith also serves as an officer of other funds. Ms. Smith serves as Assistant Treasurer of FIMM, LLC (2021-present) and FMR Capital, Inc. (2017-present), is an employee of Fidelity Investments (2009-present), and has served in other fund officer roles. Prior to joining Fidelity Investments, Ms. Smith served as Senior Audit Manager of Ernst & Young LLP (accounting firm, 1996-2009). Previously, Ms. Smith served as Assistant Treasurer (2013-2019) and Deputy Treasurer (2013-2016) of certain Fidelity® funds.
Jim Wegmann (1979)
Year of Election or Appointment: 2021
Deputy Treasurer
Mr. Wegmann also serves as an officer of other funds. Mr. Wegmann serves as Assistant Treasurer of FIMM, LLC (2021-present) and is an employee of Fidelity Investments (2011-present). Previously, Mr. Wegmann served as Assistant Treasurer of certain Fidelity® funds (2019-2021).
Shareholder Expense Example
As a shareholder, you incur two types of costs: (1) transaction costs, which may include sales charges (loads) on purchase payments or redemption proceeds, as applicable and (2) ongoing costs, which generally include management fees, distribution and/or service (12b-1) fees and other Fund expenses. This Example is intended to help you understand your ongoing costs (in dollars) of investing in a fund and to compare these costs with the ongoing costs of investing in other mutual funds.
The Example is based on an investment of $1,000 invested at the beginning of the period and held for the entire period (November 1, 2021 to April 30, 2022).
Actual Expenses
The first line of the accompanying table provides information about actual account values and actual expenses. You may use the information in this line, together with the amount you invested, to estimate the expenses that you paid over the period. Simply divide your account value by $1,000.00 (for example, an $8,600 account value divided by $1,000.00 = 8.6), then multiply the result by the number in the first line for a class/Fund under the heading entitled "Expenses Paid During Period" to estimate the expenses you paid on your account during this period. If any fund is a shareholder of any underlying mutual funds or exchange-traded funds (ETFs) (the Underlying Funds), such fund indirectly bears its proportional share of the expenses of the Underlying Funds in addition to the direct expenses incurred presented in the table. These fees and expenses are not included in the annualized expense ratio used to calculate the expense estimate in the table below.
Hypothetical Example for Comparison Purposes
The second line of the accompanying table provides information about hypothetical account values and hypothetical expenses based on the actual expense ratio and an assumed rate of return of 5% per year before expenses, which is not the actual return. The hypothetical account values and expenses may not be used to estimate the actual ending account balance or expenses you paid for the period. You may use this information to compare the ongoing costs of investing in the Fund and other funds. To do so, compare this 5% hypothetical example with the 5% hypothetical examples that appear in the shareholder reports of the other funds. If any fund is a shareholder of any Underlying Funds, such fund indirectly bears its proportional share of the expenses of the Underlying Funds in addition to the direct expenses as presented in the table. These fees and expenses are not included in the annualized expense ratio used to calculate the expense estimate in the table below.
Please note that the expenses shown in the table are meant to highlight your ongoing costs only and do not reflect any transaction costs. Therefore, the second line of the table is useful in comparing ongoing costs only, and will not help you determine the relative total costs of owning different funds. In addition, if these transactional costs were included, your costs would have been higher.
| Annualized Expense Ratio-A | Beginning Account Value November 1, 2021 | Ending Account Value April 30, 2022 | Expenses Paid During Period-B November 1, 2021 to April 30, 2022 |
|
| Fidelity Series Large Cap Growth Index Fund | - %C | |||
| Actual | $1,000.00 | $821.60 | $-D | |
| Hypothetical-E | $1,000.00 | $1,024.79 | $-D |
A Annualized expense ratio reflects expenses net of applicable fee waivers.
B Expenses are equal to the annualized expense ratio, multiplied by the average account value over the period, multiplied by 181/ 365 (to reflect the one-half year period). The fees and expenses of any Underlying Funds are not included in each annualized expense ratio.
C Amount represents less than .005%.
D Amount represents less than $.005 per share
E 5% return per year before expenses
Distributions (Unaudited)
The dividend and capital gains distributions for the fund(s) are available on Fidelity.com or Institutional.Fidelity.com.
The fund hereby designates as a capital gain dividend with respect to the taxable year ended April 30, 2022, $10,992,128, or, if subsequently determined to be different, the net capital gain of such year.
The fund designates 55% and 37% of the dividends distributed in June and December, respectively during the fiscal year as qualifying for the dividends–received deduction for corporate shareholders.
The fund designates 57% and 38% of the dividends distributed in June and December, respectively during the fiscal year as amounts which may be taken into account as a dividend for the purposes of the maximum rate under section 1(h)(11) of the Internal Revenue Code.
The fund designates 2% and 3% of the dividends distributed in June and December, respectively during the fiscal year as a section 199A dividend.
The fund will notify shareholders in January 2023 of amounts for use in preparing 2022 income tax returns.
Liquidity Risk Management Program
The Securities and Exchange Commission adopted Rule 22e-4 under the Investment Company Act of 1940 (the Liquidity Rule) to promote effective liquidity risk management throughout the open-end investment company industry, thereby reducing the risk that funds will be unable to meet their redemption obligations and mitigating dilution of the interests of fund shareholders.
The Fund has adopted and implemented a liquidity risk management program pursuant to the Liquidity Rule (the Program) effective December 1, 2018. The Program is reasonably designed to assess and manage the Fund’s liquidity risk and to comply with the requirements of the Liquidity Rule. The Fund’s Board of Trustees (the Board) has designated the Fund’s investment adviser as administrator of the Program. The Fidelity advisers have established a Liquidity Risk Management Committee (the LRM Committee) to manage the Program for each of the Fidelity Funds. The LRM Committee monitors the adequacy and effectiveness of implementation of the Program and on a periodic basis assesses each Fund’s liquidity risk based on a variety of factors including (1) the Fund’s investment strategy, (2) portfolio liquidity and cash flow projections during normal and reasonably foreseeable stressed conditions, (3) shareholder redemptions, (4) borrowings and other funding sources and (5) in the case of exchange-traded funds, certain additional factors including the effect of the Fund’s prices and spreads, market participants, and basket compositions on the overall liquidity of the Fund’s portfolio, as applicable.
In accordance with the Program, each of the Fund’s portfolio investments is classified into one of four liquidity categories described below based on a determination of a reasonable expectation for how long it would take to convert the investment to cash (or sell or dispose of the investment) without significantly changing its market value.
- Highly liquid investments – cash or convertible to cash within three business days or less
- Moderately liquid investments – convertible to cash in three to seven calendar days
- Less liquid investments – can be sold or disposed of, but not settled, within seven calendar days
- Illiquid investments – cannot be sold or disposed of within seven calendar days
Liquidity classification determinations take into account a variety of factors including various market, trading and investment-specific considerations, as well as market depth, and generally utilize analysis from a third-party liquidity metrics service.
The Liquidity Rule places a 15% limit on a fund’s illiquid investments and requires funds that do not primarily hold assets that are highly liquid investments to determine and maintain a minimum percentage of the fund’s net assets to be invested in highly liquid investments (highly liquid investment minimum or HLIM). The Program includes provisions reasonably designed to comply with the 15% limit on illiquid investments and for determining, periodically reviewing and complying with the HLIM requirement as applicable.
At a recent meeting of the Fund’s Board of Trustees, the LRM Committee provided a written report to the Board pertaining to the operation, adequacy, and effectiveness of implementation of the Program for the annual period from December 1, 2020 through November 30, 2021. The report concluded that the Program has been implemented and is operating effectively and is reasonably designed to assess and manage the Fund’s liquidity risk.
CGI-ANN-0622
1.9891255.103
Item 2.
Code of Ethics
As of the end of the period, April 30, 2022, Fidelity Salem Street Trust (the trust) has adopted a code of ethics, as defined in Item 2 of Form N-CSR, that applies to its President and Treasurer and its Chief Financial Officer. A copy of the code of ethics is filed as an exhibit to this Form N-CSR.
Item 3.
Audit Committee Financial Expert
The Board of Trustees of the trust has determined that Elizabeth S. Acton is an audit committee financial expert, as defined in Item 3 of Form N-CSR. Ms. Acton is independent for purposes of Item 3 of Form N-CSR.
Item 4.
Principal Accountant Fees and Services
Fees and Services
The following table presents fees billed by Deloitte & Touche LLP, the member firms of Deloitte Touche Tohmatsu, and their respective affiliates (collectively, “Deloitte Entities”) in each of the last two fiscal years for services rendered to Fidelity Flex Mid Cap Index Fund, Fidelity Flex Small Cap Index Fund, Fidelity Large Cap Growth Index Fund, Fidelity Large Cap Value Index Fund, and Fidelity Series Large Cap Growth Index Fund (the “Funds”):
Services Billed by Deloitte Entities
April 30, 2022 FeesA
| | Audit Fees | Audit-Related Fees | Tax Fees | All Other Fees |
| Fidelity Flex Mid Cap Index Fund | $39,700 | $- | $7,100 | $900 |
| Fidelity Flex Small Cap Index Fund | $49,600 | $- | $6,900 | $1,100 |
| Fidelity Large Cap Growth Index Fund | $38,800 | $- | $7,100 | $900 |
| Fidelity Large Cap Value Index Fund | $38,800 | $- | $7,100 | $900 |
| Fidelity Series Large Cap Growth Index Fund | $38,800 | $- | $7,800 | $900 |
April 30, 2021 FeesA
| | Audit Fees | Audit-Related Fees | Tax Fees | All Other Fees |
| Fidelity Flex Mid Cap Index Fund | $38,700 | $- | $6,900 | $1,000 |
| Fidelity Flex Small Cap Index Fund | $48,200 | $- | $6,700 | $1,200 |
| Fidelity Large Cap Growth Index Fund | $37,700 | $- | $6,900 | $900 |
| Fidelity Large Cap Value Index Fund | $37,700 | $- | $7,100 | $900 |
| Fidelity Series Large Cap Growth Index Fund | $37,800 | $- | $7,400 | $900 |
A Amounts may reflect rounding.
The following table(s) present(s) fees billed by Deloitte Entities that were required to be approved by the Audit Committee for services that relate directly to the operations and financial reporting of the Fund(s) and that are rendered on behalf of Fidelity Management & Research Company LLC ("FMR") and entities controlling, controlled by, or under common control with FMR (not including any sub-adviser whose role is primarily portfolio management and is subcontracted with or overseen by another investment adviser) that provide ongoing services to the Fund(s) (“Fund Service Providers”):
Services Billed by Deloitte Entities
| | April 30, 2022A | April 30, 2021A |
| Audit-Related Fees | $- | $- |
| Tax Fees | $- | $- |
| All Other Fees | $- | $- |
A Amounts may reflect rounding.
“Audit-Related Fees” represent fees billed for assurance and related services that are reasonably related to the performance of the fund audit or the review of the fund's financial statements and that are not reported under Audit Fees.
“Tax Fees” represent fees billed for tax compliance, tax advice or tax planning that relate directly to the operations and financial reporting of the fund.
“All Other Fees” represent fees billed for services provided to the fund or Fund Service Provider, a significant portion of which are assurance related, that relate directly to the operations and financial reporting of the fund, excluding those services that are reported under Audit Fees, Audit-Related Fees or Tax Fees.
Assurance services must be performed by an independent public accountant.
* * *
The aggregate non-audit fees billed by Deloitte Entities for services rendered to the Fund(s), FMR (not including any sub-adviser whose role is primarily portfolio management and is subcontracted with or overseen by another investment adviser), and any Fund Service Provider for each of the last two fiscal years of the Fund(s) are as follows:
| Billed By | April 30, 2022A | April 30, 2021A |
| Deloitte Entities | $498,300 | $561,500 |
A Amounts may reflect rounding.
The trust's Audit Committee has considered non-audit services that were not pre-approved that were provided by Deloitte Entities to Fund Service Providers to be compatible with maintaining the independence of Deloitte Entities in its(their) audit of the Fund(s), taking into account representations from Deloitte Entities, in accordance with Public Company Accounting Oversight Board rules, regarding its independence from the Fund(s) and its(their) related entities and FMR’s review of the appropriateness and permissibility under applicable law of such non-audit services prior to their provision to the Fund(s) Service Providers.
Audit Committee Pre-Approval Policies and Procedures
The trust’s Audit Committee must pre-approve all audit and non-audit services provided by a fund’s independent registered public accounting firm relating to the operations or financial reporting of the fund. Prior to the commencement of any audit or non-audit services to a fund, the Audit Committee reviews the services to determine whether they are appropriate and permissible under applicable law.
The Audit Committee has adopted policies and procedures to, among other purposes, provide a framework for the Committee’s consideration of non-audit services by the audit firms that audit the Fidelity funds. The policies and procedures require that any non-audit service provided by a fund audit firm to a Fidelity fund and any non-audit service provided by a fund auditor to a Fund Service Provider that relates directly to the operations and financial reporting of a Fidelity fund (“Covered Service”) are subject to approval by the Audit Committee before such service is provided.
All Covered Services must be approved in advance of provision of the service either: (i) by formal resolution of the Audit Committee, or (ii) by oral or written approval of the service by the Chair of the Audit Committee (or if the Chair is unavailable, such other
member of the Audit Committee as may be designated by the Chair to act in the Chair’s absence). The approval contemplated by (ii) above is permitted where the Treasurer determines that action on such an engagement is necessary before the next meeting of the Audit Committee.
Non-audit services provided by a fund audit firm to a Fund Service Provider that do not relate directly to the operations and financial reporting of a Fidelity fund are reported to the Audit Committee periodically.
Non-Audit Services Approved Pursuant to Rule 2-01(c)(7)(i)(C) and (ii) of Regulation S-X (“De Minimis Exception”)
There were no non-audit services approved or required to be approved by the Audit Committee pursuant to the De Minimis Exception during the Fund’s(s’) last two fiscal years relating to services provided to (i) the Fund(s) or (ii) any Fund Service Provider that relate directly to the operations and financial reporting of the Fund(s).
Item 5.
Audit Committee of Listed Registrants
Not applicable.
Item 6.
Investments
(a)
Not applicable.
(b)
Not applicable.
Item 7.
Disclosure of Proxy Voting Policies and Procedures for Closed-End Management Investment Companies
Not applicable.
Item 8.
Portfolio Managers of Closed-End Management Investment Companies
Not applicable.
Item 9.
Purchase of Equity Securities by Closed-End Management Investment Company and Affiliated Purchasers
Not applicable.
Item 10.
Submission of Matters to a Vote of Security Holders
There were no material changes to the procedures by which shareholders may recommend nominees to the trust’s Board of Trustees.
Item 11.
Controls and Procedures
(a)(i) The President and Treasurer and the Chief Financial Officer have concluded that the trust’s disclosure controls and procedures (as defined in Rule 30a-3(c) under the Investment Company Act) provide reasonable assurances that material information relating to the trust is made known to them by the appropriate persons, based on their evaluation of these controls and procedures as of a date within 90 days of the filing date of this report.
(a)(ii) There was no change in the trust’s internal control over financial reporting (as defined in Rule 30a-3(d) under the Investment Company Act) that occurred during the period covered by this report that has materially affected, or is reasonably likely to materially affect, the trust’s internal control over financial reporting.
Item 12.
Disclosure of Securities Lending Activities for Closed-End Management
Investment Companies
Not applicable.
Item 13.
Exhibits
| (a) | (1) | Code of Ethics pursuant to Item 2 of Form N-CSR is filed and attached hereto as EX-99.CODE ETH. |
| (a) | (2) | |
| (a) | (3) | Not applicable. |
| (b) | |
SIGNATURES
Pursuant to the requirements of the Securities Exchange Act of 1934 and the Investment Company Act of 1940, the registrant has duly caused this report to be signed on its behalf by the undersigned, thereunto duly authorized.
Fidelity Salem Street Trust
| By: | /s/Laura M. Del Prato |
| | Laura M. Del Prato |
| | President and Treasurer |
| | |
| Date: | June 21, 2022 |
Pursuant to the requirements of the Securities Exchange Act of 1934 and the Investment Company Act of 1940, this report has been signed below by the following persons on behalf of the registrant and in the capacities and on the dates indicated.
| By: | /s/Laura M. Del Prato |
| | Laura M. Del Prato |
| | President and Treasurer |
| | |
| Date: | June 21, 2022 |
| By: | /s/John J. Burke III |
| | John J. Burke III |
| | Chief Financial Officer |
| | |
| Date: | June 21, 2022 |
Exhibit EX-99.CERT
I, Laura M. Del Prato, certify that:
1.
I have reviewed this report on Form N-CSR of Fidelity Salem Street Trust;
2.
Based on my knowledge, this report does not contain any untrue statement of a material fact or omit to state a material fact necessary to make the statements made, in light of the circumstances under which such statements were made, not misleading with respect to the period covered by this report;
3.
Based on my knowledge, the financial statements, and other financial information included in this report, fairly present in all material respects the financial condition, results of operations, changes in net assets, and cash flows (if the financial statements are required to include a statement of cash flows) of the registrant as of, and for, the periods presented in this report;
4.
The registrant's other certifying officer(s) and I are responsible for establishing and maintaining disclosure controls and procedures (as defined in Rule 30a-3(c) under the Investment Company Act of 1940) and internal control over financial reporting (as defined in Rule 30a-3(d) under the Investment Company Act of 1940) for the registrant and have:
a.
Designed such disclosure controls and procedures, or caused such disclosure controls and procedures to be designed under our supervision, to ensure that material information relating to the registrant, including its consolidated subsidiaries, is made known to us by others within those entities, particularly during the period in which this report is being prepared;
b.
Designed such internal control over financial reporting, or caused such internal control over financial reporting to be designed under our supervision, to provide reasonable assurance regarding the reliability of financial reporting and the preparation of financial statements for external purposes in accordance with generally accepted accounting principles;
c.
Evaluated the effectiveness of the registrant's disclosure controls and procedures and presented in this report our conclusions about the effectiveness of the disclosure controls and procedures, as of a date within 90 days prior to the filing date of this report based upon such evaluation; and
d.
Disclosed in this report any change in the registrant’s internal control over financial reporting that occurred during the period covered by this report that has materially affected, or is reasonably likely to materially affect, the registrant’s internal control over financial reporting; and
5.
The registrant's other certifying officer(s) and I have disclosed to the registrant's auditors and the audit committee of the registrant's board of directors (or persons performing the equivalent functions):
a.
All significant deficiencies and material weaknesses in the design or operation of internal control over financial reporting which are reasonably likely to adversely affect the registrant's ability to record, process, summarize, and report financial information; and
b.
Any fraud, whether or not material, that involves management or other employees who have a significant role in the registrant's internal control over financial reporting.
Date:
June 21, 2022
/s/Laura M. Del Prato |
Laura M. Del Prato |
President and Treasurer |
I, John J. Burke III, certify that:
1.
I have reviewed this report on Form N-CSR of Fidelity Salem Street Trust;
2.
Based on my knowledge, this report does not contain any untrue statement of a material fact or omit to state a material fact necessary to make the statements made, in light of the circumstances under which such statements were made, not misleading with respect to the period covered by this report;
3.
Based on my knowledge, the financial statements, and other financial information included in this report, fairly present in all material respects the financial condition, results of operations, changes in net assets, and cash flows (if the financial statements are required to include a statement of cash flows) of the registrant as of, and for, the periods presented in this report;
4.
The registrant's other certifying officer(s) and I are responsible for establishing and maintaining disclosure controls and procedures (as defined in Rule 30a-3(c) under the Investment Company Act of 1940) and internal control over financial reporting (as defined in Rule 30a-3(d) under the Investment Company Act of 1940) for the registrant and have:
a.
Designed such disclosure controls and procedures, or caused such disclosure controls and procedures to be designed under our supervision, to ensure that material information relating to the registrant, including its consolidated subsidiaries, is made known to us by others within those entities, particularly during the period in which this report is being prepared;
b.
Designed such internal control over financial reporting, or caused such internal control over financial reporting to be designed under our supervision, to provide reasonable assurance regarding the reliability of financial reporting and the preparation of financial statements for external purposes in accordance with generally accepted accounting principles;
c.
Evaluated the effectiveness of the registrant's disclosure controls and procedures and presented in this report our conclusions about the effectiveness of the disclosure controls and procedures, as of a date within 90 days prior to the filing date of this report based upon such evaluation; and
d.
Disclosed in this report any change in the registrant’s internal control over financial reporting that occurred during the period covered by this report that has materially affected, or is reasonably likely to materially affect, the registrant’s internal control over financial reporting; and
5.
The registrant's other certifying officer(s) and I have disclosed to the registrant's auditors and the audit committee of the registrant's board of directors (or persons performing the equivalent functions):
a.
All significant deficiencies and material weaknesses in the design or operation of internal control over financial reporting which are reasonably likely to adversely affect the registrant's ability to record, process, summarize, and report financial information; and
b.
Any fraud, whether or not material, that involves management or other employees who have a significant role in the registrant's internal control over financial reporting.
Date:
June 21, 2022
/s/John J. Burke III |
John J. Burke III |
Chief Financial Officer |
Exhibit EX-99.906CERT
Certification Pursuant to Section 906 of the Sarbanes-Oxley Act of 2002 (subsections (a) and (b) of section 1350, chapter 63 of title 18, United States Code)
In connection with the attached Report of Fidelity Salem Street Trust (the “Trust”) on Form N-CSR to be filed with the Securities and Exchange Commission (the “Report”), each of the undersigned officers of the Trust does hereby certify that, to the best of such officer’s knowledge:
1.
The Report fully complies with the requirements of 13(a) or 15(d) of the Securities Exchange Act of 1934; and
2.
The information contained in the Report fairly presents, in all material respects, the financial condition and results of operations of the Trust as of, and for, the periods presented in the Report.
Dated: June 21, 2022
/s/Laura M. Del Prato |
Laura M. Del Prato |
President and Treasurer |
Dated: June 21, 2022
/s/John J. Burke III |
John J. Burke III |
Chief Financial Officer |
A signed original of this written statement required by Section 906, or other document authenticating, acknowledging, or otherwise adopting the signature that appears in typed form within the electronic version of this written statement required by Section 906, has been provided to the Trust and will be retained by the Trust and furnished to the Securities and Exchange Commission or its staff upon request.
EXHIBIT EX-99.CODE ETH
FIDELITY FUNDS’ CODE OF ETHICS FOR
PRESIDENT, TREASURER AND PRINCIPAL ACCOUNTING OFFICER
I. Purposes of the Code/Covered Officers
This document constitutes the Code of Ethics (Code) adopted by the Fidelity Funds (Funds) pursuant to the provisions of Rule 30b2-1(a) under the Investment Company Act of 1940), which Rule implements Sections 406 of the Sarbanes-Oxley Act of 2002 with respect to registered investment companies. The Code applies to the Fidelity Funds’ President and Treasurer, and Chief Financial Officer (Covered Officers). Fidelity’s Ethics Office, a part of Corporate Compliance Group within Core Compliance, administers the Code.
The purposes of the Code are to deter wrongdoing and to promote, on the part of the Covered Officers:
·
honest and ethical conduct, including the ethical handling of actual or apparent conflicts of interest between personal and professional relationships;
·
full, fair, accurate, timely and understandable disclosure in reports and documents that the Fidelity Funds submit to the Securities and Exchange Commission (SEC), and in other public communications by a Fidelity Fund;
·
compliance with applicable laws and governmental rules and regulations;
·
the prompt internal reporting to an appropriate person or persons identified in the Code of violations of the Code; and
·
accountability for adherence to the Code.
Each Covered Officer should adhere to a high standard of business ethics and should be sensitive to situations that may give rise to actual as well as apparent conflicts of interest.
II.
Covered Officers Should Handle Ethically
Actual and Apparent Conflicts of Interest
Overview. A “conflict of interest” occurs when a Covered Officer’s private interest interferes with the interests of, or his service to, the Fidelity Funds. For example, a conflict of interest would arise if a Covered Officer, or a member of his family, receives improper personal benefits as a result of his position with the Fidelity Funds.
Certain conflicts of interest arise out of the relationships between Covered Officers and the Fidelity Funds and already are subject to conflict of interest provisions in the Investment Company Act of 1940 (Investment Company Act) and the Investment Advisers Act of 1940 (Investment Advisers Act). For example, Covered Officers may not individually engage in certain transactions (such as the purchase or sale of securities or other property) with a Fidelity Fund because of their status as “affiliated persons” of the Fund. Separate compliance programs and procedures of the Fidelity Funds, Fidelity Management & Research Company (FMR) and the other Fidelity companies are designed to prevent, or identify and correct, violations of these provisions. This Code does not, and is not intended to, repeat or replace these programs and procedures, and such conflicts fall outside of the parameters of this Code.
Although typically not presenting an opportunity for improper personal benefit, conflicts arise from, or as a result of, the contractual relationship between the Fidelity Funds and FMR (or another Fidelity company) of which the Covered Officers are also officers or employees. As a result, this Code recognizes that the Covered Officers will, in the normal course of their duties (whether formally for the Fidelity Funds, FMR or another Fidelity company), be involved in establishing policies and implementing decisions that have different effects on the Fidelity Funds, FMR and other Fidelity companies. The participation of the Covered Officers in such activities is inherent in the contractual relationship between the Fidelity Funds and FMR (or another Fidelity company), and is consistent with the performance by the Covered Officers of their duties as officers of the Fidelity Funds. Thus, if performed in conformity with the provisions of the Investment Company Act and the Investment Advisers Act, such activities will be deemed to have been handled ethically. In addition, it is recognized by the Funds’ Board of Trustees (Board) that the Covered Officers also may be officers or employees of one or more other Fidelity Funds covered by this Code.
Other conflicts of interest are covered by the Code, even if such conflicts of interest are not subject to provisions in the Investment Company Act and the Investment Advisers Act. The following list provides examples of conflicts of interest under the Code, but Covered Officers should keep in mind that these examples are not exhaustive. The overarching principle is that the personal interest of a Covered Officer should not be placed improperly before the interest of a Fidelity Fund.
* * *
Each Covered Officer must:
·
not use his or her personal influence or personal relationships improperly to influence investment decisions or financial reporting by any Fidelity Fund whereby the Covered Officer would benefit personally to the detriment of any Fidelity Fund;
·
not cause a Fidelity Fund to take action, or fail to take action, for the individual personal benefit of the Covered Officer rather than the benefit of the Fidelity Fund;
·
not engage in any outside business activity, including serving as a director or trustee, that prevents the Covered Officer from devoting appropriate time and attention to the Covered Officer’s responsibilities with the Fidelity Funds;
·
not have a consulting or employment relationship with any of the Fidelity Funds’ service providers that are not affiliated with Fidelity; and
·
not retaliate against any employee or Covered Officer for reports of actual or potential misconduct, which are made in good faith.
With respect to other fact patterns, if a Covered Officer is in doubt, other potential conflict of interest situations should be described immediately to the Fidelity Ethics Office for resolution. Similarly, any questions a Covered Officer has generally regarding the application or interpretation of the Code should be directed to the Fidelity Ethics Office immediately.
III. Disclosure and Compliance
·
Each Covered Officer should familiarize himself with the disclosure requirements generally applicable to the Fidelity Funds.
·
Each Covered Officer should not knowingly misrepresent, or cause others to misrepresent, facts about any Fidelity Fund to others, whether within or outside Fidelity, including to the Board and auditors, and to governmental regulators and self-regulatory organizations;
·
Each Covered Officer should, to the extent appropriate within his area of responsibility, consult with other officers and employees of the Fidelity Funds, FMR and the Fidelity service providers, and with the Board’s Compliance Committee, with the goal of promoting full, fair, accurate, timely and understandable disclosure in the reports and documents the Fidelity Funds file with, or submit to, the SEC and in other public communications made by the Fidelity Funds; and
·
It is the responsibility of each Covered Officer to promote compliance with the standards and restrictions imposed by applicable laws, rules and regulations.
IV. Reporting and Accountability
Each Covered Officer must:
·
upon receipt of the Code, and annually thereafter, submit to the Fidelity Ethics Office an acknowledgement stating that he or she has received, read, and understands the Code; and
·
notify the Fidelity Ethics Office promptly if he or she knows of any violation of the Code. Failure to do so is itself a violation of this Code.
The Fidelity Ethics Office shall take all action it considers appropriate to investigate any actual or potential violations reported to it. Upon completion of the investigation, if necessary, the matter will be reviewed with senior management or other appropriate parties, and a determination will be made as to whether any action should be taken as detailed below. The Covered Officer will be informed of any action determined to be appropriate. The Fidelity Ethics Office will inform the Personal Trading Committee of all Code violations and actions taken in response. Without implied limitation, appropriate remedial, disciplinary or preventive action may include a written warning, a letter of censure, suspension, dismissal or, in the event of criminal or other serious violations of law, notification of the SEC or other appropriate law enforcement authorities. Additionally, other legal remedies may be pursued.
The policies and procedures described in the Code do not create any obligations to any person or entity other than the Fidelity Funds. The Code is intended solely for the internal use by the Fidelity Funds and does not constitute a promise, contract or an admission by or on behalf of any Fidelity Fund as to any fact, circumstance, or legal conclusion. The Fidelity Funds, the Fidelity companies and the Fidelity Chief Ethics Officer retain the discretion to decide whether the Code applies to a specific situation, and how it should be interpreted.
V. Oversight
Material violations of this Code will be reported promptly by FMR to the Board’s Compliance Committee. In addition, at least once each year, FMR will provide a written report to the Board, which describes any issues arising under the Code since the last report to the Board, including, but not limited to, information about material violations of the Code and action taken in response to the material violations.
VI. Other Policies and Procedures
This Code shall be the sole code of ethics adopted by the Fidelity Funds for purposes of Section 406 of the Sarbanes-Oxley Act and the rules and forms applicable to registered investment companies thereunder. Other Fidelity policies or procedures that cover the behavior or activities of Covered Officers are separate requirements applying to the Covered Officers (and others), and are not part of this Code.
VII. Amendments
Any material amendments or changes to this Code must be approved or ratified by a majority vote of the Board, including a majority of the Trustees who are not interested persons of the Fidelity Funds.
VIII. Records and Confidentiality
Records of any violation of the Code and of the actions taken as a result of such violations will be kept by the Fidelity Ethics Office. All reports and records prepared or maintained pursuant to this Code will be considered confidential and shall be maintained and protected accordingly. Except as otherwise required by law or this Code, such matters shall not be disclosed to anyone other than the Fidelity Ethics Office, the Personal Trading Committee, the Board, appropriate personnel at the relevant Fidelity company or companies and the legal counsel of any or all of the foregoing.
Serious News for Serious Traders! Try StreetInsider.com Premium Free!
You May Also Be Interested In
- Grupo Aeroportuario Del Pacifico Reports A Passenger Traffic Increase In July 2026 Of 1.2% Compared To 2025
- DataMeds AI to be Featured In-Person on Fox Business’ Claman Countdown to Introduce “Health Lives Here”
- Johnson Pope Advises Longstanding Client Monticciolo Family and Sedation Dentistry in Strategic Partnership with Sage Dental
Create E-mail Alert Related Categories
SEC FilingsSign up for StreetInsider Free!
Receive full access to all new and archived articles, unlimited portfolio tracking, e-mail alerts, custom newswires and RSS feeds - and more!
