

Form N-CSR Eaton Vance Enhanced For: Dec 31
 Tweet
Tweet Share
Share
UNITED STATES
SECURITIES AND EXCHANGE COMMISSION
Washington, D.C. 20549
Form N-CSR
CERTIFIED SHAREHOLDER REPORT OF REGISTERED
MANAGEMENT INVESTMENT COMPANIES
Investment Company Act File Number: 811-21670
Eaton Vance Enhanced Equity Income Fund II
(Exact Name of Registrant as Specified in Charter)
Two International Place, Boston, Massachusetts 02110
(Address of Principal Executive Offices)
Deidre E. Walsh
Two International Place, Boston, Massachusetts 02110
(Name and Address of Agent for Services)
(617) 482-8260
(Registrant’s Telephone Number)
December 31
Date of Fiscal Year End
December 31, 2021
Date of Reporting Period
Item 1. Reports to Stockholders

Eaton Vance
Enhanced Equity Income Fund II (EOS)
Annual Report
December 31, 2021

Commodity Futures Trading Commission Registration. The Commodity Futures Trading Commission (“CFTC”) has adopted regulations that subject registered investment companies and advisers to regulation by the CFTC if a fund invests more than a prescribed level of its assets in certain CFTC-regulated instruments (including futures, certain options and swap agreements) or markets itself as providing investment exposure to such instruments. The investment adviser has claimed an exclusion from the definition of “commodity pool operator” under the Commodity Exchange Act with respect to its management of the Fund. Accordingly, neither the Fund nor the adviser with respect to the operation of the Fund is subject to CFTC regulation. Because of its management of other strategies, the Fund’s adviser is registered with the CFTC as a commodity pool operator. The adviser is also registered as a commodity trading advisor.
Managed Distribution Plan. Pursuant to an exemptive order issued by the Securities and Exchange Commission (Order), the Fund is authorized to distribute long-term capital gains to shareholders more frequently than once per year. Pursuant to the Order, the Fund’s Board of Trustees approved a Managed Distribution Plan (MDP) pursuant to which the Fund makes monthly cash distributions to common shareholders, stated in terms of a fixed amount per common share.
The Fund currently distributes monthly cash distributions equal to $0.1373 per share in accordance with the MDP. You should not draw any conclusions about the Fund’s investment performance from the amount of these distributions or from the terms of the MDP. The MDP will be subject to regular periodic review by the Fund’s Board of Trustees and the Board may amend or terminate the MDP at any time without prior notice to Fund shareholders. However, at this time there are no reasonably foreseeable circumstances that might cause the termination of the MDP.
The Fund may distribute more than its net investment income and net realized capital gains and, therefore, a distribution may include a return of capital. A return of capital distribution does not necessarily reflect the Fund’s investment performance and should not be confused with “yield” or “income.” With each distribution, the Fund will issue a notice to shareholders and a press release containing information about the amount and sources of the distribution and other related information. The amounts and sources of distributions contained in the notice and press release are only estimates and are not provided for tax purposes. The amounts and sources of the Fund’s distributions for tax purposes will be reported to shareholders on Form 1099-DIV for each calendar year.
Fund shares are not insured by the FDIC and are not deposits or other obligations of, or guaranteed by, any depository institution. Shares are subject to investment risks, including possible loss of principal invested.
Annual Report December 31, 2021
Eaton Vance
Enhanced Equity Income Fund II
| 2 | ||||
| 3 | ||||
| 4 | ||||
| The Fund’s Investment Objectives, Principal Strategies and Principal Risks |
5 | |||
| 9 | ||||
| 10 | ||||
| 23 | ||||
| 24 | ||||
| 25 | ||||
| 27 | ||||
| 30 | ||||
| 32 |
Eaton Vance
Enhanced Equity Income Fund II
December 31, 2021
Management’s Discussion of Fund Performance1
Economic and Market Conditions
The 12-month period starting January 1, 2021, was notable for a U.S. equity rally that lasted for most of the period and resulted in U.S. stocks outperforming most other stock markets in developed economies. Except for temporary retreats in September and November, broad-market indexes generally posted strong returns during the period. Investors cheered the reopening of businesses that had been affected by the pandemic and the rollout of several highly effective COVID-19 vaccines.
COVID-19, however, continued to have a firm grip on the U.S. economy. Disease rates advanced and declined with second, third, and fourth waves of infections. Worker shortages led to global supply-chain disruptions. From computer chips to shipping containers, scarcities of key items led to temporary factory shutdowns and empty store shelves. Those shortages — combined with high demand from consumers eager to spend money saved earlier in the pandemic — led to higher year-over-year inflation than the U.S. had seen in decades.
Still, investor optimism about a recovering economy drove stock prices up during most of the period. A significant pullback, however, occurred in September 2021 when virtually every major U.S. stock index reported negative returns. Unexpectedly weak job creation in August and the U.S. Federal Reserve’s (the Fed’s) announcement that it might soon begin tapering its monthly bond purchases — which had stimulated the economy earlier — combined to drive stocks into negative territory. Rising COVID-19 infections also weighed on equity performance in September.
In the final quarter of 2021, however, stock prices came roaring back. Even the late-November news of a new and more transmissible COVID-19 variant — Omicron — caused only a temporary market retreat. The Fed’s actions to tamp down inflation were applauded by investors, with stocks gaining ground after the central bank announced that tapering would be accelerated and that three possible interest rate hikes were forecast for 2022. Just two trading days before year-end, the S&P 500® Index closed at its 70th new all-time high for the period, and the Dow Jones Industrial Average® (DJIA) closed at an all-time high as well.
For the period as a whole, the broad-market S&P 500® Index returned 28.71%; the blue-chip DJIA was up 20.95%; and the technology-laden Nasdaq Composite Index rose 22.18%. Large-cap U.S. stocks, as measured by the Russell 1000® Index, outperformed their small-cap counterparts, as measured by the Russell 2000® Index. In the large-cap space, growth stocks modestly outperformed value stocks, but in the small-cap space, value stocks strongly outperformed growth stocks during the period.
Fund Performance
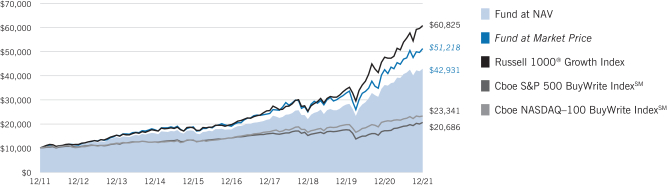
For the 12-month period ended December 31, 2021, Eaton Vance Enhanced Equity Income Fund II (the Fund) returned 18.82% at net asset value of its common shares (NAV), underperforming its equity benchmark, the Russell 1000® Growth Index (the Index), which returned 27.60%. The Fund underperformed one of its two options benchmarks, the Cboe S&P 500 BuyWrite IndexSM, which returned 20.47%; but outperformed its other options benchmark, the Cboe NASDAQ-100 BuyWrite IndexSM, which returned 10.56% during the period. The Fund’s underlying common stock portfolio underperformed the Index.
The Fund’s options overlay strategy (the options strategy) detracted from Fund performance versus the Index during the period. The options strategy, which is designed to help limit the Fund’s exposure to market volatility and contribute to current income, may be beneficial during times of market weakness, but it may also detract from performance during periods of market strength.
Particularly in the information technology (IT) sector, the options strategy weighed on the Fund’s relative return during the period. Call options sold on Microsoft Corp., Intuit, Inc., and Alphabet, Inc. had the largest negative impact on Fund performance. Meanwhile, call options sold on Visa, Inc., Meta Platforms, Inc., and Amazon.com, Inc. were the most profitable during the period.
In the Fund’s common stock portfolio, stock selections in the IT and consumer discretionary sectors, along with stock selections and an overweight position relative to the Index in the health care sector, detracted from Fund performance versus the Index during the period.
In the IT sector, the Fund’s underweight position in NVIDIA Corp. (NVIDIA), a maker of computer graphics processing units used in gaming, data center, and self-driving vehicle applications, hurt relative returns. Long-term tailwinds — growth in the gaming, artificial intelligence, and autonomous vehicle industries — combined with a sharp increase in gaming and data center demand during the pandemic helped NVIDIA’s stock price more than double during the period. By period-end, the stock was sold from the Fund.
In the consumer discretionary sector, underweighting electric car maker Tesla, Inc. (Tesla) — due to inconsistency of earnings and the company’s high valuation — hurt relative performance as vehicle deliveries and profits rose and Tesla’s stock performed strongly during the period. By period-end, Tesla was sold from the Fund.
In contrast, stock selections in the communication services, financials, and industrials sectors contributed to Fund performance versus the Index. In the communication services sector, the Fund’s overweight position in Alphabet, Inc. (Alphabet), parent company of search engine Google, performed strongly as positive e-commerce trends drove increased demand for search engine advertising and engagement during the period. In addition, growth in viewership and ad sales on video sharing platform YouTube, an Alphabet subsidiary, exceeded analyst expectations during the period and provided an additional tailwind for Alphabet’s stock price.
Fund Distributions
Pursuant to an exemptive order issued by the Securities and Exchange Commission (the Order), the Fund is authorized to distribute long-term capital gains to shareholders more frequently than once per year. Pursuant to the Order, the Fund’s Board of Trustees approved a Managed Distribution Plan (MDP) pursuant to which the Fund makes monthly cash distributions to common shareholders. The Fund’s MDP had no effect on the Fund’s investment strategy during the most recent fiscal year and is not expected to have an effect in future periods, but distributions in excess of Fund returns will cause its per share NAV to erode. Investors should not draw any conclusions about the Fund’s investment performance from the amount of its distribution or from the terms of its MDP.
For the period from January 1, 2021 to July 31, 2021, the Fund made monthly distributions of $0.0988 per share and, for the period from August 1, 2021 to December 31, 2021, the Fund made monthly distributions of $0.1373 per share. The Fund’s distributions may be comprised of amounts characterized for federal income tax purposes as qualified and non-qualified ordinary dividends, capital gains and non-dividend distributions, also known as return of capital distributions. The federal income tax character of distributions is determined after the end of the calendar year and reported to shareholders on the Internal Revenue Service’s form 1099-DIV. For additional information, see Note 2 in the Notes to Financial Statements herein.
See Endnotes and Additional Disclosures in this report.
Past performance is no guarantee of future results. Returns are historical and are calculated net of management fees and other expenses by determining the percentage change in net asset value (NAV) or market price (as applicable) with all distributions reinvested in accordance with the Fund’s Dividend Reinvestment Plan. Performance at market price will differ from performance at NAV due to variations in the Fund’s market price versus NAV, which may reflect factors such as fluctuations in supply and demand for Fund shares, changes in Fund distributions, shifting market expectations for the Fund’s future returns and distribution rates, and other considerations affecting the trading prices of closed-end funds. Investment return and principal value will fluctuate so that shares, when sold, may be worth more or less than their original cost.Performance for periods less than or equal to one year is cumulative. Performance is for the stated time period only; due to market volatility, current Fund performance may be lower or higher than the quoted return. For performance as of the most recent month-end, please refer to eatonvance.com.
| 2 |
Eaton Vance
Enhanced Equity Income Fund II
December 31, 2021
Portfolio Manager(s) Lewis R. Piantedosi and Douglas R. Rogers, CFA, CMT
| % Average Annual Total Returns | Inception Date | One Year | Five Years | Ten Years | ||||||||||||
| Fund at NAV |
01/31/2005 | 18.82 | % | 19.37 | % | 15.67 | % | |||||||||
| Fund at Market Price |
— | 20.40 | 21.81 | 17.73 | ||||||||||||
|
| ||||||||||||||||
| Russell 1000® Growth Index |
— | 27.60 | % | 25.30 | % | 19.77 | % | |||||||||
| Cboe S&P 500 BuyWrite IndexSM |
— | 20.47 | 7.84 | 7.53 | ||||||||||||
| Cboe NASDAQ–100 BuyWrite IndexSM |
— | 10.56 | 10.50 | 8.84 | ||||||||||||
| % Premium/Discount to NAV3 | ||||||||||||||||
| 3.67 | % | |||||||||||||||
| Distributions4 | ||||||||||||||||
| Total Distributions per share for the period |
$ | 1.378 | ||||||||||||||
| Distribution Rate at NAV |
6.95 | % | ||||||||||||||
| Distribution Rate at Market Price |
6.70 | |||||||||||||||
Growth of $10,000
This graph shows the change in value of a hypothetical investment of $10,000 in the Fund for the period indicated. For comparison, the same investment is shown in the indicated index.
See Endnotes and Additional Disclosures in this report.
Past performance is no guarantee of future results. Returns are historical and are calculated net of management fees and other expenses by determining the percentage change in net asset value (NAV) or market price (as applicable) with all distributions reinvested in accordance with the Fund’s Dividend Reinvestment Plan. Performance at market price will differ from performance at NAV due to variations in the Fund’s market price versus NAV, which may reflect factors such as fluctuations in supply and demand for Fund shares, changes in Fund distributions, shifting market expectations for the Fund’s future returns and distribution rates, and other considerations affecting the trading prices of closed-end funds. Investment return and principal value will fluctuate so that shares, when sold, may be worth more or less than their original cost. Performance for periods less than or equal to one year is cumulative. Performance is for the stated time period only; due to market volatility, current Fund performance may be lower or higher than the quoted return. For performance as of the most recent month-end, please refer to eatonvance.com.
| 3 |
Eaton Vance
Enhanced Equity Income Fund II
December 31, 2021
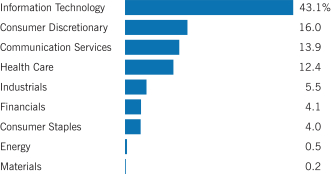
Sector Allocation (% of total investments)5
Top 10 Holdings (% of total investments)5
| Amazon.com, Inc. |
8.1 | % | ||
| Microsoft Corp. |
7.7 | |||
| Alphabet, Inc., Class C |
7.6 | |||
| Apple, Inc. |
5.8 | |||
| Visa, Inc., Class A |
4.3 | |||
| Adobe, Inc. |
3.7 | |||
| Meta Platforms, Inc., Class A |
3.2 | |||
| Intuit, Inc. |
3.0 | |||
| QUALCOMM, Inc. |
2.8 | |||
| PayPal Holdings, Inc. |
2.7 | |||
| Total |
48.9 | % | ||
See Endnotes and Additional Disclosures in this report.
| 4 |
Eaton Vance
Enhanced Equity Income Fund II
December 31, 2021
The Fund’s Investment Objectives, Principal Strategies and Principal Risks6
Investment Objectives. The Fund’s investment objective is to provide current income, with a secondary objective of capital appreciation.
Principal Strategies. The Fund pursues its investment objectives by investing primarily in a portfolio of mid-and large-capitalization common stocks. Under normal market conditions, the Fund seeks to generate current earnings from option premiums by selling covered call options on a substantial portion of its portfolio securities.
Under normal market conditions, the Fund invests at least 80% of its total assets in common stocks. The Fund generally invests in common stocks on which exchange traded call options are currently available. The Fund invests primarily in common stocks of U.S. issuers, although the Fund may invest up to 25% of its total assets in securities of foreign issuers, including American Depositary Receipts (‘‘ADRs’’), Global Depositary Receipts (‘‘GDRs’’) and European Depositary Receipts (‘‘EDRs’’).
Under normal market conditions, the Fund pursues its primary investment objective principally by employing an options strategy of writing (selling) covered call options on a substantial portion of its portfolio securities, although on up to 5% of the Fund’s net assets, the Fund may sell the stock underlying a call option prior to purchasing back the call option. Such sales shall occur no more than three days before the option buy back. The extent of option writing activity will depend upon market conditions and the Adviser’s ongoing assessment of the attractiveness of writing call options on the Fund’s stock holdings. Writing call options involves a tradeoff between the option premiums received and reduced participation in potential future stock price appreciation. Depending on the Adviser’s evaluation, the Fund may write call options on varying percentages of the Fund’s common stock holdings. The Fund seeks to generate current earnings from option writing premiums and, to a lesser extent, from dividends on stocks held.
In addition to the strategy of selling covered call options, the Fund may invest up to 20% of its total assets in other derivative instruments acquired for hedging, risk management and investment purposes, provided that no more than 10% of the Fund’s total assets may be invested in such derivative instruments acquired for non-hedging purposes. Among other derivative strategies, the Fund may purchase put options on the S&P 500® and other broad-based securities indices deemed suitable for this purpose, and/or on individual stocks held in its portfolio or use other derivative instruments in order to help protect against a decline in the value of its portfolio securities. Derivative instruments may be used by the Fund to enhance returns or as a substitute for the purchase or sale of securities.
Principal Risks
Market Discount Risk. As with any security, the market value of the common shares may increase or decrease from the amount initially paid for the common shares. The Fund’s common shares have traded both at a premium and at a discount relative to NAV. The shares of closed-end management investment companies frequently trade at a discount from their NAV. This is a risk separate and distinct from the risk that the Fund’s NAV may decrease.
Market Risk. The value of investments held by the Fund may increase or decrease in response to economic, political, financial, public health crises (such as epidemics or pandemics) or other disruptive events (whether real, expected or perceived) in the U.S. and global markets. These events may negatively impact broad segments of businesses and populations and may exacerbate pre-existing risks to the Fund. The frequency and magnitude of
resulting changes in the value of the Fund’s investments cannot be predicted. Certain securities and other investments held by the Fund may experience increased volatility, illiquidity, or other potentially adverse effects in reaction to changing market conditions. Monetary and/or fiscal actions taken by U.S. or foreign governments to stimulate or stabilize the global economy may not be effective and could lead to high market volatility. No active trading market may exist for certain investments held by the Fund, which may impair the ability of the Fund to sell or to realize the current valuation of such investments in the event of the need to liquidate such assets.
Equity Securities Risk. The value of equity securities and related instruments may decline in response to adverse changes in the economy or the economic outlook; deterioration in investor sentiment; interest rate, currency, and commodity price fluctuations; adverse geopolitical, social or environmental developments; issuer and sector-specific considerations; unexpected trading activity among retail investors; or other factors. Market conditions may affect certain types of stocks to a greater extent than other types of stocks. If the stock market declines in value, the value of the Fund’s equity securities will also likely decline. Although prices can rebound, there is no assurance that values will return to previous levels.
Option Strategy Risk. As the writer of a call option, the Fund forgoes, during the option’s life, the opportunity to profit from increases in the market value of the security covering the call option above the sum of the option premium received and the exercise price of the call, but has retained the risk of loss, minus the option premium received, should the price of the underlying security decline. The writer of an option has no control over when during the exercise period of the option it may be required to fulfill its obligation as a writer of the option. Once an option writer has received an exercise notice, it cannot effect a closing purchase transaction in order to terminate its obligation under the option and must deliver the underlying security at the exercise price. Thus, the use of options may require the Fund to sell portfolio securities at inopportune times or for prices other than current market values, will limit the amount of appreciation the Fund can realize on an investment, or may cause the Fund to hold a security that it might otherwise sell. The value of options may also be adversely affected if the market for such options becomes less liquid or smaller.
Derivatives Risk. The Fund’s exposure to derivatives involves risks different from, or possibly greater than, the risks associated with investing directly in securities and other investments. The use of derivatives can lead to losses because of adverse movements in the price or value of the security, instrument, index, currency, commodity, economic indicator or event underlying a derivative (“reference instrument”), due to failure of a counterparty or due to tax or regulatory constraints. Derivatives may create leverage in the Fund, which represents a non-cash exposure to the underlying reference instrument. Leverage can increase both the risk and return potential of the Fund. Derivatives risk may be more significant when derivatives are used to enhance return or as a substitute for a cash investment position, rather than solely to hedge the risk of a position held by the Fund. Use of derivatives involves the exercise of specialized skill and judgment, and a transaction may be unsuccessful in whole or in part because of market behavior or unexpected events. Changes in the value of a derivative (including one used for hedging) may not correlate perfectly with the underlying reference instrument. Derivative instruments traded in over-the-counter markets may be difficult to value, may be illiquid, and may be subject to wide swings in valuation caused by changes in the value of the underlying reference instrument. If a derivative’s counterparty is unable
See Endnotes and Additional Disclosures in this report.
| 5 |
Eaton Vance
Enhanced Equity Income Fund II
December 31, 2021
The Fund’s Investment Objectives, Principal Strategies and Principal Risks6 — continued
to honor its commitments, the value of Fund shares may decline and the Fund could experience delays in the return of collateral or other assets held by the counterparty. The loss on derivative transactions may substantially exceed the initial investment, particularly when there is no stated limit on the Fund’s use of derivatives. A derivative investment also involves the risks relating to the reference instrument underlying the investment.
Risks of Investing in Smaller and Mid-Sized Companies. The Fund may make investments in stocks of companies whose market capitalization is considered middle sized or “mid-cap.” Smaller and mid-sized companies often are newer or less established companies than larger companies. Investments in smaller and mid-sized companies carry additional risks because earnings of these companies tend to be less predictable; they often have limited product lines, markets, distribution channels or financial resources; and the management of such companies may be dependent upon one or a few key people. The market movements of equity securities of smaller and mid-sized companies may be more abrupt or erratic than the market movements of equity securities of larger, more established companies or the stock market in general. Historically, smaller and mid-sized companies have sometimes gone through extended periods when they did not perform as well as larger companies. In addition, equity securities of smaller and mid-sized companies generally are less liquid than those of larger companies.
Foreign Investment Risk. Foreign investments can be adversely affected by political, economic and market developments abroad, including the imposition of economic and other sanctions by the United States or another country. There may be less publicly available information about foreign issuers because they may not be subject to reporting practices, requirements or regulations comparable to those to which U.S. companies are subject. Foreign markets may be smaller, less liquid and more volatile than the major markets in the United States, and as a result, Fund share values may be more volatile. Trading in foreign markets typically involves higher expense than trading in the United States. The Fund may have difficulties enforcing its legal or contractual rights in a foreign country.
Emerging Markets Investment Risk. Investment markets within emerging market countries are typically smaller, less liquid, less developed and more volatile than those in more developed markets like the United States, and may be focused in certain sectors. Emerging market securities often involve greater risks than developed market securities. The information available about an emerging market issuer may be less reliable than for comparable issuers in more developed capital markets.
Currency Risk. Exchange rates for currencies fluctuate daily. The value of foreign investments may be affected favorably or unfavorably by changes in currency exchange rates in relation to the U.S. dollar. Currency markets generally are not as regulated as securities markets and currency transactions are subject to settlement, custodial and other operational risks.
LIBOR Transition and Associated Risk. The London Interbank Offered Rate or LIBOR is used throughout global banking and financial industries to determine interest rates for a variety of financial instruments (such as debt instruments and derivatives) and borrowing arrangements. The ICE Benchmark Administration Limited, the administrator of LIBOR, ceased publishing certain LIBOR settings on December 31, 2021, and is expected to cease publishing the remaining LIBOR settings on June 30, 2023. The Fund has exposure to LIBOR-based instruments. Although the transition process away from LIBOR has become increasingly well-defined, the impact on certain debt securities, derivatives and other financial
instruments that utilize LIBOR remains uncertain. The transition process may involve, among other things, increased volatility or illiquidity in markets for instruments that currently rely on LIBOR, such as floating-rate debt obligations. Any effects of the transition away from LIBOR and the adoption of alternative reference rates, as well as other unforeseen effects, could result in losses to the Fund. Such effects may occur prior to the anticipated discontinuation of the remaining LIBOR settings in 2023. Furthermore, the risks associated with the discontinuation of LIBOR and transition to replacement rates may be exacerbated if an orderly transition to an alternative reference rate is not completed in a timely manner.
Interest Rate Risk. The level of premiums from call options writing and the amounts available for distribution from the Fund’s options activity may decrease in declining interest rate environments. Any preferred stocks paying fixed dividend rates in which the Fund invests, will likely change in value as market interest rates change. When interest rates rise, the market value of such securities generally will fall. To the extent that the Fund invests in preferred stocks, the net asset value and price of the Common Shares may decline if market interest rates rise. Interest rates are currently low relative to historic levels. During periods of declining interest rates, an issuer of preferred stock may exercise its option to redeem securities prior to maturity, forcing the Fund to reinvest in lower yielding securities. This is known as call risk. During periods of rising interest rates, the average life of certain types of securities may be extended because of slower than expected payments. This may lock in a below market yield, increase the security’s duration, and reduce the value of the security. This is known as extension risk. The value of the Fund’s common stock investments may also be influenced by changes in interest rates.
Sector Risk. Because the Fund may, under certain market conditions, invest a significant portion of its assets in the utilities and/or financial services sectors, the value of Fund shares may be affected by events that adversely affect those sectors and may fluctuate more than that of a more broadly diversified fund.
Liquidity Risk. The Fund is exposed to liquidity risk when trading volume, lack of a market maker or trading partner, large position size, market conditions, or legal restrictions impair its ability to sell particular investments or to sell them at advantageous market prices. Consequently, the Fund may have to accept a lower price to sell an investment or continue to hold it or keep the position open, sell other investments to raise cash or abandon an investment opportunity, any of which could have a negative effect on the Fund’s performance. These effects may be exacerbated during times of financial or political stress.
Risks Associated with Active Management. The success of the Fund’s investment strategy depends on portfolio management’s successful application of analytical skills and investment judgment. Active management involves subjective decisions.
Recent Market Conditions. An outbreak of respiratory disease caused by a novel coronavirus was first detected in China in late 2019 and subsequently spread internationally. This coronavirus has resulted in closing borders, enhanced health screenings, changes to healthcare service preparation and delivery, quarantines, cancellations, disruptions to supply chains and customer activity, as well as general concern and uncertainty. The impact of this coronavirus has resulted in a substantial economic downturn, which may continue for an extended period of time. Health crises caused by outbreaks of disease, such as the coronavirus outbreak, may exacerbate other pre-existing political, social and economic risks and
See Endnotes and Additional Disclosures in this report.
| 6 |
Eaton Vance
Enhanced Equity Income Fund II
December 31, 2021
The Fund’s Investment Objectives, Principal Strategies and Principal Risks6 — continued
disrupt normal market conditions and operations. The impact of this outbreak has negatively affected the worldwide economy, as well as the economies of individual countries and industries, and could continue to affect the market in significant and unforeseen ways. Other epidemics and pandemics that may arise in the future may have similar effects. For example, a global pandemic or other widespread health crisis could cause substantial market volatility and exchange trading suspensions and closures. In addition, the increasing interconnectedness of markets around the world may result in many markets being affected by events or conditions in a single country or region or events affecting a single or small number of issuers. The coronavirus outbreak and public and private sector responses thereto have led to large portions of the populations of many countries working from home for indefinite periods of time, temporary or permanent layoffs, disruptions in supply chains, and lack of availability of certain goods. The impact of such responses could adversely affect the information technology and operational systems upon which the Fund and the Fund’s service providers rely, and could otherwise disrupt the ability of the employees of the Fund’s service providers to perform critical tasks relating to the Fund. Any such impact could adversely affect the Fund’s performance, or the performance of the securities in which the Fund invests and may lead to losses on your investment in the Fund.
Cybersecurity Risk. With the increased use of technologies by Fund service providers to conduct business, such as the Internet, the Fund is susceptible to operational, information security and related risks. In general, cyber incidents can result from deliberate attacks or unintentional events. Cybersecurity failures by or breaches of the Fund’s investment adviser or administrator and other service providers (including, but not limited to, the custodian or transfer agent), and the issuers of securities in which the Fund invests, may disrupt and otherwise adversely affect their business operations. This may result in financial losses to the Fund, impede Fund trading, interfere with the Fund’s ability to calculate its NAV, interfere with Fund shareholders’ ability to transact business or cause violations of applicable privacy and other laws, regulatory fines, penalties, reputational damage, reimbursement or other compensation costs, or additional compliance costs.
General Fund Investing Risks. The Fund is not a complete investment program and there is no guarantee that the Fund will achieve its investment objective. It is possible to lose money by investing in the Fund. An investment in the Fund is not a deposit in a bank and is not insured or guaranteed by the Federal Deposit Insurance Corporation or any other government agency.
Potential Conflicts of Interest
As a diversified global financial services firm, Morgan Stanley, the parent company of the investment adviser, engages in a broad spectrum of activities where Morgan Stanley’s interests or the interests of its clients may conflict with the interests of the Fund. Morgan Stanley advises clients and sponsors, manages or advises other investment funds and investment programs, accounts and businesses (collectively, together with any new or successor Morgan Stanley funds, programs, accounts or businesses, (other than funds, programs, accounts or businesses sponsored, managed, or advised by former direct or indirect subsidiaries of Eaton Vance Corp. (“Eaton Vance Investment Accounts”)), the “MS Investment Accounts,” and, together with the Eaton Vance Investment Accounts, the ‘‘Affiliated Investment Accounts’’) with a wide variety of investment objectives that in some instances may overlap or conflict with a Fund’s investment objectives
and present conflicts of interest. There is no assurance that conflicts of interest will be resolved in favor of Fund shareholders and, in fact, they may not be. Conflicts of interest not described below may also exist.
Material Non-public Information. It is expected that confidential or material non-public information regarding an investment or potential investment opportunity may become available to the investment adviser. If such information becomes available, the investment adviser may be precluded (including by applicable law or internal policies or procedures) from pursuing an investment or disposition opportunity with respect to such investment or investment opportunity. Morgan Stanley has established certain information barriers and other policies to address the sharing of information between different businesses within Morgan Stanley.
Investments by Morgan Stanley and its Affiliated Investment Accounts. In serving in multiple capacities to Affiliated Investment Accounts, Morgan Stanley, including the investment adviser and its investment teams, may have obligations to other clients or investors in Affiliated Investment Accounts, the fulfillment of which may not be in the best interests of a Fund or its shareholders. A Fund’s investment objectives may overlap with the investment objectives of certain Affiliated Investment Accounts. As a result, the members of an investment team may face conflicts in the allocation of investment opportunities among a Fund and other investment funds, programs, accounts and businesses advised by or affiliated with the investment adviser. Certain Affiliated Investment Accounts may provide for higher management or incentive fees or greater expense reimbursements or overhead allocations, all of which may contribute to this conflict of interest and create an incentive for the investment adviser to favor such other accounts. To seek to reduce potential conflicts of interest and to attempt to allocate investment opportunities in a fair and equitable manner, the investment adviser has implemented allocation policies and procedures. These policies and procedures are intended to give all clients of the investment adviser, including the Fund(s), fair access to investment opportunities, consistent with the requirements of organizational documents, investment strategies, applicable laws and regulations, and the fiduciary duties of the investment adviser.
Investments by Separate Investment Departments. The entities and individuals that provide investment-related services for the Fund and certain other Eaton Vance Investment Accounts (the “Eaton Vance Investment Department”) may be different from the entities and individuals that provide investment-related services to MS Investment Accounts (the “MS Investment Department” and, together with the Eaton Vance Investment Department, the “Investment Departments”). Although Morgan Stanley has implemented information barriers between the Investment Departments in accordance with internal policies and procedures, each Investment Department may engage in discussions and share information and resources with the other Investment Department on certain investment-related matters. A MS Investment Account could trade in advance of a Fund (and vice versa), might complete trades more quickly and efficiently than a Fund, and/or achieve different execution than a Fund on the same or similar investments made contemporaneously.
Morgan Stanley Trading and Principal Investing Activities. Notwithstanding anything to the contrary herein, Morgan Stanley will generally conduct its sales and trading businesses, publish research and analysis, and render investment advice without regard for a Fund’s holdings, although these activities could have an adverse impact on the value of one or more of the Fund’s investments, or could cause Morgan
See Endnotes and Additional Disclosures in this report.
| 7 |
Eaton Vance
Enhanced Equity Income Fund II
December 31, 2021
The Fund’s Investment Objectives, Principal Strategies and Principal Risks6 — continued
Stanley to have an interest in one or more portfolio investments that is different from, and potentially adverse to, that of a Fund.
Morgan Stanley’s Investment Banking and Other Commercial Activities. Morgan Stanley advises clients on a variety of mergers, acquisitions, restructuring, bankruptcy and financing transactions. Morgan Stanley may act as an advisor to clients, including other investment funds that may compete with a Fund and with respect to investments that a Fund may hold. Morgan Stanley may give advice and take action with respect to any of its clients or proprietary accounts that may differ from the advice given, or may involve an action of a different timing or nature than the action taken, by a Fund.
General Process for Potential Conflicts. All of the transactions described above involve the potential for conflicts of interest between the investment adviser, related persons of the investment adviser and/or their clients. The Investment Advisers Act of 1940, as amended (the “Advisers Act”), the Investment Company Act of 1940, as amended (the “1940 Act”), and the Employee Retirement Income Security Act, as amended (“ERISA”) impose certain requirements designed to decrease the possibility of conflicts of interest between an investment adviser and its clients. In some cases, transactions may be permitted subject to fulfillment of certain conditions. Certain other transactions may be prohibited. In addition, the investment adviser has instituted policies and procedures designed to prevent conflicts of interest from arising and, when they do arise, to ensure that it effects transactions for clients in a manner that is consistent with its fiduciary duty to its clients and in accordance with applicable law.
See Endnotes and Additional Disclosures in this report.
| 8 |
Eaton Vance
Enhanced Equity Income Fund II
December 31, 2021
Endnotes and Additional Disclosures
| 1 | The views expressed in this report are those of the portfolio manager(s) and are current only through the date stated at the top of this page. These views are subject to change at any time based upon market or other conditions, and Eaton Vance and the Fund(s) disclaim any responsibility to update such views. These views may not be relied upon as investment advice and, because investment decisions are based on many factors, may not be relied upon as an indication of trading intent on behalf of any Eaton Vance fund. This commentary may contain statements that are not historical facts, referred to as “forward-looking statements.” The Fund’s actual future results may differ significantly from those stated in any forward-looking statement, depending on factors such as changes in securities or financial markets or general economic conditions, the volume of sales and purchases of Fund shares, the continuation of investment advisory, administrative and service contracts, and other risks discussed from time to time in the Fund’s filings with the Securities and Exchange Commission. |
| 2 | Russell 1000® Growth Index is an unmanaged index of U.S. large-cap growth stocks. Cboe S&P 500 BuyWrite IndexSM measures the performance of a hypothetical buy-write strategy on the S&P 500® Index. Cboe NASDAQ–100 BuyWrite IndexSM measures the performance of a theoretical portfolio that owns stocks included in the NASDAQ–100® Index and writes (sells) NASDAQ–100® Index covered call options. Unless otherwise stated, index returns do not reflect the effect of any applicable sales charges, commissions, expenses, taxes or leverage, as applicable. It is not possible to invest directly in an index. |
| 3 | The shares of the Fund often trade at a discount or premium to their net asset value. The discount or premium may vary over time and may be higher or lower than what is quoted in this report. For up-to-date premium/discount information, please refer to https://funds.eatonvance.com/closed-end-fund-prices.php. |
| 4 | The Distribution Rate is based on the Fund’s last regular distribution per share in the period (annualized) divided by the Fund’s NAV or market price at the end of the period. The Fund’s distributions may be comprised of amounts characterized for federal income tax purposes as qualified and non-qualified ordinary dividends, capital gains and nondividend distributions, also known as return of capital. For additional information about nondividend distributions, please refer to Eaton Vance Closed-End Fund Distribution Notices (19a) posted on our website, eatonvance.com. The Fund will determine the federal income tax character of distributions paid to a shareholder after the end of the calendar year. This is reported on the IRS form 1099-DIV and provided to the shareholder shortly after each year-end. For information about the tax character of distributions made in prior calendar years, please refer to Performance-Tax Character of Distributions on the Fund’s webpage available at eatonvance.com. In recent years, a significant portion of the Fund’s distributions has been characterized as a return of capital. The Fund’s distributions are determined by the investment adviser based on its current assessment of the Fund’s long-term return potential. Fund distributions may be affected by numerous factors including changes in Fund performance, the cost of financing for leverage, portfolio holdings, realized and projected returns, and other factors. As portfolio and market conditions change, the rate of distributions paid by the Fund could change. |
| 5 | Depictions do not reflect the Fund’s option positions. Excludes cash and cash equivalents. |
| 6 | The information contained herein is provided for informational purposes only and does not constitute a solicitation of an offer to buy or sell Fund shares. Common shares of the Fund are available for purchase and sale only at current market prices in secondary market trading. |
Fund profile subject to change due to active management
Additional Information
S&P 500® Index is an unmanaged index of large-cap stocks commonly used as a measure of U.S. stock market performance. Dow Jones Industrial Average® is a price-weighted average of 30 blue-chip stocks that are generally the leaders in their industry. S&P Dow Jones Indices are a product of S&P Dow Jones Indices LLC (“S&P DJI”) and have been licensed for use. S&P® and S&P 500® are registered trademarks of S&P DJI; Dow Jones® is a registered trademark of Dow Jones Trademark Holdings LLC (“Dow Jones”); S&P DJI, Dow Jones and their respective affiliates do not sponsor, endorse, sell or promote the Fund, will not have any liability with respect thereto and do not have any liability for any errors, omissions, or interruptions of the S&P Dow Jones Indices. Nasdaq Composite Index is a market capitalization-weighted index of all domestic and international securities listed on Nasdaq. Source: Nasdaq, Inc. The information is provided by Nasdaq (with its affiliates, are referred to as the “Corporations”) and Nasdaq’s third party licensors on an “as is” basis and the Corporations make no guarantees and bear no liability of any kind with respect to the information or the Fund. Russell 1000® Index is an unmanaged index of 1,000 U.S. large-cap stocks. Russell 2000® Index is an unmanaged index of 2,000 U.S. small-cap stocks.
Important Notice to Shareholders
Lewis R. Piantedosi will retire from the Eaton Vance organization effective June 30, 2022.
| 9 |
Eaton Vance
Enhanced Equity Income Fund II
December 31, 2021
| Common Stocks — 100.2%(1) |
| |||||||
| Security | Shares | Value | ||||||
| Aerospace & Defense — 1.1% | ||||||||
| Hexcel Corp.(2) |
147,137 | $ | 7,621,697 | |||||
| Raytheon Technologies Corp. |
66,119 | 5,690,201 | ||||||
| $ | 13,311,898 | |||||||
| Auto Components — 1.3% | ||||||||
| Aptiv PLC(2) |
93,535 | $ | 15,428,598 | |||||
| $ | 15,428,598 | |||||||
| Banks — 0.8% | ||||||||
| JPMorgan Chase & Co. |
60,877 | $ | 9,639,873 | |||||
| $ | 9,639,873 | |||||||
| Beverages — 1.9% | ||||||||
| Coca-Cola Co. (The) |
318,591 | $ | 18,863,773 | |||||
| Constellation Brands, Inc., Class A |
16,284 | 4,086,796 | ||||||
| $ | 22,950,569 | |||||||
| Biotechnology — 2.8% | ||||||||
| AbbVie, Inc. |
191,373 | $ | 25,911,904 | |||||
| Argenx SE ADR(2) |
23,328 | 8,169,233 | ||||||
| $ | 34,081,137 | |||||||
| Building Products — 0.9% | ||||||||
| Trane Technologies PLC |
56,633 | $ | 11,441,565 | |||||
| $ | 11,441,565 | |||||||
| Capital Markets — 3.4% | ||||||||
| Charles Schwab Corp. (The) |
243,056 | $ | 20,441,010 | |||||
| Goldman Sachs Group, Inc. (The) |
52,988 | 20,270,559 | ||||||
| $ | 40,711,569 | |||||||
| Chemicals — 0.2% | ||||||||
| Ecolab, Inc. |
9,744 | $ | 2,285,845 | |||||
| $ | 2,285,845 | |||||||
| Commercial Services & Supplies — 0.7% | ||||||||
| Waste Connections, Inc. |
59,343 | $ | 8,086,671 | |||||
| $ | 8,086,671 | |||||||
| Electrical Equipment — 1.2% | ||||||||
| AMETEK, Inc. |
100,757 | $ | 14,815,309 | |||||
| $ | 14,815,309 | |||||||
| Security | Shares | Value | ||||||
| Electronic Equipment, Instruments & Components — 1.8% | ||||||||
| Zebra Technologies Corp., Class A(2) |
36,989 | $ | 22,015,853 | |||||
| $ | 22,015,853 | |||||||
| Entertainment — 2.3% | ||||||||
| Netflix, Inc.(2) |
30,833 | $ | 18,575,032 | |||||
| Walt Disney Co. (The)(2) |
63,847 | 9,889,262 | ||||||
| $ | 28,464,294 | |||||||
| Food & Staples Retailing — 1.0% | ||||||||
| Sysco Corp. |
150,615 | $ | 11,830,808 | |||||
| $ | 11,830,808 | |||||||
| Food Products — 0.8% | ||||||||
| Mondelez International, Inc., Class A |
153,625 | $ | 10,186,874 | |||||
| $ | 10,186,874 | |||||||
| Health Care Equipment & Supplies — 4.2% | ||||||||
| Abbott Laboratories |
102,141 | $ | 14,375,324 | |||||
| Inari Medical, Inc.(2) |
76,620 | 6,993,108 | ||||||
| Intuitive Surgical, Inc.(2) |
58,020 | 20,846,586 | ||||||
| Tandem Diabetes Care, Inc.(2) |
53,892 | 8,111,824 | ||||||
| $ | 50,326,842 | |||||||
| Health Care Providers & Services — 1.9% | ||||||||
| UnitedHealth Group, Inc. |
46,952 | $ | 23,576,477 | |||||
| $ | 23,576,477 | |||||||
| Health Care Technology — 0.5% | ||||||||
| Veeva Systems, Inc., Class A(2) |
22,801 | $ | 5,825,200 | |||||
| $ | 5,825,200 | |||||||
| Hotels, Restaurants & Leisure — 1.3% | ||||||||
| Starbucks Corp. |
132,809 | $ | 15,534,669 | |||||
| $ | 15,534,669 | |||||||
| Household Products — 0.3% | ||||||||
| Church & Dwight Co., Inc. |
39,028 | $ | 4,000,370 | |||||
| $ | 4,000,370 | |||||||
| Interactive Media & Services — 11.6% | ||||||||
| Alphabet, Inc., Class C(2) |
32,153 | $ | 93,037,599 | |||||
| Meta Platforms, Inc., Class A(2) |
117,108 | 39,389,276 | ||||||
| 10 | See Notes to Financial Statements. |
Eaton Vance
Enhanced Equity Income Fund II
December 31, 2021
Portfolio of Investments — continued
| Security | Shares | Value | ||||||
| Interactive Media & Services (continued) | ||||||||
| Snap, Inc., Class A(2) |
103,032 | $ | 4,845,595 | |||||
| Twitter, Inc.(2) |
75,248 | 3,252,219 | ||||||
| $ | 140,524,689 | |||||||
| Internet & Direct Marketing Retail — 8.2% | ||||||||
| Amazon.com, Inc.(2) |
29,704 | $ | 99,043,235 | |||||
| $ | 99,043,235 | |||||||
| IT Services — 7.0% | ||||||||
| PayPal Holdings, Inc.(2) |
173,979 | $ | 32,808,960 | |||||
| Visa, Inc., Class A |
238,921 | 51,776,570 | ||||||
| $ | 84,585,530 | |||||||
| Life Sciences Tools & Services — 2.1% | ||||||||
| 10X Genomics, Inc., Class A(2) |
60,825 | $ | 9,060,492 | |||||
| Illumina, Inc.(2) |
16,561 | 6,300,467 | ||||||
| Thermo Fisher Scientific, Inc. |
15,588 | 10,400,937 | ||||||
| $ | 25,761,896 | |||||||
| Oil, Gas & Consumable Fuels — 0.5% | ||||||||
| EOG Resources, Inc. |
71,787 | $ | 6,376,839 | |||||
| $ | 6,376,839 | |||||||
| Pharmaceuticals — 1.0% | ||||||||
| Eli Lilly & Co. |
43,106 | $ | 11,906,739 | |||||
| $ | 11,906,739 | |||||||
| Road & Rail — 1.6% | ||||||||
| CSX Corp. |
313,764 | $ | 11,797,526 | |||||
| Uber Technologies, Inc.(2) |
176,578 | 7,403,916 | ||||||
| $ | 19,201,442 | |||||||
| Semiconductors & Semiconductor Equipment — 8.6% | ||||||||
| Ambarella, Inc.(2) |
40,965 | $ | 8,311,389 | |||||
| Intel Corp. |
247,469 | 12,744,653 | ||||||
| Micron Technology, Inc. |
293,859 | 27,372,966 | ||||||
| QUALCOMM, Inc. |
188,600 | 34,489,282 | ||||||
| Texas Instruments, Inc. |
115,404 | 21,750,192 | ||||||
| $ | 104,668,482 | |||||||
| Software — 19.2% | ||||||||
| Adobe, Inc.(2) |
80,327 | $ | 45,550,229 | |||||
| Altair Engineering, Inc., Class A(2) |
80,916 | 6,256,425 | ||||||
| Security | Shares | Value | ||||||
| Software (continued) | ||||||||
| Intuit, Inc. |
56,776 | $ | 36,519,459 | |||||
| Microsoft Corp. |
280,404 | 94,305,473 | ||||||
| Palantir Technologies, Inc., Class A(2) |
619,954 | 11,289,362 | ||||||
| Paycom Software, Inc.(2) |
14,009 | 5,816,397 | ||||||
| salesforce.com, inc.(2) |
70,758 | 17,981,730 | ||||||
| Zscaler, Inc.(2) |
47,927 | 15,400,383 | ||||||
| $ | 233,119,458 | |||||||
| Specialty Retail — 3.7% | ||||||||
| Home Depot, Inc. (The) |
46,129 | $ | 19,143,996 | |||||
| TJX Cos., Inc. (The) |
343,289 | 26,062,501 | ||||||
| $ | 45,206,497 | |||||||
| Technology Hardware, Storage & Peripherals — 6.7% | ||||||||
| Apple, Inc. |
398,426 | $ | 70,748,505 | |||||
| Logitech International S.A. |
123,818 | 10,212,508 | ||||||
| $ | 80,961,013 | |||||||
| Textiles, Apparel & Luxury Goods — 1.6% | ||||||||
| NIKE, Inc., Class B |
114,972 | $ | 19,162,383 | |||||
| $ | 19,162,383 | |||||||
| Total Common
Stocks |
|
$ | 1,215,032,624 | |||||
| Short-Term Investments — 0.3% |
| |||||||
| Description | Units | Value | ||||||
| Eaton Vance Cash Reserves Fund, LLC, 0.08%(3) |
3,051,128 | $ | 3,050,823 | |||||
| Total Short-Term
Investments |
|
$ | 3,050,823 | |||||
| Total Investments —
100.5% |
|
$ | 1,218,083,447 | |||||
| Total Written Covered Call
Options — (0.5)% |
|
$ | (5,943,143 | ) | ||||
| Other Assets, Less Liabilities — (0.0)%(4) |
|
$ | (115,944 | ) | ||||
| Net Assets — 100.0% |
|
$ | 1,212,024,360 | |||||
The percentage shown for each investment category in the Portfolio of Investments is based on net assets.
| 11 | See Notes to Financial Statements. |
Eaton Vance
Enhanced Equity Income Fund II
December 31, 2021
Portfolio of Investments — continued
| (1) | All or a portion of each applicable common stock for which a written call option is outstanding at December 31, 2021 has been pledged as collateral for such written option. |
| (2) | Non-income producing security. |
| (3) | Affiliated investment company, available to Eaton Vance portfolios and funds, which invests in high quality, U.S. dollar denominated money market instruments. The rate shown is the annualized seven-day yield as of December 31, 2021. |
| (4) | Amount is less than (0.05%). |
| Written Covered Call Options — (0.5)% | ||||||||||||||||
| Exchange-Traded Options — (0.5)% | ||||||||||||||||
| Description | Number of Contracts |
Notional Amount |
Exercise Price |
Expiration Date |
Value | |||||||||||
| 10X Genomics, Inc., Class A | 300 | $ 4,468,800 | $ | 155 | 1/21/22 | $ | (180,000 | ) | ||||||||
| Abbott Laboratories | 510 | 7,177,740 | 145 | 1/28/22 | (84,150 | ) | ||||||||||
| AbbVie, Inc. | 955 | 12,930,700 | 139 | 1/28/22 | (131,790 | ) | ||||||||||
| Adobe, Inc. | 400 | 22,682,400 | 590 | 1/21/22 | (230,000 | ) | ||||||||||
| Alphabet, Inc., Class C | 160 | 46,297,440 | 3,050 | 1/28/22 | (228,000 | ) | ||||||||||
| Amazon.com, Inc. | 145 | 48,347,930 | 3,550 | 1/14/22 | (123,250 | ) | ||||||||||
| Ambarella, Inc. | 200 | 4,057,800 | 225 | 2/4/22 | (115,000 | ) | ||||||||||
| AMETEK, Inc. | 500 | 7,352,000 | 150 | 1/21/22 | (70,000 | ) | ||||||||||
| Apple, Inc. | 1,990 | 35,336,430 | 185 | 1/14/22 | (209,945 | ) | ||||||||||
| Aptiv PLC | 465 | 7,670,175 | 170 | 1/21/22 | (101,138 | ) | ||||||||||
| Charles Schwab Corp. (The) | 1,215 | 10,218,150 | 84 | 1/14/22 | (212,018 | ) | ||||||||||
| Church & Dwight Co., Inc. | 195 | 1,998,750 | 100 | 1/21/22 | (69,225 | ) | ||||||||||
| Coca-Cola Co. (The) | 1,590 | 9,414,390 | 59 | 1/14/22 | (115,275 | ) | ||||||||||
| Constellation Brands, Inc., Class A | 80 | 2,007,760 | 250 | 1/21/22 | (52,400 | ) | ||||||||||
| CSX Corp. | 1,565 | 5,884,400 | 38 | 1/7/22 | (39,125 | ) | ||||||||||
| Ecolab, Inc. | 45 | 1,055,655 | 240 | 1/21/22 | (4,725 | ) | ||||||||||
| EOG Resources, Inc. | 355 | 3,153,465 | 93 | 1/28/22 | (61,770 | ) | ||||||||||
| Goldman Sachs Group, Inc. (The) | 260 | 9,946,300 | 400 | 1/21/22 | (79,950 | ) | ||||||||||
| Hexcel Corp. | 735 | 3,807,300 | 55 | 1/21/22 | (181,913 | ) | ||||||||||
| Home Depot, Inc. (The) | 230 | 9,545,230 | 430 | 1/14/22 | (30,935 | ) | ||||||||||
| Illumina, Inc. | 80 | 3,043,520 | 415 | 2/4/22 | (51,848 | ) | ||||||||||
| Inari Medical, Inc. | 380 | 3,468,260 | 90 | 1/21/22 | (209,000 | ) | ||||||||||
| Intel Corp. | 1,235 | 6,360,250 | 55 | 2/4/22 | (95,095 | ) | ||||||||||
| Intuit, Inc. | 280 | 18,010,160 | 660 | 1/21/22 | (239,400 | ) | ||||||||||
| Intuitive Surgical, Inc. | 290 | 10,419,700 | 390 | 1/28/22 | (152,975 | ) | ||||||||||
| JPMorgan Chase & Co. | 300 | 4,750,500 | 165 | 1/28/22 | (33,000 | ) | ||||||||||
| Logitech International S.A. | 615 | 5,072,520 | 90 | 1/21/22 | (35,362 | ) | ||||||||||
| Meta Platforms, Inc., Class A | 585 | 19,676,475 | 350 | 1/14/22 | (150,053 | ) | ||||||||||
| Micron Technology, Inc. | 1,465 | 13,646,475 | 100 | 1/28/22 | (202,170 | ) | ||||||||||
| Microsoft Corp. | 1,400 | 47,084,800 | 340 | 1/14/22 | (504,000 | ) | ||||||||||
| Mondelez International, Inc., Class A | 765 | 5,072,715 | 68 | 1/21/22 | (26,775 | ) | ||||||||||
| Netflix, Inc. | 150 | 9,036,600 | 650 | 1/7/22 | (7,500 | ) | ||||||||||
| NIKE, Inc., Class B | 570 | 9,500,190 | 175 | 1/28/22 | (59,565 | ) | ||||||||||
| Palantir Technologies, Inc., Class A | 3,095 | 5,635,995 | 21 | 1/28/22 | (71,185 | ) | ||||||||||
| Paycom Software, Inc. | 70 | 2,906,330 | 460 | 1/21/22 | (12,950 | ) | ||||||||||
| PayPal Holdings, Inc. | 865 | 16,312,170 | 200 | 1/28/22 | (276,800 | ) | ||||||||||
| QUALCOMM, Inc. | 940 | 17,189,780 | 190 | 1/21/22 | (208,210 | ) | ||||||||||
| 12 | See Notes to Financial Statements. |
Eaton Vance
Enhanced Equity Income Fund II
December 31, 2021
Portfolio of Investments — continued
| Written Covered Call Options — (0.5)% (continued) | ||||||||||||||||
| Exchange-Traded Options — (0.5)% (continued) | ||||||||||||||||
| Description | Number of Contracts |
Notional Amount |
Exercise Price |
Expiration Date |
Value | |||||||||||
| Raytheon Technologies Corp. | 330 | $ 2,839,980 | $ | 89 | 2/4/22 | $ | (34,980 | ) | ||||||||
| salesforce.com, inc. | 350 | 8,894,550 | 265 | 1/28/22 | (105,700 | ) | ||||||||||
| Snap, Inc., Class A | 515 | 2,422,045 | 49 | 1/21/22 | (66,692 | ) | ||||||||||
| Starbucks Corp. | 660 | 7,720,020 | 121 | 1/14/22 | (30,360 | ) | ||||||||||
| Sysco Corp. | 750 | 5,891,250 | 80 | 1/28/22 | (67,500 | ) | ||||||||||
| Tandem Diabetes Care, Inc. | 265 | 3,988,780 | 150 | 1/7/22 | (82,812 | ) | ||||||||||
| Texas Instruments, Inc. | 575 | 10,837,025 | 205 | 1/7/22 | (4,025 | ) | ||||||||||
| Thermo Fisher Scientific, Inc. | 75 | 5,004,300 | 690 | 1/21/22 | (47,250 | ) | ||||||||||
| TJX Cos., Inc. (The) | 1,715 | 13,020,280 | 78 | 1/7/22 | (35,157 | ) | ||||||||||
| Trane Technologies PLC | 280 | 5,656,840 | 210 | 1/21/22 | (47,600 | ) | ||||||||||
| Twitter, Inc. | 375 | 1,620,750 | 47 | 1/21/22 | (17,250 | ) | ||||||||||
| Uber Technologies, Inc. | 880 | 3,689,840 | 47 | 1/28/22 | (50,160 | ) | ||||||||||
| UnitedHealth Group, Inc. | 230 | 11,549,220 | 525 | 2/4/22 | (119,025 | ) | ||||||||||
| Veeva Systems, Inc., Class A | 110 | 2,810,280 | 280 | 1/21/22 | (14,025 | ) | ||||||||||
| Visa, Inc., Class A | 1,190 | 25,788,490 | 220 | 1/14/22 | (251,090 | ) | ||||||||||
| Walt Disney Co. (The) | 315 | 4,879,035 | 160 | 1/7/22 | (13,545 | ) | ||||||||||
| Waste Connections, Inc. | 295 | 4,019,965 | 135 | 1/21/22 | (91,450 | ) | ||||||||||
| Zebra Technologies Corp., Class A | 180 | 10,713,600 | 630 | 1/21/22 | (72,900 | ) | ||||||||||
| Zscaler, Inc. | 235 | 7,551,255 | 325 | 1/7/22 | (135,125 | ) | ||||||||||
| Total |
$ | (5,943,143 | ) | |||||||||||||
Abbreviations:
| ADR | – | American Depositary Receipt | ||
| 13 | See Notes to Financial Statements. |
Eaton Vance
Enhanced Equity Income Fund II
December 31, 2021
Statement of Assets and Liabilities
| Assets | December 31, 2021 | |||
| Unaffiliated investments, at value (identified cost, $488,229,026) |
$ | 1,215,032,624 | ||
| Affiliated investment, at value (identified cost, $3,050,823) |
3,050,823 | |||
| Cash |
33,413 | |||
| Dividends receivable |
92,177 | |||
| Dividends receivable from affiliated investment |
335 | |||
| Receivable for premiums on written options |
296,229 | |||
| Receivable for Fund shares sold |
364,243 | |||
| Receivable from the transfer agent |
341,781 | |||
| Tax reclaims receivable |
57,263 | |||
| Total assets |
$ | 1,219,268,888 | ||
| Liabilities |
| |||
| Written options outstanding, at value (premiums received, $8,649,699) |
$ | 5,943,143 | ||
| Payable for closed written options |
14,588 | |||
| Payable to affiliates: |
||||
| Investment adviser fee |
1,018,101 | |||
| Trustees’ fees |
13,943 | |||
| Accrued expenses |
254,753 | |||
| Total liabilities |
$ | 7,244,528 | ||
| Net Assets |
$ | 1,212,024,360 | ||
| Sources of Net Assets |
| |||
| Common shares, $0.01 par value, unlimited number of shares authorized, 51,102,915 shares issued and outstanding |
$ | 511,029 | ||
| Additional paid-in capital |
482,524,034 | |||
| Distributable earnings |
728,989,297 | |||
| Net Assets |
$ | 1,212,024,360 | ||
| Net Asset Value | ||||
| ($1,212,024,360 ÷ 51,102,915 common shares issued and outstanding) |
$ | 23.72 | ||
| 14 | See Notes to Financial Statements. |
Eaton Vance
Enhanced Equity Income Fund II
December 31, 2021
Statement of Operations
| Investment Income | Year Ended December 31, 2021 |
|||
| Dividends (net of foreign taxes, $25,061) |
$ | 8,237,858 | ||
| Dividends from affiliated investment |
3,173 | |||
| Total investment income |
$ | 8,241,031 | ||
| Expenses | ||||
| Investment adviser fee |
$ | 11,427,327 | ||
| Trustees’ fees and expenses |
56,275 | |||
| Custodian fee |
332,365 | |||
| Transfer and dividend disbursing agent fees |
18,784 | |||
| Legal and accounting services |
100,688 | |||
| Printing and postage |
344,951 | |||
| Miscellaneous |
79,813 | |||
| Total expenses |
$ | 12,360,203 | ||
| Net investment loss |
$ | (4,119,172 | ) | |
| Realized and Unrealized Gain (Loss) | ||||
| Net realized gain (loss) — |
||||
| Investment transactions |
$ | 80,407,801 | ||
| Investment transactions — affiliated investment |
(62 | ) | ||
| Written options |
(10,545,709 | ) | ||
| Foreign currency transactions |
(38,652 | ) | ||
| Net realized gain |
$ | 69,823,378 | ||
| Change in unrealized appreciation (depreciation) — |
||||
| Investments |
$ | 127,744,484 | ||
| Written options |
984,154 | |||
| Net change in unrealized appreciation (depreciation) |
$ | 128,728,638 | ||
| Net realized and unrealized gain |
$ | 198,552,016 | ||
| Net increase in net assets from operations |
$ | 194,432,844 | ||
| 15 | See Notes to Financial Statements. |
Eaton Vance
Enhanced Equity Income Fund II
December 31, 2021
Statements of Changes in Net Assets
| Year Ended December 31, | ||||||||
| Increase (Decrease) in Net Assets | 2021 | 2020 | ||||||
| From operations — |
||||||||
| Net investment loss |
$ | (4,119,172 | ) | $ | (3,117,711 | ) | ||
| Net realized gain (loss) |
69,823,378 | (585,044 | ) | |||||
| Net change in unrealized appreciation (depreciation) |
128,728,638 | 240,065,961 | ||||||
| Net increase in net assets from operations |
$ | 194,432,844 | $ | 236,363,206 | ||||
| Distributions to shareholders |
$ | (64,519,572 | ) | $ | (1,811,802 | ) | ||
| Tax return of capital to shareholders |
$ | (4,726,785 | ) | $ | (52,079,822 | ) | ||
| Capital share transactions — |
||||||||
| Proceeds from shelf offering, net of offering costs (see Note 5) |
$ | 28,448,067 | $ | 12,051,025 | ||||
| Reinvestment of distributions |
2,823,214 | 1,728,984 | ||||||
| Net increase in net assets from capital share transactions |
$ | 31,271,281 | $ | 13,780,009 | ||||
| Net increase in net assets |
$ | 156,457,768 | $ | 196,251,591 | ||||
| Net Assets |
| |||||||
| At beginning of year |
$ | 1,055,566,592 | $ | 859,315,001 | ||||
| At end of year |
$ | 1,212,024,360 | $ | 1,055,566,592 | ||||
| 16 | See Notes to Financial Statements. |
Eaton Vance
Enhanced Equity Income Fund II
December 31, 2021
Financial Highlights
| Year Ended December 31, | ||||||||||||||||||||
| 2021 | 2020 | 2019 | 2018 | 2017 | ||||||||||||||||
| Net asset value — Beginning of year |
$ | 21.200 | $ | 17.530 | $ | 14.820 | $ | 15.770 | $ | 13.660 | ||||||||||
| Income (Loss) From Operations | ||||||||||||||||||||
| Net investment loss(1) |
$ | (0.082 | ) | $ | (0.063 | ) | $ | (0.026 | ) | $ | (0.027 | ) | $ | (0.023 | ) | |||||
| Net realized and unrealized gain |
3.971 | 4.819 | 4.015 | 0.127 | 3.183 | |||||||||||||||
| Total income from operations |
$ | 3.889 | $ | 4.756 | $ | 3.989 | $ | 0.100 | $ | 3.160 | ||||||||||
| Less Distributions |
| |||||||||||||||||||
| From net realized gain |
$ | (1.284 | ) | $ | (0.037 | ) | $ | (1.284 | )(2) | $ | (1.050 | ) | $ | (0.423 | ) | |||||
| Tax return of capital |
(0.094 | ) | (1.050 | ) | — | — | (0.627 | ) | ||||||||||||
| Total distributions |
$ | (1.378 | ) | $ | (1.087 | ) | $ | (1.284 | ) | $ | (1.050 | ) | $ | (1.050 | ) | |||||
| Premium from common shares sold through shelf offering (see Note 5)(1) |
$ | 0.009 | $ | 0.001 | $ | 0.005 | $ | — | $ | — | ||||||||||
| Net asset value — End of year |
$ | 23.720 | $ | 21.200 | $ | 17.530 | $ | 14.820 | $ | 15.770 | ||||||||||
| Market value — End of year |
$ | 24.590 | $ | 21.690 | $ | 17.830 | $ | 14.670 | $ | 15.220 | ||||||||||
| Total Investment Return on Net Asset Value(3) |
18.82 | % | 28.55 | % | 27.71 | % | 0.21 | % | 24.04 | %(4) | ||||||||||
| Total Investment Return on Market Value(3) |
20.40 | % | 29.31 | % | 31.22 | % | 2.78 | % | 27.76 | % | ||||||||||
| Ratios/Supplemental Data |
| |||||||||||||||||||
| Net assets, end of year (000’s omitted) |
$ | 1,212,024 | $ | 1,055,567 | $ | 859,315 | $ | 707,577 | $ | 751,565 | ||||||||||
| Ratios (as a percentage of average daily net assets): |
||||||||||||||||||||
| Expenses |
1.08 | % | 1.09 | % | 1.09 | % | 1.10 | % | 1.10 | % | ||||||||||
| Net investment loss |
(0.36 | )% | (0.35 | )% | (0.16 | )% | (0.17 | )% | (0.15 | )% | ||||||||||
| Portfolio Turnover |
18 | % | 38 | % | 40 | % | 44 | % | 48 | % | ||||||||||
| (1) | Computed using average shares outstanding. |
| (2) | The tax character of a portion of the distribution ($0.069 per share) was based on management’s estimate and was subsequently determined to be $0.063 per share of tax return of capital and $0.006 per share from net realized gain. |
| (3) | Returns are historical and are calculated by determining the percentage change in net asset value or market value with all distributions reinvested. Distributions are assumed to be reinvested at prices obtained under the Fund’s dividend reinvestment plan. |
| (4) | During the year ended December 31, 2017, the Fund received a payment from an affiliate as reimbursement for certain losses. Excluding this payment, total return at net asset value would have been 23.72%. |
| 17 | See Notes to Financial Statements. |
Eaton Vance
Enhanced Equity Income Fund II
December 31, 2021
Notes to Financial Statements
1 Significant Accounting Policies
Eaton Vance Enhanced Equity Income Fund II (the Fund) is a Massachusetts business trust registered under the Investment Company Act of 1940, as amended (the 1940 Act), as a diversified, closed-end management investment company. The Fund’s primary investment objective is to provide current income, with a secondary objective of capital appreciation.
The following is a summary of significant accounting policies of the Fund. The policies are in conformity with accounting principles generally accepted in the United States of America (U.S. GAAP). The Fund is an investment company and follows accounting and reporting guidance in the Financial Accounting Standards Board (FASB) Accounting Standards Codification Topic 946.
A Investment Valuation — The following methodologies are used to determine the market value or fair value of investments.
Equity Securities. Equity securities listed on a U.S. securities exchange generally are valued at the last sale or closing price on the day of valuation or, if no sales took place on such date, at the mean between the closing bid and ask prices on the exchange where such securities are principally traded. Equity securities listed on the NASDAQ National Market System are valued at the NASDAQ official closing price. Unlisted or listed securities for which closing sales prices or closing quotations are not available are valued at the mean between the latest available bid and ask prices.
Derivatives. U.S. exchange-traded options are valued at the mean between the bid and ask prices at valuation time as reported by the Options Price Reporting Authority. Non-U.S. exchange-traded options and over-the-counter options are valued by a third party pricing service using techniques that consider factors including the value of the underlying instrument, the volatility of the underlying instrument and the period of time until option expiration.
Foreign Securities and Currencies. Foreign securities and currencies are valued in U.S. dollars, based on foreign currency exchange rate quotations supplied by a third party pricing service. The pricing service uses a proprietary model to determine the exchange rate. Inputs to the model include reported trades and implied bid/ask spreads. The daily valuation of exchange-traded foreign securities generally is determined as of the close of trading on the principal exchange on which such securities trade. Events occurring after the close of trading on foreign exchanges may result in adjustments to the valuation of foreign securities to more accurately reflect their fair value as of the close of regular trading on the New York Stock Exchange. When valuing foreign equity securities that meet certain criteria, the Fund’s Trustees have approved the use of a fair value service that values such securities to reflect market trading that occurs after the close of the applicable foreign markets of comparable securities or other instruments that have a strong correlation to the fair-valued securities.
Affiliated Fund. The Fund may invest in Eaton Vance Cash Reserves Fund, LLC (Cash Reserves Fund), an affiliated investment company managed by Eaton Vance Management (EVM). While Cash Reserves Fund is not a registered money market mutual fund, it conducts all of its investment activities in accordance with the requirements of Rule 2a-7 under the 1940 Act. Investments in Cash Reserves Fund are valued at the closing net asset value per unit on the valuation day. Cash Reserves Fund generally values its investment securities based on available market quotations provided by a third party pricing service.
Fair Valuation. Investments for which valuations or market quotations are not readily available or are deemed unreliable are valued at fair value using methods determined in good faith by or at the direction of the Trustees of the Fund in a manner that most fairly reflects the security’s “fair value”, which is the amount that the Fund might reasonably expect to receive for the security upon its current sale in the ordinary course. Each such determination is based on a consideration of relevant factors, which are likely to vary from one pricing context to another. These factors may include, but are not limited to, the type of security, the existence of any contractual restrictions on the security’s disposition, the price and extent of public trading in similar securities of the issuer or of comparable companies or entities, quotations or relevant information obtained from broker/dealers or other market participants, information obtained from the issuer, analysts, and/or the appropriate stock exchange (for exchange-traded securities), an analysis of the company’s or entity’s financial statements, and an evaluation of the forces that influence the issuer and the market(s) in which the security is purchased and sold.
B Investment Transactions — Investment transactions for financial statement purposes are accounted for on a trade date basis. Realized gains and losses on investments sold are determined on the basis of identified cost.
C Income — Dividend income is recorded on the ex-dividend date for dividends received in cash and/or securities. However, if the ex-dividend date has passed, certain dividends from foreign securities are recorded as the Fund is informed of the ex-dividend date. Withholding taxes on foreign dividends and capital gains have been provided for in accordance with the Fund’s understanding of the applicable countries’ tax rules and rates.
D Federal Taxes — The Fund’s policy is to comply with the provisions of the Internal Revenue Code applicable to regulated investment companies and to distribute to shareholders each year substantially all of its net investment income, and all or substantially all of its net realized capital gains. Accordingly, no provision for federal income or excise tax is necessary.
As of December 31, 2021, the Fund had no uncertain tax positions that would require financial statement recognition, de-recognition, or disclosure. The Fund files a U.S. federal income tax return annually after its fiscal year-end, which is subject to examination by the Internal Revenue Service for a period of three years from the date of filing.
E Foreign Currency Translation — Investment valuations, other assets, and liabilities initially expressed in foreign currencies are translated each business day into U.S. dollars based upon current exchange rates. Purchases and sales of foreign investment securities and income and expenses denominated in foreign currencies are translated into U.S. dollars based upon currency exchange rates in effect on the respective dates of such transactions. Recognized gains or losses on investment transactions attributable to changes in foreign currency exchange rates are recorded for financial statement purposes as net
| 18 |
Eaton Vance
Enhanced Equity Income Fund II
December 31, 2021
Notes to Financial Statements — continued
realized gains and losses on investments. That portion of unrealized gains and losses on investments that results from fluctuations in foreign currency exchange rates is not separately disclosed.
F Use of Estimates — The preparation of the financial statements in conformity with U.S. GAAP requires management to make estimates and assumptions that affect the reported amounts of assets and liabilities at the date of the financial statements and the reported amounts of income and expense during the reporting period. Actual results could differ from those estimates.
G Indemnifications — Under the Fund’s organizational documents, its officers and Trustees may be indemnified against certain liabilities and expenses arising out of the performance of their duties to the Fund. Under Massachusetts law, if certain conditions prevail, shareholders of a Massachusetts business trust (such as the Fund) could be deemed to have personal liability for the obligations of the Fund. However, the Fund’s Declaration of Trust contains an express disclaimer of liability on the part of Fund shareholders and the By-laws provide that the Fund shall assume, upon request by the shareholder, the defense on behalf of any Fund shareholders. Moreover, the By-laws also provide for indemnification out of Fund property of any shareholder held personally liable solely by reason of being or having been a shareholder for all loss or expense arising from such liability. Additionally, in the normal course of business, the Fund enters into agreements with service providers that may contain indemnification clauses. The Fund’s maximum exposure under these arrangements is unknown as this would involve future claims that may be made against the Fund that have not yet occurred.
H Written Options — Upon the writing of a call or a put option, the premium received by the Fund is included in the Statement of Assets and Liabilities as a liability. The amount of the liability is subsequently marked-to-market to reflect the current market value of the option written, in accordance with the Fund’s policies on investment valuations discussed above. Premiums received from writing options which expire are treated as realized gains. Premiums received from writing options which are exercised or are closed are added to or offset against the proceeds or amount paid on the transaction to determine the realized gain or loss. When an index option is exercised, the Fund is required to deliver an amount of cash determined by the excess of the exercise price of the option over the value of the index (in the case of a put) or the excess of the value of the index over the exercise price of the option (in the case of a call) at contract termination. If a put option on a security is exercised, the premium reduces the cost basis of the securities purchased by the Fund. The Fund, as a writer of an option, may have no control over whether the underlying securities or other assets may be sold (call) or purchased (put) and, as a result, bears the market risk of an unfavorable change in the price of the securities or other assets underlying the written option. The Fund may also bear the risk of not being able to enter into a closing transaction if a liquid secondary market does not exist.
2 Distributions to Shareholders and Income Tax Information
Subject to its Managed Distribution Plan, the Fund makes monthly distributions from its cash available for distribution, which consists of the Fund’s dividends and interest income after payment of Fund expenses, net option premiums and net realized and unrealized gains on stock investments. The Fund intends to distribute all or substantially all of its net realized capital gains. Distributions are recorded on the ex-dividend date. Distributions to shareholders are determined in accordance with income tax regulations, which may differ from U.S. GAAP. As required by U.S. GAAP, only distributions in excess of tax basis earnings and profits are reported in the financial statements as a return of capital. Permanent differences between book and tax accounting relating to distributions are reclassified to paid-in capital. For tax purposes, distributions from short-term capital gains are considered to be from ordinary income. Distributions in any year may include a substantial return of capital component.
The tax character of distributions declared for the years ended December 31, 2021 and December 31, 2020 was as follows:
| Year Ended December 31, | ||||||||
| 2021 | 2020 | |||||||
| Long-term capital gains |
$ | 64,519,572 | $ | 1,811,802 | ||||
| Tax return of capital |
$ | 4,726,785 | $ | 52,079,822 | ||||
During the year ended December 31, 2021, distributable earnings was increased by $4,157,913 and paid-in capital was decreased by $4,157,913 due to differences between book and tax accounting for net operating losses. These reclassifications had no effect on the net assets or net asset value per share of the Fund.
As of December 31, 2021, the components of distributable earnings (accumulated loss) on a tax basis were as follows:
| Net unrealized appreciation |
$ | 728,989,297 | ||
| Distributable earnings |
$ | 728,989,297 | ||
| 19 |
Eaton Vance
Enhanced Equity Income Fund II
December 31, 2021
Notes to Financial Statements — continued
The cost and unrealized appreciation (depreciation) of investments, including open derivative contracts, of the Fund at December 31, 2021, as determined on a federal income tax basis, were as follows:
| Aggregate cost |
$ | 483,151,007 | ||
| Gross unrealized appreciation |
$ | 737,010,369 | ||
| Gross unrealized depreciation |
(8,021,072 | ) | ||
| Net unrealized appreciation |
$ | 728,989,297 | ||
3 Investment Adviser Fee and Other Transactions with Affiliates
The investment adviser fee is earned by EVM as compensation for investment advisory services rendered to the Fund. On March 1, 2021, Morgan Stanley acquired Eaton Vance Corp. (the “Transaction”) and EVM became an indirect, wholly-owned subsidiary of Morgan Stanley. In connection with the Transaction, the Fund entered into a new investment advisory agreement (the “New Agreement”) with EVM, which took effect on March 1, 2021. Pursuant to the New Agreement (and the Fund’s investment advisory agreement with EVM in effect prior to March 1, 2021), the fee is computed at an annual rate of 1.00% of the Fund’s average daily gross assets, as defined in the New Agreement (and the Fund’s investment advisory agreement with EVM in effect prior to March 1, 2021), and is payable monthly. For purposes of this calculation, gross assets represent net assets plus obligations attributable to investment leverage. During the year ended December 31, 2021, the Fund had no obligations attributable to investment leverage. For the year ended December 31, 2021, the investment adviser fee amounted to $11,427,327. The Fund may invest its cash in Cash Reserves Fund. EVM does not currently receive a fee for advisory services provided to Cash Reserves Fund. EVM also serves as administrator of the Fund, but receives no compensation.
Trustees and officers of the Fund who are members of EVM’s organization receive remuneration for their services to the Fund out of the investment adviser fee. Trustees of the Fund who are not affiliated with EVM may elect to defer receipt of all or a percentage of their annual fees in accordance with the terms of the Trustees Deferred Compensation Plan. For the year ended December 31, 2021, no significant amounts have been deferred. Certain officers and Trustees of the Fund are officers of EVM.
4 Purchases and Sales of Investments
Purchases and sales of investments, other than short-term obligations, aggregated $205,017,393 and $264,085,026, respectively, for the year ended December 31, 2021.
5 Common Shares of Beneficial Interest and Shelf Offering
Common shares issued by the Fund pursuant to its dividend reinvestment plan for the years ended December 31, 2021 and December 31, 2020 were 122,942 and 93,428, respectively.
In August 2012, the Board of Trustees initially approved a share repurchase program for the Fund. Pursuant to the reauthorization of the share repurchase program by the Board of Trustees in March 2019, the Fund is authorized to repurchase up to 10% of its common shares outstanding as of the last day of the prior calendar year at market prices when shares are trading at a discount to net asset value. The share repurchase program does not obligate the Fund to purchase a specific amount of shares. There were no repurchases of common shares by the Fund for the years ended December 31, 2021 and December 31, 2020.
Pursuant to a registration statement filed with and declared effective on April 11, 2019 by the SEC, the Fund is authorized to issue up to an additional 3,584,261 common shares through an equity shelf offering program (the “shelf offering”). Under the shelf offering, the Fund, subject to market conditions, may raise additional capital from time to time and in varying amounts and offering methods at a net price at or above the Fund’s net asset value per common share.
During the years ended December 31, 2021 and December 31, 2020, the Fund sold 1,194,582 and 668,511 common shares, respectively, and received proceeds (net of offering costs) of $28,448,067 and $12,051,025, respectively, through its shelf offering. The net proceeds in excess of the net asset value of the shares sold were $472,542 and $35,802 for the years ended December 31, 2021 and December 31, 2020, respectively. Offering costs (other than the applicable sales commissions) incurred in connection with the shelf offering were borne directly by EVM. Eaton Vance Distributors, Inc. (EVD), an affiliate of EVM, is the distributor of the Fund’s shares and is entitled to receive a sales commission from the Fund of 1.00% of the gross sales price per share, a portion of which is re-allowed to sales agents. The Fund was informed that the sales commissions retained by EVD during the years ended December 31, 2021 and December 31, 2020 were $57,471 and $24,346, respectively.
| 20 |
Eaton Vance
Enhanced Equity Income Fund II
December 31, 2021
Notes to Financial Statements — continued
6 Financial Instruments
The Fund may trade in financial instruments with off-balance sheet risk in the normal course of its investing activities. These financial instruments may include written options and may involve, to a varying degree, elements of risk in excess of the amounts recognized for financial statement purposes. The notional or contractual amounts of these instruments represent the investment the Fund has in particular classes of financial instruments and do not necessarily represent the amounts potentially subject to risk. The measurement of the risks associated with these instruments is meaningful only when all related and offsetting transactions are considered. A summary of obligations under these financial instruments at December 31, 2021 is included in the Portfolio of Investments. At December 31, 2021, the Fund had sufficient cash and/or securities to cover commitments under these contracts.
The Fund is subject to equity price risk in the normal course of pursuing its investment objectives. The Fund writes covered call options on individual stocks above the current value of the stock to generate premium income. In writing call options on individual stocks, the Fund in effect sells potential appreciation in the value of the applicable stock above the exercise price in exchange for the option premium received. The Fund retains the risk of loss, minus the premium received, should the price of the underlying stock decline.
The fair value of open derivative instruments (not considered to be hedging instruments for accounting disclosure purposes) and whose primary underlying risk exposure is equity price risk at December 31, 2021 was as follows:
| Fair Value | ||||||||
| Derivative | Asset Derivative | Liability Derivative(1) | ||||||
| Written options |
$ | — | $ | (5,943,143 | ) | |||
| (1) | Statement of Assets and Liabilities location: Written options outstanding, at value. |
The effect of derivative instruments (not considered to be hedging instruments for accounting disclosure purposes) on the Statement of Operations and whose primary underlying risk exposure is equity price risk for the year ended December 31, 2021 was as follows:
| Derivative | Realized Gain (Loss) on Derivatives Recognized in Income(1) |
Change in Unrealized Appreciation (Depreciation) on Derivatives Recognized in Income(2) |
||||||
| Written options |
$ | (10,545,709 | ) | $ | 984,154 | |||
| (1) | Statement of Operations location: Net realized gain (loss) – Written options. |
| (2) | Statement of Operations location: Change in unrealized appreciation (depreciation) – Written options. |
The average number of written options contracts outstanding during the year ended December 31, 2021, which is indicative of the volume of this derivative type, was 32,779 contracts.
7 Investments in Affiliated Funds
At December 31, 2021, the value of the Fund’s investment in affiliated funds was $3,050,823, which represents 0.3% of the Fund’s net assets. Transactions in affiliated funds by the Fund for the year ended December 31, 2021 were as follows:
| Name | Value, beginning of period |
Purchases | Sales proceeds |
Net realized gain (loss) |
Change in unrealized appreciation (depreciation) |
Value, end of period |
Dividend income |
Units, end of period |
||||||||||||||||||||||||
| Short-Term Investments |
| |||||||||||||||||||||||||||||||
| Eaton Vance Cash Reserves Fund, LLC |
$ | 152,824 | $ | 139,866,192 | $ | (136,968,131 | ) | $ | (62 | ) | $ | — | $ | 3,050,823 | $ | 3,173 | 3,051,128 | |||||||||||||||
| 21 |
Eaton Vance
Enhanced Equity Income Fund II
December 31, 2021
Notes to Financial Statements — continued
8 Fair Value Measurements
Under generally accepted accounting principles for fair value measurements, a three-tier hierarchy to prioritize the assumptions, referred to as inputs, is used in valuation techniques to measure fair value. The three-tier hierarchy of inputs is summarized in the three broad levels listed below.
| • | Level 1 – quoted prices in active markets for identical investments |
| • | Level 2 – other significant observable inputs (including quoted prices for similar investments, interest rates, prepayment speeds, credit risk, etc.) |
| • | Level 3 – significant unobservable inputs (including a fund’s own assumptions in determining the fair value of investments) |
In cases where the inputs used to measure fair value fall in different levels of the fair value hierarchy, the level disclosed is determined based on the lowest level input that is significant to the fair value measurement in its entirety. The inputs or methodology used for valuing securities are not necessarily an indication of the risk associated with investing in those securities.
At December 31, 2021, the hierarchy of inputs used in valuing the Fund’s investments and open derivative instruments, which are carried at value, were as follows:
| Asset Description | Level 1 | Level 2 | Level 3 | Total | ||||||||||||
| Common Stocks |
$ | 1,215,032,624 | * | $ | — | $ | — | $ | 1,215,032,624 | |||||||
| Short-Term Investments |
— | 3,050,823 | — | 3,050,823 | ||||||||||||
| Total Investments |
$ | 1,215,032,624 | $ | 3,050,823 | $ | — | $ | 1,218,083,447 | ||||||||
| Liability Description |
||||||||||||||||
| Written Covered Call Options |
$ | (5,943,143 | ) | $ | — | $ | — | $ | (5,943,143 | ) | ||||||
| Total |
$ | (5,943,143 | ) | $ | — | $ | — | $ | (5,943,143 | ) | ||||||
| * | The level classification by major category of investments is the same as the category presentation in the Portfolio of Investments. |
9 Risks and Uncertainties
Pandemic Risk
An outbreak of respiratory disease caused by a novel coronavirus was first detected in China in late 2019 and subsequently spread internationally. This coronavirus has resulted in closing borders, enhanced health screenings, changes to healthcare service preparation and delivery, quarantines, cancellations, disruptions to supply chains and customer activity, as well as general concern and uncertainty. Health crises caused by outbreaks, such as the coronavirus outbreak, may exacerbate other pre-existing political, social and economic risks and disrupt normal market conditions and operations. The impact of this outbreak has negatively affected the worldwide economy, the economies of individual countries, individual companies, and the market in general, and may continue to do so in significant and unforeseen ways, as may other epidemics and pandemics that may arise in the future. Any such impact could adversely affect the Fund’s performance, or the performance of the securities in which the Fund invests.
| 22 |
Eaton Vance
Enhanced Equity Income Fund II
December 31, 2021
Report of Independent Registered Public Accounting Firm
To the Trustees and Shareholders of Eaton Vance Enhanced Equity Income Fund II:
Opinion on the Financial Statements and Financial Highlights
We have audited the accompanying statement of assets and liabilities of Eaton Vance Enhanced Equity Income Fund II (the “Fund”), including the portfolio of investments, as of December 31, 2021, the related statement of operations for the year then ended, the statements of changes in net assets for each of the two years in the period then ended, the financial highlights for each of the five years in the period then ended, and the related notes. In our opinion, the financial statements and financial highlights present fairly, in all material respects, the financial position of the Fund as of December 31, 2021, and the results of its operations for the year then ended, the changes in its net assets for each of the two years in the period then ended, and the financial highlights for each of the five years in the period then ended, in conformity with accounting principles generally accepted in the United States of America.
Basis for Opinion
These financial statements and financial highlights are the responsibility of the Fund’s management. Our responsibility is to express an opinion on the Fund’s financial statements and financial highlights based on our audits. We are a public accounting firm registered with the Public Company Accounting Oversight Board (United States) (PCAOB) and are required to be independent with respect to the Fund in accordance with the U.S. federal securities laws and the applicable rules and regulations of the Securities and Exchange Commission and the PCAOB.
We conducted our audits in accordance with the standards of the PCAOB. Those standards require that we plan and perform the audit to obtain reasonable assurance about whether the financial statements and financial highlights are free of material misstatement, whether due to error or fraud. The Fund is not required to have, nor were we engaged to perform, an audit of its internal control over financial reporting. As part of our audits, we are required to obtain an understanding of internal control over financial reporting but not for the purpose of expressing an opinion on the effectiveness of the Fund’s internal control over financial reporting. Accordingly, we express no such opinion.
Our audits included performing procedures to assess the risks of material misstatement of the financial statements and financial highlights, whether due to error or fraud, and performing procedures that respond to those risks. Such procedures included examining, on a test basis, evidence regarding the amounts and disclosures in the financial statements and financial highlights. Our audits also included evaluating the accounting principles used and significant estimates made by management, as well as evaluating the overall presentation of the financial statements and financial highlights. Our procedures included confirmation of securities owned as of December 31, 2021, by correspondence with the custodian and brokers; when replies were not received from brokers, we performed other auditing procedures. We believe that our audits provide a reasonable basis for our opinion.
/s/ Deloitte & Touche LLP
Boston, Massachusetts
February 17, 2022
We have served as the auditor of one or more Eaton Vance investment companies since 1959.
| 23 |
Eaton Vance
Enhanced Equity Income Fund II
December 31, 2021
Federal Tax Information (Unaudited)
The Form 1099-DIV you received in February 2022 showed the tax status of all distributions paid to your account in calendar year 2021. Shareholders are advised to consult their own tax adviser with respect to the tax consequences of their investment in the Fund. As required by the Internal Revenue Code and/or regulations, shareholders must be notified regarding the status of capital gains dividends.
Capital Gains Dividends. The Fund hereby designates as a capital gain dividend with respect to the taxable year ended December 31, 2021, $64,519,572 or, if subsequently determined to be different, the net capital gain of such year.
| 24 |
Eaton Vance
Enhanced Equity Income Fund II
December 31, 2021
The Fund offers a dividend reinvestment plan (Plan) pursuant to which shareholders may elect to have distributions automatically reinvested in common shares (Shares) of the Fund. You may elect to participate in the Plan by completing the Dividend Reinvestment Plan Application Form. If you do not participate, you will receive all distributions in cash paid by check mailed directly to you by American Stock Transfer & Trust Company, LLC (AST) as dividend paying agent. On the distribution payment date, if the NAV per Share is equal to or less than the market price per Share plus estimated brokerage commissions, then new Shares will be issued. The number of Shares shall be determined by the greater of the NAV per Share or 95% of the market price. Otherwise, Shares generally will be purchased on the open market by AST, the Plan agent (Agent). Distributions subject to income tax (if any) are taxable whether or not Shares are reinvested.
If your Shares are in the name of a brokerage firm, bank, or other nominee, you can ask the firm or nominee to participate in the Plan on your behalf. If the nominee does not offer the Plan, you will need to request that the Fund’s transfer agent re-register your Shares in your name or you will not be able to participate.
The Agent’s service fee for handling distributions will be paid by the Fund. Plan participants will be charged their pro rata share of brokerage commissions on all open-market purchases.
Plan participants may withdraw from the Plan at any time by writing to the Agent at the address noted on the following page. If you withdraw, you will receive Shares in your name for all Shares credited to your account under the Plan. If a participant elects by written notice to the Agent to sell part or all of his or her Shares and remit the proceeds, the Agent is authorized to deduct a $5.00 fee plus brokerage commissions from the proceeds.
If you wish to participate in the Plan and your Shares are held in your own name, you may complete the form on the following page and deliver it to the Agent. Any inquiries regarding the Plan can be directed to the Agent at 1-866-439-6787.
| 25 |
Eaton Vance
Enhanced Equity Income Fund II
December 31, 2021
Application for Participation in Dividend Reinvestment Plan
This form is for shareholders who hold their common shares in their own names. If your common shares are held in the name of a brokerage firm, bank, or other nominee, you should contact your nominee to see if it will participate in the Plan on your behalf. If you wish to participate in the Plan, but your brokerage firm, bank, or nominee is unable to participate on your behalf, you should request that your common shares be re-registered in your own name which will enable your participation in the Plan.
The following authorization and appointment is given with the understanding that I may terminate it at any time by terminating my participation in the Plan as provided in the terms and conditions of the Plan.
Please print exact name on account
Shareholder signature Date
Shareholder signature Date
Please sign exactly as your common shares are registered. All persons whose names appear on the share certificate must sign.
YOU SHOULD NOT RETURN THIS FORM IF YOU WISH TO RECEIVE YOUR DISTRIBUTIONS IN CASH. THIS IS NOT A PROXY.
This authorization form, when signed, should be mailed to the following address:
Eaton Vance Enhanced Equity Income Fund II
c/o American Stock Transfer & Trust Company, LLC
P.O. Box 922
Wall Street Station
New York, NY 10269-0560
| 26 |
Eaton Vance
Enhanced Equity Income Fund II
December 31, 2021
Fund Management. The Board of Trustees of the Fund (the “Board”) is responsible for the overall management and supervision of the affairs of the Fund. The Board members and officers of the Fund are listed below. Except as indicated, each individual has held the office shown or other offices in the same company for the last five years. Each Trustee holds office until the annual meeting for the year in which his or her term expires and until his or her successor is elected and qualified, subject to a prior death, resignation, retirement, disqualification or removal. Under the terms of the Fund’s current Trustee retirement policy, an Independent Trustee must retire and resign as a Trustee on the earlier of: (i) the first day of July following his or her 74th birthday; or (ii), with limited exception, December 31st of the 20th year in which he or she has served as a Trustee. However, if such retirement and resignation would cause the Fund to be out of compliance with Section 16 of the 1940 Act or any other regulations or guidance of the Securities and Exchange Commission, then such retirement and resignation will not become effective until such time as action has been taken for the Fund to be in compliance therewith. The “noninterested Trustees” consist of those Trustees who are not “interested persons” of the Fund, as that term is defined under the 1940 Act. The business address of each Board member and officer is Two International Place, Boston, Massachusetts 02110. As used below, “BMR” refers to Boston Management and Research, “EVC” refers to Eaton Vance Corp., “EV” refers to EV LLC, “EVM” refers to Eaton Vance Management and “EVD” refers to Eaton Vance Distributors, Inc. EV is the trustee of each of EVM and BMR. Effective March 1, 2021, each of EVM, BMR, EVD and EV are indirect, wholly owned subsidiaries of Morgan Stanley. Each officer affiliated with EVM may hold a position with other EVM affiliates that is comparable to his or her position with EVM listed below. Each Trustee oversees 138 funds (with the exception of Messrs. Faust and Wennerholm and Ms. Frost who oversee 137 funds) in the Eaton Vance fund complex (including both funds and portfolios in a hub and spoke structure).
| Name and Year of Birth | Fund Position(s) |
Length of Service | Principal Occupation(s) and Other Directorships During Past Five Years and Other Relevant Experience | |||
| Interested Trustee | ||||||
| Thomas E. Faust Jr. 1958 |
Class I Trustee |
Until 2023. 3 years. Since 2007. |
Chairman of Morgan Stanley Investment Management, Inc. (MSIM), member of the Board of Managers and President of EV, Chief Executive Officer of EVM and BMR, and Director of EVD. Formerly, Chairman, Chief Executive Officer and President of EVC. Mr. Faust is an interested person because of his positions with MSIM, BMR, EVM, EVD, and EV, which are affiliates of the Fund, and his former position with EVC, which was an affiliate of the Fund prior to March 1, 2021. Other Directorships. Formerly, Director of EVC (2007-2021) and Hexavest Inc. (investment management firm) (2012-2021). | |||
| Noninterested Trustees | ||||||
| Mark R. Fetting 1954 |
Class III Trustee |
Until 2022. 3 years. Since 2016. |
Private investor. Formerly held various positions at Legg Mason, Inc. (investment management firm) (2000-2012), including President, Chief Executive Officer, Director and Chairman (2008-2012), Senior Executive Vice President (2004-2008) and Executive Vice President (2001-2004). Formerly, President of Legg Mason family of funds (2001-2008). Formerly, Division President and Senior Officer of Prudential Financial Group, Inc. and related companies (investment management firm) (1991-2000). Other Directorships. None. | |||
| Cynthia E. Frost 1961 |
Class I Trustee |
Until 2023. 3 years. Since 2014. |
Private investor. Formerly, Chief Investment Officer of Brown University (university endowment) (2000-2012). Formerly, Portfolio Strategist for Duke Management Company (university endowment manager) (1995-2000). Formerly, Managing Director, Cambridge Associates (investment consulting company) (1989-1995). Formerly, Consultant, Bain and Company (management consulting firm) (1987-1989). Formerly, Senior Equity Analyst, BA Investment Management Company (1983-1985). Other Directorships. None. | |||
| George J. Gorman 1952 |
Chairperson of the Board and Class II Trustee |
Until 2024. 3 years. Chairperson of the Board since 2021 and Trustee since 2014. |
Principal at George J. Gorman LLC (consulting firm). Formerly, Senior Partner at Ernst & Young LLP (a registered public accounting firm) (1974-2009). Other Directorships. None. | |||
| 27 |
Eaton Vance
Enhanced Equity Income Fund II
December 31, 2021
Management and Organization — continued
| Name and Year of Birth | Fund Position(s) |
Length of Service | Principal Occupation(s) and Other Directorships During Past Five Years and Other Relevant Experience | |||
| Noninterested Trustees (continued) | ||||||
| Valerie A. Mosley 1960 |
Class III Trustee |
Until 2022. 3 years. Since 2014. |
Chairwoman and Chief Executive Officer of Valmo Ventures (a consulting and investment firm). Founder of Upward Wealth, Inc., dba BrightUP, a fintech platform. Formerly, Partner and Senior Vice President, Portfolio Manager and Investment Strategist at Wellington Management Company, LLP (investment management firm) (1992-2012). Formerly, Chief Investment Officer, PG Corbin Asset Management (1990-1992). Formerly worked in institutional corporate bond sales at Kidder Peabody (1986-1990). Other Directorships. Director of DraftKings, Inc. (digital sports entertainment and gaming company) (since September 2020). Director of Groupon, Inc. (e-commerce provider) (since April 2020). Director of Envestnet, Inc. (provider of intelligent systems for wealth management and financial wellness) (since 2018). Formerly, Director of Dynex Capital, Inc. (mortgage REIT) (2013-2020). | |||
| William H. Park 1947 |
Class II Trustee |
Until 2024. 3 years. Since 2003. |
Private investor. Formerly, Consultant (management and transactional) (2012-2014). Formerly, Chief Financial Officer, Aveon Group L.P. (investment management firm) (2010-2011). Formerly, Vice Chairman, Commercial Industrial Finance Corp. (specialty finance company) (2006-2010). Formerly, President and Chief Executive Officer, Prizm Capital Management, LLC (investment management firm) (2002-2005). Formerly, Executive Vice President and Chief Financial Officer, United Asset Management Corporation (investment management firm) (1982-2001). Formerly, Senior Manager, Price Waterhouse (now PricewaterhouseCoopers) (a registered public accounting firm) (1972-1981). Other Directorships. None. | |||
| Helen Frame Peters 1948 |
Class II Trustee |
Until 2024. 3 years. Since 2008. |
Professor of Finance, Carroll School of Management, Boston College. Formerly, Dean, Carroll School of Management, Boston College (2000-2002). Formerly, Chief Investment Officer, Fixed Income, Scudder Kemper Investments (investment management firm) (1998-1999). Formerly, Chief Investment Officer, Equity and Fixed Income, Colonial Management Associates (investment management firm) (1991-1998). Other Directorships. None. | |||
| Keith Quinton 1958 |
Class I Trustee |
Until 2023. 3 years. Since 2018. |
Private investor, researcher and lecturer. Formerly, Independent Investment Committee Member at New Hampshire Retirement System (2017-2021). Formerly, Portfolio Manager and Senior Quantitative Analyst at Fidelity Investments (investment management firm) (2001-2014). Other Directorships. Formerly, Director (2016-2021) and Chairman (2019-2021) of New Hampshire Municipal Bond Bank. | |||
| Marcus L. Smith 1966 |
Class III Trustee |
Until 2022. 3 years. Since 2018. |
Private investor. Formerly, Portfolio Manager at MFS Investment Management (investment management firm) (1994-2017). Other Directorships. Director of First Industrial Realty Trust, Inc. (an industrial REIT) (since 2021). Director of MSCI Inc. (global provider of investment decision support tools) (since 2017). Formerly, Director of DCT Industrial Trust Inc. (logistics real estate company) (2017-2018). | |||
| Susan J. Sutherland 1957 |
Class II Trustee |
Until 2024. 3 years. Since 2015. |
Private investor. Director of Ascot Group Limited and certain of its subsidiaries (insurance and reinsurance) (since 2017). Formerly, Director of Hagerty Holding Corp. (insurance) (2015-2018) and Montpelier Re Holdings Ltd. (insurance and reinsurance) (2013-2015). Formerly, Associate, Counsel and Partner at Skadden, Arps, Slate, Meagher & Flom LLP (law firm) (1982-2013). Other Directorships. Director of Kairos Acquisition Corp. (insurance/InsurTech acquisition company) (since 2021). | |||
| Scott E. Wennerholm 1959 |
Class I Trustee |
Until 2023. 3 years. Since 2016. |
Private investor. Formerly, Trustee at Wheelock College (postsecondary institution) (2012-2018). Formerly, Consultant at GF Parish Group (executive recruiting firm) (2016-2017). Formerly, Chief Operating Officer and Executive Vice President at BNY Mellon Asset Management (investment management firm) (2005-2011). Formerly, Chief Operating Officer and Chief Financial Officer at Natixis Global Asset Management (investment management firm) (1997-2004). Formerly, Vice President at Fidelity Investments Institutional Services (investment management firm) (1994-1997). Other Directorships. None. | |||
| 28 |
Eaton Vance
Enhanced Equity Income Fund II
December 31, 2021
Management and Organization — continued
| Name and Year of Birth | Fund Position(s) |
Length of Service | Principal Occupation(s) During Past Five Years | |||
| Principal Officers who are not Trustees | ||||||
| Edward J. Perkin 1972 |
President | Since 2014 | Vice President and Chief Equity Investment Officer of EVM and BMR. Also Vice President of Calvert Research and Management (“CRM”). | |||
| Deidre E. Walsh 1971 |
Vice President and Chief Legal Officer | Since 2009 | Vice President of EVM and BMR. Also Vice President of CRM. | |||
| James F. Kirchner 1967 |
Treasurer | Since 2007 | Vice President of EVM and BMR. Also Vice President of CRM. | |||
| Jill R. Damon 1984 |
Secretary | Since 2022 | Vice President of EVM and BMR since 2017. Formerly, associate at Dechert LLP (2009-2017). | |||
| Richard F. Froio 1968 |
Chief Compliance Officer | Since 2017 | Vice President of EVM and BMR since 2017. Formerly, Deputy Chief Compliance Officer (Adviser/Funds) and Chief Compliance Officer (Distribution) at PIMCO (2012-2017) and Managing Director at BlackRock/Barclays Global Investors (2009-2012). | |||
| 29 |
Eaton Vance Funds
| Privacy Notice | April 2021 |
| FACTS | WHAT DOES EATON VANCE DO WITH YOUR PERSONAL INFORMATION? | |
| Why? | Financial companies choose how they share your personal information. Federal law gives consumers the right to limit some but not all sharing. Federal law also requires us to tell you how we collect, share, and protect your personal information. Please read this notice carefully to understand what we do. | |
| What? | The types of personal information we collect and share depend on the product or service you have with us. This information can include:
∎ Social Security number and income ∎ investment experience and risk tolerance ∎ checking account number and wire transfer instructions | |
| How? | All financial companies need to share customers’ personal information to run their everyday business. In the section below, we list the reasons financial companies can share their customers’ personal information; the reasons Eaton Vance chooses to share; and whether you can limit this sharing. | |
| Reasons we can share your personal information |
Does Eaton Vance share? | Can you limit this sharing? | ||
| For our everyday business purposes — such as to process your transactions, maintain your account(s), respond to court orders and legal investigations, or report to credit bureaus | Yes | No | ||
| For our marketing purposes — to offer our products and services to you | Yes | No | ||
| For joint marketing with other financial companies | No | We don’t share | ||
| For our investment management affiliates’ everyday business purposes — information about your transactions, experiences, and creditworthiness | Yes | Yes | ||
| For our affiliates’ everyday business purposes — information about your transactions and experiences | Yes | No | ||
| For our affiliates’ everyday business purposes — information about your creditworthiness | No | We don’t share | ||
| For our investment management affiliates to market to you | Yes | Yes | ||
| For our affiliates to market to you | No | We don’t share | ||
| For nonaffiliates to market to you | No | We don’t share |
| To limit our sharing | Call toll-free 1-800-262-1122 or email: [email protected]
Please note:
If you are a new customer, we can begin sharing your information 30 days from the date we sent this notice. When you are no longer our customer, we continue to share your information as described in this notice. However, you can contact us at any time to limit our sharing. | |
| Questions? | Call toll-free 1-800-262-1122 or email: [email protected] | |
| 30 |
Eaton Vance Funds
| Privacy Notice — continued | April 2021 |
| Page 2 |
| Who we are | ||
| Who is providing this notice? | Eaton Vance Management, Eaton Vance Distributors, Inc., Eaton Vance Trust Company, Eaton Vance Management (International) Limited, Eaton Vance Advisers International Ltd., Eaton Vance Global Advisors Limited, Eaton Vance Management’s Real Estate Investment Group, Boston Management and Research, Calvert Research and Management, Eaton Vance and Calvert Fund Families and our investment advisory affiliates (“Eaton Vance”) (see Investment Management Affiliates definition below) | |
| What we do | ||
| How does Eaton Vance protect my personal information? | To protect your personal information from unauthorized access and use, we use security measures that comply with federal law. These measures include computer safeguards and secured files and buildings. We have policies governing the proper handling of customer information by personnel and requiring third parties that provide support to adhere to appropriate security standards with respect to such information. | |
| How does Eaton Vance collect my personal information? | We collect your personal information, for example, when you
∎ open an account or make deposits or withdrawals from your account ∎ buy securities from us or make a wire transfer ∎ give us your contact information
We also collect your personal information from others, such as credit bureaus, affiliates, or other companies. | |
| Why can’t I limit all sharing? | Federal law gives you the right to limit only
∎ sharing for affiliates’ everyday business purposes — information about your creditworthiness ∎ affiliates from using your information to market to you ∎ sharing for nonaffiliates to market to you
State laws and individual companies may give you additional rights to limit sharing. See below for more on your rights under state law. | |
| Definitions | ||
| Investment Management Affiliates | Eaton Vance Investment Management Affiliates include registered investment advisers, registered broker-dealers, and registered and unregistered funds. Investment Management Affiliates does not include entities associated with Morgan Stanley Wealth Management, such as Morgan Stanley Smith Barney LLC and Morgan Stanley & Co. | |
| Affiliates | Companies related by common ownership or control. They can be financial and nonfinancial companies.
∎ Our affiliates include companies with a Morgan Stanley name and financial companies such as Morgan Stanley Smith Barney LLC and Morgan Stanley & Co. | |
| Nonaffiliates | Companies not related by common ownership or control. They can be financial and nonfinancial companies.
∎ Eaton Vance does not share with nonaffiliates so they can market to you. | |
| Joint marketing | A formal agreement between nonaffiliated financial companies that together market financial products or services to you.
∎ Eaton Vance doesn’t jointly market. | |
| Other important information | ||
|
Vermont: Except as permitted by law, we will not share personal information we collect about Vermont residents with Nonaffiliates unless you provide us with your written consent to share such information.
California: Except as permitted by law, we will not share personal information we collect about California residents with Nonaffiliates and we will limit sharing such personal information with our Affiliates to comply with California privacy laws that apply to us. | ||
| 31 |
Eaton Vance Funds
Delivery of Shareholder Documents. The Securities and Exchange Commission (SEC) permits funds to deliver only one copy of shareholder documents, including prospectuses, proxy statements and shareholder reports, to fund investors with multiple accounts at the same residential or post office box address. This practice is often called “householding” and it helps eliminate duplicate mailings to shareholders. American Stock Transfer & Trust Company, LLC (“AST”), the closed-end funds transfer agent, or your financial intermediary, may household the mailing of your documents indefinitely unless you instruct AST, or your financial intermediary, otherwise. If you would prefer that your Eaton Vance documents not be householded, please contact AST or your financial intermediary. Your instructions that householding not apply to delivery of your Eaton Vance documents will typically be effective within 30 days of receipt by AST or your financial intermediary.
Portfolio Holdings. Each Eaton Vance Fund and its underlying Portfolio(s) (if applicable) files a schedule of portfolio holdings on Part F to Form N-PORT with the SEC. Certain information filed on Form N-PORT may be viewed on the Eaton Vance website at www.eatonvance.com, by calling Eaton Vance at 1-800-262-1122 or in the EDGAR database on the SEC’s website at www.sec.gov.
Proxy Voting. From time to time, funds are required to vote proxies related to the securities held by the funds. The Eaton Vance Funds or their underlying Portfolios (if applicable) vote proxies according to a set of policies and procedures approved by the Funds’ and Portfolios’ Boards. You may obtain a description of these policies and procedures and information on how the Funds or Portfolios voted proxies relating to portfolio securities during the most recent 12-month period ended June 30, without charge, upon request, by calling 1-800-262-1122 and by accessing the SEC’s website at www.sec.gov.
Share Repurchase Program. The Fund’s Board of Trustees has approved a share repurchase program authorizing the Fund to repurchase up to 10% of its common shares outstanding as of the last day of the prior calendar year in open-market transactions at a discount to net asset value. The repurchase program does not obligate the Fund to purchase a specific amount of shares. The Fund’s repurchase activity, including the number of shares purchased, average price and average discount to net asset value, is disclosed in the Fund’s annual and semi-annual reports to shareholders.
Additional Notice to Shareholders. If applicable, a Fund may also redeem or purchase its outstanding preferred shares in order to maintain compliance with regulatory requirements, borrowing or rating agency requirements or for other purposes as it deems appropriate or necessary.
Closed-End Fund Information. Eaton Vance closed-end funds make fund performance data and certain information about portfolio characteristics available on the Eaton Vance website shortly after the end of each month. Other information about the funds is available on the website. The funds’ net asset value per share is readily accessible on the Eaton Vance website. Portfolio holdings for the most recent month-end are also posted to the website approximately 30 days following the end of the month. This information is available at www.eatonvance.com on the fund information pages under “Closed-End Funds and Term Trusts”.
| 32 |
Investment Adviser and Administrator
Eaton Vance Management
Two International Place
Boston, MA 02110
Custodian
State Street Bank and Trust Company
State Street Financial Center, One Lincoln Street
Boston, MA 02111
Transfer Agent
American Stock Transfer & Trust Company, LLC
6201 15th Avenue
Brooklyn, NY 11219
Independent Registered Public Accounting Firm
Deloitte & Touche LLP
200 Berkeley Street
Boston, MA 02116-5022
Fund Offices
Two International Place
Boston, MA 02110
2426 12.31.21
Item 2. Code of Ethics
The registrant (sometimes referred to as the “Fund” has adopted a code of ethics applicable to its Principal Executive Officer, Principal Financial Officer and Principal Accounting Officer. The registrant undertakes to provide a copy of such code of ethics to any person upon request, without charge, by calling 1-800-262-1122. The registrant has not amended the code of ethics as described in Form N-CSR during the period covered by this report. The registrant has not granted any waiver, including an implicit waiver, from a provision of the code of ethics as described in Form N-CSR during the period covered by this report.
Item 3. Audit Committee Financial Expert
The registrant’s Board of Trustees (the “Board”) has designated George J. Gorman, William H. Park and Scott E. Wennerholm, each an independent trustee, as audit committee financial experts. Mr. Gorman is a certified public accountant who is the Principal at George J. Gorman LLC (a consulting firm). Previously, Mr. Gorman served in various capacities at Ernst & Young LLP (a registered public accounting firm), including as Senior Partner. Mr. Gorman also has experience serving as an independent trustee and audit committee financial
expert of other mutual fund complexes. Mr. Park is a certified public accountant who is a private investor. Previously, he served as a consultant, as the Chief Financial Officer of Aveon Group, L.P. (an investment management firm), as the Vice Chairman of Commercial Industrial Finance Corp. (specialty finance company), as President and Chief Executive Officer of Prizm Capital Management, LLC (investment management firm), as Executive Vice President and Chief Financial Officer of United Asset Management Corporation (an institutional investment management firm) and as a Senior Manager at Price Waterhouse (now PricewaterhouseCoopers) (a registered public accounting firm). Mr. Wennerholm is a private investor. Previously, Mr. Wennerholm served as a Trustee at Wheelock College (postsecondary institution), as a Consultant at GF Parish Group (executive recruiting firm), Chief Operating Officer and Executive Vice President at BNY Mellon Asset Management (investment management firm), Chief Operating Officer and Chief Financial Officer at Natixis Global Asset Management (investment management firm), and Vice President at Fidelity Investments Institutional Services (investment management firm).
Item 4. Principal Accountant Fees and Services
(a) –(d)
The following table presents the aggregate fees billed to the registrant for the registrant’s fiscal years ended December 31, 2020 and December 31, 2021 by the registrant’s principal accountant, Deloitte & Touche LLP (“D&T”), for professional services rendered for the audit of the registrant’s annual financial statements and fees billed for other services rendered by D&T during such periods.
| Fiscal Years Ended |
12/31/20 | 12/31/21 | ||||||
| Audit Fees |
$ | 51,950 | $ | 51,950 | ||||
| Audit-Related Fees(1) |
$ | 0 | $ | 0 | ||||
| Tax Fees(2) |
$ | 19,707 | $ | 19,357 | ||||
| All Other Fees(3) |
$ | 0 | $ | 0 | ||||
|
|
|
|
|
|||||
| Total |
$ | 71,657 | $ | 71,307 | ||||
|
|
|
|
|
|||||
| (1) | Audit-related fees consist of the aggregate fees billed for assurance and related services that are reasonably related to the performance of the audit of financial statements and are not reported under the category of audit fees. |
| (2) | Tax fees consist of the aggregate fees billed for professional services rendered by the principal accountant relating to tax compliance, tax advice, and tax planning and specifically include fees for tax return preparation and other related tax compliance/planning matters. |
| (3) | All other fees consist of the aggregate fees billed for products and services provided by the principal accountant other than audit, audit-related, and tax services. |
(e)(1) The registrant’s audit committee has adopted policies and procedures relating to the pre-approval of services provided by the registrant’s principal accountant (the “Pre-Approval Policies”). The Pre-Approval Policies establish a framework intended to assist the audit committee in the proper discharge of its pre-approval responsibilities. As a general matter, the Pre-Approval Policies (i) specify certain types of audit, audit-related, tax, and other services determined to be pre-approved by the audit committee; and (ii) delineate specific procedures governing the mechanics of the pre-approval process, including the approval and monitoring of audit and non-audit service fees. Unless a service is specifically pre-approved under the Pre-Approval Policies, it must be separately pre-approved by the audit committee.
The Pre-Approval Policies and the types of audit and non-audit services pre-approved therein must be reviewed and ratified by the registrant’s audit committee at least annually. The registrant’s audit committee maintains full responsibility for the appointment, compensation, and oversight of the work of the registrant’s principal accountant.
(e)(2) No services described in paragraphs (b)-(d) above were approved by the registrant’s audit committee pursuant to the “de minimis exception” set forth in Rule 2-01(c)(7)(i)(C) of Regulation S-X.
(f) Not applicable.
(g) The following table presents (i) the aggregate non-audit fees (i.e., fees for audit-related, tax, and other services) billed to the registrant by D&T for the registrant’s fiscal years ended December 31, 2020 and December 31, 2021; and (ii) the aggregate non-audit fees (i.e., fees for audit-related, tax, and other services) billed to the Eaton Vance organization by D&T for the same time periods.
| Fiscal Years Ended |
12/31/20 | 12/31/21 | ||||||
| Registrant |
$ | 19,707 | $ | 19,357 | ||||
| Eaton Vance(1) |
$ | 150,300 | $ | 51,800 | ||||
| (1) | The investment adviser to the registrant, as well as any of its affiliates that provide ongoing services to the registrant, are subsidiaries of Morgan Stanley. |
(h) The registrant’s audit committee has considered whether the provision by the registrant’s principal accountant of non-audit services to the registrant’s investment adviser and any entity controlling, controlled by, or under common control with the adviser that provides ongoing services to the registrant that were not pre-approved pursuant to Rule 2-01(c)(7)(ii) of Regulation S-X is compatible with maintaining the principal accountant’s independence.
Item 5. Audit Committee of Listed Registrants
The registrant has a separately-designated standing audit committee established in accordance with Section 3(a)(58)(A) of the Securities and Exchange Act of 1934, as amended. George J. Gorman, William H. Park, Helen Frame Peters and Scott E. Wennerholm (Chair) are the members of the registrant’s audit committee.
Item 6. Schedule of Investments
Please see schedule of investments contained in the Report to Stockholders included under Item 1 of this Form N-CSR.
Item 7. Disclosure of Proxy Voting Policies and Procedures for Closed-End Management Investment Companies
The Board of the Fund has adopted a proxy voting policy and procedure (the “Fund Policy”), pursuant to which the trustees have delegated proxy voting responsibility to the Fund’s investment adviser and adopted the investment adviser’s proxy voting policies and procedures (the “Policies”) which are described below. The trustees will review the Policies annually. In the event that a conflict of interest arises between the Fund’s shareholders and the investment adviser, the administrator, or any of their affiliates or any affiliate of the Fund, the investment adviser will generally refrain from voting the proxies related to the companies giving rise to such conflict until it consults with the Board, or any committee, sub-committee or group of independent trustees identified by the Board, which will instruct the investment adviser on the appropriate course of action. If the Board Members are unable to meet and the failure to vote a proxy would have a material adverse impact on the Fund, the investment adviser may vote such proxy, provided that it discloses the existence of the material conflict to the Chairperson of the Fund’s Board as soon as practicable and to the Board at its next meeting.
The Policies are designed to promote accountability of a company’s management to its shareholders and to align the interests of management with those shareholders. An independent proxy voting service (“Agent”), currently Institutional Shareholder Services, Inc., has been retained to assist in the voting of proxies through the provision of vote analysis, implementation and recordkeeping and disclosure services. The investment adviser will generally vote proxies through the Agent. The Agent is required to vote all proxies in accordance with customized proxy voting guidelines (the “Guidelines”) and/or refer them back to the investment adviser pursuant to the Policies.
The Agent is required to establish and maintain adequate internal controls and policies in connection with the provision of proxy voting services, including methods to reasonably ensure that its analysis and recommendations are not influenced by a conflict of interest. The Guidelines include voting guidelines for matters relating to, among other things, the election of directors, approval of independent auditors, executive compensation, corporate structure and anti-takeover defenses. The investment adviser may cause the Fund to abstain from voting from time to time where it determines that the costs associated with voting a proxy outweigh the benefits derived from exercising the right to vote or it is unable to access or access timely ballots or other proxy information, among other stated reasons. The Agent will refer Fund proxies to the investment adviser for instructions under circumstances where, among others: (1) the application of the Guidelines is unclear; (2) a particular proxy question is not covered by the Guidelines; or (3) the Guidelines require input from the investment adviser. When a proxy voting issue has been referred to the investment adviser, the analyst (or portfolio manager if applicable) covering the company subject to the proxy proposal determines the final vote (or decision not to vote) and the investment adviser’s Proxy Administrator (described below) instructs the Agent to vote accordingly for securities held by the Fund. Where more than one analyst covers a particular company and the recommendations of such analysts voting a proposal conflict, the investment adviser’s Global Proxy Group (described below) will review such recommendations and any other available information related to the proposal and determine the manner in which it should be voted, which may result in different recommendations for the Fund that may differ from other clients of the investment adviser.
The investment adviser has appointed a Proxy Administrator to assist in the coordination of the voting of client proxies (including the Fund’s) in accordance with the Guidelines and the Policies. The investment adviser and its affiliates have also established a Global Proxy Group. The Global Proxy Group develops the investment adviser’s positions on all major corporate issues, creates the Guidelines and oversees the proxy voting process. The Proxy Administrator maintains a record of all proxy questions that have been referred by the Agent, all applicable recommendations, analysis and research received and any resolution of the matter. Before instructing the Agent to vote contrary to the Guidelines or the recommendation of the Agent, the Proxy Administrator will provide the Global Proxy Group with the Agent’s recommendation for the proposal along with any other relevant materials, including the basis for the analyst’s recommendation. The Proxy Administrator will then instruct the Agent to vote the proxy in the manner determined by the Global Proxy Group. A similar process will be followed if the Agent has a conflict of interest with respect to a proxy. The investment adviser will report to the Fund’s Board any votes cast contrary to the Guidelines or Agent recommendations, as applicable, no less than annually.
The investment adviser’s Global Proxy Group is responsible for monitoring and resolving possible material conflicts with respect to proxy voting. Because the Guidelines are predetermined and designed to be in the best interests of shareholders, application of the Guidelines to vote client proxies should, in most cases, adequately address any possible conflict of interest. The investment adviser will monitor situations that may result in a conflict of interest between any of its clients and the investment adviser or any of its affiliates by maintaining a list of significant existing and prospective corporate clients. The Proxy Administrator will compare such list with the names of companies of which he or she has been referred a proxy statement (the “Proxy Companies”). If a company on the list is also a Proxy Company, the Proxy Administrator will report that fact to the Global
Proxy Group. If the Proxy Administrator intends to instruct the Agent to vote in a manner inconsistent with the Guidelines, the Global Proxy Group will first determine, in consultation with legal counsel if necessary, whether a material conflict exists. If it is determined that a material conflict exists, the investment adviser will seek instruction on how the proxy should be voted from the Fund’s Board, or any committee or subcommittee identified by the Board. If a matter is referred to the Global Proxy Group, the decision made and basis for the decision will be documented by the Proxy Administrator and/or Global Proxy Group.
Information on how the Fund voted proxies relating to portfolio securities during the most recent 12 month period ended June 30 is available (1) without charge, upon request, by calling 1-800-262-1122, and (2) on the Securities and Exchange Commission’s website at http://www.sec.gov.
Item 8. Portfolio Managers of Closed-End Management Investment Companies
Eaton Vance Management (“EVM” or “Eaton Vance”) is the investment adviser of the Fund. Lewis R. Piantedosi and Douglas R. Rogers comprise the investment team responsible for the overall and day-to-day management of the Fund’s investments.
Mr. Piantedosi is a Vice President of EVM, has been a portfolio manager of the Fund since September 2014 and has managed other Eaton Vance portfolios for more than five years. Mr. Rogers is a Vice President of EVM, has been an equity analyst at Eaton Vance since 2001 and has been a portfolio manager of the Fund since July 2021. This information is provided as of the date of filing this report.
The following table shows, as of the Fund’s most recent fiscal year end, the number of accounts each portfolio manager managed in each of the listed categories and the total assets (in millions of dollars) in the accounts managed within each category. The table also shows the number of accounts with respect to which the advisory fee is based on the performance of the account, if any, and the total assets (in millions of dollars) in those accounts.
| Number of All Accounts |
Total Assets of All Accounts |
Number of Accounts Paying a Performance Fee |
Total Assets of Accounts Paying a Performance Fee |
|||||||||||||
| Lewis R. Piantedosi(1)(2) |
||||||||||||||||
| Registered Investment Companies |
6 | $ | 3,128.3 | 0 | $ | 0 | ||||||||||
| Other Pooled Investment Vehicles |
1 | $ | 30.0 | 0 | $ | 0 | ||||||||||
| Other Accounts |
6 | $ | 74.1 | 0 | $ | 0 | ||||||||||
| Douglas R. Rogers(1)(2) |
||||||||||||||||
| Registered Investment Companies |
6 | $ | 3,128.3 | 0 | $ | 0 | ||||||||||
| Other Pooled Investment Vehicles |
1 | $ | 30.0 | 0 | $ | 0 | ||||||||||
| Other Accounts |
6 | $ | 74.1 | 0 | $ | 0 | ||||||||||
| (1) | This portfolio manager serves as portfolio manager of one or more registered investment companies that invests or may invest in one or more underlying registered investment companies in the Eaton Vance family of funds or other pooled investment vehicles sponsored by Eaton Vance. The underlying investment companies may be managed by this portfolio manager or another portfolio manager. |
| (2) | This portfolio manager provides advisory services for certain of the “Other Accounts” on a nondiscretionary or model basis. For “Other Accounts” that are part of a wrap account program, the number of accounts is the number of sponsors for which the portfolio manager provides advisory services rather than the number of individual customer accounts within each wrap account program. The assets managed may include assets advised on a nondiscretionary or model basis. |
The following table shows the dollar range of Fund shares beneficially owned by each portfolio manager as of the Fund’s most recent fiscal year end.
| Portfolio Manager |
Dollar Range of Equity Securities Beneficially Owned in the Fund | |
| Lewis R. Piantedosi |
None | |
| Douglas R. Rogers |
None |
Potential for Conflicts of Interest. It is possible that conflicts of interest may arise in connection with a portfolio manager’s management of the Fund’s investments on the one hand and the investments of other accounts for which a portfolio manager is responsible on the other. For example, a portfolio manager may have conflicts of interest in allocating management time, resources and investment opportunities among the Fund and other accounts he advises. In addition, due to differences in the investment strategies or restrictions between the Fund and the other accounts, the portfolio manager may take action with respect to another account that differs from the action taken with respect to the Fund. In some cases, another account managed by a portfolio manager may compensate the investment adviser based on the performance of the securities held by that account. The existence of such a performance based fee may create additional conflicts of interest for the portfolio manager in the allocation of management time, resources and investment opportunities. Whenever conflicts of interest arise, the portfolio manager will endeavor to exercise his discretion in a manner that he believes is equitable to all interested persons. EVM has adopted several policies and procedures designed to address these potential conflicts including a code of ethics and policies that govern the investment adviser’s trading practices, including among other things the aggregation and allocation of trades among clients, brokerage allocations, cross trades and best execution.
Compensation Structure for EVM
Compensation of EVM’s portfolio managers and other investment professionals has the following primary components: (1) a base salary and (2) discretionary variable compensation that is comprised of cash bonus and depending on eligibility, may also include deferred compensation consisting of restricted shares of Morgan Stanley stock and deferred cash that are subject to a fixed vesting and distribution schedule. EVM’s investment professionals also receive certain retirement, insurance and other benefits that are broadly available to EVM’s employees. Compensation of EVM’s investment professionals is reviewed primarily on an annual basis. Cash bonuses and deferred compensation awards, and adjustments in base salary are typically paid or put into effect shortly after the December 31st fiscal year end of Morgan Stanley.
Method to Determine Compensation. EVM compensates its portfolio managers based on company and team business results, and individual performance, including the scale and complexity of their portfolio responsibilities and the total return performance of managed funds and accounts versus the benchmark(s) stated in the prospectus, as well as an appropriate peer group (as described below). In addition to rankings within peer groups of funds on the basis of absolute performance, consideration may also be given to relative risk-adjusted performance. Risk-adjusted performance measures include, but are not limited to the Sharpe ratio, which uses standard deviation and excess return to determine reward per unit of risk. Fund performance is normally evaluated primarily versus peer groups of funds as determined by Lipper Inc. and/or Morningstar, Inc. When a fund’s peer group as determined by Lipper or Morningstar is deemed by EVM’s management not to provide a fair comparison, performance may instead be evaluated primarily against a custom peer group or market index. In evaluating the performance of a fund and its manager, primary emphasis is normally placed on three-year performance, with secondary consideration of performance over longer and shorter periods. For funds that are tax-managed or otherwise have an objective of after-tax returns, performance is measured net of taxes. For other funds, performance is evaluated on a pre-tax basis. For funds with an investment objective other than total return (such as current income), consideration will also be given to the fund’s success in achieving its objective. For managers responsible for multiple funds and accounts, investment performance is evaluated on an aggregate basis, based on averages or weighted averages among managed funds and accounts. Funds and accounts that have performance-based advisory fees are not accorded disproportionate weightings in measuring aggregate portfolio manager performance.
The compensation of portfolio managers with other job responsibilities (such as heading an investment group or providing analytical support to other portfolios) will include consideration of the scope of such responsibilities and the managers’ performance in meeting them.
EVM seeks to compensate portfolio managers commensurate with their responsibilities and performance, and competitive with other firms within the investment management industry. EVM participates in investment-industry compensation surveys and utilizes survey data as a factor in determining salary and variable compensation levels for portfolio managers and other investment professionals. Salaries and variable compensation are also influenced by the operating performance of EVM and Morgan Stanley. While the salaries of EVM’s portfolio managers are comparatively fixed, variable compensation may fluctuate significantly from year to year, based on changes in company and team performance, manager performance and other factors as described herein. For a high performing portfolio manager, variable compensation may represent a substantial portion of total compensation.
Item 9. Purchases of Equity Securities by Closed-End Management Investment Company and Affiliated Purchasers
No such purchases this period.
Item 10. Submission of Matters to a Vote of Security Holders
No material changes.
Item 11. Controls and Procedures
(a) It is the conclusion of the registrant’s principal executive officer and principal financial officer that the effectiveness of the registrant’s current disclosure controls and procedures (such disclosure controls and procedures having been evaluated within 90 days of the date of this filing) provide reasonable assurance that the information required to be disclosed by the registrant has been recorded, processed, summarized and reported within the time period specified in the Commission’s rules and forms and that the information required to be disclosed by the registrant has been accumulated and communicated to the registrant’s principal executive officer and principal financial officer in order to allow timely decisions regarding required disclosure.
(b) There have been no changes in the registrant’s internal controls over financial reporting during the period covered by this report that has materially affected, or is reasonably likely to materially affect, the registrant’s internal control over financial reporting.
Item 12. Disclosure of Securities Lending Activities for Closed-End Management Investment Companies
No activity to report for the registrant’s most recent fiscal year end.
Item 13. Exhibits
| (a)(1) |
Registrant’s Code of Ethics – Not applicable (please see Item 2). | |
| (a)(2)(i) |
Treasurer’s Section 302 certification. | |
| (a)(2)(ii) |
President’s Section 302 certification. | |
| (b) |
Combined Section 906 certification. | |
| (c) |
Registrant’s notices to shareholders pursuant to Registrant’s exemptive order granting an exemption from Section 19(b) of the 1940 Act and Rule 19b-1 thereunder regarding distributions paid pursuant to the Registrant’s Managed Distribution Plan. | |
Signatures
Pursuant to the requirements of the Securities Exchange Act of 1934 and the Investment Company Act of 1940, the registrant has duly caused this report to be signed on its behalf by the undersigned, thereunto duly authorized.
| Eaton Vance Enhanced Equity Income Fund II | ||
| By: | /s/ Edward J. Perkin | |
| Edward J. Perkin | ||
| President | ||
Date: February 23, 2022
Pursuant to the requirements of the Securities Exchange Act of 1934 and the Investment Company Act of 1940, this report has been signed below by the following persons on behalf of the registrant and in the capacities and on the dates indicated.
| By: | /s/ James F. Kirchner | |
| James F. Kirchner | ||
| Treasurer | ||
| Date: | February 23, 2022 | |
| By: | /s/ Edward J. Perkin | |
| Edward J. Perkin | ||
| President | ||
| Date: | February 23, 2022 | |
Eaton Vance Enhanced Equity Income Fund II
FORM N-CSR
Exhibit 13(a)(2)(i)
CERTIFICATION
I, James F. Kirchner, certify that:
1. I have reviewed this report on Form N-CSR of Eaton Vance Enhanced Equity Income Fund II;
2. Based on my knowledge, this report does not contain any untrue statement of a material fact or omit to state a material fact necessary to make the statements made, in light of the circumstances under which such statements were made, not misleading with respect to the period covered by this report;
3. Based on my knowledge, the financial statements, and other financial information included in this report, fairly present in all material respects the financial condition, results of operations, changes in net assets, and cash flows (if the financial statements are required to include a statement of cash flows) of the registrant as of, and for, the periods presented in this report;
4. The registrant’s other certifying officer(s) and I are responsible for establishing and maintaining disclosure controls and procedures (as defined in Rule 30a-3(c) under the Investment Company Act of 1940) and internal control over financial reporting (as defined in Rule 30a-3(d) under the Investment Company Act of 1940) for the registrant and have:
(a) Designed such disclosure controls and procedures, or caused such disclosure controls and procedures to be designed under our supervision, to ensure that material information relating to the registrant, including its consolidated subsidiaries, is made known to us by others within those entities, particularly during the period in which this report is being prepared;
(b) Designed such internal control over financial reporting, or caused such internal control over financial reporting to be designed under our supervision, to provide reasonable assurance regarding the reliability of financial reporting and the preparation of financial statements for external purposes in accordance with generally accepted accounting principles;
(c) Evaluated the effectiveness of the registrant’s disclosure controls and procedures and presented in this report our conclusions about the effectiveness of the disclosure controls and procedures, as of a date within 90 days prior to the filing date of this report based on such evaluation; and
(d) Disclosed in this report any change in the registrant’s internal control over financial reporting that occurred during the period covered by this report that has materially affected, or is reasonably likely to materially affect, the registrant’s internal control over financial reporting; and
5. The registrant’s other certifying officer(s) and I have disclosed to the registrant’s auditors and the audit committee of the registrant’s board of directors (or persons performing the equivalent functions):
(a) All significant deficiencies and material weaknesses in the design or operation of internal control over financial reporting which are reasonably likely to adversely affect the registrant’s ability to record, process, summarize, and report financial information; and
(b) Any fraud, whether or not material, that involves management or other employees who have a significant role in the registrant’s internal control over financial reporting.
Date: February 23, 2022
| /s/ James F. Kirchner |
| James F. Kirchner |
| Treasurer |
Eaton Vance Enhanced Equity Income Fund II
FORM N-CSR
Exhibit 13(a)(2)(ii)
CERTIFICATION
I, Edward J. Perkin, certify that:
1. I have reviewed this report on Form N-CSR of Eaton Vance Enhanced Equity Income Fund II;
2. Based on my knowledge, this report does not contain any untrue statement of a material fact or omit to state a material fact necessary to make the statements made, in light of the circumstances under which such statements were made, not misleading with respect to the period covered by this report;
3. Based on my knowledge, the financial statements, and other financial information included in this report, fairly present in all material respects the financial condition, results of operations, changes in net assets, and cash flows (if the financial statements are required to include a statement of cash flows) of the registrant as of, and for, the periods presented in this report;
4. The registrant’s other certifying officer(s) and I are responsible for establishing and maintaining disclosure controls and procedures (as defined in Rule 30a-3(c) under the Investment Company Act of 1940) and internal control over financial reporting (as defined in Rule 30a-3(d) under the Investment Company Act of 1940) for the registrant and have:
(a) Designed such disclosure controls and procedures, or caused such disclosure controls and procedures to be designed under our supervision, to ensure that material information relating to the registrant, including its consolidated subsidiaries, is made known to us by others within those entities, particularly during the period in which this report is being prepared;
(b) Designed such internal control over financial reporting, or caused such internal control over financial reporting to be designed under our supervision, to provide reasonable assurance regarding the reliability of financial reporting and the preparation of financial statements for external purposes in accordance with generally accepted accounting principles;
(c) Evaluated the effectiveness of the registrant’s disclosure controls and procedures and presented in this report our conclusions about the effectiveness of the disclosure controls and procedures, as of a date within 90 days prior to the filing date of this report based on such evaluation; and
(d) Disclosed in this report any change in the registrant’s internal control over financial reporting that occurred during the period covered by this report that has materially affected, or is reasonably likely to materially affect, the registrant’s internal control over financial reporting; and
5. The registrant’s other certifying officer(s) and I have disclosed to the registrant’s auditors and the audit committee of the registrant’s board of directors (or persons performing the equivalent functions):
(a) All significant deficiencies and material weaknesses in the design or operation of internal control over financial reporting which are reasonably likely to adversely affect the registrant’s ability to record, process, summarize, and report financial information; and
(b) Any fraud, whether or not material, that involves management or other employees who have a significant role in the registrant’s internal control over financial reporting.
| Date: February 23, 2022 | /s/ Edward J. Perkin | |||||
| Edward J. Perkin | ||||||
| President |
Form N-CSR Item 13(b) Exhibit
CERTIFICATION PURSUANT TO
18 U.S.C. SECTION 1350,
AS ADOPTED PURSUANT TO
SECTION 906 OF THE SARBANES-OXLEY ACT OF 2002
The undersigned hereby certify in their capacity as Treasurer and President, respectively, of Eaton Vance Enhanced Equity Income Fund II (the “Fund”), that:
| (a) | the Annual Report of the Fund on Form N-CSR for the period ended December 31, 2021 (the “Report”) fully complies with the requirements of Section 13(a) or 15(d) of the Securities Exchange Act of 1934, as amended; and |
| (b) | the information contained in the Report fairly presents, in all material respects, the financial condition and the results of operations of the Fund for such period. |
A signed original of this written statement required by section 906 has been provided to the Fund and will be retained by the Fund and furnished to the Securities and Exchange Commission or its staff upon request.
| Eaton Vance Enhanced Equity Income Fund II |
| Date: February 23, 2022 |
| /s/ James F. Kirchner |
| James F. Kirchner |
| Treasurer |
| Date: February 23, 2022 |
| /s/ Edward J. Perkin |
| Edward J. Perkin |
| President |
Form N-CSR Item 13(c) Exhibit

Dear Eaton Vance Fund Shareholder:
This notice provides shareholders of the Eaton Vance Enhanced Equity Income Fund II (NYSE: EOS) with important information concerning the distribution declared in July 2021. You are receiving this notice as a requirement of the Fund’s managed distribution plan (Plan). The Board of Trustees approved the implementation of the Plan to make monthly cash distributions to common shareholders, stated in terms of a fixed amount per common share. This information is sent to you for informational purposes only and is an estimate of the sources of the July distribution. It is not determinative of the tax character of the Fund’s distributions for the 2021 calendar year.
The amounts and sources of distributions reported in this notice are estimates, are not being provided for tax reporting purposes and the distribution may later be determined to be from other sources including realized short-term gains, long-term gains, to the extent permitted by law, and return of capital. The actual amounts and sources for tax reporting purposes will depend upon the Fund’s investment experience during the remainder of its fiscal year and may be subject to changes based on tax regulations. The Fund will send you a Form 1099-DIV for the calendar year that will tell you how to report these distributions for federal income tax purposes.
Distribution Period: July 2021
Distribution Amount per Common Share: 0.0988
The following table sets forth an estimate of the sources of the Fund’s July distribution and its cumulative distributions paid this fiscal year to date. Amounts are expressed on a per common share basis and as a percentage of the distribution amount.
Eaton Vance Enhanced Equity Income Fund II
| Source |
Current Distribution |
% of Current Distribution |
Cumulative Distributions for the Fiscal Year-to-Date1 |
% of the Cumulative Distributions for the Fiscal Year-to-Date1 |
||||||||||||
| Net Investment Income |
$ | 0.0000 | 0.0 | % | $ | 0.0000 | 0.0 | % | ||||||||
| Net Realized Short-Term Capital Gains |
$ | 0.0000 | 0.0 | % | $ | 0.0000 | 0.0 | % | ||||||||
| Net Realized Long-Term Capital Gains |
$ | 0.0988 | 100.0 | % | $ | 0.6916 | 100.0 | % | ||||||||
| Return of Capital or Other Capital Source(s) |
$ | 0.0000 | 0.0 | % | $ | 0.0000 | 0.0 | % | ||||||||
| Total per common share |
$ | 0.0988 | 100.0 | % | $ | 0.6916 | 100.0 | % | ||||||||
| 1 | The Fund’s fiscal year is January 1, 2021 to December 31, 2021 |
IMPORTANT DISCLOSURE: You should not draw any conclusions about the Fund’s investment performance from the amount of this distribution or from the terms of the Fund’s Plan. The Fund estimates that it has distributed more than its income and net realized capital gains; therefore, a portion of your distribution may be a return of capital. A return of capital may occur for example, when some or all of the money that you invested in the Fund is paid back to you. A return of capital distribution does not necessarily reflect the Fund’s investment performance and should not be confused with ‘yield’ or ‘income.’ The amounts and sources of distributions reported in this Notice are only estimates and are not being provided for tax reporting purposes. The actual amounts and sources of the amounts for accounting and/or tax reporting purposes will depend upon the Fund’s investment experience during the remainder of its fiscal year and may be subject to changes based on tax regulations. The Fund will send you a Form 1099-DIV for the calendar year that will tell you how to report these distributions for federal income tax purposes.
Set forth in the table below is information relating to the Fund’s performance based on its net asset value (NAV) for certain periods.
| Average annual total return at NAV for the 5-year period ended on June 30, 20211 |
19.14 | % | ||
| Annualized current distribution rate expressed as a percentage of NAV as of June 30, 20212 |
5.10 | % | ||
| Cumulative total return at NAV for the fiscal year through June 30, 20213 |
12.64 | % | ||
| Cumulative fiscal year to date distribution rate as a percentage of NAV as of June 30, 20214 |
2.55 | % |
| 1 | Average annual total return at NAV represents the change in NAV of the Fund, with all distributions reinvested, for the 5-year period ended on June 30, 2021. |
| 2 | The annualized current distribution rate is the cumulative distribution rate annualized as a percentage of the Fund’s NAV as of June 30, 2021. |
| 3 | Cumulative total return at NAV is the percentage change in the Fund’s NAV for the period from the beginning of its fiscal year to June 30, 2021 including distributions paid and assuming reinvestment of those distributions. |
| 4 | Cumulative fiscal year distribution rate for the period from the beginning of its fiscal year to June 30, 2021 measured on the dollar value of distributions in the year-to-date period as a percentage of the Fund’s NAV as of June 30, 2021. |
If you have any questions regarding this information, please contact your investment advisor or an Eaton Vance Investor Services associate at 1-866-328-6681. Our associates are available to assist you Monday-Friday 8:30 a.m. to 5:30 p.m., Eastern Time.
NOTE: This correspondence is for informational purposes only and should not be relied upon to project the tax character of actual Fund distributions for the 2021 calendar year.
NO ACTION IS REQUIRED ON YOUR PART.
Eaton Vance Enhanced Equity Income Fund II
July 30, 2021
Dear Eaton Vance Fund Shareholder:
This notice provides shareholders of the Eaton Vance Enhanced Equity Income Fund II (NYSE: EOS) with important information concerning the distribution declared in August 2021. You are receiving this notice as a requirement of the Fund’s managed distribution plan (Plan). The Board of Trustees approved the implementation of the Plan to make monthly cash distributions to common shareholders, stated in terms of a fixed amount per common share. This information is sent to you for informational purposes only and is an estimate of the sources of the August distribution. It is not determinative of the tax character of the Fund’s distributions for the 2021 calendar year.
The amounts and sources of distributions reported in this notice are estimates, are not being provided for tax reporting purposes and the distribution may later be determined to be from other sources including realized short-term gains, long-term gains, to the extent permitted by law, and return of capital. The actual amounts and sources for tax reporting purposes will depend upon the Fund’s investment experience during the remainder of its fiscal year and may be subject to changes based on tax regulations. The Fund will send you a Form 1099-DIV for the calendar year that will tell you how to report these distributions for federal income tax purposes.
Distribution Period: August 2021
Distribution Amount per Common Share: $0.1373
The following table sets forth an estimate of the sources of the Fund’s August distribution and its cumulative distributions paid this fiscal year to date. Amounts are expressed on a per common share basis and as a percentage of the distribution amount.
Eaton Vance Enhanced Equity Income Fund II
| Source |
Current Distribution |
% of Current Distribution |
Cumulative Distributions for the Fiscal Year-to-Date1 |
% of the Cumulative Distributions for the Fiscal Year-to-Date1 |
||||||||||||
| Net Investment Income |
$ | 0.0000 | 0.0 | % | $ | 0.0000 | 0.0 | % | ||||||||
| Net Realized Short-Term Capital Gains |
$ | 0.0000 | 0.0 | % | $ | 0.0000 | 0.0 | % | ||||||||
| Net Realized Long-Term Capital Gains |
$ | 0.1373 | 100.0 | % | $ | 0.8289 | 100.0 | % | ||||||||
| Return of Capital or Other Capital Source(s) |
$ | 0.0000 | 0.0 | % | $ | 0.0000 | 0.0 | % | ||||||||
| Total per common share |
$ | 0.1373 | 100.0 | % | $ | 0.8289 | 100.0 | % | ||||||||
| 1 | The Fund’s fiscal year is January 1, 2021 to December 31, 2021 |
IMPORTANT DISCLOSURE: You should not draw any conclusions about the Fund’s investment performance from the amount of this distribution or from the terms of the Fund’s Plan. The Fund estimates that it has distributed more than its income and net realized capital gains; therefore, a portion of your distribution may be a return of capital. A return of capital may occur for example, when some or all of the money that you invested in the Fund is paid back to you. A return of capital distribution does not necessarily reflect the Fund’s investment performance and should not be confused with ‘yield’ or ‘income.’ The amounts and sources of distributions reported in this Notice are only estimates and are not being provided for tax reporting purposes. The actual amounts and sources of the amounts for accounting and/or tax reporting purposes will depend upon the Fund’s investment experience during the remainder of its fiscal year and may be subject to changes based on tax regulations. The Fund will send you a Form 1099-DIV for the calendar year that will tell you how to report these distributions for federal income tax purposes.
Set forth in the table below is information relating to the Fund’s performance based on its net asset value (NAV) for certain periods.
| Average annual total return at NAV for the 5-year period ended on July 31, 20211 |
18.23 | % | ||
| Annualized current distribution rate expressed as a percentage of NAV as of July 31, 20212 |
5.04 | % | ||
| Cumulative total return at NAV for the fiscal year through July 31, 20213 |
14.48 | % | ||
| Cumulative fiscal year to date distribution rate as a percentage of NAV as of July 31, 20214 |
2.94 | % |
| 1 | Average annual total return at NAV represents the change in NAV of the Fund, with all distributions reinvested, for the 5-year period ended on July 31, 2021. |
| 2 | The annualized current distribution rate is the cumulative distribution rate annualized as a percentage of the Fund’s NAV as of July 31, 2021. |
| 3 | Cumulative total return at NAV is the percentage change in the Fund’s NAV for the period from the beginning of its fiscal year to July 31, 2021 including distributions paid and assuming reinvestment of those distributions. |
| 4 | Cumulative fiscal year distribution rate for the period from the beginning of its fiscal year to July 31, 2021 measured on the dollar value of distributions in the year-to-date period as a percentage of the Fund’s NAV as of July 31, 2021. |
If you have any questions regarding this information, please contact your investment advisor or an Eaton Vance Investor Services associate at 1-866-328-6681. Our associates are available to assist you Monday-Friday 8:30 a.m. to 5:30 p.m., Eastern Time.
NOTE: This correspondence is for informational purposes only and should not be relied upon to project the tax character of actual Fund distributions for the 2021 calendar year.
NO ACTION IS REQUIRED ON YOUR PART.
Eaton Vance Enhanced Equity Income Fund II
August 31, 2021
Dear Eaton Vance Fund Shareholder:
This notice provides shareholders of the Eaton Vance Enhanced Equity Income Fund II (NYSE: EOS) with important information concerning the distribution declared in September 2021. You are receiving this notice as a requirement of the Fund’s managed distribution plan (Plan). The Board of Trustees approved the implementation of the Plan to make monthly cash distributions to common shareholders, stated in terms of a fixed amount per common share. This information is sent to you for informational purposes only and is an estimate of the sources of the September distribution. It is not determinative of the tax character of the Fund’s distributions for the 2021 calendar year.
The amounts and sources of distributions reported in this notice are estimates, are not being provided for tax reporting purposes and the distribution may later be determined to be from other sources including realized short-term gains, long-term gains, to the extent permitted by law, and return of capital. The actual amounts and sources for tax reporting purposes will depend upon the Fund’s investment experience during the remainder of its fiscal year and may be subject to changes based on tax regulations. The Fund will send you a Form 1099-DIV for the calendar year that will tell you how to report these distributions for federal income tax purposes.
Distribution Period: September 2021
Distribution Amount per Common Share: $0.1373
The following table sets forth an estimate of the sources of the Fund’s September distribution and its cumulative distributions paid this fiscal year to date. Amounts are expressed on a per common share basis and as a percentage of the distribution amount.
Eaton Vance Enhanced Equity Income Fund II
| Source |
Current Distribution |
% of Current Distribution |
Cumulative Distributions for the Fiscal Year-to-Date1 |
% of the Cumulative Distributions for the Fiscal Year-to-Date1 |
||||||||||||
| Net Investment Income |
$ | 0.0000 | 0.0 | % | $ | 0.0000 | 0.0 | % | ||||||||
| Net Realized Short-Term Capital Gains |
$ | 0.0000 | 0.0 | % | $ | 0.0000 | 0.0 | % | ||||||||
| Net Realized Long-Term Capital Gains |
$ | 0.1373 | 100.0 | % | $ | 0.9662 | 100.0 | % | ||||||||
| Return of Capital or Other Capital Source(s) |
$ | 0.0000 | 0.0 | % | $ | 0.0000 | 0.0 | % | ||||||||
| Total per common share |
$ | 0.1373 | 100.0 | % | $ | 0.9662 | 100.0 | % | ||||||||
| 1 | The Fund’s fiscal year is January 1, 2021 to December 31, 2021 |
IMPORTANT DISCLOSURE: You should not draw any conclusions about the Fund’s investment performance from the amount of this distribution or from the terms of the Fund’s Plan. The Fund estimates that it has distributed more than its income and net realized capital gains; therefore, a portion of your distribution may be a return of capital. A return of capital may occur for example, when some or all of the money that you invested in the Fund is paid back to you. A return of capital distribution does not necessarily reflect the Fund’s investment performance and should not be confused with ‘yield’ or ‘income.’ The amounts and sources of distributions reported in this Notice are only estimates and are not being provided for tax reporting purposes. The actual amounts and sources of the amounts for accounting and/or tax reporting purposes will depend upon the Fund’s investment experience during the remainder of its fiscal year and may be subject to changes based on tax regulations. The Fund will send you a Form 1099-DIV for the calendar year that will tell you how to report these distributions for federal income tax purposes.
Set forth in the table below is information relating to the Fund’s performance based on its net asset value (NAV) for certain periods.
| Average annual total return at NAV for the 5-year period ended on August 31, 20211 |
18.87 | % | ||
| Annualized current distribution rate expressed as a percentage of NAV as of August 31, 20212 |
6.84 | % | ||
| Cumulative total return at NAV for the fiscal year through August 31, 20213 |
17.82 | % | ||
| Cumulative fiscal year to date distribution rate as a percentage of NAV as of August 31, 20214 |
3.44 | % |
| 1 | Average annual total return at NAV represents the change in NAV of the Fund, with all distributions reinvested, for the 5-year period ended on August 31, 2021. |
| 2 | The annualized current distribution rate is the cumulative distribution rate annualized as a percentage of the Fund’s NAV as of August 31, 2021. |
| 3 | Cumulative total return at NAV is the percentage change in the Fund’s NAV for the period from the beginning of its fiscal year to August 31, 2021 including distributions paid and assuming reinvestment of those distributions. |
| 4 | Cumulative fiscal year distribution rate for the period from the beginning of its fiscal year to August 31, 2021 measured on the dollar value of distributions in the year-to-date period as a percentage of the Fund’s NAV as of August 31, 2021. |
If you have any questions regarding this information, please contact your investment advisor or an Eaton Vance Investor Services associate at 1-866-328-6681. Our associates are available to assist you Monday-Friday 8:30 a.m. to 5:30 p.m., Eastern Time.
NOTE: This correspondence is for informational purposes only and should not be relied upon to project the tax character of actual Fund distributions for the 2021 calendar year.
NO ACTION IS REQUIRED ON YOUR PART.
Eaton Vance Enhanced Equity Income Fund II
September 30, 2021
Dear Eaton Vance Fund Shareholder:
This notice provides shareholders of the Eaton Vance Enhanced Equity Income Fund II (NYSE: EOS) with important information concerning the distribution declared in October 2021. You are receiving this notice as a requirement of the Fund’s managed distribution plan (Plan). The Board of Trustees approved the implementation of the Plan to make monthly cash distributions to common shareholders, stated in terms of a fixed amount per common share. This information is sent to you for informational purposes only and is an estimate of the sources of the October distribution. It is not determinative of the tax character of the Fund’s distributions for the 2021 calendar year.
The amounts and sources of distributions reported in this notice are estimates, are not being provided for tax reporting purposes and the distribution may later be determined to be from other sources including realized short-term gains, long-term gains, to the extent permitted by law, and return of capital. The actual amounts and sources for tax reporting purposes will depend upon the Fund’s investment experience during the remainder of its fiscal year and may be subject to changes based on tax regulations. The Fund will send you a Form 1099-DIV for the calendar year that will tell you how to report these distributions for federal income tax purposes.
Distribution Period: October 2021
Distribution Amount per Common Share: $0.1373
The following table sets forth an estimate of the sources of the Fund’s October distribution and its cumulative distributions paid this fiscal year to date. Amounts are expressed on a per common share basis and as a percentage of the distribution amount.
Eaton Vance Enhanced Equity Income Fund II
| Source |
Current Distribution |
% of Current Distribution |
Cumulative Distributions for the Fiscal Year-to-Date1 |
% of the Cumulative Distributions for the Fiscal Year-to-Date1 |
||||||||||||
| Net Investment Income |
$ | 0.0000 | 0.0 | % | $ | 0.0000 | 0.0 | % | ||||||||
| Net Realized Short-Term Capital Gains |
$ | 0.0000 | 0.0 | % | $ | 0.0000 | 0.0 | % | ||||||||
| Net Realized Long-Term Capital Gains |
$ | 0.1373 | 100.0 | % | $ | 1.1035 | 100.0 | % | ||||||||
| Return of Capital or Other Capital Source(s) |
$ | 0.0000 | 0.0 | % | $ | 0.0000 | 0.0 | % | ||||||||
| Total per common share |
$ | 0.1373 | 100.0 | % | $ | 1.1035 | 100.0 | % | ||||||||
| 1 | The Fund’s fiscal year is January 1, 2021 to December 31, 2021 |
IMPORTANT DISCLOSURE: You should not draw any conclusions about the Fund’s investment performance from the amount of this distribution or from the terms of the Fund’s Plan. The Fund estimates that it has distributed more than its income and net realized capital gains; therefore, a portion of your distribution may be a return of capital. A return of capital may occur for example, when some or all of the money that you invested in the Fund is paid back to you. A return of capital distribution does not necessarily reflect the Fund’s investment performance and should not be confused with ‘yield’ or ‘income.’ The amounts and sources of distributions reported in this Notice are only estimates and are not being provided for tax reporting purposes. The actual amounts and sources of the amounts for accounting and/or tax reporting purposes will depend upon the Fund’s investment experience during the remainder of its fiscal year and may be subject to changes based on tax regulations. The Fund will send you a Form 1099-DIV for the calendar year that will tell you how to report these distributions for federal income tax purposes.
Set forth in the table below is information relating to the Fund’s performance based on its net asset value (NAV) for certain periods.
| Average annual total return at NAV for the 5-year period ended on September 30, 20211 |
17.39 | % | ||
| Annualized current distribution rate expressed as a percentage of NAV as of September 30, 20212 |
7.31 | % | ||
| Cumulative total return at NAV for the fiscal year through September 30, 20213 |
10.96 | % | ||
| Cumulative fiscal year to date distribution rate as a percentage of NAV as of September 30, 20214 |
4.29 | % |
| 1 | Average annual total return at NAV represents the change in NAV of the Fund, with all distributions reinvested, for the 5-year period ended on September 30, 2021. |
| 2 | The annualized current distribution rate is the cumulative distribution rate annualized as a percentage of the Fund’s NAV as of September 30, 2021. |
| 3 | Cumulative total return at NAV is the percentage change in the Fund’s NAV for the period from the beginning of its fiscal year to September 30, 2021 including distributions paid and assuming reinvestment of those distributions. |
| 4 | Cumulative fiscal year distribution rate for the period from the beginning of its fiscal year to September 30, 2021 measured on the dollar value of distributions in the year-to-date period as a percentage of the Fund’s NAV as of September 30, 2021. |
If you have any questions regarding this information, please contact your investment advisor or an Eaton Vance Investor Services associate at 1-866-328-6681. Our associates are available to assist you Monday-Friday 8:30 a.m. to 5:30 p.m., Eastern Time.
NOTE: This correspondence is for informational purposes only and should not be relied upon to project the tax character of actual Fund distributions for the 2021 calendar year.
NO ACTION IS REQUIRED ON YOUR PART.
Eaton Vance Enhanced Equity Income Fund II
October 29, 2021
Dear Eaton Vance Fund Shareholder:
This notice provides shareholders of the Eaton Vance Enhanced Equity Income Fund II (NYSE: EOS) with important information concerning the distribution declared in November 2021. You are receiving this notice as a requirement of the Fund’s managed distribution plan (Plan). The Board of Trustees approved the implementation of the Plan to make monthly cash distributions to common shareholders, stated in terms of a fixed amount per common share. This information is sent to you for informational purposes only and is an estimate of the sources of the November distribution. It is not determinative of the tax character of the Fund’s distributions for the 2021 calendar year.
The amounts and sources of distributions reported in this notice are estimates, are not being provided for tax reporting purposes and the distribution may later be determined to be from other sources including realized short-term gains, long-term gains, to the extent permitted by law, and return of capital. The actual amounts and sources for tax reporting purposes will depend upon the Fund’s investment experience during the remainder of its fiscal year and may be subject to changes based on tax regulations. The Fund will send you a Form 1099-DIV for the calendar year that will tell you how to report these distributions for federal income tax purposes.
Distribution Period: November 2021
Distribution Amount per Common Share: $0.1373
The following table sets forth an estimate of the sources of the Fund’s November distribution and its cumulative distributions paid this fiscal year to date. Amounts are expressed on a per common share basis and as a percentage of the distribution amount.
Eaton Vance Enhanced Equity Income Fund II
| Source |
Current Distribution |
% of Current Distribution |
Cumulative Distributions for the Fiscal Year-to-Date1 |
% of the Cumulative Distributions for the Fiscal Year-to-Date1 |
||||||||||||
| Net Investment Income |
$ | 0.0000 | 0.0 | % | $ | 0.0000 | 0.0 | % | ||||||||
| Net Realized Short-Term Capital Gains |
$ | 0.0000 | 0.0 | % | $ | 0.0000 | 0.0 | % | ||||||||
| Net Realized Long-Term Capital Gains |
$ | 0.0000 | 0.0 | % | $ | 0.8748 | 70.5 | % | ||||||||
| Return of Capital or Other Capital Source(s) |
$ | 0.1373 | 100.0 | % | $ | 0.3660 | 29.5 | % | ||||||||
| Total per common share |
$ | 0.1373 | 100.0 | % | $ | 1.2408 | 100.0 | % | ||||||||
| 1 | The Fund’s fiscal year is January 1, 2021 to December 31, 2021 |
IMPORTANT DISCLOSURE: You should not draw any conclusions about the Fund’s investment performance from the amount of this distribution or from the terms of the Fund’s Plan. The Fund estimates that it has distributed more than its income and net realized capital gains; therefore, a portion of your distribution may be a return of capital. A return of capital may occur for example, when some or all of the money that you invested in the Fund is paid back to you. A return of capital distribution does not necessarily reflect the Fund’s investment performance and should not be confused with ‘yield’ or ‘income.’ The amounts and sources of distributions reported in this Notice are only estimates and are not being provided for tax reporting purposes. The actual amounts and sources of the amounts for accounting and/or tax reporting purposes will depend upon the Fund’s investment experience during the remainder of its fiscal year and may be subject to changes based on tax regulations. The Fund will send you a Form 1099-DIV for the calendar year that will tell you how to report these distributions for federal income tax purposes.
Set forth in the table below is information relating to the Fund’s performance based on its net asset value (NAV) for certain periods.
| Average annual total return at NAV for the 5-year period ended on October 31, 20211 |
19.11 | % | ||
| Annualized current distribution rate expressed as a percentage of NAV as of October 31, 20212 |
6.98 | % | ||
| Cumulative total return at NAV for the fiscal year through October 31, 20213 |
16.80 | % | ||
| Cumulative fiscal year to date distribution rate as a percentage of NAV as of October 31, 20214 |
4.68 | % |
| 1 | Average annual total return at NAV represents the change in NAV of the Fund, with all distributions reinvested, for the 5-year period ended on October 31, 2021. |
| 2 | The annualized current distribution rate is the cumulative distribution rate annualized as a percentage of the Fund’s NAV as of October 31, 2021. |
| 3 | Cumulative total return at NAV is the percentage change in the Fund’s NAV for the period from the beginning of its fiscal year to October 31, 2021 including distributions paid and assuming reinvestment of those distributions. |
| 4 | Cumulative fiscal year distribution rate for the period from the beginning of its fiscal year to October 31, 2021 measured on the dollar value of distributions in the year-to-date period as a percentage of the Fund’s NAV as of October 31, 2021. |
If you have any questions regarding this information, please contact your investment advisor or an Eaton Vance Investor Services associate at 1-866-328-6681. Our associates are available to assist you Monday-Friday 8:30 a.m. to 5:30 p.m., Eastern Time.
NOTE: This correspondence is for informational purposes only and should not be relied upon to project the tax character of actual Fund distributions for the 2021 calendar year.
NO ACTION IS REQUIRED ON YOUR PART.
Eaton Vance Enhanced Equity Income Fund II
November 30, 2021
Dear Eaton Vance Fund Shareholder:
This notice provides shareholders of the Eaton Vance Enhanced Equity Income Fund II (NYSE: EOS) with important information concerning the distribution declared in December 2021. You are receiving this notice as a requirement of the Fund’s managed distribution plan (Plan). The Board of Trustees approved the implementation of the Plan to make monthly cash distributions to common shareholders, stated in terms of a fixed amount per common share. This information is sent to you for informational purposes only and is an estimate of the sources of the December distribution. It is not determinative of the tax character of the Fund’s distributions for the 2021 calendar year.
The amounts and sources of distributions reported in this notice are estimates, are not being provided for tax reporting purposes and the distribution may later be determined to be from other sources including realized short-term gains, long-term gains, to the extent permitted by law, and return of capital. The actual amounts and sources for tax reporting purposes will depend upon the Fund’s investment experience during the remainder of its fiscal year and may be subject to changes based on tax regulations. The Fund will send you a Form 1099-DIV for the calendar year that will tell you how to report these distributions for federal income tax purposes.
Distribution Period: December 2021
Distribution Amount per Common Share: $0.1373
The following table sets forth an estimate of the sources of the Fund’s December distribution and its cumulative distributions paid this fiscal year to date. Amounts are expressed on a per common share basis and as a percentage of the distribution amount.
| Eaton Vance Enhanced Equity Income Fund II
|
||||||||||||||||
| Source |
Current Distribution |
% of Current Distribution |
Cumulative Distributions for the Fiscal Year-to-Date1 |
% of the Cumulative Distributions for the Fiscal Year-to-Date1 |
||||||||||||
| Net Investment Income |
$ | 0.0000 | 0.0 | % | $ | 0.0000 | 0.0 | % | ||||||||
| Net Realized Short-Term Capital Gains |
$ | 0.0000 | 0.0 | % | $ | 0.0000 | 0.0 | % | ||||||||
| Net Realized Long-Term Capital Gains |
$ | 0.1373 | 100.0 | % | $ | 1.2417 | 90.1 | % | ||||||||
| Return of Capital or Other Capital Source(s) |
$ | 0.0000 | 0.0 | % | $ | 0.1364 | 9.9 | % | ||||||||
| Total per common share |
$ | 0.1373 | 100.0 | % | $ | 1.3781 | 100.0 | % | ||||||||
| 1 | The Fund’s fiscal year is January 1, 2021 to December 31, 2021 |
IMPORTANT DISCLOSURE: You should not draw any conclusions about the Fund’s investment performance from the amount of this distribution or from the terms of the Fund’s Plan. The Fund estimates that it has distributed more than its income and net realized capital gains; therefore, a portion of your distribution may be a return of capital. A return of capital may occur for example, when some or all of the money that you invested in the Fund is paid back to you. A return of capital distribution does not necessarily reflect the Fund’s investment performance and should not be confused with ‘yield’ or ‘income.’ The amounts and sources of distributions reported in this Notice are only estimates and are not being provided for tax reporting purposes. The actual amounts and sources of the amounts for accounting and/or tax reporting purposes will depend upon the Fund’s investment experience during the remainder of its fiscal year and may be subject to changes based on tax regulations. The Fund will send you a Form 1099-DIV for the calendar year that will tell you how to report these distributions for federal income tax purposes.
Set forth in the table below is information relating to the Fund’s performance based on its net asset value (NAV) for certain periods.
| Average annual total return at NAV for the 5-year period ended on November 30, 20211 |
18.77 | % | ||
| Annualized current distribution rate expressed as a percentage of NAV as of November 30, 20212 |
7.09 | % | ||
| Cumulative total return at NAV for the fiscal year through November 30, 20213 |
15.75 | % | ||
| Cumulative fiscal year to date distribution rate as a percentage of NAV as of November 30, 20214 |
5.34 | % |
| 1 | Average annual total return at NAV represents the change in NAV of the Fund, with all distributions reinvested, for the 5-year period ended on November 30, 2021. |
| 2 | The annualized current distribution rate is the cumulative distribution rate annualized as a percentage of the Fund’s NAV as of November 30, 2021. |
| 3 | Cumulative total return at NAV is the percentage change in the Fund’s NAV for the period from the beginning of its fiscal year to November 30, 2021 including distributions paid and assuming reinvestment of those distributions. |
| 4 | Cumulative fiscal year distribution rate for the period from the beginning of its fiscal year to November 30, 2021 measured on the dollar value of distributions in the year-to-date period as a percentage of the Fund’s NAV as of November 30, 2021. |
If you have any questions regarding this information, please contact your investment advisor or an Eaton Vance Investor Services associate at 1-866-328-6681. Our associates are available to assist you Monday-Friday 8:30 a.m. to 5:30 p.m., Eastern Time.
NOTE: This correspondence is for informational purposes only and should not be relied upon to project the tax character of actual Fund distributions for the 2021 calendar year.
NO ACTION IS REQUIRED ON YOUR PART.
Eaton Vance Enhanced Equity Income Fund II
December 31, 2021
Serious News for Serious Traders! Try StreetInsider.com Premium Free!
You May Also Be Interested In
- Genenta-backed Sòphia High Tech Brings Aerospace Precision Inside a Nuclear Fusion Reactor with ROMAN, a Robotic Arm
- Evotec Selects Navan to Unify Global Travel, Payments, and Expense Management
- OP Mortgage Bank plc: Half-year Financial Report for 1 January–30 June 2026
Create E-mail Alert Related Categories
SEC FilingsSign up for StreetInsider Free!
Receive full access to all new and archived articles, unlimited portfolio tracking, e-mail alerts, custom newswires and RSS feeds - and more!