



Form 8-K XO GROUP INC. For: Nov 03
 Tweet
Tweet Share
Share E-mail
UNITED STATES
SECURITIES AND EXCHANGE COMMISSION
WASHINGTON, D.C. 20549
_____________________
FORM 8-K
CURRENT REPORT
Pursuant to Section 13 or 15(d) of the Securities Exchange Act of 1934
Date of Report (Date of earliest event reported): November 3, 2015
XO Group Inc.
(Exact Name of Registrant as Specified in its Charter)
| Delaware | 001-35217 | 13-3895178 |
| (State or other Jurisdiction of Incorporation) |
(Commission File Number) | (I.R.S. Employer Identification No.) |
|
195 Broadway, 25th Floor New York, New York |
10007 |
| (Address of Principal Executive Offices) | (Zip Code) |
| Registrant’s telephone number, including area code: (212) 219-8555 |
| _____________________ (Former name or former address, if changed since last report) |
_____________________
Check the appropriate box below if the Form 8-K filing is intended to simultaneously satisfy the filing obligation of the registrant under any of the following provisions:
| ¨ | Written communications pursuant to Rule 425 under the Securities Act (17 CFR 230.425) |
| ¨ | Soliciting material pursuant to Rule 14a-12 under the Exchange Act (17 CFR 240.14a-12) |
| ¨ | Pre-commencement communications pursuant to Rule 14d-2(b) under the Exchange Act (17 CFR 240.14d-2(b)) |
| ¨ | Pre-commencement communications pursuant to Rule 13e-4(c) under the Exchange Act (17 CFR 240.13e-4(c)) |
| Item 2.02. | Results of Operations and Financial Condition. |
On November 3, 2015, XO Group Inc. (the “Company”) issued a press release announcing its financial results as of and for the quarter ended September 30, 2015. A copy of the Company’s press release announcing these financial results is attached as Exhibit 99.1 hereto, and is incorporated by reference into this report. The information included in this Current Report on Form 8-K (including Exhibit 99.1 hereto) that is furnished pursuant to this Item 2.02 shall not be deemed to be “filed” for the purposes of Section 18 of the Securities Exchange Act of 1934, as amended, or otherwise subject to the liabilities of that Section or Sections 11 and 12(a)(2) of the Securities Act of 1933, as amended. The information contained in this Item and in the accompanying Exhibit 99.1 shall not be incorporated by reference into any filing of the Company, whether made before or after the date hereof, regardless of any general incorporation language in such filing, unless expressly incorporated by specific reference into such filing.
| Item 7.01 | Regulation FD Disclosure. |
On November 3, 2015, during the course of the teleconference that the Company will be holding, management will make reference to a financial presentation. The presentation will be available on the Company’s website at http://ir.xogroupinc.com and is filed herewith as Exhibit 99.2.
The information included in this Current Report on Form 8-K (including Exhibit 99.2 hereto) that is furnished pursuant to this Item 7.01 shall not be deemed to be “filed” for the purposes of Section 18 of the Securities Exchange Act of 1934, as amended, or otherwise subject to the liabilities of that Section or Sections 11 and 12(a) (2) of the Securities Act of 1933, as amended. The information contained in this Item and in the accompanying Exhibit 99.2 shall not be incorporated by reference into any filing of the Company, whether made before or after the date hereof, regardless of any general incorporation language in such filing, unless expressly incorporated by specific reference into such filing.
By furnishing the information in this Item 7.01, the Company makes no admission as to the materiality of Item 7.01 in this report or the presentation attached hereto as Exhibit 99.2. The information contained in the presentation is summary information that is intended to be considered in the context of the Company’s filings with the United States Securities and Exchange Commission (the “SEC”) and other public announcements that the Company makes, by press release or otherwise, from time to time. The Company undertakes no duty or obligation to publicly update or revise the information contained in this Item, although it may do so from time to time as its management believes is appropriate. Any such updating may be made through the filing of other reports or documents with the SEC, through press releases or through other public disclosure.
The Company cautions readers that the presentation attached hereto as Exhibit 99.2 contains forward-looking statements within the meaning of the Private Securities Litigation Reform Act of 1995. Readers are cautioned not to place undue reliance on these forward-looking statements as actual events or results could differ materially from the forward-looking statements contained in the presentation. Readers are urged to read the reports and documents filed from time to time by the Company with the SEC for a discussion of important risk factors that could cause actual results to differ materially from those discussed in the forward-looking statements. It is routine for the Company’s internal projections and expectations to change as the quarter and year progress, and therefore it should be clearly understood that the internal projections and beliefs upon which the Company bases its expectations may change. Although these expectations may change, the Company is under no obligation to inform the readers if they do or to update the presentation that is attached hereto as Exhibit 99.2.
| Item 9.01. | Financial Statements and Exhibits. |
| (d) | Exhibits. The following documents are included as exhibits to this report: |
| 99.1 | Press Release dated November 3, 2015. |
| 99.2 | Investor Presentation by XO Group Inc. |
SIGNATURE
Pursuant to the requirements of the Securities Exchange Act of 1934, the registrant has duly caused this report to be signed on its behalf by the undersigned hereunto duly authorized.
|
XO GROUP INC. (Registrant) |
| Date: November 3, 2015 | By: | /s/ GILLIAN MUNSON | |
| Gillian Munson | |||
| Chief Financial Officer |
EXHIBIT INDEX
| 99.1 | Press Release dated November 3, 2015. |
| 99.2 | Investor Presentation by XO Group Inc. |
Exhibit 99.1

XO Group Reports Third Quarter 2015 Financial Results
- Third quarter earnings per diluted share were $0.11
- Total revenue excluding merchandise operations increased 10.6% year-over-year
- Conference Call Tuesday, November 3rd, at 4:30 p.m. ET, Dial-In (877) 201-0168 (ID# 44930458)
NEW YORK, Nov. 3, 2015 /PRNewswire/ -- XO Group Inc. (the "Company") (NYSE: XOXO, xogroupinc.com), the premier consumer internet and media company dedicated to guiding people through transformative life stages - from getting married, moving in together and having a baby - today reported financial results for the three months ended September 30, 2015.
Total revenue for the third quarter of 2015 was $34.7 million, down 3.2% compared to the same period in the prior year. Excluding revenue from the Merchandise operations, a business that was exited during the first quarter of 2015, third quarter revenue increased 10.6% compared to the prior year. Net income for the quarter was $2.9 million or $0.11 per diluted share compared to earnings per share of $0.08 in the prior year quarter. The Company's balance sheet at September 30, 2015 reflects cash and cash equivalents of $86.3 million compared to $85.6 million at June 30, 2015 and $90.0 million at December 31, 2014. During the third quarter of 2015, the Company made investments in the amount of $2.5 million.
"The team delivered strong quarterly results for our online advertising and transactional businesses, while continuing to execute opportunities that will unlock value for our couples, local wedding professionals, advertising partners and shareholders," said Mike Steib, Chief Executive Officer. "I am also excited to welcome GigMasters to the XO Group family."
"During the quarter, we continued to make progress on our investment goals, while managing to a responsible profitability level. These results are encouraging as we continue to invest in our company in order to drive long-term shareholder value," said Gillian Munson, Chief Financial Officer.
Long-Term Financial Targets
The Company is reiterating its long-term financial targets of double digit revenue growth rates, gross margins of approximately 90-95%, and operating expense growth below revenue growth rates, yielding adjusted EBITDA margins of at least 20%. The Company is also reiterating that is does not expect to meet these targets in 2015.
| XO GROUP INC. |
| CONDENSED CONSOLIDATED STATEMENTS OF OPERATIONS |
| (Amounts in Thousands, Except for Per Share Data) |
| (Unaudited) |
| Three Months Ended September 30, | Nine Months Ended September 30, | |||||||||||||||
| 2015 | 2014 | 2015 | 2014 | |||||||||||||
| Net revenue: | ||||||||||||||||
| National online advertising | $ | 8,669 | $ | 7,326 | $ | 25,219 | $ | 21,777 | ||||||||
| Local online advertising | 16,369 | 14,796 | 48,460 | 43,745 | ||||||||||||
| Online advertising | 25,038 | 22,122 | 73,679 | 65,522 | ||||||||||||
| Registry and commerce | 4,809 | 3,430 | 11,266 | 8,387 | ||||||||||||
| Merchandise | - | 4,473 | 878 | 12,902 | ||||||||||||
| Publishing and other | 4,859 | 5,833 | 17,675 | 19,797 | ||||||||||||
| Total net revenue | 34,706 | 35,858 | 103,498 | 106,608 | ||||||||||||
| Cost of revenue: | ||||||||||||||||
| Online advertising | 683 | 365 | 1,588 | 1,337 | ||||||||||||
| Merchandise | - | 2,833 | 881 | 8,106 | ||||||||||||
| Publishing and other | 1,367 | 1,663 | 5,082 | 5,920 | ||||||||||||
| Total cost of revenue | 2,050 | 4,861 | 7,551 | 15,363 | ||||||||||||
| Gross profit | 32,656 | 30,997 | 95,947 | 91,245 | ||||||||||||
| Operating expenses: | ||||||||||||||||
| Product and content development | 9,901 | 8,569 | 29,300 | 26,274 | ||||||||||||
| Sales and marketing | 10,679 | 10,842 | 31,683 | 32,606 | ||||||||||||
| General and administrative | 5,955 | 5,389 | 18,116 | 18,778 | ||||||||||||
| Depreciation and amortization | 1,361 | 1,868 | 4,027 | 5,393 | ||||||||||||
| Total operating expenses | 27,896 | 26,668 | 83,126 | 83,051 | ||||||||||||
| Income from operations | 4,760 | 4,329 | 12,821 | 8,194 | ||||||||||||
| Loss in equity interests | (173 | ) | (68 | ) | (209 | ) | (243 | ) | ||||||||
| Interest and other (expense) income, net | (3 | ) | 57 | (51 | ) | 55 | ||||||||||
| Income before income taxes | 4,584 | 4,318 | 12,561 | 8,006 | ||||||||||||
| Income tax expense | 1,718 | 2,234 | 4,939 | 3,551 | ||||||||||||
| Net income | $ | 2,866 | $ | 2,084 | $ | 7,622 | $ | 4,455 | ||||||||
| Net income per share: | ||||||||||||||||
| Basic | $ | 0.11 | $ | 0.08 | $ | 0.30 | $ | 0.18 | ||||||||
| Diluted | $ | 0.11 | $ | 0.08 | $ | 0.30 | $ | 0.17 | ||||||||
| Weighted average number of shares used in calculating net earnings per share: | ||||||||||||||||
| Basic | 25,136 | 25,351 | 25,161 | 25,159 | ||||||||||||
| Diluted | 25,449 | 25,670 | 25,537 | 25,547 | ||||||||||||
| XO GROUP INC. |
| CONDENSED CONSOLIDATED BALANCE SHEETS |
| (Amounts in Thousands, Except for Per Share Data) |
| (Unaudited) |
| September 30, 2015 | December 31, 2014 | |||||||
| ASSETS | ||||||||
| Current assets: | ||||||||
| Cash and cash equivalents | $ | 86,318 | $ | 89,955 | ||||
| Accounts receivable, net | 20,084 | 15,785 | ||||||
| Deferred tax assets, net | 3,052 | 3,052 | ||||||
| Prepaid expenses and other current assets | 3,807 | 4,696 | ||||||
| Total current assets | 113,261 | 113,488 | ||||||
| Long-term restricted cash | 2,599 | 2,600 | ||||||
| Property and equipment, net | 13,791 | 15,125 | ||||||
| Goodwill and intangibles, net | 43,435 | 43,558 | ||||||
| Deferred tax assets, net | 12,123 | 13,110 | ||||||
| Investments | 7,792 | 5,501 | ||||||
| Other assets | 73 | 200 | ||||||
| Total assets | $ | 193,074 | $ | 193,582 | ||||
| LIABILITIES AND STOCKHOLDERS' EQUITY | ||||||||
| Current liabilities: | ||||||||
| Accounts payable and accrued expenses | $ | 11,618 | $ | 12,463 | ||||
| Deferred revenue | 15,319 | 16,236 | ||||||
| Total current liabilities | 26,937 | 28,699 | ||||||
| Deferred rent | 4,674 | 5,167 | ||||||
| Other liabilities | 1,218 | 1,790 | ||||||
| Total liabilities | 32,829 | 35,656 | ||||||
| Stockholders' equity: | ||||||||
| Preferred stock | ||||||||
| Common stock | 264 | 267 | ||||||
| Additional paid-in-capital | 172,184 | 171,951 | ||||||
| Accumulated other comprehensive income | - | 35 | ||||||
| Accumulated deficit | (12,203 | ) | (14,327 | ) | ||||
| Total stockholders' equity | 160,245 | 157,926 | ||||||
| Total liabilities and stockholders' equity | $ | 193,074 | $ | 193,582 | ||||
| XO GROUP INC. |
| RECONCILIATION OF GAAP TO NON-GAAP FINANCIAL MEASURES |
| (Amounts in Thousands, Except for Per Share Data) |
| (Unaudited) |
| Three Months Ended September 30, | Nine Months Ended September 30, | |||||||||||||||
| 2015 | 2014 | 2015 | 2014 | |||||||||||||
| Net income | $ | 2,866 | $ | 2,084 | $ | 7,622 | $ | 4,455 | ||||||||
| Income tax expense | 1,718 | 2,234 | 4,939 | 3,551 | ||||||||||||
| Depreciation and amortization | 1,361 | 1,868 | 4,027 | 5,393 | ||||||||||||
| Stock-based compensation expense | 1,135 | 1,449 | 4,252 | 4,447 | ||||||||||||
| Exit of merchandise operations(a) | - | - | 434 | - | ||||||||||||
| Interest and other expense | ||||||||||||||||
| (income), net | 3 | (57 | ) | 51 | (55 | ) | ||||||||||
| Loss in equity interests | 173 | 68 | 209 | 243 | ||||||||||||
| Severance charges(b) | - | - | - | 1,354 | ||||||||||||
| Foreign VAT, interest and penalties(c) | - | (592 | ) | - | (592 | ) | ||||||||||
| Adjusted EBITDA | $ | 7,256 | $ | 7,054 | $ | 21,534 | $ | 18,796 | ||||||||
| Depreciation and amortization | (1,361 | ) | (1,868 | ) | (4,027 | ) | (5,393 | ) | ||||||||
| Stock-based compensation expense | (1,135 | ) | (1,449 | ) | (4,252 | ) | (4,447 | ) | ||||||||
| Loss in equity interests | (173 | ) | (68 | ) | (209 | ) | (243 | ) | ||||||||
| Interest and other (expense) income, net | (3 | ) | 57 | (51 | ) | 55 | ||||||||||
| Adjusted income before income taxes | 4,584 | 3,726 | 12,995 | 8,768 | ||||||||||||
| Adjusted income tax expense(d) | 1,718 | 1,423 | 5,110 | 3,349 | ||||||||||||
| Adjusted net income | $ | 2,866 | $ | 2,303 | $ | 7,885 | $ | 5,419 | ||||||||
| Adjusted net income per share, diluted | $ | 0.11 | $ | 0.09 | $ | 0.31 | $ | 0.21 | ||||||||
| Diluted weighted average number of shared outstanding | 25,449 | 25,670 | 25,537 | 25,547 | ||||||||||||
| Net cash provided by operating activities | $ | 4,114 | $ | 7,675 | $ | 11,559 | $ | 11,553 | ||||||||
| Less: capital expenditures | (741 | ) | (1,329 | ) | (2,777 | ) | (3,973 | ) | ||||||||
| Free cash flow | $ | 3,373 | $ | 6,346 | $ | 8,782 | $ | 7,580 | ||||||||
| (a) | Costs impacting comparability included in operating expenses in the condensed consolidated statements of operations for the year ended September 30, 2015 included costs related to the closure of our merchandise operations in Redding, CA of (i) severance of approximately $0.2 million recorded in general and administrative and (ii) rent acceleration and other closure costs of $0.2 million recorded in sales and marketing. |
| (b) | Costs impacting comparability included in operating expenses in the condensed consolidated statements of operations for the year ended September 30, 2014 include severance of approximately $1.4 million, representing (i) severance charges for certain executive officers and (ii) severance charges for the employees in our Los Angeles office ($0.1 million in product and content development, $0.5 million in sales and marketing and $0.8 million in general and administrative). |
| (c) | Included in general and administrative expenses on the condensed consolidated statements of operations for the three and nine months ended September 30, 2014 include a favorable adjustment for foreign value-added tax ("VAT"), interest and penalties of $0.6 million. |
| (d) | Adjusted income tax expense was calculated using the annual effective tax rate of 37.5% and 38.2% for three months ended September 30, 2015 and 2014, respectively, and 39.3% and 38.2% for the nine months ended September 30, 2015 and 2014, respectively. |
XO GROUP INC.
SUPPLEMENTAL DATA TABLES (UNAUDITED)
Local advertising metrics (excluding Two Bright Lights)
| Q3 2015 | Q3 2014 | |
| Vendor Count | 25,034 | 24,304 |
| Retention Rate(a) | 75% | 77% |
| Avg. Revenue/Vendor(b) | $2,582 | $2,517 |
| (a) Calculated on a trailing twelve-month basis. Previously disclosed as churn rate. Retention rate calculated as one less churn rate. |
| (b) Calculated on a trailing twelve-month basis. |
Stock Based Compensation
The Company included total stock-based compensation expense related to all its stock awards in various operating expense categories
for the three and nine months ended September 30, 2015 and 2014, as follows:
| Three Months Ended September 30, | Nine Months Ended September 30, | |||||||||||||||
| 2015 | 2014 | 2015 | 2014 | |||||||||||||
| (In Thousands) | ||||||||||||||||
| Product and content development | $ | 174 | $ | 382 | $ | 1,271 | $ | 1,451 | ||||||||
| Sales and marketing | 289 | 338 | 1,012 | 1,065 | ||||||||||||
| General and administrative | 672 | 729 | 1,969 | 1,931 | ||||||||||||
| Total stock-based compensation | $ | 1,135 | $ | 1,449 | $ | 4,252 | $ | 4,447 | ||||||||
Conference Call and Replay Information
XO Group Inc. will host a conference call with investors at 4:30 p.m. ET on Tuesday, November 3, 2015, to discuss its third quarter 2015 financial results. Participants should dial (877) 201-0168 and use Conference ID# 44930458 at least 10 minutes before the call is scheduled to begin. Participants can also access the live broadcast over the internet on the Investor Relations section of the Company's website, accessible at http://ir.xogroupinc.com. To access the webcast, participants should visit XO Group's website at least 15 minutes prior to the conference call in order to download or install any necessary audio software.
A replay of the webcast will also be archived on the Company's website approximately two hours after the conference call ends.
About XO Group Inc.
XO Group Inc.'s (NYSE: XOXO; xogroupinc.com) mission is to help people navigate and enjoy life's biggest moments, together. Our family of multi-platform brands guide people through transformative lifestages, from getting married to moving in together and having a baby. Our brands include The Knot, the number one wedding planning resource, The Bump, a leading pregnancy and parenting brand, and The Nest, the hip guide to all things home for new couples. The Company is publicly listed on the New York Stock Exchange and is headquartered in New York City.
Forward Looking Statements
This release may contain projections or other forward-looking statements regarding future events or our future financial performance or estimates regarding third parties. These statements are only estimates or predictions and reflect our current beliefs and expectations. Actual events or results may differ materially from those contained in the estimates, projections or forward-looking statements. It is routine for internal projections and expectations to change as the quarter progresses, and therefore it should be clearly understood that the internal projections and beliefs upon which we base our expectations may change prior to the end of the quarter. Although these expectations may change, we will not necessarily inform you if they do. Our policy is to provide expectations not more than once per quarter, and not to update that information until the next quarter. Some of the factors that could cause actual results to differ materially from the forward-looking statements contained herein include, without limitation, (i) our online wedding-related and other websites, mobile and other digital properties may fail to generate sufficient revenue to survive over the long term, (ii) we incurred losses for many years following our inception and may incur losses in the future, (iii) we may be unable to adjust spending quickly enough to offset any unexpected revenue shortfall, (iv) efforts to launch new or upgrading existing technology and features may not generate significant new revenue or may reduce revenue from existing services, (v) we may be unable to develop solutions that generate revenue from advertising and other services delivered to mobile phones and wireless devices, (vi) the significant fluctuation to which our quarterly revenue and operating results are subject, (vii) the seasonality of the wedding industry, (viii) our operations are dependent on Internet search engine rankings, and our ability to influence those rankings is limited, (ix) the dependence of our registry and commerce services business on third parties, (x) increased competition in our markets could reduce our market share and (xi) other factors detailed in documents we file from time to time with the Securities and Exchange Commission. Forward-looking statements in this release are made pursuant to the safe harbor provisions contained in the Private Securities Litigation Reform Act of 1995.
Non-GAAP Financial Measures
This press release includes information about certain financial measures that are not prepared in accordance with generally accepted accounting principles in the United States ("GAAP" or "U.S. GAAP"), including adjusted EBITDA, adjusted net income, adjusted net income per diluted share and free cash flow. These non-GAAP measures have important limitations as analytical tools and should not be considered in isolation or as substitutes for an analysis of our results as reported under U.S. GAAP. Our use of these terms may vary from the use of similarly-titled measures by others in our industry due to the potential inconsistencies in the method of calculation and differences due to items subject to interpretation.
Management defines its non-GAAP financial measures as follows:
| · | Adjusted EBITDA represents GAAP net income (loss) adjusted to exclude, if applicable: (1) income tax expense, (2) depreciation and amortization, (3) stock-based compensation expense, (4) asset impairment charges, (5) loss in equity interests, (6) interest and other income (expense), net and (7) other items affecting comparability during the period. |
| · | Adjusted net income represents GAAP net income, adjusted for items that impact comparability, which may include: (1) asset impairment charges, (2) executive separation and other severance charges, (3) non-recurring foreign taxes, interest and penalties and (4) costs related to exit activities. |
| · | Adjusted net income per diluted share represents adjusted net income (as defined above), divided by the diluted weighted-average number of shares outstanding for the period. |
| · | Free cash flow represents GAAP net cash provided by operations, less capital expenditures. |
Management believes that these non-GAAP financial measures, when viewed with our results under U.S. GAAP and the accompanying reconciliations, provide useful information about our period-over-period growth and provide additional information that is useful for evaluating our operating performance. However, adjusted EBITDA, adjusted net income, adjusted net income per diluted share and free cash flow are not measures of financial performance under U.S. GAAP and, accordingly, should not be considered substitutes for or superior to net income (loss) and net income (loss) per diluted share and net cash provided by operating activities as indicators of operating performance.
A reconciliation of GAAP to Non-GAAP financial measures is included in this press release.
Contact:
Ivan Marmolejos
Director, Investor Relations
(212) 219-8555 x1004
[email protected]
Exhibit 99.2

Investor Presentation | November 2015
2 © 2015 XO GROUP INC. ALL RIGHTS RESERVED. This presentation may contain projections or other forward - looking statements regarding future events or our future financial performance or estimates regarding third parties . These statements are only estimates or predictions and reflect our current beliefs and expectations . Actual events or results may differ materially from those contained in the estimates, projections or forward - looking statements . It is routine for internal projections and expectations to change as the quarter progresses, and therefore it should be clearly understood that the internal projections and beliefs upon which we base our expectations may change prior to the end of the quarter . Although these expectations may change, we will not necessarily inform you if they do . Our policy is to provide expectations not more than once per quarter, and not to update that information until the next quarter . Some of the factors that could cause actual results to differ materially from the forward - looking statements contained herein include, without limitation, (i) our online wedding - related and other websites, mobile and other digital properties may fail to generate sufficient revenue to survive over the long term, (ii) we incurred losses for many years following our inception and may incur losses in the future, (iii) we may be unable to adjust spending quickly enough to offset any unexpected revenue shortfall, (iv) efforts to launch new or upgrading existing technology and features may not generate significant new revenue or may reduce revenue from existing services, (v) we may be unable to develop solutions that generate revenue from advertising and other services delivered to mobile phones and wireless devices, (vi) the significant fluctuation to which our quarterly revenue and operating results are subject, (vii) the seasonality of the wedding industry, (viii) our operations are dependent on Internet search engine rankings, and our ability to influence those rankings is limited, (ix) the dependence of our registry and commerce services business on third parties, (x) increased competition in our markets could reduce our market share, and (xi) other factors detailed in documents we file from time to time with the Securities and Exchange Commission . Forward - looking statements in this release are made pursuant to the safe harbor provisions contained in the Private Securities Litigation Reform Act of 1995 . This presentation includes certain "Non - GAAP financial information." A reconciliation of such information to the most directly comparable GAAP data can be found at the end of this presentation. Safe Harbor
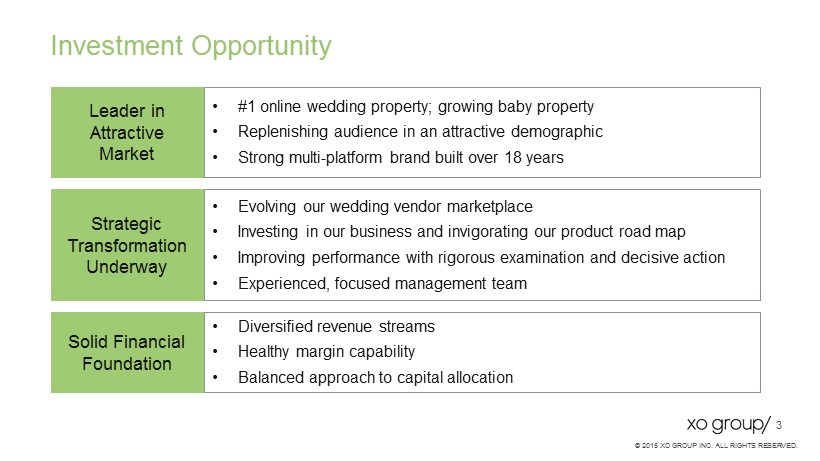
3 © 2015 XO GROUP INC. ALL RIGHTS RESERVED. Leader in Attractive Market • #1 online wedding property; growing baby property • Replenishing audience in an attractive demographic • Strong multi - platform brand built over 18 years Solid Financial Foundation • Diversified revenue streams • Healthy margin capability • Balanced approach to capital allocation Strategic Transformation Underway • Evolving our wedding vendor marketplace • Investing in our business and invigorating our product road map • Improving performance with rigorous examination and decisive action • Experienced, focused management team Investment Opportunity
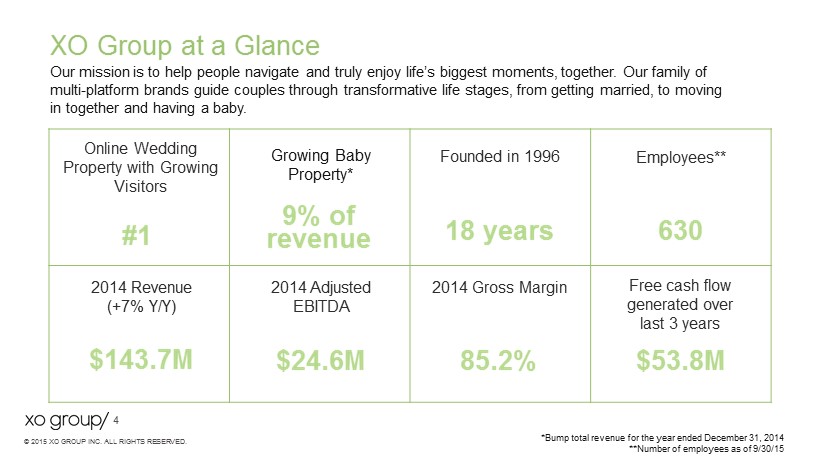
4 © 2015 XO GROUP INC. ALL RIGHTS RESERVED. XO Group at a Glance Our mission is to help people navigate and truly enjoy life’s biggest moments, together. Our family of multi - platform brands guide couples through transformative life stages, from getting married, to moving in together and having a baby. *Bump total revenue for the year ended December 31, 2014 **Number of employees as of 9/30/15 $143.7M $24.6M 630 #1 $53.8M 85.2% 18 years 9% of revenue 2014 Revenue (+7% Y/Y) 2014 Adjusted EBITDA Employees** Online Wedding Property with Growing Visitors Free cash flow generated over last 3 years 2014 Gross Margin Growing Baby Property* Founded in 1996
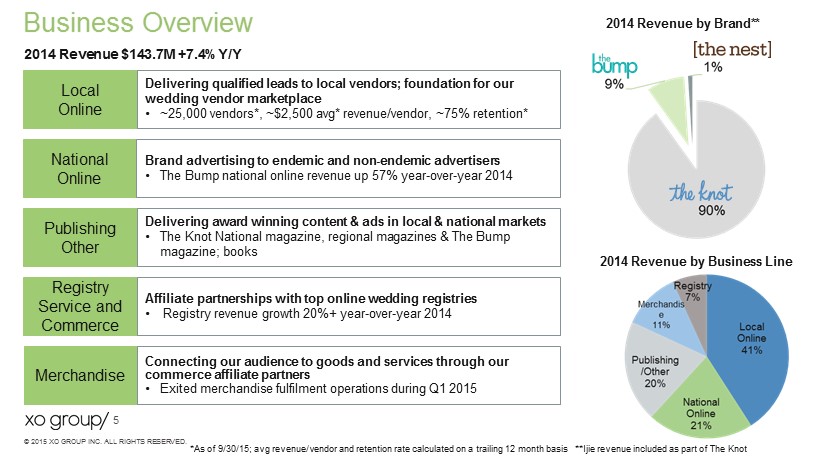
5 © 2015 XO GROUP INC. ALL RIGHTS RESERVED. Business Overview * As of 9/30/15; avg revenue/vendor and retention rate calculated on a trailing 12 month basis **Ijie revenue included as part of The Knot 2014 Revenue by Business Line 2014 Revenue by Brand** 2014 Revenue $143.7M +7.4% Y/Y Local Online Delivering qualified leads to local vendors; foundation for our wedding vendor marketplace • ~25,000 vendors*, ~$2,500 avg * revenue/vendor, ~75% retention* National Online Brand advertising to endemic and non - endemic advertisers • The Bump national online revenue up 57% year - over - year 2014 Publishing Other Delivering award winning content & ads in local & national markets • The Knot National magazine, regional magazines & The Bump magazine; books Registry Service and Commerce Affiliate partnerships with top online wedding registries • Registry revenue growth 20%+ year - over - year 2014 Merchandise Connecting our audience to goods and services through our commerce affiliate partners • Exited merchandise fulfilment operations during Q1 2015
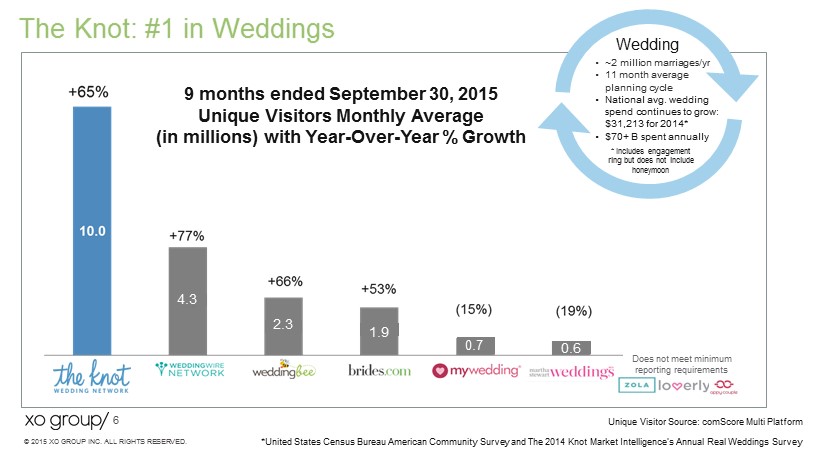
6 © 2015 XO GROUP INC. ALL RIGHTS RESERVED. The Knot: #1 in Weddings 9 months ended September 30, 2015 Unique Visitors Monthly Average (in millions) with Year - Over - Year % Growth *United States Census Bureau American Community Survey and The 2014 Knot Market Intelligence’s Annual Real Weddings Survey Does not meet minimum reporting requirements Unique Visitor Source: comScore Multi Platform • ~2 million marriages/yr • 11 month average planning cycle • National avg. wedding spend continues to grow: $31,213 for 2014* • $70+ B spent annually Wedding * Includes engagement ring but does not include honeymoon 0.7 0.6 1.9 2.3 4.3
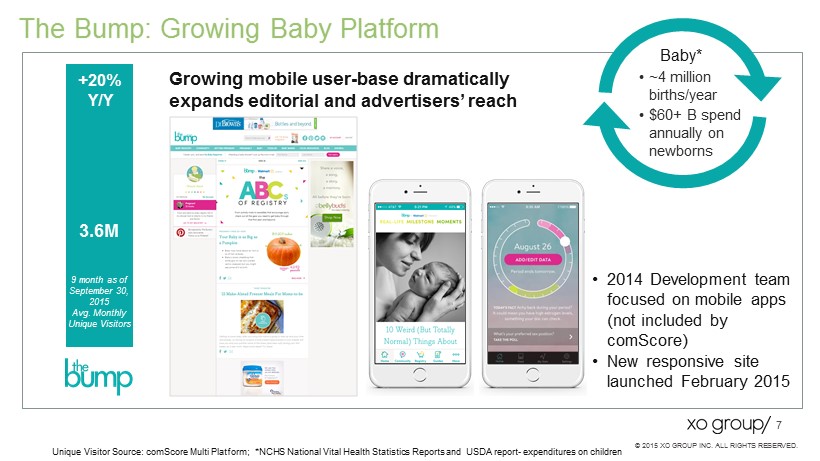
7 © 2015 XO GROUP INC. ALL RIGHTS RESERVED. • ~4 million births/year • $60+ B spend annually on newborns Baby* Growing mobile user - base dramatically expands editorial and advertisers’ reach The Bump: Growing Baby Platform +20% Y/Y 3.6M 9 month as of September 30, 2015 Avg. Monthly Unique Visitors • 2014 Development team focused on mobile apps (not included by comScore) • New responsive site launched February 2015 Unique Visitor Source: comScore Multi Platform; *NCHS National Vital Health Statistics Reports and USDA report - expenditures o n children

8 © 2015 XO GROUP INC. ALL RIGHTS RESERVED. Strategic Transformation to Accelerate Growth
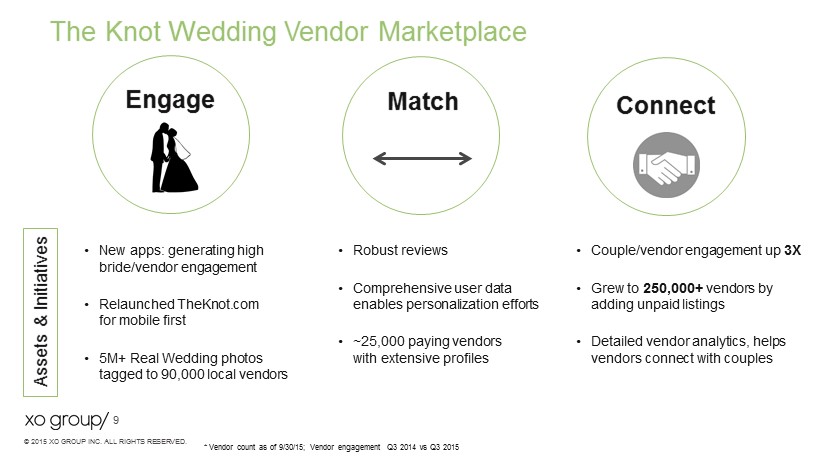
9 © 2015 XO GROUP INC. ALL RIGHTS RESERVED. The Knot Wedding Vendor Marketplace Match Connect * Vendor count as of 9/30/15; Vendor engagement Q3 2014 vs Q3 2015 • New apps: generating high bride/vendor engagement • Relaunched TheKnot.com for mobile first • 5M+ Real Wedding photos tagged to 90,000 local vendors • Robust reviews • Comprehensive user data enables personalization efforts • ~25,000 paying vendors with extensive profiles • Couple/vendor engagement up 3X • Grew to 250,000+ vendors by adding unpaid listings • Detailed vendor analytics, helps vendors connect with couples Assets & Initiatives Engage
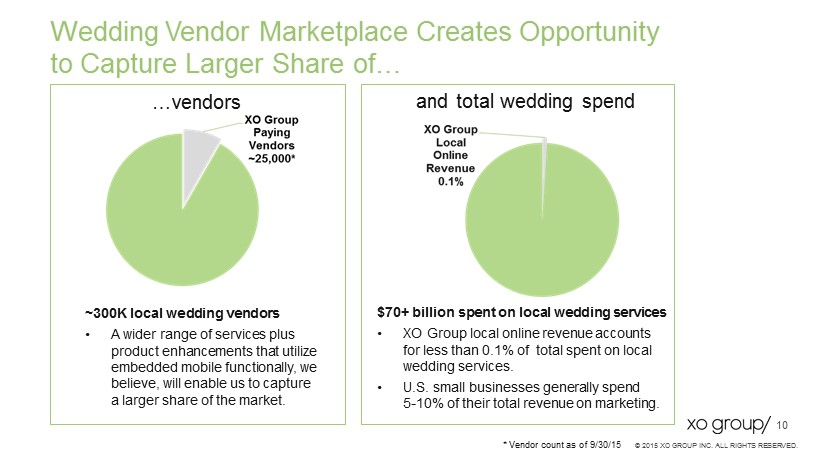
10 © 2015 XO GROUP INC. ALL RIGHTS RESERVED. …vendors and total wedding spend ~300K local wedding vendors • A wider range of services plus product enhancements that utilize embedded mobile functionally, we believe, will enable us to capture a larger share of the market. Wedding Vendor Marketplace Creates Opportunity to Capture Larger Share of… * Vendor count as of 9/30/15 $70+ billion spent on local wedding services • XO Group local online revenue accounts for less than 0.1% of total spent on local wedding services. • U.S. small businesses generally spend 5 - 10% of their total revenue on marketing.
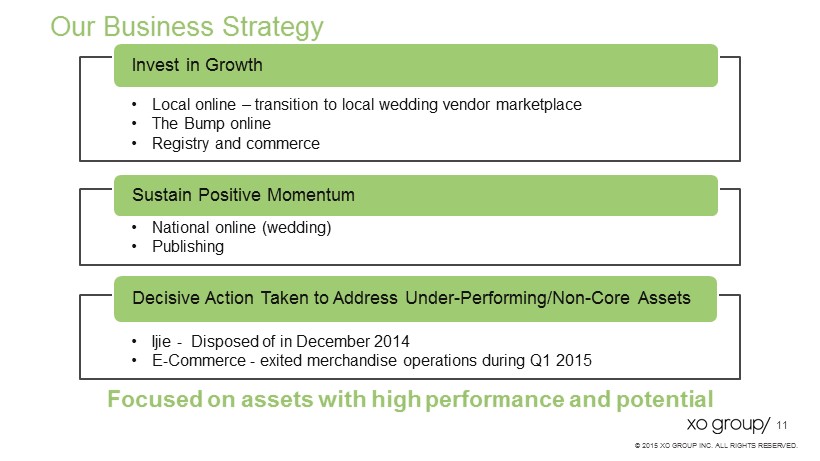
11 © 2015 XO GROUP INC. ALL RIGHTS RESERVED. Focused on assets with high performance and potential • Local online – transition to local wedding vendor marketplace • The Bump online • Registry and commerce Invest in Growth • National online (wedding) • Publishing Sustain Positive Momentum • Ijie - Disposed of in December 2014 • E - Commerce - exited merchandise operations during Q1 2015 Decisive Action Taken to Address Under - Performing/Non - Core Assets Our Business Strategy
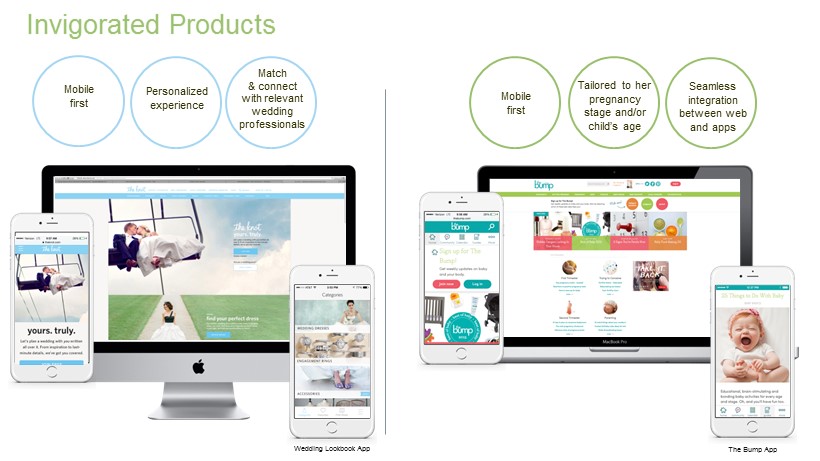
12 © 2015 XO GROUP INC. ALL RIGHTS RESERVED. Invigorated Products The Bump App Wedding Lookbook App Personalized experience Mobile first Match & connect with relevant wedding professionals Tailored to her pregnancy stage and/or child’s age Mobile first Seamless integration between web and apps
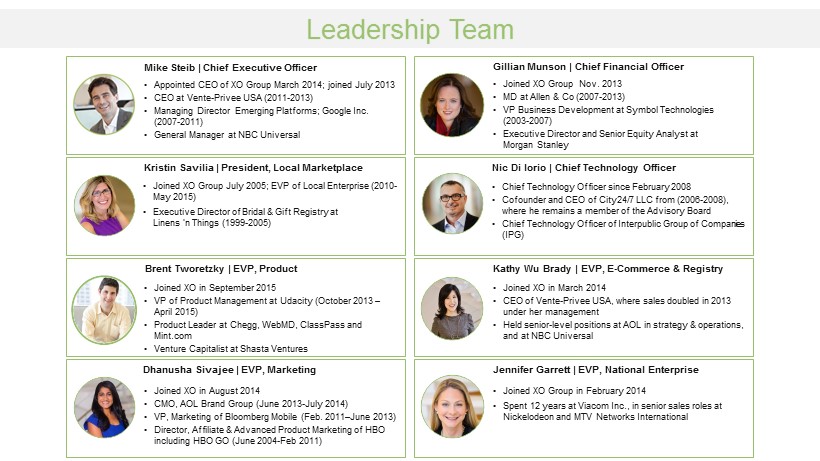
13 © 2015 XO GROUP INC. ALL RIGHTS RESERVED. • Joined XO in September 2015 • VP of Product Management at Udacity (October 2013 – April 2015) • Product Leader at Chegg, WebMD, ClassPass and Mint.com • Venture Capitalist at Shasta Ventures Brent Tworetzky | EVP, Product Nic Di Iorio | Chief Technology Officer • Chief Technology Officer since February 2008 • Cofounder and CEO of City24/7 LLC from (2006 - 2008), where he remains a member of the Advisory Board • Chief Technology Officer of Interpublic Group of Companies (IPG) • Joined XO Group July 2005; EVP of Local Enterprise (2010 - May 2015) • Executive Director of Bridal & Gift Registry at Linens ’n Things (1999 - 2005) Kristin Savilia | President, Local Marketplace Leadership Team Mike Steib | Chief Executive Officer • Appointed CEO of XO Group March 2014; joined July 2013 • CEO at Vente - Privee USA (2011 - 2013) • Managing Director Emerging Platforms; Google Inc. (2007 - 2011) • General Manager at NBC Universal Gillian Munson | Chief Financial Officer • Joined XO Group Nov. 2013 • MD at Allen & Co (2007 - 2013) • VP Business Development at Symbol Technologies (2003 - 2007) • Executive Director and Senior Equity Analyst at Morgan Stanley Kathy Wu Brady | EVP, E - Commerce & Registry • Joined XO in March 2014 • CEO of Vente - Privee USA, where sales doubled in 2013 under her management • Held senior - level positions at AOL in strategy & operations, and at NBC Universal Dhanusha Sivajee | EVP, Marketing • Joined XO in August 2014 • CMO, AOL Brand Group (June 2013 - July 2014) • VP, Marketing of Bloomberg Mobile (Feb. 2011 – June 2013) • Director, Affiliate & Advanced Product Marketing of HBO including HBO GO (June 2004 - Feb 2011) Jennifer Garrett | EVP, National Enterprise • Joined XO Group in February 2014 • Spent 12 years at Viacom Inc., in senior sales roles at Nickelodeon and MTV Networks International

14 © 2015 XO GROUP INC. ALL RIGHTS RESERVED. Financials
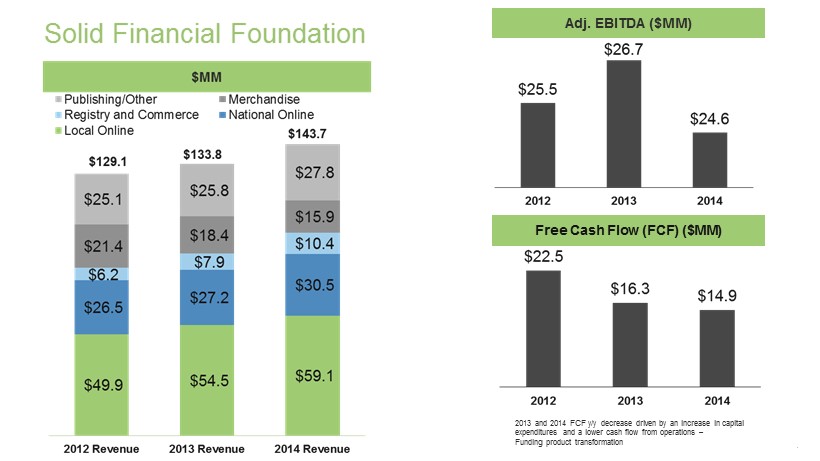
15 © 2015 XO GROUP INC. ALL RIGHTS RESERVED. Solid Financial Foundation Adj. EBITDA ($MM) 2013 and 2014 FCF y/y decrease driven by an increase in capital expenditures and a lower cash flow from operations – Funding product transformation Free Cash Flow (FCF) ($MM)
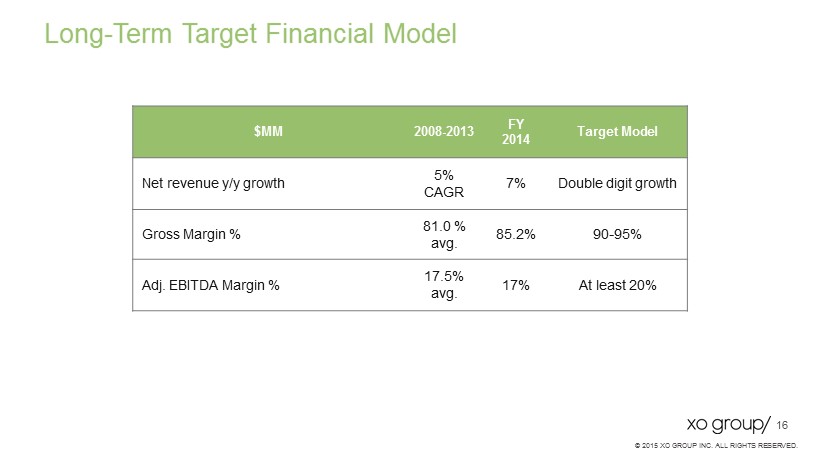
16 © 2015 XO GROUP INC. ALL RIGHTS RESERVED. Long - Term Target Financial Model $MM 2008 - 2013 FY 2014 Target Model Net revenue y/y growth 5% CAGR 7% Double digit growth Gross Margin % 81.0 % avg. 85.2% 90 - 95% Adj. EBITDA Margin % 17.5% avg. 17 % At least 20%
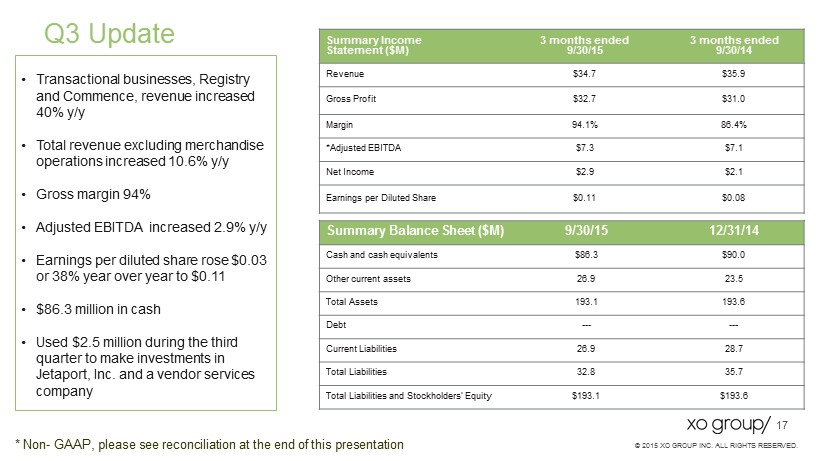
17 © 2015 XO GROUP INC. ALL RIGHTS RESERVED. Q3 Update • text Summary Income Statement ($M) 3 months ended 9/30/15 3 months ended 9/30/14 Revenue $34.7 $35.9 Gross Profit $32.7 $31.0 Margin 94.1% 86.4% *Adjusted EBITDA $7.3 $7.1 Net Income $2.9 $2.1 Earnings per Diluted Share $0.11 $0.08 • Transactional businesses, Registry and Commence, revenue increased 40% y/y • Total revenue excluding merchandise operations increased 10.6% y/y • Gross margin 94% • Adjusted EBITDA increased 2.9% y/y • Earnings per diluted share rose $0.03 or 38% year over year to $ 0.11 • $86.3 million in cash • Used $2.5 million during the third quarter to make investments in Jetaport , Inc. and a vendor services company * Non - GAAP, please see reconciliation at the end of this presentation Summary Balance Sheet ($M) 9/30/15 12/31/14 Cash and cash equivalents $86.3 $90.0 Other current assets 26.9 23.5 Total Assets 193.1 193.6 Debt --- --- Current Liabilities 26.9 28.7 Total Liabilities 32.8 35.7 Total Liabilities and Stockholders’ Equity $193.1 $193.6
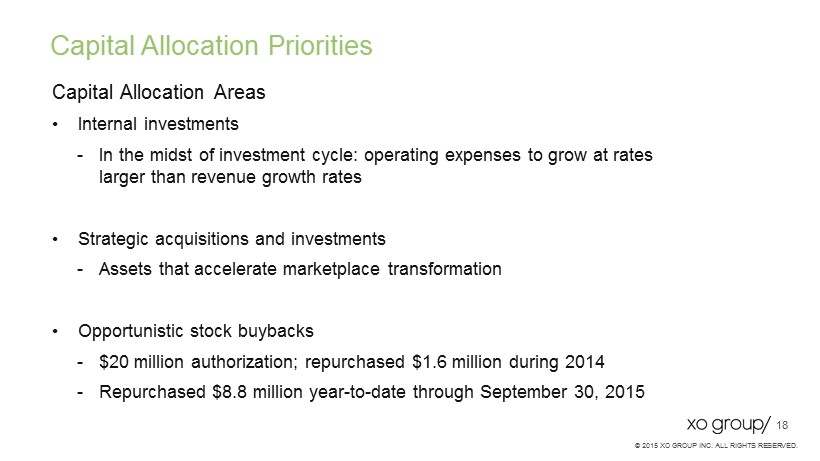
18 © 2015 XO GROUP INC. ALL RIGHTS RESERVED. Capital Allocation Priorities Capital Allocation Areas • Internal investments - In the midst of investment cycle: operating expenses to grow at rates larger than revenue growth rates • Strategic acquisitions and investments - Assets that accelerate marketplace transformation • Opportunistic stock buybacks - $20 million authorization; repurchased $1.6 million during 2014 - Repurchased $8.8 million year - to - date through September 30, 2015
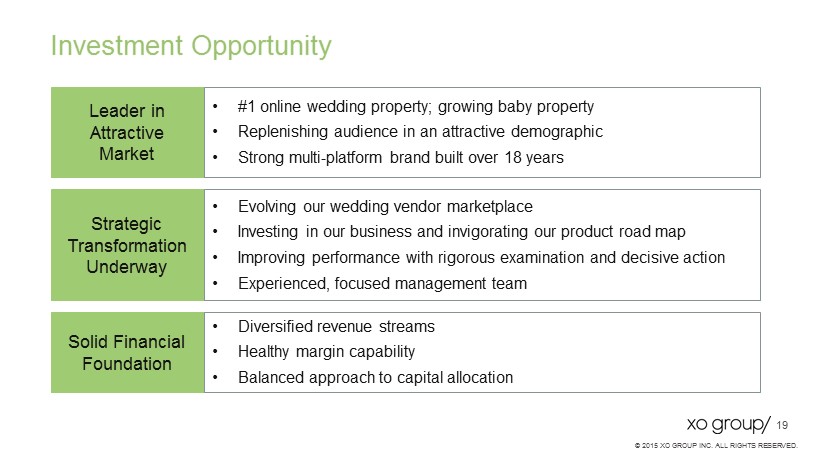
19 © 2015 XO GROUP INC. ALL RIGHTS RESERVED. Leader in Attractive Market • #1 online wedding property; growing baby property • Replenishing audience in an attractive demographic • Strong multi - platform brand built over 18 years Solid Financial Foundation • Diversified revenue streams • Healthy margin capability • Balanced approach to capital allocation Strategic Transformation Underway • Evolving our wedding vendor marketplace • Investing in our business and invigorating our product road map • Improving performance with rigorous examination and decisive action • Experienced, focused management team Investment Opportunity

20 © 2015 XO GROUP INC. ALL RIGHTS RESERVED. Questions? Contact [email protected]
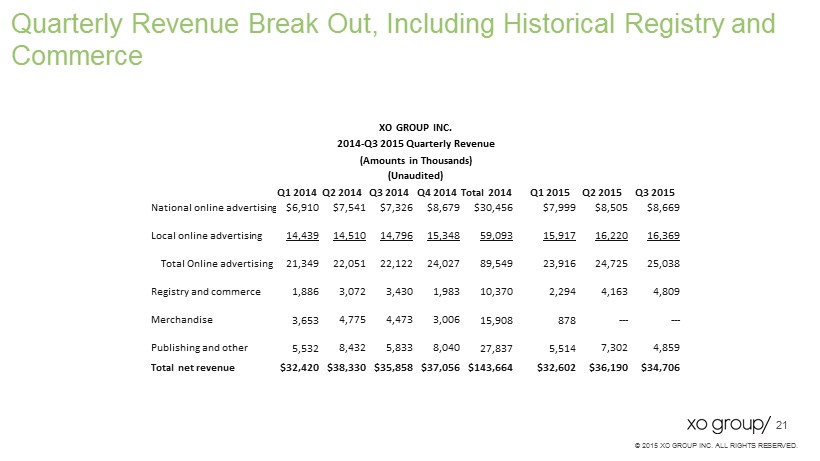
21 © 2015 XO GROUP INC. ALL RIGHTS RESERVED. Quarterly Revenue Break Out, Including Historical Registry and Commerce XO GROUP INC. 2014 - Q3 2015 Quarterly Revenue (Amounts in Thousands) (Unaudited) Q1 2014 Q2 2014 Q3 2014 Q4 2014 Total 2014 Q1 2015 Q2 2015 Q3 2015 National online advertising $6,910 $7,541 $7,326 $8,679 $30,456 $7,999 $8,505 $8,669 Local online advertising 14,439 14,510 14,796 15,348 59,093 15,917 16,220 16,369 Total Online advertising 21,349 22,051 22,122 24,027 89,549 23,916 24,725 25,038 Registry and commerce 1,886 3,072 3,430 1,983 10,370 2,294 4,163 4,809 Merchandise 3,653 4,775 4,473 3,006 15,908 878 --- --- Publishing and other 5,532 8,432 5,833 8,040 27,837 5,514 7,302 4,859 Total net revenue $32,420 $ 38,330 $ 35,858 $37,056 $ 143,664 $32,602 $36,190 $34,706
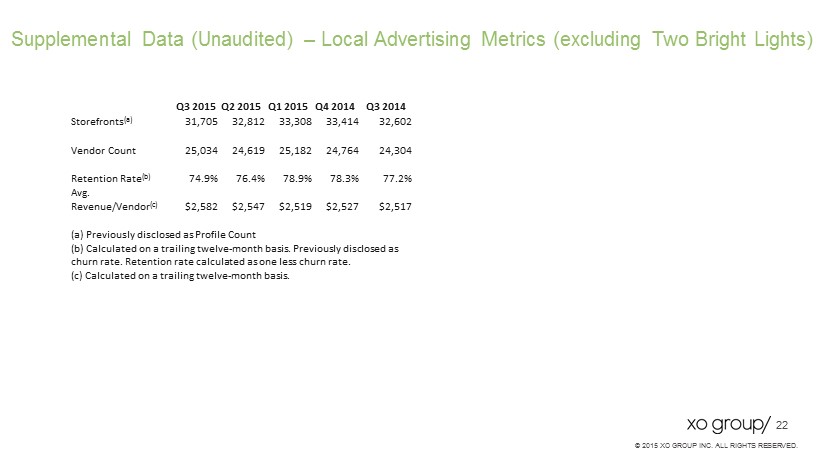
22 © 2015 XO GROUP INC. ALL RIGHTS RESERVED. Supplemental Data (Unaudited) – Local Advertising Metrics (excluding Two Bright Lights) Q3 2015 Q2 2015 Q1 2015 Q4 2014 Q3 2014 Storefronts (a) 31,705 32,812 33,308 33,414 32,602 Vendor Count 25,034 24,619 25,182 24,764 24,304 Retention Rate (b) 74.9% 76.4% 78.9% 78.3% 77.2% Avg. Revenue/Vendor (c) $2,582 $2,547 $2,519 $2,527 $2,517 (a) Previously disclosed as Profile Count (b) Calculated on a trailing twelve - month basis. Previously disclosed as churn rate. Retention rate calculated as one less churn rate. (c) Calculated on a trailing twelve - month basis.
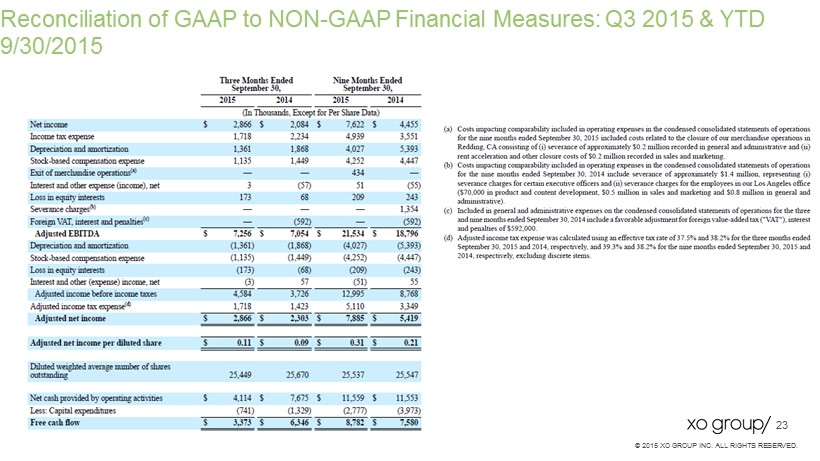
23 © 2015 XO GROUP INC. ALL RIGHTS RESERVED. Reconciliation of GAAP to NON - GAAP Financial Measures: Q3 2015 & YTD 9/30/2015
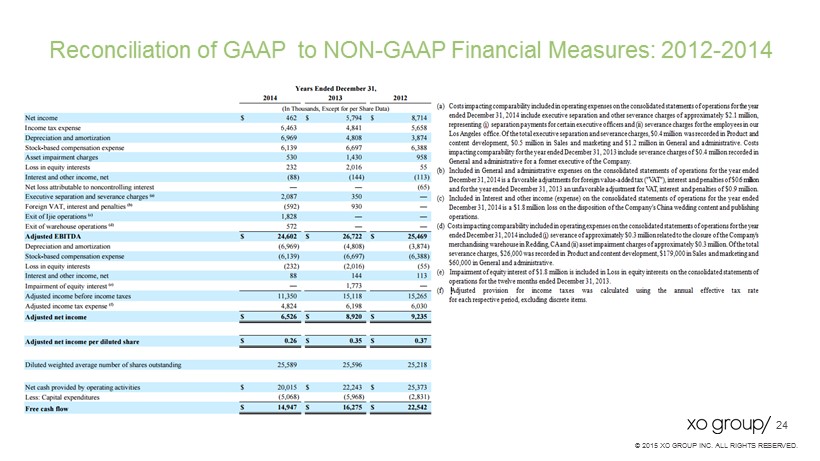
24 © 2015 XO GROUP INC. ALL RIGHTS RESERVED. Reconciliation of GAAP to NON - GAAP Financial Measures: 2012 - 2014
Serious News for Serious Traders! Try StreetInsider.com Premium Free!
You May Also Be Interested In
- Andrew Glen Brown Brings Entrepreneurship and Ownership Message to Madison Park Students in Boston
- Crypto Overview: ETH and ADA Sit 50% Below Peaks While Pepeto Presale Rushes Toward
- Reconnect, a Contender for Best Resort in Sulawesi, Plans 2027 Expansion
Create E-mail Alert Related Categories
SEC FilingsSign up for StreetInsider Free!
Receive full access to all new and archived articles, unlimited portfolio tracking, e-mail alerts, custom newswires and RSS feeds - and more!
