



Form 8-K Western Asset Mortgage For: Oct 29
 Tweet
Tweet Share
Share E-mail
UNITED STATES
SECURITIES AND EXCHANGE COMMISSION
Washington, D.C. 20549
FORM 8-K
CURRENT REPORT
Pursuant to Section 13 or 15(d) of the Securities Exchange Act of 1934
Date of Report (Date of earliest event reported):
November 4, 2015 (October 29, 2015)
Western Asset Mortgage Capital Corporation
(EXACT NAME OF REGISTRANT AS SPECIFIED IN ITS CHARTER)
DELAWARE
(STATE OF INCORPORATION)
|
001-35543 |
27-0298092 |
|
(COMMISSION FILE NUMBER) |
(IRS EMPLOYER ID. NUMBER) |
|
385 East Colorado Boulevard |
91101 |
|
Pasadena, California |
(ZIP CODE) |
|
(ADDRESS OF PRINCIPAL EXECUTIVE OFFICES) |
|
(626) 844-9400
(REGISTRANT’S TELEPHONE NUMBER, INCLUDING AREA CODE)
Check the appropriate box below if the Form 8-K filing is intended to simultaneously satisfy the filing obligation of the registrant under any of the following provisions:
[ ] Written communications pursuant to Rule 425 under the Securities Act (17 CFR 230.425)
[ ] Soliciting material pursuant to Rule 14a-12 under the Exchange Act (17 CFR 240.14a-12)
[ ] Pre-commencement communications pursuant to Rule 14d-2(b) under the Exchange Act (17 CFR 240.14d-2(b))
[ ] Pre-commencement communications pursuant to Rule 13e-4(c) under the Exchange Act (17 CFR 240.13e-4(c))
Item 2.02. Results of Operations and Financial Condition
On November 4, 2015, Western Asset Mortgage Capital Corporation (the “Company”) issued a press release announcing its financial results for the fiscal quarter ended September 30, 2015. The text of the press release is furnished as exhibit 99.1 to this Form 8-K.
Item 5.02. Departure of Directors or Certain Officers; Election of Directors; Appointment of Certain Officers; Compensatory Arrangements of Certain Officers
On October 29, 2015, the board of directors of the Company appointed Elliott Neumayer as Chief Operating Officer of the Company, effective immediately. Mr. Neumayer succeeds Travis M. Carr in the role of Chief Operating Officer of the Company. Mr. Carr will continue to serve as a Product Specialist at Western Asset Management Company, the Company’s external manager (the “Manager”), but will no longer serve in any capacity with the Company.
Mr. Neumayer, age 34, is a Product Specialist and head of mortgage-related business efforts at the Manager, having joined the Manager in 2004 from Marshall & Stevens, where he served as Senior Associate. Mr. Neumayer received an MBA and Bachelor of Arts degree from Loyola Marymount University.
Mr. Neumayer will hold his office from October 29, 2015 until his resignation or removal. There is no arrangement or understanding between Mr. Neumayer and any other person pursuant to which he was selected as an officer of the Company. There are no family relationships between Mr. Neumayer and any director, executive officer or person nominated or chosen by the Company to become a director or executive officer. There have been no transactions between Mr. Neumayer and the Company which would be required to be reported pursuant to Item 404(a) of Regulation S-K. Mr. Neumayer is an employee of the Manager, not the Company, and there is no material plan, contract or arrangement to which Mr. Neumayer was a party or in which he participated in connection with his appointment as Chief Operating Officer of the Company, and Mr. Neumayer will not receive any salary, bonus, equity awards or other compensation in connection with his appointment as Chief Operating Officer of the Company.
Item 7.01 Regulation FD Disclosure
On November 4, 2015, the Company will be holding its quarterly conference call in which it will discuss its financial results. The presentation for such call is furnished herewith as Exhibit 99.2 to this Form 8-K.
Pursuant to the rules and regulations of the Securities and Exchange Commission, Exhibits 99.1 and 99.2 and the information set forth therein and herein are being furnished and shall not be deemed to be filed for purposes of Section 18 of the Securities Exchange Act of 1934, as amended (the “Exchange Act”), nor shall they be deemed to be incorporated by reference in any filing under the Securities Act of 1933, as amended, or the Exchange Act, except as shall be expressly set forth by specific reference in such a filing.
Item 9.01. Financial Statements and Exhibits
(d) Exhibits
|
Exhibit No. |
Description |
|
99.1 |
Press Release, dated November 4, 2015, issued by Western Asset Mortgage Capital Corporation |
|
99.2 |
Presentation, dated November 4, 2015, by Western Asset Mortgage Capital Corporation |
SIGNATURE
Pursuant to the requirements of the Securities Exchange Act of 1934, the registrant has duly caused this report to be signed on its behalf by the undersigned hereunto duly authorized.
WESTERN ASSET MORTGAGE CAPITAL CORPORATION
By: /s/ Adam C. E. Wright
Name: Adam C. E. Wright
Title: Assistant Secretary
Date: November 4, 2015
Exhibit 99.1

WESTERN ASSET MORTGAGE CAPITAL CORPORATION
ANNOUNCES THIRD QUARTER 2015 RESULTS
Conference Call and Webcast Scheduled for today, Wednesday, November 4 at 12:00 p.m. Eastern Time/9:00 a.m. Pacific Time
Pasadena, CA, November 4, 2015 – Western Asset Mortgage Capital Corporation (the “Company”) (NYSE: WMC) today reported its results for the third quarter ended September 30, 2015. For the third quarter, the Company recorded a GAAP net loss of $1.9 million, or $0.05 per basic and diluted share. Core earnings plus drop income for the third quarter was $22.6 million, or $0.54 per basic and diluted share1,2. The Company also reported a net book value of $13.26 per share as of September 30, 20153 and previously declared a $0.60 per share dividend for the quarter.
THIRD QUARTER 2015 HIGHLIGHTS
· Paid a quarterly cash dividend of $0.60 per share
· Recorded a GAAP net loss of $1.9 million, or $0.05 per basic and diluted share
o Net loss includes $24.7 million of net unrealized gain on mortgage-backed securities (“MBS”), other securities and whole-loans (“Whole-Loans”); $2.5 million of net realized loss on MBS, other securities and Whole-Loans; and $41.4 million of net loss on derivative instruments
· Generated core earnings plus drop income of $22.6 million, or $0.54 per basic and diluted share1,2 of which $2.6 million, or approximately 11% was attributable to dollar roll income associated with the Company’s “to-be-announced” or TBA positions2
· $13.26 per share net book value as of September 30, 20153 versus $13.89 as of June 30, 20153
· Economic return for the quarter was approximately flat (-0.2%).1,4
· 2.45% weighted average net interest spread on Agency and Non-Agency residential MBS (“RMBS”), commercial mortgage backed securities (“CMBS”), asset-backed securities (“ABS”), other securities and Whole-Loans, including interest only (“IO”) securities accounted for as derivatives1
· $3.5 billion investment portfolio fair value as of September 30, 2015
1 Non – GAAP measure.
2 Drop income is income derived from the use of ‘to-be-announced’ forward contract (“TBA”) dollar roll transactions which is a component of our gain (loss) on derivative instruments on our consolidated statement of operations, but is not included in core earnings.
3 September 30, 2015 book value per share reflects the $0.60 per share dividend declared on September 24, 2015 and paid on October 27, 2015.
4 Economic return is calculated by taking the sum of: (i) the total dividends declared; and (ii) the change in book value during the period and dividing by the beginning book value.
Page 2 of 11
o 38% of the total portfolio consists of non-government or Non-Agency (“credit”) securities, including Non-Agency RMBS, CMBS, GSE credit risk sharing securities, Residential Whole-Loans and ABS
· Constant prepayment rate on its Agency RMBS portfolio of 10.1% for the quarter
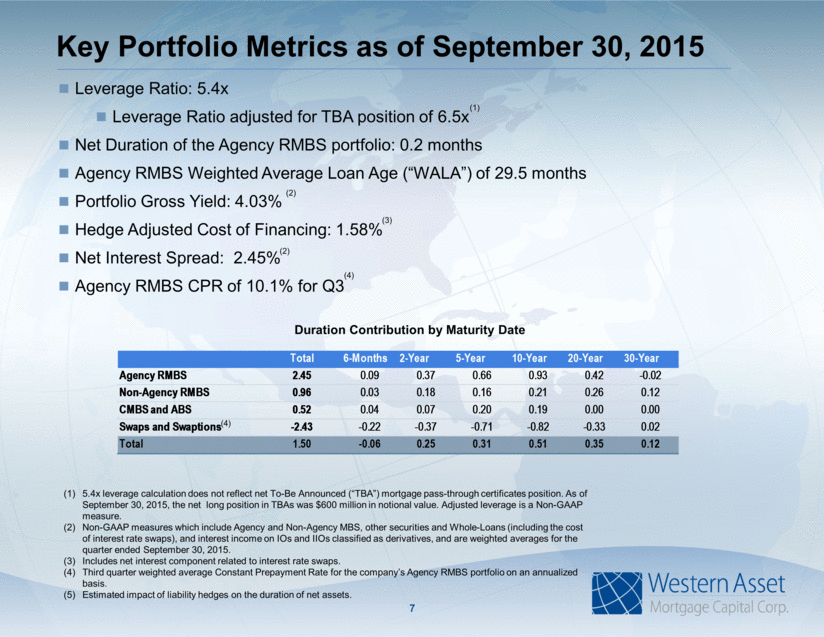
· 5.4x leverage as of September 30, 2015
o 6.5x leverage when adjusted for net TBA position 1, 52
COMMENTARY ON QUARTER
“During the third quarter, the fixed income market continued to experience a high level of volatility, driven by concerns over slower global economic growth and ongoing uncertainty over the timing of when the Federal Reserve would begin to increase interest rates,” said Gavin James, Chief Executive Officer of Western Asset Mortgage Capital Corporation. “While our portfolio wasn’t immune to the overall volatility in the fixed income markets and, in particular, the U.S. mortgage markets, our diversification and proactive approach to portfolio management enabled us to deliver an approximately break-even economic return for the quarter.”
Anup Agarwal, Chief Investment Officer of Western Asset Mortgage Capital Corporation, commented, “For the quarter, we continued to shift our portfolio to include a higher proportion of credit sensitive investments, increasing our credit exposure from approximately 28% of the portfolio at the beginning of the year to just over 38% of the portfolio at September 30, 2015. We believe that these securities offer attractive relative value and are a good complement to our Agency MBS holdings. During the quarter, we primarily increased our holdings in Residential Whole-Loans and CMBS. While our overall securities and loan portfolio experienced additional price appreciation, we were once again impacted by losses on our interest rate hedges as rates moved toward the low end of our expected range. We believe that our disciplined approach to security selection combined with our hedging strategies have and will continue to position us to manage through the current highly volatile interest rate environment.”
THIRD QUARTER 2015 RESULTS
For the third quarter ended September 30, 2015, the Company recorded a GAAP net loss of $1.9 million, or $0.05 per basic and diluted share. This compares to a net loss of $1.7 million, or $0.05 per basic and diluted share, for the second quarter ended June 30, 2015. During the third quarter ended September 30, 2015, the Company generated core earnings plus drop income of $22.6 million, or $0.54 per basic and diluted share. This compares to core earnings plus drop income of $31.7 million, or $0.76 per basic and diluted share, for the second quarter ended June 30, 2015. Core earnings represents a non-GAAP financial measure and is defined as net income (loss) excluding: (i) net realized gain (loss) on investments and derivative contracts; (ii) net unrealized gain (loss) on investments; (iii) gain (loss) resulting from mark-to-market adjustments on derivative
5 5.4x leverage calculation does not reflect net To-Be Announced (“TBA”) mortgage pass-through certificates position. As of September 30, 2015, the net long position in TBAs was $600.0 million in notional value.
Page 3 of 11
contracts; (iv) other loss on MBS and other securities; (v) non-cash stock-based compensation expense; and (vi) certain other non-cash charges. Drop income represents a non-GAAP financial measure and is derived from the use of “to-be-announced” forward contract (“TBA”) dollar roll transactions and is defined as the difference between the spot price and the forward settlement price for a comparable security on the trade date.
For the quarter ended September 30, 2015, average amortized cost of MBS, other securities and Whole-Loans held, including Agency and Non-Agency IO Strips, accounted for as derivatives, was $3.67 billion, as compared to $4.31 billion for the quarter ended June 30, 2015.
For the quarter ended September 30, 2015, the Company’s weighted average yield on its portfolio was 4.03%, including Agency and Non-Agency MBS, other securities and Whole-Loans, and interest from Interest-Only securities accounted for as derivatives. The Company’s effective cost of funds on its financing of its Agency and Non-Agency MBS, other securities and Whole-Loans, and from its Interest-Only securities accounted for as derivatives (including the cost of interest rate swaps), was 1.58%. The annualized net interest spread on its portfolio was 2.45%, including Agency and Non-Agency MBS, other securities and Whole-Loans, interest from Interest-Only securities accounted for as derivatives, and taking into account the cost of the interest rate swaps. This compares with a weighted average yield of 3.98%, an effective cost of funds of 1.19%, and an annualized net interest spread of 2.79%, respectively, for the quarter ended June 30, 2015.
The actual constant prepayment rate (“CPR”) for the Company’s Agency RMBS portfolio during the third quarter was 10.1% on an annualized basis, as compared to 9.8% for the second quarter of 2015.
DIVIDEND
On September 24, 2015, the Company declared a regular cash dividend of $0.60 per share for each common share. Since inception in May of 2012, the Company has declared and paid total dividends of $12.10 per share in a combination of cash and stock.
PORTFOLIO COMPOSITION
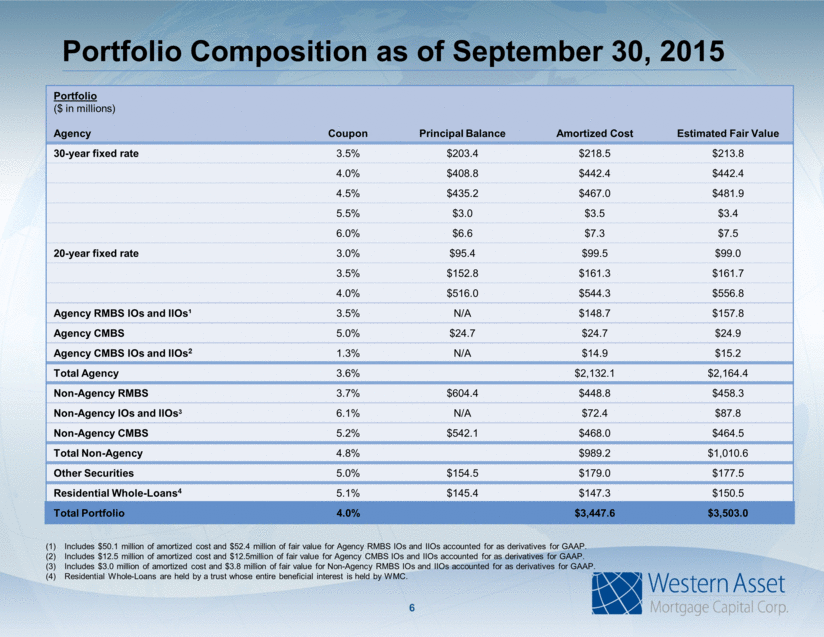
As of September 30, 2015, the Company owned an aggregate securities and loan portfolio equaling $3.5 billion in market value, comprised of $1.15 billion of 30-year fixed-rate Agency RMBS (residential mortgage-backed securities for which the principal and interest payments are guaranteed by a U.S. Government agency or sponsored entity), $817.5 million of 20-year fixed-rate Agency RMBS, $458.3 million of Non-Agency RMBS, $489.4 million of Agency and Non-Agency CMBS, $132.6 million of Agency MBS Interest-Only and $40.4 million of Agency MBS Inverse Interest-Only strips, $2.4 million of Non-Agency MBS Interest-Only and $85.5 million of Non-Agency MBS Inverse Interest-Only strips, $177.5 million of other securities, and $150.5 million of Residential Whole-Loans.
The following table sets forth additional information regarding the Company’s portfolio as of September 30, 2015:
Page 4 of 11
|
Portfolio |
|
|||||||
|
($ in millions) |
||||||||
|
Agency |
Coupon |
Principal |
Amortized |
Estimated Fair | ||||
|
30-year fixed rate |
3.5% |
$203.4 |
|
$218.5 |
|
$213.8 | ||
|
4.0% |
$408.8 |
|
$442.4 |
|
$442.4 | |||
|
|
|
4.5% |
|
$435.2 |
|
$467.0 |
|
$481.9 |
|
5.5% |
$3.0 |
|
$3.5 |
|
$3.4 | |||
|
|
|
6.0% |
|
$6.6 |
|
$7.3 |
|
$7.5 |
|
20-year fixed rate |
3.0% |
$95.4 |
|
$99.5 |
|
$99.0 | ||
|
3.5% |
$152.8 |
|
$161.3 |
|
$161.7 | |||
|
4.0% |
$516.0 |
|
$544.3 |
|
$556.8 | |||
|
|
|
|
|
|
|
|
|
|
|
Agency RMBS IOs and IIOs(1) |
|
3.5% |
|
N/A |
|
$148.7 |
|
$157.8 |
|
Agency CMBS |
|
5.0% |
|
$24.7 |
|
$24.7 |
|
$24.9 |
|
Agency CMBS IOs and IIOs(2) |
|
1.3% |
|
N/A |
|
$14.9 |
|
$15.2 |
|
Total Agency |
3.6% |
|
|
$2,132.1 |
|
$2,164.4 | ||
|
|
|
|
|
|
|
|
|
|
|
Non-Agency |
|
|
|
|
|
|
|
|
|
Non-Agency RMBS |
|
3.7% |
|
$604.4 |
|
$448.8 |
|
$458.3 |
|
Non-Agency RMBS IOs and IIOs(3) |
|
6.1% |
|
N/A |
|
$72.4 |
|
$87.8 |
|
Non-Agency CMBS |
|
5.2% |
|
$542.1 |
|
$468.0 |
|
$464.5 |
|
Total Non-Agency |
4.8% |
|
|
$989.2 |
|
$1,010.6 | ||
|
|
|
|
|
|
|
|
|
|
|
Other Securities |
|
5.0% |
|
$154.5 |
|
$179.0 |
|
$177.5 |
|
|
|
|
|
|
|
|
|
|
|
Residential Whole-Loans |
|
5.1% |
|
$145.4 |
|
$147.3 |
|
$150.5 |
|
Total Portfolio |
4.0% |
|
|
$3,447.6 |
|
$3,503.0 |
(1) Includes $50.1 million of amortized cost and $52.4 million of fair value for Agency RMBS IOs and IIOs accounted for as derivatives for GAAP.
(2) Includes $12.5 million of amortized cost and $12.5 million of fair value for Agency CMBS IOs and IIOs accounted for as derivatives for GAAP.
(3) Includes $3.0 million of amortized cost and $3.8 million of fair value for Non-Agency RMBS IOs and IIOs accounted for as derivatives for GAAP.
PORTFOLIO FINANCING
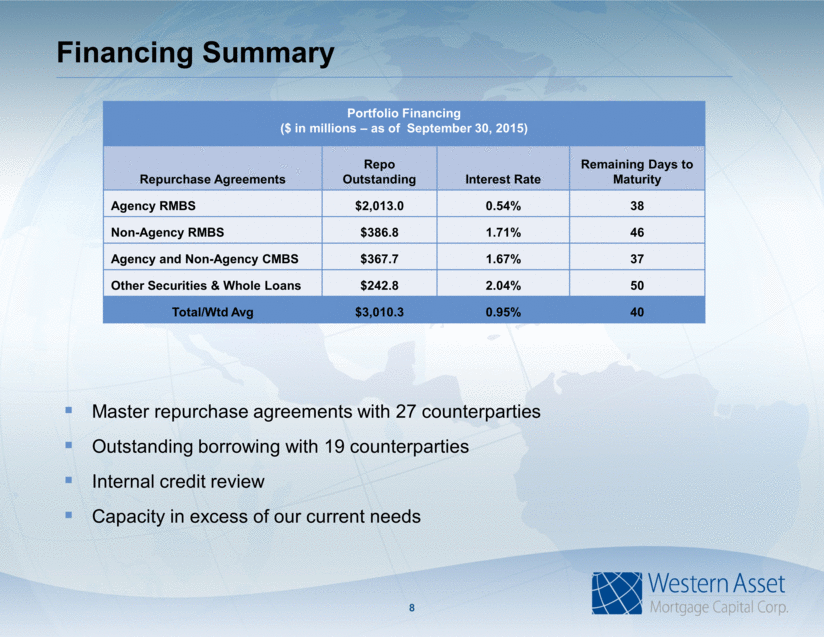
At September 30, 2015, the Company financed its portfolio with $3.0 billion of borrowings under master repurchase agreements with nineteen (19) of its twenty-seven (27) approved counterparties, bearing fixed interest rates with maturities between October 2015 and May 2016.
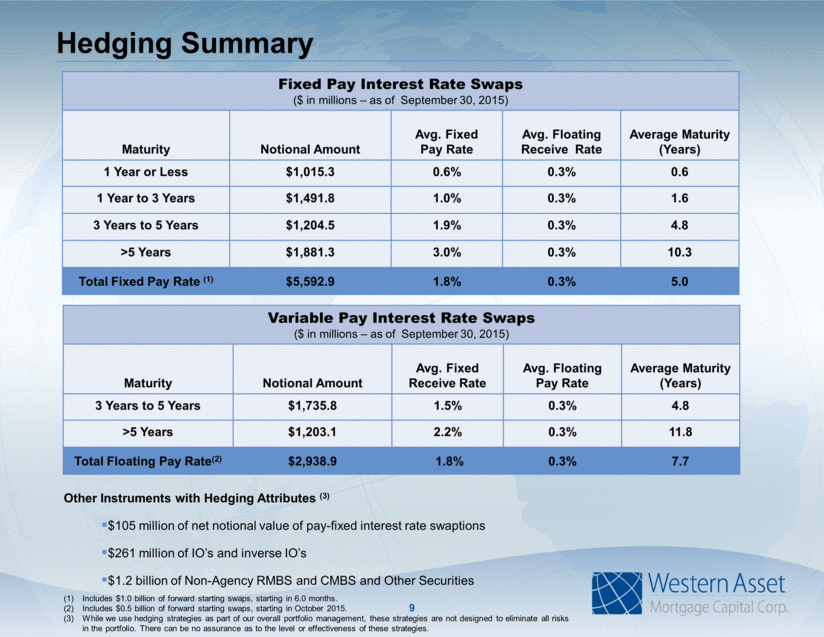
The Company has also entered into approximately $4.6 billion notional amount of pay-fixed interest rate swaps, excluding forward starting swaps of $1.0 billion (approximately 6.0 months forward) that have variable maturities between October 2015 and February 2044, and $2.4 billion notional amount of pay-variable interest rate swaps, excluding forward starting swaps of $0.5 billion (approximately 1 day forward) that have variable
Page 5 of 11
maturities between February 2020 and February 2045. In addition, the Company has entered into $605.0 million notional amount of pay-fixed interest rate swaptions with a weighted average swap term of 4.3 years, and $500.0 million notional amount of receive-fixed interest rate swaptions with a weighted average swap term of 5.0 years.
The following table sets forth additional information regarding the Company’s portfolio financing as of September 30, 2015:
|
Financing ($ in millions) |
|||||||
|
Repurchase agreements |
Balance |
Weighted |
Weighted | ||||
|
Agency RMBS |
|
|
$2,013.0 |
|
0.54% |
|
38 |
|
Non-Agency RMBS |
|
|
$386.8 |
|
1.71% |
|
46 |
|
Agency and Non-Agency CMBS |
|
|
$367.7 |
|
1.67% |
|
37 |
|
Other Securities and Residential Whole-Loans |
|
|
$242.8 |
|
2.04% |
|
50 |
|
Total |
|
|
$3,010.3 |
|
0.95% |
|
40 |
The following tables summarize the average pay rate and average maturity for the Company’s interest rate swaps as of September 30, 2015:
|
Fixed Pay Rate Swap Transactions |
| ||||||
|
($ in millions) |
| ||||||
|
Remaining Term to |
Notional |
Average |
Average |
| |||
|
1 year or less |
|
$1,015.3 |
|
0.6% |
|
0.6 |
|
|
> 1 year to 3 years |
$1,491.8 |
|
1.0% |
|
1.6 |
| |
|
> 3 years to 5 years |
$1,204.5 |
|
1.9% |
|
4.8 |
| |
|
> 5 years |
$1,881.3 |
|
3.0% |
|
10.3 |
| |
|
Total Fixed Pay Rate |
$5,592.9 |
|
1.8% |
|
5.0 |
| |
|
Variable Pay Rate Swap Transactions |
|||||||
|
($ in millions) |
|||||||
|
Remaining Term to |
Notional |
Average |
Average | ||||
|
> 3 years to 5 years |
|
$1,735.8 |
|
0.3% |
|
4.8 | |
|
> 5 years |
$1,203.1 |
|
0.3% |
|
11.8 | ||
|
Total |
$2,938.9 |
|
0.3% |
|
7.7 | ||
Page 6 of 11
CONFERENCE CALL
The Company will host a conference call with a live webcast today, November 4, at 12:00 p.m. Eastern Time/9:00 a.m. Pacific Time, to discuss financial results for the third quarter ended September 30, 2015.
Individuals interested in participating in the conference call may do so by dialing 866.235.9914 from the United States, or 412.902.4115 from outside the United States and referencing “Western Asset Mortgage Capital Corporation.” Those interested in listening to the conference call live via the Internet may do so by visiting the Investor Relations section of the Company’s website at www.westernassetmcc.com.
The Company is enabling investors to pre-register for the earnings conference call so that they can expedite their entry into the call and avoid the need to wait for a live operator. In order to pre-register for the call, investors can visit http://dpregister.com/10075572 and enter in their contact information. Investors will then be issued a personalized phone number and pin to dial into the live conference call. Individuals can pre-register any time prior to the start of the conference call on November 3, 2015.
A telephone replay will be available through November 18, 2015 by dialing 877.344.7529 from the United States, or 412.317.0088 from outside the United States, and entering conference ID 10075572. A webcast replay will be available for 90 days.
ABOUT WESTERN ASSET MORTGAGE CAPITAL CORPORATION
Western Asset Mortgage Capital Corporation is a mortgage REIT that invests in Agency RMBS, which are residential mortgage-backed securities for which the principal and interest payments are guaranteed by a U.S. Government agency (such as GNMA) or a U.S. Government-sponsored entity (such as FNMA or FHLMC). The Company also invests in residential mortgage-backed securities that are not guaranteed by a U.S. Government agency or sponsored entity as well as commercial mortgage-backed securities or CMBS, asset-backed securities or ABS, Residential and Commercial Whole-Loans and/or whole-loan securities and other securities. The Company’s investment strategy may change, subject to the Company’s stated investment guidelines, and is based on our manager Western Asset Management Company’s perspective of which mix of portfolio assets it believes provide the Company with the best risk-reward opportunities at any given time. The Company is externally managed and advised by Western Asset Management Company, an investment advisor registered with the SEC and a wholly-owned subsidiary of Legg Mason, Inc.
FORWARD-LOOKING STATEMENTS
This press release contains statements that constitute “forward-looking statements.” Operating results are subject to numerous conditions, many of which are beyond the control of the Company, including, without limitation, changes in interest rates; changes in the yield curve; changes in prepayment rates; the availability and terms of financing; general economic conditions; market conditions; conditions in the market for mortgage related investments; legislative and regulatory changes that could adversely affect the business of the Company; and other factors, including those set forth in the Risk Factors section of the Company’s annual report on Form 10-K for the period ended December 31,
Page 7 of 11
2014 filed with the Securities and Exchange Commission (“SEC”). The Company undertakes no obligation to update these statements for revisions or changes after the date of this release, except as required by law.
USE OF NON-GAAP FINANCIAL INFORMATION
In addition to the results presented in accordance with GAAP, this release includes certain non-GAAP financial information, including core earnings, core earnings per share, drop income and drop income per share and certain financial metrics derived from non-GAAP information, such as weighted average yield, including IO securities; weighted average effective cost of financing, including swaps; weighted average net interest spread, including IO securities and swaps, which constitute non-GAAP financial measures within the meaning of Regulation G promulgated by the SEC. We believe that these measures presented in this release, when considered together with GAAP financial measures, provide information that is useful to investors in understanding our borrowing costs and net interest income, as viewed by us. An analysis of any non-GAAP financial measure should be made in conjunction with results presented in accordance with GAAP.
###
|
Investor Relations Contact: |
Media Contact: |
|
Larry Clark |
Tricia Ross |
|
Financial Profiles, Inc. |
Financial Profiles, Inc. |
|
(310) 622-8223 |
(310) 622-8226 |
-Financial Tables to Follow-
Page 8 of 11
Western Asset Mortgage Capital Corporation and Subsidiaries
Consolidated Balance Sheets (Unaudited)
(in thousands—except share and per share data)
|
|
|
September |
|
December 31, |
| ||
|
Assets: |
|
|
|
|
| ||
|
Cash and cash equivalents |
$ |
|
39,703 |
$ |
|
47,222 |
|
|
Mortgage-backed securities and other securities, at fair value ($3,343,683 and $4,362,532 pledged as collateral, at fair value, respectively) |
|
3,352,509 |
|
4,385,723 |
| ||
|
Residential Whole-Loans, at fair value ($150,486 and $7,220 pledged as collateral, at fair value, respectively) |
|
150,486 |
|
7,220 |
| ||
|
Linked transactions, net, at fair value |
|
- |
|
20,627 |
| ||
|
Receivable under reverse repurchase agreements |
|
758,467 |
|
- |
| ||
|
Investment related receivable |
|
10,734 |
|
162,837 |
| ||
|
Accrued interest receivable |
|
21,415 |
|
27,309 |
| ||
|
Due from counterparties |
|
236,525 |
|
184,757 |
| ||
|
Derivative assets, at fair value |
|
56,985 |
|
73,256 |
| ||
|
Other assets |
|
773 |
|
326 |
| ||
|
Total Assets |
$ |
|
4,627,597 |
$ |
|
4,909,277 |
|
|
|
|
|
|
|
| ||
|
Liabilities and Stockholders’ Equity: |
|
|
|
|
| ||
|
Liabilities: |
|
|
|
|
| ||
|
Borrowings under repurchase agreements |
$ |
|
3,010,268 |
$ |
|
3,875,721 |
|
|
Accrued interest payable |
|
21,719 |
|
17,573 |
| ||
|
Investment related payables |
|
10,742 |
|
166,608 |
| ||
|
Due to counterparties |
|
771,784 |
|
12,180 |
| ||
|
Derivative liability, at fair value |
|
227,158 |
|
180,280 |
| ||
|
Accounts payable and accrued expenses |
|
2,262 |
|
1,794 |
| ||
|
Payable to related party |
|
2,797 |
|
2,705 |
| ||
|
Dividend payable |
|
25,152 |
|
29,204 |
| ||
|
Total Liabilities |
|
4,071,882 |
|
4,286,065 |
| ||
|
|
|
|
|
|
| ||
|
|
|
|
|
|
| ||
|
Commitments and contingencies |
|
|
|
|
| ||
|
|
|
|
|
|
| ||
|
|
|
|
|
|
| ||
|
Stockholders’ Equity: |
|
|
|
|
| ||
|
Common stock, $0.01 par value, 500,000,000 shares authorized, 41,919,801 and 41,719,801 shares issued and outstanding, respectively |
|
419 |
|
417 |
| ||
|
Preferred stock, $0.01 par value, 100,000,000 shares authorized and no shares outstanding |
|
- |
|
- |
| ||
|
Additional paid-in capital |
|
762,935 |
|
760,925 |
| ||
|
Retained earnings (accumulated deficit) |
|
(207,639) |
|
(138,130) |
| ||
|
Total Stockholders’ Equity |
|
555,715 |
|
623,212 |
| ||
|
Total Liabilities and Stockholders’ Equity |
$ |
|
4,627,597 |
$ |
|
4,909,277 |
|
Page 9 of 11
Western Asset Mortgage Capital Corporation and Subsidiaries
Consolidated Statements of Operations (Unaudited)
(in thousands—except share and per share data)
|
|
|
For the three |
|
For the three |
|
For the nine |
|
For the nine | ||||
|
|
|
|
|
|
|
|
|
| ||||
|
Net Interest Income: |
|
|
|
|
|
|
|
| ||||
|
Interest income |
|
$ |
35,821 |
|
$ |
40,718 |
|
$ |
117,656 |
|
$ |
108,752 |
|
Interest expense |
|
6,981 |
|
6,468 |
|
19,960 |
|
15,829 | ||||
|
Net Interest Income |
|
28,840 |
|
34,250 |
|
97,696 |
|
92,923 | ||||
|
|
|
|
|
|
|
|
|
| ||||
|
Other Income (Loss): |
|
|
|
|
|
|
|
| ||||
|
Interest income on cash balances and other income (loss), net |
|
(29) |
|
942 |
|
1,744 |
|
954 | ||||
|
Realized gain (loss) on sale of Mortgage-backed securities, other securities and Whole-Loans, net |
|
(2,482) |
|
4,912 |
|
9,267 |
|
(2,650) | ||||
|
Other loss on Mortgage-backed securities and other securities |
|
(5,917) |
|
(2,857) |
|
(14,884) |
|
(7,565) | ||||
|
Unrealized gain (loss) on Mortgage-backed securities, other securities and Whole-Loans, net |
|
24,723 |
|
(4,453) |
|
10,284 |
|
140,755 | ||||
|
Gain on linked transactions, net |
|
- |
|
(1,241) |
|
- |
|
1,666 | ||||
|
Loss on derivative instruments, net |
|
(41,363) |
|
(401) |
|
(76,511) |
|
(126,984) | ||||
|
Other Income (Loss), net |
|
(25,068) |
|
(3,098) |
|
(70,100) |
|
6,176 | ||||
|
|
|
|
|
|
|
|
|
| ||||
|
Operating Expenses: |
|
|
|
|
|
|
|
| ||||
|
General and administrative (includes $509, $587, $1,969 and $1,654 non-cash stock based compensation, respectively) |
|
2,863 |
|
2,253 |
|
8,862 |
|
6,703 | ||||
|
Management fee – related party |
|
2,761 |
|
2,763 |
|
8,133 |
|
7,127 | ||||
|
Total Operating Expenses |
|
5,624 |
|
5,016 |
|
16,995 |
|
13,830 | ||||
|
|
|
|
|
|
|
|
|
| ||||
|
Net income (loss) available to Common Stock and participating securities |
|
$ |
(1,852) |
|
$ |
26,136 |
|
$ |
10,601 |
|
$ |
85,269 |
|
|
|
|
|
|
|
|
|
| ||||
|
Net income (loss) per Common Share – Basic |
|
$ |
(0.05) |
|
$ |
0.63 |
|
$ |
0.24 |
|
$ |
2.35 |
|
Net income (loss) per Common Share – Diluted |
|
$ |
(0.05) |
|
$ |
0.63 |
|
$ |
0.24 |
|
$ |
2.35 |
|
Dividends Declared per Share of Common Stock |
|
$ |
0.60 |
|
$ |
0.70 |
|
$ |
1.91 |
|
$ |
2.04 |
Page 10 of 11
Reconciliation of GAAP Net Income to Non-GAAP Core Earnings
(Unaudited)
(in thousands—except share and per share data)
The table below reconciles Net Income (Loss) to Core Earnings for the three and nine months ended September 30, 2015 and September 30, 2014:
|
(dollars in thousands) |
|
For the three |
|
For the three |
|
For the nine |
|
For the nine | |||||
|
|
|
|
|
|
|
|
|
|
| ||||
|
Net Income (loss) – GAAP |
|
$ |
(1,852) |
|
$ |
26,136 |
|
$ |
10,601 |
|
$ |
85,269 |
|
|
Adjustments: |
|
|
|
|
|
|
|
|
| ||||
|
|
|
|
|
|
|
|
|
|
| ||||
|
MBS, other securities and Whole-Loans: |
|
|
|
|
|
|
|
|
| ||||
|
|
|
|
|
|
|
|
|
|
| ||||
|
Unrealized (gain) loss on MBS, other securities and Whole-Loans |
|
(24,723) |
|
4,453 |
|
(10,284) |
|
(140,755) |
| ||||
|
Other loss on mortgage-backed and other securities |
|
5,917 |
|
2,857 |
|
14,884 |
|
7,565 |
| ||||
|
Realized (gain) loss on sale of MBS and other securities |
|
2,482 |
|
(4,912) |
|
(9,267) |
|
2,650 |
| ||||
|
|
|
|
|
|
|
|
|
|
| ||||
|
Derivative Instruments: |
|
|
|
|
|
|
|
|
| ||||
|
|
|
|
|
|
|
|
|
|
| ||||
|
Realized gain on termination of interest rate swaps |
|
(28,291) |
|
(23,798) |
|
(18,729) |
|
(17,012) |
| ||||
|
Realized (gain) loss on settlement of TBAs |
|
8,205 |
|
(2,608) |
|
1,728 |
|
(25,169) |
| ||||
|
Realized loss on currency forwards |
|
134 |
|
1,182 |
|
980 |
|
1,182 |
| ||||
|
Realized gain on option derivatives |
|
(684) |
|
- |
|
(684) |
|
- |
| ||||
|
Realized loss on termination of futures |
|
168 |
|
- |
|
627 |
|
16,495 |
| ||||
|
Realized loss on sale of swaptions |
|
150 |
|
- |
|
3,873 |
|
5,908 |
| ||||
|
Realized gain on sale/unlinking of securities underlying linked transactions |
|
- |
|
(107) |
|
- |
|
(1,397) |
| ||||
|
Realized (gain) loss on Agency Interest-Only Strips – accounted for as derivatives |
|
(626) |
|
(389) |
|
(624) |
|
755 |
| ||||
|
Realized (gain) loss on foreign currency transactions |
|
275 |
|
(1,070) |
|
(2,523) |
|
(1,070) |
| ||||
|
Unrealized (gain) loss on foreign currency transactions |
|
(201) |
|
- |
|
859 |
|
- |
| ||||
|
Mark-to- market adjustments on interest rate swaps |
|
64,701 |
|
15,587 |
|
83,209 |
|
123,026 |
| ||||
|
Mark-to- market adjustments on interest rate swaptions |
|
(71) |
|
624 |
|
72 |
|
5,615 |
| ||||
|
Mark-to-market adjustments on options |
|
- |
|
340 |
|
- |
|
340 |
| ||||
|
Mark-to-market adjustments on futures contracts |
|
38 |
|
200 |
|
(683) |
|
311 |
| ||||
|
Mark-to- market adjustments on TBAs |
|
(7,155) |
|
1,110 |
|
2,784 |
|
(1,521) |
| ||||
|
Mark-to-market adjustments on linked transactions |
|
- |
|
2,131 |
|
- |
|
1,418 |
| ||||
|
Mark-to-market adjustments on derivative instruments |
|
1,799 |
|
915 |
|
1,966 |
|
332 |
| ||||
|
Mark-to-market adjustments on foreign currency swaps |
|
(652) |
|
(2,057) |
|
(3,944) |
|
(2,072) |
| ||||
|
Mark-to-market adjustments on foreign currency forwards |
|
(114) |
|
(57) |
|
(452) |
|
81 |
| ||||
|
|
|
|
|
|
|
|
|
|
| ||||
|
Non-cash stock-based compensation expense |
|
509 |
|
587 |
|
1,969 |
|
1,654 |
| ||||
|
Total adjustments |
|
21,861 |
|
(5,012) |
|
65,761 |
|
(21,664) |
| ||||
|
Core Earnings – Non-GAAP Financial Measure |
|
$ |
20,009 |
|
$ |
21,124 |
|
$ |
76,362 |
|
$ |
63,605 |
|
|
|
|
|
|
|
|
|
|
|
| ||||
|
Basic Core Earnings per Share of Common Stock and Participating Securities - Non-GAAP Financial Measure |
|
$ |
0.48 |
|
$ |
0.51 |
|
$ |
1.82 |
|
$ |
1.75 |
|
|
Diluted Core Earnings per Share of Common Stock and Participating Securities - Non-GAAP Financial Measure |
|
$ |
0.48 |
|
$ |
0.51 |
|
$ |
1.82 |
|
$ |
1.75 |
|
|
|
|
|
|
|
|
|
|
|
| ||||
|
|
|
|
|
|
|
|
|
|
| ||||
|
Basic weighted average common shares and participating securities |
|
41,946,885 |
|
41,731,928 |
|
41,896,839 |
|
36,311,055 |
| ||||
|
Diluted weighted average common shares and participating securities |
|
41,946,885 |
|
41,731,928 |
|
41,896,839 |
|
36,311,055 |
| ||||
Page 11 of 11
Reconciliation of Interest Income and Effective Cost of Funds
(Unaudited, in thousands)
The following table reconciles total interest income to interest income including interest income on Agency and Non-Agency Interest-Only Strips classified as derivatives and interest income on linked transactions prior to January 1, 2015 (Non-GAAP financial measure) for the three and nine months ended September 30, 2015 and September 30, 2014:
|
(in thousands) |
|
For the three |
|
For the three |
|
For the nine |
|
For the nine | ||||
|
Coupon interest income |
|
$ |
49,287 |
|
$ |
58,782 |
|
$ |
161,835 |
|
$ |
152,014 |
|
Premium accretion, discount amortization and amortization of basis, net |
|
(13,466) |
|
(18,064) |
|
(44,179) |
|
(43,262) | ||||
|
Interest income |
|
$ |
35,821 |
|
$ |
40,718 |
|
$ |
117,656 |
|
$ |
108,752 |
|
|
|
|
|
|
|
|
|
| ||||
|
Contractual interest income, net of amortization of basis on Agency and Non-Agency Interest-Only Strips, classified as derivatives(1): |
|
|
|
|
|
|
|
| ||||
|
Coupon interest income |
|
$ |
5,436 |
|
$ |
5,723 |
|
$ |
16,700 |
|
$ |
20,288 |
|
Amortization of basis (Non-GAAP Financial Measure) |
|
(4,163) |
|
(4,187) |
|
(12,877) |
|
(14,286) | ||||
|
Contractual interest income, net on Foreign currency swaps(1) |
|
190 |
|
140 |
|
585 |
|
141 | ||||
|
Contractual interest income, net of premium amortization, discount accretion and amortization of basis on Linked transactions (2): |
|
|
|
|
|
|
|
| ||||
|
Coupon interest |
|
- |
|
1,142 |
|
- |
|
5,002 | ||||
|
Premium amortization, discount accretion and amortization of basis, net |
|
- |
|
(220) |
|
- |
|
(2,901) | ||||
|
Subtotal |
|
1,463 |
|
2,598 |
|
4,408 |
|
8,244 | ||||
|
Total interest income, including interest income on Agency and Non-Agency Interest-Only Strips, classified as derivatives and Linked transactions - Non-GAAP Financial Measure |
|
$ |
37,284 |
|
$ |
43,316 |
|
$ |
122,064 |
|
$ |
116,996 |
(1) Reported in gain (loss) on derivative instruments in the Consolidated Statement of Operations.
(2) Reported in gain (loss) on linked transactions in the Consolidated Statement of Operations.
The following tables reconcile the Effective Cost of Funds (Non-GAAP financial measure) with interest expense for the three and nine months ended September 30, 2015 and September 30, 2014:
|
|
|
For the three months ended |
|
|
For the nine months ended |
| ||||||
|
(dollars in thousands) |
|
Reconciliation |
|
Cost of |
|
|
Reconciliation |
|
Cost of |
| ||
|
|
|
|
|
|
|
|
|
|
|
| ||
|
Interest expense |
|
$ |
6,981 |
|
0.90 |
% |
|
$ |
19,960 |
|
0.75 |
% |
|
Net interest paid - interest rate swaps |
|
5,224 |
|
0.68 |
% |
|
10,796 |
|
0.41 |
% | ||
|
Effective Borrowing Costs |
|
$ |
12,205 |
|
1.58 |
% |
|
$ |
30,756 |
|
1.16 |
% |
|
Weighted average repurchase borrowings |
|
3,064,689 |
|
|
|
|
3,536,381 |
|
|
| ||
|
|
|
|
For the three months ended September |
|
|
|
For the nine months ended September |
| ||||||
|
(dollars in thousands) |
|
|
Reconciliation |
|
Cost of |
|
|
|
Reconciliation |
|
Cost of |
| ||
|
|
|
|
|
|
|
|
|
|
|
|
|
| ||
|
Interest expense |
|
|
$ |
6,468 |
|
0.63 |
% |
|
|
$ |
15,829 |
|
0.58 |
% |
|
Interest expense on linked transactions |
|
|
139 |
|
1.84 |
% |
|
|
414 |
|
1.75 |
% | ||
|
Net interest paid - interest rate swaps |
|
|
11,028 |
|
1.09 |
% |
|
|
24,856 |
|
0.92 |
% | ||
|
Effective Borrowing Costs |
|
|
$ |
17,635 |
|
1.72 |
% |
|
|
$ |
41,099 |
|
1.50 |
% |
|
Weighted average repurchase borrowings (1) |
|
|
4,072,179 |
|
|
|
|
|
3,668,932 |
|
|
| ||
(1) Includes average repurchase borrowings under linked transactions.
Exhibit 99.2
Third Quarter 2015 Investor Presentation November 4, 2015
Safe Harbor Statement We make forward-looking statements in this presentation that are subject to risks and uncertainties. These forward-looking statements include information about possible or assumed future results of our business, financial condition, liquidity, results of operations, plans and objectives. When we use the words "believe," "expect," "anticipate," "estimate," "plan," "continue," "intend," "should," "may" or similar expressions, we intend to identify forward-looking statements. Statements regarding the following subjects, among others, may be forward-looking: our business and investment strategy; our projected operating results; our ability to obtain financing arrangements; financing and advance rates for MBS and our potential target assets; our expected leverage; general volatility of the securities markets in which we invest and the market price of our common stock; our expected investments; interest rate mismatches between MBS and our potential target assets and our borrowings used to fund such investments; changes in interest rates and the market value of MBS and our potential target assets; changes in prepayment rates on Agency MBS and Non-Agency MBS; effects of hedging instruments on MBS and our potential target assets; rates of default or decreased recovery rates on our potential target assets; the degree to which any hedging strategies may or may not protect us from interest rate volatility; impact of and changes in governmental regulations, tax law and rates, accounting guidance and similar matters; our ability to maintain our qualification as a REIT; our ability to maintain our exemption from registration under the Investment Company Act of 1940, as amended; availability of investment opportunities in mortgage-related, real estate-related and other securities; availability of qualified personnel; estimates relating to our ability to make distributions to our stockholders in the future; our understanding of our competition; and market trends in our industry, interest rates, real estate values, the debt securities markets or the general economy. The forward-looking statements in this presentation are based on our beliefs, assumptions and expectations of our future performance, taking into account all information currently available to us. You should not place undue reliance on these forward-looking statements. These beliefs, assumptions and expectations can change as a result of many possible events or factors, not all of which are known to us. Some of these factors are described in our filings with the SEC under the headings "Summary," "Risk factors," "Management's discussion and analysis of financial condition and results of operations" and "Business." If a change occurs, our business, financial condition, liquidity and results of operations may vary materially from those expressed in our forward-looking statements. Any forward-looking statement speaks only as of the date on which it is made. New risks and uncertainties arise over time, and it is not possible for us to predict those events or how they may affect us. Except as required by law, we are not obligated to, and do not intend to, update or revise any forward-looking statements, whether as a result of new information, future events or otherwise. This presentation is not an offer to sell securities nor a solicitation of an offer to buy securities in any jurisdiction where the offer and sale is not permitted. 1
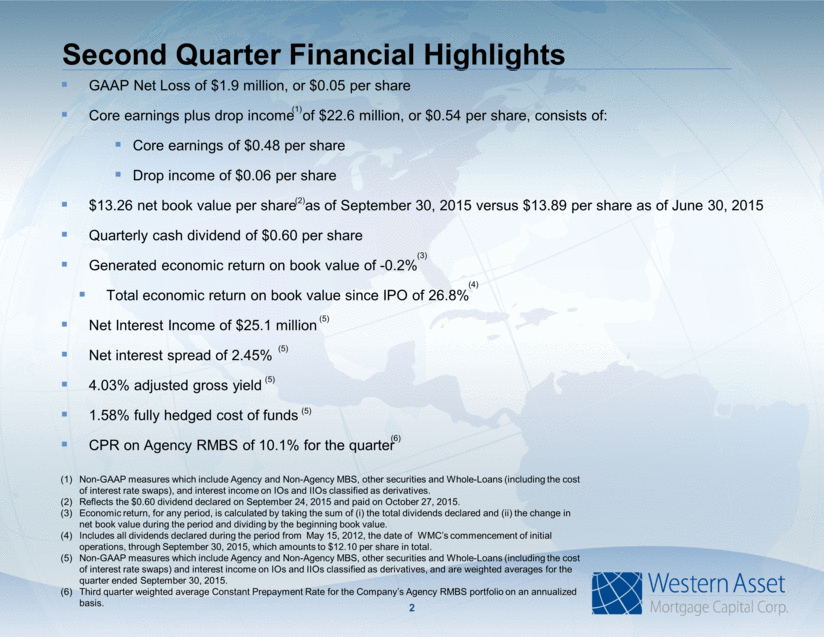
Second Quarter Financial Highlights GAAP Net Loss of $1.9 million, or $0.05 per share Core earnings plus drop income of $22.6 million, or $0.54 per share, consists of: Core earnings of $0.48 per share Drop income of $0.06 per share $13.26 net book value per share as of September 30, 2015 versus $13.89 per share as of June 30, 2015 Quarterly cash dividend of $0.60 per share Generated economic return on book value of -0.2% Total economic return on book value since IPO of 26.8% Net Interest Income of $25.1 million Net interest spread of 2.45% 4.03% adjusted gross yield 1.58% fully hedged cost of funds CPR on Agency RMBS of 10.1% for the quarter 2 Non-GAAP measures which include Agency and Non-Agency MBS, other securities and Whole-Loans (including the cost of interest rate swaps), and interest income on IOs and IIOs classified as derivatives. Reflects the $0.60 dividend declared on September 24, 2015 and paid on October 27, 2015. Economic return, for any period, is calculated by taking the sum of (i) the total dividends declared and (ii) the change in net book value during the period and dividing by the beginning book value. Includes all dividends declared during the period from May 15, 2012, the date of WMC’s commencement of initial operations, through September 30, 2015, which amounts to $12.10 per share in total. Non-GAAP measures which include Agency and Non-Agency MBS, other securities and Whole-Loans (including the cost of interest rate swaps) and interest income on IOs and IIOs classified as derivatives, and are weighted averages for the quarter ended September 30, 2015. Third quarter weighted average Constant Prepayment Rate for the Company’s Agency RMBS portfolio on an annualized basis. (5) (3) (5) (1) (5) (2) (5) (4) (6)
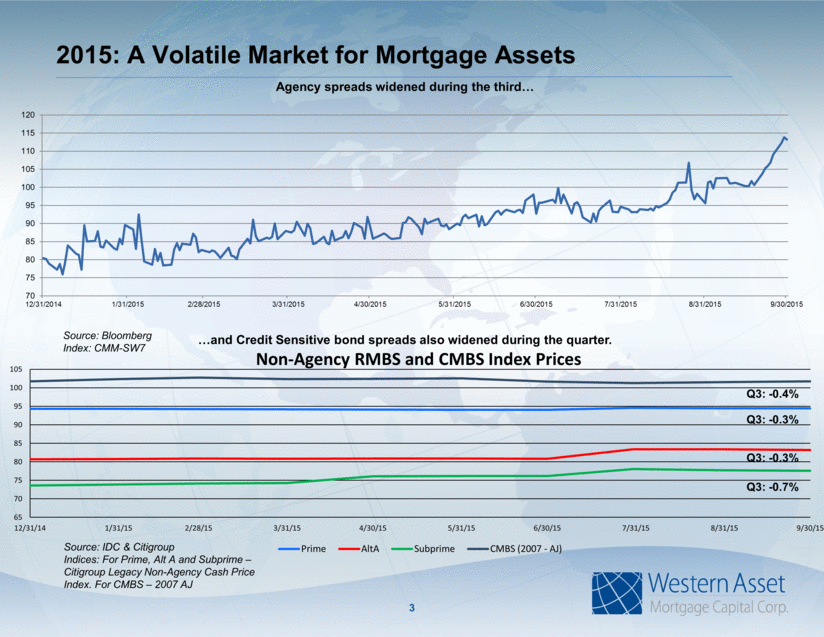
2015: A Volatile Market for Mortgage Assets 3 Agency spreads widened during the third and Credit Sensitive bond spreads also widened during the quarter. Source: IDC & Citigroup Indices: For Prime, Alt A and Subprime – Citigroup Legacy Non-Agency Cash Price Index. For CMBS – 2007 AJ Source: Bloomberg Index: CMM-SW7 Q3: -0.3% Q3: -0.3% Q3: -0.7% Q3: -0.4% 65 70 75 80 85 90 95 100 105 12/31/14 1/31/15 2/28/15 3/31/15 4/30/15 5/31/15 6/30/15 7/31/15 8/31/15 9/30/15 Non - Agency RMBS and CMBS Index Prices Prime AltA Subprime CMBS (2007 - AJ) 70 75 80 85 90 95 100 105 110 115 120 12/31/2014 1/31/2015 2/28/2015 3/31/2015 4/30/2015 5/31/2015 6/30/2015 7/31/2015 8/31/2015 9/30/2015
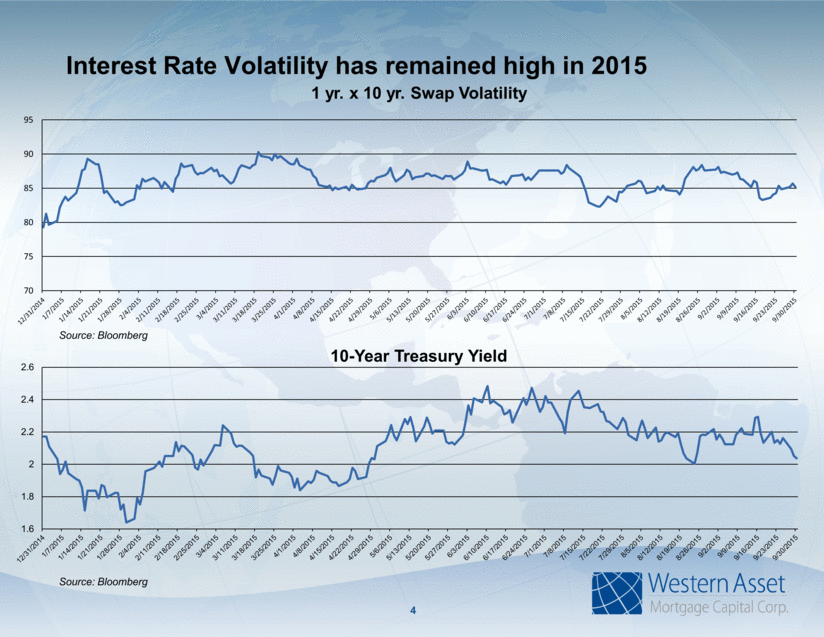
Interest Rate Volatility has remained high in 2015 1 yr. x 10 yr. Swap Volatility 4 Source: Bloomberg 10-Year Treasury Yield Source: Bloomberg 1.6 1.8 2 2.2 2.4 2.6 70 75 80 85 90 95
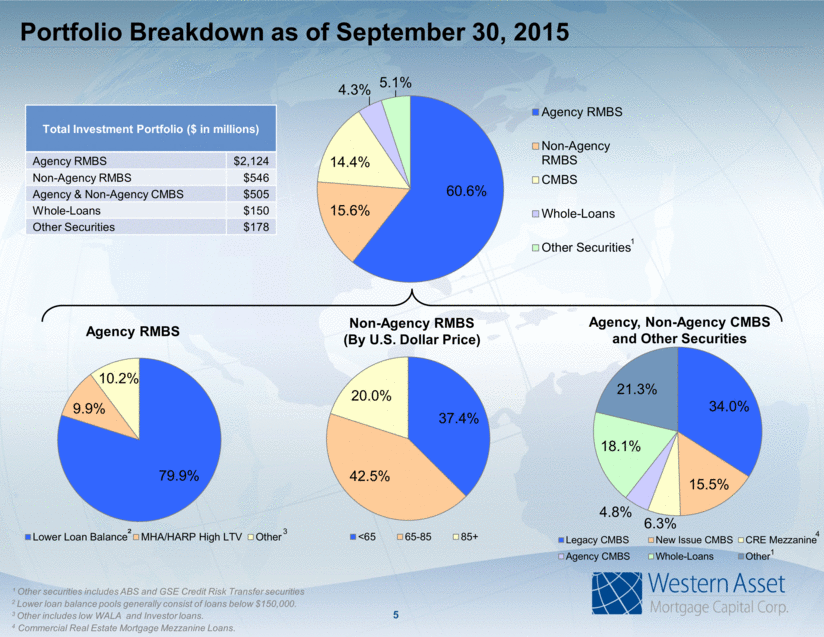
Portfolio Breakdown as of September 30, 2015 ¹ Other securities includes ABS and GSE Credit Risk Transfer securities 2 Lower loan balance pools generally consist of loans below $150,000. 3 Other includes low WALA and Investor loans. 4 Commercial Real Estate Mortgage Mezzanine Loans. Agency RMBS Non-Agency RMBS (By U.S. Dollar Price) Agency, Non-Agency CMBS and Other Securities 3 4 5 Total Investment Portfolio ($ in millions) Agency RMBS $2,124 Non-Agency RMBS $546 Agency & Non-Agency CMBS $505 Whole-Loans $150 Other Securities $178 1 ² 1 37.4% 42.5% 20.0% <65 65-85 85+ 34.0% 15.5% 6.3% 4.8% 18.1% 21.3% Legacy CMBS New Issue CMBS CRE Mezzanine Agency CMBS Whole-Loans Other 79.9% 9.9% 10.2% Lower Loan Balance MHA/HARP High LTV Other 60.6% 15.6% 14.4% 4.3% 5.1% Agency RMBS Non-Agency RMBS CMBS Whole-Loans Other Securities
6 Portfolio Composition as of September 30, 2015 Portfolio ($ in millions) Agency Coupon Principal Balance Amortized Cost Estimated Fair Value 30-year fixed rate 3.5% $203.4 $218.5 $213.8 4.0% $408.8 $442.4 $442.4 4.5% $435.2 $467.0 $481.9 5.5% $3.0 $3.5 $3.4 6.0% $6.6 $7.3 $7.5 20-year fixed rate 3.0% $95.4 $99.5 $99.0 3.5% $152.8 $161.3 $161.7 4.0% $516.0 $544.3 $556.8 Agency RMBS IOs and IIOs¹ 3.5% N/A $148.7 $157.8 Agency CMBS 5.0% $24.7 $24.7 $24.9 Agency CMBS IOs and IIOs2 1.3% N/A $14.9 $15.2 Total Agency 3.6% $2,132.1 $2,164.4 Non-Agency RMBS 3.7% $604.4 $448.8 $458.3 Non-Agency IOs and IIOs3 6.1% N/A $72.4 $87.8 Non-Agency CMBS 5.2% $542.1 $468.0 $464.5 Total Non-Agency 4.8% $989.2 $1,010.6 Other Securities 5.0% $154.5 $179.0 $177.5 Residential Whole-Loans4 5.1% $145.4 $147.3 $150.5 Total Portfolio 4.0% $3,447.6 $3,503.0 Includes $50.1 million of amortized cost and $52.4 million of fair value for Agency RMBS IOs and IIOs accounted for as derivatives for GAAP. Includes $12.5 million of amortized cost and $12.5million of fair value for Agency CMBS IOs and IIOs accounted for as derivatives for GAAP. Includes $3.0 million of amortized cost and $3.8 million of fair value for Non-Agency RMBS IOs and IIOs accounted for as derivatives for GAAP. Residential Whole-Loans are held by a trust whose entire beneficial interest is held by WMC.
5.4x leverage calculation does not reflect net To-Be Announced (“TBA”) mortgage pass-through certificates position. As of September 30, 2015, the net long position in TBAs was $600 million in notional value. Adjusted leverage is a Non-GAAP measure. Non-GAAP measures which include Agency and Non-Agency MBS, other securities and Whole-Loans (including the cost of interest rate swaps), and interest income on IOs and IIOs classified as derivatives, and are weighted averages for the quarter ended September 30, 2015. Includes net interest component related to interest rate swaps. Third quarter weighted average Constant Prepayment Rate for the company’s Agency RMBS portfolio on an annualized basis. Estimated impact of liability hedges on the duration of net assets. Leverage Ratio: 5.4x Leverage Ratio adjusted for TBA position of 6.5x Net Duration of the Agency RMBS portfolio: 0.2 months Agency RMBS Weighted Average Loan Age (“WALA”) of 29.5 months Portfolio Gross Yield: 4.03% Hedge Adjusted Cost of Financing: 1.58% Net Interest Spread: 2.45% Agency RMBS CPR of 10.1% for Q3 Duration Contribution by Maturity Date Key Portfolio Metrics as of September 30, 2015 (2) (2) (1) 7 (4) (3) (4) 2.45 0.09 0.37 0.66 0.93 0.42 -0.02 0.96 0.03 0.18 0.16 0.21 0.26 0.12 0.52 0.04 0.07 0.20 0.19 0.00 0.00 -2.43 -0.22 -0.37 -0.71 -0.82 -0.33 0.02 1.50 -0.06 0.25 0.31 0.51 0.35 0.12
Financing Summary Portfolio Financing ($ in millions – as of September 30, 2015) Repurchase Agreements Repo Outstanding Interest Rate Remaining Days to Maturity Agency RMBS $2,013.0 0.54% 38 Non-Agency RMBS $386.8 1.71% 46 Agency and Non-Agency CMBS $367.7 1.67% 37 Other Securities & Whole Loans $242.8 2.04% 50 Total/Wtd Avg $3,010.3 0.95% 40 8 Master repurchase agreements with 27 counterparties Outstanding borrowing with 19 counterparties Internal credit review Capacity in excess of our current needs
Hedging Summary 9 Includes $1.0 billion of forward starting swaps, starting in 6.0 months. Includes $0.5 billion of forward starting swaps, starting in October 2015. While we use hedging strategies as part of our overall portfolio management, these strategies are not designed to eliminate all risks in the portfolio. There can be no assurance as to the level or effectiveness of these strategies. Fixed Pay Interest Rate Swaps ($ in millions – as of September 30, 2015) Maturity Notional Amount Avg. Fixed Pay Rate Avg. Floating Receive Rate Average Maturity (Years) 1 Year or Less $1,015.3 0.6% 0.3% 0.6 1 Year to 3 Years $1,491.8 1.0% 0.3% 1.6 3 Years to 5 Years $1,204.5 1.9% 0.3% 4.8 >5 Years $1,881.3 3.0% 0.3% 10.3 Total Fixed Pay Rate (1) $5,592.9 1.8% 0.3% 5.0 Other Instruments with Hedging Attributes (3) $105 million of net notional value of pay-fixed interest rate swaptions $261 million of IO’s and inverse IO’s $1.2 billion of Non-Agency RMBS and CMBS and Other Securities Variable Pay Interest Rate Swaps ($ in millions – as of September 30, 2015) Maturity Notional Amount Avg. Fixed Receive Rate Avg. Floating Pay Rate Average Maturity (Years) 3 Years to 5 Years $1,735.8 1.5% 0.3% 4.8 >5 Years $1,203.1 2.2% 0.3% 11.8 Total Floating Pay Rate(2) $2,938.9 1.8% 0.3% 7.7
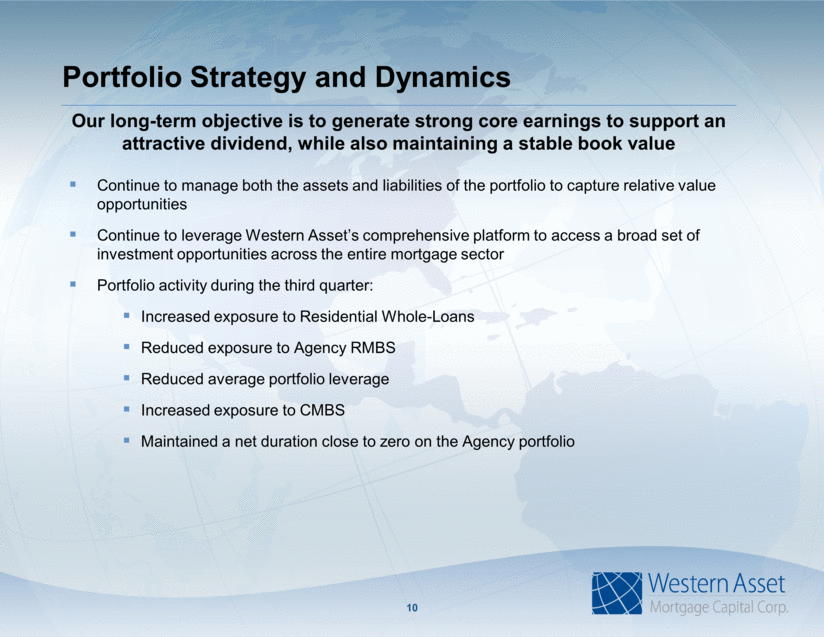
Portfolio Strategy and Dynamics Continue to manage both the assets and liabilities of the portfolio to capture relative value opportunities Continue to leverage Western Asset’s comprehensive platform to access a broad set of investment opportunities across the entire mortgage sector Portfolio activity during the third quarter: Increased exposure to Residential Whole-Loans Reduced exposure to Agency RMBS Reduced average portfolio leverage Increased exposure to CMBS Maintained a net duration close to zero on the Agency portfolio 10 Our long-term objective is to generate strong core earnings to support an attractive dividend, while also maintaining a stable book value
Contact Information 11 Western Asset Mortgage Capital Corporation c/o Financial Profiles, Inc. 11601 Wilshire Blvd., Suite 1920 Los Angeles, CA 90025 www.westernassetmcc.com Investor Relations Contact: Larry Clark Tel: (310) 622-8223 [email protected]
Serious News for Serious Traders! Try StreetInsider.com Premium Free!
You May Also Be Interested In
- Craftsman's Choice Moves Headquarters to Maple Grove, Plans New Exterior Remodeling Showroom
- Celebrating the Winners of the 2026 ‘MADE in NJ’ Manufacturing Day Awards
- Already Own ETH? The $3,300 Ethereum Price Prediction Leaves Room to Consider AlphaPepe With $2.87M Raised
Create E-mail Alert Related Categories
SEC FilingsSign up for StreetInsider Free!
Receive full access to all new and archived articles, unlimited portfolio tracking, e-mail alerts, custom newswires and RSS feeds - and more!
