



Form 8-K WCI Communities, Inc. For: Jul 29
 Tweet
Tweet Share
Share E-mail
UNITED STATES
SECURITIES AND EXCHANGE COMMISSION
Washington, D.C. 20549
FORM 8-K
CURRENT REPORT
Pursuant to Section 13 or 15(d)
of the Securities Exchange Act of 1934
Date of Report (Date of earliest event reported): July 29, 2015
WCI Communities, Inc.
(Exact name of registrant as specified in its charter)
| Delaware | 001-36023 | 27-0472098 | ||
| (State or other jurisdiction of incorporation) |
(Commission File Number) |
(IRS Employer Identification No.) |
| 24301 Walden Center Drive | ||||
| Bonita Springs, Florida | 34134 | |||
| (Address of principal executive offices) | (Zip Code) | |||
Registrant’s telephone number, including area code: (239) 947-2600
Not applicable
(Former name or former address, if changed since last report)
Check the appropriate box below if the Form 8-K filing is intended to simultaneously satisfy the filing obligation of the registrant under any of the following provisions:
| ¨ | Written communications pursuant to Rule 425 under the Securities Act (17 CFR 230.425) |
| ¨ | Soliciting material pursuant to Rule 14a-12 under the Exchange Act (17 CFR 240.14a-12) |
| ¨ | Pre-commencement communications pursuant to Rule 14d-2(b) under the Exchange Act (17 CFR 240.14d-2(b)) |
| ¨ | Pre-commencement communications pursuant to Rule 13e-4(c) under the Exchange Act (17 CFR 240.13e-4(c)) |
| Item 2.02 | Results of Operations and Financial Condition. |
On July 29, 2015, WCI Communities, Inc. (the “Company”) issued a press release regarding its consolidated financial results as of and for the three and six months ended June 30, 2015 (the “Earnings Release”). The full text of the Earnings Release is furnished as Exhibit 99.1 to this Current Report on Form 8-K.
The information furnished under this Item 2.02 (including Exhibit 99.1) shall not be deemed “filed” for purposes of Section 18 of the Securities Exchange Act of 1934, as amended (the “Exchange Act”), or otherwise subject to the liabilities of that section, nor shall it be deemed incorporated by reference in any filing under the Securities Act of 1933, as amended (the “Securities Act”), or the Exchange Act, except as expressly set forth by specific reference in such a filing.
| Item 7.01 | Regulation FD Disclosure. |
In connection with the issuance of the Earnings Release, the Company is holding a public conference call and webcast on July 29, 2015 at 8:30 a.m. (Eastern Time) during which Keith E. Bass, President and Chief Executive Officer, and Russell Devendorf, Senior Vice President and Chief Financial Officer, will make the presentation attached as Exhibit 99.2 to this Current Report on Form 8-K. Information regarding access to the conference call and webcast is set forth in the Earnings Release.
The information furnished under this Item 7.01 (including Exhibit 99.2) shall not be deemed “filed” for purposes of Section 18 of the Exchange Act, or otherwise subject to the liabilities of that section, nor shall it be deemed incorporated by reference in any filing under the Securities Act or the Exchange Act, except as expressly set forth by specific reference in such a filing.
| Item 9.01 | Financial Statements and Exhibits. |
| (d) | Exhibits. |
The exhibits listed below shall be deemed to be furnished and not “filed.”
| Exhibit Number |
Description of Exhibit | |
| 99.1 | Earnings press release issued by the Company on July 29, 2015. | |
| 99.2 | Presentation of the Company on July 29, 2015. | |
2
SIGNATURES
Pursuant to the requirements of the Securities Exchange Act of 1934, the registrant has duly caused this report to be signed on its behalf by the undersigned hereunto duly authorized.
| WCI COMMUNITIES, INC. |
| /s/ Vivien N. Hastings |
| Vivien N. Hastings |
| Senior Vice President, Secretary and General Counsel |
Date: July 29, 2015
3
INDEX TO EXHIBITS
| Exhibit Number |
Description of Exhibit | |
| 99.1 | Earnings press release issued by the Company on July 29, 2015. | |
| 99.2 | Presentation of the Company on July 29, 2015. | |
4
Exhibit 99.1
WCI Communities Announces 2015 Second Quarter Results
Bonita Springs, Fla, July 29, 2015 — WCI Communities, Inc. (NYSE: WCIC), a lifestyle community developer and luxury homebuilder, today announced results for the second quarter ended June 30, 2015.
Second Quarter 2015 Highlights and Selected Comparisons to Second Quarter 2014
| • | New orders of 300, up 53.8% |
| • | Contract value of new orders of $128.6 million, up 37.4% |
| • | Quarter-end active selling neighborhood count of 45, up 60.7% |
| • | Deliveries of 243, up 69.9% |
| • | Average selling price per home delivered of $476,000, up 11.7% |
| • | Backlog units totaling 627, up 44.8% |
| • | Backlog contract value of $294.1 million, up 27.9% |
| • | Revenues from homes delivered of $115.6 million, up 89.8% |
| • | Adjusted gross margin from homes delivered of 29.1% |
| • | Selling, general and administrative (“SG&A”) expenses as a percentage of Homebuilding revenues improved by 350 basis points |
| • | Real Estate Services gross margin of $2.1 million, up 40.0% |
| • | Adjusted EBITDA of $20.7 million, up 102.4% |
| • | Income from operations before income taxes of $15.9 million, up 120.8% |
| • | Net income attributable to common shareholders of $9.8 million, up 126.4% |
| • | Earnings per diluted share of $0.37, up 117.6% |
| • | Net debt to net capitalization of 18.7% |
| • | Approximately 13,500 owned or controlled home sites, up 30.3% |
Six Months Ended June 30, 2015 and Selected Comparisons to Prior Year
| • | New Orders of 616, up 54.0% |
| • | Contract value of new orders of $269.4 million, up 38.4% |
| • | Deliveries of 381, up 46.5% |
| • | Average selling price per home delivered of $479,000, up 14.3% |
| • | Revenues from homes delivered of $182.6 million, up 67.7% |
| • | SG&A expenses as a percentage of Homebuilding revenues improved by 330 basis points |
| • | Real Estate Services gross margin of $3.0 million, up 114.3% |
| • | Adjusted EBITDA of $30.7 million, up 93.5% |
| • | Income from operations before income taxes of $22.8 million, up 115.0% |
| • | Net income attributable to common shareholders of $15.5 million, up 165.9% |
| • | Earnings per diluted share of $0.59, up 168.2% |
Management Comments
Keith Bass, the Company’s President and Chief Executive Officer commented, “Demand for our homes and communities remains robust, supported by strong fundamentals in the attractive Florida real estate market. WCI Communities continues to scale and generate meaningful growth across our key operating metrics. The performance of our entire team has resulted in significant improvement in the profitability of the business, as Adjusted EBITDA and EPS in the second quarter have both more than doubled from a year ago.” Mr. Bass added, “In addition, we added over 1,000 home sites to our controlled home site inventory in the quarter to continue to position the company for sustained growth.”
Second Quarter 2015 Results
The Company generated total revenues of $150.7 million for the quarter ended June 30, 2015, an increase of $57.8 million, or 62.0%, compared to $93.0 million in the second quarter of 2014. Compared to the prior year period, Homebuilding revenues grew 89.8%, Real Estate Services revenues were up 9.8% and Amenities revenues increased by 9.1%.
1
The Company delivered 243 homes in the second quarter, an increase of 100 units, or 69.9% from the prior year period. The average selling price per home delivered during the quarter ended June 30, 2015 was $476,000, an increase of 11.7%, compared to $426,000 in the prior year period. Adjusted gross margin from homes delivered, a non-GAAP financial measure, was 29.1% in the quarter ended June 30, 2015.
For the quarter ended June 30, 2015, net income attributable to common shareholders was $9.8 million, or $0.37 per diluted share, compared to $4.3 million and $0.17, respectively, in the prior year period.
New orders during the second quarter of 2015 increased 53.8% to 300 homes and the contract value of new orders was $128.6 million for the second quarter, an increase of 37.4% from the prior year period.
As of June 30, 2015, backlog contract value was $294.1 million, an increase of $64.1 million, or 27.9% from June 30, 2014. Backlog units totaled 627 units at the end of the second quarter, representing a 194 unit, or 44.8% increase from the prior year.
Conference Call
As previously announced, the Company will host a conference call to discuss the 2015 second quarter results on Wednesday, July 29, 2015 at 8:30 a.m. (ET). A slide presentation for the call will be available on the Investors section of the Company’s website at investors.WCICommunities.com. The conference call can be accessed live over the phone by dialing (877) 407-0784, or for international callers, (201) 689-8560. A telephonic replay will be available after the call and can be accessed by dialing (877) 870-5176, or for international callers, (858) 384-5517. The passcode for both the live call and the replay is 13613222. The replay will be available until 11:59 p.m. (ET) on August 12, 2015.
Shareholders, investors and other interested parties may also listen to a webcast of the conference call by logging onto the Investors section of the Company’s website at investors.WCICommunities.com. The on-line replay will be available for a limited time beginning approximately two hours following the call.
Use of Non-GAAP Financial Measures
In addition to the financial measures prepared in accordance with U.S. generally accepted accounting principles (“GAAP”), this press release contains the non-GAAP financial measures of EBITDA, Adjusted EBITDA , Adjusted gross margin from homes delivered and net debt to net capitalization. The reasons for the use of these measures, a reconciliation of these measures to the most directly comparable GAAP measures and other information relating to these measures are included below following the unaudited consolidated financial statements.
About WCI Communities, Inc.
WCI Communities is a lifestyle community developer and luxury homebuilder of single- and multi-family homes in most of coastal Florida’s highest growth and largest markets. With a legacy that spans more than 60 years, WCI Communities has an established expertise in developing amenity-rich, lifestyle-oriented master-planned communities, catering to move-up, second-home and active adult buyers. Headquartered in Bonita Springs, Florida, WCI Communities is a fully integrated homebuilder and developer with complementary real estate brokerage and title services businesses.
To learn more about WCI Communities, please visit the Company’s website at WCICommunities.com.
2
Forward-Looking Statements
Any statements made in this press release that are not statements of historical fact, including statements about the Company’s beliefs and expectations, are forward-looking statements within the meaning of the federal securities laws, and should be evaluated as such. These forward-looking statements include, but are not limited to, statements we make regarding our ability to leverage overhead costs and increase profitability, our expectations with respect to future growth, and market conditions. The Company bases these forward-looking statements or projections on its current expectations, plans and assumptions that it has made in light of its experience in the industry, as well as its perceptions of historical trends, current conditions, expected future developments and other factors it believes are appropriate under the circumstances and at such time. Actual results could differ materially from those expressed or implied by the forward-looking statements. Important factors that could cause actual results to differ materially from those in the forward-looking statements include, but are not limited to: a slowing or reversal of the recovery of the housing market, either on a national level or in Florida; changing local and economic conditions and the cyclical nature of the housing business; rising levels of unemployment; substantial increases in mortgage interest rates or the unavailability of mortgage financing; our ability to utilize our net operating loss carryforwards in the future; tax law and interest rate changes that could make home ownership more expensive or less attractive; and poor weather conditions or natural disasters. For more information concerning these and other important factors that could cause actual results to differ materially from those contained in the forward-looking statements, please refer to the Company’s “Risk Factors” in Item 1A of Part I of our Annual Report on Form 10-K for the year ended December 31, 2014 that was filed by the Company with the Securities and Exchange Commission on February 25, 2015 and elsewhere therein, and subsequent filings by the Company. As you read and consider this press release, you should understand that the forward-looking statements are not guarantees of performance or results. The forward-looking statements and projections are subject to and involve risks, uncertainties and assumptions and you should not place undue reliance on these forward-looking statements or projections. Although the Company believes that these forward-looking statements and projections are based on reasonable assumptions at the time they are made, you should be aware that many factors could affect the Company’s actual financial results or results of operations and could cause actual results to differ materially from those expressed or implied in the forward-looking statements and projections. The Company undertakes no obligation to update or revise any forward-looking statements, whether as a result of new information, future events or otherwise. If the Company does update one or more forward-looking statement, there should be no inference that it will make additional updates with respect to those or its other forward-looking statements.
3
WCI Communities, Inc.
Consolidated Balance Sheets
(in thousands, except share and per share amounts)
| June 30, 2015 |
December 31, 2014 |
|||||||
| (unaudited) | ||||||||
| Assets |
||||||||
| Cash and cash equivalents |
$ | 146,015 | $ | 174,756 | ||||
| Restricted cash |
15,593 | 12,125 | ||||||
| Notes and accounts receivable |
5,436 | 5,637 | ||||||
| Real estate inventories |
510,985 | 449,249 | ||||||
| Property and equipment, net |
24,704 | 25,021 | ||||||
| Other assets |
23,912 | 20,179 | ||||||
| Deferred tax assets, net of valuation allowances |
103,609 | 110,823 | ||||||
| Goodwill |
7,520 | 7,520 | ||||||
|
|
|
|
|
|||||
| Total assets |
$ | 837,774 | $ | 805,310 | ||||
|
|
|
|
|
|||||
| Liabilities and Equity |
||||||||
| Accounts payable |
$ | 20,177 | $ | 20,040 | ||||
| Accrued expenses and other liabilities |
70,951 | 68,986 | ||||||
| Customer deposits |
43,386 | 30,662 | ||||||
| Senior notes, including unamortized premiums of $1,106 and $1,179 at |
251,106 | 251,179 | ||||||
|
|
|
|
|
|||||
| Total liabilities |
385,620 | 370,867 | ||||||
|
|
|
|
|
|||||
| WCI Communities, Inc. shareholders’ equity: |
||||||||
| Preferred stock, $0.01 par value; 15,000,000 shares authorized, none issued |
— | — | ||||||
| Common stock, $0.01 par value; 150,000,000 shares authorized, |
259 | 259 | ||||||
| Additional paid-in capital |
304,204 | 302,111 | ||||||
| Retained earnings |
146,053 | 130,581 | ||||||
| Treasury stock, at cost, 43,778 shares at both June 30, 2015 and December 31, 2014 |
(505 | ) | (505 | ) | ||||
|
|
|
|
|
|||||
| Total WCI Communities, Inc. shareholders’ equity |
450,011 | 432,446 | ||||||
| Noncontrolling interests in consolidated joint ventures |
2,143 | 1,997 | ||||||
|
|
|
|
|
|||||
| Total equity |
452,154 | 434,443 | ||||||
|
|
|
|
|
|||||
| Total liabilities and equity |
$ | 837,774 | $ | 805,310 | ||||
|
|
|
|
|
|||||
4
WCI Communities, Inc.
Consolidated Statements of Operations
(in thousands, except per share amounts)
(unaudited)
| Three Months Ended June 30, | Six Months Ended June 30, | |||||||||||||||
| 2015 | 2014 | 2015 | 2014 | |||||||||||||
| Revenues |
||||||||||||||||
| Homebuilding |
$ | 115,565 | $ | 60,918 | $ | 182,612 | $ | 108,913 | ||||||||
| Real estate services |
29,107 | 26,499 | 51,873 | 44,962 | ||||||||||||
| Amenities |
6,038 | 5,542 | 13,927 | 12,864 | ||||||||||||
|
|
|
|
|
|
|
|
|
|||||||||
| Total revenues |
150,710 | 92,959 | 248,412 | 166,739 | ||||||||||||
|
|
|
|
|
|
|
|
|
|||||||||
| Cost of Sales |
||||||||||||||||
| Homebuilding |
84,676 | 43,869 | 133,224 | 78,417 | ||||||||||||
| Real estate services |
26,991 | 25,004 | 48,875 | 43,586 | ||||||||||||
| Amenities |
6,827 | 6,079 | 13,969 | 12,895 | ||||||||||||
|
|
|
|
|
|
|
|
|
|||||||||
| Total cost of sales |
118,494 | 74,952 | 196,068 | 134,898 | ||||||||||||
|
|
|
|
|
|
|
|
|
|||||||||
| Gross margin |
32,216 | 18,007 | 52,344 | 31,841 | ||||||||||||
|
|
|
|
|
|
|
|
|
|||||||||
| Selling, general and administrative expenses |
16,213 | 10,670 | 29,304 | 20,992 | ||||||||||||
| Interest expense |
198 | 187 | 458 | 685 | ||||||||||||
| Other income, net |
(99 | ) | (63 | ) | (195 | ) | (428 | ) | ||||||||
|
|
|
|
|
|
|
|
|
|||||||||
| 16,312 | 10,794 | 29,567 | 21,249 | |||||||||||||
|
|
|
|
|
|
|
|
|
|||||||||
| Income from operations before income taxes |
15,904 | 7,213 | 22,777 | 10,592 | ||||||||||||
| Income tax expense |
6,187 | 2,974 | 7,103 | 4,634 | ||||||||||||
|
|
|
|
|
|
|
|
|
|||||||||
| Net income |
9,717 | 4,239 | 15,674 | 5,958 | ||||||||||||
| Net loss (income) attributable to noncontrolling interests |
103 | 99 | (202 | ) | (140 | ) | ||||||||||
|
|
|
|
|
|
|
|
|
|||||||||
| Net income attributable to common shareholders of |
$ | 9,820 | $ | 4,338 | $ | 15,472 | $ | 5,818 | ||||||||
|
|
|
|
|
|
|
|
|
|||||||||
| Earnings per share attributable to common shareholders of |
||||||||||||||||
| Basic |
$ | 0.38 | $ | 0.17 | $ | 0.59 | $ | 0.22 | ||||||||
|
|
|
|
|
|
|
|
|
|||||||||
| Diluted |
$ | 0.37 | $ | 0.17 | $ | 0.59 | $ | 0.22 | ||||||||
|
|
|
|
|
|
|
|
|
|||||||||
| Weighted average number of shares of common stock outstanding: |
||||||||||||||||
| Basic |
26,186 | 26,020 | 26,183 | 26,017 | ||||||||||||
|
|
|
|
|
|
|
|
|
|||||||||
| Diluted |
26,449 | 26,278 | 26,416 | 26,255 | ||||||||||||
|
|
|
|
|
|
|
|
|
|||||||||
5
WCI Communities, Inc.
Consolidated Statements of Cash Flows
(in thousands)
(unaudited)
| Six Months Ended June 30, | ||||||||
| 2015 | 2014 | |||||||
| Operating activities |
||||||||
| Net income |
$ | 15,674 | $ | 5,958 | ||||
| Adjustments to reconcile net income to net cash used in operating activities: |
||||||||
| Amortization of debt issuance costs |
457 | 398 | ||||||
| Amortization of debt premium |
(73 | ) | — | |||||
| Depreciation |
1,467 | 1,232 | ||||||
| Provision for (recovery of) bad debts |
(102 | ) | 108 | |||||
| Loss on disposition of property and equipment |
63 | — | ||||||
| Deferred income tax expense |
7,230 | 4,634 | ||||||
| Stock-based compensation expense |
2,077 | 1,685 | ||||||
| Changes in assets and liabilities: |
||||||||
| Restricted cash |
(3,468 | ) | (3,391 | ) | ||||
| Notes and accounts receivable |
303 | 1,748 | ||||||
| Real estate inventories |
(62,550 | ) | (105,394 | ) | ||||
| Other assets |
(4,190 | ) | (775 | ) | ||||
| Accounts payable and other liabilities |
2,510 | (786 | ) | |||||
| Customer deposits |
12,724 | 12,461 | ||||||
|
|
|
|
|
|||||
| Net cash used in operating activities |
(27,878 | ) | (82,122 | ) | ||||
|
|
|
|
|
|||||
| Investing activities |
||||||||
| Additions to property and equipment |
(807 | ) | (1,801 | ) | ||||
|
|
|
|
|
|||||
| Net cash used in investing activities |
(807 | ) | (1,801 | ) | ||||
|
|
|
|
|
|||||
| Financing activities |
||||||||
| Proceeds from the issuance of senior notes |
— | 51,250 | ||||||
| Accrued interest received from senior noteholders |
— | 1,251 | ||||||
| Payments of debt issuance costs |
— | (869 | ) | |||||
| Proceeds from the sale of community development district bonds |
— | 21,673 | ||||||
| Payments of community development district obligations |
— | (936 | ) | |||||
| Purchases of treasury stock |
— | (178 | ) | |||||
| Distributions to noncontrolling interests |
(56 | ) | (78 | ) | ||||
|
|
|
|
|
|||||
| Net cash provided by (used in) financing activities |
(56 | ) | 72,113 | |||||
|
|
|
|
|
|||||
| Net decrease in cash and cash equivalents |
(28,741 | ) | (11,810 | ) | ||||
| Cash and cash equivalents at the beginning of the period |
174,756 | 213,352 | ||||||
|
|
|
|
|
|||||
| Cash and cash equivalents at the end of the period |
$ | 146,015 | $ | 201,542 | ||||
|
|
|
|
|
|||||
6
Reconciliation of Non-GAAP Financial Measures
In addition to the results reported in accordance with U.S. generally accepted accounting principles (“GAAP”), we have provided information in this press release relating to adjusted gross margin from homes delivered, EBITDA and Adjusted EBITDA (both such terms are defined below), and net debt to net capitalization. Our GAAP-based measures can be found in our unaudited consolidated financial statements in Item 1 of the Quarterly Report on Form 10-Q for the quarter ended June 30, 2015 that we plan to file with the Securities and Exchange Commission on or before July 31, 2015.
Adjusted Gross Margin from Homes Delivered
We calculate adjusted gross margin from homes delivered by subtracting the gross margin from land and home sites, if any, from Homebuilding gross margin to arrive at gross margin from homes delivered. Adjusted gross margin from homes delivered is calculated by adding asset impairments, if any, and capitalized interest in cost of sales to gross margin from homes delivered. Management uses adjusted gross margin from homes delivered to evaluate operating performance in our Homebuilding segment and make strategic decisions regarding sales price, construction and development pace, product mix and other operating decisions. We believe that adjusted gross margin from homes delivered is (i) meaningful because it isolates the impact that our indebtedness and asset impairments have on gross margin and (ii) relevant and useful to shareholders, investors and other interested parties for evaluating our comparative operating performance from period to period and among companies within the homebuilding industry as it is reflective of overall profitability during any given reporting period. This measure is considered a non-GAAP financial measure and should be considered in addition to, rather than as a substitute for, the comparable GAAP financial measures when evaluating our operating performance. Although other companies in the homebuilding industry report similar information, they may calculate the measure differently than we do and, therefore, may not be comparable. We urge shareholders, investors and other interested parties to understand the methods used by other companies in the homebuilding industry to calculate gross margins and any adjustments to such amounts before comparing our measures to those of such other companies.
The table below reconciles adjusted gross margin from homes delivered to the most directly comparable GAAP financial measure, Homebuilding gross margin, for the periods presented herein.
| Three Months Ended June 30, | Six Months Ended June 30, | |||||||||||||||
| 2015 | 2014 | 2015 | 2014 | |||||||||||||
| ($ in thousands) | ||||||||||||||||
| Homebuilding gross margin |
$ | 30,889 | $ | 17,049 | $ | 49,388 | $ | 30,496 | ||||||||
| Less: gross margin from land and home sites |
— | — | — | — | ||||||||||||
|
|
|
|
|
|
|
|
|
|||||||||
| Gross margin from homes delivered |
30,889 | 17,049 | 49,388 | 30,496 | ||||||||||||
| Add: capitalized interest in cost of sales |
2,740 | 1,282 | 4,364 | 2,267 | ||||||||||||
|
|
|
|
|
|
|
|
|
|||||||||
| Adjusted gross margin from homes delivered |
$ | 33,629 | $ | 18,331 | $ | 53,752 | $ | 32,763 | ||||||||
|
|
|
|
|
|
|
|
|
|||||||||
| Gross margin from homes delivered as a percentage of revenues from homes delivered |
26.7 | % | 28.0 | % | 27.0 | % | 28.0 | % | ||||||||
|
|
|
|
|
|
|
|
|
|||||||||
| Adjusted gross margin from homes delivered as a percentage of revenues from homes delivered |
29.1 | % | 30.1 | % | 29.4 | % | 30.1 | % | ||||||||
|
|
|
|
|
|
|
|
|
|||||||||
EBITDA and Adjusted EBITDA
Adjusted EBITDA measures performance by adjusting net income (loss) attributable to common shareholders of WCI Communities, Inc. to exclude, if any, interest expense, capitalized interest in cost of sales, income taxes, depreciation (‘‘EBITDA’’), preferred stock dividends, income (loss) from discontinued operations, other income, stock-based compensation expense, asset impairments and expenses related to early repayment of debt. We believe that the presentation of Adjusted EBITDA provides useful information to shareholders, investors and other interested parties regarding our results of operations because it assists
7
those parties and us when analyzing and benchmarking the performance and value of our business. We also believe that Adjusted EBITDA is useful as a measure of comparative operating performance from period to period and among companies in the homebuilding industry as it is reflective of changes in pricing decisions, cost controls and other factors that affect operating performance, and it removes the effects of our capital structure (such as preferred stock dividends and interest expense), asset base (primarily depreciation), items outside of our control (primarily income taxes) and the volatility related to the timing and extent of non-operating activities (such as discontinued operations and asset impairments). Accordingly, we believe that this measure is useful for comparing general operating performance from period to period. Other companies may define Adjusted EBITDA differently and, as a result, our measure of Adjusted EBITDA may not be directly comparable to Adjusted EBITDA of other companies. Although we use Adjusted EBITDA as a financial measure to assess the performance of our business, the use of Adjusted EBITDA is limited because it does not include certain material costs, such as interest and income taxes, necessary to operate our business. EBITDA and Adjusted EBITDA should be considered in addition to, and not as substitutes for, net income (loss) in accordance with GAAP as a measure of performance. Our presentation of EBITDA and Adjusted EBITDA should not be construed as an indication that our future results will be unaffected by unusual or nonrecurring items. Our EBITDA-based measures have limitations as analytical tools and, therefore, shareholders, investors and other interested parties should not consider them in isolation or as substitutes for analyses of our results as reported under GAAP. Some such limitations are:
| • | they do not reflect the impact of earnings or charges resulting from matters that we consider not to be indicative of our ongoing operations; |
| • | they are not adjusted for all non-cash income or expense items that are reflected in our consolidated statements of cash flows; |
| • | they do not reflect the interest that is necessary to service our debt; and |
| • | other companies in our industry may calculate these measures differently than we do, thereby limiting their usefulness as comparative measures. |
Because of these limitations, our EBITDA-based measures are not intended to be alternatives to net income (loss), indicators of our operating performance, alternatives to any other measure of performance in conformity with GAAP or alternatives to cash flow provided by (used in) operating activities as measures of liquidity. Shareholders, investors and other interested parties should therefore not place undue reliance on our EBITDA-based measures or ratios calculated using those measures.
8
The table below reconciles EBITDA and Adjusted EBITDA to the most directly comparable GAAP financial measure, net income attributable to common shareholders of WCI Communities, Inc., for the periods presented herein.
| Three Months Ended June 30, | Six Months Ended June 30, | |||||||||||||||
| 2015 | 2014 | 2015 | 2014 | |||||||||||||
| ($ in thousands) | ||||||||||||||||
| Net income attributable to common shareholders of WCI Communities, Inc. |
$ | 9,820 | $ | 4,338 | $ | 15,472 | $ | 5,818 | ||||||||
| Interest expense |
198 | 187 | 458 | 685 | ||||||||||||
| Capitalized interest in cost of sales (1) |
2,740 | 1,282 | 4,364 | 2,267 | ||||||||||||
| Income tax expense |
6,187 | 2,974 | 7,103 | 4,634 | ||||||||||||
| Depreciation |
758 | 644 | 1,467 | 1,232 | ||||||||||||
|
|
|
|
|
|
|
|
|
|||||||||
| EBITDA |
19,703 | 9,425 | 28,864 | 14,636 | ||||||||||||
| Other income, net |
(99 | ) | (63 | ) | (195 | ) | (428 | ) | ||||||||
| Stock-based compensation expense (2) |
1,110 | 873 | 2,077 | 1,685 | ||||||||||||
|
|
|
|
|
|
|
|
|
|||||||||
| Adjusted EBITDA |
$ | 20,714 | $ | 10,235 | $ | 30,746 | $ | 15,893 | ||||||||
|
|
|
|
|
|
|
|
|
|||||||||
| Adjusted EBITDA margin |
13.7 | % | 11.0 | % | 12.4 | % | 9.5 | % | ||||||||
|
|
|
|
|
|
|
|
|
|||||||||
| (1) | Represents capitalized interest expensed in cost of sales on home deliveries and land and home site sales. |
| (2) | Represents the expense recorded in the Company’s unaudited consolidated statements of operations related to its stock-based compensation plans. |
Net Debt to Net Capitalization
We believe that net debt to net capitalization provides useful information to shareholders, investors and other interested parties regarding our financial position and cash and debt management. It is also a relevant financial measure for understanding the leverage employed in our operations and as an indicator of our ability to obtain future financing.
By deducting cash and cash equivalents from our outstanding debt, we provide a measure of our debt that considers our cash position. We believe that this approach provides useful information because the ratio of debt to capital does not consider our cash and cash equivalents and we believe that a debt ratio net of cash, such as net debt to net capitalization, provides supplemental information by which our financial position may be considered. Shareholders, investors and other interested parties may also find this information to be helpful when comparing our leverage to the leverage of other companies in our industry that present similar information.
9
The table below presents the computations of our net debt to net capitalization and reconciles such amounts to the most directly comparable GAAP financial measure, debt to capital.
| June 30, 2015 |
December 31, 2014 |
|||||||
| ($ in thousands) | ||||||||
| Senior Notes due 2021 |
$ | 251,106 | $ | 251,179 | ||||
| Total equity |
452,154 | 434,443 | ||||||
|
|
|
|
|
|||||
| Total capital |
$ | 703,260 | $ | 685,622 | ||||
|
|
|
|
|
|||||
| Debt to capital (1) |
35.7 | % | 36.6 | % | ||||
|
|
|
|
|
|||||
| Senior Notes due 2021 |
$ | 251,106 | $ | 251,179 | ||||
| Less: unamortized premium |
1,106 | 1,179 | ||||||
|
|
|
|
|
|||||
| Principal amount of Senior Notes due 2021 |
250,000 | 250,000 | ||||||
| Less: cash and cash equivalents |
146,015 | 174,756 | ||||||
|
|
|
|
|
|||||
| Net debt |
103,985 | 75,244 | ||||||
| Total equity |
452,154 | 434,443 | ||||||
|
|
|
|
|
|||||
| Net capitalization |
$ | 556,139 | $ | 509,687 | ||||
|
|
|
|
|
|||||
| Net debt to net capitalization (2) |
18.7 | % | 14.8 | % | ||||
|
|
|
|
|
|||||
| (1) | Debt to capital is computed by dividing the carrying value of our Senior Notes due 2021, as reported on our consolidated balance sheets, by total capital as calculated above. The Senior Notes due 2021 were our only outstanding debt as of June 30, 2015 and December 31, 2014. |
| (2) | Net debt to net capitalization is computed by dividing net debt by net capitalization. |
Investor Relations Contact:
Scott Bowles – [email protected] – (239) 498-8481
10
 WCI
Communities Second Quarter 2015 Earnings Conference Call
July 29, 2015 Exhibit 99.2 |
 Disclosure
Statement This presentation contains forward-looking statements. All
statements that are not statements of historical fact, including
statements about the Company’s beliefs and expectations, are forward-looking
statements within the meaning of the federal securities laws and should
be evaluated as such. Forward-looking statements include information concerning the Company’s future goals, expected growth, market conditions and outlook (including the estimates, forecasts, statements and projections
relating to Florida or national markets prepared by John Burns Real Estate Consulting),
expected liquidity and possible or assumed future results of operations,
including descriptions of its business plan and strategies. These forward-looking statements may be identified by the use of such forward-looking terminology, including the terms “believe,” “estimate,”
“project,” “anticipate,” “expect,”
“seek,” “predict,” “contemplate,” “continue,” “possible,” “intend,” “may,” “might,” “will,” “could,” “would,” “should,”
“forecast,” or “assume” or, in each case, their
negative, or other variations or comparable terminology. For more
information concerning factors that could cause actual results to differ materially from those contained in the forward- looking statements, please refer to “Risk Factors” in Item 1A of Part I of our Annual Report on Form 10-K for the year ended
December 31, 2014 that was filed by the Company with the Securities and
Exchange Commission on February 25, 2015 and elsewhere therein, and
subsequent filings by the Company. The Company bases these forward-looking statements or projections on its current expectations, plans and assumptions that it has made in light of its experience in the industry, as well as its
perceptions of historical trends, current conditions, expected future developments and
other factors it believes are appropriate under the circumstances and at
such time. As you read and consider this presentation, you should understand that these statements are not guarantees of performance or results. The forward-looking statements and projections are subject to and
involve risks, uncertainties and assumptions and you should not place undue reliance on
these forward-looking statements or projections. Although the Company
believes that these forward-looking statements and projections are based on reasonable assumptions at the time they are made, you should be aware that many factors could affect the Company’s actual financial
results or results of operations and could cause actual results to differ
materially from those expressed in the forward-looking statements and
projections. The Company undertakes no obligation to update or revise any forward-looking statements, whether as a result of new information, future events or otherwise. If the Company does update one or more forward-looking statements, there should be
no inference that it will make additional updates with respect to those or other
forward-looking statements. In addition to the financial measures
prepared in accordance with U.S. generally accepted accounting principles (“GAAP”), this presentation contains the non-GAAP financial measures EBITDA, Adjusted EBITDA, Adjusted gross margin from homes delivered
and net debt to net capitalization.
The reasons for the use of these measures, a reconciliation of these measures to the
most directly comparable GAAP measures and other information relating to
these measures are included in the appendix to this presentation.
2 |
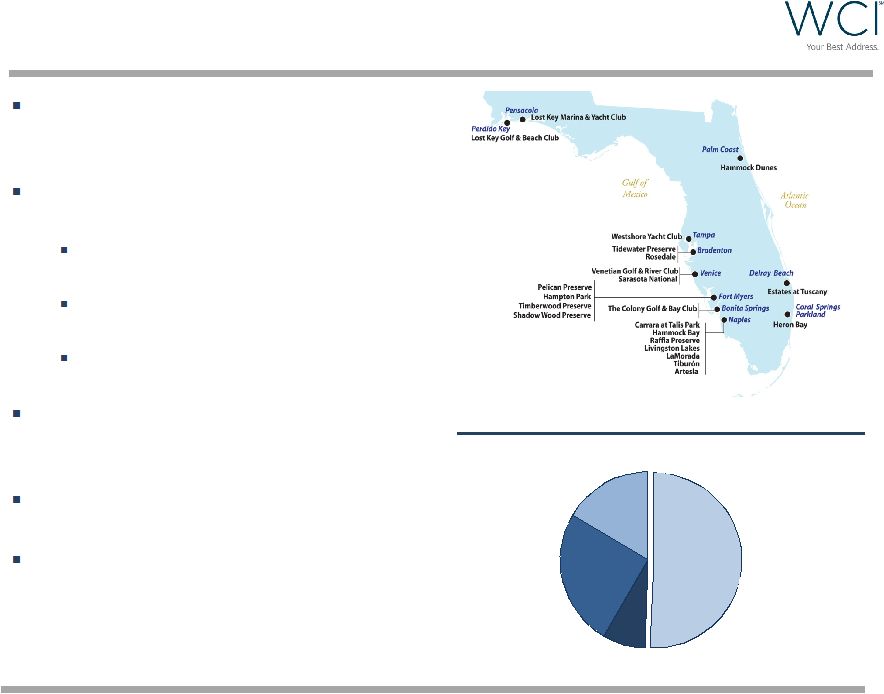 Cash 50.6% LTV > 80% 7.8% LTV 65 - 80% 25.1% LTV 1 - 64% 16.5% Loan to Value Percentage (“LTV”) – 2Q15 Deliveries WCI Communities at a Glance Lifestyle community developer and luxury homebuilder throughout Florida Target move-up, second-home and active adult customers High average selling prices - $476,000 on 2Q15 deliveries High proportion of cash buyers – 51% of 2Q15 deliveries Low cancellation rate – 8.3% during 2Q15 Approximately 13,500 home sites owned or controlled as of June 30, 2015 Conservative balance sheet with $146 million of cash Complementary and value-add Real Estate Services (“RES”) and Amenities businesses 3 Buyer Profile with Low Reliance on Financing |
 Compelling
Florida Real Estate Market Florida building permits
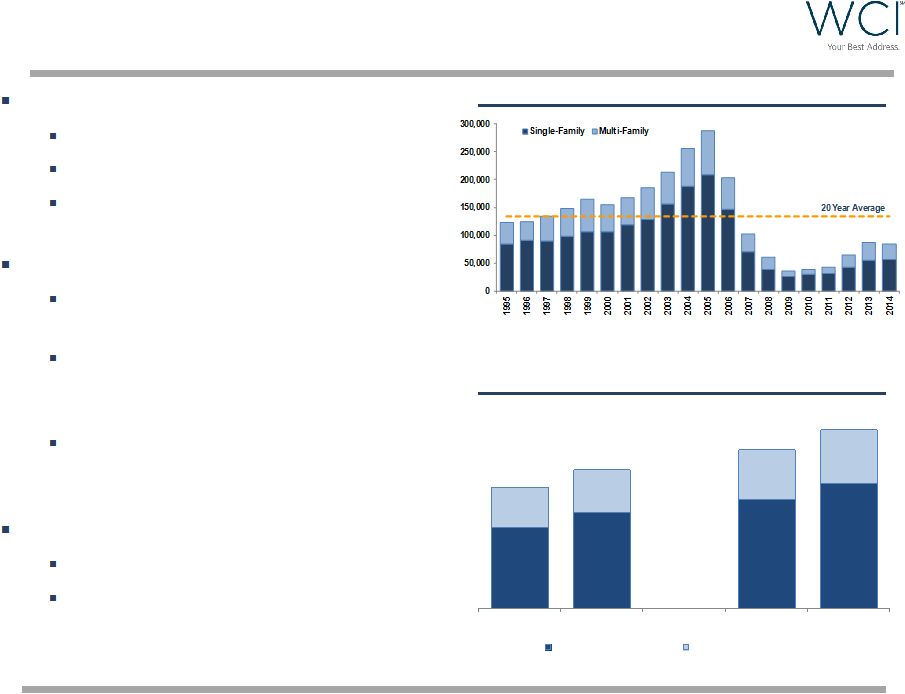
(1) Second highest in the U.S. in 2014 Permits still ~70% off peak YTD May 2015 building permits are up 23% vs. prior year Florida is a leading growth state Job growth rate of 3.4%; higher than national average of 2.1% (2) Nine of the top 18 U.S. cities forecast to see the most economic growth are located in Florida (3) 25 Florida locations were named the best places to retire; more than double any other state (4) 2015 resale statistics (5) 1H15 closings up 13.6% over 1H14 43rd
consecutive month median sales
prices increased year-over-year
4 (1) U.S. Census Bureau (2) Florida Department of Economic Opportunity; July 17, 2015 (3) U.S. Conference of Mayors with HIS Global Insight; BloombergBusiness article – June 19, 2015 (4) TopRetirements.com 9 th annual survey of the 100 most popular retirement spots; February 21, 2015 (5) Florida Realtors ® Florida Annual Permit Activity (1) Strong Growth in Florida Resale Closings in 2015 (5) 50,251 59,599 67,579 77,724 24,860 26,637 30,918 33,183 75,111 86,236 98,497 110,907 1Q14 1Q15 2Q14 2Q15 Single-Family Resale Condo/Townhouse Resale |
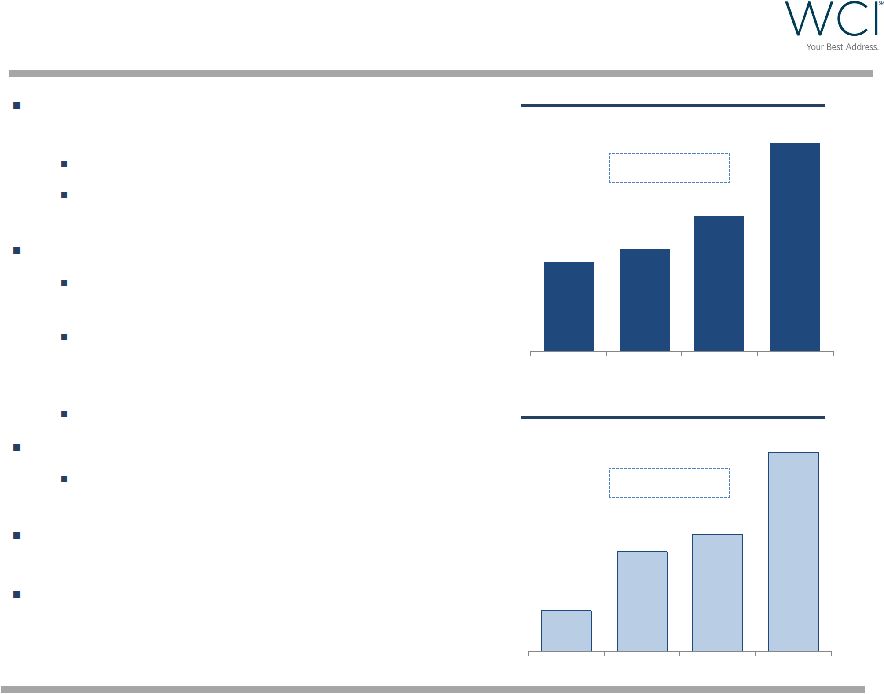 50 122 143 243 2Q12 2Q13 2Q14 2Q15 128 147 195 300 2Q12 2Q13 2Q14 2Q15 Homebuilding – 2Q15 Highlights Revenues from homes delivered up 89.8% to $115.6 million Deliveries up 69.9% to 243 homes Average selling price per delivered home of $476,000, up 11.7% New orders up 53.8% to 300 homes Contract value of new orders of $128.6 million, up 37.4% Sales mix weighted more toward primary and active adult segment in 2Q15 Neighborhood count up 60.7% Backlog units up 44.8% to 627 homes Backlog contract value of $294.1 million, up 27.9% Adjusted gross margin from homes delivered of 29.1% All cash buyers accounted for 51% of 2Q15 deliveries 5 Second Quarter – New Orders Trend Second Quarter – Deliveries Trend Note: All comparisons are to 2Q14 32.8% CAGR 69.4% CAGR |
 $1,495
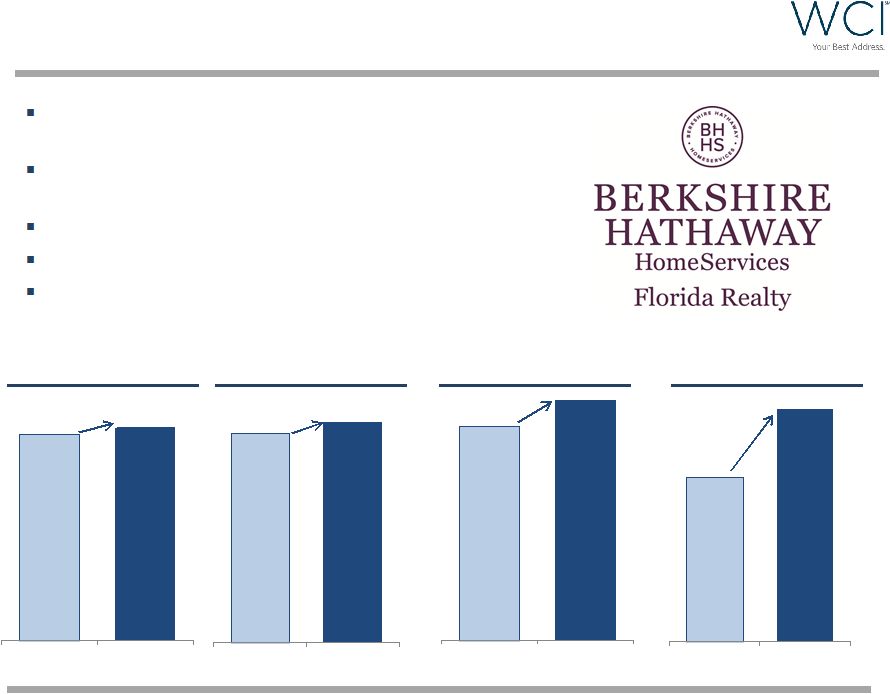
$2,116 2Q14 2Q15 +40.0% $26,499 $29,107 2Q14 2Q15 +9.8% 2,746 2,857 2Q14 2Q15 +4.0% $307 $320 2Q14 2Q15 +4.2% Real Estate Services – 2Q15 Highlights 6 RES Revenues Brokerage Transactions Brokerage ASP Brokerage closed home sales transactions up 4.0% Brokerage average selling price up 4.2% to $320,000 Title revenues increased 36.8% Total revenues up 9.8% Total gross margin up 40.0% to $2.1 million RES Gross Margin Note: All comparisons are to 2Q14 ($ in thousands) ($ in thousands) ($ in thousands) |
 $14.4
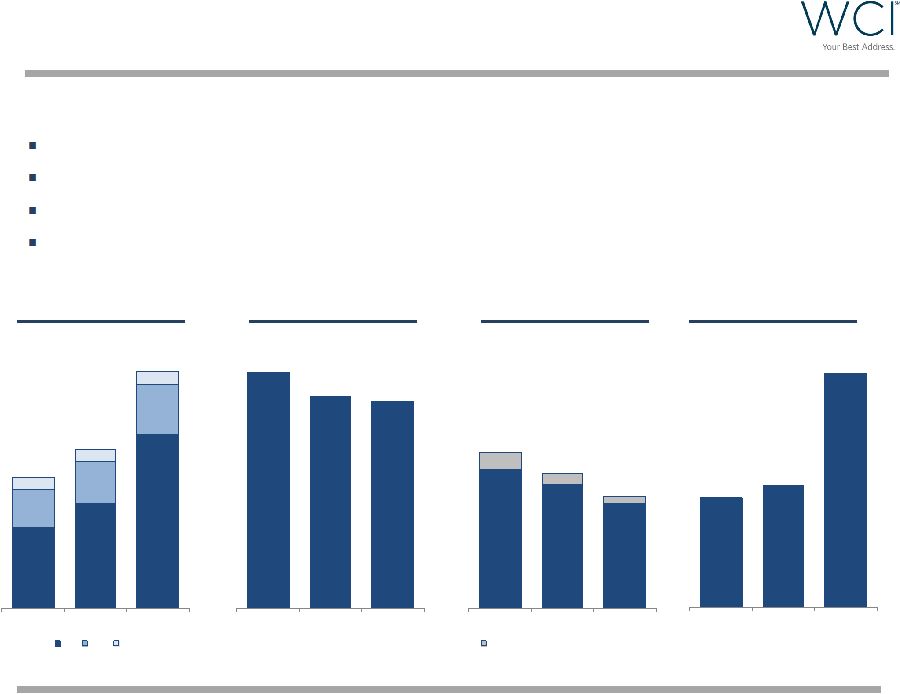
$15.9 $30.7 10.5% 9.5% 12.4% 1H13 1H14 1H15 $84 $109 $183 $40 $45 $52 $12 $13 $14 $137 $167 $248 1H13 1H14 1H15 HB RES AM Executing on the WCI Growth Strategy Year to Date June 2015 Comparisons to Prior Year Periods Increasing revenues driven by Homebuilding and Real Estate Services Continued Homebuilding gross margin strength Improved SG&A leverage by 330 basis points 93% growth in Adjusted EBITDA 7 (1) Represents adjusted gross margin from homes delivered (2) Measured as a percentage of Homebuilding revenues (3) Measured as a percentage of total revenues Revenues ($ in millions) Adjusted EBITDA (3) SG&A % (2) Adjusted GM % (1) ($ in millions) 33.5% 30.1% 29.4% 1H13 1H14 1H15 19.8% 17.7% 14.9% 2.4% 1.5% 1.1% 22.2% 19.3% 16.0% 1H13 1H14 1H15 Stock-based compensation expense Note: Totals may not foot due to rounding |
 Land
Portfolio Positioned for Growth High quality land positions in
land- constrained markets
Land portfolio totals approximately 13,500
owned or controlled home sites; up 30%
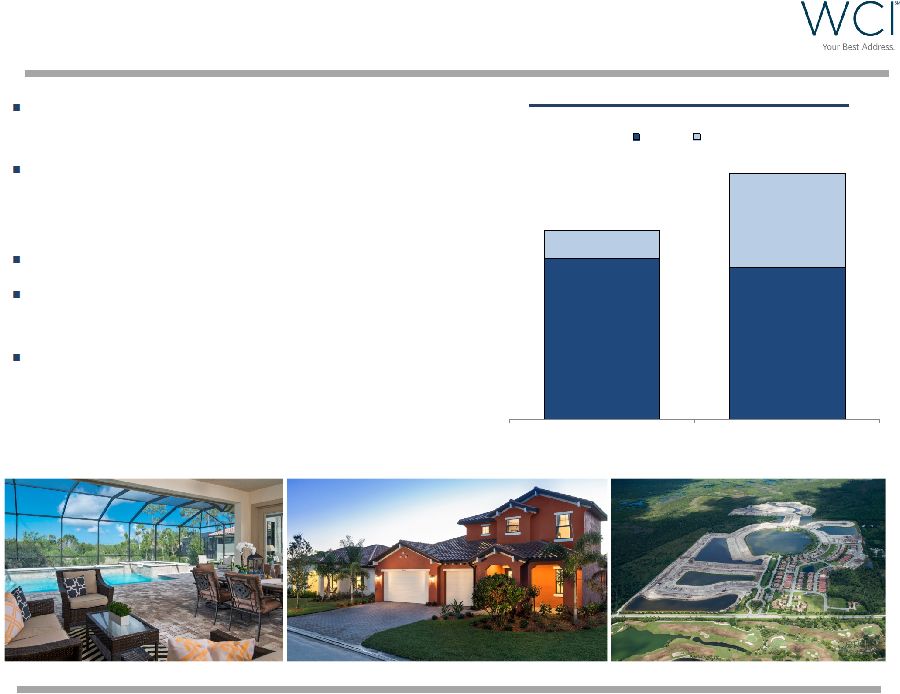
from 2Q14 62% owned / 38% optioned Experienced team with extensive land entitlement and development experience Actively pursuing additional land acquisition opportunities throughout Florida 8 Owned or Controlled Home Sites 8,814 8,307 1,520 5,158 10,334 13,465 2Q14 2Q15 Owned Optioned |
 Selected
Operating Results 9
$ in thousands, except per share amounts
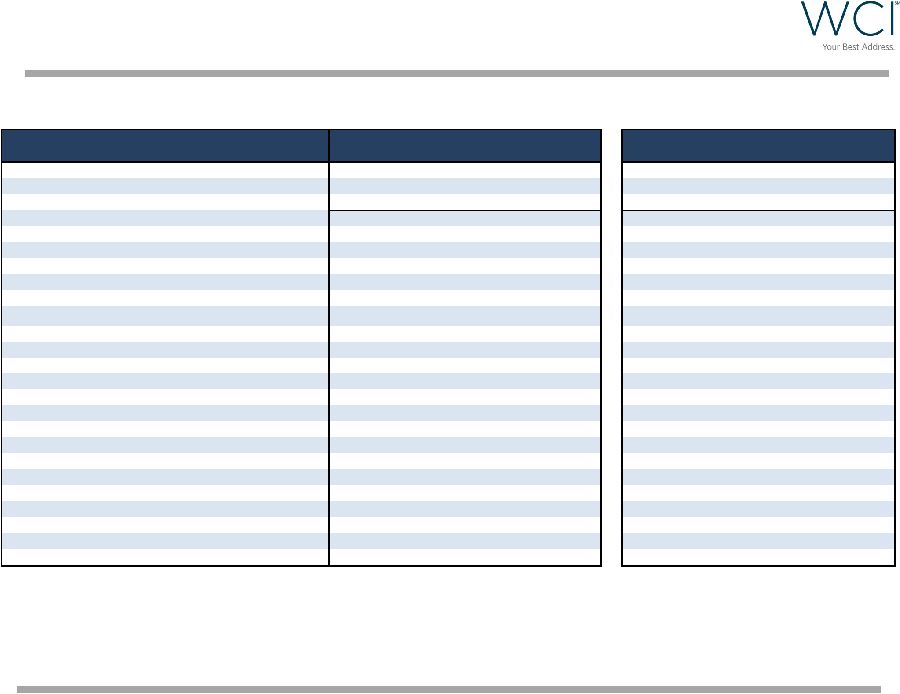
2015 2014 Variance % 2015 2014 Variance % Homebuilding revenues 115,565 $ 60,918 $ 89.8% 182,612 $ 108,913 $ 67.7% Real estate services revenues 29,107 26,499 9.8% 51,873 44,962 15.3% Amenities revenues 6,038 5,542 9.1% 13,927 12,864 7.8% Total revenues 150,710 92,959 62.0% 248,412 166,739 49.0% Total gross margin 32,216 18,007 78.9% 52,344 31,841 64.4% Income tax expense 6,187 2,974 108.0% 7,103 4,634 53.3% Net income attributable to common shareholders 9,820 $
4,338 $
126.4% 15,472 $ 5,818 $
165.9% Earnings per share - diluted 0.37 $
0.17 $
117.6% 0.59 $
0.22 $
168.2% SG&A expenses as a percent of Homebuilding revenues 14.0% 17.5% -350 bps 16.0% 19.3% -330 bps Adjusted gross margin percentage 29.1% 30.1% -100 bps 29.4% 30.1% -70 bps Adjusted EBITDA 20,714 $ 10,235 $ 102.4% 30,746 $ 15,893 $ 93.5% Adjusted EBITDA percentage 13.7% 11.0% +270 bps 12.4% 9.5% +290 bps Homes delivered 243 143 69.9% 381 260 46.5% Average selling price per home delivered 476 $
426 $
11.7% 479 $
419 $
14.3% New orders 300 195 53.8% 616 400 54.0% Average selling price per new order 429 $
480 $
-10.6% 437 $
487 $
-10.3% Backlog units 627 433 44.8% Average selling price in backlog 469 $
531 $
-11.7% Three Months Ended June 30, Six Months Ended June 30, |
 Conservative Balance Sheet
Balance sheet positioned to
execute the growth strategy
Undrawn $75 million revolving
credit facility Invested $42 million year-to- date on land and land development Completed two secondary offerings; no primary shares or proceeds to the company April 2015 – 3.7 million shares July 2015 – 3.7 million shares 10 (1) Available liquidity includes the $75 million of borrowing capacity under a four-year revolving credit
facility and $8.3 million of borrowing capacity under a revolving credit facility with
Stonegate Bank (2)
Debt to capital is computed by dividing the carrying value of our total debt, as
reported on our consolidated balance sheets, by total
capital (3)
Net debt represents total debt, excluding premium, less cash and cash equivalents; net
capitalization represents net debt plus total equity
$ in thousands Cash and cash equivalents 146,015 $
174,756 $
Real estate inventories
510,985 449,249
Total
debt 251,106
251,179 Total equity
452,154 434,443
Total
capital 703,260
685,622 Available liquidity
(1) 229,351 257,756
Debt to capital
(2) 35.7% 36.6% Net debt to net capitalization (3) 18.7% 14.8% (Cash + inventories) / total debt 2.62 2.48
June 30, 2015 December 31, 2014 |
 Key
Takeaways Florida real estate market remains strong
Fully integrated Florida luxury homebuilder and
community developer Executing the strategy Focus on move-up, second-home and active adult customer segments Differentiate via extensive amenity offerings Operational discipline Positioned for continued growth Growing new orders and deliveries Increasing active selling neighborhood count Growing revenues and Adjusted EBITDA Complementary Real Estate Services and Amenities businesses Actively pursuing land acquisition opportunities Conservative balance sheet with liquidity and flexibility for growth Experienced and talented team 11 |
 Appendix |
 Reconciliation of Non-GAAP Financial Measures
In addition to the results reported in accordance with U.S. generally accepted
accounting principles (“GAAP”), we have provided information in
this presentation relating to adjusted gross margin from homes delivered, EBITDA, Adjusted EBITDA (both terms defined below) and net debt to net capitalization. Our GAAP-based measures can be found in our unaudited consolidated financial statements in Item 1 of the Quarterly Report
on Form 10-Q for the quarter ended June 30, 2015 that we plan to file with the
Securities and Exchange Commission on or before July 31, 2015. Adjusted
Gross Margin from Homes Delivered We calculate adjusted gross margin from
homes delivered by subtracting the gross margin from land and home sites, if any, from Homebuilding gross margin to arrive at gross margin from homes delivered. Adjusted gross margin from homes delivered is calculated by adding asset impairments, if any, and capitalized interest in cost of sales to gross margin from homes delivered. Management uses adjusted gross margin
from homes delivered to evaluate operating performance in our
Homebuilding segment and make strategic decisions regarding sales price,
construction and development pace, product mix and other operating decisions. We
believe that adjusted gross margin from homes delivered is (i) meaningful
because it isolates the impact that our indebtedness and asset impairments have on gross margin and (ii) relevant and useful to shareholders, investors and other interested parties for evaluating our comparative operating performance from period to period and among
companies
within the homebuilding industry as it is reflective of overall profitability during any given reporting period. This measure is considered a non-GAAP financial measure and should be considered in addition to, rather than as a substitute for, the comparable GAAP financial measures
when evaluating our operating performance. Although other companies in the homebuilding industry report similar information, they may calculate this measure differently than we do and, therefore, it may not be comparable. We urge shareholders, investors and other
interested parties to understand the methods used by other companies in
the homebuilding industry to calculate gross margins and any adjustments to such amounts before comparing our measures to those of such other companies. The table below reconciles adjusted gross margin from homes delivered to the most directly comparable GAAP financial measure, Homebuilding gross margin, for the periods presented herein. 13 2015 2014 2015 2014 Homebuilding gross margin 30,889 $
17,049
$
49,388
$
30,496
$
Less: gross margin from
land and home sites -
- -
- Gross margin
from homes delivered 30,889
17,049
49,388
30,496
Add:
capitalized interest in cost of sales
2,740
1,282
4,364
2,267
Adjusted gross margin from homes delivered
33,629
$
18,331
$
53,752
$
32,763
$
Gross margin from homes
delivered as a percentage of
revenues from homes delivered
26.7%
28.0%
27.0%
28.0%
Adjusted gross margin from homes delivered as
a percentage of revenues from
homes delivered 29.1%
30.1%
29.4%
30.1%
Three Months Ended June 30,
($ in thousands)
Six Months Ended June 30,
|
 Reconciliation of Non-GAAP Financial Measures
(continued) EBITDA and Adjusted
EBITDA Adjusted
EBITDA measures performance by adjusting net income (loss) attributable to common shareholders of WCI Communities, Inc. to exclude, if any, interest expense, capitalized interest in cost of sales, income taxes, depreciation (‘‘EBITDA’’), preferred stock dividends, income (loss) from discontinued operations, other income, stock-based compensation expense, asset impairments and expenses related to early repayment of debt. We believe that the presentation of Adjusted EBITDA provides useful information to shareholders, investors and other interested parties regarding our results of operations because it assists those parties and us when analyzing and benchmarking the performance and value of our business. We also believe that Adjusted EBITDA is useful as a measure of comparative operating performance from period to period and among companies in the homebuilding industry as it is reflective of changes in pricing decisions, cost controls and other factors that affect operating performance, and it removes the effects of our capital structure (such as preferred stock dividends and interest expense), asset base (primarily depreciation), items outside of our control (primarily income taxes) and the volatility related to the timing and extent of non-operating activities (such as discontinued operations and asset impairments). Accordingly, we believe that this measure is useful for comparing general operating performance from period to period. Other companies may define Adjusted EBITDA differently and, as a result, our measure of Adjusted EBITDA may not be directly comparable to Adjusted EBITDA of other companies. Although we use Adjusted EBITDA as a financial measure to assess the performance of our business, the use of Adjusted EBITDA is limited because it does not include certain material costs, such as interest and income taxes, necessary to operate our business. EBITDA and Adjusted EBITDA should be considered in addition to, and not as substitutes for, net income (loss) in accordance with GAAP as a measure of performance. Our presentation of EBITDA and Adjusted EBITDA should not be construed as an indication that our future results will be unaffected by unusual or nonrecurring items. Our EBITDA-based measures have limitations as analytical tools and, therefore, shareholders, investors and other interested parties should not consider them in isolation or as substitutes for analyses of our results as reported under GAAP. Some such limitations are: they do not reflect the impact of earnings or charges resulting from matters that we consider not to be indicative of our ongoing
operations; they are not adjusted for all non-cash income or expense items that are reflected in our consolidated statements of cash flows;
they do not reflect the interest that is necessary to service our debt;
and other companies in our industry may calculate these measures
differently than we do, thereby limiting their usefulness as comparative
measures. Because of these limitations, our EBITDA-based measures are not intended to be alternatives to net income (loss), indicators of our operating
performance, alternatives to any other measure of performance in
conformity with GAAP or alternatives to cash flow provided by (used in)
operating activities as measures of liquidity. Shareholders, investors and other
interested parties should therefore not place undue reliance on our
EBITDA-based measures or ratios calculated using those measures.
14 |
 Reconciliation of Non-GAAP Financial Measures
(continued) EBITDA and Adjusted EBITDA
(continued) The table below reconciles EBITDA and Adjusted EBITDA to the
most directly comparable GAAP financial measure, net income (loss)
attributable to common shareholders of WCI Communities, Inc., for the periods presented
herein. 15
(1) Represents capitalized interest expensed in cost of sales on home deliveries and land and home site sales.
(2) Represents the expense recorded in the Company’s unaudited consolidated statements of operations related to its stock-based
compensation plans.
2015
2014
2015
2014
Net income attributable to common
shareholders of WCI Communities,
Inc. 9,820
$
4,338
$
15,472
$
5,818
$
Interest
expense 198
187 458
685 Capitalized interest in cost of sales
(1) 2,740
1,282
4,364
2,267
Income tax expense
6,187
2,974
7,103
4,634
Depreciation
758
644 1,467
1,232
EBITDA
19,703
9,425
28,864
14,636
Other
income, net (99)
(63) (195)
(428) Stock-based compensation expense
(2) 1,110
873
2,077 1,685
Adjusted EBITDA
20,714
$
10,235
$
30,746
$
15,893
$
Adjusted EBITDA
margin 13.7%
11.0%
12.4%
9.5%
Three Months Ended June 30,
($ in thousands)
Six Months Ended June 30,
|
 Reconciliation of Non-GAAP Financial Measures
(continued) Net Debt to Net
Capitalization We believe that net debt to net capitalization provides
useful information to shareholders, investors and other interested parties regarding our financial position and cash and debt management. It is also a relevant financial measure for understanding the leverage employed in our
operations and as an indicator of our ability to obtain future
financing. By deducting cash and cash equivalents from our
outstanding debt, we provide a measure of our debt that considers our cash position. We believe that this approach provides useful information because the ratio of debt to capital does not consider our cash and cash equivalents and
we believe that a debt ratio net of cash, such as net debt to net capitalization, provides supplemental information by which our financial position may be considered. Shareholders, investors and other interested parties may also find this information to be helpful when comparing our
leverage to the leverage of our competitors that present similar
information. The
table below presents the computations of our net debt to net capitalization and reconciles such amounts to the most directly comparable GAAP financial measure, debt to capital. 16 (1) Debt to capital is computed by dividing the carrying value of our Senior Notes due 2021, as reported on our consolidated balance sheets, by total capital as calculated above. The Senior Notes due 2021 were our only outstanding debt as of June 30, 2015 and December 31, 2014. (2) Net debt to net capitalization is computed by dividing net debt by net capitalization. June 30, December 31, 2015 2014 Senior Notes due 2021 251,106 $
251,179
$
Total equity 452,154 434,443 Total capital 703,260 $
685,622
$
Debt to capital (1) 35.7% 36.6% Senior Notes due 2021 251,106 $
251,179
$
Less: unamortized premium 1,106 1,179 Principal amount of Senior Notes due 2021 250,000 250,000 Less: cash and cash equivalents 146,015 174,756 Net debt 103,985 75,244 Total equity 452,154 434,443 Net capitalization 556,139 $
509,687
$
Net debt to net capitalization (2) 18.7% 14.8% ($ in thousands) |
Serious News for Serious Traders! Try StreetInsider.com Premium Free!
You May Also Be Interested In
- SpecialtyRx Fills Booth 713 at FHCA 2026 with 20x20 Island Exhibit
- Is Fortuno Markets Safe? Here Are Its Key Fund Protection Systems
- PureHealth Research Explores Horse Chestnut and Butcher's Broom in Supplements for Vein Health
Create E-mail Alert Related Categories
SEC FilingsSign up for StreetInsider Free!
Receive full access to all new and archived articles, unlimited portfolio tracking, e-mail alerts, custom newswires and RSS feeds - and more!
