



Form 8-K WALTER INVESTMENT MANAGE For: Nov 05
 Tweet
Tweet Share
Share E-mail
UNITED STATES
SECURITIES AND EXCHANGE COMMISSION
Washington, D.C. 20549
FORM 8-K
CURRENT REPORT
Pursuant to Section 13 or 15(d)
of the Securities Exchange Act of 1934
Date of Report (Date of earliest event reported): November 5, 2015
Walter Investment Management Corp.
(Exact name of registrant as specified in its charter)
| Maryland | 001-13417 | 13-3950486 | ||
| (State or other jurisdiction of incorporation) |
(Commission File Number) |
(IRS Employer Identification No.) |
| 3000 Bayport Drive, Suite 1100 Tampa, FL |
33607 | |
| (Address of principal executive offices) | (Zip Code) |
Registrant’s telephone number, including area code: (813) 421-7600
Not Applicable
(Former name or former address, if changed since last report)
Check the appropriate box below if the Form 8-K filing is intended to simultaneously satisfy the filing obligation of the registrant under any of the following provisions:
| ¨ | Written communications pursuant to Rule 425 under the Securities Act (17 CFR 230.425) |
| ¨ | Soliciting material pursuant to Rule 14a-12 under the Exchange Act (17 CFR 240.14a-12) |
| ¨ | Pre-commencement communications pursuant to Rule 14d-2(b) under the Exchange Act (17 CFR 240.14d-2(b)) |
| ¨ | Pre-commencement communications pursuant to Rule 13e-4(c) under the Exchange Act (17 CFR 240.13e-4(c)) |
Item 2.02. Results of Operations and Financial Condition.
On November 5, 2015, Walter Investment Management Corp. (the “Company”) issued a press release announcing its financial results for the quarter ended September 30, 2015, as well as updates on operational highlights for the Company. On the same date, the Company posted earnings presentation materials, which include a financial supplement, on its investor relations website at http://investor.walterinvestment.com. These materials are being made available in connection with the Company’s earnings conference call and audio webcast on November 5, 2015 at 10:00 a.m. ET. The press release and the earnings presentation are furnished as Exhibits 99.1 and 99.2 to this Current Report on Form 8-K and are hereby incorporated herein by reference.
Item 7.01. Regulation FD Disclosure.
The information set forth above under Item 2.02 is hereby incorporated herein by reference.
In accordance with General Instruction B.2 of Form 8-K, the information being furnished pursuant to this Current Report on Form 8-K, including Exhibits 99.1 and 99.2, shall not be deemed to be “filed” for purposes of Section 18 of the Securities Exchange Act of 1934, as amended (the “Exchange Act”), or otherwise subject to the liabilities of that section, nor shall it be deemed incorporated by reference into any registration statement or other document filed by the Company under the Securities Act of 1933, as amended, or the Exchange Act, except as expressly set forth by specific reference in such filing.
Item 9.01. Financial Statements and Exhibits.
(d) Exhibits.
| Exhibit No. |
Description | |
| 99.1 | Press Release, dated November 5, 2015 | |
| 99.2 | Earnings Presentation, including Financial Supplement, dated November 5, 2015 | |
SIGNATURE
Pursuant to the requirements of the Securities Exchange Act of 1934, the registrant has duly caused this report to be signed on its behalf by the undersigned hereunto duly authorized.
| WALTER INVESTMENT MANAGEMENT CORP. | ||||||
| Date: November 5, 2015 | By: | /s/ Gary L. Tillett | ||||
| Gary L. Tillett, Executive Vice President and Chief Financial Officer | ||||||
EXHIBIT INDEX
| Exhibit No. |
Description | |
| 99.1 | Press Release, dated November 5, 2015 | |
| 99.2 | Earnings Presentation, including Financial Supplement, dated November 5, 2015 | |
Exhibit 99.1

Press Release
Investor and Media Contact: Whitney Finch
Vice President of Investor Relations
813.421.7694
FOR IMMEDIATE RELEASE
November 5, 2015
WALTER INVESTMENT MANAGEMENT CORP. ANNOUNCES
THIRD QUARTER 2015 HIGHLIGHTS AND FINANCIAL RESULTS
(Tampa, Fla.) – Walter Investment Management Corp. (NYSE: WAC) (“Walter Investment” or the “Company”) today announced operational highlights and financial results for the quarter ended September 30, 2015.
Third Quarter 2015 Operational Overview and Recent Developments
| • | Adjusted Earnings of $16.6 million after taxes, or $0.44 per share |
| • | Servicing segment delivered 15 bps of AEBITDA margin |
| • | Assisted approximately 13,200 homeowners in obtaining modifications and originated approximately 10,700 HARP loans |
| • | Originations segment funded volumes grew 23% to $6.9 billion as compared to the prior year quarter |
| • | Reverse Mortgage segment issued $390 million of HMBS during the quarter, continuing its #2 HMBS issuer ranking for the year |
| • | Completed the consolidation of forward originations and servicing businesses under Ditech brand |
| • | Completed sale of excess spread securitization of GSE product, generating cash proceeds of approximately $70 million |
| • | Finalizing arrangements to sell MSRs and an excess servicing spread to WCO, expected to generate cash proceeds of approximately $60 million, with servicing retained by Ditech on the MSR sale |
| • | S&P raised the rating on the term loan to ‘BB-’, affirmed the ‘B+’ issuer credit rating and ‘B-’ rating on the senior unsecured notes and revised outlook to stable |
Third Quarter 2015 Financial Overview
The Company reported a GAAP net loss for the third quarter of 2015 of ($76.9) million, or ($2.04) per diluted share, as compared to a GAAP net loss of ($70.8) million, or ($1.88) per diluted share, for the third quarter of 2014. Included in the third quarter net loss are $74.8 million or $1.98 per share of after tax charges resulting from changes in valuation inputs and other assumptions used in the fair value of assets and liabilities carried at fair value.
Adjusted Earnings for the third quarter of 2015 was $16.6 million after taxes(1), or $0.44 per share(1), a decrease of 54% as compared to the prior year quarter. Adjusted Earnings for the quarter ended September 30, 2015 reflects the impact of $21.2 million higher realization of cash flows and $6.0 million lower Adjusted Earnings related to the sale of the residual interest in the Residual Trusts. Adjusted EBITDA for the quarter was $145.4 million, relatively flat when compared to the prior year quarter.
| (1) | This calculation assumes an effective tax rate of 38% and 39% for 2015 and 2014, respectively. |
1
“We completed the merger of our forward originations and servicing businesses under the Ditech brand, positioning us to deliver a seamless customer experience, streamline processes and drive operational efficiencies,” said Denmar J. Dixon, Walter Investment’s Vice Chairman, Chief Executive Officer and President. “In addition, we made progress on several of our balance sheet initiatives and will look to continue to build on those accomplishments in the near term. We had a solid operating quarter across the segments led by the Originations business which grew its funded volumes 23% as compared to the prior year quarter and the Servicing business which delivered 15 bps of AEBITDA margin. The Reverse business held its #2 HMBS issuer ranking for the year and we added a very capable leader to the business who we believe will greatly enhance our prospects in that sector.”
“While we have accomplished many things, we have not yet realized the full intrinsic value of our Company. Both the sector and Walter Investment have endured a complex operating environment, significant industry changes and challenges over the past 18 - 24 months which I believe have made it difficult for the market to evaluate the fundamental value of the Company. I firmly believe that we have the platform, strategy and, most importantly, the team in place to execute on our initiatives, drive results and realize the true intrinsic value of the Company. We are intensifying our efforts to accelerate the execution of the strategy and believe tangible progress in that regard should create a significant opportunity to drive shareholder value. We are not satisfied, in any way, with the current market valuations and will take all steps necessary to drive long-term value for shareholders.”
Third Quarter 2015 Financial and Operating Overview
Total revenues for the third quarter of 2015 were $219.4 million, a decrease of $166.6 million compared to the prior year quarter, driven by a $165.2 million decrease in net servicing revenue and fees. The decrease in net servicing revenue and fees primarily resulted from $174.1 million in higher fair value losses on our servicing rights primarily as a result of decreasing interest rates, higher discount rates used to value our servicing rights and higher realization of expected cash flows, and $10.2 million lower incentive and performance-based fees due to the improving credit quality of the portfolio, partially offset by $11.2 million higher servicing fees, $3.6 million favorable amortization of servicing rights and $3.1 million favorable change in fair value of the excess servicing spread liability. Additionally, the current quarter had $27.4 million higher net fair value gains on reverse loans resulting primarily from the low interest rate environment and $9.3 million higher other income driven primarily by higher origination fee income. These favorable variances were offset by $21.0 million lower interest income on loans due to the sale of the residual interests in the seven Residual Trusts in April 2015 and $11.3 million lower net gains on sales of loans driven by a shift in volume mix as compared to the prior year quarter.
Total expenses for the third quarter of 2015 were 7% lower as compared to the third quarter of 2014, declining to $364.1 million. Results reflect $10.0 million lower interest expense in the current quarter as compared to the prior year quarter primarily due to the sale of the residual interests in the seven Residual Trusts and $11.4 million lower general and administrative expenses primarily driven by accruals in the prior year quarter relating to loss contingencies and legal expenses due to legal and regulatory matters outside of the normal course of business.
Other pre-tax gains for the third quarter of 2015 include an $8.9 million realized gain recognized on the sale of a trading security and a $3.1 million gain for consideration received for the contribution of Marix to Walter Capital Opportunity Corp. (together with its consolidated subsidiaries, “WCO”).
Segments
Results for the Company’s segments are presented below.
Servicing
The Servicing segment generated total revenue of $31.2 million in the third quarter of 2015, an 86% decline as compared to third quarter 2014 revenue of $225.7 million. The decline was primarily comprised of $174.1 million in higher fair value losses
2
on our servicing rights and $21.0 million lower interest income on loans resulting primarily from the sale of the residual interests in the seven Residual Trusts in April 2015. Servicing revenues for the quarter ended September 30, 2015 included $178.7 million of servicing fees, $19.4 million of incentive and performance-based fees and $22.7 million of ancillary and other fees.
Expense for the Servicing segment was $192.7 million, a decline of 16% as compared to the prior year quarter. The change was driven by a $22.8 million decrease in operational expenses including $24.9 million lower legal related costs primarily due to lower accruals for legal and regulatory matters outside of the ordinary course of business and $7.5 million lower salaries and benefits driven by fewer employees, partially offset by $5.3 million in higher servicing-related costs due to continued growth in our servicing portfolio, $2.7 million in expenses relating to consolidating and re-branding our mortgage loan business as Ditech, a Walter Company, and $1.6 million in additional costs in 2015 to support efficiency and technology-related initiatives. Additionally, there was $12.8 million lower interest expense primarily as a result of the sale of the residual interests in the seven Residual Trusts in April 2015. Expenses also included $11.4 million of depreciation and amortization costs.
The segment generated Adjusted Earnings of $14.6 million for the third quarter of 2015 and AEBITDA of $89.2 million, a decline of 69% and 13%, respectively, as compared to the third quarter of 2014. The variance in Adjusted Earnings as compared to the prior year quarter was primarily due to lower revenues which are adjusted for the impact of changes in fair value due to changes in valuation inputs, partially offset by lower expenses. These lower revenues include $21.2 million in higher realization of cash flows, which include the effect of accelerated prepayments.
The Servicing segment ended the quarter with approximately 2.1 million total accounts serviced with a UPB of approximately $245.6 billion. During the quarter, the Company experienced a net disappearance rate of 14.4%, slightly higher than the prior year quarter of 14.1% as a result of increased levels of prepayments in the continued low interest rate environment.
Originations
The Originations segment generated revenue of $132.0 million in the third quarter of 2015, flat as compared to the prior year quarter primarily due to a $9.2 million increase in other revenues driven by higher origination fees largely offsetting the $9.9 million decrease in net gains on sales of loans driven by a shift in volume from the higher margin retention channel to the lower margin correspondent channel. Expenses for the Originations segment of $95.5 million, which include $10.2 million of interest expense and $7.2 million of depreciation and amortization, increased slightly as compared to the prior year quarter, primarily driven by $2.9 million higher depreciation and $1.8 million higher interest expense as a result of a higher volume of loan fundings.
The segment generated Adjusted Earnings of $43.9 million for the third quarter of 2015, relatively flat compared to the prior year quarter. AEBITDA for the current quarter was $51.0 million, an 11% increase as compared to the third quarter of 2014, primarily due to higher origination fee income, offset partially by lower net gains on sales of loans and higher expenses.
Total pull-through adjusted locked volume for the third quarter was $6.3 billion, compared to $5.0 billion for the third quarter of 2014 as volumes in the correspondent lending channel grew 58%. Funded loans in the current quarter totaled $6.9 billion, with approximately 26% of that volume in the consumer lending channel and approximately 74% generated by the correspondent lending channel. Funded loans in the third quarter of 2014 totaled $5.6 billion, with approximately 45% of that volume in the consumer lending channel and approximately 55% driven by the correspondent lending channel. The combined direct margin for the current quarter was 106 bps and included a direct margin of 220 bps in the consumer lending channel which decreased 91 bps as compared to the prior year quarter. In the correspondent lending channel, overall volume growth combined with a shift to more GNMA production drove margin expansion of 26 bps, as compared to the third quarter of 2014, to 52 bps for the current quarter.
Reverse Mortgage
The Reverse Mortgage segment generated revenue of $65.4 million for the quarter, a 75% increase as compared to the prior year quarter reflecting higher net fair value gains on reverse loans and related HMBS obligations of $27.4 million, driven primarily by favorable changes in non-cash fair value adjustments due to a lower LIBOR rate at September 30, 2015 as compared to the prior year period. Current quarter revenues included a $52.6 million gain from the net impact of HECM loan and related HMBS obligation fair value adjustments, $11.2 million in net servicing revenue and fees and $1.5 million of other revenues. Total expenses for the third quarter of $42.9 million remained relatively flat as compared to the prior year period.
3
The segment reported Adjusted Earnings of $1.0 million and AEBITDA of $2.2 million for the third quarter of 2015 as compared to Adjusted Earnings of $0.6 million and AEBITDA of $1.8 million in the third quarter of 2014 due primarily to the growth in cash generated from origination, purchase and securitization of HECMs and higher net servicing revenue and fees partially offset by higher expenses.
Securitized volumes increased 34% compared to the prior year quarter as volumes were assisted by an increase in loans that were initiated prior to the Financial Assessment rules going into effect. Funded origination volumes, excluding tails, decreased 9% as compared to the third quarter of 2014.
Other Non-Reportable Segment
The Other Non-Reportable segment generated revenue of $0.7 million for the third quarter of 2015 as compared to revenue of $3.2 million in the prior year quarter. The prior year quarter included $2.5 million of asset management performance fees earned by the Investment Management business. Total expenses in the current quarter of $43.0 million, which included $38.4 million related to corporate debt, remained relatively flat as compared to the third quarter of 2014.
The Other non-reportable segment generated Adjusted Loss of ($32.6) million and AEBITDA of $3.1 million for the third quarter of 2015 as compared to Adjusted Loss of ($33.7) million and AEBITDA of $1.3 million in the third quarter of 2014.
About Walter Investment Management Corp.
Walter Investment Management Corp. is a diversified mortgage banking firm focused primarily on the servicing and origination of residential loans, including reverse loans. Based in Tampa, Fla., the Company has approximately 5,850 employees and services a diverse loan portfolio. For more information about Walter Investment Management Corp., please visit the Company’s website at www.walterinvestment.com. The information on our website is not a part of this release.
Conference Call Webcast
Members of the Company’s leadership team will discuss Walter Investment’s third quarter results and other general business matters during a conference call and live webcast to be held on Thursday, November 5, 2015, at 10 a.m. Eastern Time. To listen to the event live or in an archive, and to access presentation slides (which include supplemental information) which will be available for at least 30 days, visit the Company’s website at www.walterinvestment.com.
This press release and the accompanying reconciliations include non-GAAP financial measures. For a description of these non-GAAP financial measures, including the reasons management uses each measure, and reconciliations of these non-GAAP financial measures to the most directly comparable financial measures prepared in accordance with GAAP, please see the reconciliations as well as “Non-GAAP Financial Measures” at the end of this press release.
Disclaimer and Cautionary Note Regarding Forward-Looking Statements
This press release contains “forward-looking statements” within the meaning of Section 27A of the Securities Act of 1933, as amended and Section 21E of the Securities Exchange Act of 1934, as amended. Statements that are not historical fact are forward-looking statements. Certain of these forward-looking statements can be identified by the use of words such as “believes,” “anticipates,” “expects,” “intends,” “plans,” “projects,” “estimates,” “assumes,” “may,” “should,” “will,” or other similar expressions. Such forward-looking statements involve known and unknown risks, uncertainties and other important factors, and our actual results, performance or achievements could differ materially from future results, performance or achievements expressed in these forward-looking statements. These forward-looking statements are based on our current beliefs, intentions and expectations. These statements are not guarantees or indicative of future performance. Important assumptions and other important factors that could cause actual results to differ materially from those forward-looking statements include, but are not limited to, those factors, risks and uncertainties described below and in more detail under the caption “Risk Factors” in our Annual Report on Form 10-K for the year ended December 31, 2014, our Quarterly Reports on Form 10-Q for the quarterly periods ended March 31, 2015, June 30, 2015 and September 30, 2015 and in our other filings with the SEC.
4
In particular (but not by way of limitation), the following important factors, risks and uncertainties could affect our future results, performance and achievements and could cause actual results, performance and achievements to differ materially from those expressed in the forward-looking statements:
| • | our ability to operate our business in compliance with existing and future rules and regulations affecting our business, including those relating to the origination and servicing of residential loans, the management of third-party assets and the insurance industry (including lender-placed insurance), and changes to, and/or more stringent enforcement of, such rules and regulations; |
| • | increased scrutiny and potential enforcement actions by federal and state authorities; |
| • | the substantial resources (including senior management time and attention) we devote to, and the significant compliance costs we incur in connection with, regulatory and contractual compliance and regulatory examinations and inquiries, and any consumer redress, fines, penalties or similar payments we make in connection with resolving such matters; |
| • | uncertainties relating to interest curtailment obligations and any related financial and litigation exposure (including exposure relating to false claims); |
| • | potential costs and uncertainties, including the effect on future revenues, associated with and arising from litigation, regulatory investigations and other legal proceedings; |
| • | our dependence on U.S. government-sponsored entities (especially Fannie Mae) and agencies and their residential loan programs and our ability to maintain relationships with, and remain qualified to participate in programs sponsored by, such entities, our ability to satisfy various existing or future GSE, agency and other capital, net worth, liquidity and other financial requirements applicable to our business, and our ability to remain qualified as a GSE approved seller, servicer or component servicer, including the ability to continue to comply with the GSEs’ respective residential loan and selling and servicing guides; |
| • | uncertainties relating to the status and future role of GSEs, and the effects of any changes to the origination and/or servicing requirements of the GSEs or various regulatory authorities or the servicing compensation structure for mortgage servicers pursuant to programs of GSEs or various regulatory authorities; |
| • | our ability to maintain our loan servicing, loan origination, insurance agency or collection agency licenses, or any other licenses necessary to operate our businesses, or changes to, or our ability to comply with, our licensing requirements; |
| • | our ability to comply with the servicing standards required by the National Mortgage Settlement; |
| • | our ability to comply with the terms of the stipulated order resolving allegations arising from an FTC and CFPB investigation of Ditech Financial; |
| • | operational risks inherent in the mortgage servicing and mortgage originations businesses, including reputational risk; |
| • | risks related to our substantial levels of indebtedness, including our ability to comply with covenants contained in our debt agreements, generate sufficient cash to service such indebtedness and refinance such indebtedness on favorable terms, as well as our ability to incur substantially more debt; |
| • | our ability to renew advance financing facilities or warehouse facilities and maintain borrowing capacity under such facilities; |
| • | our ability to maintain or grow our servicing business and our residential loan originations business; |
| • | our ability to achieve strategic initiatives, particularly our ability to: raise capital; execute and complete balance sheet management activities; make arrangements with potential capital partners; complete sales of assets to, and enter into other arrangements with, WCO; and develop new business, including acquisitions of MSRs or entering into new sub-servicing arrangements; |
| • | changes in prepayment rates and delinquency rates on the loans we service or sub-service; |
| • | the ability of our clients and credit owners to transfer or otherwise terminate our servicing or sub-servicing rights; |
| • | a downgrade in our servicer ratings or credit ratings; |
5
| • | our ability to collect reimbursements for servicing advances and earn and timely receive incentive and performance payments and ancillary fees on our servicing portfolio; |
| • | our ability to collect indemnification payments and enforce repurchase obligations relating to mortgage loans we purchase from our correspondent clients and our ability to collect indemnification payments relating to servicing rights we purchase from prior servicers; |
| • | local, regional, national and global economic trends and developments in general, and local, regional and national real estate and residential mortgage market trends in particular, including the volume and pricing of home sales, the credit quality of loan origination customers and uncertainty regarding the levels of mortgage originations and prepayments; |
| • | uncertainty as to the volume of originations activity we will benefit from prior to, and following, the expiration of HARP, which is scheduled to occur on December 31, 2016, including uncertainty as to the number of “in-the-money” accounts we may be able to refinance; |
| • | risks associated with the origination, securitization and servicing of reverse mortgages, including changes to reverse mortgage programs operated by FHA, HUD or Ginnie Mae, our ability to accurately estimate interest curtailment liabilities, continued demand for HECM loans and other reverse mortgages, our ability to fund HECM repurchase obligations, our ability to fund principal additions on our HECM loans, and our ability to securitize our HECM loans and tails; |
| • | our ability to realize all anticipated benefits of past, pending or potential future acquisitions or joint venture investments; |
| • | the effects of competition on our existing and potential future business, including the impact of competitors with greater financial resources and broader scopes of operation; |
| • | changes in interest rates and the effectiveness of any hedge we may employ against such changes; |
| • | risks and potential costs associated with technology and cybersecurity, including: the risks of technology failures and of cyber-attacks against us or our vendors; our ability to adequately respond to actual or alleged cyber-attacks; our ability to implement adequate internal security measures and protect confidential borrower information; and disruptions to our business in connection with the implementation of new technology, the use of new vendors or the transfer of our servers or other infrastructure to new data center facilities; |
| • | our ability to comply with evolving and complex accounting rules, many of which involve significant judgment and assumptions; |
| • | uncertainties regarding impairment charges relating to our goodwill or other intangible assets; |
| • | our ability to maintain effective internal controls over financial reporting and disclosure controls and procedures; |
| • | our ability to manage conflicts of interest relating to our investment in WCO; and |
| • | risks related to our relationship with Walter Energy and uncertainties arising from or relating to its bankruptcy filings, including potential liability for any taxes, interest and/or penalties owed by the Walter Energy consolidated group for the full or partial tax years during which certain of the Company’s former subsidiaries were a part of such consolidated group and certain other tax risks allocated to us in connection with our spin-off from Walter Energy. |
All of the above factors, risks and uncertainties are difficult to predict and reflect uncertainties that may materially affect actual results and may be beyond our control. New factors, risks and uncertainties emerge from time to time, and it is not possible for our management to predict all such factors, risks and uncertainties.
6
Although we believe that the assumptions underlying the forward-looking statements (including those relating to our outlook) contained herein are reasonable, any of the assumptions could be inaccurate, and therefore any of these statements included herein may prove to be inaccurate. In light of the significant uncertainties inherent in the forward-looking statements included herein, the inclusion of such information should not be regarded as a representation by us or any other person that the results or conditions described in such statements or our objectives and plans will be achieved. We make no commitment to revise or update any forward-looking statements in order to reflect events or circumstances after the date any such statement is made, except as otherwise required under the federal securities laws. If we were in any particular instance to update or correct a forward-looking statement, investors and others should not conclude that we would make additional updates or corrections thereafter except as otherwise required under the federal securities laws.
Amounts or metrics that relate to future earnings projections are forward-looking and subject to significant business, economic, regulatory and competitive uncertainties, many of which are beyond the control of us and our management, and are based upon assumptions with respect to future decisions, which are subject to change. Actual results will vary and those variations may be material. Nothing in this report should be regarded as a representation by any person that any target will be achieved and we undertake no duty to update any target. Please refer to the disclosures in this press release, in our Annual Report on Form 10-K for the year ended December 31, 2014, our Quarterly Reports on Form 10-Q for the quarterly periods ended March 31, 2015, June 30, 2015 and September 30, 2015 and our other filings with the SEC for important information regarding forward-looking statements and the use and limitations of Non-GAAP Financial Measures. Because we do not predict special items that might occur in the future, and our outlook is developed at a level of detail different than that used to prepare GAAP financial measures, we are not providing a reconciliation to GAAP of any forward-looking financial measures presented herein.
In addition, this press release may contain statements of opinion or belief concerning market conditions and similar matters. In certain instances, those opinions and beliefs could be based upon general observations by members of our management, anecdotal evidence and/or our experience in the conduct of our business, without specific investigation or statistical analyses. Therefore, while such statements reflect our view of the industries and markets in which we are involved, they should not be viewed as reflecting verifiable views and such views may not be shared by all who are involved in those industries or markets.
7
Walter Investment Management Corp. and Subsidiaries
Consolidated Statements of Comprehensive Loss
(in thousands, except per share data)
| For the Three Months Ended September 30, |
For the Nine Months Ended September 30, |
|||||||||||||||
| 2015 | 2014 | 2015 | 2014 | |||||||||||||
| REVENUES |
||||||||||||||||
| Net servicing revenue and fees |
$ | (1,771 | ) | $ | 163,411 | $ | 313,031 | $ | 477,179 | |||||||
| Net gains on sales of loans |
116,218 | 127,515 | 360,844 | 376,160 | ||||||||||||
| Interest income on loans |
12,410 | 33,451 | 62,537 | 102,091 | ||||||||||||
| Net fair value gains on reverse loans and related HMBS obligations |
52,644 | 25,268 | 90,233 | 69,440 | ||||||||||||
| Insurance revenue |
8,763 | 14,566 | 34,323 | 57,760 | ||||||||||||
| Other revenues |
31,129 | 21,789 | 81,715 | 87,031 | ||||||||||||
|
|
|
|
|
|
|
|
|
|||||||||
| Total revenues |
219,393 | 386,000 | 942,683 | 1,169,661 | ||||||||||||
| EXPENSES |
||||||||||||||||
| Salaries and benefits |
142,088 | 147,278 | 432,473 | 428,677 | ||||||||||||
| General and administrative |
132,067 | 143,445 | 402,814 | 394,651 | ||||||||||||
| Interest expense |
66,728 | 76,722 | 210,264 | 226,261 | ||||||||||||
| Depreciation and amortization |
20,646 | 17,918 | 53,371 | 54,953 | ||||||||||||
| Goodwill impairment |
— | — | 56,539 | 82,269 | ||||||||||||
| Other expenses, net |
2,595 | 4,160 | 8,043 | 8,363 | ||||||||||||
|
|
|
|
|
|
|
|
|
|||||||||
| Total expenses |
364,124 | 389,523 | 1,163,504 | 1,195,174 | ||||||||||||
| OTHER GAINS (LOSSES) |
||||||||||||||||
| Other net fair value gains |
1,119 | 16,794 | 3,573 | 15,823 | ||||||||||||
| Other |
12,054 | (590 | ) | 21,013 | (590 | ) | ||||||||||
|
|
|
|
|
|
|
|
|
|||||||||
| Total other gains (losses) |
13,173 | 16,204 | 24,586 | 15,233 | ||||||||||||
| Income (loss) before income taxes |
(131,558 | ) | 12,681 | (196,235 | ) | (10,280 | ) | |||||||||
| Income tax expense (benefit) |
(54,630 | ) | 83,484 | (50,180 | ) | 56,075 | ||||||||||
|
|
|
|
|
|
|
|
|
|||||||||
| Net loss |
$ | (76,928 | ) | $ | (70,803 | ) | $ | (146,055 | ) | $ | (66,355 | ) | ||||
|
|
|
|
|
|
|
|
|
|||||||||
| Comprehensive loss |
$ | (76,793 | ) | $ | (71,023 | ) | $ | (145,804 | ) | $ | (66,566 | ) | ||||
|
|
|
|
|
|
|
|
|
|||||||||
| Net loss |
$ | (76,928 | ) | $ | (70,803 | ) | $ | (146,055 | ) | $ | (66,355 | ) | ||||
| Basic loss per common and common equivalent share |
$ | (2.04 | ) | $ | (1.88 | ) | $ | (3.87 | ) | $ | (1.76 | ) | ||||
| Diluted loss per common and common equivalent share |
(2.04 | ) | (1.88 | ) | (3.87 | ) | (1.76 | ) | ||||||||
| Weighted-average common and common equivalent shares outstanding — basic |
37,802 | 37,707 | 37,760 | 37,604 | ||||||||||||
| Weighted-average common and common equivalent shares outstanding — diluted |
37,802 | 37,707 | 37,760 | 37,604 | ||||||||||||
8
Walter Investment Management Corp. and Subsidiaries
Consolidated Balance Sheets
(in thousands, except share and per share data)
| September 30, 2015 |
December 31, 2014 |
|||||||
| ASSETS |
||||||||
| Cash and cash equivalents |
$ | 268,601 | $ | 320,175 | ||||
| Restricted cash and cash equivalents |
740,459 | 733,015 | ||||||
| Residential loans at amortized cost, net (includes $4,116 and $10,033 in allowance for loan losses at September 30, 2015 and December 31, 2014, respectively) |
538,894 | 1,314,539 | ||||||
| Residential loans at fair value |
12,729,586 | 11,832,630 | ||||||
| Receivables, net (includes $19,313 and $25,201 at fair value at September 30, 2015 and December 31, 2014, respectively) |
246,775 | 215,629 | ||||||
| Servicer and protective advances, net (includes $113,294 and $112,427 in allowance for uncollectible advances at September 30, 2015 and December 31, 2014, respectively) |
1,529,222 | 1,761,082 | ||||||
| Servicing rights, net (includes $1,639,624 and $1,599,541 at fair value at September 30, 2015 and December 31, 2014, respectively) |
1,752,770 | 1,730,216 | ||||||
| Goodwill |
518,929 | 575,468 | ||||||
| Intangible assets, net |
87,513 | 103,503 | ||||||
| Premises and equipment, net |
104,618 | 124,926 | ||||||
| Other assets (includes $70,678 and $68,151 at fair value at September 30, 2015 and December 31, 2014, respectively) |
258,966 | 280,794 | ||||||
|
|
|
|
|
|||||
| Total assets |
$ | 18,776,333 | $ | 18,991,977 | ||||
|
|
|
|
|
|||||
| LIABILITIES AND STOCKHOLDERS’ EQUITY |
||||||||
| Payables and accrued liabilities (includes $36,838 and $30,024 at fair value at September 30, 2015 and December 31, 2014, respectively) |
$ | 602,454 | $ | 663,829 | ||||
| Servicer payables |
633,949 | 584,567 | ||||||
| Servicing advance liabilities |
1,209,082 | 1,365,885 | ||||||
| Warehouse borrowings |
1,225,437 | 1,176,956 | ||||||
| Excess servicing spread liability at fair value |
59,569 | 66,311 | ||||||
| Corporate debt |
2,216,123 | 2,267,799 | ||||||
| Mortgage-backed debt (includes $599,389 and $653,167 at fair value at September 30, 2015 and December 31, 2014, respectively) |
1,080,606 | 1,751,459 | ||||||
| HMBS related obligations at fair value |
10,745,030 | 9,951,895 | ||||||
| Deferred tax liability, net |
58,981 | 86,617 | ||||||
|
|
|
|
|
|||||
| Total liabilities |
17,831,231 | 17,915,318 | ||||||
| Stockholders’ equity: |
||||||||
| Preferred stock, $0.01 par value per share: |
||||||||
| Authorized - 10,000,000 shares |
||||||||
| Issued and outstanding - 0 shares at September 30, 2015 and December 31, 2014 |
— | — | ||||||
| Common stock, $0.01 par value per share: |
||||||||
| Authorized - 90,000,000 shares |
||||||||
| Issued and outstanding - 37,802,297 and 37,711,623 shares at September 30, 2015 and December 31, 2014, respectively |
378 | 377 | ||||||
| Additional paid-in capital |
614,889 | 600,643 | ||||||
| Retained earnings |
329,189 | 475,244 | ||||||
| Accumulated other comprehensive income |
646 | 395 | ||||||
|
|
|
|
|
|||||
| Total stockholders’ equity |
945,102 | 1,076,659 | ||||||
|
|
|
|
|
|||||
| Total liabilities and stockholders’ equity |
$ | 18,776,333 | $ | 18,991,977 | ||||
|
|
|
|
|
|||||
9
Non-GAAP Financial Measures
We manage our Company in three reportable segments: Servicing, Originations and Reverse Mortgage. We measure the performance of our business segments through the following measures: income (loss) before income taxes, Adjusted Earnings (Loss), and Adjusted EBITDA. Management considers Adjusted Earnings (Loss) and Adjusted EBITDA, both non-GAAP financial measures, to be important in the evaluation of our business segments and of the Company as a whole, as well as for allocating capital resources to our segments. Adjusted Earnings (Loss) and Adjusted EBITDA are utilized by management to assess the underlying operational performance of the continuing operations of the business. In addition, analysts, investors, and creditors may use these measures when analyzing our operating performance. Adjusted Earnings (Loss) and Adjusted EBITDA are not presentations made in accordance with GAAP and our use of these measures and terms may vary from other companies in our industry.
Adjusted Earnings (Loss) is a supplemental metric used by management to evaluate our Company’s underlying key drivers and operating performance of the business. Adjusted Earnings (Loss) is defined as income (loss) before income taxes plus changes in fair value due to changes in valuation inputs and other assumptions, estimated settlements and costs for certain legal and regulatory matters, goodwill impairment (if any), certain depreciation and amortization costs related to the increased basis in assets (including servicing rights and sub-servicing contracts) acquired within business combination transactions (or step-up depreciation and amortization), transaction and integration costs, share-based compensation expense, non-cash interest expense, the net impact of the Non-Residual Trusts, fair value to cash adjustments for reverse loans, and certain other cash and non-cash adjustments, primarily including certain non-recurring costs. Adjusted Earnings (Loss) excludes unrealized changes in fair value of MSRs that are based on projections of expected future cash flows and prepayments. Adjusted Earnings (Loss) includes both cash and non-cash gains from mortgage loan origination activities. Non-cash gains are net of non-cash charges or reserves provided. Adjusted Earnings (Loss) includes cash generated from reverse mortgage origination activities. Adjusted Earnings (Loss) may from time to time also include other adjustments, as applicable based upon facts and circumstances, consistent with the intent of providing investors with a supplemental means of evaluating our operating performance.
Adjusted EBITDA eliminates the effects of financing, income taxes and depreciation and amortization. Adjusted EBITDA is defined as income (loss) before income taxes, depreciation and amortization, interest expense on corporate debt, amortization of servicing rights and other fair value adjustments, estimated settlements and costs for certain legal and regulatory matters, goodwill impairment (if any), fair value to cash adjustment for reverse loans, non-cash interest income, share-based compensation expense, servicing fee economics, Residual Trusts cash flows, transaction and integration related costs, the net impact of the Non-Residual Trusts and certain other cash and non-cash adjustments primarily including the net provision for the repurchase of loans sold, provision for loan losses and certain non-recurring costs. Adjusted EBITDA includes both cash and non-cash gains from mortgage loan origination activities. Adjusted EBITDA excludes the impact of fair value option accounting on certain assets and liabilities and includes cash generated from reverse mortgage origination activities. Adjusted EBITDA may also include other adjustments, as applicable based upon facts and circumstances, consistent with the intent of providing investors a supplemental means of evaluating our operating performance.
Adjusted Earnings (Loss) and Adjusted EBITDA should not be considered as alternatives to (i) net income (loss) or any other performance measures determined in accordance with GAAP or (ii) operating cash flows determined in accordance with GAAP. Adjusted Earnings (Loss) and Adjusted EBITDA have important limitations as analytical tools, and should not be considered in isolation or as substitutes for analysis of our results as reported under GAAP. Some of the limitations of these metrics are:
| • | Adjusted Earnings (Loss) and Adjusted EBITDA do not reflect cash expenditures for long-term assets and other items that have been and will be incurred, future requirements for capital expenditures or contractual commitments; |
| • | Adjusted Earnings (Loss) and Adjusted EBITDA do not reflect changes in, or cash requirements for, our working capital needs; |
| • | Adjusted Earnings (Loss) and Adjusted EBITDA do not reflect certain tax payments that represent reductions in cash available to us; |
| • | Adjusted Earnings (Loss) and Adjusted EBITDA do not reflect any cash requirements for the assets being depreciated and amortized that may have to be replaced in the future; |
10
| • | Adjusted Earnings (Loss) and Adjusted EBITDA do not reflect non-cash compensation which is and will remain a key element of our overall long-term incentive compensation package; |
| • | Adjusted Earnings (Loss) and Adjusted EBITDA do not reflect the change in fair value of servicing rights due to changes in valuation inputs or other assumptions; and |
| • | Adjusted EBITDA does not reflect the significant interest expense or the cash requirements necessary to service interest or principal payments on our corporate debt and excess servicing spread liability, although they do reflect interest expense associated with our servicing advance liabilities, master repurchase agreements, mortgage-backed debt, and HMBS related obligations. |
Because of these limitations, Adjusted Earnings (Loss) and Adjusted EBITDA should not be considered as measures of discretionary cash available to us to invest in the growth of our business. We compensate for these limitations by relying primarily on our GAAP results and using Adjusted Earnings (Loss) and Adjusted EBITDA only as supplements. Users of our financial statements are cautioned not to place undue reliance on Adjusted Earnings (Loss) and Adjusted EBITDA.
11
Walter Investment Management Corp.
Segment Results of Operations and Non-GAAP Financial Measures
For the Three Months Ended September 30, 2015
(in thousands)
| Servicing | Originations | Reverse Mortgage |
Other | Eliminations | Total Consolidated |
|||||||||||||||||||
| REVENUES: |
||||||||||||||||||||||||
| Servicing revenue and fees |
$ | (9,859 | ) | $ | — | $ | 11,247 | $ | — | $ | (3,159 | ) | $ | (1,771 | ) | |||||||||
| Gain on loan sales, net |
(2,286 | ) | 117,580 | — | — | 924 | 116,218 | |||||||||||||||||
| Interest income on loans |
12,397 | 13 | — | — | — | 12,410 | ||||||||||||||||||
| Insurance revenue |
8,763 | — | — | — | — | 8,763 | ||||||||||||||||||
| Net fair value gains on reverse loans and related HMBS obligations |
— | — | 52,644 | — | — | 52,644 | ||||||||||||||||||
| Other income |
22,171 | 14,433 | 1,504 | 739 | (7,718 | ) | 31,129 | |||||||||||||||||
|
|
|
|
|
|
|
|
|
|
|
|
|
|||||||||||||
| Total revenues |
31,186 | 132,026 | 65,395 | 739 | (9,953 | ) | 219,393 | |||||||||||||||||
|
|
|
|
|
|
|
|
|
|
|
|
|
|||||||||||||
| EXPENSES: |
||||||||||||||||||||||||
| Interest expense |
17,303 | 10,211 | 843 | 38,371 | — | 66,728 | ||||||||||||||||||
| Depreciation and amortization |
11,437 | 7,204 | 2,001 | 4 | — | 20,646 | ||||||||||||||||||
| Other expenses, net |
163,992 | 78,093 | 40,008 | 4,610 | (9,953 | ) | 276,750 | |||||||||||||||||
|
|
|
|
|
|
|
|
|
|
|
|
|
|||||||||||||
| Total expenses |
192,732 | 95,508 | 42,852 | 42,985 | (9,953 | ) | 364,124 | |||||||||||||||||
|
|
|
|
|
|
|
|
|
|
|
|
|
|||||||||||||
| OTHER GAINS (LOSSES) |
||||||||||||||||||||||||
| Net fair value gains (losses) |
(213 | ) | — | — | 1,332 | — | 1,119 | |||||||||||||||||
| Other |
8,937 | — | — | 3,117 | — | 12,054 | ||||||||||||||||||
|
|
|
|
|
|
|
|
|
|
|
|
|
|||||||||||||
| Total other gains (losses) |
8,724 | — | — | 4,449 | — | 13,173 | ||||||||||||||||||
|
|
|
|
|
|
|
|
|
|
|
|
|
|||||||||||||
| Income (loss) before income taxes |
(152,822 | ) | 36,518 | 22,543 | (37,797 | ) | — | (131,558 | ) | |||||||||||||||
| ADJUSTED EARNINGS (LOSS) |
||||||||||||||||||||||||
| Changes in fair value due to changes in valuation inputs and other assumptions |
147,900 | — | — | — | — | 147,900 | ||||||||||||||||||
| Step-up depreciation and amortization |
6,945 | 5,068 | 1,329 | — | — | 13,342 | ||||||||||||||||||
| Step-up amortization of sub-servicing rights |
4,737 | — | — | — | — | 4,737 | ||||||||||||||||||
| Non-cash interest expense |
375 | — | — | 2,759 | — | 3,134 | ||||||||||||||||||
| Share-based compensation expense |
3,346 | 1,487 | 929 | 154 | — | 5,916 | ||||||||||||||||||
| Fair value to cash adjustment for reverse loans |
— | — | (27,441 | ) | — | — | (27,441 | ) | ||||||||||||||||
| Curtailment expense |
— | — | 450 | — | — | 450 | ||||||||||||||||||
| Legal and regulatory matters |
— | — | 2,158 | — | — | 2,158 | ||||||||||||||||||
| Other |
4,091 | 801 | 999 | 2,315 | — | 8,206 | ||||||||||||||||||
|
|
|
|
|
|
|
|
|
|
|
|
|
|||||||||||||
| Total adjustments |
167,394 | 7,356 | (21,576 | ) | 5,228 | — | 158,402 | |||||||||||||||||
|
|
|
|
|
|
|
|
|
|
|
|
|
|||||||||||||
| Adjusted Earnings (Loss) |
14,572 | 43,874 | 967 | (32,569 | ) | — | 26,844 | |||||||||||||||||
| ADJUSTED EBITDA |
||||||||||||||||||||||||
| Amortization of servicing rights and other fair value adjustments |
68,098 | — | 499 | — | — | 68,597 | ||||||||||||||||||
| Interest expense on debt |
2,270 | — | 1 | 35,612 | — | 37,883 | ||||||||||||||||||
| Depreciation and amortization |
4,492 | 2,136 | 672 | 4 | — | 7,304 | ||||||||||||||||||
| Other |
(232 | ) | 4,950 | 76 | 22 | — | 4,816 | |||||||||||||||||
|
|
|
|
|
|
|
|
|
|
|
|
|
|||||||||||||
| Total adjustments |
74,628 | 7,086 | 1,248 | 35,638 | — | 118,600 | ||||||||||||||||||
|
|
|
|
|
|
|
|
|
|
|
|
|
|||||||||||||
| Adjusted EBITDA |
$ | 89,200 | $ | 50,960 | $ | 2,215 | $ | 3,069 | $ | — | $ | 145,444 | ||||||||||||
|
|
|
|
|
|
|
|
|
|
|
|
|
|||||||||||||
12
Walter Investment Management Corp.
Segment Results of Operations and Non-GAAP Financial Measures
For the Three Months Ended September 30, 2014
(in thousands)
| Servicing | Originations | Reverse Mortgage |
Other | Eliminations | Total Consolidated |
|||||||||||||||||||
| REVENUES: |
||||||||||||||||||||||||
| Servicing revenue and fees |
$ | 156,755 | $ | — | $ | 9,232 | $ | — | $ | (2,576 | ) | $ | 163,411 | |||||||||||
| Gain on loan sales, net |
— | 127,515 | — | — | — | 127,515 | ||||||||||||||||||
| Interest income on loans |
33,402 | 49 | — | — | — | 33,451 | ||||||||||||||||||
| Insurance revenue |
14,566 | — | — | — | — | 14,566 | ||||||||||||||||||
| Net fair value gains on reverse loans and related HMBS obligations |
— | — | 25,268 | — | — | 25,268 | ||||||||||||||||||
| Other income |
21,007 | 5,198 | 2,922 | 3,150 | (10,488 | ) | 21,789 | |||||||||||||||||
|
|
|
|
|
|
|
|
|
|
|
|
|
|||||||||||||
| Total revenues |
225,730 | 132,762 | 37,422 | 3,150 | (13,064 | ) | 386,000 | |||||||||||||||||
|
|
|
|
|
|
|
|
|
|
|
|
|
|||||||||||||
| EXPENSES: |
||||||||||||||||||||||||
| Interest expense |
30,082 | 8,368 | 852 | 37,420 | — | 76,722 | ||||||||||||||||||
| Depreciation and amortization |
11,316 | 4,302 | 2,296 | 4 | — | 17,918 | ||||||||||||||||||
| Other expenses, net |
186,770 | 77,621 | 37,774 | 5,782 | (13,064 | ) | 294,883 | |||||||||||||||||
|
|
|
|
|
|
|
|
|
|
|
|
|
|||||||||||||
| Total expenses |
228,168 | 90,291 | 40,922 | 43,206 | (13,064 | ) | 389,523 | |||||||||||||||||
|
|
|
|
|
|
|
|
|
|
|
|
|
|||||||||||||
| OTHER GAINS (LOSSES) |
||||||||||||||||||||||||
| Net fair value gains (losses) |
(274 | ) | — | — | 17,068 | — | 16,794 | |||||||||||||||||
| Other |
(590 | ) | — | — | — | — | (590 | ) | ||||||||||||||||
|
|
|
|
|
|
|
|
|
|
|
|
|
|||||||||||||
| Total other gains (losses) |
(864 | ) | — | — | 17,068 | — | 16,204 | |||||||||||||||||
|
|
|
|
|
|
|
|
|
|
|
|
|
|||||||||||||
| Income (loss) before income taxes |
(3,302 | ) | 42,471 | (3,500 | ) | (22,988 | ) | — | 12,681 | |||||||||||||||
| ADJUSTED EARNINGS (LOSS) |
||||||||||||||||||||||||
| Changes in fair value due to changes in valuation inputs and other assumptions |
1,724 | — | — | — | — | 1,724 | ||||||||||||||||||
| Step-up depreciation and amortization |
6,227 | 2,332 | 1,726 | — | — | 10,285 | ||||||||||||||||||
| Step-up amortization of sub-servicing contracts |
7,833 | — | — | — | — | 7,833 | ||||||||||||||||||
| Non-cash interest expense |
706 | — | — | 2,489 | — | 3,195 | ||||||||||||||||||
| Share-based compensation expense |
1,849 | 779 | 478 | 164 | — | 3,270 | ||||||||||||||||||
| Fair value to cash adjustments for reverse loans |
— | — | (5,109 | ) | — | — | (5,109 | ) | ||||||||||||||||
| Legal and regulatory matters |
31,645 | — | 5,542 | — | — | 37,187 | ||||||||||||||||||
| Other |
4 | 85 | 1,457 | (13,348 | ) | — | (11,802 | ) | ||||||||||||||||
|
|
|
|
|
|
|
|
|
|
|
|
|
|||||||||||||
| Total adjustments |
49,988 | 3,196 | 4,094 | (10,695 | ) | — | 46,583 | |||||||||||||||||
|
|
|
|
|
|
|
|
|
|
|
|
|
|||||||||||||
| Adjusted Earnings (Loss) |
46,686 | 45,667 | 594 | (33,683 | ) | — | 59,264 | |||||||||||||||||
| ADJUSTED EBITDA |
||||||||||||||||||||||||
| Amortization of servicing rights and other fair value adjustments |
47,228 | — | 651 | — | — | 47,879 | ||||||||||||||||||
| Interest expense on debt |
2,674 | — | 5 | 34,931 | — | 37,610 | ||||||||||||||||||
| Depreciation and amortization |
5,089 | 1,970 | 570 | 4 | — | 7,633 | ||||||||||||||||||
| Other |
1,139 | (1,575 | ) | 11 | 57 | — | (368 | ) | ||||||||||||||||
|
|
|
|
|
|
|
|
|
|
|
|
|
|||||||||||||
| Total adjustments |
56,130 | 395 | 1,237 | 34,992 | — | 92,754 | ||||||||||||||||||
|
|
|
|
|
|
|
|
|
|
|
|
|
|||||||||||||
| Adjusted EBITDA |
$ | 102,816 | $ | 46,062 | $ | 1,831 | $ | 1,309 | $ | — | $ | 152,018 | ||||||||||||
|
|
|
|
|
|
|
|
|
|
|
|
|
|||||||||||||
13
Walter Investment Management Corp.
Segment Results of Operations and Non-GAAP Financial Measures
For the Nine Months Ended September 30, 2015
(in thousands)
| Servicing | Originations | Reverse Mortgage |
Other | Eliminations | Total Consolidated |
|||||||||||||||||||
| REVENUES: |
||||||||||||||||||||||||
| Servicing revenue and fees |
$ | 286,405 | $ | — | $ | 34,568 | $ | — | $ | (7,942 | ) | $ | 313,031 | |||||||||||
| Gain on loan sales, net |
1,418 | 358,600 | (98 | ) | — | 924 | 360,844 | |||||||||||||||||
| Interest income on loans |
62,487 | 50 | — | — | — | 62,537 | ||||||||||||||||||
| Insurance revenue |
34,323 | — | — | — | — | 34,323 | ||||||||||||||||||
| Net fair value gains on reverse loans and related HMBS obligations |
— | — | 90,233 | — | — | 90,233 | ||||||||||||||||||
| Other income |
64,512 | 32,378 | 4,791 | 4,886 | (24,852 | ) | 81,715 | |||||||||||||||||
|
|
|
|
|
|
|
|
|
|
|
|
|
|||||||||||||
| Total revenues |
449,145 | 391,028 | 129,494 | 4,886 | (31,870 | ) | 942,683 | |||||||||||||||||
|
|
|
|
|
|
|
|
|
|
|
|
|
|||||||||||||
| EXPENSES: |
||||||||||||||||||||||||
| Interest expense |
67,062 | 27,958 | 3,074 | 112,170 | — | 210,264 | ||||||||||||||||||
| Depreciation and amortization |
34,322 | 13,083 | 5,955 | 11 | — | 53,371 | ||||||||||||||||||
| Goodwill impairment |
— | — | 56,539 | — | — | 56,539 | ||||||||||||||||||
| Other expenses, net |
474,548 | 238,706 | 145,800 | 16,146 | (31,870 | ) | 843,330 | |||||||||||||||||
|
|
|
|
|
|
|
|
|
|
|
|
|
|||||||||||||
| Total expenses |
575,932 | 279,747 | 211,368 | 128,327 | (31,870 | ) | 1,163,504 | |||||||||||||||||
|
|
|
|
|
|
|
|
|
|
|
|
|
|||||||||||||
| OTHER GAINS (LOSSES) |
||||||||||||||||||||||||
| Net fair value gains (losses) |
(545 | ) | — | — | 4,118 | — | 3,573 | |||||||||||||||||
| Other |
6,134 | — | — | 14,879 | — | 21,013 | ||||||||||||||||||
|
|
|
|
|
|
|
|
|
|
|
|
|
|||||||||||||
| Total other gains (losses) |
5,589 | — | — | 18,997 | — | 24,586 | ||||||||||||||||||
|
|
|
|
|
|
|
|
|
|
|
|
|
|||||||||||||
| Income (loss) before income taxes |
(121,198 | ) | 111,281 | (81,874 | ) | (104,444 | ) | — | (196,235 | ) | ||||||||||||||
| ADJUSTED EARNINGS (LOSS) |
||||||||||||||||||||||||
| Goodwill impairment |
— | — | 56,539 | — | — | 56,539 | ||||||||||||||||||
| Changes in fair value due to changes in valuation inputs and other assumptions |
157,312 | — | — | — | — | 157,312 | ||||||||||||||||||
| Step-up depreciation and amortization |
20,912 | 6,856 | 3,985 | — | — | 31,753 | ||||||||||||||||||
| Step-up amortization of sub-servicing rights |
14,564 | — | — | — | — | 14,564 | ||||||||||||||||||
| Non-cash interest expense |
1,493 | — | — | 7,983 | — | 9,476 | ||||||||||||||||||
| Share-based compensation expense |
8,474 | 3,737 | 1,749 | 385 | — | 14,345 | ||||||||||||||||||
| Fair value to cash adjustment for reverse loans |
— | — | (7,647 | ) | — | — | (7,647 | ) | ||||||||||||||||
| Curtailment expense |
— | — | 23,012 | — | — | 23,012 | ||||||||||||||||||
| Legal and regulatory matters |
2,218 | — | 5,020 | — | — | 7,238 | ||||||||||||||||||
| Other |
7,322 | 1,544 | 1,429 | 7,321 | — | 17,616 | ||||||||||||||||||
|
|
|
|
|
|
|
|
|
|
|
|
|
|||||||||||||
| Total adjustments |
212,295 | 12,137 | 84,087 | 15,689 | — | 324,208 | ||||||||||||||||||
|
|
|
|
|
|
|
|
|
|
|
|
|
|||||||||||||
| Adjusted Earnings (Loss) |
91,097 | 123,418 | 2,213 | (88,755 | ) | — | 127,973 | |||||||||||||||||
| ADJUSTED EBITDA |
||||||||||||||||||||||||
| Amortization of servicing rights and other fair value adjustments |
184,019 | — | 1,576 | — | — | 185,595 | ||||||||||||||||||
| Interest expense on debt |
6,987 | — | 2 | 104,187 | — | 111,176 | ||||||||||||||||||
| Depreciation and amortization |
13,410 | 6,227 | 1,970 | 11 | — | 21,618 | ||||||||||||||||||
| Other |
(5,640 | ) | 7,493 | 175 | 109 | — | 2,137 | |||||||||||||||||
|
|
|
|
|
|
|
|
|
|
|
|
|
|||||||||||||
| Total adjustments |
198,776 | 13,720 | 3,723 | 104,307 | — | 320,526 | ||||||||||||||||||
|
|
|
|
|
|
|
|
|
|
|
|
|
|||||||||||||
| Adjusted EBITDA |
$ | 289,873 | $ | 137,138 | $ | 5,936 | $ | 15,552 | $ | — | $ | 448,499 | ||||||||||||
|
|
|
|
|
|
|
|
|
|
|
|
|
|||||||||||||
14
Walter Investment Management Corp.
Segment Results of Operations and Non-GAAP Financial Measures
For the Nine Months Ended September 30, 2014
(in thousands)
| Servicing | Originations | Reverse Mortgage |
Other | Eliminations | Total Consolidated |
|||||||||||||||||||
| REVENUES: |
||||||||||||||||||||||||
| Servicing revenue and fees |
$ | 458,781 | $ | — | $ | 25,619 | $ | — | $ | (7,221 | ) | $ | 477,179 | |||||||||||
| Gain on loan sales, net |
— | 376,160 | — | — | — | 376,160 | ||||||||||||||||||
| Interest income on loans |
102,042 | 49 | — | — | — | 102,091 | ||||||||||||||||||
| Insurance revenue |
57,760 | — | — | — | — | 57,760 | ||||||||||||||||||
| Net fair value gains on reverse loans and related HMBS obligations |
— | — | 69,440 | — | — | 69,440 | ||||||||||||||||||
| Other income |
55,593 | 16,066 | 8,949 | 40,076 | (33,653 | ) | 87,031 | |||||||||||||||||
|
|
|
|
|
|
|
|
|
|
|
|
|
|||||||||||||
| Total revenues |
674,176 | 392,275 | 104,008 | 40,076 | (40,874 | ) | 1,169,661 | |||||||||||||||||
|
|
|
|
|
|
|
|
|
|
|
|
|
|||||||||||||
| EXPENSES: |
||||||||||||||||||||||||
| Interest expense |
91,277 | 21,828 | 2,486 | 110,670 | — | 226,261 | ||||||||||||||||||
| Depreciation and amortization |
35,027 | 12,901 | 7,014 | 11 | — | 54,953 | ||||||||||||||||||
| Goodwill impairment |
— | — | 82,269 | — | — | 82,269 | ||||||||||||||||||
| Other expenses, net |
505,795 | 242,447 | 110,518 | 13,805 | (40,874 | ) | 831,691 | |||||||||||||||||
|
|
|
|
|
|
|
|
|
|
|
|
|
|||||||||||||
| Total expenses |
632,099 | 277,176 | 202,287 | 124,486 | (40,874 | ) | 1,195,174 | |||||||||||||||||
|
|
|
|
|
|
|
|
|
|
|
|
|
|||||||||||||
| OTHER GAINS (LOSSES) |
||||||||||||||||||||||||
| Net fair value gains (losses) |
(1,762 | ) | — | — | 17,585 | — | 15,823 | |||||||||||||||||
| Other |
(590 | ) | — | — | — | — | (590 | ) | ||||||||||||||||
|
|
|
|
|
|
|
|
|
|
|
|
|
|||||||||||||
| Total other gains (losses) |
(2,352 | ) | — | — | 17,585 | — | 15,233 | |||||||||||||||||
|
|
|
|
|
|
|
|
|
|
|
|
|
|||||||||||||
| Income (loss) before income taxes |
39,725 | 115,099 | (98,279 | ) | (66,825 | ) | — | (10,280 | ) | |||||||||||||||
| ADJUSTED EARNINGS (LOSS) |
||||||||||||||||||||||||
| Goodwill impairment |
— | — | 82,269 | — | — | 82,269 | ||||||||||||||||||
| Changes in fair value due to changes in valuation inputs and other assumptions |
70,718 | — | — | — | — | 70,718 | ||||||||||||||||||
| Step-up depreciation and amortization |
20,486 | 7,628 | 5,400 | 1 | — | 33,515 | ||||||||||||||||||
| Step-up amortization of sub-servicing rights |
23,980 | — | — | — | — | 23,980 | ||||||||||||||||||
| Non-cash interest expense |
3,343 | — | — | 7,201 | — | 10,544 | ||||||||||||||||||
| Share-based compensation expense |
6,783 | 2,654 | 1,723 | 411 | — | 11,571 | ||||||||||||||||||
| Fair value to cash adjustment for reverse loans |
— | — | (6,331 | ) | — | — | (6,331 | ) | ||||||||||||||||
| Legal and regulatory matters |
44,837 | — | 5,542 | — | — | 50,379 | ||||||||||||||||||
| Other |
964 | 5,860 | 5,312 | (9,257 | ) | — | 2,879 | |||||||||||||||||
|
|
|
|
|
|
|
|
|
|
|
|
|
|||||||||||||
| Total adjustments |
171,111 | 16,142 | 93,915 | (1,644 | ) | — | 279,524 | |||||||||||||||||
|
|
|
|
|
|
|
|
|
|
|
|
|
|||||||||||||
| Adjusted Earnings (Loss) |
210,836 | 131,241 | (4,364 | ) | (68,469 | ) | — | 269,244 | ||||||||||||||||
| ADJUSTED EBITDA |
||||||||||||||||||||||||
| Amortization of servicing rights and other fair value adjustments |
113,135 | — | 2,094 | — | — | 115,229 | ||||||||||||||||||
| Interest expense on debt |
2,725 | — | 23 | 103,469 | — | 106,217 | ||||||||||||||||||
| Depreciation and amortization |
14,541 | 5,273 | 1,614 | 10 | — | 21,438 | ||||||||||||||||||
| Other |
8,942 | (1,779 | ) | (35 | ) | (41 | ) | — | 7,087 | |||||||||||||||
|
|
|
|
|
|
|
|
|
|
|
|
|
|||||||||||||
| Total adjustments |
139,343 | 3,494 | 3,696 | 103,438 | — | 249,971 | ||||||||||||||||||
|
|
|
|
|
|
|
|
|
|
|
|
|
|||||||||||||
| Adjusted EBITDA |
$ | 350,179 | $ | 134,735 | $ | (668 | ) | $ | 34,969 | $ | — | $ | 519,215 | |||||||||||
|
|
|
|
|
|
|
|
|
|
|
|
|
|||||||||||||
15
Reconciliation of GAAP Income (Loss) Before Income Taxes to
Non-GAAP AEBITDA
(in millions)
| For the Three Months Ended | For the Nine Months Ended | |||||||||||||||
| September 30, 2015 |
September 30, 2014 |
September 30, 2015 |
September 30, 2014 |
|||||||||||||
| Income (loss) before income taxes |
$ | (131.6 | ) | $ | 12.7 | $ | (196.2 | ) | $ | (10.3 | ) | |||||
| Add/(Subtract): |
||||||||||||||||
| Goodwill impairment |
— | — | 56.5 | 82.3 | ||||||||||||
| Amortization of servicing rights and other fair value adjustments |
221.2 | 57.4 | 357.5 | 209.9 | ||||||||||||
| Interest expense |
41.0 | 40.8 | 120.7 | 116.7 | ||||||||||||
| Depreciation and amortization |
20.6 | 17.9 | 53.4 | 55.0 | ||||||||||||
| Curtailment expense |
0.5 | — | 23.0 | — | ||||||||||||
| Share-based compensation expense |
5.9 | 3.3 | 14.3 | 11.6 | ||||||||||||
| Fair value to cash adjustment for reverse loans |
(27.4 | ) | (5.1 | ) | (7.6 | ) | (6.3 | ) | ||||||||
| Legal and regulatory matters |
2.2 | 37.2 | 7.2 | 50.4 | ||||||||||||
| Other |
13.0 | (12.2 | ) | 19.7 | 9.9 | |||||||||||
|
|
|
|
|
|
|
|
|
|||||||||
| Sub-total |
277.0 | 139.3 | 644.7 | 529.5 | ||||||||||||
|
|
|
|
|
|
|
|
|
|||||||||
| Adjusted EBITDA |
$ | 145.4 | $ | 152.0 | $ | 448.5 | $ | 519.2 | ||||||||
|
|
|
|
|
|
|
|
|
|||||||||
Reconciliation of GAAP Income (Loss) Before Income Taxes to
Non-GAAP Adjusted Earnings
(in millions, except per share amounts)
| For the Three Months Ended | For the Nine Months Ended | |||||||||||||||
| September 30, 2015 |
September 30, 2014 |
September 30, 2015 |
September 30, 2014 |
|||||||||||||
| Income (loss) before income taxes |
$ | (131.6 | ) | $ | 12.7 | $ | (196.2 | ) | $ | (10.3 | ) | |||||
| Add/(Subtract): |
||||||||||||||||
| Goodwill impairment |
— | — | 56.5 | 82.3 | ||||||||||||
| Changes in fair value due to changes in valuation inputs and other assumptions |
147.9 | 1.7 | 157.3 | 70.7 | ||||||||||||
| Curtailment expense |
0.5 | — | 23.0 | — | ||||||||||||
| Step-up depreciation and amortization |
13.3 | 10.3 | 31.8 | 33.5 | ||||||||||||
| Step-up amortization of sub-servicing rights |
4.7 | 7.8 | 14.6 | 24.0 | ||||||||||||
| Share-based compensation expense |
5.9 | 3.3 | 14.3 | 11.6 | ||||||||||||
| Non-cash interest expense |
3.1 | 3.2 | 9.5 | 10.5 | ||||||||||||
| Fair value to cash adjustment for reverse loans |
(27.4 | ) | (5.1 | ) | (7.6 | ) | (6.3 | ) | ||||||||
| Legal and regulatory matters |
2.2 | 37.2 | 7.2 | 50.4 | ||||||||||||
| Other |
8.2 | (11.8 | ) | 17.6 | 2.9 | |||||||||||
|
|
|
|
|
|
|
|
|
|||||||||
| Adjusted Earnings |
$ | 26.8 | $ | 59.3 | $ | 128.0 | $ | 269.3 | ||||||||
| Adjusted Earnings after tax (38% in 2015 and 39% in 2014) |
16.6 | 36.2 | 79.3 | 164.2 | ||||||||||||
| Adjusted Earnings after taxes per common and common equivalent share. |
$ | 0.44 | $ | 0.96 | $ | 2.10 | $ | 4.37 | ||||||||
16
Third Quarter 2015 Earnings Presentation November 5, 2015 Exhibit 99.2
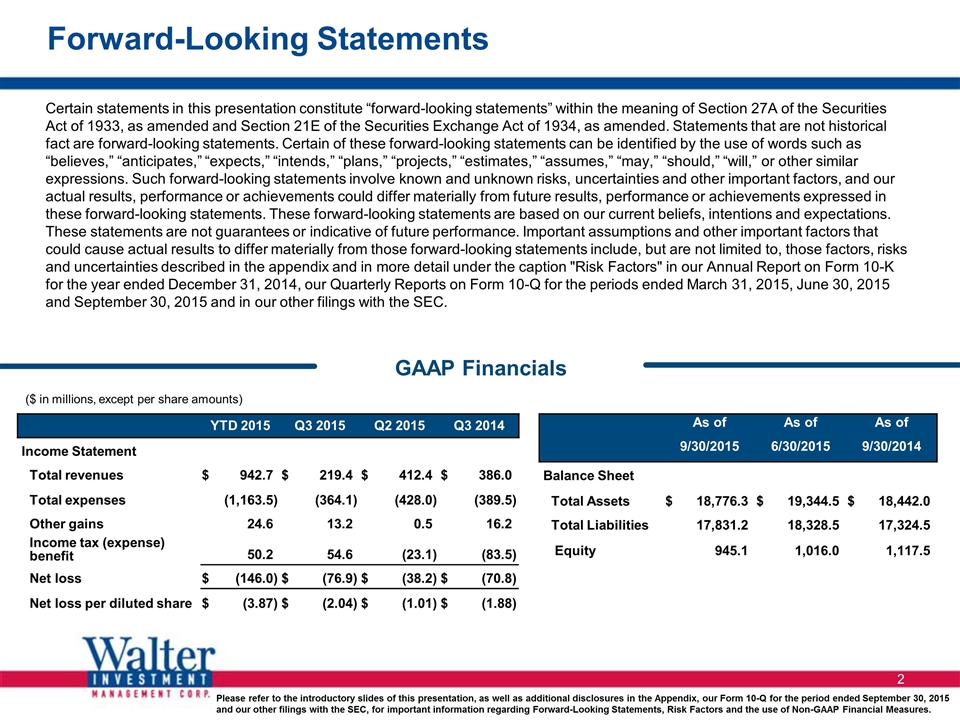
Forward-Looking Statements Certain statements in this presentation constitute “forward-looking statements” within the meaning of Section 27A of the Securities Act of 1933, as amended and Section 21E of the Securities Exchange Act of 1934, as amended. Statements that are not historical fact are forward-looking statements. Certain of these forward-looking statements can be identified by the use of words such as “believes,” “anticipates,” “expects,” “intends,” “plans,” “projects,” “estimates,” “assumes,” “may,” “should,” “will,” or other similar expressions. Such forward-looking statements involve known and unknown risks, uncertainties and other important factors, and our actual results, performance or achievements could differ materially from future results, performance or achievements expressed in these forward-looking statements. These forward-looking statements are based on our current beliefs, intentions and expectations. These statements are not guarantees or indicative of future performance. Important assumptions and other important factors that could cause actual results to differ materially from those forward-looking statements include, but are not limited to, those factors, risks and uncertainties described in the appendix and in more detail under the caption "Risk Factors" in our Annual Report on Form 10-K for the year ended December 31, 2014, our Quarterly Reports on Form 10-Q for the periods ended March 31, 2015, June 30, 2015 and September 30, 2015 and in our other filings with the SEC. As of As of As of As of As of As of 9/30/2015 9/30/2015 6/30/2015 6/30/2015 9/30/2014 9/30/2014 Balance Sheet Total Assets $ 18,776.3 $ 19,344.5 $ 18,442.0 Total Liabilities 17,831.2 18,328.5 17,324.5 Equity 945.1 1,016.0 1,117.5 YTD 2015 YTD 2015 Q3 2015 Q3 2015 Q2 2015 Q2 2015 Q3 2014 Q3 2014 Income Statement Total revenues $ 942.7 $ 219.4 $ 412.4 $ 386.0 Total expenses (1,163.5 ) (364.1 ) (428.0 ) (389.5 ) Other gains 24.6 13.2 0.5 16.2 Income tax (expense) benefit 50.2 54.6 (23.1 ) (83.5 ) Net loss $ (146.0 ) $ (76.9 ) $ (38.2 ) $ (70.8 ) Net loss per diluted share $ (3.87 ) $ (2.04 ) $ (1.01 ) $ (1.88 ) GAAP Financials ($ in millions, except per share amounts)

Walter Investment Overview Diversified capabilities position business for sustainable growth in changing sector Significant alignment of interest exists between the servicer, the regulators, our clients and our consumers as we pursue a best-in-class culture of compliance and enhanced consumer experience Continued focus on enhancing differentiated platform to drive profitable growth and deliver value to our shareholders Seasoned senior management team; well-positioned for developing environment Top 10 national Servicer with serviced UPB of $265.4 BN Top 20 national Originator focused on retention opportunity and growing the Retail and Consumer Direct channels Reverse Mortgage business a leading issuer and servicer in sector Investment Management business capitalizing on Walter's depth and scale in mortgage sector and leveraging our relationship with WCO Diversified Mortgage Banking Operations Scale of U.S. Residential Mortgage Sector provides significant opportunity for Walter Investment
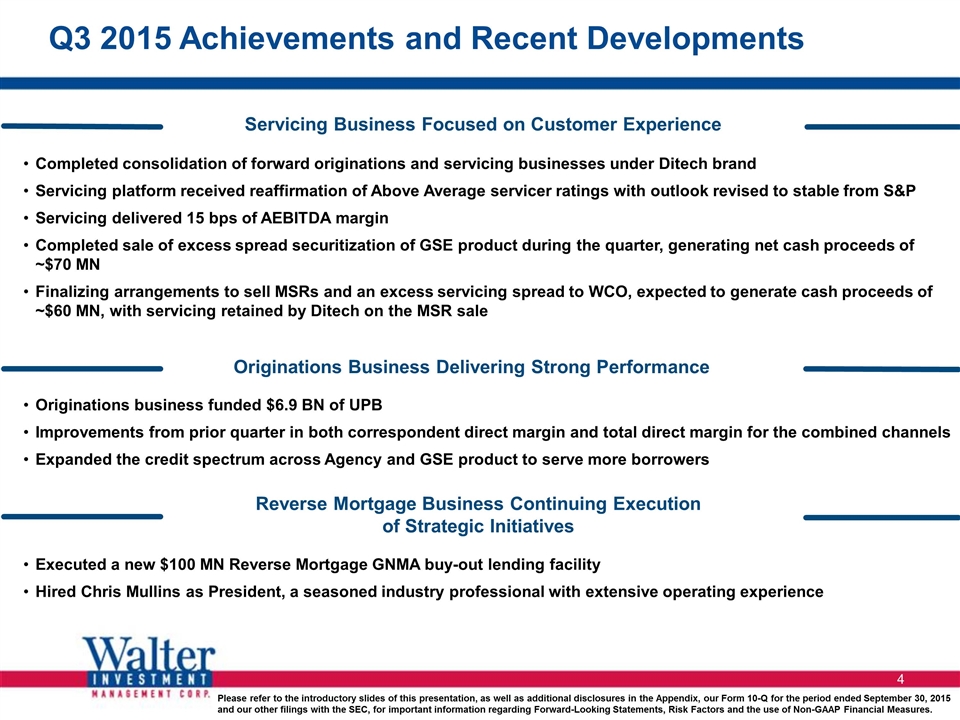
Please refer to the introductory slides of this presentation, as well as additional disclosures in the Appendix, our Form 10-Q for the period ended September 30, 2015 and our other filings with the SEC, for important information regarding Forward-Looking Statements, Risk Factors and the use of Non-GAAP Financial Measures. Completed consolidation of forward originations and servicing businesses under Ditech brand Servicing platform received reaffirmation of Above Average servicer ratings with outlook revised to stable from S&P Servicing delivered 15 bps of AEBITDA margin Completed sale of excess spread securitization of GSE product during the quarter, generating net cash proceeds of ~$70 MN Finalizing arrangements to sell MSRs and an excess servicing spread to WCO, expected to generate cash proceeds of ~$60 MN, with servicing retained by Ditech on the MSR sale Executed a new $100 MN Reverse Mortgage GNMA buy-out lending facility Hired Chris Mullins as President, a seasoned industry professional with extensive operating experience Originations business funded $6.9 BN of UPB Improvements from prior quarter in both correspondent direct margin and total direct margin for the combined channels Expanded the credit spectrum across Agency and GSE product to serve more borrowers Servicing Business Focused on Customer Experience Originations Business Delivering Strong Performance Reverse Mortgage Business Continuing Execution of Strategic Initiatives Q3 2015 Achievements and Recent Developments
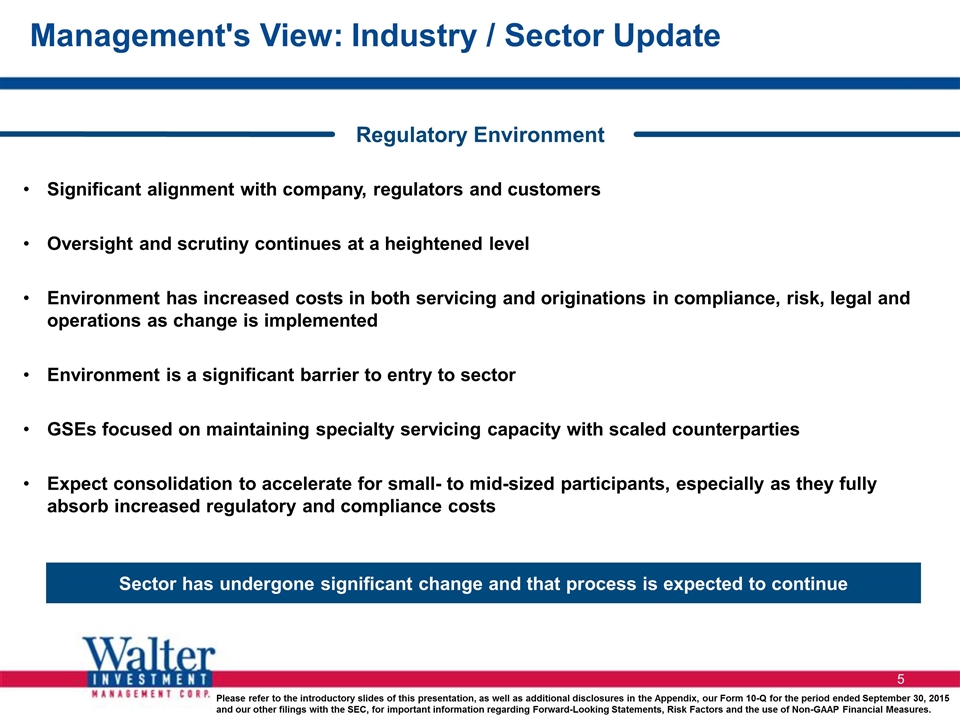
Management's View: Industry / Sector Update Sector has undergone significant change and that process is expected to continue Regulatory Environment Significant alignment with company, regulators and customers Oversight and scrutiny continues at a heightened level Environment has increased costs in both servicing and originations in compliance, risk, legal and operations as change is implemented Environment is a significant barrier to entry to sector GSEs focused on maintaining specialty servicing capacity with scaled counterparties Expect consolidation to accelerate for small- to mid-sized participants, especially as they fully absorb increased regulatory and compliance costs
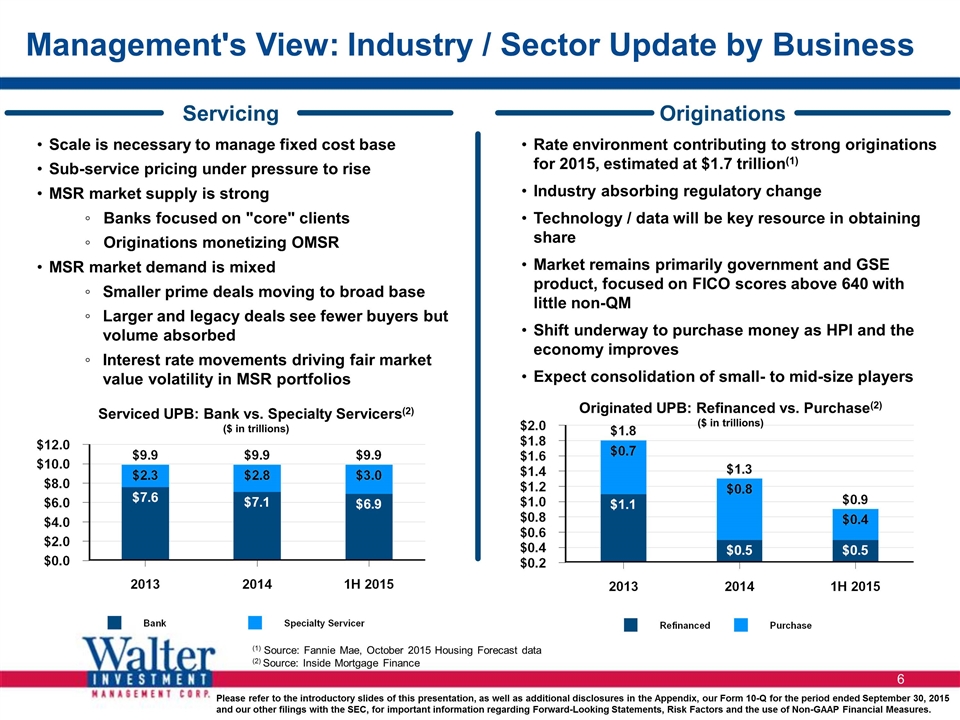
Management's View: Industry / Sector Update by Business Rate environment contributing to strong originations for 2015, estimated at $1.7 trillion(1) Industry absorbing regulatory change Technology / data will be key resource in obtaining share Market remains primarily government and GSE product, focused on FICO scores above 640 with little non-QM Shift underway to purchase money as HPI and the economy improves Expect consolidation of small- to mid-size players Scale is necessary to manage fixed cost base Sub-service pricing under pressure to rise MSR market supply is strong Banks focused on "core" clients Originations monetizing OMSR MSR market demand is mixed Smaller prime deals moving to broad base Larger and legacy deals see fewer buyers but volume absorbed Interest rate movements driving fair market value volatility in MSR portfolios Servicing Originations (1) Source: Fannie Mae, October 2015 Housing Forecast data (2) Source: Inside Mortgage Finance Serviced UPB: Bank vs. Specialty Servicers(2) ($ in trillions) Originated UPB: Refinanced vs. Purchase(2) ($ in trillions)
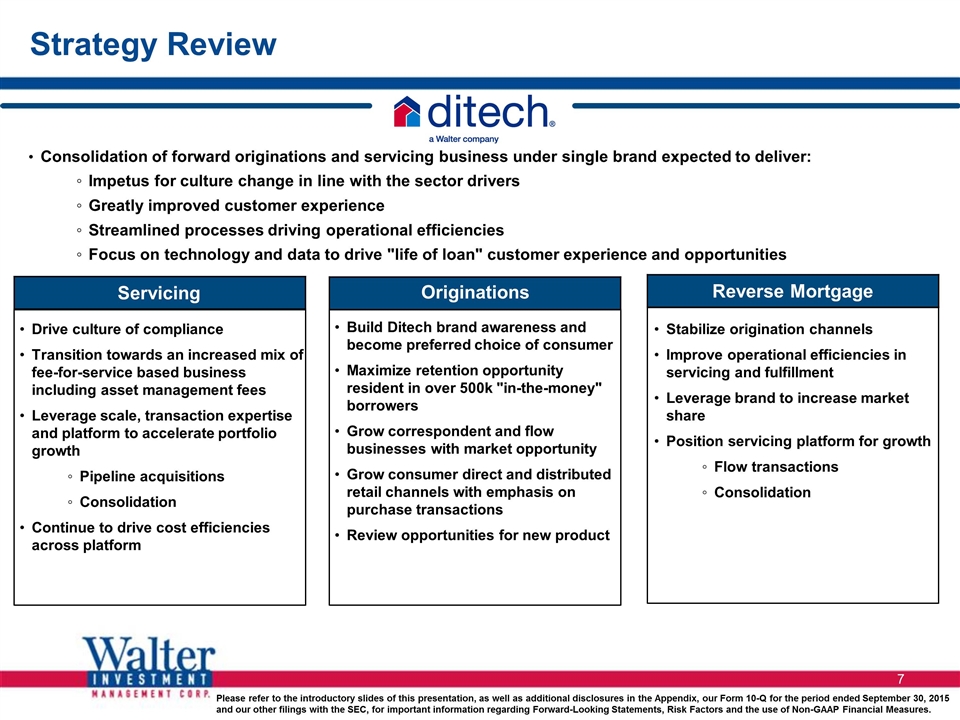
Strategy Review Consolidation of forward originations and servicing business under single brand expected to deliver: Impetus for culture change in line with the sector drivers Greatly improved customer experience Streamlined processes driving operational efficiencies Focus on technology and data to drive "life of loan" customer experience and opportunities Drive culture of compliance Transition towards an increased mix of fee-for-service based business including asset management fees Leverage scale, transaction expertise and platform to accelerate portfolio growth Pipeline acquisitions Consolidation Continue to drive cost efficiencies across platform Build Ditech brand awareness and become preferred choice of consumer Maximize retention opportunity resident in over 500k "in-the-money" borrowers Grow correspondent and flow businesses with market opportunity Grow consumer direct and distributed retail channels with emphasis on purchase transactions Review opportunities for new product Stabilize origination channels Improve operational efficiencies in servicing and fulfillment Leverage brand to increase market share Position servicing platform for growth Flow transactions Consolidation Servicing Originations Reverse Mortgage
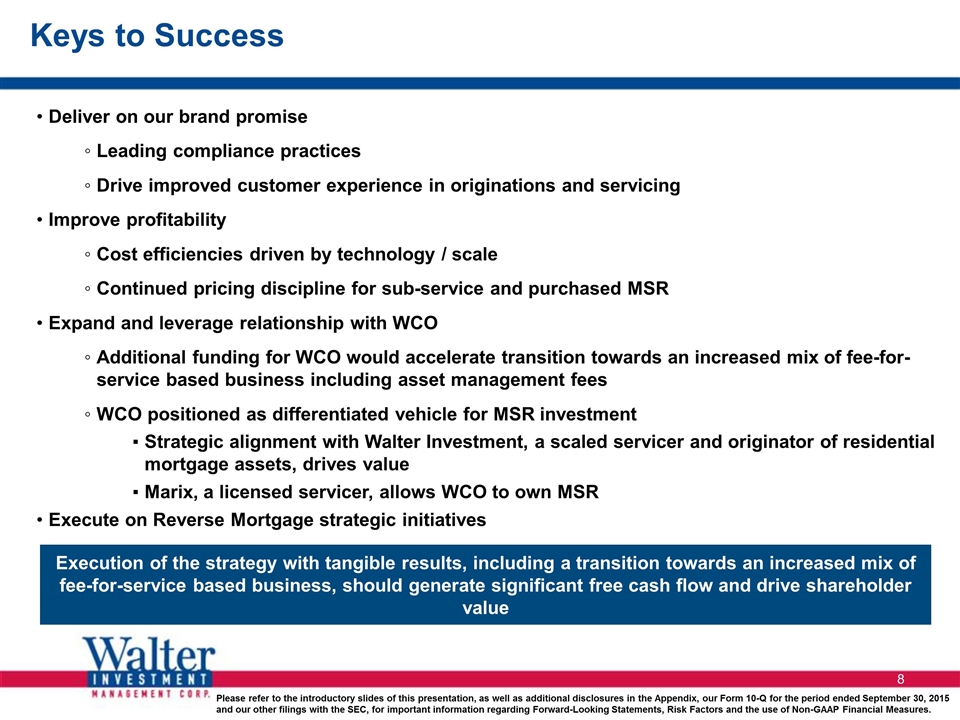
Keys to Success Deliver on our brand promise Leading compliance practices Drive improved customer experience in originations and servicing Improve profitability Cost efficiencies driven by technology / scale Continued pricing discipline for sub-service and purchased MSR Expand and leverage relationship with WCO Additional funding for WCO would accelerate transition towards an increased mix of fee-for-service based business including asset management fees WCO positioned as differentiated vehicle for MSR investment Strategic alignment with Walter Investment, a scaled servicer and originator of residential mortgage assets, drives value Marix, a licensed servicer, allows WCO to own MSR Execute on Reverse Mortgage strategic initiatives Execution of the strategy with tangible results, including a transition towards an increased mix of fee-for-service based business, should generate significant free cash flow and drive shareholder value
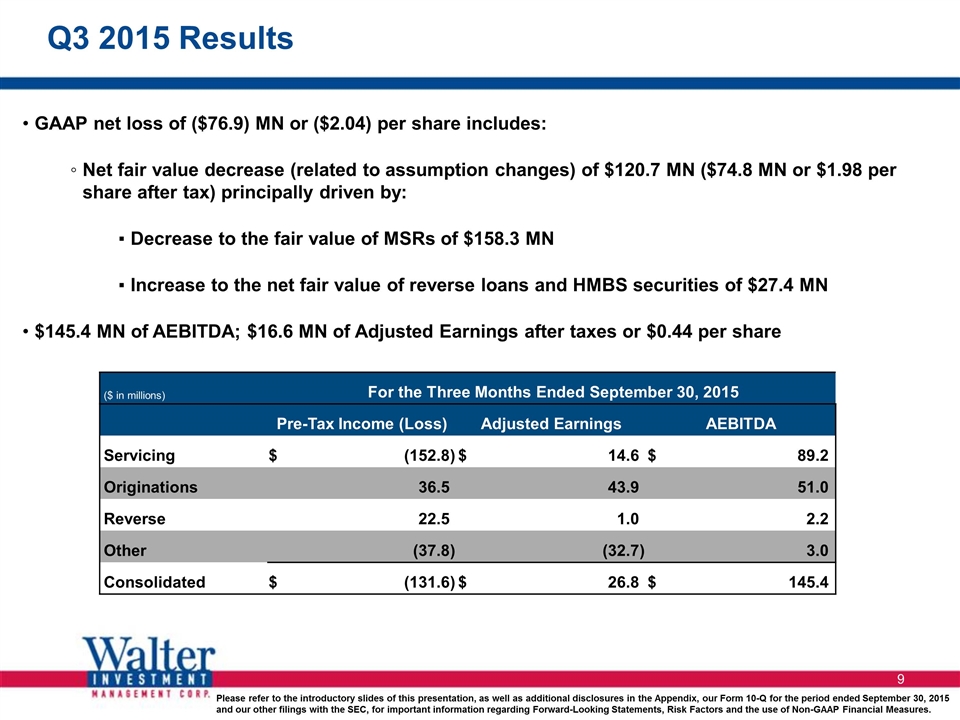
Q3 2015 Results GAAP net loss of ($76.9) MN or ($2.04) per share includes: Net fair value decrease (related to assumption changes) of $120.7 MN ($74.8 MN or $1.98 per share after tax) principally driven by: Decrease to the fair value of MSRs of $158.3 MN Increase to the net fair value of reverse loans and HMBS securities of $27.4 MN $145.4 MN of AEBITDA; $16.6 MN of Adjusted Earnings after taxes or $0.44 per share ($ in millions) For the Three Months Ended September 30, 2015 For the Three Months Ended September 30, 2015 Pre-Tax Income (Loss) Pre-Tax Income (Loss) Adjusted Earnings Adjusted Earnings AEBITDA AEBITDA Servicing $ (152.8 ) $ 14.6 $ 89.2 Originations 36.5 43.9 51.0 Reverse 22.5 1.0 2.2 Other (37.8 ) (32.7 ) 3.0 Consolidated $ (131.6 ) $ 26.8 $ 145.4
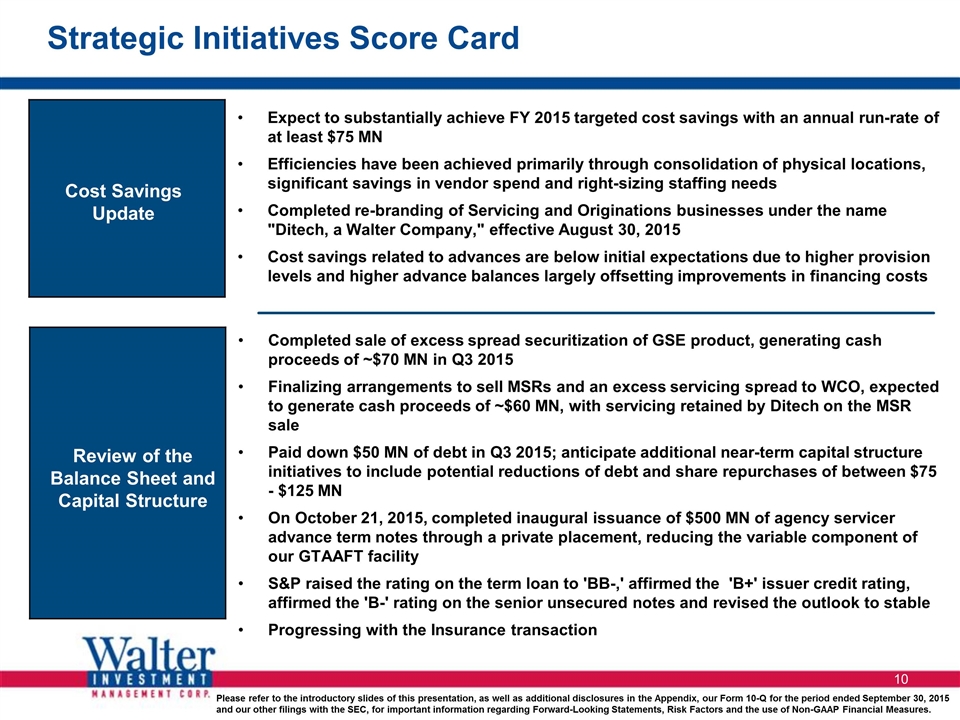
Review of the Balance Sheet and Capital Structure Cost Savings Update Completed sale of excess spread securitization of GSE product, generating cash proceeds of ~$70 MN in Q3 2015 Finalizing arrangements to sell MSRs and an excess servicing spread to WCO, expected to generate cash proceeds of ~$60 MN, with servicing retained by Ditech on the MSR sale Paid down $50 MN of debt in Q3 2015; anticipate additional near-term capital structure initiatives to include potential reductions of debt and share repurchases of between $75 - $125 MN On October 21, 2015, completed inaugural issuance of $500 MN of agency servicer advance term notes through a private placement, reducing the variable component of our GTAAFT facility S&P raised the rating on the term loan to 'BB-,' affirmed the 'B+' issuer credit rating, affirmed the 'B-' rating on the senior unsecured notes and revised the outlook to stable Progressing with the Insurance transaction Expect to substantially achieve FY 2015 targeted cost savings with an annual run-rate of at least $75 MN Efficiencies have been achieved primarily through consolidation of physical locations, significant savings in vendor spend and right-sizing staffing needs Completed re-branding of Servicing and Originations businesses under the name "Ditech, a Walter Company," effective August 30, 2015 Cost savings related to advances are below initial expectations due to higher provision levels and higher advance balances largely offsetting improvements in financing costs Please refer to the introductory slides of this presentation, as well as additional disclosures in the Appendix, our Form 10-Q for the period ended September 30, 2015 and our other filings with the SEC, for important information regarding Forward-Looking Statements, Risk Factors and the use of Non-GAAP Financial Measures. Strategic Initiatives Score Card
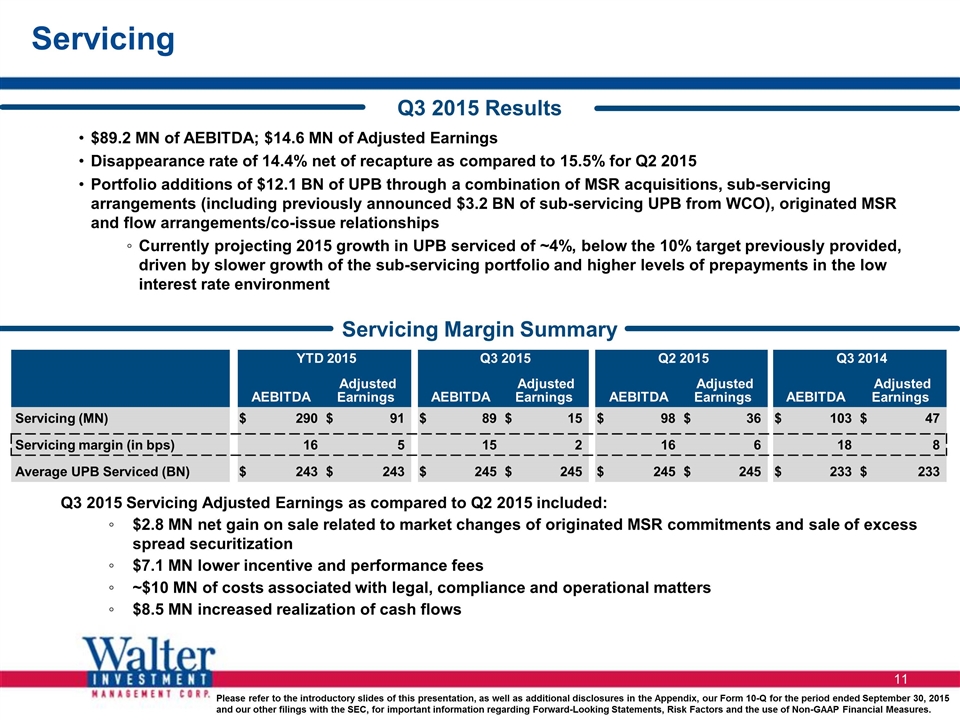
Please refer to the introductory slides of this presentation, as well as additional disclosures in the Appendix, our Form 10-Q for the period ended September 30, 2015 and our other filings with the SEC, for important information regarding Forward-Looking Statements, Risk Factors and the use of Non-GAAP Financial Measures. Servicing Q3 2015 Servicing Adjusted Earnings as compared to Q2 2015 included: $2.8 MN net gain on sale related to market changes of originated MSR commitments and sale of excess spread securitization $7.1 MN lower incentive and performance fees ~$10 MN of costs associated with legal, compliance and operational matters $8.5 MN increased realization of cash flows $89.2 MN of AEBITDA; $14.6 MN of Adjusted Earnings Disappearance rate of 14.4% net of recapture as compared to 15.5% for Q2 2015 Portfolio additions of $12.1 BN of UPB through a combination of MSR acquisitions, sub-servicing arrangements (including previously announced $3.2 BN of sub-servicing UPB from WCO), originated MSR and flow arrangements/co-issue relationships Currently projecting 2015 growth in UPB serviced of ~4%, below the 10% target previously provided, driven by slower growth of the sub-servicing portfolio and higher levels of prepayments in the low interest rate environment Q3 2015 Results Servicing Margin Summary YTD 2015 Q3 2015 Q2 2015 Q3 2014 AEBITDA Adjusted Earnings AEBITDA Adjusted Earnings AEBITDA Adjusted Earnings AEBITDA Adjusted Earnings Servicing (MN) $ 290 $ 91 $ 89 $ 15 $ 98 $ 36 $ 103 $ 47 Servicing margin (in bps) 16 5 15 2 16 6 18 8 Average UPB Serviced (BN) $ 243 $ 243 $ 245 $ 245 $ 245 $ 245 $ 233 $ 233
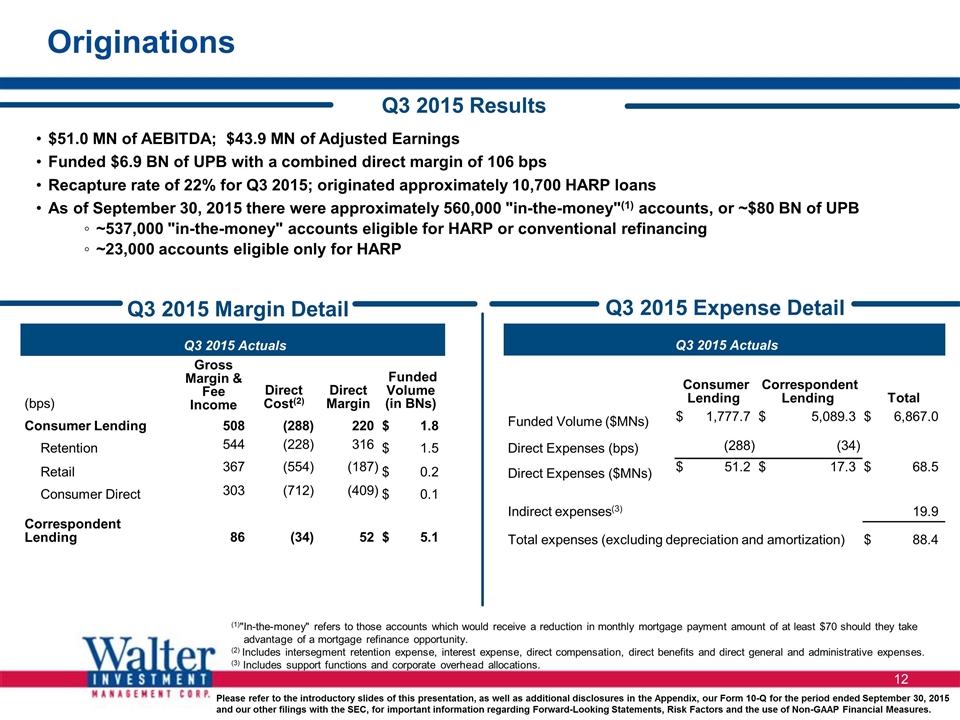
Originations Q3 2015 Actuals (bps) Gross Margin & Fee Income Direct Cost(2) Direct Margin Funded Volume (in BNs) Funded Volume (in BNs) Consumer Lending 508 (288 ) 220 $ 1.8 Retention 544 (228 ) 316 $ 1.5 Retail 367 (554 ) (187 ) $ 0.2 Consumer Direct 303 (712 ) (409 ) $ 0.1 Correspondent Lending 86 (34 ) 52 $ 5.1 $51.0 MN of AEBITDA; $43.9 MN of Adjusted Earnings Funded $6.9 BN of UPB with a combined direct margin of 106 bps Recapture rate of 22% for Q3 2015; originated approximately 10,700 HARP loans As of September 30, 2015 there were approximately 560,000 "in-the-money"(1) accounts, or ~$80 BN of UPB ~537,000 "in-the-money" accounts eligible for HARP or conventional refinancing ~23,000 accounts eligible only for HARP Q3 2015 Results (1)"In-the-money" refers to those accounts which would receive a reduction in monthly mortgage payment amount of at least $70 should they take advantage of a mortgage refinance opportunity. (2) Includes intersegment retention expense, interest expense, direct compensation, direct benefits and direct general and administrative expenses. (3) Includes support functions and corporate overhead allocations. Q3 2015 Margin Detail Q3 2015 Expense Detail Q3 2015 Actuals Consumer Lending Consumer Lending Correspondent Lending Correspondent Lending Total Total Funded Volume ($MNs) $ 1,777.7 $ 5,089.3 $ 6,867.0 Direct Expenses (bps) (288 ) (34 ) Direct Expenses ($MNs) $ 51.2 $ 17.3 $ 68.5 Indirect expenses(3) 19.9 Total expenses (excluding depreciation and amortization) $ 88.4
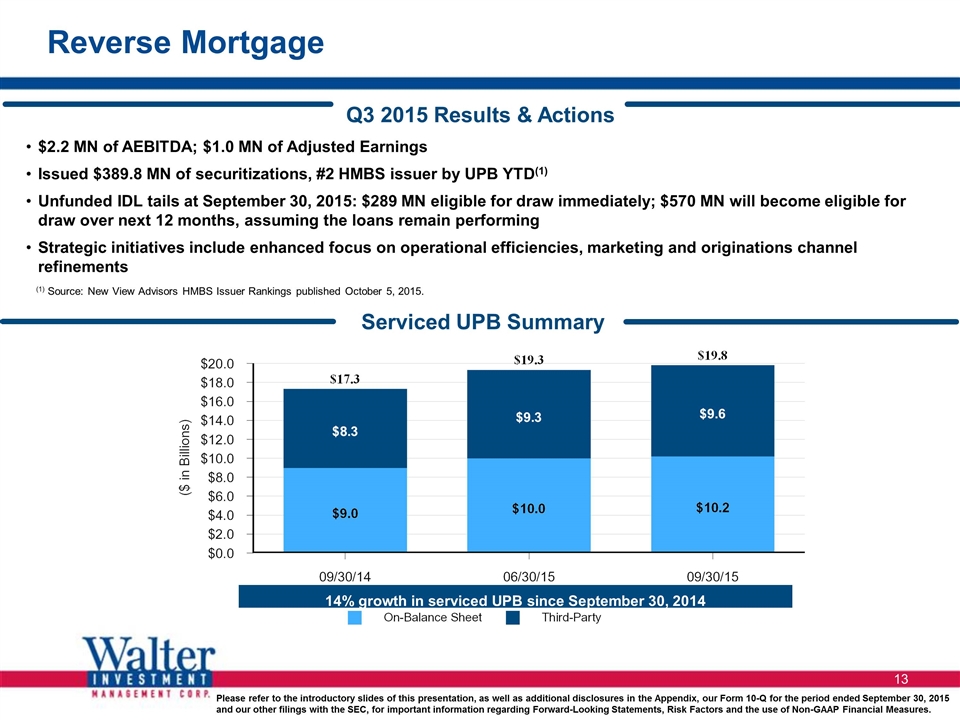
Reverse Mortgage $2.2 MN of AEBITDA; $1.0 MN of Adjusted Earnings Issued $389.8 MN of securitizations, #2 HMBS issuer by UPB YTD(1) Unfunded IDL tails at September 30, 2015: $289 MN eligible for draw immediately; $570 MN will become eligible for draw over next 12 months, assuming the loans remain performing Strategic initiatives include enhanced focus on operational efficiencies, marketing and originations channel refinements Serviced UPB Summary (1) Source: New View Advisors HMBS Issuer Rankings published October 5, 2015. Q3 2015 Results & Actions 14% growth in serviced UPB since September 30, 2014
Appendix: Supplemental Information & Reconciliations
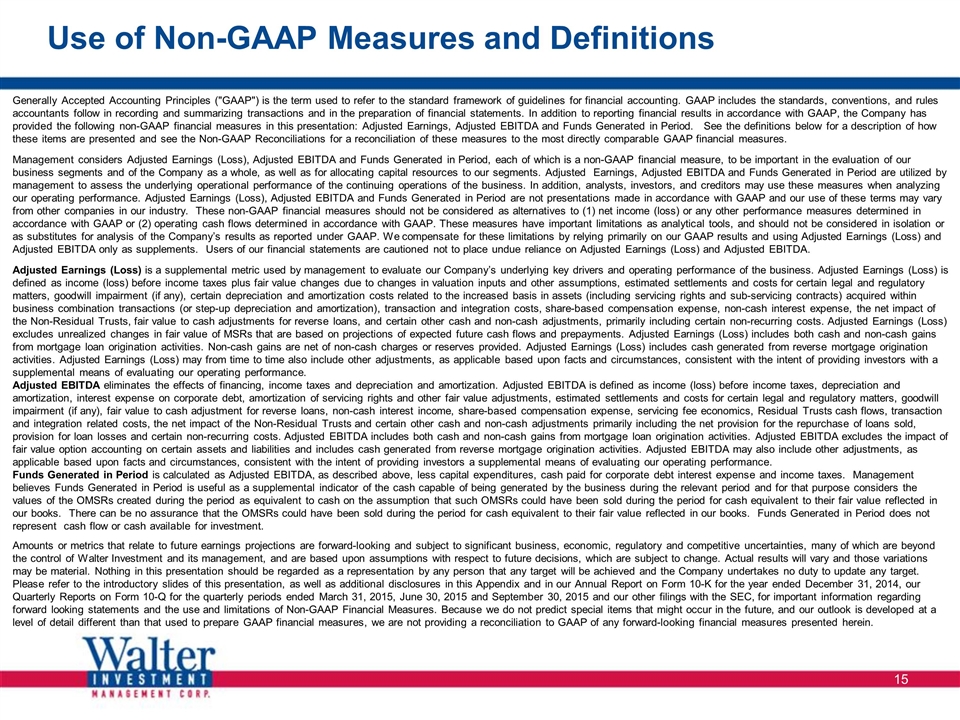
Use of Non-GAAP Measures and Definitions Generally Accepted Accounting Principles ("GAAP") is the term used to refer to the standard framework of guidelines for financial accounting. GAAP includes the standards, conventions, and rules accountants follow in recording and summarizing transactions and in the preparation of financial statements. In addition to reporting financial results in accordance with GAAP, the Company has provided the following non-GAAP financial measures in this presentation: Adjusted Earnings, Adjusted EBITDA and Funds Generated in Period. See the definitions below for a description of how these items are presented and see the Non-GAAP Reconciliations for a reconciliation of these measures to the most directly comparable GAAP financial measures. Management considers Adjusted Earnings (Loss), Adjusted EBITDA and Funds Generated in Period, each of which is a non-GAAP financial measure, to be important in the evaluation of our business segments and of the Company as a whole, as well as for allocating capital resources to our segments. Adjusted Earnings, Adjusted EBITDA and Funds Generated in Period are utilized by management to assess the underlying operational performance of the continuing operations of the business. In addition, analysts, investors, and creditors may use these measures when analyzing our operating performance. Adjusted Earnings (Loss), Adjusted EBITDA and Funds Generated in Period are not presentations made in accordance with GAAP and our use of these terms may vary from other companies in our industry. These non-GAAP financial measures should not be considered as alternatives to (1) net income (loss) or any other performance measures determined in accordance with GAAP or (2) operating cash flows determined in accordance with GAAP. These measures have important limitations as analytical tools, and should not be considered in isolation or as substitutes for analysis of the Company’s results as reported under GAAP. We compensate for these limitations by relying primarily on our GAAP results and using Adjusted Earnings (Loss) and Adjusted EBITDA only as supplements. Users of our financial statements are cautioned not to place undue reliance on Adjusted Earnings (Loss) and Adjusted EBITDA. Adjusted Earnings (Loss) is a supplemental metric used by management to evaluate our Company’s underlying key drivers and operating performance of the business. Adjusted Earnings (Loss) is defined as income (loss) before income taxes plus fair value changes due to changes in valuation inputs and other assumptions, estimated settlements and costs for certain legal and regulatory matters, goodwill impairment (if any), certain depreciation and amortization costs related to the increased basis in assets (including servicing rights and sub-servicing contracts) acquired within business combination transactions (or step-up depreciation and amortization), transaction and integration costs, share-based compensation expense, non-cash interest expense, the net impact of the Non-Residual Trusts, fair value to cash adjustments for reverse loans, and certain other cash and non-cash adjustments, primarily including certain non-recurring costs. Adjusted Earnings (Loss) excludes unrealized changes in fair value of MSRs that are based on projections of expected future cash flows and prepayments. Adjusted Earnings (Loss) includes both cash and non-cash gains from mortgage loan origination activities. Non-cash gains are net of non-cash charges or reserves provided. Adjusted Earnings (Loss) includes cash generated from reverse mortgage origination activities. Adjusted Earnings (Loss) may from time to time also include other adjustments, as applicable based upon facts and circumstances, consistent with the intent of providing investors with a supplemental means of evaluating our operating performance. Adjusted EBITDA eliminates the effects of financing, income taxes and depreciation and amortization. Adjusted EBITDA is defined as income (loss) before income taxes, depreciation and amortization, interest expense on corporate debt, amortization of servicing rights and other fair value adjustments, estimated settlements and costs for certain legal and regulatory matters, goodwill impairment (if any), fair value to cash adjustment for reverse loans, non-cash interest income, share-based compensation expense, servicing fee economics, Residual Trusts cash flows, transaction and integration related costs, the net impact of the Non-Residual Trusts and certain other cash and non-cash adjustments primarily including the net provision for the repurchase of loans sold, provision for loan losses and certain non-recurring costs. Adjusted EBITDA includes both cash and non-cash gains from mortgage loan origination activities. Adjusted EBITDA excludes the impact of fair value option accounting on certain assets and liabilities and includes cash generated from reverse mortgage origination activities. Adjusted EBITDA may also include other adjustments, as applicable based upon facts and circumstances, consistent with the intent of providing investors a supplemental means of evaluating our operating performance. Funds Generated in Period is calculated as Adjusted EBITDA, as described above, less capital expenditures, cash paid for corporate debt interest expense and income taxes. Management believes Funds Generated in Period is useful as a supplemental indicator of the cash capable of being generated by the business during the relevant period and for that purpose considers the values of the OMSRs created during the period as equivalent to cash on the assumption that such OMSRs could have been sold during the period for cash equivalent to their fair value reflected in our books. There can be no assurance that the OMSRs could have been sold during the period for cash equivalent to their fair value reflected in our books. Funds Generated in Period does not represent cash flow or cash available for investment. Amounts or metrics that relate to future earnings projections are forward-looking and subject to significant business, economic, regulatory and competitive uncertainties, many of which are beyond the control of Walter Investment and its management, and are based upon assumptions with respect to future decisions, which are subject to change. Actual results will vary and those variations may be material. Nothing in this presentation should be regarded as a representation by any person that any target will be achieved and the Company undertakes no duty to update any target. Please refer to the introductory slides of this presentation, as well as additional disclosures in this Appendix and in our Annual Report on Form 10-K for the year ended December 31, 2014, our Quarterly Reports on Form 10-Q for the quarterly periods ended March 31, 2015, June 30, 2015 and September 30, 2015 and our other filings with the SEC, for important information regarding forward looking statements and the use and limitations of Non-GAAP Financial Measures. Because we do not predict special items that might occur in the future, and our outlook is developed at a level of detail different than that used to prepare GAAP financial measures, we are not providing a reconciliation to GAAP of any forward-looking financial measures presented herein.
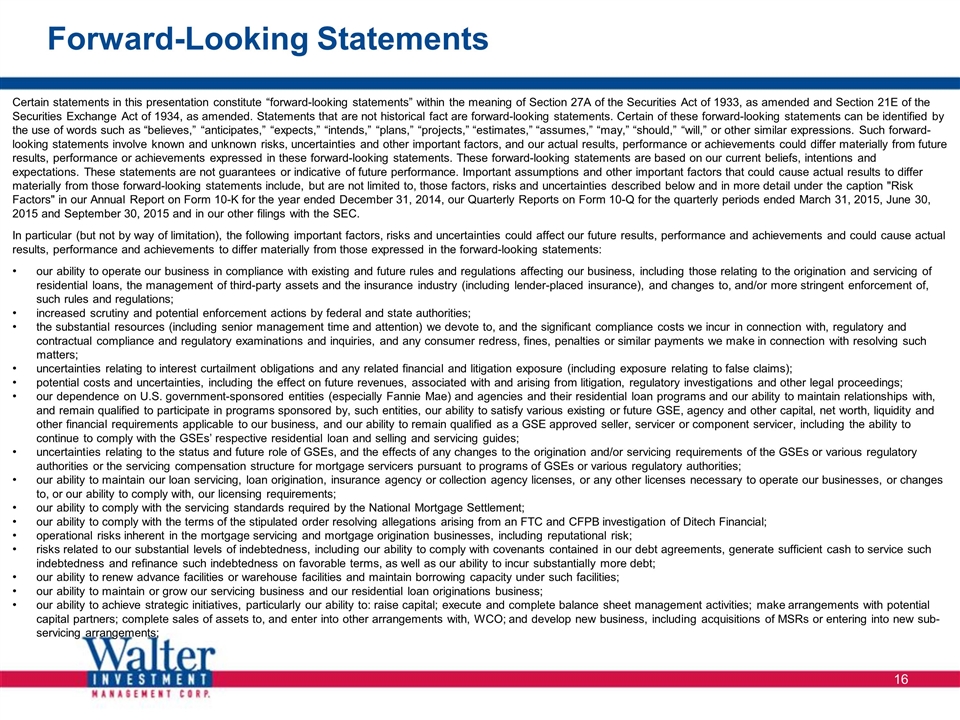
Forward-Looking Statements Certain statements in this presentation constitute “forward-looking statements” within the meaning of Section 27A of the Securities Act of 1933, as amended and Section 21E of the Securities Exchange Act of 1934, as amended. Statements that are not historical fact are forward-looking statements. Certain of these forward-looking statements can be identified by the use of words such as “believes,” “anticipates,” “expects,” “intends,” “plans,” “projects,” “estimates,” “assumes,” “may,” “should,” “will,” or other similar expressions. Such forward-looking statements involve known and unknown risks, uncertainties and other important factors, and our actual results, performance or achievements could differ materially from future results, performance or achievements expressed in these forward-looking statements. These forward-looking statements are based on our current beliefs, intentions and expectations. These statements are not guarantees or indicative of future performance. Important assumptions and other important factors that could cause actual results to differ materially from those forward-looking statements include, but are not limited to, those factors, risks and uncertainties described below and in more detail under the caption "Risk Factors" in our Annual Report on Form 10-K for the year ended December 31, 2014, our Quarterly Reports on Form 10-Q for the quarterly periods ended March 31, 2015, June 30, 2015 and September 30, 2015 and in our other filings with the SEC. In particular (but not by way of limitation), the following important factors, risks and uncertainties could affect our future results, performance and achievements and could cause actual results, performance and achievements to differ materially from those expressed in the forward-looking statements: our ability to operate our business in compliance with existing and future rules and regulations affecting our business, including those relating to the origination and servicing of residential loans, the management of third-party assets and the insurance industry (including lender-placed insurance), and changes to, and/or more stringent enforcement of, such rules and regulations; increased scrutiny and potential enforcement actions by federal and state authorities; the substantial resources (including senior management time and attention) we devote to, and the significant compliance costs we incur in connection with, regulatory and contractual compliance and regulatory examinations and inquiries, and any consumer redress, fines, penalties or similar payments we make in connection with resolving such matters; uncertainties relating to interest curtailment obligations and any related financial and litigation exposure (including exposure relating to false claims); potential costs and uncertainties, including the effect on future revenues, associated with and arising from litigation, regulatory investigations and other legal proceedings; our dependence on U.S. government-sponsored entities (especially Fannie Mae) and agencies and their residential loan programs and our ability to maintain relationships with, and remain qualified to participate in programs sponsored by, such entities, our ability to satisfy various existing or future GSE, agency and other capital, net worth, liquidity and other financial requirements applicable to our business, and our ability to remain qualified as a GSE approved seller, servicer or component servicer, including the ability to continue to comply with the GSEs’ respective residential loan and selling and servicing guides; uncertainties relating to the status and future role of GSEs, and the effects of any changes to the origination and/or servicing requirements of the GSEs or various regulatory authorities or the servicing compensation structure for mortgage servicers pursuant to programs of GSEs or various regulatory authorities; our ability to maintain our loan servicing, loan origination, insurance agency or collection agency licenses, or any other licenses necessary to operate our businesses, or changes to, or our ability to comply with, our licensing requirements; our ability to comply with the servicing standards required by the National Mortgage Settlement; our ability to comply with the terms of the stipulated order resolving allegations arising from an FTC and CFPB investigation of Ditech Financial; operational risks inherent in the mortgage servicing and mortgage origination businesses, including reputational risk; risks related to our substantial levels of indebtedness, including our ability to comply with covenants contained in our debt agreements, generate sufficient cash to service such indebtedness and refinance such indebtedness on favorable terms, as well as our ability to incur substantially more debt; our ability to renew advance facilities or warehouse facilities and maintain borrowing capacity under such facilities; our ability to maintain or grow our servicing business and our residential loan originations business; our ability to achieve strategic initiatives, particularly our ability to: raise capital; execute and complete balance sheet management activities; make arrangements with potential capital partners; complete sales of assets to, and enter into other arrangements with, WCO; and develop new business, including acquisitions of MSRs or entering into new sub-servicing arrangements;
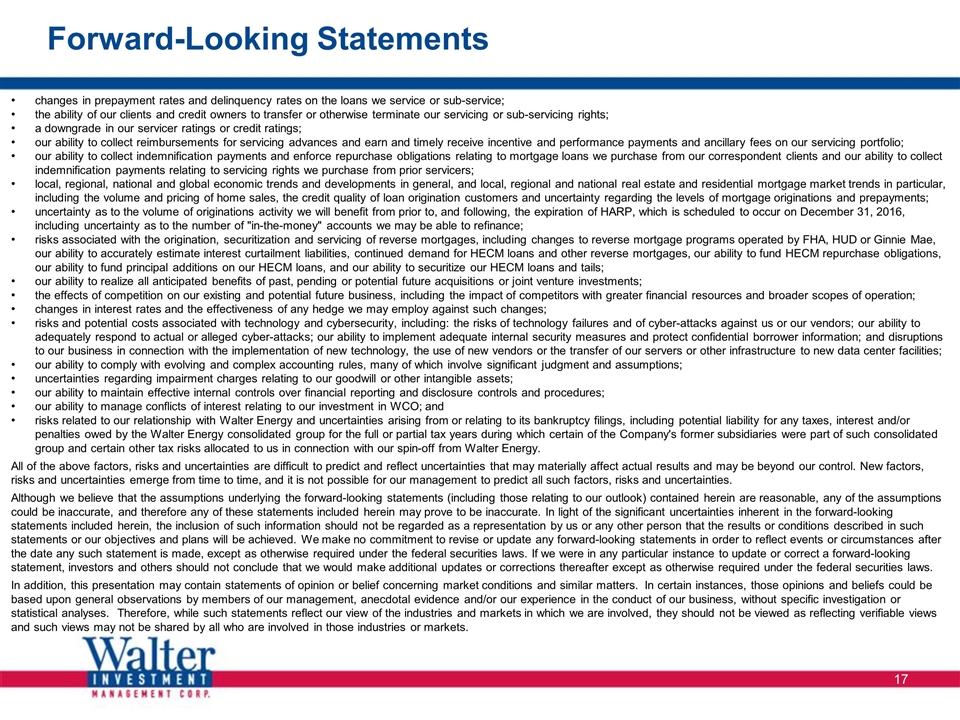
Forward-Looking Statements changes in prepayment rates and delinquency rates on the loans we service or sub-service; the ability of our clients and credit owners to transfer or otherwise terminate our servicing or sub-servicing rights; a downgrade in our servicer ratings or credit ratings; our ability to collect reimbursements for servicing advances and earn and timely receive incentive and performance payments and ancillary fees on our servicing portfolio; our ability to collect indemnification payments and enforce repurchase obligations relating to mortgage loans we purchase from our correspondent clients and our ability to collect indemnification payments relating to servicing rights we purchase from prior servicers; local, regional, national and global economic trends and developments in general, and local, regional and national real estate and residential mortgage market trends in particular, including the volume and pricing of home sales, the credit quality of loan origination customers and uncertainty regarding the levels of mortgage originations and prepayments; uncertainty as to the volume of originations activity we will benefit from prior to, and following, the expiration of HARP, which is scheduled to occur on December 31, 2016, including uncertainty as to the number of "in-the-money" accounts we may be able to refinance; risks associated with the origination, securitization and servicing of reverse mortgages, including changes to reverse mortgage programs operated by FHA, HUD or Ginnie Mae, our ability to accurately estimate interest curtailment liabilities, continued demand for HECM loans and other reverse mortgages, our ability to fund HECM repurchase obligations, our ability to fund principal additions on our HECM loans, and our ability to securitize our HECM loans and tails; our ability to realize all anticipated benefits of past, pending or potential future acquisitions or joint venture investments; the effects of competition on our existing and potential future business, including the impact of competitors with greater financial resources and broader scopes of operation; changes in interest rates and the effectiveness of any hedge we may employ against such changes; risks and potential costs associated with technology and cybersecurity, including: the risks of technology failures and of cyber-attacks against us or our vendors; our ability to adequately respond to actual or alleged cyber-attacks; our ability to implement adequate internal security measures and protect confidential borrower information; and disruptions to our business in connection with the implementation of new technology, the use of new vendors or the transfer of our servers or other infrastructure to new data center facilities; our ability to comply with evolving and complex accounting rules, many of which involve significant judgment and assumptions; uncertainties regarding impairment charges relating to our goodwill or other intangible assets; our ability to maintain effective internal controls over financial reporting and disclosure controls and procedures; our ability to manage conflicts of interest relating to our investment in WCO; and risks related to our relationship with Walter Energy and uncertainties arising from or relating to its bankruptcy filings, including potential liability for any taxes, interest and/or penalties owed by the Walter Energy consolidated group for the full or partial tax years during which certain of the Company's former subsidiaries were part of such consolidated group and certain other tax risks allocated to us in connection with our spin-off from Walter Energy. All of the above factors, risks and uncertainties are difficult to predict and reflect uncertainties that may materially affect actual results and may be beyond our control. New factors, risks and uncertainties emerge from time to time, and it is not possible for our management to predict all such factors, risks and uncertainties. Although we believe that the assumptions underlying the forward-looking statements (including those relating to our outlook) contained herein are reasonable, any of the assumptions could be inaccurate, and therefore any of these statements included herein may prove to be inaccurate. In light of the significant uncertainties inherent in the forward-looking statements included herein, the inclusion of such information should not be regarded as a representation by us or any other person that the results or conditions described in such statements or our objectives and plans will be achieved. We make no commitment to revise or update any forward-looking statements in order to reflect events or circumstances after the date any such statement is made, except as otherwise required under the federal securities laws. If we were in any particular instance to update or correct a forward-looking statement, investors and others should not conclude that we would make additional updates or corrections thereafter except as otherwise required under the federal securities laws. In addition, this presentation may contain statements of opinion or belief concerning market conditions and similar matters. In certain instances, those opinions and beliefs could be based upon general observations by members of our management, anecdotal evidence and/or our experience in the conduct of our business, without specific investigation or statistical analyses. Therefore, while such statements reflect our view of the industries and markets in which we are involved, they should not be viewed as reflecting verifiable views and such views may not be shared by all who are involved in those industries or markets.
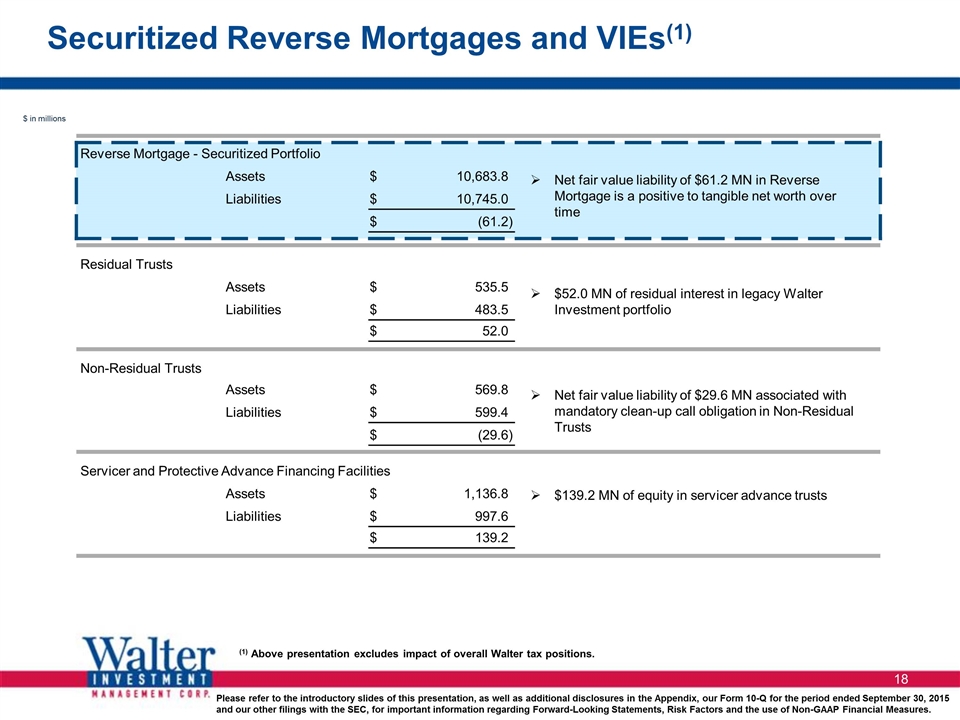
Securitized Reverse Mortgages and VIEs(1) $ in millions Reverse Mortgage - Securitized Portfolio Assets $ 10,683.8 Liabilities $ 10,745.0 $ (61.2 ) Residual Trusts Assets $ 535.5 Liabilities $ 483.5 $ 52.0 Non-Residual Trusts Assets $ 569.8 Liabilities $ 599.4 $ (29.6 ) Servicer and Protective Advance Financing Facilities Assets $ 1,136.8 Liabilities $ 997.6 $ 139.2 Ø Net fair value liability of $61.2 MN in Reverse Mortgage is a positive to tangible net worth over time Ø $52.0 MN of residual interest in legacy Walter Investment portfolio Ø Net fair value liability of $29.6 MN associated with mandatory clean-up call obligation in Non-Residual Trusts Ø $139.2 MN of equity in servicer advance trusts (1) Above presentation excludes impact of overall Walter tax positions.
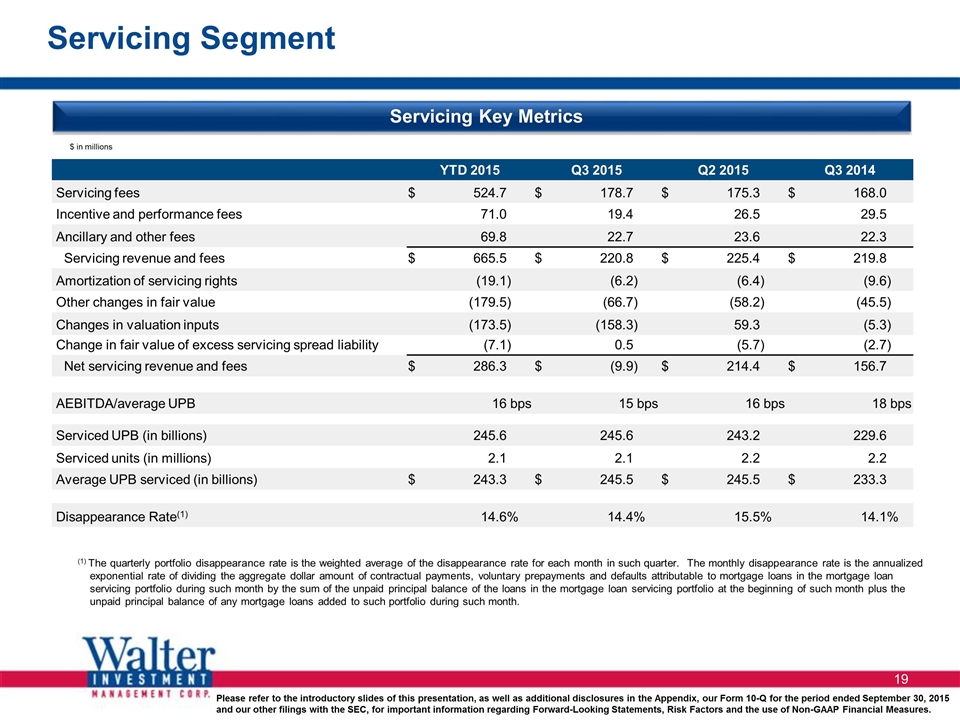
Servicing Segment (1) The quarterly portfolio disappearance rate is the weighted average of the disappearance rate for each month in such quarter. The monthly disappearance rate is the annualized exponential rate of dividing the aggregate dollar amount of contractual payments, voluntary prepayments and defaults attributable to mortgage loans in the mortgage loan servicing portfolio during such month by the sum of the unpaid principal balance of the loans in the mortgage loan servicing portfolio at the beginning of such month plus the unpaid principal balance of any mortgage loans added to such portfolio during such month. $ in millions Servicing Key Metrics YTD 2015 YTD 2015 Q3 2015 Q3 2015 Q2 2015 Q2 2015 Q3 2014 Q3 2014 Servicing fees $ 524.7 $ 178.7 $ 175.3 $ 168.0 Incentive and performance fees 71.0 19.4 26.5 29.5 Ancillary and other fees 69.8 22.7 23.6 22.3 Servicing revenue and fees $ 665.5 $ 220.8 $ 225.4 $ 219.8 Amortization of servicing rights (19.1 ) (6.2 ) (6.4 ) (9.6 ) Other changes in fair value (179.5 ) (66.7 ) (58.2 ) (45.5 ) Changes in valuation inputs (173.5 ) (158.3 ) 59.3 (5.3 ) Change in fair value of excess servicing spread liability (7.1 ) 0.5 (5.7 ) (2.7 ) Net servicing revenue and fees $ 286.3 $ (9.9 ) $ 214.4 $ 156.7 AEBITDA/average UPB 16 bps 15 bps 16 bps 18 bps Serviced UPB (in billions) 245.6 245.6 243.2 229.6 Serviced units (in millions) 2.1 2.1 2.2 2.2 Average UPB serviced (in billions) $ 243.3 $ 245.5 $ 245.5 $ 233.3 Disappearance Rate(1) 14.6 % 14.4 % 15.5 % 14.1 %
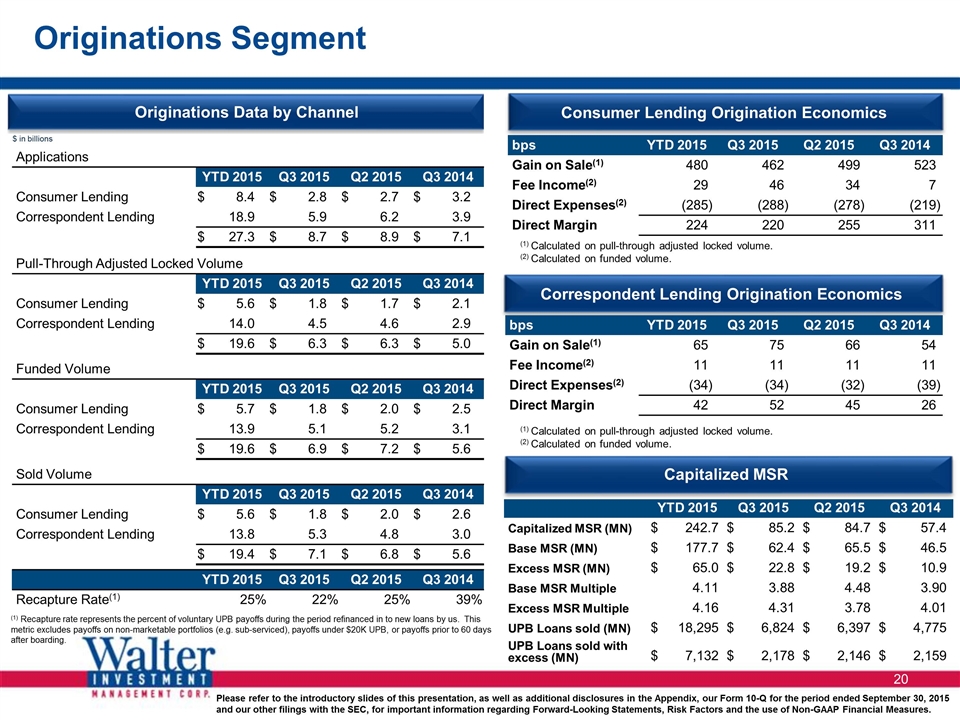
Originations Segment $ in billions (1) Calculated on pull-through adjusted locked volume. (2) Calculated on funded volume. $ in thousands (1) Calculated on pull-through adjusted locked volume. (2) Calculated on funded volume. (1) Recapture rate represents the percent of voluntary UPB payoffs during the period refinanced in to new loans by us. This metric excludes payoffs on non-marketable portfolios (e.g. sub-serviced), payoffs under $20K UPB, or payoffs prior to 60 days after boarding. Originations Data by Channel Consumer Lending Origination Economics Correspondent Lending Origination Economics Capitalized MSR Applications YTD 2015 YTD 2015 Q3 2015 Q3 2015 Q2 2015 Q2 2015 Q3 2014 Q3 2014 Consumer Lending $ 8.4 $ 2.8 $ 2.7 $ 3.2 Correspondent Lending 18.9 5.9 6.2 3.9 $ 27.3 $ 8.7 $ 8.9 $ 7.1 Pull-Through Adjusted Locked Volume YTD 2015 YTD 2015 Q3 2015 Q3 2015 Q2 2015 Q2 2015 Q3 2014 Q3 2014 Consumer Lending $ 5.6 $ 1.8 $ 1.7 $ 2.1 Correspondent Lending 14.0 4.5 4.6 2.9 $ 19.6 $ 6.3 $ 6.3 $ 5.0 Funded Volume YTD 2015 YTD 2015 Q3 2015 Q3 2015 Q2 2015 Q2 2015 Q3 2014 Q3 2014 Consumer Lending $ 5.7 $ 1.8 $ 2.0 $ 2.5 Correspondent Lending 13.9 5.1 5.2 3.1 $ 19.6 $ 6.9 $ 7.2 $ 5.6 Sold Volume YTD 2015 YTD 2015 Q3 2015 Q3 2015 Q2 2015 Q2 2015 Q3 2014 Q3 2014 Consumer Lending $ 5.6 $ 1.8 $ 2.0 $ 2.6 Correspondent Lending 13.8 5.3 4.8 3.0 $ 19.4 $ 7.1 $ 6.8 $ 5.6 YTD 2015 YTD 2015 Q3 2015 Q3 2015 Q2 2015 Q2 2015 Q3 2014 Q3 2014 Recapture Rate(1) 25 % 22 % 25 % 39 % bps YTD 2015 Q3 2015 Q2 2015 Q3 2014 Gain on Sale(1) 480 462 499 523 Fee Income(2) 29 46 34 7 Direct Expenses(2) (285 ) (288 ) (278 ) (219 ) Direct Margin 224 220 255 311 bps YTD 2015 Q3 2015 Q2 2015 Q3 2014 Gain on Sale(1) 65 75 66 54 Fee Income(2) 11 11 11 11 Direct Expenses(2) (34 ) (34 ) (32 ) (39 ) Direct Margin 42 52 45 26 YTD 2015 YTD 2015 Q3 2015 Q3 2015 Q2 2015 Q2 2015 Q3 2014 Q3 2014 Capitalized MSR (MN) $ 242.7 $ 85.2 $ 84.7 $ 57.4 Base MSR (MN) $ 177.7 $ 62.4 $ 65.5 $ 46.5 Excess MSR (MN) $ 65.0 $ 22.8 $ 19.2 $ 10.9 Base MSR Multiple 4.11 3.88 4.48 3.90 Excess MSR Multiple 4.16 4.31 3.78 4.01 UPB Loans sold (MN) $ 18,295 $ 6,824 $ 6,397 $ 4,775 UPB Loans sold with excess (MN) $ 7,132 $ 2,178 $ 2,146 $ 2,159
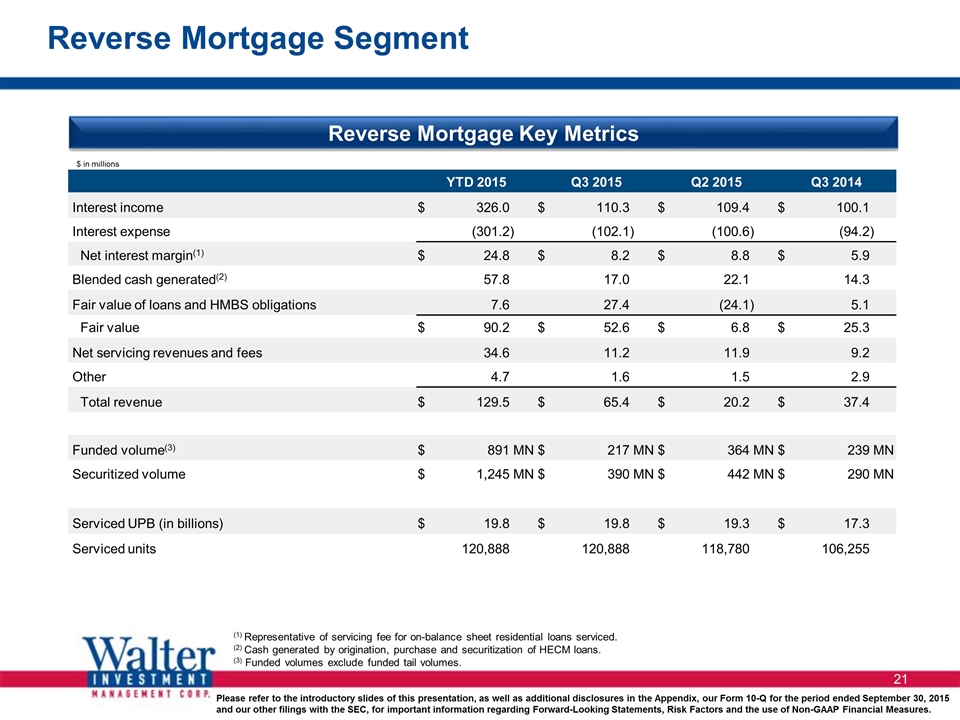
Reverse Mortgage Segment $ in millions (1) Representative of servicing fee for on-balance sheet residential loans serviced. (2) Cash generated by origination, purchase and securitization of HECM loans. (3) Funded volumes exclude funded tail volumes. Reverse Mortgage Key Metrics YTD 2015 YTD 2015 Q3 2015 Q3 2015 Q2 2015 Q2 2015 Q3 2014 Q3 2014 Interest income $ 326.0 $ 110.3 $ 109.4 $ 100.1 Interest expense (301.2 ) (102.1 ) (100.6 ) (94.2 ) Net interest margin(1) $ 24.8 $ 8.2 $ 8.8 $ 5.9 Blended cash generated(2) 57.8 17.0 22.1 14.3 Fair value of loans and HMBS obligations 7.6 27.4 (24.1 ) 5.1 Fair value $ 90.2 $ 52.6 $ 6.8 $ 25.3 Net servicing revenues and fees 34.6 11.2 11.9 9.2 Other 4.7 1.6 1.5 2.9 Total revenue $ 129.5 $ 65.4 $ 20.2 $ 37.4 Funded volume(3) $ 891 MN $ 217 MN $ 364 MN $ 239 MN Securitized volume $ 1,245 MN $ 390 MN $ 442 MN $ 290 MN Serviced UPB (in billions) $ 19.8 $ 19.8 $ 19.3 $ 17.3 Serviced units 120,888 120,888 118,780 106,255 $ in millions
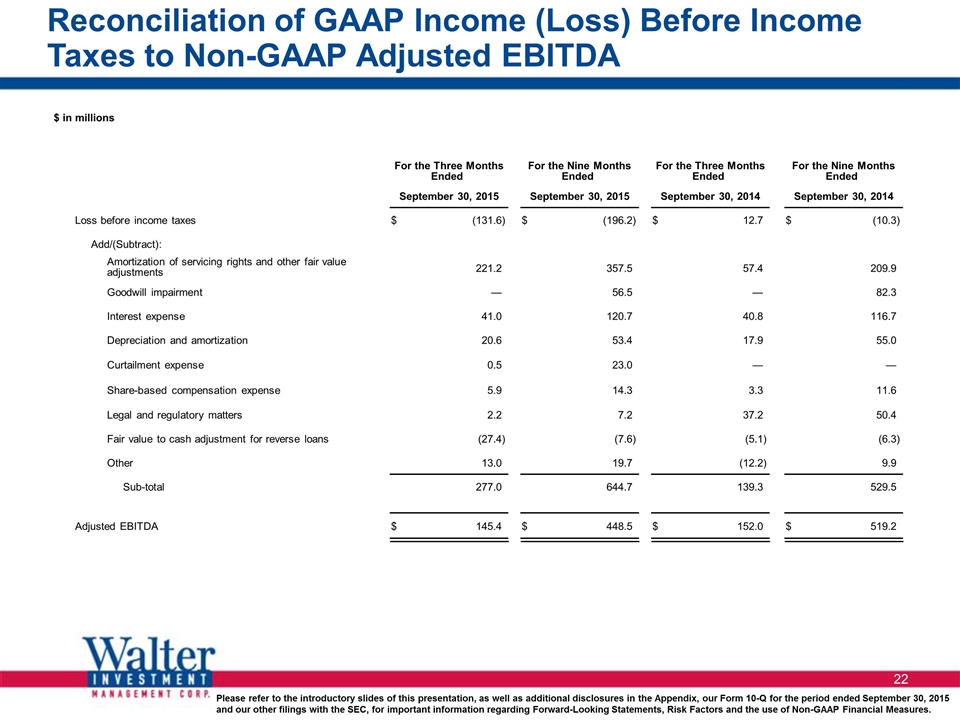
Reconciliation of GAAP Income (Loss) Before Income Taxes to Non-GAAP Adjusted EBITDA $ in millions For the Three Months Ended For the Three Months Ended For the Nine Months Ended For the Nine Months Ended For the Three Months Ended For the Three Months Ended For the Nine Months Ended For the Nine Months Ended September 30, 2015 September 30, 2015 September 30, 2015 September 30, 2015 September 30, 2014 September 30, 2014 September 30, 2014 September 30, 2014 Loss before income taxes $ (131.6 ) $ (196.2 ) $ 12.7 $ (10.3 ) Add/(Subtract): Amortization of servicing rights and other fair value adjustments 221.2 357.5 57.4 209.9 Goodwill impairment — 56.5 — 82.3 Interest expense 41.0 120.7 40.8 116.7 Depreciation and amortization 20.6 53.4 17.9 55.0 Curtailment expense 0.5 23.0 — — Share-based compensation expense 5.9 14.3 3.3 11.6 Legal and regulatory matters 2.2 7.2 37.2 50.4 Fair value to cash adjustment for reverse loans (27.4 ) (7.6 ) (5.1 ) (6.3 ) Other 13.0 19.7 (12.2 ) 9.9 Sub-total 277.0 644.7 139.3 529.5 Adjusted EBITDA $ 145.4 $ 448.5 $ 152.0 $ 519.2

Reconciliation of GAAP Income (Loss) Before Income Taxes to Non-GAAP Adjusted Earnings ($ in millions, except per share amounts) For the Three Months Ended For the Three Months Ended For the Nine Months Ended For the Nine Months Ended For the Three Months Ended For the Three Months Ended For the Nine Months Ended For the Nine Months Ended September 30, 2015 September 30, 2015 September 30, 2015 September 30, 2015 September 30, 2014 September 30, 2014 September 30, 2014 September 30, 2014 Loss before income taxes $ (131.6 ) $ (196.2 ) $ 12.7 $ (10.3 ) Add/(Subtract): Changes in fair value due to changes in valuation inputs and other assumptions 147.9 157.3 1.7 70.7 Goodwill impairment — 56.5 — 82.3 Legal and regulatory matters 2.2 7.2 37.2 50.4 Curtailment expense 0.5 23.0 — — Step-up depreciation and amortization 13.3 31.8 10.3 33.5 Step-up amortization of sub-servicing rights 4.7 14.6 7.8 24.0 Non-cash interest expense 3.1 9.5 3.2 10.5 Share-based compensation expense 5.9 14.3 3.3 11.6 Fair value to cash adjustment for reverse loans (27.4 ) (7.6 ) (5.1 ) (6.3 ) Other 8.2 17.6 (11.8 ) 2.9 Adjusted Earnings $ 26.8 $ 128.0 $ 59.3 $ 269.3 Adjusted Earnings after tax (38% in 2015 and 39% in 2014) $ 16.6 $ 79.3 $ 36.2 $ 164.2 Adjusted Earnings after taxes per common and common equivalent share. $ 0.44 $ 2.10 $ 0.96 $ 4.37
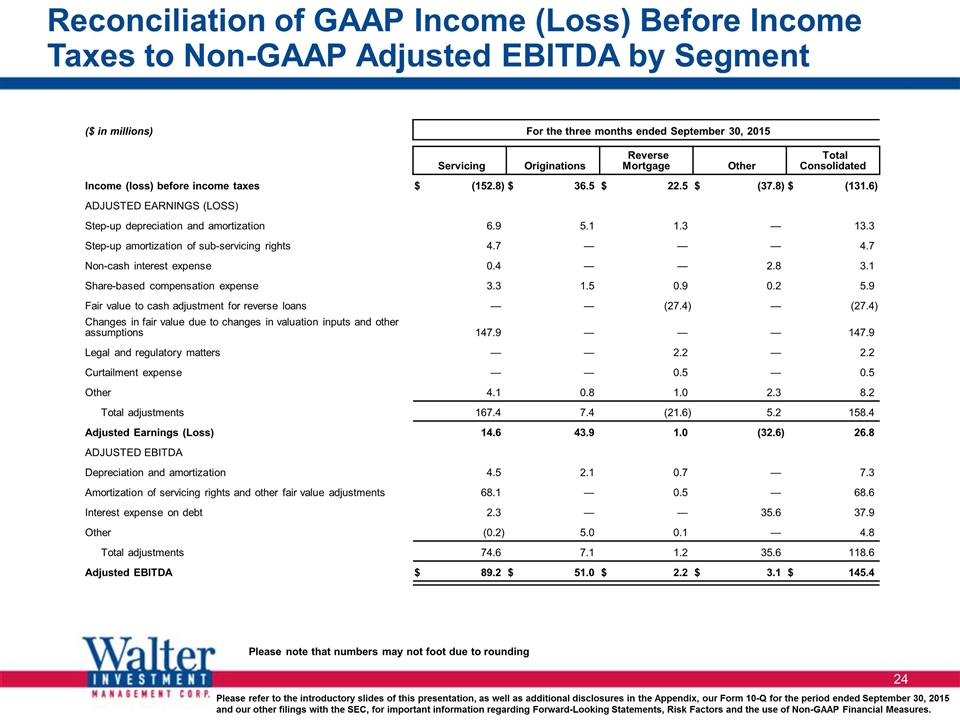
Reconciliation of GAAP Income (Loss) Before Income Taxes to Non-GAAP Adjusted EBITDA by Segment ($ in millions) For the three months ended September 30, 2015 For the three months ended September 30, 2015 Servicing Servicing Originations Originations Reverse Mortgage Reverse Mortgage Other Other Total Consolidated Total Consolidated Income (loss) before income taxes $ (152.8 ) $ 36.5 $ 22.5 $ (37.8 ) $ (131.6 ) ADJUSTED EARNINGS (LOSS) Step-up depreciation and amortization 6.9 5.1 1.3 — 13.3 Step-up amortization of sub-servicing rights 4.7 — — — 4.7 Non-cash interest expense 0.4 — — 2.8 3.1 Share-based compensation expense 3.3 1.5 0.9 0.2 5.9 Fair value to cash adjustment for reverse loans — — (27.4 ) — (27.4 ) Changes in fair value due to changes in valuation inputs and other assumptions 147.9 — — — 147.9 Legal and regulatory matters — — 2.2 — 2.2 Curtailment expense — — 0.5 — 0.5 Other 4.1 0.8 1.0 2.3 8.2 Total adjustments 167.4 7.4 (21.6 ) 5.2 158.4 Adjusted Earnings (Loss) 14.6 43.9 1.0 (32.6 ) 26.8 ADJUSTED EBITDA Depreciation and amortization 4.5 2.1 0.7 — 7.3 Amortization of servicing rights and other fair value adjustments 68.1 — 0.5 — 68.6 Interest expense on debt 2.3 — — 35.6 37.9 Other (0.2 ) 5.0 0.1 — 4.8 Total adjustments 74.6 7.1 1.2 35.6 118.6 Adjusted EBITDA $ 89.2 $ 51.0 $ 2.2 $ 3.1 $ 145.4 Please note that numbers may not foot due to rounding
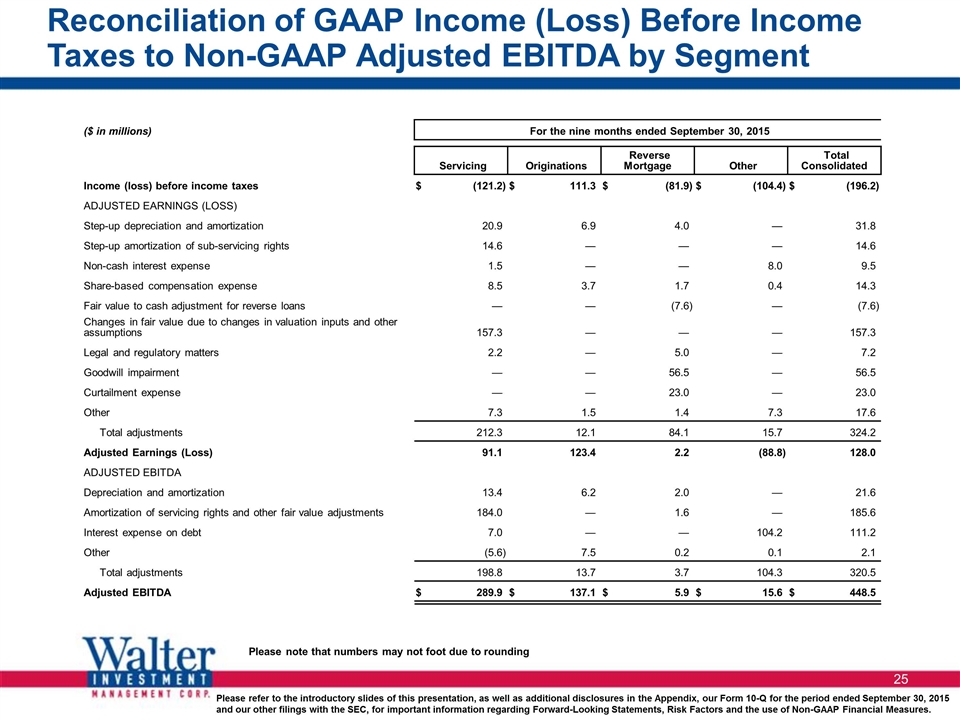
Reconciliation of GAAP Income (Loss) Before Income Taxes to Non-GAAP Adjusted EBITDA by Segment ($ in millions) For the nine months ended September 30, 2015 For the nine months ended September 30, 2015 Servicing Servicing Originations Originations Reverse Mortgage Reverse Mortgage Other Other Total Consolidated Total Consolidated Income (loss) before income taxes $ (121.2 ) $ 111.3 $ (81.9 ) $ (104.4 ) $ (196.2 ) ADJUSTED EARNINGS (LOSS) Step-up depreciation and amortization 20.9 6.9 4.0 — 31.8 Step-up amortization of sub-servicing rights 14.6 — — — 14.6 Non-cash interest expense 1.5 — — 8.0 9.5 Share-based compensation expense 8.5 3.7 1.7 0.4 14.3 Fair value to cash adjustment for reverse loans — — (7.6 ) — (7.6 ) Changes in fair value due to changes in valuation inputs and other assumptions 157.3 — — — 157.3 Legal and regulatory matters 2.2 — 5.0 — 7.2 Goodwill impairment — — 56.5 — 56.5 Curtailment expense — — 23.0 — 23.0 Other 7.3 1.5 1.4 7.3 17.6 Total adjustments 212.3 12.1 84.1 15.7 324.2 Adjusted Earnings (Loss) 91.1 123.4 2.2 (88.8 ) 128.0 ADJUSTED EBITDA Depreciation and amortization 13.4 6.2 2.0 — 21.6 Amortization of servicing rights and other fair value adjustments 184.0 — 1.6 — 185.6 Interest expense on debt 7.0 — — 104.2 111.2 Other (5.6 ) 7.5 0.2 0.1 2.1 Total adjustments 198.8 13.7 3.7 104.3 320.5 Adjusted EBITDA $ 289.9 $ 137.1 $ 5.9 $ 15.6 $ 448.5 Please note that numbers may not foot due to rounding
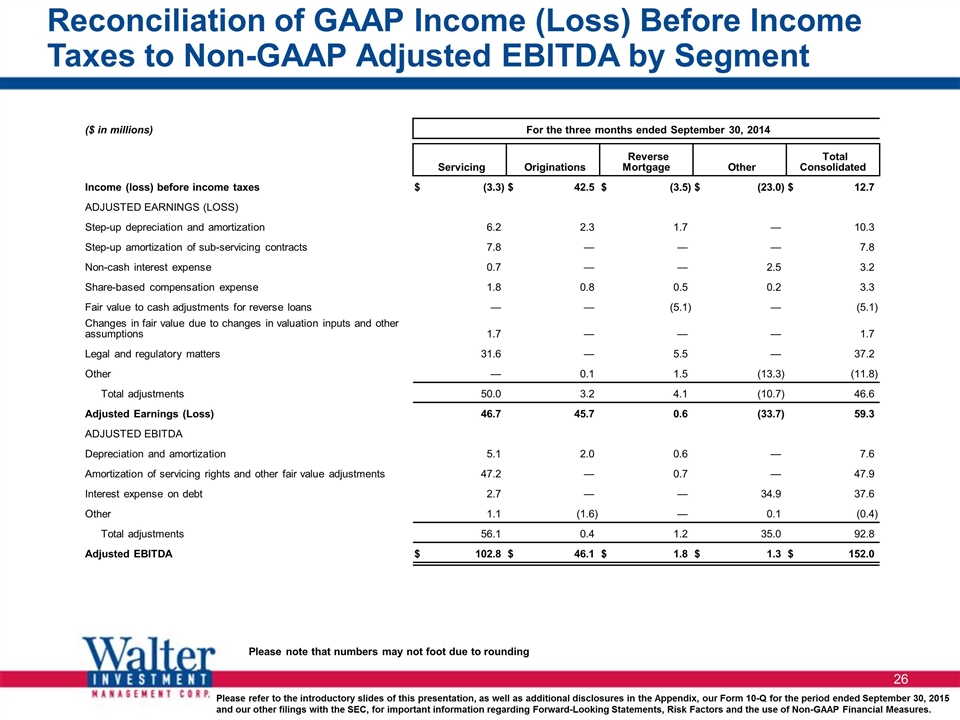
Reconciliation of GAAP Income (Loss) Before Income Taxes to Non-GAAP Adjusted EBITDA by Segment ($ in millions) For the three months ended September 30, 2014 For the three months ended September 30, 2014 Servicing Servicing Originations Originations Reverse Mortgage Reverse Mortgage Other Other Total Consolidated Total Consolidated Income (loss) before income taxes $ (3.3 ) $ 42.5 $ (3.5 ) $ (23.0 ) $ 12.7 ADJUSTED EARNINGS (LOSS) Step-up depreciation and amortization 6.2 2.3 1.7 — 10.3 Step-up amortization of sub-servicing contracts 7.8 — — — 7.8 Non-cash interest expense 0.7 — — 2.5 3.2 Share-based compensation expense 1.8 0.8 0.5 0.2 3.3 Fair value to cash adjustments for reverse loans — — (5.1 ) — (5.1 ) Changes in fair value due to changes in valuation inputs and other assumptions 1.7 — — — 1.7 Legal and regulatory matters 31.6 — 5.5 — 37.2 Other — 0.1 1.5 (13.3 ) (11.8 ) Total adjustments 50.0 3.2 4.1 (10.7 ) 46.6 Adjusted Earnings (Loss) 46.7 45.7 0.6 (33.7 ) 59.3 ADJUSTED EBITDA Depreciation and amortization 5.1 2.0 0.6 — 7.6 Amortization of servicing rights and other fair value adjustments 47.2 — 0.7 — 47.9 Interest expense on debt 2.7 — — 34.9 37.6 Other 1.1 (1.6 ) — 0.1 (0.4 ) Total adjustments 56.1 0.4 1.2 35.0 92.8 Adjusted EBITDA $ 102.8 $ 46.1 $ 1.8 $ 1.3 $ 152.0 Please note that numbers may not foot due to rounding
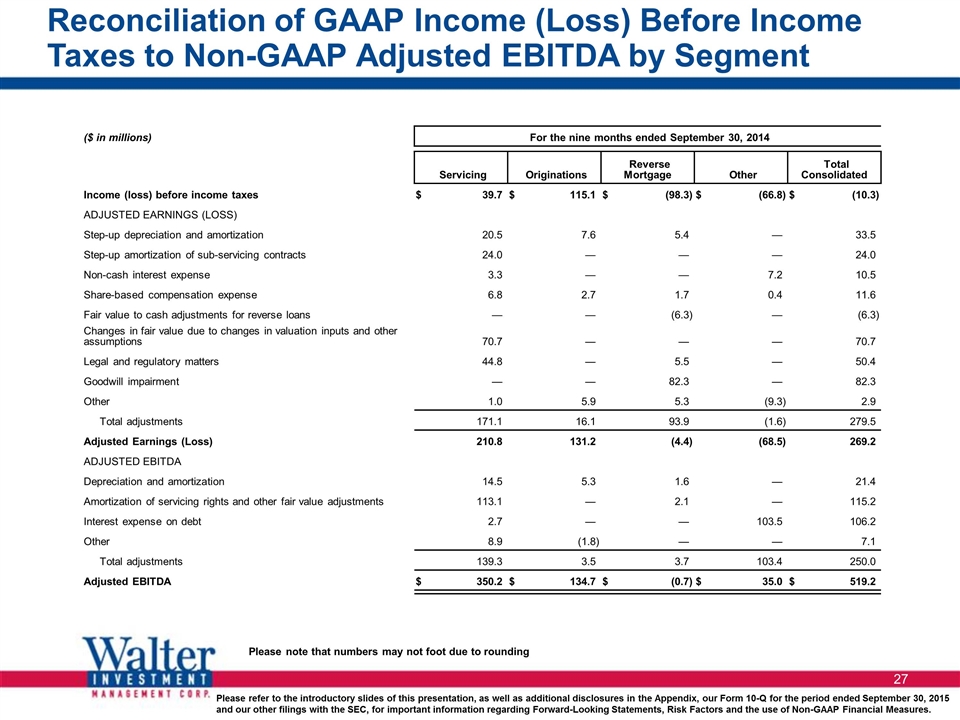
Reconciliation of GAAP Income (Loss) Before Income Taxes to Non-GAAP Adjusted EBITDA by Segment ($ in millions) For the nine months ended September 30, 2014 For the nine months ended September 30, 2014 Servicing Servicing Originations Originations Reverse Mortgage Reverse Mortgage Other Other Total Consolidated Total Consolidated Income (loss) before income taxes $ 39.7 $ 115.1 $ (98.3 ) $ (66.8 ) $ (10.3 ) ADJUSTED EARNINGS (LOSS) Step-up depreciation and amortization 20.5 7.6 5.4 — 33.5 Step-up amortization of sub-servicing contracts 24.0 — — — 24.0 Non-cash interest expense 3.3 — — 7.2 10.5 Share-based compensation expense 6.8 2.7 1.7 0.4 11.6 Fair value to cash adjustments for reverse loans — — (6.3 ) — (6.3 ) Changes in fair value due to changes in valuation inputs and other assumptions 70.7 — — — 70.7 Legal and regulatory matters 44.8 — 5.5 — 50.4 Goodwill impairment — — 82.3 — 82.3 Other 1.0 5.9 5.3 (9.3 ) 2.9 Total adjustments 171.1 16.1 93.9 (1.6 ) 279.5 Adjusted Earnings (Loss) 210.8 131.2 (4.4 ) (68.5 ) 269.2 ADJUSTED EBITDA Depreciation and amortization 14.5 5.3 1.6 — 21.4 Amortization of servicing rights and other fair value adjustments 113.1 — 2.1 — 115.2 Interest expense on debt 2.7 — — 103.5 106.2 Other 8.9 (1.8 ) — — 7.1 Total adjustments 139.3 3.5 3.7 103.4 250.0 Adjusted EBITDA $ 350.2 $ 134.7 $ (0.7 ) $ 35.0 $ 519.2 Please note that numbers may not foot due to rounding
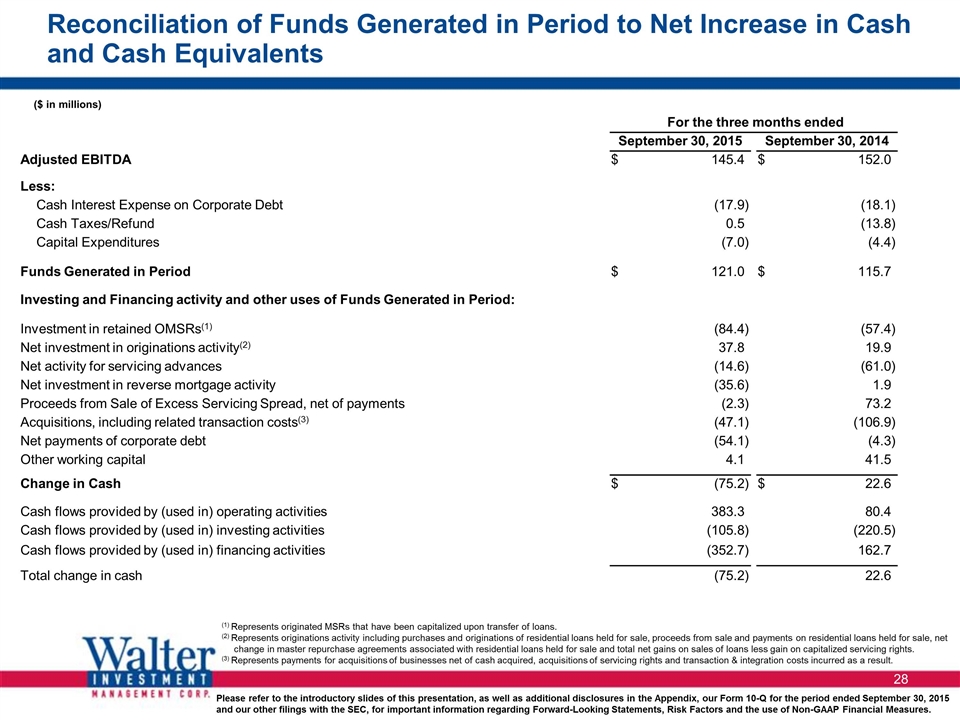
Reconciliation of Funds Generated in Period to Net Increase in Cash and Cash Equivalents ($ in millions) (1) Represents originated MSRs that have been capitalized upon transfer of loans. (2) Represents originations activity including purchases and originations of residential loans held for sale, proceeds from sale and payments on residential loans held for sale, net change in master repurchase agreements associated with residential loans held for sale and total net gains on sales of loans less gain on capitalized servicing rights. (3) Represents payments for acquisitions of businesses net of cash acquired, acquisitions of servicing rights and transaction & integration costs incurred as a result. For the three months ended For the three months ended September 30, 2015 September 30, 2015 September 30, 2014 September 30, 2014 Adjusted EBITDA $ 145.4 $ 152.0 Less: Cash Interest Expense on Corporate Debt (17.9 ) (18.1 ) Cash Taxes/Refund 0.5 (13.8 ) Capital Expenditures (7.0 ) (4.4 ) Funds Generated in Period $ 121.0 $ 115.7 Investing and Financing activity and other uses of Funds Generated in Period: Investment in retained OMSRs(1) (84.4 ) (57.4 ) Net investment in originations activity(2) 37.8 19.9 Net activity for servicing advances (14.6 ) (61.0 ) Net investment in reverse mortgage activity (35.6 ) 1.9 Proceeds from Sale of Excess Servicing Spread, net of payments (2.3 ) 73.2 Acquisitions, including related transaction costs(3) (47.1 ) (106.9 ) Net payments of corporate debt (54.1 ) (4.3 ) Other working capital 4.1 41.5 Change in Cash $ (75.2 ) $ 22.6 Cash flows provided by (used in) operating activities 383.3 80.4 Cash flows provided by (used in) investing activities (105.8 ) (220.5 ) Cash flows provided by (used in) financing activities (352.7 ) 162.7 Total change in cash (75.2 ) 22.6
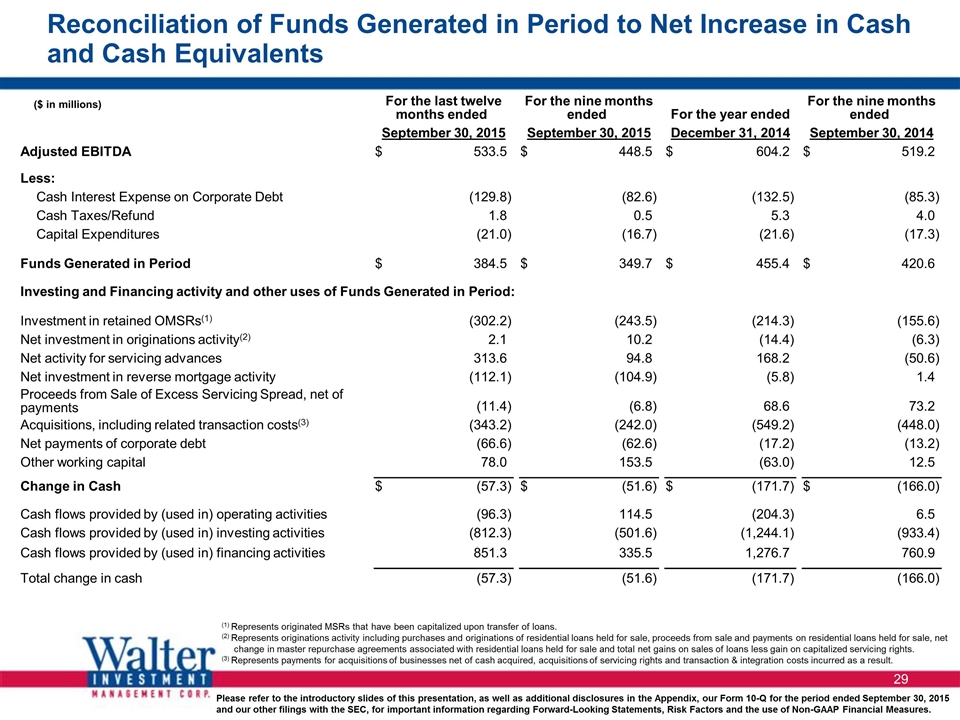
Reconciliation of Funds Generated in Period to Net Increase in Cash and Cash Equivalents ($ in millions) (1) Represents originated MSRs that have been capitalized upon transfer of loans. (2) Represents originations activity including purchases and originations of residential loans held for sale, proceeds from sale and payments on residential loans held for sale, net change in master repurchase agreements associated with residential loans held for sale and total net gains on sales of loans less gain on capitalized servicing rights. (3) Represents payments for acquisitions of businesses net of cash acquired, acquisitions of servicing rights and transaction & integration costs incurred as a result. For the last twelve months ended For the last twelve months ended For the nine months ended For the nine months ended For the year ended For the year ended For the nine months ended For the nine months ended September 30, 2015 September 30, 2015 September 30, 2015 September 30, 2015 December 31, 2014 December 31, 2014 September 30, 2014 September 30, 2014 Adjusted EBITDA $ 533.5 $ 448.5 $ 604.2 $ 519.2 Less: Cash Interest Expense on Corporate Debt (129.8 ) (82.6 ) (132.5 ) (85.3 ) Cash Taxes/Refund 1.8 0.5 5.3 4.0 Capital Expenditures (21.0 ) (16.7 ) (21.6 ) (17.3 ) Funds Generated in Period $ 384.5 $ 349.7 $ 455.4 $ 420.6 Investing and Financing activity and other uses of Funds Generated in Period: Investment in retained OMSRs(1) (302.2 ) (243.5 ) (214.3 ) (155.6 ) Net investment in originations activity(2) 2.1 10.2 (14.4 ) (6.3 ) Net activity for servicing advances 313.6 94.8 168.2 (50.6 ) Net investment in reverse mortgage activity (112.1 ) (104.9 ) (5.8 ) 1.4 Proceeds from Sale of Excess Servicing Spread, net of payments (11.4 ) (6.8 ) 68.6 73.2 Acquisitions, including related transaction costs(3) (343.2 ) (242.0 ) (549.2 ) (448.0 ) Net payments of corporate debt (66.6 ) (62.6 ) (17.2 ) (13.2 ) Other working capital 78.0 153.5 (63.0 ) 12.5 Change in Cash $ (57.3 ) $ (51.6 ) $ (171.7 ) $ (166.0 ) Cash flows provided by (used in) operating activities (96.3 ) 114.5 (204.3 ) 6.5 Cash flows provided by (used in) investing activities (812.3 ) (501.6 ) (1,244.1 ) (933.4 ) Cash flows provided by (used in) financing activities 851.3 335.5 1,276.7 760.9 Total change in cash (57.3 ) (51.6 ) (171.7 ) (166.0 )
Serious News for Serious Traders! Try StreetInsider.com Premium Free!
You May Also Be Interested In
- Bloomberg Electronic Markets Brings Automation to its Japanese Government Bond Market-on-Close Functionality
- Premier Cleaning Expands Commercial Janitorial Services for Denver Schools, Warehouses and Medical Facilities
- S&P Global Ratings launches Vault Risk Assessment for digital asset markets
Create E-mail Alert Related Categories
SEC FilingsSign up for StreetInsider Free!
Receive full access to all new and archived articles, unlimited portfolio tracking, e-mail alerts, custom newswires and RSS feeds - and more!
