

Form 8-K Voya Financial, Inc. For: May 06
 Tweet
Tweet Share
Share
UNITED STATES
SECURITIES AND EXCHANGE COMMISSION
Washington, D.C. 20549
FORM 8-K
CURRENT REPORT
Pursuant to Section 13 or 15(d)
of the Securities Exchange Act of 1934
Date of Report (Date of earliest event reported):
May 6, 2015
VOYA FINANCIAL, INC.
(Exact name of registrant as specified in its charter)
| Delaware | 001-35897 | No. 52-1222820 | ||
| (State or other jurisdiction of incorporation) |
(Commission File Number) |
(IRS Employer Identification Number) |
| 230 Park Avenue New York, New York |
10169 | |
| (Address of principal executive offices) | (Zip Code) |
Registrant’s telephone number, including area code: (212) 309-8200
N/A
(Former name or former address, if changed since last report)
Check the appropriate box below if the Form 8-K filing is intended to simultaneously satisfy the filing obligation of the registrant under any of the following provisions:
| ¨ | Written communications pursuant to Rule 425 under the Securities Act (17 CFR 230.425) |
| ¨ | Soliciting material pursuant to Rule 14a-12 under the Exchange Act (17 CFR 240.14a-12) |
| ¨ | Pre-commencement communications pursuant to Rule 14d-2(b) under the Exchange Act (17 CFR 240.14d-2(b)) |
| ¨ | Pre-commencement communications pursuant to Rule 13e-4(c) under the Exchange Act (17 CFR 240.13e-4(c)) |
| Item 2.02 | Results of Operations and Financial Condition |
On May 6, 2015, Voya Financial, Inc. (“Voya Financial”) reported its financial results for the three months ended March 31, 2015. A copy of the press release containing this information is furnished as Exhibit 99.1 hereto and is incorporated by reference in this Item 2.02.
As previously announced, Voya Financial will host a conference call on Wednesday, May 6, 2015 at 10:00 am EDT to discuss its first quarter 2015 results. The call can be accessed via Voya Financial’s investor relations website at http://investors.voya.com. The call will be accompanied by a slide presentation, which will be accessible via Voya Financial’s investor relations website at http://investors.voya.com beginning at 9:30 am EDT on Wednesday, May 6, 2015. In addition, more detailed financial information can be found in Voya Financial’s Quarterly Investor Supplement for the three months ended March 31, 2015, available on Voya Financial’s investor relations website at http://investors.voya.com. The Quarterly Investor Supplement for the three months ended March 31, 2015 is furnished herewith as Exhibit 99.2 and is incorporated by reference in this Item 2.02.
As provided in General Instruction B.2 of Form 8-K, the information and exhibits provided pursuant to this Item 2.02 shall not be deemed to be “filed” for purposes of Section 18 of the Securities Exchange Act of 1934, as amended, nor shall they be deemed to be incorporated by reference in any filing under the Securities Act of 1933, as amended, except as shall be expressly set forth by specific reference in such a filing.
| Item 9.01 | Financial Statements and Exhibits |
(d) Exhibits
| 99.1 | Press release of Voya Financial, Inc., dated May 6, 2015 (furnished and not filed) | |
| 99.2 | Quarterly Investor Supplement for the three months ended March 31, 2015 (furnished and not filed) | |
SIGNATURES
Pursuant to the requirements of the Securities Exchange Act of 1934, the Registrant has duly caused this report to be signed on its behalf by the undersigned hereunto duly authorized.
| Voya Financial, Inc. | ||||
| (Registrant) | ||||
| By: | /s/ Jean Weng | |||
| Name: | Jean Weng | |||
| Title: | Senior Vice President and Corporate Secretary | |||
Dated: May 6, 2015
Exhibit 99.1

NEW YORK, May 6, 2015
Voya Financial Announces First Quarter 2015 Results
Voya Financial, Inc. (NYSE: VOYA), today reported the following financial results for the first quarter of 2015:
| • | After-tax operating earnings1,2 of $197 million, or $0.82 per diluted share, compared with $150 million, or $0.57 per diluted share in the first quarter of 20143. The following items primarily accounted for this change: |
| • | $30 million, after-tax, of higher adjusted operating earnings from the Ongoing Business driven by increased earnings in Retirement, Annuities, Individual Life, and Employee Benefits; and |
| • | $3 million, after-tax, of positive DAC/VOBA and other intangibles unlocking compared with $13 million, after-tax, of negative DAC/VOBA and other intangibles unlocking in the first quarter of 2014. |
| • | Net income available to common shareholders of $186 million, or $0.77 per diluted share, compared with $258 million, or $0.98 per diluted share in the first quarter of 20143. Included in the first quarter 2015 result is the Closed Block Variable Annuity (CBVA) segment’s first quarter 2015 after-tax loss of $22 million, which includes an after-tax gain of $36 million related to nonperformance risk4. The CBVA segment reflects the effect of its hedge program, which focuses on protecting regulatory and rating agency capital from market movements, rather than minimizing GAAP earnings volatility. |
ONGOING BUSINESS RESULTS
Voya Financial’s Ongoing Business includes the Retirement, Annuities, Investment Management, Individual Life, and Employee Benefits segments. The Corporate, CBVA, Closed Block Institutional Spread Products, and Closed Block Other segments are not reflected in Ongoing Business results.
| Three months ended March 31, | ||||||||
| ($ in millions, before income taxes) | 2015 | 2014 | ||||||
| Ongoing Business operating earnings |
$ | 324 | $ | 268 | ||||
| Less: DAC/VOBA and other intangibles unlocking |
5 | (20 | ) | |||||
|
|
|
|
|
|||||
| Ongoing Business adjusted operating earnings |
$ | 319 | $ | 287 | ||||
| 1 | Voya Financial assumes a 32% tax rate for 2015 and 35% tax rate for 2014 on all operating earnings described as “after-tax.” A 35% tax rate is applied to all non-operating items for both 2014 and 2015. Net income (loss) available to common shareholders reflects the actual effective tax rate. |
| 2 | Operating earnings, Ongoing Business operating earnings, and Ongoing Business adjusted operating earnings are each non-GAAP financial measures; information regarding the non-GAAP financial measures included in this press release, and reconciliations to the most comparable U.S. GAAP measures, are provided in the tables that accompany this release and in the Quarterly Investor Supplement. |
| 3 | For the three months ended March 31, 2015 and 2014, weighted-average fully diluted common shares outstanding were 240.7 million and 263.5 million, respectively. |
| 4 | Nonperformance risk, which the company considers a noneconomic factor, is influenced by the credit quality of the insurance company subsidiary that issued the guarantee and the priority of policyholder claims. Improving credit quality will typically produce a loss, and worsening credit quality will typically produce a gain. |
1
Ongoing Business adjusted operating earnings before income taxes were $319 million, compared with $287 million in the first quarter of 2014. The following items primarily accounted for this increase:
| • | Higher investment spread and other income ($27 million positive variance) driven by higher prepayment income and lower credited interest, partially offset by lower alternative income and lower fixed income investment income; |
| • | Higher underwriting gain and other revenue ($18 million positive variance) driven by lower loss ratios and profitable growth in Employee Benefits; and |
| • | Higher DAC/VOBA and other intangibles amortization ($14 million negative variance) and higher trail commissions ($6 million negative variance), partially offset by lower administrative expenses ($7 million positive variance). |
Ongoing Business adjusted operating return on equity (“Adjusted Operating ROE”)5 for the twelve months ended March 31, 2015 was 12.6%, compared with 12.1% for the twelve months ended December 31, 2014.
“During the first quarter of 2015, we continued to deliver strong financial performance as our Adjusted Operating ROE for the trailing twelve months ended March 31 increased 50 basis points from year-end 2014 to 12.6%,” said Rodney O. Martin, Jr., chairman and chief executive officer, Voya Financial. “Our Ongoing Business continued to achieve a number of positive results during the quarter. In addition to growing adjusted operating earnings in many of our segments, we also delivered strong underlying business performance, including positive net flows in Retirement and Investment Management (excluding VA) as well as continued strong loss ratios in Employee Benefits.
“We also reached an important and significant milestone as an independent company during the quarter as ING Group sold its remaining shares of Voya Financial. In connection with this transaction, we repurchased $600 million of our common stock, demonstrating both our strong capital position as well as our commitment to driving shareholder value. Finally, Standard & Poor’s, Moody’s, and Fitch all raised Voya’s ratings during the quarter, which shows the significant progress we have made in strengthening Voya’s financial position over the past several years. We have improved earnings from our Ongoing Business, driven excess capital generation, ensured strong liquidity and strengthened our balance sheet.
“We look forward to continuing to execute on our plans to drive greater value for our customers and shareholders and to working closely with our distribution partners to help Americans with their retirement readiness needs,” concluded Martin.
FIRST QUARTER 2015 SUMMARY
| • | Retirement and Investment Solutions accounted for approximately 74% of Ongoing Business adjusted operating earnings before income taxes in the first quarter of 2015 |
| • | Retirement net inflows of $661 million |
| • | Investment Management operating margin of 26.0%, excluding results from investment capital; net inflows of $0.5 billion, excluding $0.8 billion in variable annuity outflows |
| 5 | Ongoing Business adjusted operating ROE is a non-GAAP financial measure. A reconciliation to the most comparable U.S. GAAP measure is provided in the tables that accompany this release. |
2
| • | Continued shift in Individual Life sales, with indexed universal life products accounting for 66% of the $22 million in sales during the quarter |
| • | Employee Benefits loss ratios of 74.2% for Group Life and 70.4% for Stop Loss – better than the expected annual range of 77-80% for both loss ratios |
| • | Total AUM of $284 billion and total assets under management and administration of $486 billion |
| • | Estimated combined risk-based capital (RBC) ratio of 547%6, which is above the company’s target of 425% |
| • | Debt-to-capital ratio excluding accumulated other comprehensive income (AOCI) of 21.9% |
| • | Book value per share (excluding AOCI) of $54.887 |
| Three months ended March 31, | ||||||||||||
| ($ in millions, except per share amounts) | 2015 | 2014 | % Change | |||||||||
| Operating earnings before income taxes by segment |
||||||||||||
| Retirement |
$ | 124 | $ | 115 | 8 | % | ||||||
| Annuities |
69 | 55 | 25 | |||||||||
| Investment Management |
47 | 50 | (6 | ) | ||||||||
| Individual Life |
43 | 31 | 39 | |||||||||
| Employee Benefits |
41 | 17 | NM | |||||||||
|
|
|
|
|
|
|
|||||||
| Ongoing Business |
$ | 324 | $ | 268 | 21 | % | ||||||
| Corporate |
(48 | ) | (38 | ) | (26 | ) | ||||||
| Closed Block Institutional Spread Products and Other |
14 | 1 | NM | |||||||||
|
|
|
|
|
|
|
|||||||
| Total operating earnings before income taxes |
$ | 290 | $ | 231 | 26 | % | ||||||
| Total operating earnings, after-tax* |
$ | 197 | $ | 150 | 31 | % | ||||||
| Closed Block Variable Annuity, after-tax* |
(22 | ) | 13 | NM | ||||||||
| Net investment gains (losses), after-tax* |
33 | 37 | (11 | ) | ||||||||
| Other, after-tax** |
(49 | ) | (13 | ) | NM | |||||||
| Difference between actual tax (expense) benefit and assumed tax rate |
27 | 71 | NM | |||||||||
|
|
|
|
|
|
|
|||||||
| Net income (loss) available to common shareholders |
$ | 186 | $ | 258 | (28 | )% | ||||||
|
|
|
|
|
|
|
|||||||
| Operating earnings per diluted share |
$ | 0.82 | $ | 0.57 | 44 | % | ||||||
| Net income (loss) per diluted share |
$ | 0.77 | $ | 0.98 | (21 | ) | ||||||
| Fully diluted weighted average shares outstanding (in millions) |
240.7 | 263.5 | ||||||||||
| * | Assumes 32% tax rate for 2015 and 35% tax rate for 2014 on all operating earnings and 35% on all non-operating items for both 2014 and 2015. These tax rates do not reflect the actual tax expense or benefit, including the benefit or expense from recognizing certain deferred tax assets. |
| ** | Other, after-tax consists of net guaranteed benefit hedging gains (losses) and related charges and adjustments; income (loss) from business exited; certain expenses and deal incentives related to the divestment of Voya Financial by ING Group; expenses associated with the rebranding of Voya Financial from ING U.S.; and restructuring expenses (severance, lease write-offs, etc.). |
NM = Not Meaningful
| 6 | Estimated combined RBC ratio primarily for Voya Financial’s four principal U.S. insurance subsidiaries. |
| 7 | Book value per share (excluding AOCI) is a non-GAAP financial measure. For a reconciliation to the most comparable U.S. GAAP measure, see the tables accompanying this press release. |
3
BUSINESS SEGMENT DISCUSSIONS
The following discussions compare the first quarters of 2015 and 2014 unless otherwise noted. All figures are presented before income taxes.
RETIREMENT – LOWER ADMINISTRATIVE EXPENSES AND HIGHER PREPAYMENT INCOME DRIVE HIGHER EARNINGS
| Three months ended March 31, | ||||||||
| ($ in millions, before income taxes) | 2015 | 2014 | ||||||
| Operating earnings |
$ | 124 | $ | 115 | ||||
| Less: DAC/VOBA and other intangibles unlocking |
(4 | ) | (11 | ) | ||||
|
|
|
|
|
|||||
| Adjusted operating earnings |
$ | 129 | $ | 126 | ||||
Retirement adjusted operating earnings were $129 million, compared with $126 million. The following items primarily accounted for this increase:
| • | Lower administrative expenses ($7 million positive variance), primarily related to lower expenses reflecting the non-renewal of certain recordkeeping clients; |
| • | Higher investment spread and other investment income ($4 million positive variance) driven by higher prepayment income partially offset by lower alternative income; |
| • | Lower underwriting income ($4 million negative variance) due in part to lower interest rates; and |
| • | Lower fee-based margin ($4 million negative variance) as reduced recordkeeping revenues were partially offset by higher full service revenue. |
Retirement net inflows were $661 million, compared with net inflows of $44 million in the first quarter of 2014 and net outflows of $202 million in the fourth quarter of 2014. Net flows vary in size and timing, sometimes substantially, from one quarter to the next. Retirement AUM totaled $113 billion, compared with $110 billion as of December 31, 2014 and $107 billion as of March 31, 2014.
ANNUITIES – HIGHER INVESTMENT SPREAD DRIVEN BY LOWER CREDITED INTEREST AND HIGHER PREPAYMENT INCOME
| Three months ended March 31, | ||||||||
| ($ in millions, before income taxes) | 2015 | 2014 | ||||||
| Operating earnings |
$ | 69 | $ | 55 | ||||
| Less: DAC/VOBA and other intangibles unlocking |
10 | 3 | ||||||
|
|
|
|
|
|||||
| Adjusted operating earnings |
$ | 59 | $ | 52 | ||||
Annuities adjusted operating earnings were $59 million, compared with $52 million. The following items primarily accounted for this increase:
| • | Higher investment spread and other investment income ($12 million positive variance) due to lower credited interest from a favorable change in the mix of business and higher prepayment income, partially offset by lower alternative income; |
| • | Higher fee based margin ($2 million positive variance) on increased levels of mutual fund custodial assets; and |
| • | Higher DAC/VOBA and other intangibles amortization ($5 million negative variance) driven by higher investment spread, and higher trail commissions ($2 million negative variance). |
4
Net outflows were $109 million as $169 million in net outflows for fixed rate annuities and $19 million in fixed index annuities were partially offset by $133 million in net inflows from mutual fund custodial sales.
Annuities AUM totaled $27 billion as of March 31, 2015, relatively unchanged from December 31, 2014 and March 31, 2014. AUM for Voya’s mutual fund custodial product (Select Advantage), which is included in total Annuities AUM, increased to $4.3 billion, up from $4.1 billion as of December 31, 2014 and $3.6 billion as of March 31, 2014.
INVESTMENT MANAGEMENT – HIGHER ADMINISTRATIVE EXPENSES PARTIALLY OFFSET BY HIGHER FEE-BASED MARGIN
| Three months ended March 31, | ||||||||
| ($ in millions, before income taxes) | 2015 | 2014 | ||||||
| Operating earnings |
$ | 47 | $ | 50 | ||||
| Adjustments |
— | — | ||||||
|
|
|
|
|
|||||
| Adjusted operating earnings |
$ | 47 | $ | 50 | ||||
Investment Management adjusted operating earnings were $47 million, compared with $50 million. The following items primarily accounted for this decrease:
| • | Higher administrative expenses ($6 million negative variance) primarily due to investments in the business and higher compensation-related expenses; |
| • | Higher fee-based margin ($4 million positive variance) due to higher AUM from a combination of cumulative net positive client flows (including sub-advisor replacements) and market appreciation; and |
| • | Lower investment capital and other investment income ($1 million negative variance) slightly below prior year’s results. |
Investment Management’s operating margin was 28.8%, compared with 31.0% in the first quarter of 2014 and 28.8% in the fourth quarter of 2014. The change in operating margin compared with the first quarter of 2014 reflects lower income on investment capital as well as higher administrative expenses, partially offset by higher fee income. The operating margin excluding investment capital revenues was 26.0%, compared with 27.7% in the first quarter of 2014 and 30.7% in the fourth quarter of 2014.
Excluding sub-advisor replacement and variable annuity net flows, Investment Management had net inflows of $0.5 billion compared with $1.0 billion in the first quarter of 2014 and $0.3 billion in the fourth quarter of 2014. There were no sub-advisor replacement flows in the first quarter of 2015, compared with $4.7 billion of such flows in the first quarter of 2014 and $0.8 billion of such flows in the fourth quarter of 2014. Total Investment Management net outflows for the first quarter of 2015 were $0.3 billion, compared with net inflows of $4.9 billion in the first quarter of 2014 and net outflows of $0.2 billion in the fourth quarter of 2014.
Third-party8 inflows were $4.9 billion, compared with $9.8 billion in the first quarter of 2014 and $5.6 billion in the fourth quarter of 2014. Third-party AUM totaled $130 billion as of March 31, 2015, up from $127 billion as of March 31, 2014, and $129 billion as of December 31, 2014.
| 8 | Excludes general account assets of Voya Financial’s insurance company subsidiaries. |
5
INDIVIDUAL LIFE – LOWER ADMINISTRATIVE EXPENSES ALONG WITH HIGHER INVESTMENT SPREAD DRIVEN BY PREPAYMENT INCOME
| Three months ended March 31, | ||||||||
| ($ in millions, before income taxes) | 2015 | 2014 | ||||||
| Operating earnings |
$ | 43 | $ | 31 | ||||
| Less: DAC/VOBA and other intangibles unlocking |
— | (7 | ) | |||||
|
|
|
|
|
|||||
| Adjusted operating earnings |
$ | 43 | $ | 38 | ||||
Individual Life adjusted operating earnings were $43 million, compared with $38 million. The following items primarily accounted for this increase:
| • | Higher investment spread and other investment income ($11 million positive variance) reflecting higher prepayment income and lower interest credited on universal life policies, partially offset by lower alternative income; |
| • | Higher DAC/VOBA and other intangibles amortization expense ($10 million negative variance) due to higher universal life gross profits; |
| • | Lower administrative expenses ($7 million positive variance) primarily due to lower staff expense; |
| • | Higher trail commissions ($4 million negative variance) primarily due to lower capitalized commissions as a result of mix of business related to sales; and |
| • | Higher underwriting income ($2 million positive variance) resulting from improved mortality partially offset by other underwriting experience. |
Sales were $22 million, compared with $19 million in the first quarter of 2014 and $24 million in the fourth quarter of 2014. Sales of indexed life products accounted for 66% of total sales in the first quarter of 2015, compared with 42% in the first quarter of 2014 and 52% in the fourth quarter of 2014.
EMPLOYEE BENEFITS – HIGHER UNDERWRITING GAIN DRIVEN BY IMPROVED LOSS RATIOS AND STOP LOSS PREMIUM GROWTH
| Three months ended March 31, | ||||||||
| ($ in millions, before income taxes) | 2015 | 2014 | ||||||
| Operating earnings |
$ | 41 | $ | 17 | ||||
| Less: DAC/VOBA and other intangibles unlocking |
(1 | ) | (5 | ) | ||||
|
|
|
|
|
|||||
| Adjusted operating earnings |
$ | 41 | $ | 22 | ||||
Employee Benefits adjusted operating earnings were $41 million, compared with $22 million. The following items primarily accounted for this increase:
| • | Higher net underwriting gain ($20 million positive variance) due to an improved loss ratio for Group Life as a result of lower severity and higher Stop Loss premiums combined with an improved loss ratio for Stop Loss; and |
| • | Higher administrative expense ($1 million negative variance) due to higher sales volume. |
The loss ratio for Group Life was 74.2%, compared with 82.0% and the loss ratio for Stop Loss was 70.4%, compared with 72.4%. The expected annual loss ratio for Group Life and Stop Loss is 77-80%.
6
Employee Benefits sales were $273 million, compared with $252 million in the first quarter of 2014, driven by higher Stop Loss sales.
CORPORATE
Corporate operating losses were $48 million, compared with losses of $38 million, primarily due to consulting expense and a decrease in alternative income.
CLOSED BLOCK INSTITUTIONAL SPREAD PRODUCTS AND CLOSED BLOCK OTHER
| Three months ended March 31, | ||||||||
| ($ in millions, before income taxes) | 2015 | 2014 | ||||||
| Closed Block Institutional Spread Products |
$ | 5 | $ | 5 | ||||
| Closed Block Other |
9 | (4 | ) | |||||
|
|
|
|
|
|||||
| Operating earnings |
$ | 14 | $ | 1 | ||||
Closed Block Institutional Spread Products and Closed Block Other operating earnings were $14 million, compared with $1 million. The increase in earnings was due to the first quarter of 2015 benefitting primarily from favorable reserve development in our retained group reinsurance business.
The average AUM for Closed Block Institutional Spread Products decreased to $1.6 billion for the quarter ended March 31, 2015, down from $1.7 billion for the quarter ended December 31, 2014 and $2.5 billion for the quarter ended March 31, 2014, reflecting the continued run-off of the block.
CBVA
CBVA had a loss before income taxes of $34 million, compared with a profit before income taxes of $20 million in the first quarter of 2014. Changes in the fair value of guaranteed benefit derivatives related to nonperformance risk, which the company considers a non-economic factor, generated a gain of $55 million in the first quarter of 2015, compared with a $30 million gain in the first quarter of 2014.
The continued decline in interest rates and less favorable changes in implied volatility led to higher losses when compared to the first quarter of 2014. The focus continues to be on protecting regulatory and rating agency capital, and our hedge program is primarily designed to mitigate the impacts of market movements on capital resources, rather than mitigating U.S. GAAP earnings volatility.
During the first quarter of 2015, the hedge program resulted in a net gain to regulatory surplus as a result of the difference between the decline in reserves and the decline in hedge assets related to equity market movements.
The retained net amount at risk for CBVA living benefit guarantees was $4.1 billion as of March 31, 2015, up from $3.7 billion at December 31, 2014, primarily driven by lower interest rates.
Share Repurchases
During the first quarter, Voya Financial repurchased approximately 13.6 million shares of its common stock from ING Group for an aggregate purchase price of $600 million. Voya Financial also repurchased an additional 707,563 shares of its common stock in the open market for an aggregate purchase price of $31 million. As a result of the total $631 million in share repurchases during the quarter, Voya Financial had approximately $130 million remaining under its share repurchase authorization as of March 31, 2015.
7
Supplementary Financial Information
More detailed financial information can be found in Voya Financial’s Quarterly Investor Supplement, which is available on Voya Financial’s investor relations website, investors.voya.com.
Earnings Conference Call and Slide Presentation
Voya Financial will host a conference call on Wednesday, May 6, 2015 at 10:00 a.m. ET to discuss the company’s first quarter 2015 results. The call and slide presentation can be accessed via the company’s investor relations website at investors.voya.com.
A replay of the call will be available on the company’s investor relations website at investors.voya.com starting at 1:00 p.m. ET on May 6th.
About Voya Financial®
Voya Financial, Inc. (NYSE: VOYA), is composed of premier retirement, investment and insurance companies serving the financial needs of approximately 13 million individual and institutional customers in the United States. The company’s vision is to be America’s Retirement CompanyTM and its guiding principle is centered on solving the most daunting financial challenge facing Americans today — retirement readiness. Working directly with clients and through a broad group of financial intermediaries, independent producers, affiliated advisors and dedicated sales specialists, Voya provides a comprehensive portfolio of asset accumulation, asset protection and asset distribution products and services. With a dedicated workforce of approximately 6,500 employees, Voya is grounded in a clear mission to make a secure financial future possible — one person, one family, one institution at a time. For more information, visit voya.com or view our Voya Financial Interactive Company Profile. Follow Voya Financial on Facebook and Twitter @Voya.
| Media Contact: | Investor Contact: | |
| Christopher Breslin 212-309-8941 |
Darin Arita 212-309-8999 | |
Use of Non-GAAP Financial Measures
We use operating earnings, which consists of operating revenues minus operating benefits and expenses, to evaluate segment performance. We also report operating earnings on an aggregate basis (both before and after income taxes) for both our Ongoing Business and for our Company as a whole. Operating earnings does not replace net income (loss) as the measure of our results of operations. Each segment’s operating earnings before income taxes is calculated by adjusting income (loss) before income taxes for the following items:
| • | Net investment gains (losses), net of related amortization of DAC, VOBA, sales inducements and unearned revenue. Net investment gains (losses) include gains (losses) on the sale of securities, impairments, changes in the fair value of investments using the fair value option unrelated to the implied loan-backed security income recognition for certain mortgage-backed obligations and changes in the fair value of derivative instruments, excluding realized gains (losses) associated with swap settlements and accrued interest; |
| • | Net guaranteed benefit hedging gains (losses), which include changes in the fair value of derivatives related to guaranteed benefits, net of related reserve increases (decreases) and net of related amortization of DAC, VOBA and sales inducements, less the estimated cost of these benefits. The estimated cost, which is reflected in operating results, reflects the expected cost of these benefits if markets perform in line with our long-term expectations and includes the cost of hedging. Other derivative and reserve changes related to guaranteed benefits are excluded from operating results, including the impacts related to changes in our nonperformance spread; |
8
| • | Income (loss) related to businesses exited through reinsurance or divestment (including net investment gains (losses) on securities sold and expenses directly related to these transactions); |
| • | Income (loss) attributable to noncontrolling interest; |
| • | Income (loss) related to early extinguishment of debt; |
| • | Impairment of goodwill, value of management contract rights and value of customer relationships acquired; |
| • | Immediate recognition of net actuarial gains (losses) related to our pension and other postretirement benefit obligations and gains (losses) from plan amendments and curtailments; and |
| • | Other items, including restructuring expenses (severance, lease write-offs, etc.), certain third-party expenses and deal incentives related to the divestment of Voya Financial by ING Group and expenses associated with the rebranding of Voya Financial from ING U.S. |
Our CBVA segment is managed to focus on protecting regulatory and rating agency capital rather than U.S. GAAP earnings and, therefore, we do not include its results of operations within operating earnings before income taxes. When we present the adjustments to Income (loss) before income taxes on a consolidated basis, each adjustment excludes the portions attributable to our CBVA segment.
We also use adjusted operating earnings before income taxes as a measure of our financial performance. This measure excludes from operating earnings the following items: (1) DAC/VOBA and other intangibles unlocking, (2) gains or losses in conjunction with a Lehman Brothers bankruptcy settlement for assets held in a partnership owned by the Company, (3) losses recognized in certain periods of 2013 as a result of the disposal of low-income housing tax credit partnerships, (4) a gain on a reinsurance recapture in the fourth quarter of 2014, and (5) Interest expense related to debt in our Corporate segment. Because DAC/VOBA and other intangibles unlocking can be volatile, excluding the effect of this item can improve period to period comparability. The gains and losses from the Lehman Brothers bankruptcy settlement, loss from the disposition of low-income housing tax credit partnerships, and gain on reinsurance recapture affected run-rate results and we believe that this effect is not reflective of our ongoing performance.
We report Ongoing Business operating earnings before income taxes (both adjusted and unadjusted as described above) because we believe this measure is a useful indicator of the business performance for our Ongoing Business segments, excluding the effect of our Closed Block and Corporate segments.
The most directly comparable U.S. GAAP measure to operating earnings (both before and after income taxes), adjusted operating earnings before income taxes, Ongoing Business operating earnings before income taxes and Ongoing Business adjusted operating earnings before income taxes, is in each case income (loss) before income taxes. For a reconciliation of each of these non-GAAP measures to income (loss) before income taxes, see the tables that accompany this release, as well as our Quarterly Investor Supplement.
We report Ongoing Business adjusted operating ROE and adjusted operating ROC because we believe these measures are useful indicators of how effectively we use capital resources allocated to our Ongoing Business. The most directly comparable U.S. GAAP measure to Ongoing Business adjusted operating ROE and adjusted operating ROC is return on equity. For a reconciliation of these non-GAAP measures to return on equity, see the tables that accompany this release as well as our Quarterly Investor Supplement.
In our Investment Management business we report the operating margin excluding Investment Capital results. Because results from Investment Capital can be volatile, excluding the effect of this item can improve period to period comparability.
In addition to book value per share including AOCI, we report book value per share excluding AOCI. Included in AOCI are investment portfolio unrealized gains or losses. In the ordinary course of business we do not plan to sell most investments for the sole purpose of realizing gains or losses, and book value per share excluding AOCI provides a measure consistent with that view.
9
We also analyze our Ongoing Business performance based on the sources of earnings. We believe this supplemental information is useful in order to gain a better understanding of our financial performance, because it provides insight into the main drivers of operating earnings (loss) before income taxes of our Ongoing Business. The sources of earnings are defined as follows:
| • | Investment spread and other investment income consists of net investment income and net realized investment gains (losses) associated with swap settlements and accrued interest, less interest credited to policyholder reserves. |
| • | Fee based margin consists primarily of fees earned on AUM, AUA, and transaction based recordkeeping fees. |
| • | Net underwriting gain (loss) and other revenue contains the difference between fees charged for insurance risks and incurred benefits, including mortality, morbidity, and surrender results, contractual charges for universal life and annuity contracts, the change in the unearned revenue reserve for universal life contracts, and that portion of traditional life insurance premiums intended to cover expenses and profits. Certain contract charges for universal life insurance are not recognized in income immediately, but are deferred as unearned revenues and are amortized into income in a manner similar to the amortization of DAC. |
| • | Administrative expenses are general expenses, net of amounts capitalized as acquisition expenses and exclude commission expenses and fees on letters of credit. |
| • | Trail commissions are commissions paid that are not deferred and thus recorded directly to expense. |
| • | For a detailed explanation of DAC/VOBA and other intangibles amortization/unlocking see “Management’s Discussion and Analysis of Financial Condition and Results of Operations – Unlocking of DAC/VOBA and other Contract Owner/Policyholder Intangibles” in our 2014 Annual Report on Form 10-K, filed with the SEC on February 27, 2015. |
More details on these sources of earnings can be found in Voya Financial’s Quarterly Investor Supplement, which is available on Voya Financial’s investor relations website, investors.voya.com.
Forward-Looking and Other Cautionary Statements
This press release contains forward-looking statements. Forward-looking statements include statements relating to future developments in our business or expectations for our future financial performance and any statement not involving a historical fact. Forward-looking statements use words such as “anticipate,” “believe,” “estimate,” “expect,” “intend,” “plan,” and other words and terms of similar meaning in connection with a discussion of future operating or financial performance. Actual results, performance or events may differ materially from those projected in any forward-looking statement due to, among other things, (i) general economic conditions, particularly economic conditions in our core markets, (ii) performance of financial markets, including emerging markets, (iii) the frequency and severity of insured loss events, (iv) mortality and morbidity levels, (v) persistency and lapse levels, (vi) interest rates, (vii) currency exchange rates, (viii) general competitive factors, (ix) changes in laws and regulations, including those relating to the use of and possible application of NAIC accreditation standards to captive reinsurance entities and those made pursuant to the Dodd-Frank Wall Street Reform and Consumer Protection Act or the U.S. Department of Labor’s proposed rules and exemptions pertaining to the fiduciary status of providers of investment advice, and (x) changes in the policies of governments and/or regulatory authorities. Factors that may cause actual results to differ from those in any forward-looking statement also include those described under “Risk Factors” and “Management’s Discussion and Analysis of Results of Operations and Financial Condition—Trends and Uncertainties” in our Annual Report on Form 10-K for the year ended December 31, 2014, filed with the Securities and Exchange Commission on February 27, 2015, and our Quarterly Report for the three-month period ended March 31, 2015, to be filed with the Securities and Exchange Commission.
10
Voya Financial
Calculation and Reconciliation of Return on Equity and Return on Capital - TTM
| Twelve Months ended | Twelve Months ended | |||||||
| ($ in millions, unless otherwise indicated) | March 31, 2015 | December 31, 2014 | ||||||
| GAAP Return on Equity |
||||||||
| Net income (loss) available to Voya Financial, Inc.’s common shareholders |
$ | 2,227.1 | $ | 2,299.7 | ||||
| Voya Financial, Inc. shareholders’ equity: end of period |
$ | 16,102 | $ | 16,108 | ||||
| Voya Financial, Inc. shareholders’ equity: average for period |
$ | 15,141 | $ | 14,524 | ||||
| GAAP Return on Equity |
14.7 | % | 15.8 | % | ||||
| Ongoing Business Adjusted Operating Return on Capital and Adjusted Operating Return on Equity |
||||||||
| Ongoing Business adjusted operating earnings before income taxes |
$ | 1,409.9 | $ | 1,377.9 | ||||
| Income taxes on adjusted operating earnings (based on an assumed tax rate of 35% for 2014 and 32% for 2015) |
(483.9 | ) | (482.2 | ) | ||||
|
|
|
|
|
|||||
| Ongoing Business adjusted operating earnings after income taxes |
926.0 | 895.7 | ||||||
| Interest expense after-tax1 |
(78.6 | ) | (77.3 | ) | ||||
|
|
|
|
|
|||||
| Ongoing Business adjusted operating earnings after income taxes and interest expense |
$ | 847.4 | $ | 818.4 | ||||
|
|
|
|
|
|||||
| End of period capital for Ongoing Business |
$ | 8,864 | $ | 8,777 | ||||
| Average capital for Ongoing Business |
$ | 8,941 | $ | 9,028 | ||||
| Average debt (based on 25% debt-to-capital ratio) |
$ | (2,235 | ) | $ | (2,257 | ) | ||
|
|
|
|
|
|||||
| Average equity for Ongoing Business |
$ | 6,706 | $ | 6,771 | ||||
|
|
|
|
|
|||||
| Adjusted Operating Return on Capital for Ongoing Business 2 |
10.4 | % | 9.9 | % | ||||
| Adjusted Operating Return on Equity for |
12.6 | % | 12.1 | % | ||||
| Voya Financial
Reconciliation of Ongoing Business Adjusted Operating Earnings to Net Income (Loss) - Trailing Twelve Months |
| |||||||
|
Twelve Months ended |
Twelve Months ended | |||||||
| ($ in millions) | March 31, 2015 | December 31, 2014 | ||||||
| Ongoing Business adjusted operating earnings before income taxes |
$ | 1,409.9 | $ | 1,377.9 | ||||
| DAC/VOBA and other intangibles unlocking |
2.9 | (21.6 | ) | |||||
| Gain on reinsurance recapture |
20.0 | 20.0 | ||||||
|
|
|
|
|
|||||
| Operating earnings before income taxes for Ongoing Business |
1,432.8 | 1,376.3 | ||||||
| Corporate |
(181.3 | ) | (170.4 | ) | ||||
| Closed Blocks Institutional Spread Products and Other |
37.6 | 24.7 | ||||||
|
|
|
|
|
|||||
| Total operating earnings before income taxes |
1,289.1 | 1,230.6 | ||||||
| Income taxes (based on an assumed tax rate of 35% for 2014 and 32% for 2015) |
(442.5 | ) | (430.7 | ) | ||||
|
|
|
|
|
|||||
| Operating earnings, after-tax 3 |
846.6 | 799.9 | ||||||
| Closed Block Variable Annuity, after-tax 3 |
(201.4 | ) | (165.9 | ) | ||||
| Net investment gains (losses) and related charges and adjustments, after-tax 3 |
135.1 | 139.8 | ||||||
| Other, after-tax 4 |
1,446.8 | 1,525.9 | ||||||
|
|
|
|
|
|||||
| Net income (loss) available to Voya Financial, Inc.’s common shareholders |
2,227.1 | 2,299.7 | ||||||
| Net income (loss) attributable to noncontrolling interest |
250.3 | 237.7 | ||||||
|
|
|
|
|
|||||
| Net income (loss) |
$ | 2,477.4 | $ | 2,537.4 | ||||
|
|
|
|
|
|||||
|
Voya Financial
Reconciliation of Ongoing Business Adjusted Operating Earnings to Net Income (Loss) - Quarter-to-date |
| |||||||
| ($ in millions) |
Three Months ended |
Three Months ended March 31, 2014 |
||||||
| Ongoing Business adjusted operating earnings before income taxes |
$ | 319.3 | $ | 287.3 | ||||
| DAC/VOBA and other intangibles unlocking |
4.7 | (19.8 | ) | |||||
|
|
|
|
|
|||||
| Operating earnings before income taxes for Ongoing Business |
324.0 | 267.5 | ||||||
| Corporate |
(48.2 | ) | (37.3 | ) | ||||
| Closed Blocks Institutional Spread Products and Other |
13.8 | 0.9 | ||||||
|
|
|
|
|
|||||
| Total operating earnings before income taxes |
289.6 | 231.1 | ||||||
| Income taxes (based on an assumed tax rate of 35% for 2014, 32% for 2015) |
(92.7 | ) | (80.9 | ) | ||||
|
|
|
|
|
|||||
| Operating earnings, after-tax 3 |
196.9 | 150.2 | ||||||
| Closed Block Variable Annuity, after-tax 3 |
(22.4 | ) | 13.1 | |||||
| Net investment gains (losses) and related charges and |
32.8 | 37.4 | ||||||
| Other, after-tax |
(21.8 | ) | 57.4 | |||||
|
|
|
|
|
|||||
| Net income (loss) available to Voya Financial, Inc.’s common shareholders |
185.5 | 258.1 | ||||||
| Net income (loss) attributable to noncontrolling interest |
26.1 | 13.5 | ||||||
|
|
|
|
|
|||||
| Net income (loss) |
$ | 211.6 | $ | 271.6 | ||||
|
|
|
|
|
|||||
| 1 | Assumes debt-to-capital ratio of approximately 25% and the actual weighted average pre-tax interest rate for all time periods presented. |
| 2 | Average capital and equity are calculated by taking the average of the quarterly capital and equity averages for the trailing four quarters. |
| 3 | Assumes 32% tax rate for 2015 and 35% tax rate for 2014 on all operating earnings and 35% on all non-operating items for both 2014 and 2015. These tax rates do not reflect the actual tax expense or benefit, including the benefit or expense from recognizing certain deferred tax assets. |
| 4 | The twelve months ended 03/31/15 and 12/31/14 include $1,811.5 million and $1,850.0, respectively, of decrease in tax valuation allowance. |
11
Voya Financial
Reconciliation of End of Period Capital for Ongoing Business to Shareholders’ Equity
| As of | As of | |||||||
| ($ in millions) | March 31, 2015 | December 31, 2014 | ||||||
| End of Period Capital for Ongoing Business |
$ | 8,864 | $ | 8,777 | ||||
| Closed Block Variable Annuity, Corporate, and Other Closed Blocks |
$ | 7,223 | $ | 7,743 | ||||
|
|
|
|
|
|||||
| End of Period Capital |
$ | 16,087 | $ | 16,520 | ||||
| Long -Term Debt |
$ | (3,516 | ) | $ | (3,516 | ) | ||
|
|
|
|
|
|||||
| Voya Financial, Inc. shareholders’ equity excluding AOCI end of period |
$ | 12,571 | $ | 13,004 | ||||
| AOCI |
$ | 3,531 | $ | 3,104 | ||||
|
|
|
|
|
|||||
| Voya Financial, Inc. shareholders’ equity: end of period |
$ | 16,102 | $ | 16,108 | ||||
|
|
|
|
|
|||||
Voya Financial
Reconciliation of Book Value Per Share
| As of March 31, | ||||
| 2015 | ||||
| Book value per share, including AOCI |
$ | 70.30 | ||
| Per share impact of AOCI |
$ | (15.42 | ) | |
|
|
|
|||
| Book value per share, excluding AOCI |
$ | 54.88 | ||
|
|
|
|||
Voya Financial
Reconciliation of Investment Management Operating Margin
| Three Months Ended | Three Months Ended | Three Months Ended | ||||||||||
| ($ in millions, unless otherwise indicated) | March 31, 2015 | December 31, 2014 | March 31, 2014 | |||||||||
| Operating revenues |
$ | 163.1 | $ | 163.4 | $ | 160.5 | ||||||
| Operating expenses |
116.2 | 116.4 | 110.7 | |||||||||
|
|
|
|
|
|
|
|||||||
| Operating earnings before income taxes |
$ | 46.9 | $ | 47.0 | $ | 49.8 | ||||||
| Operating margin |
28.8 | % | 28.8 | % | 31.0 | % | ||||||
| Operating revenues |
$ | 163.1 | $ | 163.4 | $ | 160.5 | ||||||
| Less: |
||||||||||||
| Investment Capital Results |
6.1 | (4.6 | ) | 7.3 | ||||||||
|
|
|
|
|
|
|
|||||||
| Revenues excluding Investment Capital |
157.0 | 168.0 | 153.2 | |||||||||
| Operating expenses |
116.2 | 116.4 | 110.7 | |||||||||
|
|
|
|
|
|
|
|||||||
| Operating earnings excluding Investment Capital |
$ | 40.8 | $ | 51.6 | $ | 42.5 | ||||||
|
|
|
|
|
|
|
|||||||
| Operating margin excluding Investment Capital |
26.0 | % | 30.7 | % | 27.7 | % | ||||||
12
Exhibit 99.2

Quarterly Investor Supplement March 31, 2015 This report should be read in conjunction with Voya Financial, Inc.‘s Quarterly Report on Form 10-Q for the quarter ended March 31, 2015. Voya Financial’s Annual Reports on Form 10-K, and Quarterly Reports on Form 10-Q, can be accessed upon filing at the Securities and Exchange Commissions website at www.sec.gov, and at our website at investors.voya.com. All information is unaudited.
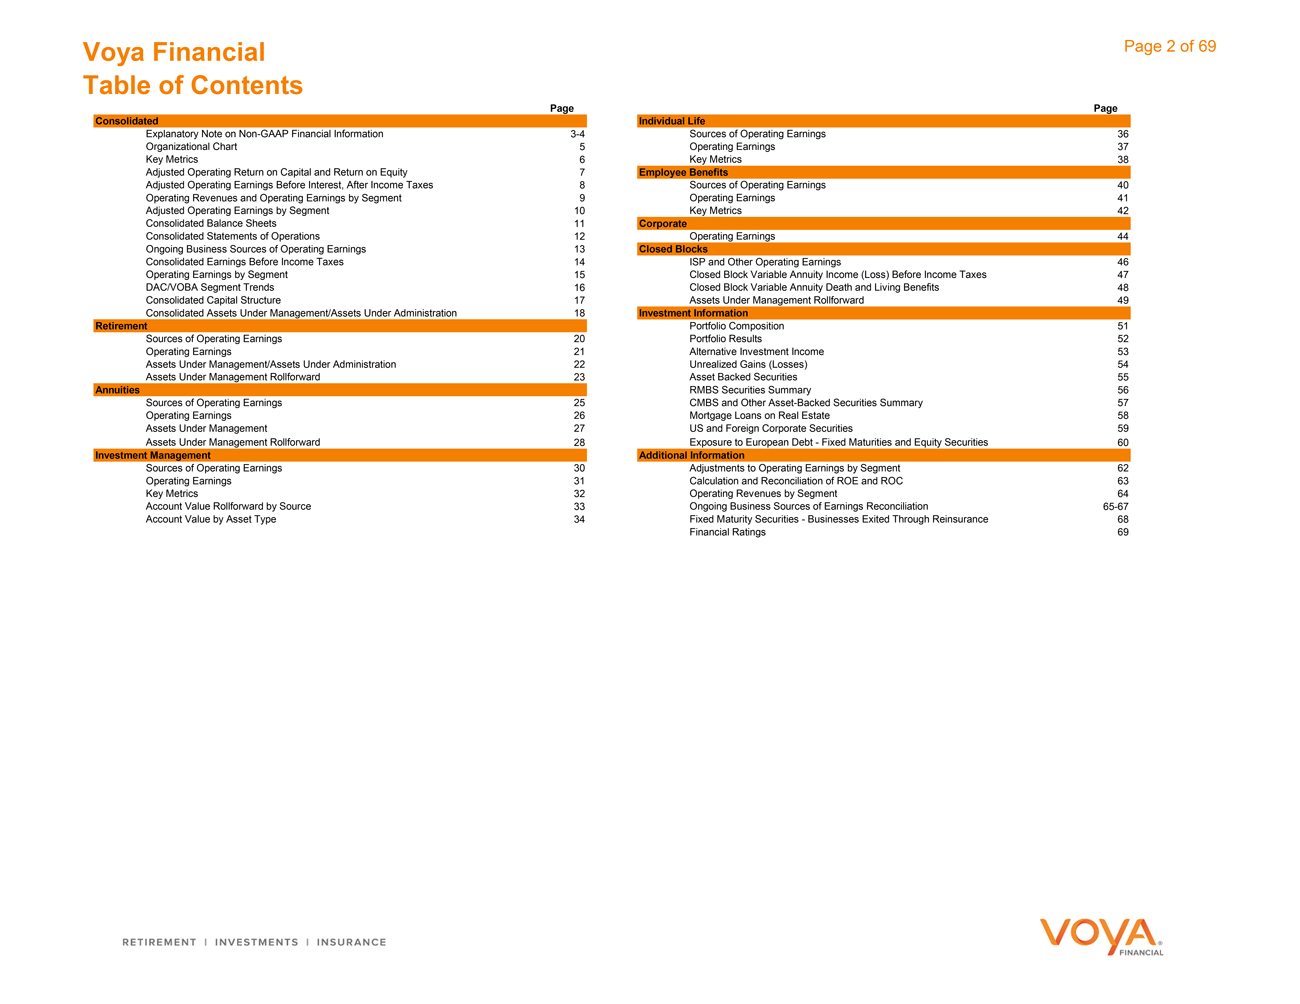
Voya Financial Table of Contents Page 2 of 69 Page Page Consolidated Individual Life Explanatory Note on Non-GAAP Financial Information 3-4 Sources of Operating Earnings 36 Organizational Chart 5 Operating Earnings 37 Key Metrics 6 Key Metrics 38 Adjusted Operating Return on Capital and Return on Equity 7 Employee Benefits Adjusted Operating Earnings Before Interest, After Income Taxes 8 Sources of Operating Earnings 40 9 Operating Earnings 41 Operating Revenues and Operating Earnings by Segment Adjusted Operating Earnings by Segment 10 Key Metrics 42 Consolidated Balance Sheets 11 Corporate Consolidated Statements of Operations 12 Operating Earnings 44 13 Closed Blocks Ongoing Business Sources of Operating Earnings Consolidated Earnings Before Income Taxes 14 46 ISP and Other Operating Earnings Operating Earnings by Segment 15 Closed Block Variable Annuity Income (Loss) Before Income Taxes 47 DAC/VOBA Segment Trends 16 Closed Block Variable Annuity Death and Living Benefits 48 Consolidated Capital Structure 17 Assets Under Management Rollforward 49 Consolidated Assets Under Management/Assets Under Administration 18 Investment Information Retirement 51 Portfolio Composition 20 52 Portfolio Results Sources of Operating Earnings 21 53 Alternative Investment Income Operating Earnings Assets Under Management/Assets Under Administration 22 Unrealized Gains (Losses) 54 Assets Under Management Rollforward 23 Asset Backed Securities 55 Annuities RMBS Securities Summary 56 25 57 CMBS and Other Asset-Backed Securities Summary Sources of Operating Earnings 26 58 Mortgage Loans on Real Estate Operating Earnings Assets Under Management 27 US and Foreign Corporate Securities 59 Assets Under Management Rollforward 28 Exposure to European Debt—Fixed Maturities and Equity Securities 60 Investment Management Additional Information 30 62 Sources of Operating Earnings Adjustments to Operating Earnings by Segment 31 63 Calculation and Reconciliation of ROE and ROC Operating Earnings Key Metrics 32 Operating Revenues by Segment 64 Account Value Rollforward by Source 33 Ongoing Business Sources of Earnings Reconciliation 65-67 Account Value by Asset Type 34 Fixed Maturity Securities—Businesses Exited Through Reinsurance 68 Financial Ratings 69
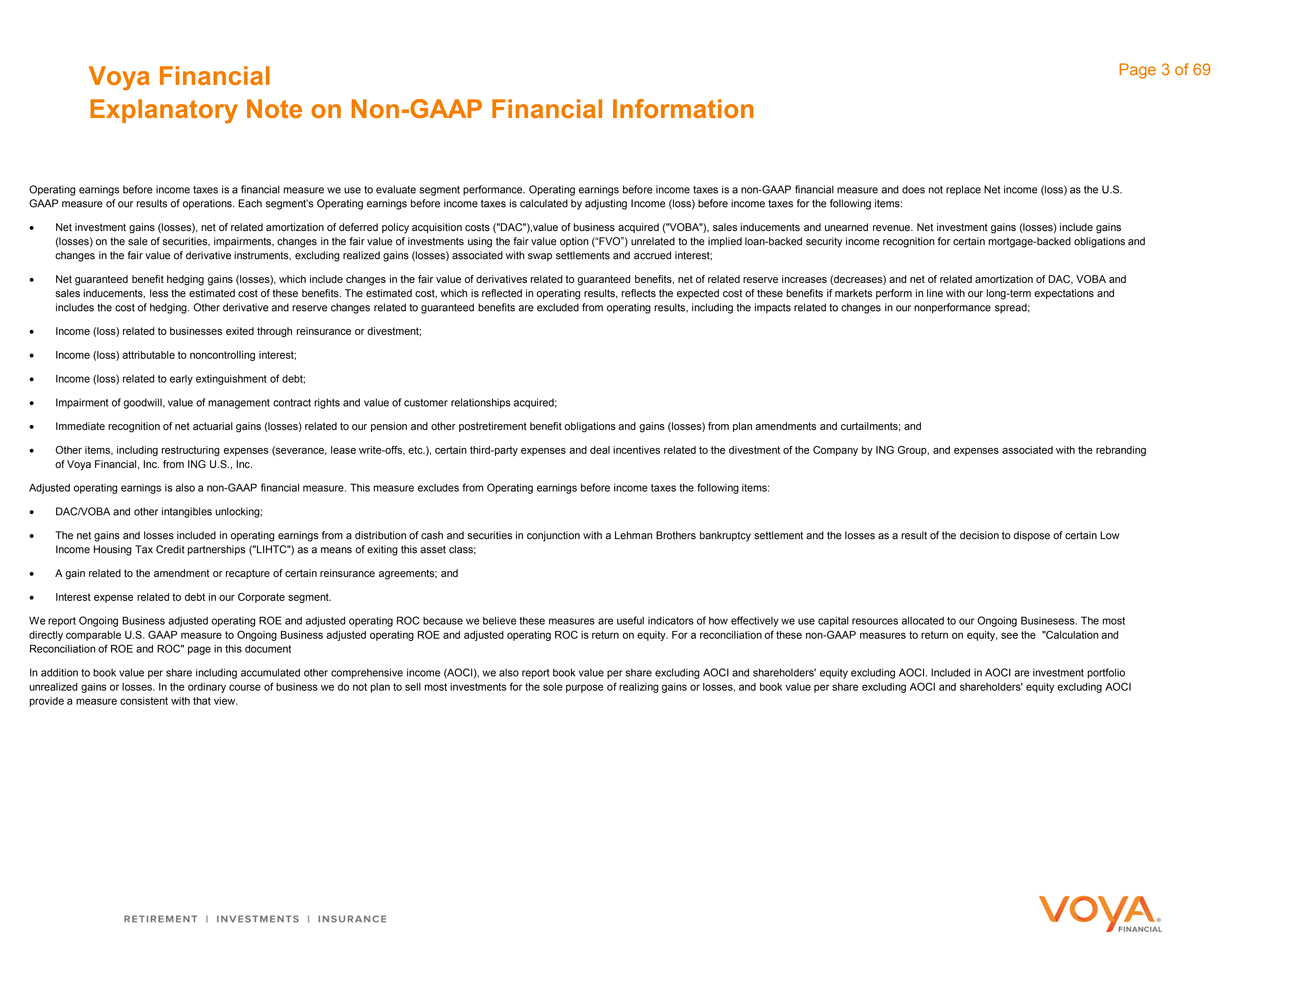
Voya Financial Explanatory Note on Non-GAAP Financial Information Page 3 of 69 Operating earnings before income taxes is a financial measure we use to evaluate segment performance. Operating earnings before income taxes is a non-GAAP financial measure and does not replace Net income (loss) as the U.S. GAAP measure of our results of operations. Each segments Operating earnings before income taxes is calculated by adjusting Income (loss) before income taxes for the following items: Net investment gains (losses), net of related amortization of deferred policy acquisition costs (“DAC”),value of business acquired (“VOBA”), sales inducements and unearned revenue. Net investment gains (losses) include gains (losses) on the sale of securities, impairments, changes in the fair value of investments using the fair value option (FVO) unrelated to the implied loan-backed security income recognition for certain mortgage-backed obligations and changes in the fair value of derivative instruments, excluding realized gains (losses) associated with swap settlements and accrued interest; Net guaranteed benefit hedging gains (losses), which include changes in the fair value of derivatives related to guaranteed benefits, net of related reserve increases (decreases) and net of related amortization of DAC, VOBA and sales inducements, less the estimated cost of these benefits. The estimated cost, which is reflected in operating results, reflects the expected cost of these benefits if markets perform in line with our long-term expectations and includes the cost of hedging. Other derivative and reserve changes related to guaranteed benefits are excluded from operating results, including the impacts related to changes in our nonperformance spread; Income (loss) related to businesses exited through reinsurance or divestment; Income (loss) attributable to noncontrolling interest; Income (loss) related to early extinguishment of debt; Impairment of goodwill, value of management contract rights and value of customer relationships acquired; Immediate recognition of net actuarial gains (losses) related to our pension and other postretirement benefit obligations and gains (losses) from plan amendments and curtailments; and Other items, including restructuring expenses (severance, lease write-offs, etc.), certain third-party expenses and deal incentives related to the divestment of the Company by ING Group, and expenses associated with the rebranding of Voya Financial, Inc. from ING U.S., Inc. Adjusted operating earnings is also a non-GAAP financial measure. This measure excludes from Operating earnings before income taxes the following items: DAC/VOBA and other intangibles unlocking; The net gains and losses included in operating earnings from a distribution of cash and securities in conjunction with a Lehman Brothers bankruptcy settlement and the losses as a result of the decision to dispose of certain Low Income Housing Tax Credit partnerships (“LIHTC”) as a means of exiting this asset class; A gain related to the amendment or recapture of certain reinsurance agreements; and Interest expense related to debt in our Corporate segment. We report Ongoing Business adjusted operating ROE and adjusted operating ROC because we believe these measures are useful indicators of how effectively we use capital resources allocated to our Ongoing Businesess. The most directly comparable U.S. GAAP measure to Ongoing Business adjusted operating ROE and adjusted operating ROC is return on equity. For a reconciliation of these non-GAAP measures to return on equity, see the “Calculation and Reconciliation of ROE and ROC” page in this document In addition to book value per share including accumulated other comprehensive income (AOCI), we also report book value per share excluding AOCI and shareholders’ equity excluding AOCI. Included in AOCI are investment portfolio unrealized gains or losses. In the ordinary course of business we do not plan to sell most investments for the sole purpose of realizing gains or losses, and book value per share excluding AOCI and shareholders’ equity excluding AOCI provide a measure consistent with that view.
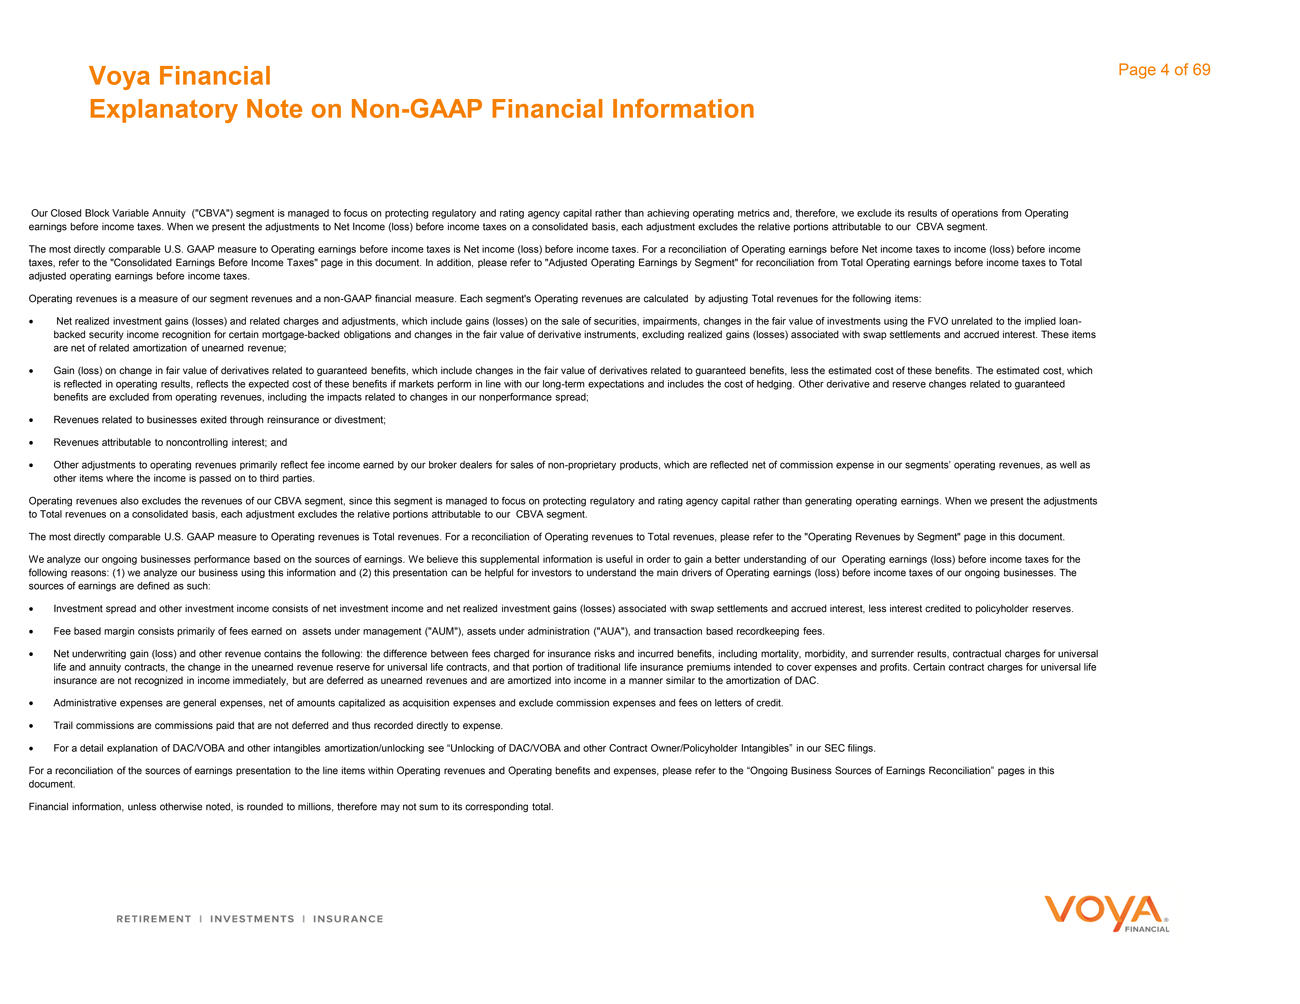
Voya Financial Explanatory Note on Non-GAAP Financial Information Page 4 of 69 Our Closed Block Variable Annuity (“CBVA”) segment is managed to focus on protecting regulatory and rating agency capital rather than achieving operating metrics and, therefore, we exclude its results of operations from Operating earnings before income taxes. When we present the adjustments to Net Income (loss) before income taxes on a consolidated basis, each adjustment excludes the relative portions attributable to our CBVA segment. The most directly comparable U.S. GAAP measure to Operating earnings before income taxes is Net income (loss) before income taxes. For a reconciliation of Operating earnings before Net income taxes to income (loss) before income taxes, refer to the “Consolidated Earnings Before Income Taxes” page in this document. In addition, please refer to “Adjusted Operating Earnings by Segment” for reconciliation from Total Operating earnings before income taxes to Total adjusted operating earnings before income taxes. Operating revenues is a measure of our segment revenues and a non-GAAP financial measure. Each segment’s Operating revenues are calculated by adjusting Total revenues for the following items: Net realized investment gains (losses) and related charges and adjustments, which include gains (losses) on the sale of securities, impairments, changes in the fair value of investments using the FVO unrelated to the implied loan-backed security income recognition for certain mortgage-backed obligations and changes in the fair value of derivative instruments, excluding realized gains (losses) associated with swap settlements and accrued interest. These items are net of related amortization of unearned revenue; Gain (loss) on change in fair value of derivatives related to guaranteed benefits, which include changes in the fair value of derivatives related to guaranteed benefits, less the estimated cost of these benefits. The estimated cost, which is reflected in operating results, reflects the expected cost of these benefits if markets perform in line with our long-term expectations and includes the cost of hedging. Other derivative and reserve changes related to guaranteed benefits are excluded from operating revenues, including the impacts related to changes in our nonperformance spread; Revenues related to businesses exited through reinsurance or divestment; Revenues attributable to noncontrolling interest; and Other adjustments to operating revenues primarily reflect fee income earned by our broker dealers for sales of non-proprietary products, which are reflected net of commission expense in our segments’ operating revenues, as well as other items where the income is passed on to third parties. Operating revenues also excludes the revenues of our CBVA segment, since this segment is managed to focus on protecting regulatory and rating agency capital rather than generating operating earnings. When we present the adjustments to Total revenues on a consolidated basis, each adjustment excludes the relative portions attributable to our CBVA segment. The most directly comparable U.S. GAAP measure to Operating revenues is Total revenues. For a reconciliation of Operating revenues to Total revenues, please refer to the “Operating Revenues by Segment” page in this document. We analyze our ongoing businesses performance based on the sources of earnings. We believe this supplemental information is useful in order to gain a better understanding of our Operating earnings (loss) before income taxes for the following reasons: (1) we analyze our business using this information and (2) this presentation can be helpful for investors to understand the main drivers of Operating earnings (loss) before income taxes of our ongoing businesses. The sources of earnings are defined as such: Investment spread and other investment income consists of net investment income and net realized investment gains (losses) associated with swap settlements and accrued interest, less interest credited to policyholder reserves. Fee based margin consists primarily of fees earned on assets under management (“AUM”), assets under administration (“AUA”), and transaction based recordkeeping fees. Net underwriting gain (loss) and other revenue contains the following: the difference between fees charged for insurance risks and incurred benefits, including mortality, morbidity, and surrender results, contractual charges for universal life and annuity contracts, the change in the unearned revenue reserve for universal life contracts, and that portion of traditional life insurance premiums intended to cover expenses and profits. Certain contract charges for universal life insurance are not recognized in income immediately, but are deferred as unearned revenues and are amortized into income in a manner similar to the amortization of DAC. Administrative expenses are general expenses, net of amounts capitalized as acquisition expenses and exclude commission expenses and fees on letters of credit. Trail commissions are commissions paid that are not deferred and thus recorded directly to expense. For a detail explanation of DAC/VOBA and other intangibles amortization/unlocking see “Unlocking of DAC/VOBA and other Contract Owner/Policyholder Intangibles” in our SEC filings. For a reconciliation of the sources of earnings presentation to the line items within Operating revenues and Operating benefits and expenses, please refer to the “Ongoing Business Sources of Earnings Reconciliation” pages in this document. Financial information, unless otherwise noted, is rounded to millions, therefore may not sum to its corresponding total.
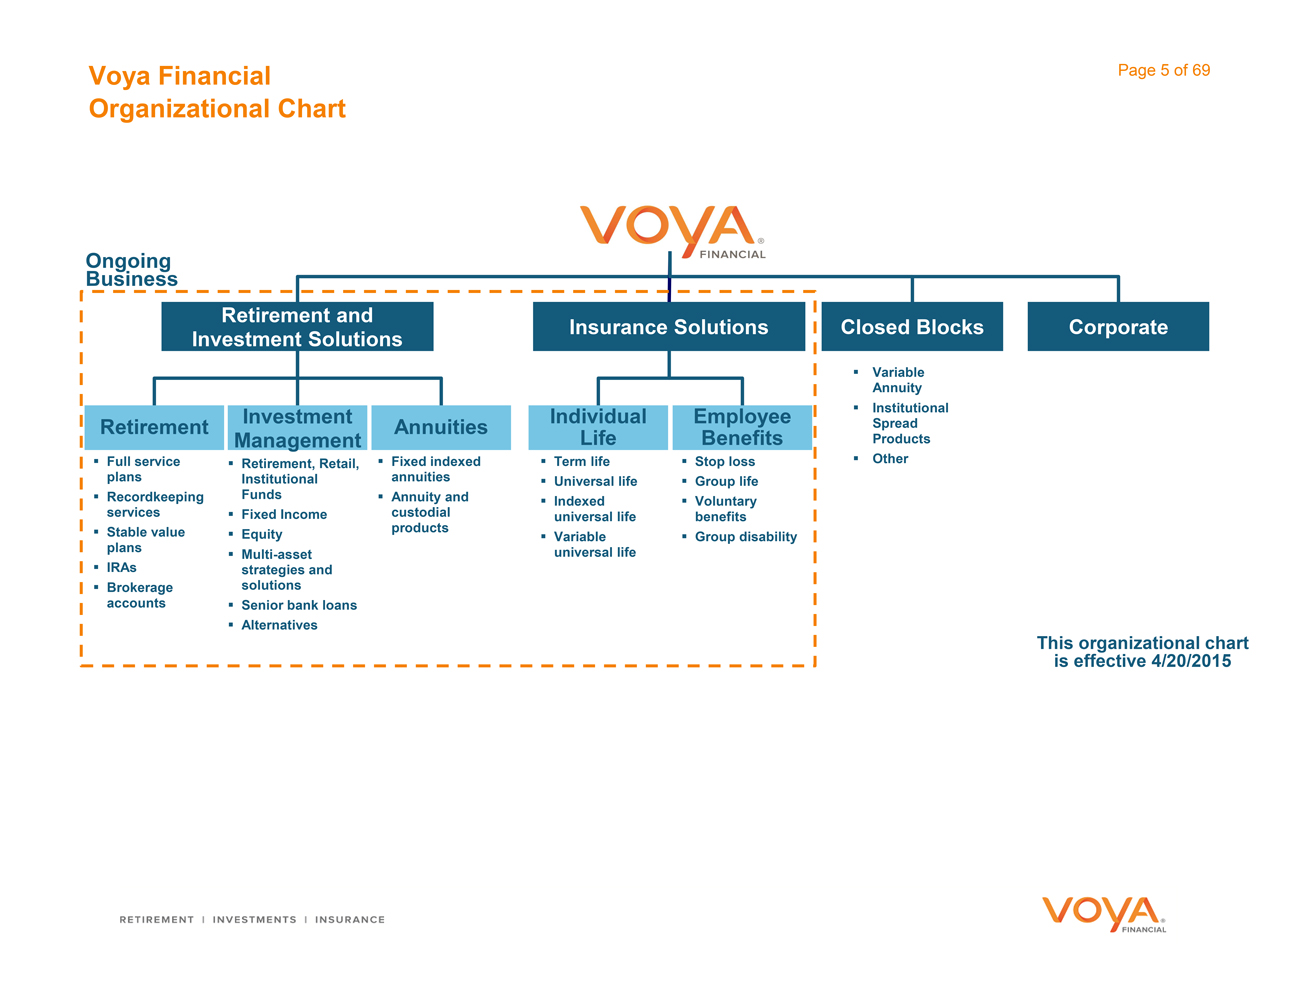
Voya Financial Organizational Chart Page 5 of 69 Retirement and Investment Solutions Retirement Investment Management Insurance Solutions Corporate Closed Blocks Annuities Individual Life Employee Benefits Full service plans Recordkeeping services Stable value plans Brokerage accounts Fixed indexed annuities Annuity and custodial products Retirement, Retail, Institutional Funds Multi-asset strategies and solutions Indexed universal life Variable universal Voluntary Variable Annuity Institutional Spread Products Ongoing Business This organizational chart is effective 4/20/2015
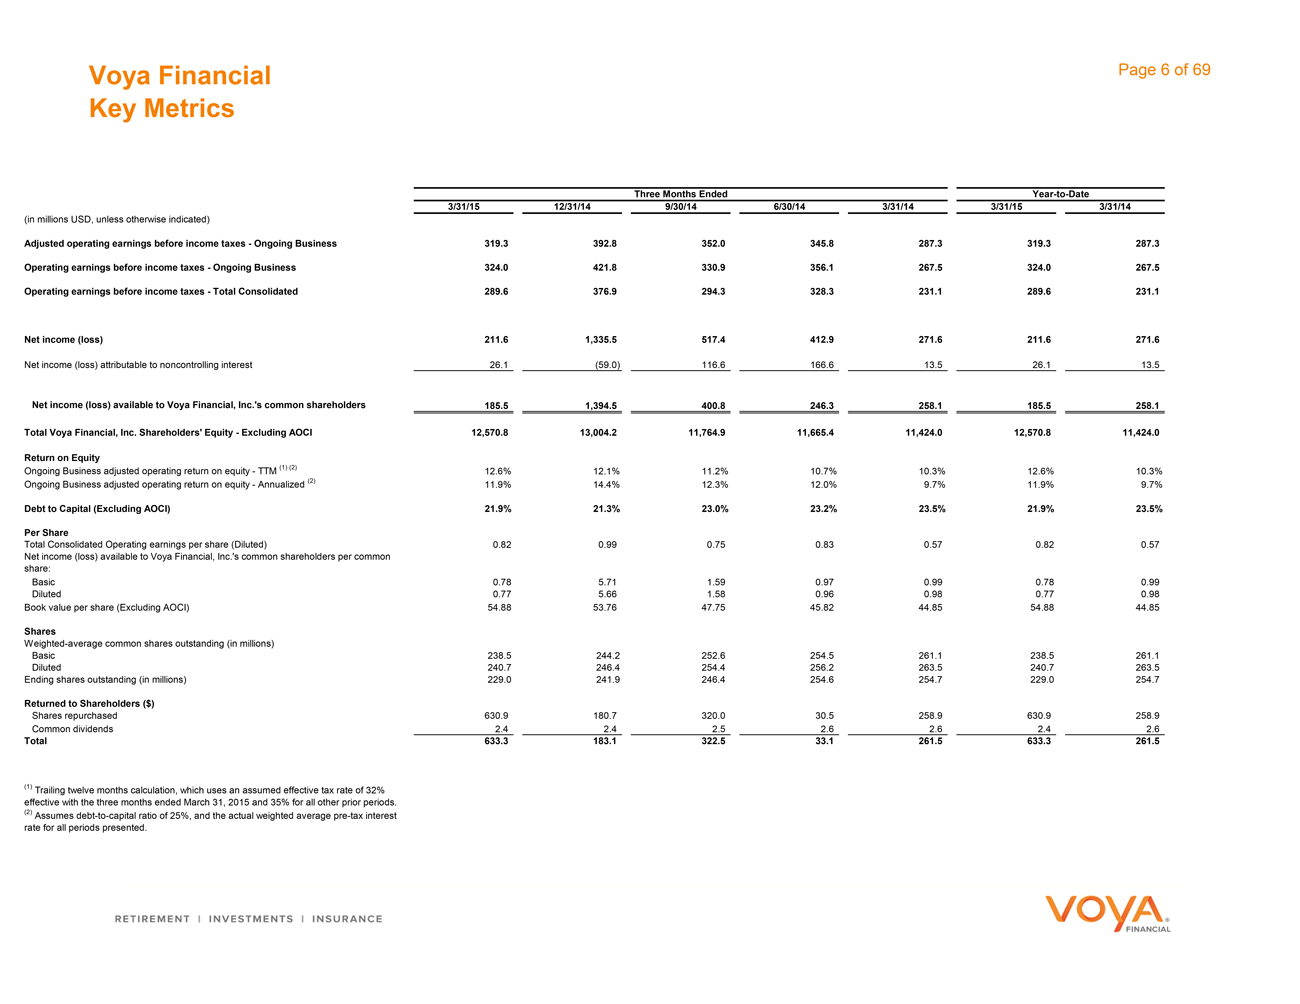
Voya Financial Key Metrics Page 6 of 69 Three Months Ended Year-to-Date 3/31/15 12/31/14 9/30/14 6/30/14 3/31/14 3/31/15 3/31/14 (in millions USD, unless otherwise indicated) Adjusted operating earnings before income taxes—Ongoing Business 319.3 392.8 352.0 345.8 287.3 319.3 287.3 Operating earnings before income taxes—Ongoing Business 324.0 421.8 330.9 356.1 267.5 324.0 267.5 Operating earnings before income taxes—Total Consolidated 289.6 376.9 294.3 328.3 231.1 289.6 231.1 Net income (loss) 211.6 1,335.5 517.4 412.9 271.6 211.6 271.6 Net income (loss) attributable to noncontrolling interest 26.1 (59.0) 116.6 166.6 13.5 26.1 13.5 Net income (loss) available to Voya Financial, Inc.‘s common shareholders 185.5 1,394.5 400.8 246.3 258.1 185.5 258.1 Total Voya Financial, Inc. Shareholders’ Equity—Excluding AOCI 12,570.8 13,004.2 11,764.9 11,665.4 11,424.0 12,570.8 11,424.0 Return on Equity Ongoing Business adjusted operating return on equity—TTM (1) (2) 12.6% 12.1% 11.2% 10.7% 10.3% 12.6% 10.3% Ongoing Business adjusted operating return on equity—Annualized (2) 11.9% 14.4% 12.3% 12.0% 9.7% 11.9% 9.7% Debt to Capital (Excluding AOCI) 21.9% 21.3% 23.0% 23.2% 23.5% 21.9% 23.5% Per Share Total Consolidated Operating earnings per share (Diluted) 0.82 0.99 0.75 0.83 0.57 0.82 0.57 Net income (loss) available to Voya Financial, Inc.‘s common shareholders per common share: Basic 0.78 5.71 1.59 0.97 0.99 0.78 0.99 Diluted 0.77 5.66 1.58 0.96 0.98 0.77 0.98 Book value per share (Excluding AOCI) 54.88 53.76 47.75 45.82 44.85 54.88 44.85 Shares Weighted-average common shares outstanding (in millions) Basic 238.5 244.2 252.6 254.5 261.1 238.5 261.1 Diluted 240.7 246.4 254.4 256.2 263.5 240.7 263.5 Ending shares outstanding (in millions) 229.0 241.9 246.4 254.6 254.7 229.0 254.7 Returned to Shareholders ($) Shares repurchased 630.9 180.7 320.0 30.5 258.9 630.9 258.9 Common dividends 2.4 2.4 2.5 2.6 2.6 2.4 2.6 Total 633.3 183.1 322.5 33.1 261.5 633.3 261.5 (1) Trailing twelve months calculation, which uses an assumed effective tax rate of 32% effective with the three months ended March 31, 2015 and 35% for all other prior periods. (2) Assumes debt-to-capital ratio of 25%, and the actual weighted average pre-tax interest rate for all periods presented.
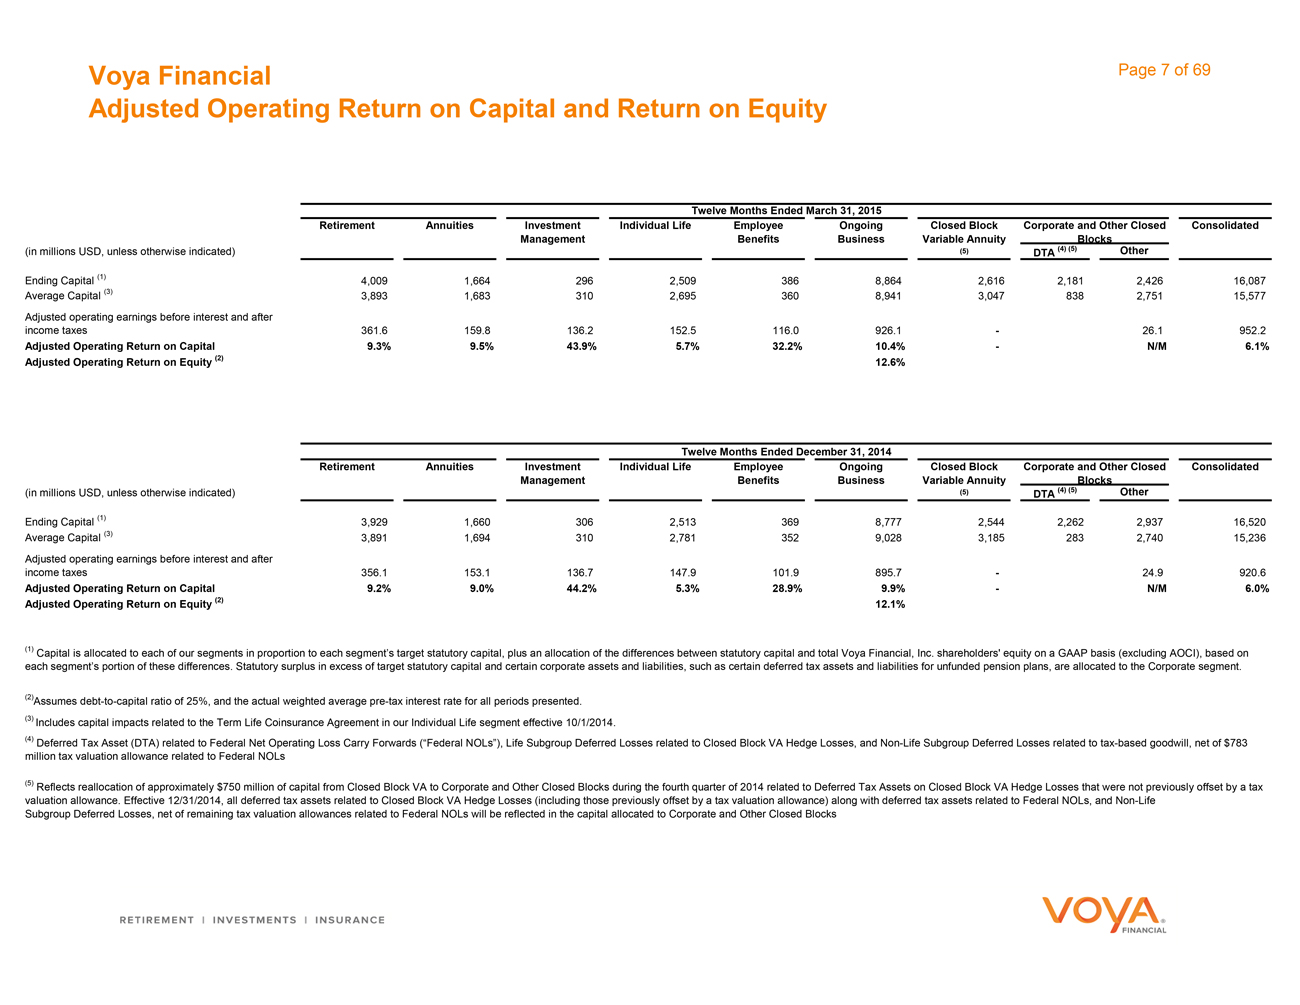
Voya Financial Adjusted Operating Return on Capital and Return on Equity Page 7 of 69 Twelve Months Ended March 31, 2015 Retirement Annuities Investment Individual Life Employee Ongoing Closed Block Corporate and Other Closed Consolidated Management Benefits Business Variable Annuity Blocks (in millions USD, unless otherwise indicated) (5) DTA (4) (5) Other Ending Capital (1) 4,009 1,664 296 2,509 386 8,864 2,616 2,181 2,426 16,087 Average Capital (3) 3,893 1,683 310 2,695 360 8,941 3,047 838 2,751 15,577 Adjusted operating earnings before interest and after income taxes 361.6 159.8 136.2 152.5 116.0 926.1 - 26.1 952.2 Adjusted Operating Return on Capital 9.3% 9.5% 43.9% 5.7% 32.2% 10.4% - N/M 6.1% Adjusted Operating Return on Equity (2) 12.6% Twelve Months Ended December 31, 2014 Retirement Annuities Investment Individual Life Employee Ongoing Closed Block Corporate and Other Closed Consolidated Management Benefits Business Variable Annuity Blocks (in millions USD, unless otherwise indicated) (5) DTA (4) (5) Other Ending Capital (1) 3,929 1,660 306 2,513 369 8,777 2,544 2,262 2,937 16,520 Average Capital (3) 3,891 1,694 310 2,781 352 9,028 3,185 283 2,740 15,236 Adjusted operating earnings before interest and after income taxes 356.1 153.1 136.7 147.9 101.9 895.7 - 24.9 920.6 Adjusted Operating Return on Capital 9.2% 9.0% 44.2% 5.3% 28.9% 9.9% - N/M 6.0% Adjusted Operating Return on Equity (2) 12.1% (1) Capital is allocated to each of our segments in proportion to each segment’s target statutory capital, plus an allocation of the differences between statutory capital and total Voya Financial, Inc. shareholders’ equity on a GAAP basis (excluding AOCI), based on each segment’s portion of these differences. Statutory surplus in excess of target statutory capital and certain corporate assets and liabilities, such as certain deferred tax assets and liabilities for unfunded pension plans, are allocated to the Corporate segment. (2)Assumes debt-to-capital ratio of 25%, and the actual weighted average pre-tax interest rate for all periods presented. (3) Includes capital impacts related to the Term Life Coinsurance Agreement in our Individual Life segment effective 10/1/2014. (4) Deferred Tax Asset (DTA) related to Federal Net Operating Loss Carry Forwards (“Federal NOLs”), Life Subgroup Deferred Losses related to Closed Block VA Hedge Losses, and Non-Life Subgroup Deferred Losses related to tax-based goodwill, net of $783 million tax valuation allowance related to Federal NOLs (5) Reflects reallocation of approximately $750 million of capital from Closed Block VA to Corporate and Other Closed Blocks during the fourth quarter of 2014 related to Deferred Tax Assets on Closed Block VA Hedge Losses that were not previously offset by a tax valuation allowance. Effective 12/31/2014, all deferred tax assets related to Closed Block VA Hedge Losses (including those previously offset by a tax valuation allowance) along with deferred tax assets related to Federal NOLs, and Non-Life Subgroup Deferred Losses, net of remaining tax valuation allowances related to Federal NOLs will be reflected in the capital allocated to Corporate and Other Closed Blocks Retirement Investment Insurance VOYA Financial
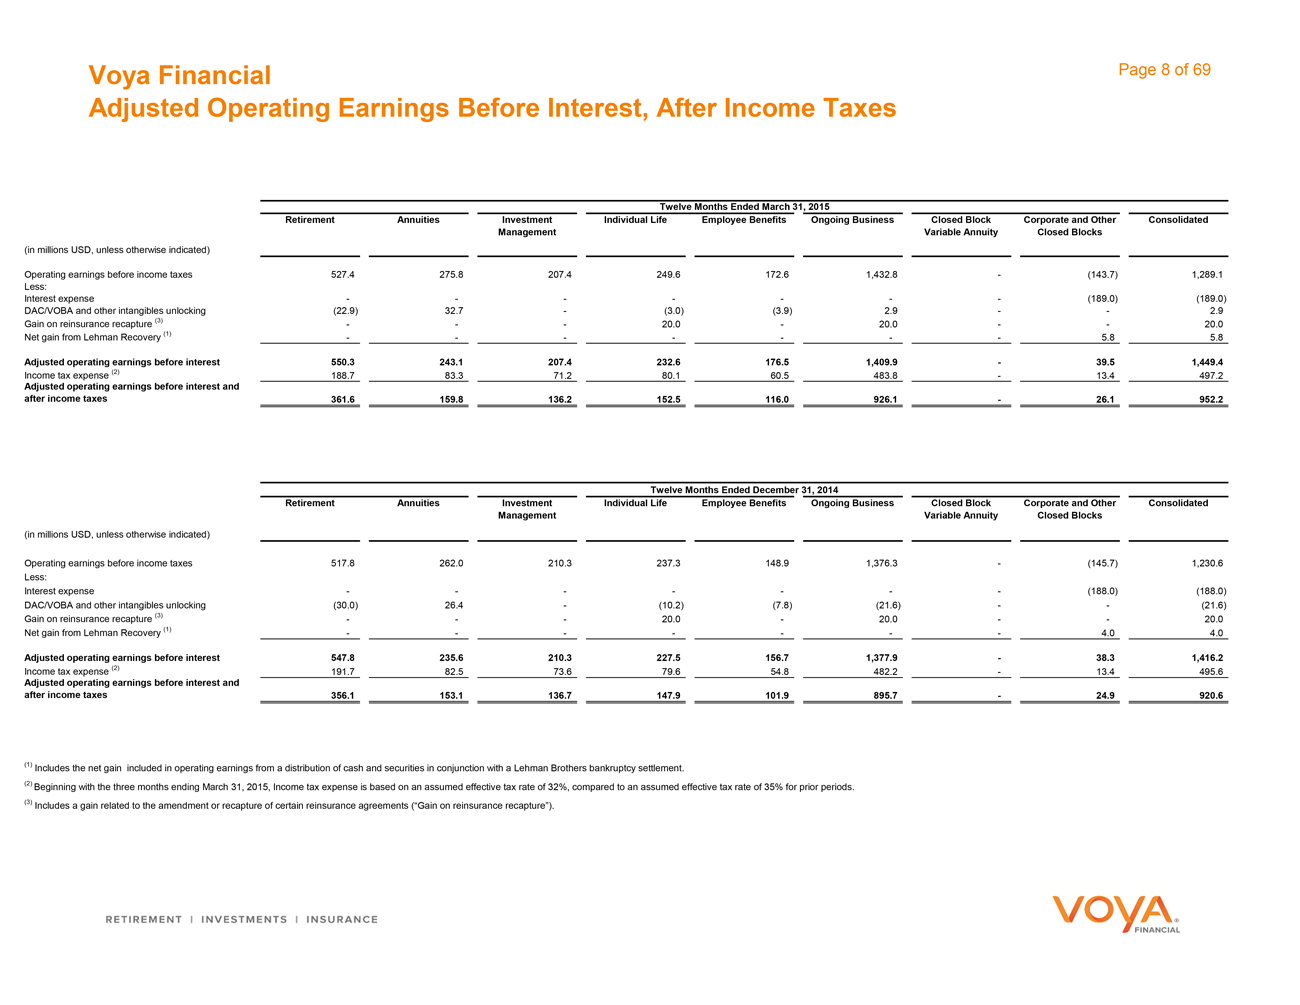
Voya Financial Adjusted Operating Earnings Before Interest, After Income Taxes Page 8 of 69 Twelve Months Ended March 31, 2015 Retirement Annuities Investment Individual Life Employee Benefits Ongoing Business Closed Block Corporate and Other Consolidated Management Variable Annuity Closed Blocks (in millions USD, unless otherwise indicated) Operating earnings before income taxes 527.4 275.8 207.4 249.6 172.6 1,432.8 - (143.7) 1,289.1 Less: Interest expense - - - - - - - (189.0) (189.0) DAC/VOBA and other intangibles unlocking (22.9) 32.7 - (3.0) (3.9) 2.9 - - 2.9 Gain on reinsurance recapture (3) - - - 20.0 - 20.0 - - 20.0 Net gain from Lehman Recovery (1) - - - - - - - 5.8 5.8 Adjusted operating earnings before interest 550.3 243.1 207.4 232.6 176.5 1,409.9 - 39.5 1,449.4 Income tax expense (2) 188.7 83.3 71.2 80.1 60.5 483.8 - 13.4 497.2 Adjusted operating earnings before interest and after income taxes 361.6 159.8 136.2 152.5 116.0 926.1 - 26.1 952.2 Twelve Months Ended December 31, 2014 Retirement Annuities Investment Individual Life Employee Benefits Ongoing Business Closed Block Corporate and Other Consolidated Management Variable Annuity Closed Blocks (in millions USD, unless otherwise indicated) Operating earnings before income taxes 517.8 262.0 210.3 237.3 148.9 1,376.3 - (145.7) 1,230.6 Less: Interest expense - - - - - - - (188.0) (188.0) DAC/VOBA and other intangibles unlocking (30.0) 26.4 - (10.2) (7.8) (21.6) - - (21.6) Gain on reinsurance recapture (3) - - - 20.0 - 20.0 - - 20.0 Net gain from Lehman Recovery (1) - - - - - - - 4.0 4.0 Adjusted operating earnings before interest 547.8 235.6 210.3 227.5 156.7 1,377.9 - 38.3 1,416.2 Income tax expense (2) 191.7 82.5 73.6 79.6 54.8 482.2 - 13.4 495.6 Adjusted operating earnings before interest and after income taxes 356.1 153.1 136.7 147.9 101.9 895.7 - 24.9 920.6 (1) Includes the net gain included in operating earnings from a distribution of cash and securities in conjunction with a Lehman Brothers bankruptcy settlement. (2) Beginning with the three months ending March 31, 2015, Income tax expense is based on an assumed effective tax rate of 32%, compared to an assumed effective tax rate of 35% for prior periods. (3) Includes a gain related to the amendment or recapture of certain reinsurance agreements (“Gain on reinsurance recapture”). Retirement Investment Insurance VOYA Financial
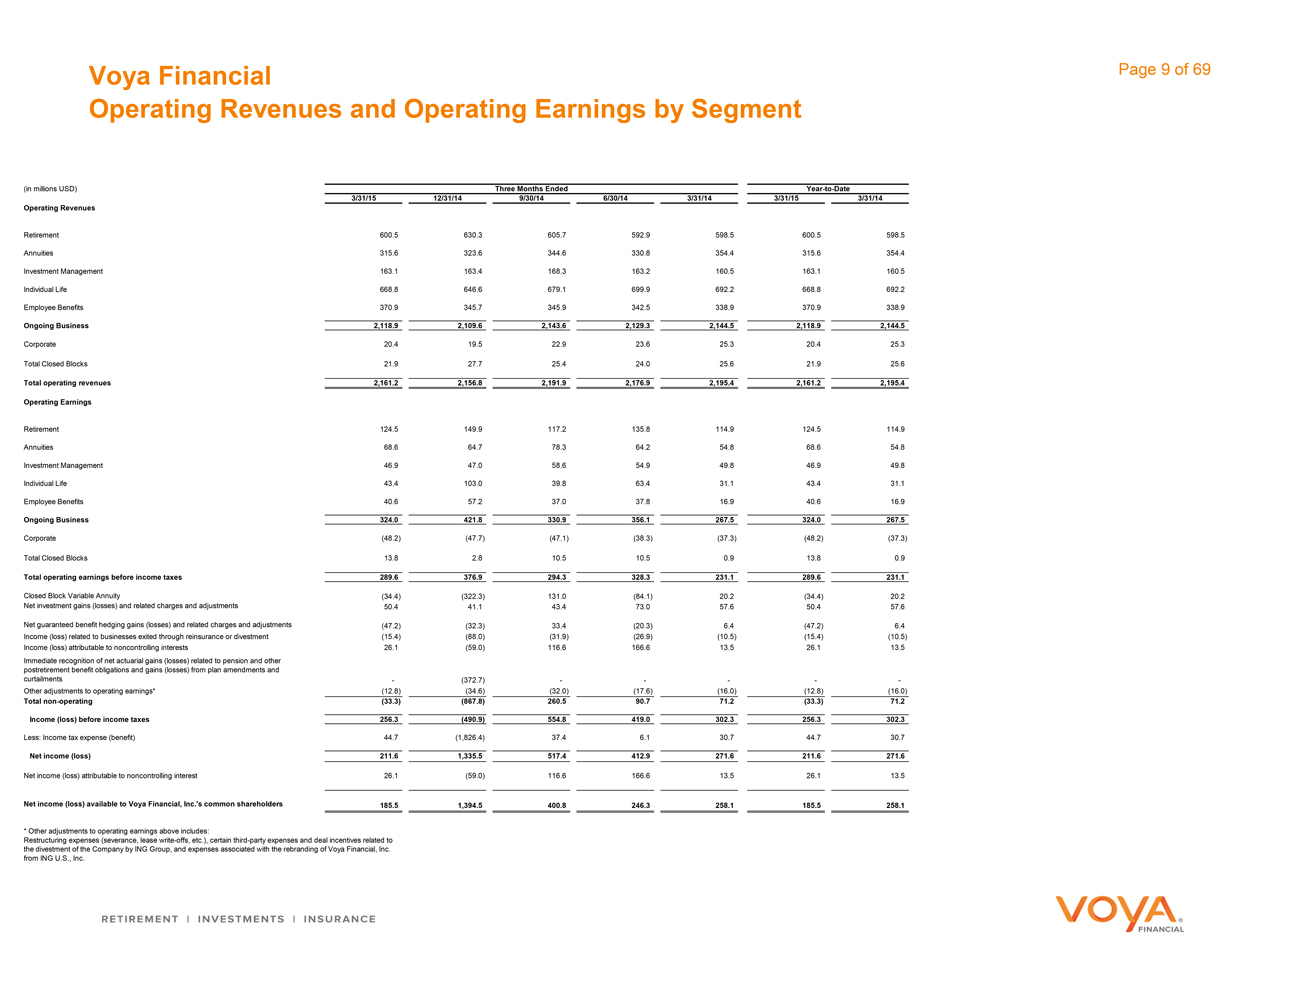
Voya Financial Operating Revenues and Operating Earnings by Segment Page 9 of 69 (in millions USD) Year-to-Date Three Months Ended 3/31/15 12/31/14 9/30/14 6/30/14 3/31/14 3/31/15 3/31/14 Operating Revenues Retirement 600.5 630.3 605.7 592.9 598.5 600.5 598.5 Annuities 315.6 323.6 344.6 330.8 354.4 315.6 354.4 Investment Management 163.1 163.4 168.3 163.2 160.5 163.1 160.5 Individual Life 668.8 646.6 679.1 699.9 692.2 668.8 692.2 Employee Benefits 370.9 345.7 345.9 342.5 338.9 370.9 338.9 Ongoing Business 2,118.9 2,109.6 2,143.6 2,129.3 2,144.5 2,118.9 2,144.5 Corporate 20.4 19.5 22.9 23.6 25.3 20.4 25.3 Total Closed Blocks 21.9 27.7 25.4 24.0 25.6 21.9 25.6 Total operating revenues 2,161.2 2,156.8 2,191.9 2,176.9 2,195.4 2,161.2 2,195.4 Operating Earnings Retirement 124.5 149.9 117.2 135.8 114.9 124.5 114.9 Annuities 68.6 64.7 78.3 64.2 54.8 68.6 54.8 Investment Management 46.9 47.0 58.6 54.9 49.8 46.9 49.8 Individual Life 43.4 103.0 39.8 63.4 31.1 43.4 31.1 Employee Benefits 40.6 57.2 37.0 37.8 16.9 40.6 16.9 Ongoing Business 324.0 421.8 330.9 356.1 267.5 324.0 267.5 Corporate (48.2) (47.7) (47.1) (38.3) (37.3) (48.2) (37.3) Total Closed Blocks 13.8 2.8 10.5 10.5 0.9 13.8 0.9 Total operating earnings before income taxes 289.6 376.9 294.3 328.3 231.1 289.6 231.1 Closed Block Variable Annuity (34.4) (322.3) 131.0 (84.1) 20.2 (34.4) 20.2 Net investment gains (losses) and related charges and adjustments 50.4 41.1 43.4 73.0 57.6 50.4 57.6 Net guaranteed benefit hedging gains (losses) and related charges and adjustments (47.2) (32.3) 33.4 (20.3) 6.4 (47.2) 6.4 Income (loss) related to businesses exited through reinsurance or divestment (15.4) (88.0) (31.9) (26.9) (10.5) (15.4) (10.5) Income (loss) attributable to noncontrolling interests 26.1 (59.0) 116.6 166.6 13.5 26.1 13.5 Immediate recognition of net actuarial gains (losses) related to pension and other postretirement benefit obligations and gains (losses) from plan amendments and curtailments— (372.7) ————— Other adjustments to operating earnings* (12.8) (34.6) (32.0) (17.6) (16.0) (12.8) (16.0) Total non-operating (33.3) (867.8) 260.5 90.7 71.2 (33.3) 71.2 Income (loss) before income taxes 256.3 (490.9) 554.8 419.0 302.3 256.3 302.3 Less: Income tax expense (benefit) 44.7 (1,826.4) 37.4 6.1 30.7 44.7 30.7 Net income (loss) 211.6 1,335.5 517.4 412.9 271.6 211.6 271.6 Net income (loss) attributable to noncontrolling interest 26.1 (59.0) 116.6 166.6 13.5 26.1 13.5 Net income (loss) available to Voya Financial, Inc.‘s common shareholders 185.5 1,394.5 400.8 246.3 258.1 185.5 258.1 * Other adjustments to operating earnings above includes: Restructuring expenses (severance, lease write-offs, etc.), certain third-party expenses and deal incentives related to the divestment of the Company by ING Group, and expenses associated with the rebranding of Voya Financial, Inc. from ING U.S., Inc.
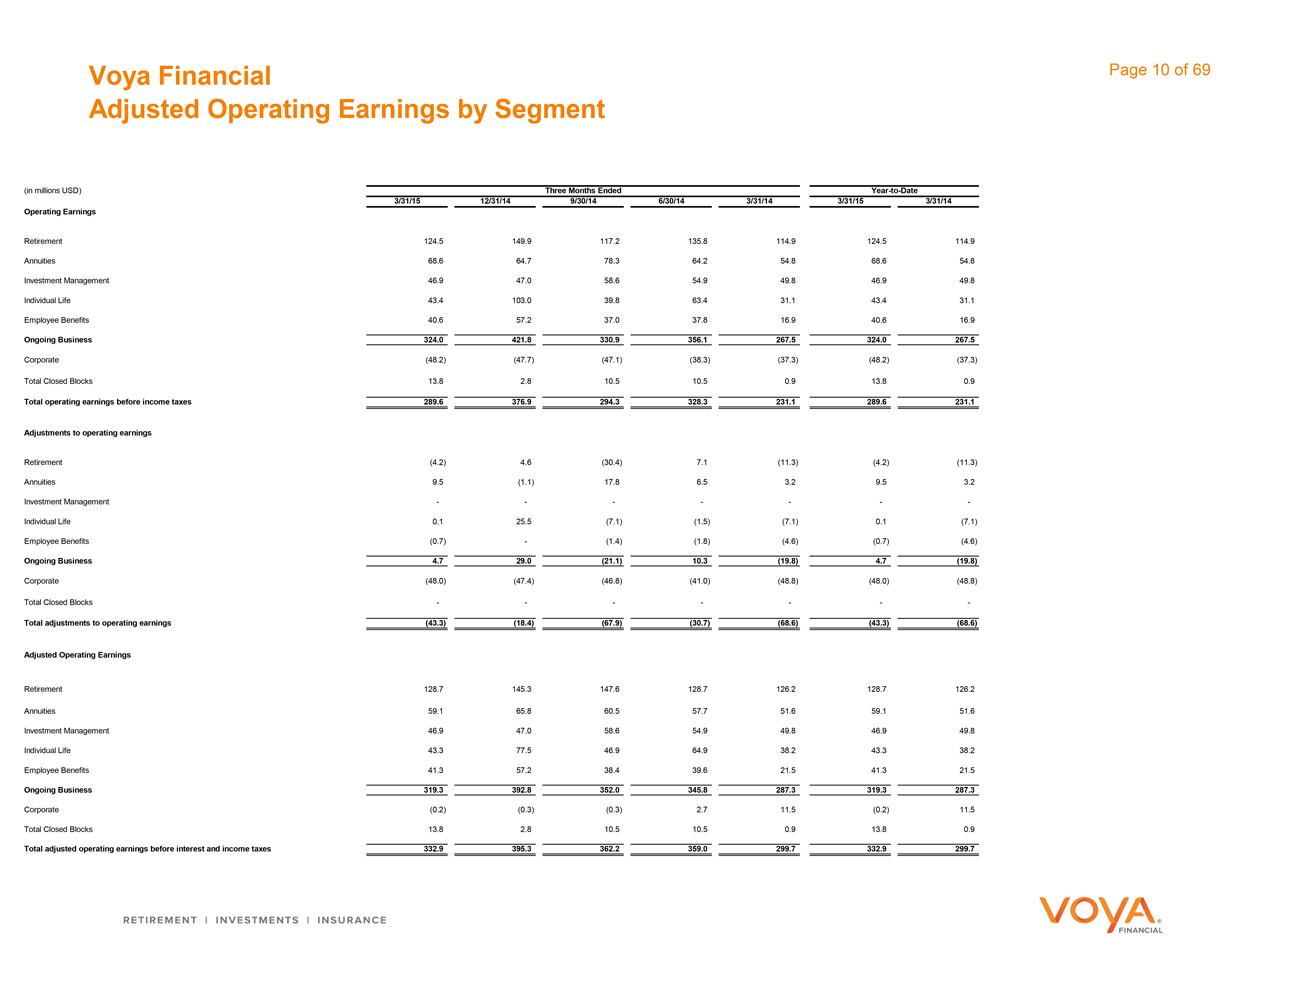
Voya Financial Adjusted Operating Earnings by Segment Page 10 of 69 (in millions USD) Three Months Ended Year-to-Date 3/31/15 12/31/14 9/30/14 6/30/14 3/31/14 3/31/15 3/31/14 Operating Earnings Retirement 124.5 149.9 117.2 135.8 114.9 124.5 114.9 Annuities 68.6 64.7 78.3 64.2 54.8 68.6 54.8 Investment Management 46.9 47.0 58.6 54.9 49.8 46.9 49.8 Individual Life 43.4 103.0 39.8 63.4 31.1 43.4 31.1 Employee Benefits 40.6 57.2 37.0 37.8 16.9 40.6 16.9 Ongoing Business 324.0 421.8 330.9 356.1 267.5 324.0 267.5 Corporate (48.2) (47.7) (47.1) (38.3) (37.3) (48.2) (37.3) Total Closed Blocks 13.8 2.8 10.5 10.5 0.9 13.8 0.9 Total operating earnings before income taxes 289.6 376.9 294.3 328.3 231.1 289.6 231.1 Adjustments to operating earnings Retirement (4.2) 4.6 (30.4) 7.1 (11.3) (4.2) (11.3) Annuities 9.5 (1.1) 17.8 6.5 3.2 9.5 3.2 Investment Management - - - - - - - Individual Life 0.1 25.5 (7.1) (1.5) (7.1) 0.1 (7.1) Employee Benefits (0.7) - (1.4) (1.8) (4.6) (0.7) (4.6) Ongoing Business 4.7 29.0 (21.1) 10.3 (19.8) 4.7 (19.8) Corporate (48.0) (47.4) (46.8) (41.0) (48.8) (48.0) (48.8) Total Closed Blocks - - - - - - - Total adjustments to operating earnings (43.3) (18.4) (67.9) (30.7) (68.6) (43.3) (68.6) Adjusted Operating Earnings Retirement 128.7 145.3 147.6 128.7 126.2 128.7 126.2 Annuities 59.1 65.8 60.5 57.7 51.6 59.1 51.6 Investment Management 46.9 47.0 58.6 54.9 49.8 46.9 49.8 Individual Life 43.3 77.5 46.9 64.9 38.2 43.3 38.2 Employee Benefits 41.3 57.2 38.4 39.6 21.5 41.3 21.5 Ongoing Business 319.3 392.8 352.0 345.8 287.3 319.3 287.3 Corporate (0.2) (0.3) (0.3) 2.7 11.5 (0.2) 11.5 Total Closed Blocks 13.8 2.8 10.5 10.5 0.9 13.8 0.9 Total adjusted operating earnings before interest and income taxes 332.9 395.3 362.2 359.0 299.7 332.9 299.7 Retirement Investment Insurance VOYA Financial
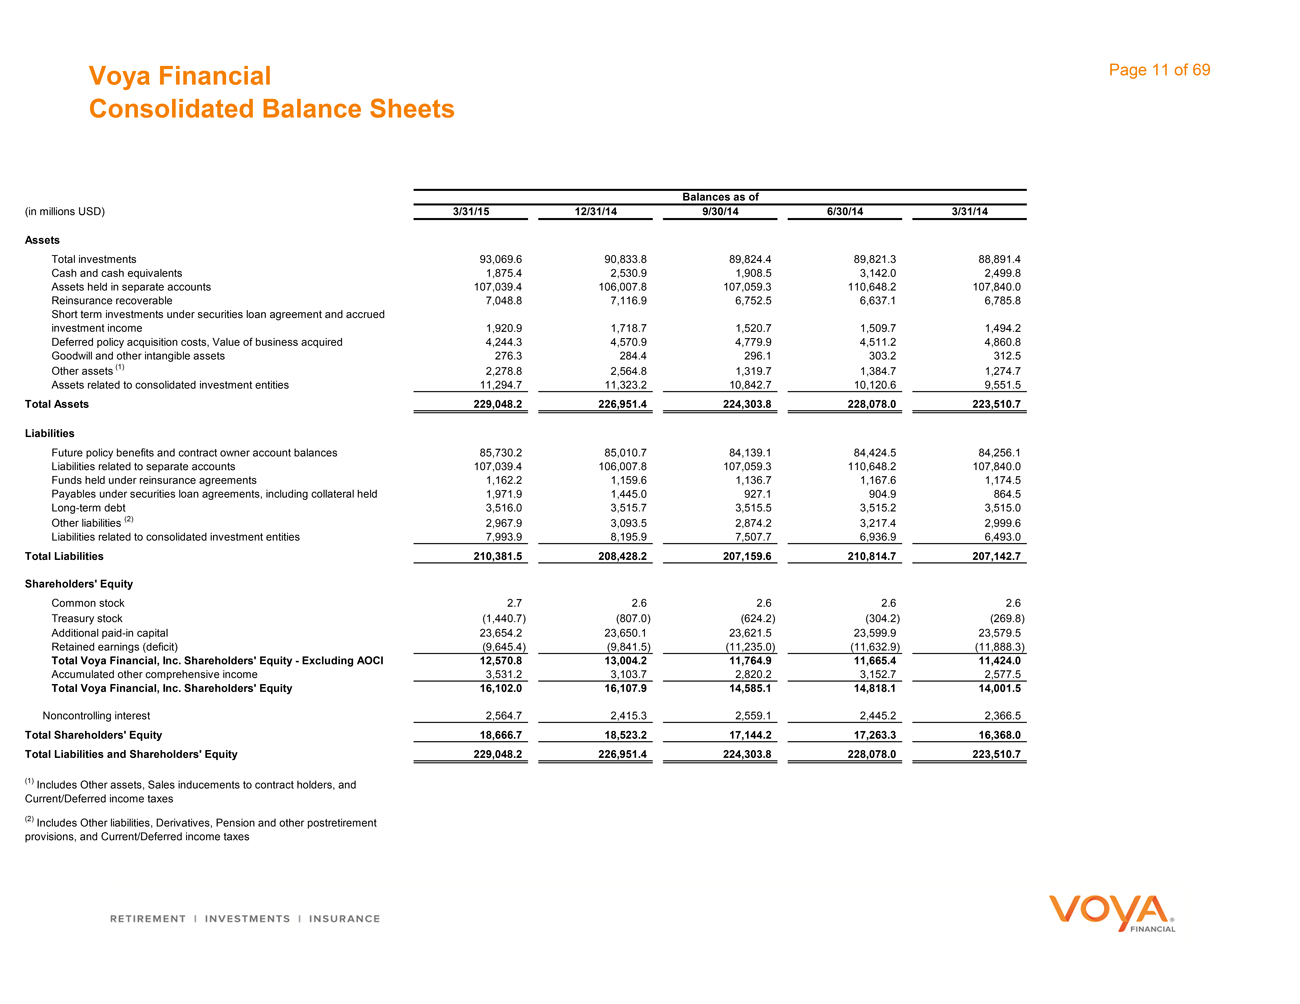
Voya Financial Consolidated Balance Sheets Page 11 of 69 Balances as of (in millions USD) 3/31/15 12/31/14 9/30/14 6/30/14 3/31/14 Assets Total investments 93,069.6 90,833.8 89,824.4 89,821.3 88,891.4 Cash and cash equivalents 1,875.4 2,530.9 1,908.5 3,142.0 2,499.8 Assets held in separate accounts 107,039.4 106,007.8 107,059.3 110,648.2 107,840.0 Reinsurance recoverable 7,048.8 7,116.9 6,752.5 6,637.1 6,785.8 Short term investments under securities loan agreement and accrued investment income 1,920.9 1,718.7 1,520.7 1,509.7 1,494.2 Deferred policy acquisition costs, Value of business acquired 4,244.3 4,570.9 4,779.9 4,511.2 4,860.8 Goodwill and other intangible assets 276.3 284.4 296.1 303.2 312.5 Other assets (1) 2,278.8 2,564.8 1,319.7 1,384.7 1,274.7 Assets related to consolidated investment entities 11,294.7 11,323.2 10,842.7 10,120.6 9,551.5 Total Assets 229,048.2 226,951.4 224,303.8 228,078.0 223,510.7 Liabilities Future policy benefits and contract owner account balances 85,730.2 85,010.7 84,139.1 84,424.5 84,256.1 Liabilities related to separate accounts 107,039.4 106,007.8 107,059.3 110,648.2 107,840.0 Funds held under reinsurance agreements 1,162.2 1,159.6 1,136.7 1,167.6 1,174.5 Payables under securities loan agreements, including collateral held 1,971.9 1,445.0 927.1 904.9 864.5 Long-term debt 3,516.0 3,515.7 3,515.5 3,515.2 3,515.0 Other liabilities (2) 2,967.9 3,093.5 2,874.2 3,217.4 2,999.6 Liabilities related to consolidated investment entities 7,993.9 8,195.9 7,507.7 6,936.9 6,493.0 Total Liabilities 210,381.5 208,428.2 207,159.6 210,814.7 207,142.7 Shareholders’ Equity Common stock 2.7 2.6 2.6 2.6 2.6 Treasury stock (1,440.7) (807.0) (624.2) (304.2) (269.8) Additional paid-in capital 23,654.2 23,650.1 23,621.5 23,599.9 23,579.5 Retained earnings (deficit) (9,645.4) (9,841.5) (11,235.0) (11,632.9) (11,888.3) Total Voya Financial, Inc. Shareholders’ Equity—Excluding AOCI 12,570.8 13,004.2 11,764.9 11,665.4 11,424.0 Accumulated other comprehensive income 3,531.2 3,103.7 2,820.2 3,152.7 2,577.5 Total Voya Financial, Inc. Shareholders’ Equity 16,102.0 16,107.9 14,585.1 14,818.1 14,001.5 Noncontrolling interest 2,564.7 2,415.3 2,559.1 2,445.2 2,366.5 Total Shareholders’ Equity 18,666.7 18,523.2 17,144.2 17,263.3 16,368.0 Total Liabilities and Shareholders’ Equity 229,048.2 226,951.4 224,303.8 228,078.0 223,510.7 (1) Includes Other assets, Sales inducements to contract holders, and Current/Deferred income taxes (2) Includes Other liabilities, Derivatives, Pension and other postretirement provisions, and Current/Deferred income taxes
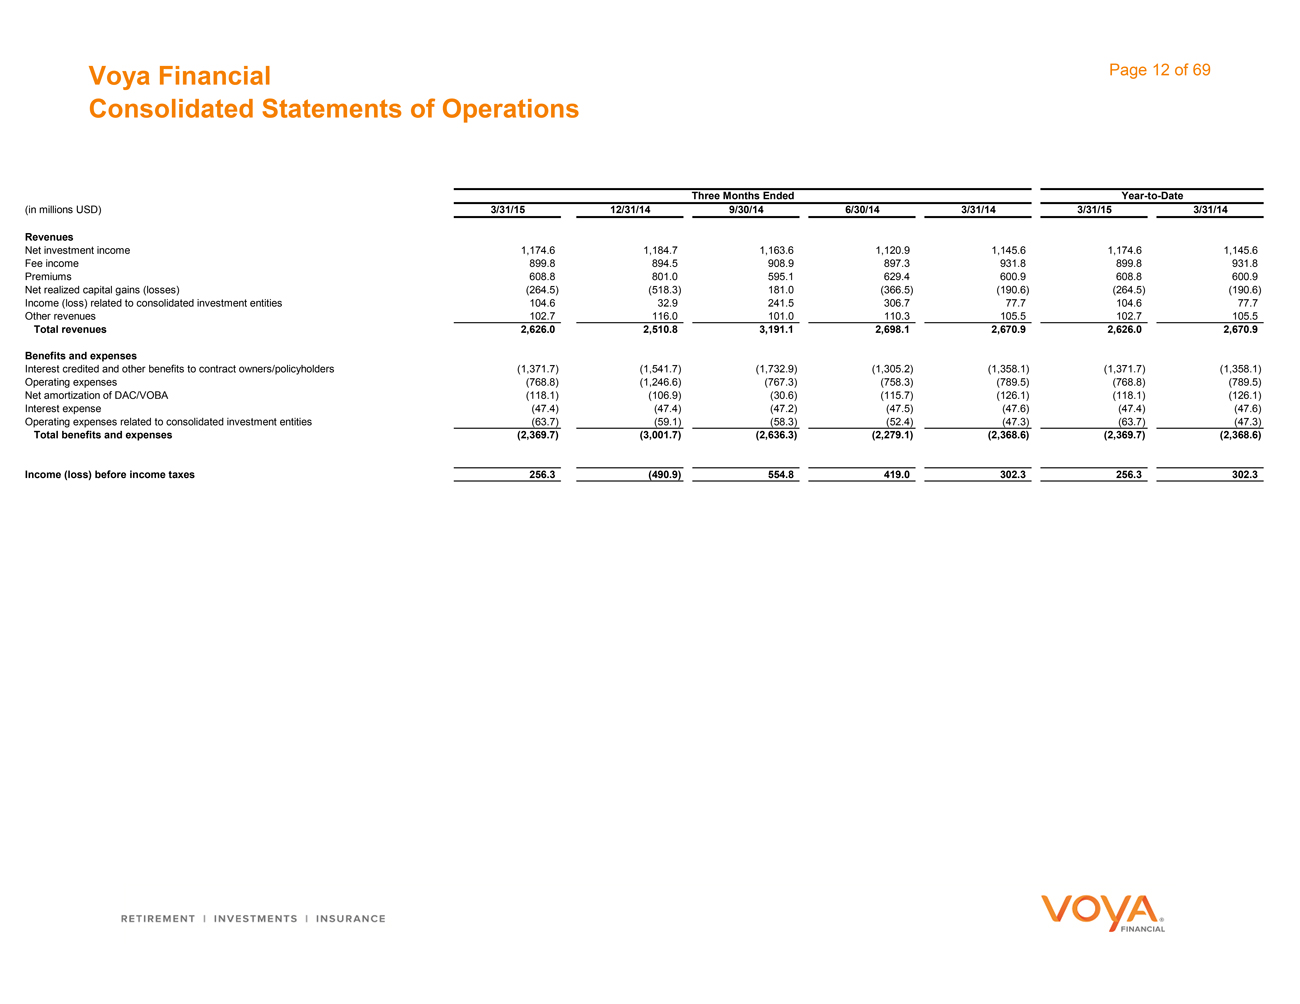
Voya Financial Consolidated Statements of Operations Page 12 of 69 Year-to-Date Three Months Ended (in millions USD) 3/31/15 12/31/14 9/30/14 6/30/14 3/31/14 3/31/15 3/31/14 Revenues Net investment income 1,174.6 1,184.7 1,163.6 1,120.9 1,145.6 1,174.6 1,145.6 Fee income 899.8 894.5 908.9 897.3 931.8 899.8 931.8 Premiums 608.8 801.0 595.1 629.4 600.9 608.8 600.9 Net realized capital gains (losses) (264.5) (518.3) 181.0 (366.5) (190.6) (264.5) (190.6) Income (loss) related to consolidated investment entities 104.6 32.9 241.5 306.7 77.7 104.6 77.7 Other revenues 102.7 116.0 101.0 110.3 105.5 102.7 105.5 Total revenues 2,626.0 2,510.8 3,191.1 2,698.1 2,670.9 2,626.0 2,670.9 Benefits and expenses Interest credited and other benefits to contract owners/policyholders (1,371.7) (1,541.7) (1,732.9) (1,305.2) (1,358.1) (1,371.7) (1,358.1) Operating expenses (768.8) (1,246.6) (767.3) (758.3) (789.5) (768.8) (789.5) Net amortization of DAC/VOBA (118.1) (106.9) (30.6) (115.7) (126.1) (118.1) (126.1) Interest expense (47.4) (47.4) (47.2) (47.5) (47.6) (47.4) (47.6) Operating expenses related to consolidated investment entities (63.7) (59.1) (58.3) (52.4) (47.3) (63.7) (47.3) Total benefits and expenses (2,369.7) (3,001.7) (2,636.3) (2,279.1) (2,368.6) (2,369.7) (2,368.6) Income (loss) before income taxes 256.3 (490.9) 554.8 419.0 302.3 256.3 302.3

Voya Financial Ongoing Business Sources of Operating Earnings Page 13 of 69 Year-to-Date Three Months Ended (in millions USD) 3/31/15 12/31/14 9/30/14 6/30/14 3/31/14 3/31/15 3/31/14 Sources of operating earnings before income taxes: Investment spread and other investment income 388.6 386.9 394.2 361.9 361.9 388.6 361.9 Fee based margin 382.0 403.5 389.8 385.3 381.2 382.0 381.2 Net underwriting gain (loss) and other revenue 191.1 251.0 181.5 219.4 173.6 191.1 173.6 Administrative expenses (429.5) (418.0) (404.1) (417.9) (436.4) (429.5) (436.4) Trail commissions (79.6) (69.0) (73.9) (71.1) (73.7) (79.6) (73.7) DAC/VOBA and other intangibles amortization, excluding unlocking (133.3) (141.6) (135.5) (131.8) (119.3) (133.3) (119.3) DAC/VOBA and other intangibles unlocking 4.7 9.0 (21.1) 10.3 (19.8) 4.7 (19.8) Operating earnings before income taxes 324.0 421.8 330.9 356.1 267.5 324.0 267.5
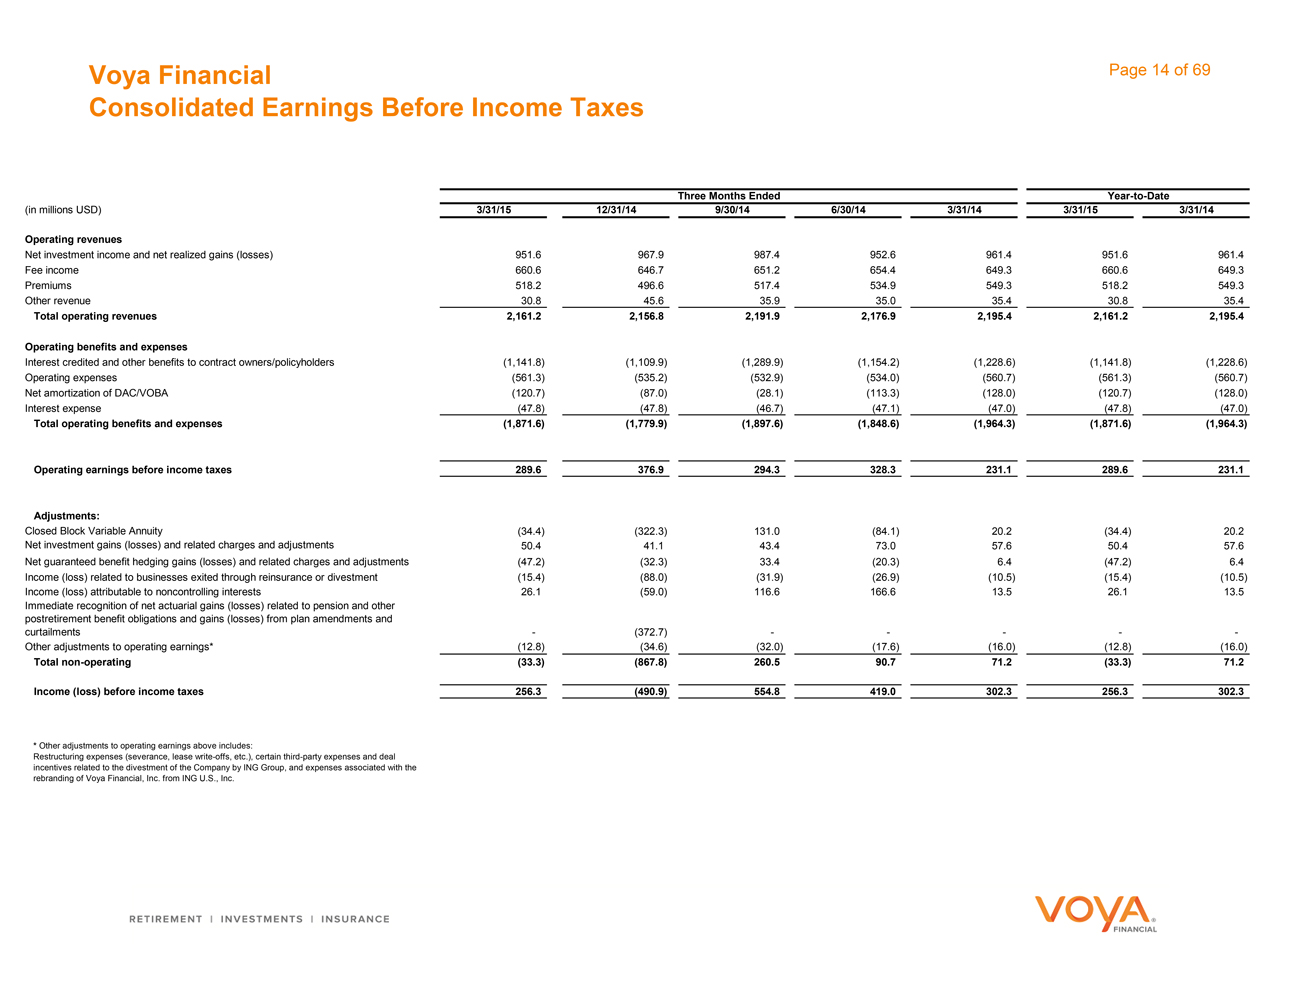
Voya Financial Consolidated Earnings Before Income Taxes Page 14 of 69 Year-to-Date Three Months Ended (in millions USD) 3/31/15 12/31/14 9/30/14 6/30/14 3/31/14 3/31/15 3/31/14 Operating revenues Net investment income and net realized gains (losses) 951.6 967.9 987.4 952.6 961.4 951.6 961.4 Fee income 660.6 646.7 651.2 654.4 649.3 660.6 649.3 Premiums 518.2 496.6 517.4 534.9 549.3 518.2 549.3 Other revenue 30.8 45.6 35.9 35.0 35.4 30.8 35.4 Total operating revenues 2,161.2 2,156.8 2,191.9 2,176.9 2,195.4 2,161.2 2,195.4 Operating benefits and expenses Interest credited and other benefits to contract owners/policyholders (1,141.8) (1,109.9) (1,289.9) (1,154.2) (1,228.6) (1,141.8) (1,228.6) Operating expenses (561.3) (535.2) (532.9) (534.0) (560.7) (561.3) (560.7) Net amortization of DAC/VOBA (120.7) (87.0) (28.1) (113.3) (128.0) (120.7) (128.0) Interest expense (47.8) (47.8) (46.7) (47.1) (47.0) (47.8) (47.0) Total operating benefits and expenses (1,871.6) (1,779.9) (1,897.6) (1,848.6) (1,964.3) (1,871.6) (1,964.3) Operating earnings before income taxes 289.6 376.9 294.3 328.3 231.1 289.6 231.1 Adjustments: Closed Block Variable Annuity (34.4) (322.3) 131.0 (84.1) 20.2 (34.4) 20.2 Net investment gains (losses) and related charges and adjustments 50.4 41.1 43.4 73.0 57.6 50.4 57.6 Net guaranteed benefit hedging gains (losses) and related charges and adjustments (47.2) (32.3) 33.4 (20.3) 6.4 (47.2) 6.4 Income (loss) related to businesses exited through reinsurance or divestment (15.4) (88.0) (31.9) (26.9) (10.5) (15.4) (10.5) Income (loss) attributable to noncontrolling interests 26.1 (59.0) 116.6 166.6 13.5 26.1 13.5 Immediate recognition of net actuarial gains (losses) related to pension and other postretirement benefit obligations and gains (losses) from plan amendments and curtailments— (372.7) ————— Other adjustments to operating earnings* (12.8) (34.6) (32.0) (17.6) (16.0) (12.8) (16.0) Total non-operating (33.3) (867.8) 260.5 90.7 71.2 (33.3) 71.2 Income (loss) before income taxes 256.3 (490.9) 554.8 419.0 302.3 256.3 302.3 * Other adjustments to operating earnings above includes: Restructuring expenses (severance, lease write-offs, etc.), certain third-party expenses and deal incentives related to the divestment of the Company by ING Group, and expenses associated with the rebranding of Voya Financial, Inc. from ING U.S., Inc.
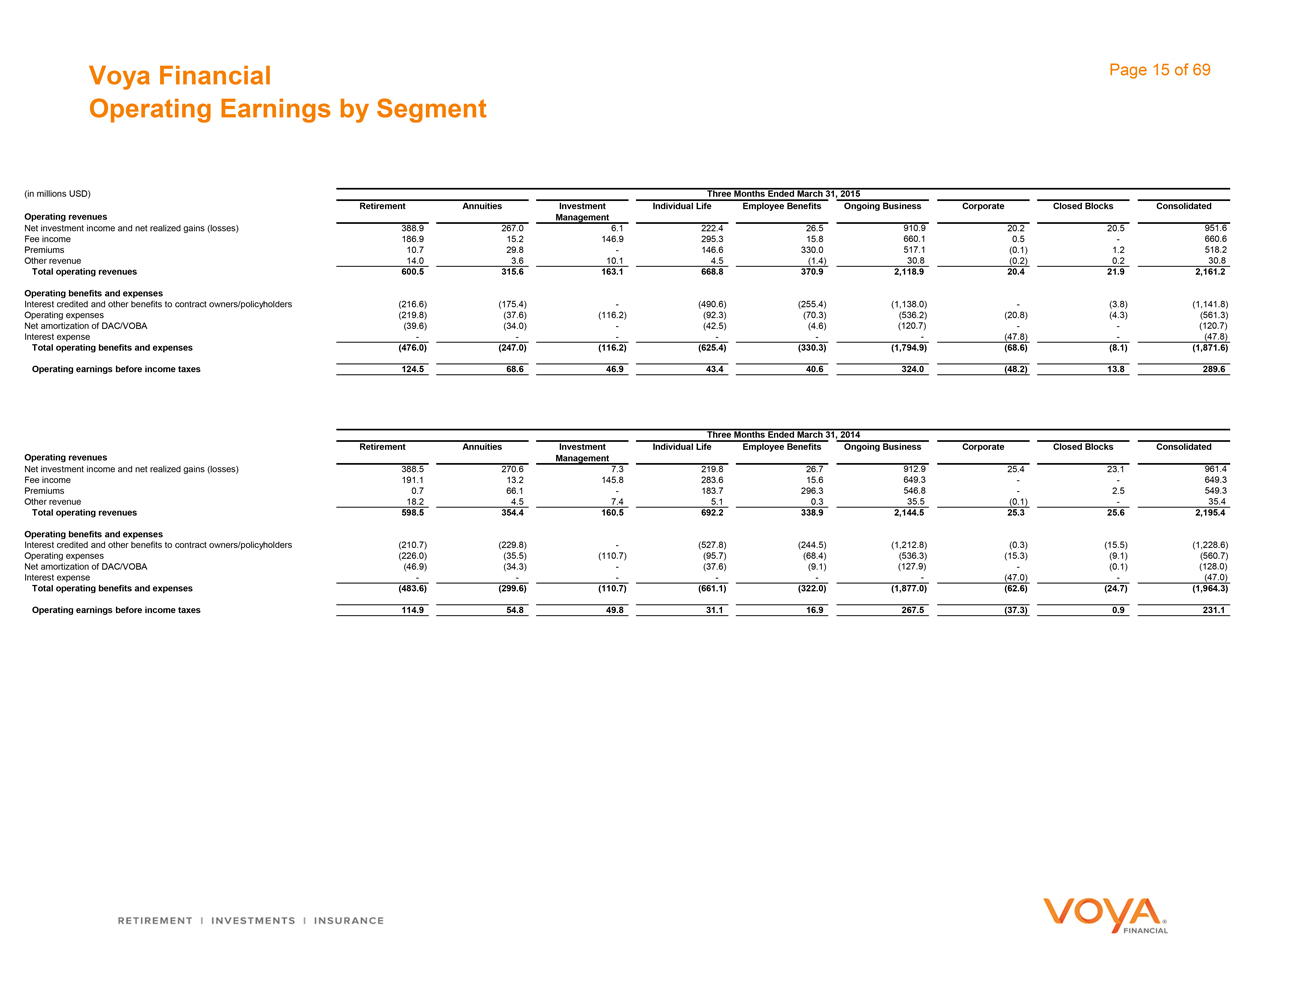
Voya Financial Operating Earnings by Segment Page 15 of 69 (in millions USD) Three Months Ended March 31, 2015 Retirement Annuities Investment Individual Life Employee Benefits Ongoing Business Corporate Closed Blocks Consolidated Operating revenues Management Net investment income and net realized gains (losses) 388.9 267.0 6.1 222.4 26.5 910.9 20.2 20.5 951.6 Fee income 186.9 15.2 146.9 295.3 15.8 660.1 0.5 - 660.6 Premiums 10.7 29.8 - 146.6 330.0 517.1 (0.1) 1.2 518.2 Other revenue 14.0 3.6 10.1 4.5 (1.4) 30.8 (0.2) 0.2 30.8 Total operating revenues 600.5 315.6 163.1 668.8 370.9 2,118.9 20.4 21.9 2,161.2 Operating benefits and expenses Interest credited and other benefits to contract owners/policyholders (216.6) (175.4) - (490.6) (255.4) (1,138.0) - (3.8) (1,141.8) Operating expenses (219.8) (37.6) (116.2) (92.3) (70.3) (536.2) (20.8) (4.3) (561.3) Net amortization of DAC/VOBA (39.6) (34.0) - (42.5) (4.6) (120.7) - - (120.7) Interest expense - - - - - - (47.8) - (47.8) Total operating benefits and expenses (476.0) (247.0) (116.2) (625.4) (330.3) (1,794.9) (68.6) (8.1) (1,871.6) Operating earnings before income taxes 124.5 68.6 46.9 43.4 40.6 324.0 (48.2) 13.8 289.6 Three Months Ended March 31, 2014 Retirement Annuities Investment Individual Life Employee Benefits Ongoing Business Corporate Closed Blocks Consolidated Operating revenues Management Net investment income and net realized gains (losses) 388.5 270.6 7.3 219.8 26.7 912.9 25.4 23.1 961.4 Fee income 191.1 13.2 145.8 283.6 15.6 649.3 - - 649.3 Premiums 0.7 66.1 - 183.7 296.3 546.8 - 2.5 549.3 Other revenue 18.2 4.5 7.4 5.1 0.3 35.5 (0.1) - 35.4 Total operating revenues 598.5 354.4 160.5 692.2 338.9 2,144.5 25.3 25.6 2,195.4 Operating benefits and expenses Interest credited and other benefits to contract owners/policyholders (210.7) (229.8) - (527.8) (244.5) (1,212.8) (0.3) (15.5) (1,228.6) Operating expenses (226.0) (35.5) (110.7) (95.7) (68.4) (536.3) (15.3) (9.1) (560.7) Net amortization of DAC/VOBA (46.9) (34.3) - (37.6) (9.1) (127.9) - (0.1) (128.0) Interest expense - - - - - - (47.0) - (47.0) Total operating benefits and expenses (483.6) (299.6) (110.7) (661.1) (322.0) (1,877.0) (62.6) (24.7) (1,964.3) Operating earnings before income taxes 114.9 54.8 49.8 31.1 16.9 267.5 (37.3) 0.9 231.1 Retirement Investment Insurance VOYA Financial
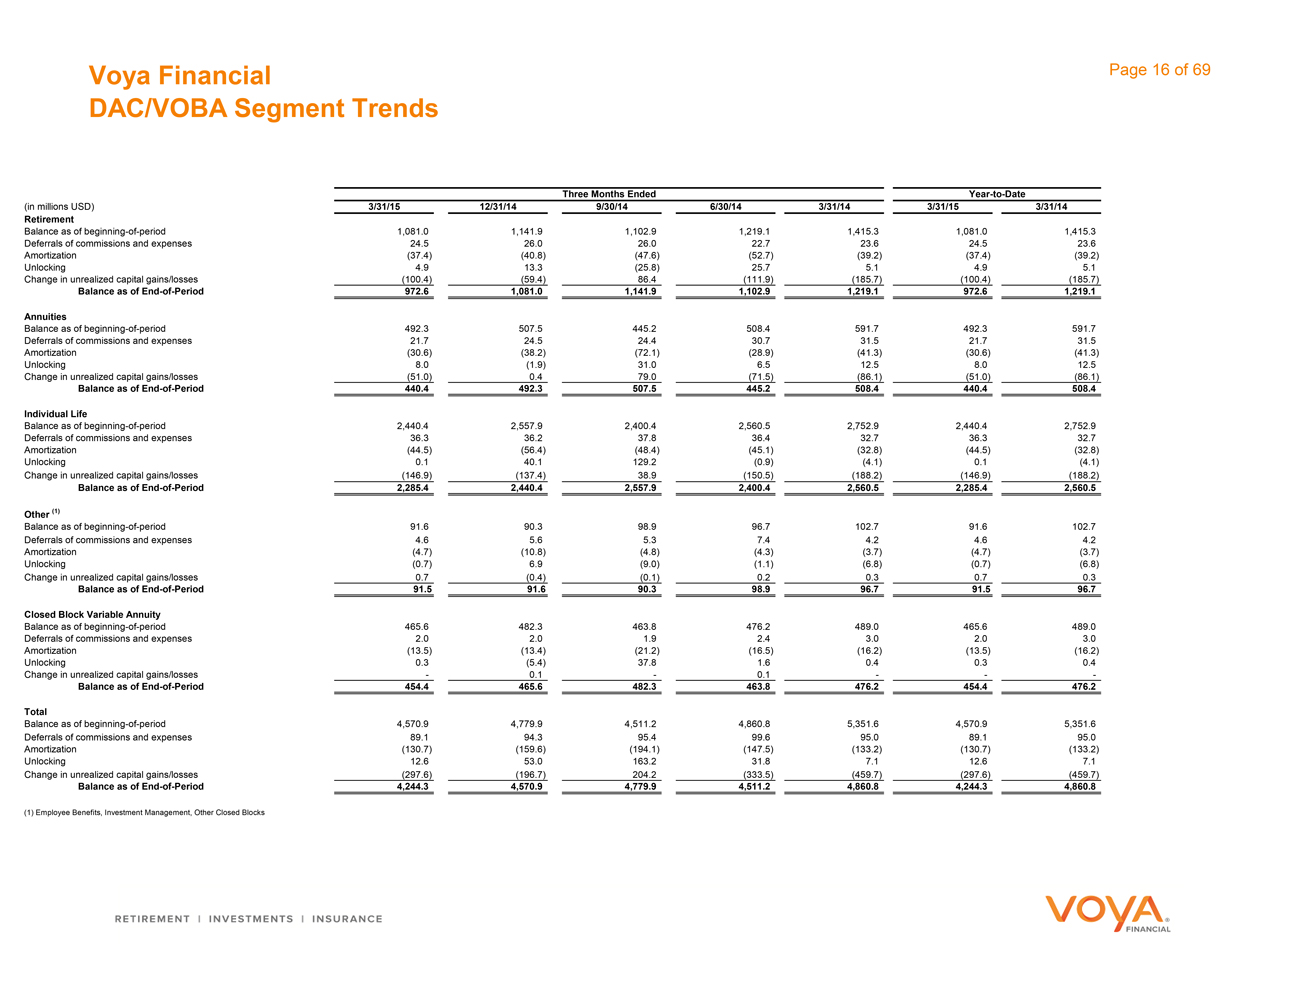
Voya Financial DAC/VOBA Segment Trends Page 16 of 69 Three Months Ended Year-to-Date (in millions USD) 3/31/15 12/31/14 9/30/14 6/30/14 3/31/14 3/31/15 3/31/14 Retirement Balance as of beginning-of-period 1,081.0 1,141.9 1,102.9 1,219.1 1,415.3 1,081.0 1,415.3 Deferrals of commissions and expenses 24.5 26.0 26.0 22.7 23.6 24.5 23.6 Amortization (37.4) (40.8) (47.6) (52.7) (39.2) (37.4) (39.2) Unlocking 4.9 13.3 (25.8) 25.7 5.1 4.9 5.1 Change in unrealized capital gains/losses (100.4) (59.4) 86.4 (111.9) (185.7) (100.4) (185.7) Balance as of End-of-Period 972.6 1,081.0 1,141.9 1,102.9 1,219.1 972.6 1,219.1 Annuities Balance as of beginning-of-period 492.3 507.5 445.2 508.4 591.7 492.3 591.7 Deferrals of commissions and expenses 21.7 24.5 24.4 30.7 31.5 21.7 31.5 Amortization (30.6) (38.2) (72.1) (28.9) (41.3) (30.6) (41.3) Unlocking 8.0 (1.9) 31.0 6.5 12.5 8.0 12.5 Change in unrealized capital gains/losses (51.0) 0.4 79.0 (71.5) (86.1) (51.0) (86.1) Balance as of End-of-Period 440.4 492.3 507.5 445.2 508.4 440.4 508.4 Individual Life Balance as of beginning-of-period 2,440.4 2,557.9 2,400.4 2,560.5 2,752.9 2,440.4 2,752.9 Deferrals of commissions and expenses 36.3 36.2 37.8 36.4 32.7 36.3 32.7 Amortization (44.5) (56.4) (48.4) (45.1) (32.8) (44.5) (32.8) Unlocking 0.1 40.1 129.2 (0.9) (4.1) 0.1 (4.1) Change in unrealized capital gains/losses (146.9) (137.4) 38.9 (150.5) (188.2) (146.9) (188.2) Balance as of End-of-Period 2,285.4 2,440.4 2,557.9 2,400.4 2,560.5 2,285.4 2,560.5 Other (1) Balance as of beginning-of-period 91.6 90.3 98.9 96.7 102.7 91.6 102.7 Deferrals of commissions and expenses 4.6 5.6 5.3 7.4 4.2 4.6 4.2 Amortization (4.7) (10.8) (4.8) (4.3) (3.7) (4.7) (3.7) Unlocking (0.7) 6.9 (9.0) (1.1) (6.8) (0.7) (6.8) Change in unrealized capital gains/losses 0.7 (0.4) (0.1) 0.2 0.3 0.7 0.3 Balance as of End-of-Period 91.5 91.6 90.3 98.9 96.7 91.5 96.7 Closed Block Variable Annuity Balance as of beginning-of-period 465.6 482.3 463.8 476.2 489.0 465.6 489.0 Deferrals of commissions and expenses 2.0 2.0 1.9 2.4 3.0 2.0 3.0 Amortization (13.5) (13.4) (21.2) (16.5) (16.2) (13.5) (16.2) Unlocking 0.3 (5.4) 37.8 1.6 0.4 0.3 0.4 Change in unrealized capital gains/losses — 0.1 — 0.1 ——— Balance as of End-of-Period 454.4 465.6 482.3 463.8 476.2 454.4 476.2 Total Balance as of beginning-of-period 4,570.9 4,779.9 4,511.2 4,860.8 5,351.6 4,570.9 5,351.6 Deferrals of commissions and expenses 89.1 94.3 95.4 99.6 95.0 89.1 95.0 Amortization (130.7) (159.6) (194.1) (147.5) (133.2) (130.7) (133.2) Unlocking 12.6 53.0 163.2 31.8 7.1 12.6 7.1 Change in unrealized capital gains/losses (297.6) (196.7) 204.2 (333.5) (459.7) (297.6) (459.7) Balance as of End-of-Period 4,244.3 4,570.9 4,779.9 4,511.2 4,860.8 4,244.3 4,860.8 (1) Employee Benefits, Investment Management, Other Closed Blocks
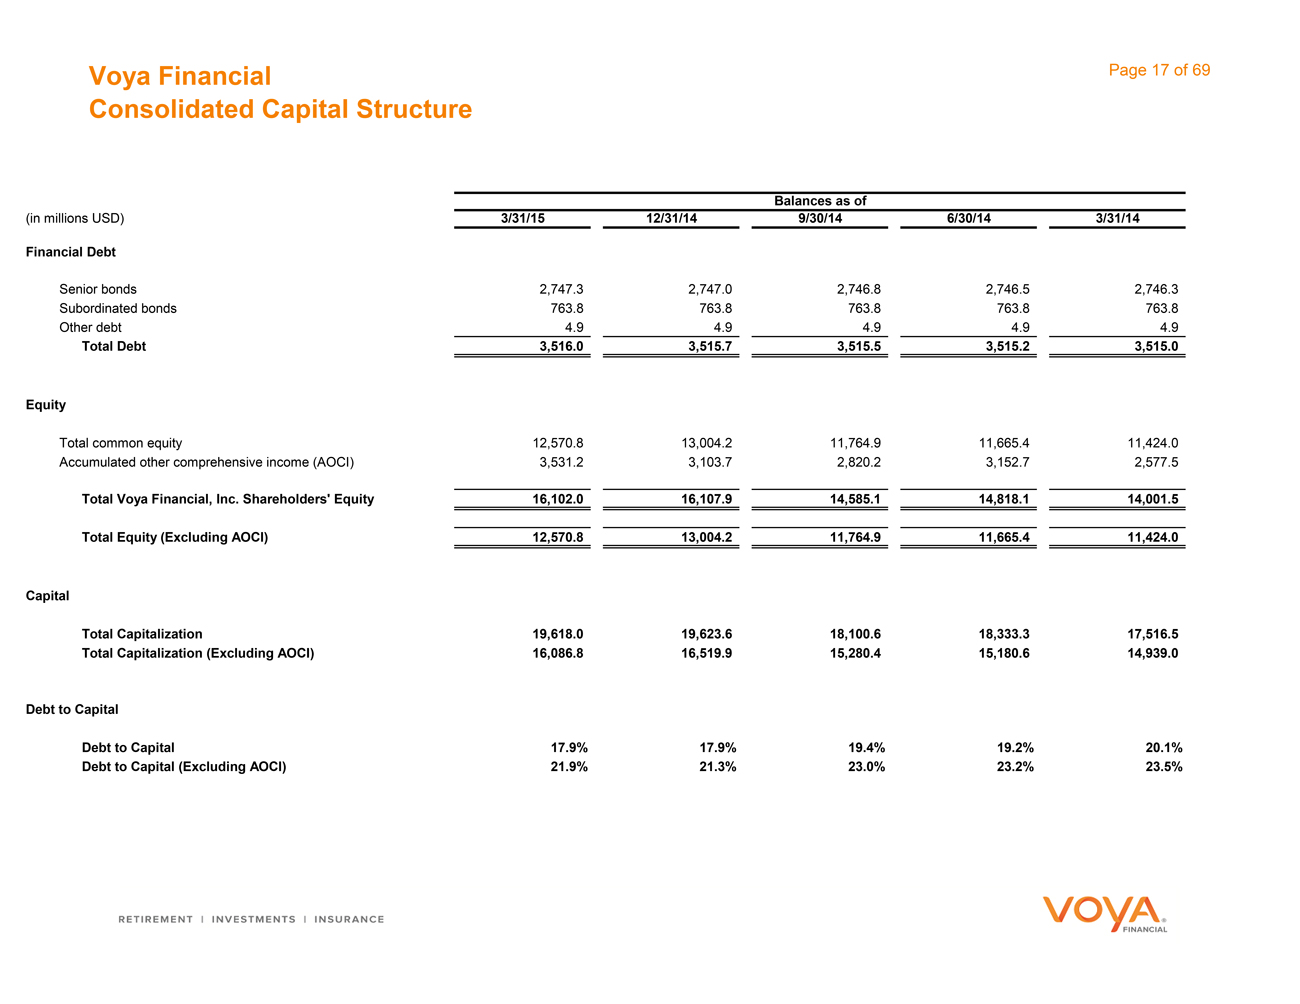
Voya Financial Consolidated Capital Structure Page 17 of 69 Balances as of (in millions USD) 3/31/15 12/31/14 9/30/14 6/30/14 3/31/14 Financial Debt Senior bonds 2,747.3 2,747.0 2,746.8 2,746.5 2,746.3 Subordinated bonds 763.8 763.8 763.8 763.8 763.8 Other debt 4.9 4.9 4.9 4.9 4.9 Total Debt 3,516.0 3,515.7 3,515.5 3,515.2 3,515.0 Equity Total common equity 12,570.8 13,004.2 11,764.9 11,665.4 11,424.0 Accumulated other comprehensive income (AOCI) 3,531.2 3,103.7 2,820.2 3,152.7 2,577.5 Total Voya Financial, Inc. Shareholders’ Equity 16,102.0 16,107.9 14,585.1 14,818.1 14,001.5 Total Equity (Excluding AOCI) 12,570.8 13,004.2 11,764.9 11,665.4 11,424.0 Capital Total Capitalization 19,618.0 19,623.6 18,100.6 18,333.3 17,516.5 Total Capitalization (Excluding AOCI) 16,086.8 16,519.9 15,280.4 15,180.6 14,939.0 Debt to Capital Debt to Capital 17.9% 17.9% 19.4% 19.2% 20.1% Debt to Capital (Excluding AOCI) 21.9% 21.3% 23.0% 23.2% 23.5%
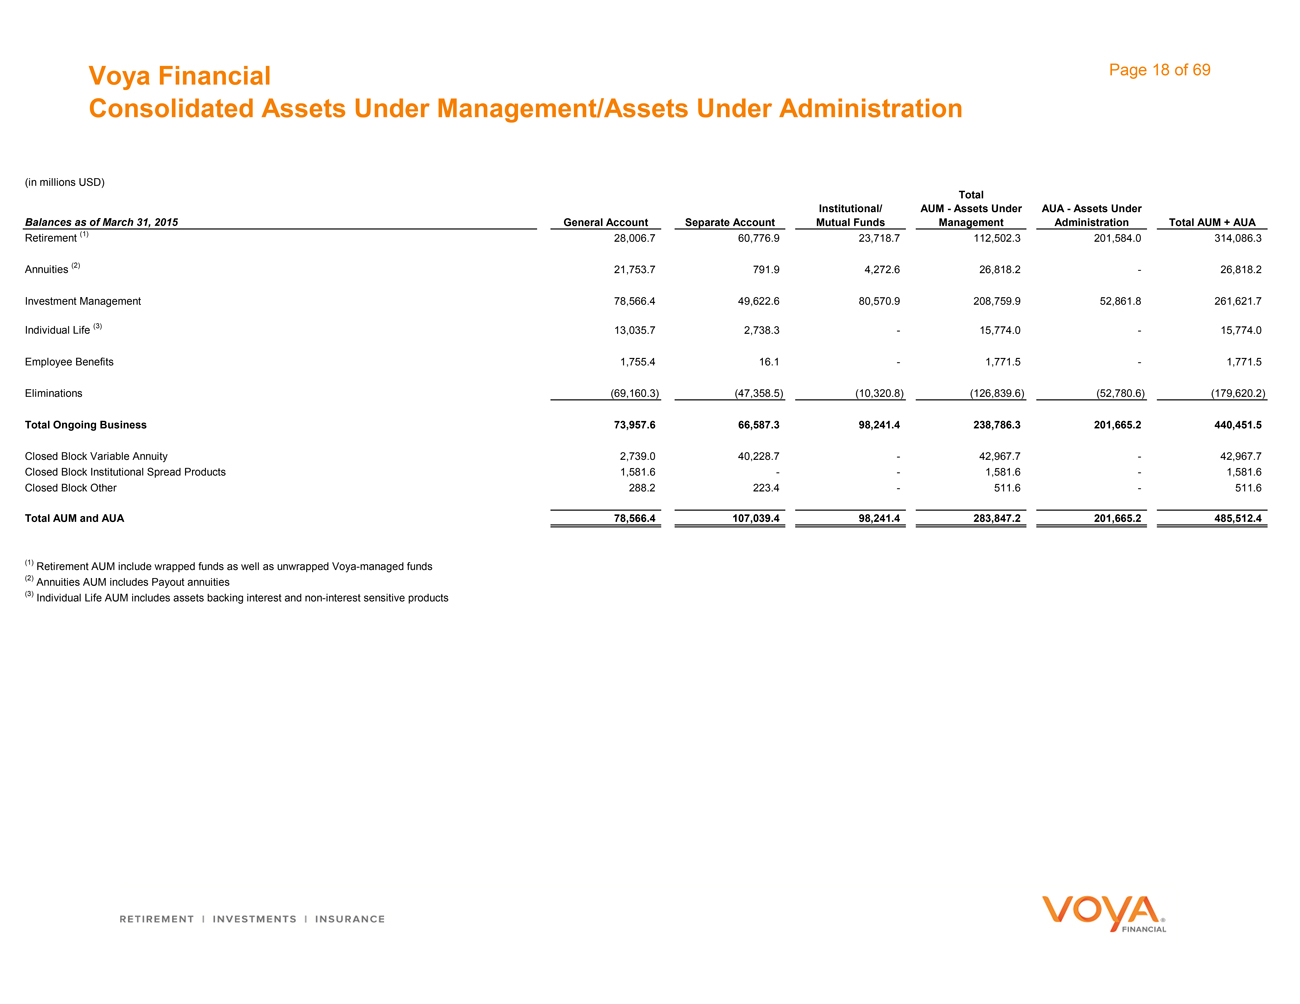
Voya Financial Consolidated Assets Under Management/Assets Under Administration Page 18 of 69 (in millions USD) Balances as of March 31, 2015 General Account Separate Account Institutional/ Mutual Funds Total AUM—Assets Under Management AUA—Assets Under Administration Total AUM + AUA Retirement (1) 28,006.7 60,776.9 23,718.7 112,502.3 201,584.0 314,086.3 Annuities (2) 21,753.7 791.9 4,272.6 26,818.2 — 26,818.2 Investment Management 78,566.4 49,622.6 80,570.9 208,759.9 52,861.8 261,621.7 Individual Life (3) 13,035.7 2,738.3 — 15,774.0 — 15,774.0 Employee Benefits 1,755.4 16.1 — 1,771.5 — 1,771.5 Eliminations (69,160.3) (47,358.5) (10,320.8) (126,839.6) (52,780.6) (179,620.2) Total Ongoing Business 73,957.6 66,587.3 98,241.4 238,786.3 201,665.2 440,451.5 Closed Block Variable Annuity 2,739.0 40,228.7 — 42,967.7 — 42,967.7 Closed Block Institutional Spread Products 1,581.6 —— 1,581.6 — 1,581.6 Closed Block Other 288.2 223.4 — 511.6 — 511.6 Total AUM and AUA 78,566.4 107,039.4 98,241.4 283,847.2 201,665.2 485,512.4 (1) Retirement AUM include wrapped funds as well as unwrapped Voya-managed funds (2) Annuities AUM includes Payout annuities (3) Individual Life AUM includes assets backing interest and non-interest sensitive products

Retirement
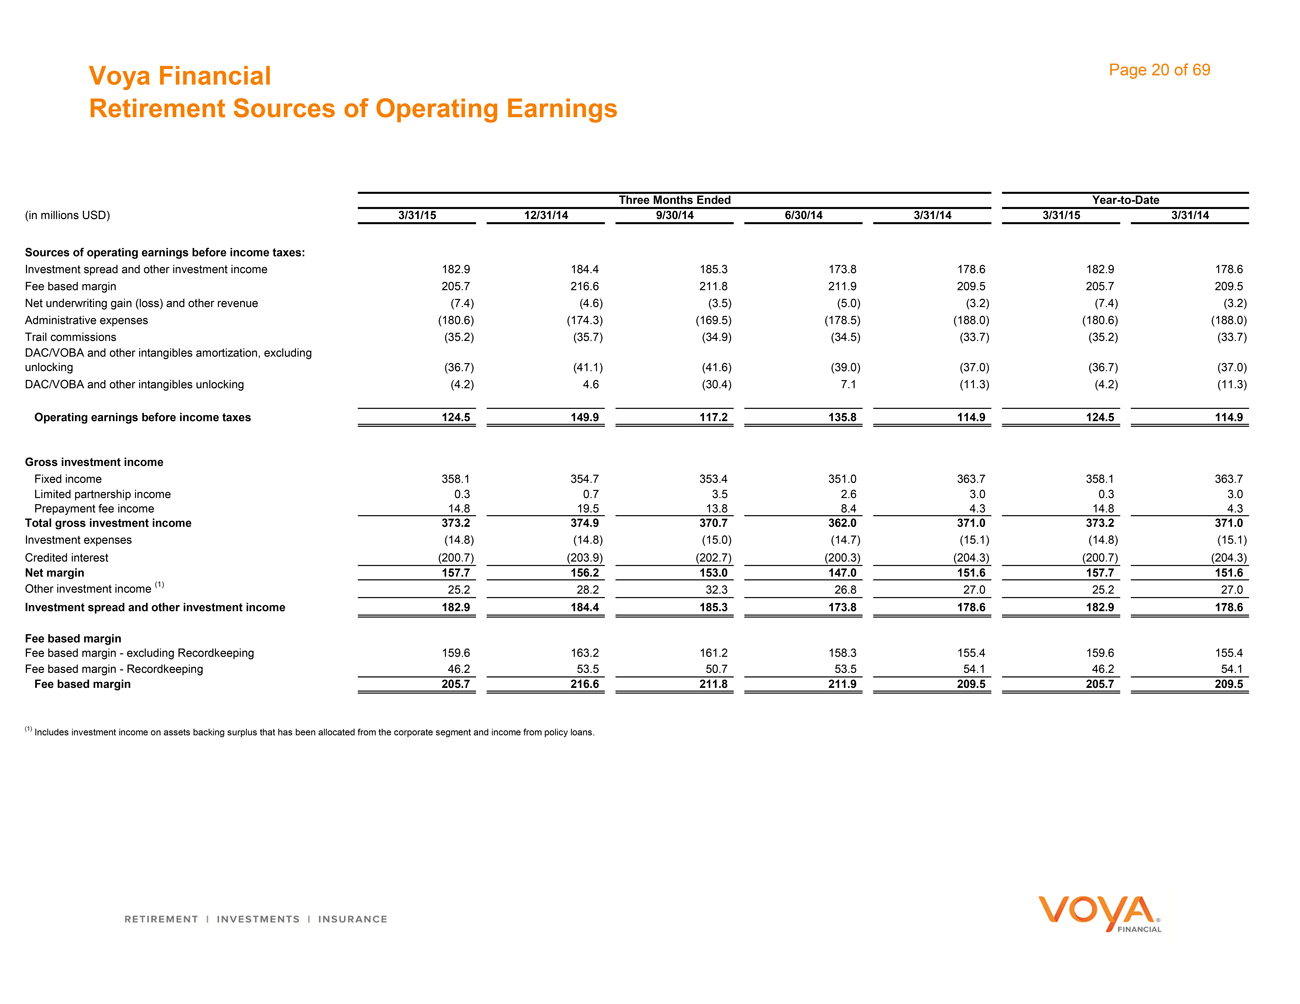
Voya Financial Retirement Sources of Operating Earnings Page 20 of 69 Three Months Ended Year-to-Date (in millions USD) 3/31/15 12/31/14 9/30/14 6/30/14 3/31/14 3/31/15 3/31/14 Sources of operating earnings before income taxes: Investment spread and other investment income 182.9 184.4 185.3 173.8 178.6 182.9 178.6 Fee based margin 205.7 216.6 211.8 211.9 209.5 205.7 209.5 Net underwriting gain (loss) and other revenue (7.4) (4.6) (3.5) (5.0) (3.2) (7.4) (3.2) Administrative expenses (180.6) (174.3) (169.5) (178.5) (188.0) (180.6) (188.0) Trail commissions (35.2) (35.7) (34.9) (34.5) (33.7) (35.2) (33.7) DAC/VOBA and other intangibles amortization, excluding unlocking (36.7) (41.1) (41.6) (39.0) (37.0) (36.7) (37.0) DAC/VOBA and other intangibles unlocking (4.2) 4.6 (30.4) 7.1 (11.3) (4.2) (11.3) Operating earnings before income taxes 124.5 149.9 117.2 135.8 114.9 124.5 114.9 Gross investment income Fixed income 358.1 354.7 353.4 351.0 363.7 358.1 363.7 Limited partnership income 0.3 0.7 3.5 2.6 3.0 0.3 3.0 Prepayment fee income 14.8 19.5 13.8 8.4 4.3 14.8 4.3 Total gross investment income 373.2 374.9 370.7 362.0 371.0 373.2 371.0 Investment expenses (14.8) (14.8) (15.0) (14.7) (15.1) (14.8) (15.1) Credited interest (200.7) (203.9) (202.7) (200.3) (204.3) (200.7) (204.3) Net margin 157.7 156.2 153.0 147.0 151.6 157.7 151.6 Other investment income (1) 25.2 28.2 32.3 26.8 27.0 25.2 27.0 Investment spread and other investment income 182.9 184.4 185.3 173.8 178.6 182.9 178.6 Fee based margin Fee based margin—excluding Recordkeeping 159.6 163.2 161.2 158.3 155.4 159.6 155.4 Fee based margin—Recordkeeping 46.2 53.5 50.7 53.5 54.1 46.2 54.1 Fee based margin 205.7 216.6 211.8 211.9 209.5 205.7 209.5 (1) Includes investment income on assets backing surplus that has been allocated from the corporate segment and income from policy loans.
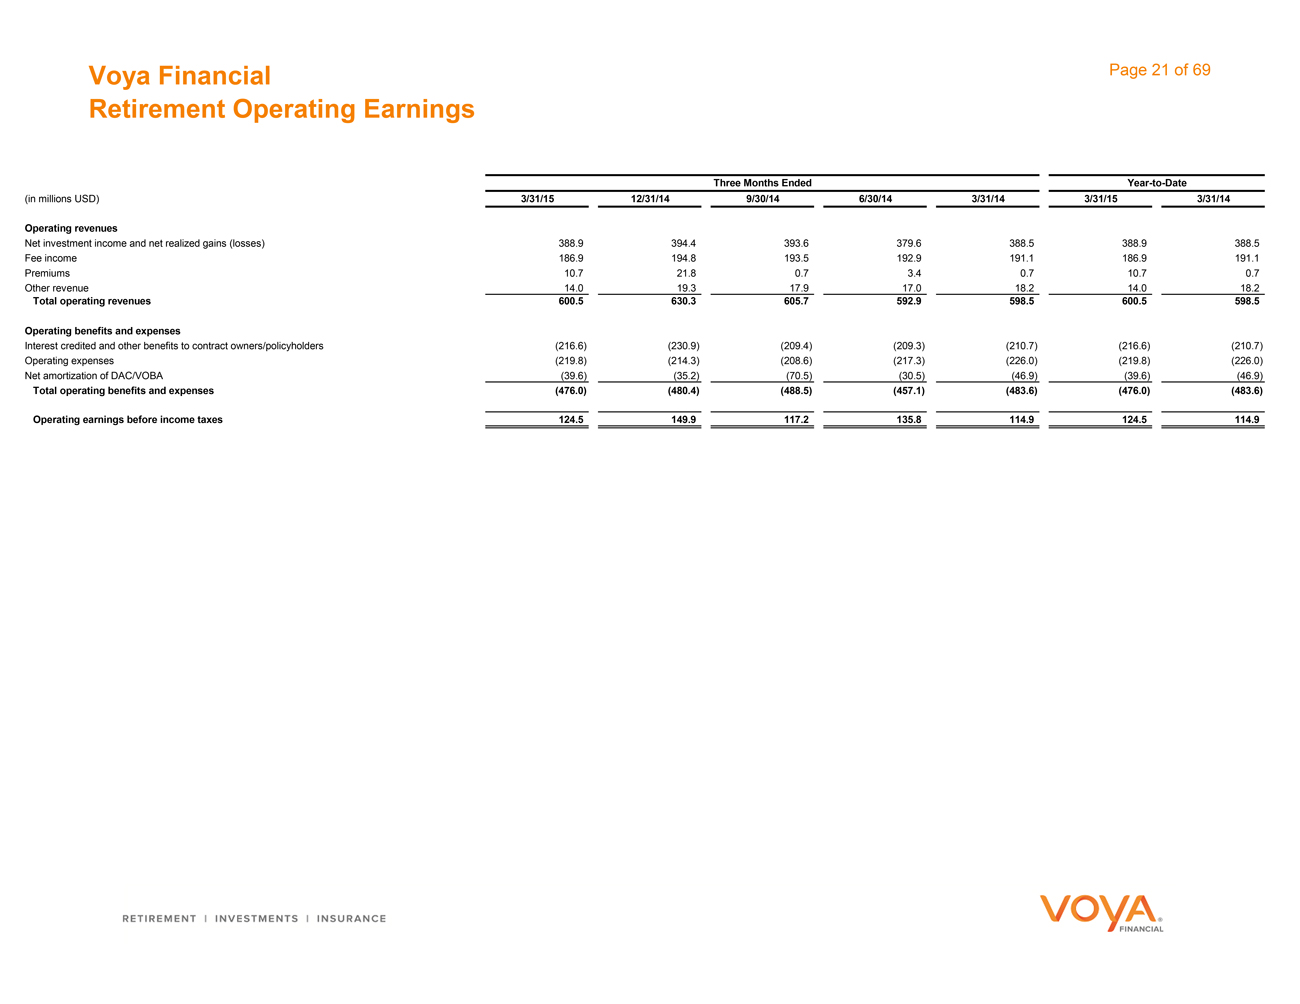
Voya Financial Retirement Operating Earnings Page 21 of 69 Year-to-Date Three Months Ended (in millions USD) 3/31/15 12/31/14 9/30/14 6/30/14 3/31/14 3/31/15 3/31/14 Operating revenues Net investment income and net realized gains (losses) 388.9 394.4 393.6 379.6 388.5 388.9 388.5 Fee income 186.9 194.8 193.5 192.9 191.1 186.9 191.1 Premiums 10.7 21.8 0.7 3.4 0.7 10.7 0.7 Other revenue 14.0 19.3 17.9 17.0 18.2 14.0 18.2 Total operating revenues 600.5 630.3 605.7 592.9 598.5 600.5 598.5 Operating benefits and expenses Interest credited and other benefits to contract owners/policyholders (216.6) (230.9) (209.4) (209.3) (210.7) (216.6) (210.7) Operating expenses (219.8) (214.3) (208.6) (217.3) (226.0) (219.8) (226.0) Net amortization of DAC/VOBA (39.6) (35.2) (70.5) (30.5) (46.9) (39.6) (46.9) Total operating benefits and expenses (476.0) (480.4) (488.5) (457.1) (483.6) (476.0) (483.6) Operating earnings before income taxes 124.5 149.9 117.2 135.8 114.9 124.5 114.9
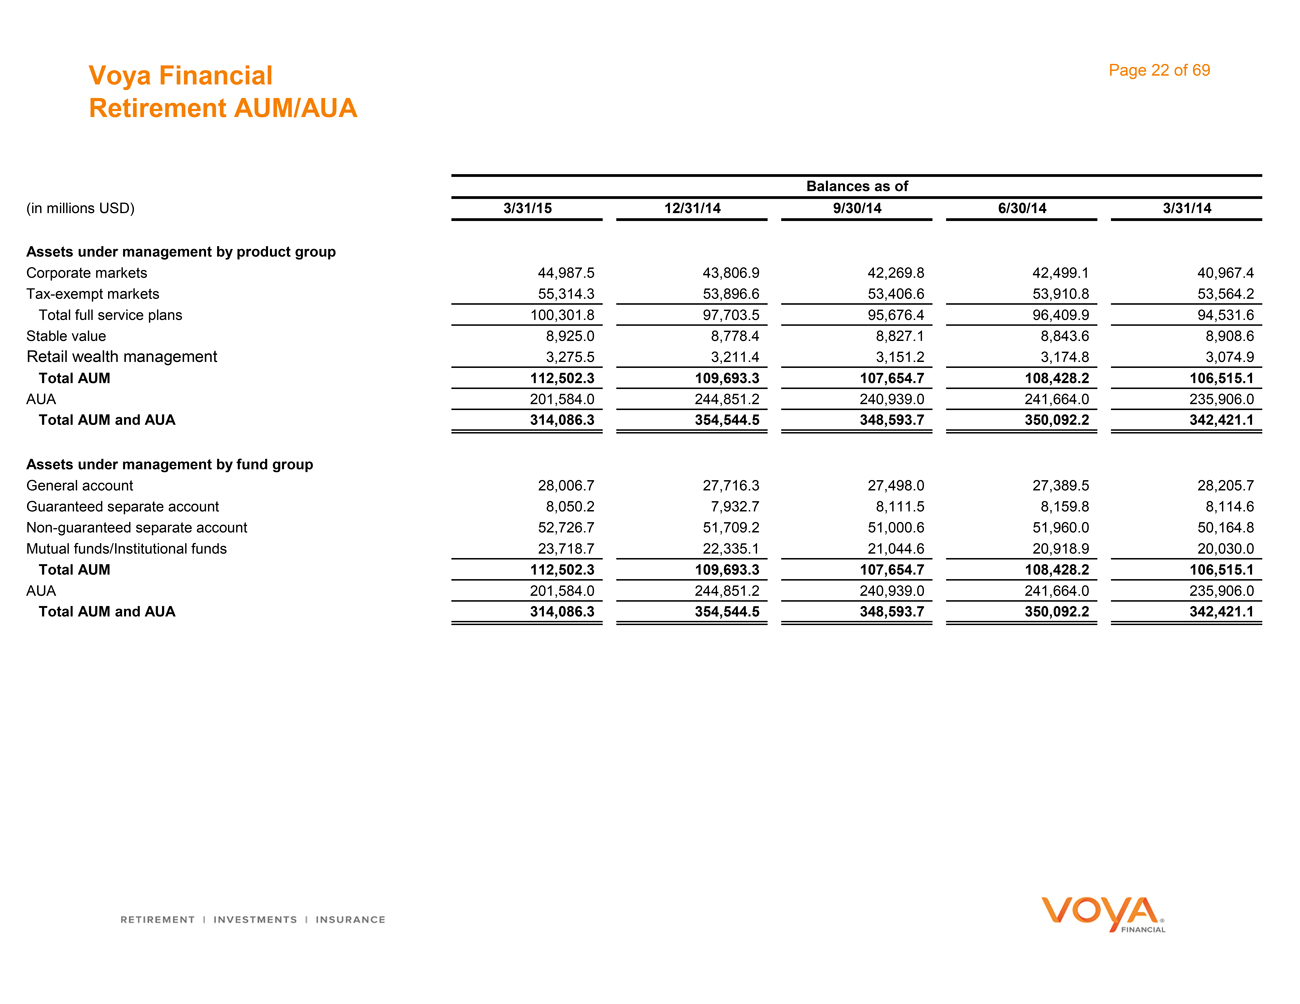
Voya Financial Retirement AUM/AUA Page 22 of 69 Balances as of (in millions USD) 3/31/15 12/31/14 9/30/14 6/30/14 3/31/14 Assets under management by product group Corporate markets 44,987.5 43,806.9 42,269.8 42,499.1 40,967.4 Tax-exempt markets 55,314.3 53,896.6 53,406.6 53,910.8 53,564.2 Total full service plans 100,301.8 97,703.5 95,676.4 96,409.9 94,531.6 Stable value 8,925.0 8,778.4 8,827.1 8,843.6 8,908.6 Retail wealth management 3,275.5 3,211.4 3,151.2 3,174.8 3,074.9 Total AUM 112,502.3 109,693.3 107,654.7 108,428.2 106,515.1 AUA 201,584.0 244,851.2 240,939.0 241,664.0 235,906.0 Total AUM and AUA 314,086.3 354,544.5 348,593.7 350,092.2 342,421.1 Assets under management by fund group General account 28,006.7 27,716.3 27,498.0 27,389.5 28,205.7 Guaranteed separate account 8,050.2 7,932.7 8,111.5 8,159.8 8,114.6 Non-guaranteed separate account 52,726.7 51,709.2 51,000.6 51,960.0 50,164.8 Mutual funds/Institutional funds 23,718.7 22,335.1 21,044.6 20,918.9 20,030.0 Total AUM 112,502.3 109,693.3 107,654.7 108,428.2 106,515.1 AUA 201,584.0 244,851.2 240,939.0 241,664.0 235,906.0 Total AUM and AUA 314,086.3 354,544.5 348,593.7 350,092.2 342,421.1
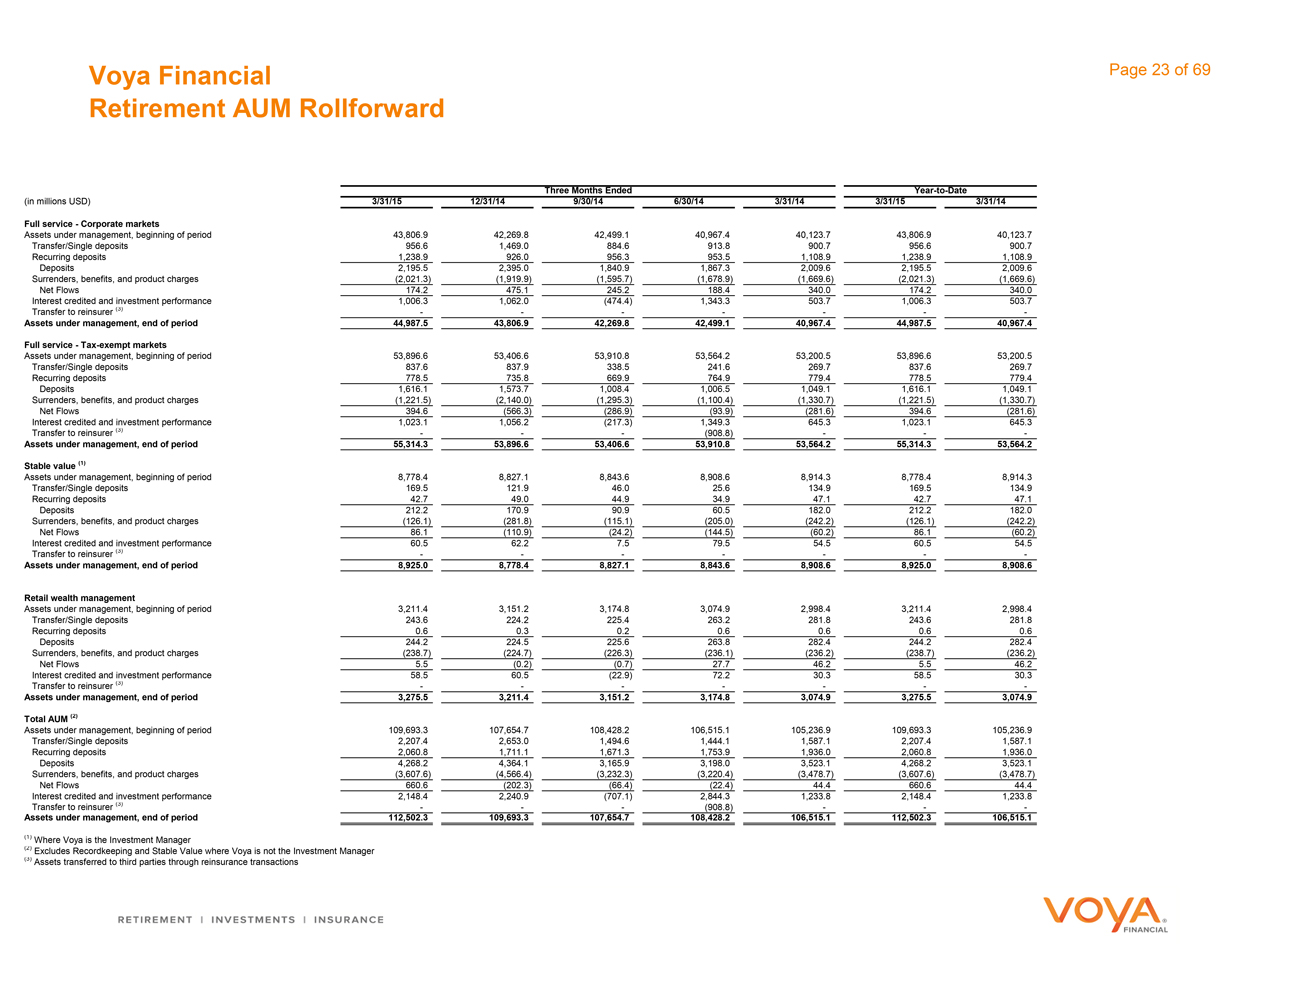
Voya Financial Retirement AUM Rollforward Page 23 of 69 Year-to-Date Three Months Ended (in millions USD) 3/31/15 12/31/14 9/30/14 6/30/14 3/31/14 3/31/15 3/31/14 Full service—Corporate markets Assets under management, beginning of period 43,806.9 42,269.8 42,499.1 40,967.4 40,123.7 43,806.9 40,123.7 Transfer/Single deposits 956.6 1,469.0 884.6 913.8 900.7 956.6 900.7 Recurring deposits 1,238.9 926.0 956.3 953.5 1,108.9 1,238.9 1,108.9 Deposits 2,195.5 2,395.0 1,840.9 1,867.3 2,009.6 2,195.5 2,009.6 Surrenders, benefits, and product charges (2,021.3) (1,919.9) (1,595.7) (1,678.9) (1,669.6) (2,021.3) (1,669.6) Net Flows 174.2 475.1 245.2 188.4 340.0 174.2 340.0 Interest credited and investment performance 1,006.3 1,062.0 (474.4) 1,343.3 503.7 1,006.3 503.7 Transfer to reinsurer (3)——————— Assets under management, end of period 44,987.5 43,806.9 42,269.8 42,499.1 40,967.4 44,987.5 40,967.4 Full service—Tax-exempt markets Assets under management, beginning of period 53,896.6 53,406.6 53,910.8 53,564.2 53,200.5 53,896.6 53,200.5 Transfer/Single deposits 837.6 837.9 338.5 241.6 269.7 837.6 269.7 Recurring deposits 778.5 735.8 669.9 764.9 779.4 778.5 779.4 Deposits 1,616.1 1,573.7 1,008.4 1,006.5 1,049.1 1,616.1 1,049.1 Surrenders, benefits, and product charges (1,221.5) (2,140.0) (1,295.3) (1,100.4) (1,330.7) (1,221.5) (1,330.7) Net Flows 394.6 (566.3) (286.9) (93.9) (281.6) 394.6 (281.6) Interest credited and investment performance 1,023.1 1,056.2 (217.3) 1,349.3 645.3 1,023.1 645.3 Transfer to reinsurer (3)——— (908.8) ——— Assets under management, end of period 55,314.3 53,896.6 53,406.6 53,910.8 53,564.2 55,314.3 53,564.2 Stable value (1) Assets under management, beginning of period 8,778.4 8,827.1 8,843.6 8,908.6 8,914.3 8,778.4 8,914.3 Transfer/Single deposits 169.5 121.9 46.0 25.6 134.9 169.5 134.9 Recurring deposits 42.7 49.0 44.9 34.9 47.1 42.7 47.1 Deposits 212.2 170.9 90.9 60.5 182.0 212.2 182.0 Surrenders, benefits, and product charges (126.1) (281.8) (115.1) (205.0) (242.2) (126.1) (242.2) Net Flows 86.1 (110.9) (24.2) (144.5) (60.2) 86.1 (60.2) Interest credited and investment performance 60.5 62.2 7.5 79.5 54.5 60.5 54.5 Transfer to reinsurer (3)——————— Assets under management, end of period 8,925.0 8,778.4 8,827.1 8,843.6 8,908.6 8,925.0 8,908.6 Retail wealth management Assets under management, beginning of period 3,211.4 3,151.2 3,174.8 3,074.9 2,998.4 3,211.4 2,998.4 Transfer/Single deposits 243.6 224.2 225.4 263.2 281.8 243.6 281.8 Recurring deposits 0.6 0.3 0.2 0.6 0.6 0.6 0.6 Deposits 244.2 224.5 225.6 263.8 282.4 244.2 282.4 Surrenders, benefits, and product charges (238.7) (224.7) (226.3) (236.1) (236.2) (238.7) (236.2) Net Flows 5.5 (0.2) (0.7) 27.7 46.2 5.5 46.2 Interest credited and investment performance 58.5 60.5 (22.9) 72.2 30.3 58.5 30.3 Transfer to reinsurer (3)——————— Assets under management, end of period 3,275.5 3,211.4 3,151.2 3,174.8 3,074.9 3,275.5 3,074.9 Total AUM (2) Assets under management, beginning of period 109,693.3 107,654.7 108,428.2 106,515.1 105,236.9 109,693.3 105,236.9 Transfer/Single deposits 2,207.4 2,653.0 1,494.6 1,444.1 1,587.1 2,207.4 1,587.1 Recurring deposits 2,060.8 1,711.1 1,671.3 1,753.9 1,936.0 2,060.8 1,936.0 Deposits 4,268.2 4,364.1 3,165.9 3,198.0 3,523.1 4,268.2 3,523.1 Surrenders, benefits, and product charges (3,607.6) (4,566.4) (3,232.3) (3,220.4) (3,478.7) (3,607.6) (3,478.7) Net Flows 660.6 (202.3) (66.4) (22.4) 44.4 660.6 44.4 Interest credited and investment performance 2,148.4 2,240.9 (707.1) 2,844.3 1,233.8 2,148.4 1,233.8 Transfer to reinsurer (3)——— (908.8) ——— Assets under management, end of period 112,502.3 109,693.3 107,654.7 108,428.2 106,515.1 112,502.3 106,515.1 (1) Where Voya is the Investment Manager (2) Excludes Recordkeeping and Stable Value where Voya is not the Investment Manager (3) Assets transferred to third parties through reinsurance transactions

Annuities
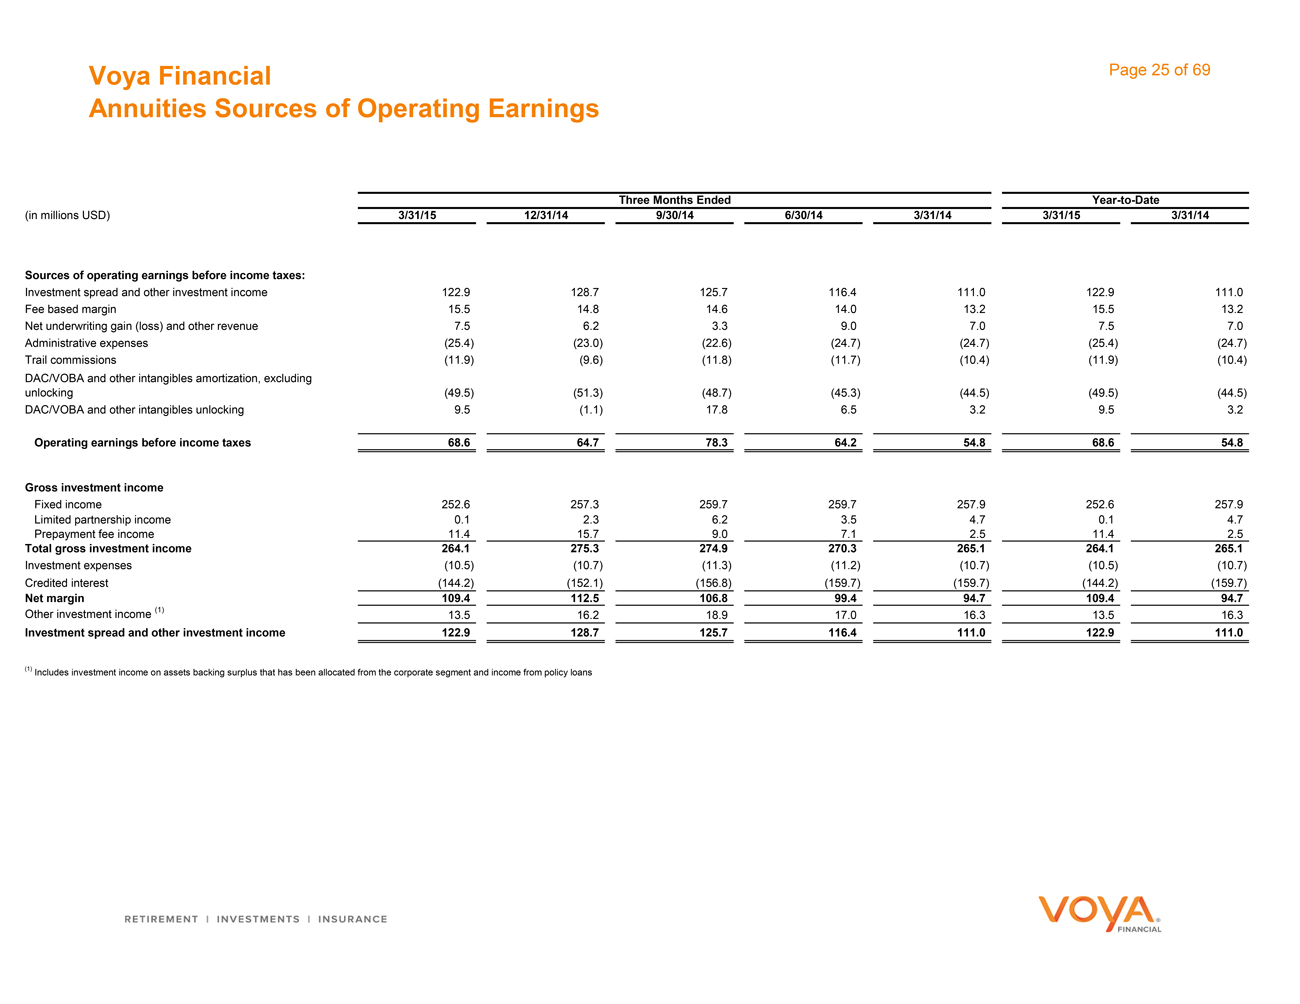
Voya Financial Annuities Sources of Operating Earnings Page 25 of 69 Year-to-Date Three Months Ended (in millions USD) 3/31/15 12/31/14 9/30/14 6/30/14 3/31/14 3/31/15 3/31/14 Sources of operating earnings before income taxes: Investment spread and other investment income 122.9 128.7 125.7 116.4 111.0 122.9 111.0 Fee based margin 15.5 14.8 14.6 14.0 13.2 15.5 13.2 Net underwriting gain (loss) and other revenue 7.5 6.2 3.3 9.0 7.0 7.5 7.0 Administrative expenses (25.4) (23.0) (22.6) (24.7) (24.7) (25.4) (24.7) Trail commissions (11.9) (9.6) (11.8) (11.7) (10.4) (11.9) (10.4) DAC/VOBA and other intangibles amortization, excluding unlocking (49.5) (51.3) (48.7) (45.3) (44.5) (49.5) (44.5) DAC/VOBA and other intangibles unlocking 9.5 (1.1) 17.8 6.5 3.2 9.5 3.2 Operating earnings before income taxes 68.6 64.7 78.3 64.2 54.8 68.6 54.8 Gross investment income Fixed income 252.6 257.3 259.7 259.7 257.9 252.6 257.9 Limited partnership income 0.1 2.3 6.2 3.5 4.7 0.1 4.7 Prepayment fee income 11.4 15.7 9.0 7.1 2.5 11.4 2.5 Total gross investment income 264.1 275.3 274.9 270.3 265.1 264.1 265.1 Investment expenses (10.5) (10.7) (11.3) (11.2) (10.7) (10.5) (10.7) Credited interest (144.2) (152.1) (156.8) (159.7) (159.7) (144.2) (159.7) Net margin 109.4 112.5 106.8 99.4 94.7 109.4 94.7 Other investment income (1) 13.5 16.2 18.9 17.0 16.3 13.5 16.3 Investment spread and other investment income 122.9 128.7 125.7 116.4 111.0 122.9 111.0 (1) Includes investment income on assets backing surplus that has been allocated from the corporate segment and income from policy loans
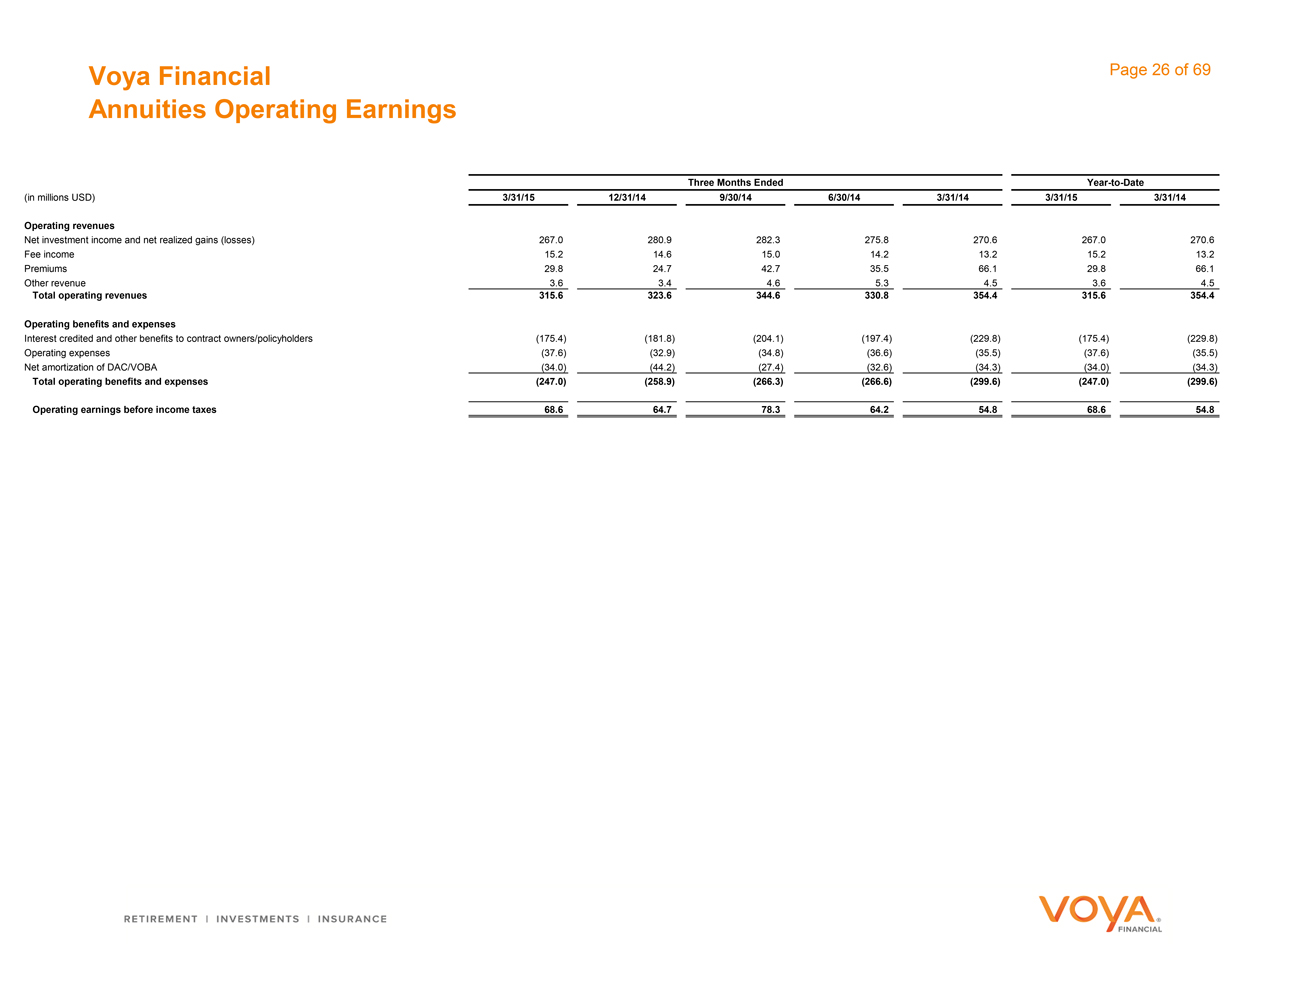
Voya Financial Annuities Operating Earnings Page 26 of 69 Year-to-Date Three Months Ended (in millions USD) 3/31/15 12/31/14 9/30/14 6/30/14 3/31/14 3/31/15 3/31/14 Operating revenues Net investment income and net realized gains (losses) 267.0 280.9 282.3 275.8 270.6 267.0 270.6 Fee income 15.2 14.6 15.0 14.2 13.2 15.2 13.2 Premiums 29.8 24.7 42.7 35.5 66.1 29.8 66.1 Other revenue 3.6 3.4 4.6 5.3 4.5 3.6 4.5 Total operating revenues 315.6 323.6 344.6 330.8 354.4 315.6 354.4 Operating benefits and expenses Interest credited and other benefits to contract owners/policyholders (175.4) (181.8) (204.1) (197.4) (229.8) (175.4) (229.8) Operating expenses (37.6) (32.9) (34.8) (36.6) (35.5) (37.6) (35.5) Net amortization of DAC/VOBA (34.0) (44.2) (27.4) (32.6) (34.3) (34.0) (34.3) Total operating benefits and expenses (247.0) (258.9) (266.3) (266.6) (299.6) (247.0) (299.6) Operating earnings before income taxes 68.6 64.7 78.3 64.2 54.8 68.6 54.8
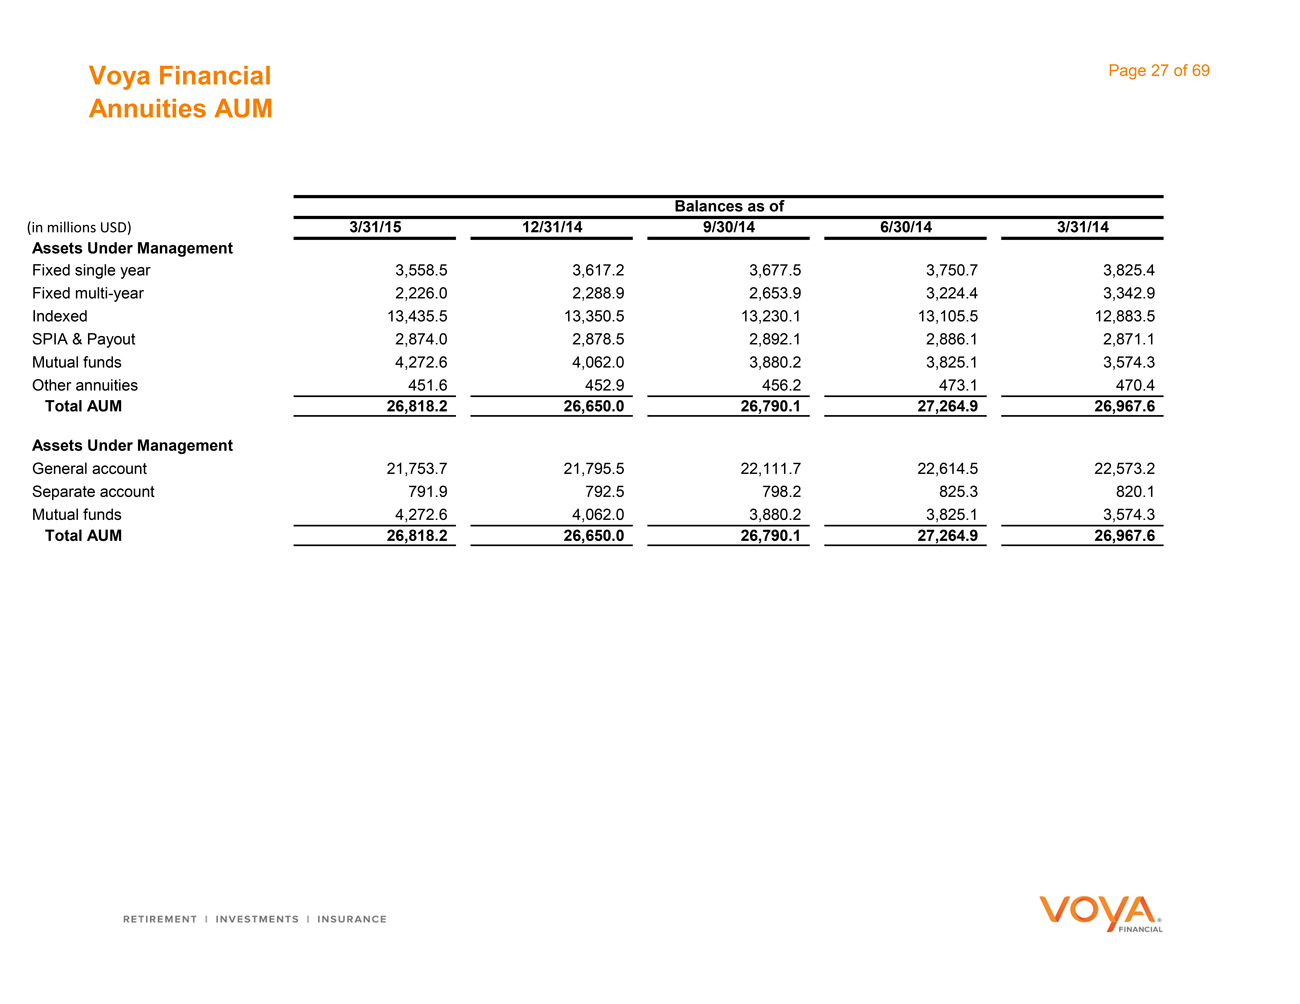
Voya Financial Annuities AUM Page 27 of 69 Balances as of (in millions USD) 3/31/15 12/31/14 9/30/14 6/30/14 3/31/14 Assets Under Management Fixed single year 3,558.5 3,617.2 3,677.5 3,750.7 3,825.4 Fixed multi-year 2,226.0 2,288.9 2,653.9 3,224.4 3,342.9 Indexed 13,435.5 13,350.5 13,230.1 13,105.5 12,883.5 SPIA & Payout 2,874.0 2,878.5 2,892.1 2,886.1 2,871.1 Mutual funds 4,272.6 4,062.0 3,880.2 3,825.1 3,574.3 Other annuities 451.6 452.9 456.2 473.1 470.4 Total AUM 26,818.2 26,650.0 26,790.1 27,264.9 26,967.6 Assets Under Management General account 21,753.7 21,795.5 22,111.7 22,614.5 22,573.2 Separate account 791.9 792.5 798.2 825.3 820.1 Mutual funds 4,272.6 4,062.0 3,880.2 3,825.1 3,574.3 Total AUM 26,818.2 26,650.0 26,790.1 27,264.9 26,967.6
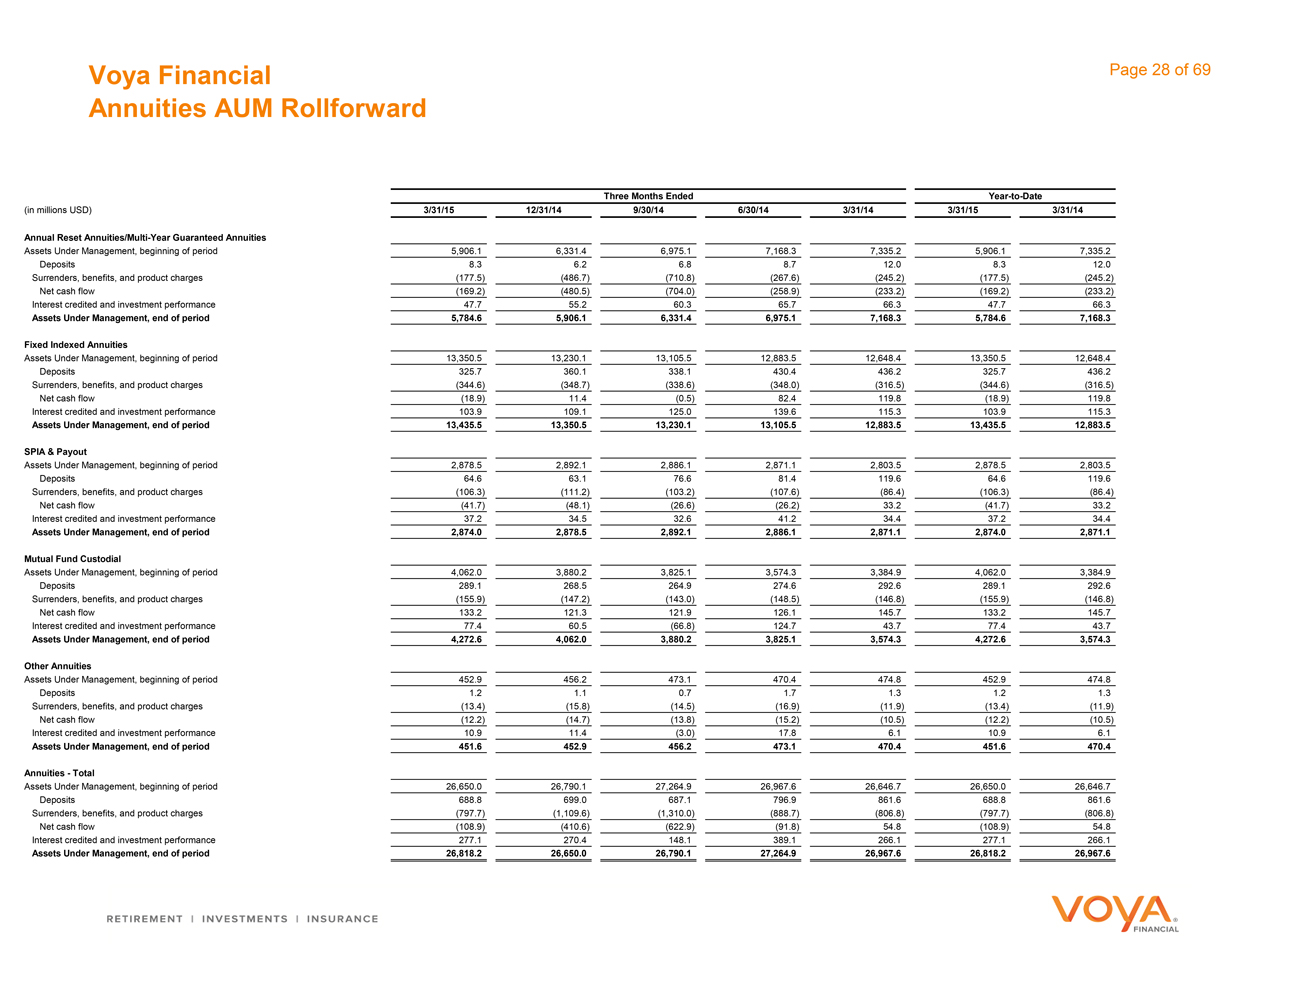
Voya Financial Annuities AUM Rollforward Page 28 of 69 Year-to-Date Three Months Ended (in millions USD) 3/31/15 12/31/14 9/30/14 6/30/14 3/31/14 3/31/15 3/31/14 Annual Reset Annuities/Multi-Year Guaranteed Annuities Assets Under Management, beginning of period 5,906.1 6,331.4 6,975.1 7,168.3 7,335.2 5,906.1 7,335.2 Deposits 8.3 6.2 6.8 8.7 12.0 8.3 12.0 Surrenders, benefits, and product charges (177.5) (486.7) (710.8) (267.6) (245.2) (177.5) (245.2) Net cash flow (169.2) (480.5) (704.0) (258.9) (233.2) (169.2) (233.2) Interest credited and investment performance 47.7 55.2 60.3 65.7 66.3 47.7 66.3 Assets Under Management, end of period 5,784.6 5,906.1 6,331.4 6,975.1 7,168.3 5,784.6 7,168.3 Fixed Indexed Annuities Assets Under Management, beginning of period 13,350.5 13,230.1 13,105.5 12,883.5 12,648.4 13,350.5 12,648.4 Deposits 325.7 360.1 338.1 430.4 436.2 325.7 436.2 Surrenders, benefits, and product charges (344.6) (348.7) (338.6) (348.0) (316.5) (344.6) (316.5) Net cash flow (18.9) 11.4 (0.5) 82.4 119.8 (18.9) 119.8 Interest credited and investment performance 103.9 109.1 125.0 139.6 115.3 103.9 115.3 Assets Under Management, end of period 13,435.5 13,350.5 13,230.1 13,105.5 12,883.5 13,435.5 12,883.5 SPIA & Payout Assets Under Management, beginning of period 2,878.5 2,892.1 2,886.1 2,871.1 2,803.5 2,878.5 2,803.5 Deposits 64.6 63.1 76.6 81.4 119.6 64.6 119.6 Surrenders, benefits, and product charges (106.3) (111.2) (103.2) (107.6) (86.4) (106.3) (86.4) Net cash flow (41.7) (48.1) (26.6) (26.2) 33.2 (41.7) 33.2 Interest credited and investment performance 37.2 34.5 32.6 41.2 34.4 37.2 34.4 Assets Under Management, end of period 2,874.0 2,878.5 2,892.1 2,886.1 2,871.1 2,874.0 2,871.1 Mutual Fund Custodial Assets Under Management, beginning of period 4,062.0 3,880.2 3,825.1 3,574.3 3,384.9 4,062.0 3,384.9 Deposits 289.1 268.5 264.9 274.6 292.6 289.1 292.6 Surrenders, benefits, and product charges (155.9) (147.2) (143.0) (148.5) (146.8) (155.9) (146.8) Net cash flow 133.2 121.3 121.9 126.1 145.7 133.2 145.7 Interest credited and investment performance 77.4 60.5 (66.8) 124.7 43.7 77.4 43.7 Assets Under Management, end of period 4,272.6 4,062.0 3,880.2 3,825.1 3,574.3 4,272.6 3,574.3 Other Annuities Assets Under Management, beginning of period 452.9 456.2 473.1 470.4 474.8 452.9 474.8 Deposits 1.2 1.1 0.7 1.7 1.3 1.2 1.3 Surrenders, benefits, and product charges (13.4) (15.8) (14.5) (16.9) (11.9) (13.4) (11.9) Net cash flow (12.2) (14.7) (13.8) (15.2) (10.5) (12.2) (10.5) Interest credited and investment performance 10.9 11.4 (3.0) 17.8 6.1 10.9 6.1 Assets Under Management, end of period 451.6 452.9 456.2 473.1 470.4 451.6 470.4 Annuities—Total Assets Under Management, beginning of period 26,650.0 26,790.1 27,264.9 26,967.6 26,646.7 26,650.0 26,646.7 Deposits 688.8 699.0 687.1 796.9 861.6 688.8 861.6 Surrenders, benefits, and product charges (797.7) (1,109.6) (1,310.0) (888.7) (806.8) (797.7) (806.8) Net cash flow (108.9) (410.6) (622.9) (91.8) 54.8 (108.9) 54.8 Interest credited and investment performance 277.1 270.4 148.1 389.1 266.1 277.1 266.1 Assets Under Management, end of period 26,818.2 26,650.0 26,790.1 27,264.9 26,967.6 26,818.2 26,967.6
 Investment Management
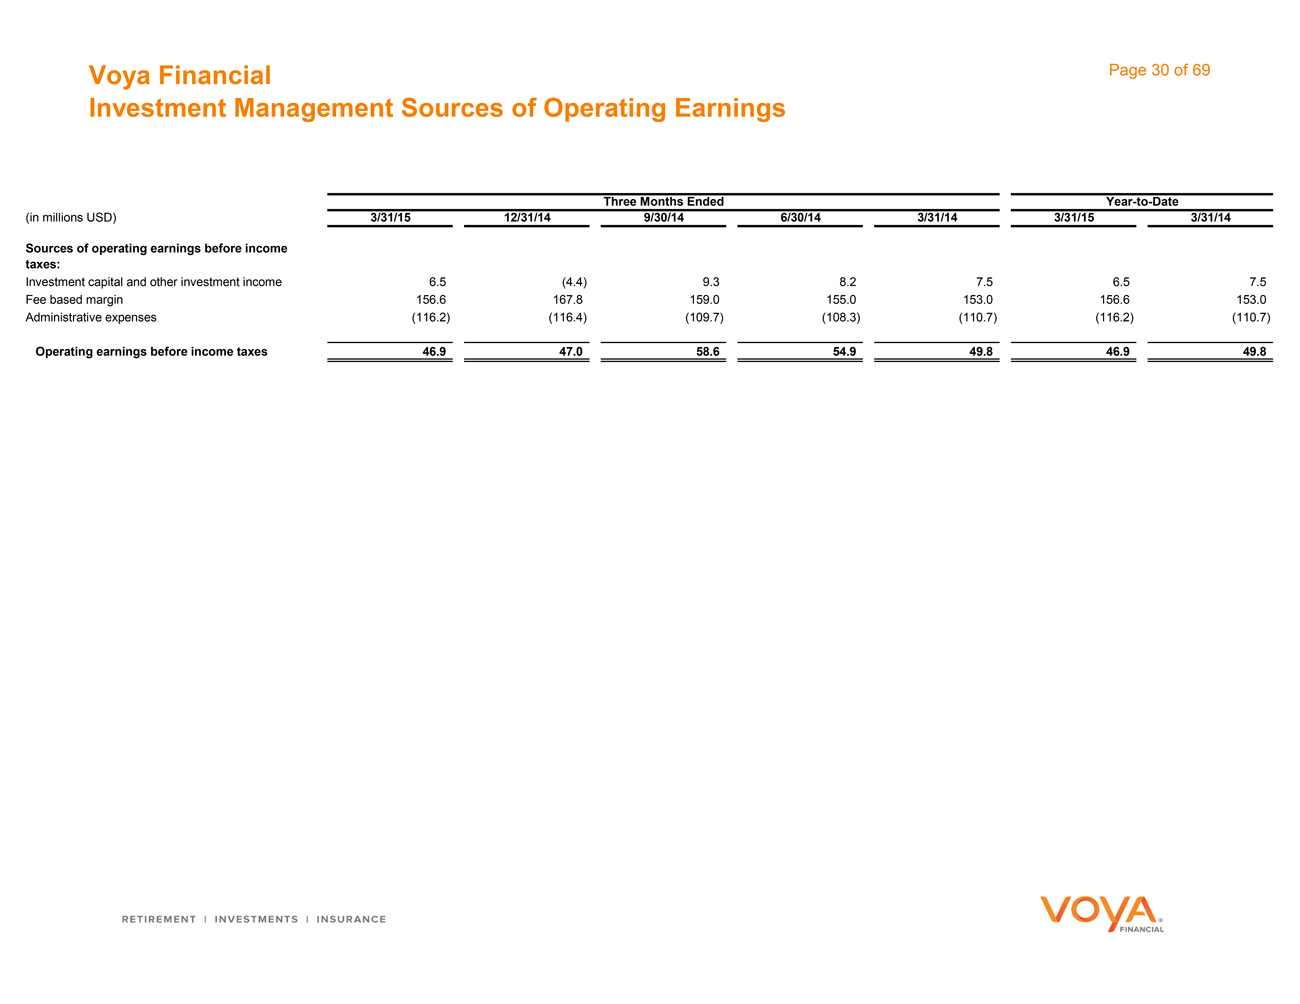
Voya Financial Investment Management Sources of Operating Earnings Page 30 of 69 Year-to-Date Three Months Ended (in millions USD) 3/31/15 12/31/14 9/30/14 6/30/14 3/31/14 3/31/15 3/31/14 Sources of operating earnings before income taxes: Investment capital and other investment income 6.5 (4.4) 9.3 8.2 7.5 6.5 7.5 Fee based margin 156.6 167.8 159.0 155.0 153.0 156.6 153.0 Administrative expenses (116.2) (116.4) (109.7) (108.3) (110.7) (116.2) (110.7) Operating earnings before income taxes 46.9 47.0 58.6 54.9 49.8 46.9 49.8
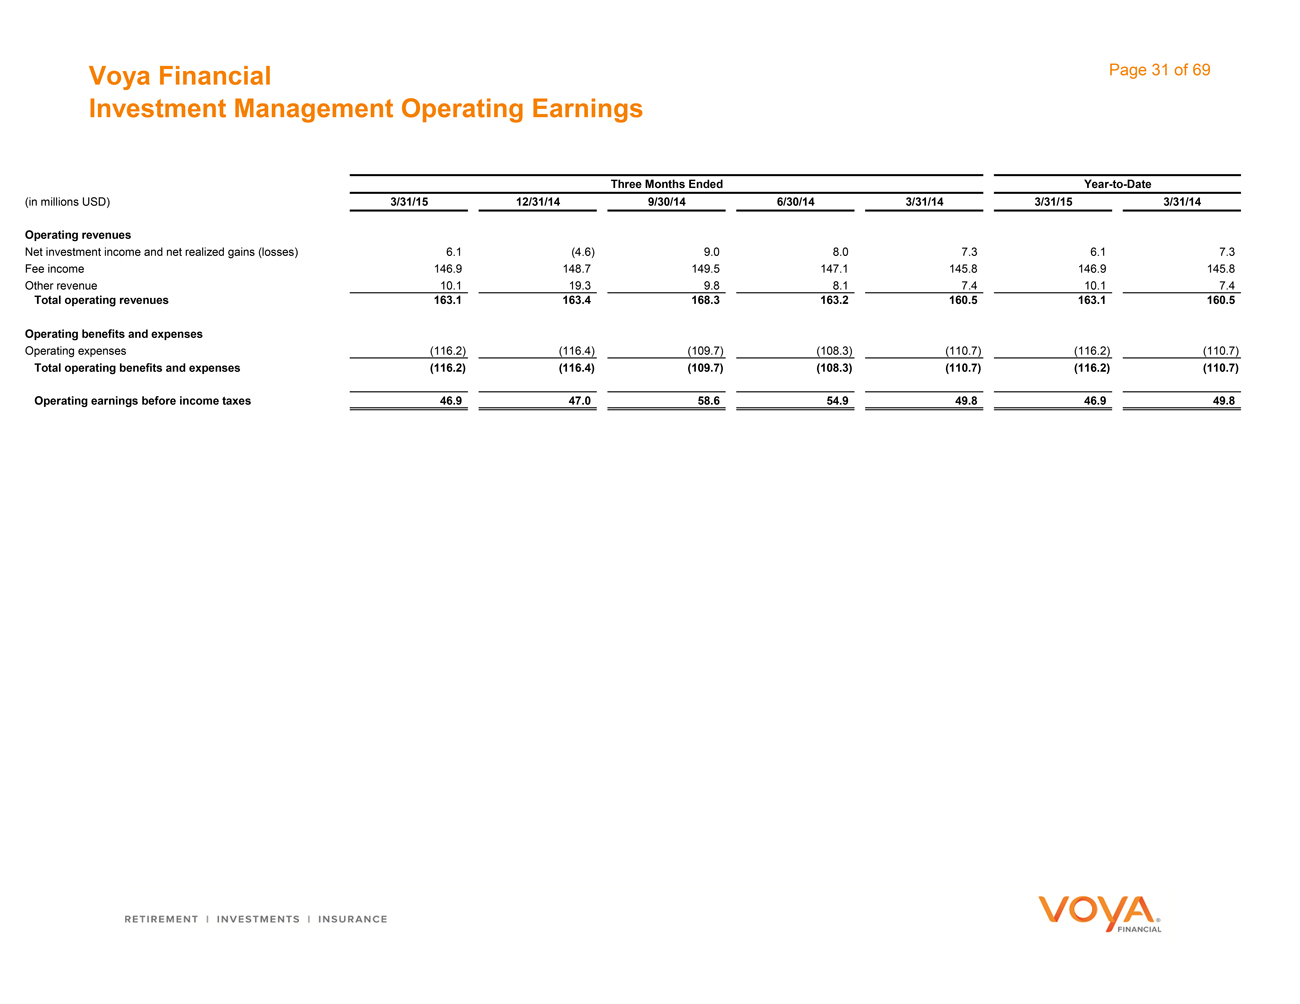
Voya Financial Investment Management Operating Earnings Page 31 of 69 Year-to-Date Three Months Ended (in millions USD) 3/31/15 12/31/14 9/30/14 6/30/14 3/31/14 3/31/15 3/31/14 Operating revenues Net investment income and net realized gains (losses) 6.1 (4.6) 9.0 8.0 7.3 6.1 7.3 Fee income 146.9 148.7 149.5 147.1 145.8 146.9 145.8 Other revenue 10.1 19.3 9.8 8.1 7.4 10.1 7.4 Total operating revenues 163.1 163.4 168.3 163.2 160.5 163.1 160.5 Operating benefits and expenses Operating expenses (116.2) (116.4) (109.7) (108.3) (110.7) (116.2) (110.7) Total operating benefits and expenses (116.2) (116.4) (109.7) (108.3) (110.7) (116.2) (110.7) Operating earnings before income taxes 46.9 47.0 58.6 54.9 49.8 46.9 49.8
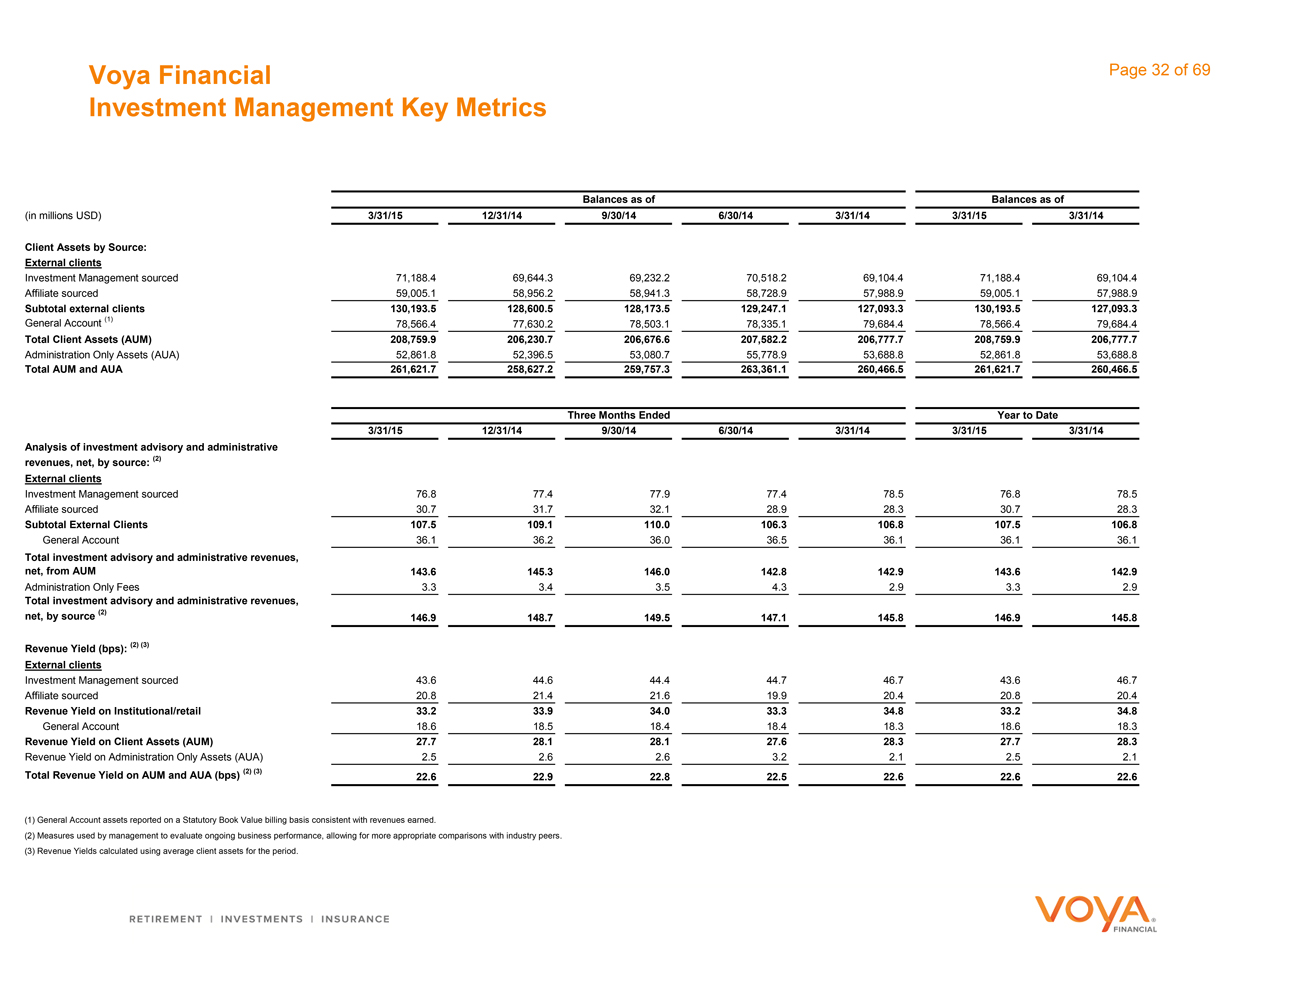
Voya Financial Investment Management Key Metrics Page 32 of 69 Balances as of Balances as of (in millions USD) 3/31/15 12/31/14 9/30/14 6/30/14 3/31/14 3/31/15 3/31/14 Client Assets by Source: External clients Investment Management sourced 71,188.4 69,644.3 69,232.2 70,518.2 69,104.4 71,188.4 69,104.4 Affiliate sourced 59,005.1 58,956.2 58,941.3 58,728.9 57,988.9 59,005.1 57,988.9 Subtotal external clients 130,193.5 128,600.5 128,173.5 129,247.1 127,093.3 130,193.5 127,093.3 General Account (1) 78,566.4 77,630.2 78,503.1 78,335.1 79,684.4 78,566.4 79,684.4 Total Client Assets (AUM) 208,759.9 206,230.7 206,676.6 207,582.2 206,777.7 208,759.9 206,777.7 Administration Only Assets (AUA) 52,861.8 52,396.5 53,080.7 55,778.9 53,688.8 52,861.8 53,688.8 Total AUM and AUA 261,621.7 258,627.2 259,757.3 263,361.1 260,466.5 261,621.7 260,466.5 Three Months Ended Year to Date 3/31/15 12/31/14 9/30/14 6/30/14 3/31/14 3/31/15 3/31/14 Analysis of investment advisory and administrative revenues, net, by source: (2) External clients Investment Management sourced 76.8 77.4 77.9 77.4 78.5 76.8 78.5 Affiliate sourced 30.7 31.7 32.1 28.9 28.3 30.7 28.3 Subtotal External Clients 107.5 109.1 110.0 106.3 106.8 107.5 106.8 General Account 36.1 36.2 36.0 36.5 36.1 36.1 36.1 Total investment advisory and administrative revenues, net, from AUM 143.6 145.3 146.0 142.8 142.9 143.6 142.9 Administration Only Fees 3.3 3.4 3.5 4.3 2.9 3.3 2.9 Total investment advisory and administrative revenues, net, by source (2) 146.9 148.7 149.5 147.1 145.8 146.9 145.8 Revenue Yield (bps): (2) (3) External clients Investment Management sourced 43.6 44.6 44.4 44.7 46.7 43.6 46.7 Affiliate sourced 20.8 21.4 21.6 19.9 20.4 20.8 20.4 Revenue Yield on Institutional/retail 33.2 33.9 34.0 33.3 34.8 33.2 34.8 General Account 18.6 18.5 18.4 18.4 18.3 18.6 18.3 Revenue Yield on Client Assets (AUM) 27.7 28.1 28.1 27.6 28.3 27.7 28.3 Revenue Yield on Administration Only Assets (AUA) 2.5 2.6 2.6 3.2 2.1 2.5 2.1 Total Revenue Yield on AUM and AUA (bps) (2) (3) 22.6 22.9 22.8 22.5 22.6 22.6 22.6 (1) General Account assets reported on a Statutory Book Value billing basis consistent with revenues earned. (2) Measures used by management to evaluate ongoing business performance, allowing for more appropriate comparisons with industry peers. (3) Revenue Yields calculated using average client assets for the period.
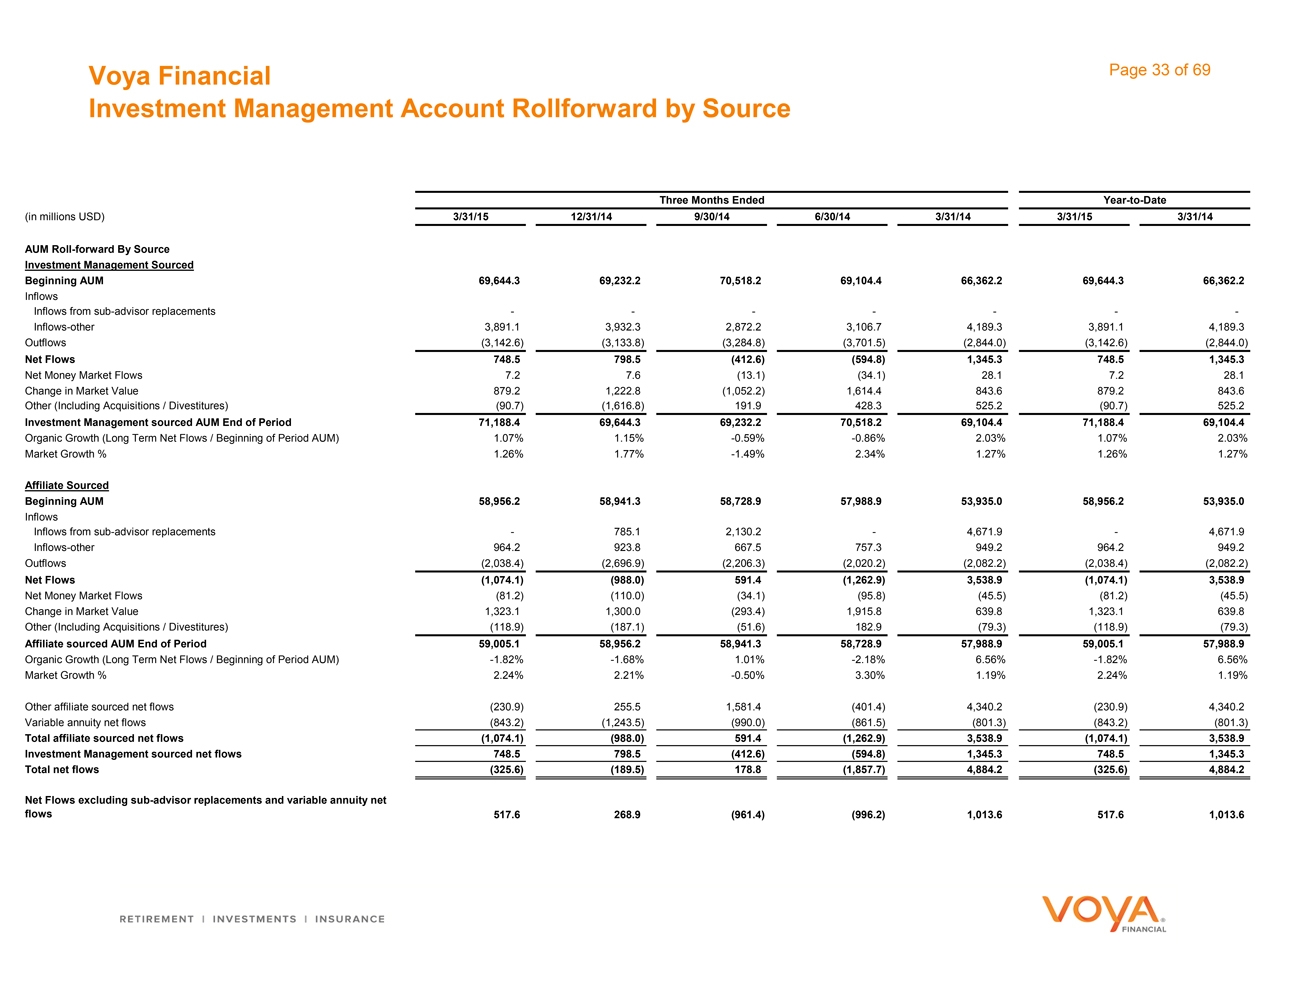
Voya Financial Investment Management Account Rollforward by Source Page 33 of 69 Year-to-Date Three Months Ended (in millions USD) 3/31/15 12/31/14 9/30/14 6/30/14 3/31/14 3/31/15 3/31/14 AUM Roll-forward By Source Investment Management Sourced Beginning AUM 69,644.3 69,232.2 70,518.2 69,104.4 66,362.2 69,644.3 66,362.2 Inflows Inflows from sub-advisor replacements——————— Inflows-other 3,891.1 3,932.3 2,872.2 3,106.7 4,189.3 3,891.1 4,189.3 Outflows (3,142.6) (3,133.8) (3,284.8) (3,701.5) (2,844.0) (3,142.6) (2,844.0) Net Flows 748.5 798.5 (412.6) (594.8) 1,345.3 748.5 1,345.3 Net Money Market Flows 7.2 7.6 (13.1) (34.1) 28.1 7.2 28.1 Change in Market Value 879.2 1,222.8 (1,052.2) 1,614.4 843.6 879.2 843.6 Other (Including Acquisitions / Divestitures) (90.7) (1,616.8) 191.9 428.3 525.2 (90.7) 525.2 Investment Management sourced AUM End of Period 71,188.4 69,644.3 69,232.2 70,518.2 69,104.4 71,188.4 69,104.4 Organic Growth (Long Term Net Flows / Beginning of Period AUM) 1.07% 1.15% -0.59% -0.86% 2.03% 1.07% 2.03% Market Growth % 1.26% 1.77% -1.49% 2.34% 1.27% 1.26% 1.27% Affiliate Sourced Beginning AUM 58,956.2 58,941.3 58,728.9 57,988.9 53,935.0 58,956.2 53,935.0 Inflows Inflows from sub-advisor replacements— 785.1 2,130.2 — 4,671.9 — 4,671.9 Inflows-other 964.2 923.8 667.5 757.3 949.2 964.2 949.2 Outflows (2,038.4) (2,696.9) (2,206.3) (2,020.2) (2,082.2) (2,038.4) (2,082.2) Net Flows (1,074.1) (988.0) 591.4 (1,262.9) 3,538.9 (1,074.1) 3,538.9 Net Money Market Flows (81.2) (110.0) (34.1) (95.8) (45.5) (81.2) (45.5) Change in Market Value 1,323.1 1,300.0 (293.4) 1,915.8 639.8 1,323.1 639.8 Other (Including Acquisitions / Divestitures) (118.9) (187.1) (51.6) 182.9 (79.3) (118.9) (79.3) Affiliate sourced AUM End of Period 59,005.1 58,956.2 58,941.3 58,728.9 57,988.9 59,005.1 57,988.9 Organic Growth (Long Term Net Flows / Beginning of Period AUM) -1.82% -1.68% 1.01% -2.18% 6.56% -1.82% 6.56% Market Growth % 2.24% 2.21% -0.50% 3.30% 1.19% 2.24% 1.19% Other affiliate sourced net flows (230.9) 255.5 1,581.4 (401.4) 4,340.2 (230.9) 4,340.2 Variable annuity net flows (843.2) (1,243.5) (990.0) (861.5) (801.3) (843.2) (801.3) Total affiliate sourced net flows (1,074.1) (988.0) 591.4 (1,262.9) 3,538.9 (1,074.1) 3,538.9 Investment Management sourced net flows 748.5 798.5 (412.6) (594.8) 1,345.3 748.5 1,345.3 Total net flows (325.6) (189.5) 178.8 (1,857.7) 4,884.2 (325.6) 4,884.2 Net Flows excluding sub-advisor replacements and variable annuity net flows 517.6 268.9 (961.4) (996.2) 1,013.6 517.6 1,013.6
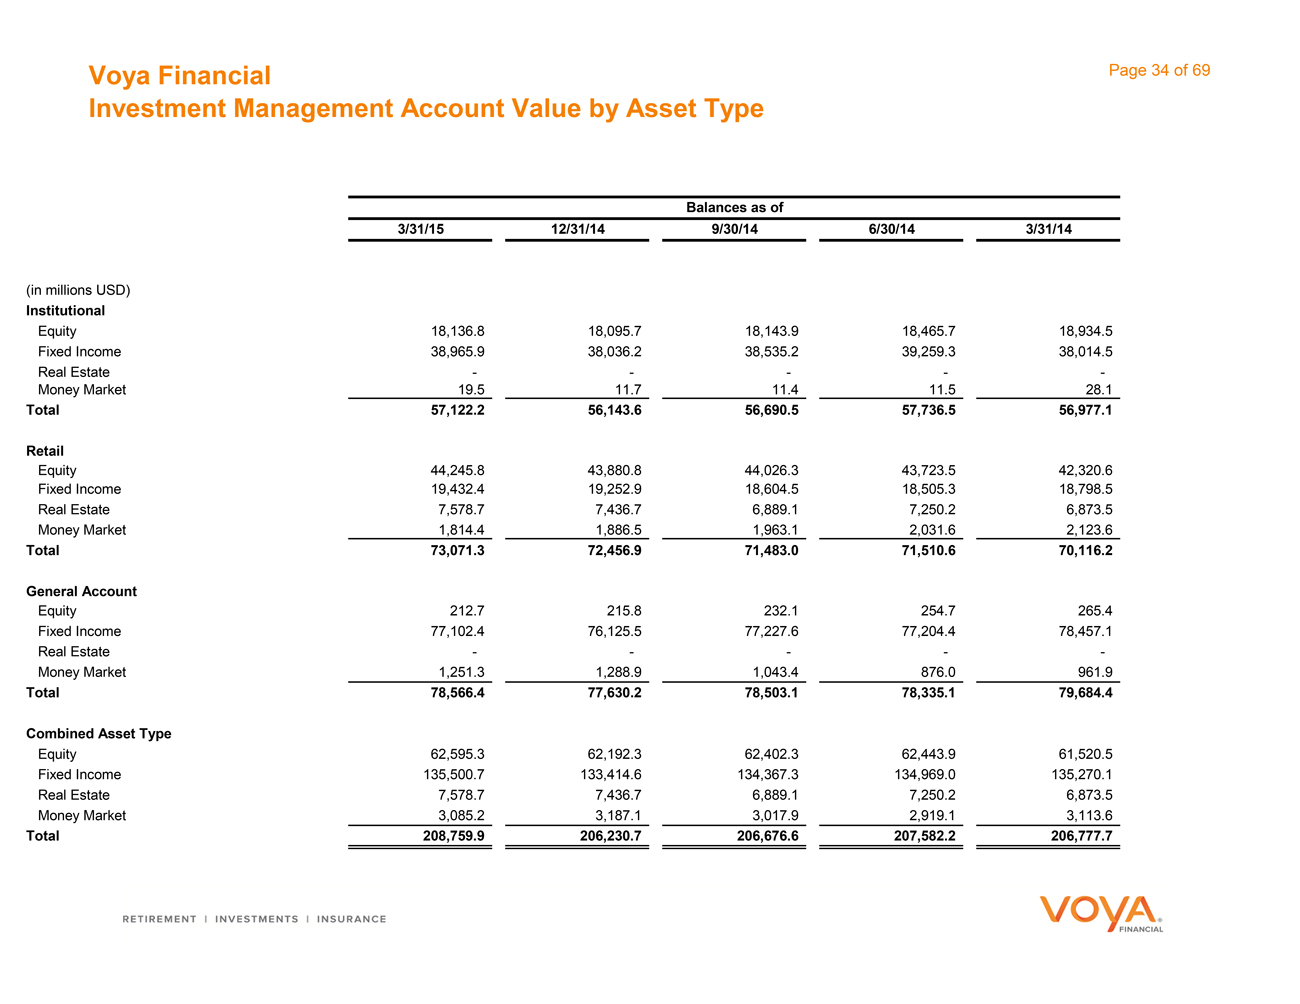
Voya Financial Investment Management Account Value by Asset Type Page 34 of 69 Balances as of 3/31/15 12/31/14 9/30/14 6/30/14 3/31/14 (in millions USD) Institutional Equity 18,136.8 18,095.7 18,143.9 18,465.7 18,934.5 Fixed Income 38,965.9 38,036.2 38,535.2 39,259.3 38,014.5 Real Estate ————— Money Market 19.5 11.7 11.4 11.5 28.1 Total 57,122.2 56,143.6 56,690.5 57,736.5 56,977.1 Retail Equity 44,245.8 43,880.8 44,026.3 43,723.5 42,320.6 Fixed Income 19,432.4 19,252.9 18,604.5 18,505.3 18,798.5 Real Estate 7,578.7 7,436.7 6,889.1 7,250.2 6,873.5 Money Market 1,814.4 1,886.5 1,963.1 2,031.6 2,123.6 Total 73,071.3 72,456.9 71,483.0 71,510.6 70,116.2 General Account Equity 212.7 215.8 232.1 254.7 265.4 Fixed Income 77,102.4 76,125.5 77,227.6 77,204.4 78,457.1 Real Estate ————— Money Market 1,251.3 1,288.9 1,043.4 876.0 961.9 Total 78,566.4 77,630.2 78,503.1 78,335.1 79,684.4 Combined Asset Type Equity 62,595.3 62,192.3 62,402.3 62,443.9 61,520.5 Fixed Income 135,500.7 133,414.6 134,367.3 134,969.0 135,270.1 Real Estate 7,578.7 7,436.7 6,889.1 7,250.2 6,873.5 Money Market 3,085.2 3,187.1 3,017.9 2,919.1 3,113.6 Total 208,759.9 206,230.7 206,676.6 207,582.2 206,777.7

Individual Life
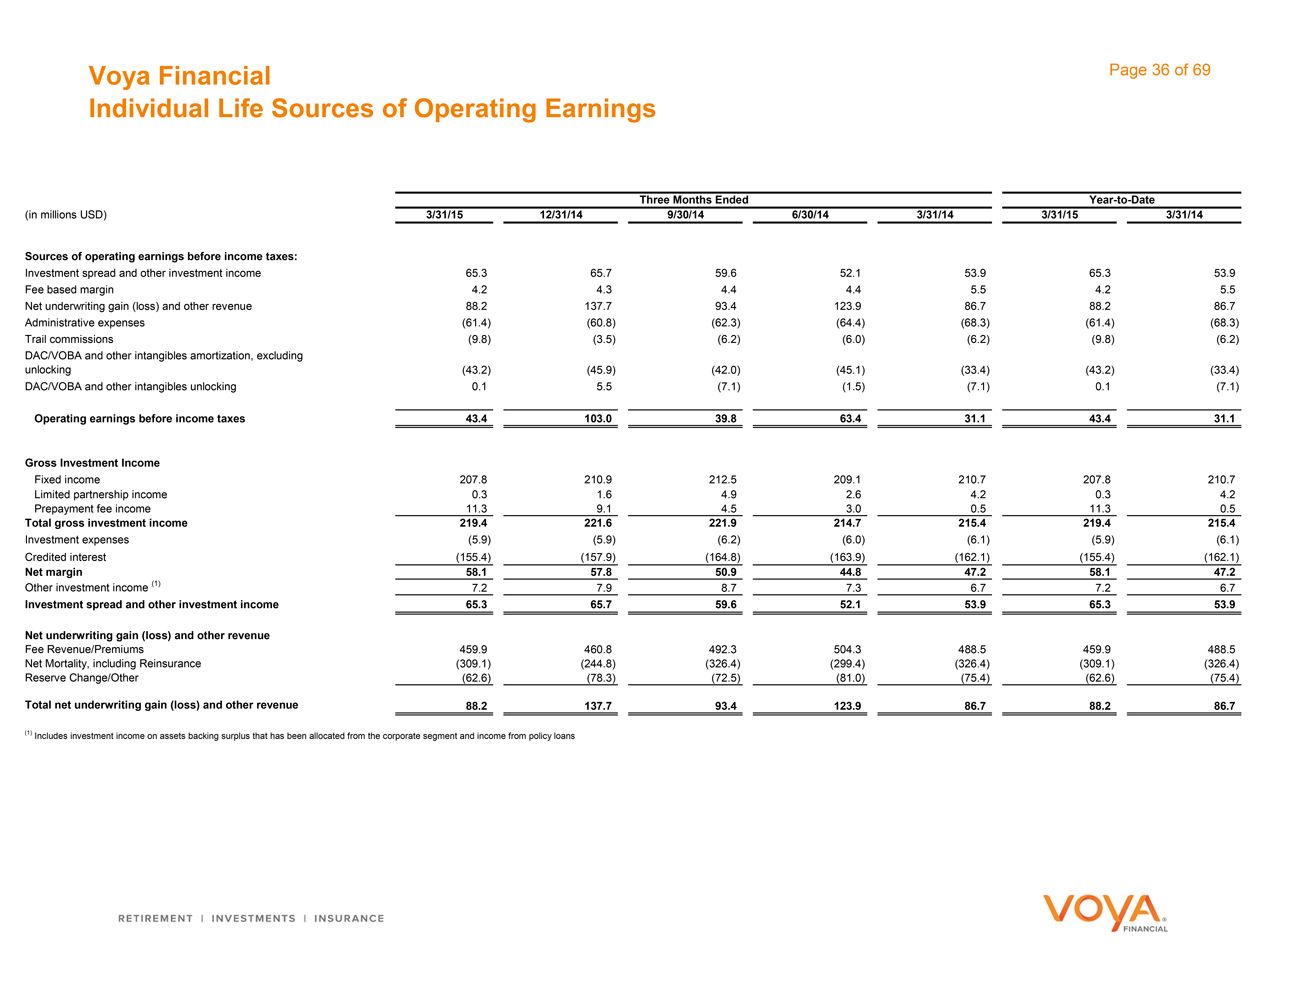
Voya Financial Individual Life Sources of Operating Earnings Page 36 of 69 Year-to-Date Three Months Ended (in millions USD) 3/31/15 12/31/14 9/30/14 6/30/14 3/31/14 3/31/15 3/31/14 Sources of operating earnings before income taxes: Investment spread and other investment income 65.3 65.7 59.6 52.1 53.9 65.3 53.9 Fee based margin 4.2 4.3 4.4 4.4 5.5 4.2 5.5 Net underwriting gain (loss) and other revenue 88.2 137.7 93.4 123.9 86.7 88.2 86.7 Administrative expenses (61.4) (60.8) (62.3) (64.4) (68.3) (61.4) (68.3) Trail commissions (9.8) (3.5) (6.2) (6.0) (6.2) (9.8) (6.2) DAC/VOBA and other intangibles amortization, excluding unlocking (43.2) (45.9) (42.0) (45.1) (33.4) (43.2) (33.4) DAC/VOBA and other intangibles unlocking 0.1 5.5 (7.1) (1.5) (7.1) 0.1 (7.1) Operating earnings before income taxes 43.4 103.0 39.8 63.4 31.1 43.4 31.1 Gross Investment Income Fixed income 207.8 210.9 212.5 209.1 210.7 207.8 210.7 Limited partnership income 0.3 1.6 4.9 2.6 4.2 0.3 4.2 Prepayment fee income 11.3 9.1 4.5 3.0 0.5 11.3 0.5 Total gross investment income 219.4 221.6 221.9 214.7 215.4 219.4 215.4 Investment expenses (5.9) (5.9) (6.2) (6.0) (6.1) (5.9) (6.1) Credited interest (155.4) (157.9) (164.8) (163.9) (162.1) (155.4) (162.1) Net margin 58.1 57.8 50.9 44.8 47.2 58.1 47.2 Other investment income (1) 7.2 7.9 8.7 7.3 6.7 7.2 6.7 Investment spread and other investment income 65.3 65.7 59.6 52.1 53.9 65.3 53.9 Net underwriting gain (loss) and other revenue Fee Revenue/Premiums 459.9 460.8 492.3 504.3 488.5 459.9 488.5 Net Mortality, including Reinsurance (309.1) (244.8) (326.4) (299.4) (326.4) (309.1) (326.4) Reserve Change/Other (62.6) (78.3) (72.5) (81.0) (75.4) (62.6) (75.4) Total net underwriting gain (loss) and other revenue 88.2 137.7 93.4 123.9 86.7 88.2 86.7 (1) Includes investment income on assets backing surplus that has been allocated from the corporate segment and income from policy loans
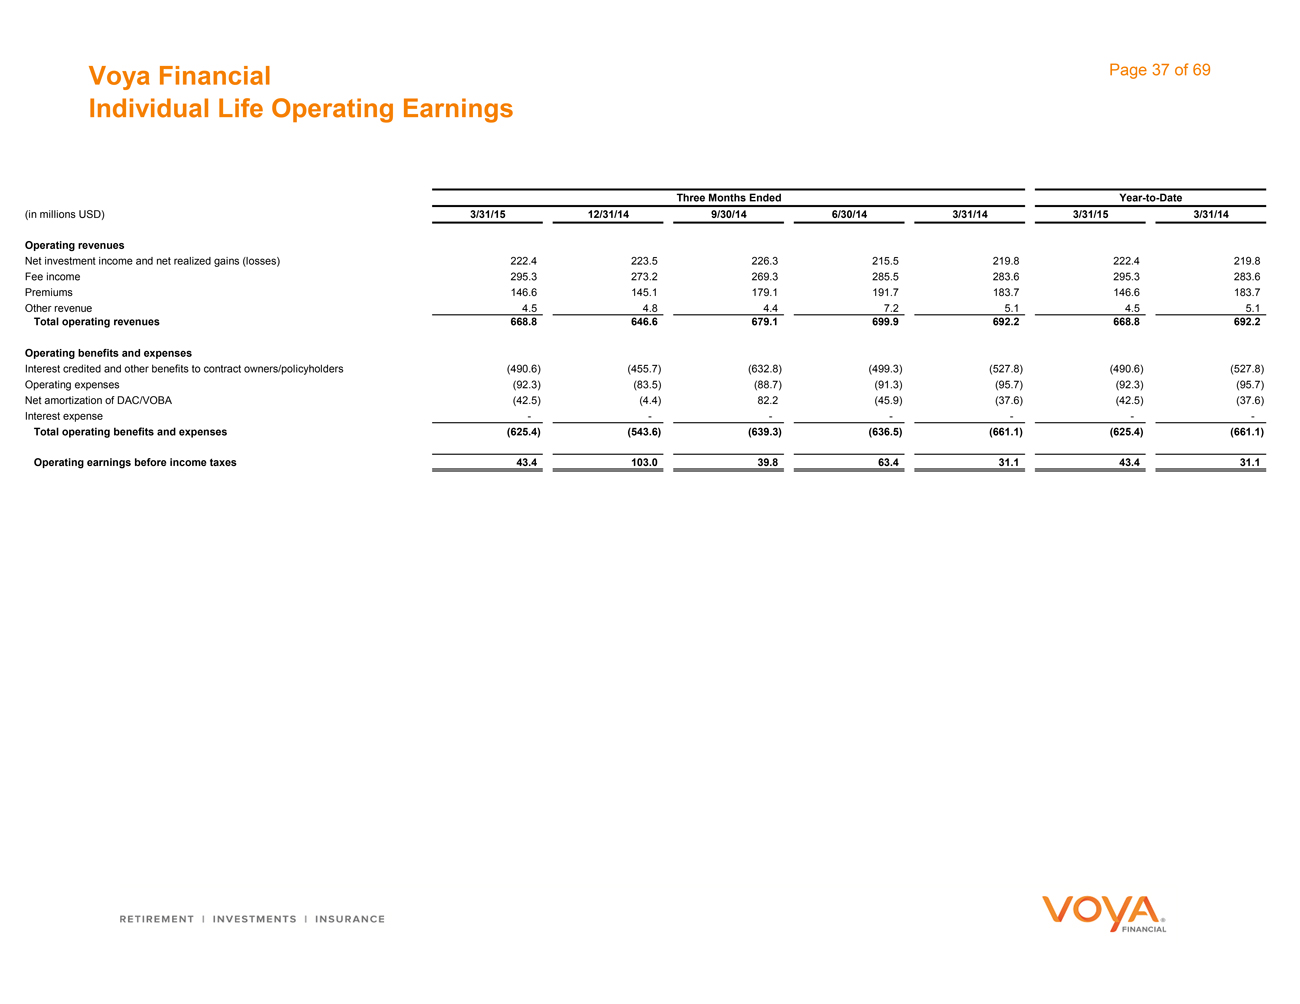
Voya Financial Individual Life Operating Earnings Page 37 of 69 Year-to-Date Three Months Ended (in millions USD) 3/31/15 12/31/14 9/30/14 6/30/14 3/31/14 3/31/15 3/31/14 Operating revenues Net investment income and net realized gains (losses) 222.4 223.5 226.3 215.5 219.8 222.4 219.8 Fee income 295.3 273.2 269.3 285.5 283.6 295.3 283.6 Premiums 146.6 145.1 179.1 191.7 183.7 146.6 183.7 Other revenue 4.5 4.8 4.4 7.2 5.1 4.5 5.1 Total operating revenues 668.8 646.6 679.1 699.9 692.2 668.8 692.2 Operating benefits and expenses Interest credited and other benefits to contract owners/policyholders (490.6) (455.7) (632.8) (499.3) (527.8) (490.6) (527.8) Operating expenses (92.3) (83.5) (88.7) (91.3) (95.7) (92.3) (95.7) Net amortization of DAC/VOBA (42.5) (4.4) 82.2 (45.9) (37.6) (42.5) (37.6) Interest expense——————— Total operating benefits and expenses (625.4) (543.6) (639.3) (636.5) (661.1) (625.4) (661.1) Operating earnings before income taxes 43.4 103.0 39.8 63.4 31.1 43.4 31.1
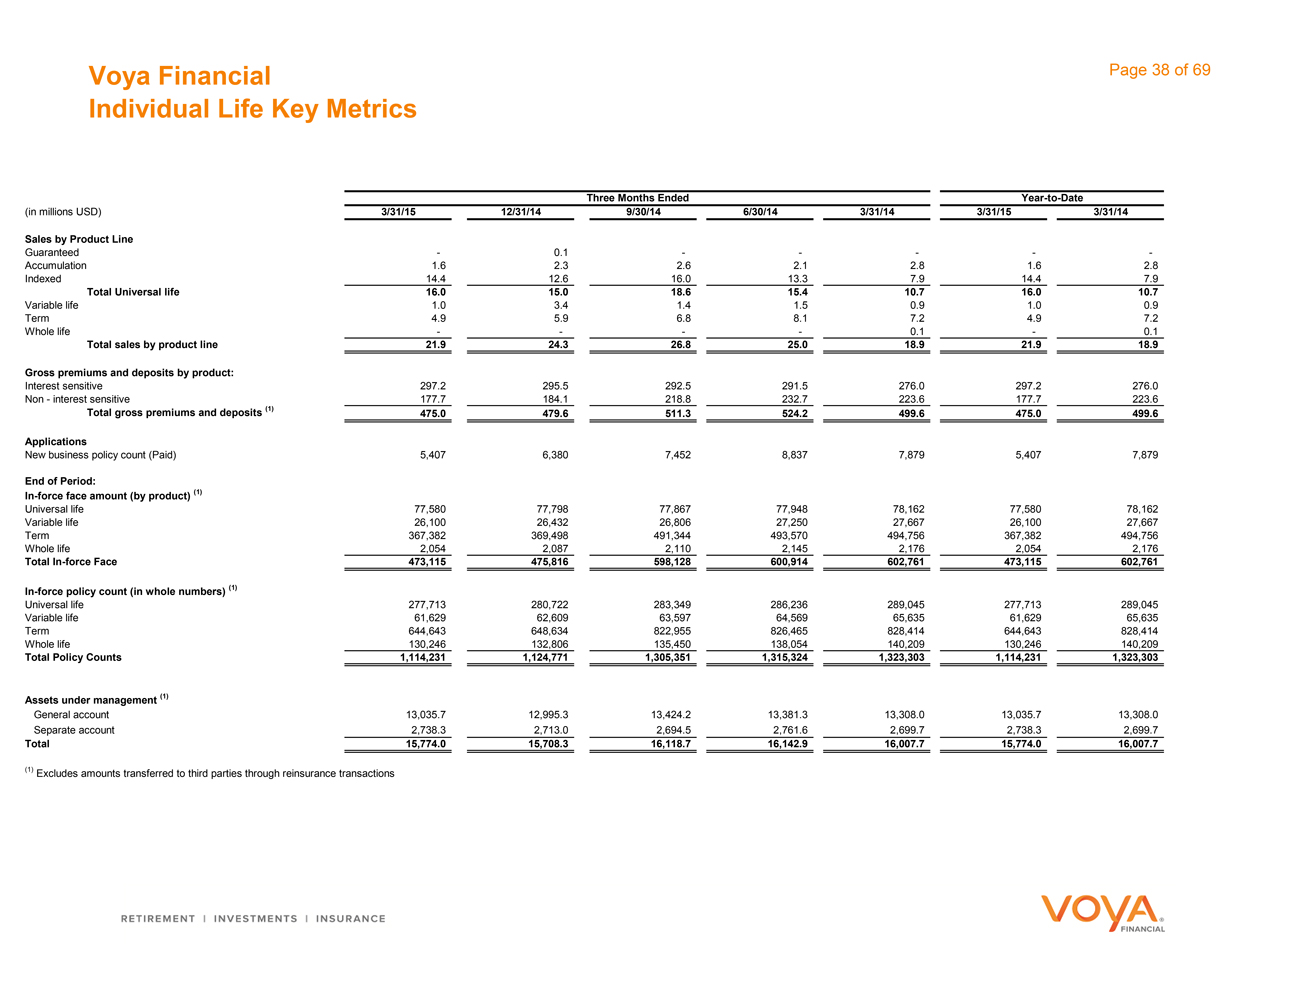
Voya Financial Individual Life Key Metrics Page 38 of 69 Year-to-Date Three Months Ended (in millions USD) 3/31/15 12/31/14 9/30/14 6/30/14 3/31/14 3/31/15 3/31/14 Sales by Product Line Guaranteed— 0.1 ————— Accumulation 1.6 2.3 2.6 2.1 2.8 1.6 2.8 Indexed 14.4 12.6 16.0 13.3 7.9 14.4 7.9 Total Universal life 16.0 15.0 18.6 15.4 10.7 16.0 10.7 Variable life 1.0 3.4 1.4 1.5 0.9 1.0 0.9 Term 4.9 5.9 6.8 8.1 7.2 4.9 7.2 Whole life———— 0.1 — 0.1 Total sales by product line 21.9 24.3 26.8 25.0 18.9 21.9 18.9 Gross premiums and deposits by product: Interest sensitive 297.2 295.5 292.5 291.5 276.0 297.2 276.0 Non—interest sensitive 177.7 184.1 218.8 232.7 223.6 177.7 223.6 Total gross premiums and deposits (1) 475.0 479.6 511.3 524.2 499.6 475.0 499.6 Applications New business policy count (Paid) 5,407 6,380 7,452 8,837 7,879 5,407 7,879 End of Period: In-force face amount (by product) (1) Universal life 77,580 77,798 77,867 77,948 78,162 77,580 78,162 Variable life 26,100 26,432 26,806 27,250 27,667 26,100 27,667 Term 367,382 369,498 491,344 493,570 494,756 367,382 494,756 Whole life 2,054 2,087 2,110 2,145 2,176 2,054 2,176 Total In-force Face 473,115 475,816 598,128 600,914 602,761 473,115 602,761 In-force policy count (in whole numbers) (1) Universal life 277,713 280,722 283,349 286,236 289,045 277,713 289,045 Variable life 61,629 62,609 63,597 64,569 65,635 61,629 65,635 Term 644,643 648,634 822,955 826,465 828,414 644,643 828,414 Whole life 130,246 132,806 135,450 138,054 140,209 130,246 140,209 Total Policy Counts 1,114,231 1,124,771 1,305,351 1,315,324 1,323,303 1,114,231 1,323,303 Assets under management (1) General account 13,035.7 12,995.3 13,424.2 13,381.3 13,308.0 13,035.7 13,308.0 Separate account 2,738.3 2,713.0 2,694.5 2,761.6 2,699.7 2,738.3 2,699.7 Total 15,774.0 15,708.3 16,118.7 16,142.9 16,007.7 15,774.0 16,007.7 (1) Excludes amounts transferred to third parties through reinsurance transactions

Employee Benefits
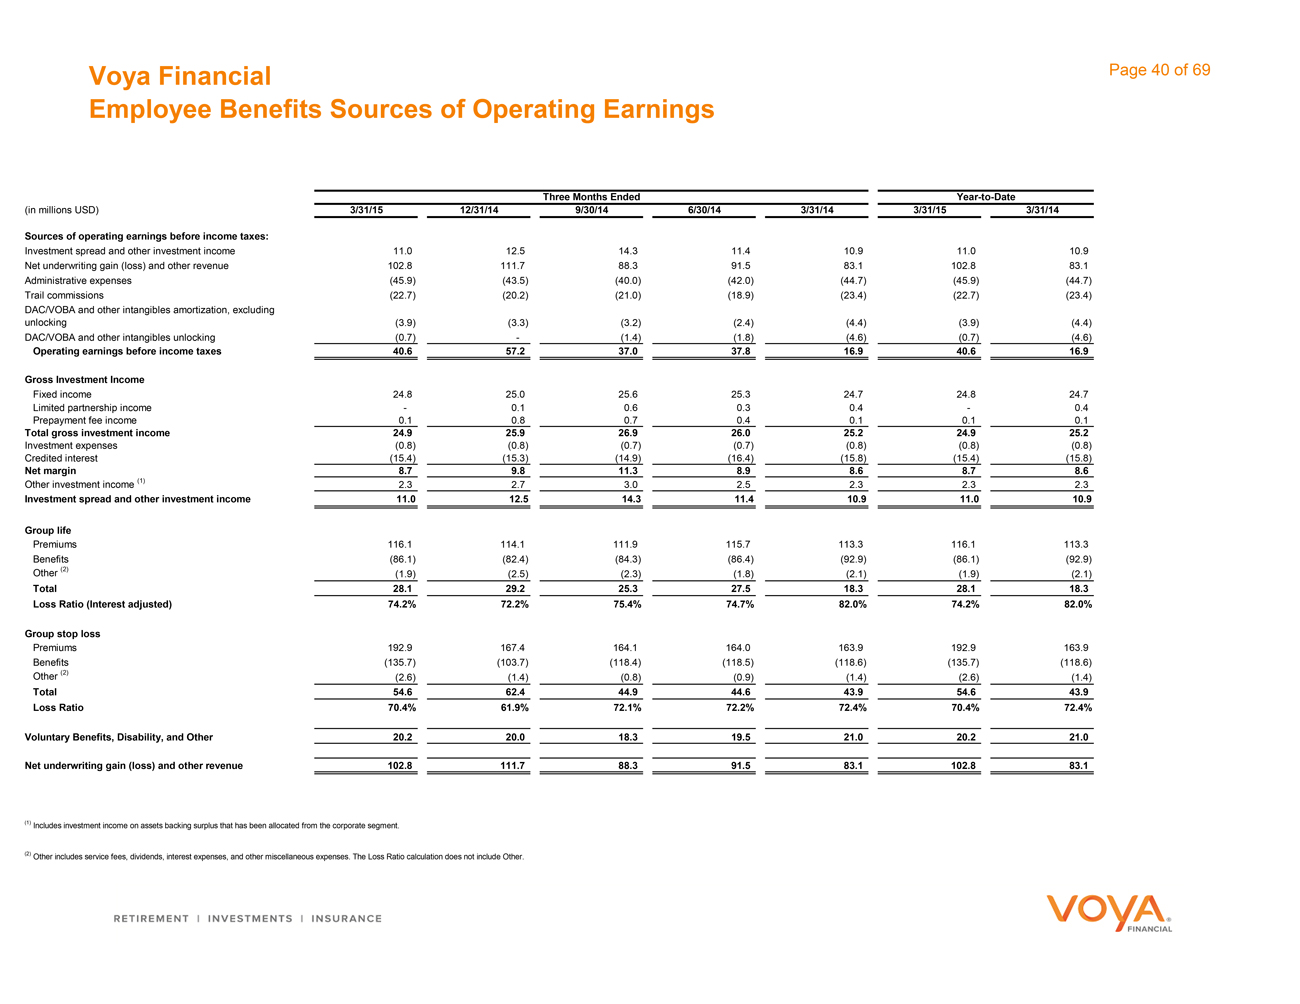
Voya Financial Employee Benefits Sources of Operating Earnings Page 40 of 69 Year-to-Date Three Months Ended (in millions USD) 3/31/15 12/31/14 9/30/14 6/30/14 3/31/14 3/31/15 3/31/14 Sources of operating earnings before income taxes: Investment spread and other investment income 11.0 12.5 14.3 11.4 10.9 11.0 10.9 Net underwriting gain (loss) and other revenue 102.8 111.7 88.3 91.5 83.1 102.8 83.1 Administrative expenses (45.9) (43.5) (40.0) (42.0) (44.7) (45.9) (44.7) Trail commissions (22.7) (20.2) (21.0) (18.9) (23.4) (22.7) (23.4) DAC/VOBA and other intangibles amortization, excluding unlocking (3.9) (3.3) (3.2) (2.4) (4.4) (3.9) (4.4) DAC/VOBA and other intangibles unlocking (0.7) — (1.4) (1.8) (4.6) (0.7) (4.6) Operating earnings before income taxes 40.6 57.2 37.0 37.8 16.9 40.6 16.9 Gross Investment Income Fixed income 24.8 25.0 25.6 25.3 24.7 24.8 24.7 Limited partnership income— 0.1 0.6 0.3 0.4 — 0.4 Prepayment fee income 0.1 0.8 0.7 0.4 0.1 0.1 0.1 Total gross investment income 24.9 25.9 26.9 26.0 25.2 24.9 25.2 Investment expenses (0.8) (0.8) (0.7) (0.7) (0.8) (0.8) (0.8) Credited interest (15.4) (15.3) (14.9) (16.4) (15.8) (15.4) (15.8) Net margin 8.7 9.8 11.3 8.9 8.6 8.7 8.6 Other investment income (1) 2.3 2.7 3.0 2.5 2.3 2.3 2.3 Investment spread and other investment income 11.0 12.5 14.3 11.4 10.9 11.0 10.9 Group life Premiums 116.1 114.1 111.9 115.7 113.3 116.1 113.3 Benefits (86.1) (82.4) (84.3) (86.4) (92.9) (86.1) (92.9) Other (2) (1.9) (2.5) (2.3) (1.8) (2.1) (1.9) (2.1) Total 28.1 29.2 25.3 27.5 18.3 28.1 18.3 Loss Ratio (Interest adjusted) 74.2% 72.2% 75.4% 74.7% 82.0% 74.2% 82.0% Group stop loss Premiums 192.9 167.4 164.1 164.0 163.9 192.9 163.9 Benefits (135.7) (103.7) (118.4) (118.5) (118.6) (135.7) (118.6) Other (2) (2.6) (1.4) (0.8) (0.9) (1.4) (2.6) (1.4) Total 54.6 62.4 44.9 44.6 43.9 54.6 43.9 Loss Ratio 70.4% 61.9% 72.1% 72.2% 72.4% 70.4% 72.4% Voluntary Benefits, Disability, and Other 20.2 20.0 18.3 19.5 21.0 20.2 21.0 Net underwriting gain (loss) and other revenue 102.8 111.7 88.3 91.5 83.1 102.8 83.1 (1) Includes investment income on assets backing surplus that has been allocated from the corporate segment. (2) Other includes service fees, dividends, interest expenses, and other miscellaneous expenses. The Loss Ratio calculation does not include Other.
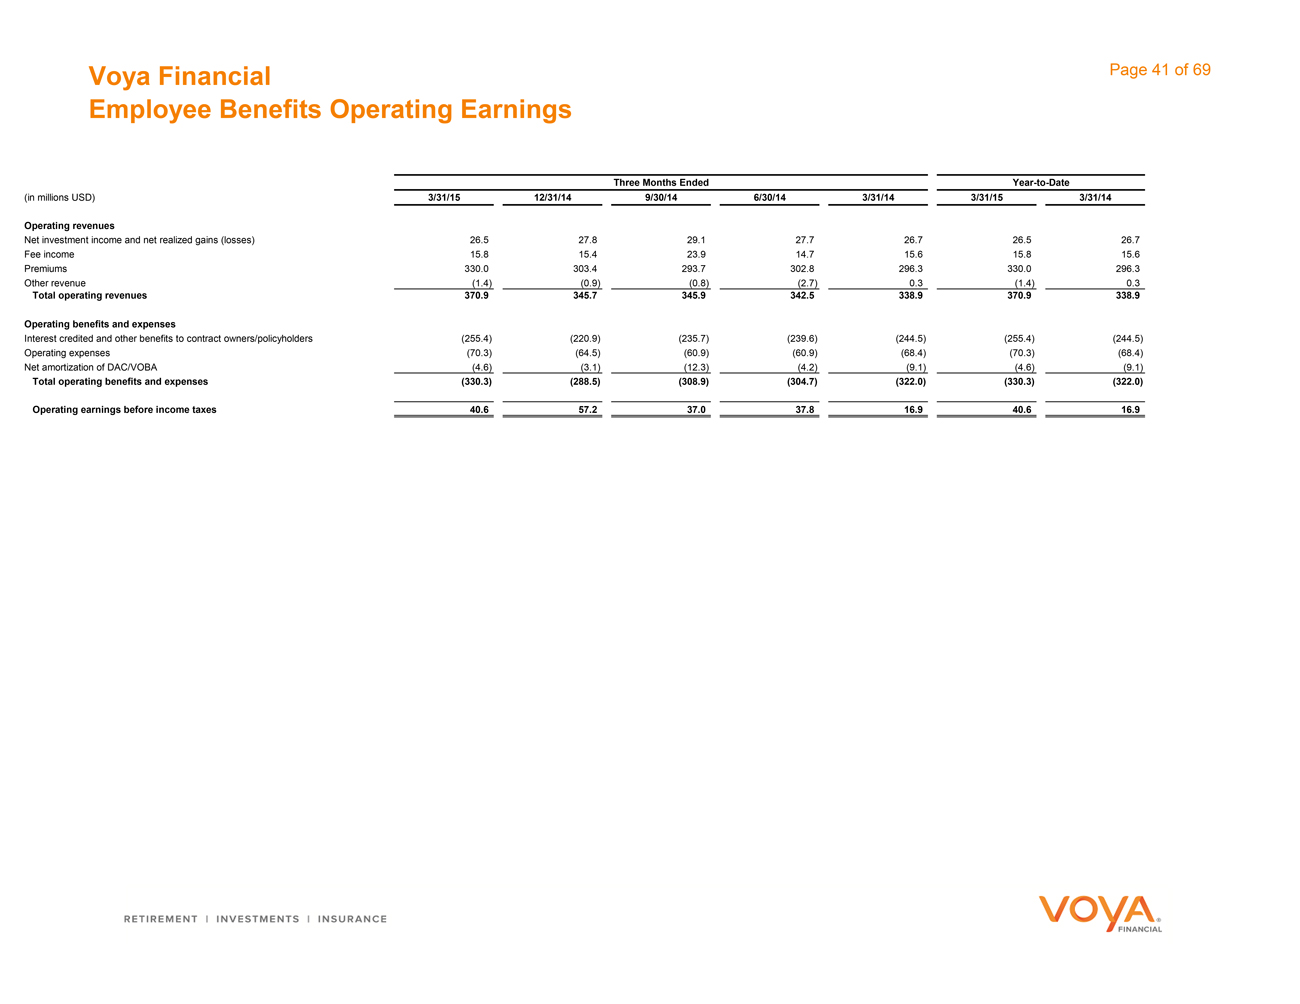
Voya Financial Employee Benefits Operating Earnings Page 41 of 69 Year-to-Date Three Months Ended (in millions USD) 3/31/15 12/31/14 9/30/14 6/30/14 3/31/14 3/31/15 3/31/14 Operating revenues Net investment income and net realized gains (losses) 26.5 27.8 29.1 27.7 26.7 26.5 26.7 Fee income 15.8 15.4 23.9 14.7 15.6 15.8 15.6 Premiums 330.0 303.4 293.7 302.8 296.3 330.0 296.3 Other revenue (1.4) (0.9) (0.8) (2.7) 0.3 (1.4) 0.3 Total operating revenues 370.9 345.7 345.9 342.5 338.9 370.9 338.9 Operating benefits and expenses Interest credited and other benefits to contract owners/policyholders (255.4) (220.9) (235.7) (239.6) (244.5) (255.4) (244.5) Operating expenses (70.3) (64.5) (60.9) (60.9) (68.4) (70.3) (68.4) Net amortization of DAC/VOBA (4.6) (3.1) (12.3) (4.2) (9.1) (4.6) (9.1) Total operating benefits and expenses (330.3) (288.5) (308.9) (304.7) (322.0) (330.3) (322.0) Operating earnings before income taxes 40.6 57.2 37.0 37.8 16.9 40.6 16.9
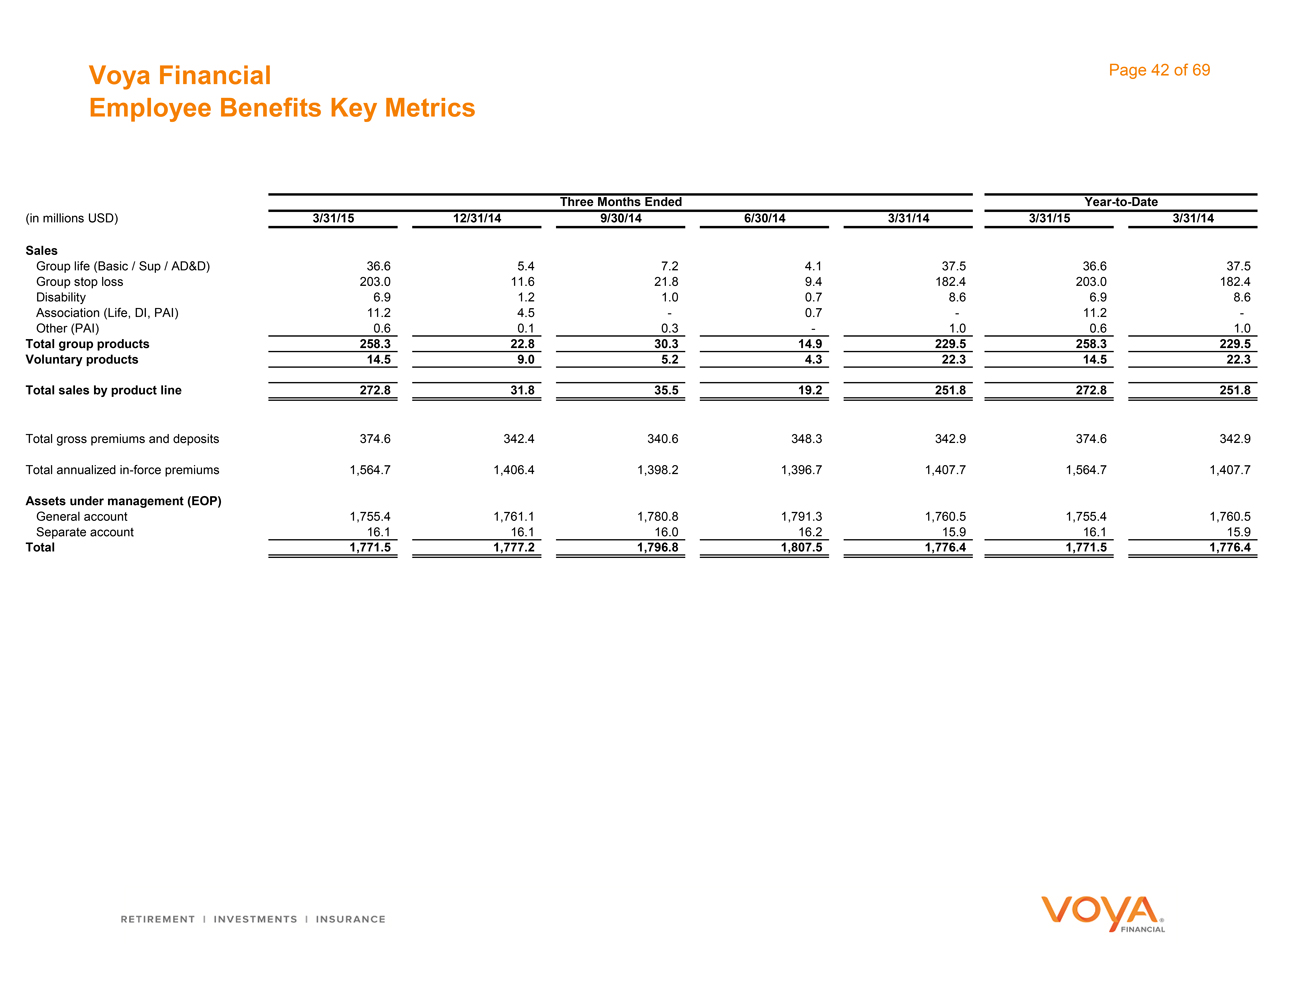
Voya Financial Employee Benefits Key Metrics Page 42 of 69 Three Months Ended Year-to-Date (in millions USD) 3/31/15 12/31/14 9/30/14 6/30/14 3/31/14 3/31/15 3/31/14 Sales Group life (Basic / Sup / AD&D) 36.6 5.4 7.2 4.1 37.5 36.6 37.5 Group stop loss 203.0 11.6 21.8 9.4 182.4 203.0 182.4 Disability 6.9 1.2 1.0 0.7 8.6 6.9 8.6 Association (Life, DI, PAI) 11.2 4.5 — 0.7 — 11.2 — Other (PAI) 0.6 0.1 0.3 — 1.0 0.6 1.0 Total group products 258.3 22.8 30.3 14.9 229.5 258.3 229.5 Voluntary products 14.5 9.0 5.2 4.3 22.3 14.5 22.3 Total sales by product line 272.8 31.8 35.5 19.2 251.8 272.8 251.8 Total gross premiums and deposits 374.6 342.4 340.6 348.3 342.9 374.6 342.9 Total annualized in-force premiums 1,564.7 1,406.4 1,398.2 1,396.7 1,407.7 1,564.7 1,407.7 Assets under management (EOP) General account 1,755.4 1,761.1 1,780.8 1,791.3 1,760.5 1,755.4 1,760.5 Separate account 16.1 16.1 16.0 16.2 15.9 16.1 15.9 Total 1,771.5 1,777.2 1,796.8 1,807.5 1,776.4 1,771.5 1,776.4

Corporate
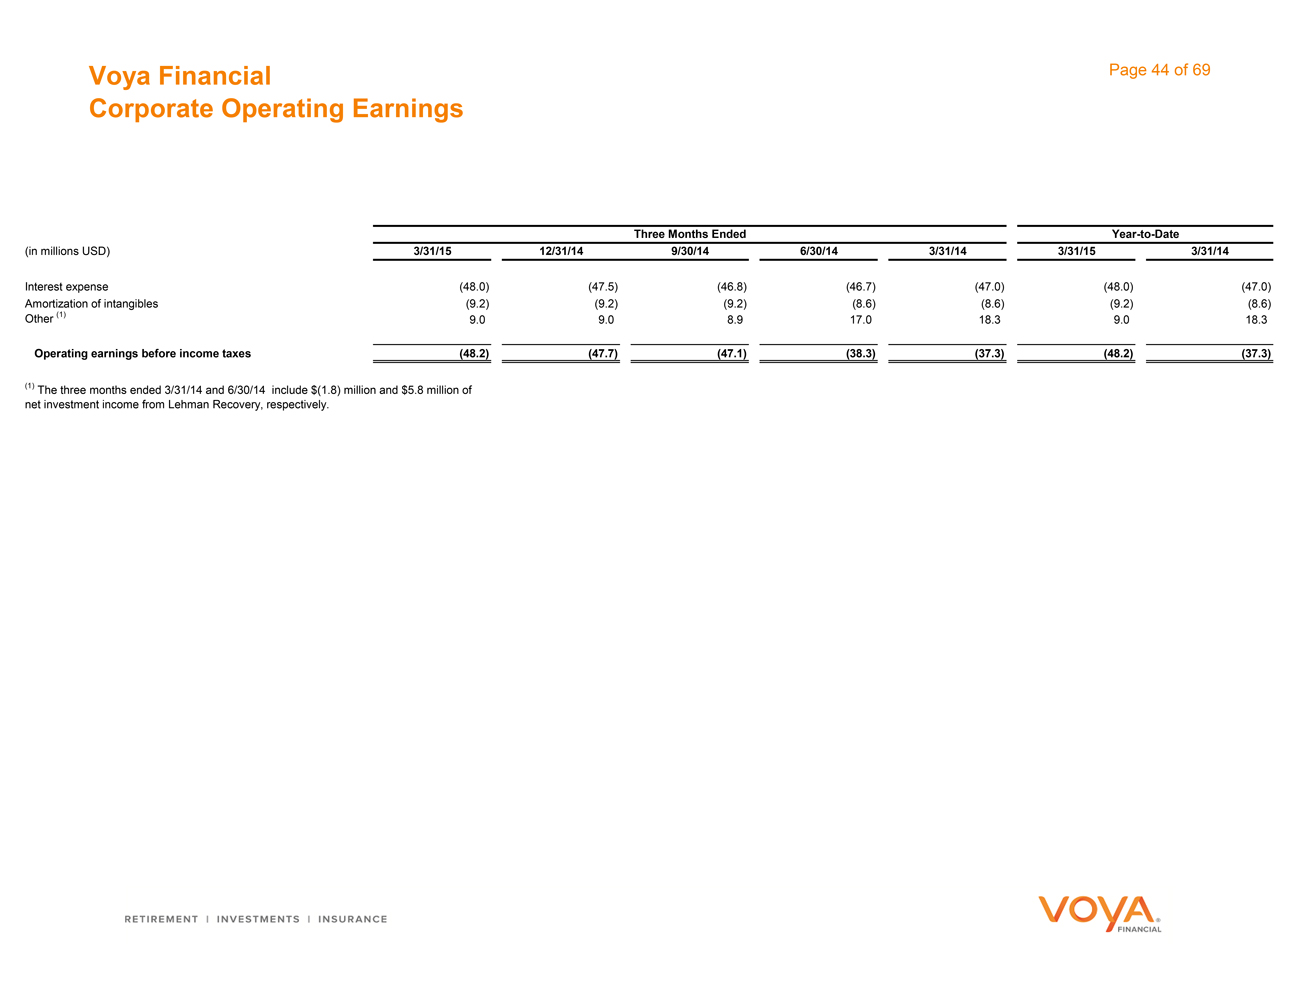
Voya Financial Corporate Operating Earnings Page 44 of 69 Year-to-Date Three Months Ended (in millions USD) 3/31/15 12/31/14 9/30/14 6/30/14 3/31/14 3/31/15 3/31/14 Interest expense (48.0) (47.5) (46.8) (46.7) (47.0) (48.0) (47.0) Amortization of intangibles (9.2) (9.2) (9.2) (8.6) (8.6) (9.2) (8.6) Other (1) 9.0 9.0 8.9 17.0 18.3 9.0 18.3 Operating earnings before income taxes (48.2) (47.7) (47.1) (38.3) (37.3) (48.2) (37.3) (1) The three months ended 3/31/14 and 6/30/14 include $(1.8) million and $5.8 million of net investment income from Lehman Recovery, respectively.

Closed Blocks (Variable Annuity and Other)
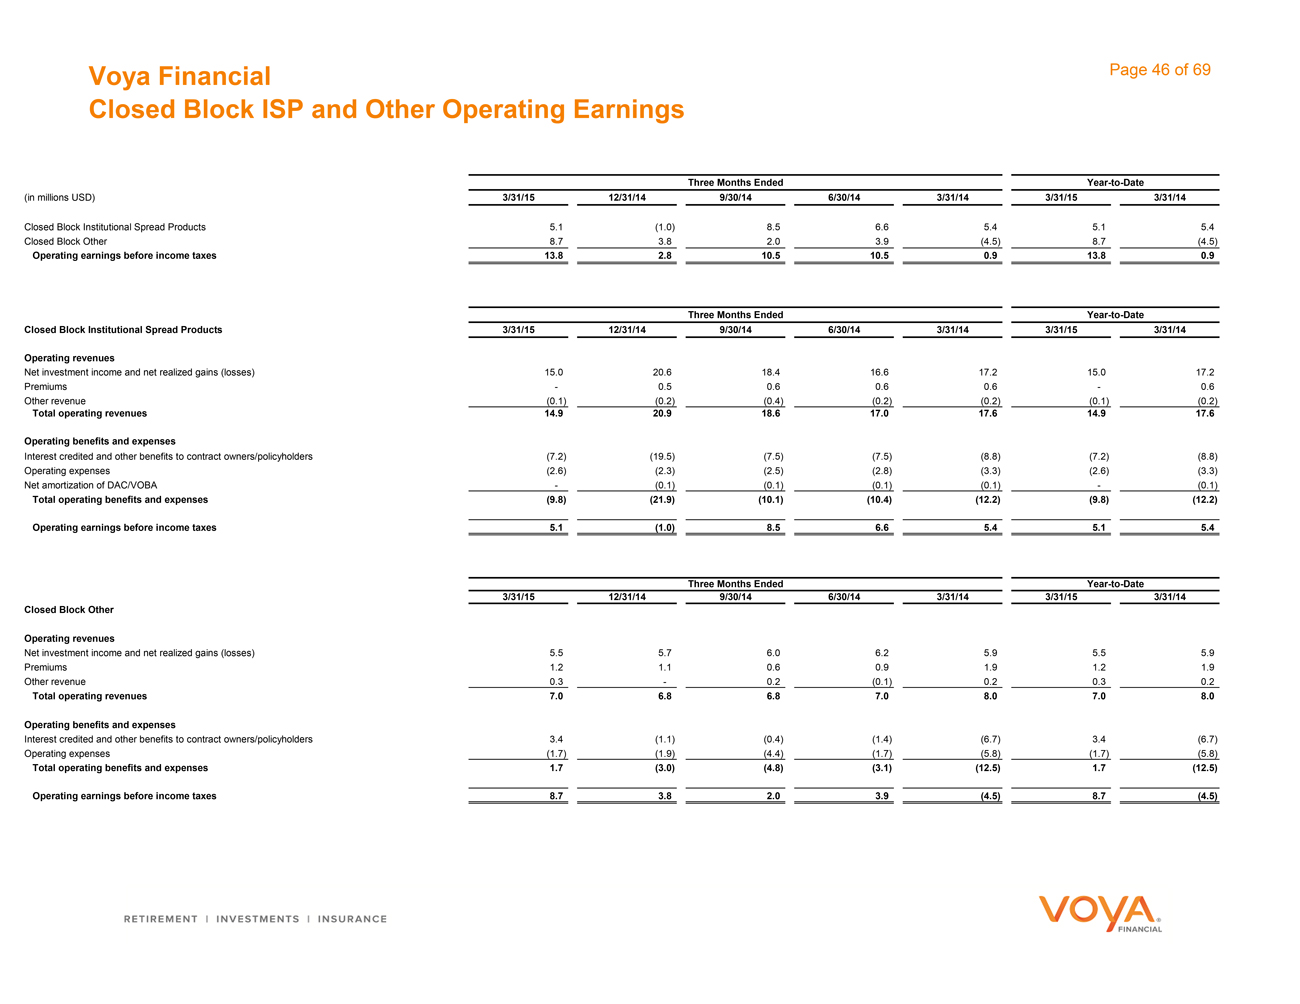
Voya Financial Closed Block ISP and Other Operating Earnings Page 46 of 69 Three Months Ended Year-to-Date (in millions USD) 3/31/15 12/31/14 9/30/14 6/30/14 3/31/14 3/31/15 3/31/14 Closed Block Institutional Spread Products 5.1 (1.0) 8.5 6.6 5.4 5.1 5.4 Closed Block Other 8.7 3.8 2.0 3.9 (4.5) 8.7 (4.5) Operating earnings before income taxes 13.8 2.8 10.5 10.5 0.9 13.8 0.9 Three Months Ended Year-to-Date Closed Block Institutional Spread Products 3/31/15 12/31/14 9/30/14 6/30/14 3/31/14 3/31/15 3/31/14 Operating revenues Net investment income and net realized gains (losses) 15.0 20.6 18.4 16.6 17.2 15.0 17.2 Premiums— 0.5 0.6 0.6 0.6 — 0.6 Other revenue (0.1) (0.2) (0.4) (0.2) (0.2) (0.1) (0.2) Total operating revenues 14.9 20.9 18.6 17.0 17.6 14.9 17.6 Operating benefits and expenses Interest credited and other benefits to contract owners/policyholders (7.2) (19.5) (7.5) (7.5) (8.8) (7.2) (8.8) Operating expenses (2.6) (2.3) (2.5) (2.8) (3.3) (2.6) (3.3) Net amortization of DAC/VOBA— (0.1) (0.1) (0.1) (0.1) — (0.1) Total operating benefits and expenses (9.8) (21.9) (10.1) (10.4) (12.2) (9.8) (12.2) Operating earnings before income taxes 5.1 (1.0) 8.5 6.6 5.4 5.1 5.4 Three Months Ended Year-to-Date 3/31/15 12/31/14 9/30/14 6/30/14 3/31/14 3/31/15 3/31/14 Closed Block Other Operating revenues Net investment income and net realized gains (losses) 5.5 5.7 6.0 6.2 5.9 5.5 5.9 Premiums 1.2 1.1 0.6 0.9 1.9 1.2 1.9 Other revenue 0.3 — 0.2 (0.1) 0.2 0.3 0.2 Total operating revenues 7.0 6.8 6.8 7.0 8.0 7.0 8.0 Operating benefits and expenses Interest credited and other benefits to contract owners/policyholders 3.4 (1.1) (0.4) (1.4) (6.7) 3.4 (6.7) Operating expenses (1.7) (1.9) (4.4) (1.7) (5.8) (1.7) (5.8) Total operating benefits and expenses 1.7 (3.0) (4.8) (3.1) (12.5) 1.7 (12.5) Operating earnings before income taxes 8.7 3.8 2.0 3.9 (4.5) 8.7 (4.5)
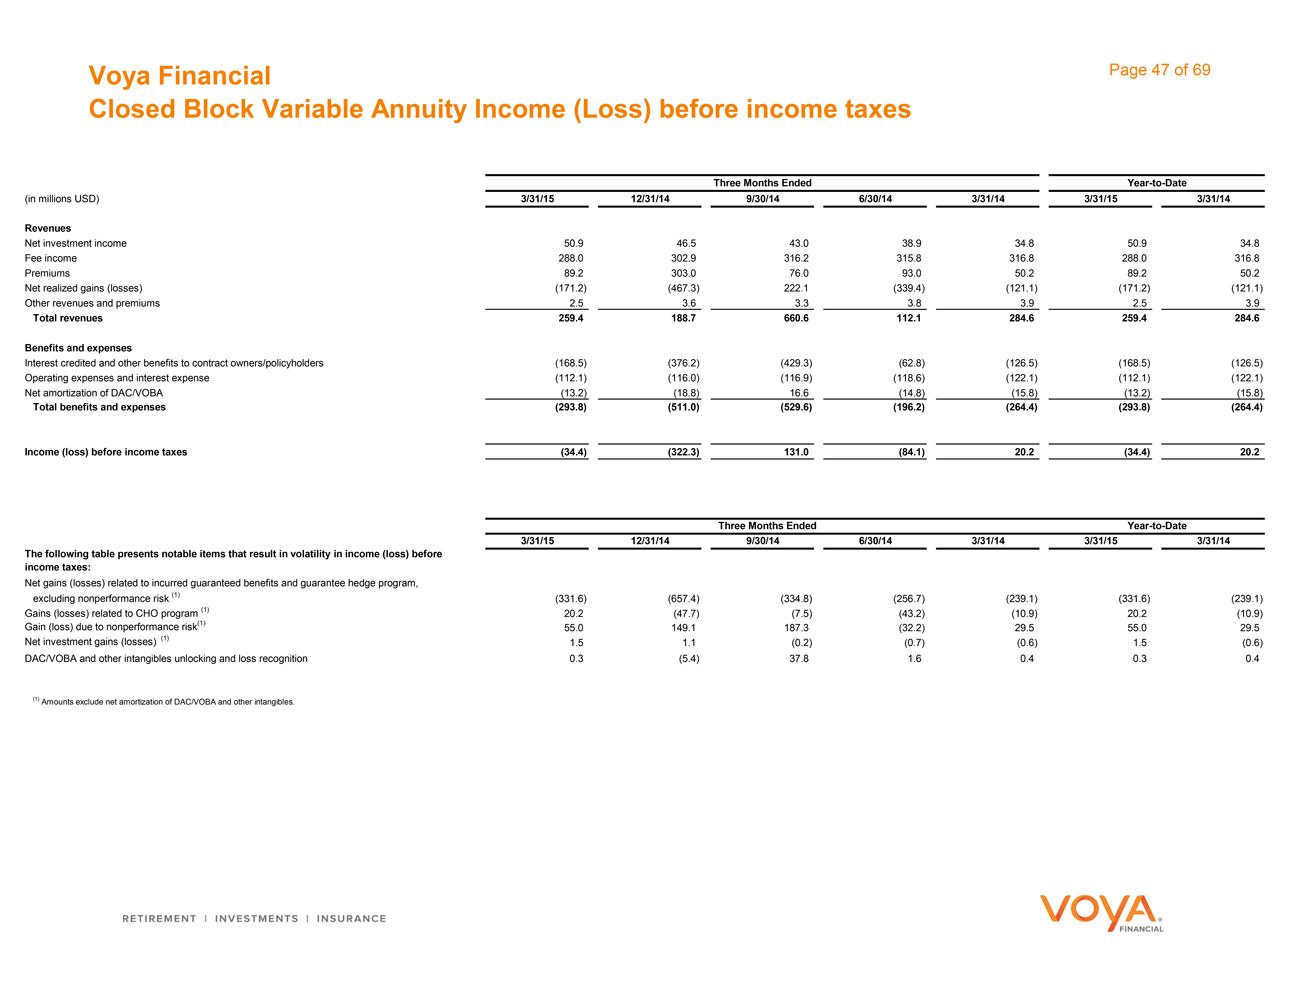
Voya Financial Closed Block Variable Annuity Income (Loss) before income taxes Page 47 of 69 Year-to-Date Three Months Ended (in millions USD) 3/31/15 12/31/14 9/30/14 6/30/14 3/31/14 3/31/15 3/31/14 Revenues Net investment income 50.9 46.5 43.0 38.9 34.8 50.9 34.8 Fee income 288.0 302.9 316.2 315.8 316.8 288.0 316.8 Premiums 89.2 303.0 76.0 93.0 50.2 89.2 50.2 Net realized gains (losses) (171.2) (467.3) 222.1 (339.4) (121.1) (171.2) (121.1) Other revenues and premiums 2.5 3.6 3.3 3.8 3.9 2.5 3.9 Total revenues 259.4 188.7 660.6 112.1 284.6 259.4 284.6 Benefits and expenses Interest credited and other benefits to contract owners/policyholders (168.5) (376.2) (429.3) (62.8) (126.5) (168.5) (126.5) Operating expenses and interest expense (112.1) (116.0) (116.9) (118.6) (122.1) (112.1) (122.1) Net amortization of DAC/VOBA (13.2) (18.8) 16.6 (14.8) (15.8) (13.2) (15.8) Total benefits and expenses (293.8) (511.0) (529.6) (196.2) (264.4) (293.8) (264.4) Income (loss) before income taxes (34.4) (322.3) 131.0 (84.1) 20.2 (34.4) 20.2 Year-to-Date Three Months Ended 3/31/15 12/31/14 9/30/14 6/30/14 3/31/14 3/31/15 3/31/14 The following table presents notable items that result in volatility in income (loss) before income taxes: Net gains (losses) related to incurred guaranteed benefits and guarantee hedge program, excluding nonperformance risk (1) (331.6) (657.4) (334.8) (256.7) (239.1) (331.6) (239.1) Gains (losses) related to CHO program (1) 20.2 (47.7) (7.5) (43.2) (10.9) 20.2 (10.9) Gain (loss) due to nonperformance risk(1) 55.0 149.1 187.3 (32.2) 29.5 55.0 29.5 Net investment gains (losses) (1) 1.5 1.1 (0.2) (0.7) (0.6) 1.5 (0.6) DAC/VOBA and other intangibles unlocking and loss recognition 0.3 (5.4) 37.8 1.6 0.4 0.3 0.4 (1) Amounts exclude net amortization of DAC/VOBA and other intangibles.
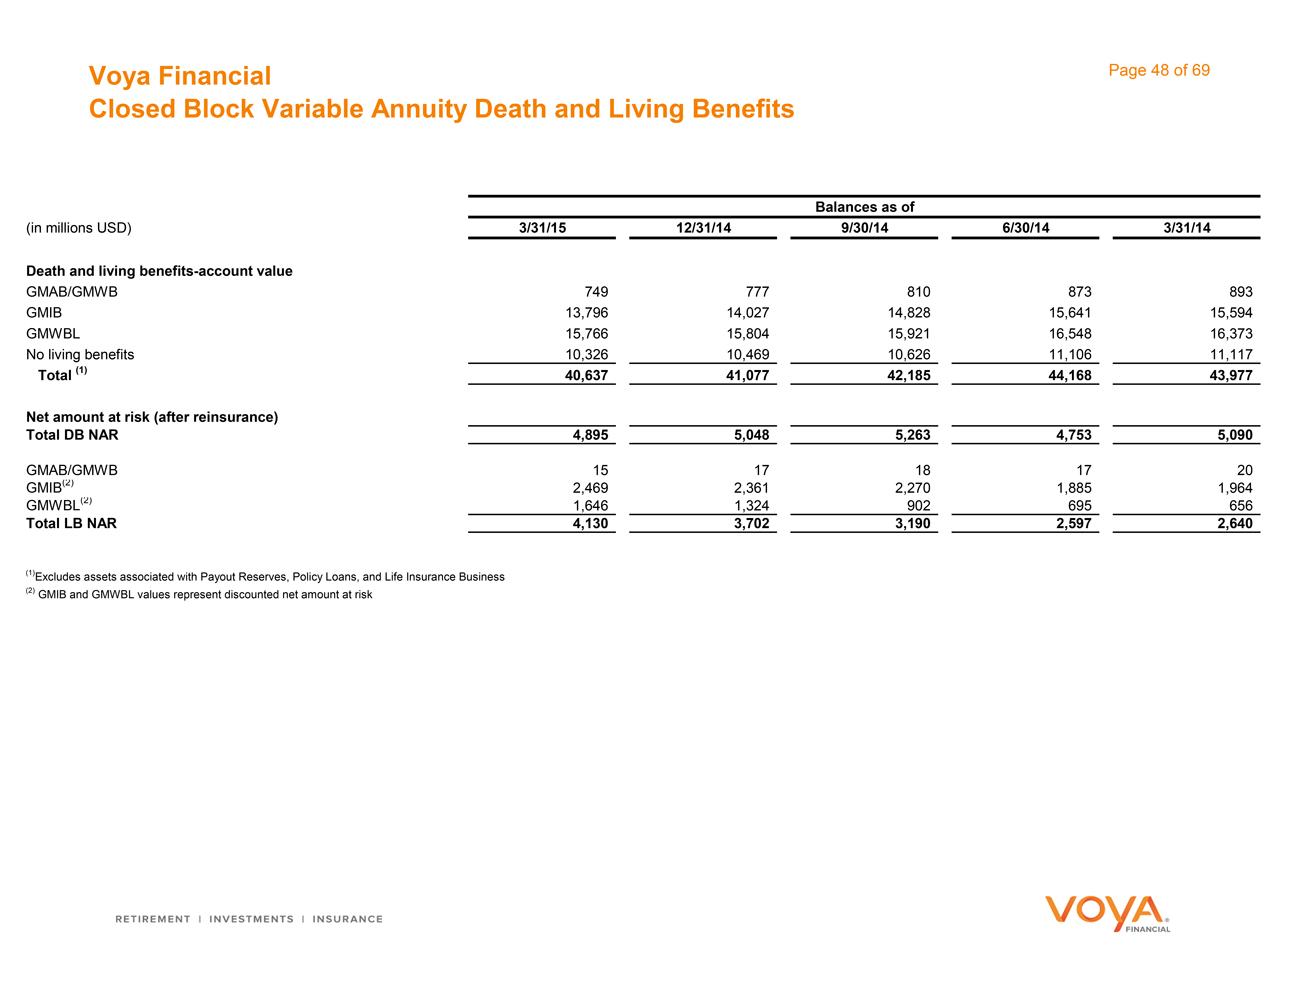
Voya Financial Closed Block Variable Annuity Death and Living Benefits Page 48 of 69 Balances as of (in millions USD) 3/31/15 12/31/14 9/30/14 6/30/14 3/31/14 Death and living benefits-account value GMAB/GMWB 749 777 810 873 893 GMIB 13,796 14,027 14,828 15,641 15,594 GMWBL 15,766 15,804 15,921 16,548 16,373 No living benefits 10,326 10,469 10,626 11,106 11,117 Total (1) 40,637 41,077 42,185 44,168 43,977 Net amount at risk (after reinsurance) Total DB NAR 4,895 5,048 5,263 4,753 5,090 GMAB/GMWB 15 17 18 17 20 GMIB(2) 2,469 2,361 2,270 1,885 1,964 GMWBL(2) 1,646 1,324 902 695 656 Total LB NAR 4,130 3,702 3,190 2,597 2,640 (1)Excludes assets associated with Payout Reserves, Policy Loans, and Life Insurance Business (2) GMIB and GMWBL values represent discounted net amount at risk
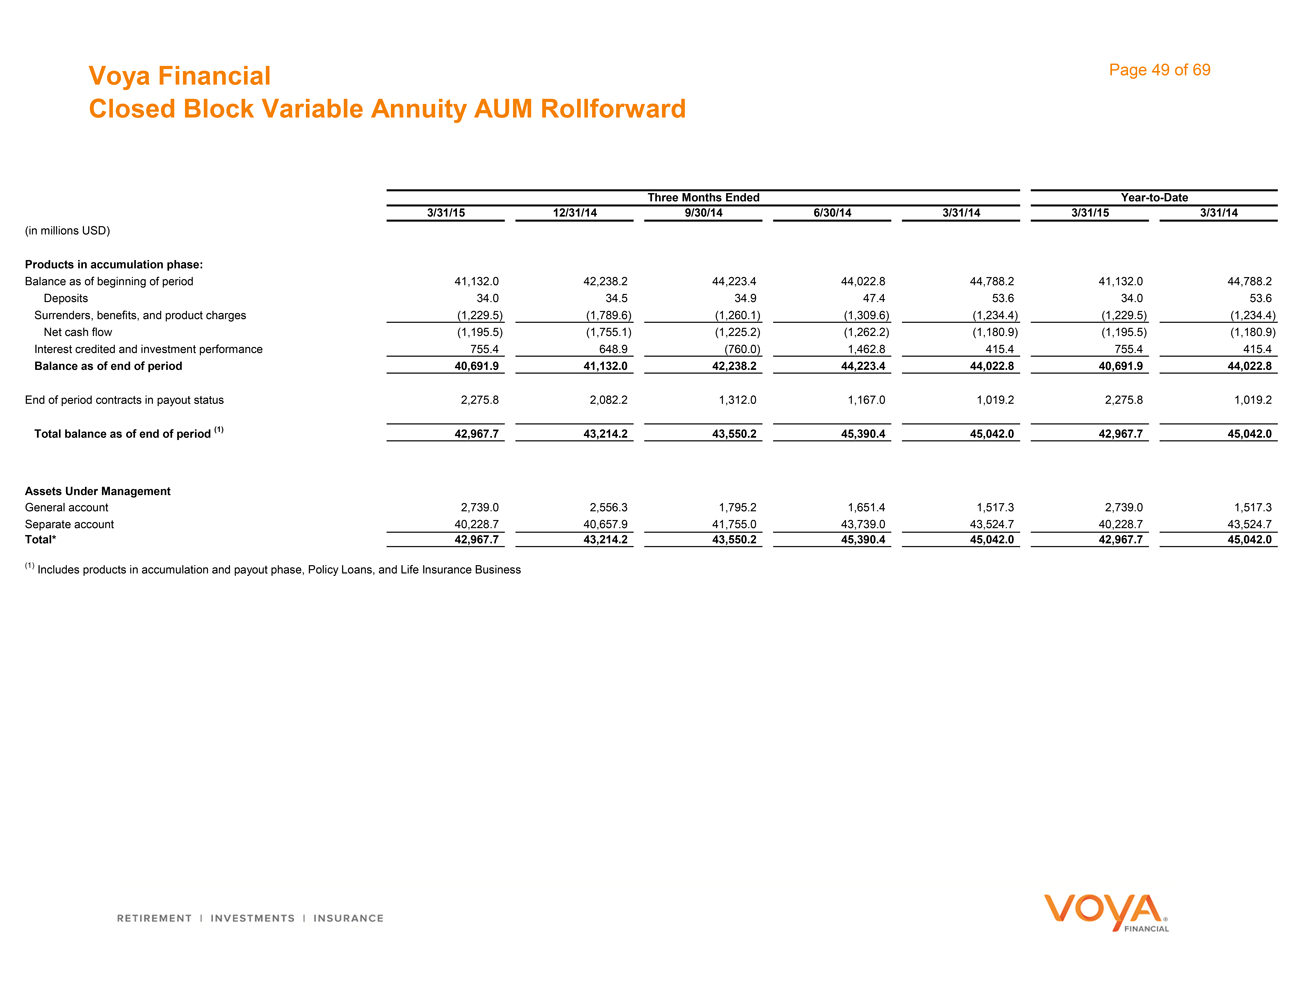
Voya Financial Closed Block Variable Annuity AUM Rollforward Page 49 of 69 Three Months Ended Year-to-Date 3/31/15 12/31/14 9/30/14 6/30/14 3/31/14 3/31/15 3/31/14 (in millions USD) Products in accumulation phase: Balance as of beginning of period 41,132.0 42,238.2 44,223.4 44,022.8 44,788.2 41,132.0 44,788.2 Deposits 34.0 34.5 34.9 47.4 53.6 34.0 53.6 Surrenders, benefits, and product charges (1,229.5) (1,789.6) (1,260.1) (1,309.6) (1,234.4) (1,229.5) (1,234.4) Net cash flow (1,195.5) (1,755.1) (1,225.2) (1,262.2) (1,180.9) (1,195.5) (1,180.9) Interest credited and investment performance 755.4 648.9 (760.0) 1,462.8 415.4 755.4 415.4 Balance as of end of period 40,691.9 41,132.0 42,238.2 44,223.4 44,022.8 40,691.9 44,022.8 End of period contracts in payout status 2,275.8 2,082.2 1,312.0 1,167.0 1,019.2 2,275.8 1,019.2 Total balance as of end of period (1) 42,967.7 43,214.2 43,550.2 45,390.4 45,042.0 42,967.7 45,042.0 Assets Under Management General account 2,739.0 2,556.3 1,795.2 1,651.4 1,517.3 2,739.0 1,517.3 Separate account 40,228.7 40,657.9 41,755.0 43,739.0 43,524.7 40,228.7 43,524.7 Total* 42,967.7 43,214.2 43,550.2 45,390.4 45,042.0 42,967.7 45,042.0 (1) Includes products in accumulation and payout phase, Policy Loans, and Life Insurance Business

Investment Information
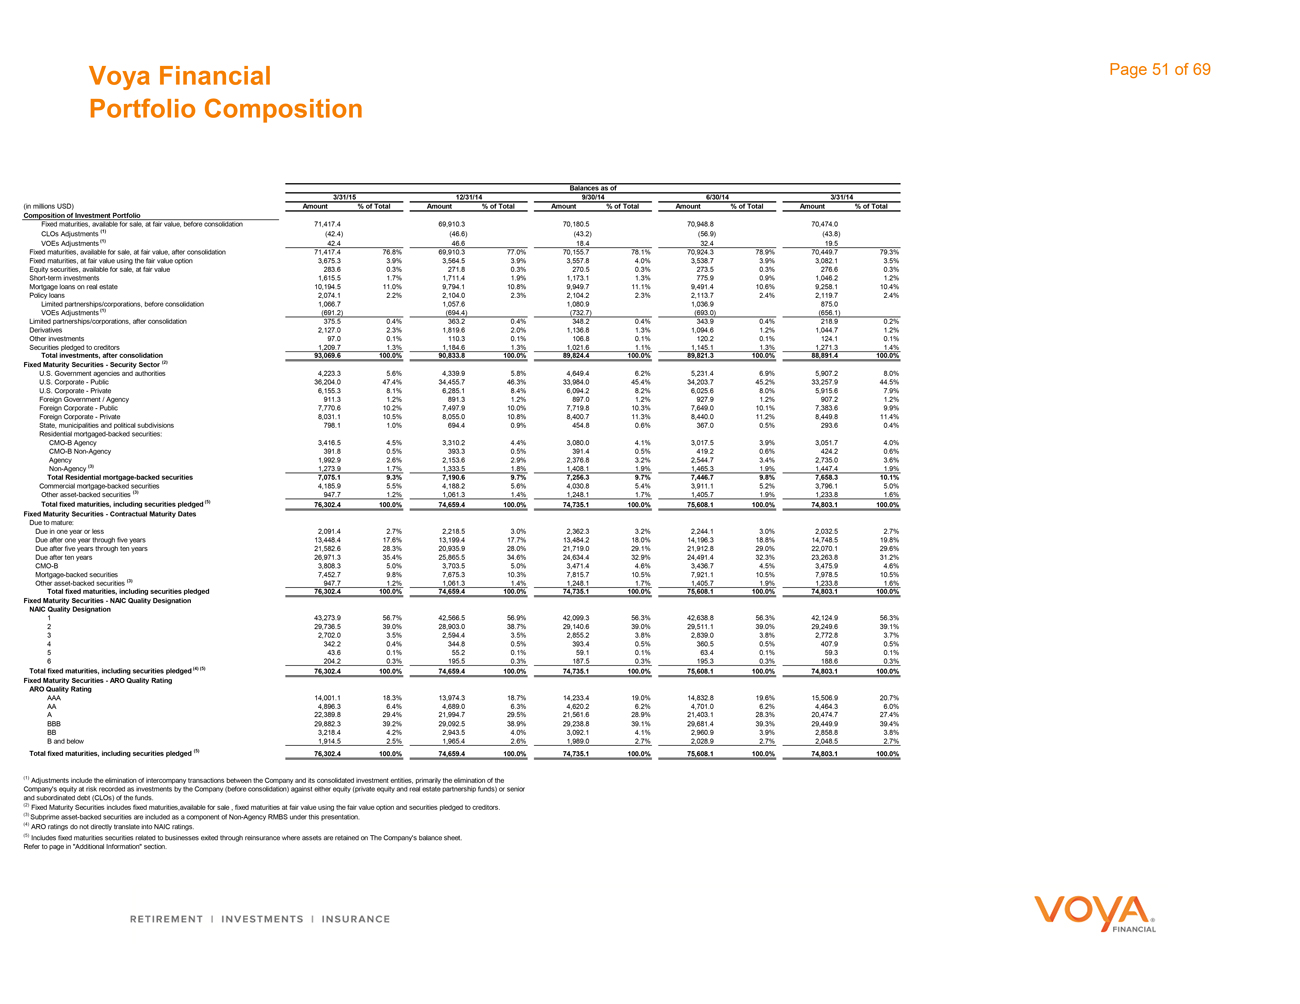
Voya Financial Portfolio Composition Page 51 of 69 Balances as of 3/31/15 12/31/14 9/30/14 6/30/14 3/31/14 (in millions USD) Amount % of Total Amount % of Total Amount % of Total Amount % of Total Amount % of Total Composition of Investment Portfolio Fixed maturities, available for sale, at fair value, before consolidation 71,417.4 69,910.3 70,180.5 70,948.8 70,474.0 CLOs Adjustments (1) (42.4) (46.6) (43.2) (56.9) (43.8) VOEs Adjustments (1) 42.4 46.6 18.4 32.4 19.5 Fixed maturities, available for sale, at fair value, after consolidation 71,417.4 76.8% 69,910.3 77.0% 70,155.7 78.1% 70,924.3 78.9% 70,449.7 79.3% Fixed maturities, at fair value using the fair value option 3,675.3 3.9% 3,564.5 3.9% 3,557.8 4.0% 3,538.7 3.9% 3,082.1 3.5% Equity securities, available for sale, at fair value 283.6 0.3% 271.8 0.3% 270.5 0.3% 273.5 0.3% 276.6 0.3% Short-term investments 1,615.5 1.7% 1,711.4 1.9% 1,173.1 1.3% 775.9 0.9% 1,046.2 1.2% Mortgage loans on real estate 10,194.5 11.0% 9,794.1 10.8% 9,949.7 11.1% 9,491.4 10.6% 9,258.1 10.4% Policy loans 2,074.1 2.2% 2,104.0 2.3% 2,104.2 2.3% 2,113.7 2.4% 2,119.7 2.4% Limited partnerships/corporations, before consolidation 1,066.7 1,057.6 1,080.9 1,036.9 875.0 VOEs Adjustments (1) (691.2) (694.4) (732.7) (693.0) (656.1) Limited partnerships/corporations, after consolidation 375.5 0.4% 363.2 0.4% 348.2 0.4% 343.9 0.4% 218.9 0.2% Derivatives 2,127.0 2.3% 1,819.6 2.0% 1,136.8 1.3% 1,094.6 1.2% 1,044.7 1.2% Other investments 97.0 0.1% 110.3 0.1% 106.8 0.1% 120.2 0.1% 124.1 0.1% Securities pledged to creditors 1,209.7 1.3% 1,184.6 1.3% 1,021.6 1.1% 1,145.1 1.3% 1,271.3 1.4% Total investments, after consolidation 93,069.6 100.0% 90,833.8 100.0% 89,824.4 100.0% 89,821.3 100.0% 88,891.4 100.0% Fixed Maturity Securities—Security Sector (2) U.S. Government agencies and authorities 4,223.3 5.6% 4,339.9 5.8% 4,649.4 6.2% 5,231.4 6.9% 5,907.2 8.0% U.S. Corporate—Public 36,204.0 47.4% 34,455.7 46.3% 33,984.0 45.4% 34,203.7 45.2% 33,257.9 44.5% U.S. Corporate—Private 6,155.3 8.1% 6,285.1 8.4% 6,094.2 8.2% 6,025.6 8.0% 5,915.6 7.9% Foreign Government / Agency 911.3 1.2% 891.3 1.2% 897.0 1.2% 927.9 1.2% 907.2 1.2% Foreign Corporate—Public 7,770.6 10.2% 7,497.9 10.0% 7,719.8 10.3% 7,649.0 10.1% 7,383.6 9.9% Foreign Corporate—Private 8,031.1 10.5% 8,055.0 10.8% 8,400.7 11.3% 8,440.0 11.2% 8,449.8 11.4% State, municipalities and political subdivisions 798.1 1.0% 694.4 0.9% 454.8 0.6% 367.0 0.5% 293.6 0.4% Residential mortgaged-backed securities: CMO-B Agency 3,416.5 4.5% 3,310.2 4.4% 3,080.0 4.1% 3,017.5 3.9% 3,051.7 4.0% CMO-B Non-Agency 391.8 0.5% 393.3 0.5% 391.4 0.5% 419.2 0.6% 424.2 0.6% Agency 1,992.9 2.6% 2,153.6 2.9% 2,376.8 3.2% 2,544.7 3.4% 2,735.0 3.6% Non-Agency (3) 1,273.9 1.7% 1,333.5 1.8% 1,408.1 1.9% 1,465.3 1.9% 1,447.4 1.9% Total Residential mortgage-backed securities 7,075.1 9.3% 7,190.6 9.7% 7,256.3 9.7% 7,446.7 9.8% 7,658.3 10.1% Commercial mortgage-backed securities 4,185.9 5.5% 4,188.2 5.6% 4,030.8 5.4% 3,911.1 5.2% 3,796.1 5.0% Other asset-backed securities (3) 947.7 1.2% 1,061.3 1.4% 1,248.1 1.7% 1,405.7 1.9% 1,233.8 1.6% Total fixed maturities, including securities pledged (5) 76,302.4 100.0% 74,659.4 100.0% 74,735.1 100.0% 75,608.1 100.0% 74,803.1 100.0% Fixed Maturity Securities—Contractual Maturity Dates Due to mature: Due in one year or less 2,091.4 2.7% 2,218.5 3.0% 2,362.3 3.2% 2,244.1 3.0% 2,032.5 2.7% Due after one year through five years 13,448.4 17.6% 13,199.4 17.7% 13,484.2 18.0% 14,196.3 18.8% 14,748.5 19.8% Due after five years through ten years 21,582.6 28.3% 20,935.9 28.0% 21,719.0 29.1% 21,912.8 29.0% 22,070.1 29.6% Due after ten years 26,971.3 35.4% 25,865.5 34.6% 24,634.4 32.9% 24,491.4 32.3% 23,263.8 31.2% CMO-B 3,808.3 5.0% 3,703.5 5.0% 3,471.4 4.6% 3,436.7 4.5% 3,475.9 4.6% Mortgage-backed securities 7,452.7 9.8% 7,675.3 10.3% 7,815.7 10.5% 7,921.1 10.5% 7,978.5 10.5% Other asset-backed securities (3) 947.7 1.2% 1,061.3 1.4% 1,248.1 1.7% 1,405.7 1.9% 1,233.8 1.6% Total fixed maturities, including securities pledged 76,302.4 100.0% 74,659.4 100.0% 74,735.1 100.0% 75,608.1 100.0% 74,803.1 100.0% Fixed Maturity Securities—NAIC Quality Designation NAIC Quality Designation 1 43,273.9 56.7% 42,566.5 56.9% 42,099.3 56.3% 42,638.8 56.3% 42,124.9 56.3% 2 29,736.5 39.0% 28,903.0 38.7% 29,140.6 39.0% 29,511.1 39.0% 29,249.6 39.1% 3 2,702.0 3.5% 2,594.4 3.5% 2,855.2 3.8% 2,839.0 3.8% 2,772.8 3.7% 4 342.2 0.4% 344.8 0.5% 393.4 0.5% 360.5 0.5% 407.9 0.5% 5 43.6 0.1% 55.2 0.1% 59.1 0.1% 63.4 0.1% 59.3 0.1% 6 204.2 0.3% 195.5 0.3% 187.5 0.3% 195.3 0.3% 188.6 0.3% Total fixed maturities, including securities pledged (4) (5) 76,302.4 100.0% 74,659.4 100.0% 74,735.1 100.0% 75,608.1 100.0% 74,803.1 100.0% Fixed Maturity Securities—ARO Quality Rating ARO Quality Rating AAA 14,001.1 18.3% 13,974.3 18.7% 14,233.4 19.0% 14,832.8 19.6% 15,506.9 20.7% AA 4,896.3 6.4% 4,689.0 6.3% 4,620.2 6.2% 4,701.0 6.2% 4,464.3 6.0% A 22,389.8 29.4% 21,994.7 29.5% 21,561.6 28.9% 21,403.1 28.3% 20,474.7 27.4% BBB 29,882.3 39.2% 29,092.5 38.9% 29,238.8 39.1% 29,681.4 39.3% 29,449.9 39.4% BB 3,218.4 4.2% 2,943.5 4.0% 3,092.1 4.1% 2,960.9 3.9% 2,858.8 3.8% B and below 1,914.5 2.5% 1,965.4 2.6% 1,989.0 2.7% 2,028.9 2.7% 2,048.5 2.7% Total fixed maturities, including securities pledged (5) 76,302.4 100.0% 74,659.4 100.0% 74,735.1 100.0% 75,608.1 100.0% 74,803.1 100.0% (1) Adjustments include the elimination of intercompany transactions between the Company and its consolidated investment entities, primarily the elimination of the Company’s equity at risk recorded as investments by the Company (before consolidation) against either equity (private equity and real estate partnership funds) or senior and subordinated debt (CLOs) of the funds. (2) Fixed Maturity Securities includes fixed maturities,available for sale , fixed maturities at fair value using the fair value option and securities pledged to creditors. (3) Subprime asset-backed securities are included as a component of Non-Agency RMBS under this presentation. (4) ARO ratings do not directly translate into NAIC ratings. (5) Includes fixed maturities securities related to businesses exited through reinsurance where assets are retained on The Company’s balance sheet. Refer to page in “Additional Information” section.
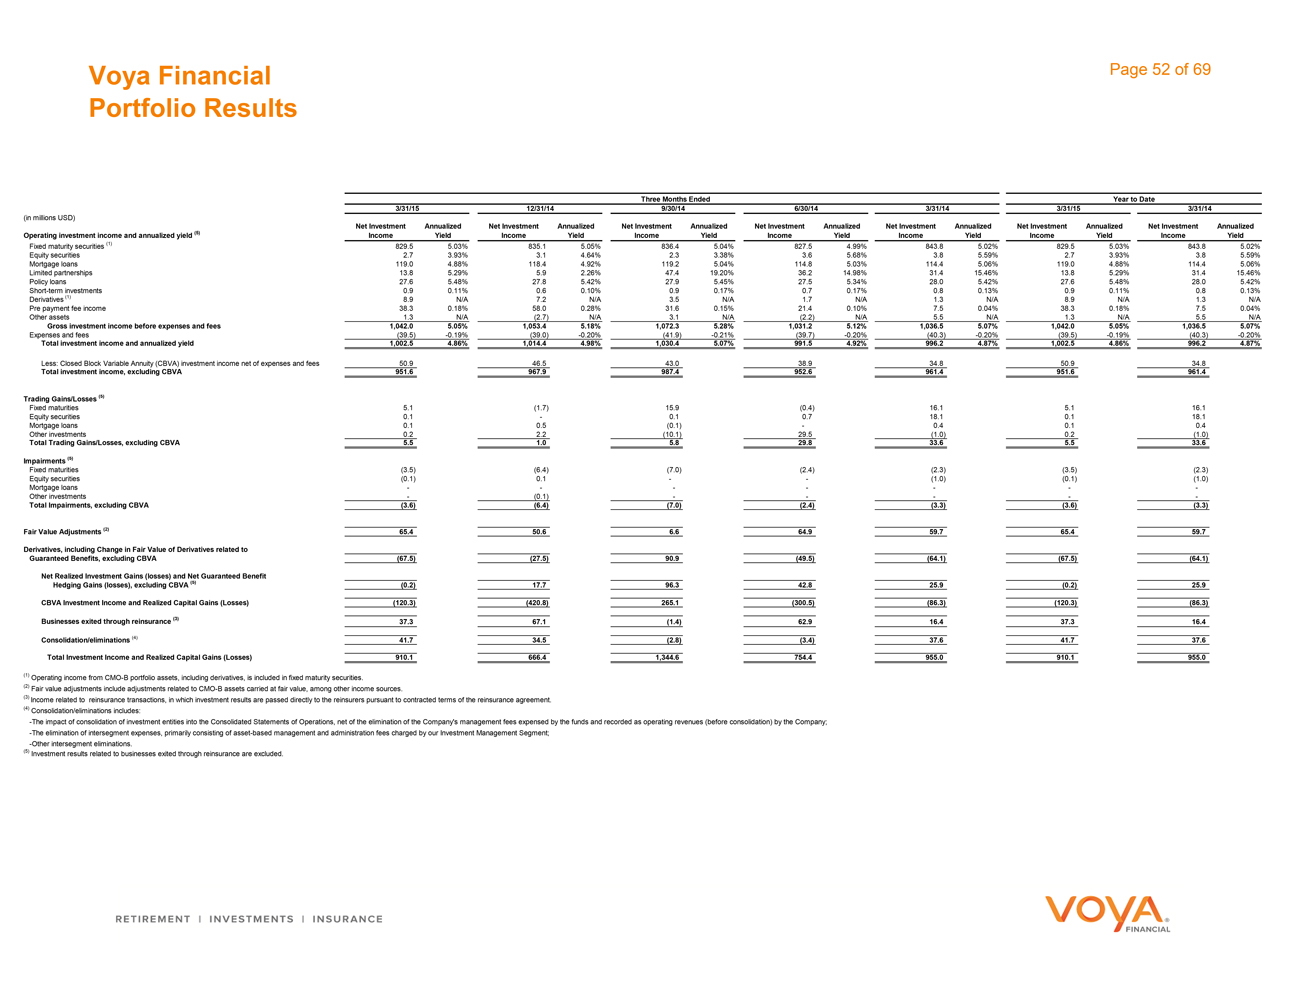
Voya Financial Portfolio Results Page 52 of 69 Three Months Ended Year to Date 3/31/15 3/31/14 3/31/15 12/31/14 9/30/14 6/30/14 3/31/14 (in millions USD) Operating investment income and annualized yield (5) Net Investment Income Annualized Yield Net Investment Income Annualized Yield Net Investment Income Annualized Yield Net Investment Income Annualized Yield Net Investment Income Annualized Yield Net Investment Income Annualized Yield Net Investment Income Annualized Yield Fixed maturity securities (1) 829.5 5.03% 835.1 5.05% 836.4 5.04% 827.5 4.99% 843.8 5.02% 829.5 5.03% 843.8 5.02% Equity securities 2.7 3.93% 3.1 4.64% 2.3 3.38% 3.6 5.68% 3.8 5.59% 2.7 3.93% 3.8 5.59% Mortgage loans 119.0 4.88% 118.4 4.92% 119.2 5.04% 114.8 5.03% 114.4 5.06% 119.0 4.88% 114.4 5.06% Limited partnerships 13.8 5.29% 5.9 2.26% 47.4 19.20% 36.2 14.98% 31.4 15.46% 13.8 5.29% 31.4 15.46% Policy loans 27.6 5.48% 27.8 5.42% 27.9 5.45% 27.5 5.34% 28.0 5.42% 27.6 5.48% 28.0 5.42% Short-term investments 0.9 0.11% 0.6 0.10% 0.9 0.17% 0.7 0.17% 0.8 0.13% 0.9 0.11% 0.8 0.13% Derivatives (1) 8.9 N/A 7.2 N/A 3.5 N/A 1.7 N/A 1.3 N/A 8.9 N/A 1.3 N/A Pre payment fee income 38.3 0.18% 58.0 0.28% 31.6 0.15% 21.4 0.10% 7.5 0.04% 38.3 0.18% 7.5 0.04% Other assets 1.3 N/A (2.7) N/A 3.1 N/A (2.2) N/A 5.5 N/A 1.3 N/A 5.5 N/A Gross investment income before expenses and fees 1,042.0 5.05% 1,053.4 5.18% 1,072.3 5.28% 1,031.2 5.12% 1,036.5 5.07% 1,042.0 5.05% 1,036.5 5.07% Expenses and fees (39.5) -0.19% (39.0) -0.20% (41.9) -0.21% (39.7) -0.20% (40.3) -0.20% (39.5) -0.19% (40.3) -0.20% Total investment income and annualized yield 1,002.5 4.86% 1,014.4 4.98% 1,030.4 5.07% 991.5 4.92% 996.2 4.87% 1,002.5 4.86% 996.2 4.87% Less: Closed Block Variable Annuity (CBVA) investment income net of expenses and fees 50.9 46.5 43.0 38.9 34.8 50.9 34.8 Total investment income, excluding CBVA 951.6 967.9 987.4 952.6 961.4 951.6 961.4 Trading Gains/Losses (5) Fixed maturities 5.1 (1.7) 15.9 (0.4) 16.1 5.1 16.1 Equity securities 0.1— 0.1 0.7 18.1 0.1 18.1 Mortgage loans 0.1 0.5 (0.1) — 0.4 0.1 0.4 Other investments 0.2 2.2 (10.1) 29.5 (1.0) 0.2 (1.0) Total Trading Gains/Losses, excluding CBVA 5.5 1.0 5.8 29.8 33.6 5.5 33.6 Impairments (5) Fixed maturities (3.5) (6.4) (7.0) (2.4) (2.3) (3.5) (2.3) Equity securities (0.1) 0.1 —— (1.0) (0.1) (1.0) Mortgage loans——————— Other investments— (0.1) ————— Total Impairments, excluding CBVA (3.6) (6.4) (7.0) (2.4) (3.3) (3.6) (3.3) Fair Value Adjustments (2) 65.4 50.6 6.6 64.9 59.7 65.4 59.7 Derivatives, including Change in Fair Value of Derivatives related to Guaranteed Benefits, excluding CBVA (67.5) (27.5) 90.9 (49.5) (64.1) (67.5) (64.1) Net Realized Investment Gains (losses) and Net Guaranteed Benefit Hedging Gains (losses), excluding CBVA (5) (0.2) 17.7 96.3 42.8 25.9 (0.2) 25.9 CBVA Investment Income and Realized Capital Gains (Losses) (120.3) (420.8) 265.1 (300.5) (86.3) (120.3) (86.3) Businesses exited through reinsurance (3) 37.3 67.1 (1.4) 62.9 16.4 37.3 16.4 Consolidation/eliminations (4) 41.7 34.5 (2.8) (3.4) 37.6 41.7 37.6 Total Investment Income and Realized Capital Gains (Losses) 910.1 666.4 1,344.6 754.4 955.0 910.1 955.0 (1) Operating income from CMO-B portfolio assets, including derivatives, is included in fixed maturity securities. (2) Fair value adjustments include adjustments related to CMO-B assets carried at fair value, among other income sources. (3) Income related to reinsurance transactions, in which investment results are passed directly to the reinsurers pursuant to contracted terms of the reinsurance agreement. (4) Consolidation/eliminations includes: -The impact of consolidation of investment entities into the Consolidated Statements of Operations, net of the elimination of the Company’s management fees expensed by the funds and recorded as operating revenues (before consolidation) by the Company; -The elimination of intersegment expenses, primarily consisting of asset-based management and administration fees charged by our Investment Management Segment; -Other intersegment eliminations. (5) Investment results related to businesses exited through reinsurance are excluded.
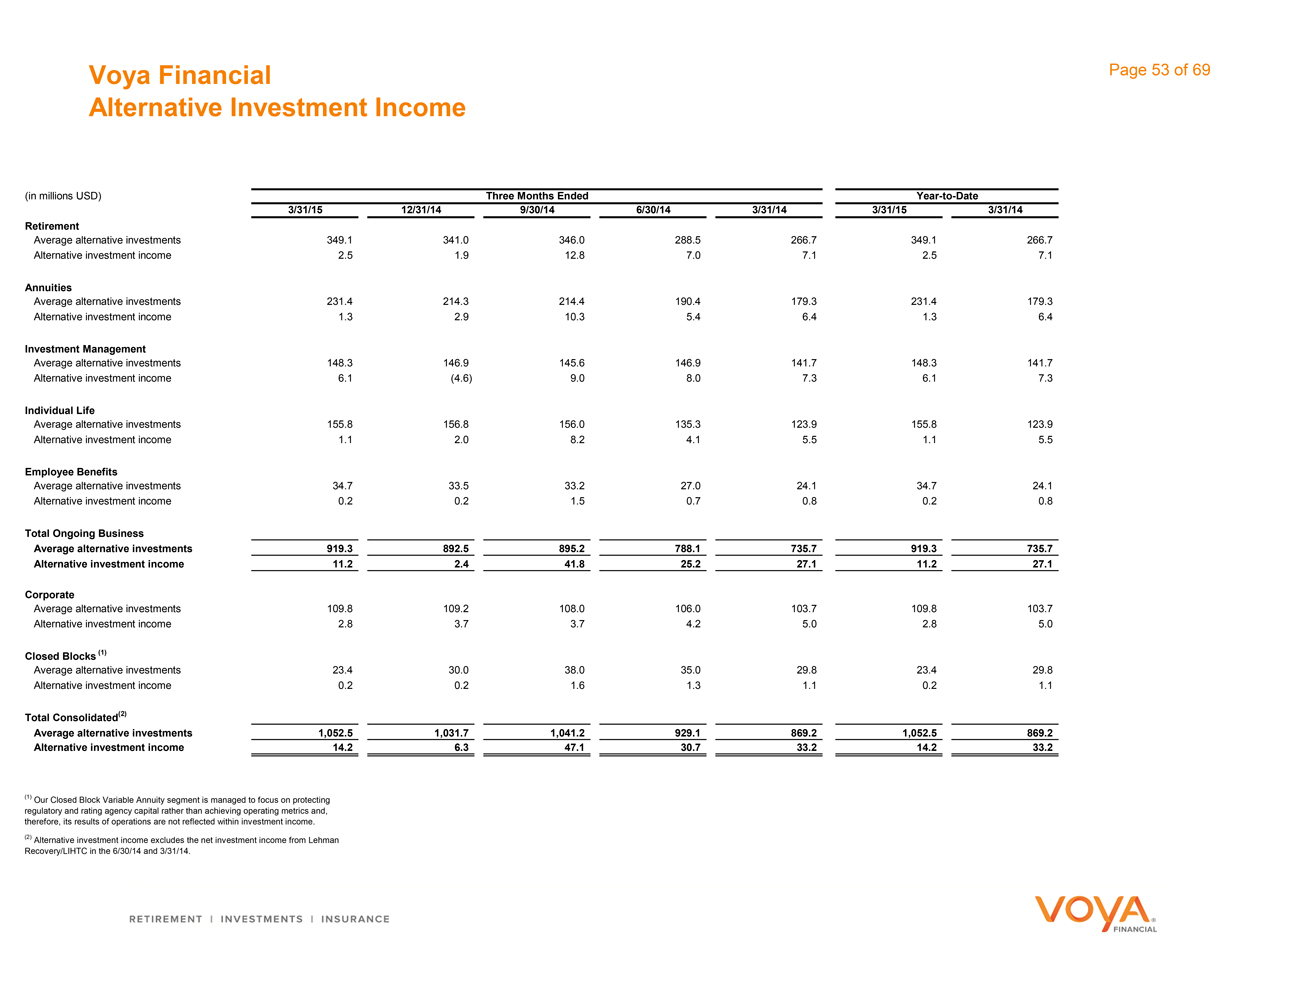
Voya Financial Alternative Investment Income Page 53 of 69 (in millions USD) Three Months Ended Year-to-Date 3/31/15 12/31/14 9/30/14 6/30/14 3/31/14 3/31/15 3/31/14 Retirement Average alternative investments 349.1 341.0 346.0 288.5 266.7 349.1 266.7 Alternative investment income 2.5 1.9 12.8 7.0 7.1 2.5 7.1 Annuities Average alternative investments 231.4 214.3 214.4 190.4 179.3 231.4 179.3 Alternative investment income 1.3 2.9 10.3 5.4 6.4 1.3 6.4 Investment Management Average alternative investments 148.3 146.9 145.6 146.9 141.7 148.3 141.7 Alternative investment income 6.1 (4.6) 9.0 8.0 7.3 6.1 7.3 Individual Life Average alternative investments 155.8 156.8 156.0 135.3 123.9 155.8 123.9 Alternative investment income 1.1 2.0 8.2 4.1 5.5 1.1 5.5 Employee Benefits Average alternative investments 34.7 33.5 33.2 27.0 24.1 34.7 24.1 Alternative investment income 0.2 0.2 1.5 0.7 0.8 0.2 0.8 Total Ongoing Business Average alternative investments 919.3 892.5 895.2 788.1 735.7 919.3 735.7 Alternative investment income 11.2 2.4 41.8 25.2 27.1 11.2 27.1 Corporate Average alternative investments 109.8 109.2 108.0 106.0 103.7 109.8 103.7 Alternative investment income 2.8 3.7 3.7 4.2 5.0 2.8 5.0 Closed Blocks (1) Average alternative investments 23.4 30.0 38.0 35.0 29.8 23.4 29.8 Alternative investment income 0.2 0.2 1.6 1.3 1.1 0.2 1.1 Total Consolidated(2) Average alternative investments 1,052.5 1,031.7 1,041.2 929.1 869.2 1,052.5 869.2 Alternative investment income 14.2 6.3 47.1 30.7 33.2 14.2 33.2 (1) Our Closed Block Variable Annuity segment is managed to focus on protecting regulatory and rating agency capital rather than achieving operating metrics and, therefore, its results of operations are not reflected within investment income. (2) Alternative investment income excludes the net investment income from Lehman Recovery/LIHTC in the 6/30/14 and 3/31/14.
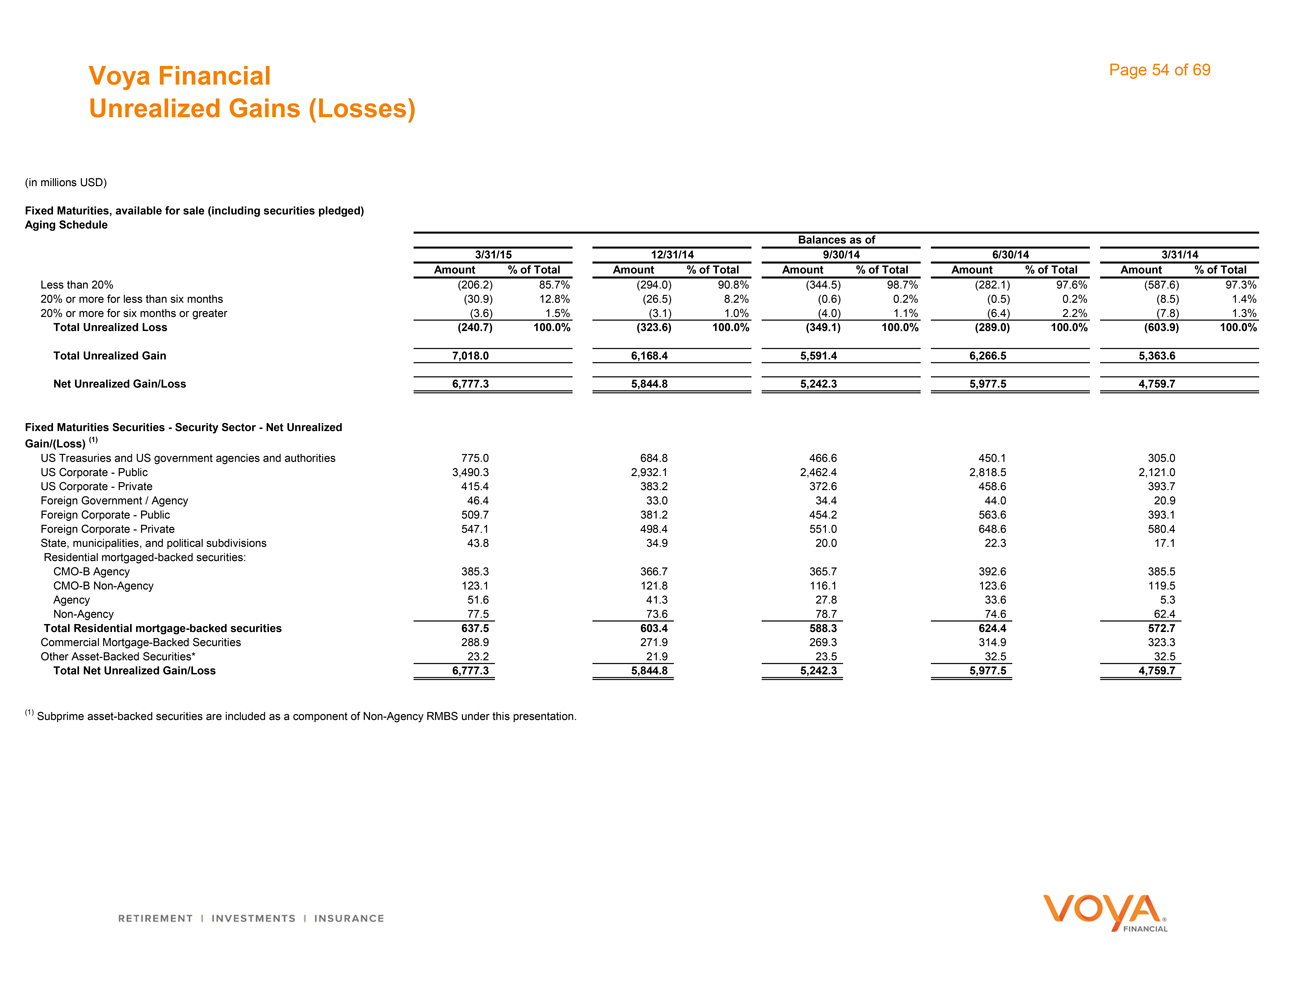
Voya Financial Unrealized Gains (Losses) Page 54 of 69 (in millions USD) Fixed Maturities, available for sale (including securities pledged) Aging Schedule Balances as of 12/31/14 9/30/14 6/30/14 3/31/14 3/31/15 Amount % of Total Amount % of Total Amount % of Total Amount % of Total Amount % of Total Less than 20% (206.2) 85.7% (294.0) 90.8% (344.5) 98.7% (282.1) 97.6% (587.6) 97.3% 20% or more for less than six months (30.9) 12.8% (26.5) 8.2% (0.6) 0.2% (0.5) 0.2% (8.5) 1.4% 20% or more for six months or greater (3.6) 1.5% (3.1) 1.0% (4.0) 1.1% (6.4) 2.2% (7.8) 1.3% Total Unrealized Loss (240.7) 100.0% (323.6) 100.0% (349.1) 100.0% (289.0) 100.0% (603.9) 100.0% Total Unrealized Gain 7,018.0 6,168.4 5,591.4 6,266.5 5,363.6 Net Unrealized Gain/Loss 6,777.3 5,844.8 5,242.3 5,977.5 4,759.7 Fixed Maturities Securities—Security Sector—Net Unrealized Gain/(Loss) (1) US Treasuries and US government agencies and authorities 775.0 684.8 466.6 450.1 305.0 US Corporate—Public 3,490.3 2,932.1 2,462.4 2,818.5 2,121.0 US Corporate—Private 415.4 383.2 372.6 458.6 393.7 Foreign Government / Agency 46.4 33.0 34.4 44.0 20.9 Foreign Corporate—Public 509.7 381.2 454.2 563.6 393.1 Foreign Corporate—Private 547.1 498.4 551.0 648.6 580.4 State, municipalities, and political subdivisions 43.8 34.9 20.0 22.3 17.1 Residential mortgaged-backed securities: CMO-B Agency 385.3 366.7 365.7 392.6 385.5 CMO-B Non-Agency 123.1 121.8 116.1 123.6 119.5 Agency 51.6 41.3 27.8 33.6 5.3 Non-Agency 77.5 73.6 78.7 74.6 62.4 Total Residential mortgage-backed securities 637.5 603.4 588.3 624.4 572.7 Commercial Mortgage-Backed Securities 288.9 271.9 269.3 314.9 323.3 Other Asset-Backed Securities* 23.2 21.9 23.5 32.5 32.5 Total Net Unrealized Gain/Loss 6,777.3 5,844.8 5,242.3 5,977.5 4,759.7 (1) Subprime asset-backed securities are included as a component of Non-Agency RMBS under this presentation.
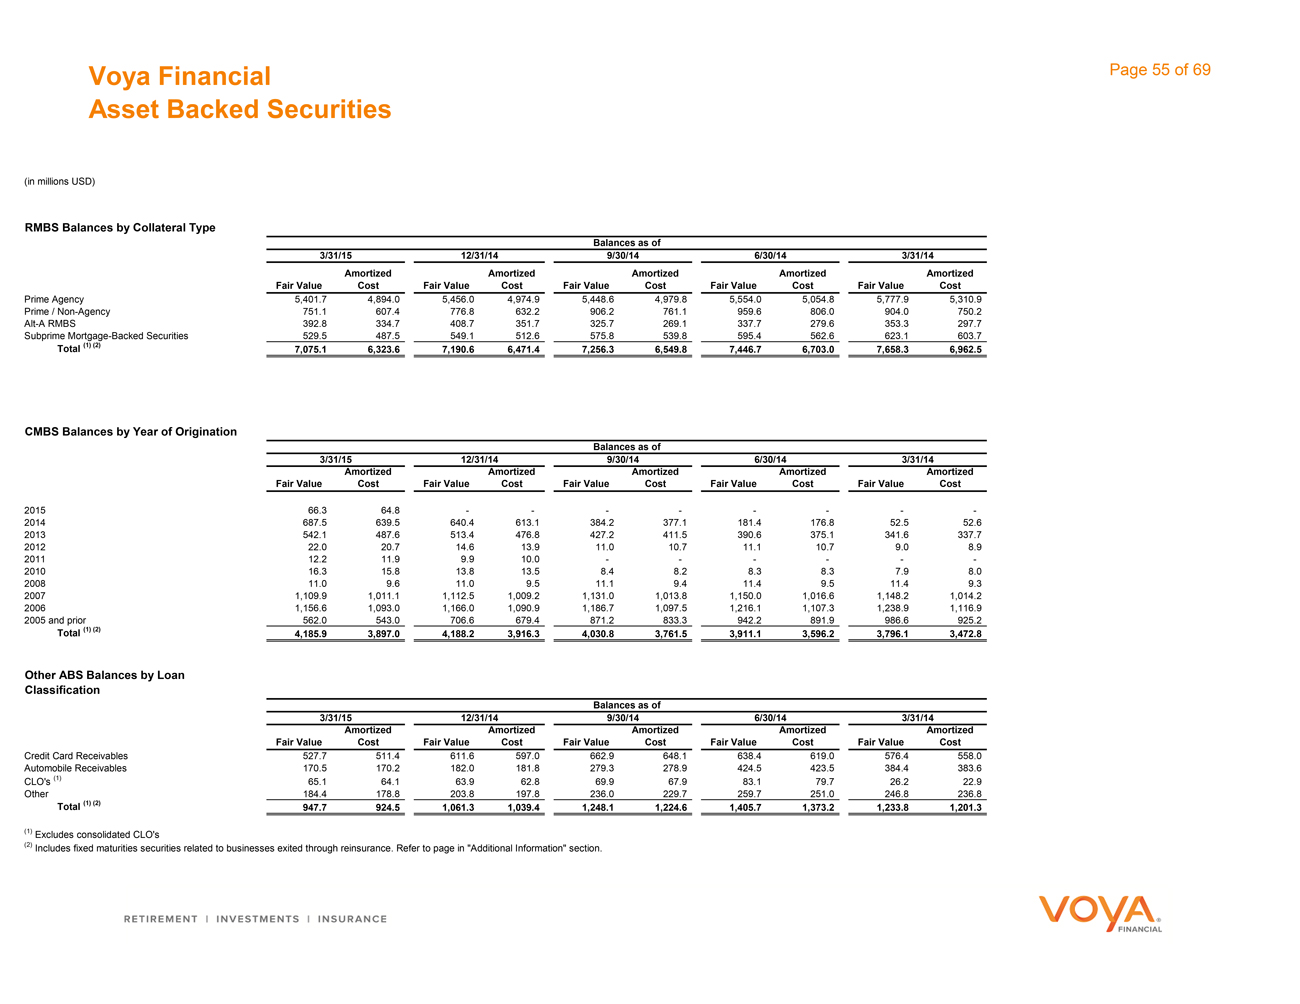
Voya Financial Asset Backed Securities Page 55 of 69 (in millions USD) RMBS Balances by Collateral Type Balances as of 3/31/15 12/31/14 9/30/14 6/30/14 3/31/14 Fair Value Amortized Cost Fair Value Amortized Cost Fair Value Amortized Cost Fair Value Amortized Cost Fair Value Amortized Cost Prime Agency 5,401.7 4,894.0 5,456.0 4,974.9 5,448.6 4,979.8 5,554.0 5,054.8 5,777.9 5,310.9 Prime / Non-Agency 751.1 607.4 776.8 632.2 906.2 761.1 959.6 806.0 904.0 750.2 Alt-A RMBS 392.8 334.7 408.7 351.7 325.7 269.1 337.7 279.6 353.3 297.7 Subprime Mortgage-Backed Securities 529.5 487.5 549.1 512.6 575.8 539.8 595.4 562.6 623.1 603.7 Total (1) (2) 7,075.1 6,323.6 7,190.6 6,471.4 7,256.3 6,549.8 7,446.7 6,703.0 7,658.3 6,962.5 CMBS Balances by Year of Origination Balances as of 3/31/15 9/30/14 6/30/14 3/31/14 12/31/14 Fair Value Amortized Cost Fair Value Amortized Cost Fair Value Amortized Cost Fair Value Amortized Cost Fair Value Amortized Cost 2015 66.3 64.8 ———————— 2014 687.5 639.5 640.4 613.1 384.2 377.1 181.4 176.8 52.5 52.6 2013 542.1 487.6 513.4 476.8 427.2 411.5 390.6 375.1 341.6 337.7 2012 22.0 20.7 14.6 13.9 11.0 10.7 11.1 10.7 9.0 8.9 2011 12.2 11.9 9.9 10.0 —————— 2010 16.3 15.8 13.8 13.5 8.4 8.2 8.3 8.3 7.9 8.0 2008 11.0 9.6 11.0 9.5 11.1 9.4 11.4 9.5 11.4 9.3 2007 1,109.9 1,011.1 1,112.5 1,009.2 1,131.0 1,013.8 1,150.0 1,016.6 1,148.2 1,014.2 2006 1,156.6 1,093.0 1,166.0 1,090.9 1,186.7 1,097.5 1,216.1 1,107.3 1,238.9 1,116.9 2005 and prior 562.0 543.0 706.6 679.4 871.2 833.3 942.2 891.9 986.6 925.2 Total (1) (2) 4,185.9 3,897.0 4,188.2 3,916.3 4,030.8 3,761.5 3,911.1 3,596.2 3,796.1 3,472.8 Other ABS Balances by Loan Classification Balances as of 3/31/15 12/31/14 9/30/14 6/30/14 3/31/14 Fair Value Amortized Cost Fair Value Amortized Cost Fair Value Amortized Cost Fair Value Amortized Cost Fair Value Amortized Cost Credit Card Receivables 527.7 511.4 611.6 597.0 662.9 648.1 638.4 619.0 576.4 558.0 Automobile Receivables 170.5 170.2 182.0 181.8 279.3 278.9 424.5 423.5 384.4 383.6 CLO’s (1) 65.1 64.1 63.9 62.8 69.9 67.9 83.1 79.7 26.2 22.9 Other 184.4 178.8 203.8 197.8 236.0 229.7 259.7 251.0 246.8 236.8 Total (1) (2) 947.7 924.5 1,061.3 1,039.4 1,248.1 1,224.6 1,405.7 1,373.2 1,233.8 1,201.3 (1) Excludes consolidated CLO’s (2) Includes fixed maturities securities related to businesses exited through reinsurance. Refer to page in “Additional Information” section.
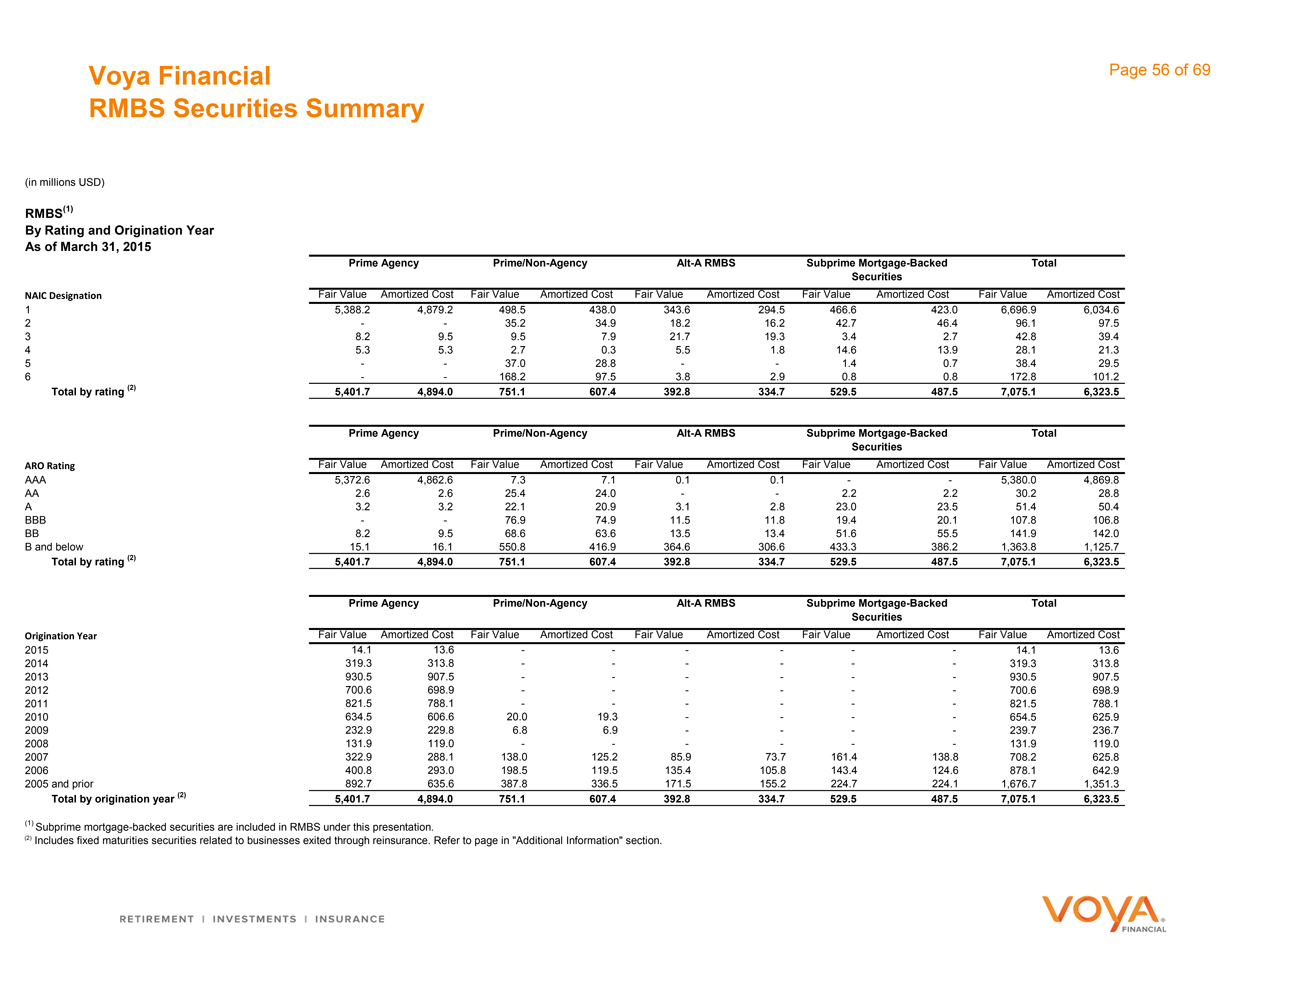
Voya Financial RMBS Securities Summary Page 56 of 69 (in millions USD) RMBS(1) By Rating and Origination Year As of March 31, 2015 Prime Agency Prime/Non-Agency Alt-A RMBS Subprime Mortgage-Backed Securities Total NAIC Designation Fair Value Amortized Cost Fair Value Amortized Cost Fair Value Amortized Cost Fair Value Amortized Cost Fair Value Amortized Cost 1 5,388.2 4,879.2 498.5 438.0 343.6 294.5 466.6 423.0 6,696.9 6,034.6 2—— 35.2 34.9 18.2 16.2 42.7 46.4 96.1 97.5 3 8.2 9.5 9.5 7.9 21.7 19.3 3.4 2.7 42.8 39.4 4 5.3 5.3 2.7 0.3 5.5 1.8 14.6 13.9 28.1 21.3 5—— 37.0 28.8 —— 1.4 0.7 38.4 29.5 6—— 168.2 97.5 3.8 2.9 0.8 0.8 172.8 101.2 Total by rating (2) 5,401.7 4,894.0 751.1 607.4 392.8 334.7 529.5 487.5 7,075.1 6,323.5 Prime Agency Prime/Non-Agency Alt-A RMBS Subprime Mortgage-Backed Securities Total ARO Rating Fair Value Amortized Cost Fair Value Amortized Cost Fair Value Amortized Cost Fair Value Amortized Cost Fair Value Amortized Cost AAA 5,372.6 4,862.6 7.3 7.1 0.1 0.1 —— 5,380.0 4,869.8 AA 2.6 2.6 25.4 24.0 —— 2.2 2.2 30.2 28.8 A 3.2 3.2 22.1 20.9 3.1 2.8 23.0 23.5 51.4 50.4 BBB—— 76.9 74.9 11.5 11.8 19.4 20.1 107.8 106.8 BB 8.2 9.5 68.6 63.6 13.5 13.4 51.6 55.5 141.9 142.0 B and below 15.1 16.1 550.8 416.9 364.6 306.6 433.3 386.2 1,363.8 1,125.7 Total by rating (2) 5,401.7 4,894.0 751.1 607.4 392.8 334.7 529.5 487.5 7,075.1 6,323.5 Prime Agency Prime/Non-Agency Alt-A RMBS Subprime Mortgage-Backed Securities Total Origination Year Fair Value Amortized Cost Fair Value Amortized Cost Fair Value Amortized Cost Fair Value Amortized Cost Fair Value Amortized Cost 2015 14.1 13.6 —————— 14.1 13.6 2014 319.3 313.8 —————— 319.3 313.8 2013 930.5 907.5 —————— 930.5 907.5 2012 700.6 698.9 —————— 700.6 698.9 2011 821.5 788.1 —————— 821.5 788.1 2010 634.5 606.6 20.0 19.3 ———— 654.5 625.9 2009 232.9 229.8 6.8 6.9 ———— 239.7 236.7 2008 131.9 119.0 —————— 131.9 119.0 2007 322.9 288.1 138.0 125.2 85.9 73.7 161.4 138.8 708.2 625.8 2006 400.8 293.0 198.5 119.5 135.4 105.8 143.4 124.6 878.1 642.9 2005 and prior 892.7 635.6 387.8 336.5 171.5 155.2 224.7 224.1 1,676.7 1,351.3 Total by origination year (2) 5,401.7 4,894.0 751.1 607.4 392.8 334.7 529.5 487.5 7,075.1 6,323.5 (1) Subprime mortgage-backed securities are included in RMBS under this presentation. (2) Includes fixed maturities securities related to businesses exited through reinsurance. Refer to page in “Additional Information” section.
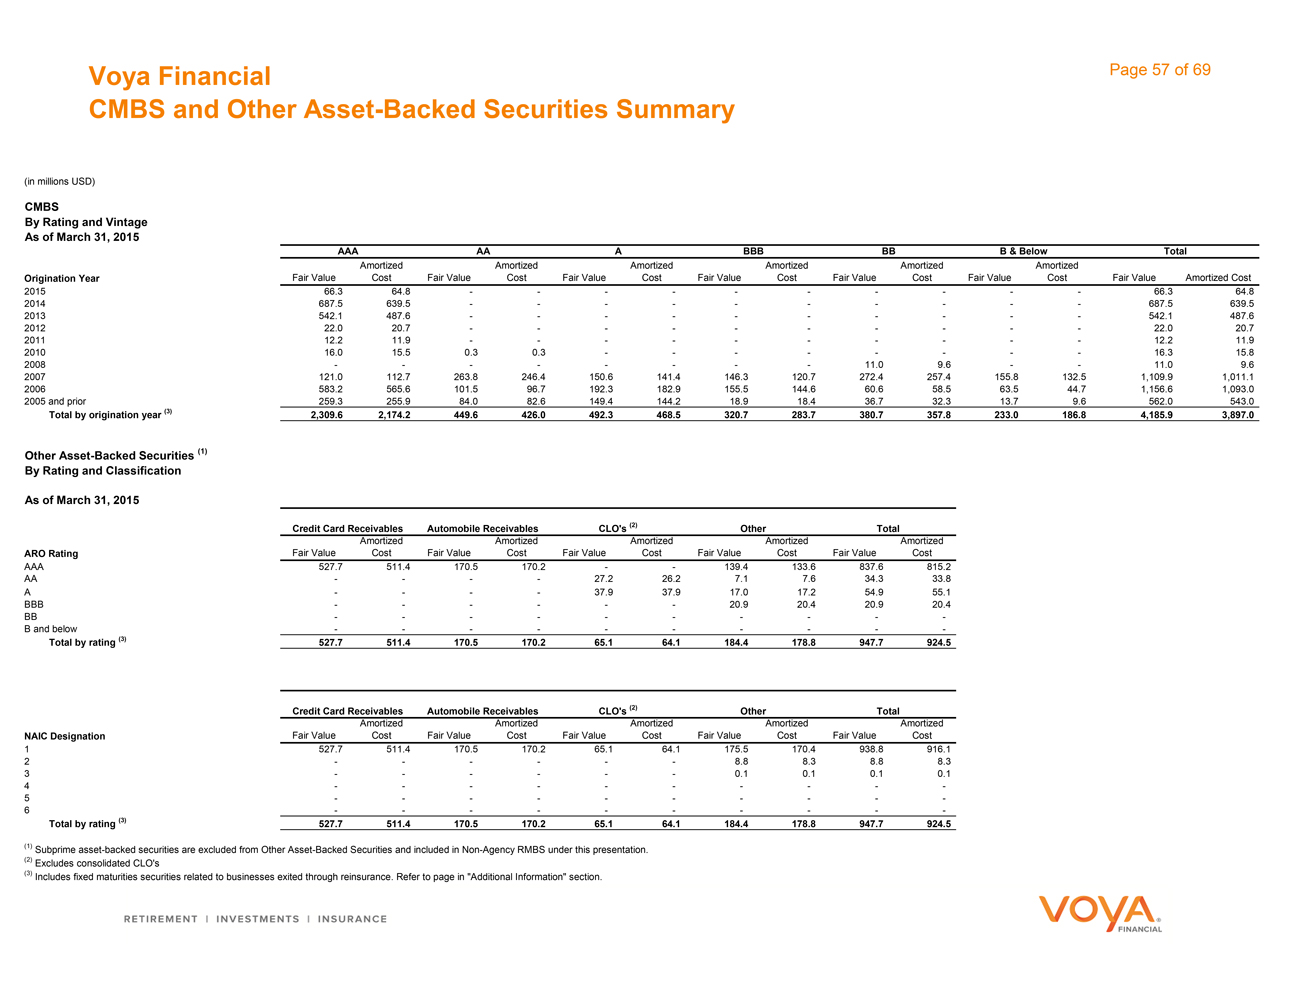
Voya Financial CMBS and Other Asset-Backed Securities Summary Page 57 of 69 (in millions USD) CMBS By Rating and Vintage As of March 31, 2015 B & Below Total AAA AA A BBB BB Origination Year Fair Value Amortized Cost Fair Value Amortized Cost Fair Value Amortized Cost Fair Value Amortized Cost Fair Value Amortized Cost Fair Value Amortized Cost Fair Value Amortized Cost 2015 66.3 64.8 —————————— 66.3 64.8 2014 687.5 639.5 —————————— 687.5 639.5 2013 542.1 487.6 —————————— 542.1 487.6 2012 22.0 20.7 —————————— 22.0 20.7 2011 12.2 11.9 —————————— 12.2 11.9 2010 16.0 15.5 0.3 0.3 ———————— 16.3 15.8 2008———————— 11.0 9.6 —— 11.0 9.6 2007 121.0 112.7 263.8 246.4 150.6 141.4 146.3 120.7 272.4 257.4 155.8 132.5 1,109.9 1,011.1 2006 583.2 565.6 101.5 96.7 192.3 182.9 155.5 144.6 60.6 58.5 63.5 44.7 1,156.6 1,093.0 2005 and prior 259.3 255.9 84.0 82.6 149.4 144.2 18.9 18.4 36.7 32.3 13.7 9.6 562.0 543.0 Total by origination year (3) 2,309.6 2,174.2 449.6 426.0 492.3 468.5 320.7 283.7 380.7 357.8 233.0 186.8 4,185.9 3,897.0 Other Asset-Backed Securities (1) By Rating and Classification As of March 31, 2015 Credit Card Receivables Automobile Receivables CLO’s (2) Other Total ARO Rating Fair Value Amortized Cost Fair Value Amortized Cost Fair Value Amortized Cost Fair Value Amortized Cost Fair Value Amortized Cost AAA 527.7 511.4 170.5 170.2 —— 139.4 133.6 837.6 815.2 AA———— 27.2 26.2 7.1 7.6 34.3 33.8 A———— 37.9 37.9 17.0 17.2 54.9 55.1 BBB—————— 20.9 20.4 20.9 20.4 BB—————————— B and below—————————— Total by rating (3) 527.7 511.4 170.5 170.2 65.1 64.1 184.4 178.8 947.7 924.5 Credit Card Receivables Automobile Receivables CLO’s (2) Other Total NAIC Designation Fair Value Amortized Cost Fair Value Amortized Cost Fair Value Amortized Cost Fair Value Amortized Cost Fair Value Amortized Cost 1 527.7 511.4 170.5 170.2 65.1 64.1 175.5 170.4 938.8 916.1 2—————— 8.8 8.3 8.8 8.3 3—————— 0.1 0.1 0.1 0.1 4—————————— 5—————————— 6—————————— Total by rating (3) 527.7 511.4 170.5 170.2 65.1 64.1 184.4 178.8 947.7 924.5 (1) Subprime asset-backed securities are excluded from Other Asset-Backed Securities and included in Non-Agency RMBS under this presentation. (2) Excludes consolidated CLO’s (3) Includes fixed maturities securities related to businesses exited through reinsurance. Refer to page in “Additional Information” section.
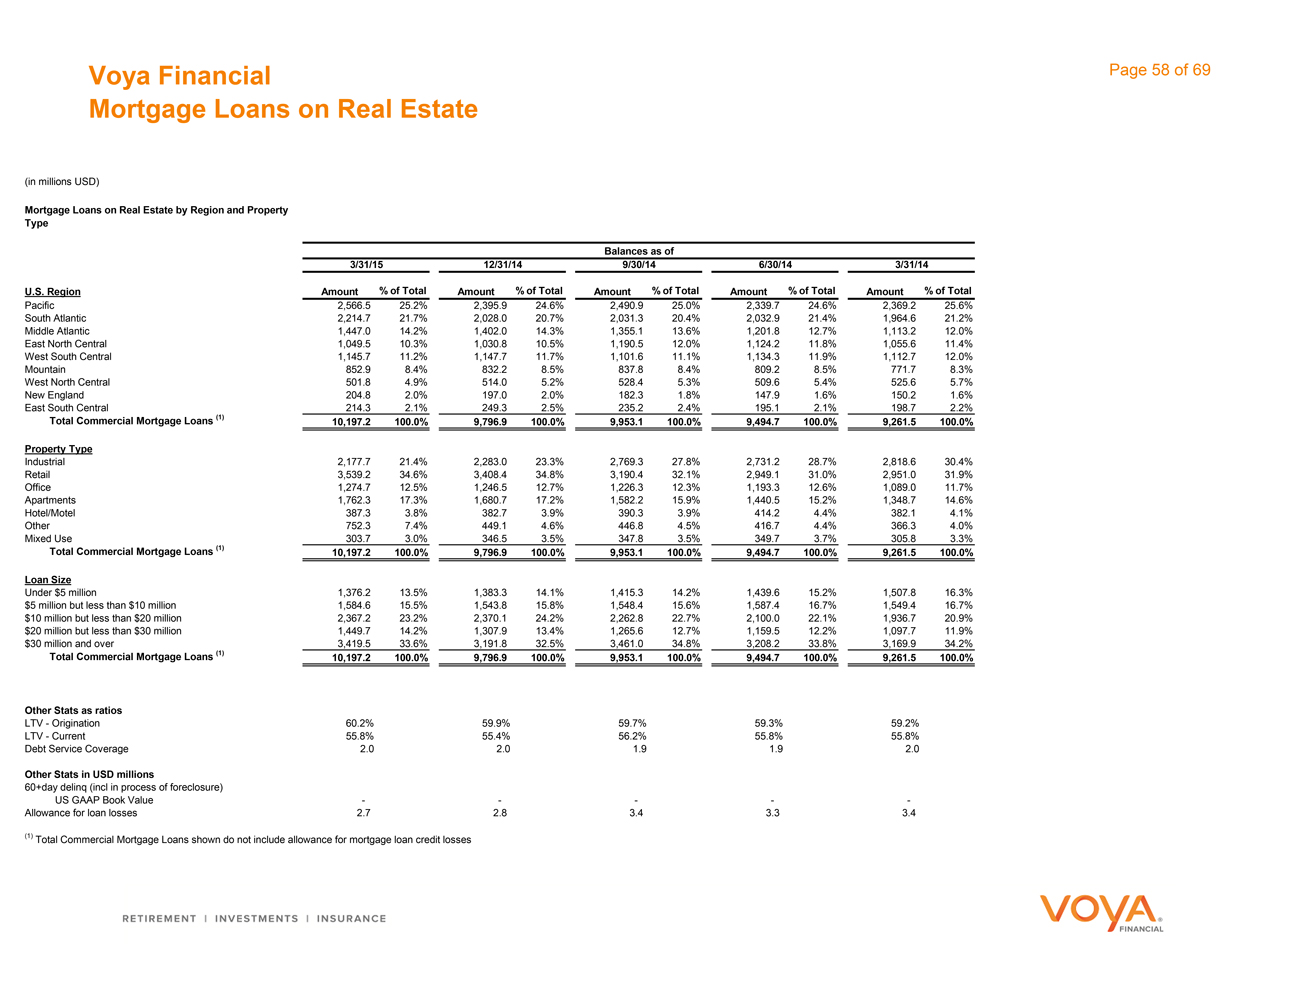
Voya Financial Mortgage Loans on Real Estate Page 58 of 69 (in millions USD) Mortgage Loans on Real Estate by Region and Property Type Balances as of 3/31/15 12/31/14 9/30/14 6/30/14 3/31/14 U.S. Region Amount % of Total Amount % of Total Amount % of Total Amount % of Total Amount % of Total Pacific 2,566.5 25.2% 2,395.9 24.6% 2,490.9 25.0% 2,339.7 24.6% 2,369.2 25.6% South Atlantic 2,214.7 21.7% 2,028.0 20.7% 2,031.3 20.4% 2,032.9 21.4% 1,964.6 21.2% Middle Atlantic 1,447.0 14.2% 1,402.0 14.3% 1,355.1 13.6% 1,201.8 12.7% 1,113.2 12.0% East North Central 1,049.5 10.3% 1,030.8 10.5% 1,190.5 12.0% 1,124.2 11.8% 1,055.6 11.4% West South Central 1,145.7 11.2% 1,147.7 11.7% 1,101.6 11.1% 1,134.3 11.9% 1,112.7 12.0% Mountain 852.9 8.4% 832.2 8.5% 837.8 8.4% 809.2 8.5% 771.7 8.3% West North Central 501.8 4.9% 514.0 5.2% 528.4 5.3% 509.6 5.4% 525.6 5.7% New England 204.8 2.0% 197.0 2.0% 182.3 1.8% 147.9 1.6% 150.2 1.6% East South Central 214.3 2.1% 249.3 2.5% 235.2 2.4% 195.1 2.1% 198.7 2.2% Total Commercial Mortgage Loans (1) 10,197.2 100.0% 9,796.9 100.0% 9,953.1 100.0% 9,494.7 100.0% 9,261.5 100.0% Property Type Industrial 2,177.7 21.4% 2,283.0 23.3% 2,769.3 27.8% 2,731.2 28.7% 2,818.6 30.4% Retail 3,539.2 34.6% 3,408.4 34.8% 3,190.4 32.1% 2,949.1 31.0% 2,951.0 31.9% Office 1,274.7 12.5% 1,246.5 12.7% 1,226.3 12.3% 1,193.3 12.6% 1,089.0 11.7% Apartments 1,762.3 17.3% 1,680.7 17.2% 1,582.2 15.9% 1,440.5 15.2% 1,348.7 14.6% Hotel/Motel 387.3 3.8% 382.7 3.9% 390.3 3.9% 414.2 4.4% 382.1 4.1% Other 752.3 7.4% 449.1 4.6% 446.8 4.5% 416.7 4.4% 366.3 4.0% Mixed Use 303.7 3.0% 346.5 3.5% 347.8 3.5% 349.7 3.7% 305.8 3.3% Total Commercial Mortgage Loans (1) 10,197.2 100.0% 9,796.9 100.0% 9,953.1 100.0% 9,494.7 100.0% 9,261.5 100.0% Loan Size Under $5 million 1,376.2 13.5% 1,383.3 14.1% 1,415.3 14.2% 1,439.6 15.2% 1,507.8 16.3% $5 million but less than $10 million 1,584.6 15.5% 1,543.8 15.8% 1,548.4 15.6% 1,587.4 16.7% 1,549.4 16.7% $10 million but less than $20 million 2,367.2 23.2% 2,370.1 24.2% 2,262.8 22.7% 2,100.0 22.1% 1,936.7 20.9% $20 million but less than $30 million 1,449.7 14.2% 1,307.9 13.4% 1,265.6 12.7% 1,159.5 12.2% 1,097.7 11.9% $30 million and over 3,419.5 33.6% 3,191.8 32.5% 3,461.0 34.8% 3,208.2 33.8% 3,169.9 34.2% Total Commercial Mortgage Loans (1) 10,197.2 100.0% 9,796.9 100.0% 9,953.1 100.0% 9,494.7 100.0% 9,261.5 100.0% Other Stats as ratios LTV—Origination 60.2% 59.9% 59.7% 59.3% 59.2% LTV—Current 55.8% 55.4% 56.2% 55.8% 55.8% Debt Service Coverage 2.0 2.0 1.9 1.9 2.0 Other Stats in USD millions 60+day delinq (incl in process of foreclosure) US GAAP Book Value————— Allowance for loan losses 2.7 2.8 3.4 3.3 3.4 (1) Total Commercial Mortgage Loans shown do not include allowance for mortgage loan credit losses
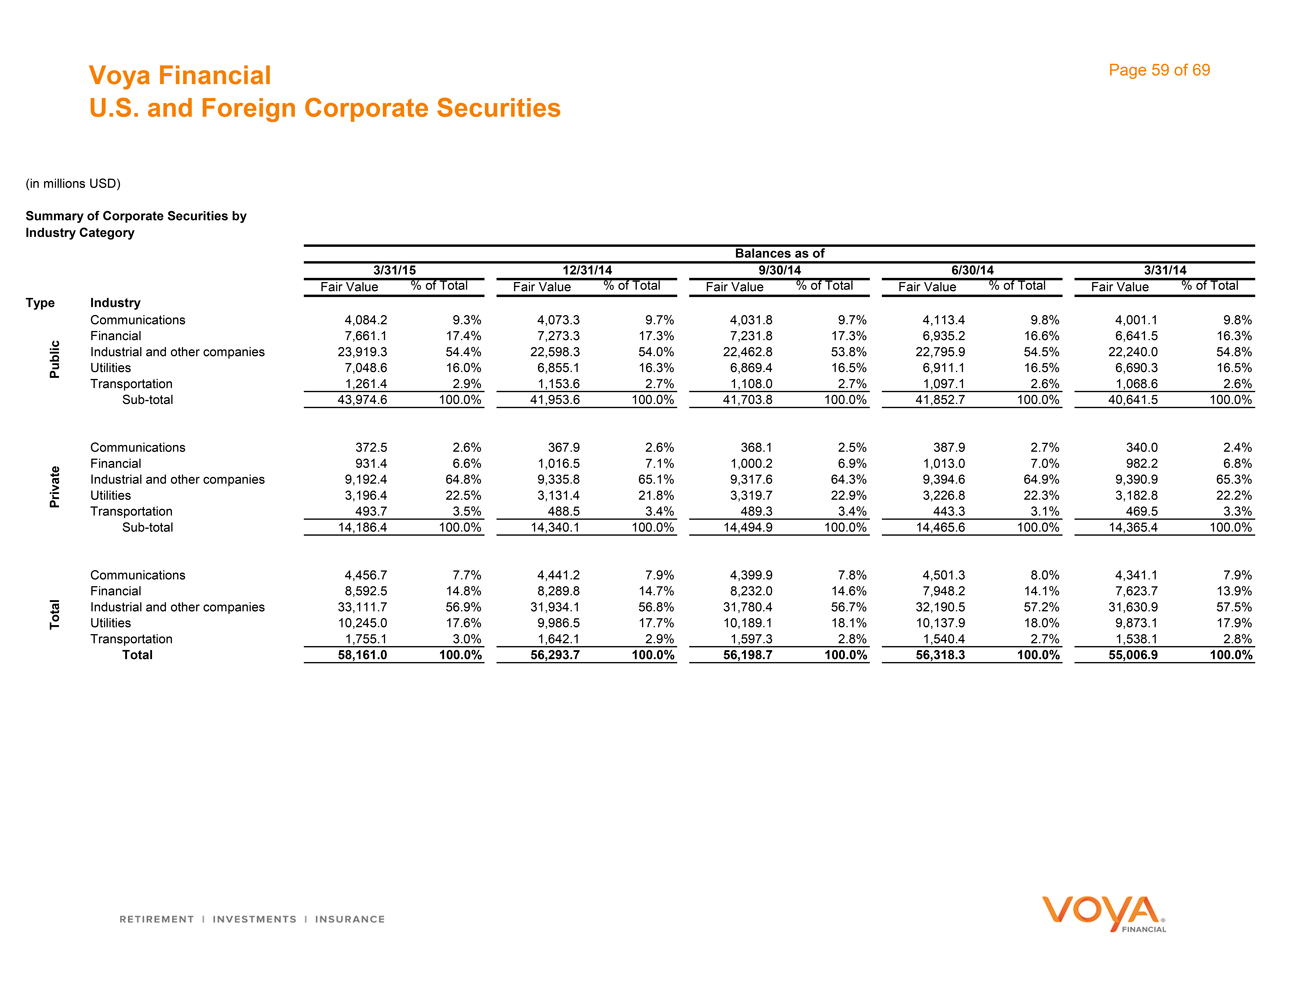
Voya Financial U.S. and Foreign Corporate Securities Page 59 of 69 (in millions USD) Summary of Corporate Securities by Industry Category Balances as of 3/31/15 6/30/14 3/31/14 Type Industry 12/31/14 9/30/14 Fair Value % of Total Fair Value % of Total Fair Value % of Total Fair Value % of Total Fair Value % of Total Communications 4,084.2 9.3% 4,073.3 9.7% 4,031.8 9.7% 4,113.4 9.8% 4,001.1 9.8% Public Financial 7,661.1 17.4% 7,273.3 17.3% 7,231.8 17.3% 6,935.2 16.6% 6,641.5 16.3% Industrial and other companies 23,919.3 54.4% 22,598.3 54.0% 22,462.8 53.8% 22,795.9 54.5% 22,240.0 54.8% Utilities 7,048.6 16.0% 6,855.1 16.3% 6,869.4 16.5% 6,911.1 16.5% 6,690.3 16.5% Transportation 1,261.4 2.9% 1,153.6 2.7% 1,108.0 2.7% 1,097.1 2.6% 1,068.6 2.6% Sub-total 43,974.6 100.0% 41,953.6 100.0% 41,703.8 100.0% 41,852.7 100.0% 40,641.5 100.0% Communications 372.5 2.6% 367.9 2.6% 368.1 2.5% 387.9 2.7% 340.0 2.4% Private Financial 931.4 6.6% 1,016.5 7.1% 1,000.2 6.9% 1,013.0 7.0% 982.2 6.8% Industrial and other companies 9,192.4 64.8% 9,335.8 65.1% 9,317.6 64.3% 9,394.6 64.9% 9,390.9 65.3% Utilities 3,196.4 22.5% 3,131.4 21.8% 3,319.7 22.9% 3,226.8 22.3% 3,182.8 22.2% Transportation 493.7 3.5% 488.5 3.4% 489.3 3.4% 443.3 3.1% 469.5 3.3% Sub-total 14,186.4 100.0% 14,340.1 100.0% 14,494.9 100.0% 14,465.6 100.0% 14,365.4 100.0% Communications 4,456.7 7.7% 4,441.2 7.9% 4,399.9 7.8% 4,501.3 8.0% 4,341.1 7.9% Total Financial 8,592.5 14.8% 8,289.8 14.7% 8,232.0 14.6% 7,948.2 14.1% 7,623.7 13.9% Industrial and other companies 33,111.7 56.9% 31,934.1 56.8% 31,780.4 56.7% 32,190.5 57.2% 31,630.9 57.5% Utilities 10,245.0 17.6% 9,986.5 17.7% 10,189.1 18.1% 10,137.9 18.0% 9,873.1 17.9% Transportation 1,755.1 3.0% 1,642.1 2.9% 1,597.3 2.8% 1,540.4 2.7% 1,538.1 2.8% Total 58,161.0 100.0% 56,293.7 100.0% 56,198.7 100.0% 56,318.3 100.0% 55,006.9 100.0%
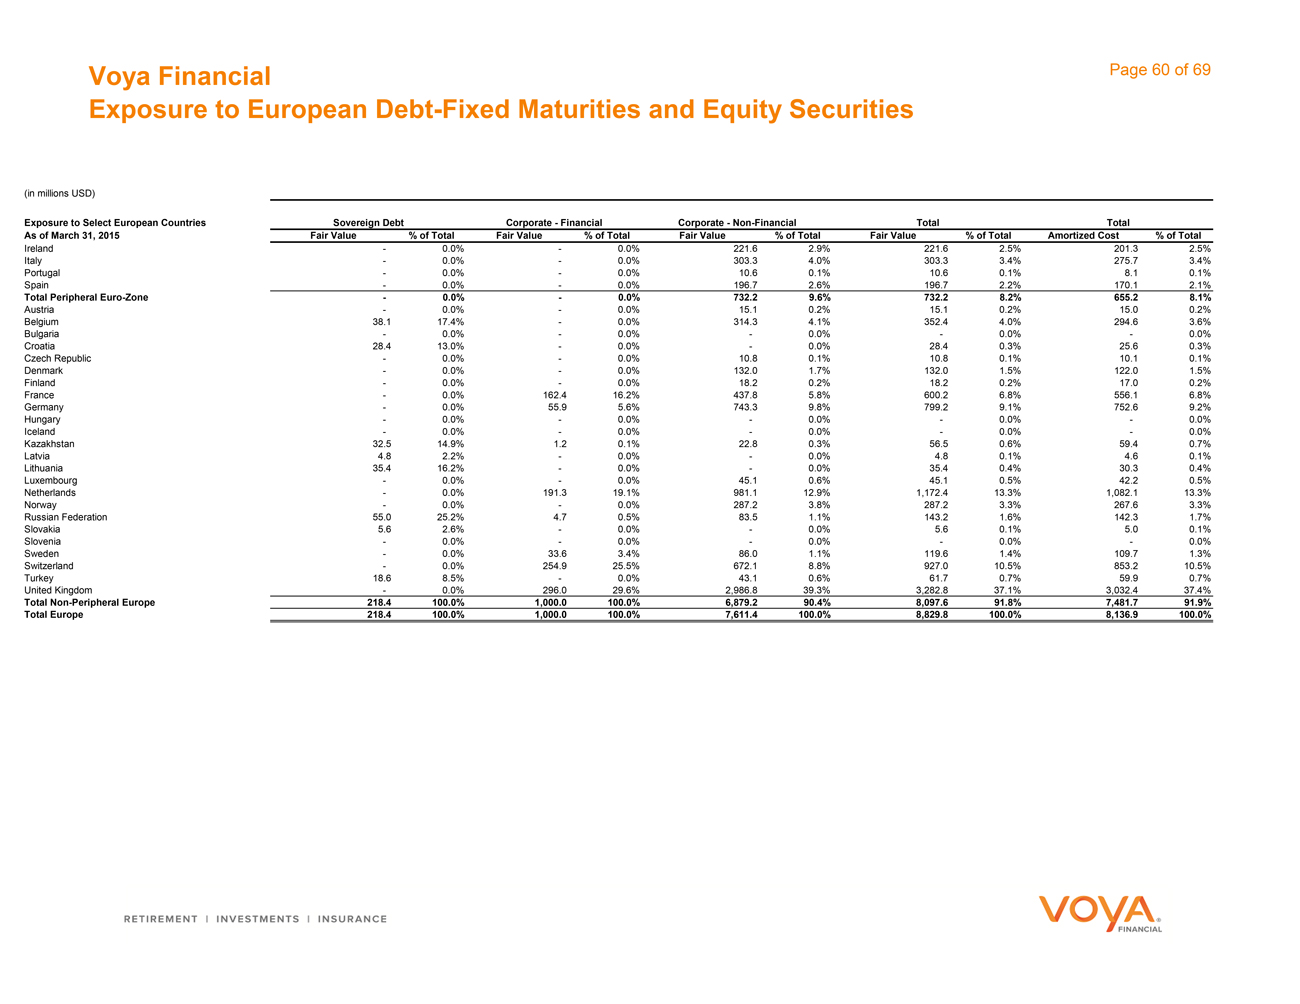
Voya Financial Exposure to European Debt-Fixed Maturities and Equity Securities Page 60 of 69 (in millions USD) Exposure to Select European Countries Sovereign Debt Corporate—Financial Corporate—Non-Financial Total Total As of March 31, 2015 Fair Value % of Total Fair Value % of Total Fair Value % of Total Fair Value % of Total Amortized Cost % of Total Ireland— 0.0%— 0.0% 221.6 2.9% 221.6 2.5% 201.3 2.5% Italy— 0.0%— 0.0% 303.3 4.0% 303.3 3.4% 275.7 3.4% Portugal— 0.0%— 0.0% 10.6 0.1% 10.6 0.1% 8.1 0.1% Spain— 0.0%— 0.0% 196.7 2.6% 196.7 2.2% 170.1 2.1% Total Peripheral Euro-Zone— 0.0%— 0.0% 732.2 9.6% 732.2 8.2% 655.2 8.1% Austria— 0.0%— 0.0% 15.1 0.2% 15.1 0.2% 15.0 0.2% Belgium 38.1 17.4%— 0.0% 314.3 4.1% 352.4 4.0% 294.6 3.6% Bulgaria— 0.0%— 0.0%— 0.0%— 0.0%— 0.0% Croatia 28.4 13.0%— 0.0%— 0.0% 28.4 0.3% 25.6 0.3% Czech Republic— 0.0%— 0.0% 10.8 0.1% 10.8 0.1% 10.1 0.1% Denmark— 0.0%— 0.0% 132.0 1.7% 132.0 1.5% 122.0 1.5% Finland— 0.0%— 0.0% 18.2 0.2% 18.2 0.2% 17.0 0.2% France— 0.0% 162.4 16.2% 437.8 5.8% 600.2 6.8% 556.1 6.8% Germany— 0.0% 55.9 5.6% 743.3 9.8% 799.2 9.1% 752.6 9.2% Hungary— 0.0%— 0.0%— 0.0%— 0.0%— 0.0% Iceland— 0.0%— 0.0%— 0.0%— 0.0%— 0.0% Kazakhstan 32.5 14.9% 1.2 0.1% 22.8 0.3% 56.5 0.6% 59.4 0.7% Latvia 4.8 2.2%— 0.0%— 0.0% 4.8 0.1% 4.6 0.1% Lithuania 35.4 16.2%— 0.0%— 0.0% 35.4 0.4% 30.3 0.4% Luxembourg— 0.0%— 0.0% 45.1 0.6% 45.1 0.5% 42.2 0.5% Netherlands— 0.0% 191.3 19.1% 981.1 12.9% 1,172.4 13.3% 1,082.1 13.3% Norway— 0.0%— 0.0% 287.2 3.8% 287.2 3.3% 267.6 3.3% Russian Federation 55.0 25.2% 4.7 0.5% 83.5 1.1% 143.2 1.6% 142.3 1.7% Slovakia 5.6 2.6%— 0.0%— 0.0% 5.6 0.1% 5.0 0.1% Slovenia— 0.0%— 0.0%— 0.0%— 0.0%— 0.0% Sweden— 0.0% 33.6 3.4% 86.0 1.1% 119.6 1.4% 109.7 1.3% Switzerland— 0.0% 254.9 25.5% 672.1 8.8% 927.0 10.5% 853.2 10.5% Turkey 18.6 8.5%— 0.0% 43.1 0.6% 61.7 0.7% 59.9 0.7% United Kingdom— 0.0% 296.0 29.6% 2,986.8 39.3% 3,282.8 37.1% 3,032.4 37.4% Total Non-Peripheral Europe 218.4 100.0% 1,000.0 100.0% 6,879.2 90.4% 8,097.6 91.8% 7,481.7 91.9% Total Europe 218.4 100.0% 1,000.0 100.0% 7,611.4 100.0% 8,829.8 100.0% 8,136.9 100.0%

Additional Information
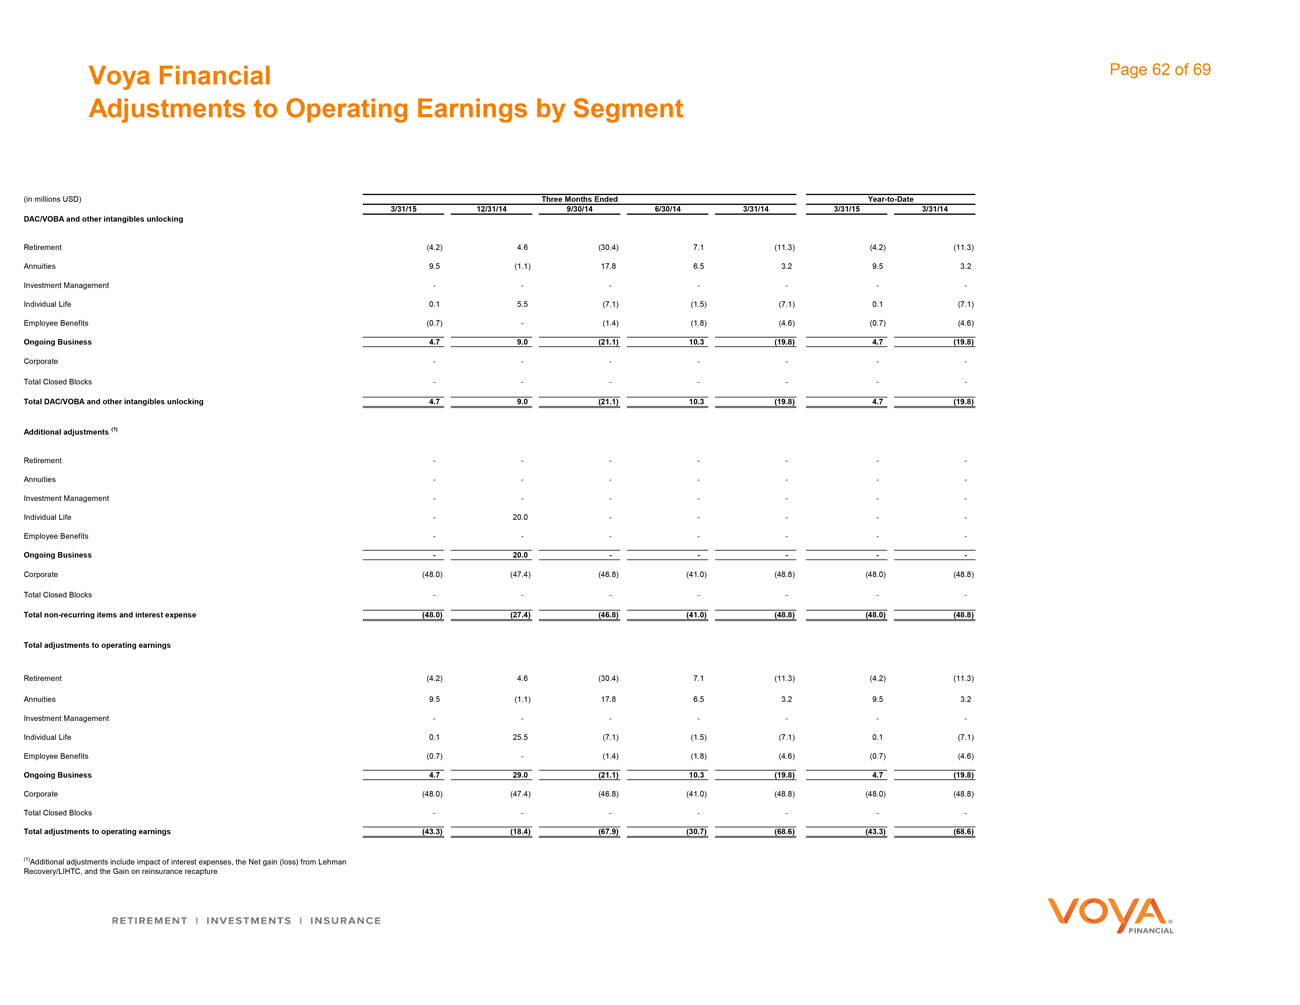
Voya Financial Adjustments to Operating Earnings by Segment Page 62 of 69 (in millions USD) Three Months Ended Year-to-Date 3/31/15 12/31/14 9/30/14 6/30/14 3/31/14 3/31/15 3/31/14 DAC/VOBA and other intangibles unlocking Retirement (4.2) 4.6 (30.4) 7.1 (11.3) (4.2) (11.3) Annuities 9.5 (1.1) 17.8 6.5 3.2 9.5 3.2 Investment Management - - - - - - - Individual Life 0.1 5.5 (7.1) (1.5) (7.1) 0.1 (7.1) Employee Benefits (0.7) - (1.4) (1.8) (4.6) (0.7) (4.6) Ongoing Business 4.7 9.0 (21.1) 10.3 (19.8) 4.7 (19.8) Corporate - - - - - - - Total Closed Blocks - - - - - - - Total DAC/VOBA and other intangibles unlocking 4.7 9.0 (21.1) 10.3 (19.8) 4.7 (19.8) Additional adjustments (1) Retirement - - - - - - - Annuities - - - - - - - Investment Management - - - - - - - Individual Life - 20.0 - - - - - Employee Benefits - - - - - - - Ongoing Business - 20.0 - - - - - Corporate (48.0) (47.4) (46.8) (41.0) (48.8) (48.0) (48.8) Total Closed Blocks - - - - - - - Total non-recurring items and interest expense (48.0) (27.4) (46.8) (41.0) (48.8) (48.0) (48.8) Total adjustments to operating earnings Retirement (4.2) 4.6 (30.4) 7.1 (11.3) (4.2) (11.3) Annuities 9.5 (1.1) 17.8 6.5 3.2 9.5 3.2 Investment Management - - - - - - - Individual Life 0.1 25.5 (7.1) (1.5) (7.1) 0.1 (7.1) Employee Benefits (0.7) - (1.4) (1.8) (4.6) (0.7) (4.6) Ongoing Business 4.7 29.0 (21.1) 10.3 (19.8) 4.7 (19.8) Corporate (48.0) (47.4) (46.8) (41.0) (48.8) (48.0) (48.8) Total Closed Blocks - - - - - - - Total adjustments to operating earnings (43.3) (18.4) (67.9) (30.7) (68.6) (43.3) (68.6) (1) Additional adjustments include impact of interest expenses, the Net gain (loss) from Lehman Recovery/LIHTC, and the Gain on reinsurance recapture Retirement Investment Insurance VOYA Financial
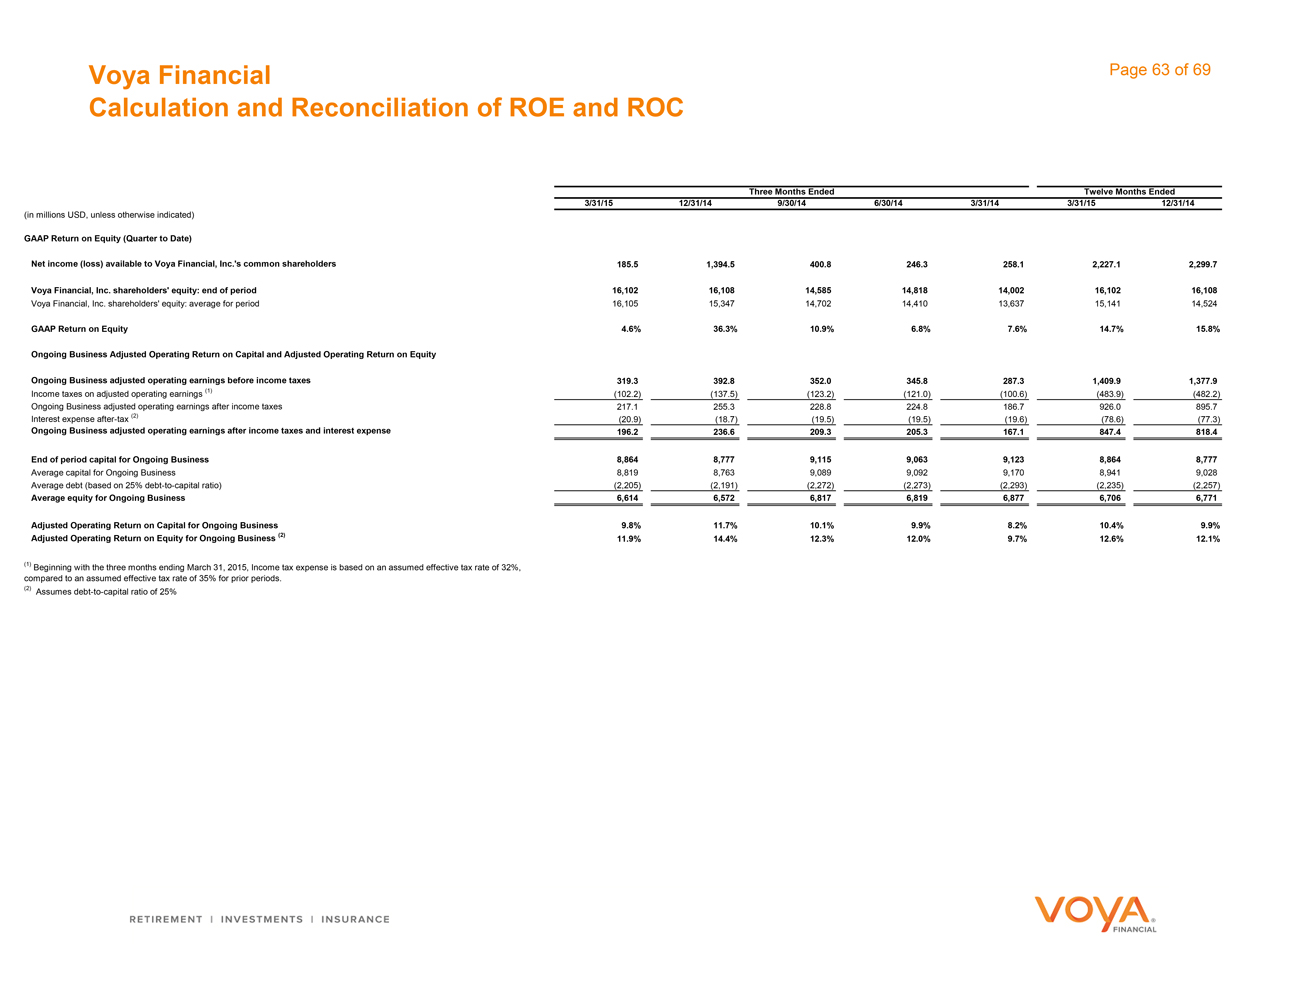
Voya Financial Calculation and Reconciliation of ROE and ROC Page 63 of 69 Three Months Ended Twelve Months Ended 3/31/15 12/31/14 9/30/14 6/30/14 3/31/14 3/31/15 12/31/14 (in millions USD, unless otherwise indicated) GAAP Return on Equity (Quarter to Date) Net income (loss) available to Voya Financial, Inc.‘s common shareholders 185.5 1,394.5 400.8 246.3 258.1 2,227.1 2,299.7 Voya Financial, Inc. shareholders’ equity: end of period 16,102 16,108 14,585 14,818 14,002 16,102 16,108 Voya Financial, Inc. shareholders’ equity: average for period 16,105 15,347 14,702 14,410 13,637 15,141 14,524 GAAP Return on Equity 4.6% 36.3% 10.9% 6.8% 7.6% 14.7% 15.8% Ongoing Business Adjusted Operating Return on Capital and Adjusted Operating Return on Equity Ongoing Business adjusted operating earnings before income taxes 319.3 392.8 352.0 345.8 287.3 1,409.9 1,377.9 Income taxes on adjusted operating earnings (1) (102.2) (137.5) (123.2) (121.0) (100.6) (483.9) (482.2) Ongoing Business adjusted operating earnings after income taxes 217.1 255.3 228.8 224.8 186.7 926.0 895.7 Interest expense after-tax (2) (20.9) (18.7) (19.5) (19.5) (19.6) (78.6) (77.3) Ongoing Business adjusted operating earnings after income taxes and interest expense 196.2 236.6 209.3 205.3 167.1 847.4 818.4 End of period capital for Ongoing Business 8,864 8,777 9,115 9,063 9,123 8,864 8,777 Average capital for Ongoing Business 8,819 8,763 9,089 9,092 9,170 8,941 9,028 Average debt (based on 25% debt-to-capital ratio) (2,205) (2,191) (2,272) (2,273) (2,293) (2,235) (2,257) Average equity for Ongoing Business 6,614 6,572 6,817 6,819 6,877 6,706 6,771 Adjusted Operating Return on Capital for Ongoing Business 9.8% 11.7% 10.1% 9.9% 8.2% 10.4% 9.9% Adjusted Operating Return on Equity for Ongoing Business (2) 11.9% 14.4% 12.3% 12.0% 9.7% 12.6% 12.1% (1) Beginning with the three months ending March 31, 2015, Income tax expense is based on an assumed effective tax rate of 32%, compared to an assumed effective tax rate of 35% for prior periods. (2) Assumes debt-to-capital ratio of 25%
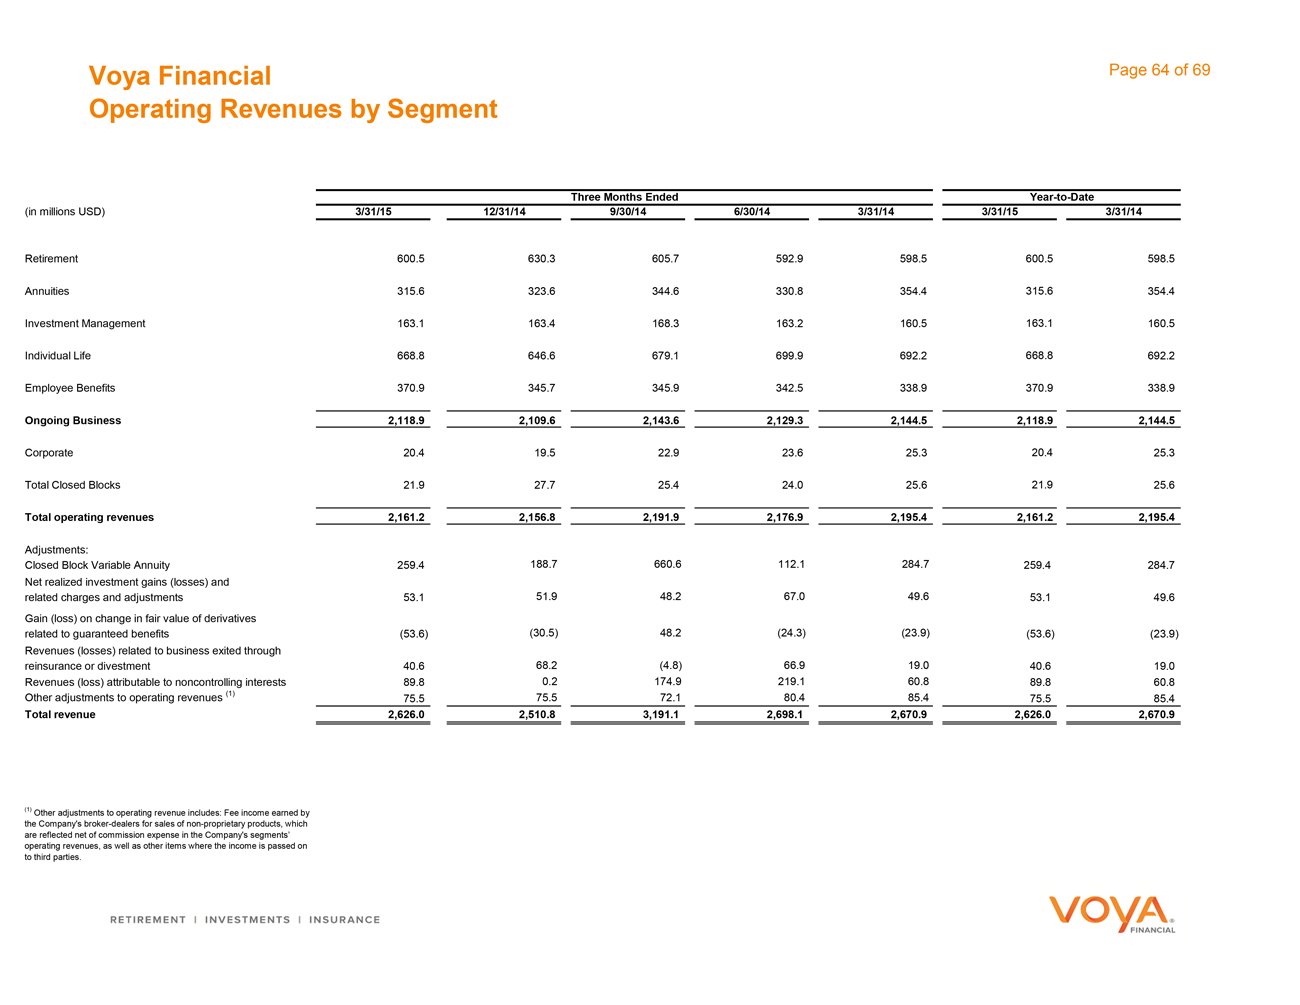
Voya Financial Operating Revenues by Segment Page 64 of 69 Three Months Ended Year-to-Date (in millions USD) 3/31/15 12/31/14 9/30/14 6/30/14 3/31/14 3/31/15 3/31/14 Retirement 600.5 630.3 605.7 592.9 598.5 600.5 598.5 Annuities 315.6 323.6 344.6 330.8 354.4 315.6 354.4 Investment Management 163.1 163.4 168.3 163.2 160.5 163.1 160.5 Individual Life 668.8 646.6 679.1 699.9 692.2 668.8 692.2 Employee Benefits 370.9 345.7 345.9 342.5 338.9 370.9 338.9 Ongoing Business 2,118.9 2,109.6 2,143.6 2,129.3 2,144.5 2,118.9 2,144.5 Corporate 20.4 19.5 22.9 23.6 25.3 20.4 25.3 Total Closed Blocks 21.9 27.7 25.4 24.0 25.6 21.9 25.6 Total operating revenues 2,161.2 2,156.8 2,191.9 2,176.9 2,195.4 2,161.2 2,195.4 Adjustments: Closed Block Variable Annuity 259.4 188.7 660.6 112.1 284.7 259.4 284.7 Net realized investment gains (losses) and related charges and adjustments 53.1 51.9 48.2 67.0 49.6 53.1 49.6 Gain (loss) on change in fair value of derivatives related to guaranteed benefits (53.6) (30.5) 48.2 (24.3) (23.9) (53.6) (23.9) Revenues (losses) related to business exited through reinsurance or divestment 40.6 68.2 (4.8) 66.9 19.0 40.6 19.0 Revenues (loss) attributable to noncontrolling interests 89.8 0.2 174.9 219.1 60.8 89.8 60.8 Other adjustments to operating revenues (1) 75.5 75.5 72.1 80.4 85.4 75.5 85.4 Total revenue 2,626.0 2,510.8 3,191.1 2,698.1 2,670.9 2,626.0 2,670.9 (1) Other adjustments to operating revenue includes: Fee income earned by the Company’s broker-dealers for sales of non-proprietary products, which are reflected net of commission expense in the Company’s segments’ operating revenues, as well as other items where the income is passed on to third parties. Retirement Investment Insurance VOYA Financial
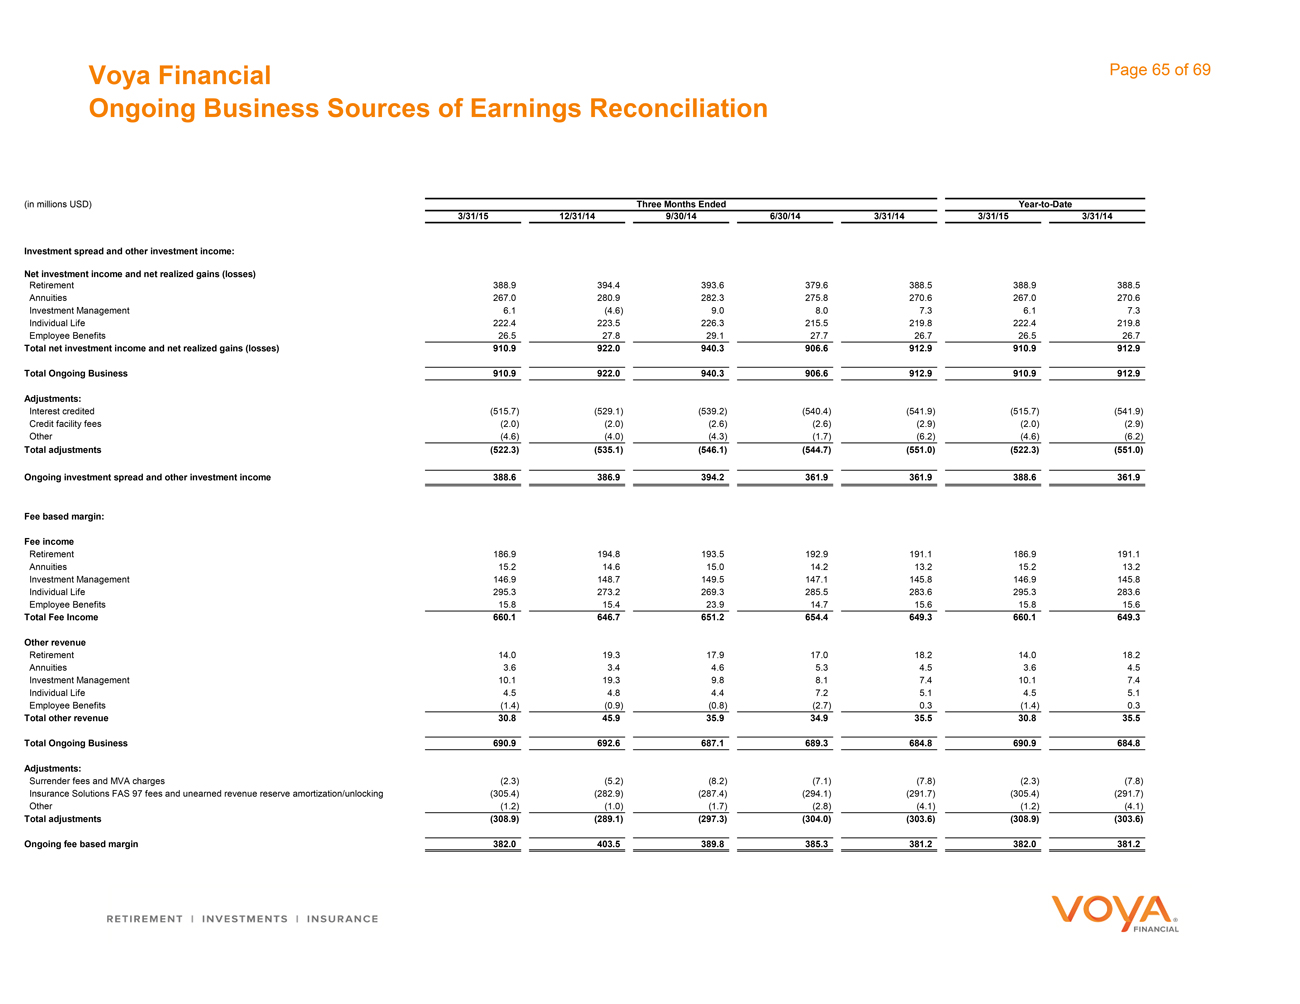
Voya Financial Ongoing Business Sources of Earnings Reconciliation Page 65 of 69 (in millions USD) Three Months Ended Year-to-Date 3/31/15 12/31/14 9/30/14 6/30/14 3/31/14 3/31/15 3/31/14 Investment spread and other investment income: Net investment income and net realized gains (losses) Retirement 388.9 394.4 393.6 379.6 388.5 388.9 388.5 Annuities 267.0 280.9 282.3 275.8 270.6 267.0 270.6 Investment Management 6.1 (4.6) 9.0 8.0 7.3 6.1 7.3 Individual Life 222.4 223.5 226.3 215.5 219.8 222.4 219.8 Employee Benefits 26.5 27.8 29.1 27.7 26.7 26.5 26.7 Total net investment income and net realized gains (losses) 910.9 922.0 940.3 906.6 912.9 910.9 912.9 Total Ongoing Business 910.9 922.0 940.3 906.6 912.9 910.9 912.9 Adjustments: Interest credited (515.7) (529.1) (539.2) (540.4) (541.9) (515.7) (541.9) Credit facility fees (2.0) (2.0) (2.6) (2.6) (2.9) (2.0) (2.9) Other (4.6) (4.0) (4.3) (1.7) (6.2) (4.6) (6.2) Total adjustments (522.3) (535.1) (546.1) (544.7) (551.0) (522.3) (551.0) Ongoing investment spread and other investment income 388.6 386.9 394.2 361.9 361.9 388.6 361.9 Fee based margin: Fee income Retirement 186.9 194.8 193.5 192.9 191.1 186.9 191.1 Annuities 15.2 14.6 15.0 14.2 13.2 15.2 13.2 Investment Management 146.9 148.7 149.5 147.1 145.8 146.9 145.8 Individual Life 295.3 273.2 269.3 285.5 283.6 295.3 283.6 Employee Benefits 15.8 15.4 23.9 14.7 15.6 15.8 15.6 Total Fee Income 660.1 646.7 651.2 654.4 649.3 660.1 649.3 Other revenue Retirement 14.0 19.3 17.9 17.0 18.2 14.0 18.2 Annuities 3.6 3.4 4.6 5.3 4.5 3.6 4.5 Investment Management 10.1 19.3 9.8 8.1 7.4 10.1 7.4 Individual Life 4.5 4.8 4.4 7.2 5.1 4.5 5.1 Employee Benefits (1.4) (0.9) (0.8) (2.7) 0.3 (1.4) 0.3 Total other revenue 30.8 45.9 35.9 34.9 35.5 30.8 35.5 Total Ongoing Business 690.9 692.6 687.1 689.3 684.8 690.9 684.8 Adjustments: Surrender fees and MVA charges (2.3) (5.2) (8.2) (7.1) (7.8) (2.3) (7.8) Insurance Solutions FAS 97 fees and unearned revenue reserve amortization/unlocking (305.4) (282.9) (287.4) (294.1) (291.7) (305.4) (291.7) Other (1.2) (1.0) (1.7) (2.8) (4.1) (1.2) (4.1) Total adjustments (308.9) (289.1) (297.3) (304.0) (303.6) (308.9) (303.6) Ongoing fee based margin 382.0 403.5 389.8 385.3 381.2 382.0 381.2
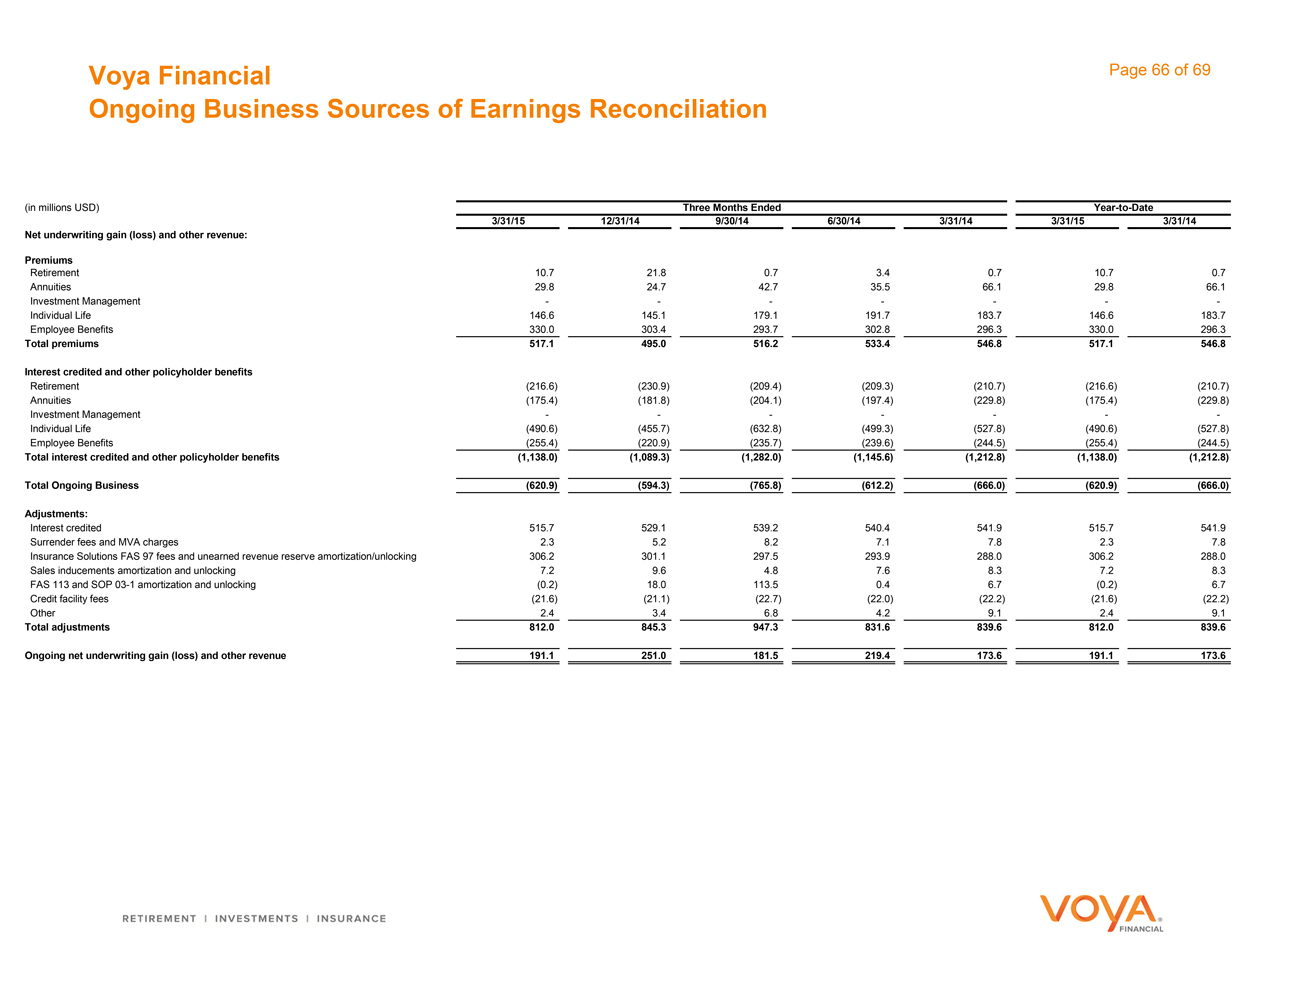
Voya Financial Ongoing Business Sources of Earnings Reconciliation Page 66 of 69 (in millions USD) Three Months Ended Year-to-Date 3/31/15 12/31/14 9/30/14 6/30/14 3/31/14 3/31/15 3/31/14 Net underwriting gain (loss) and other revenue: Premiums Retirement 10.7 21.8 0.7 3.4 0.7 10.7 0.7 Annuities 29.8 24.7 42.7 35.5 66.1 29.8 66.1 Investment Management——————— Individual Life 146.6 145.1 179.1 191.7 183.7 146.6 183.7 Employee Benefits 330.0 303.4 293.7 302.8 296.3 330.0 296.3 Total premiums 517.1 495.0 516.2 533.4 546.8 517.1 546.8 Interest credited and other policyholder benefits Retirement (216.6) (230.9) (209.4) (209.3) (210.7) (216.6) (210.7) Annuities (175.4) (181.8) (204.1) (197.4) (229.8) (175.4) (229.8) Investment Management——————— Individual Life (490.6) (455.7) (632.8) (499.3) (527.8) (490.6) (527.8) Employee Benefits (255.4) (220.9) (235.7) (239.6) (244.5) (255.4) (244.5) Total interest credited and other policyholder benefits (1,138.0) (1,089.3) (1,282.0) (1,145.6) (1,212.8) (1,138.0) (1,212.8) Total Ongoing Business (620.9) (594.3) (765.8) (612.2) (666.0) (620.9) (666.0) Adjustments: Interest credited 515.7 529.1 539.2 540.4 541.9 515.7 541.9 Surrender fees and MVA charges 2.3 5.2 8.2 7.1 7.8 2.3 7.8 Insurance Solutions FAS 97 fees and unearned revenue reserve amortization/unlocking 306.2 301.1 297.5 293.9 288.0 306.2 288.0 Sales inducements amortization and unlocking 7.2 9.6 4.8 7.6 8.3 7.2 8.3 FAS 113 and SOP 03-1 amortization and unlocking (0.2) 18.0 113.5 0.4 6.7 (0.2) 6.7 Credit facility fees (21.6) (21.1) (22.7) (22.0) (22.2) (21.6) (22.2) Other 2.4 3.4 6.8 4.2 9.1 2.4 9.1 Total adjustments 812.0 845.3 947.3 831.6 839.6 812.0 839.6 Ongoing net underwriting gain (loss) and other revenue 191.1 251.0 181.5 219.4 173.6 191.1 173.6
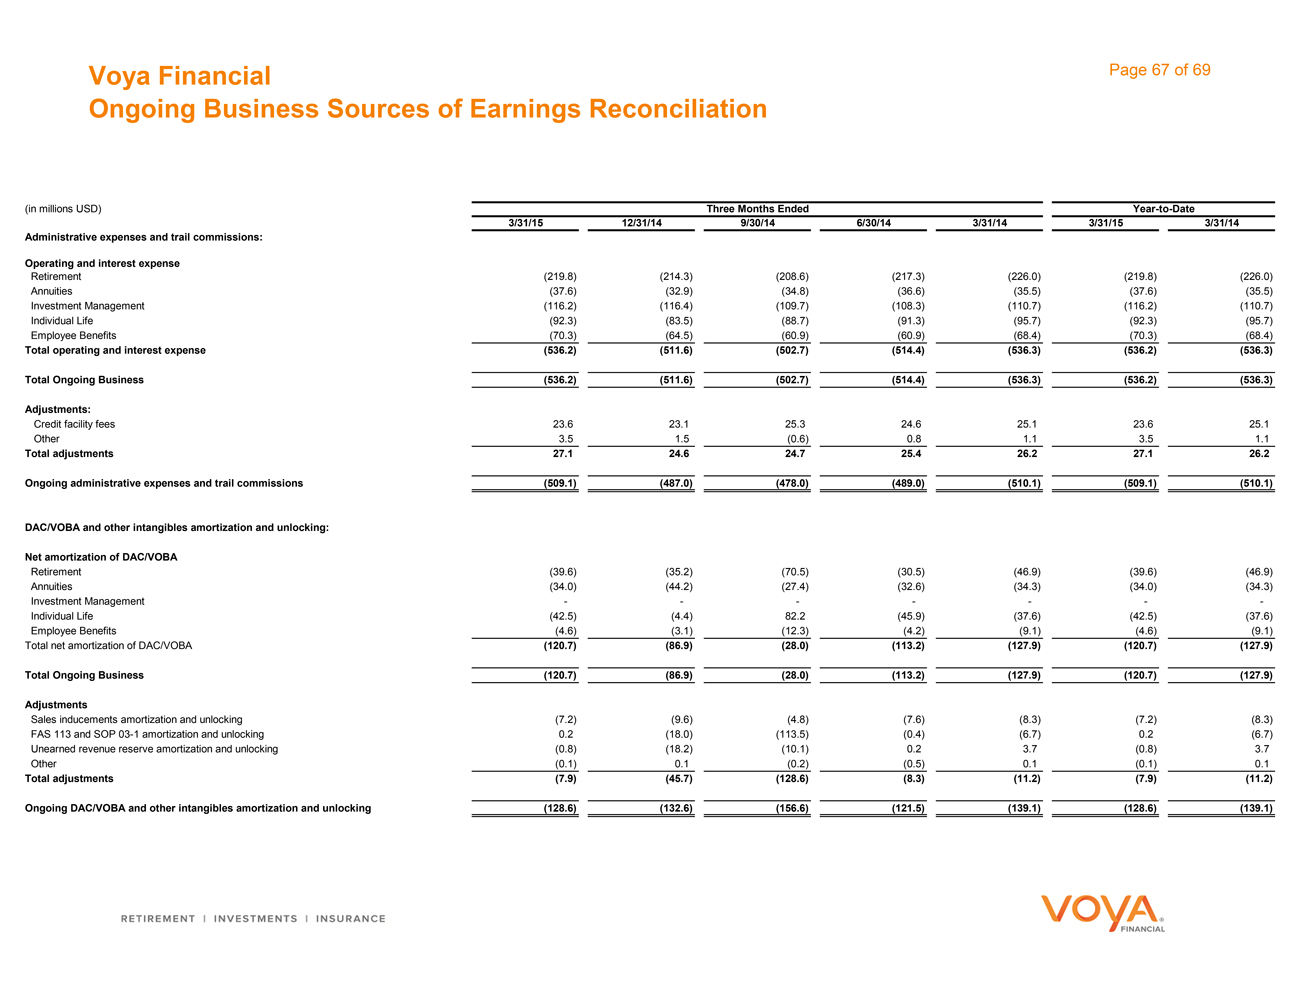
Voya Financial Ongoing Business Sources of Earnings Reconciliation Page 67 of 69 (in millions USD) Three Months Ended Year-to-Date 3/31/15 12/31/14 9/30/14 6/30/14 3/31/14 3/31/15 3/31/14 Administrative expenses and trail commissions: Operating and interest expense Retirement (219.8) (214.3) (208.6) (217.3) (226.0) (219.8) (226.0) Annuities (37.6) (32.9) (34.8) (36.6) (35.5) (37.6) (35.5) Investment Management (116.2) (116.4) (109.7) (108.3) (110.7) (116.2) (110.7) Individual Life (92.3) (83.5) (88.7) (91.3) (95.7) (92.3) (95.7) Employee Benefits (70.3) (64.5) (60.9) (60.9) (68.4) (70.3) (68.4) Total operating and interest expense (536.2) (511.6) (502.7) (514.4) (536.3) (536.2) (536.3) Total Ongoing Business (536.2) (511.6) (502.7) (514.4) (536.3) (536.2) (536.3) Adjustments: Credit facility fees 23.6 23.1 25.3 24.6 25.1 23.6 25.1 Other 3.5 1.5 (0.6) 0.8 1.1 3.5 1.1 Total adjustments 27.1 24.6 24.7 25.4 26.2 27.1 26.2 Ongoing administrative expenses and trail commissions (509.1) (487.0) (478.0) (489.0) (510.1) (509.1) (510.1) DAC/VOBA and other intangibles amortization and unlocking: Net amortization of DAC/VOBA Retirement (39.6) (35.2) (70.5) (30.5) (46.9) (39.6) (46.9) Annuities (34.0) (44.2) (27.4) (32.6) (34.3) (34.0) (34.3) Investment Management——————— Individual Life (42.5) (4.4) 82.2 (45.9) (37.6) (42.5) (37.6) Employee Benefits (4.6) (3.1) (12.3) (4.2) (9.1) (4.6) (9.1) Total net amortization of DAC/VOBA (120.7) (86.9) (28.0) (113.2) (127.9) (120.7) (127.9) Total Ongoing Business (120.7) (86.9) (28.0) (113.2) (127.9) (120.7) (127.9) Adjustments Sales inducements amortization and unlocking (7.2) (9.6) (4.8) (7.6) (8.3) (7.2) (8.3) FAS 113 and SOP 03-1 amortization and unlocking 0.2 (18.0) (113.5) (0.4) (6.7) 0.2 (6.7) Unearned revenue reserve amortization and unlocking (0.8) (18.2) (10.1) 0.2 3.7 (0.8) 3.7 Other (0.1) 0.1 (0.2) (0.5) 0.1 (0.1) 0.1 Total adjustments (7.9) (45.7) (128.6) (8.3) (11.2) (7.9) (11.2) Ongoing DAC/VOBA and other intangibles amortization and unlocking (128.6) (132.6) (156.6) (121.5) (139.1) (128.6) (139.1)
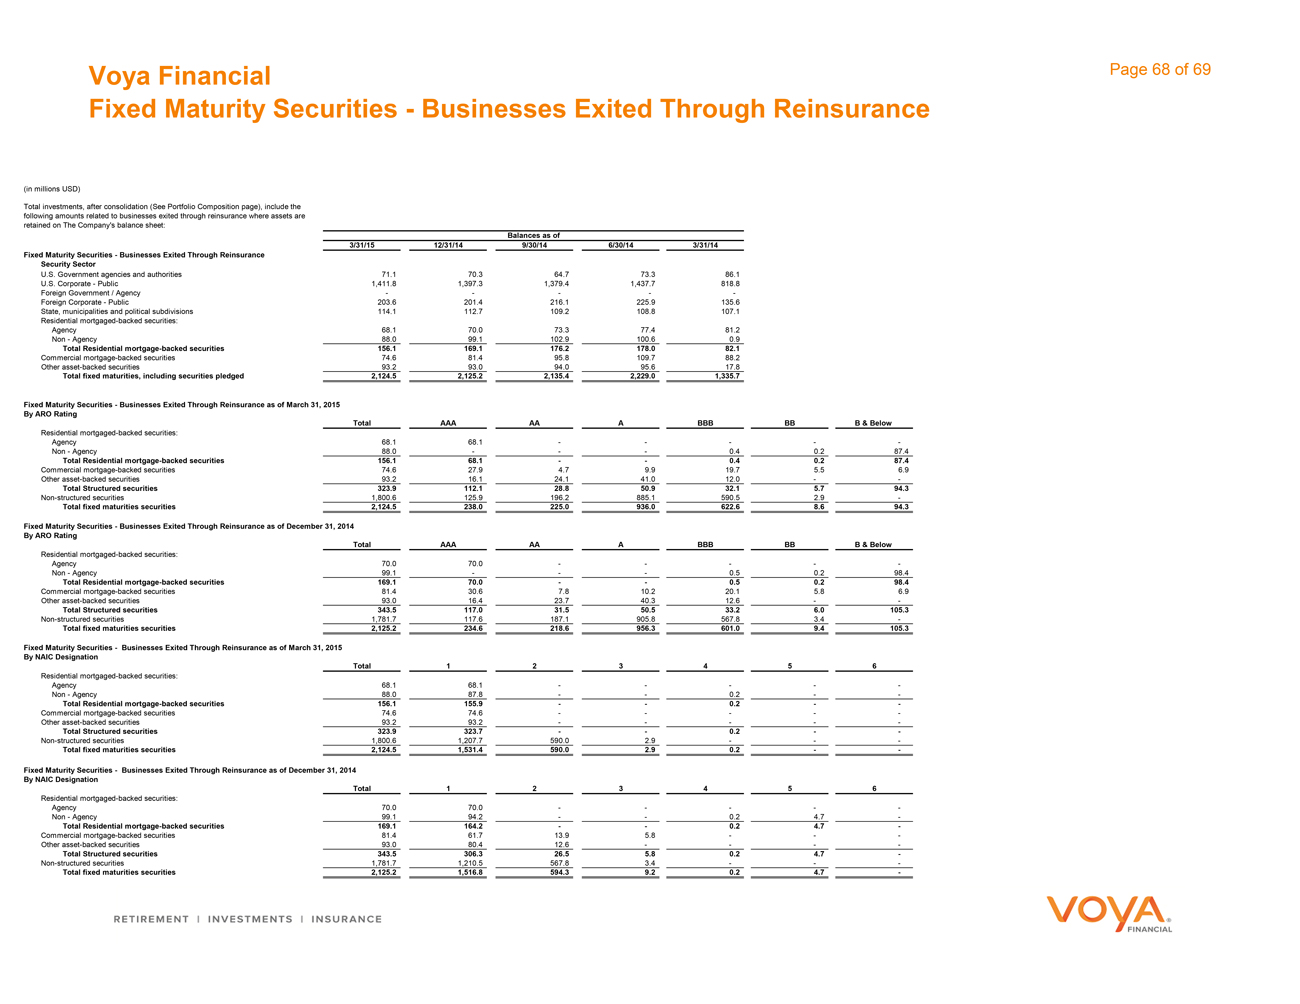
Voya Financial Fixed Maturity Securities—Businesses Exited Through Reinsurance Page 68 of 69 (in millions USD) Total investments, after consolidation (See Portfolio Composition page), include the following amounts related to businesses exited through reinsurance where assets are retained on The Company’s balance sheet: Balances as of 3/31/15 12/31/14 9/30/14 6/30/14 3/31/14 Fixed Maturity Securities—Businesses Exited Through Reinsurance Security Sector U.S. Government agencies and authorities 71.1 70.3 64.7 73.3 86.1 U.S. Corporate—Public 1,411.8 1,397.3 1,379.4 1,437.7 818.8 Foreign Government / Agency————— Foreign Corporate—Public 203.6 201.4 216.1 225.9 135.6 State, municipalities and political subdivisions 114.1 112.7 109.2 108.8 107.1 Residential mortgaged-backed securities: Agency 68.1 70.0 73.3 77.4 81.2 Non—Agency 88.0 99.1 102.9 100.6 0.9 Total Residential mortgage-backed securities 156.1 169.1 176.2 178.0 82.1 Commercial mortgage-backed securities 74.6 81.4 95.8 109.7 88.2 Other asset-backed securities 93.2 93.0 94.0 95.6 17.8 Total fixed maturities, including securities pledged 2,124.5 2,125.2 2,135.4 2,229.0 1,335.7 Fixed Maturity Securities—Businesses Exited Through Reinsurance as of March 31, 2015 By ARO Rating Total AAA AA A BBB BB B & Below Residential mortgaged-backed securities: Agency 68.1 68.1 ————— Non—Agency 88.0 ——— 0.4 0.2 87.4 Total Residential mortgage-backed securities 156.1 68.1 —— 0.4 0.2 87.4 Commercial mortgage-backed securities 74.6 27.9 4.7 9.9 19.7 5.5 6.9 Other asset-backed securities 93.2 16.1 24.1 41.0 12.0 —— Total Structured securities 323.9 112.1 28.8 50.9 32.1 5.7 94.3 Non-structured securities 1,800.6 125.9 196.2 885.1 590.5 2.9 — Total fixed maturities securities 2,124.5 238.0 225.0 936.0 622.6 8.6 94.3 Fixed Maturity Securities—Businesses Exited Through Reinsurance as of December 31, 2014 By ARO Rating Total AAA AA A BBB BB B & Below Residential mortgaged-backed securities: Agency 70.0 70.0 ————— Non—Agency 99.1 ——— 0.5 0.2 98.4 Total Residential mortgage-backed securities 169.1 70.0 —— 0.5 0.2 98.4 Commercial mortgage-backed securities 81.4 30.6 7.8 10.2 20.1 5.8 6.9 Other asset-backed securities 93.0 16.4 23.7 40.3 12.6 —— Total Structured securities 343.5 117.0 31.5 50.5 33.2 6.0 105.3 Non-structured securities 1,781.7 117.6 187.1 905.8 567.8 3.4 — Total fixed maturities securities 2,125.2 234.6 218.6 956.3 601.0 9.4 105.3 Fixed Maturity Securities—Businesses Exited Through Reinsurance as of March 31, 2015 By NAIC Designation Total 1 2 3 4 5 6 Residential mortgaged-backed securities: Agency 68.1 68.1 ————— Non—Agency 88.0 87.8 —— 0.2 —— Total Residential mortgage-backed securities 156.1 155.9 —— 0.2 —— Commercial mortgage-backed securities 74.6 74.6 ————— Other asset-backed securities 93.2 93.2 ————— Total Structured securities 323.9 323.7 —— 0.2 —— Non-structured securities 1,800.6 1,207.7 590.0 2.9 ——— Total fixed maturities securities 2,124.5 1,531.4 590.0 2.9 0.2 —— Fixed Maturity Securities—Businesses Exited Through Reinsurance as of December 31, 2014 By NAIC Designation Total 1 2 3 4 5 6 Residential mortgaged-backed securities: Agency 70.0 70.0 ————— Non—Agency 99.1 94.2 —— 0.2 4.7 — Total Residential mortgage-backed securities 169.1 164.2 —— 0.2 4.7 — Commercial mortgage-backed securities 81.4 61.7 13.9 5.8 ——— Other asset-backed securities 93.0 80.4 12.6 ———— Total Structured securities 343.5 306.3 26.5 5.8 0.2 4.7 — Non-structured securities 1,781.7 1,210.5 567.8 3.4 ——— Total fixed maturities securities 2,125.2 1,516.8 594.3 9.2 0.2 4.7 —
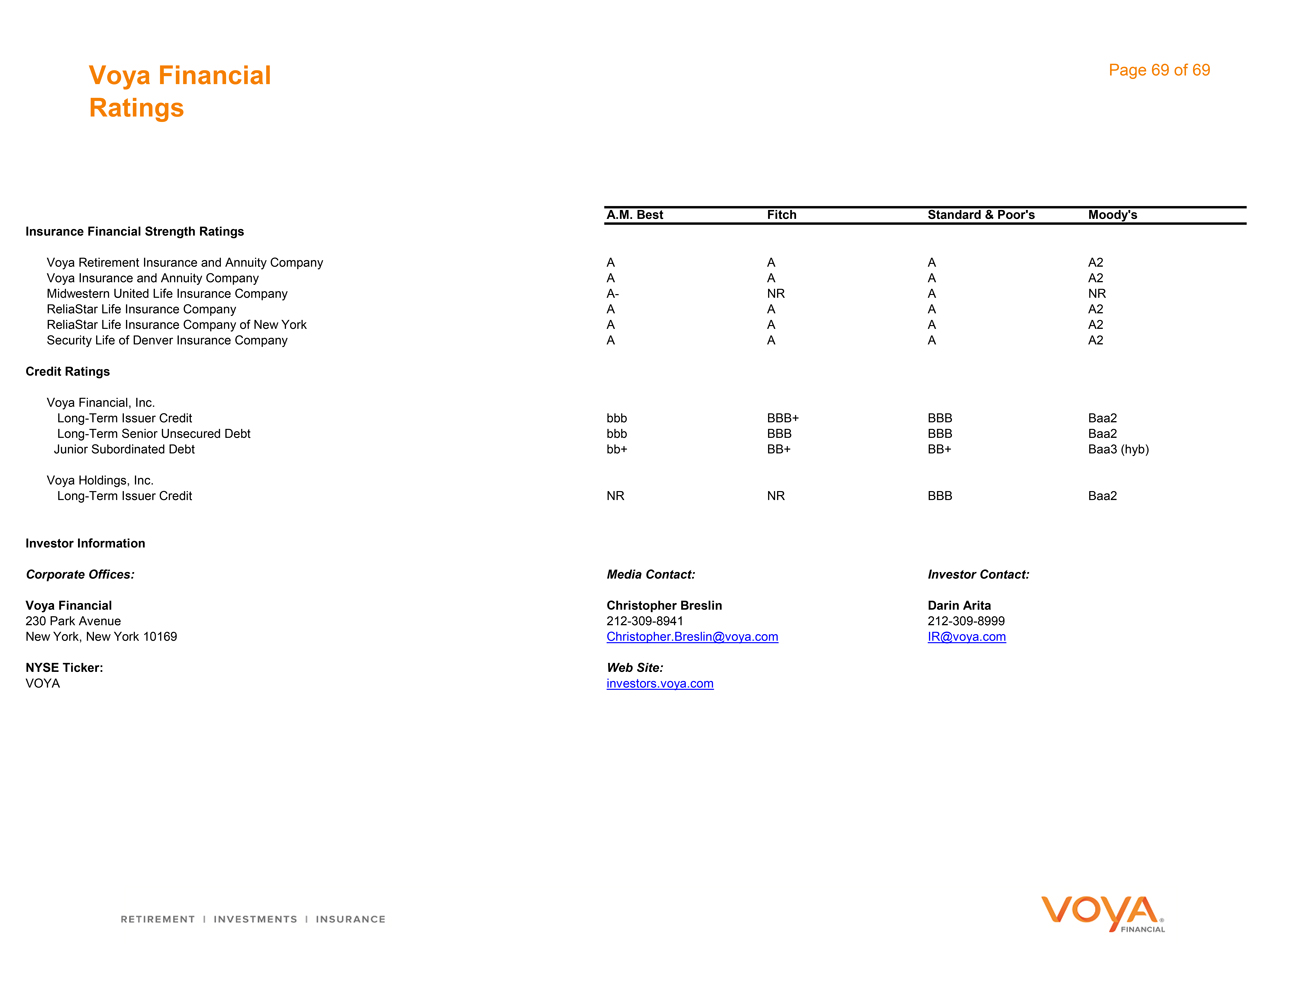
Voya Financial Ratings Page 69 of 69 A.M. Best Fitch Standard & Poor’s Moody’s Insurance Financial Strength Ratings Voya Retirement Insurance and Annuity Company A A A A2 Voya Insurance and Annuity Company A A A A2 Midwestern United Life Insurance Company A- NR A NR ReliaStar Life Insurance Company A A A A2 ReliaStar Life Insurance Company of New York A A A A2 Security Life of Denver Insurance Company A A A A2 Credit Ratings Voya Financial, Inc. Long-Term Issuer Credit bbb BBB+ BBB Baa2 Long-Term Senior Unsecured Debt bbb BBB BBB Baa2 Junior Subordinated Debt bb+ BB+ BB+ Baa3 (hyb) Voya Holdings, Inc. Long-Term Issuer Credit NR NR BBB Baa2 Investor Information Corporate Offices: Media Contact: Investor Contact: Voya Financial Christopher Breslin Darin Arita 230 Park Avenue 212-309-8941 212-309-8999 New York, New York 10169 [email protected] [email protected] NYSE Ticker: Web Site: VOYA investors.voya.com
Serious News for Serious Traders! Try StreetInsider.com Premium Free!
You May Also Be Interested In
- Voya Financial (VOYA) PT Raised to $92 at Wells Fargo
- TPT Global Tech Files 10K to Regain Full SEC Compliance
- Voya Investment Management to host a webcast for the Voya Global Advantage and Premium Opportunity Fund; Voya Global Equity Dividend and Premium Opportunity Fund; and Voya Infrastructure, Industrials
Create E-mail Alert Related Categories
SEC FilingsSign up for StreetInsider Free!
Receive full access to all new and archived articles, unlimited portfolio tracking, e-mail alerts, custom newswires and RSS feeds - and more!
