




Form 8-K Vectrus, Inc. For: Aug 05

FREE Breaking News Alerts from StreetInsider.com!
StreetInsider.com Top Tickers, 10/24/2026
- Wall Street closes lower to end rocky week
- Meta's capital-raising plans expose a major weakness in the AI boom
- Oil prices jump $3 on Houthi attacks, oil spill, highest settlement since April
- BofA flags further downside risk for stocks, yields and dollar
- SpaceX cell-site ambitions lift tower stocks and weigh on carriers
 Tweet
Tweet Share
Share E-mail
UNITED STATES
SECURITIES AND EXCHANGE COMMISSION
Washington, D.C. 20549
FORM 8-K
CURRENT REPORT
Pursuant to Section 13 or 15(d) of
the Securities Exchange Act of 1934
Date of Report (Date of earliest event reported): August 5, 2015
VECTRUS, INC.
(Exact name of Registrant as specified in its charter)
Indiana | 0001-36341 | 38-3924636 |
(State or other jurisdiction of incorporation or organization) | (Commission File Number) | (I.R.S. Employer Identification No.) |
655 Space Center Drive
Colorado Springs, CO 80915
(Address of principal executive offices) (Zip Code)
Registrant's telephone number, including area code: (719) 591-3600
Not Applicable
(Former name or former address, if changed since last report)
Check the appropriate box below if the Form 8-K filing is intended to simultaneously satisfy the filing obligation of the registrant under any of the following provisions:
[ ] Written communications pursuant to Rule 425 under the Securities Act (17 CFR 230.425)
[ ] Soliciting material pursuant to Rule 14a-12 under the Exchange Act (17 CFR 240.14a-12)
[ ] Pre-commencement communications pursuant to Rule 14d-2(b) under the Exchange Act (17 CFR 240.14d-2(b))
[ ] Pre-commencement communications pursuant to Rule 13e-4(c) under the Exchange Act (17 CFR 240.13e-4(c))
Item 2.02 Results of Operations and Financial Condition.
Attached hereto as Exhibit 99.1 and incorporated by reference herein is a press release issued by Vectrus, Inc. (the "Company") on August 5, 2015 that includes financial information for the Company for the second quarter of 2015 and updated guidance for fiscal 2015 revenue and adjusted diluted earnings per share. This information shall not be deemed filed for purposes of Section 18 of the Securities Exchange Act of 1934, as amended (the "Exchange Act") or incorporated by reference into any filing under the Securities Act of 1933, as amended (the "Securities Act"), or the Exchange Act, except as shall be expressly set forth by specific reference in such filing.
Item 7.01 Regulation FD Disclosure.
Mr. Kenneth Hunzeker, Chief Executive Officer and President, and Mr. Matthew Klein, Senior Vice President and Chief Financial Officer, will present the financial information for the Company for the second quarter of 2015 and updated guidance for fiscal 2015 revenue and adjusted diluted earnings per share on August 6, 2015. A copy of the presentation is attached hereto and incorporated by reference herein as Exhibit 99.2. This information is furnished pursuant to Item 7.01 Regulation FD Disclosure and shall not be deemed filed for purposes of Section 18 of the Exchange Act or incorporated by reference into any filing under the Securities Act or the Exchange Act, except as shall be expressly set forth by specific reference in such filing.
Item 9.01 Financial Statements and Exhibits.
(d) Exhibits.
Exhibit No. | Description | |
99.1 | Press Release of Vectrus, Inc. dated August 5, 2015 | |
99.2 | Presentation slides issued by Vectrus, Inc. on August 5, 2015 | |
SIGNATURE
Pursuant to the requirements of the Securities Exchange Act of 1934, the registrant has duly caused this report to be signed on its behalf by the undersigned hereunto duly authorized.
Date: August 5, 2015 | VECTRUS, INC. | |
By: | /s/ Kathryn S. Lamping | |
Its: | Assistant Secretary | |
EXHIBIT INDEX
Exhibit No. | Description | |||
99.1 | Press Release dated August 5, 2015, issued by Vectrus, Inc. | |||
99.2 | Presentation slides issued by Vectrus, Inc. on August 5, 2015 | |||
Exhibit 99.1
PRESS RELEASE
CONTACT:
Investors |
Mike Smith |
719-637-5773 |
Media |
George Rhynedance |
719-637-4182 |
Vectrus posts solid second quarter 2015 financial results
• | Core business1 revenue increased 15% |
• | Awarded positions on three indefinite-delivery/indefinite-quantity (IDIQ) contracts; new programs now underway |
• | Free cash flow2 improvements enabled $6 million voluntary debt payment |
• | Raising the lower end of 2015 revenue and adjusted EPS2 guidance |
COLORADO SPRINGS, Colo., Aug. 5, 2015 — Vectrus, Inc. (NYSE: VEC) announced second quarter 2015 results which included revenue of $309.5 million, operating income of $10.8 million and diluted earnings per share of $0.56. As of June 26, 2015, year-to-date net cash used in operating activities was $0.2 million and free cash flow use was $0.9 million, which represents an incremental change of $26.8 million in the second quarter.
“Our strong second quarter results were highlighted by 15% growth in the core business when compared to second quarter 2014,” said Ken Hunzeker, chief executive officer and president of Vectrus. "Our new Turkey-Spain Base Maintenance and Army Corps of Engineers IT contracts are now contributing to revenue as we expected, and we are pleased with the opportunities our recent IDIQ wins represent.”
1
Exhibit 99.1
Recent Contract Awards
During the quarter, Vectrus secured prime positions on three multiple award, IDIQ contracts:
• | AFCAP IV (Air Force Contract Augmentation Program) - Vectrus was one of eight companies selected for a prime position on the approximately $5 billion multiple award IDIQ contract that has an estimated completion date of September 2021. |
• | TACOM TS3 (U.S. Army Tank-automotive and Armaments Command Strategic Service Solutions Equipment Related Services contract) - Vectrus was one of 18 large service providers selected for a prime position on the $1.1 billion multiple award IDIQ contract that has an estimated completion date of May 2023. |
• | SeaPort-e (Seaport Enhanced) - Vectrus was awarded a position on the Navy’s SeaPort-e acquisition program for services procurements. This award creates a distinct position for Vectrus as a services provider for the Navy. |
Vectrus was awarded a $62 million bridge contract to extend existing services at Maxwell Air Force Base. The one-year bridge extends into May 2016 and has the potential for an additional two, three-month option periods.
Additionally, subsequent to the end of the second quarter, Vectrus received a $221 million extension to the U.S. Army base operations and security support services contract in Kuwait. The six-month extension extends into March 2016.
Core Business and New Contracts Continue to Progress
"Our long-term strategy is yielding visible results. Core business revenue was $263.6 million for the second quarter, and Afghanistan revenue in the second quarter was $45.9 million," said Hunzeker. "We expect contributions from new business will continue to drive growth in our core business and will offset expected declines in Afghanistan-related work in 2015.”
As previously reported, the Turkey-Spain Base Maintenance Contract reached full operating capability at the beginning of the second quarter. The Army Corps of Engineers Enterprise Information Management and Information Technology Support Services contract also contributed to second quarter results, and achieved full operating capability in late July.
Second Quarter 2015 Results
• | Revenue $309.5 million |
• | Operating income $10.8 million |
• | Operating margin 3.5 percent |
• | Diluted earnings per share $0.56 |
Second quarter 2015 revenue of $309.5 million declined $3.4 million or 1.1 percent compared to the second quarter 2014. On an adjusted basis, second quarter 2015 revenue2 of $309.5 million increased $8.0 million or 2.7 percent compared to the second quarter 2014.
2
Exhibit 99.1
"In the second quarter, we were successful in achieving adjusted revenue growth after several periods of decline," said Matt Klein, chief financial officer at Vectrus. "We are pleased with our progress and expect to build from this solid foundation in the coming quarters."
Programs based in Afghanistan contributed $45.9 million of revenue in the second quarter 2015, down $27.2 million compared to the second quarter 2014.
Operating income was $10.8 million or 3.5 percent operating margin in the second quarter 2015, compared to $9.4 million or 3.0 percent in the second quarter 2014.
Second quarter 2015 diluted earnings per share were $0.56 compared to $0.59 in 2014 and adjusted diluted earnings per share2 were $0.56 compared to $0.81 in 2014.
Year-to-date, June 26, 2015, net cash used in operating activities was $0.2 million compared to net cash provided by operating activities of $2.6 million during the same period in 2014. Free cash flow use was $0.9 million year-to-date June 26, 2015, compared to $1.6 million provided during the same period in 2014.
"Our free cash flow improved $27 million compared to the first quarter," said Klein. "This enabled us to make a voluntary debt payment of $6 million in the quarter."
For the quarter ending June 26, 2015, book-to-bill3 ratio was 1.06x. The Company ended the quarter with total backlog of $2.5 billion. Funded backlog at June 26, 2015, was $0.7 billion.
2015 Guidance
The company is updating its 2015 revenue and adjusted diluted EPS guidance; however, the 2015 adjusted operating margin and free cash flow guidance remain unchanged:
(In millions, except Adjusted Operating Margin and per share amounts) | (Prior) 2015 Guidance | (Updated) 2015 Guidance | ||||||||||
Revenue | $1,100 | to | $1,200 | $1,150 | to | $1,200 | ||||||
Adjusted Operating Margin 4 | 3.2 | % | to | 3.6 | % | 3.2 | % | to | 3.6 | % | ||
Free Cash Flow 5 | $15 | to | $19 | $15 | to | $19 | ||||||
Adjusted EPS, diluted 6 | $1.76 | to | $2.23 | $1.85 | to | $2.23 | ||||||
The Company notes that forward-looking statements of future performance made in this release are based upon current expectations and are subject to factors that could cause actual results to differ materially from those suggested here, including those factors set forth in the Safe Harbor Statement below.
Investor Call
Management representatives will conduct an investor briefing and conference call at 8 a.m. ET on Thursday, Aug. 6, 2015. U.S.-based participants may dial in to the conference call at 888-572-7033, while international participants may dial 719-325-2361. Passcode for both is 9661551. For all other listeners, a live webcast of the briefing and conference call will be available on the Vectrus Investor Relations website at http://investors.vectrus.com.
A replay of the briefing will be posted on the Vectrus website shortly after completion of the call, and will remain available for one year. A telephonic replay will also be available through Aug. 20 at
3
Exhibit 99.1
877-870-5176 (domestic) or 858-384-5517 (international) with passcode 9661551.
###
Footnotes:
1 Core Business is defined as Revenue (or adjusted Revenue) less Afghanistan programs. Q2 2015 revenue less Afghanistan program revenue is $263.6M and Q2 2014 adjusted revenue2 less Afghanistan program revenue $228.2 million; represents a 15% increase.
2 See “Key Performance Indicators and Non-GAAP Financial Measures.”
3 Adjusted book-to-bill is the amount of adjusted funded orders divided by adjusted revenue for the period.
4 See “Key Performance Indicators and Non-GAAP Financial Measures.” Full year 2015 adjusted operating margin guidance excludes the pretax impact of year-to-date separation costs to become a stand-alone public company in the amount of $177K.
5 Full-year 2015 free cash flow guidance is GAAP net cash (used in) and provided by operating activities less estimated capital expenditures of $2M.
6 See “Key Performance Indicators and Non-GAAP Financial Measures.” Full-year 2015 adjusted diluted EPS guidance reflects the impact, net of tax, of separation costs incurred to become a stand-alone public company in the amount of $113K or $.01 per share. The total number of estimated weighted average diluted common shares outstanding is 10.8M at Dec. 31, 2015.
About Vectrus
Vectrus is a leading, global government services company with a history in the services market that dates back more than 70 years. The company provides infrastructure asset management, information technology and network communication services, and logistics and supply chain management services to U.S. government customers around the world. Vectrus is differentiated by operational excellence, superior program performance, a history of long-term customer relationships, and a strong commitment to their mission success. Vectrus is headquartered in Colorado Springs, Colo., and includes more than 5,000 employees spanning 85 locations in 15 countries. In 2014, Vectrus generated sales of $1.2 billion. For more information, visit our website at www.vectrus.com or connect with us on Facebook, Twitter, LinkedIn, and YouTube.
Safe Harbor Statement
Safe Harbor Statement under the Private Securities Litigation Reform Act of 1995 (the "Act"): Certain material presented herein includes forward-looking statements intended to qualify for the safe harbor from liability established by the Act. These forward-looking statements include, but are not limited to, statements about the spin-off of Vectrus, Inc. (the "Company") from Exelis Inc. (The “Separation”), the terms and the effect of the separation and related matters, future strategic plans and other statements that describe the Company's business strategy, outlook, objectives, plans, intentions or goals, and any discussion of guidance or future operating or financial performance. Whenever used, words such as "may", "will", "likely", "anticipate", "estimate", "expect", "project", "intend", "plan", "believe", "target", "could," "potential," "continue," or similar terminology. These statements are based on the beliefs and assumptions of the management of the company based on information currently available to management. Forward-looking statements are not guarantees of future performance and are subject to risks and uncertainties that could cause actual results to differ materially from the results contemplated by the forward-looking statements. The company undertakes no obligation to update our forward looking statements, whether as a result of new information, future events or otherwise, except as required by law.
4
Exhibit 99.1
Such forward-looking statements are subject to certain risks and uncertainties that could cause actual results to differ materially from the Company's historical experience and our present expectations or projections. These risks and uncertainties include, but are not limited to: risks and uncertainties relating to the spin-off, including whether the spin-off and related transactions will result in any tax liability, the operational and financial profile of the Company or any of its businesses after giving effect to the spin-off, and the ability of the Company to operate as an independent entity; economic, political and social conditions in the countries in which we conduct our businesses; changes in U.S. or international government defense budgets; protests of new awards; our ability to submit proposals for and/or win all potential opportunities in our pipeline; changes in technology, intellectual property matters, government regulations and compliance therewith, including changes to the Department of Defense procurement process; changes in technology; intellectual property matters; governmental investigations, reviews, audits and cost adjustments; contingencies related to actual or alleged environmental contamination, claims and concerns; delays in completion of the U.S. Government's budget; our success in expanding our geographic footprint or broadening our customer base; our ability to realize the full amounts reflected in our backlog and retain and renew our existing contracts; impairment of goodwill; misconduct of our employees, subcontractors, agents and business partners; our ability to control costs; our level of indebtedness; subcontractor performance; economic and capital markets conditions; ability to retain and recruit qualified personnel; security breaches and other disruptions to our information technology and operations; changes in our tax provisions or exposure to additional income tax liabilities; changes in generally accepted accounting principles; and other factors described in Item Part I, Item 1A – “Risk Factors,” and elsewhere in our 2014 Annual Report on Form 10-K and described from time to time in our future reports filed with the Securities and Exchange Commission (SEC).
5
Exhibit 99.1
VECTRUS, INC.
CONDENSED CONSOLIDATED AND COMBINED STATEMENTS OF INCOME (UNAUDITED)
Three Months Ended | Six Months Ended | |||||||||||||||
June 26, | June 28, | June 26, | June 28, | |||||||||||||
(In thousands, except per share data) | 2015 | 2014 | 2015 | 2014 | ||||||||||||
Revenue | $ | 309,509 | $ | 312,902 | $ | 570,429 | $ | 616,853 | ||||||||
Cost of revenue | 282,563 | 283,952 | 518,945 | 551,886 | ||||||||||||
Selling, general and administrative expenses | 16,101 | 19,528 | 31,284 | 37,989 | ||||||||||||
Operating income | 10,845 | 9,422 | 20,200 | 26,978 | ||||||||||||
Interest (expense) income, net | (1,437 | ) | 27 | (3,033 | ) | 49 | ||||||||||
Income from continuing operations before income taxes | 9,408 | 9,449 | 17,167 | 27,027 | ||||||||||||
Income tax expense | 3,388 | 3,317 | 6,182 | 9,660 | ||||||||||||
Net income | $ | 6,020 | $ | 6,132 | $ | 10,985 | $ | 17,367 | ||||||||
Earnings per share ¹ | ||||||||||||||||
Basic | $ | 0.57 | $ | 0.59 | $ | 1.04 | $ | 1.66 | ||||||||
Diluted | $ | 0.56 | $ | 0.59 | $ | 1.02 | $ | 1.66 | ||||||||
Weighted average common shares outstanding - basic | 10,548 | 10,474 | 10,520 | 10,474 | ||||||||||||
Weighted average common shares outstanding - diluted | 10,804 | 10,474 | 10,789 | 10,474 | ||||||||||||
¹ For periods ended September 27, 2014 and prior, basic and diluted earnings per share are computed using the number of shares of Vectrus common stock outstanding on September 27, 2014, the date on which the Vectrus common stock was distributed to the shareholders of Exelis Inc. | ||||||||||||||||
6
Exhibit 99.1
VECTRUS, INC.
CONDENSED CONSOLIDATED BALANCE SHEETS
June 26, | December 31, | |||||||
(In thousands, except share information) | 2015 | 2014 | ||||||
Assets | (unaudited) | |||||||
Current assets | ||||||||
Cash | $ | 40,003 | $ | 42,823 | ||||
Receivables | 212,654 | 202,732 | ||||||
Costs incurred in excess of billings | 6,386 | 7,112 | ||||||
Other current assets | 18,607 | 10,883 | ||||||
Total current assets | 277,650 | 263,550 | ||||||
Property, plant, and equipment, net | 7,516 | 8,920 | ||||||
Goodwill | 216,930 | 216,930 | ||||||
Other non-current assets | 6,190 | 6,575 | ||||||
Total non-current assets | 230,636 | 232,425 | ||||||
Total Assets | $ | 508,286 | $ | 495,975 | ||||
Liabilities and Shareholders' Equity | ||||||||
Current liabilities | ||||||||
Accounts payable | 102,369 | 114,487 | ||||||
Billings in excess of costs | 15,127 | 5,806 | ||||||
Compensation and other employee benefits | 46,217 | 36,580 | ||||||
Deferred tax liability | 23,635 | 25,414 | ||||||
Short-term debt | 19,125 | 11,375 | ||||||
Other accrued liabilities | 43,979 | 37,073 | ||||||
Total current liabilities | 250,452 | 230,735 | ||||||
Long-term debt, net | 103,855 | 122,484 | ||||||
Deferred tax liability | 73,612 | 75,337 | ||||||
Other non-current liabilities | 12,973 | 13,544 | ||||||
Total non-current liabilities | 190,440 | 211,365 | ||||||
Total liabilities | 440,892 | 442,100 | ||||||
Commitments and contingencies | ||||||||
Shareholders' Equity | ||||||||
Preferred stock; $0.01 par value; 10,000,000 shares authorized; No shares issued and outstanding | — | — | ||||||
Common stock; $0.01 par value; 100,000,000 shares authorized; 10,559,446 and 10,484,974 shares issued and outstanding | 106 | 105 | ||||||
Additional paid in capital | 56,322 | 52,967 | ||||||
Retained earnings | 14,316 | 3,331 | ||||||
Accumulated other comprehensive loss | (3,350 | ) | (2,528 | ) | ||||
Total shareholders' equity | 67,394 | 53,875 | ||||||
Total Liabilities and Shareholders' Equity | $ | 508,286 | $ | 495,975 | ||||
7
Exhibit 99.1
VECTRUS, INC. CONDENSED CONSOLIDATED AND COMBINED STATEMENTS OF CASH FLOWS (UNAUDITED)
Six Months Ended | ||||||||
(In thousands) | June 26, 2015 | June 28, 2014 | ||||||
Operating activities | ||||||||
Net income | $ | 10,985 | $ | 17,367 | ||||
Adjustments to reconcile net income to net cash used in operating activities: | ||||||||
Depreciation and amortization expense | 1,753 | 1,569 | ||||||
Loss on disposal of property, plant, and equipment | 328 | — | ||||||
Stock-based compensation | 3,852 | — | ||||||
Amortization of debt issuance costs | 370 | — | ||||||
Changes in assets and liabilities: | ||||||||
Receivables | (9,922 | ) | (13,563 | ) | ||||
Other assets | (6,586 | ) | 3,021 | |||||
Accounts payable | (12,062 | ) | 6,068 | |||||
Billings in excess of costs | 9,321 | (4,377 | ) | |||||
Deferred taxes | (3,504 | ) | (1,087 | ) | ||||
Compensation and other employee benefits | 9,637 | (4,008 | ) | |||||
Other liabilities | (4,353 | ) | (2,353 | ) | ||||
Net cash (used in) and provided by operating activities | (181 | ) | 2,637 | |||||
Investing activities | ||||||||
Purchases of capital assets | (734 | ) | (1,004 | ) | ||||
Net cash used in investing activities | (734 | ) | (1,004 | ) | ||||
Financing activities | ||||||||
Repayments of long-term debt | (11,250 | ) | — | |||||
Proceeds from revolver | 132,500 | — | ||||||
Repayments of revolver | (132,500 | ) | — | |||||
Proceeds from exercise of stock options | 107 | — | ||||||
Proceeds from insurance financing | 14,857 | — | ||||||
Repayments of insurance financing | (4,018 | ) | — | |||||
Payments of employee withholding taxes on share-based compensation | (752 | ) | — | |||||
Transfer to Former Parent, net | — | (2,105 | ) | |||||
Net cash used in financing activities | (1,056 | ) | (2,105 | ) | ||||
Exchange rate effect on cash | (849 | ) | (657 | ) | ||||
Net change in cash | (2,820 | ) | (1,129 | ) | ||||
Cash-beginning of year | 42,823 | 10,446 | ||||||
Cash-end of period | $ | 40,003 | $ | 9,317 | ||||
Supplemental Disclosure of Cash Flow Information: | ||||||||
Interest paid | $ | 2,393 | $ | 16 | ||||
Income taxes paid | $ | 6,234 | $ | — | ||||
Non-cash investing activities: | ||||||||
Purchase of capital assets on account | $ | 35 | $ | 167 | ||||
8
Exhibit 99.1
Key Performance Indicators and Non-GAAP Financial Measures
The primary financial performance measures Vectrus uses to manage its business and monitor results of operations are revenue trends and operating income trends. In addition, we consider adjusted revenue, adjusted operating income, adjusted operating margin, adjusted net income, adjusted diluted earnings per share, and free cash flow, to be useful to management and investors in evaluating our operating performance for the periods presented, and to provide a tool for evaluating our ongoing operations. This information can assist investors in assessing our financial performance and measures our ability to generate capital for deployment among competing strategic alternatives and initiatives.
Adjusted revenue, adjusted operating income, adjusted operating margin, adjusted net income, adjusted diluted earnings per share, and free cash flow, however, are not measures of financial performance under generally accepted accounting principles in the United States of America (GAAP) and should not be considered a substitute for revenue, operating income, net income, diluted earnings per share, or net cash provided by operating activities as determined in accordance with GAAP. Reconciliations of adjusted revenue, adjusted operating income, adjusted net income, adjusted diluted earnings per share, and free cash flow are provided below.
“Adjusted revenue” is defined as revenue adjusted to exclude the TARS program revenue which has been retained by Exelis.
“Adjusted operating income” is defined as net income, adjusted to exclude income taxes, interest income (expense), TARS program operating income, and separation costs incurred to become a public company.
“Adjusted operating margin” is defined as net income, adjusted to exclude income taxes, interest income (expense), TARS program operating income, and separation costs incurred to become a public company, divided by adjusted revenue.
"Adjusted net income" is defined as net income, adjusted to exclude TARS program operating income and separation costs incurred to become a public company, net of taxes.
"Adjusted diluted earnings per share" is defined as net income, adjusted to exclude TARS program operating income and separation costs incurred to become a public company, net of taxes divided by the weighted average diluted common shares outstanding.
“Free cash flow” is defined as GAAP net cash (used in) and provided by operating activities less capital expenditures.
"Adjusted funded orders" is defined as funded orders adjusted to exclude the TARS program.
"Core business revenue" is defined as revenue (or adjusted revenue) less Afghanistan programs revenue.
(In thousands) | Three Months Ended | Six Months Ended | ||||||||||||||
Adjusted Revenue (Non-GAAP Measure) | June 26, 2015 | June 28, 2014 | June 26, 2015 | June 28, 2014 | ||||||||||||
Revenue | $ | 309,509 | $ | 312,902 | $ | 570,429 | $ | 616,853 | ||||||||
TARS revenue ¹ | — | (11,438 | ) | — | (18,737 | ) | ||||||||||
Adjusted revenue | $ | 309,509 | $ | 301,464 | $ | 570,429 | $ | 598,116 | ||||||||
¹ TARS program historical revenue, which has been retained by Exelis | ||||||||||||||||
9
Exhibit 99.1
(In thousands) | Three Months Ended | Six Months Ended | ||||||||||||||
Adjusted Operating Income (Non-GAAP Measure) | June 26, 2015 | June 28, 2014 | June 26, 2015 | June 28, 2014 | ||||||||||||
Net income | $ | 6,020 | $ | 6,132 | $ | 10,985 | $ | 17,367 | ||||||||
Income taxes | 3,388 | 3,317 | 6,182 | 9,660 | ||||||||||||
Interest (expense) income, net | (1,437 | ) | 27 | (3,033 | ) | 49 | ||||||||||
Operating income | 10,845 | 9,422 | 20,200 | 26,978 | ||||||||||||
Operating margin | 3.5 | % | 3.0 | % | 3.5 | % | 4.4 | % | ||||||||
TARS operating income (loss) ¹ (pretax) | — | 291 | — | (610 | ) | |||||||||||
Separation costs ² (pretax) | 31 | 3,412 | 177 | 5,522 | ||||||||||||
Adjusted operating income | $ | 10,876 | $ | 13,125 | $ | 20,377 | $ | 31,890 | ||||||||
Adjusted operating margin | 3.5 | % | 4.4 | % | 3.6 | % | 5.3 | % | ||||||||
¹ TARS program historical operating income (loss), which has been retained by Exelis. | ||||||||||||||||
² Costs incurred to become a stand-alone public company | ||||||||||||||||
(In thousands, except for per share data) | Three Months Ended | Six Months Ended | ||||||||||||||
Adjusted Diluted Earnings Per Share | June 26, 2015 | June 28, 2014 | June 26, 2015 | June 28, 2014 | ||||||||||||
Net income | $ | 6,020 | $ | 6,132 | $ | 10,985 | $ | 17,367 | ||||||||
TARS operating income (loss) ¹ (pretax) | — | 291 | — | (610 | ) | |||||||||||
Separation costs ² (pretax) | 31 | 3,412 | 177 | 5,522 | ||||||||||||
Tax impact of adjustments | (11 | ) | (1,300 | ) | (64 | ) | (1,754 | ) | ||||||||
Adjusted net income | $ | 6,040 | $ | 8,535 | $ | 11,098 | $ | 20,525 | ||||||||
GAAP EPS - diluted | $ | 0.56 | $ | 0.59 | $ | 1.02 | $ | 1.66 | ||||||||
Adjusted EPS - diluted | $ | 0.56 | $ | 0.81 | $ | 1.03 | $ | 1.96 | ||||||||
Weighted average common shares outstanding - diluted | 10,804 | 10,474 | 10,789 | 10,474 | ||||||||||||
¹ TARS program historical operating income (loss), which has been retained by Exelis. | ||||||||||||||||
² Costs incurred to become a stand-alone public company | ||||||||||||||||
(In thousands) | Six Months Ended | |||||||
Free Cash Flow (Non-GAAP Measure) | June 26, 2015 | June 28, 2014 | ||||||
Net cash (used in) and provided by operating activities | $ | (181 | ) | $ | 2,637 | |||
Subtract: | ||||||||
Capital expenditures | (734 | ) | (1,004 | ) | ||||
Free cash flow | $ | (915 | ) | $ | 1,633 | |||
10
Exhibit 99.1
(In millions) | Three Months Ended | Six Months Ended | ||||||||
Adjusted Funded Orders (Non-GAAP Measure) | June 26, 2015 | June 28, 2014 | June 26, 2015 | June 28, 2014 | ||||||
Orders | $332.4 | $337.0 | $476.0 | $477.3 | ||||||
TARS Orders ¹ | $0.0 | $11.0 | $0.0 | $ | (12.4 | ) | ||||
Adjusted Orders | $332.4 | $348.0 | $476.0 | $465.0 | ||||||
¹ TARS program historical orders, which has been retained by Exelis | ||||||||||
(In millions) | Three Months Ended | ||||||||||||||
Adjusted Revenue and Core Business Revenue (Non-GAAP Measure) | June 26, 2015 | June 28, 2014 | $ Change | % Change | |||||||||||
Revenue | $ | 309.5 | $ | 312.9 | |||||||||||
TARS revenue ¹ | — | (11.4 | ) | ||||||||||||
Adjusted revenue | $ | 309.5 | $ | 301.5 | |||||||||||
Less Afghanistan Program Revenue | $ | (45.9 | ) | $ | (73.1 | ) | |||||||||
Core business revenue | $ | 263.6 | $ | 228.4 | $ | 35.2 | 15 | % | |||||||
¹ TARS program historical revenue, which has been retained by Exelis | |||||||||||||||
11
Exhibit 99.1
SUPPLEMENTAL INFORMATION
Three Months Ended | Six Months Ended | |||||||||||||||||||||||
(In thousands) | June 26, 2015 | June 28, 2014 | June 26, 2015 | June 28, 2014 | ||||||||||||||||||||
Military branch | Revenue | % of Total | Revenue | % of Total | Revenue | % of Total | Revenue | % of Total | ||||||||||||||||
Army | 282,414 | 91 | % | 271,446 | 87 | % | 518,676 | 91 | % | 531,110 | 86 | % | ||||||||||||
Navy | 6,055 | 2 | % | 4,732 | 2 | % | 12,514 | 2 | % | 11,103 | 2 | % | ||||||||||||
Air Force | 20,331 | 7 | % | 23,782 | 8 | % | 38,222 | 7 | % | 42,563 | 7 | % | ||||||||||||
Marines | 709 | — | % | — | — | % | 1,017 | — | % | — | — | % | ||||||||||||
Other U.S Government¹ | — | — | % | 12,942 | 4 | % | — | — | % | 32,076 | 5 | % | ||||||||||||
Total Revenue | 309,509 | 312,902 | 570,429 | 616,853 | ||||||||||||||||||||
¹ TARS program, which was retained by Exelis | ||||||||||||||||||||||||
Three Months Ended | Six Months Ended | |||||||||||||||||||||||
(in thousands) | June 26, 2015 | June 28, 2014 | June 26, 2015 | June 28, 2014 | ||||||||||||||||||||
Contract type | Revenue | % of Total | Revenue | % of Total | Revenue | % of Total | Revenue | % of Total | ||||||||||||||||
Firm-Fixed-Price | 118,071 | 38 | % | 83,767 | 27 | % | 203,744 | 36 | % | 157,862 | 26 | % | ||||||||||||
Cost-Plus and Cost Reimbursable ¹ | 191,438 | 62 | % | 229,135 | 73 | % | 366,685 | 64 | % | 458,991 | 74 | % | ||||||||||||
Total Revenue | 309,509 | 312,902 | 570,429 | 616,853 | ||||||||||||||||||||
¹ Includes time and material contracts | ||||||||||||||||||||||||
Three Months Ended | Six Months Ended | |||||||||||||||||||||||
(In thousands) | June 26, 2015 | June 28, 2014 | June 26, 2015 | June 28, 2014 | ||||||||||||||||||||
Contract Relationship | Revenue | % of Total | Revenue | % of Total | Revenue | % of Total | Revenue | % of Total | ||||||||||||||||
Prime Contractor | 281,278 | 91 | % | 266,505 | 85 | % | 512,884 | 90 | % | 524,381 | 85 | % | ||||||||||||
Sub Contractor | 28,231 | 9 | % | 46,397 | 15 | % | 57,545 | 10 | % | 92,472 | 15 | % | ||||||||||||
Total Revenue | 309,509 | 312,902 | 570,429 | 616,853 | ||||||||||||||||||||
Source: Vectrus, Inc.
12
VECTRUS SECOND QUARTER 2015 EARNINGS PRESENTATION KEN HUNZEKER CHIEF EXECUTIVE OFFICER AND PRESIDENT MATT KLEIN SENIOR VICE PRESIDENT AND CHIEF FINANCIAL OFFICER AUGUST 6, 2015
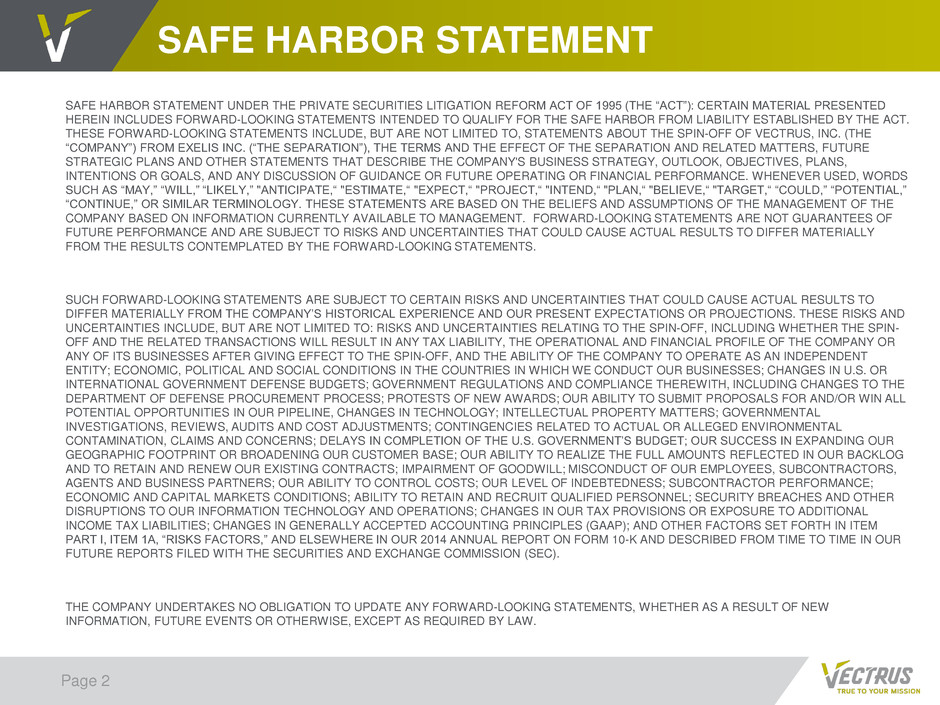
SAFE HARBOR STATEMENT Page 2 SAFE HARBOR STATEMENT UNDER THE PRIVATE SECURITIES LITIGATION REFORM ACT OF 1995 (THE “ACT”): CERTAIN MATERIAL PRESENTED HEREIN INCLUDES FORWARD-LOOKING STATEMENTS INTENDED TO QUALIFY FOR THE SAFE HARBOR FROM LIABILITY ESTABLISHED BY THE ACT. THESE FORWARD-LOOKING STATEMENTS INCLUDE, BUT ARE NOT LIMITED TO, STATEMENTS ABOUT THE SPIN-OFF OF VECTRUS, INC. (THE “COMPANY”) FROM EXELIS INC. (“THE SEPARATION”), THE TERMS AND THE EFFECT OF THE SEPARATION AND RELATED MATTERS, FUTURE STRATEGIC PLANS AND OTHER STATEMENTS THAT DESCRIBE THE COMPANY'S BUSINESS STRATEGY, OUTLOOK, OBJECTIVES, PLANS, INTENTIONS OR GOALS, AND ANY DISCUSSION OF GUIDANCE OR FUTURE OPERATING OR FINANCIAL PERFORMANCE. WHENEVER USED, WORDS SUCH AS “MAY,” “WILL,” “LIKELY,” "ANTICIPATE,“ "ESTIMATE,“ "EXPECT,“ "PROJECT,“ "INTEND,“ "PLAN,“ "BELIEVE,“ "TARGET,“ “COULD,” “POTENTIAL,” “CONTINUE,” OR SIMILAR TERMINOLOGY. THESE STATEMENTS ARE BASED ON THE BELIEFS AND ASSUMPTIONS OF THE MANAGEMENT OF THE COMPANY BASED ON INFORMATION CURRENTLY AVAILABLE TO MANAGEMENT. FORWARD-LOOKING STATEMENTS ARE NOT GUARANTEES OF FUTURE PERFORMANCE AND ARE SUBJECT TO RISKS AND UNCERTAINTIES THAT COULD CAUSE ACTUAL RESULTS TO DIFFER MATERIALLY FROM THE RESULTS CONTEMPLATED BY THE FORWARD-LOOKING STATEMENTS. SUCH FORWARD-LOOKING STATEMENTS ARE SUBJECT TO CERTAIN RISKS AND UNCERTAINTIES THAT COULD CAUSE ACTUAL RESULTS TO DIFFER MATERIALLY FROM THE COMPANY’S HISTORICAL EXPERIENCE AND OUR PRESENT EXPECTATIONS OR PROJECTIONS. THESE RISKS AND UNCERTAINTIES INCLUDE, BUT ARE NOT LIMITED TO: RISKS AND UNCERTAINTIES RELATING TO THE SPIN-OFF, INCLUDING WHETHER THE SPIN- OFF AND THE RELATED TRANSACTIONS WILL RESULT IN ANY TAX LIABILITY, THE OPERATIONAL AND FINANCIAL PROFILE OF THE COMPANY OR ANY OF ITS BUSINESSES AFTER GIVING EFFECT TO THE SPIN-OFF, AND THE ABILITY OF THE COMPANY TO OPERATE AS AN INDEPENDENT ENTITY; ECONOMIC, POLITICAL AND SOCIAL CONDITIONS IN THE COUNTRIES IN WHICH WE CONDUCT OUR BUSINESSES; CHANGES IN U.S. OR INTERNATIONAL GOVERNMENT DEFENSE BUDGETS; GOVERNMENT REGULATIONS AND COMPLIANCE THEREWITH, INCLUDING CHANGES TO THE DEPARTMENT OF DEFENSE PROCUREMENT PROCESS; PROTESTS OF NEW AWARDS; OUR ABILITY TO SUBMIT PROPOSALS FOR AND/OR WIN ALL POTENTIAL OPPORTUNITIES IN OUR PIPELINE, CHANGES IN TECHNOLOGY; INTELLECTUAL PROPERTY MATTERS; GOVERNMENTAL INVESTIGATIONS, REVIEWS, AUDITS AND COST ADJUSTMENTS; CONTINGENCIES RELATED TO ACTUAL OR ALLEGED ENVIRONMENTAL CONTAMINATION, CLAIMS AND CONCERNS; DELAYS IN COMPLETION OF THE U.S. GOVERNMENT’S BUDGET; OUR SUCCESS IN EXPANDING OUR GEOGRAPHIC FOOTPRINT OR BROADENING OUR CUSTOMER BASE; OUR ABILITY TO REALIZE THE FULL AMOUNTS REFLECTED IN OUR BACKLOG AND TO RETAIN AND RENEW OUR EXISTING CONTRACTS; IMPAIRMENT OF GOODWILL; MISCONDUCT OF OUR EMPLOYEES, SUBCONTRACTORS, AGENTS AND BUSINESS PARTNERS; OUR ABILITY TO CONTROL COSTS; OUR LEVEL OF INDEBTEDNESS; SUBCONTRACTOR PERFORMANCE; ECONOMIC AND CAPITAL MARKETS CONDITIONS; ABILITY TO RETAIN AND RECRUIT QUALIFIED PERSONNEL; SECURITY BREACHES AND OTHER DISRUPTIONS TO OUR INFORMATION TECHNOLOGY AND OPERATIONS; CHANGES IN OUR TAX PROVISIONS OR EXPOSURE TO ADDITIONAL INCOME TAX LIABILITIES; CHANGES IN GENERALLY ACCEPTED ACCOUNTING PRINCIPLES (GAAP); AND OTHER FACTORS SET FORTH IN ITEM PART I, ITEM 1A, “RISKS FACTORS,” AND ELSEWHERE IN OUR 2014 ANNUAL REPORT ON FORM 10-K AND DESCRIBED FROM TIME TO TIME IN OUR FUTURE REPORTS FILED WITH THE SECURITIES AND EXCHANGE COMMISSION (SEC). THE COMPANY UNDERTAKES NO OBLIGATION TO UPDATE ANY FORWARD-LOOKING STATEMENTS, WHETHER AS A RESULT OF NEW INFORMATION, FUTURE EVENTS OR OTHERWISE, EXCEPT AS REQUIRED BY LAW.
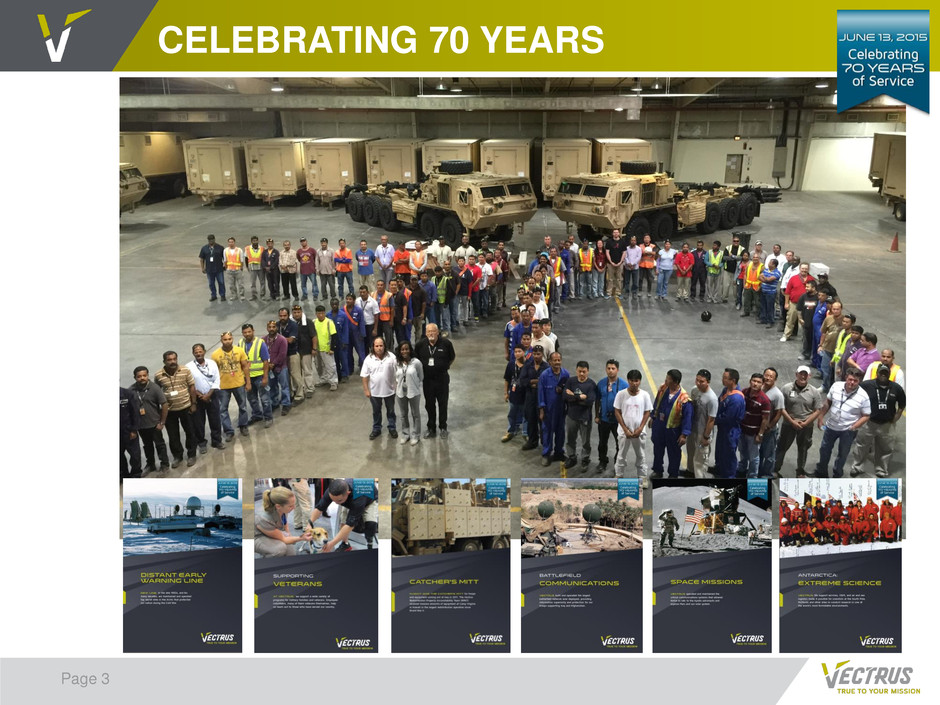
CELEBRATING 70 YEARS Page 3
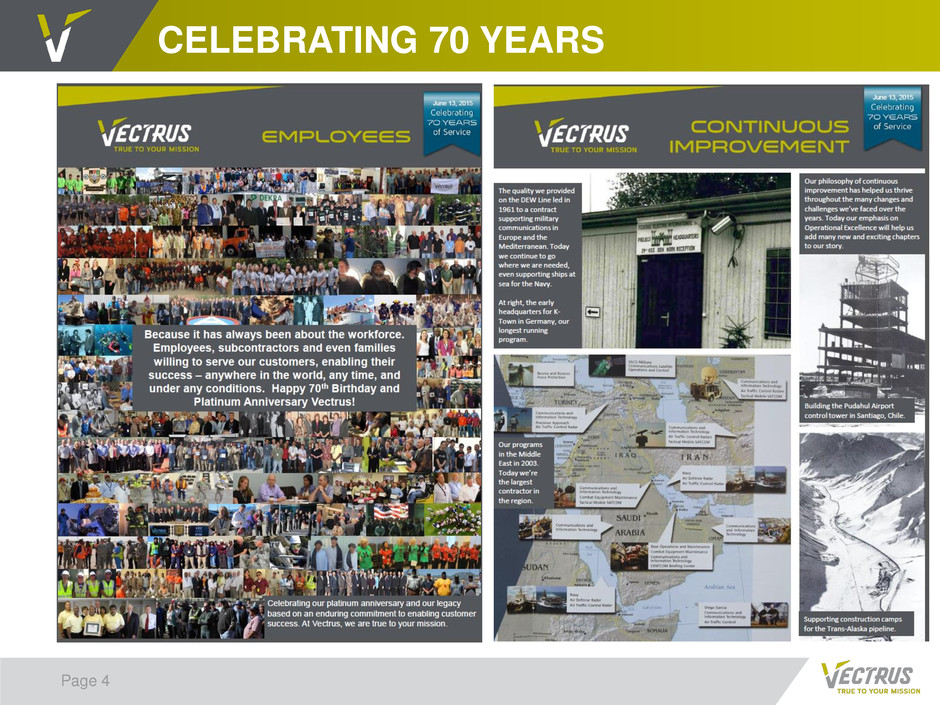
CELEBRATING 70 YEARS Page 4
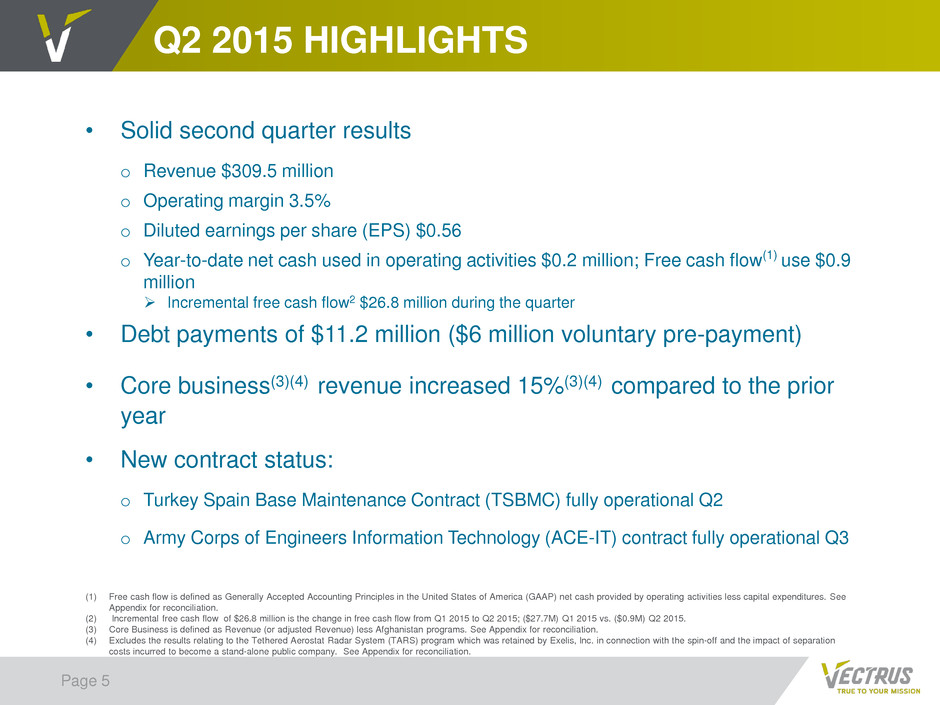
Q2 2015 HIGHLIGHTS Page 5 • Solid second quarter results o Revenue $309.5 million o Operating margin 3.5% o Diluted earnings per share (EPS) $0.56 o Year-to-date net cash used in operating activities $0.2 million; Free cash flow(1) use $0.9 million Incremental free cash flow2 $26.8 million during the quarter • Debt payments of $11.2 million ($6 million voluntary pre-payment) • Core business(3)(4) revenue increased 15%(3)(4) compared to the prior year • New contract status: o Turkey Spain Base Maintenance Contract (TSBMC) fully operational Q2 o Army Corps of Engineers Information Technology (ACE-IT) contract fully operational Q3 (1) Free cash flow is defined as Generally Accepted Accounting Principles in the United States of America (GAAP) net cash provided by operating activities less capital expenditures. See Appendix for reconciliation. (2) Incremental free cash flow of $26.8 million is the change in free cash flow from Q1 2015 to Q2 2015; ($27.7M) Q1 2015 vs. ($0.9M) Q2 2015. (3) Core Business is defined as Revenue (or adjusted Revenue) less Afghanistan programs. See Appendix for reconciliation. (4) Excludes the results relating to the Tethered Aerostat Radar System (TARS) program which was retained by Exelis, Inc. in connection with the spin-off and the impact of separation costs incurred to become a stand-alone public company. See Appendix for reconciliation.
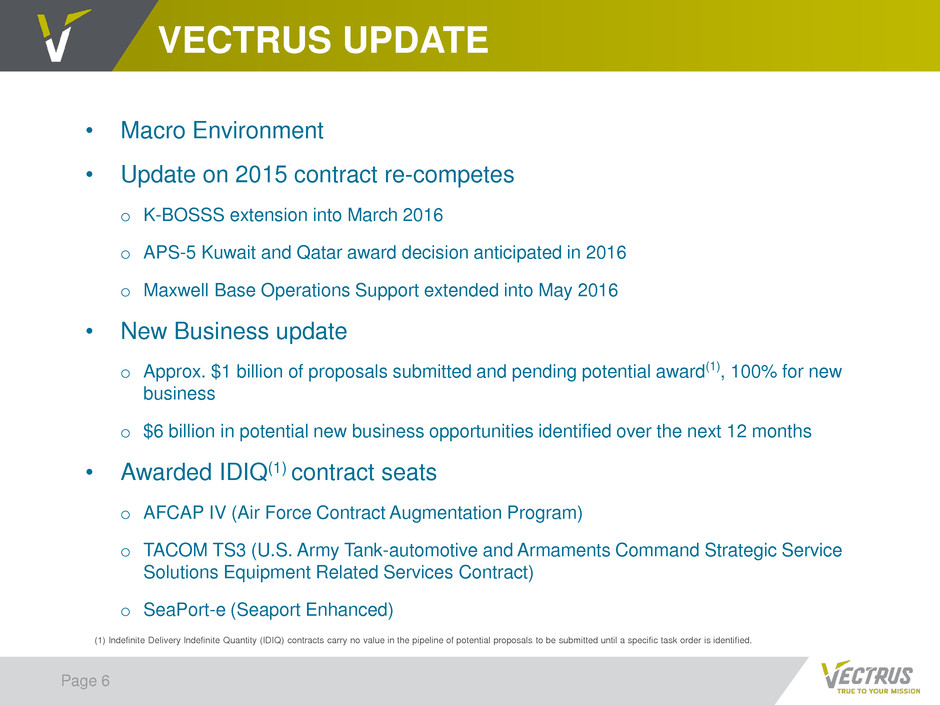
VECTRUS UPDATE Page 6 • Macro Environment • Update on 2015 contract re-competes o K-BOSSS extension into March 2016 o APS-5 Kuwait and Qatar award decision anticipated in 2016 o Maxwell Base Operations Support extended into May 2016 • New Business update o Approx. $1 billion of proposals submitted and pending potential award(1), 100% for new business o $6 billion in potential new business opportunities identified over the next 12 months • Awarded IDIQ(1) contract seats o AFCAP IV (Air Force Contract Augmentation Program) o TACOM TS3 (U.S. Army Tank-automotive and Armaments Command Strategic Service Solutions Equipment Related Services Contract) o SeaPort-e (Seaport Enhanced) (1) Indefinite Delivery Indefinite Quantity (IDIQ) contracts carry no value in the pipeline of potential proposals to be submitted until a specific task order is identified.
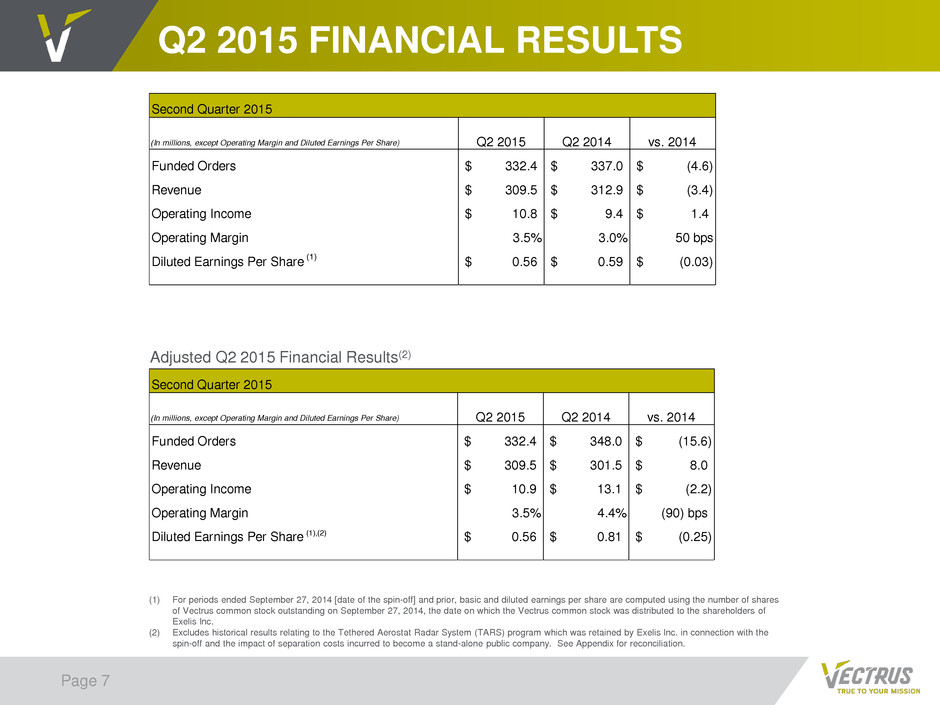
Q2 2015 FINANCIAL RESULTS Page 7 (In millions, except Operating Margin and Diluted Earnings Per Share) Q2 2015 Q2 2014 vs. 2014 Funded Orders 332.4$ 337.0$ (4.6)$ Revenue 309.5$ 312.9$ (3.4)$ Operating Income 10.8$ 9.4$ 1.4$ Operating Margin 3.5% 3.0% 50 bps Diluted Earnings Per Share (1) 0.56$ 0.59$ (0.03)$ Second Quarter 2015 (In millions, except Operating Margin and Diluted Earnings Per Share) Q2 2015 Q2 2014 vs. 2014 Funded Orders 332.4$ 348.0$ (15.6)$ Revenue 309.5$ 301.5$ 8.0$ Operating Income 10.9$ 13.1$ (2.2)$ Operating Margin 3.5% 4.4% (90) bps Diluted Earnings Per Share (1),(2) 0.56$ 0.81$ (0.25)$ Secon Quarter 2015 (1) For periods ended September 27, 2014 [date of the spin-off] and prior, basic and diluted earnings per share are computed using the number of shares of Vectrus common stock outstanding on September 27, 2014, the date on which the Vectrus common stock was distributed to the shareholders of Exelis Inc. (2) Excludes historical results relating to the Tethered Aerostat Radar System (TARS) program which was retained by Exelis Inc. in connection with the spin-off and the impact of separation costs incurred to become a stand-alone public company. See Appendix for reconciliation. Adjusted Q2 2015 Financial Results(2)
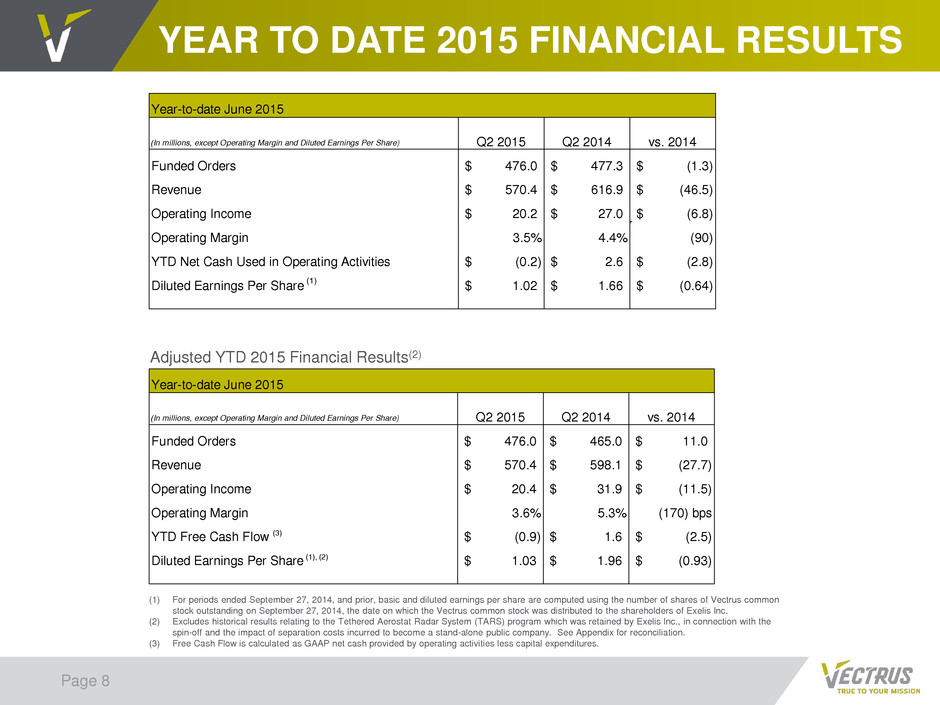
YEAR TO DATE 2015 FINANCIAL RESULTS Page 8 (In millions, except Operating Margin and Diluted Earnings Per Share) Q2 2015 Q2 2014 vs. 2014 Funded Orders 476.0$ 477.3$ (1.3)$ Revenue 570.4$ 616.9$ (46.5)$ Operating Income 20.2$ 27.0$ (6.8)$ Operating Margin 3.5% 4.4% (90) YTD Net Cash Used in Operating Activities (0.2)$ 2.6$ (2.8)$ Diluted Earnings Per Share (1) 1.02$ 1.66$ (0.64)$ Year-to-date June 2015 (In millio s, xcept Operating Margin and Diluted Earnings Per Share) Q2 2015 Q2 20 4 vs. 2014 Funded Orders 476 0 465 11 0 Revenue 570.4$ 598.1$ (27.7$ Operating Income 2 4 31 9 (11 5 Operating Mar in 3 6% 5 3% (170) bps YTD Free Cash Flow (3) (0.9)$ 1.6$ (2.5)$ Diluted Earnings Per Share (1), (2) 1.03$ 1.96$ (0.93)$ Year-to-date June 2015 (1) For periods ended September 27, 2014, and prior, basic and diluted earnings per share are computed using the number of shares of Vectrus common stock outstanding on September 27, 2014, the date on which the Vectrus common stock was distributed to the shareholders of Exelis Inc. (2) Excludes historical results relating to the Tethered Aerostat Radar System (TARS) program which was retained by Exelis Inc., in connection with the spin-off and the impact of separation costs incurred to become a stand-alone public company. See Appendix for reconciliation. (3) Free Cash Flow is calculated as GAAP net cash provided by operating activities less capital expenditures. Adjusted YTD 2015 Financial Results(2)
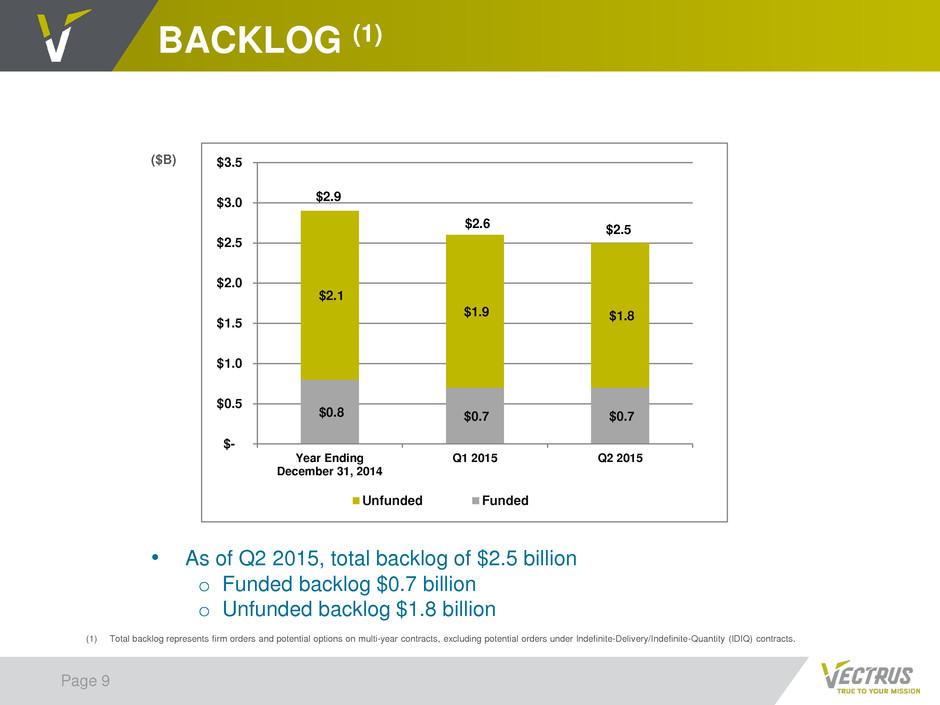
BACKLOG (1) Page 9 (2) (1) Total backlog represents firm orders and potential options on multi-year contracts, excluding potential orders under Indefinite-Delivery/Indefinite-Quantity (IDIQ) contracts. ($B) $0.8 $0.7 $0.7 $2.1 $1.9 $1.8 $- $0.5 $1.0 $1.5 $2.0 $2.5 $3.0 $3.5 Year Ending December 31, 2014 Q1 2015 Q2 2015 Unfunded Funded $2.9 $2.6 $2.5 • As of Q2 2015, total backlog of $2.5 billion o Funded backlog $0.7 billion o Unfunded backlog $1.8 billion
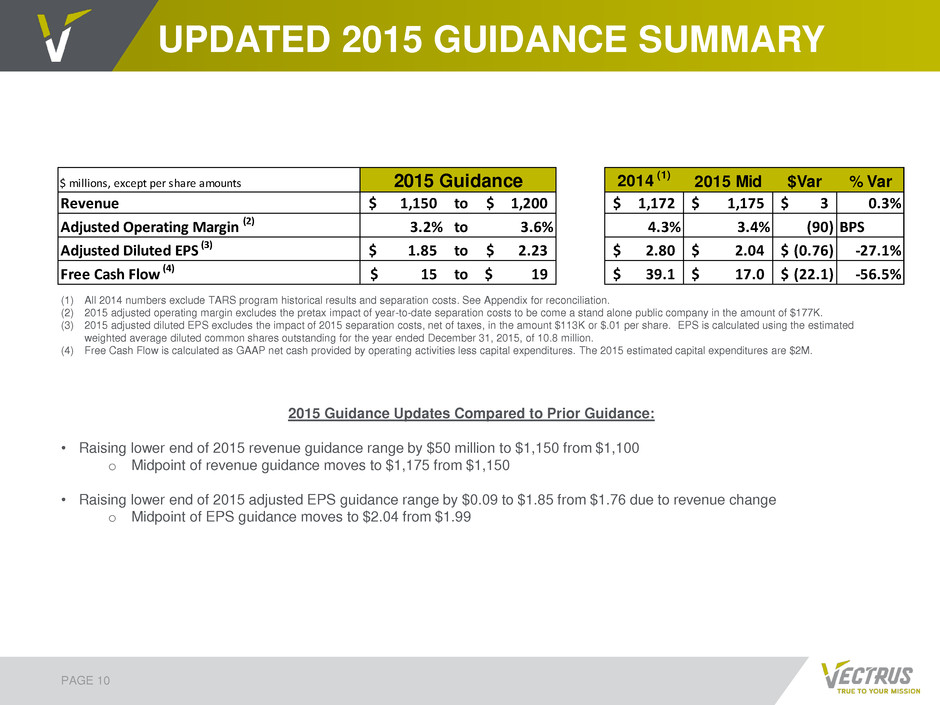
UPDATED 2015 GUIDANCE SUMMARY PAGE 10 (1) All 2014 numbers exclude TARS program historical results and separation costs. See Appendix for reconciliation. (2) 2015 adjusted operating margin excludes the pretax impact of year-to-date separation costs to be come a stand alone public company in the amount of $177K. (3) 2015 adjusted diluted EPS excludes the impact of 2015 separation costs, net of taxes, in the amount $113K or $.01 per share. EPS is calculated using the estimated weighted average diluted common shares outstanding for the year ended December 31, 2015, of 10.8 million. (4) Free Cash Flow is calculated as GAAP net cash provided by operating activities less capital expenditures. The 2015 estimated capital expenditures are $2M. 2015 Guidance Updates Compared to Prior Guidance: • Raising lower end of 2015 revenue guidance range by $50 million to $1,150 from $1,100 o Midpoint of revenue guidance moves to $1,175 from $1,150 • Raising lower end of 2015 adjusted EPS guidance range by $0.09 to $1.85 from $1.76 due to revenue change o Midpoint of EPS guidance moves to $2.04 from $1.99 $ millions, except per share amounts 2014 (1) 2015 Mid $Var % Var Revenue 1,150$ to 1,200$ 1,172$ 1,175$ 3$ 0.3% Adjusted Operating Margin (2) 3.2% to 3.6% 4.3% 3.4% (90) BPS Adjusted Diluted EPS (3) 1.85$ to 2.23$ 2.80$ 2.04$ (0.76)$ -27.1% Fre Cash Flow (4) 15$ to 19$ 39.1$ 17.0$ (22.1)$ -56.5 20 Guidance

VECTRUS SECOND QUARTER 2015 EARNINGS PRESENTATION KEN HUNZEKER CHIEF EXECUTIVE OFFICER AND PRESIDENT MATT KLEIN SENIOR VICE PRESIDENT AND CHIEF FINANCIAL OFFICER AUGUST 6, 2015
APPENDIX
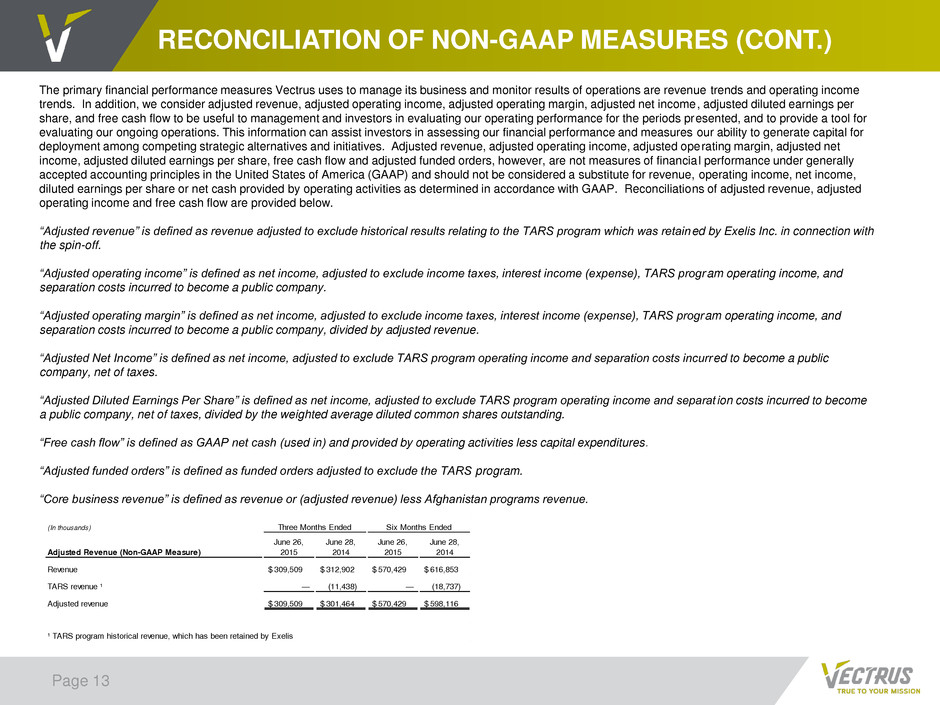
RECONCILIATION OF NON-GAAP MEASURES (CONT.) Page 13 The primary financial performance measures Vectrus uses to manage its business and monitor results of operations are revenue trends and operating income trends. In addition, we consider adjusted revenue, adjusted operating income, adjusted operating margin, adjusted net income, adjusted diluted earnings per share, and free cash flow to be useful to management and investors in evaluating our operating performance for the periods presented, and to provide a tool for evaluating our ongoing operations. This information can assist investors in assessing our financial performance and measures our ability to generate capital for deployment among competing strategic alternatives and initiatives. Adjusted revenue, adjusted operating income, adjusted operating margin, adjusted net income, adjusted diluted earnings per share, free cash flow and adjusted funded orders, however, are not measures of financial performance under generally accepted accounting principles in the United States of America (GAAP) and should not be considered a substitute for revenue, operating income, net income, diluted earnings per share or net cash provided by operating activities as determined in accordance with GAAP. Reconciliations of adjusted revenue, adjusted operating income and free cash flow are provided below. “Adjusted revenue” is defined as revenue adjusted to exclude historical results relating to the TARS program which was retained by Exelis Inc. in connection with the spin-off. “Adjusted operating income” is defined as net income, adjusted to exclude income taxes, interest income (expense), TARS program operating income, and separation costs incurred to become a public company. “Adjusted operating margin” is defined as net income, adjusted to exclude income taxes, interest income (expense), TARS program operating income, and separation costs incurred to become a public company, divided by adjusted revenue. “Adjusted Net Income” is defined as net income, adjusted to exclude TARS program operating income and separation costs incurred to become a public company, net of taxes. “Adjusted Diluted Earnings Per Share” is defined as net income, adjusted to exclude TARS program operating income and separat ion costs incurred to become a public company, net of taxes, divided by the weighted average diluted common shares outstanding. “Free cash flow” is defined as GAAP net cash (used in) and provided by operating activities less capital expenditures. “Adjusted funded orders” is defined as funded orders adjusted to exclude the TARS program. “Core business revenue” is defined as revenue or (adjusted revenue) less Afghanistan programs revenue. (In thousa ds) Adjusted Revenue (Non-GAAP Measure) June 26, 2015 June 28, 2014 June 26, 2015 June 28, 2014 Revenue 309,509$ 312,902$ 570,429$ 616,853$ TARS revenue ¹ — (11,438) — (18,737) Adjusted revenue 309,509$ 301,464$ 570,429$ 598,116$ Three Months Ended Six Months Ended ¹ TARS program historical revenue, which has been retained by Exelis
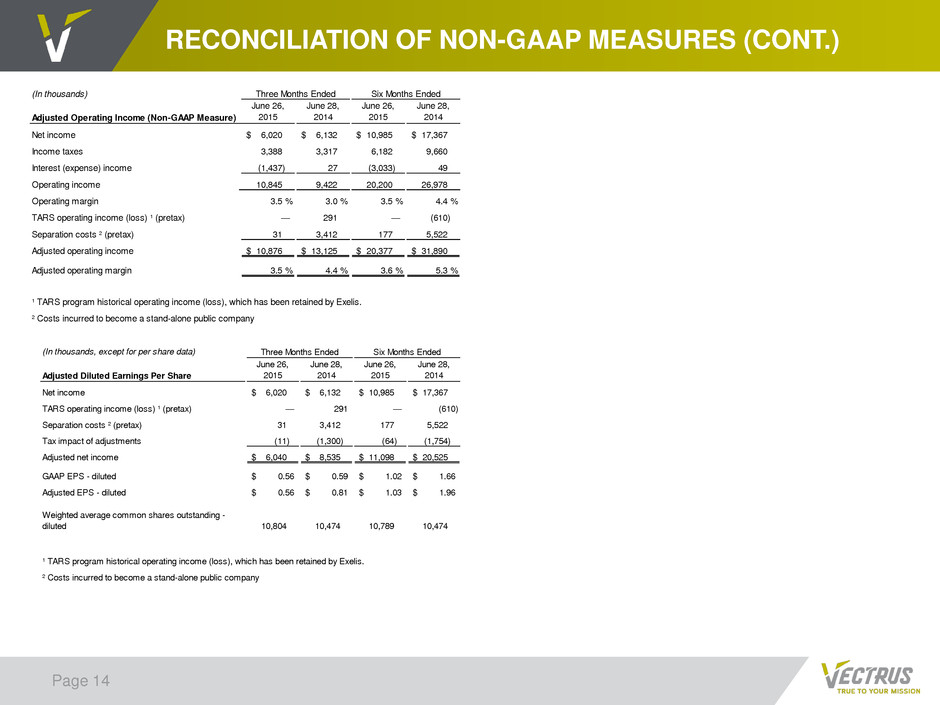
RECONCILIATION OF NON-GAAP MEASURES (CONT.) Page 14 (In thousands) Adjusted Operating Income (Non-GAAP Measure) June 26, 2015 June 28, 2014 June 26, 2015 June 28, 2014 Net income 6,020$ 6,132$ 10,985$ 17,367$ Income taxes 3,388 3,317 6,182 9,660 Interest (expense) income (1,437) 27 (3,033) 49 Operating income 10,845 9,422 20,200 26,978 Operating margin 3.5 % 3.0 % 3.5 % 4.4 % TARS operating income (loss) ¹ (pretax) — 291 — (610) Separation costs ² (pretax) 31 3,412 177 5,522 Adjusted operating income 10,876$ 13,125$ 20,377$ 31,890$ Adjusted operating margin 3.5 % 4.4 % 3.6 % 5.3 % ¹ TARS program historical operating income (loss), which has been retained by Exelis. ² Costs incurred to become a stand-alone public company Three Months Ended Six Months Ended (In thousands, except for per share data) Adjusted Diluted Earnings Per Share June 26, 2015 June 28, 2014 June 26, 2015 June 28, 2014 Net income 6,020$ 6,132$ 10,985$ 17,367$ TARS operating income (loss) ¹ (pretax) — 291 — (610) Separation costs ² (pretax) 31 3,412 177 5,522 Tax impact of adjustments (11) (1,300) (64) (1,754) Adjusted net income 6,040$ 8,535$ 11,098$ 20,525$ GAAP EPS - diluted 0.56$ 0.59$ 1.02$ 1.66$ Adjusted EPS - diluted 0.56$ 0.81$ 1.03$ 1.96$ Weighted average common shares outstanding - diluted 10,804 10,474 10,789 10,474 ² Costs incurred to become a stand-alone public company Three Months Ended Six Months Ended ¹ TARS program historical operating income (loss), which has been retained by Exelis.
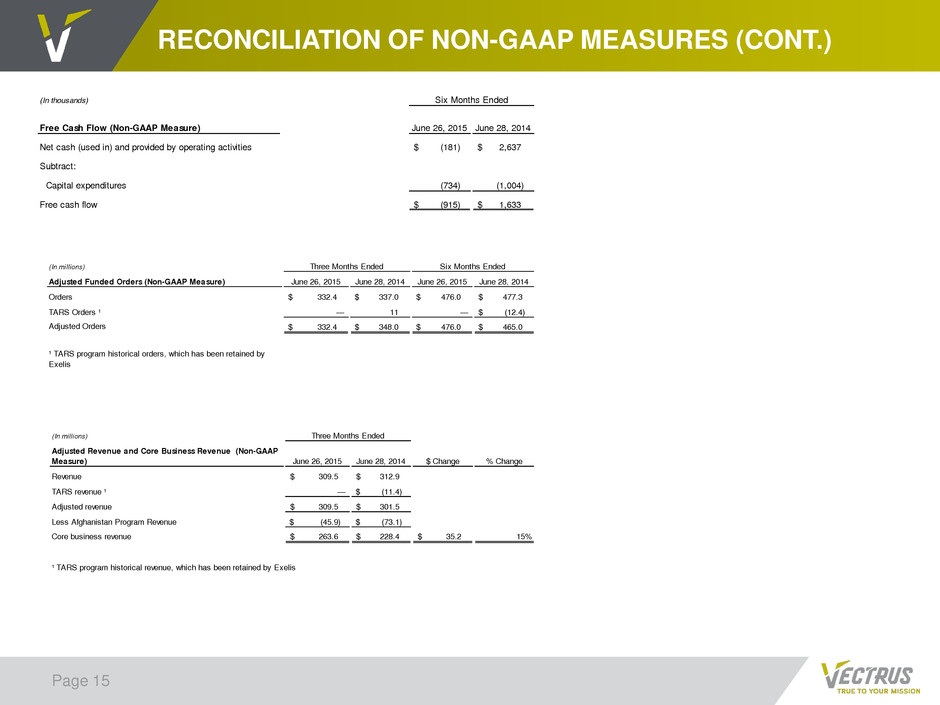
RECONCILIATION OF NON-GAAP MEASURES (CONT.) Page 15 (In thousands) Free Cash Flow (Non-GAAP Measure) June 26, 2015 June 28, 2014 Net cash (used in) and provided by operating activities (181)$ 2,637$ Subtract: Capital expenditures (734) (1,004) Free cash flow (915)$ 1,633$ Six Months Ended (In millions) Adjusted Funded Orders (Non-GAAP Measure) June 26, 2015 June 28, 2014 June 26, 2015 June 28, 2014 Orders 332.4$ 337.0$ 476.0$ 477.3$ TARS Orders ¹ — 11 — (12.4)$ Adjusted Orders 332.4$ 348.0$ 476.0$ 465.0$ ¹ TARS program historical orders, which has been retained by Exelis Three Months Ended Six Months Ended (In millions) Adjusted Revenue and Core Business Revenue (Non-GAAP Mea ure) June 26, 2015 June 28, 2014 $ Change % Change Revenue 309.5$ 312.9$ TARS revenue ¹ — (11.4)$ Adjusted revenue 309.5$ 301.5$ Less Afghanistan Program Revenue (45.9)$ (73.1)$ Core business revenue 263.6$ 228.4$ 35.2$ 15% Three Months Ended ¹ TARS program historical revenue, which has been retained by Exelis
Serious News for Serious Traders! Try StreetInsider.com Premium Free!
You May Also Be Interested In
- Trustovi Announces Availability of Its Estate Planning Platform Pairing a Technology-Supported Client Process With Attorney-Prepared Plans
- Junshi Biosciences Announces Completion of First Patient Dosing in the Phase 3 Clinical Trial of JS203 in Combination with Chemotherapy for the Treatment of Diffuse Large B-cell Lymphoma
- Best Crypto Portfolio: German Savings Banks Add Five Coins as Remittix Plans 41 More Fiat Currencies
Create E-mail Alert Related Categories
SEC FilingsSign up for StreetInsider Free!
Receive full access to all new and archived articles, unlimited portfolio tracking, e-mail alerts, custom newswires and RSS feeds - and more!
