



Form 8-K Univar Inc. For: Jul 29
 Tweet
Tweet Share
Share E-mail
UNITED STATES
SECURITIES AND EXCHANGE COMMISSION
Washington, D.C. 20549
FORM 8-K
CURRENT REPORT
PURSUANT TO SECTION 13 OR 15(d)
OF THE SECURITIES EXCHANGE ACT OF 1934
Date of Report (Date of earliest event reported): July 29, 2015
Univar Inc.
(Exact name of registrant as specified in its charter)
| Delaware | 001-37443 | 26-1251958 | ||
| (State or other jurisdiction of incorporation) |
(Commission File Number) |
(I.R.S Employer Identification No.) |
3075 Highland Parkway, Suite 200
Downers Grove, IL 60515
(Address of principal executive offices, including zip code)
Registrant’s telephone number, including area code: (331) 777-6000
Not Applicable
(Former name or former address, if changed since last report.)
Check the appropriate box below if the Form 8-K filing is intended to simultaneously satisfy the filing obligation of the registrant under any of the following provisions:
| ¨ | Written communications pursuant to Rule 425 under the Securities Act (17 CFR 230.425) |
| ¨ | Soliciting material pursuant to Rule 14a-12 under the Exchange Act (17 CFR 240.14a-12) |
| ¨ | Pre-commencement communications pursuant to Rule 14d-2(b) under the Exchange Act (17 CFR 240.14d-2(b)) |
| ¨ | Pre-commencement communications pursuant to Rule 13e-4(c) under the Exchange Act (17 CFR 240.13e-4(c)) |
| Item 2.02 | Results of Operations and Financial Condition |
On July 29, 2015, Univar Inc. (the “Company”) announced its consolidated financial results for the quarter ended June 30, 2015. A copy of the Company’s press release and related presentation are furnished herewith on Form 8-K as Exhibits 99.1 and 99.2, respectively. The information contained in Item 2.02, including Exhibit 99.1 and Exhibit 99.2, of this report on Form 8-K shall not be deemed “filed” for purposes of Section 18 of the Securities Exchange Act of 1934, as amended (the “Exchange Act”), or otherwise subject to the liability of that section, and it will not be incorporated by reference into any registration statement or other document filed by the Company under the Securities Act of 1933, as amended, or the Exchange Act except as expressly set forth by specific reference in such a filing.
| Item 9.01 | Financial Statements and Exhibits |
(d) Exhibits:
| 99.1 | Press Release dated July 29, 2015 |
| 99.2 | Univar Inc. Second Quarter 2015 Earnings Presentation dated July 29, 2015 |
SIGNATURE
Pursuant to the requirements of the Securities Exchange Act of 1934, as amended, the Company has duly caused this report to be signed on its behalf by the undersigned hereunto duly authorized.
| Date: July 29, 2015 | Univar Inc. | |||||
| By: | /s/ Stephen N. Landsman | |||||
| Name: | Stephen N. Landsman | |||||
| Title: | Executive Vice President, General Counsel and Secretary | |||||
Exhibit 99.1
| PRESS RELEASE |
|
| FOR ADDITIONAL INFORMATION: | ||
| Investor Relations | ||
| Kerri Howard | ||
| +1 844-632-1060 | ||
| Media Relations | ||
| Scott C. Johnson | ||
| +1 331-777-6187 | ||
Univar Reports
Second Quarter 2015 Financial Results
Adjusted EBITDA exceeds prior year on a currency neutral basis
Second Quarter 2015 Highlights (Versus Second Quarter 2014)
| • | Reported Adjusted EBITDA of $168.6 million declined 4.4 percent from $176.4 million, but increased 1.5 percent on a currency neutral basis, despite significantly lower chemical demand in upstream oil and gas markets in the U.S. and other regions. |
| • | Reported net loss of $12.4 million compared to $19.5 million net income in the prior year, largely due to $26 million in after-tax expenses related to the Company’s initial public offering (“IPO”) and debt refinancing. |
| • | Gross profit margin and Adjusted EBITDA margin increased during the quarter, benefiting from product mix improvements, growth in value-added services, and cost productivity gains. |
| • | Reported net sales decreased 12.3 percent from $2,861 million to $2,510 million, reflecting a 6.9-percent decrease from foreign currency translation and a 6.9-percent decline in volumes, largely attributable to lower demand from oil and gas markets. This was partially offset by a 1.5-percent increase from higher average selling price due to product mix. |
| • | Raised approximately $760 million net of fees from the IPO of 20 million primary shares of common stock at $22 per share and a concurrent $350 million private placement with a wholly owned subsidiary of Temasek Holdings (Private) Limited. Proceeds were used to immediately retire $650 million of senior unsecured notes, bearing 10.5 percent annual interest. |
| • | Completed acquisition of Key Chemical on April 10, expanding the Company’s presence in the U.S. municipal water treatment market. |
DOWNERS GROVE, Ill. – July 29, 2015 – Univar Inc. (NYSE: UNVR) (“Univar”), a global chemical distributor and provider of value-added services, announced today its financial results for the second quarter ended June 30, 2015.
“Univar delivered modest Adjusted EBITDA growth on a currency neutral basis versus the prior-year quarter, successfully offsetting strong headwinds within our upstream oil and gas markets,” said Erik Fyrwald, President and Chief Executive Officer. “This demonstrates the resilience of our diversified business model and solid execution against our strategic objectives as we position the company for profitable growth.”
“Additionally, with our successful initial public offering and the completion of our debt refinancing in July, we have significantly strengthened our balance sheet and improved future cash flow by reducing cash interest payments,” said Fyrwald.
Company Performance
The results of the Company’s operating performance are described below and compare 2015 second quarter with 2014 second quarter results, including Adjusted EBITDA, which is reconciled to reported net (loss) income in the accompanying supplemental financial information.
| (Unaudited) Three months ended June 30, |
||||||||||||||||||||
| (in millions) |
2015 | 2014 | $ change |
% change |
% change excl. currency |
|||||||||||||||
| External Net Sales |
||||||||||||||||||||
| USA |
$ | 1,389.4 | $ | 1,546.2 | $ | (156.8 | ) | (10.1 | )% | (10.1 | )% | |||||||||
| Canada |
534.6 | 587.7 | (53.1 | ) | (9.0 | )% | 2.5 | % | ||||||||||||
| EMEA |
467.4 | 596.9 | (129.5 | ) | (21.7 | )% | (4.1 | )% | ||||||||||||
| Rest of World |
118.7 | 130.6 | (11.9 | ) | (9.1 | )% | 10.4 | % | ||||||||||||
|
|
|
|
|
|
|
|||||||||||||||
| Total Consolidated Net Sales |
$ | 2,510.1 | $ | 2,861.4 | $ | (351.3 | ) | (12.3 | )% | (5.4 | )% | |||||||||
|
|
|
|
|
|
|
|
|
|
|
|||||||||||
| Gross Profit |
||||||||||||||||||||
| USA |
$ | 284.2 | $ | 298.6 | $ | (14.4 | ) | (4.8 | )% | (4.8 | )% | |||||||||
| Canada |
63.0 | 67.9 | (4.9 | ) | (7.2 | )% | 4.6 | % | ||||||||||||
| EMEA |
98.6 | 115.0 | (16.4 | ) | (14.3 | )% | 4.9 | % | ||||||||||||
| Rest of World |
21.4 | 19.0 | 2.4 | 12.6 | % | 40.5 | % | |||||||||||||
|
|
|
|
|
|
|
|||||||||||||||
| Total Consolidated Gross Profit |
$ | 467.2 | $ | 500.5 | $ | (33.3 | ) | (6.7 | )% | 0.4 | % | |||||||||
|
|
|
|
|
|
|
|
|
|
|
|||||||||||
| Adjusted EBITDA |
||||||||||||||||||||
| USA |
$ | 110.1 | $ | 120.5 | $ | (10.4 | ) | (8.6 | )% | (8.6 | )% | |||||||||
| Canada |
30.4 | 31.9 | (1.5 | ) | (4.7 | )% | 7.5 | % | ||||||||||||
| EMEA |
27.1 | 22.7 | 4.4 | 19.4 | % | 39.7 | % | |||||||||||||
| Rest of World |
6.2 | 4.7 | 1.5 | 31.9 | % | 70.2 | % | |||||||||||||
| Other* |
(5.2 | ) | (3.4 | ) | (1.8 | ) | (52.9 | )% | — | |||||||||||
|
|
|
|
|
|
|
|||||||||||||||
| Total Consolidated Adjusted EBITDA |
$ | 168.6 | $ | 176.4 | $ | (7.8 | ) | (4.4 | )% | 1.5 | % | |||||||||
|
|
|
|
|
|
|
|
|
|
|
|||||||||||
| * | Other represents unallocated corporate costs consisting of costs specifically related to parent company operations that do not directly benefit segments. |
Segment Highlights
USA – Reported external net sales decreased 10.1 percent from $1,546.2 million to $1,389.4 million, primarily driven by reduction in sales to the upstream oil and gas market, and pricing pressure on several commodity products driven by lower oil prices. Gross profit decreased $14.4 million, or 4.8 percent, to $284.2 million. Gross margin increased 115 basis points to 20.5 percent due to pricing and product mix improvements, including substantial year-over-year growth in higher-margin pharmaceutical and food ingredients markets, and service businesses outside oil and gas. Adjusted EBITDA decreased 8.6 percent from $120.5 million to $110.1 million. Adjusted EBITDA margin increased 15 basis points to 7.9 percent primarily due to improved gross margin.
Canada – Reported external net sales decreased 9.0 percent from $587.7 million to $534.6 million. On a currency neutral basis, sales increased 2.5 percent on growth within the mining, food ingredients, and chemical manufacturing markets. This was partially offset by lower sales in the upstream oil and gas markets. Gross profit decreased 7.2 percent from $67.9 million to $63.0 million. Gross margin increased 25 basis points to 11.8 percent due to higher average selling prices in certain markets and favorable product mix. Reported Adjusted EBITDA decreased 4.7 percent from $31.9 million to $30.4 million. On a currency neutral basis, Adjusted EBITDA increased 7.5 percent. Adjusted EBITDA margin increased 25 basis points to 5.7 percent, primarily due to improved gross margin.
EMEA – Reported external net sales decreased 21.7 percent from $596.9 million to $467.4 million. On a currency neutral basis, sales decreased 4.1 percent. The decrease was primarily related to exiting certain low-margin contracts, as well as declines in caustic soda sales driven by a tight supply market. Gross profit decreased by 14.3 percent from $115.0 million to $98.6 million. Gross margin increased 185 basis points to 21.1 percent due to pricing and product mix improvements. Reported Adjusted EBITDA increased 19.4 percent from $22.7 million to $27.1 million. On a currency neutral basis, Adjusted EBITDA increased by 39.7 percent. Adjusted EBITDA margin increased 200 basis points to 5.8 percent, primarily due to improved gross margin.
Rest of World – Reported external net sales decreased 9.1 percent from $130.6 million to $118.7 million. On a currency neutral basis, sales increased 10.4 percent. Gross profit increased 12.6 percent from $19.0 million to $21.4 million. Gross margin increased 350 basis points to 18.0 percent. Reported Adjusted EBITDA increased 31.9 percent, from $4.7 million to $6.2 million. Adjusted EBITDA margin increased by 160 basis points to 5.2 percent. Increases in sales, gross profit, gross margin, and Adjusted EBITDA were primarily driven by the favorable year-over-year impact of the November 2014 D’Altomare acquisition.
Recent Events
| • | In July, Univar completed a refinancing of its debt structure. The Company repaid its existing loans with $2.05 billion of USD Term Loan B; €250 million of euro denominated First Lien Term Loan, and $400 million aggregate principal amount of 6.75% Senior Notes due July 15, 2023. The Company also completed a new five-year $1.4 billion senior secured Asset Based Lending (“ABL”) credit facility. As a result, combined with the repayment of debt from IPO and private placement funds, the Company extended its debt maturities five years to 2022-2023 and has substantially lowered its expected future cash interest payments. |
| • | On July 16, Univar completed the acquisition of the assets of Chemical Associates, Inc., which helps increase the value Univar brings several key markets, such as personal care, food, cleaning and sanitization, lubricants, and coatings and adhesives. Chemical Associates specializes in blending, mixing, and packaging of formulated oleochemical products, many of which are based on renewable resources. |
Outlook
The Company expects third quarter 2015 results to reflect continued gains from margin improvement, especially in EMEA, lower demand from oil and gas markets, and unfavorable foreign currency translation impacts compared to the prior year. On a currency neutral basis, the Company expects third quarter 2015 Adjusted EBITDA to be modestly below the $170.6 million reported for the third quarter of 2014.
“While we are excited about Univar’s prospects as a global market leader, we continue to strive to offset near-term and steep upstream oil and gas market and foreign exchange headwinds, and are focused on controlling costs and pursuing attractive growth, including through bolt-on acquisitions,” said Fyrwald.
Univar to Host Webcast Today at 8 a.m. EDT
The Company will host a webcast with investors to discuss the second quarter results at 8 a.m. EDT on July 29, which can be accessed on the Investor Relations section of its website at http://investor.univar.com. Following the event, an archived version of the webcast and supporting materials will be available on the same website.
Adjusted EBITDA
The Company monitors the results of its operating segments separately for the purposes of making decisions about resource allocation and performance assessment. The Company evaluates performance on the basis of Adjusted EBITDA, which it defines as its consolidated net income (loss), plus the sum of interest expense, net of interest income, income tax expense (benefit), depreciation, amortization, other operating expenses, net (which primarily consists of pension mark to market adjustments, acquisition and integration related expenses, employee stock-based compensation expense, redundancy and restructuring costs, advisory fees paid to stockholders, and other unusual or non-recurring expenses), impairment charges, loss on extinguishment of debt and other expense, net (which consists of gains and losses on foreign currency transactions and undesignated derivative instruments, ineffective portion of cash flow hedges, debt refinancing costs, and other non-operating activity). The Company believes that Adjusted EBITDA is an important indicator of operating performance because:
| • | the Company reports Adjusted EBITDA to its lenders as required under the covenants of its credit agreements; |
| • | Adjusted EBITDA excludes the effects of income taxes, as well as the effects of financing and investing activities by eliminating the effects of interest, depreciation and amortization expenses; |
| • | the Company uses Adjusted EBITDA in setting performance incentive targets; |
| • | the Company considers gains (losses) on the acquisition, disposal and impairment of assets as resulting from investing decisions rather than ongoing operations; and |
| • | other significant items, while periodically affecting the Company’s results, may vary significantly from period to period and have a disproportionate effect in a given period, which affects comparability of its results. |
Use of Non-GAAP Measures
The Company’s management believes that certain financial measures that do not comply with accounting principles generally accepted in the United States (“GAAP”) provide relevant and meaningful information concerning the ongoing operating results of the Company. Such non-GAAP financial measures are used from time to time herein but should not be viewed as a substitute for GAAP measures of performance. Reconciliations of non-GAAP measures to GAAP are provided in Schedules A, B, and C.
About Univar
Founded in 1924, Univar is a global distributor of specialty and basic chemicals from more than 8,000 producers worldwide. Univar operates more than 800 distribution facilities throughout North America, Western Europe, the Asia-Pacific region, and Latin America, supported by a global network of sales and technical professionals. With a broad portfolio of products and value-added services, and deep technical and market expertise, Univar delivers the tailored solutions customers need through one of the most extensive chemical distribution networks in the world. Univar is Chemistry DeliveredSM.
Forward-Looking Statements
This press release includes “forward-looking statements” within the meaning of Section 27A of the Securities Act and Section 21E of the Securities Exchange Act of 1934, as amended. Forward-looking statements are subject to known and unknown risks and uncertainties, many of which may be beyond our control. We caution you that the forward-looking information presented in this press release is not a guarantee of future events, and that actual events may differ materially from those made in or suggested by the forward-looking information contained in this press release. In addition, forward-looking statements generally can be identified by the use of forward-looking terminology such as “may,” “plan,” “seek,” “comfortable with,” “will,” “expect,” “intend,” “estimate,” “anticipate,” “believe” or “continue” or the negative thereof or variations thereon or similar terminology. Any forward-looking information presented herein is made only as of the date of this press release, and we do not undertake any obligation to update or revise any forward-looking information to reflect changes in assumptions, the occurrence of unanticipated events, or otherwise.
###
Univar Inc.
Condensed Consolidated Statements of Operations
(Unaudited)
| Three months ended June 30, | Six months ended June 30, | |||||||||||||||
| (in millions, except share and per share data) |
2015 | 2014 | 2015 | 2014 | ||||||||||||
| Net sales |
$ | 2,510.1 | $ | 2,861.4 | $ | 4,809.2 | $ | 5,377.8 | ||||||||
| Cost of goods sold (exclusive of depreciation) |
2,042.9 | 2,360.9 | 3,880.4 | 4,404.9 | ||||||||||||
|
|
|
|
|
|
|
|
|
|||||||||
| Gross profit |
467.2 | 500.5 | 928.8 | 972.9 | ||||||||||||
| Operating expenses: |
||||||||||||||||
| Outbound freight and handling |
81.5 | 93.6 | 166.0 | 181.4 | ||||||||||||
| Warehousing, selling and administrative |
217.1 | 230.5 | 448.5 | 469.5 | ||||||||||||
| Other operating expenses, net |
39.0 | 25.6 | 47.1 | 47.3 | ||||||||||||
| Depreciation |
37.7 | 30.6 | 69.7 | 61.2 | ||||||||||||
| Amortization |
22.4 | 24.1 | 44.3 | 47.8 | ||||||||||||
|
|
|
|
|
|
|
|
|
|||||||||
| Total operating expenses |
397.7 | 404.4 | 775.6 | 807.2 | ||||||||||||
|
|
|
|
|
|
|
|
|
|||||||||
| Operating income |
69.5 | 96.1 | 153.2 | 165.7 | ||||||||||||
|
|
|
|
|
|
|
|
|
|||||||||
| Other (expense) income: |
||||||||||||||||
| Interest income |
1.5 | 2.5 | 2.7 | 4.9 | ||||||||||||
| Interest expense |
(64.6 | ) | (67.3 | ) | (129.0 | ) | (133.6 | ) | ||||||||
| Loss on extinguishment of debt |
(7.3 | ) | — | (7.3 | ) | (1.2 | ) | |||||||||
| Other expense, net |
(12.1 | ) | (2.0 | ) | (5.3 | ) | (3.9 | ) | ||||||||
|
|
|
|
|
|
|
|
|
|||||||||
| Total other expense |
(82.5 | ) | (66.8 | ) | (138.9 | ) | (133.8 | ) | ||||||||
|
|
|
|
|
|
|
|
|
|||||||||
| (Loss) income before income taxes |
(13.0 | ) | 29.3 | 14.3 | 31.9 | |||||||||||
| Income tax (benefit) expense |
(0.6 | ) | 9.8 | 7.0 | 15.2 | |||||||||||
|
|
|
|
|
|
|
|
|
|||||||||
| Net (loss) income |
$ | (12.4 | ) | $ | 19.5 | $ | 7.3 | $ | 16.7 | |||||||
|
|
|
|
|
|
|
|
|
|||||||||
| (Loss) income per common share: |
||||||||||||||||
| Basic |
$ | (0.12 | ) | $ | 0.20 | $ | 0.07 | $ | 0.16 | |||||||
| Diluted |
(0.12 | ) | 0.20 | 0.07 | 0.16 | |||||||||||
| Weighted average common shares outstanding: |
||||||||||||||||
| Basic |
102,846,681 | 99,713,076 | 101,377,921 | 99,679,015 | ||||||||||||
| Diluted |
102,846,681 | 100,362,747 | 101,956,005 | 100,045,395 | ||||||||||||
Univar Inc.
Condensed Consolidated Balance Sheets
(Unaudited)
| (in millions, except share and per share data) |
June 30, 2015 |
December 31, 2014 |
||||||
| Assets |
||||||||
| Current assets: |
||||||||
| Cash and cash equivalents |
$ | 197.0 | $ | 206.0 | ||||
| Trade accounts receivable, net |
1,407.6 | 1,277.5 | ||||||
| Inventories |
902.8 | 942.7 | ||||||
| Prepaid expenses and other current assets |
154.1 | 158.5 | ||||||
| Deferred tax assets |
52.4 | 37.1 | ||||||
|
|
|
|
|
|||||
| Total current assets |
2,713.9 | 2,621.8 | ||||||
|
|
|
|
|
|||||
| Property, plant and equipment, net |
1,032.4 | 1,032.3 | ||||||
| Goodwill |
1,737.1 | 1,767.6 | ||||||
| Intangible assets, net |
526.6 | 574.9 | ||||||
| Deferred tax assets |
10.0 | 15.5 | ||||||
| Other assets |
61.7 | 64.5 | ||||||
|
|
|
|
|
|||||
| Total assets |
$ | 6,081.7 | $ | 6,076.6 | ||||
|
|
|
|
|
|||||
| Liabilities and stockholders’ equity |
||||||||
| Current liabilities: |
||||||||
| Short-term financing |
$ | 38.6 | $ | 61.1 | ||||
| Trade accounts payable |
1,185.0 | 991.9 | ||||||
| Current portion of long-term debt |
69.4 | 80.7 | ||||||
| Accrued compensation |
65.4 | 73.7 | ||||||
| Other accrued expenses |
253.1 | 308.1 | ||||||
| Deferred tax liabilities |
0.6 | 3.4 | ||||||
|
|
|
|
|
|||||
| Total current liabilities |
1,612.1 | 1,518.9 | ||||||
|
|
|
|
|
|||||
| Long-term debt |
3,006.2 | 3,739.5 | ||||||
| Pension and other postretirement benefit liabilities |
273.9 | 304.5 | ||||||
| Deferred tax liabilities |
128.9 | 119.7 | ||||||
| Other long-term liabilities |
136.9 | 145.9 | ||||||
| Commitment and contingencies |
— | — | ||||||
| Stockholders’ equity: |
||||||||
| Preferred stock, 200,000,000 shares authorized at $0.01 par value with no shares outstanding as of June 30, 2015 and December 31, 2014 |
— | — | ||||||
| Common stock, 2,000,000,000 shares authorized at $0.01 par value with 137,947,059 shares issued and outstanding at June 30, 2015; 370,181,733 shares authorized at $0.000000028 par value with 100,190,194 shares issued and outstanding at December 31, 2014 |
1.4 | — | ||||||
| Additional paid-in capital |
2,221.0 | 1,457.6 | ||||||
| Accumulated deficit |
(994.2 | ) | (1,001.3 | ) | ||||
| Accumulated other comprehensive loss |
(304.5 | ) | (208.2 | ) | ||||
|
|
|
|
|
|||||
| Total stockholders’ equity |
923.7 | 248.1 | ||||||
|
|
|
|
|
|||||
| Total liabilities and stockholders’ equity |
$ | 6,081.7 | $ | 6,076.6 | ||||
|
|
|
|
|
|||||
Univar Inc.
Condensed Consolidated Statements of Cash Flows
(Unaudited)
| Three months ended June 30, |
Six months ended June 30, |
|||||||||||||||
| (in millions) |
2015 | 2014 | 2015 | 2014 | ||||||||||||
| Operating activities: |
||||||||||||||||
| Net (loss) income |
$ | (12.4 | ) | $ | 19.5 | $ | 7.3 | $ | 16.7 | |||||||
| Adjustments to reconcile net (loss) income to net cash provided by (used by) operating activities: |
||||||||||||||||
| Depreciation and amortization |
60.1 | 54.7 | 114.0 | 109.0 | ||||||||||||
| Amortization of deferred financing fees and debt discount |
3.8 | 4.2 | 8.0 | 8.2 | ||||||||||||
| Amortization of pension credit from accumulated other comprehensive loss |
(3.0 | ) | (3.0 | ) | (6.0 | ) | (6.0 | ) | ||||||||
| Loss on extinguishment of debt |
7.3 | — | 7.3 | 1.2 | ||||||||||||
| Deferred income taxes |
(5.6 | ) | 5.5 | (1.8 | ) | 6.2 | ||||||||||
| Stock-based compensation expense |
1.9 | 4.0 | 3.4 | 7.6 | ||||||||||||
| Other |
0.2 | 0.5 | (0.6 | ) | 0.4 | |||||||||||
| Changes in operating assets and liabilities: |
||||||||||||||||
| Trade accounts receivable, net |
(149.3 | ) | (218.2 | ) | (172.2 | ) | (374.8 | ) | ||||||||
| Inventories |
53.0 | 37.9 | 8.3 | (94.5 | ) | |||||||||||
| Prepaid expenses and other current assets |
13.3 | (5.4 | ) | (2.0 | ) | (7.5 | ) | |||||||||
| Trade accounts payable |
128.0 | 133.3 | 227.8 | 311.2 | ||||||||||||
| Pensions and other postretirement benefit liabilities |
(14.6 | ) | (15.0 | ) | (31.0 | ) | (23.7 | ) | ||||||||
| Other, net |
(62.2 | ) | (45.6 | ) | (53.9 | ) | (29.9 | ) | ||||||||
|
|
|
|
|
|
|
|
|
|||||||||
| Net cash provided by (used by) operating activities |
20.5 | (27.6 | ) | 108.6 | (75.9 | ) | ||||||||||
|
|
|
|
|
|
|
|
|
|||||||||
| Investing activities: |
||||||||||||||||
| Purchases of property, plant and equipment |
(30.5 | ) | (23.5 | ) | (62.4 | ) | (48.4 | ) | ||||||||
| Purchase of a business, net of cash acquired |
(18.6 | ) | — | (18.6 | ) | — | ||||||||||
| Proceeds from sale of property, plant and equipment |
3.3 | 0.5 | 5.0 | 1.7 | ||||||||||||
| Other |
(5.5 | ) | (1.0 | ) | (5.5 | ) | (1.0 | ) | ||||||||
|
|
|
|
|
|
|
|
|
|||||||||
| Net cash used by investing activities |
(51.3 | ) | (24.0 | ) | (81.5 | ) | (47.7 | ) | ||||||||
|
|
|
|
|
|
|
|
|
|||||||||
| Financing activities: |
||||||||||||||||
| Proceeds from sale of common stock |
763.8 | 1.1 | 765.8 | 3.0 | ||||||||||||
| Proceeds from the issuance of long-term debt |
— | 60.9 | — | 163.3 | ||||||||||||
| Payments on long-term debt and capital lease obligations |
(709.4 | ) | (20.3 | ) | (763.1 | ) | (39.8 | ) | ||||||||
| Short-term financing, net |
(14.6 | ) | 2.3 | (11.2 | ) | (11.9 | ) | |||||||||
| Financing fees paid |
— | (1.0 | ) | — | (5.0 | ) | ||||||||||
| Other |
(1.8 | ) | (0.4 | ) | (1.9 | ) | (3.6 | ) | ||||||||
|
|
|
|
|
|
|
|
|
|||||||||
| Net cash (used by) provided by financing activities |
38.0 | 42.6 | (10.4 | ) | 106.0 | |||||||||||
|
|
|
|
|
|
|
|
|
|||||||||
| Effect of exchange rate changes on cash and cash equivalents |
8.4 | 8.1 | (25.7 | ) | 0.4 | |||||||||||
|
|
|
|
|
|
|
|
|
|||||||||
| Net decrease in cash and cash equivalents |
15.6 | (0.9 | ) | (9.0 | ) | (17.2 | ) | |||||||||
| Cash and cash equivalents at beginning of period |
181.4 | 164.1 | 206.0 | 180.4 | ||||||||||||
|
|
|
|
|
|
|
|
|
|||||||||
| Cash and cash equivalents at end of period |
$ | 197.0 | $ | 163.2 | $ | 197.0 | $ | 163.2 | ||||||||
|
|
|
|
|
|
|
|
|
|||||||||
Schedule A
Univar Inc.
Reconciliation of Adjusted EBITDA to Reported Net Income
(Unaudited)
| (in millions) |
USA | Canada | EMEA | Rest of World |
Other/ Elimin- ations(1) |
Consolidated | ||||||||||||||||||
| Three Months Ended June 30, 2015 | ||||||||||||||||||||||||
| Net sales: |
||||||||||||||||||||||||
| External customers |
$ | 1,389.4 | $ | 534.6 | $ | 467.4 | $ | 118.7 | $ | — | $ | 2,510.1 | ||||||||||||
| Inter-segment |
22.0 | 2.2 | 1.1 | — | (25.3 | ) | — | |||||||||||||||||
|
|
|
|
|
|
|
|
|
|
|
|
|
|||||||||||||
| Total net sales |
1,411.4 | 536.8 | 468.5 | 118.7 | (25.3 | ) | 2,510.1 | |||||||||||||||||
| Cost of goods sold (exclusive of depreciation) |
1,127.2 | 473.8 | 369.9 | 97.3 | (25.3 | ) | 2,042.9 | |||||||||||||||||
|
|
|
|
|
|
|
|
|
|
|
|
|
|||||||||||||
| Gross profit |
284.2 | 63.0 | 98.6 | 21.4 | — | 467.2 | ||||||||||||||||||
| Outbound freight and handling |
53.5 | 10.9 | 14.9 | 2.2 | — | 81.5 | ||||||||||||||||||
| Warehousing, selling and administrative (operating expenses) |
120.6 | 21.7 | 56.6 | 13.0 | 5.2 | 217.1 | ||||||||||||||||||
|
|
|
|
|
|
|
|
|
|
|
|
|
|||||||||||||
| Adjusted EBITDA |
$ | 110.1 | $ | 30.4 | $ | 27.1 | $ | 6.2 | $ | (5.2 | ) | $ | 168.6 | |||||||||||
|
|
|
|
|
|
|
|
|
|
|
|
|
|||||||||||||
| Other operating expenses, net(2) |
39.0 | |||||||||||||||||||||||
| Depreciation |
37.7 | |||||||||||||||||||||||
| Amortization |
22.4 | |||||||||||||||||||||||
| Interest expense, net |
63.1 | |||||||||||||||||||||||
| Loss on extinguishment of debt |
7.3 | |||||||||||||||||||||||
| Other expense, net(3) |
12.1 | |||||||||||||||||||||||
| Income tax benefit |
(0.6 | ) | ||||||||||||||||||||||
|
|
|
|||||||||||||||||||||||
| Net loss |
$ | (12.4 | ) | |||||||||||||||||||||
|
|
|
|||||||||||||||||||||||
| (in millions) |
USA | Canada | EMEA | Rest of World |
Other/ Elimin- ations(1) |
Consolidated | ||||||||||||||||||
| Three Months Ended June 30, 2014 | ||||||||||||||||||||||||
| Net sales: |
||||||||||||||||||||||||
| External customers |
$ | 1,546.2 | $ | 587.7 | $ | 596.9 | $ | 130.6 | $ | — | $ | 2,861.4 | ||||||||||||
| Inter-segment |
28.2 | 2.1 | 1.1 | — | (31.4 | ) | — | |||||||||||||||||
|
|
|
|
|
|
|
|
|
|
|
|
|
|||||||||||||
| Total net sales |
1,574.4 | 589.8 | 598.0 | 130.6 | (31.4 | ) | 2,861.4 | |||||||||||||||||
| Cost of goods sold (exclusive of depreciation) |
1,275.8 | 521.9 | 483.0 | 111.6 | (31.4 | ) | 2,360.9 | |||||||||||||||||
|
|
|
|
|
|
|
|
|
|
|
|
|
|||||||||||||
| Gross profit |
298.6 | 67.9 | 115.0 | 19.0 | — | 500.5 | ||||||||||||||||||
| Outbound freight and handling |
58.1 | 12.2 | 20.2 | 3.1 | — | 93.6 | ||||||||||||||||||
| Warehousing, selling and administrative (operating expenses) |
120.0 | 23.8 | 72.1 | 11.2 | 3.4 | 230.5 | ||||||||||||||||||
|
|
|
|
|
|
|
|
|
|
|
|
|
|||||||||||||
| Adjusted EBITDA |
$ | 120.5 | $ | 31.9 | $ | 22.7 | $ | 4.7 | $ | (3.4 | ) | $ | 176.4 | |||||||||||
|
|
|
|
|
|
|
|
|
|
|
|
|
|||||||||||||
| Other operating expenses, net(2) |
25.6 | |||||||||||||||||||||||
| Depreciation |
30.6 | |||||||||||||||||||||||
| Amortization |
24.1 | |||||||||||||||||||||||
| Interest expense, net |
64.8 | |||||||||||||||||||||||
| Other expense, net(3) |
2.0 | |||||||||||||||||||||||
| Income tax expense |
9.8 | |||||||||||||||||||||||
|
|
|
|||||||||||||||||||||||
| Net income |
$ | 19.5 | ||||||||||||||||||||||
|
|
|
|||||||||||||||||||||||
| (1) | Other/Eliminations represents the elimination of intersegment transactions as well as unallocated corporate costs consisting of costs specifically related to parent company operations that do not directly benefit segments. |
| (2) | See Schedule B for items included in other operating expenses, net. |
| (3) | See Schedule C for items included in other expense, net. |
Schedule B
Univar Inc.
Other Operating Expenses, Net
(Unaudited)
| Three months ended June 30, |
||||||||
| (in millions) |
2015 | 2014 | ||||||
| Acquisition and integration related expenses |
$ | 1.0 | $ | — | ||||
| Stock-based compensation expense |
1.9 | 4.0 | ||||||
| Redundancy and restructuring |
12.5 | 16.1 | ||||||
| Advisory fees paid to CVC and CD&R(1) |
1.3 | 1.6 | ||||||
| Other(2) |
22.3 | 3.9 | ||||||
|
|
|
|
|
|||||
| Total other operating expenses, net |
$ | 39.0 | $ | 25.6 | ||||
|
|
|
|
|
|||||
| (1) | Significant stockholders CVC Capital Partners (“CVC”) and Clayton, Dubilier & Rice, LLC (“CD&R”). |
| (2) | In the three months ended June 30, 2015, other is inclusive of a contract termination fee of $26.2 million related to terminating consulting agreements between the Company and CVC and CD&R related to the IPO. |
Schedule C
Univar Inc.
Other Expense, Net
(Unaudited)
| Three months ended June 30, |
||||||||
| (in millions) |
2015 | 2014 | ||||||
| Foreign currency transactions |
$ | (2.4 | ) | $ | 1.3 | |||
| Undesignated foreign currency derivative instruments |
(1.6 | ) | (1.7 | ) | ||||
| Ineffective portion of cash flow hedges |
0.2 | (0.3 | ) | |||||
| Loss due to discontinuance of cash flow hedges |
(7.5 | ) | — | |||||
| Other |
(0.8 | ) | (1.3 | ) | ||||
|
|
|
|
|
|||||
| Total other expense, net |
$ | (12.1 | ) | $ | (2.0 | ) | ||
|
|
|
|
|
|||||
Schedule D
Univar Inc.
Condensed Consolidated Statements of Comprehensive Income (Loss)
(Unaudited)
| Three months ended June 30, | Six months ended June 30, | |||||||||||||||
| (in millions) |
2015 | 2014 | 2015 | 2014 | ||||||||||||
| Net (loss) income |
$ | (12.4 | ) | $ | 19.5 | $ | 7.3 | $ | 16.7 | |||||||
| Other comprehensive income (loss), net of tax: |
||||||||||||||||
| Foreign currency translation |
21.7 | 41.7 | (96.3 | ) | 2.2 | |||||||||||
| Pension and other postretirement benefit adjustment |
(1.9 | ) | (1.9 | ) | (3.7 | ) | (3.7 | ) | ||||||||
| Derivative financial instruments |
5.0 | (2.4 | ) | 3.7 | (2.3 | ) | ||||||||||
|
|
|
|
|
|
|
|
|
|||||||||
| Total other comprehensive income (loss), net of tax |
24.8 | 37.4 | (96.3 | ) | (3.8 | ) | ||||||||||
|
|
|
|
|
|
|
|
|
|||||||||
| Comprehensive income (loss) |
$ | 12.4 | $ | 56.9 | $ | (89.0 | ) | $ | 12.9 | |||||||
|
|
|
|
|
|
|
|
|
|||||||||
 Second
Quarter Fiscal 2015 Earnings Conference Call
July 29, 2015 Exhibit 99.2 |
| Forward-Looking
Statements This presentation includes “forward-looking
statements,” including with respect to the initial public offering,
within the meaning of Section 27A of the Securities Act and Section 21E of the Securities Exchange Act of 1934, as amended. Forward-looking statements are subject to known and unknown
risks and uncertainties, many of which may be beyond our control. We caution you that
the forward- looking information presented in this presentation is not
a guarantee of future events, and that actual events may differ
materially from those made in or suggested by the forward-looking information contained in this presentation. You should review Univar’s filings with the Securities and Exchange
Commission for more information regarding the factors that could cause actual results
to differ materially from these projections or expectations. In addition,
forward-looking statements generally can be identified by the use of
forward-looking terminology such as “may,” “plan,” “seek,” “comfortable with,” “will,” “expect,” “intend,” “estimate,” “anticipate,” “believe” or
“continue” or the negative thereof or variations thereon or
similar terminology. Any forward-looking information presented herein is made only as of the date of this presentation, and we do not undertake any obligation to update or revise any
forward-looking information to reflect changes in assumptions, the occurrence of
unanticipated events, or otherwise.
Regulation G: Non GAAP Measures
The information presented herein regarding certain unaudited non GAAP measures does not
conform to generally accepted accounting principles in the United States
(U.S. GAAP) and should not be construed as an alternative to the reported
results determined in accordance with U.S. GAAP. Univar has included this
non-GAAP information to assist in understanding the operating performance of the company and its operating segments. The non-GAAP information provided may not be consistent with
the methodologies used by other companies. All non-GAAP information related to
previous Univar filings with the SEC has been reconciled with reported
U.S. GAAP results. 2 |
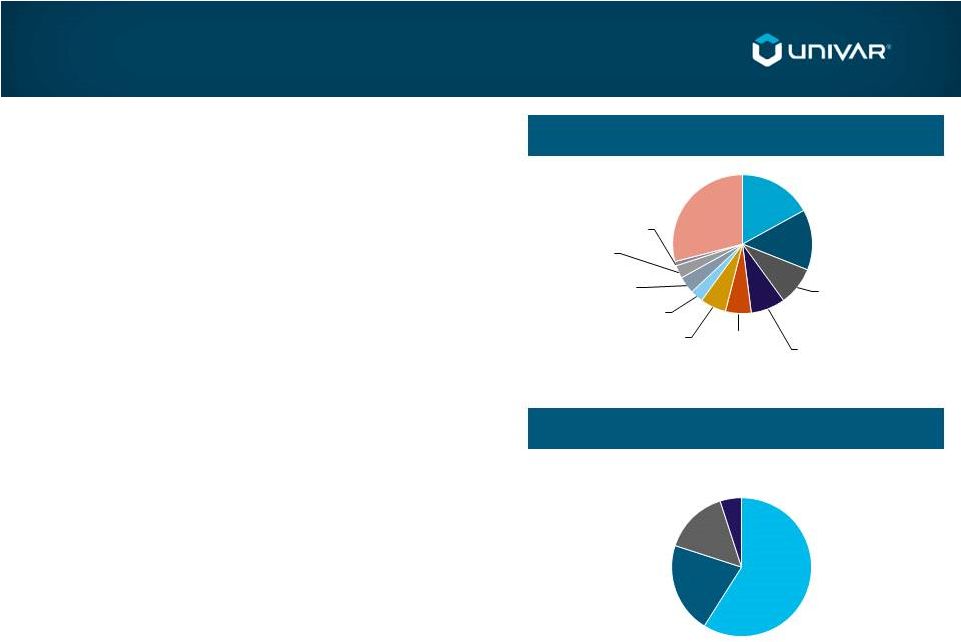 3 World Leader in Chemical Distribution 2014 Revenue By End Market 2014 Revenue By Operating Segment Global provider of basic and specialty chemicals; innovative value-added services • Net Sales $9.8 billion – Last 12 months (LTM) 6/30/15 • Adjusted EBITDA $634.0 million - LTM 6/30/15 #1 in North America and #2 in Europe (a) Strategically positioned for growth and margin expansion (a) Univar and Brenntag are the largest North American chemical distributors per “Specialty Chemical Distribution Market Update” (Boston Consulting Group; April
2014); market share measured based upon revenue per Univar
S-1 (USA + Canada) and Brenntag
2014 annual report. Water treatment comprises 5% of total revenue Oil, Gas & Mining 17% Coatings & Adhesives 14% Agricultural Sciences 9% Chemical Food Ingredients 6% Cleaning & Sanitization 6% 3% Pharmaceuticals Rubber & Plastics 1% Other 29% Manufacturing 8% Personal Care 4% Utilities 3% USA 59% EMEA 21% Canada 15% RoW 5% |
 4 Second Quarter 2015 Highlights Strong Execution Despite Significant FX and Oil & Gas Headwinds Adjusted EBITDA 1 (4.4%) • Adjusted EBITDA Excl. FX +1.5% Margin Expansion 1 • Gross margin +110 basis points • Adjusted EBITDA margin + 55 basis points Attractive Bolt-on Acquisition • Key Chemical (April) Initial Public Offering • 40,250,000 shares of common stock (primary and secondary) and $350.0 million private placement 1 Variances to Q2 2014 |
 5 Univar - Consolidated Highlights Successfully Offsetting Headwinds • Large FX translation impact • Oil & Gas volume decline • Mix enrichment from industrial
chemicals and services
• Gross Margin up • Conversion ratio up 1 • Adjusted EBITDA margin up Key Metrics: $ in millions 2Q15 2Q14 Y/Y % Net Sales $2,510.1 $2,861.4 (12.3%) Currency Neutral -- -- (5.4%) Gross Profit $467.2 $500.5 (6.7%) Currency Neutral -- -- 0.4% Gross Margin 18.6% 17.5% +110 bps Adjusted EBITDA $168.6 $176.4 (4.4%) Currency Neutral -- -- 1.4% Adjusted EBITDA Margin 6.7% 6.2% +55 bps 1 Defined as Adjusted EBITDA divided by Gross Profit |
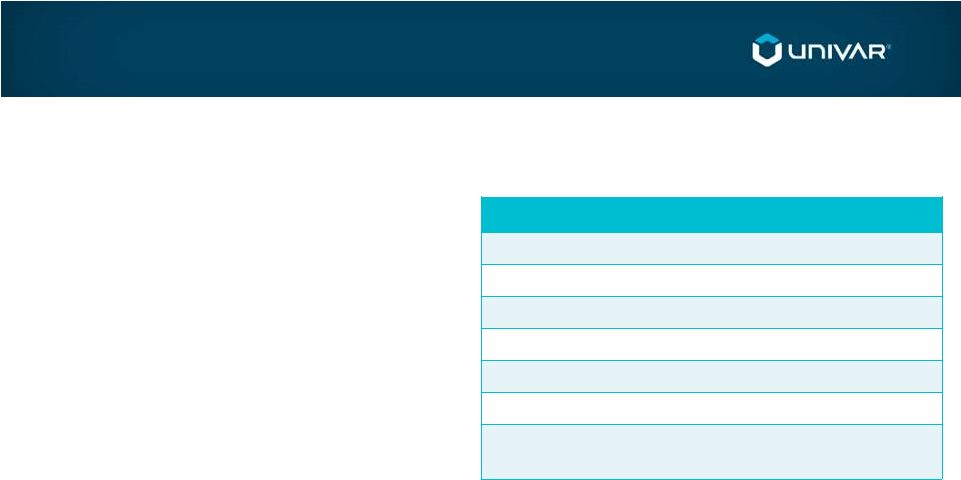 6 USA - Highlights Higher Profitability Outside Oil & Gas • Strong performance in Industrial Chemicals • Attractive growth in value-added services (ChemPoint, ChemCare, MiniBulk, and Environmental Sciences) • Significant declines in upstream Oil & Gas Key Metrics: $ in millions 2Q15 2Q14 Y/Y % Net Sales $1,389.4 $1,546.2 (10.1%) Gross Profit $284.2 $298.6 (4.8%) Gross Margin 20.5% 19.3% +115 bps Adjusted EBITDA $110.1 $120.5 (8.6%) Adjusted EBITDA Margin 7.9% 7.8% +15 bps |
 7 Canada - Highlights Solid Results Ex-FX Translation • Good growth in eastern Canada industrial markets • Strong early agriculture season tapers off with dry weather and lower demand for crop protection products • Volume declines in western Canada oil drilling markets Key Metrics: $ in millions 2Q15 2Q14 Y/Y % Net Sales $534.6 $587.7 (9.0%) Currency Neutral -- -- 2.5% Gross Profit $63.0 $67.9 (7.2%) Currency Neutral -- -- 4.6% Gross Margin 11.8% 11.6% +25 bps Adjusted EBITDA $30.4 $31.9 (4.7%) Currency Neutral -- -- 7.5% Adjusted EBITDA Margin 5.7% 5.4% +25 bps |
 8 EMEA - Highlights Improved Profitability • 18% FX translation impact on sales • Lower volumes driven by business resizing • Gross Margin and Adjusted EBITDA up significantly • Restructuring program on track $ in millions 2Q15 2Q14 Y/Y % Net Sales $467.4 $596.9 (21.7%) Currency Neutral -- -- (4.1%) Gross Profit $98.6 $115.0 (14.3%) Currency Neutral -- -- 4.9% Gross Margin 21.1% 19.3% +185 bps Adjusted EBITDA $27.1 $22.7 19.4% Currency Neutral -- -- 39.7% Adjusted EBITDA Margin 5.8% 3.8% +200 bps Key Metrics: |
 9 Acquisition Drives Growth • Nov. 2014 D’Altomare acquisition (Brazil) driving margins up significantly with product shift to specialty chemicals • Positive double-digit impact on a currency neutral basis • Tight operating expense controls • Lower prices in commodity products reducing overall revenues $ in millions 2Q15 2Q14 Y/Y % Net Sales $118.7 $130.6 (9.1%) Currency Neutral -- -- 10.4% Gross Profit $21.4 $19.0 12.6% Currency Neutral -- -- 40.5% Gross Margin 18.0% 14.5% +350 bps Adjusted EBITDA $6.2 $4.7 31.9% Currency Neutral -- -- 70.2% Adjusted EBITDA Margin 5.2% 3.6% +160 bps Key Metrics: Rest of World - Highlights |
 10 Consolidated Balance Sheet & Cash Flow Highlights (1) Cash flow from operating activities less net cash investment in PP&E and cost method investments.
(2) Net Debt defined as Total Debt (Long term debt plus short term financing) less cash and cash equivalents.
(3) LTM Earnings before Interest, Taxes and Amortization (EBITA) divided by trailing 13 month average of net PP&E plus trade working capital (accounts receivable plus inventory less accounts payable). $ in millions YTD 6/30/15 YTD 6/30/14 Y/Y % Free Cash Flow (1) $51.2 $(123.6) 141.4% Total Debt (2) $3,114.2 $3,949.0 (21.1)% Net Debt (2) $2,917.2 $3,785.8 (22.9)% Return on Assets Deployed (3) 22.2% 21.7% +50 bps Cash Taxes $16.9 $10.8 56.5% |
 11 Strengthened Financial Condition Three transactions strengthen financial condition IPO + Private Placement + Refinancing • ~$760 million of equity proceeds raised in June 2015 • Paid off all $650 million of 10.5% interest rate Mezzanine Debt • Refinanced entire capital structure • Extended debt maturities 5 years to 2022-23 • future annual cash interest reduced ~$100 million • Net debt/EBITDA reduced from 5.6 times to 4.5 times • Credit rating raised in June 2015 |
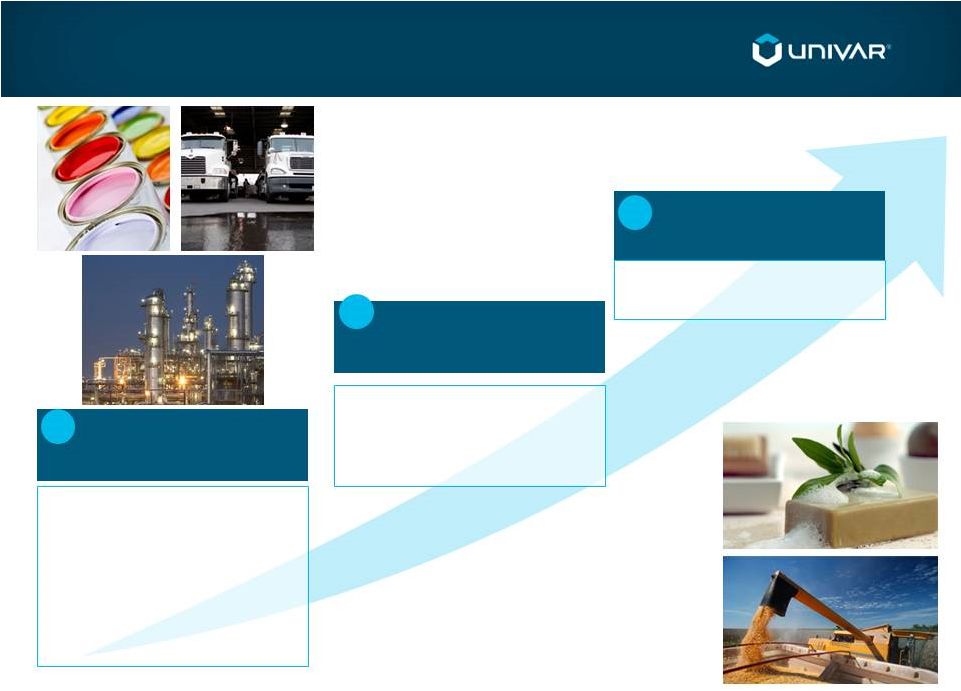 12 Strategic Priorities Capitalize on Organic Growth Opportunities in Attractive Markets 1 › Innovative Valued-Added Services › Highly Focused Sales Force › Full Solution Customer Value Proposition › Producer-Supported Solutions Model Continue to Execute on Operational Excellence Initiatives 2 › Commercial Excellence Initiatives › Ongoing Productivity Improvements “Tuck-in”
Acquisitions to Complement Organic
Growth 3 › Steady Flow of Opportunities › New Markets / New Products |
 13 Outlook Key Assumptions • Margin improvement • Unfavorable FX translation impact • Lower demand from Oil & Gas end markets Outlook • Expect third quarter 2015 Adjusted EBITDA to be modestly below the third quarter 2014 on a currency neutral basis |
 14 Appendix – Adj. EBITDA Reconciliation 3 months ended 6/30 6 months ended 6/30 LTM $ in Millions 2015 2014 2015 2014 6/30/2015 Adjusted EBITDA $168.6 $176.4 $314.3 $322.0 $634.0 Other Operating Expenses, net 39.0 25.6 47.1 47.3 196.9 Depreciation 37.7 30.6 69.7 61.2 142.0 Amortization 22.4 24.1 44.3 47.8 92.5 Impairment Charges -- -- -- -- 0.3 Interest Expense, net 63.1 64.8 126.3 128.7 248.2 Loss on Extinguishment of Debt 7.3 -- 7.3 1.2 7.3 Other Expense, net 12.1 2.0 5.3 3.9 0.3 Income tax expense (benefit) (0.6) 9.8 7.0 15.2 (24.0) Net Income (Loss) $(12.4) $19.5 $7.3 $16.7 $(29.5) |
 15 |
Serious News for Serious Traders! Try StreetInsider.com Premium Free!
You May Also Be Interested In
- T-Mobile Activates T-Satellite and Mobilizes Network Teams as Tropical Storm Lala Approaches Hawaiʻi
- KB HOME OPENS BRIGHTON CROSSINGS, A NEW COMMUNITY PRICED FROM THE $460Ks WITHIN A DESIRABLE BRIGHTON, COLORADO MASTER PLAN
- Partners Value Investments Inc. Announces Q2 2026 Interim Results
Create E-mail Alert Related Categories
SEC FilingsSign up for StreetInsider Free!
Receive full access to all new and archived articles, unlimited portfolio tracking, e-mail alerts, custom newswires and RSS feeds - and more!
