



Form 8-K USG CORP For: Jul 23
 Tweet
Tweet Share
Share E-mail
UNITED
STATES
SECURITIES
AND EXCHANGE COMMISSION
Washington,
D.C. 20549
Form 8-K
CURRENT
REPORT
PURSUANT
TO SECTION 13 OR 15(d)
OF
THE SECURITIES EXCHANGE ACT OF 1934
Date of
Report (Date of earliest event reported): July 23, 2015 (July 23, 2015)
|
USG Corporation |
| (Exact name of registrant as specified in its charter) |
Commission File Number: 1-8864
|
Delaware |
|
36-3329400 |
|
(State or other jurisdiction of |
|
(IRS Employer Identification No.) |
|
550 West Adams Street, Chicago, Illinois |
60661-3676 |
|
|
(Address of principal executive offices) |
(Zip Code) |
|
(312) 436-4000 |
||
| Registrant’s telephone number, including area code |
Check the appropriate box below if the Form 8-K filing is intended to simultaneously satisfy the filing obligation of the registrant under any of the following provisions:
⃞ Written communications pursuant to Rule 425 under the Securities Act (17 CFR 230.425)
⃞ Soliciting material pursuant to Rule 14a-12 under the Exchange Act (17 CFR 240.14a-12)
⃞ Pre-commencement communications pursuant to Rule 14d-2(b) under the Exchange Act (17 CFR 240.14d-2(b))
⃞ Pre-commencement communications pursuant to Rule 13e-4(c) under the Exchange Act (17 CFR 240.13e-4(c))
Section 2 – Financial Information
|
Item 2.02 |
Results of Operations and Financial Condition. |
On July 23, 2015, USG Corporation issued a press release containing earnings information for the quarter ended June 30, 2015. A copy of the press release is furnished as Exhibit 99.1 hereto. As previously announced, a conference call and webcast to discuss second quarter 2015 results will be held at 8:00 a.m. Central Time on July 23, 2015. A copy of the slides to be presented as part of the webcast is furnished as Exhibit 99.2 hereto.
The information contained in this report, including the Exhibits hereto, shall not be deemed to be filed for purposes of the Securities Exchange Act of 1934, as amended, and it shall not be deemed to be incorporated by reference in any filing under the Securities Act of 1933, as amended, except as expressly set forth by specific reference in such filing.
Section 9 – Financial Statements and Exhibits
|
Item 9.01 |
Financial Statements and Exhibits. |
|
(d) Exhibits |
|
|
Exhibit 99.1 – USG Corporation press release dated July 23, 2015. |
|
|
Exhibit 99.2 – USG Corporation presentation slides dated July 23, 2015. |
|
SIGNATURE
Pursuant to the requirements of the Securities Exchange Act of 1934, the registrant has duly caused this report to be signed on its behalf by the undersigned hereunto duly authorized.
|
USG CORPORATION |
|||||
|
Registrant |
|||||
| Date: |
July 23, 2015 |
By: |
/s/ Matthew F. Hilzinger |
||
|
Matthew F. Hilzinger, |
|||||
|
Executive Vice President |
|||||
|
and Chief Financial Officer |
|||||
EXHIBIT INDEX
| Exhibit No. | Exhibit | |
| 99.1 |
USG Corporation press release dated July 23, 2015 |
|
| 99.2 |
USG Corporation presentation slides dated July 23, 2015 |
|
Exhibit 99.1
USG Corporation Reports Second Quarter 2015 Results
Second Quarter 2015 vs. Second Quarter 2014
Business Highlights
- Net income increases 39% to $79 million
- Adjusted net income increases 81% to $78 million
- US Gypsum operating profit margin improvement of 60 basis points to 17.6%
- US Ceilings operating profit margin improvement of 150 basis points to 19.0%
CHICAGO--(BUSINESS WIRE)--July 23, 2015--USG Corporation (NYSE: USG), a leading building products company, today reported results for the second quarter of 2015. “All of our businesses expanded their margins and contributed to our strong second quarter,” said James S. Metcalf, Chairman, President, and CEO. “We generated the highest level of net income since the fourth quarter of 2006 when demand was fifty percent higher.”
On a consolidated basis in the second quarter of 2015, net sales were $970 million, up 2 percent from the second quarter of 2014. Operating profit improved 7 percent to $105 million. The corporation’s adjusted operating profit was $118 million in the second quarter of 2015, compared to an adjusted operating profit of $87 million in the second quarter of 2014.
USG generated $79 million in net income and $0.54 per diluted share in the second quarter of 2015. On an adjusted basis, net income of $78 million and diluted earnings per share of $0.53 increased over 80 percent. Adjusted results exclude results from Gypsum Transportation Limited (GTL), a shipping operation that the Company has exited, included in the Gypsum segment. A full reconciliation of GAAP to adjusted metrics is set forth on a schedule attached hereto.
The corporation’s Gypsum segment generated $98 million of operating profit in the second quarter of 2015. On an adjusted basis, operating profit in the Gypsum segment improved by $20 million, led by the US Gypsum business which realized 310 basis points of improved operating margins. Wallboard provided $14 million of improved operating profit and the surfaces and substrates businesses contributed $9 million in total incremental profit. Favorable pricing and improved volumes coupled with lower natural gas costs and operational efficiencies drove the margin expansion in the US Gypsum business.
“In the second quarter, our Gypsum segment realized its strongest operating margin in over 8 years,” Mr. Metcalf said. “We are focused on expanding our margins and growing our non-wallboard portfolio of products in this business.”
The corporation’s Ceilings segment earned $25 million of operating profit in the second quarter of 2015, led by the US Ceilings business, which drove operating margins higher by 150 basis points through lower costs and increased sales of higher performing, higher margin ceilings products.
The Distribution segment earned $9 million of operating profit and more than doubled its operating margins to 2.5% in the second quarter of 2015. Same store sales increased 5%.
“We made strides in all three phases of our Plan to Win in the second quarter by strengthening our core operations, diversifying our earnings base, and differentiating USG through innovation. The outlook for all of our businesses is bright,” Mr. Metcalf said.
A conference call is being held today at 8:00 A.M. Central Time during which USG senior management will discuss the corporation’s operating results. The conference call will be webcast on the USG website, www.usg.com, in the Investor Relations section. The dial-in number for the conference call is 1-800-315-2944 in the United States and Canada (1-847-413-2929 for other international callers), and the pass code is 40172695. After the live webcast, a replay of the webcast will be available on the USG website. In addition, a telephonic replay of the call will be available until Thursday, August 6, 2015. The replay dial-in number is 1-888-843-7419 (1-630-652-3042 for international callers), and the pass code is 40172695.
USG Corporation
USG Corporation is a manufacturer and distributor of innovative, high-performance building systems through its United States Gypsum Company, USG Interiors, LLC, and L&W Supply Corporation subsidiaries and its USG Boral Building Products joint venture. Headquartered in Chicago, USG's worldwide operations serve the commercial, residential, and repair and remodel construction markets, enabling our customers to build the outstanding spaces where people live, work and play. USG wall, ceiling, exterior sheathing, flooring underlayment and roofing systems provide leading-edge building solutions, while L&W Supply branch locations efficiently stock and deliver building materials throughout the United States. USG Boral Building Products is a leading plasterboard & ceilings joint venture across Asia, Australasia, and the Middle East. USG and its subsidiaries are proud sponsors of the U.S. Olympic and Paralympic teams and the Canadian Olympic team. For additional information, visit www.usg.com.
Non-GAAP Financial Measures
In this press release, the corporation’s financial results are provided both in accordance with accounting principles generally accepted in the United States of America (GAAP) and using certain non-GAAP financial measures. In particular, the corporation presents the non-GAAP financial measures adjusted operating profit, adjusted equity income from USG Boral Building Products, adjusted net income, and adjusted earnings per diluted share, which exclude certain items. In addition, adjusted operating profit includes the corporation’s income from its equity method investments, including the USG Boral Building Products joint venture. The non-GAAP financial measures are included as a complement to results provided in accordance with GAAP because management believes these non-GAAP financial measures help investors’ ability to analyze underlying trends in the corporation’s business, evaluate its performance relative to other companies in its industry and provide useful information to both management and investors by excluding certain items that may not be indicative of the corporation’s core operating results. Adjusted operating profit includes the income from the corporation's equity method investments, including the USG Boral Building Products joint venture, because management views the joint venture as a business unit, even though the corporation’s share of the joint venture is 50%. In addition, the corporation uses adjusted operating profit and adjusted net income as components in the measurement of incentive compensation. Adjusted results also exclude results from Gypsum Transportation Limited (GTL), a shipping operation that USG has exited. The non-GAAP measures should not be considered a substitute for or superior to GAAP results and may vary from others in the industry. For further information related to the corporation’s use of non-GAAP financial measures, and reconciliations to the nearest GAAP measures, see the schedules attached hereto.
This press release contains forward-looking statements within the meaning of the Private Securities Litigation Reform Act of 1995 related to management’s expectations about future conditions. Actual business, market or other conditions may differ materially from management’s expectations and, accordingly, may affect our sales and profitability or other results and liquidity. Actual results may differ materially due to various other factors, including: economic conditions, such as the levels of new home and other construction activity, employment levels, the availability of mortgage, construction and other financing, mortgage and other interest rates, housing affordability and supply, the levels of foreclosures and home resales, currency exchange rates and consumer confidence; capital markets conditions and the availability of borrowings under our credit agreement or other financings; our substantial indebtedness and our ability to incur substantial additional indebtedness; competitive conditions, such as price, service and product competition; shortages in raw materials; changes in raw material and energy costs; volatility in the assumptions used to determine the funded status of our pension plans; the loss of one or more major customers and our customers’ ability to meet their financial obligations to us; capacity utilization rates for us and the industry; our ability to expand into new geographic markets and the stability of such markets; our ability to successfully operate the joint venture with Boral Limited, including risks that our joint venture partner, Boral Limited, may not fulfill its obligations as an investor or may take actions that are inconsistent with our objectives; our ability to protect our intellectual property and other proprietary rights; changes in laws or regulations, including environmental and safety regulations; the satisfactory performance of certain business functions by third party service providers; our ability to achieve anticipated savings from cost reduction programs; the outcome in contested litigation matters; the effects of acts of terrorism or war upon domestic and international economies and financial markets; and acts of God. We assume no obligation to update any forward-looking information contained in this press release. Additional information concerning these and other factors may be found in our filings with the Securities and Exchange Commission, including the “Risk Factors” in our most recent Annual Report on Form 10-K.
| USG CORPORATION | ||||||||||||||||||
| CONSOLIDATED STATEMENTS OF OPERATIONS | ||||||||||||||||||
| (dollars in millions, except share and per share data) | ||||||||||||||||||
| (Unaudited) | ||||||||||||||||||
| Three months ended June 30, | Six months ended June 30, | |||||||||||||||||
| 2015 | 2014 | 2015 | 2014 | |||||||||||||||
| Net sales | $ | 970 | $ | 948 | $ | 1,879 | $ | 1,798 | ||||||||||
| Cost of products sold | 787 | 773 | 1,543 | 1,480 | ||||||||||||||
| Gross profit | 183 | 175 | 336 | 318 | ||||||||||||||
| Selling and administrative expenses | 79 | 77 | 156 | 154 | ||||||||||||||
| Gain on disposal of shipping operations, net | (1 | ) | — | (1 | ) | — | ||||||||||||
| Operating profit | 105 | 98 | 181 | 164 | ||||||||||||||
| Income from equity method investments | 14 | 5 | 22 | 8 | ||||||||||||||
| Interest expense | (40 | ) | (45 | ) | (83 | ) | (92 | ) | ||||||||||
| Interest income | — | — | 1 | 1 | ||||||||||||||
| Loss on extinguishment of debt | — | — | (19 | ) | — | |||||||||||||
| Gain on deconsolidation of subsidiaries and consolidated joint ventures | — | — | — | 27 | ||||||||||||||
| Other income, net | 1 | — | — | — | ||||||||||||||
| Income from continuing operations before income taxes | 80 | 58 | 102 | 108 | ||||||||||||||
| Income tax benefit (expense) | (1 | ) | — | 1 | (5 | ) | ||||||||||||
| Income from continuing operations | 79 | 58 | 103 | 103 | ||||||||||||||
| Loss from discontinued operations, net of tax | — | (1 | ) | — | (1 | ) | ||||||||||||
| Net income | $ | 79 | $ | 57 | $ | 103 | $ | 102 | ||||||||||
| Earnings (loss) per common share - basic: | ||||||||||||||||||
| Income from continuing operations | $ | 0.54 | $ | 0.40 | $ | 0.70 | $ | 0.74 | ||||||||||
| Loss from discontinued operations | — | (0.01 | ) | — | (0.01 | ) | ||||||||||||
| Basic earnings per common share | $ | 0.54 | $ | 0.39 | $ | 0.70 | $ | 0.73 | ||||||||||
| Earnings (loss) per common share - diluted: | ||||||||||||||||||
| Income from continuing operations | $ | 0.54 | $ | 0.39 | $ | 0.70 | $ | 0.72 | ||||||||||
| Loss from discontinued operations | — | (0.01 | ) | — | (0.01 | ) | ||||||||||||
| Diluted earnings per common share | $ | 0.54 | $ | 0.38 | $ | 0.70 | $ | 0.71 | ||||||||||
| Average common shares | 145,424,853 | 144,500,682 | 145,393,548 | 139,702,728 | ||||||||||||||
| Average diluted common shares | 146,990,178 | 147,024,196 | 147,167,248 | 146,920,294 | ||||||||||||||
| USG CORPORATION | ||||||||||
| CONSOLIDATED BALANCE SHEETS | ||||||||||
| (dollars in millions) | ||||||||||
| (Unaudited) | ||||||||||
| As of | As of | |||||||||
| June 30, 2015 | December 31, 2014 | |||||||||
| Assets | ||||||||||
| Cash and cash equivalents | $ | 231 | $ | 228 | ||||||
| Short-term marketable securities | 61 | 96 | ||||||||
| Restricted cash | 50 | 1 | ||||||||
| Receivables (net of reserves - $20 and $22) | 468 | 404 | ||||||||
| Inventories | 324 | 329 | ||||||||
| Income taxes receivable | 3 | 3 | ||||||||
| Deferred income taxes | 42 | 43 | ||||||||
| Other current assets | 84 | 48 | ||||||||
| Total current assets | 1,263 | 1,152 | ||||||||
| Long-term marketable securities | 21 | 58 | ||||||||
| Property, plant and equipment (net of accumulated | ||||||||||
| depreciation and depletion - $1,926 and $1,885) | 1,826 | 1,908 | ||||||||
| Deferred income taxes | 17 | 19 | ||||||||
| Equity method investments | 681 | 735 | ||||||||
| Other assets | 122 | 122 | ||||||||
| Total assets | $ | 3,930 | $ | 3,994 | ||||||
| Liabilities and Stockholders' Equity | ||||||||||
| Accounts payable | $ | 246 | $ | 290 | ||||||
| Accrued expenses | 205 | 220 | ||||||||
| Current portion of long-term debt | — | 4 | ||||||||
| Income taxes payable | 1 | 1 | ||||||||
| Deferred income taxes | 1 | — | ||||||||
| Litigation settlement accrual | 48 | 48 | ||||||||
| Total current liabilities | 501 | 563 | ||||||||
| Long-term debt | 2,188 | 2,205 | ||||||||
| Deferred income taxes | 61 | 61 | ||||||||
| Pension and other postretirement benefits | 451 | 491 | ||||||||
| Other liabilities | 253 | 266 | ||||||||
| Total liabilities | 3,454 | 3,586 | ||||||||
| Stockholders' Equity: | ||||||||||
| Preferred stock | — | — | ||||||||
| Common stock | 14 | 14 | ||||||||
| Treasury stock | (3 | ) | — | |||||||
| Additional paid-in capital | 3,017 | 3,014 | ||||||||
| Accumulated other comprehensive loss | (372 | ) | (338 | ) | ||||||
| Retained earnings (accumulated deficit) | (2,180 | ) | (2,283 | ) | ||||||
| Stockholders' equity of parent | 476 | 407 | ||||||||
| Noncontrolling interest | — | 1 | ||||||||
| Total stockholders' equity including noncontrolling interest | 476 | 408 | ||||||||
| Total liabilities and stockholders' equity | $ | 3,930 | $ | 3,994 | ||||||
| Other Information: | ||||||||||
| Total cash and cash equivalents and marketable securities | $ | 313 | $ | 382 | ||||||
| Borrowing availability under existing credit facilities | 352 | 291 | ||||||||
| Total Liquidity | $ | 665 | $ | 673 | ||||||
| USG CORPORATION | ||||||||||
| CONSOLIDATED STATEMENTS OF CASH FLOWS | ||||||||||
| (dollars in millions) | ||||||||||
| (Unaudited) | ||||||||||
| Six months ended June 30, | ||||||||||
| 2015 | 2014 | |||||||||
| Operating Activities | ||||||||||
| Net income | $ | 103 | $ | 102 | ||||||
| Less: Loss from discontinued operations, net of tax | — | (1 | ) | |||||||
| Income from continuing operations | 103 | 103 | ||||||||
| Adjustments to reconcile income from continuing operations to net cash: | ||||||||||
| Depreciation, depletion and amortization | 72 | 77 | ||||||||
| Loss on extinguishment of debt | 19 | — | ||||||||
| Share-based compensation expense | 6 | 10 | ||||||||
| Deferred income taxes | 1 | 4 | ||||||||
| Gain on asset dispositions | (7 | ) | (12 | ) | ||||||
| Income from equity method investments | (22 | ) | (8 | ) | ||||||
| Dividends received from equity method investments | 18 | — | ||||||||
| Gain on deconsolidation of subsidiaries and consolidated joint ventures | — | (27 | ) | |||||||
| (Increase) decrease in working capital, net of deconsolidation of subsidiaries and consolidated joint ventures: | ||||||||||
| Receivables | (66 | ) | (54 | ) | ||||||
| Income taxes receivable | (1 | ) | (1 | ) | ||||||
| Inventories | 6 | (17 | ) | |||||||
| Other current assets | 1 | (1 | ) | |||||||
| Payables | (33 | ) | (18 | ) | ||||||
| Accrued expenses | (25 | ) | (22 | ) | ||||||
| Decrease in other assets | 1 | — | ||||||||
| Decrease in pension and other postretirement benefits | (40 | ) | — | |||||||
| Decrease in other liabilities | (4 | ) | (7 | ) | ||||||
| Other, net | 5 | (7 | ) | |||||||
| Net cash provided by operating activities | $ | 34 | $ | 20 | ||||||
| Investing Activities | ||||||||||
| Purchases of marketable securities | (32 | ) | (97 | ) | ||||||
| Sales or maturities of marketable securities | 103 | 99 | ||||||||
| Capital expenditures | (48 | ) | (58 | ) | ||||||
| Net proceeds from asset dispositions | 42 | 14 | ||||||||
| Investment in joint ventures, including $23 of cash of contributed subsidiaries in 2014 | — | (557 | ) | |||||||
| Insurance proceeds | 2 | 2 | ||||||||
| Return (deposit) of restricted cash | (49 | ) | 4 | |||||||
| Net cash provided by (used for) investing activities | $ | 18 | $ | (593 | ) | |||||
| Financing Activities | ||||||||||
| Issuance of debt | 350 | 3 | ||||||||
| Repayment of debt | (386 | ) | (2 | ) | ||||||
| Payment of debt issuance fees | (6 | ) | — | |||||||
| Issuance of common stock | 4 | 3 | ||||||||
| Repurchases of common stock to satisfy employee tax withholding obligations | (8 | ) | (5 | ) | ||||||
| Net cash used for financing activities | $ | (46 | ) | $ | (1 | ) | ||||
| (continued) | ||||||||||
| USG CORPORATION | ||||||||||
| CONSOLIDATED STATEMENTS OF CASH FLOWS (Continued) | ||||||||||
| (dollars in millions) | ||||||||||
| (Unaudited) | ||||||||||
| Six months ended June 30, | ||||||||||
| 2015 | 2014 | |||||||||
| Effect of exchange rate changes on cash | (3 | ) | — | |||||||
| Net cash used for operating activities - discontinued operations | — | (1 | ) | |||||||
| Net increase (decrease) in cash and cash equivalents | $ | 3 | $ | (575 | ) | |||||
| Cash and cash equivalents at beginning of period | 228 | 810 | ||||||||
| Cash and cash equivalents at end of period | $ | 231 | $ | 235 | ||||||
| Supplemental Cash Flow Disclosures: | ||||||||||
| Interest paid, net of interest capitalized | $ | 80 | $ | 86 | ||||||
| Income taxes paid, net of refunds received | 1 | 8 | ||||||||
| Noncash Investing and Financing Activities: | ||||||||||
| Amount in accounts payable for capital expenditures | 6 | 6 | ||||||||
| Contribution of wholly-owned subsidiaries and joint venture investments as consideration for investments in USG Boral Building Products | — | 121 | ||||||||
| Conversion of 10% convertible senior notes due 2018, net of discount | — | (73 | ) | |||||||
| Issuance of common stock upon conversion of debt | — | 75 | ||||||||
| Accrued interest on debt conversion | — | (2 | ) | |||||||
| USG CORPORATION | ||||||||||||||||||
| CORE BUSINESS RESULTS | ||||||||||||||||||
| (dollars in millions) | ||||||||||||||||||
| (Unaudited) | ||||||||||||||||||
| Three months ended June 30, | Six months ended June 30, | |||||||||||||||||
| 2015 | 2014 | 2015 | 2014 (a) | |||||||||||||||
|
Net Sales: |
||||||||||||||||||
| Gypsum: | ||||||||||||||||||
| United States | $ | 516 | $ | 488 | $ | 993 | $ | 920 | ||||||||||
| Canada | 87 | 90 | 163 | 166 | ||||||||||||||
| Mexico / Latin America | 48 | 48 | 96 | 95 | ||||||||||||||
| Gypsum Transportation Limited | — | 21 | 10 | 42 | ||||||||||||||
| Canadian Mining | 2 | 1 | 2 | 1 | ||||||||||||||
| Eliminations | (36 | ) | (36 | ) | (70 | ) | (67 | ) | ||||||||||
| Total | 617 | 612 | 1,194 | 1,157 | ||||||||||||||
| Ceilings: | ||||||||||||||||||
| United States | 121 | 120 | 236 | 228 | ||||||||||||||
| USG International | — | — | — | 7 | ||||||||||||||
| Canada | 14 | 15 | 28 | 28 | ||||||||||||||
| Mexico / Latin America | 8 | 7 | 17 | 17 | ||||||||||||||
| Eliminations | (12 | ) | (12 | ) | (27 | ) | (25 | ) | ||||||||||
| Total | 131 | 130 | 254 | 255 | ||||||||||||||
| Distribution: | ||||||||||||||||||
| L&W Supply | 364 | 344 | 698 | 644 | ||||||||||||||
| Eliminations | (142 | ) | (138 | ) | (267 | ) | (258 | ) | ||||||||||
| Total USG Corporation Net Sales | $ | 970 | $ | 948 | $ | 1,879 | $ | 1,798 | ||||||||||
|
Operating Profit (Loss): |
||||||||||||||||||
| Gypsum: | ||||||||||||||||||
| United States | $ | 91 | $ | 83 | $ | 157 | $ | 131 | ||||||||||
| Canada | 3 | 5 | 4 | 8 | ||||||||||||||
| Mexico / Latin America | 5 | 4 | 9 | 8 | ||||||||||||||
| Gypsum Transportation Limited | 1 | 6 | 1 | 14 | ||||||||||||||
| Canadian Mining | (2 | ) | (3 | ) | (5 | ) | (1 | ) | ||||||||||
| Total | 98 | 95 | 166 | 160 | ||||||||||||||
| Ceilings: | ||||||||||||||||||
| United States | 23 | 21 | 42 | 32 | ||||||||||||||
| USG International | — | — | — | — | ||||||||||||||
| Canada | 1 | 2 | 2 | 4 | ||||||||||||||
| Mexico / Latin America | 1 | 1 | 2 | 3 | ||||||||||||||
| Total | 25 | 24 | 46 | 39 | ||||||||||||||
| Distribution: | ||||||||||||||||||
| L&W Supply | 9 | 4 | 13 | 5 | ||||||||||||||
| Corporate | (24 | ) | (21 | ) | (47 | ) | (42 | ) | ||||||||||
| Eliminations | (3 | ) | (4 | ) | 3 | 2 | ||||||||||||
| Total USG Corporation Operating Profit | $ | 105 | $ | 98 | $ | 181 | $ | 164 | ||||||||||
| USG Boral Building Products (UBBP): | ||||||||||||||||||
| Net sales | $ | 264 | $ | 280 | $ | 492 | $ | 369 | ||||||||||
| Operating profit | 34 | 16 | 57 | 26 | ||||||||||||||
| Net income attributable to UBBP | 26 | 9 | 42 | 15 | ||||||||||||||
| USG share of income from UBBP | 13 | 4 | 21 | 7 | ||||||||||||||
| (a) Historical results have been recast to reflect the company's change in segments effective April 1, 2014. | ||||||||||||||||||
| USG CORPORATION | |||||||
| ROLLFORWARD of QUARTERLY ADJUSTED OPERATING PROFIT | |||||||
| (dollars in millions) | |||||||
| (Unaudited) | |||||||
| Adjusted operating profit - Non-GAAP measure - Three months ended June 30, 2014 | $ | 87 | |||||
| US Wallboard | 14 | ||||||
| US Surfaces and Substrates | 9 | ||||||
| US Gypsum Selling, General, and Administrative Expenses | (3 | ) | |||||
| US Tile and Grid | 2 | ||||||
| Distribution | 5 | ||||||
| Income from Equity Method Investments | 9 | ||||||
| USG's Share of USG-Boral Q2 2014 Restructuring Charges, Net of Tax | (2 | ) | |||||
| Corporate and Eliminations | (2 | ) | |||||
| Canada, Mexico, Mining | (1 | ) | |||||
| Adjusted operating profit - Non-GAAP measure - Three months ended June 30, 2015 | $ | 118 | |||||
| Adjusted operating profit - Non-GAAP measure - Six months ended June 30, 2014 | 148 | ||||||
| US Wallboard | 23 | ||||||
| US Surfaces and Substrates | 18 | ||||||
| US Gypsum Selling, General, and Administrative Expenses | (3 | ) | |||||
| US Tile and Grid | 8 | ||||||
| US Ceiling Selling, General, and Administrative Expenses | 2 | ||||||
| Distribution | 8 | ||||||
| Income from Equity Method Investments | 14 | ||||||
| USG's Share of USG-Boral Q2 2014 Restructuring Charges, Net of Tax | (2 | ) | |||||
| Corporate and Eliminations | (4 | ) | |||||
| Q1 2014 Asset Retirement Obligation Adjustment | (7 | ) | |||||
| Canada, Mining, and Mexico | (3 | ) | |||||
| Adjusted operating profit - Non-GAAP measure - Six months ended June 30, 2015 | 202 | ||||||
| USG CORPORATION | ||||||||||||||||||
| RECONCILIATION of NON-GAAP MEASURES TO GAAP MEASURES | ||||||||||||||||||
| (dollars in millions, except share and per share data) | ||||||||||||||||||
| (Unaudited) | ||||||||||||||||||
| Three months ended June 30, | Six months ended June 30, | |||||||||||||||||
| 2015 | 2014 | 2015 | 2014 | |||||||||||||||
| Income from equity method investments - GAAP measure | $ | 14 | $ | 5 | $ | 22 | $ | 8 | ||||||||||
| Less: Income from equity method investments - Other joint ventures | 1 | 1 | 1 | 1 | ||||||||||||||
| USG's share of UBBP restructuring charges, net of tax | — | 2 | — | 2 | ||||||||||||||
| Adjusted equity income from UBBP - Non-GAAP measure | $ | 13 | $ | 6 | $ | 21 | $ | 9 | ||||||||||
| Gypsum operating profit - GAAP measure | $ | 98 | $ | 95 | $ | 166 | $ | 160 | ||||||||||
| Gain on sale of surplus property | — | (12 | ) | — | (12 | ) | ||||||||||||
| GTL - Shipping operations (a) | (1 | ) | (6 | ) | (1 | ) | (14 | ) | ||||||||||
| Gypsum adjusted operating profit - Non-GAAP measure | $ | 97 | $ | 77 | $ | 165 | $ | 134 | ||||||||||
| Operating profit - GAAP measure | $ | 105 | $ | 98 | $ | 181 | $ | 164 | ||||||||||
| Gain on sale of surplus property | — | (12 | ) | — | (12 | ) | ||||||||||||
| GTL - Shipping operations (a) | (1 | ) | (6 | ) | (1 | ) | (14 | ) | ||||||||||
| Income from equity method investments | 14 | 5 | 22 | 8 | ||||||||||||||
| USG's share of UBBP restructuring charges, net of tax | — | 2 | — | 2 | ||||||||||||||
| Adjusted operating profit - Non-GAAP measure | $ | 118 | $ | 87 | $ | 202 | $ | 148 | ||||||||||
| Net income attributable to USG - GAAP measure | $ | 79 | $ | 57 | $ | 103 | $ | 102 | ||||||||||
| Loss from discontinued operations | — | 1 | — | 1 | ||||||||||||||
| Gain on sale of surplus property | — | (12 | ) | — | (12 | ) | ||||||||||||
| GTL - Shipping operations (a) | (1 | ) | (5 | ) | — | (12 | ) | |||||||||||
| USG's share of UBBP restructuring charges, net of tax | — | 2 | — | 2 | ||||||||||||||
| Gain on deconsolidation of subsidiaries and consolidated joint ventures | — | — | — | (27 | ) | |||||||||||||
| Withholding tax on property contributed to USG Boral joint venture | — | — | — | 1 | ||||||||||||||
| Loss on extinguishment of debt | — | — | 19 | — | ||||||||||||||
| Adjusted net income attributable to USG - Non-GAAP measure | $ | 78 | $ | 43 | $ | 122 | $ | 55 | ||||||||||
| (continued) | ||||||||||||||||||
| USG CORPORATION | ||||||||||||||||||
| RECONCILIATION of NON-GAAP MEASURES TO GAAP MEASURES | ||||||||||||||||||
| (dollars in millions, except share and per share data) | ||||||||||||||||||
| (Unaudited) | ||||||||||||||||||
| Three months ended June 30, | Six months ended June 30, | |||||||||||||||||
| 2015 | 2014 | 2015 | 2014 | |||||||||||||||
| Earnings per average diluted common share - GAAP measure | $ | 0.54 | $ | 0.38 | $ | 0.70 | $ | 0.71 | ||||||||||
| Adjustments per average diluted common share: | ||||||||||||||||||
| Loss from discontinued operations | — | 0.01 | — | 0.01 | ||||||||||||||
| Gain on sale of surplus property | — | (0.08 | ) | — | (0.08 | ) | ||||||||||||
| GTL - Shipping operations (a) | (0.01 | ) | (0.03 | ) | — | (0.08 | ) | |||||||||||
| USG's share of UBBP restructuring charges, net of tax | — | 0.01 | — | 0.01 | ||||||||||||||
| Gain on deconsolidation of subsidiaries and consolidated joint ventures | — | — | — | (0.18 | ) | |||||||||||||
| Withholding tax on property contributed to USG Boral joint venture | — | — | — | 0.01 | ||||||||||||||
| Loss on extinguishment of debt | 0.13 | — | ||||||||||||||||
| Adjusted earnings per adjusted average diluted common share – Non-GAAP measure | $ | 0.53 | $ | 0.29 | $ | 0.83 | $ | 0.40 | ||||||||||
| Average diluted common shares – GAAP | 146,990,178 | 147,024,196 | 147,167,248 | 146,920,294 | ||||||||||||||
| Adjustment to remove common shares that would be antidilutive based on adjusted net income | — | — | — | — | ||||||||||||||
| Adjusted average diluted common shares – Non-GAAP | 146,990,178 | 147,024,196 | 147,167,248 | 146,920,294 | ||||||||||||||
| (a) Adjusted results for both the quarter and the year ended June 30, 2014 have been adjusted to exclude the results from GTL. | ||||||||||||||||||
CONTACT:
USG Corporation
Media
Sasha Bigda, (312) 436-6511
[email protected]
or
Investors
Ryan
Flanagan, (312) 436-5304
[email protected]
Exhibit 99.2
USG Corporation Second Quarter 2015 Earnings Conference Call and Webcast July 23, 2015
This presentation contains forward-looking statements within the meaning of the Private Securities Litigation Reform Act of 1995 related to management’s expectations about future conditions. Actual business, market or other conditions may differ materially from management’s expectations and, accordingly, may affect our sales and profitability or other results and liquidity. Actual results may differ materially due to various other factors, including: economic conditions, such as the levels of new home and other construction activity, employment levels, the availability of mortgage, construction and other financing, mortgage and other interest rates, housing affordability and supply, the levels of foreclosures and home resales, currency exchange rates and consumer confidence; capital markets conditions and the availability of borrowings under our credit agreement or other financings; our substantial indebtedness and our ability to incur substantial additional indebtedness; competitive conditions, such as price, service and product competition; shortages in raw materials; changes in raw material and energy costs; volatility in the assumptions used to determine the funded status of our pension plans; the loss of one or more major customers and our customers’ ability to meet their financial obligations to us; capacity utilization rates for us and the industry; our ability to expand into new geographic markets and the stability of such markets; our ability to successfully operate the joint venture with Boral Limited, including risks that our joint venture partner, Boral Limited, may not fulfill its obligations as an investor or may take actions that are inconsistent with our objectives; our ability to protect our intellectual property and other proprietary rights; changes in laws or regulations, including environmental and safety regulations; the satisfactory performance of certain business functions by third party service providers; our ability to achieve anticipated savings from cost reduction programs; the outcome in contested litigation matters; the effects of acts of terrorism or war upon domestic and international economies and financial markets; and acts of God. We assume no obligation to update any forward-looking information contained in this presentation. Additional information concerning these and other factors may be found in our filings with the Securities and Exchange Commission, including the “Risk Factors” in our most recent Annual Report on Form 10-K. CAUTIONARY STATEMENTS 2
USG Corporation Second Quarter 2015 Agenda Overview and Strategy Financial Results Market Outlook Questions Closing Remarks James S. Metcalf Chairman, President and CEO Matthew F. Hilzinger Executive VP, Chief Financial Officer James S. Metcalf Chairman, President and CEO James S. Metcalf Chairman, President and CEO 3
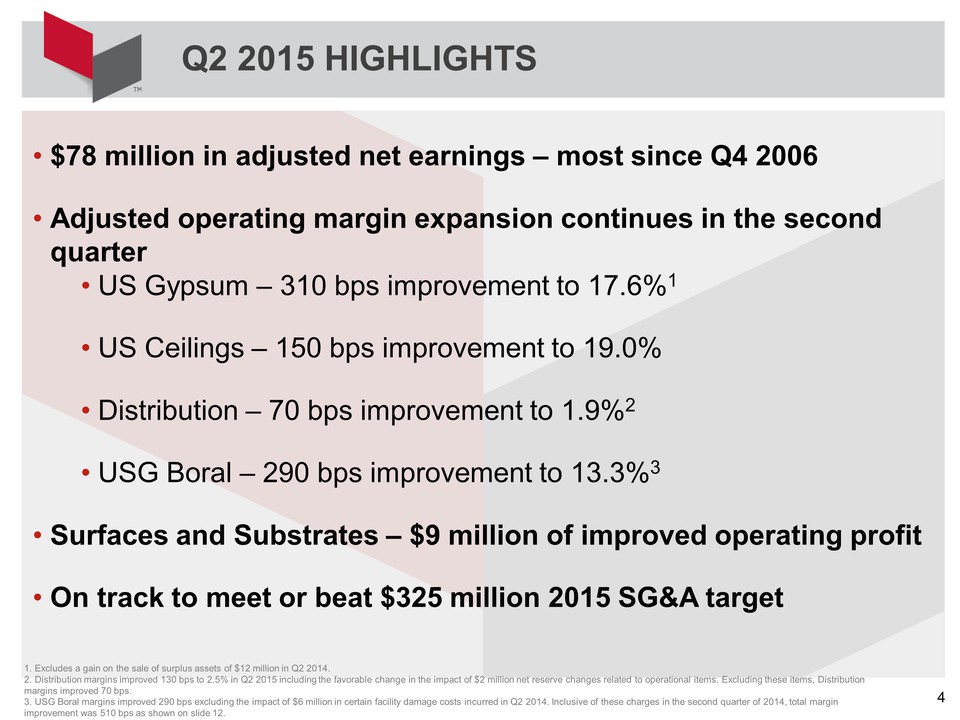
Q2 2015 HIGHLIGHTS • $78 million in adjusted net earnings – most since Q4 2006 • Adjusted operating margin expansion continues in the second quarter • US Gypsum – 310 bps improvement to 17.6%1 • US Ceilings – 150 bps improvement to 19.0% • Distribution – 70 bps improvement to 1.9%2 • USG Boral – 290 bps improvement to 13.3%3 • Surfaces and Substrates – $9 million of improved operating profit • On track to meet or beat $325 million 2015 SG&A target 4 1. Excludes a gain on the sale of surplus assets of $12 million in Q2 2014. 2. Distribution margins improved 130 bps to 2.5% in Q2 2015 including the favorable change in the impact of $2 million net reserve changes related to operational items. Excluding these items, Distribution margins improved 70 bps. 3. USG Boral margins improved 290 bps excluding the impact of $6 million in certain facility damage costs incurred in Q2 2014. Inclusive of these charges in the second quarter of 2014, total margin improvement was 510 bps as shown on slide 12.
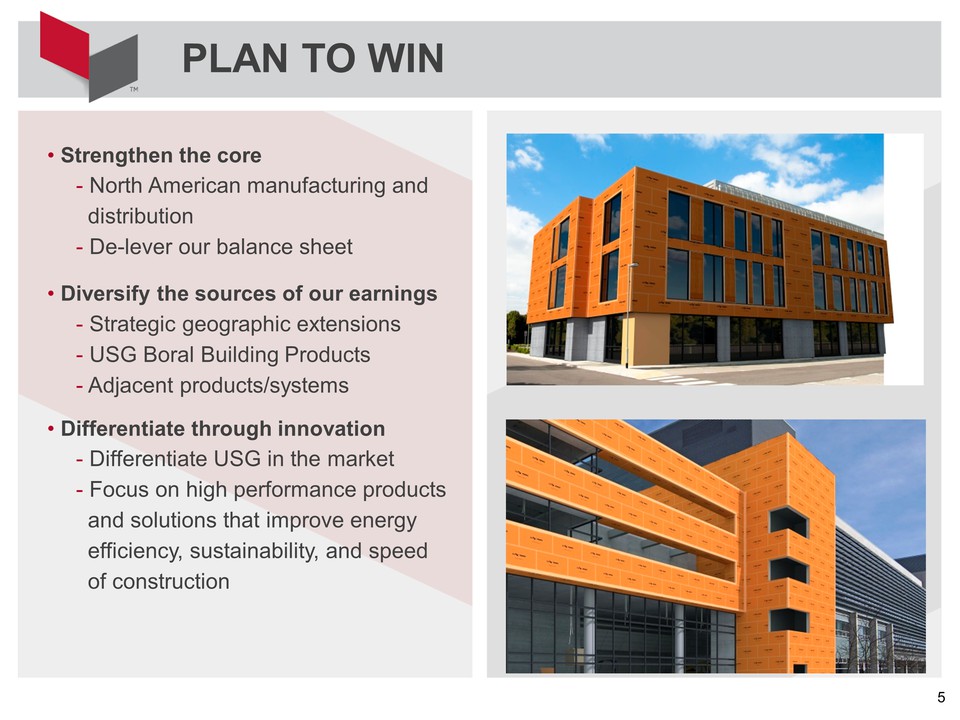
PLAN TO WIN • Strengthen the core - North American manufacturing and distribution - De-lever our balance sheet • Diversify the sources of our earnings - Strategic geographic extensions - USG Boral Building Products - Adjacent products/systems • Differentiate through innovation - Differentiate USG in the market - Focus on high performance products and solutions that improve energy efficiency, sustainability, and speed of construction 5
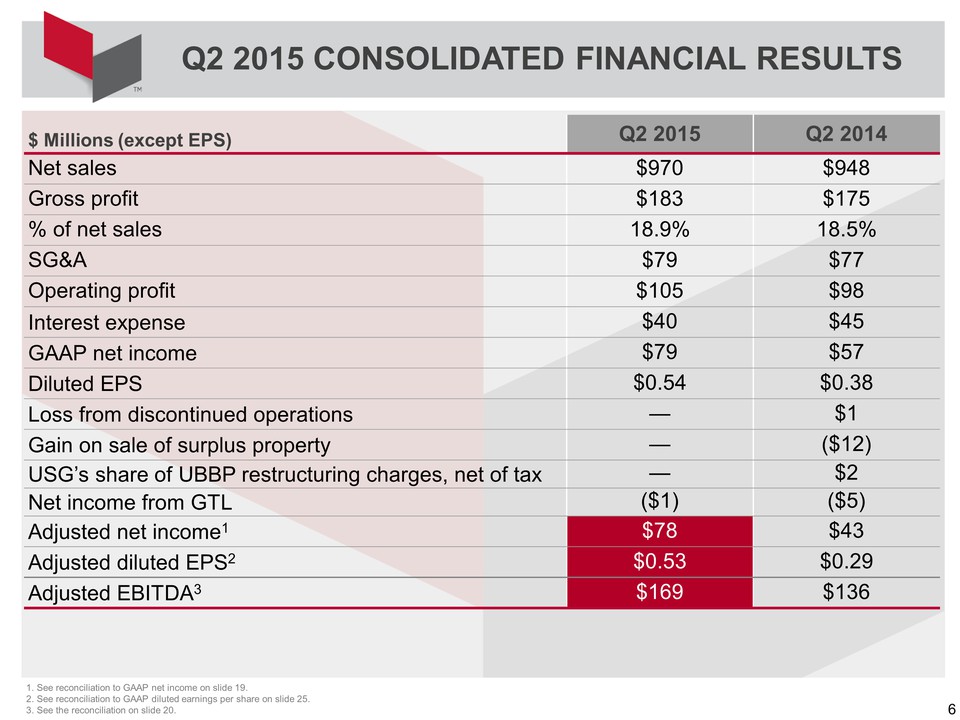
$ Millions (except EPS) Q2 2015 Q2 2014 Net sales $970 $948 Gross profit $183 $175 % of net sales 8.9% 18.5% SG&A $79 $77 Operating profit $105 $98 Interest expense $40 $45 GAAP net income $79 $57 Diluted EPS $0.54 $0.38 Loss from discontinued operations — $1 Gain on sale of surplus property — ($12) USG’s share of UBBP restructuring charges, net of tax — $2 Net income from GTL ($1) ($5) Adjusted net income1 $78 $43 Adjusted diluted EPS2 $0.53 $0.29 Adjusted EBITDA3 $169 $136 1. See reconciliation to GAAP net income on slide 19. 2. See reconciliation to GAAP diluted earnings per share on slide 25. 3. See the reconciliation on slide 20. Q2 2015 CONSOLIDATED FINANCIAL RESULTS 6
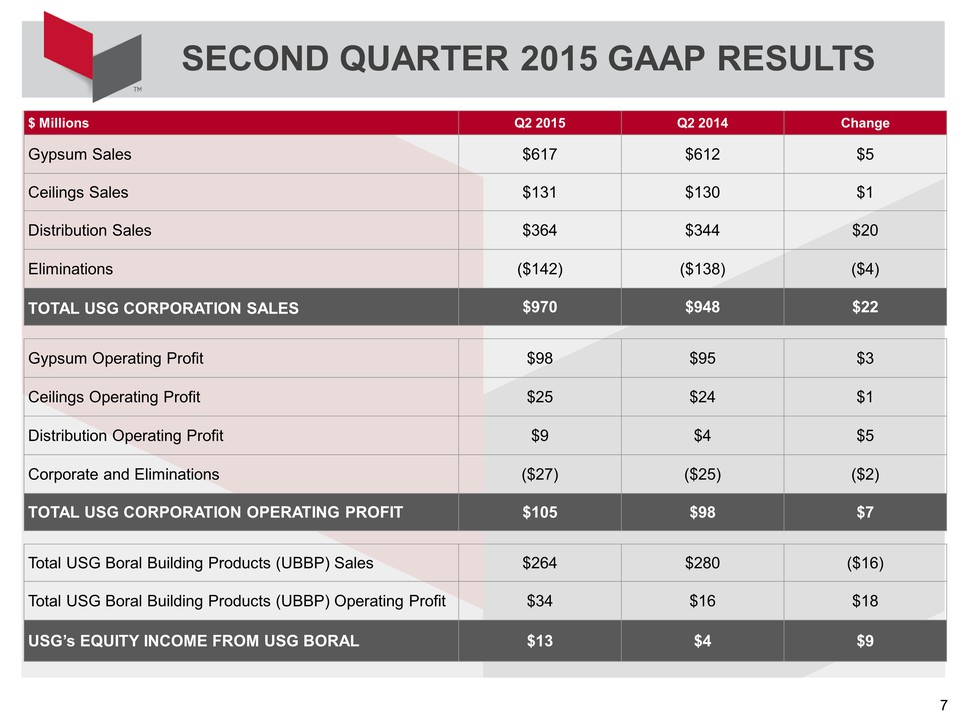
SECOND QUARTER 2015 GAAP RESULTS 7 $ Millions Q2 2015 Q2 2014 Change Gypsum Sales $617 $612 $5 Ceilings Sales $131 $130 $1 Distribution Sales $364 $344 $20 Eliminations ($142) ($138) ($4) TOTAL USG CORPORATION SALES $970 $948 $22 Gypsum Operating Profit $98 $95 $3 Ceilings Operating Profit $25 $24 $1 Distribution Operating Profit $9 $4 $5 Corporate and Eliminations ($27) ($25) ($2) TOTAL USG CORPORATION OPERATING PROFIT $105 $98 $7 Total USG Boral Building Products (UBBP) Sales $264 $280 ($16) Total USG Boral Building Products (UBBP) Operating Profit $34 $16 $18 USG’s EQUITY INCOME FROM USG BORAL $13 $4 $9
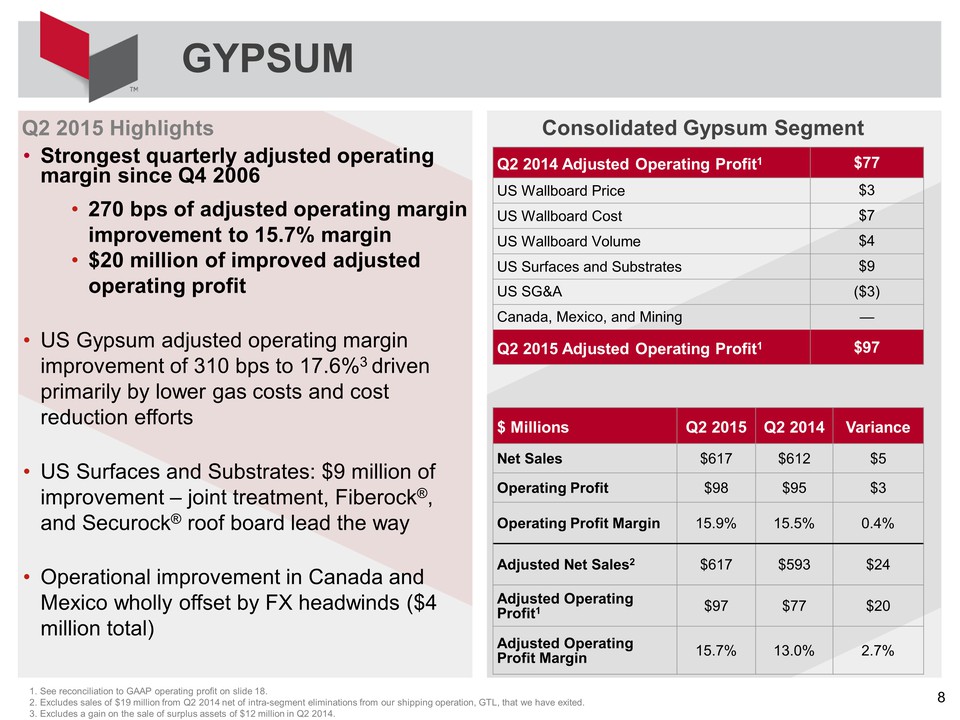
Q2 2015 Highlights • Strongest quarterly adjusted operating margin since Q4 2006 • 270 bps of adjusted operating margin improvement to 15.7% margin • $20 million of improved adjusted operating profit • US Gypsum adjusted operating margin improvement of 310 bps to 17.6%3 driven primarily by lower gas costs and cost reduction efforts • US Surfaces and Substrates: $9 million of improvement – joint treatment, Fiberock®, and Securock® roof board lead the way • Operational improvement in Canada and Mexico wholly offset by FX headwinds ($4 million total) GYPSUM 1. See reconciliation to GAAP operating profit on slide 18. 2. Excludes sales of $19 million from Q2 2014 net of intra-segment eliminations from our shipping operation, GTL, that we have exited. 3. Excludes a gain on the sale of surplus assets of $12 million in Q2 2014. 8 Q2 2014 Adjusted Operating Profit1 $77 US Wallboard Price $3 US Wallboard Cost $7 US Wallboard Volume $4 US Surfaces and Substrates $9 US SG&A ($3) Canada, Mexico, and Mining — Q2 2015 Adjusted Operating Profit1 $97 $ Millions Q2 2015 Q2 2014 Variance Net Sales $617 $612 $5 Operating Profit $98 $95 $3 Operating Profit Margin 15.9% 15.5% 0.4% Adjusted Net Sales2 $617 $593 $24 Adjusted Operating Profit1 $97 $77 $20 Adjusted Operating Profit Margin 15.7% 13.0% 2.7% Consolidated Gypsum Segment
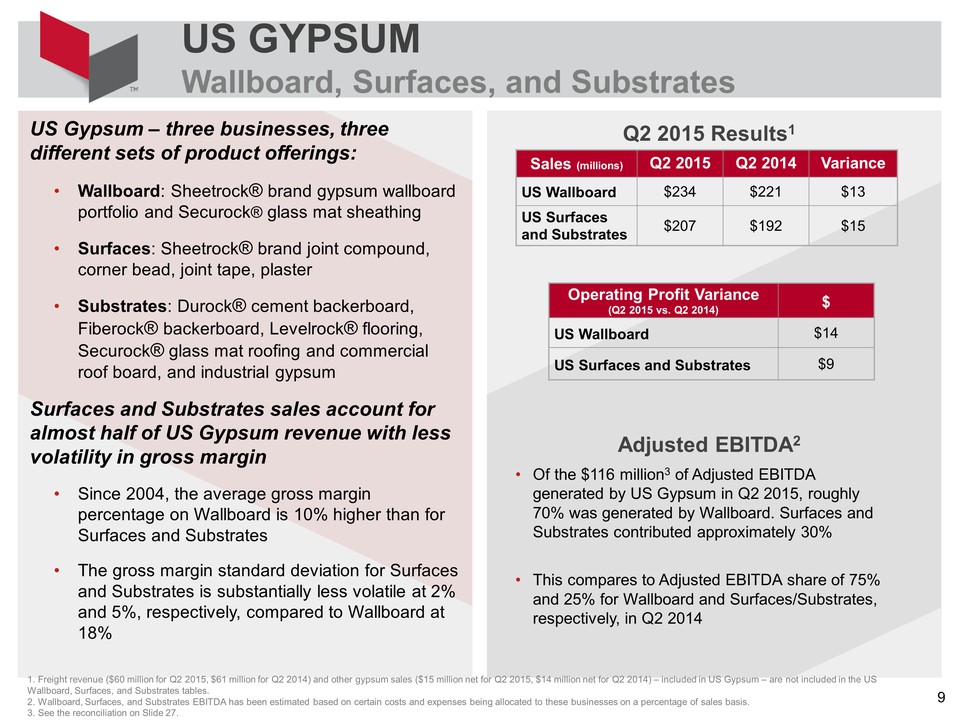
US GYPSUM Wallboard, Surfaces, and Substrates 1. Freight revenue ($60 million for Q2 2015, $61 million for Q2 2014) and other gypsum sales ($15 million net for Q2 2015, $14 million net for Q2 2014) – included in US Gypsum – are not included in the US Wallboard, Surfaces, and Substrates tables. 2. Wallboard, Surfaces, and Substrates EBITDA has been estimated based on certain costs and expenses being allocated to these businesses on a percentage of sales basis. 3. See the reconciliation on Slide 27. 9 US Gypsum – three businesses, three different sets of product offerings: • Wallboard: Sheetrock® brand gypsum wallboard portfolio and Securock® glass mat sheathing • Surfaces: Sheetrock® brand joint compound, corner bead, joint tape, plaster • Substrates: Durock® cement backerboard, Fiberock® backerboard, Levelrock® flooring, Securock® glass mat roofing and commercial roof board, and industrial gypsum Surfaces and Substrates sales account for almost half of US Gypsum revenue with less volatility in gross margin • Since 2004, the average gross margin percentage on Wallboard is 10% higher than for Surfaces and Substrates • The gross margin standard deviation for Surfaces and Substrates is substantially less volatile at 2% and 5%, respectively, compared to Wallboard at 18% Sales (millions) Q2 2015 Q2 2014 Variance US Wallboard $234 $221 $13 US Surfaces and Substrates $207 $192 $15 Q2 2015 Results1 Operating Profit Variance (Q2 2015 vs. Q2 2014) $ US Wallboard $14 US Surfaces and Substrates $9 Adjusted EBITDA2 • Of the $116 million3 of Adjusted EBITDA generated by US Gypsum in Q2 2015, roughly 70% was generated by Wallboard. Surfaces and Substrates contributed approximately 30% • This compares to Adjusted EBITDA share of 75% and 25% for Wallboard and Surfaces/Substrates, respectively, in Q2 2014
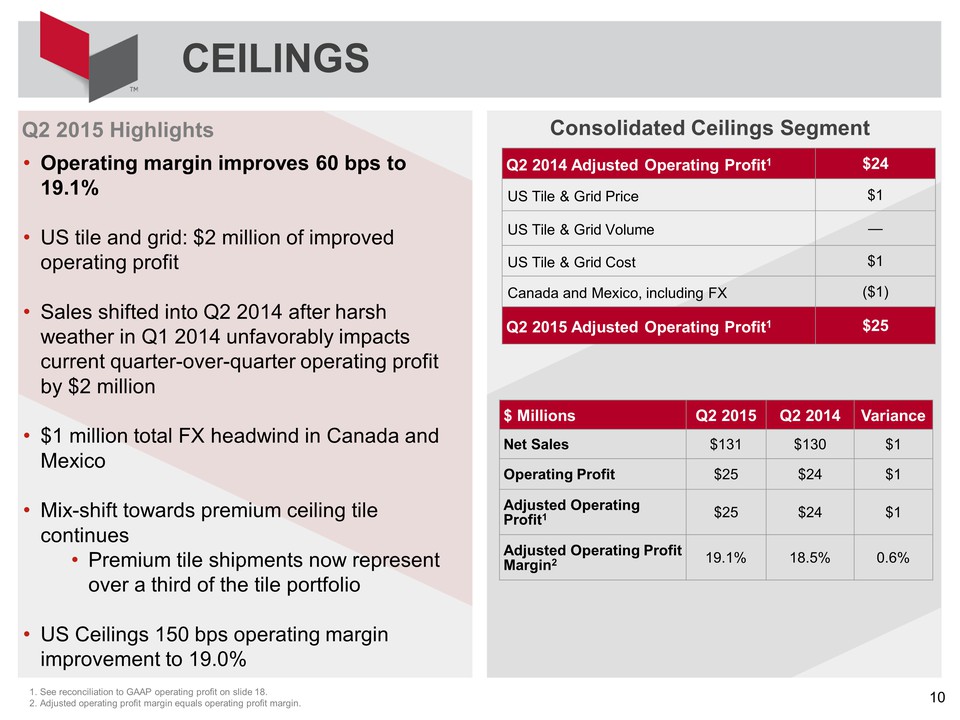
Q2 2015 Highlights • Operating margin improves 60 bps to 19.1% • US tile and grid: $2 million of improved operating profit • Sales shifted into Q2 2014 after harsh weather in Q1 2014 unfavorably impacts current quarter-over-quarter operating profit by $2 million • $1 million total FX headwind in Canada and Mexico • Mix-shift towards premium ceiling tile continues • Premium tile shipments now represent over a third of the tile portfolio • US Ceilings 150 bps operating margin improvement to 19.0% Q2 2014 Adjusted Operating Profit1 $24 US Tile & Grid Price $1 US Tile & Grid Volume — US Tile & Grid Cost $1 Canada and Mexico, including FX ($1) Q2 2015 Adjusted Operating Profit1 $25 $ Millions Q2 2015 Q2 2014 Variance Net Sales $131 $130 $1 Operating Profit $25 $24 $1 Adjusted Operating Profit1 $25 $24 $1 Adjusted Operating Profit Margin2 19.1% 18.5% 0.6% CEILINGS 1. See reconciliation to GAAP operating profit on slide 18. 10 2. Adjusted operating profit margin equals operating profit margin. Consolidated Ceilings Segment
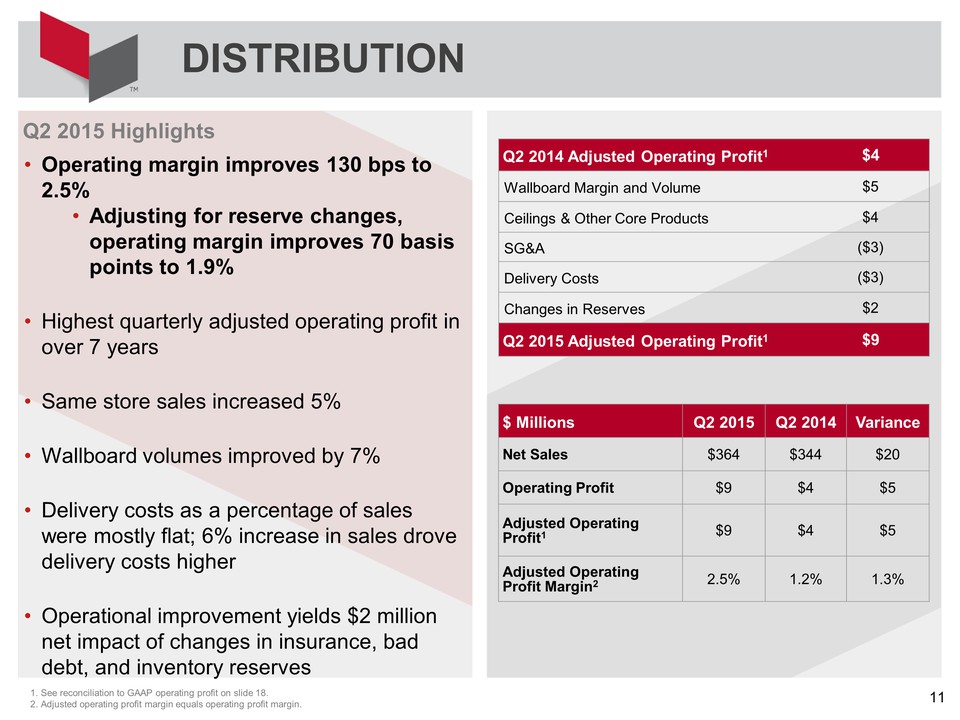
DISTRIBUTION 1. See reconciliation to GAAP operating profit on slide 18. 11 2. Adjusted operating profit margin equals operating profit margin. Q2 2015 Highlights • Operating margin improves 130 bps to 2.5% • Adjusting for reserve changes, operating margin improves 70 basis points to 1.9% • Highest quarterly adjusted operating profit in over 7 years • Same store sales increased 5% • Wallboard volumes improved by 7% • Delivery costs as a percentage of sales were mostly flat; 6% increase in sales drove delivery costs higher • Operational improvement yields $2 million net impact of changes in insurance, bad debt, and inventory reserves Q2 2014 Adjusted Operating Profit1 $4 Wallboard Margin and Volume $5 Ceilings & Other Core Products $4 SG&A ($3) Delivery Costs ($3) Changes in Reserves $2 Q2 2015 Adjusted Operating Profit1 $9 $ Millions Q2 2015 Q2 2014 Variance Net Sales $364 $344 $20 Operating Profit $9 $4 $5 Adjusted Operating Profit1 $9 $4 $5 Adjusted Operating Profit Margin2 2.5% 1.2% 1.3% 1. See reconciliation to GAAP operating profit on slide 18. 11 2. Adjusted operating profit margin equals operating profit margin.
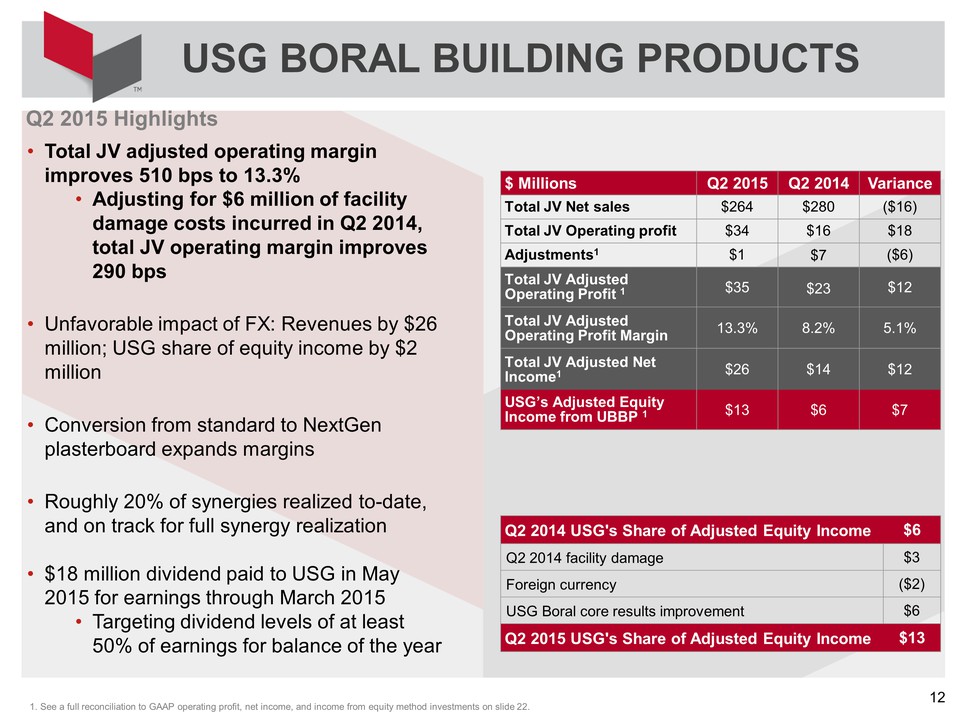
Q2 2015 Highlights • Total JV adjusted operating margin improves 510 bps to 13.3% • Adjusting for $6 million of facility damage costs incurred in Q2 2014, total JV operating margin improves 290 bps • Unfavorable impact of FX: Revenues by $26 million; USG share of equity income by $2 million • Conversion from standard to NextGen plasterboard expands margins • Roughly 20% of synergies realized to-date, and on track for full synergy realization • $18 million dividend paid to USG in May 2015 for earnings through March 2015 • Targeting dividend levels of at least 50% of earnings for balance of the year USG BORAL BUILDING PRODUCTS $ Millions Q2 2015 Q2 2014 Variance Total JV Net sales $264 $280 ($16) Total JV Operating profit $34 $16 $18 Adjustments1 $1 $7 ($6) Total JV Adjusted Operating Profit 1 $35 $23 $12 Total JV Adjusted Operating Profit Margin 13.3% 8.2% 5.1% Total JV Adjusted Net Income1 $26 $14 $12 USG’s Adjusted Equity Income from UBBP 1 $13 $6 $7 Q2 2014 USG's Share of Adjusted Equity Income $6 Q2 2014 facility damage $3 Foreign currency ($2) USG Boral core results improvement $6 Q2 2015 USG's Share of Adjusted Equity Income $13 1. See a full reconciliation to GAAP operating profit, net income, and income from equity method investments on slide 22. 12
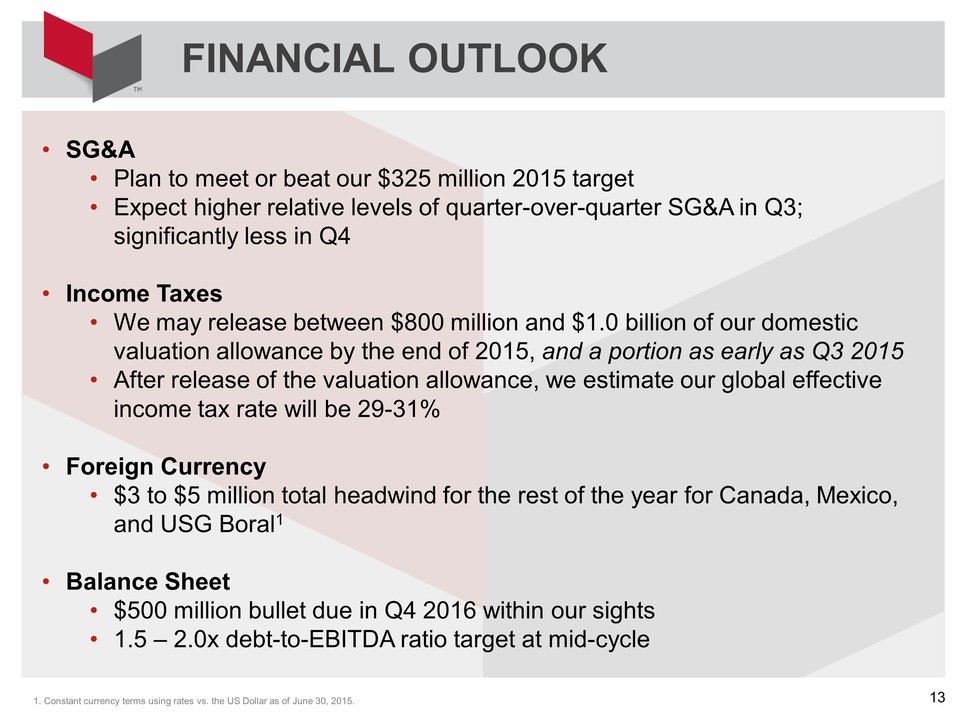
FINANCIAL OUTLOOK • SG&A • Plan to meet or beat our $325 million 2015 target • Expect higher relative levels of quarter-over-quarter SG&A in Q3; significantly less in Q4 • Income Taxes • We may release between $800 million and $1.0 billion of our domestic valuation allowance by the end of 2015, and a portion as early as Q3 2015 • After release of the valuation allowance, we estimate our global effective income tax rate will be 29-31% • Foreign Currency • $3 to $5 million total headwind for the rest of the year for Canada, Mexico, and USG Boral1 • Balance Sheet • $500 million bullet due in Q4 2016 within our sights • 1.5 – 2.0x debt-to-EBITDA ratio target at mid-cycle 1. Constant currency terms using rates vs. the US Dollar as of June 30, 2015. 13
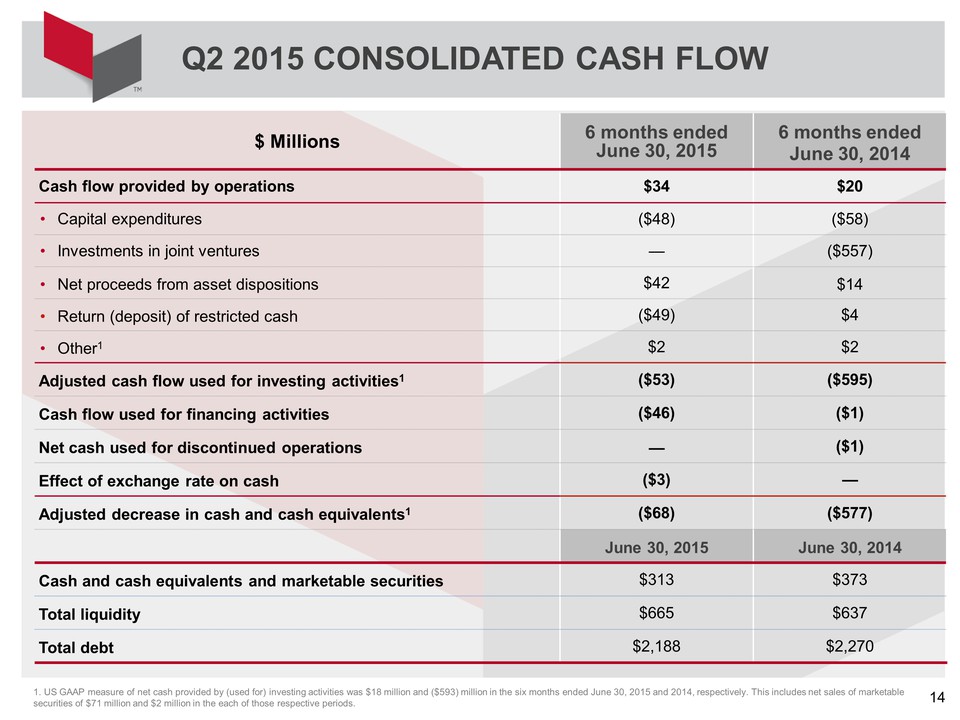
Q2 2015 CONSOLIDATED CASH FLOW 14 $ Millions 6 months ended June 30, 2015 6 months ended June 30, 2014 Cash flow provided by operations $34 $20 • Capital expenditures ($48) ($58) • Investments in joint ventures — ($557) • Net proceeds from asset dispositions $42 $14 • Return (deposit) of restricted cash ($49) $4 • Other1 $2 $2 Adjusted cash flow used for investing activities1 ($53) ($595) Cash flow used for financing activities ($46) ($1) Net cash used for discontinued operations — ($1) Effect of exchange rate on cash ($3) — Adjusted decrease in cash and cash equivalents1 ($68) ($577) June 30, 2015 June 30, 2014 Cash and cash equivalents and marketable securities $313 $373 Total liquidity $665 $637 Total debt $2,188 $2,270 1. US GAAP measure of net cash provided by (used for) investing activities was $18 million and ($593) million in the six months ended June 30, 2015 and 2014, respectively. This includes net sales of marketable securities of $71 million and $2 million in the each of those respective periods.
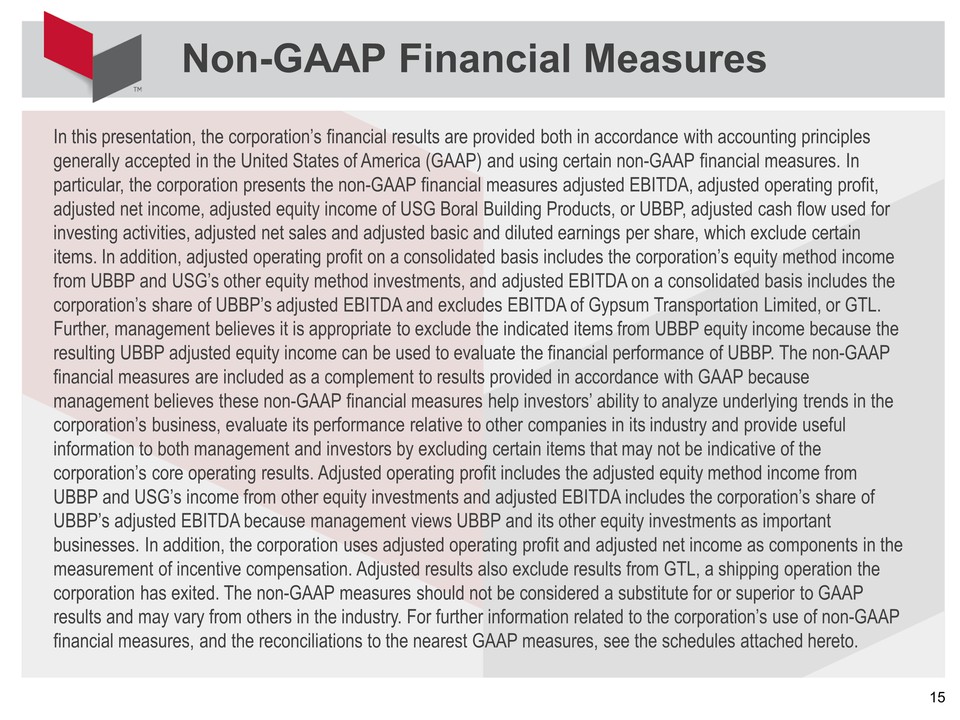
In this presentation, the corporation’s financial results are provided both in accordance with accounting principles generally accepted in the United States of America (GAAP) and using certain non-GAAP financial measures. In particular, the corporation presents the non-GAAP financial measures adjusted EBITDA, adjusted operating profit, adjusted net income, adjusted equity income of USG Boral Building Products, or UBBP, adjusted cash flow used for investing activities, adjusted net sales and adjusted basic and diluted earnings per share, which exclude certain items. In addition, adjusted operating profit on a consolidated basis includes the corporation’s equity method income from UBBP and USG’s other equity method investments, and adjusted EBITDA on a consolidated basis includes the corporation’s share of UBBP’s adjusted EBITDA and excludes EBITDA of Gypsum Transportation Limited, or GTL. Further, management believes it is appropriate to exclude the indicated items from UBBP equity income because the resulting UBBP adjusted equity income can be used to evaluate the financial performance of UBBP. The non-GAAP financial measures are included as a complement to results provided in accordance with GAAP because management believes these non-GAAP financial measures help investors’ ability to analyze underlying trends in the corporation’s business, evaluate its performance relative to other companies in its industry and provide useful information to both management and investors by excluding certain items that may not be indicative of the corporation’s core operating results. Adjusted operating profit includes the adjusted equity method income from UBBP and USG’s income from other equity investments and adjusted EBITDA includes the corporation’s share of UBBP’s adjusted EBITDA because management views UBBP and its other equity investments as important businesses. In addition, the corporation uses adjusted operating profit and adjusted net income as components in the measurement of incentive compensation. Adjusted results also exclude results from GTL, a shipping operation the corporation has exited. The non-GAAP measures should not be considered a substitute for or superior to GAAP results and may vary from others in the industry. For further information related to the corporation’s use of non-GAAP financial measures, and the reconciliations to the nearest GAAP measures, see the schedules attached hereto. Non-GAAP Financial Measures 15
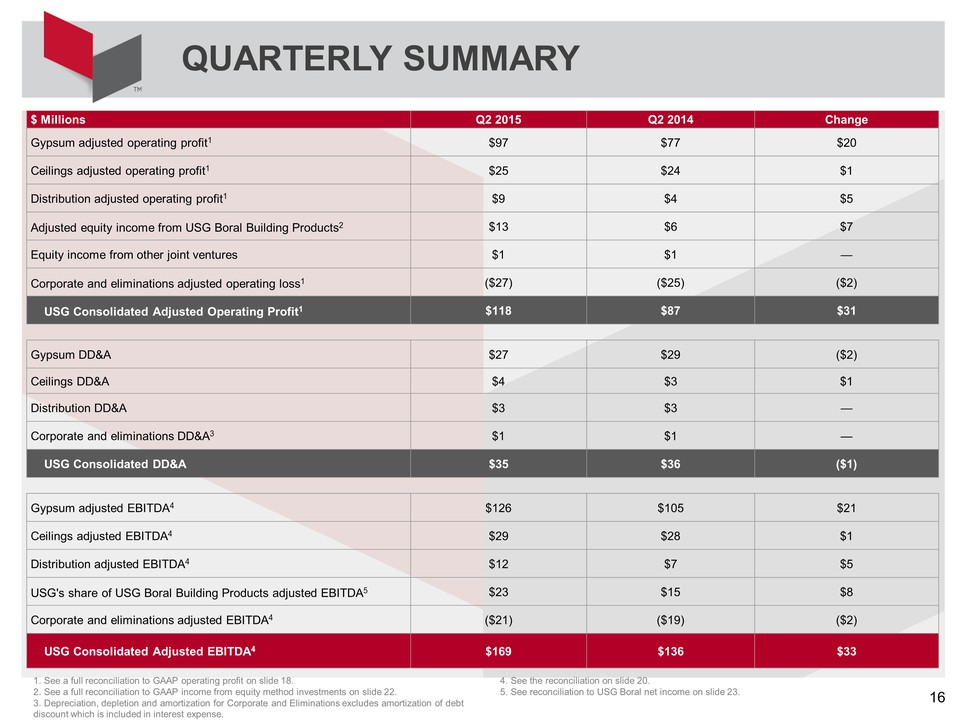
QUARTERLY SUMMARY $ Millions Q2 2015 Q2 2014 Change Gypsum adjusted operating profit1 $97 $77 $20 Ceilings adjusted operating profit1 $25 $24 $1 Distribution adjusted operating profit1 $9 $4 $5 Adjusted equity income from USG Boral Building Products2 $13 $6 $7 Equity income from other joint ventures $1 $1 — Corporate and eliminations adjusted operating loss1 ($27) ($25) ($2) USG Consolidated Adjusted Operating Profit1 $118 $87 $31 Gypsum DD&A $27 $29 ($2) Ceilings DD&A $4 $3 $1 Distribution DD&A $3 $3 — Corporate and eliminations DD&A3 $1 $1 — USG Consolidated DD&A $35 $36 ($1) Gypsum adjusted EBITDA4 $126 $105 $21 Ceilings adjusted EBITDA4 $29 $28 $1 Distribution adjusted EBITDA4 $12 $7 $5 USG's share of USG Boral Building Products adjusted EBITDA5 $23 $15 $8 Corporate and eliminations adjusted EBITDA4 ($21) ($19) ($2) USG Consolidated Adjusted EBITDA4 $169 $136 $33 1. See a full reconciliation to GAAP operating profit on slide 18. 2. See a full reconciliation to GAAP income from equity method investments on slide 22. 3. Depreciation, depletion and amortization for Corporate and Eliminations excludes amortization of debt discount which is included in interest expense. QUARTERLY SUMMARY 4. See the reconciliation on slide 20. 5. See reconciliation to USG Boral net income on slide 23. 16
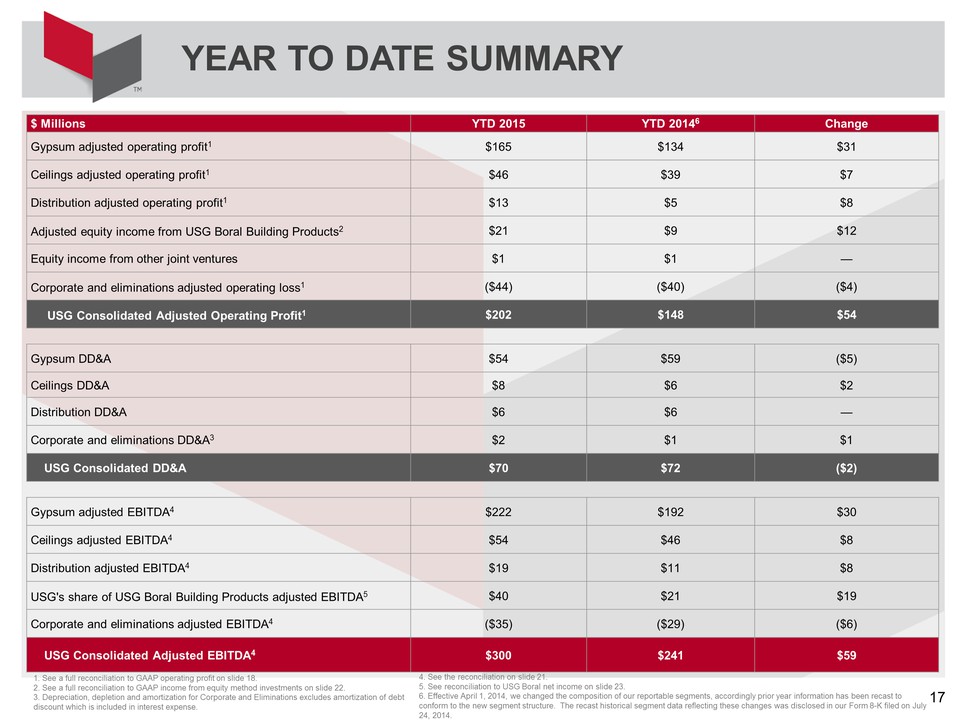
YEAR TO DATE SUMMARY $ Millions YTD 2015 YTD 20146 Change Gypsum adjusted operating profit1 $165 $134 $31 Ceilings adjusted operating profit1 $46 $39 $7 Distribution adjusted operating profit1 $13 $5 $8 Adjusted equity income from USG Boral Building Products2 $21 $9 $12 Equity income from other joint ventures $1 $1 — Corporate and eliminations adjusted operating loss1 ($44) ($40) ($4) USG Consolidated Adjusted Operating Profit1 $202 $148 $54 Gypsum DD&A $54 $59 ($5) Ceilings DD&A $8 $6 $2 Distribution DD&A $6 $6 — Corporate and eliminations DD&A3 $2 $1 $1 USG Consolidated DD&A $70 $72 ($2) Gypsum adjusted EBITDA4 $222 $192 $30 Ceilings adjusted EBITDA4 $54 $46 $8 Distribution adjusted EBITDA4 $19 $11 $8 USG's share of USG Boral Building Products adjusted EBITDA5 $40 $21 $19 Corporate and eliminations adjusted EBITDA4 ($35) ($29) ($6) USG Consolidated Adjusted EBITDA4 $300 $241 $59 1. See a full reconciliation to GAAP operating profit on slide 18. 2. See a full reconciliation to GAAP income from equity method investments on slide 22. 3. Depreciation, depletion and amortization for Corporate and Eliminations excludes amortization of debt discount which is included in interest expense. YEAR TO DATE SUMMARY 4. See the reconciliation on slide 21. 5. See reconciliation to USG Boral net income on slide 23. 6. Effective April 1, 2014, we changed the composition of our reportable segments, accordingly prior year information has been recast to conform to the new segment structure. The recast historical segment data reflecting these changes was disclosed in our Form 8-K filed on July 24, 2014. 17
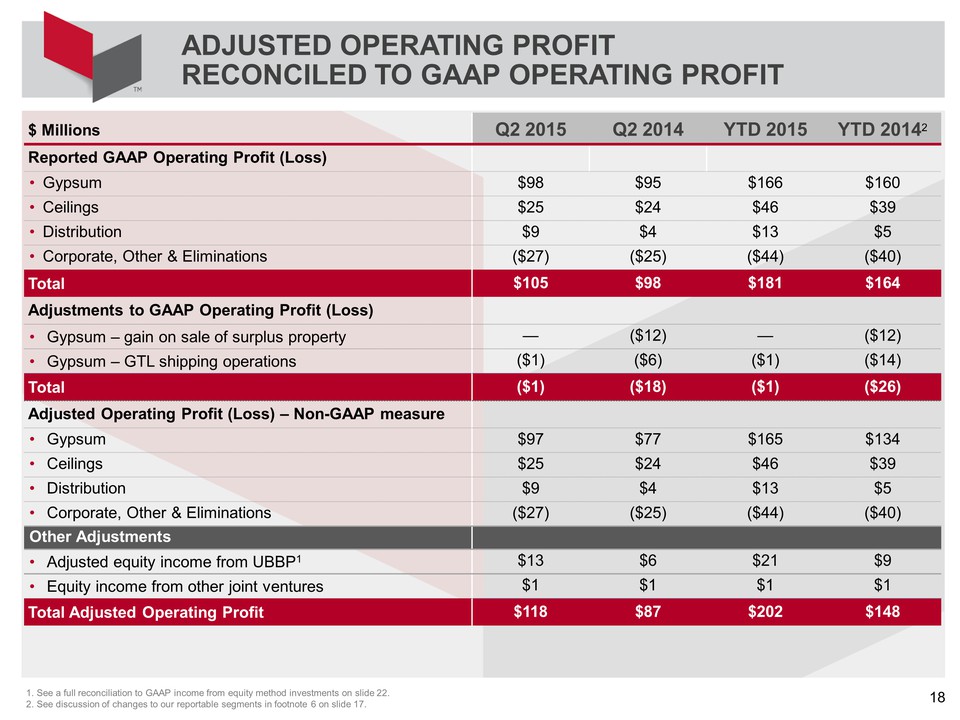
ADJUSTED OPERATING PROFIT RECONCILED TO GAAP OPERATING PROFIT $ Millions Q2 2015 Q2 2014 YTD 2015 YTD 20142 Reported GAAP Operating Profit (Loss) • Gypsum $98 $95 $166 $160 • Ceilings $25 $24 $46 $39 • Distribution $9 $4 $13 $5 • Corporate, Other & Eliminations ($27) ($25) ($44) ($40) Total $105 $98 $181 $164 Adjustments to GAAP Operating Profit (Loss) • Gypsum – gain on sale of surplus property — ($12) — ($12) • Gypsum – GTL shipping operations ($1) ($6) ($1) ($14) Total ($1) ($18) ($1) ($26) Adjusted Operating Profit (Loss) – Non-GAAP measure • Gypsum $97 $77 $165 $134 • Ceilings $25 $24 $46 $39 • Distribution $9 $4 $13 $5 • Corporate, Other & Eliminations ($27) ($25) ($44) ($40) Other Adjustments • Adjusted equity income from UBBP1 $13 $6 $21 $9 • Equity income from other joint ventures $1 $1 $1 $1 Total Adjusted Operating Profit $118 $87 $202 $148 1. See a full reconciliation to GAAP income from equity method investments on slide 22. 2. See discussion of changes to our reportable segments in footnote 6 on slide 17. 18
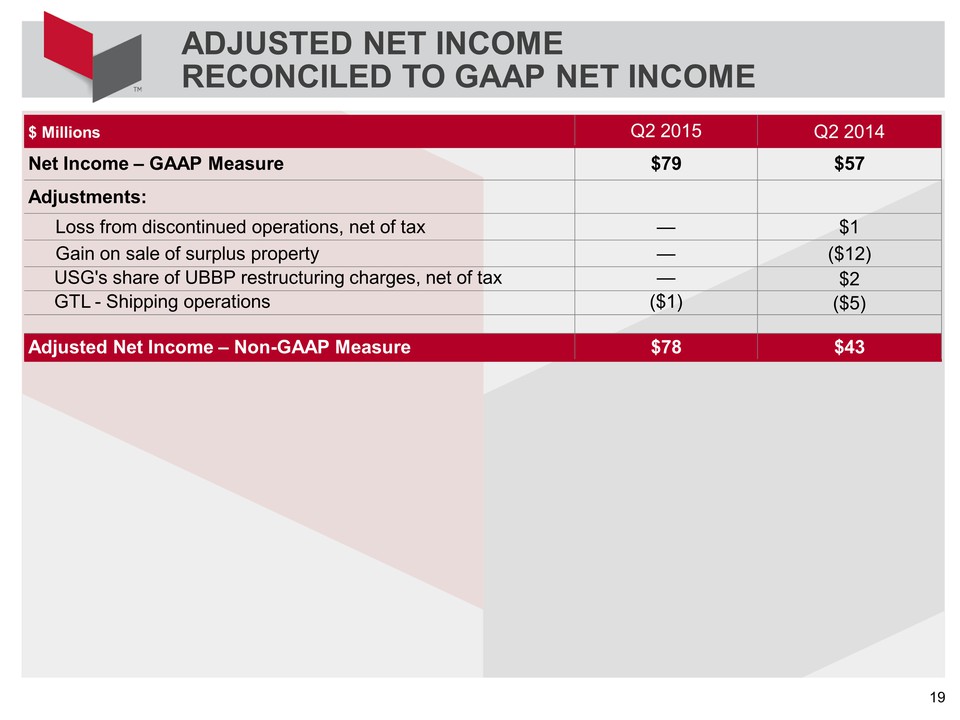
ADJUSTED NET INCOME RECONCILED TO GAAP NET INCOME $ Millions Q2 2015 Q2 2014 Net Income – GAAP Measure $79 $57 Adjustments: Loss from discontinued operations, net of tax — $1 Gain on sale of surplus property — ($12) USG's share of UBBP restructuring charges, net of tax — $2 GTL - Shipping operations ($1) ($5) Adjusted Net Income – Non-GAAP Measure $78 $43 19
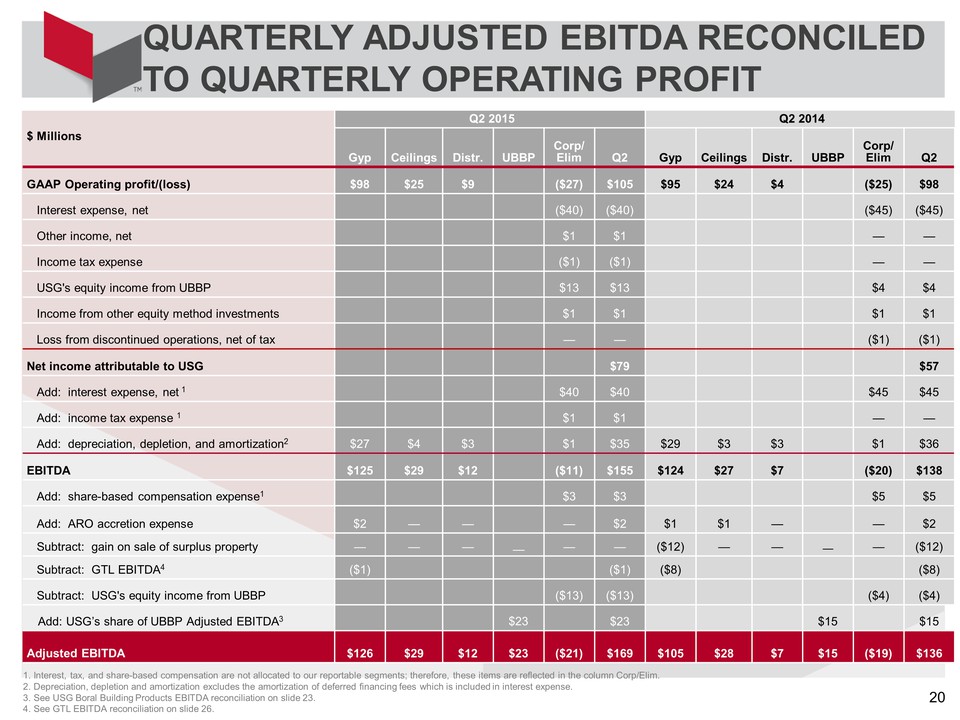
QUARTERLY ADJUSTED EBITDA RECONCILED TO QUARTERLY OPERATING PROFIT 20 Q2 2015 Q2 2014 $ Millions Gyp Ceilings Distr. UBBP Corp/ Elim Q2 Gyp Ceilings Distr. UBBP Corp/ Elim Q2 GAAP Operating profit/(loss) $98 $25 $9 ($27) $105 $95 $24 $4 ($25) $98 Interest expense, net ($40) ($40) ($45) ($45) Other income, net $1 $1 — — Income tax expense ($1) ($1) — — USG's equity income from UBBP $13 $13 $4 $4 Income from other equity method investments $1 $1 $1 $1 Loss from discontinued operations, net of tax — — ($1) ($1) Net income attributable to USG $79 $57 Add: interest expense, net 1 $40 $40 $45 $45 Add: income tax expense 1 $1 $1 — — Add: depreciation, depletion, and amortization2 $27 $4 $3 $1 $35 $29 $3 $3 $1 $36 EBITDA $125 $29 $12 ($11) $155 $124 $27 $7 ($20) $138 Add: share-based compensation expense1 $3 $3 $5 $5 Add: ARO accretion expense $2 — — — $2 $1 $1 — — $2 Subtract: gain on sale of surplus property — — — — — — ($12) — — — — ($12) Subtract: GTL EBITDA4 ($1) ($1) ($8) ($8) Subtract: USG's equity income from UBBP ($13) ($13) ($4) ($4) Add: USG’s share of UBBP Adjusted EBITDA3 $23 $23 $15 $15 Adjusted EBITDA $126 $29 $12 $23 ($21) $169 $105 $28 $7 $15 ($19) $136 1. Interest, tax, and share-based compensation are not allocated to our reportable segments; therefore, these items are reflected in the column Corp/Elim. 2. Depreciation, depletion and amortization excludes the amortization of deferred financing fees which is included in interest expense. 3. See USG Boral Building Products EBITDA reconciliation on slide 23. 4. See GTL EBITDA reconciliation on slide 26.
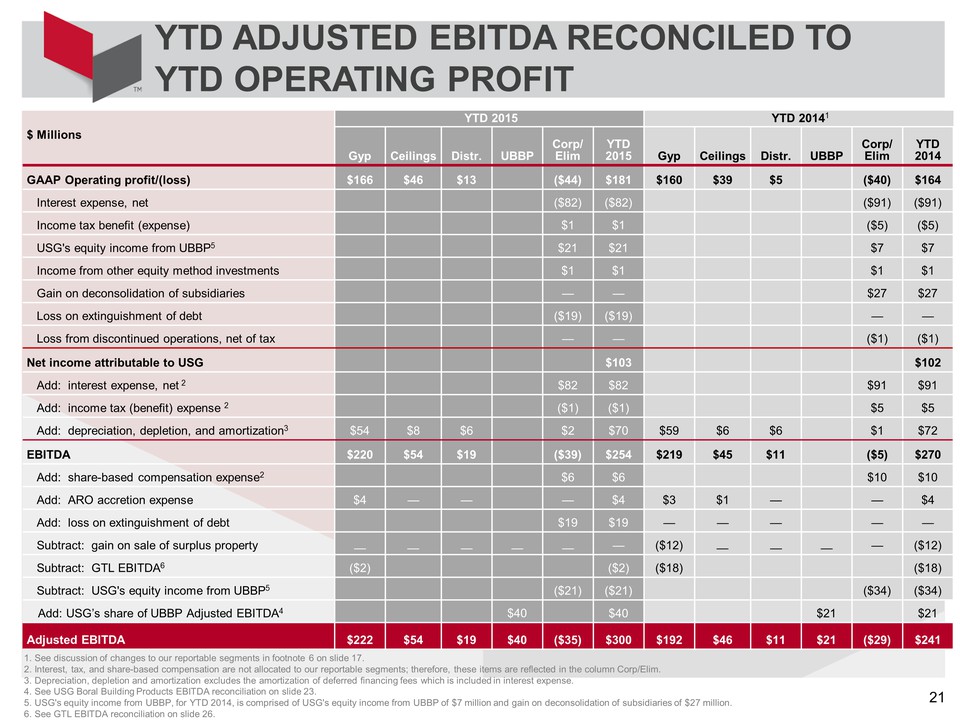
YTD ADJUSTED EBITDA RECONCILED TO YTD OPERATING PROFIT 21 YTD 2015 YTD 20141 $ Millions Gyp Ceilings Distr. UBBP Corp/ Elim YTD 2015 Gyp Ceilings Distr. UBBP Corp/ Elim YTD 2014 GAAP Operating profit/(loss) $166 $46 $13 ($44) $181 $160 $39 $5 ($40) $164 Interest expense, net ($82) ($82) ($91) ($91) Income tax benefit (expense) $1 $1 ($5) ($5) USG's equity income from UBBP5 $21 $21 $7 $7 Income from other equity method investments $1 $1 $1 $1 Gain on deconsolidation of subsidiaries — — $27 $27 Loss on extinguishment of debt ($19) ($19) — — Loss from discontinued operations, net of tax — — ($1) ($1) Net income attributable to USG $103 $102 Add: interest expense, net 2 $82 $82 $91 $91 Add: income tax (benefit) expense 2 ($1) ($1) $5 $5 Add: depreciation, depletion, and amortization3 $54 $8 $6 $2 $70 $59 $6 $6 $1 $72 EBITDA $220 $54 $19 ($39) $254 $219 $45 $11 ($5) $270 Add: share-based compensation expense2 $6 $6 $10 $10 Add: ARO accretion expense $4 — — — $4 $3 $1 — — $4 Add: loss on extinguishment of debt $19 $19 — — — — — Subtract: gain on sale of surplus property — — — — — — ($12) — — — — ($12) Subtract: GTL EBITDA6 ($2) ($2) ($18) ($18) Subtract: USG's equity income from UBBP5 ($21) ($21) ($34) ($34) Add: USG’s share of UBBP Adjusted EBITDA4 $40 $40 $21 $21 Adjusted EBITDA $222 $54 $19 $40 ($35) $300 $192 $46 $11 $21 ($29) $241 1. See discussion of changes to our reportable segments in footnote 6 on slide 17. 2. Interest, tax, and share-based compensation are not allocated to our reportable segments; therefore, these items are reflected in the column Corp/Elim. 3. Depreciation, depletion and amortization excludes the amortization of deferred financing fees which is included in interest expense. 4. See USG Boral Building Products EBITDA reconciliation on slide 23. 5. USG's equity income from UBBP, for YTD 2014, is comprised of USG's equity income from UBBP of $7 million and gain on deconsolidation of subsidiaries of $27 million. 6. See GTL EBITDA reconciliation on slide 26.
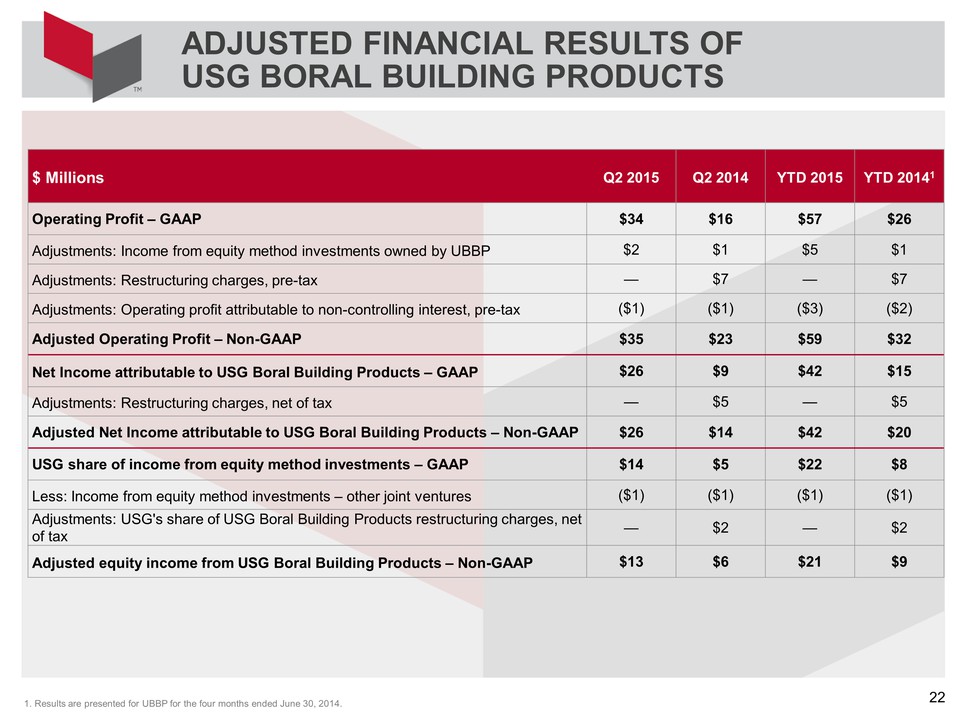
ADJUSTED FINANCIAL RESULTS OF USG BORAL BUILDING PRODUCTS 22 $ Millions Q2 2015 Q2 2014 YTD 2015 YTD 20141 Operating Profit – GAAP $34 $16 $57 $26 Adjustments: Income from equity method investments owned by UBBP $2 $1 $5 $1 Adjustments: Restructuring charges, pre-tax — $7 — $7 Adjustments: Operating profit attributable to non-controlling interest, pre-tax ($1) ($1) ($3) ($2) Adjusted Operating Profit – Non-GAAP $35 $23 $59 $32 Net Income attributable to USG Boral Building Products – GAAP $26 $9 $42 $15 Adjustments: Restructuring charges, net of tax — $5 — $5 Adjusted Net Income attributable to USG Boral Building Products – Non-GAAP $26 $14 $42 $20 USG share of income from equity method investments – GAAP $14 $5 $22 $8 Less: Income from equity method investments – other joint ventures ($1) ($1) ($1) ($1) Adjustments: USG's share of USG Boral Building Products restructuring charges, net of tax — $2 — $2 Adjusted equity income from USG Boral Building Products – Non-GAAP $13 $6 $21 $9 1. Results are presented for UBBP for the four months ended June 30, 2014.
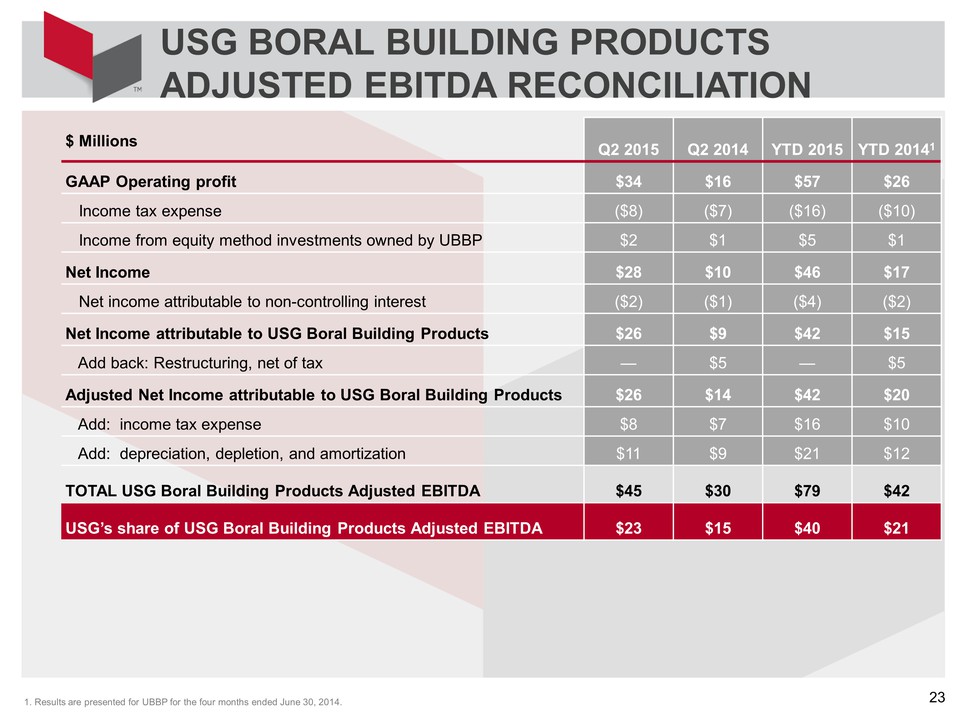
USG BORAL BUILDING PRODUCTS ADJUSTED EBITDA RECONCILIATION 23 $ Millions Q2 2015 Q2 2014 YTD 2015 YTD 20141 GAAP Operating profit $34 $16 $57 $26 Income tax expense ($8) ($7) ($16) ($10) Income from equity method investments owned by UBBP $2 $1 $5 $1 Net Income $28 $10 $46 $17 Net income attributable to non-controlling interest ($2) ($1) ($4) ($2) Net Income attributable to USG Boral Building Products $26 $9 $42 $15 Add back: Restructuring, net of tax — $5 — $5 Adjusted Net Income attributable to USG Boral Building Products $26 $14 $42 $20 Add: income tax expense $8 $7 $16 $10 Add: depreciation, depletion, and amortization $11 $9 $21 $12 TOTAL USG Boral Building Products Adjusted EBITDA $45 $30 $79 $42 USG’s share of USG Boral Building Products Adjusted EBITDA $23 $15 $40 $21 1. Results are presented for UBBP for the four months ended June 30, 2014.
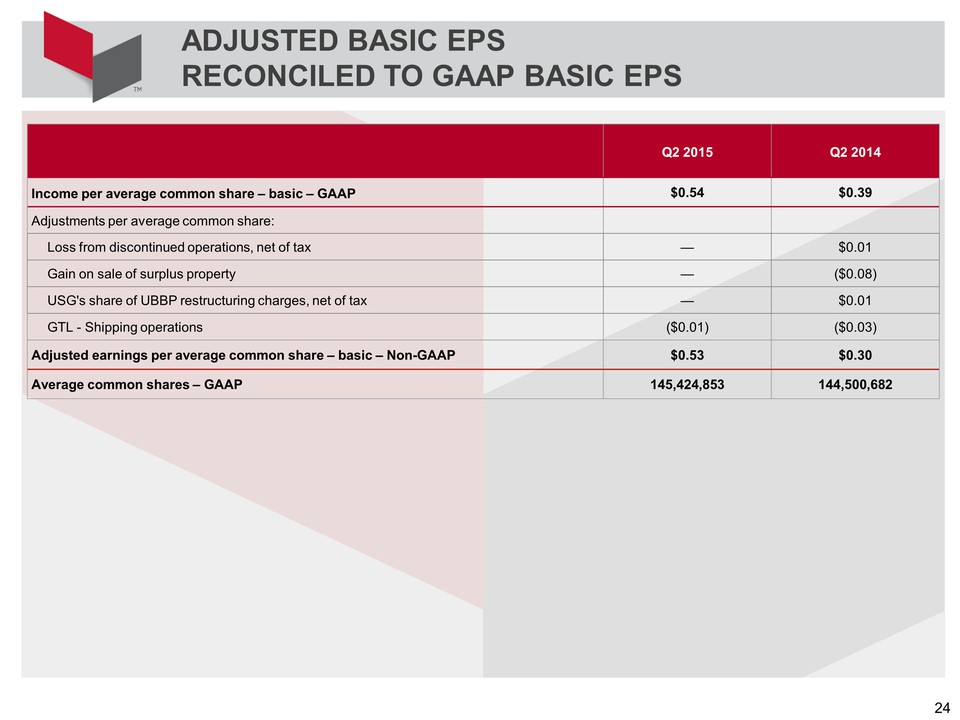
ADJUSTED BASIC EPS RECONCILED TO GAAP BASIC EPS Q2 2015 Q2 2014 Income per average common share – basic – GAAP $0.54 $0.39 Adjustments per average common share: Loss from discontinued operations, net of tax — $0.01 Gain on sale of surplus property — ($0.08) USG's share of UBBP restructuring charges, net of tax — $0.01 GTL - Shipping operations ($0.01) ($0.03) Adjusted earnings per average common share – basic – Non-GAAP $0.53 $0.30 Average common shares – GAAP 145,424,853 144,500,682 24
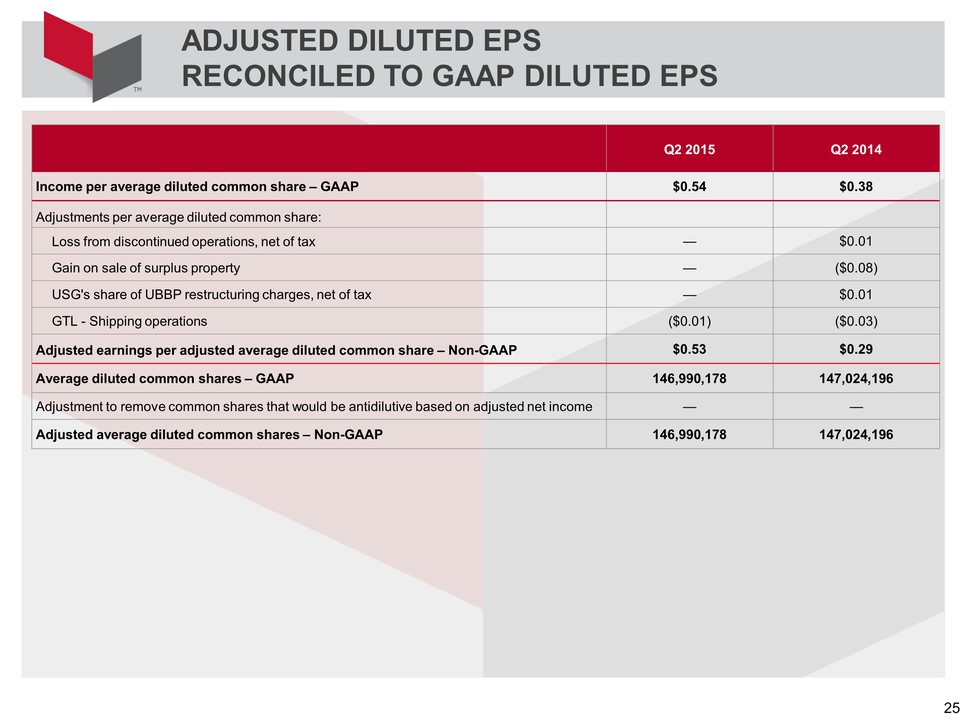
ADJUSTED DILUTED EPS RECONCILED TO GAAP DILUTED EPS Q2 2015 Q2 2014 Income per average diluted common share – GAAP $0.54 $0.38 Adjustments per average diluted common share: Loss from discontinued operations, net of tax — $0.01 Gain on sale of surplus property — ($0.08) USG's share of UBBP restructuring charges, net of tax — $0.01 GTL - Shipping operations ($0.01) ($0.03) Adjusted earnings per adjusted average diluted common share – Non-GAAP $0.53 $0.29 Average diluted common shares – GAAP 146,990,178 147,024,196 Adjustment to remove common shares that would be antidilutive based on adjusted net income — — Adjusted average diluted common shares – Non-GAAP 146,990,178 147,024,196 25
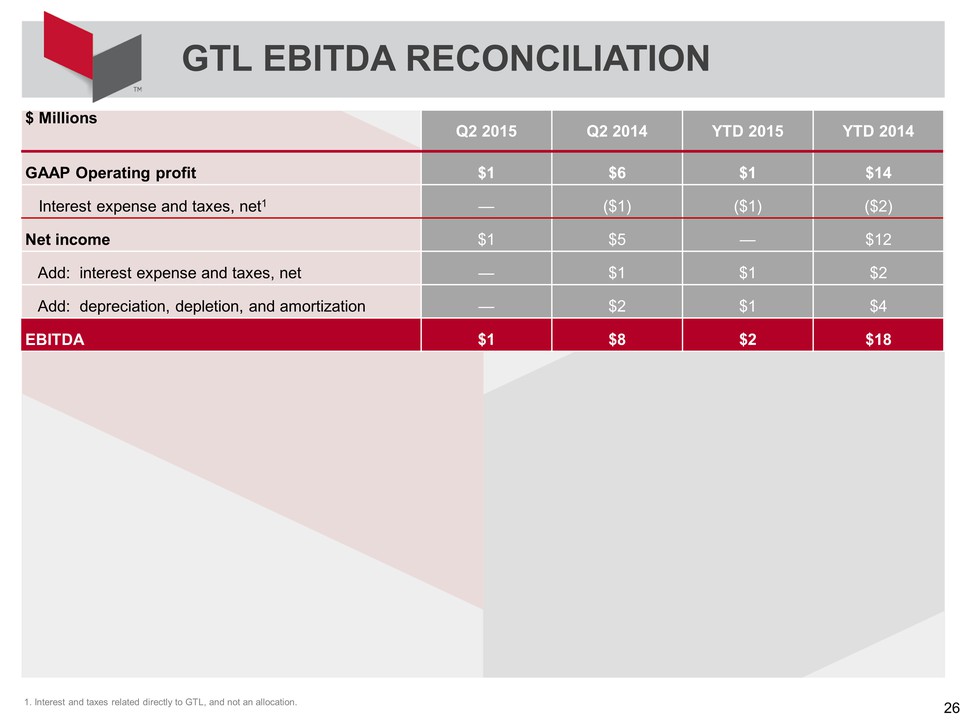
GTL EBITDA RECONCILIATION 26 $ Millions Q2 2015 Q2 2014 YTD 2015 YTD 2014 GAAP Operating profit $1 $6 $1 $14 Interest expense and taxes, net1 — ($1) ($1) ($2) Net income $1 $5 — $12 Add: interest expense and taxes, net — $1 $1 $2 Add: depreciation, depletion, and amortization — $2 $1 $4 EBITDA $1 $8 $2 $18 1. Interest and taxes related directly to GTL, and not an allocation.
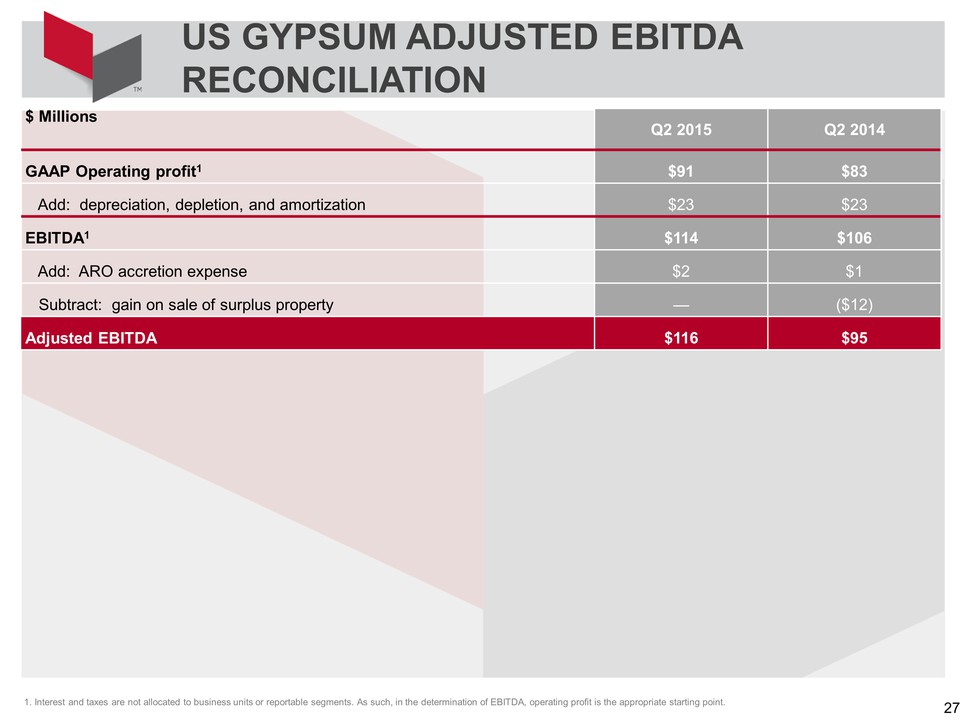
$ Millions Q2 2015 Q2 2014 GAAP Operating profit1 $91 $83 Add: depreciation, depletion, and amortization $23 $23 EBITDA1 $114 $106 Add: ARO accretion expense $2 $1 Subtract: gain on sale of surplus property — ($12) Adjusted EBITDA $116 $95 1. Interest and taxes are not allocated to business units or reportable segments. As such, in the determination of EBITDA, operating profit is the appropriate appropriate starting point.
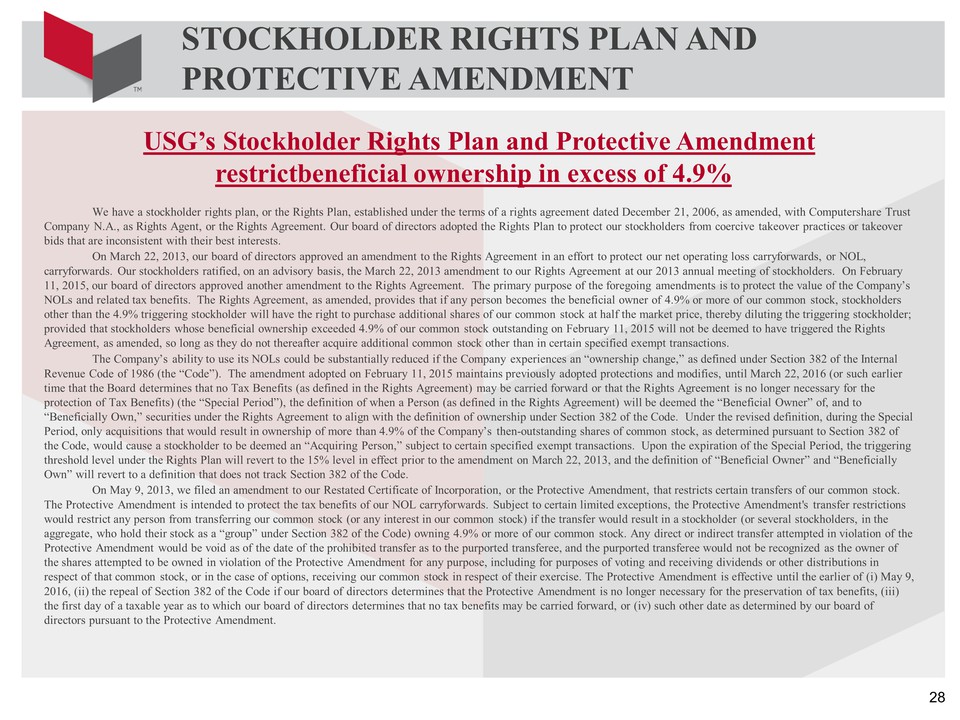
STOCKHOLDER RIGHTS PLAN AND PROTECTIVE AMENDMENT 28 USG’s Stockholder Rights Plan and Protective Amendment restrictbeneficial ownership in excess of 4.9% We have a stockholder rights plan, or the Rights Plan, established under the terms of a rights agreement dated December 21, 2006, as amended, with Computershare Trust Company N.A., as Rights Agent, or the Rights Agreement. Our board of directors adopted the Rights Plan to protect our stockholders from coercive takeover practices or takeover bids that are inconsistent with their best interests. On March 22, 2013, our board of directors approved an amendment to the Rights Agreement in an effort to protect our net operating loss carryforwards, or NOL, carryforwards. Our stockholders ratified, on an advisory basis, the March 22, 2013 amendment to our Rights Agreement at our 2013 annual meeting of stockholders. On February 11, 2015, our board of directors approved another amendment to the Rights Agreement. The primary purpose of the foregoing amendments is to protect the value of the Company’s NOLs and related tax benefits. The Rights Agreement, as amended, provides that if any person becomes the beneficial owner of 4.9% or more of our common stock, stockholders other than the 4.9% triggering stockholder will have the right to purchase additional shares of our common stock at half the market price, thereby diluting the triggering stockholder; provided that stockholders whose beneficial ownership exceeded 4.9% of our common stock outstanding on February 11, 2015 will not be deemed to have triggered the Rights Agreement, as amended, so long as they do not thereafter acquire additional common stock other than in certain specified exempt transactions. The Company’s ability to use its NOLs could be substantially reduced if the Company experiences an “ownership change,” as defined under Section 382 of the Internal Revenue Code of 1986 (the “Code”). The amendment adopted on February 11, 2015 maintains previously adopted protections and modifies, until March 22, 2016 (or such earlier time that the Board determines that no Tax Benefits (as defined in the Rights Agreement) may be carried forward or that the Rights Agreement is no longer necessary for the protection of Tax Benefits) (the “Special Period”), the definition of when a Person (as defined in the Rights Agreement) will be deemed the “Beneficial Owner” of, and to “Beneficially Own,” securities under the Rights Agreement to align with the definition of ownership under Section 382 of the Code. Under the revised definition, during the Special Period, only acquisitions that would result in ownership of more than 4.9% of the Company’s then-outstanding shares of common stock, as determined pursuant to Section 382 of the Code, would cause a stockholder to be deemed an “Acquiring Person,” subject to certain specified exempt transactions. Upon the expiration of the Special Period, the triggering threshold level under the Rights Plan will revert to the 15% level in effect prior to the amendment on March 22, 2013, and the definition of “Beneficial Owner” and “Beneficially Own” will revert to a definition that does not track Section 382 of the Code. On May 9, 2013, we filed an amendment to our Restated Certificate of Incorporation, or the Protective Amendment, that restricts certain transfers of our common stock. The Protective Amendment is intended to protect the tax benefits of our NOL carryforwards. Subject to certain limited exceptions, the Protective Amendment's transfer restrictions would restrict any person from transferring our common stock (or any interest in our common stock) if the transfer would result in a stockholder (or several stockholders, in the aggregate, who hold their stock as a “group” under Section 382 of the Code) owning 4.9% or more of our common stock. Any direct or indirect transfer attempted in violation of the Protective Amendment would be void as of the date of the prohibited transfer as to the purported transferee, and the purported transferee would not be recognized as the owner of the shares attempted to be owned in violation of the Protective Amendment for any purpose, including for purposes of voting and receiving dividends or other distributions in respect of that common stock, or in the case of options, receiving our common stock in respect of their exercise. The Protective Amendment is effective until the earlier of (i) May 9, 2016, (ii) the repeal of Section 382 of the Code if our board of directors determines that the Protective Amendment is no longer necessary for the preservation of tax benefits, (iii) the first day of a taxable year as to which our board of directors determines that no tax benefits may be carried forward, or (iv) such other date as determined by our board of directors pursuant to the Protective Amendment
Serious News for Serious Traders! Try StreetInsider.com Premium Free!
You May Also Be Interested In
- Cal-Pacific Builders Addresses Coastal Roofing Needs Across 11 South Bay Cities
- WentRogue Announces Public Experiment on Rogue AI Claims
- Corboy & Demetrio files Lawsuit for Family of Frankfort Girl Killed by School Bus
Create E-mail Alert Related Categories
SEC FilingsSign up for StreetInsider Free!
Receive full access to all new and archived articles, unlimited portfolio tracking, e-mail alerts, custom newswires and RSS feeds - and more!
