

Form 8-K TripAdvisor, Inc. For: Aug 04
 Tweet
Tweet Share
Share
UNITED STATES
SECURITIES AND EXCHANGE COMMISSION
WASHINGTON, D.C. 20549
FORM
CURRENT REPORT
Pursuant to Section 13 or 15(d) of the Securities Exchange Act of 1934
Date of Report (Date of earliest event reported):
(Exact name of Registrant as Specified in Its Charter)
(State or Other Jurisdiction of Incorporation) |
(Commission File Number) |
(IRS Employer Identification No.) |
|
|
|
(Address of Principal Executive Offices) (Zip Code) |
||
(
Registrant’s Telephone Number, Including Area Code
Not Applicable
(Former Name or Former Address, if Changed Since Last Report)
Check the appropriate box below if the Form 8-K filing is intended to simultaneously satisfy the filing obligation of the registrant under any of the following provisions:
Written communications pursuant to Rule 425 under the Securities Act (17 CFR 230.425) |
|
Soliciting material pursuant to Rule 14a-12 under the Exchange Act (17 CFR 240.14a-12) |
|
Pre-commencement communications pursuant to Rule 14d-2(b) under the Exchange Act (17 CFR 240.14d-2(b)) |
|
Pre-commencement communications pursuant to Rule 13e-4(c) under the Exchange Act (17 CFR 240.13e-4(c)) |
Securities registered pursuant to Section 12(b) of the Act:
Title of each class |
|
Trading Symbol(s) |
|
Name of each exchange on which registered |
|
|
Indicate by check mark whether the registrant is an emerging growth company as defined in Rule 405 of the Securities Act of 1933 (§ 230.405 of this chapter) or Rule 12b-2 of the Securities Exchange Act of 1934 (§ 240.12b-2 of this chapter).
Emerging growth company
If an emerging growth company, indicate by check mark if the registrant has elected not to use the extended transition period for complying with any new or revised financial accounting standards provided pursuant to Section 13(a) of the Exchange Act. ☐
Item 2.02. |
Results of Operations and Financial Condition. |
On August 4, 2022, Tripadvisor, Inc. issued a press release announcing its preliminary financial results for the three and six months ended June 30, 2022. Tripadvisor, Inc. also posted a letter to shareholders from Matt Goldberg, Chief Executive Officer, and Ernst Teunissen, Chief Financial Officer, on the “Investor Relations” section of its website at http://ir.tripadvisor.com/events-and-presentations. The full text of this press release and letter are furnished as Exhibits 99.1 and 99.2 to this Current Report on Form 8-K.
Pursuant to General Instruction B.2. to Form 8-K, the information set forth in Items 2.02 and Exhibit 99.1 and 99.2 shall not be deemed “filed” for purposes of Section 18 of the Securities Exchange Act of 1934, as amended (the “Exchange Act”), or otherwise subject to the liabilities of that section, nor shall they be incorporated by reference in any filing under the Securities Act of 1933, as amended (the “Securities Act”), or the Exchange Act, except as expressly set forth by specific reference in such a filing.
Item 7.01. |
Regulation FD Disclosure. |
During the second quarter of 2022, as part of our continuous review of the business and in consultation with our new Chief Executive Officer ("CEO"), we evaluated our operations and realigned the reportable segment information which our chief operating decision maker ("CODM") regularly assesses to evaluate performance for operating decision-making purposes, including allocation of resources. The CODM for the Company is our CEO. The revised segment reporting structure includes the following reportable segments: (1) Tripadvisor Core; (2) Viator; and (3) TheFork.
All prior period segment disclosure information in Exhibit 99.1 and Exhibit 99.2 to this Form 8-K filed August 4, 2022 has been reclassified to conform to the current reporting structure. These reclassifications had no effect on our unaudited condensed consolidated financial statements in any period. We have included comparative figures by recasting summary historical results for the quarters within and for the years ended December 31, 2021, 2020, and 2019, and the quarter ended March 31, 2022, on a segment basis as Exhibit 99.3 on this Form 8-K filed August 4, 2022.
Item 9.01. Financial Statements and Exhibits.
(d) Exhibits.
Exhibit |
|
|
Number |
|
Description |
|
|
|
99.1 |
|
Press Release of Tripadvisor, Inc. dated August 4, 2022 regarding earnings. |
|
|
|
99.2 |
|
|
|
|
|
99.3 |
|
Memo regarding Changes in Segment Information dated August 4, 2022. |
|
|
|
104 |
|
Cover Page Interactive Data File (embedded within the Inline XBRL document). |
SIGNATURES
Pursuant to the requirements of the Securities Exchange Act of 1934, the registrant has duly caused this report to be signed on its behalf by the undersigned hereunto duly authorized.
|
|
|
|
|
|
|
|
Date: August 4, 2022 |
|
By: |
/S/ ERNST TEUNISSEN |
|
|
|
Ernst Teunissen |
|
|
|
Chief Financial Officer |
Exhibit 99.1

Tripadvisor Reports Second Quarter 2022 Financial Results
NEEDHAM, MA, August 4, 2022 — Tripadvisor, Inc. (Nasdaq: TRIP) today announced financial results for the second quarter ended June 30, 2022.
“I am pleased with our Q2 2022 performance across all segments, which continued to see robust improvement due to the strong demand in leisure travel, our position as a trusted resource for travelers, diners, and experience seekers, and the excellent execution across our teams,” said Chief Executive Officer Matt Goldberg. “I join the Company at an exciting time in travel, and look forward to delivering on our plan for the remainder of the year, while charting our course for the future. I am enthusiastic about building from such a strong foundation as we look to provide additional value to travelers and our partners.”
Chief Financial Officer Ernst Teunissen continued, “Momentum continued in Q2, and we outperformed our expectations. Our strong performance was driven by high growth rates in Viator and TheFork, and the continued recovery in our hotels business. Our results give us confidence that our investment plan, which balances growth and margin expansion, is working to capture share in key strategic growth areas, and demonstrates the value we are driving for customers across categories. We believe our new segment reporting will provide investors additional insight into the underlying value of our growth assets.”
The following summarizes the second quarter of 2022 results under our new segment reporting structure. For additional information on our reportable segments, please see the narrative below captioned "Changes in Segment Information."
Second Quarter 2022 Summary
|
|
Three months ended June 30, |
|
|
|
||||||
(In millions, except percentages and per share amounts) |
|
2022 |
|
|
2021 |
|
% Change |
|
|||
Total Revenue |
|
$ |
417 |
|
|
$ |
235 |
|
|
77 |
% |
Tripadvisor Core (1) |
|
$ |
274 |
|
|
$ |
184 |
|
|
49 |
% |
Viator |
|
$ |
136 |
|
|
$ |
40 |
|
|
240 |
% |
TheFork |
|
$ |
32 |
|
|
$ |
18 |
|
|
78 |
% |
Intersegment eliminations (1) |
|
$ |
(25 |
) |
|
$ |
(7 |
) |
|
257 |
% |
|
|
|
|
|
|
|
|
|
|||
GAAP Net Income (Loss) |
|
$ |
31 |
|
|
$ |
(40 |
) |
n.m. |
|
|
|
|
|
|
|
|
|
|
|
|||
Total Adjusted EBITDA (2) |
|
$ |
109 |
|
|
$ |
25 |
|
|
336 |
% |
Tripadvisor Core |
|
$ |
116 |
|
|
$ |
49 |
|
|
137 |
% |
Viator |
|
$ |
— |
|
|
$ |
(13 |
) |
n.m. |
|
|
TheFork |
|
$ |
(7 |
) |
|
$ |
(11 |
) |
|
(36 |
)% |
|
|
|
|
|
|
|
|
|
|||
Non-GAAP Net Income (Loss) (2) |
|
$ |
54 |
|
|
$ |
(10 |
) |
n.m. |
|
|
|
|
|
|
|
|
|
|
|
|||
Diluted Earnings (Loss) per Share: |
|
|
|
|
|
|
|
|
|||
GAAP |
|
$ |
0.21 |
|
|
$ |
(0.29 |
) |
n.m. |
|
|
Non-GAAP (2) |
|
$ |
0.37 |
|
|
$ |
(0.07 |
) |
n.m. |
|
|
|
|
|
|
|
|
|
|
|
|||
Cash flow from operating activities |
|
$ |
295 |
|
|
$ |
126 |
|
|
134 |
% |
Free cash flow (2) |
|
$ |
282 |
|
|
$ |
112 |
|
|
152 |
% |
n.m. = not meaningful
1
Monthly unique users – During the second quarter of 2022, average monthly unique users on Tripadvisor-branded websites, a leading indicator of consumer travel demand, increased 19% year-over-year and was approximately 83% of the comparable period in 2019 (pre-COVID-19 timeframe), as compared to approximately 70% of the comparable period in 2019 in Q2 2021.
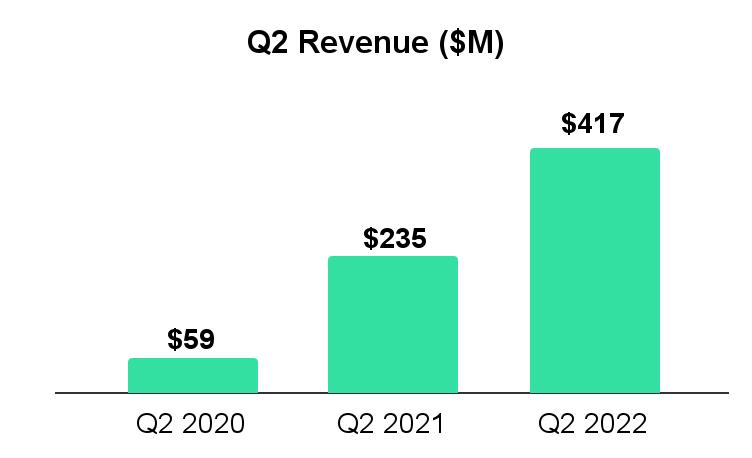
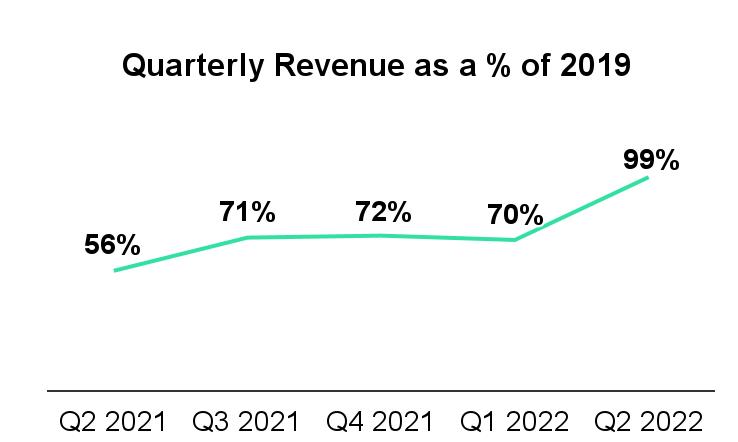
Revenue – Q2 2022 total revenue of $417 million increased 77% year-over-year and nearly reached parity with the comparable period in 2019 (pre-COVID-19 timeframe), as compared to 56% of the comparable period in 2019 in Q2 2021. Improvement during the second quarter of 2022 was primarily driven by increased consumer demand for travel industry related services, as well as continued easing of government travel restrictions.
Cost performance – Total operating expenses were $354 million for the second quarter, an increase of 31% year-over-year, primarily driven by the following:
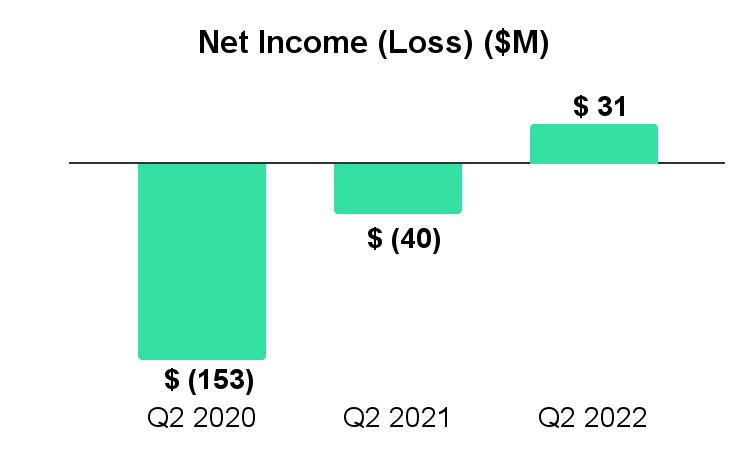
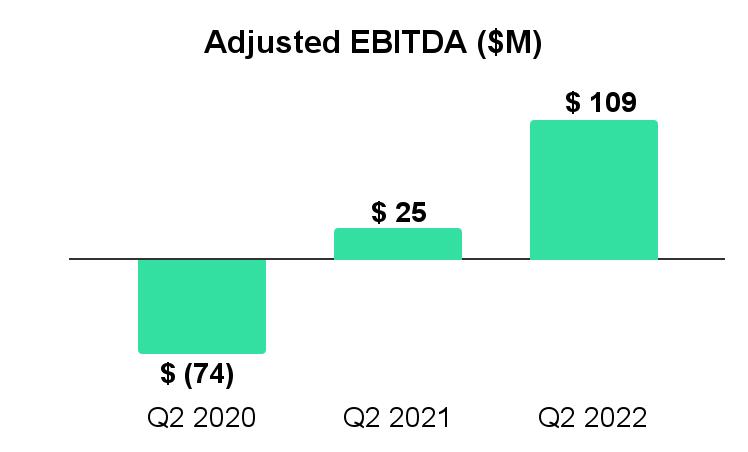
Profitability – Q2 2022 consolidated net income of $31 million improved from a net loss of $40 million in Q2 2021, primarily driven by an increase in consolidated revenue. Q2 2022 Adjusted EBITDA of $109 million improved from Adjusted EBITDA of $25 million in Q2 2021.
Cash & Liquidity – As of June 30, 2022, the Company had $1.05 billion of cash and cash equivalents, an increase of $322 million from December 31, 2021, driven by operating cashflows.
Changes in Segment Information
During the second quarter of 2022, as part of our continuous review of the business and in consultation with our new Chief Executive Officer ("CEO"), we evaluated our operations and realigned the reportable segment information which our chief operating decision maker (“CODM”) regularly assesses to evaluate performance for operating decision-making purposes, including allocation of resources. The CODM for the Company is our CEO.
As a result of this segment realignment, effective for the quarter ended June 30, 2022, the Company has the following reportable segments:
2
Direct costs are included in the applicable operating segments, including certain corporate general and administrative personnel costs, which have been allocated to each segment. We do not allocate certain shared expenses to our reportable segments, such as certain information system costs, technical infrastructure costs, and other costs supporting the Tripadvisor platform and operations, that we do not believe are a material driver of individual segment performance. We include these expenses in our Tripadvisor Core segment. This is consistent with the financial information viewed by our CODM.
All prior period segment disclosure information in this press release has been reclassified to conform to the current segment reporting structure. These reclassifications had no effect on our unaudited condensed consolidated financial statements in any period. We have included comparative figures by recasting summary historical results for the quarters within and for the years ended December 31, 2021, 2020, and 2019, and the quarter ended March 31, 2022, on a segment basis as Exhibit 99.3 to our Form 8-K filed August 4, 2022.
Second Quarter 2022 Revenue by Source
|
|
Three months ended June 30, |
|
|
|
||||||
(In millions, except percentages) |
|
2022 |
|
|
2021 |
|
% Change |
|
|||
Tripadvisor Core |
|
|
|
|
|
|
|
|
|||
Tripadvisor-branded hotels |
|
$ |
188 |
|
|
$ |
131 |
|
|
44 |
% |
Tripadvisor-branded display and platform |
|
|
37 |
|
|
|
26 |
|
|
42 |
% |
Tripadvisor experiences and dining (1) |
|
|
35 |
|
|
|
16 |
|
|
119 |
% |
Other |
|
|
14 |
|
|
|
11 |
|
|
27 |
% |
Total Tripadvisor Core Revenue |
|
|
274 |
|
|
|
184 |
|
|
49 |
% |
|
|
|
|
|
|
|
|
|
|||
Viator |
|
|
136 |
|
|
|
40 |
|
|
240 |
% |
TheFork |
|
|
32 |
|
|
|
18 |
|
|
78 |
% |
Intersegment eliminations (1) |
|
|
(25 |
) |
|
|
(7 |
) |
|
257 |
% |
Total Revenue |
|
$ |
417 |
|
|
$ |
235 |
|
|
77 |
% |
3
Conference Call
Tripadvisor posted prepared remarks and supplemental financial information on the Investor Relations section of Tripadvisor’s website at http://ir.tripadvisor.com. Tripadvisor will host a conference call tomorrow, August 5, 2022, at 8:30 a.m., Eastern Time, to discuss the Company’s second quarter 2022 financial results, and which may include forward looking information about Tripadvisor’s business. Investors and other interested parties may also go to the Investor Relations section of Tripadvisor’s website at http://ir.tripadvisor.com for a live webcast of the conference call. A replay of the conference call will be available on Tripadvisor’s website for three months.
About Tripadvisor
Tripadvisor, the world's largest travel guidance platform*, helps hundreds of millions of people each month** become better travelers, from planning to booking to taking a trip. Travelers across the globe use the Tripadvisor site and app to discover where to stay, what to do and where to eat based on guidance from those who have been there before. With more than 1 billion reviews and opinions of nearly 8 million businesses, travelers turn to Tripadvisor to find deals on accommodations, book experiences, reserve tables at delicious restaurants and discover great places nearby. As a travel guidance company available in 43 markets and 22 languages, Tripadvisor makes planning easy no matter the trip type.
The subsidiaries of Tripadvisor, Inc. (Nasdaq: TRIP), own and operate a portfolio of travel media brands and businesses, operating under various websites and apps, including the following websites: www.bokun.io, www.cruisecritic.com, www.flipkey.com, www.thefork.com, www.helloreco.com, www.holidaylettings.co.uk, www.housetrip.com, www.jetsetter.com, www.niumba.com,www.seatguru.com, www.singleplatform.com, www.vacationhomerentals.com, and www.viator.com.
* Source: SimilarWeb, unique users de-duplicated monthly, June 2022
** Source: Tripadvisor internal log files
4
Tripadvisor, Inc.
SELECTED FINANCIAL INFORMATION
Unaudited Condensed Consolidated Statements of Operations
(in millions, except per share amounts)
|
|
Three Months Ended |
|
|
Six Months Ended |
|
||||||||||
|
|
June 30, 2022 |
|
|
June 30, 2021 |
|
|
June 30, 2022 |
|
|
June 30, 2021 |
|
||||
Revenue |
|
$ |
417 |
|
|
$ |
235 |
|
|
$ |
679 |
|
|
$ |
358 |
|
|
|
|
|
|
|
|
|
|
|
|
|
|
||||
Costs and expenses: |
|
|
|
|
|
|
|
|
|
|
|
|
||||
Cost of revenue (1) (exclusive of depreciation and amortization as shown separately below) |
|
|
31 |
|
|
|
19 |
|
|
|
53 |
|
|
|
31 |
|
Selling and marketing (1) |
|
|
217 |
|
|
|
123 |
|
|
|
357 |
|
|
|
196 |
|
Technology and content (1) |
|
|
53 |
|
|
|
54 |
|
|
|
107 |
|
|
|
109 |
|
General and administrative (1) |
|
|
28 |
|
|
|
46 |
|
|
|
68 |
|
|
|
84 |
|
Depreciation and amortization |
|
|
25 |
|
|
|
28 |
|
|
|
50 |
|
|
|
57 |
|
Total costs and expenses |
|
|
354 |
|
|
|
270 |
|
|
|
635 |
|
|
|
477 |
|
Operating income (loss) |
|
|
63 |
|
|
|
(35 |
) |
|
|
44 |
|
|
|
(119 |
) |
Other income (expense): |
|
|
|
|
|
|
|
|
|
|
|
|
||||
Interest expense |
|
|
(11 |
) |
|
|
(11 |
) |
|
|
(23 |
) |
|
|
(22 |
) |
Interest income and other, net |
|
|
1 |
|
|
|
— |
|
|
|
— |
|
|
|
— |
|
Total other income (expense), net |
|
|
(10 |
) |
|
|
(11 |
) |
|
|
(23 |
) |
|
|
(22 |
) |
Income (loss) before income taxes |
|
|
53 |
|
|
|
(46 |
) |
|
|
21 |
|
|
|
(141 |
) |
(Provision) benefit for income taxes |
|
|
(22 |
) |
|
|
6 |
|
|
|
(24 |
) |
|
|
21 |
|
Net income (loss) |
|
$ |
31 |
|
|
$ |
(40 |
) |
|
$ |
(3 |
) |
|
$ |
(120 |
) |
|
|
|
|
|
|
|
|
|
|
|
|
|
||||
Earnings (loss) per share attributable to common stockholders: |
|
|
|
|
|
|
|
|
|
|
|
|
||||
Basic |
|
$ |
0.22 |
|
|
$ |
(0.29 |
) |
|
$ |
(0.02 |
) |
|
$ |
(0.88 |
) |
Diluted |
|
$ |
0.21 |
|
|
$ |
(0.29 |
) |
|
$ |
(0.02 |
) |
|
$ |
(0.88 |
) |
|
|
|
|
|
|
|
|
|
|
|
|
|
||||
Weighted average common shares outstanding: |
|
|
|
|
|
|
|
|
|
|
|
|
||||
Basic |
|
|
140 |
|
|
|
137 |
|
|
|
139 |
|
|
|
136 |
|
Diluted |
|
|
145 |
|
|
|
137 |
|
|
|
139 |
|
|
|
136 |
|
|
|
|
|
|
|
|
|
|
|
|
|
|
||||
|
|
|
|
|
|
|
|
|
|
|
|
|
||||
(1) Includes stock-based compensation expense as follows: |
|
|
|
|
|
|
|
|
|
|
|
|
||||
|
|
|
|
|
|
|
|
|
|
|
|
|
||||
Cost of revenue |
|
$ |
— |
|
|
$ |
— |
|
|
$ |
1 |
|
|
$ |
1 |
|
Selling and marketing |
|
$ |
3 |
|
|
$ |
4 |
|
|
$ |
6 |
|
|
$ |
8 |
|
Technology and content |
|
$ |
9 |
|
|
$ |
13 |
|
|
$ |
18 |
|
|
$ |
24 |
|
General and administrative |
|
$ |
9 |
|
|
$ |
15 |
|
|
$ |
18 |
|
|
$ |
28 |
|
5
Tripadvisor, Inc.
Unaudited Condensed Consolidated Balance Sheets
(in millions, except number of shares and per share amounts)
|
|
June 30, |
|
|
December 31, |
|
||
|
|
2022 |
|
|
2021 |
|
||
ASSETS |
|
|
|
|
|
|
||
Current assets: |
|
|
|
|
|
|
||
Cash and cash equivalents |
|
$ |
1,045 |
|
|
$ |
723 |
|
Accounts receivable and contract assets, net of allowance for credit losses of $29 and $28, respectively |
|
|
246 |
|
|
|
142 |
|
Income taxes receivable |
|
|
12 |
|
|
|
49 |
|
Prepaid expenses and other current assets |
|
|
34 |
|
|
|
26 |
|
Total current assets |
|
|
1,337 |
|
|
|
940 |
|
Property and equipment, net of accumulated depreciation of $497 and $460, respectively |
|
|
201 |
|
|
|
215 |
|
Operating lease right-of-use assets |
|
|
33 |
|
|
|
42 |
|
Intangible assets, net of accumulated amortization of $200 and $202, respectively |
|
|
58 |
|
|
|
65 |
|
Goodwill |
|
|
820 |
|
|
|
843 |
|
Non-marketable investments |
|
|
35 |
|
|
|
36 |
|
Deferred income taxes, net |
|
|
40 |
|
|
|
54 |
|
Other long-term assets, net of allowance for credit losses of $10 and $10, respectively |
|
|
88 |
|
|
|
94 |
|
TOTAL ASSETS |
|
$ |
2,612 |
|
|
$ |
2,289 |
|
|
|
|
|
|
|
|
||
LIABILITIES AND STOCKHOLDERS' EQUITY |
|
|
|
|
|
|
||
Current liabilities: |
|
|
|
|
|
|
||
Accounts payable |
|
$ |
50 |
|
|
$ |
27 |
|
Deferred merchant payables |
|
|
323 |
|
|
|
113 |
|
Deferred revenue |
|
|
70 |
|
|
|
36 |
|
Accrued expenses and other current liabilities |
|
|
213 |
|
|
|
181 |
|
Total current liabilities |
|
|
656 |
|
|
|
357 |
|
Long-term debt |
|
|
835 |
|
|
|
833 |
|
Finance lease obligation, net of current portion |
|
|
61 |
|
|
|
65 |
|
Operating lease liabilities, net of current portion |
|
|
20 |
|
|
|
29 |
|
Deferred income taxes, net |
|
|
1 |
|
|
|
1 |
|
Other long-term liabilities |
|
|
243 |
|
|
|
215 |
|
Total Liabilities |
|
|
1,816 |
|
|
|
1,500 |
|
|
|
|
|
|
|
|
||
Stockholders’ equity: |
|
|
|
|
|
|
||
Preferred stock, $0.001 par value |
|
|
— |
|
|
|
— |
|
Authorized shares: 100,000,000 |
|
|
|
|
|
|
||
Shares issued and outstanding: 0 and 0 |
|
|
|
|
|
|
||
Common stock, $0.001 par value |
|
|
— |
|
|
|
— |
|
Authorized shares: 1,600,000,000 |
|
|
|
|
|
|
||
Shares issued: 145,847,721 and 144,656,649, respectively |
|
|
|
|
|
|
||
Shares outstanding: 127,003,107 and 125,812,035, respectively |
|
|
|
|
|
|
||
Class B common stock, $0.001 par value |
|
|
— |
|
|
|
— |
|
Authorized shares: 400,000,000 |
|
|
|
|
|
|
||
Shares issued and outstanding: 12,799,999 and 12,799,999, respectively |
|
|
|
|
|
|
||
Additional paid-in capital |
|
|
1,364 |
|
|
|
1,326 |
|
Retained earnings |
|
|
238 |
|
|
|
241 |
|
Accumulated other comprehensive income (loss) |
|
|
(84 |
) |
|
|
(56 |
) |
Treasury stock-common stock, at cost, 18,844,614 and 18,844,614 shares, respectively |
|
|
(722 |
) |
|
|
(722 |
) |
Total Stockholders’ Equity |
|
|
796 |
|
|
|
789 |
|
TOTAL LIABILITIES AND STOCKHOLDERS' EQUITY |
|
$ |
2,612 |
|
|
$ |
2,289 |
|
6
Tripadvisor, Inc.
Unaudited Condensed Consolidated Statements of Cash Flows
(in millions)
|
|
Three Months Ended |
|
|
Six Months Ended |
|
||||||||||
|
|
June 30, 2022 |
|
|
June 30, 2021 |
|
|
June 30, 2022 |
|
|
June 30, 2021 |
|
||||
Operating activities: |
|
|
|
|
|
|
|
|
|
|
|
|
||||
Net income (loss) |
|
$ |
31 |
|
|
$ |
(40 |
) |
|
$ |
(3 |
) |
|
$ |
(120 |
) |
Adjustments to reconcile net income (loss) to net cash provided by (used in) operating activities: |
|
|
|
|
|
|
|
|
|
|
|
|
||||
Depreciation and amortization |
|
|
25 |
|
|
|
28 |
|
|
|
50 |
|
|
|
57 |
|
Stock-based compensation expense |
|
|
21 |
|
|
|
32 |
|
|
|
43 |
|
|
|
61 |
|
Deferred income tax expense (benefit) |
|
|
14 |
|
|
|
(6 |
) |
|
|
14 |
|
|
|
(29 |
) |
Provision for expected credit losses |
|
|
2 |
|
|
|
1 |
|
|
|
3 |
|
|
|
3 |
|
Other, net |
|
|
(1 |
) |
|
|
3 |
|
|
|
2 |
|
|
|
8 |
|
Changes in operating assets and liabilities, net |
|
|
203 |
|
|
|
108 |
|
|
|
271 |
|
|
|
126 |
|
Net cash provided by (used in) operating activities |
|
|
295 |
|
|
|
126 |
|
|
|
380 |
|
|
|
106 |
|
|
|
|
|
|
|
|
|
|
|
|
|
|
||||
Investing activities: |
|
|
|
|
|
|
|
|
|
|
|
|
||||
Capital expenditures, including capitalized website development |
|
|
(13 |
) |
|
|
(14 |
) |
|
|
(27 |
) |
|
|
(25 |
) |
Other investing activities, net |
|
|
1 |
|
|
|
(2 |
) |
|
|
1 |
|
|
|
(1 |
) |
Net cash provided by (used in) investing activities |
|
|
(12 |
) |
|
|
(16 |
) |
|
|
(26 |
) |
|
|
(26 |
) |
|
|
|
|
|
|
|
|
|
|
|
|
|
||||
Financing activities: |
|
|
|
|
|
|
|
|
|
|
|
|
||||
Proceeds from issuance of 2026 Senior Notes, net of financing costs |
|
|
— |
|
|
|
— |
|
|
|
— |
|
|
|
340 |
|
Purchase of capped calls in connection with 2026 Senior Notes |
|
|
— |
|
|
|
— |
|
|
|
— |
|
|
|
(35 |
) |
Proceeds from exercise of stock options |
|
|
— |
|
|
|
1 |
|
|
|
— |
|
|
|
8 |
|
Payment of withholding taxes on net share settlements of equity awards |
|
|
(1 |
) |
|
|
(6 |
) |
|
|
(9 |
) |
|
|
(29 |
) |
Payments of finance lease obligation and other financings activities, net |
|
|
(2 |
) |
|
|
(2 |
) |
|
|
(4 |
) |
|
|
(3 |
) |
Net cash provided by (used in) financing activities |
|
|
(3 |
) |
|
|
(7 |
) |
|
|
(13 |
) |
|
|
281 |
|
Effect of exchange rate changes on cash, cash equivalents and restricted cash |
|
|
(17 |
) |
|
|
(2 |
) |
|
|
(19 |
) |
|
|
(4 |
) |
Net increase (decrease) in cash, cash equivalents and restricted cash |
|
|
263 |
|
|
|
101 |
|
|
|
322 |
|
|
|
357 |
|
Cash, cash equivalents and restricted cash at beginning of period |
|
|
782 |
|
|
|
674 |
|
|
|
723 |
|
|
|
418 |
|
Cash, cash equivalents and restricted cash at end of period |
|
$ |
1,045 |
|
|
$ |
775 |
|
|
$ |
1,045 |
|
|
$ |
775 |
|
7
Tripadvisor, Inc.
Unaudited Segment Information
(in millions, except percentages)
|
|
Three Months Ended |
|
|
|
|
||||||
|
|
June 30, 2022 |
|
|
June 30, 2021 |
|
|
% Change |
|
|||
Revenue: |
|
|
|
|
|
|
|
|
|
|||
Tripadvisor Core (1) |
|
$ |
274 |
|
|
$ |
184 |
|
|
|
49 |
% |
Viator |
|
|
136 |
|
|
|
40 |
|
|
|
240 |
% |
TheFork |
|
|
32 |
|
|
|
18 |
|
|
|
78 |
% |
Intersegment eliminations (1) |
|
|
(25 |
) |
|
|
(7 |
) |
|
|
257 |
% |
Total revenue |
|
$ |
417 |
|
|
$ |
235 |
|
|
|
77 |
% |
Adjusted EBITDA: |
|
|
|
|
|
|
|
|
|
|||
Tripadvisor Core |
|
$ |
116 |
|
|
$ |
49 |
|
|
|
137 |
% |
Viator |
|
|
— |
|
|
|
(13 |
) |
|
n.m. |
|
|
TheFork |
|
|
(7 |
) |
|
|
(11 |
) |
|
|
(36 |
)% |
Total Adjusted EBITDA (2) |
|
$ |
109 |
|
|
$ |
25 |
|
|
|
336 |
% |
Adjusted EBITDA Margin: |
|
|
|
|
|
|
|
|
|
|||
Tripadvisor Core |
|
|
42 |
% |
|
|
27 |
% |
|
|
|
|
Viator |
|
|
0 |
% |
|
|
(33 |
)% |
|
|
|
|
TheFork |
|
|
(22 |
)% |
|
|
(61 |
)% |
|
|
|
|
Total Adjusted EBITDA Margin (2) |
|
|
26 |
% |
|
|
11 |
% |
|
|
|
|
|
|
|
|
|
|
|
|
|
|
|||
Net Income (Loss) (3) |
|
$ |
31 |
|
|
$ |
(40 |
) |
|
|
|
|
Net Income (Loss) Margin |
|
|
7 |
% |
|
|
(17 |
)% |
|
|
|
|
|
|
Six Months Ended |
|
|
|
|
||||||
|
|
June 30, 2022 |
|
|
June 30, 2021 |
|
|
% Change |
|
|||
Revenue: |
|
|
|
|||||||||
Tripadvisor Core (1) |
|
$ |
465 |
|
|
$ |
291 |
|
|
|
60 |
% |
Viator |
|
|
192 |
|
|
|
52 |
|
|
|
269 |
% |
TheFork |
|
|
58 |
|
|
|
24 |
|
|
|
142 |
% |
Intersegment eliminations (1) |
|
|
(36 |
) |
|
|
(9 |
) |
|
|
300 |
% |
Total revenue |
|
$ |
679 |
|
|
$ |
358 |
|
|
|
90 |
% |
Adjusted EBITDA: |
|
|
|
|
|
|
|
|
|
|||
Tripadvisor Core |
|
$ |
172 |
|
|
$ |
55 |
|
|
|
213 |
% |
Viator |
|
|
(20 |
) |
|
|
(26 |
) |
|
|
(23 |
)% |
TheFork |
|
|
(15 |
) |
|
|
(30 |
) |
|
|
(50 |
)% |
Total Adjusted EBITDA (2) |
|
$ |
137 |
|
|
$ |
(1 |
) |
|
n.m. |
|
|
Adjusted EBITDA Margin: |
|
|
|
|
|
|
|
|
|
|||
Tripadvisor Core |
|
|
37 |
% |
|
|
19 |
% |
|
|
|
|
Viator |
|
|
(10 |
)% |
|
|
(50 |
)% |
|
|
|
|
TheFork |
|
|
(26 |
)% |
|
|
(125 |
)% |
|
|
|
|
Total Adjusted EBITDA Margin (2) |
|
|
20 |
% |
|
|
(0 |
)% |
|
|
|
|
|
|
|
|
|
|
|
|
|
|
|||
Net Income (Loss) (3) |
|
$ |
(3 |
) |
|
$ |
(120 |
) |
|
|
|
|
Net Income (Loss) Margin |
|
|
(0 |
)% |
|
|
(34 |
)% |
|
|
|
|
n.m. = not meaningful
8
9
Non-GAAP Financial Measures
To supplement our unaudited condensed consolidated financial statements, which are prepared and presented in accordance with GAAP in our press release and related conference call, we also report certain non-GAAP financial measures. A “non-GAAP financial measure” refers to a numerical measure of a company’s historical or future financial performance, financial position, or cash flows that excludes (or includes) amounts that are included in (or excluded from) the most directly comparable measure calculated and presented in accordance with GAAP in such company’s financial statements. We may use the following non-GAAP measures: Adjusted EBITDA, Adjusted EBITDA margin, non-GAAP net income (loss), non-GAAP net income (loss) per diluted share, free cash flow, non-GAAP revenue before effects of foreign exchange, and Adjusted EBITDA before effects of foreign exchange, as well as other measures.
The presentation of these financial measures is not intended to be considered in isolation or as a substitute for, or superior to, financial information prepared and presented in accordance with GAAP and should not be considered measures of Tripadvisor’s liquidity. Investors are cautioned that there are material limitations associated with the use of non-GAAP financial measures as an analytical tool. In particular, many of the adjustments to our GAAP financial measures reflect the exclusion of certain items, as defined in our non-GAAP definitions below, which are recurring and will be reflected in our financial results for the foreseeable future. In addition, these measures may be different from non-GAAP financial measures used by other companies, even where similarly titled, limiting their usefulness for comparison purposes and therefore should not be used to compare Tripadvisor’s performance to that of other companies. We endeavor to compensate for the limitation of the non-GAAP financial measures presented by also providing the most directly comparable GAAP measures and descriptions of the reconciling items and adjustments to derive the non-GAAP financial measures.
We believe these non-GAAP financial measures provide investors and analysts with useful supplemental information about the financial performance of our business, enable comparison of financial results between periods where certain items may vary independent of business performance, and allow for greater transparency with respect to key measures used by management to operate and analyze our business over different periods of time.
We define our non-GAAP financial measures as below:
Tripadvisor defines “Adjusted EBITDA” as Net Income (Loss) plus: (1) provision (benefit) for income taxes; (2) other income (expense), net; (3) depreciation and amortization; (4) stock-based compensation and other stock-settled obligations; (5) goodwill, long-lived assets and intangible asset impairments; (6) legal reserves and settlements; (7) restructuring and other related reorganization costs; and (8) non-recurring expenses and income. These items are excluded from our Adjusted EBITDA measure because these items are noncash in nature, or because the amount is not driven by core operating results and renders comparisons with prior periods less meaningful. The Company believes that excluding these amounts better enables management and investors to compare financial results between periods as these costs may vary independent of business performance.
Tripadvisor defines “Adjusted EBITDA margin” as Adjusted EBITDA divided by revenue.
Adjusted EBITDA and Adjusted EBITDA margin are key operating performance measures used by our management and board of directors to understand and evaluate the financial performance of our business as a whole and our individual business segments, and on which internal budgets and forecasts are based and approved. In particular, the exclusion of certain expenses in calculating Adjusted EBITDA can provide a useful measure for period-to-period comparisons and better enables management and investors to compare financial results between periods as these costs may vary independent of core business performance. Accordingly, we believe that Adjusted EBITDA and Adjusted EBITDA margin provide useful information to investors and others in understanding and evaluating our operating results in the same manner as our management and Board of Directors and allows for another useful comparison of our performance with our historical results from prior periods.
Our use of Adjusted EBITDA has limitations as an analytical tool, and you should not consider it in isolation or as a substitute for analysis of our results reported in accordance with GAAP. Because of these limitations, you should consider Adjusted EBITDA alongside other financial performance measures, including net income (loss) and our other GAAP results.
Some of these limitations are:
10
Tripadvisor defines “non-GAAP net income (loss)” as GAAP net income (loss) excluding, net of their related tax effects (which excludes the impact of significant one-time changes resulting from tax legislation or significant legislation that impacts tax, such as the CARES Act): (1) stock-based compensation expense and other stock-settled obligations; (2) amortization of intangible assets; (3) goodwill, intangible asset, and other long-lived asset impairments; (4) legal reserves and settlements; (5) restructuring and other related reorganization costs; and (6) certain gains, losses, and other non-recurring income or expenses that we do not believe are indicative of our ongoing operating results. We believe non-GAAP net income (loss) is an operating performance measure which provides investors and analysts with useful supplemental information about the financial performance of our business, as it incorporates our unaudited condensed consolidated statement of operations, taking into account depreciation, which management believes is an ongoing cost of doing business, but excluding the impact of certain expenses, infrequently occurring items and items not directly tied to the ongoing core operations of our businesses, and also enables comparison of financial results between periods where certain items may vary independent of business performance.
Tripadvisor defines “non-GAAP net income (loss) per diluted share”, or non-GAAP diluted EPS, as non-GAAP net income (loss) divided by GAAP diluted shares. We believe non-GAAP diluted EPS is useful to investors because it represents, on a per share basis, our unaudited condensed consolidated statement of operations, taking into account depreciation, which we believe is an ongoing cost of doing business, as well as other items which are not allocated to the operating businesses such as interest expense, interest income, income taxes and foreign exchange gains or losses, but excluding the effects of certain expenses not directly tied to the ongoing core operations of our businesses. Tripadvisor calculates non-GAAP diluted EPS using weighted average diluted shares determined under GAAP.
Non-GAAP net income (loss) and non-GAAP diluted EPS have some of the same limitations as Adjusted EBITDA. In addition, non-GAAP net income (loss) does not include all items that affect our GAAP net income (loss) and GAAP diluted EPS for the period. Therefore, we think it is important to evaluate these measures along with our unaudited condensed consolidated statements of operations.
Tripadvisor defines “free cash flow” as net cash provided by operating activities less capital expenditures, which are purchases of property and equipment, including capitalization of website development costs. We believe this financial measure can provide useful supplemental information to help investors better understand underlying trends in our business, as it represents the operating cash flow that our operating businesses generate, less capital expenditures but before taking into account other cash movements that are not directly tied to the ongoing core operations of our businesses, such as financing activities, foreign exchange or certain investing activities. Free cash flow has certain limitations in that it does not represent the total increase or decrease in the cash balance for the period, nor does it represent the residual cash flow for discretionary expenditures. Therefore, it is important to evaluate free cash flow along with the unaudited condensed consolidated statements of cash flows.
Tripadvisor calculates our foreign exchange effect of revenue, or “non-GAAP revenue before effects of foreign exchange” on a constant currency basis by excluding the estimated effects of foreign currency exchange on revenue by translating actual revenue for the current year three months ended using the prior period foreign currency exchange rates. We believe this is a useful measure that facilitates management's internal comparison to our historical performance because it excludes the effects of foreign currency volatility that is not indicative of our ongoing core operating results.
Tripadvisor calculates our foreign exchange effect of Adjusted EBITDA, or “Adjusted EBITDA before effects of foreign exchange,” on a constant currency basis, by excluding the estimated effects of foreign currency exchange by translating all amounts included in Adjusted EBITDA for the current year three months ended using the prior period foreign currency exchange rates. We believe this is a
11
useful measure that facilitates management's internal comparison to our historical performance because it excludes the effects of foreign currency volatility that is not indicative of our ongoing core operating results.
Pursuant to the requirements of Regulation G, we present reconciliations of these non-GAAP financial measures to the most directly comparable GAAP measure below.
12
Tripadvisor, Inc.
RECONCILIATION OF GAAP TO NON-GAAP FINANCIAL MEASURES
(in millions, except per share amounts and percentages)
(Unaudited)
|
|
Three Months Ended |
|
|
Six Months Ended |
|
||||||||||||||||||
|
|
June 30, 2022 |
|
|
June 30, 2021 |
|
|
March 31, 2022 |
|
|
June 30, 2020 |
|
|
June 30, 2022 |
|
|
June 30, 2021 |
|
||||||
Reconciliation of GAAP Net Income (Loss) to Adjusted EBITDA (Non-GAAP): |
|
|
|
|
|
|
|
|
|
|
|
|
|
|
|
|
|
|
||||||
GAAP Net Income (Loss) |
|
$ |
31 |
|
|
$ |
(40 |
) |
|
$ |
(34 |
) |
|
$ |
(153 |
) |
|
$ |
(3 |
) |
|
$ |
(120 |
) |
Add: Provision (benefit) for income taxes |
|
|
22 |
|
|
|
(6 |
) |
|
|
1 |
|
|
|
(26 |
) |
|
|
24 |
|
|
|
(21 |
) |
Add: Other (income) expense, net |
|
|
10 |
|
|
|
11 |
|
|
|
13 |
|
|
|
15 |
|
|
|
23 |
|
|
|
22 |
|
Add: Depreciation and amortization |
|
|
25 |
|
|
|
28 |
|
|
|
25 |
|
|
|
32 |
|
|
|
50 |
|
|
|
57 |
|
Add: Restructuring and other related reorganization costs |
|
|
— |
|
|
|
— |
|
|
|
— |
|
|
|
33 |
|
|
|
— |
|
|
|
— |
|
Add: Stock-based compensation expense |
|
|
21 |
|
|
|
32 |
|
|
|
22 |
|
|
|
25 |
|
|
|
43 |
|
|
|
61 |
|
Adjusted EBITDA (Non-GAAP) |
|
$ |
109 |
|
|
$ |
25 |
|
|
$ |
27 |
|
|
$ |
(74 |
) |
|
$ |
137 |
|
|
$ |
(1 |
) |
|
|
|
|
|
|
|
|
|
|
|
|
|
|
|
|
|
|
|
||||||
Revenue (GAAP) |
|
$ |
417 |
|
|
$ |
235 |
|
|
|
|
|
|
|
|
$ |
679 |
|
|
$ |
358 |
|
||
|
|
|
|
|
|
|
|
|
|
|
|
|
|
|
|
|
|
|
||||||
Net Income (loss) margin (GAAP) |
|
|
7 |
% |
|
|
(17 |
)% |
|
|
|
|
|
|
|
|
(0 |
)% |
|
|
(34 |
)% |
||
Adjusted EBITDA margin (Non-GAAP) (1) |
|
|
26 |
% |
|
|
11 |
% |
|
|
|
|
|
|
|
|
20 |
% |
|
|
(0 |
)% |
||
|
|
|
|
|
|
|
|
|
|
|
|
|
|
|
|
|
|
|
||||||
Reconciliation from GAAP Net Income (Loss) and GAAP Net Income (Loss) per diluted share to Non-GAAP net income (loss) and Non-GAAP net income (loss) per diluted share: |
|
|
|
|
|
|
|
|
|
|
|
|
|
|
|
|||||||||
GAAP Net Income (Loss) |
|
$ |
31 |
|
|
$ |
(40 |
) |
|
|
|
|
|
|
|
|
|
|
|
|
||||
Add: Stock-based compensation expense |
|
|
21 |
|
|
|
32 |
|
|
|
|
|
|
|
|
|
|
|
|
|
||||
Add: Amortization of intangible assets |
|
|
3 |
|
|
|
5 |
|
|
|
|
|
|
|
|
|
|
|
|
|
||||
Add: (Gain)/Loss on investment |
|
|
(1 |
) |
|
|
(1 |
) |
|
|
|
|
|
|
|
|
|
|
|
|
||||
Subtract: Income tax effect of Non-GAAP adjustments (2) |
|
|
— |
|
|
|
6 |
|
|
|
|
|
|
|
|
|
|
|
|
|
||||
Non-GAAP net income (loss) |
|
$ |
54 |
|
|
$ |
(10 |
) |
|
|
|
|
|
|
|
|
|
|
|
|
||||
|
|
|
|
|
|
|
|
|
|
|
|
|
|
|
|
|
|
|
||||||
GAAP diluted shares |
|
|
145 |
|
|
|
137 |
|
|
|
|
|
|
|
|
|
|
|
|
|
||||
|
|
|
|
|
|
|
|
|
|
|
|
|
|
|
|
|
|
|
||||||
GAAP Net Income (loss) per diluted share |
|
$ |
0.21 |
|
|
$ |
(0.29 |
) |
|
|
|
|
|
|
|
|
|
|
|
|
||||
Non-GAAP net income (loss) per diluted share (3) |
|
$ |
0.37 |
|
|
$ |
(0.07 |
) |
|
|
|
|
|
|
|
|
|
|
|
|
||||
|
|
|
|
|
|
|
|
|
|
|
|
|
|
|
|
|||||||||
Reconciliation of GAAP cash flows from operating activities to Free Cash Flow (Non-GAAP): |
|
|
|
|
|
|
|
|
|
|
|
|
|
|
|
|
|
|
||||||
Net cash provided by (used in) operating activities (GAAP) |
|
$ |
295 |
|
|
$ |
126 |
|
|
|
|
|
|
|
|
|
|
|
|
|
||||
Subtract: Capital expenditures |
|
|
13 |
|
|
|
14 |
|
|
|
|
|
|
|
|
|
|
|
|
|
||||
Free cash flow (Non-GAAP) |
|
$ |
282 |
|
|
$ |
112 |
|
|
|
|
|
|
|
|
|
|
|
|
|
||||
13
Safe Harbor Statement
Statements in this press release regarding management’s future expectations, beliefs, intentions, goals, strategies, plans or prospects, including, without limitation, statements relating to Tripadvisor’s future financial performance on both a GAAP and non-GAAP basis, and Tripadvisor’s prospects as a comprehensive destination for hotels, experiences, and restaurants, may constitute forward-looking statements within the meaning of the Private Securities Litigation Reform Act of 1995 and other federal securities laws. Forward-looking statements can be identified by terminology such as “anticipate,” “believe,” “could,” “could increase the likelihood,” “estimate,” “expect,” “intend,” “is planned,” “may,” “should,” “will,” “will enable,” “would be expected,” “look forward,” “may provide,” “would” or similar terms, variations of such terms or the negative of those terms. Investors are cautioned that statements in this press release, which are not strictly historical statements, including, without limitation, statements by our executive officers with respect to growth objectives, strategic investments, and statements regarding management’s plans, objectives and strategies, constitute forward-looking statements. Such forward-looking statements involve known and unknown risks, uncertainties and other factors including those risks, uncertainties and factors detailed in Tripadvisor’s filings with the SEC. As a result of such risks, uncertainties and factors, Tripadvisor’s actual results may differ materially from any future results, performance or achievements discussed in or implied by the forward-looking statements contained herein. Tripadvisor is providing the information in this press release as of this date and assumes no obligations to update the information included in this press release or revise any forward-looking statements, whether as a result of new information, future events or otherwise.
Contacts
Investors
Media
14
|
Exhibit 99.2 |

Q2 2022
Letter to
Shareholders
|
1 |
|
Q2 2022 |
Q2 2021 |
Q1 2022 |
Revenue
|
$417M
|
$235M
|
$262M
|
Net Income / (Loss)
|
$31M
|
$(40)M
|
$(34)M |
Adjusted EBITDA (1)
|
$109M
|
$25M
|
$27M |
|
2 |
Letter to Shareholders
We are extremely pleased with our results in the second quarter of 2022, which mirror the strength we saw as leisure travel continued to return, and are also a testament to the strong execution of the team. We saw strong performance across our experiences offerings, and European travel saw a strong uptick. Across all our offerings, our trusted brand and rich content helped millions of travelers research trips, find the right accommodations and experiences, and choose where to dine.
These factors resulted in consolidated results this quarter at nearly 2019 revenue levels. We saw a steep sequential pickup in our Tripadvisor Core segment. We saw the strongest recovery across our Viator and TheFork segments, exceeding 2019 revenue levels across those segments in the quarter. In addition to our top line performance, our results exemplify the flexibility that our profit profile provides–with our very profitable Tripadvisor Core offerings able to fund investment in building out long-term revenue growth across the business.
Although travel is possibly also impacted by the macro trends of inflation and consumer sentiment, we point out that travel and our business have performed strongly throughout Q2 and the recovery versus 2019 has continued regardless of any macro factors. In fact, we anticipate revenue to continue to improve versus 2019 in Q3.
Finally, we are introducing new segments this quarter, which we believe better present our businesses. Starting this quarter, reportable segments within Tripadvisor, Inc.’s consolidated results include: 1) Tripadvisor Core, 2) Viator, and 3) TheFork. We believe this segment presentation will be helpful to investors given the strong P&L leadership in place, distinct growth and profit margin profiles between Tripadvisor Core segment and our faster growing Viator and TheFork segments, and unique business models. We also believe that the additional details and insight will help better present the potential for unlocking value.
To ensure that investors have a basis for comparison, we have provided supplemental information, including a re-cast of quarterly segment revenue and segment adjusted EBITDA starting in Q1 FY2019, posted concurrently with this shareholder letter, as well as in the supplemental financial information file, posted to the Investor Relation section of our website at http://ir.tripadvisor.com.
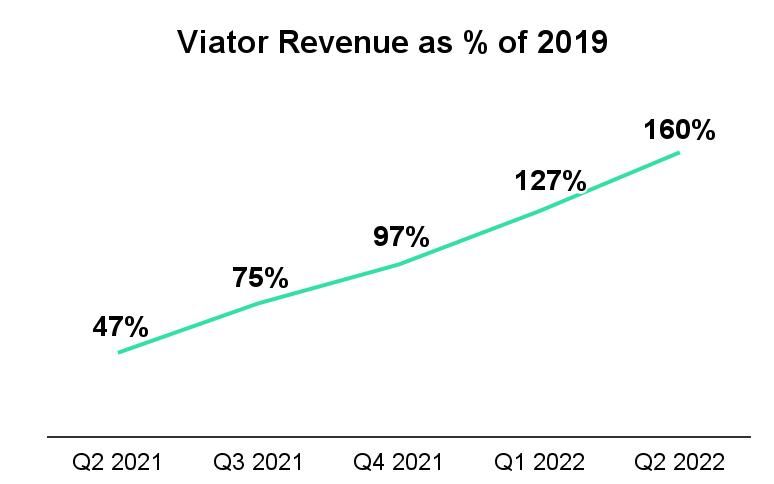
Second Quarter 2022 Consolidated Financial Results
Second quarter revenue was $417 million, growing 77% year over year, and reaching 99% of 2019 levels. Revenue recovery was driven by strong performance in our Viator and TheFork segments, as well as in Tripadvisor-branded hotels revenue. We saw continued improvements in each month of the quarter. Revenue in Q2 2019 included approximately $13 million, or 3% of Q2 2019 revenue, related to SmarterTravel and China businesses, which no longer contribute to revenue.
Trends since the same period a year ago have improved significantly, and are at nearly double the recovery levels seen in Q2 2021. A year ago, Europe was still significantly behind the U.S. across key revenue streams such as hotel auction, and as a destination in experiences, as well as in metrics such as unique users, hotel shoppers, and cost per click. We were pleased to see Europe close the gap with the U.S. this quarter in recovery rates across these metrics.
|
3 |
Recovery in experiences continues to stand out with revenue well above 2019 levels the last two quarters in Viator, and with increased bookings to European destinations.
We are subject to fluctuations in foreign currency, primarily with the EUR, which declined this quarter against the USD. We estimate that in Q2 2022, changes in foreign currency were a headwind of approximately 9 percentage points of revenue growth versus Q2 2021.
Net income for Q2 2022 was $31 million, compared to a net loss of $40 million in the same period a year ago.
Consolidated adjusted EBITDA in Q2 2022 was $109 million, or 26% of revenue, as compared to adjusted EBITDA of $25 million, or 11% of revenue, in Q2 2021.
The improvement in net loss and consolidated adjusted EBITDA was driven primarily by increases in revenue, which more than offset increases in marketing expense and higher fixed and discretionary costs in Q2 2022 when compared to Q2 2021. Year over year, we also had a benefit of approximately $11 million related to a COVID-19 subsidy payment in TheFork segment in Q2 2022.
We ended the quarter with $1.05 billion in cash and cash equivalents.
|
4 |
Tripadvisor Core Segment
Included in this segment is revenue from our Tripadvisor branded hotels, display and platform, Tripadvisor experiences and dining revenue, and other revenue derived from adjacent offerings, including rentals, flights and cars, and cruise, including some non-Tripadvisor branded revenue in our cruise and rentals offerings.
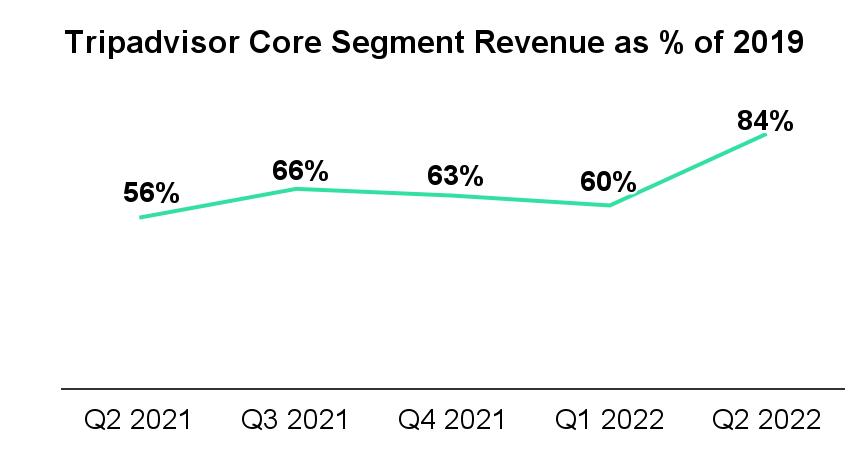
All revenue contributors to the Tripadvisor Core segment saw improvement from Q1 2022 as a percent of 2019. Tripadvisor branded hotels revenue, which was 89% of 2019 levels, and Tripadvisor experiences and dining revenue, which was 117% of 2019 levels, saw the strongest improvements from last quarter. Display and platform revenue also had solid performance at 86% of 2019 levels. We believe our results demonstrate that our brand is well-positioned in the marketplace and we continue to see opportunities to further fortify our offerings in the future.
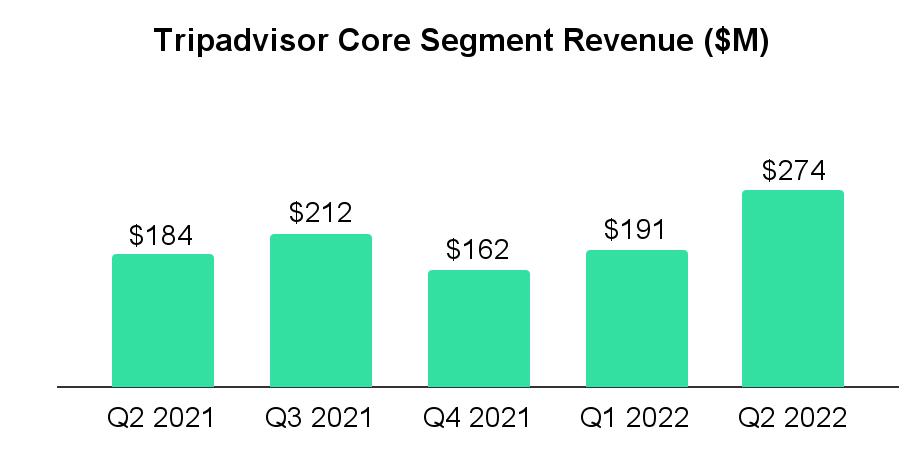
In Q2 2022, Tripadvisor Core segment revenue was $274 million, reflecting year over year growth of nearly 50%, and reaching 84% of 2019 levels. Revenue in Q2 2019 included approximately $13 million, or 4% of Tripadvisor Core segment revenue, related to SmarterTravel and China businesses, which no longer contribute to revenue.
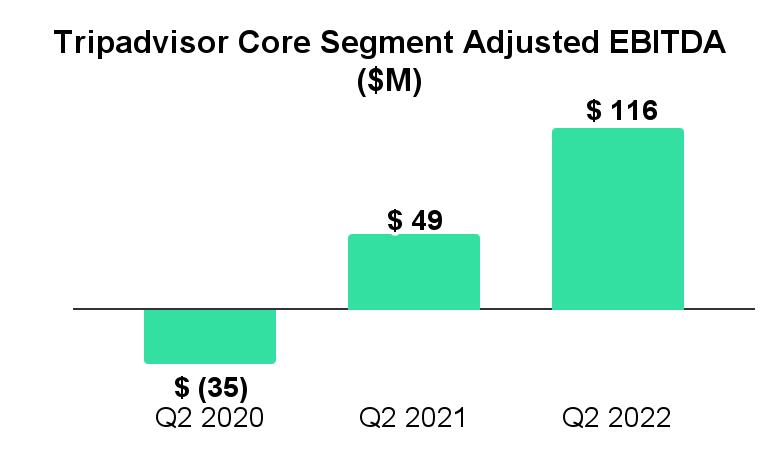
Adjusted EBITDA in the Tripadvisor Core segment in Q2 2022 was $116 million, or 42% of segment revenue compared to $49 million, or 27% of segment revenue in Q2 2021. Year over year, Tripadvisor Core segment adjusted EBITDA benefited from significant improvements in revenue, which offset the increases in online traffic spend year over year. Notably, at 42% of segment revenue in Q2, segment adjusted EBITDA margin exceeded pre-pandemic margins for the same period in 2019.
|
5 |
Tripadvisor Branded Hotels
Our branded hotels revenue stream, which includes our hotel auction and B2B subscription offerings, grew 44% year over year, reaching $188 million, or 89% of 2019 levels, a pick up from 63% of 2019 levels in Q1 2022.
In our hotel auction, we’ve seen continued improvement across geographies, picking up strongly from last quarter. Europe in particular saw a steeper sequential improvement, and narrowed the gap with the U.S. in Q2. Rest of World continues to lag, though it also saw a steep improvement sequentially.
Our Hotel B2B revenue stream also increased sequentially as a percent of 2019 levels. We expect to see some improvement in Hotel B2B in the 2H of the year, though we expect this to continue to lag the rate at which hotel auction is recovering. This lag has been due in part to the ramp of our salesforce, which we have been working to improve.
Display & Platform
Display & Platform continues on its path to recovery. Revenue in Q2 2022 was $37 million, reflecting 42% year over year growth and reaching 86% of 2019 levels. We believe our trusted brand and reach are advantages we can better leverage as we continue to work with both endemic and non-endemic advertising partners. Given our position in the ecosystem, and insight into travelers and trends, we see an opportunity to help our partners as they seek to drive strong return on their spend.
Tripadvisor Experiences & Dining
Revenue in our Tripadvisor point-of-sale (POS) experiences and dining was $35 million in Q2 2022, or 117% of 2019 levels.
Revenue from Tripadvisor experiences is derived primarily from intercompany (intersegment) marketing fees paid by Viator to Tripadvisor for experiences that originated on the Tripadvisor POS and fulfilled by Viator, and is eliminated on a consolidated basis. The recovery in this revenue stream also reflects the demand for experiences and the higher-growth nature of this category of travel. Revenue that came through this channel exceeded 2019 levels in Q2 2022. Our Tripadvisor dining revenue, which is primarily revenue from marketing to restaurants and diners, including advertising revenue, also exceeded 2019 levels in Q2 2022.
Other
Revenue from other offerings, which includes cruises, rentals, flights, and cars, was $14 million, or 33% of 2019 levels. In Q2 2019 we had approximately $13 million in revenue related to the SmarterTravel and China businesses, which no longer contribute to revenue, and were 30% of Q2 2019 Other revenue. Other revenue has also seen significant impact of the pandemic in some of these offerings, such as cruises, the de-emphasis in marketing across others, such as our rentals and flights offerings, restructuring activities, and the subsequent sale of SmarterTravel in 2020.
|
6 |
Viator Segment
Included in this segment is revenue generated from the booking of tours, attractions, and activities transacted through the Viator point of sale, including revenue generated from third party distribution partners, including the Tripadvisor point of sale and third party points of sale.
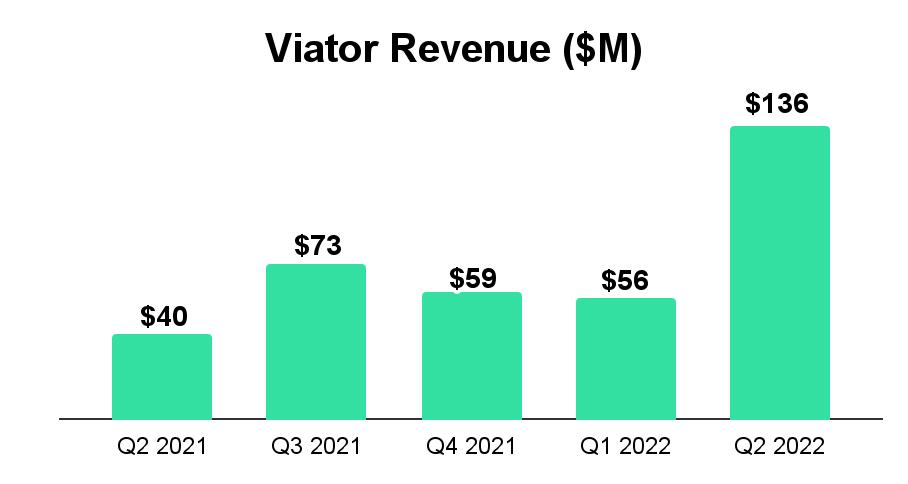
In Q2 2022 revenue in our Viator segment was $136 million, reflecting year over year growth of 240% and reaching 160% of 2019 levels. As in other parts of the business, Viator revenue saw month over month improvements within the quarter. We also saw a return across geographies throughout the quarter, and particular strength in bookings for European destinations as travel between North America and Europe picked up.
Starting in Q3 2021, the revenue recovery in Viator began to accelerate at a relatively fast pace. Revenue generated from the Viator point of sale has shown the strongest performance across our business. The step up in revenue from $56 million last quarter was driven by seasonality and what we believe to be a combination of pent up demand for travel, the secular shift as the experiences travel category expands and moves online, and our efforts to grow our competitive position.
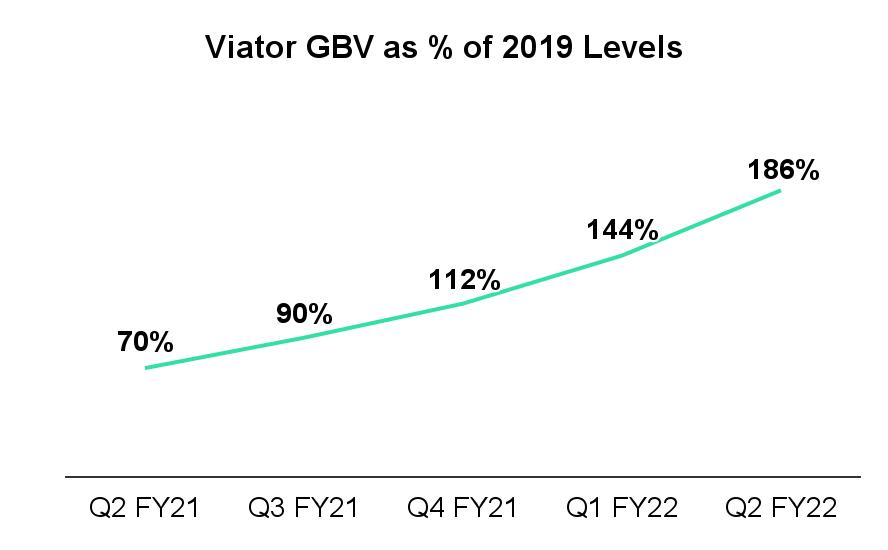
Turning to metrics, gross bookings value (GBV) was approximately $800 million, or approximately 186% of 2019 levels. Year over year, GBV grew approximately 164% from approximately $300 million in Q2 2021. GBV is reported at the time of booking and is gross of cancellations, whereas revenue is recorded at the time of the experience, and is net of cancellations. Year over year, cancellation rates are flat, but remain higher than pre-pandemic cancellation rates.
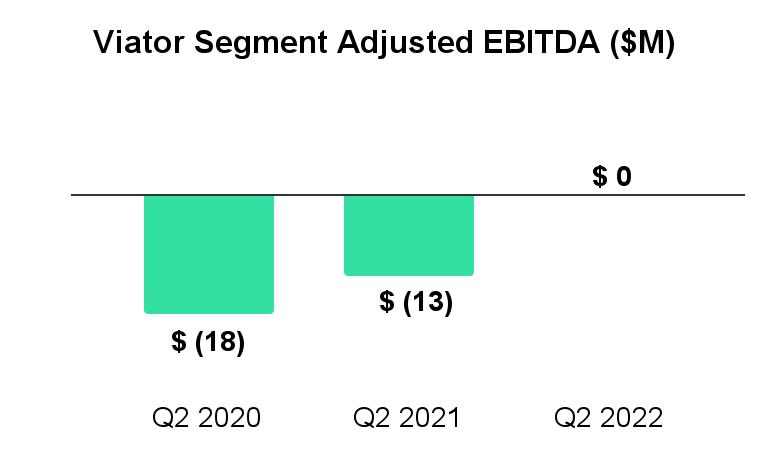
Despite significant ongoing growth investments in Viator, in Q2 2022 our adjusted EBITDA margin improved versus the same periods in 2019 and 2021. As we noted last quarter, Viator on a standalone basis operated at an adjusted EBITDA loss through 2020 and 2021, and as revenue has benefitted from the recovery, so has adjusted
|
7 |
EBITDA. The majority of expenses in Viator continue to be in sales and marketing, including inter-company affiliate marketing fees to Tripadvisor Core and third parties.
We remain excited about the opportunity in Viator. The business operates in a large global market, which is estimated to be over $250 billion in gross bookings by 2024 bookings1. The vast majority of this opportunity is booked through traditional, offline sources, with approximately 20% of these gross bookings booked online1, which is significantly lower in penetration relative to online bookings in categories such as air or hotels.
On the demand side, we continue to see good opportunities to bring customers to our platform at attractive economics. Our unit economics are further enhanced by consistent revenue retention rates, which we believe will position us to build a large base of repeat revenue, with low marketing costs. As such, we are focusing our investment on both acquiring new users and driving better retention rates.
On the supplier side, we work with approximately 50,000 operators, the majority of whom are micro-businesses. The Viator platform provides a channel for them to reach more customers through Viator and our partners. We also see an opportunity to drive more value for them, whether through our marketing programs targeted at improving their listings, or with our software solutions.
We see our position as key to our ability to capture more market share–the confluence of travel, content, online booking capabilities, and guidance, combined with relationships with thousands of operators, creates a marketplace dynamic that is resulting in high growth. We expect to continue to invest in marketing, including in discretionary brand spend in the second half of 2022.
We continue to believe there are multiple opportunities to crystalize value with this very strategic market leader in a rapidly growing category of travel given the ample opportunity to build and scale our traveler and operator base, technology, and brand awareness.
1 Arival, Phocuswright.
|
8 |
TheFork Segment
Included in this segment is revenue generated from the booking of reservations through TheFork point of sale, which includes revenue generated primarily by restaurant seating fees via our online reservation system.
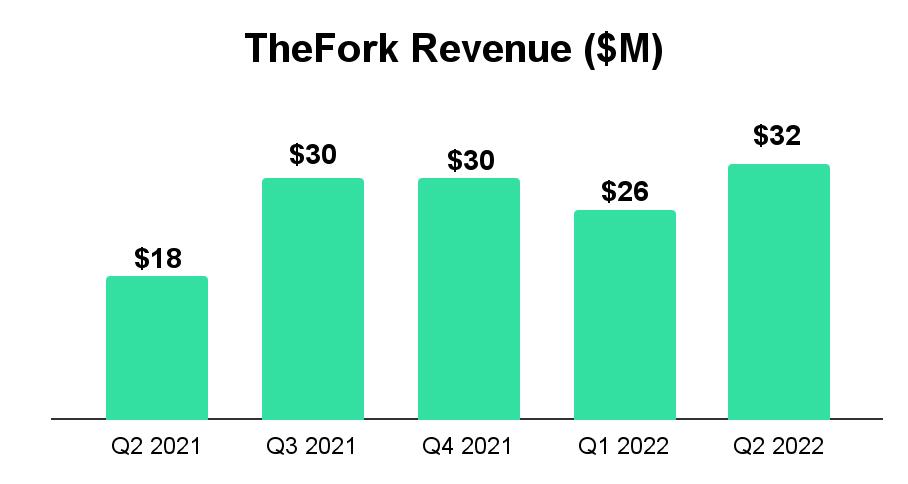
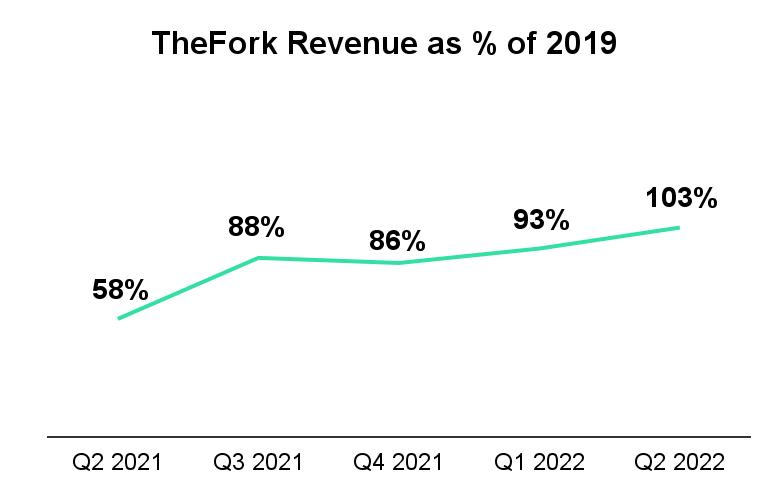
TheFork revenue is primarily European based, with operations in all major European markets. Revenue in TheFork reached $32 million in Q2 2022, growing 78% year over year, and reaching 103% of 2019 levels. In the same period a year ago, restrictions were still largely in place in Europe but, since then, as we’ve seen restrictions relax, we’ve also seen the direct benefit to revenue as diners returned to restaurants.
Changes in foreign currency negatively impacted Q2 2022 revenue due primarily to the decline of the EUR against the USD. We estimate that in Q2 2022, changes in foreign currency were a headwind of approximately 22 percentage points of revenue growth rates versus Q2 2021, and estimate that revenue recovery rates versus 2019 would have been approximately 5 percentage points higher.
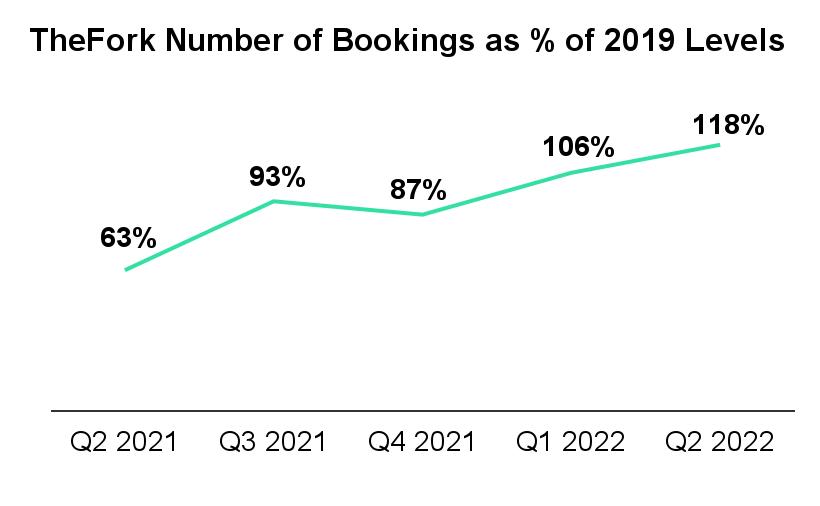
The number of bookings at TheFork grew 89% year over year and reached 118% of 2019 levels.
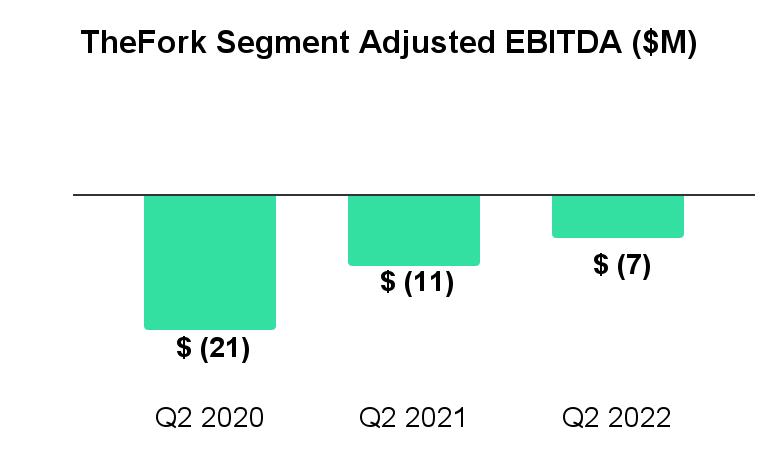
Adjusted EBITDA loss in Q2 2022 was $7 million. During the quarter, our investment in marketing picked up with our pan-European seasonal campaign, TheFork Festival. As noted last quarter, pre-pandemic, sales and marketing was the largest component of costs and remains so today. As restrictions have eased and dining has begun to return to pre-pandemic levels, we have increased investment in marketing, including in brand building in certain European markets. This quarter, this increased spend was also offset by the benefit of approximately $11 million of COVID-19-related government subsidies.
|
9 |
As a reminder, revenue at TheFork is primarily earned through per-seated diner charges paid by restaurants. These relationships and sign-ups with restaurants are driven through a salesforce that introduces restaurants to the value proposition of doing business with TheFork, as we drive diners to them through TheFork app and website. Expanding our supply of restaurants enables us to drive more seated diners and therefore revenue. With a market opportunity of over 500,000 restaurants in our top five countries alone2, we see room to continue to create value for restauranteurs.
For potential diners, we offer a reservations platform that provides visibility into most restaurants, including menus and pricing information, reviews, as well as the ability to reserve a seat. In addition to access directly through the app, we drive reservations through our own desktop site, search partners, and other websites. For travelers using the Tripadvisor site to reserve a table, TheFork pays an affiliate marketing fee for the booking to Tripadvisor, which for segment reporting purposes is shown as Tripadvisor revenue and is then eliminated on a consolidated basis.
We’ve seen strong growth driven opportunities in expansion of our value proposition on both the restaurant supply and diner demand side. For TheFork, 2022 is a year of significant investment versus 2019. We are making investments in our technology stack and funding strategic areas such as TheFork Pay. We believe these investments will have attractive returns post- 2022. We also continue marketing investment with a strong lifetime value to cost of acquisition profile.
As a result, this fiscal year, we expect that growth in variable and fixed and discretionary costs will outpace revenue recovery relative to pre-pandemic levels. Given this investment, we expect our losses in this segment to continue in the near future; however, we expect to drive significant adjusted EBITDA margin improvement in 2023. We believe these investments will fortify our position in Europe and drive an innovative agenda to drive future growth.
2 Euromonitor March 2021
|
10 |
Outlook
(As a reminder, we endeavor to be as accurate as possible with our forward-looking commentary; however, a number of factors outside of our control can limit our visibility into future financial performance and can cause our results to vary materially from our current expectations.)
Our performance in Q2 was excellent and we were pleased to nearly reach 2019 revenue levels on a consolidated basis earlier in the year than anticipated. We’ve seen steady, improving momentum since February. The last two quarters, demand has been strong, and we’ve exceeded our own expectations. To date, we have not seen signs of slowdown from macro pressures. Visibility has been improving, but is still uncertain.
Like many in the travel industry, we have seen that consumers were still spending on travel, despite some of the macro uncertainties, the geopolitical atmosphere, and even lingering COVID-19 flare-ups. However, as we embark on the 2H, it’s difficult to predict the probability, or the magnitude, of macro weakness, or of currency movements, and how they might impact the 2H of 2022 and the start of 2023.
Despite these factors, we expect modest improvement from Q2 recovery levels across segments, and flattening in the 2H, partly driven by the impact of currency.
For 3Q, we expect:
We expect a seasonal step down in consolidated adjusted EBITDA margin in Q4 versus Q3. In addition, in 2H we expect to partly reinvest the Q2 2022 COVID-19 related benefit in TheFork.
We are very pleased with our 1H performance and the recovery trend. Our reinvestment plans remain in place given the returns we have seen to date in revenue and our desire to scale our high growth businesses for the future. We are also excited about the value we continue to drive for travelers across all of our brands and offerings. We look forward to our next update.
***
Earnings Webcast
Tripadvisor management will host a conference call to discuss results as well as forward-looking information at 8:30 a.m. ET on August 5, 2022. The link to the live webcast, as well as the audio replay, will be made available on Tripadvisor’s Investor Relations website at http://ir.tripadvisor.com.
Investor relations contact
Media contact
Forward-Looking Statements
These prepared remarks contain “forward-looking statements” within the meaning of Section 27A of the Securities Act of 1933, as amended, and Section 21E of the Securities Exchange Act of 1934, as amended. The following words, when used, are intended to identify forward-looking statements: “anticipate,” “believe,” “could,” “estimate,”
|
11 |
“expect,” “intend,” “may,” “might,” “plan,” “project,” “target,” “should,” “will,” and similar expressions which do not relate solely to historical matters. We caution investors that any forward-looking statements in these prepared remarks, or which management may make orally or in writing from time to time, are based on management’s beliefs and on assumptions made by, and information currently available to, management. Such statements are subject to risks, uncertainties and assumptions and are not guarantees of future performance, which may be affected by known and unknown risks, trends, uncertainties and factors that are beyond our control. Some of the risks and uncertainties that may cause our actual results, performance or achievements to differ materially from those expressed or implied by forward-looking statements are more fully described in Part I. Item 1A. "Risk Factors" of our Annual Report on Form 10-K. Moreover, we operate in a rapidly changing environment. New risk factors emerge from time to time and it is not possible for management to predict all such risk factors, nor can we assess the impact of all such risk factors on our business or the extent to which any factor, or combination of factors, may cause actual results to differ materially from those contained in any forward-looking statements. We caution you that, while forward-looking statements reflect our good faith beliefs when we make them, they are not guarantees of future performance and are impacted by actual events when they occur after we make such statements. We expressly disclaim any responsibility to update our forward-looking statements, whether as a result of new information, future events or otherwise.
Investors should also refer to our quarterly reports on Form 10-Q for future periods and current reports on Form 8-K as we file them with the SEC and to other materials we may furnish to the public from time to time through current reports on Form 8-K or otherwise, for a discussion of risks and uncertainties that may cause actual results, performance or achievements to differ materially from those expressed or implied by forward-looking statements.
Use of Non-GAAP Financial Measures
These prepared remarks may include references to non-GAAP measures, such as consolidated adjusted EBITDA (including forecasted consolidated adjusted EBITDA), consolidated adjusted EBITDA margin, free cash flow, and constant currency measurements, such as, non-GAAP revenue before effects of foreign exchange, and adjusted EBITDA before effects of foreign exchange, which are considered non-GAAP financial measures as they are not prepared in conformity with accounting principles generally accepted in the United States (“GAAP”). These non-GAAP financial measures are not prepared under a comprehensive set of accounting rules and, therefore, should only be reviewed alongside results reported under GAAP.
We encourage investors to review our earnings press release as it contains important information about our financial results, including tabular reconciliations to the most directly comparable GAAP financial measure, definitions, limitations and other related information about these non-GAAP financial measures. We have not reconciled consolidated adjusted EBITDA guidance to projected consolidated GAAP net income (loss) because we do not provide guidance on GAAP net income (loss) or the reconciling items between adjusted EBITDA and GAAP net income (loss), as a result of the uncertainty regarding, and the potential variability of, certain of these items. Accordingly, a reconciliation of the non-GAAP financial measure guidance to the corresponding GAAP measure is not available without unreasonable effort.
The earnings press release in addition to other supplemental financial information is available on the Investor Relations section of our website at http://ir.tripadvisor.com/. The earnings press release is also included as Exhibit 99.1 to our Current Report on Form 8-K as furnished to the SEC on August 4, 2022, which is available on the Investor Relations section of our website at http://ir.tripadvisor.com/ and the SEC’s website at www.sec.gov.
Key Business Metrics & Definitions
We review a number of metrics, including, but not limited to, average monthly unique users, hotel shoppers, cost-per-click, gross booking value for experiences, seated diners, dining bookings, and other metrics, to evaluate our business, measure our performance, identify trends affecting our business, formulate business plans and make strategic decisions. While these numbers are based on what we believe to be reasonable estimates for the applicable period of measurement, there are inherent challenges in measuring usage and user engagement across our large user base around the world. For example, a single user may have multiple member accounts or browse the internet on multiple browsers or devices, some users may restrict our ability to accurately identify them across visits, and we are not always able to capture user information on all of our platforms. As such, the calculations of our unique users
|
12 |
may not accurately reflect the actual number of people or organizations using our platform. Our metrics are also affected by applications that automatically contact our servers for regular updates with no discernible user action involved, and this activity can cause our system to count the users associated with such applications as active users on the day or days such contact occurs. As such, the calculation of some of the metrics presented may be affected as a result of this activity. We regularly review our process and may adjust how we calculate our internal metrics to improve their accuracy.
Variable expense primarily includes costs related to revenue generation, as well as traffic generation costs.
Fixed & discretionary expense primarily includes all other expenses such as compensation costs (including outsourced services), broadcast advertising, G&A and other discretionary costs, not including depreciation, amortization, restructuring and other related reorganization costs, stock-based compensation, interest expense, or income taxes.
Tripadvisor, the world's largest travel guidance platform*, helps hundreds of millions of people each month** become better travelers, from planning to booking to taking a trip. Travelers across the globe use the Tripadvisor site and app to discover where to stay, what to do and where to eat based on guidance from those who have been there before. With more than 1 billion reviews and opinions of nearly 8 million businesses, travelers turn to Tripadvisor to find deals on accommodations, book experiences, reserve tables at delicious restaurants and discover great places nearby. As a travel guidance company available in 43 markets and 22 languages, Tripadvisor makes planning easy no matter the trip type.
Subsidiaries of Tripadvisor, Inc. (Nasdaq: TRIP), own and operate a portfolio of travel media brands and businesses, operating under various websites and apps, including the following websites: www.bokun.io, www.cruisecritic.com, www.flipkey.com, www.thefork.com, www.helloreco.com, www.holidaylettings.co.uk, www.housetrip.com, www.jetsetter.com, www.niumba.com,www.seatguru.com, www.singleplatform.com, www.vacationhomerentals.com, and www.viator.com.
*Source: SimilarWeb, unique users de-duplicated monthly, June 2022
**Source: Tripadvisor internal log files
|
13 |
Exhibit 99.3

Tripadvisor Segment Reporting Update Memo
August 4, 2022
As referenced in prior shareholder letters, we have been evaluating changes to our segment information. This quarter, Q2 2022, we are disclosing our financial information under a new segment structure. To ensure that you have a basis for comparison, attached are segment financials, which have been recast by quarter in the new segment structure, starting in Q1 2019.
New reporting
We now report under three reportable segments, Tripadvisor Core, Viator, and TheFork, and we will include a corporate & eliminations category. A summary of the changes are as follows:
Tripadvisor Core
Viator
TheFork
Eliminations
Other Considerations
The tables below describe the revenue and expense components of updated segments and the relationship to previous segments, and the following page provides updated segment financials recast for certain prior periods.
TRIPADVISOR CORE SEGMENT |
Relationship to Previous Segment |
|
Description |
|
Revenue |
Tripadvisor Branded Hotels |
Formerly included in legacy HM&P segment |
|
Former legacy Tripadvisor branded hotels revenue line |
|
Tripadvisor Display & Platform |
Formerly included in legacy HM&P segment |
|
Former legacy Display & Platform revenue line |
|
Tripadvisor Experiences & Dining |
Formerly included in legacy E&D segment revenue |
|
Tripadvisor restaurant services revenue |
|
Other |
Other revenue |
|
Includes all revenue from legacy Other line (cruises, rentals, flights, and cars) |
Expenses |
Tripadvisor segment expenses |
Expenses formerly included in legacy HM&P segment |
|
|
|
|
Expenses formerly included in legacy Other |
|
|
|
|
Certain expenses formerly included in legacy E&D segment |
>> |
Direct costs and people costs incurred in support of Tripadvisor Experiences and Dining revenue lines |
|
|
|
|
|
VIATOR SEGMENT |
Relationship to Previous Segment |
|
Description |
|
Revenue |
Viator Revenue |
All Experiences revenue, formerly included in legacy E&D segment |
|
|
Expenses |
Viator segment expenses |
Certain expenses formerly included in legacy E&D segment |
>> |
All expenses related to Viator, inclusive of affiliate marketing fee to Tripadvisor for bookings generated on Tripadvisor and fulfilled by Viator, and allocation of certain corporate costs |
|
|
|
|
|
THEFORK SEGMENT |
Relationship to Previous Segment |
|
Description |
|
Revenue |
TheFork Revenue |
Revenue related to TheFork point of sale, formerly included in the legacy E&D segment |
|
|
Expenses |
TheFork segment expenses |
Certain expenses formerly included in legacy E&D segment |
>> |
All expenses related to TheFork, inclusive of affiliate marketing fee to Tripadvisor for bookings generated on Tripadvisor and fulfilled by TheFork, and allocation of certain corporate costs |
|
|
|
|
|
Intersegment Eliminations (1) |
Relationship to Previous Segment |
|
Description |
|
Revenue |
Tripadvisor Experiences & Dining Revenue |
Formerly included in the legacy E&D segment as intra-segment eliminations |
>> |
Elimination of revenue recognized by Tripadvisor from affiliate marketing fees received from Viator and TheFork |
Expenses |
|
Certain expenses formerly included in the legacy E&D segment as intra-segment eliminations |
>> |
Expense elimination from Viator and TheFork, equal to affiliate marketing fees received by Tripadvisor |
|
|
|
|
|
(1) Revenue and expense earned and charged between segments are eliminated upon consolidation. Eliminations result in net neutral impact to adjusted EBITDA. |
||||
(in $millions, except percentages) |
Q1 2019 |
Q2 2019 |
Q3 2019 |
Q4 2019 |
FY19 |
|
Q1 2020 |
Q2 2020 |
Q3 2020 |
Q4 2020 |
FY20 |
|
Q1 2021 |
Q2 2021 |
Q3 2021 |
Q4 2021 |
FY21 |
|
Q1 2022 |
Q2 2022 |
|
|
|
|
|
|
|
|
|
|
|
|
|
|
|
|
|
|
|
|
|
Tripadvisor Core Segment Revenue |
317 |
327 |
323 |
256 |
1,223 |
|
223 |
53 |
114 |
94 |
483 |
|
107 |
184 |
212 |
162 |
665 |
|
191 |
274 |
as % of 2019 |
|
|
|
|
|
|
70% |
16% |
35% |
37% |
39% |
|
34% |
56% |
66% |
63% |
54% |
|
60% |
84% |
Tripadvisor Branded Hotels |
216 |
211 |
197 |
155 |
779 |
|
137 |
31 |
67 |
57 |
292 |
|
74 |
131 |
143 |
103 |
451 |
|
135 |
188 |
as % of 2019 |
|
|
|
|
|
|
63% |
15% |
34% |
37% |
37% |
|
34% |
62% |
73% |
66% |
58% |
|
63% |
89% |
Display & Platform |
38 |
43 |
41 |
39 |
161 |
|
32 |
7 |
13 |
17 |
69 |
|
14 |
26 |
29 |
29 |
98 |
|
26 |
37 |
as % of 2019 |
|
|
|
|
|
|
84% |
16% |
32% |
44% |
43% |
|
37% |
60% |
71% |
74% |
61% |
|
68% |
86% |
Tripadvisor Experiences & Dining (1) |
21 |
30 |
36 |
30 |
117 |
|
28 |
8 |
16 |
14 |
65 |
|
12 |
16 |
23 |
20 |
70 |
|
20 |
35 |
as % of 2019 |
|
|
|
|
|
|
133% |
27% |
44% |
47% |
56% |
|
57% |
53% |
64% |
67% |
60% |
|
95% |
117% |
Other |
42 |
43 |
49 |
32 |
166 |
|
26 |
7 |
18 |
6 |
57 |
|
7 |
11 |
17 |
10 |
46 |
|
10 |
14 |
as % of 2019 |
|
|
|
|
|
|
62% |
16% |
37% |
19% |
34% |
|
17% |
26% |
35% |
31% |
28% |
|
24% |
33% |
Tripadvisor Core Segment Adj. EBITDA |
118 |
131 |
129 |
98 |
476 |
|
73 |
(35) |
27 |
(3) |
64 |
|
7 |
49 |
73 |
49 |
177 |
|
55 |
116 |
Adj. EBITDA Margin |
37% |
40% |
40% |
38% |
39% |
|
33% |
-66% |
24% |
-3% |
13% |
|
7% |
27% |
34% |
30% |
27% |
|
29% |
42% |
|
|
|
|
|
|
|
|
|
|
|
|
|
|
|
|
|
|
|
|
|
Viator Segment |
44 |
85 |
97 |
61 |
288 |
|
36 |
1 |
9 |
8 |
55 |
|
12 |
40 |
73 |
59 |
184 |
|
56 |
136 |
as % of 2019 |
|
|
|
|
|
|
82% |
1% |
9% |
13% |
19% |
|
27% |
47% |
75% |
97% |
64% |
|
127% |
160% |
Viator Segment Adj. EBITDA |
(23) |
(2) |
1 |
(4) |
(28) |
|
(24) |
(18) |
(13) |
(16) |
(72) |
|
(14) |
(13) |
1 |
(6) |
(31) |
|
(20) |
0 |
Adj. EBITDA Margin |
-52% |
-2% |
1% |
-7% |
-10% |
|
-67% |
-1800% |
-144% |
-200% |
-131% |
|
-117% |
-33% |
1% |
-10% |
-17% |
|
-36% |
0% |
|
|
|
|
|
|
|
|
|
|
|
|
|
|
|
|
|
|
|
|
|
TheFork Segment |
28 |
31 |
34 |
35 |
127 |
|
31 |
6 |
32 |
17 |
86 |
|
7 |
18 |
30 |
30 |
85 |
|
26 |
32 |
as % of 2019 |
|
|
|
|
|
|
111% |
19% |
94% |
49% |
68% |
|
25% |
58% |
88% |
86% |
67% |
|
93% |
103% |
TheFork Segment Adj. EBITDA |
(6) |
(1) |
(1) |
(2) |
(10) |
|
(9) |
(21) |
1 |
(14) |
(43) |
|
(19) |
(11) |
(2) |
(14) |
(46) |
|
(8) |
(7) |
Adj. EBITDA Margin |
-21% |
-3% |
-3% |
-6% |
-8% |
|
-29% |
-350% |
3% |
-82% |
-50% |
|
-271% |
-61% |
-7% |
-47% |
-54% |
|
-31% |
-22% |
|
|
|
|
|
|
|
|
|
|
|
|
|
|
|
|
|
|
|
|
|
Intersegment Revenue Eliminations (1) |
(13) |
(21) |
(26) |
(17) |
(78) |
|
(12) |
(1) |
(4) |
(3) |
(20) |
|
(3) |
(7) |
(12) |
(10) |
(32) |
|
(11) |
(25) |
|
|
|
|
|
|
|
|
|
|
|
|
|
|
|
|
|
|
|
|
|
|
|
|
|
|
|
|
|
|
|
|
|
|
|
|
|
|
|
|
|
|
Consolidated Revenue |
376 |
422 |
428 |
335 |
1,560 |
|
278 |
59 |
151 |
116 |
604 |
|
123 |
235 |
303 |
241 |
902 |
|
262 |
417 |
as % of 2019 |
|
|
|
|
|
|
74% |
14% |
35% |
35% |
39% |
|
33% |
56% |
71% |
72% |
58% |
|
70% |
99% |
Consolidated Adj. EBITDA (2) |
89 |
128 |
129 |
92 |
438 |
|
40 |
(74) |
15 |
(33) |
(51) |
|
(26) |
25 |
72 |
29 |
100 |
|
27 |
109 |
Adj. EBITDA Margin (3) |
24% |
30% |
30% |
27% |
28% |
|
14% |
-125% |
10% |
-28% |
-8% |
|
-21% |
11% |
24% |
12% |
11% |
|
10% |
26% |
|
|
|
|
|
|
|
|
|
|
|
|
|
|
|
|
|
|
|
|
|
GAAP Net Income (Loss) (4) |
26 |
34 |
50 |
15 |
126 |
|
(16) |
(153) |
(48) |
(73) |
(289) |
|
(80) |
(40) |
1 |
(29) |
(148) |
|
(34) |
31 |
GAAP Net Income (Loss) Margin |
7% |
8% |
12% |
4% |
8% |
|
-6% |
-259% |
-32% |
-63% |
-48% |
|
-65% |
-17% |
0% |
-12% |
-16% |
|
-13% |
7% |
|
|
|
|
|
|
|
|
|
|
|
|
|
|
|
|
|
|
|
|
|
(1) Tripadvisor experiences and dining revenue within the Tripadvisor Core segment shown in this table are gross of intersegment (intercompany) revenue, which is eliminated on a consolidated basis. Eliminations result in net neutral impact to adjusted EBITDA. |
||||||||||||||||||||
(2) Consolidated Adjusted EBITDA is a non-GAAP financial measure. For a reconciliation of this measure to the most directly comparable GAAP measure, please refer to the reconciliations available in our supplemental financials on our investor relations website at http://ir.tripadvisor.com. |
||||||||||||||||||||
(3) Tripadvisor defines “Consolidated Adjusted EBITDA margin” as Consolidated Adjusted EBITDA divided by revenue. |
||||||||||||||||||||
(4) This amount reflects our consolidated GAAP Net Income (Loss) for the periods presented. Tripadvisor does not calculate or report net income (loss) by segment. |
||||||||||||||||||||
|
|
|
|
|
|
|
|
|
|
|
|
|
|
|
|
|
|
|
|
|
Note: Due to rounding, figures may not sum to total |
||||||||||||||||||||
Contact: [email protected]
TRIP-G
Serious News for Serious Traders! Try StreetInsider.com Premium Free!
You May Also Be Interested In
- Tripadvisor to Host First Quarter 2024 Conference Call on May 8, 2024
- Robbins LLP Reminds LYFT Stockholders of Pending May 6, 2024 Lead Plaintiff Deadline
- Robbins LLP Reminds IRobot Corporation Shareholders of the Pending May 7, 2024 Lead Plaintiff Deadline
Create E-mail Alert Related Categories
SEC FilingsSign up for StreetInsider Free!
Receive full access to all new and archived articles, unlimited portfolio tracking, e-mail alerts, custom newswires and RSS feeds - and more!
