

Form 8-K Square, Inc. For: May 06
FREE Breaking News Alerts from StreetInsider.com!
StreetInsider.com Top Tickers, 7/14/2026
- Wall Street ends lower as Iran tensions dampen risk appetite; chipmakers drop
- SK Hynix’s record plunge drags down global chip stocks
- Oil up 9% to one-month high as US says it will blockade entire Iranian coastline, all vessels
- Ditching streaming could boost Disney stock by 40%, Wells Fargo says
- AstraZeneca stock dips as HSBC downgrades stock on 'tough path ahead'
 Tweet
Tweet Share
ShareExhibit 99.1

Highlights

|

|

| ||
|
In the first quarter of 2021, we |
Our upmarket sellers experienced |
Our customers have found increased |
FIRST QUARTER FINANCIAL METRICS
In the first quarter of 2021, total net revenue was $5.06 billion, up 266% year over year, and, excluding bitcoin revenue, total net revenue was $1.55 billion, up 44% year over year.
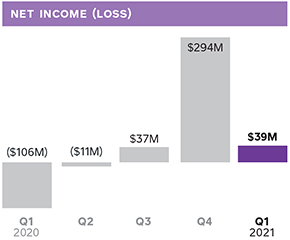
In the first quarter of 2020, net income (loss) and Adjusted EBITDA were significantly affected by an increase in provisions for transaction and loan losses as a result of the anticipated impact of COVID-19.
The following items affected net income (loss) per share during the respective periods. In the second quarter of 2020, we recognized a gain of $21 million related to observable price changes for non-marketable equity investments. In the fourth quarter of 2020, we recognized a gain of $274 million related to equity investments, driven primarily by a gain of $255 million as a result of the mark-to-market valuation of our investment in DoorDash. In the first quarter of 2021, we recognized a loss of $29 million related to the mark-to-market valuation of our investment in DoorDash as well as a $20 million bitcoin impairment.
A reconciliation of non-GAAP financial measures used in this letter to their nearest GAAP equivalents is provided at the end of this letter.
|
|
SQUARE Q1 2021 2 |
ON THE COVER
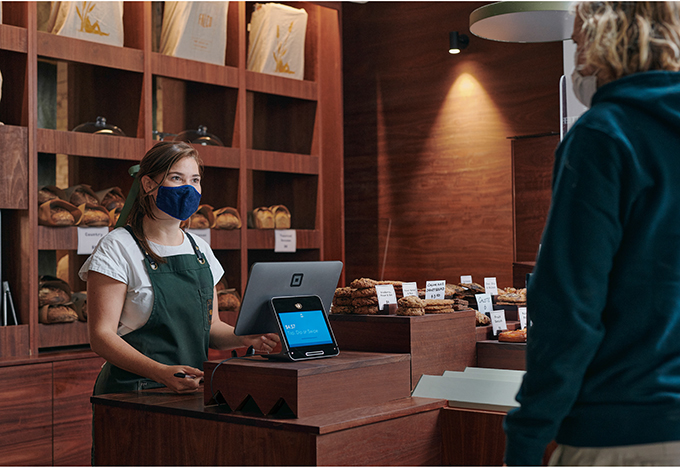
Craft + Carry, a taproom and beer store in New York City, uses Square Point of Sale, Square Loyalty, Square Team Management Plus, Square Marketing, Square Online, Square Terminal, Square Register, Square Gift Cards, and Pointy API through our App Marketplace.
CASH APP HIGHLIGHT
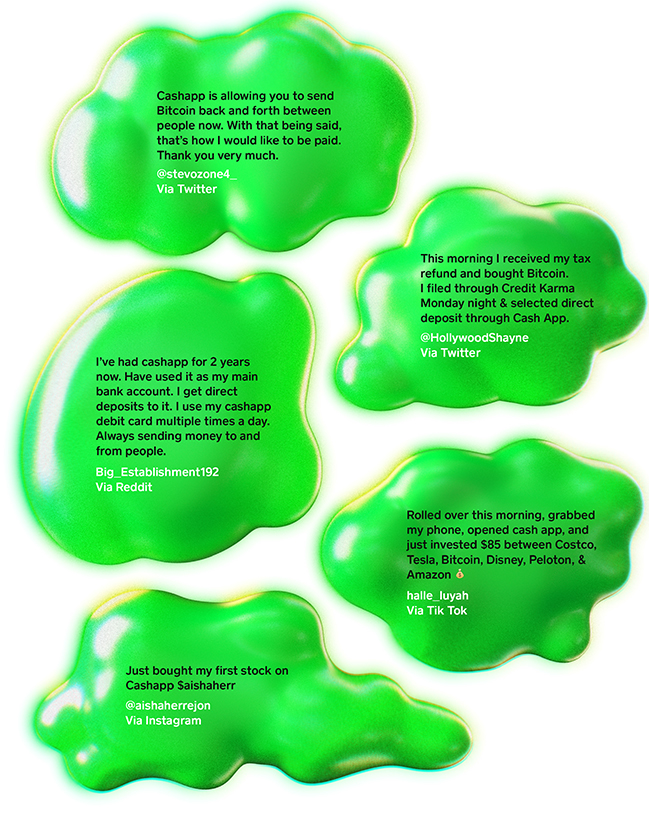
We offer customers the unique ability to send bitcoin to friends and family directly within Cash App instead of leaving the platform or locating a bitcoin wallet address.
May 6, 2021
The Paycheck Protection Program (PPP) is a loan designed to provide a direct incentive for small businesses to keep their workers on the payroll.

To Our Shareholders
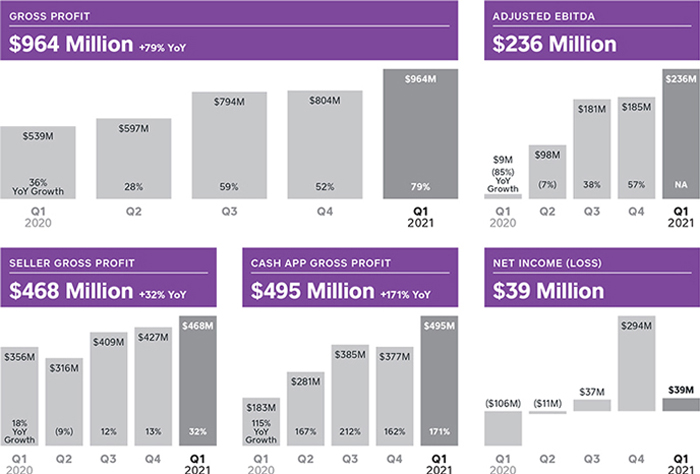
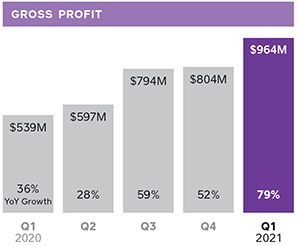
We delivered strong growth at scale during the first quarter of 2021. Gross profit grew 79% year over year to $964 million. In our Seller ecosystem, gross profit was up 32% year over year in the first quarter. Our Cash App ecosystem delivered gross profit growth of 171% year over year.
As a company, we continue to believe our purpose of economic empowerment is more important than ever. This quarter, we again participated in the Paycheck Protection Program (PPP), enabling us to uplift many of the businesses most in need through forgivable loans. As the macroeconomic environment remains uncertain, we are focused on helping our sellers and individuals thrive for the long term. To help support individuals, we made government disbursements available to customers through Cash App and facilitated payments to customers up to two days early. For each of our Seller and Cash App ecosystems, we remain encouraged by the opportunity to reach new audiences by increasing our investments in customer acquisition and product innovation, especially as regions in the U.S. and international markets begin to reopen.
|
|
SQUARE Q1 2021 3 |
Square Messages is accessible from sellers’ online Square Dashboard and is available with all Square apps on Android and iOS devices, including Square Appointments, Square for Retail, Square Point of Sale, and Square for Restaurants.
1. How Consumers Use Messaging, Twilio.
We consider upmarket to be our larger sellers, including SMB and mid-market sellers.
Seller GPV (Gross Payment Volume) represents payment volume from our Seller ecosystem. Seller GPV is composed of the total dollar amount of all card payments processed by sellers using Square, net of refunds, and does not include GPV from our Cash App ecosystem.
A larger seller generates more than $125,000 in annualized GPV. An SMB seller generates between $125,000 and $500,000 in annualized GPV. A mid-market seller generates more than $500,000 in annualized GPV.
SELLER ECOSYSTEM
Enhancing our ecosystem of products
We continued to build upon our omnichannel capabilities by launching Square Messages, a new feature that helps sellers interact with their buyers more effectively through text message or email. Instead of making a phone call, a hair stylist can simply check in with new clients within seconds through a message or hear from a customer who may be running late. Nine out of ten consumers expressed interest in messaging businesses directly, and we believe Square Messages will help sellers build more meaningful relationships with their buyers, which has become increasingly important in an omnichannel world.1
We have played a crucial role in helping sellers access government funding during the pandemic. In February, we began participating in the current round of the PPP to support small businesses that have been affected by COVID-19. In the first quarter, Square Capital facilitated $531 million in PPP loans, providing access to a financial lifeline to more than 57,000 small businesses. In keeping with our purpose of economic empowerment, we helped reach sellers who are typically overlooked by traditional financial institutions: During the first quarter, the vast majority of our PPP loans were distributed to sellers with fewer than five employees. We see a meaningful opportunity to expand access to banking products for small businesses, and we opened our bank, Square Financial Services, in March to pursue this effort.
Growing upmarket
Our ecosystem of products continued to support growth of larger sellers. In the first quarter, mid-market Seller GPV grew 43% year over year, more than 2x the growth of total Seller GPV. With our increase in sales and marketing investments, we see an opportunity to continue driving awareness of our broader ecosystem among larger sellers.
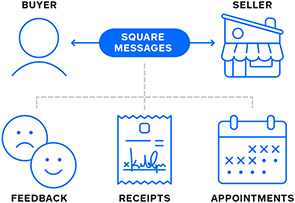
Square Messages provides a single channel for sellers to manage their relationships with customers, allowing them to view and reply to texts or emails regarding feedback, receipts, and appointment reminders in one place.
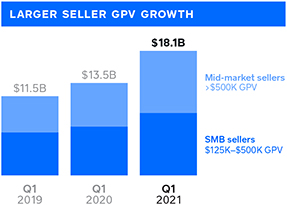
We have continued to move upmarket with larger sellers, and our mid-market category has achieved strong growth. In the first quarter, GPV from mid-market sellers increased 43% year over year, more than 2x the growth of total Seller GPV.
|
|
SQUARE Q1 2021 4 |
1. Metric is the average number of Square products, excluding hardware devices, used by Square for Restaurants and Square for Retail sellers during the first quarter of 2021.
2. Represents total gross profit from sellers that use Square for Restaurants and Square for Retail. Gross profit for only the Square for Restaurants and Square for Retail products (inclusive of SaaS and payment processing revenue) was $66 million on an annualized basis in the first quarter.
Australia represented our largest international market as a percent of total Seller GPV.
Our vertical point-of-sale software has attracted new and larger sellers to Square. In the first quarter, more than half of Square for Restaurants and Square for Retail sellers onboarded were new to Square. Restaurants and retailers value the cohesion of Square’s ecosystem to help them manage their businesses efficiently, and have adopted more than three products on average.1 These sellers have used more of our broader ecosystem and generated gross profit of more than 5x greater compared to the average seller. We have seen encouraging momentum from Square for Restaurants and Square for Retail: Overall gross profit from sellers using these products was nearly $140 million on an annualized basis during the first quarter, doubling year over year.2
Expanding globally
Strengthening our international presence remains a key priority for our Seller ecosystem, and we are focused on achieving product parity globally. In the first quarter, we launched Square Terminal in Japan, as well as Square Register in both the U.K. and Australia, to enable more contactless commerce experiences and attract larger sellers. We also introduced Square Appointments in the U.K. to help sellers accept online bookings. As we grow upmarket, we believe these versatile products will attract larger businesses with more complex needs.
During the first quarter, despite strict lockdowns around the world, Seller gross profit in our international markets grew nearly 80% year over year and represented 8% of Seller gross profit. We see an opportunity to further scale globally as we continue expanding our software and financial services offerings. In Australia, our largest international market, gross profit doubled year over year in the first quarter due primarily to strong acquisition of new sellers and continued growth upmarket.

|
Square for Restaurants is an all-in-one restaurant point-of-sale system that includes more capabilities such as integrated table management, a kitchen display system, and online order management. | |
|
|
Square for Retail is an all-in-one retail point of sale system that includes integrated inventory, vendor, and customer relationship management, and online order management. |


In March, we launched Square Terminal in Japan to provide sellers with an all-in-one solution that allows them to accept contactless payments quickly and securely. Makers’ Base in Tokyo, Japan, uses Square Terminal, Square Reader, and Square Online.
|
|
SQUARE Q1 2021 5 |
A transacting active Cash App customer has at least one financial transaction using any product or service within Cash App during the specified period. A transacting active customer for a specific Cash App product has at least one financial transaction using that product during the specified period and is referred to as an active.
Beyond peer-to-peer, Cash Card saw the highest adoption of any product in the first quarter of 2021.
CASH APP ECOSYSTEM
Strengthening the network
We are focused on strengthening our network by reaching new audiences and creating differentiated experiences across our products. In the first quarter, we continued to scale our marketing efforts to bring in new customers, increase adoption, and drive engagement for existing customers. In March, Cash App began offering customers the ability to instantly send bitcoin for free. Customers can send bitcoin to friends and family all within Cash App instead of leaving the platform or locating an individual bitcoin wallet address—a unique intersection of our bitcoin and peer-to-peer functionality. Since launch, we have seen the feature drive early adoption by existing customers as well as attract new customers to bitcoin, drawing upon the network effects in peer to peer.
As we grow our Seller and Cash App ecosystems, we believe the opportunities for connections between them become more compelling. In the first quarter, we integrated Square Loyalty into Cash App to serve as a flywheel for seller and buyer discovery, engagement, and retention. Once customers complete a purchase from a seller using Square Loyalty, they receive a text message with a link to open or download Cash App, where they can view and manage rewards in a centralized place. By reaching any buyer using Square Loyalty, we believe this seamless integration will help bring new customers into Cash App while also deepening the seller-buyer connection.
Driving engagement
We have seen a strong relationship between product adoption and greater engagement with our ecosystem. Cash Card has the greatest scale of any Cash App product, reaching more than 10 million monthly Cash Card actives in March. Customers have used their card for everyday purchases, including food, transportation services, and at major retailers, and have transacted more frequently over time: In March, 7 million Cash Card customers transacted on a weekly basis on average, nearly doubling year over year as we have seen monthly actives increasingly become weekly actives. As engagement has grown, so has spend—in the first quarter, spend through Cash Card was up approximately 2.5x compared to the prior year and the majority of weekly actives transacted multiple times per week. Cash Card has served as an entry point into our broader ecosystem, as Cash Card actives adopted nearly twice the number of products as non-Cash Card actives in the first quarter.

Square Loyalty + Cash App
This integration allows us to bring commerce to Cash App via Square’s vast network of sellers and buyers.

7 million weekly Cash Card actives
Cash Card customers have transacted more frequently over time: In March, there were 7 million weekly Cash Card actives on average, nearly doubling year over year.
|
|
SQUARE Q1 2021 6 |
Spending power drove growth in March
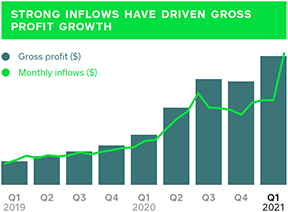
A primary driver of Cash App’s gross profit growth has been inflows, or the amount of money our customers pull into Cash App. In 2021, a top strategic priority for Cash App is to make it easier for customers to bring funds into the ecosystem, which we have seen ultimately helps drive engagement. Customers can fund their Cash App accounts in a variety of ways—such as adding cash from their primary bank account and receiving a peer-to-peer transfer.
When the spending power of our customers increases, we have seen them pull funds into Cash App to use across our ecosystem. In March, Cash App experienced a significant increase in inflows as customers brought approximately 55% more funds into our ecosystem compared to February, driven primarily by an increase in government disbursements. While we saw an uplift in direct deposit volumes in mid-March, inflows from all other sources combined were significantly greater, as customers pulled more funds into Cash App in the weeks following. These funds are being used across our ecosystem for many different needs: Among peer-to-peer payments sent between customers, top use cases included critical needs such as rent, car payments, and utility bills.
In March, Cash App experienced a significant increase of inflows from individuals’ greater spending power related to government disbursements.
Customers can fund their Cash App accounts with inflows in a variety of ways: Peer-to-peer transfers, transactions on bitcoin or stocks, cash added from a debit card or bank account into a Cash App balance, and through direct deposits including recurring paychecks or one-time deposits.
|
|
SQUARE Q1 2021 7 |
A reconciliation of non-GAAP metrics used in this letter to their nearest GAAP equivalents is provided at the end of this letter.
We deduct bitcoin revenue because our role is to facilitate customers’ access to bitcoin. When customers buy bitcoin through Cash App, we only apply a small margin to the market cost of bitcoin, which tends to be volatile and outside our control. Therefore, we believe bitcoin gross profit better reflects the economic benefits as well as our performance from these transactions.
Financial Discussion
REVENUE AND GROSS PROFIT
Total net revenue was $5.06 billion in the first quarter of 2021, up 266% year over year. Excluding bitcoin, total net revenue in the first quarter was $1.55 billion, up 44% year over year. Gross profit was $964 million in the first quarter of 2021, up 79% year over year.
Transaction-based revenue was $960 million in the first quarter of 2021, up 27% year over year, and transaction-based gross profit was $435 million, up 49% year over year. We processed $33.1 billion in GPV in the first quarter of 2021, up 29% year over year. Transaction-based gross profit as a percentage of GPV was 1.31% in the first quarter of 2021, up 17 basis points year over year and up 8 basis points quarter over quarter.
Subscription and services-based revenue was $558 million in the first quarter of 2021, up 88% year over year, and subscription and services-based gross profit was $469 million, up 84% year over year. Growth in the quarter was driven by our Cash App and Seller ecosystems.
During the first quarter of 2021, we saw significant growth in bitcoin revenue year over year. While bitcoin revenue was $3.51 billion in the first quarter of 2021, up approximately 11x year over year, bitcoin gross profit was only $75 million, or approximately 2% of bitcoin revenue.
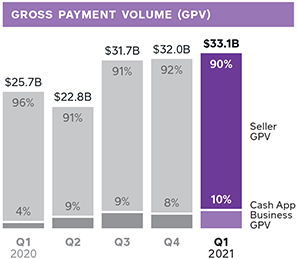
Note: Seller GPV and Cash App Business GPV are represented as a percent of total GPV. Cash App Business GPV is defined on page 11.
|
|
SQUARE Q1 2021 8 |
We use gross profit retention to measure our ability to help our sellers grow over time.
Gross profit retention rate is calculated as the year-over-year gross profit growth of a quarterly seller cohort, averaged over the last four quarters (excluding gross profit from hardware, Square Gift Cards, Caviar, and Weebly prior to the acquisition). For example, retention for our 2019 cohort is the average annual gross profit growth from sellers onboarded in 2019. We do not include hardware or Square Gift Cards because they are typically non-recurring in nature, and we view hardware as an acquisition tool and not a profit center for our business. A seller cohort represents the new sellers onboarded to Square during a given period.
1. All growth comparisons for the first quarter of 2021 are on a year-over-year basis.
Card-not-present GPV includes our online channels and card-not-present manual key entry transactions.
SELLER ECOSYSTEM REVENUE AND GROSS PROFIT
In the first quarter of 2021, our Seller ecosystem generated $1.02 billion of revenue and $468 million of gross profit, up 19% and 32% year over year, respectively.
In the first quarter of 2021, Seller generated $868 million of transaction-based revenue, up 19% year over year. We saw continued strong growth in online channels and international markets, as well as improving recovery in the U.S. supported by regional reopenings and government disbursements. During the quarter, transaction-based gross profit for our Seller ecosystem benefited from a higher percentage of debit card transactions, a higher proportion of card-not-present volumes, and an increase in average transaction size on a year-over-year basis. We recognize that these trends are elevated relative to historical periods partly as a result of changes to consumer behaviors due to COVID-19 and government disbursements, which may not continue in future quarters.
In the first quarter of 2021, we achieved positive gross profit retention driven by regional reopenings and government disbursements, as well as lapping the impact of COVID-19 in March 2020. We experienced a notable recovery in March of 2021, as GPV from existing cohorts returned nearly to their March 2019 volumes, with each existing annual cohort exhibiting a similar trend. We saw particular strength from recently acquired cohorts, which had a greater mix of larger sellers.
During the first quarter of 2021, Seller GPV was up 20% year over year. Year-over-year Seller GPV growth was relatively consistent in January and February, up 5% excluding the impact of leap year, before improving in March. In March, growth improved as a result of regional reopenings, government disbursements related to stimulus programs, and lapping the impact of COVID-19 in March 2020. Looking at the components of Seller GPV, we observed the following trends during the first quarter of 2021.¹
| • | Products: Card-not-present GPV was up 34% year over year, driven by growth from our online channels, including Square Online, Invoices, Virtual Terminal, and eCommerce API. Card-present GPV achieved positive growth, up 13% year over year. Regional trends in card-present volumes depended on changes to local reopening measures, among other factors. |
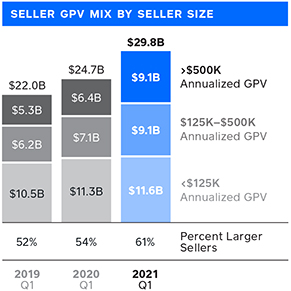
Note: We determine seller size based on annualized GPV during the applicable quarter. This only includes Seller GPV. Larger sellers are defined as greater than $125K in annualized GPV. Some sellers who were larger in size prior to COVID-19 may have fallen into smaller seller categories from the second quarter of 2020 through the first quarter of 2021 given lower processing volumes.
|
|
SQUARE Q1 2021 9 |
We began facilitating access to PPP loans in response to the COVID-19 pandemic, and PPP loans were not part of the ordinary course of operations for Square Capital prior to 2020. Future PPP loans or similar government programs will depend on government action and, at this time, we do not know to what extent these types of programs will continue, if at all.
For PPP loans sold to an institutional third-party investor, we shared economics with the investor, recognized the majority of revenue upon the sale, and deferred a portion allocated to servicing obligations. For PPP loans held on our balance sheet, we retained a greater portion of the economics, which we intend to recognize as revenue over the life of the loan. We earned lower revenue on PPP loans compared to core flex loans.
Hardware is sold primarily as an acquisition tool, and generating positive gross margins from hardware sales is not the primary goal of the hardware business.
| • | Geographies: Our largest U.S. metropolitan areas experienced a greater improvement in Seller GPV compared to the rest of the U.S., primarily as a result of regional reopenings. These metros had experienced a more pronounced impact to growth in prior quarters due to regional restrictions. Our international markets achieved strong Seller GPV growth year over year during the first quarter despite periodic regional lockdowns affecting in-person activity, with particular strength from Australia and Canada. |
Seller generated $121 million of subscription and services-based revenue during the first quarter of 2021, up 18% year over year. Seller subscription and services-based revenue from products other than Square Capital grew 38% year over year in the first quarter.
| • | Square Capital: Square Capital facilitated approximately 136,000 loans in the first quarter of 2021, totaling $923 million, up 68% year over year. PPP loans totaled $531 million across more than 57,000 loans. Flex loans totaled $392 million across more than 78,000 loans, with volumes down year over year: After pausing flex loan offers from early March to late July of 2020, we have been measured in our ongoing ramp of offers to sellers. Revenue from Square Capital was down on a year-over-year basis due to a lower mix of flex loans during the quarter. |
| • | Software subscriptions and Square Card delivered strong growth during the quarter, outpacing overall Seller gross profit growth. Software subscription growth benefited from lapping the impact from refunding sellers’ subscription fees for the month of March 2020 due to the onset of COVID-19. |
Hardware revenue in the first quarter of 2021 was $29 million, up 39% year over year, and generated a gross loss of $12 million. Revenue growth was driven by strong unit sales across nearly all of our hardware product offerings, with particular strength in Square Register, which launched in the U.K. and Australia, as well as Square Terminal, which launched in Japan.
|
|
SQUARE Q1 2021 10 |
Cash App Business GPV is composed of the total dollar amount of Cash for Business and peer-to-peer payments sent from a credit card, and does not include GPV from our Seller ecosystem.
Bitcoin revenue is the total sale amount of bitcoin to customers. Bitcoin costs are the total amount of bitcoin that we purchase. We purchase bitcoin to facilitate customers’ access to bitcoin.
CASH APP ECOSYSTEM REVENUE AND GROSS PROFIT
Cash App delivered strong growth in the first quarter of 2021, generating $4.04 billion of revenue and $495 million of gross profit, which increased 666% and 171% year over year, respectively. Excluding bitcoin, Cash App revenue was $529 million for the first quarter, up 139% year over year. We continued to drive acquisition of net-new transacting active Cash App customers as well as engagement with Cash Card, Boost, direct deposit, stock brokerage, bitcoin investing, and business accounts. We also saw strong growth in customer inflows during the first quarter, driven primarily by government fund disbursements, which helped lead to increased engagement and adoption of more products within our Cash App ecosystem.
Cash App Business GPV was $3.4 billion, up 227% year over year. Cash App generated $92 million of transaction-based revenue during the first quarter of 2021, up 231% year over year. Growth was driven by an increase in the number of business accounts and in the number of transactions per business account.
Cash App generated $437 million of subscription and services-based revenue during the first quarter, up 125% year over year. Growth in the quarter was driven primarily by transaction fees from both Instant Deposit and Cash Card.
Cash App generated $3.51 billion of bitcoin revenue and $75 million of bitcoin gross profit during the first quarter of 2021, each up approximately 11x year over year. Bitcoin revenue and gross profit benefited from a year-over-year increase in the price of bitcoin, bitcoin actives, and growth in customer demand. In future quarters, we recognize that bitcoin revenue may fluctuate as a result of changes in customer demand or the market price of bitcoin.
|
|
SQUARE Q1 2021 11 |
We offer the peer-to-peer service free to our Cash App customers, and we consider it to be a marketing tool to encourage the use of Cash App.
Each quarter, we estimate transaction losses that may materialize in future periods related to that quarter’s volume. These estimates are typically based on predictive data science–based models, which historically have been close to future actual realized losses.
The accounting rules for bitcoin will require us to recognize any decreases in market price below carrying value as an impairment charge, with no upward revisions recognized when the market price increases until the sale of that bitcoin. The bitcoin impairment loss is a GAAP expense.
Non-GAAP operating expenses exclude bitcoin impairment losses.
OPERATING EXPENSES
Operating expenses were $896 million in the first quarter of 2021, up 42% year over year, and non-GAAP operating expenses were $732 million, up 38% year over year.
Product development expenses were $309 million on a GAAP basis and $204 million on a non-GAAP basis in the first quarter of 2021, up 58% and 63% year over year, respectively, driven primarily by headcount and personnel costs related to our engineering, data science, and design teams.
Sales and marketing expenses were $349 million on a GAAP basis and $337 million on a non-GAAP basis in the first quarter of 2021, both up 80% year over year.
| • | Cash App marketing expenses were up 94% year over year, driven primarily by increases in peer-to-peer transactions and related transaction losses, Cash Card issuances, advertising, and referrals and incentives. |
| • | Other sales and marketing expenses, including advertising, personnel, and other costs, were up 59% year over year as we increased sales and marketing spend for our Seller ecosystem, including performance marketing, brand and awareness marketing, and sales headcount. |
General and administrative expenses were $196 million on a GAAP basis and $170 million on a non-GAAP basis in the first quarter of 2021, up 51% and 53% year over year, respectively. The increase was due primarily to additions to customer support, finance, legal, and compliance personnel.
Transaction and loan loss expenses were $20 million in the first quarter of 2021, down 81% year over year and up 25% quarter over quarter. During the first quarter, we released provisions for transaction losses related to the fourth quarter of 2020, although overall expenses still decreased on a year-over-year basis due to the significant increase in provisions built during the prior-year period due to the COVID-19 pandemic. Given the variability of potential outcomes related to the macro environment, actual realized losses may differ materially from our estimates for provisions. Transaction and loan loss expenses related to Cash App increased year over year, driven by Cash App’s strong growth during the quarter.
In the fourth quarter of 2020 and first quarter of 2021, we invested $50 million and $170 million, respectively, in bitcoin. As an indefinite-lived intangible asset, bitcoin is subject to impairment losses if the fair value of bitcoin decreases below the carrying value during the assessed period. In the first quarter, we recognized a bitcoin impairment loss of $20 million on our bitcoin investment. As of March 31, 2021, the fair value of our investment in bitcoin was $472 million based on observable market prices, which is $272 million greater than the carrying value of the investment.
|
|
SQUARE Q1 2021 12 |
EARNINGS
In the first quarter of 2021, net income was $39 million. Net income was $88 million when excluding losses of $29 million related to our investment in DoorDash and $20 million related to the impairment of our bitcoin investment. Net income per share was $0.09 and $0.08 on a basic and diluted basis, respectively, in the first quarter of 2021, based on 455 million weighted-average basic shares and 501 million weighted-average diluted shares. Excluding the losses from our investments in DoorDash and bitcoin, basic and diluted net income per share in the first quarter of 2021 was $0.19 and $0.17, respectively.
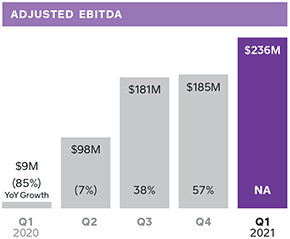
Adjusted EBITDA was $236 million in the first quarter of 2021, compared to $9 million in the first quarter of 2020. The increase in Adjusted EBITDA compared to the prior-year period was driven by gross profit growth across our Seller and Cash App ecosystems, as well as a release of $29 million in existing provisions for transaction losses in our Seller business related to the fourth quarter of 2020. Excluding this release of existing provisions during the quarter, Adjusted EBITDA was $207 million.
Adjusted Net Income Per Share (Adjusted EPS) was $0.41 on a diluted basis based on 525 million weighted-average diluted shares for the first quarter of 2021, representing a $0.43 improvement year over year.
The following items affected net income (loss) per share during the respective periods. In the first quarter of 2021, we recognized a loss of $29 million related to our investment in DoorDash as well as a $20 million bitcoin impairment. In the fourth quarter of 2020, we recognized a gain of $274 million related to equity investments, driven primarily by a gain of $255 million as a result of the mark-to-market valuation of our DoorDash investment. In the second quarter of 2020, we recognized a gain of $21 million related to observable price changes for non-marketable equity investments. See below for a discussion of items that impacted net loss and Adjusted EBITDA in the first quarter of 2020.
In the first quarter of 2020, Adjusted EBITDA and net loss were significantly affected by an increase in provisions for transaction and loan losses as a result of the anticipated impact of COVID-19.
|
|
SQUARE Q1 2021 13 |
As a reminder, the Paycheck Protection Program Liquidity Facility (PPPLF) is a facility established by the Federal Reserve to provide support for the PPP by making non-recourse loans to PPP lenders that are secured by PPP loans. Any cash received by us under the PPPLF would be repaid to the Federal Reserve if the underlying loan is repaid or forgiven.
BALANCE SHEET/CASH FLOW
We ended the first quarter of 2021 with $4.8 billion in available liquidity, with $4.3 billion in cash, cash equivalents, restricted cash, and investments in marketable debt securities, as well as $500 million available to be withdrawn from our revolving credit facility.
In the first quarter of 2021, Adjusted EBITDA, net proceeds from the PPPLF advances, and proceeds from the exercise of stock options contributed positively to our cash balance. This was offset by cash outflows due to purchases of bitcoin and other investments, the timing of purchases of property and equipment, and payments for tax withholding related to vesting of restricted stock units.
In February 2021, we invested $170 million in bitcoin as we believe cryptocurrencies are an instrument of economic empowerment, which aligns with the company’s purpose. We expect to hold this investment for the long term.
In April 2021, we completed the acquisition of a significant majority ownership stake in TIDAL, a global music and entertainment platform, for an aggregate consideration of $302 million. The acquisition extends Square’s purpose of economic empowerment to music artists.
|
|
SQUARE Q1 2021 14 |
April Trends and
Forward-Looking Commentary
Given the uncertainty around the impact and severity of COVID-19, we wanted to provide an update on the trends in our business during the month of April.
BUSINESS TRENDS
Seller ecosystem
| • | In April, Seller delivered strong gross profit growth year over year. Seller GPV was up 144% year over year in April. The two-year compound annual growth rate for Seller GPV in April was 21%, which was relatively consistent with March. In April, GPV growth improved compared to year-over-year results in the first quarter, driven primarily by regional reopenings, government fund disbursements, and lapping the impact of COVID-19 starting in late March of 2020. |
| • | We saw continued strength in GPV from our online channels as well as an improvement in in-person activity, which benefited from regional reopenings. GPV growth trends continued to vary by region, product, and vertical, depending primarily on differences in the timing and phases of reopenings. |
Cash App ecosystem
| • | In April, Cash App delivered strong gross profit growth year over year. As we lapped the government fund disbursements in mid-April of 2020, gross profit growth slowed year over year. |
| • | We achieved strong engagement across products in our Cash App ecosystem. Gross profit growth also benefited from customers pulling more funds into their Cash App accounts in late March and early April, which was driven partly by direct and indirect inflows from the disbursements of government funds. |
Growth comparisons: Looking ahead to the remainder of 2021, we believe two-year compound annual growth rates from 2019 through 2021 will help reflect underlying gross profit trends in each ecosystem. In the second quarter of 2021, Cash App will lap strong gross profit growth of 167% year over year in the second quarter of 2020 as government disbursements began in April 2020. On the other hand, in the second quarter of 2021, Seller gross profit growth will benefit, given that gross profit declined 9% year over year in the second quarter of 2020 due to significant regional restrictions affecting in-person activity.
All growth comparisons for April 2021 are on a year-over-year basis, unless otherwise specified.
The compound annual growth rate (CAGR) is the mean annual growth rate over a specified time period.
Online channels are defined as card-not-present payments through Appointments, Virtual Terminal, Invoices, eCommerce API, In-App Payments SDK, Square Online, Square Online Checkout, and eGift Cards.
|
|
SQUARE Q1 2021 15 |
OPERATING EXPENSES
We believe our Cash App and Seller ecosystems are well-positioned to help our customers adapt in a very dynamic environment, based on trends we have observed during recent quarters. We intend to prioritize investments in our Cash App and Seller ecosystems that we believe will help drive attractive long-term returns.
For the second quarter of 2021, we expect non-GAAP product development, sales and marketing, and general and administrative expenses, in aggregate, to increase by approximately $120 million compared to the first quarter of 2021, on a dollar basis.
For the full year of 2021, we expect non-GAAP product development, sales and marketing, and general and administrative expenses, in aggregate, to increase by approximately $1.0 billion to $1.1 billion compared to the full year of 2020, representing growth of 50% year over year at the midpoint.
Transaction and loan losses: In the second quarter of 2021, we expect transaction and loan loss expense to increase by approximately $40 million compared to the first quarter of 2021. Given the variability of potential outcomes related to the growth of our business and the macro environment, actual realized losses may differ materially from our estimates for provisions, depending on a number of factors, including the length and severity of the impact from COVID-19.
Share-based compensation: We intend on continuing to invest in building out our teams, including attracting, hiring, and retaining talented employees. In the second quarter of 2021, we expect the quarter-over-quarter growth in our share-based compensation expense to be greater than the 2020 year period and comparable to the 2019 year period. These share-based compensation expenses are not included in the aforementioned non-GAAP product development, sales and marketing, and general and administrative expenses.
We have not provided the forward-looking GAAP equivalents for certain forward-looking non-GAAP operating expenses or a GAAP reconciliation as a result of the uncertainty regarding, and the potential variability of, reconciling items such as share-based compensation expense. Accordingly, a reconciliation of these non-GAAP guidance metrics to their corresponding GAAP equivalents is not available without unreasonable effort. However, it is important to note that material changes to reconciling items could have a significant effect on future GAAP results. We have provided a reconciliation of other GAAP to non-GAAP metrics in tables at the end of this letter.
|
|
SQUARE Q1 2021 16 |
Earnings
Webcast
Square (NYSE: SQ) will host a conference call and earnings webcast at 2:00 p.m. Pacific time/5:00 p.m. Eastern time today, May 6, to discuss these financial results. To register to participate in the conference call, or to listen to the live audio webcast, please visit the Events & Presentations section of Square’s Investor Relations website at investors.squareup.com. A replay will be available on the same website following the call.
We will release financial results for the second quarter of 2021 on August 5, 2021, after the market closes, and will also host a conference call and earnings webcast at 2:00 p.m. Pacific time/5:00 p.m. Eastern time on the same day to discuss those financial results.

|

|
|||
| Jack Dorsey |
Amrita Ahuja |
|||
| CEO | CFO | |||
|
|
SQUARE Q1 2021 17 |

We’ve adapted our business over the past year, launching a new retail arm and offering delivery or pre-ordering for pickup. But as things return to normal in Australia, and our customers begin to come back into the bakery, efficient service is crucial. Square Register has been a game-changer: the customer-facing screen means mistakes can be more easily spotted and resolved quicker. Those seconds saved have a lasting impact on the entire business and how our customers experience Falco.”
Michael Bascetta
Co-owner, Falco Bakery & Worksmith
Melbourne, Victoria, AU
|
|
SQUARE Q1 2021 18 |
|
|
SQUARE Q1 2021 19 |
SAFE HARBOR STATEMENT
This letter contains forward-looking statements within the meaning of the Safe Harbor provisions of the Private Securities Litigation Reform Act of 1995. All statements other than statements of historical fact could be deemed forward-looking, including, but not limited to, statements regarding the future performance of Square, Inc. and its consolidated subsidiaries (the Company); the Company’s expected financial results, guidance, and general business outlook for future periods; expected impact of the COVID-19 pandemic and related responses of governments and private industry, including the impact of reduced restrictions on businesses and individuals and government stimulus and assistance programs, on the Company’s business, financial results, financial position, and liquidity; statements regarding the Company’s sales and marketing investments for the Seller and Cash App ecosystems and their expected benefits; future profitability and growth in the Company’s businesses and products and the Company’s ability to drive such profitability and growth; the Company’s expectations regarding scale, economics, and the demand for or benefits from its products, product features, and services; the Company’s international plans; the Company’s expectations regarding its near-term and long-term strategic priorities, including its definitive agreement to acquire a significant majority ownership stake in TIDAL; the ability of the Company’s products to attract and retain customers; trends in the Company’s markets and the continuation of such trends; the resiliency and growth of the Company’s Seller and Cash App ecosystems; the Company’s expectations regarding future expenses, including future transaction and loan losses and the Company’s estimated reserves for such losses; the Company’s bitcoin investments and strategy as well as the potential financial impact and volatility; and management’s statements related to business strategy, plans, investments, opportunities and objectives for future operations. In some cases, forward-looking statements can be identified by terms such as “may,” “will,” “appears,” “should,” “expects,” “plans,” “anticipates,” “could,” “intends,” “target,” “projects,” “contemplates,” “believes,” “estimates,” “predicts,” “potential,” or “continue,” or the negative of these words or other similar terms or expressions that concern our expectations, strategy, plans, or intentions. Such statements are subject to a number of known and unknown risks, uncertainties, assumptions, and other factors that may cause the Company’s actual results, performance, or achievements to differ materially from results expressed or implied in this letter. Investors are cautioned not to place undue reliance on these statements, and reported results should not be considered as an indication of future performance.
Risks that contribute to the uncertain nature of the forward-looking statements include, among others, uncertainty around the COVID-19 pandemic and the related effects of government and other measures; an economic downturn in the United States and in other countries around the world; the Company’s ability to deal with the substantial and increasingly intense competition in its industry and to develop and deliver products and services to address the rapidly evolving market for payments and point-of-sale, financial, and marketing services; the Company’s ability to retain existing customers, attract new customers, and increase sales to all customers; the Company’s ability to ensure the interoperability of its technology with that of third parties; changes to the rules and practices of payment card networks and acquiring processors; the impact of acquisitions or divestitures, strategic investments, joint ventures, or entries into new businesses; the effect of extensive regulation and oversight related to the Company’s business in a variety of areas; the effect of management changes and business initiatives; the liabilities and loss potential associated with new products, product features, and services, including those launched in connection with the COVID-19 pandemic; adoption of the Company’s products and services in international markets; and changes in political, business, and economic conditions; as well as other risks listed or described from time to time in the Company’s filings with the Securities and Exchange Commission (the SEC), including the Company’s Annual Report on Form 10-K for the fiscal year ended December 31, 2020, which is on file with the SEC and available on the Investor Relations page of the Company’s website. Additional information will also be set forth in the Company’s Quarterly Report on Form 10-Q for the fiscal quarter ended March 31, 2021. All forward-looking statements are based on information and estimates available to the Company at the time of this letter and are not guarantees of future performance. Except as required by law, the Company assumes no obligation to update any of the statements in this letter.
|
|
SQUARE Q1 2021 20 |
KEY OPERATING METRICS AND
NON-GAAP FINANCIAL MEASURES
To supplement our financial information presented in accordance with generally accepted accounting principles in the United States (GAAP), we consider certain operating and financial measures that are not prepared in accordance with GAAP, including Gross Payment Volume (GPV), Adjusted EBITDA, Adjusted EBITDA margin, Adjusted Net Income (Loss), Diluted Adjusted Net Income (Loss) Per Share (Adjusted EPS), and non-GAAP operating expenses as well as other measures defined in the shareholder letter such as measures excluding bitcoin revenue, bitcoin impairment loss, measures excluding gains or losses on equity investments, and measures excluding release of transaction loss reserves. We believe these metrics and measures are useful to facilitate period-to-period comparisons of our business and to facilitate comparisons of our performance to that of other payments solution providers.
We define GPV as the total dollar amount of all card payments processed by sellers using Square, net of refunds. Additionally, GPV includes Cash App activity related to Cash for Business and to peer-to-peer payments sent from a credit card.
Adjusted EBITDA, Adjusted EBITDA margin, Adjusted Net Income (Loss), and Diluted Adjusted Net Income (Loss) Per Share (Adjusted EPS) are non-GAAP financial measures that represent our net income (loss) and net income (loss) per share, adjusted to eliminate the effect of share-based compensation expenses; amortization of intangible assets; gain or loss on revaluation of equity investments; bitcoin impairment loss; the gain or loss on the disposal of property and equipment; and impairment of intangible assets, as applicable. Prior to the adoption of ASU No. 2020-06 on January 1, 2021, we also adjusted to eliminate the effect of amortization of debt discount and issuance costs on our convertible senior notes, and the gain or loss on debt extinguishment related to the conversion of senior notes. Subsequent to the adoption, we adjusted to eliminate the effect of amortization of debt issuance costs on our convertible senior notes. We also exclude certain costs associated with acquisitions and other activities that are not normal recurring operating expenses, including amounts paid to redeem acquirees’ unvested stock-based compensation awards, and legal, accounting, and due diligence costs, and we add back the impact of the acquired deferred revenue and deferred cost adjustment, which was written down to fair value in purchase accounting. Additionally, for purposes of calculating diluted Adjusted EPS, we add back cash interest expense on convertible senior notes, as if converted at the beginning of the period, if the impact is dilutive. In addition to the items above, Adjusted EBITDA is a non-GAAP financial measure that also excludes depreciation and amortization, interest income and expense, other income and expense, and provision or benefit from income taxes, as applicable. To calculate the diluted Adjusted EPS, we adjust the weighted-average number of shares of common stock outstanding for the dilutive effect of all potential shares of common stock. In periods when we recorded an Adjusted Net Loss, the diluted Adjusted EPS is the same as basic Adjusted EPS because the effects of potentially dilutive items were anti-dilutive given the Adjusted Net Loss position.
Non-GAAP operating expenses is a non-GAAP financial measure that represents operating expenses adjusted to remove the impact of share-based compensation, depreciation and amortization, bitcoin impairment loss, loss on disposal of property and equipment, and acquisition-related costs. Adjusted EBITDA margin is calculated as Adjusted EBITDA divided by gross profit.
We have included Adjusted EBITDA, Adjusted EPS, and non-GAAP operating expenses because they are key measures used by our management to evaluate our operating performance, generate future operating plans, and make strategic decisions, including those relating to operating expenses and the allocation of internal resources. Accordingly, we believe that Adjusted EBITDA, Adjusted EPS, and non-GAAP operating expenses provide useful information to investors and others in understanding and evaluating our operating results in the same manner as our management and board of directors. In addition, they provide useful measures for period-to-period comparisons of our business, as they remove the effect of certain non-cash items and certain variable charges. We have included measures excluding bitcoin revenue because our role is to facilitate customers’ access to bitcoin. When customers buy bitcoin through Cash App, we only apply a small margin to the market cost of bitcoin, which tends to be volatile and outside our control. Therefore, we believe deducting bitcoin revenue better reflects the economic benefits as well as our performance from these transactions. We have included measures excluding gains or losses on equity investments as well as bitcoin impairment losses because we believe these measures are useful in understanding our operating results without regard to gains and losses due to non-operating market fluctuations of our investments. We have included measures excluding release of transaction loss reserves because our transaction loss reserves experienced significant volatility in 2020 due to the COVID-19 pandemic and the economic uncertainty it caused and we believe these measures are useful in understanding our operating results without regard to these one-time effects.
Adjusted EBITDA, Adjusted EPS, and non-GAAP operating expenses, as well as other measures defined in the shareholder letter, such as measures excluding bitcoin revenue, bitcoin impairment loss, measures excluding gains or losses on equity investments, and measures excluding release of transaction loss reserves, have limitations as financial measures, and should be considered as supplemental in nature, and are not meant as substitutes for the related financial information prepared in accordance with GAAP.
We believe that the aforementioned metrics provide useful information about our operating results, enhance the overall understanding of our past performance and future prospects, and provide useful measures for period-to-period comparisons of our business, as they remove the effect of certain variable amounts. Our management uses these measures to evaluate our operating performance, generate future operating plans, and make strategic decisions, including those relating to operating expenses and the allocation of internal resources.
These non-GAAP financial measures should not be considered in isolation from, or as a substitute for, financial information prepared in accordance with GAAP. These non-GAAP financial measures are not based on any standardized methodology prescribed by GAAP and are not necessarily comparable to similarly titled measures presented by other companies.
|
|
SQUARE Q1 2021 21 |
Consolidated Statements
of Operations
UNAUDITED
In thousands, except per share data
| THREE MONTHS ENDED | ||||||||
| Mar 31, 2021 | Mar 31, 2020 | |||||||
| Revenue: |
||||||||
| Transaction-based revenue |
$ | 959,733 | $ | 758,101 | ||||
| Subscription and services-based revenue |
557,681 | 296,235 | ||||||
| Hardware revenue |
28,788 | 20,675 | ||||||
| Bitcoin revenue |
3,511,068 | 306,098 | ||||||
|
|
|
|
||||||
| Total net revenue |
5,057,270 | 1,381,109 | ||||||
|
|
|
|
||||||
| Cost of revenue: |
||||||||
| Transaction-based costs |
524,280 | 465,779 | ||||||
| Subscription and services-based costs |
88,572 | 40,711 | ||||||
| Hardware costs |
40,482 | 34,372 | ||||||
| Bitcoin costs |
3,436,135 | 299,426 | ||||||
| Amortization of acquired technology |
4,300 | 2,320 | ||||||
|
|
|
|
||||||
| Total cost of revenue |
4,093,769 | 842,608 | ||||||
|
|
|
|
||||||
| Gross profit |
963,501 | 538,501 | ||||||
|
|
|
|
||||||
| Operating expenses: |
||||||||
| Product development |
308,678 | 194,986 | ||||||
| Sales and marketing |
349,460 | 194,535 | ||||||
| General and administrative |
195,909 | 129,495 | ||||||
| Transaction and loan losses |
20,395 | 108,883 | ||||||
| Bitcoin impairment losses |
19,860 | — | ||||||
| Amortization of acquired customer assets |
1,463 | 890 | ||||||
|
|
|
|
||||||
| Total operating expenses |
895,765 | 628,789 | ||||||
|
|
|
|
||||||
| Operating income (loss) |
67,736 | (90,288 | ) | |||||
| Interest expense, net |
253 | 9,206 | ||||||
| Other expense, net |
27,528 | 5,862 | ||||||
|
|
|
|
||||||
| Income (loss) before income tax |
39,955 | (105,356 | ) | |||||
|
|
|
|
||||||
| Provision for income taxes |
947 | 535 | ||||||
|
|
|
|
||||||
| Net income (loss) |
$ | 39,008 | $ | (105,891 | ) | |||
|
|
|
|
||||||
| Net income (loss) per share: |
||||||||
| Basic |
$ | 0.09 | $ | (0.24 | ) | |||
|
|
|
|
||||||
| Diluted |
$ | 0.08 | $ | (0.24 | ) | |||
|
|
|
|
||||||
| Weighted-average shares used to compute net income (loss) per share |
||||||||
| Basic |
454,973 | 434,940 | ||||||
|
|
|
|
||||||
| Diluted |
501,353 | 434,940 | ||||||
|
|
|
|
||||||
|
|
SQUARE Q1 2021 22 |
Consolidated Balance Sheets
In thousands, except share and per share data
| Mar 31, 2021 | Dec 31, 2020 | |||||||
| (UNAUDITED) | (AUDITED) | |||||||
| Assets | ||||||||
| Current assets: |
||||||||
| Cash and cash equivalents |
$ | 3,022,485 | $ | 3,158,058 | ||||
| Investments in short-term debt securities |
644,454 | 695,112 | ||||||
| Settlements receivable |
1,109,505 | 1,024,895 | ||||||
| Customer funds |
2,976,428 | 2,037,832 | ||||||
| Loans held for sale |
742,378 | 462,665 | ||||||
| Other current assets |
823,606 | 383,067 | ||||||
|
|
|
|
||||||
| Total current assets |
9,318,856 | 7,761,629 | ||||||
|
|
|
|
||||||
| Property and equipment, net |
245,702 | 233,520 | ||||||
| Goodwill |
316,437 | 316,701 | ||||||
| Acquired intangible assets, net |
129,796 | 137,612 | ||||||
| Investments in long-term debt securities |
522,542 | 463,950 | ||||||
| Operating lease right-of-use assets |
463,331 | 456,888 | ||||||
| Other non-current assets |
352,056 | 499,250 | ||||||
|
|
|
|
||||||
| Total assets |
$ | 11,348,720 | $ | 9,869,550 | ||||
|
|
|
|
||||||
| Liabilities and Stockholders’ Equity | ||||||||
| Current liabilities: |
||||||||
| Customers payable |
$ | 4,028,859 | $ | 3,009,051 | ||||
| Settlements payable |
263,926 | 239,362 | ||||||
| Accrued expenses and other current liabilities |
448,624 | 360,850 | ||||||
| Operating lease liabilities, current |
55,485 | 52,747 | ||||||
| PPP Liquidity Facility advances |
764,208 | 464,094 | ||||||
|
|
|
|
||||||
| Total current liabilities |
5,561,102 | 4,126,104 | ||||||
|
|
|
|
||||||
| Long-term debt |
2,980,202 | 2,586,924 | ||||||
| Operating lease liabilities, non-current |
400,369 | 389,662 | ||||||
| Other non-current liabilities |
92,674 | 85,291 | ||||||
|
|
|
|
||||||
| Total liabilities |
9,034,347 | 7,187,981 | ||||||
| Stockholders’ equity: |
||||||||
| Preferred stock, $0.0000001 par value: 100,000,000 shares authorized at March 31, 2021 and December 31, 2020. None issued and outstanding at March 31, 2021 and December 31, 2020. |
— | — | ||||||
| Class A common stock, $0.0000001 par value: 1,000,000,000 shares authorized at March 31, 2021 and December 31, 2020; 390,680,544 and 390,187,079 issued and outstanding at March 31, 2021 and December 31, 2020, respectively. |
— | — | ||||||
| Class B common stock, $0.0000001 par value: 500,000,000 shares authorized at March 31, 2021 and December 31, 2020; 63,987,897 and 65,997,697 issued and outstanding at March 31, 2021 and December 31, 2020, respectively. |
— | — | ||||||
| Additional paid-in capital |
2,459,415 | 2,955,464 | ||||||
| Accumulated other comprehensive income |
10,199 | 23,328 | ||||||
| Accumulated deficit |
(155,241 | ) | (297,223 | ) | ||||
| Total stockholders’ equity |
2,314,373 | 2,681,569 | ||||||
|
|
|
|
||||||
| Total liabilities and stockholders’ equity |
$ | 11,348,720 | $ | 9,869,550 | ||||
|
|
|
|
||||||
|
|
SQUARE Q1 2021 23 |
Consolidated Statements
of Cash Flows
UNAUDITED
In thousands
| three months ended |
||||||||
| Mar 31, 2021 | Mar 31, 2020 | |||||||
| Cash Flows from Operating Activities | ||||||||
| Net income (loss) |
$ | 39,008 | $ | (105,891 | ) | |||
| Adjustments to reconcile net income (loss) to net cash provided by (used in) operating activities: |
||||||||
| Depreciation and amortization |
29,201 | 20,061 | ||||||
| Non-cash interest and other |
5,207 | 12,411 | ||||||
| Loss on extinguishment of long-term debt |
— | 990 | ||||||
| Share-based compensation |
118,623 | 77,303 | ||||||
| Loss on revaluation of equity investment |
28,900 | — | ||||||
| Bitcoin impairment losses |
19,860 | — | ||||||
| Non-cash lease expense |
20,432 | 15,125 | ||||||
| Transaction and loan losses |
20,395 | 108,883 | ||||||
| Change in deferred income taxes |
(60 | ) | (984 | ) | ||||
| Changes in operating assets and liabilities: |
||||||||
| Settlements receivable |
(114,458 | ) | 60,248 | |||||
| Customer funds |
(1,007,144 | ) | (210,201 | ) | ||||
| Purchase and originations of loans held for sale |
(812,492 | ) | (573,502 | ) | ||||
| Sales and principal payments of loans held for sale |
531,716 | 555,584 | ||||||
| Customers payable |
1,018,906 | 212,929 | ||||||
| Settlements payable |
24,564 | (6,684 | ) | |||||
| Charge-offs to accrued transaction losses |
(15,193 | ) | (17,413 | ) | ||||
| Other assets and liabilities |
(5,206 | ) | (27,563 | ) | ||||
|
|
|
|
||||||
| Net cash provided by (used in) operating activities |
(97,741 | ) | 121,296 | |||||
|
|
|
|
||||||
| Cash Flows from Investing Activities | ||||||||
| Purchase of marketable debt securities |
(401,161 | ) | (363,874 | ) | ||||
| Proceeds from maturities of marketable debt securities |
139,353 | 98,146 | ||||||
| Proceeds from sale of marketable debt securities |
249,342 | 247,027 | ||||||
| Purchase of marketable debt securities from customer funds |
(119,411 | ) | (144,494 | ) | ||||
| Proceeds from maturities of marketable debt securities from customer funds |
187,500 | 65,000 | ||||||
| Proceeds from sale of marketable debt securities from customer funds |
— | 22,457 | ||||||
| Purchase of property and equipment |
(34,149 | ) | (26,137 | ) | ||||
| Purchase of bitcoin investments |
(170,000 | ) | — | |||||
| Purchase of other investments |
(28,470 | ) | — | |||||
| Proceeds from sale of equity investments |
18,973 | — | ||||||
| Business combinations, net of cash acquired |
— | (12,742 | ) | |||||
|
|
|
|
||||||
| Net cash used in investing activities |
(158,023 | ) | (114,617 | ) | ||||
|
|
|
|
||||||
| Cash Flows from Financing Activities | ||||||||
| Proceeds from issuance of convertible senior notes, net |
— | 986,241 | ||||||
| Purchase of convertible senior note hedges |
— | (149,200 | ) | |||||
| Proceeds from issuance of warrants |
— | 99,500 | ||||||
| Proceeds from PPP Liquidity Facility advances |
494,300 | — | ||||||
| Repayments from PPP Liquidity Facility advances |
(194,186 | ) | — | |||||
| Payments for tax withholding related to vesting of restricted stock units |
(152,013 | ) | (48,772 | ) | ||||
| Proceeds from the exercise of stock options and purchases under the employee stock purchase plan, net |
32,891 | 31,406 | ||||||
| Other financing activities |
— | (1,055 | ) | |||||
|
|
|
|
||||||
| Net cash provided by financing activities |
180,992 | 918,120 | ||||||
|
|
|
|
||||||
| Effect of foreign exchange rate on cash and cash equivalents |
(8,206 | ) | (13,588 | ) | ||||
|
|
|
|
||||||
| Net increase (decrease) in cash, cash equivalents and restricted cash |
(82,978 | ) | 911,211 | |||||
| Cash, cash equivalents and restricted cash, beginning of period |
3,201,863 | 1,098,706 | ||||||
|
|
|
|
||||||
| Cash, cash equivalents and restricted cash, end of period |
$ | 3,118,885 | $ | 2,009,917 | ||||
|
|
|
|
||||||
|
|
SQUARE Q1 2021 24 |
Operating Segment Disclosures
UNAUDITED
Information on the reportable segments revenue and segment operating
profit are as follows (in thousands):
| THREE MONTHS ENDED | ||||||||||||
| MAR 31, 2021 | ||||||||||||
| Cash App | Seller | Total | ||||||||||
| Revenue |
||||||||||||
| Transaction-based revenue |
$ | 91,959 | $ | 867,774 | $ | 959,733 | ||||||
| Subscription and services-based revenue |
436,589 | 121,092 | 557,681 | |||||||||
| Hardware revenue |
— | 28,788 | 28,788 | |||||||||
| Bitcoin revenue |
3,511,068 | — | 3,511,068 | |||||||||
|
|
|
|
|
|
|
|
||||||
| Segment revenue |
4,039,616 | 1,017,654 | 5,057,270 | |||||||||
|
|
|
|
|
|
|
|
||||||
| Segment gross profit |
$ | 495,485 | $ | 468,016 | $ | 963,501 | ||||||
|
|
|
|
|
|
|
|
||||||
| THREE MONTHS ENDED | ||||||||||||
| MAR 31, 2020 | ||||||||||||
| Cash App | Seller | Total | ||||||||||
| Revenue |
||||||||||||
| Transaction-based revenue |
$ | 27,819 | $ | 730,282 | $ | 758,101 | ||||||
| Subscription and services-based revenue |
193,725 | 102,510 | 296,235 | |||||||||
| Hardware revenue |
— | 20,675 | 20,675 | |||||||||
| Bitcoin revenue |
306,098 | — | 306,098 | |||||||||
|
|
|
|
|
|
|
|
||||||
| Segment revenue |
527,642 | 853,467 | 1,381,109 | |||||||||
|
|
|
|
|
|
|
|
||||||
| Segment gross profit |
$ | 182,732 | $ | 355,769 | $ | 538,501 | ||||||
|
|
|
|
|
|
|
|
||||||
A reconciliation of total segment gross profit to the Company’s income (loss)
before applicable income taxes is as follows (in thousands):
| THREE MONTHS ENDED | ||||||||
| Mar 31, 2021 | Mar 31, 2020 | |||||||
| Total segment gross profit |
$ | 963,501 | $ | 538,501 | ||||
| Less: Product Development |
308.678 | 194,986 | ||||||
| Less: Sales and Marketing |
349,460 | 194,535 | ||||||
| Less: General and Administrative |
195,909 | 129,495 | ||||||
| Less: Transaction and loan losses |
20,395 | 108,883 | ||||||
| Less: Bitcoin impairment losses |
19,860 | — | ||||||
| Less: Amortization of acquired customer assets |
1,463 | 890 | ||||||
| Less: Interest expense, net |
253 | 9,206 | ||||||
| Less: Other expense, net |
27,528 | 5,862 | ||||||
|
|
|
|
||||||
| Income (loss) before applicable income taxes |
$ | 39,955 | $ | (105,356 | ) | |||
|
|
|
|
||||||
|
|
SQUARE Q1 2021 25 |
Key Operating Metrics and
Non-GAAP Financial Measures
UNAUDITED
In thousands, except GPV and per share data
| three months ended | ||||||||
| Mar 31, 2021 | Mar 31, 2020 | |||||||
| Gross Payment Volume (GPV) (in millions) |
$ | 33,138 | $ | 25,743 | ||||
| Adjusted EBITDA (in thousands) |
$ | 236,249 | $ | 9,331 | ||||
| Adjusted Net Income (Loss) Per Share: |
||||||||
| Basic |
$ | 0.47 | $ | (0.02 | ) | |||
| Diluted |
$ | 0.41 | $ | (0.02 | ) | |||
Adjusted EBITDA
UNAUDITED
In thousands
| THREE MONTHS ENDED | ||||||||
| Mar 31, 2021 | Mar 31, 2020 | |||||||
| Net income (loss) | $ | 39,008 | $ | (105,891 | ) | |||
| Share-based compensation expense | 118,623 | 77,303 | ||||||
| Depreciation and amortization | 29,201 | 20,061 | ||||||
| Interest expense, net | 253 | 9,206 | ||||||
| Other expense, net | 27,528 | 5,862 | ||||||
| Bitcoin impairment losses | 19,860 | — | ||||||
| Loss on disposal of property and equipment | 615 | 218 | ||||||
| Acquisition related and other costs | 26 | 1,524 | ||||||
| Acquired deferred revenue adjustment | 252 | 657 | ||||||
| Acquired deferred costs adjustment | (64 | ) | (144 | ) | ||||
| Provision for income taxes | 947 | 535 | ||||||
|
|
|
|
||||||
| Adjusted EBITDA |
$ | 236,249 | $ | 9,331 | ||||
|
|
|
|
||||||
|
|
SQUARE Q1 2021 26 |
Adjusted Net Income
and Adjusted EPS
UNAUDITED
In thousands, except per share data
| THREE MONTHS ENDED | ||||||||
| Mar 31, 2021 | Mar 31, 2020 | |||||||
| Net income (loss) |
$ | 39,008 | $ | (105,891 | ) | |||
| Share-based compensation expense |
118,623 | 77,303 | ||||||
| Amortization of intangible assets |
6,884 | 4,152 | ||||||
| Amortization of debt issuance costs |
1,832 | 12,528 | ||||||
| Loss on revaluation of equity investment |
28,900 | — | ||||||
| Bitcoin impairment losses |
19,860 | — | ||||||
| Loss on extinguishment of long-term debt |
— | 990 | ||||||
| Loss on disposal of property and equipment |
615 | 218 | ||||||
| Acquisition related and other costs |
26 | 1,524 | ||||||
| Acquired deferred revenue adjustment |
252 | 657 | ||||||
| Acquired deferred costs adjustment |
(64 | ) | (144 | ) | ||||
|
|
|
|
||||||
| Adjusted Net Income (Loss) - basic |
$ | 215,936 | $ | (8,663 | ) | |||
|
|
|
|
||||||
| Cash interest expense on convertible senior notes |
$ | 1,728 | 1,373 | |||||
|
|
|
|
||||||
| Adjusted Net Income (Loss) - diluted |
$ | 217,664 | $ | (7,290 | ) | |||
|
|
|
|
||||||
| Weighted-average shares used to compute |
||||||||
| Basic |
454,973 | 434,940 | ||||||
|
|
|
|
||||||
| Diluted |
501,353 | 434,940 | ||||||
|
|
|
|
||||||
| Net Income (Loss) Per Share |
||||||||
| Basic |
$ | 0.09 | $ | (0.24 | ) | |||
|
|
|
|
||||||
| Diluted |
$ | 0.08 | $ | (0.24 | ) | |||
|
|
|
|
||||||
| Weighted-average shares used to compute |
||||||||
| Basic |
454,973 | 434,940 | ||||||
|
|
|
|
||||||
| Diluted |
524,540 | 434,940 | ||||||
|
|
|
|
||||||
| Adjusted Net Income (Loss) Per Share |
||||||||
| Basic |
$ | 0.47 | $ | (0.02 | ) | |||
|
|
|
|
||||||
| Diluted |
$ | 0.41 | $ | (0.02 | ) | |||
|
|
|
|
||||||
|
|
SQUARE Q1 2021 27 |
Non-GAAP Operating Expenses
UNAUDITED
In thousands
| THREE MONTHS ENDED | ||||||||
| Mar 31, 2021 | Mar 31, 2020 | |||||||
| Operating expenses |
$ | (895,765 | ) | $ | (628,789 | ) | ||
| Share-based compensation |
118,524 | 77,227 | ||||||
| Depreciation and amortization |
24,901 | 17,635 | ||||||
| Bitcoin impairment losses |
19,860 | — | ||||||
| Loss on disposal of property and equipment |
615 | 218 | ||||||
| Acquisition-related and other costs |
26 | 1,524 | ||||||
|
|
|
|
||||||
| Non-GAAP operating expenses |
$ | (731,839 | ) | $ | (532,185 | ) | ||
|
|
|
|
||||||
| Product development |
$ | (308,678 | ) | $ | (194,986 | ) | ||
| Share-based compensation |
86,895 | 57,400 | ||||||
| Depreciation and amortization |
17,395 | 12,336 | ||||||
| Loss on disposal of property and equipment |
339 | 158 | ||||||
|
|
|
|
||||||
| Non-GAAP product development |
$ | (204,049 | ) | $ | (125,092 | ) | ||
|
|
|
|
||||||
| Sales and marketing |
$ | (349,460 | ) | $ | (194,535 | ) | ||
| Share-based compensation |
10,880 | 6,407 | ||||||
| Depreciation and amortization |
1,273 | 964 | ||||||
| Loss on disposal of property and equipment |
— | 60 | ||||||
|
|
|
|
||||||
| Non-GAAP sales and marketing |
$ | (337,307 | ) | $ | (187,104 | ) | ||
|
|
|
|
||||||
| General and administrative |
$ | (195,909 | ) | $ | (129,495 | ) | ||
| Share-based compensation |
20,749 | 13,420 | ||||||
| Depreciation and amortization |
4,770 | 3,445 | ||||||
| Loss on disposal of property and equipment |
276 | — | ||||||
| Acquisition-related and other costs |
26 | 1,524 | ||||||
|
|
|
|
||||||
| Non-GAAP general and administrative |
$ | (170,088 | ) | $ | (111,106 | ) | ||
|
|
|
|
||||||
Depreciation and
Amortization by Function
UNAUDITED
In thousands
| THREE MONTHS ENDED | ||||||||
| Mar 31, 2021 | Mar 31, 2020 | |||||||
| Cost of revenue |
$ | 4,300 | $ | 2,426 | ||||
| Product Development |
17,395 | 12,336 | ||||||
| Sales and Marketing |
1,273 | 964 | ||||||
| General and Administrative |
4,770 | 3,445 | ||||||
| Amortization of acquired customer assets |
1,463 | 890 | ||||||
|
|
|
|
||||||
| Total depreciation and amortization |
$ | 29,201 | $ | 20,061 | ||||
|
|
|
|
||||||
|
|
SQUARE Q1 2021 28 |
Serious News for Serious Traders! Try StreetInsider.com Premium Free!
You May Also Be Interested In
- Block reaches $45 million multistate settlement over Cash App safety claims
- Ascend Education Guides Over 500 Hong Kong Migrant Families in Navigating the UK Education System
- The 108th Lions Clubs International Convention Successfully Concluded
Create E-mail Alert Related Categories
SEC FilingsSign up for StreetInsider Free!
Receive full access to all new and archived articles, unlimited portfolio tracking, e-mail alerts, custom newswires and RSS feeds - and more!