




Form 8-K Santander Consumer USA For: Apr 28

FREE Breaking News Alerts from StreetInsider.com!
StreetInsider.com Top Tickers, 10/16/2026
- S&P 500 ends higher as traders shift from AI to healthcare
- U.S. producer prices rise by 1.3% month-on-month in September
- Brent steady as US weighs easing sanctions on global 'shadow fleet'
- UBS now expects a third Fed rate hike after hot September inflation print
- Tesla-SpaceX Merger could be announced before December, Barclays says
 Tweet
Tweet Share
Share E-mail
UNITED STATES
SECURITIES AND EXCHANGE COMMISSION
Washington, D.C. 20549
SECURITIES AND EXCHANGE COMMISSION
Washington, D.C. 20549
FORM 8-K
CURRENT REPORT
Pursuant to Section 13 or 15(d) of the Securities Exchange Act of 1934
Date of Report (Date of earliest event reported): April 28, 2015
SANTANDER CONSUMER USA HOLDINGS INC.
(Exact name of registrant as specified in its charter)
Delaware (State or other Jurisdiction of Incorporation) | 001-36270 (Commission File Number) | 32-0414408 (IRS Employer Identification No.) | |
1601 Elm St. Suite #800 Dallas, Texas (Address of Principal Executive Offices) | 75201 (Zip Code) | ||
Registrant’s telephone number, including area code: (214) 634-1110
n/a
(Former name or former address if changed since last report.)
Check the appropriate box below if the Form 8-K filing is intended to simultaneously satisfy the filing obligation of the registrant under any of the following provisions:
£ Written communications pursuant to Rule 425 under the Securities Act (17 CFR 230.425)
£ Soliciting material pursuant to Rule 14a-12 under the Exchange Act (17 CFR 240.14a-12)
£ Pre-commencement communications pursuant to Rule 14d-2(b) under the Exchange Act (17 CFR 240.14d-2(b))
£ Pre-commencement communications pursuant to Rule 13e-4(c) under the Exchange Act (17 CFR 240.13e-4(c))
Item 2.02. Results of Operations and Financial Condition.
On April 28, 2015, Santander Consumer USA Holdings Inc. (the “Company”) issued a press release announcing its financial results for the quarter ended March 31, 2015. Copies of the Company’s press release and an investor presentation for the quarter ended March 31, 2015 are attached hereto as Exhibits 99.1 and 99.2, respectively, and incorporated herein by reference.
Note: Information in this report (including Exhibits 99.1 and 99.2) furnished pursuant to Item 2.02 shall not be deemed to be “filed” for the purposes of Section 18 of the Securities Exchange Act of 1934 or otherwise subject to the liabilities of that section.
Item 9.01. Financial Statements and Exhibits.
Exhibit No. Description
Exhibit 99.1 Press Release of Santander Consumer USA Holdings Inc., dated April 28, 2015.
Exhibit 99.2 | Presentation Materials of Santander Consumer USA Holdings Inc., dated April 28, 2015. |
2
SIGNATURE
Pursuant to the requirements of the Securities Exchange Act of 1934, the registrant has duly caused this report to be signed on its behalf by the undersigned hereunto duly authorized.
Dated: April 28, 2015 | SANTANDER CONSUMER USA HOLDINGS INC. By: /s/ Jason A. Kulas Name: Jason A. Kulas Title: President and Chief Financial Officer |
Exhibit 99.1

Contacts: Investor Relations Evan Black & Kristina Carbonneau 800.493.8219 | Media Relations Laurie Kight 214.801.6455 | |
Santander Consumer USA Holdings Inc. Reports First Quarter 2015 Results
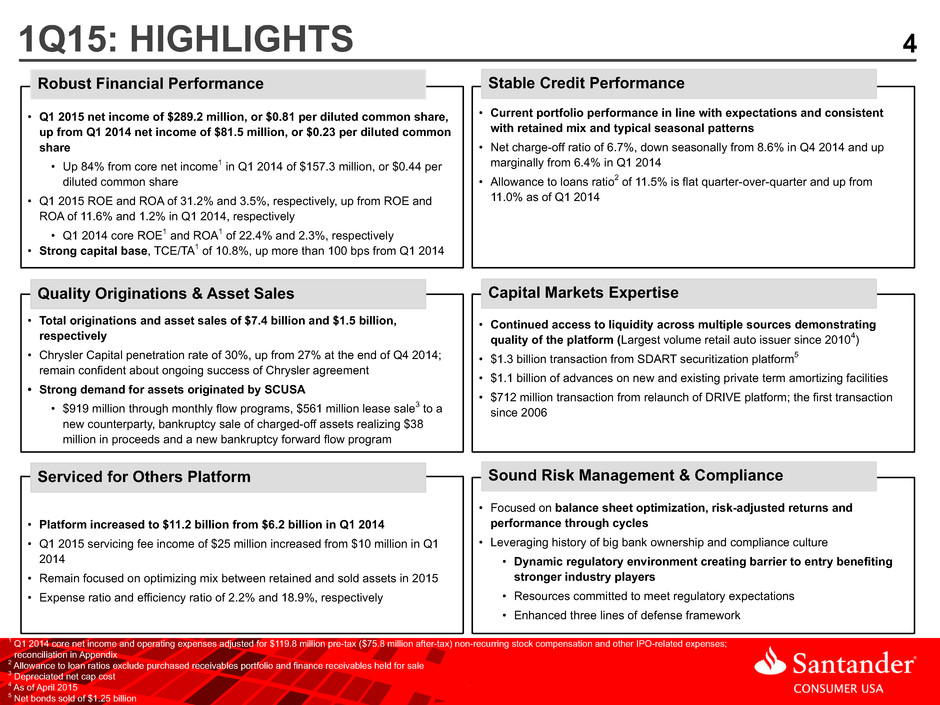
Dallas, TX (April 28, 2015) – Santander Consumer USA Holdings Inc. (NYSE: SC) (“SCUSA”) today announced net income for first quarter 2015 of $289.2 million, or $0.81 per diluted common share, up from the fourth quarter 2014 net income of $247.0 million, or $0.69 per diluted common share, and up from first quarter 2014 net income of $81.5 million, or $0.23 per diluted common share. Core net income1 for the first quarter 2014 was $157.3 million, or $0.44 per diluted common share, which translates to a year-over-year core net income1 growth of 84 percent.
First Quarter 2015 Key Highlights:
• | Return on average equity of 31.2%, up from 29.1% in prior quarter and 11.6% in prior year first quarter. Core return on average equity1 for prior year first quarter 2014 was 22.4%. |
• | Return on average assets of 3.5%, up from 3.1% in prior quarter and 1.2% in prior year first quarter. Core return on average assets1 for the first quarter 2014 was 2.3%. |
• | Total originations of $7.4 billion, up from $6.1 billion in prior quarter and in line with $7.3 billion originated in prior year first quarter. |
• | Asset sales of $1.5 billion, up from $1.1 billion in prior quarter and down from $1.7 billion in prior year first quarter. |
• | Managed assets of $46.6 billion, up from $43.5 billion as of prior year-end. |
• | Net charge-off ratio of 6.7%, down from 8.6% in prior quarter and up from 6.4% in prior year first quarter. |
• | Provision for credit losses of $606 million, up from $560 million in the prior quarter and down from $699 million in prior year first quarter. |
• | Expense ratio of 2.2%, in line with 2.2% in prior quarter and down from 3.8% in prior year first quarter. Core expense ratio1 for the first quarter 2014 was 2.4%. |
• | Efficiency ratio of 18.9%, down from 19.1% in prior quarter and 27.0% in prior year first quarter. Core efficiency ratio1 for the first quarter 2014 was 16.9%. |
"We are pleased to announce a strong start to the year with first quarter net income of $289 million and core net income1 growth of 84 percent year over year. We are producing strong returns on an increasing capital base, and these results reflect our continued ability to achieve profitable growth and display the stability and improved performance we've seen in the market. In this quarter, we continued to optimize our retained mix of assets highlighted by the increase in both retained assets and assets sold to new and existing third-party buyers," said Tom Dundon, Chairman and Chief Executive Officer.
In the first quarter, total originations were $7.4 billion, including $2.5 billion in Chrysler retail loans, $1.1 billion in Chrysler leases originated for our own portfolio, and $404 million in Chrysler lease originations facilitated for an affiliate. Other originations, including other auto and personal loans, totaled $3.4 billion for the first quarter 2015. First quarter auto originations saw a seasonal benefit due to tax refund season, while personal lending originations saw a seasonal decline due to seasonal retail patterns.
1 For a reconciliation from GAAP to this non-GAAP measure, see "Reconciliation of Non-GAAP Measures" on Page 14 of this release.
1
Finance receivables, loans and leases, net2, increased 7 percent to $30.7 billion at March 31, 2015, from $28.8 billion at December 31, 2014, and increased 21 percent from $25.3 billion at March 31, 2014. SCUSA's retained average APR as of the end of the first quarter 2015 for retail installment contracts held for investment was 16.6 percent, up from 16.0 percent as of the end of the fourth quarter 2014 and up from 16.3 percent as of the end of the first quarter 2014. Portfolio trends are reflective of the mix of assets retained at the end of each quarter which can be affected by the credit quality and timing of asset sales, as well as normal seasonality of the business.
Net finance and other interest income increased 10 percent to $1.1 billion in the first quarter 2015 from $1.0 billion in the first quarter 2014, driven by growth in the average portfolio. The provision for credit losses increased to $606 million in the first quarter 2015, from $560 million in the fourth quarter 2014, and decreased from $699 million in the first quarter 2014. The quarter-over-quarter provision increase was primarily driven by higher retained asset balances and retained portfolio mix, both of which are accretive to future earnings. The allowance for loan losses increased marginally to $3.2 billion quarter-over-quarter. The allowance to loans ratio3 remained flat at 11.5 percent as of March 31, 2015 from 11.5 percent as of December 31, 2014.
"Higher asset balances and the mix of retained assets during the quarter led to a marginal provision build versus prior quarter. Given there is an interrelationship among volume, retained portfolio mix, provision and profit, we should see a benefit to future earnings from both higher average assets and the mix of those assets," said Jason Kulas, President and Chief Financial Officer.
Consistent with expected seasonal patterns, SCUSA’s net charge-off ratio decreased to 6.7 percent for the first quarter 2015 from 8.6 percent for the fourth quarter 2014, and increased from 6.4 percent for the first quarter 2014, primarily due to aging of the overall portfolio and portfolio mix. Additionally, SCUSA’s delinquency ratio decreased to 3.2 percent as of the end of the first quarter 2015 from 4.5 percent at the end of the fourth quarter 2014, comparable to the 3.1 percent delinquency ratio as of the end of the first quarter 2014.
During the quarter, SCUSA incurred $245 million of operating expenses, up 6 percent from $230 million in the fourth quarter 2014, and down 23 percent from $318 million in the first quarter 2014. First quarter 2015 operating expenses were up 24 percent from core operating expenses4 in the first quarter 2014 of $199 million, primarily due to SCUSA’s strong managed asset growth over the previous year, leading to higher headcount. SCUSA produced a 2.2 percent expense ratio for the quarter, down from 3.8 percent expense ratio and 2.4 percent core expense ratio1 in the same period last year despite an increase in regulatory and compliance costs.
During Q1 2015, SCUSA executed two securitizations totaling $2.0 billion5 and advanced $1.1 billion on private term amortizing facilities. During the quarter, SCUSA continued to show funding diversification by relaunching the DRIVE securitization platform and executing the first DRIVE transaction since 2006 to meet investor demand.
Additionally, SCUSA continued to focus on its forward flow relationships to leverage its servicing platform and increase servicing fee income. During the quarter, SCUSA grew its relationships and completed a $561 million6 lease sale as well as a bankruptcy sale of charged off assets for $38 million in proceeds. In addition, SCUSA sold $919 million of assets through monthly loan sale programs to existing flow partners. Servicing fee income totaled $24.8 million in the first quarter 2015, up from $10.4 million in the first quarter 2014 primarily due to the increase in the portfolio of loans and leases serviced for others to $11.2 billion as of March 31, 2015, up from $6.2 billion as of March 31, 2014. For the first quarter 2015, net investment gains, which primarily consist of gains on sale, totaled $21.2 million, flat with $21.3 million in the fourth quarter 2014 and down from $35.8 million in the first quarter 2014, driven mostly by the timing of asset sales7.
2 Includes Finance receivables held for investment, Finance receivables held for sale and Leased vehicles.
3 Excludes purchased receivables portfolio and finance receivables held for sale.
4 For a reconciliation from GAAP to this non-GAAP measure, see "Reconciliation of Non-GAAP Measures" on Page 14 of this release.
5 Net bonds sold of $1.96 billion of total $2.03 billion offered.
6 Depreciated net cap cost.
7 The absence of a CCART transaction in the first quarter 2015 compared to the first quarter 2014 explains the reduction in net investment gains year-over-year. SCUSA executed a CCART transaction at the beginning of the second quarter 2015.
2
Conference Call Information
SCUSA management will host a conference call and webcast to discuss the first quarter results and other general matters at 10:30 a.m. EDT on Tuesday, April 28, 2015. The conference call will be accessible by dialing 844-856-2691 (U.S. domestic), or 815-926-1990 (international), conference ID 24853184. Please dial in 10 minutes prior to the start of the call. The conference call will also be accessible via live audio webcast through the Investor Relations section of the corporate website at http://investors.santanderconsumerusa.com. Choose “Events” and select the information pertaining to the Q1 2015 Earnings Call. Additionally there will be several slides accompanying the webcast. Please allow at least 15 minutes prior to the call to register, download, and install any necessary software.
For those unable to listen to the live broadcast, a replay will be available on the company’s website or by dialing 855-859-2056 (U.S. domestic), or 404-537-3406 (international), conference ID 24853184, approximately two hours after the event. The dial-in replay will be available for two weeks after the conference call, and the webcast replay will be available through April 28, 2016. An investor presentation will also be available by visiting the Investor Relations page of SCUSA’s website at http://investors.santanderconsumerusa.com.
Non-GAAP Disclosure
This press release includes certain non-GAAP financial measures. A non-GAAP financial measure is a numerical measure of historical or future financial performance, financial position or cash flows that excludes or includes amounts that are required to be disclosed in the most directly comparable measure calculated and presented in accordance with accounting principles generally accepted in the United States of America (“U.S. GAAP”). SCUSA believes that this non-GAAP financial measure provides both management and investors a more complete understanding of the underlying operational results and trends and SCUSA’s marketplace performance. This additional information is not meant to be considered in isolation or as a substitute for the numbers prepared in accordance with U.S. GAAP and may not be comparable to similarly titled measures used by other financial institutions.
Forward Looking Statements
This press release contains forward-looking statements within the meaning of the Private Securities Litigation Reform Act of 1995. Any statements about our expectations, beliefs, plans, predictions, forecasts, objectives, assumptions, or future events or performance are not historical facts and may be forward-looking. These statements are often, but not always, made through the use of words or phrases such as “anticipates,” “believes,” “can,” “could,” “may,” “predicts,” “potential,” “should,” “will,” “estimates,” “plans,” “projects,” “continuing,” “ongoing,” “expects,” “intends,” and similar words or phrases. Although we believe that the expectations reflected in these forward-looking statements are reasonable, these statements are not guarantees of future performance and involve risks and uncertainties which are subject to change based on various important factors, some of which are beyond our control. For additional discussion of these risks, refer to the section entitled “Risk Factors” and elsewhere in our Annual Report on Form 10-K and our Quarterly Reports on Form 10-Q filed by us with the SEC. Among the factors that could cause our financial performance to differ materially from that suggested by the forward-looking statements are: (a) we operate in a highly regulated industry and continually changing federal, state, and local laws and regulations could materially adversely affect our business; (b) adverse economic conditions in the United States and worldwide may negatively impact our results; (c) our business could suffer if our access to funding is reduced; (d) we face significant risks implementing our growth strategy, some of which are outside our control; (e) our agreement with Chrysler may not result in currently anticipated levels of growth and is subject to certain performance conditions that could result in termination of the agreement; (f) our business could suffer if we are unsuccessful in developing and maintaining relationships with automobile dealerships; (g) our financial condition, liquidity, and results of operations depend on the credit performance of our loans; (h) loss of our key management or other personnel, or an inability to attract such management and personnel, could negatively impact our business; (i) we are subject to certain regulations, including oversight by the Office of the Comptroller of the Currency, the CFPB, the Bank of Spain, and the Federal Reserve, which oversight and regulation may limit certain of our activities, including the timing and amount of dividends and other limitations on our business; and (j) future changes in our relationship with Santander could adversely affect our operations. If one or more of the factors affecting our forward-looking information and statements proves incorrect, our actual results, performance or achievements could differ materially from those expressed in, or implied by, forward-looking information and statements. Therefore, we caution not to place undue reliance on any forward-looking information or statements. The effect of these factors is difficult to predict. Factors other than these also could adversely affect our results, and the reader should not consider these factors to be a complete set of all potential risks or uncertainties. New factors emerge from time to time, and management cannot assess the impact of any such factor on our business or the extent to which any factor, or combination of factors, may cause results to differ materially from those contained in any forward-looking statement. Any forward-looking statements only speak as of the date of this document, and we undertake no obligation to update any forward-looking information or statements, whether written or oral, to reflect any change, except as required by law. All forward-looking statements attributable to us are expressly qualified by these cautionary statements.
3
About Santander Consumer USA Holdings Inc.
Santander Consumer USA Holdings Inc. (NYSE: SC) (“SCUSA”) is a full-service, technology-driven consumer finance company focused on vehicle finance and personal lending products. The company, which began originating retail installment contracts in 1997, has a managed assets portfolio of more than $46 billion (as of March 31, 2015), has more than two million customers across all credit grades, and is headquartered in Dallas. (www.santanderconsumerusa.com)
4
Santander Consumer USA Holdings Inc.
Financial Supplement
First Quarter 2015
Table of Contents | ||
Table 1: Condensed Consolidated Balance Sheets | 6 | |
Table 2: Condensed Consolidated Statements of Income | 7 | |
Table 3: Other Financial Information | 8 | |
Table 4: Credit Quality | 10 | |
Table 5: Originations | 11 | |
Table 6: Asset Sales | 12 | |
Table 7: Ending Portfolio | 13 | |
Table 8: Reconciliation of Non-GAAP Measures | 14 | |
5
Table 1: Condensed Consolidated Balance Sheets
March 31, 2015 | December 31, 2014 | ||||||
Assets | (Unaudited, Dollars in thousands, except per share amounts) | ||||||
Cash and cash equivalents | $ | 26,952 | $ | 33,157 | |||
Finance receivables held for sale | 1,045,869 | 46,585 | |||||
Finance receivables held for investment, net | 24,650,372 | 23,915,551 | |||||
Restricted cash | 2,687,304 | 1,920,857 | |||||
Accrued interest receivable | 353,121 | 364,676 | |||||
Leased vehicles, net | 5,042,419 | 4,862,783 | |||||
Furniture and equipment, net | 45,353 | 41,218 | |||||
Federal, state and other income taxes receivable | 124,545 | 502,035 | |||||
Related party taxes receivable | — | 459 | |||||
Deferred tax asset | 19,367 | 21,244 | |||||
Goodwill | 74,056 | 74,056 | |||||
Intangible assets | 53,590 | 53,682 | |||||
Due from affiliates | 90,351 | 102,457 | |||||
Other assets | 452,272 | 403,416 | |||||
Total assets | $ | 34,665,571 | $ | 32,342,176 | |||
Liabilities and Equity | |||||||
Liabilities: | |||||||
Notes payable — credit facilities | $ | 7,338,550 | $ | 6,402,327 | |||
Notes payable — secured structured financings | 18,000,121 | 17,718,974 | |||||
Notes payable — related party | 4,375,000 | 3,690,000 | |||||
Accrued interest payable | 19,175 | 17,432 | |||||
Accounts payable and accrued expenses | 366,707 | 315,130 | |||||
Federal, state and other income taxes payable | 6,856 | 319 | |||||
Deferred tax liabilities, net | 509,428 | 492,303 | |||||
Due to affiliates | 47,812 | 48,688 | |||||
Other liabilities | 151,441 | 98,654 | |||||
Total liabilities | 30,815,090 | 28,783,827 | |||||
Equity: | |||||||
Common stock, $0.01 par value | 3,500 | 3,490 | |||||
Additional paid-in capital | 1,576,234 | 1,560,519 | |||||
Accumulated other comprehensive income (loss) | (9,290 | ) | 3,553 | ||||
Retained earnings | 2,280,037 | 1,990,787 | |||||
Total stockholders’ equity | 3,850,481 | 3,558,349 | |||||
Total liabilities and equity | $ | 34,665,571 | $ | 32,342,176 | |||
6
Table 2: Condensed Consolidated Statements of Income
For the Three Months Ended March 31, | |||||||
2015 | 2014 | ||||||
(Unaudited, Dollars in thousands, except per share amounts) | |||||||
Interest on finance receivables and loans | $ | 1,230,002 | $ | 1,140,329 | |||
Leased vehicle income | 332,946 | 147,123 | |||||
Other finance and interest income | 7,341 | 250 | |||||
Total finance and other interest income | 1,570,289 | 1,287,702 | |||||
Interest expense | 148,856 | 124,446 | |||||
Leased vehicle expense | 273,064 | 120,069 | |||||
Net finance and other interest income | 1,148,369 | 1,043,187 | |||||
Provision for credit losses | 605,981 | 698,594 | |||||
Net finance and other interest income after provision for credit losses | 542,388 | 344,593 | |||||
Profit sharing | 13,516 | 32,161 | |||||
Net finance and other interest income after provision for credit losses and profit sharing | 528,872 | 312,432 | |||||
Investment gains, net | 21,247 | 35,814 | |||||
Servicing fee income | 24,803 | 10,405 | |||||
Fees, commissions, and other | 101,133 | 89,304 | |||||
Total other income | 147,183 | 135,523 | |||||
Salary and benefits expense | 100,540 | 201,915 | |||||
Repossession expense | 58,826 | 48,431 | |||||
Other operating costs | 86,013 | 68,102 | |||||
Total operating expenses | 245,379 | 318,448 | |||||
Income before income taxes | 430,676 | 129,507 | |||||
Income tax expense | 141,426 | 48,041 | |||||
Net income | 289,250 | 81,466 | |||||
Net income per common share (basic) | $ | 0.83 | $ | 0.23 | |||
Net income per common share (diluted) | $ | 0.81 | $ | 0.23 | |||
Dividends declared per common share | $ | — | $ | — | |||
Weighted average common shares (basic) | 349,421,960 | 348,101,891 | |||||
Weighted average common shares (diluted) | 356,654,466 | 356,325,036 | |||||
7
Table 3: Other Financial Information
For the Three Months Ended March 31, | ||||||||
2015 | 2014 | |||||||
Ratios | (Unaudited, Dollars in thousands) | |||||||
Yield on individually acquired retail installment contracts | 17.2 | % | 17.7 | % | ||||
Yield on purchased receivables portfolios | 14.1 | % | 15.7 | % | ||||
Yield on receivables from dealers | 5.1 | % | 4.1 | % | ||||
Yield on personal loans (1) | 21.0 | % | 27.6 | % | ||||
Yield on earning assets (2) | 15.2 | % | 16.6 | % | ||||
Cost of debt (3) | 2.1 | % | 2.0 | % | ||||
Net interest margin (4) | 13.4 | % | 14.8 | % | ||||
Efficiency ratio (5) | 18.9 | % | 27.0 | % | ||||
Expense ratio (6) | 2.2 | % | 3.8 | % | ||||
Return on average assets (7) | 3.5 | % | 1.2 | % | ||||
Return on average equity (8) | 31.2 | % | 11.6 | % | ||||
Net charge-off ratio on individually acquired retail installment contracts (9) | 6.1 | % | 6.2 | % | ||||
Net charge-off ratio on purchased receivables portfolios (9) | (1.3 | )% | 5.3 | % | ||||
Net charge-off ratio on personal loans (9) | 17.6 | % | 12.9 | % | ||||
Net charge-off ratio (9) | 6.7 | % | 6.4 | % | ||||
Delinquency ratio on individually acquired retail installment contracts, end of period (10) | 2.9 | % | 2.6 | % | ||||
Delinquency ratio on personal loans, end of period (10) | 6.6 | % | 7.4 | % | ||||
Delinquency ratio, end of period (10) | 3.2 | % | 3.1 | % | ||||
Tangible common equity to tangible assets (11) | 10.8 | % | 9.7 | % | ||||
Common stock dividend payout ratio (12) | — | — | ||||||
Allowance to loans (13) | 11.5 | % | 11.0 | % | ||||
Other Financial Information | ||||||||
Charge-offs, net of recoveries, on individually acquired retail installment contracts | $ | 383,657 | $ | 344,788 | ||||
Charge-offs, net of recoveries, on purchased receivables portfolios | (2,550 | ) | 23,523 | |||||
Charge-offs, net of recoveries, on unsecured consumer loans | 93,485 | 38,289 | ||||||
Charge-offs, net of recoveries, on capital leases | 183 | — | ||||||
Total charge-offs, net of recoveries | $ | 474,775 | $ | 406,600 | ||||
End of period Individually acquired retail installment contracts Delinquent principal over 60 days | $ | 729,274 | $ | 602,983 | ||||
End of period Personal loans Delinquent principal over 60 days | $ | 140,636 | $ | 90,103 | ||||
End of period Delinquent principal over 60 days | $ | 913,324 | $ | 802,133 | ||||
End of period assets covered by allowance for credit losses | $ | 27,868,510 | $ | 24,156,564 | ||||
End of period Gross finance receivables and loans | $ | 28,412,473 | $ | 25,720,396 | ||||
End of period Gross finance receivables, loans, and leases | $ | 34,251,453 | $ | 29,082,803 | ||||
Average Gross individually acquired retail installment contracts | $ | 25,355,751 | $ | 22,313,555 | ||||
Average Gross purchased receivables portfolios | 765,653 | 1,761,056 | ||||||
Average Gross receivables from dealers | 102,714 | 129,943 | ||||||
Average Gross personal loans | 2,128,655 | 1,189,570 | ||||||
Average Gross capital leases | 116,264 | 766 | ||||||
Average Gross finance receivables, loans and capital leases | $ | 28,469,037 | $ | 25,394,890 | ||||
Average Gross finance receivables, loans, and leases | $ | 34,206,058 | $ | 28,213,931 | ||||
Average Managed assets | $ | 44,782,142 | $ | 33,285,709 | ||||
Average Total assets | $ | 33,382,629 | $ | 27,812,499 | ||||
Average Debt | $ | 28,626,060 | $ | 24,570,719 | ||||
Average Total equity | $ | 3,704,399 | $ | 2,809,838 | ||||
8
(1) | Includes Finance and other interest income; excludes fees |
(2) | “Yield on earning assets” is defined as the ratio of Total finance and other interest income, net of Leased vehicle expense, to Average gross finance receivables, loans and leases* |
(3) | “Cost of debt” is defined as the ratio of Interest expense to Average debt* |
(4) | “Net interest margin” is defined as the ratio of Net finance and other interest income to Average gross finance receivables, loans and leases* |
(5) | “Efficiency ratio” is defined as the ratio of Operating expenses to the sum of Net finance and other interest income and Other income |
(6) | "Expense ratio" is defined as the ratio of Operating expenses to Average managed assets* |
(7) | “Return on average assets” is defined as the ratio of Net income to Average total assets* |
(8) | “Return on average equity” is defined as the ratio of Net income to Average total equity* |
(9) | “Net charge-off ratio” is defined as the ratio of Charge-offs, net of recoveries, to average balance of the respective portfolio* |
(10) | “Delinquency ratio” is defined as the ratio of End of period Delinquent principal over 60 days to End of period gross balance of the respective portfolio |
(11) | “Tangible common equity to tangible assets" is defined as the ratio of Total equity, excluding Goodwill and intangible assets, to Total assets, excluding Goodwill and intangible assets (for a reconciliation from GAAP to this non-GAAP measure, see “Reconciliation of Non-GAAP Measures” on Page 14 of this release) |
(12) | “Common stock dividend payout ratio” is defined as the ratio of Dividends declared per share of common stock to Earnings per share |
(13) | “Allowance to loans” is defined as the ratio of Allowance for credit losses to End of period assets covered by allowance for credit losses |
*Ratio is annualized
9
Table 4: Credit Quality
Amounts as of and for the quarter ended March 31, 2015 are as follows:
(dollars in thousands)
Retail Installment Contracts Acquired Individually | Personal Loans | ||||||||||
Credit loss allowance — beginning of period | $ | 2,726,338 | $ | 348,660 | |||||||
Provision for credit losses | 507,148 | 97,703 | |||||||||
Charge-offs | (926,993 | ) | (99,690 | ) | |||||||
Recoveries | 543,336 | 6,205 | |||||||||
Transfers to held-for-sale | (27,117 | ) | — | ||||||||
Credit loss allowance — end of period | $ | 2,822,712 | $ | 352,878 | |||||||
Net charge-offs | $ | 383,657 | $ | 93,485 | |||||||
Average unpaid principal balance (UPB) | 25,355,751 | 2,128,655 | |||||||||
Charge-off ratio | 6.1 | % | 17.6 | % | |||||||
Retail Installment Contracts Acquired Individually | Personal Loans | ||||||||||||
Principal, 31-60 days past due | $ | 1,716,139 | 6.7 | % | $ | 58,389 | 2.8 | % | |||||
Delinquent principal over 60 days | 729,274 | 2.9 | % | 140,636 | 6.6 | % | |||||||
Total delinquent principal | $ | 2,445,413 | 9.6 | % | $ | 199,025 | 9.4 | % | |||||
10
Table 5: Originations
Three Months Ended | |||||||
March 31, 2015 | March 31, 2014 | ||||||
Retained Originations | (Dollars in thousands) | ||||||
Retail installment contracts | $ | 4,791,581 | $ | 4,499,969 | |||
Average APR | 16.9 | % | 16.0 | % | |||
Discount | 3.4 | % | 3.5 | % | |||
Personal loans | $ | 166,492 | $ | 107,902 | |||
Average APR | 18.1 | % | 20.8 | % | |||
Discount | — | — | |||||
Receivables from dealers | $ | — | $ | 14,823 | |||
Average APR | — | 3.4 | % | ||||
Discount | — | — | |||||
Leased vehicles | $ | 1,130,115 | $ | 1,211,999 | |||
Capital leases | $ | 55,730 | $ | 3,046 | |||
Total originations retained | $ | 6,143,918 | $ | 5,837,739 | |||
Sold Originations | |||||||
Retail installment contracts | $ | 804,144 | $ | 1,112,667 | |||
Average APR | 4.7 | % | 4.5 | % | |||
Receivables from dealers | $ | — | $ | — | |||
Average APR | — | — | |||||
Leased vehicles | $ | — | $ | — | |||
Total originations sold | $ | 804,144 | $ | 1,112,667 | |||
Total SCUSA originations | $ | 6,948,062 | $ | 6,950,406 | |||
Facilitated Originations | |||||||
Retail installment contracts | $ | — | $ | — | |||
Receivables from dealers | $ | — | $ | 144,753 | |||
Leased vehicles | 403,899 | 245,668 | |||||
Total originations facilitated for affiliates | $ | 403,899 | $ | 390,421 | |||
Total originations | $ | 7,351,961 | $ | 7,340,827 | |||
11
Table 6: Asset Sales
Asset sales may include assets originated in prior periods.
Three Months Ended | |||||||
March 31, 2015 | March 31, 2014 | ||||||
(Dollars in thousands) | |||||||
Asset Sales | |||||||
Retail installment contracts | $ | 919,078 | $ | 1,685,724 | |||
Average APR | 4.7 | % | 4.5 | % | |||
Receivables from dealers | $ | — | $ | — | |||
Average APR | — | — | |||||
Leased vehicles | $ | 561,334 | $ | — | |||
Total asset sales | $ | 1,480,412 | $ | 1,685,724 | |||
12
Table 7: Ending Portfolio
Ending outstanding balance, average APR and remaining unaccreted discount as of March 31, 2015 and December 31, 2014 are as follows:
March 31, 2015 | December 31, 2014 | ||||||
(Dollars in thousands) | |||||||
Retail installment contracts | $ | 26,194,567 | $ | 25,401,461 | |||
Average APR | 16.6 | % | 16.0 | % | |||
Discount | 2.4 | % | 2.1 | % | |||
Personal loans | $ | 2,115,496 | $ | 2,128,769 | |||
Average APR | 23.0 | % | 23.1 | % | |||
Discount | 0.1 | % | 0.1 | % | |||
Receivables from dealers | $ | 102,410 | $ | 100,164 | |||
Average APR | 4.2 | % | 4.3 | % | |||
Discount | — | — | |||||
Leased vehicles | $ | 5,695,353 | $ | 5,504,467 | |||
Capital leases | $ | 143,627 | $ | 91,350 | |||
13
Table 8: Reconciliation of Non-GAAP Measures
(Dollars in thousands, except per share data) | For the Three Months Ended | |||||||
March 31, 2014 | ||||||||
Net income | $ | 81,466 | ||||||
Add back: | ||||||||
Stock compensation recognized upon IPO, net of tax | 74,428 | |||||||
Other IPO-related expenses, net of tax | 1,409 | |||||||
Core net income | $ | 157,303 | ||||||
Weighted average common shares (diluted) | 356,325,036 | |||||||
Net income per common share (diluted) | $ | 0.23 | ||||||
Core net income per common share (diluted) | $ | 0.44 | ||||||
Average total assets | $ | 27,812,499 | ||||||
Return on average assets | 1.2 | % | ||||||
Core return on average assets | 2.3 | % | ||||||
Average total equity | $ | 2,809,838 | ||||||
Return on average equity | 11.6 | % | ||||||
Core return on average equity | 22.4 | % | ||||||
Operating expenses | $ | 318,448 | ||||||
Deduct: | ||||||||
Stock compensation recognized upon IPO, net of tax | 117,654 | |||||||
Other IPO-related expenses, net of tax | 2,175 | |||||||
Core operating expenses | $ | 198,619 | ||||||
Sum of net interest income and other income | $ | 1,178,710 | ||||||
Efficiency ratio | 27.0 | % | ||||||
Core efficiency ratio | 16.9 | % | ||||||
Average managed assets | $ | 33,285,709 | ||||||
Expense ratio | 3.8 | % | ||||||
Core expense ratio | 2.4 | % | ||||||
March 31, 2015 | March 31, 2014 | |||||||
Total equity | $ | 3,850,481 | $ | 2,908,018 | ||||
Deduct: Goodwill and intangibles | 127,646 | 128,447 | ||||||
Tangible common equity | $ | 3,722,835 | $ | 2,779,571 | ||||
Total assets | $ | 34,665,571 | $ | 28,796,233 | ||||
Deduct: Goodwill and intangibles | 127,646 | 128,447 | ||||||
Tangible assets | $ | 34,537,925 | $ | 28,667,786 | ||||
Equity to assets ratio | 11.1 | % | 10.1 | % | ||||
Tangible common equity to tangible assets | 10.8 | % | 9.7 | % | ||||
14
Santander Consumer USA Holdings Inc. 1Q15 Company Update
2IMPORTANT INFORMATION Forward-Looking Statements This presentation contains forward-looking statements within the meaning of the Private Securities Litigation Reform Act of 1995. Any statements about our expectations, beliefs, plans, predictions, forecasts, objectives, assumptions, or future events or performance are not historical facts and may be forward- looking. These statements are often, but not always, made through the use of words or phrases such as “anticipates,” “believes,” “can,” “could,” “may,” “predicts,” “potential,” “should,” “will,” “estimates,” “plans,” “projects,” “continuing,” “ongoing,” “expects,” “intends,” and similar words or phrases. Although we believe that the expectations reflected in these forward-looking statements are reasonable, these statements are not guarantees of future performance and involve risks and uncertainties which are subject to change based on various important factors, some of which are beyond our control. For additional discussion of these risks, refer to the section entitled “Risk Factors” and elsewhere in our Annual Report on Form 10-K and our Quarterly Reports on Form 10-Q filed by us with the SEC. Among the factors that could cause our financial performance to differ materially from that suggested by the forward-looking statements are: (a) we operate in a highly regulated industry and continually changing federal, state, and local laws and regulations could materially adversely affect our business; (b) adverse economic conditions in the United States and worldwide may negatively impact our results; (c) our business could suffer if our access to funding is reduced; (d) we face significant risks implementing our growth strategy, some of which are outside our control; (e) our agreement with Chrysler may not result in currently anticipated levels of growth and is subject to certain performance conditions that could result in termination of the agreement; (f) our business could suffer if we are unsuccessful in developing and maintaining relationships with automobile dealerships; (g) our financial condition, liquidity, and results of operations depend on the credit performance of our loans; (h) loss of our key management or other personnel, or an inability to attract such management and personnel, could negatively impact our business; (i) we are subject to certain regulations, including oversight by the Office of the Comptroller of the Currency, the CFPB, the Bank of Spain, and the Federal Reserve, which oversight and regulation may limit certain of our activities, including the timing and amount of dividends and other limitations on our business; and (j) future changes in our relationship with Santander could adversely affect our operations. If one or more of the factors affecting our forward-looking information and statements proves incorrect, our actual results, performance or achievements could differ materially from those expressed in, or implied by, forward-looking information and statements. Therefore, we caution not to place undue reliance on any forward-looking information or statements. The effect of these factors is difficult to predict. Factors other than these also could adversely affect our results, and the reader should not consider these factors to be a complete set of all potential risks or uncertainties. New factors emerge from time to time, and management cannot assess the impact of any such factor on our business or the extent to which any factor, or combination of factors, may cause results to differ materially from those contained in any forward-looking statement. Any forward-looking statements only speak as of the date of this document, and we undertake no obligation to update any forward-looking information or statements, whether written or oral, to reflect any change, except as required by law. All forward-looking statements attributable to us are expressly qualified by these cautionary statements.
3AGENDA Highlights Strategy and Business Results Appendix: Financial and Supplemental Information
41Q15: HIGHLIGHTS • Q1 2015 net income of $289.2 million, or $0.81 per diluted common share, up from Q1 2014 net income of $81.5 million, or $0.23 per diluted common share • Up 84% from core net income1 in Q1 2014 of $157.3 million, or $0.44 per diluted common share • Q1 2015 ROE and ROA of 31.2% and 3.5%, respectively, up from ROE and ROA of 11.6% and 1.2% in Q1 2014, respectively • Q1 2014 core ROE1 and ROA1 of 22.4% and 2.3%, respectively • Strong capital base, TCE/TA1 of 10.8%, up more than 100 bps from Q1 2014 • Current portfolio performance in line with expectations and consistent with retained mix and typical seasonal patterns • Net charge-off ratio of 6.7%, down seasonally from 8.6% in Q4 2014 and up marginally from 6.4% in Q1 2014 • Allowance to loans ratio2 of 11.5% is flat quarter-over-quarter and up from 11.0% as of Q1 2014 • Total originations and asset sales of $7.4 billion and $1.5 billion, respectively • Chrysler Capital penetration rate of 30%, up from 27% at the end of Q4 2014; remain confident about ongoing success of Chrysler agreement • Strong demand for assets originated by SCUSA • $919 million through monthly flow programs, $561 million lease sale3 to a new counterparty, bankruptcy sale of charged-off assets realizing $38 million in proceeds and a new bankruptcy forward flow program • • Continued access to liquidity across multiple sources demonstrating quality of the platform (Largest volume retail auto issuer since 20104) • $1.3 billion transaction from SDART securitization platform5 • $1.1 billion of advances on new and existing private term amortizing facilities • $712 million transaction from relaunch of DRIVE platform; the first transaction since 2006 • • Platform increased to $11.2 billion from $6.2 billion in Q1 2014 • Q1 2015 servicing fee income of $25 million increased from $10 million in Q1 2014 • Remain focused on optimizing mix between retained and sold assets in 2015 • Expense ratio and efficiency ratio of 2.2% and 18.9%, respectively • • Focused on balance sheet optimization, risk-adjusted returns and performance through cycles • Leveraging history of big bank ownership and compliance culture • Dynamic regulatory environment creating barrier to entry benefiting stronger industry players • Resources committed to meet regulatory expectations • Enhanced three lines of defense framework Robust Financial Performance Quality Originations & Asset Sales Serviced for Others Platform Stable Credit Performance Sound Risk Management & Compliance Capital Markets Expertise 1 Q1 2014 core net income and operating expenses adjusted for $119.8 million pre-tax ($75.8 million after-tax) non-recurring stock compensation and other IPO-related expenses; reconciliation in Appendix 2 Allowance to loan ratios exclude purchased receivables portfolio and finance receivables held for sale 3 Depreciated net cap cost 4 As of April 2015 5 Net bonds sold of $1.25 billion
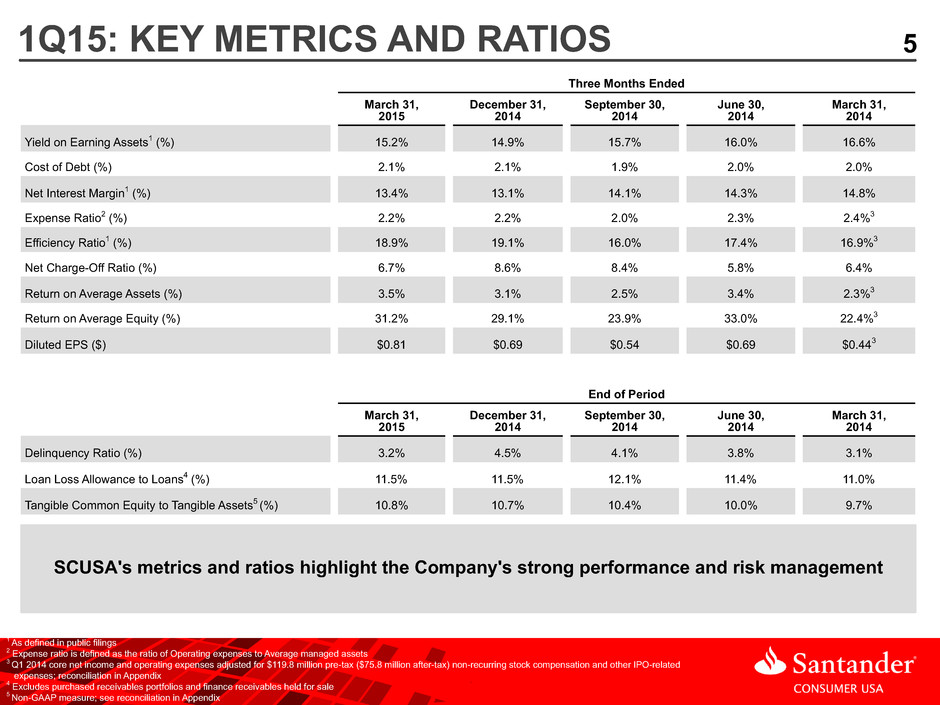
51Q15: KEY METRICS AND RATIOS 1 As defined in public filings 2 Expense ratio is defined as the ratio of Operating expenses to Average managed assets 3 Q1 2014 core net income and operating expenses adjusted for $119.8 million pre-tax ($75.8 million after-tax) non-recurring stock compensation and other IPO-related expenses; reconciliation in Appendix 4 Excludes purchased receivables portfolios and finance receivables held for sale 5 Non-GAAP measure; see reconciliation in Appendix Three Months Ended March 31, 2015 December 31, 2014 September 30, 2014 June 30, 2014 March 31, 2014 Yield on Earning Assets1 (%) 15.2% 14.9% 15.7% 16.0% 16.6% Cost of Debt (%) 2.1% 2.1% 1.9% 2.0% 2.0% Net Interest Margin1 (%) 13.4% 13.1% 14.1% 14.3% 14.8% Expense Ratio2 (%) 2.2% 2.2% 2.0% 2.3% 2.4%3 Efficiency Ratio1 (%) 18.9% 19.1% 16.0% 17.4% 16.9%3 Net Charge-Off Ratio (%) 6.7% 8.6% 8.4% 5.8% 6.4% Return on Average Assets (%) 3.5% 3.1% 2.5% 3.4% 2.3%3 Return on Average Equity (%) 31.2% 29.1% 23.9% 33.0% 22.4%3 Diluted EPS ($) $0.81 $0.69 $0.54 $0.69 $0.443 End of Period March 31, 2015 December 31, 2014 September 30, 2014 June 30, 2014 March 31, 2014 Delinquency Ratio (%) 3.2% 4.5% 4.1% 3.8% 3.1% Loan Loss Allowance to Loans4 (%) 11.5% 11.5% 12.1% 11.4% 11.0% Tangible Common Equity to Tangible Assets5 (%) 10.8% 10.7% 10.4% 10.0% 9.7% SCUSA's metrics and ratios highlight the Company's strong performance and risk management
6AGENDA Highlights Strategy and Business Results Appendix: Financial and Supplemental Information
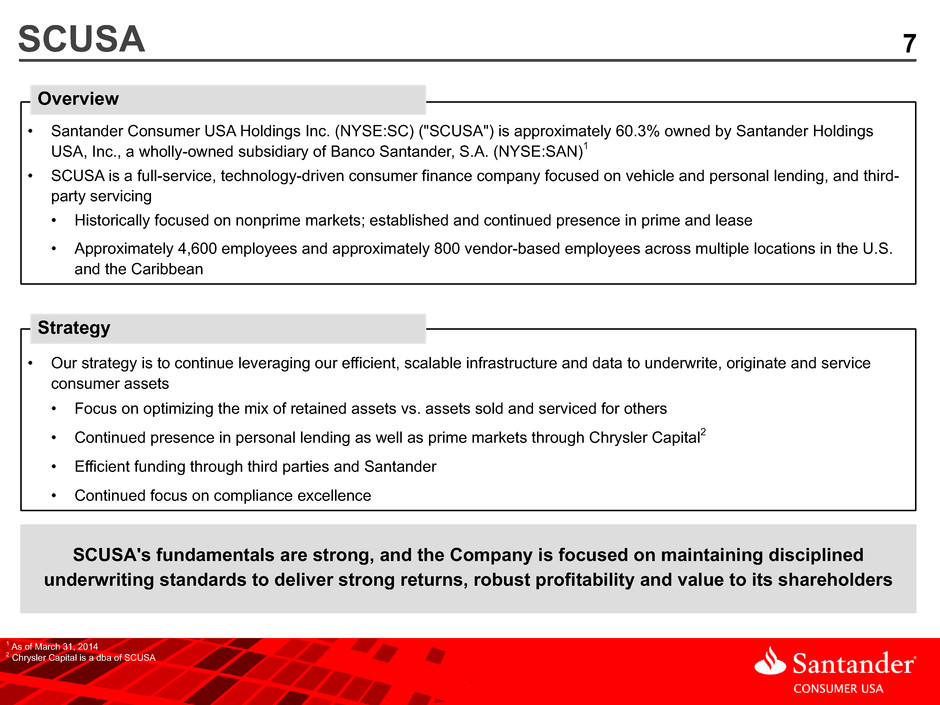
7SCUSA SCUSA's fundamentals are strong, and the Company is focused on maintaining disciplined underwriting standards to deliver strong returns, robust profitability and value to its shareholders 1 As of March 31, 2014 2 Chrysler Capital is a dba of SCUSA • Santander Consumer USA Holdings Inc. (NYSE: SC) ("SCUSA") is approximately 60.3% owned by Santander Holdings USA, Inc., a wholly-owned subsidiary of Banco Santander, S.A. (NYSE:SAN)1 • SCUSA is a full-service, technology-driven consumer finance company focused on vehicle and personal lending, and third- party servicing • Historically focused on nonprime markets; established and continued presence in prime and lease • Approximately 4,600 employees and approximately 800 vendor-based employees across multiple locations in the U.S. and the Caribbean Overview • Our strategy is to continue leveraging our efficient, scalable infrastructure and data to underwrite, originate and service consumer assets • Focus on optimizing the mix of retained assets vs. assets sold and serviced for others • Continued presence in personal lending as well as prime markets through Chrysler Capital2 • Efficient funding through third parties and Santander • Continued focus on compliance excellence Strategy
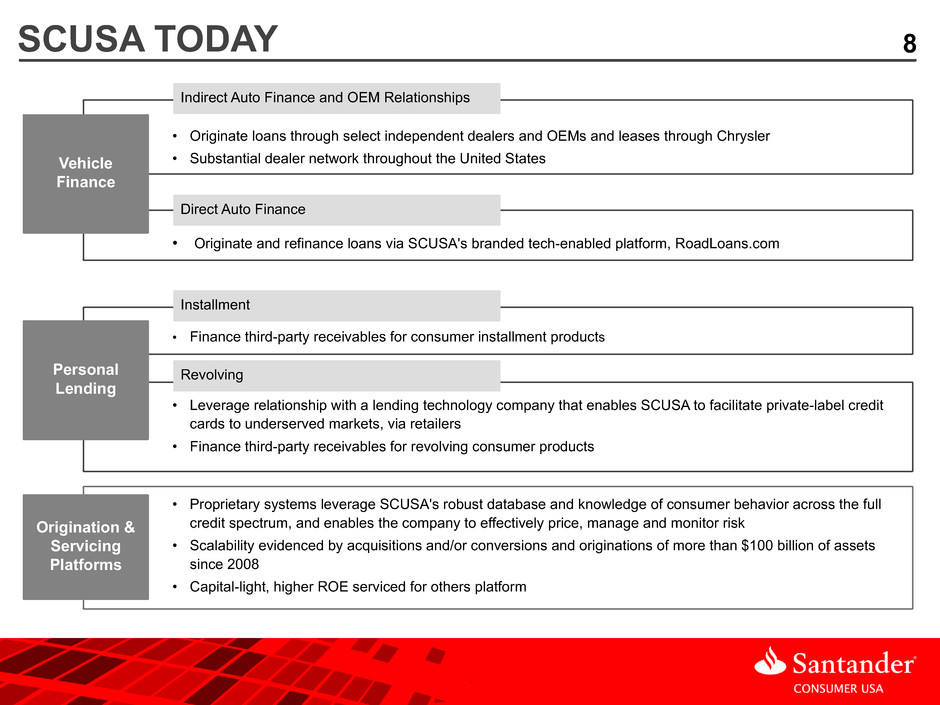
8SCUSA TODAY • Originate loans through select independent dealers and OEMs and leases through Chrysler • Substantial dealer network throughout the United States • Originate and refinance loans via SCUSA's branded tech-enabled platform, RoadLoans.com Vehicle Finance Direct Auto Finance Indirect Auto Finance and OEM Relationships • Finance third-party receivables for consumer installment products • Leverage relationship with a lending technology company that enables SCUSA to facilitate private-label credit cards to underserved markets, via retailers • Finance third-party receivables for revolving consumer products Personal Lending Revolving Installment • Proprietary systems leverage SCUSA's robust database and knowledge of consumer behavior across the full credit spectrum, and enables the company to effectively price, manage and monitor risk • Scalability evidenced by acquisitions and/or conversions and originations of more than $100 billion of assets since 2008 • Capital-light, higher ROE serviced for others platform Origination & Servicing Platforms
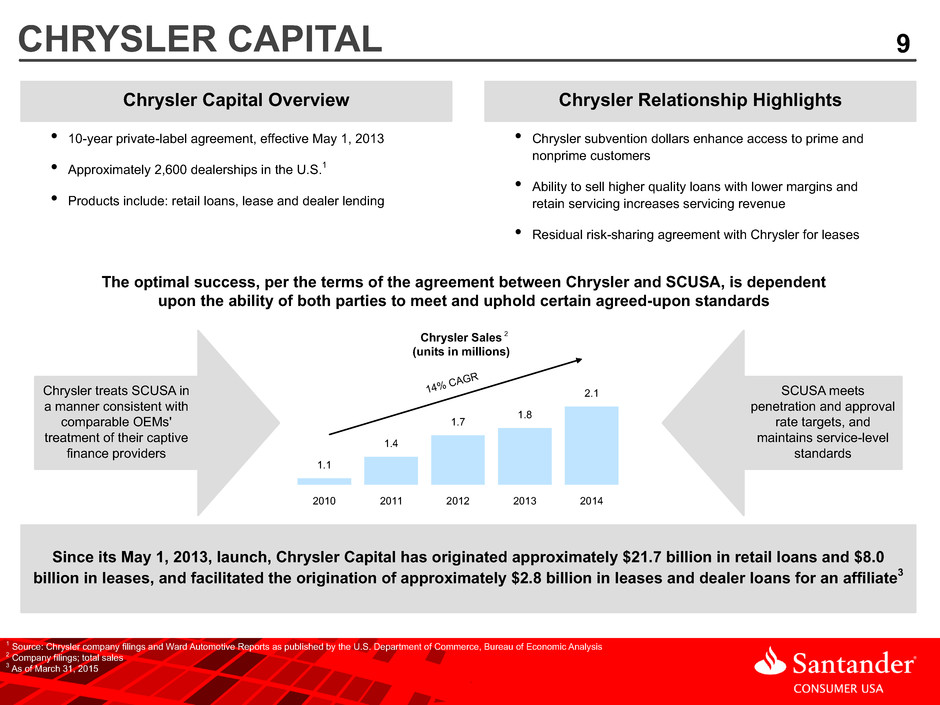
9CHRYSLER CAPITAL Chrysler Capital Overview Chrysler Relationship Highlights • 10-year private-label agreement, effective May 1, 2013 • Approximately 2,600 dealerships in the U.S.1 • Products include: retail loans, lease and dealer lending • Chrysler subvention dollars enhance access to prime and nonprime customers • Ability to sell higher quality loans with lower margins and retain servicing increases servicing revenue • Residual risk-sharing agreement with Chrysler for leases The optimal success, per the terms of the agreement between Chrysler and SCUSA, is dependent upon the ability of both parties to meet and uphold certain agreed-upon standards Since its May 1, 2013, launch, Chrysler Capital has originated approximately $21.7 billion in retail loans and $8.0 billion in leases, and facilitated the origination of approximately $2.8 billion in leases and dealer loans for an affiliate3 Chrysler treats SCUSA in a manner consistent with comparable OEMs' treatment of their captive finance providers SCUSA meets penetration and approval rate targets, and maintains service-level standards Chrysler Sales (units in millions) 2010 2011 2012 2013 2014 1.1 1.4 1.7 1.8 2.114% CAG R 1 Source: Chrysler company filings and Ward Automotive Reports as published by the U.S. Department of Commerce, Bureau of Economic Analysis 2 Company filings; total sales 3 As of March 31, 2015 2
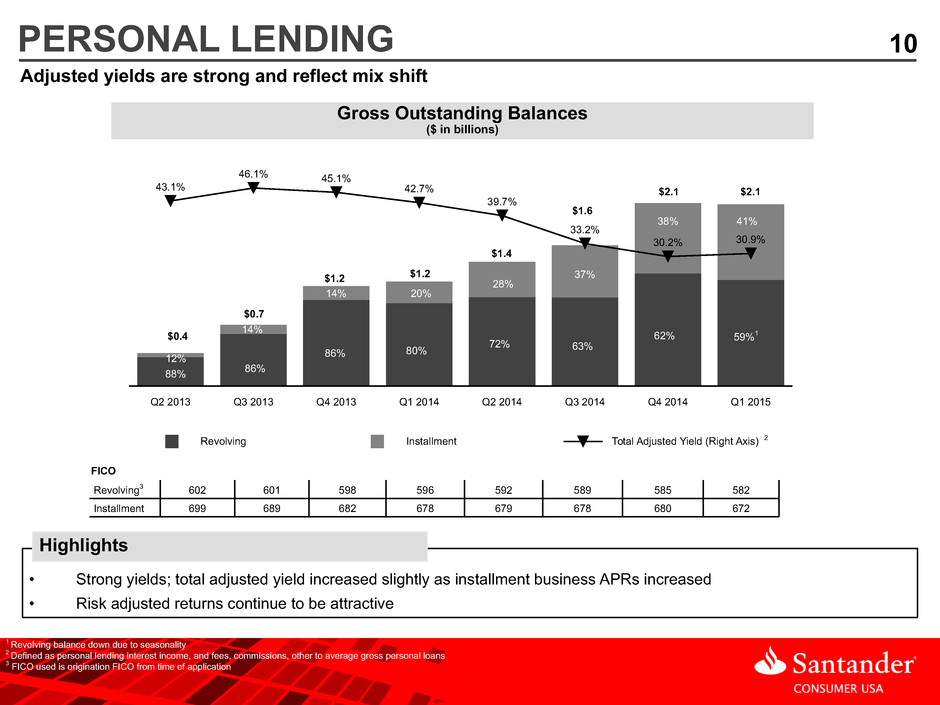
10 Gross Outstanding Balances ($ in billions) PERSONAL LENDING Revolving Installment Total Adjusted Yield (Right Axis) Q2 2013 Q3 2013 Q4 2013 Q1 2014 Q2 2014 Q3 2014 Q4 2014 Q1 2015 43.1% 46.1% 45.1% 42.7% 39.7% 33.2% 30.2% 30.9% 88% 38% 37% 28% 20%14% 14% 12% 86% 86% 80% 72% 63% 62% 59%1 41% 1 Revolving balance down due to seasonality 2 Defined as personal lending interest income, and fees, commissions, other to average gross personal loans 3 FICO used is origination FICO from time of application Revolving3 602 601 598 596 592 589 585 582 Installment 699 689 682 678 679 678 680 672 2 $0.4 $0.7 $1.2 $1.2 $1.4 $1.6 $2.1 $2.1 FICO • Strong yields; total adjusted yield increased slightly as installment business APRs increased • Risk adjusted returns continue to be attractive Highlights Adjusted yields are strong and reflect mix shift
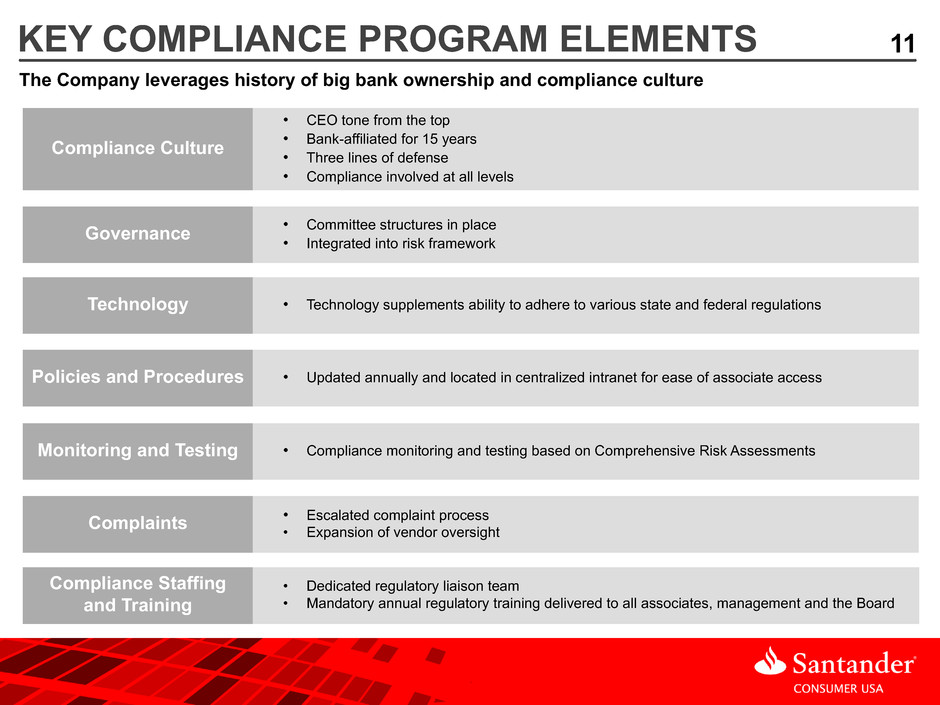
11KEY COMPLIANCE PROGRAM ELEMENTS The Company leverages history of big bank ownership and compliance culture Compliance Culture Governance Technology Compliance Staffing and Training Complaints Monitoring and Testing Policies and Procedures • CEO tone from the top • Bank-affiliated for 15 years • Three lines of defense • Compliance involved at all levels • Committee structures in place • Integrated into risk framework • Updated annually and located in centralized intranet for ease of associate access • Compliance monitoring and testing based on Comprehensive Risk Assessments • Escalated complaint process • Expansion of vendor oversight • Dedicated regulatory liaison team • Mandatory annual regulatory training delivered to all associates, management and the Board • Technology supplements ability to adhere to various state and federal regulations
12AGENDA Highlights Strategy and Business Results Appendix: Financial and Supplemental Information
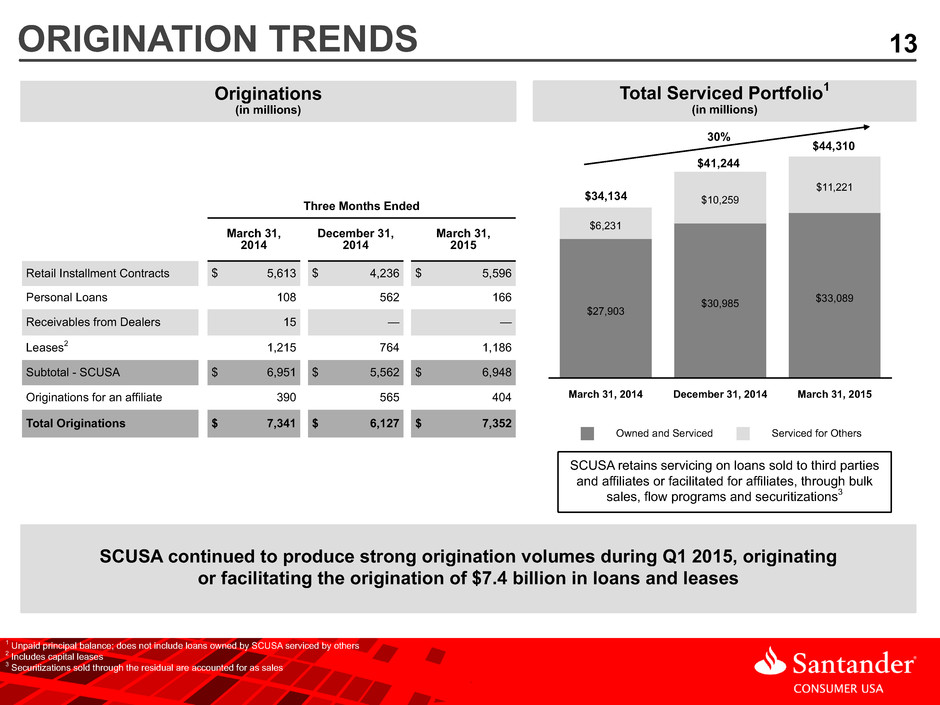
13ORIGINATION TRENDS 1 Unpaid principal balance; does not include loans owned by SCUSA serviced by others 2 Includes capital leases 3 Securitizations sold through the residual are accounted for as sales SCUSA retains servicing on loans sold to third parties and affiliates or facilitated for affiliates, through bulk sales, flow programs and securitizations3 SCUSA continued to produce strong origination volumes during Q1 2015, originating or facilitating the origination of $7.4 billion in loans and leases Originations (in millions) Total Serviced Portfolio1 (in millions) Three Months Ended March 31, 2014 December 31, 2014 March 31, 2015 Retail Installment Contracts $ 5,613 $ 4,236 $ 5,596 Personal Loans 108 562 166 Receivables from Dealers 15 — — Leases2 1,215 764 1,186 Subtotal - SCUSA $ 6,951 $ 5,562 $ 6,948 Originations for an affiliate 390 565 404 Total Originations $ 7,341 $ 6,127 $ 7,352 Owned and Serviced Serviced for Others March 31, 2014 December 31, 2014 March 31, 2015 $27,903 $30,985 $33,089 $6,231 $10,259 $11,221 $34,134 $41,244 $44,310 30%
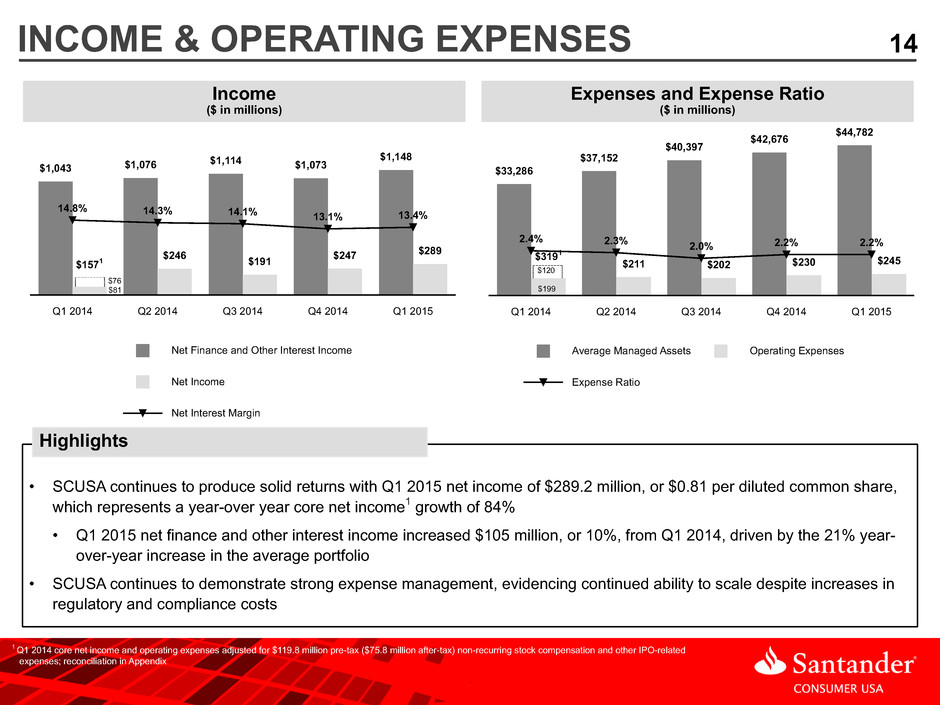
14 Expenses and Expense Ratio ($ in millions) $211 $202 $230 $245 Average Managed Assets Operating Expenses Expense Ratio Q1 2014 Q2 2014 Q3 2014 Q4 2014 Q1 2015 $33,286 $37,152 $40,397 $42,676 $44,782 2.4% 2.3% 2.0% 2.2% 2.2% Income ($ in millions) • SCUSA continues to produce solid returns with Q1 2015 net income of $289.2 million, or $0.81 per diluted common share, which represents a year-over year core net income1 growth of 84% • Q1 2015 net finance and other interest income increased $105 million, or 10%, from Q1 2014, driven by the 21% year- over-year increase in the average portfolio • SCUSA continues to demonstrate strong expense management, evidencing continued ability to scale despite increases in regulatory and compliance costs Highlights Net Finance and Other Interest Income Net Income Net Interest Margin Q1 2014 Q2 2014 Q3 2014 Q4 2014 Q1 2015 $1,043 $1,076 $1,114 $1,073 $1,148 $246 $191 $247 $289 14.8% 14.3% 14.1% 13.1% 13.4% $120 INCOME & OPERATING EXPENSES 1 Q1 2014 core net income and operating expenses adjusted for $119.8 million pre-tax ($75.8 million after-tax) non-recurring stock compensation and other IPO-related expenses; reconciliation in Appendix $1571 $76 $81 $199 $3191
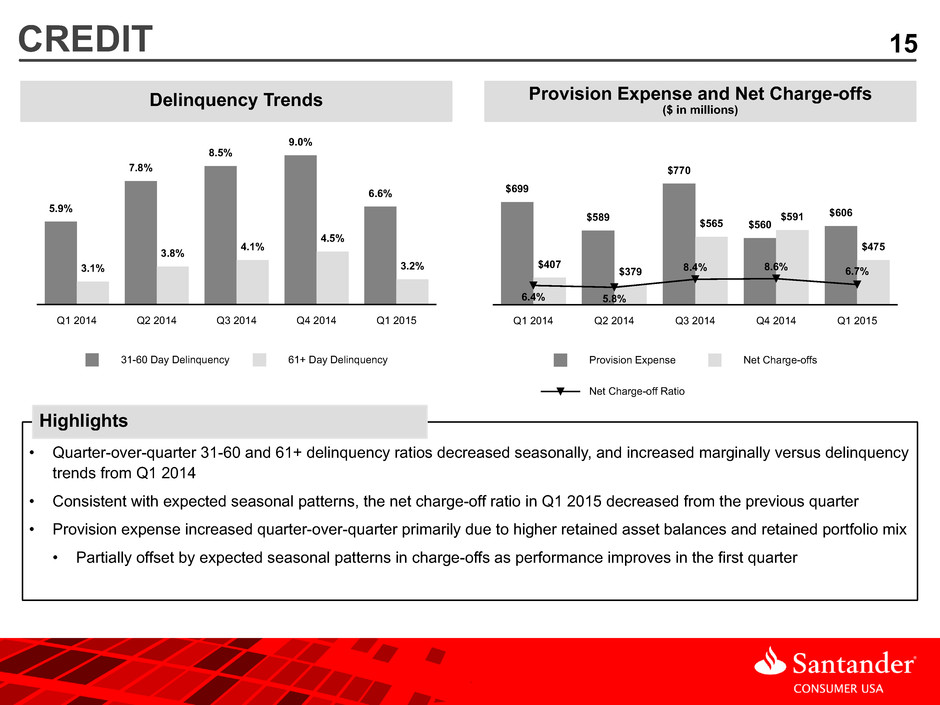
15 Provision Expense and Net Charge-offs ($ in millions)Delinquency Trends 31-60 Day Delinquency 61+ Day Delinquency Q1 2014 Q2 2014 Q3 2014 Q4 2014 Q1 2015 5.9% 7.8% 8.5% 9.0% 6.6% 3.1% 3.8% 4.1% 4.5% 3.2% Provision Expense Net Charge-offs Net Charge-off Ratio Q1 2014 Q2 2014 Q3 2014 Q4 2014 Q1 2015 $699 $589 $770 $560 $606 $407 $379 $565 $591 $475 6.4% 5.8% 8.4% 8.6% 6.7% CREDIT • Quarter-over-quarter 31-60 and 61+ delinquency ratios decreased seasonally, and increased marginally versus delinquency trends from Q1 2014 • Consistent with expected seasonal patterns, the net charge-off ratio in Q1 2015 decreased from the previous quarter • Provision expense increased quarter-over-quarter primarily due to higher retained asset balances and retained portfolio mix • Partially offset by expected seasonal patterns in charge-offs as performance improves in the first quarter Highlights
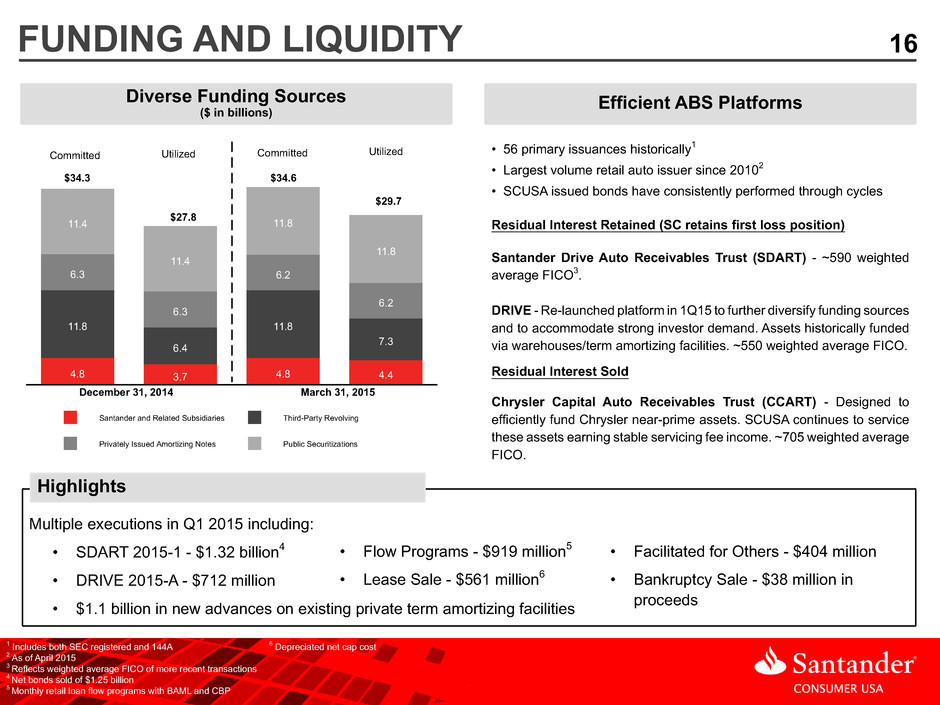
16 Diverse Funding Sources ($ in billions) Santander and Related Subsidiaries Third-Party Revolving Privately Issued Amortizing Notes Public Securitizations 4.8 3.7 4.8 4.4 11.8 6.4 11.8 7.3 6.3 6.3 6.2 6.2 11.4 11.4 11.8 34.6 11.8 29.7 Santander Drive Auto Receivables Trust (SDART) - ~590 weighted average FICO3. DRIVE - Re-launched platform in 1Q15 to further diversify funding sources and to accommodate strong investor demand. Assets historically funded via warehouses/term amortizing facilities. ~550 weighted average FICO. FUNDING AND LIQUIDITY 1 Includes both SEC registered and 144A 2 As of April 2015 3 Reflects weighted average FICO of more recent transactions 4 Net bonds sold of $1.25 billion 5 Monthly retail loan flow programs with BAML and CBP Residual Interest Retained (SC retains first loss position) Residual Interest Sold Chrysler Capital Auto Receivables Trust (CCART) - Designed to efficiently fund Chrysler near-prime assets. SCUSA continues to service these assets earning stable servicing fee income. ~705 weighted average FICO. Multiple executions in Q1 2015 including: • SDART 2015-1 - $1.32 billion4 • DRIVE 2015-A - $712 million • $1.1 billion in new advances on existing private term amortizing facilities Highlights Efficient ABS Platforms $34.6 $29.7 • Flow Programs - $919 million5 • Lease Sale - $561 million6 Committed Utilized • Facilitated for Others - $404 million • Bankruptcy Sale - $38 million in proceeds Committed Utilized $34.3 $27.8 March 31, 2015December 31, 2014 • 56 primary issuances historically1 • Largest volume retail auto issuer since 20102 • SCUSA issued bonds have consistently performed through cycles 6 Depreciated net cap cost
17AGENDA Highlights Strategy and Business Results Appendix: Financial and Supplemental Information
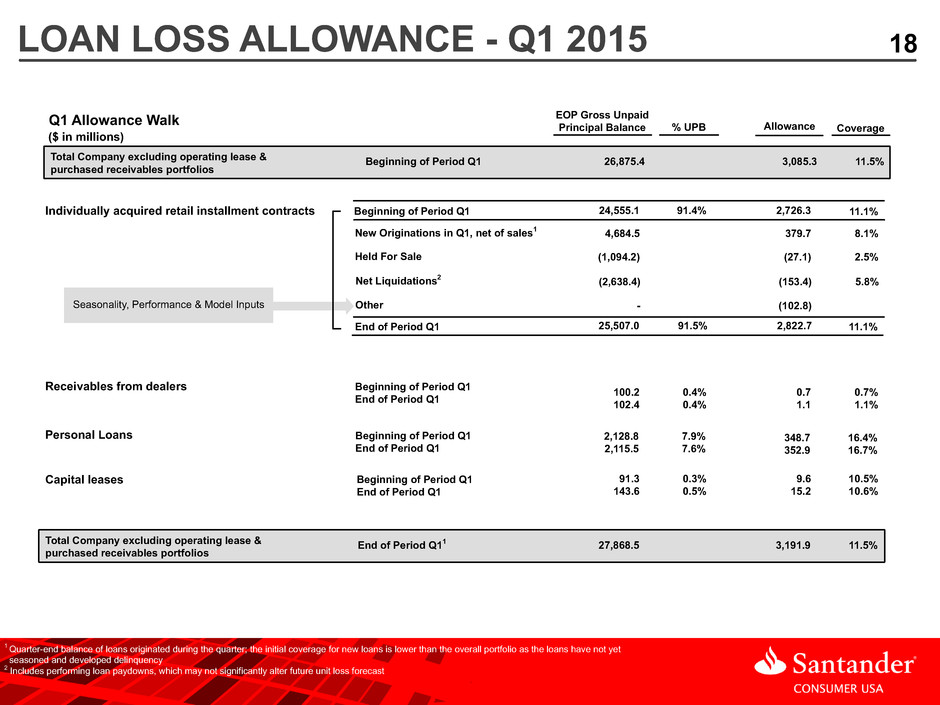
18LOAN LOSS ALLOWANCE - Q1 2015 Q1 Allowance Walk Total Company excluding operating lease & purchased receivables portfolios Beginning of Period Q1 CoverageAllowance% UPB EOP Gross Unpaid Principal Balance 26,875.4 3,085.3 11.5% Total Company excluding operating lease & purchased receivables portfolios End of Period Q11 27,868.5 3,191.9 11.5% 1 Quarter-end balance of loans originated during the quarter; the initial coverage for new loans is lower than the overall portfolio as the loans have not yet seasoned and developed delinquency 2 Includes performing loan paydowns, which may not significantly alter future unit loss forecast Individually acquired retail installment contracts Beginning of Period Q1 24,555.1 91.4% 2,726.3 11.1% New Originations in Q1, net of sales1 4,684.5 379.7 8.1% Net Liquidations2 (2,638.4) (153.4) 5.8% Other - (102.8) End of Period Q1 25,507.0 91.5% 2,822.7 11.1% Seasonality, Performance & Model Inputs Receivables from dealers Personal Loans Capital leases Beginning of Period Q1 End of Period Q1 Beginning of Period Q1 End of Period Q1 Beginning of Period Q1 End of Period Q1 100.2 102.4 0.7 1.1 0.7% 1.1% 0.4% 0.4% 2,128.8 2,115.5 348.7 352.9 16.4% 16.7% 7.9% 7.6% 91.3 143.6 9.6 15.2 10.5% 10.6% 0.3% 0.5% Held For Sale (1,094.2) (27.1) 2.5% ($ in millions)
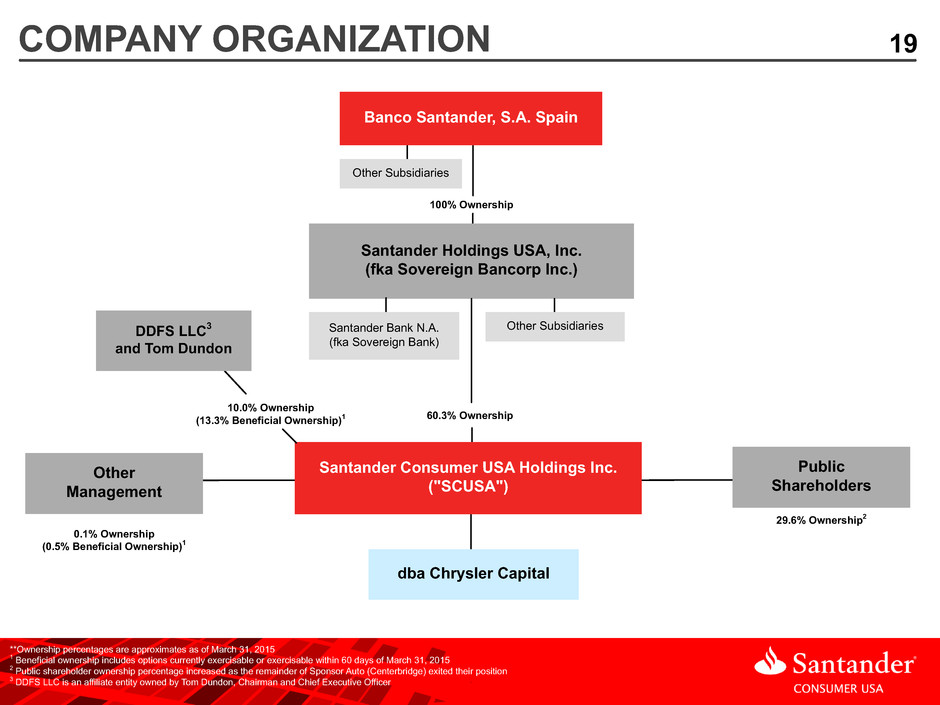
19COMPANY ORGANIZATION Other Subsidiaries 100% Ownership Santander Holdings USA, Inc. (fka Sovereign Bancorp Inc.) 60.3% Ownership Santander Consumer USA Holdings Inc. ("SCUSA") Santander Bank N.A. (fka Sovereign Bank) Other Subsidiaries dba Chrysler Capital 10.0% Ownership (13.3% Beneficial Ownership)1 DDFS LLC3 and Tom Dundon 0.1% Ownership (0.5% Beneficial Ownership)1 29.6% Ownership2 Other Management Public Shareholders **Ownership percentages are approximates as of March 31, 2015 1 Beneficial ownership includes options currently exercisable or exercisable within 60 days of March 31, 2015 2 Public shareholder ownership percentage increased as the remainder of Sponsor Auto (Centerbridge) exited their position 3 DDFS LLC is an affiliate entity owned by Tom Dundon, Chairman and Chief Executive Officer Banco Santander, S.A. Spain
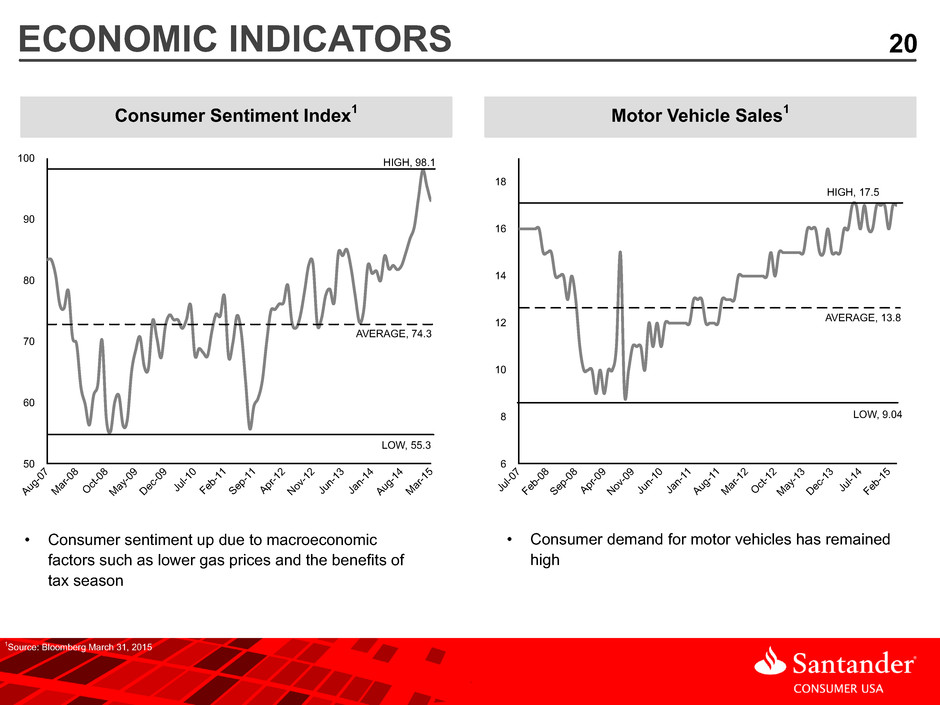
20ECONOMIC INDICATORS (units in millions) Consumer Sentiment Index1 Motor Vehicle Sales1 100 90 80 70 60 50 Au g-0 7 Ma r-0 8 Oc t-0 8 Ma y-0 9 De c-0 9 Ju l-1 0 Fe b-1 1 Se p-1 1 Ap r-1 2 No v-1 2 Ju n-1 3 Ja n-1 4 Au g-1 4 Ma r-1 5 HIGH, 98.1 LOW, 55.3 18 16 14 12 10 8 6 Ju l-0 7 Fe b-0 8 Se p-0 8 Ap r-0 9 No v-0 9 Ju n-1 0 Ja n-1 1 Au g-1 1 Ma r-1 2 Oc t-1 2 Ma y-1 3 De c-1 3 Ju l-1 4 Fe b-1 5 HIGH, 17.5 AVERAGE, 13.8 LOW, 9.04 AVERAGE, 74.3 • Consumer sentiment up due to macroeconomic factors such as lower gas prices and the benefits of tax season • Consumer demand for motor vehicles has remained high 1Source: Bloomberg March 31, 2015
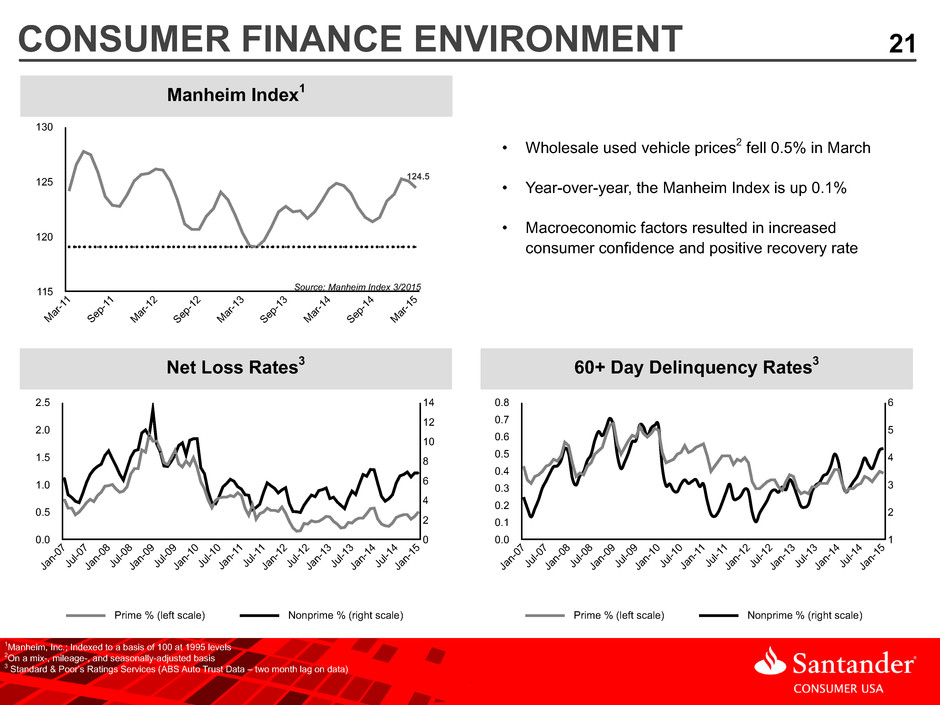
21CONSUMER FINANCE ENVIRONMENT (units in millions) Manheim Index1 60+ Day Delinquency Rates3 1Manheim, Inc.; Indexed to a basis of 100 at 1995 levels 2On a mix-, mileage-, and seasonally-adjusted basis 3 Standard & Poor’s Ratings Services (ABS Auto Trust Data – two month lag on data) • Wholesale used vehicle prices2 fell 0.5% in March • Year-over-year, the Manheim Index is up 0.1% • Macroeconomic factors resulted in increased consumer confidence and positive recovery rate Prime % (left scale) Nonprime % (right scale) 0.8 0.7 0.6 0.5 0.4 0.3 0.2 0.1 0.0 6 5 4 3 2 1 Ja n-0 7 Ju l-0 7 Ja n-0 8 Ju l-0 8 Ja n-0 9 Ju l-0 9 Ja n-1 0 Ju l-1 0 Ja n-1 1 Ju l-1 1 Ja n-1 2 Ju l-1 2 Ja n-1 3 Ju l-1 3 Ja n-1 4 Ju l-1 4 Ja n-1 5 130 125 120 115 Ma r-1 1 Se p-1 1 Ma r-1 2 Se p-1 2 Ma r-1 3 Se p-1 3 Ma r-1 4 Se p-1 4 Ma r-1 5 Source: Manheim Index 3/2015 124.5 Net Loss Rates3 Prime % (left scale) Nonprime % (right scale) 2.5 2.0 1.5 1.0 0.5 0.0 14 12 10 8 6 4 2 0 Ja n-0 7 Ju l-0 7 Ja n-0 8 Ju l-0 8 Ja n-0 9 Ju l-0 9 Ja n-1 0 Ju l-1 0 Ja n-1 1 Ju l-1 1 Ja n-1 2 Ju l-1 2 Ja n-1 3 Ju l-1 3 Ja n-1 4 Ju l-1 4 Ja n-1 5
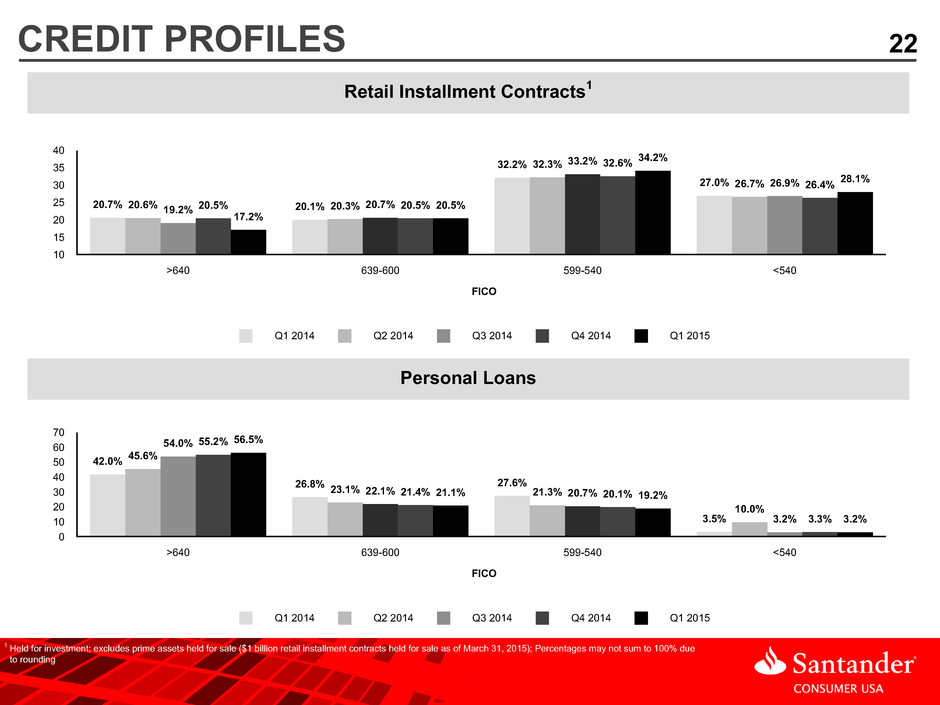
22CREDIT PROFILES 1 Held for investment; excludes prime assets held for sale ($1 billion retail installment contracts held for sale as of March 31, 2015); Percentages may not sum to 100% due to rounding Retail Installment Contracts1 Personal Loans Q1 2014 Q2 2014 Q3 2014 Q4 2014 Q1 2015 40 35 30 25 20 15 10 >640 639-600 599-540 <540 FICO 20.7% 20.1% 32.2% 27.0% 20.6% 20.3% 32.3% 26.7% 19.2% 20.7% 33.2% 26.9% 20.5% 20.5% 32.6% 26.4% 17.2% 20.5% 34.2% 28.1% Q1 2014 Q2 2014 Q3 2014 Q4 2014 Q1 2015 70 60 50 40 30 20 10 0 >640 639-600 599-540 <540 FICO 42.0% 26.8% 27.6% 3.5% 45.6% 23.1% 21.3% 10.0% 54.0% 22.1% 20.7% 3.2% 55.2% 21.4% 20.1% 3.3% 56.5% 21.1% 19.2% 3.2%
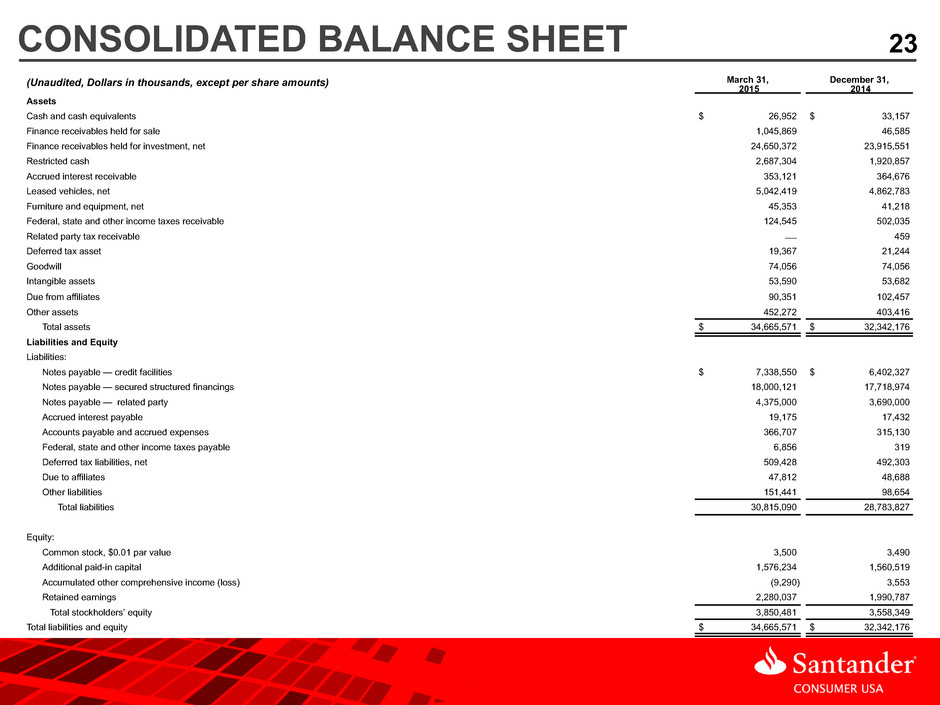
23CONSOLIDATED BALANCE SHEET (Unaudited, Dollars in thousands, except per share amounts) March 31, 2015 December 31, 2014 Assets Cash and cash equivalents $ 26,952 $ 33,157 Finance receivables held for sale 1,045,869 46,585 Finance receivables held for investment, net 24,650,372 23,915,551 Restricted cash 2,687,304 1,920,857 Accrued interest receivable 353,121 364,676 Leased vehicles, net 5,042,419 4,862,783 Furniture and equipment, net 45,353 41,218 Federal, state and other income taxes receivable 124,545 502,035 Related party tax receivable — 459 Deferred tax asset 19,367 21,244 Goodwill 74,056 74,056 Intangible assets 53,590 53,682 Due from affiliates 90,351 102,457 Other assets 452,272 403,416 Total assets $ 34,665,571 $ 32,342,176 Liabilities and Equity Liabilities: Notes payable — credit facilities $ 7,338,550 $ 6,402,327 Notes payable — secured structured financings 18,000,121 17,718,974 Notes payable — related party 4,375,000 3,690,000 Accrued interest payable 19,175 17,432 Accounts payable and accrued expenses 366,707 315,130 Federal, state and other income taxes payable 6,856 319 Deferred tax liabilities, net 509,428 492,303 Due to affiliates 47,812 48,688 Other liabilities 151,441 98,654 Total liabilities 30,815,090 28,783,827 Equity: Common stock, $0.01 par value 3,500 3,490 Additional paid-in capital 1,576,234 1,560,519 Accumulated other comprehensive income (loss) (9,290) 3,553 Retained earnings 2,280,037 1,990,787 Total stockholders’ equity 3,850,481 3,558,349 Total liabilities and equity $ 34,665,571 $ 32,342,176
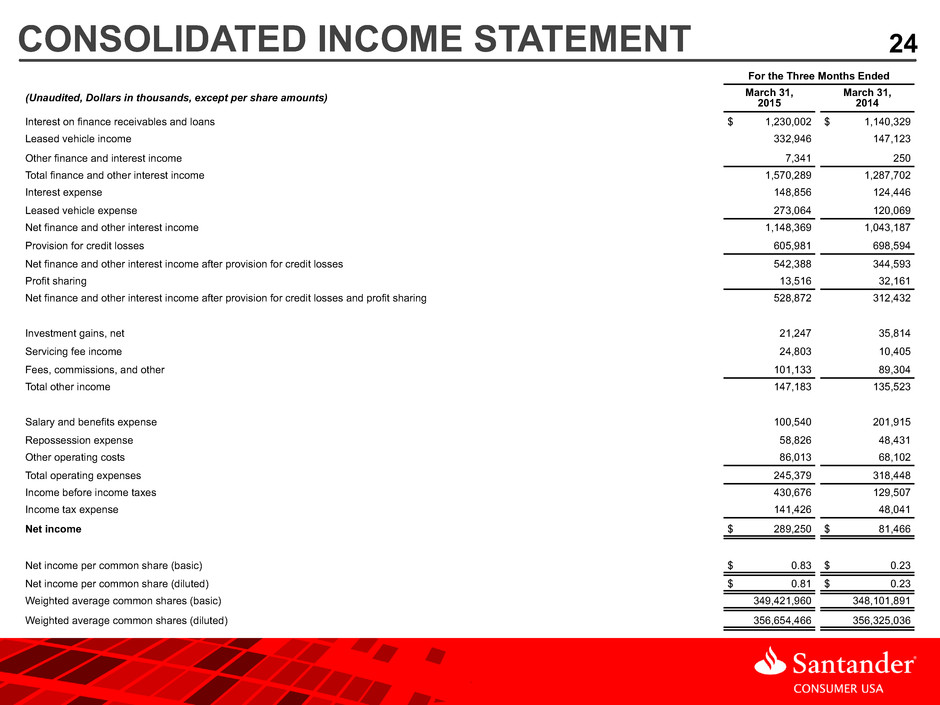
24CONSOLIDATED INCOME STATEMENT For the Three Months Ended (Unaudited, Dollars in thousands, except per share amounts) March 31,2015 March 31, 2014 Interest on finance receivables and loans $ 1,230,002 $ 1,140,329 Leased vehicle income 332,946 147,123 Other finance and interest income 7,341 250 Total finance and other interest income 1,570,289 1,287,702 Interest expense 148,856 124,446 Leased vehicle expense 273,064 120,069 Net finance and other interest income 1,148,369 1,043,187 Provision for credit losses 605,981 698,594 Net finance and other interest income after provision for credit losses 542,388 344,593 Profit sharing 13,516 32,161 Net finance and other interest income after provision for credit losses and profit sharing 528,872 312,432 Investment gains, net 21,247 35,814 Servicing fee income 24,803 10,405 Fees, commissions, and other 101,133 89,304 Total other income 147,183 135,523 Salary and benefits expense 100,540 201,915 Repossession expense 58,826 48,431 Other operating costs 86,013 68,102 Total operating expenses 245,379 318,448 Income before income taxes 430,676 129,507 Income tax expense 141,426 48,041 Net income $ 289,250 $ 81,466 Net income per common share (basic) $ 0.83 $ 0.23 Net income per common share (diluted) $ 0.81 $ 0.23 Weighted average common shares (basic) 349,421,960 348,101,891 Weighted average common shares (diluted) 356,654,466 356,325,036
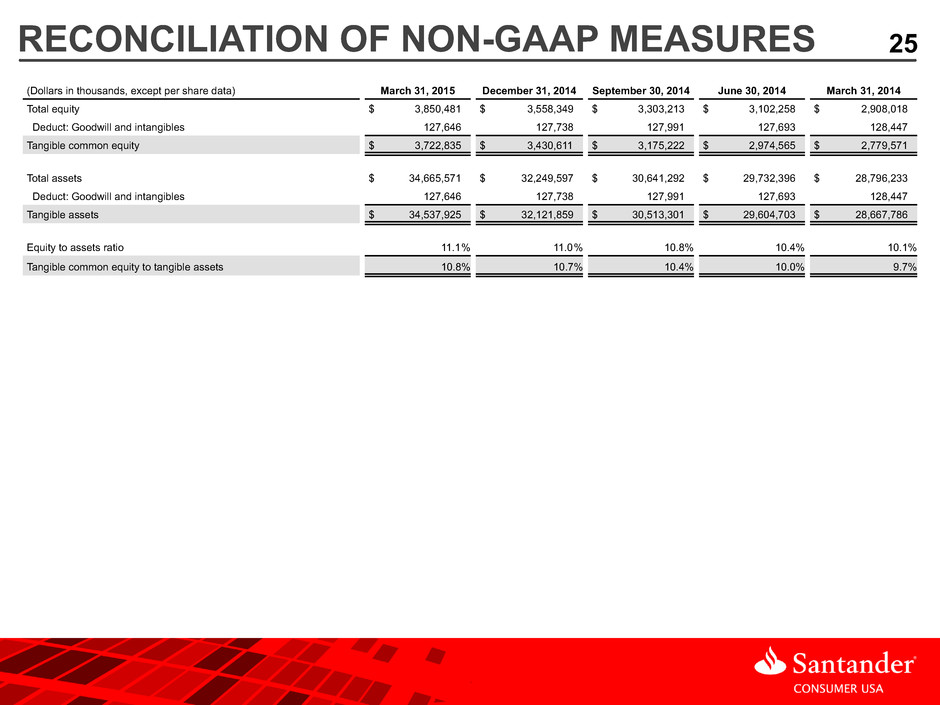
25RECONCILIATION OF NON-GAAP MEASURES (Dollars in thousands, except per share data) March 31, 2015 December 31, 2014 September 30, 2014 June 30, 2014 March 31, 2014 Total equity $ 3,850,481 $ 3,558,349 $ 3,303,213 $ 3,102,258 $ 2,908,018 Deduct: Goodwill and intangibles 127,646 127,738 127,991 127,693 128,447 Tangible common equity $ 3,722,835 $ 3,430,611 $ 3,175,222 $ 2,974,565 $ 2,779,571 Total assets $ 34,665,571 $ 32,249,597 $ 30,641,292 $ 29,732,396 $ 28,796,233 Deduct: Goodwill and intangibles 127,646 127,738 127,991 127,693 128,447 Tangible assets $ 34,537,925 $ 32,121,859 $ 30,513,301 $ 29,604,703 $ 28,667,786 Equity to assets ratio 11.1% 11.0% 10.8% 10.4% 10.1% Tangible common equity to tangible assets 10.8% 10.7% 10.4% 10.0% 9.7%
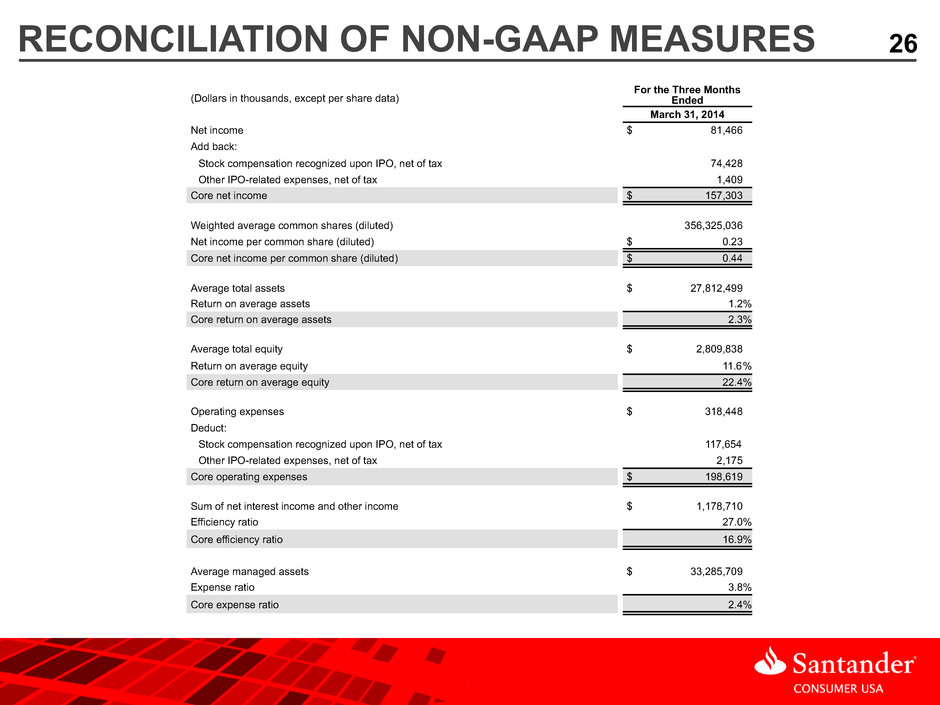
26 (Dollars in thousands, except per share data) For the Three Months Ended March 31, 2014 Net income $ 81,466 Add back: Stock compensation recognized upon IPO, net of tax 74,428 Other IPO-related expenses, net of tax 1,409 Core net income $ 157,303 Weighted average common shares (diluted) 356,325,036 Net income per common share (diluted) $ 0.23 Core net income per common share (diluted) $ 0.44 Average total assets $ 27,812,499 Return on average assets 1.2% Core return on average assets 2.3% Average total equity $ 2,809,838 Return on average equity 11.6% Core return on average equity 22.4% Operating expenses $ 318,448 Deduct: Stock compensation recognized upon IPO, net of tax 117,654 Other IPO-related expenses, net of tax 2,175 Core operating expenses $ 198,619 Sum of net interest income and other income $ 1,178,710 Efficiency ratio 27.0% Core efficiency ratio 16.9% Average managed assets $ 33,285,709 Expense ratio 3.8% Core expense ratio 2.4% RECONCILIATION OF NON-GAAP MEASURES
Serious News for Serious Traders! Try StreetInsider.com Premium Free!
You May Also Be Interested In
- BNB Standard Corporation Launches New Corporate Website as First Step in Bringing the BNB Standard to Wall Street
- Update on Ontex Russia
- Croatian Railway Tunnel Rejuvenated with Crystalline Admixture-Treated Shotcrete
Create E-mail Alert Related Categories
SEC FilingsSign up for StreetInsider Free!
Receive full access to all new and archived articles, unlimited portfolio tracking, e-mail alerts, custom newswires and RSS feeds - and more!
