

Form 8-K SIMMONS FIRST NATIONAL For: Oct 19
 Tweet
Tweet Share
ShareEXHIBIT 99.1

| For Immediate Release: | October 19, 2020 |
SIMMONS REPORTS THIRD QUARTER 2020 EARNINGS
Pine Bluff, AR – Simmons First National Corporation (NASDAQ: SFNC) (the “Company” or “Simmons”) today announced net income of $65.9 million for the quarter ended September 30, 2020, compared to $81.8 million for the same period in 2019, a decrease of $15.9 million, or 19.5%. Diluted earnings per share were $0.60, a decrease of $0.24, or 28.6%, compared to the same period in the prior year. Included in the third quarter of 2019 results was a one-time after-tax gain on the sale of Visa Inc. class B common stock of $31.7 million.
Included in third quarter 2020 results were $2.5 million in net after-tax merger-related, early retirement program and net branch right-sizing costs. Excluding the impact of these items, core earnings were $68.3 million for the quarter ended September 30, 2020, compared to $84.0 million for the quarter ended September 30, 2019, a decrease of $15.6 million, or 18.6%. Core diluted earnings per share were $0.63, a decrease of $0.24, or 27.6%, from the same period in 2019.
Year-to-date net income for the first nine months of 2020 was $201.9 million, or $1.83 diluted earnings per share, compared to $185.1 million, or $1.94 diluted earnings per share, for the same period in 2019. Excluding $426,000 in net after-tax merger-related, early retirement program and net branch right-sizing costs and the gains on the sales of branches in south Texas and Colorado, year-to-date core earnings for 2020 were $202.3 million, an increase of $3.8 million compared to the same period last year. Core diluted earnings per share for the first nine months of 2020 were $1.83, a decrease of $0.25, or 12.0%, from the same period in 2019.
“We are very proud of our results under these trying conditions. We have experienced very meaningful shifts in consumer habits which we believe will impact our delivery of products and services as well as the retail delivery of everyday amenities. Our investment in digital channels will continue to position our company for these changes and our associates are ready for the new normal,” said George A. Makris, Jr., chairman and CEO of Simmons First National Corporation.
| Selected Highlights: | 3rd Qtr 2020 | 2nd Qtr 2020 | 3rd Qtr 2019 |
| Net income | $65.9 million | $58.8 million | $81.8 million |
| Diluted earnings per share | $0.60 | $0.54 | $0.84 |
| Return on avg assets | 1.20% | 1.08% | 1.83% |
| Return on avg common equity | 8.91% | 8.21% | 13.70% |
| Return on tangible common equity (1) | 15.45% | 14.55% | 24.89% |
| Core earnings (2) | $68.3 million | $60.1 million | $84.0 million |
| Core diluted earnings per share (2) | $0.63 | $0.55 | $0.87 |
| Core return on avg assets (2) | 1.25% | 1.11% | 1.88% |
| Core return on avg common equity (2) | 9.24% | 8.40% | 14.06% |
| Core return on tangible common equity (1)(2) | 16.00% | 14.87% | 25.52% |
| Efficiency ratio (3) | 54.12% | 51.46% | 43.77% |
| Pre-tax, pre-provision (PTPP) earnings (2) | $87.5 million | $97.7 million |
$122.6 million |
| (1) | Return on tangible common equity excludes goodwill and other intangible assets and is a non-GAAP measurement. Please see “Non-GAAP Financial Measures” and “Reconciliation of Non-GAAP Financial Measures” below. |
| (2) | Core figures exclude non-core items and are non-GAAP measurements. Please see “Non-GAAP Financial Measures” and “Reconciliation of Non-GAAP Financial Measures” below. |
| (3) | Efficiency ratio is core non-interest expense before foreclosed property expense and amortization of intangibles, as a percent of net interest income (fully taxable equivalent) and non-interest revenues, excluding gains and losses from securities transactions and non-core items, and is a non-GAAP measurement. Please see “Non-GAAP Financial Measures” and “Reconciliation of Non-GAAP Financial Measures” below. |
P.O. BOX 7009 501 MAIN STREET PINE BLUFF, ARKANSAS 71611-7009 (870) 541-1000 www.simmonsbank.com
Loans
| ($ in billions) | 3rd Qtr 2020 | 2nd Qtr 2020 | 3rd Qtr 2019 |
| Total loans | $14.02 | $14.61 | $13.00 |
Total loans were $14.0 billion at September 30, 2020, an increase of $1.0 billion, or 7.8%, compared to September 30, 2019, primarily due to The Landrum Company (“Landrum”) merger completed during the fourth quarter of 2019. On a linked-quarter basis (September 30, 2020 compared to June 30, 2020), total loans decreased $589.5 million, or 4.0%. The decrease was across most loan categories with the largest decrease in the real estate loan portfolios. Makris stated, “Loan demand is very weak in almost every aspect of our commercial economy.”
Through September 30, 2020, the Company originated approximately 8,200 loans under the Paycheck Protection Program (“PPP”) of the Coronavirus Aid, Relief, and Economic Security (“CARES”) Act, with an average balance of $118,000 per loan. Approximately 93% of the PPP loans had a balance less than $350,000 as of September 30, 2020.
|
PPP Loans Balance as of September 30, 2020 |
# of Loans |
Balance ($ in millions) |
||
| Less than $50,000 | 5,216 | 63% | $94.4 | 10% |
| $50,000 to $350,000 | 2,441 | 30% | $304.8 | 31% |
| More than $350,000 to less than $2 million | 481 | 6% | $358.0 | 37% |
| $2 million to $10 million | 61 | 1% | $213.3 | 22% |
| Total | 8,199 | 100% | $970.5 | 100% |
Deposits
| ($ in billions) | 3rd Qtr 2020 | 2nd Qtr 2020 | 3rd Qtr 2019 |
| Total deposits | $16.2 | $16.6 | $13.5 |
| Non-interest bearing deposits | $4.4 | $4.6 | $3.1 |
| Interest bearing deposits | $9.0 | $9.0 | $7.3 |
| Time deposits | $2.8 | $3.0 | $3.1 |
Total deposits were $16.2 billion at September 30, 2020, an increase of $2.8 billion, or 20.6%, since September 30, 2019, primarily due to the Landrum merger. On a linked-quarter basis, total deposits decreased $369.5 million, or 2.2%, primarily due to decreases in non-interest bearing and large public fund time deposits.
Net Interest Income
| 3rd Qtr 2020 |
2nd Qtr 2020 |
1st Qtr 2020 |
4th Qtr 2019 |
3rd Qtr 2019 | |
| Loan yield (1) | 4.54% | 4.84% | 5.19% | 5.43% | 5.47% |
| Core loan yield (1) (2) | 4.29% | 4.52% | 4.86% | 5.00% | 5.19% |
| Security yield (1) | 2.60% | 2.50% | 2.63% | 2.73% | 2.87% |
| Cost of interest bearing deposits | 0.54% | 0.59% | 1.03% | 1.22% | 1.40% |
| Cost of deposits (3) | 0.39% | 0.44% | 0.80% | 0.94% | 1.09% |
| Cost of borrowed funds | 1.85% | 1.84% | 2.06% | 2.30% | 2.52% |
| Net interest margin (1) | 3.21% | 3.42% | 3.68% | 3.78% | 3.82% |
| Core net interest margin (1) (2) | 3.02% | 3.18% | 3.42% | 3.44% | 3.59% |
| (1) | Fully tax equivalent using an effective tax rate of 26.135%. |
| (2) | Core loan yield and core net interest margin exclude accretion and are non-GAAP measurements. Please see “Non-GAAP Financial Measures” and “Reconciliation of Non-GAAP Financial Measures” below. |
| (3) | Includes non-interest bearing deposits. |
The Company’s net interest income for the third quarter of 2020 was $153.6 million, an increase of $4.3 million, or 2.9%, from the same period of 2019. The increase in net interest income was primarily due to the decline in the cost of interest-bearing deposits of 86 basis points, which was partially offset by a reduction in the loan yield of 93 basis points. Included in interest income was the yield accretion recognized on loans acquired of $8.9 million and $9.3 million for the third quarters of 2020 and 2019, respectively.
The loan yield was 4.54% for the quarter ended September 30, 2020, while the core loan yield, which excludes the accretion, was 4.29% for the same period. The decrease in the loan yield during the third quarter of 2020 was primarily driven by the lower yielding PPP loans originated during the second and third quarters of 2020. The PPP loan yield was approximately 2.37% during the third quarter of 2020 (including accretion of net fees), which decreased the loan yield by approximately 16 basis points.
Net interest margin (FTE) was 3.21% for the quarter ended September 30, 2020, while the core net interest margin, which excludes the accretion, was 3.02% for the same period. The decrease in the net interest margin during the third quarter of 2020 was primarily driven by additional liquidity created in response to the COVID-19 pandemic and the lower yielding PPP loans originated during the second and third quarters of 2020, which decreased the net interest margin by approximately 30 basis points.
Non-Interest Income
Non-interest income for the third quarter of 2020 was $71.9 million, a decrease of $12.8 million compared to the same period in the previous year, primarily due to the gain on sale of Visa Inc. class B common stock recognized during the prior year period. During the third quarter of 2020, the Company benefited from additional gains on the sale of securities and incremental mortgage lending income driven by the current low mortgage interest rate environment.
|
Selected Non-Interest Income Items ($ in millions) |
3rd Qtr 2020 |
2nd Qtr 2020 |
1st Qtr 2020 |
4th Qtr 2019 |
3rd Qtr 2019 |
| Service charges on deposit accounts | $10.4 | $8.6 | $13.3 | $13.3 | $10.8 |
| Mortgage lending income | $14.0 | $12.5 | $5.0 | $4.0 | $4.5 |
| SBA lending income | $0.3 | $0.2 | $0.3 | $0.3 | $1.0 |
| Debit and credit card fees | $8.9 | $8.0 | $7.9 | $8.9 | $7.1 |
| Gain on sale of securities | $22.3 | $0.4 | $32.1 | $0.4 | $7.4 |
| Gain on sale of Visa Inc. class B stock | - | - | - | - | $42.9 |
| Other income | $5.4 | $9.8 | $12.8 | $7.1 | $1.8 |
| Core other income (1)(2) | $5.0 | $7.6 | $6.9 | $7.1 | $44.7 |
| (1) | Core figures exclude non-core items and are non-GAAP measurements. Please see “Non-GAAP Financial Measures” and “Reconciliation of Non-GAAP Financial Measures” below. |
| (2) | Core other income includes the gain on sale of Visa Inc. class B common stock. |
Non-Interest Expense
Non-interest expense for the third quarter of 2020 was $118.9 million, an increase of $12.1 million compared to the third quarter of 2019. Included in this quarter were $3.3 million of pre-tax non-core items for merger-related, early retirement program and branch right-sizing costs. Excluding these expenses, core non-interest expense was $115.3 million for the third quarter of 2020, an increase of $11.3 million compared to the same period in 2019, primarily the result of the Landrum merger and additional software and technology costs related to the Company’s Next Generation Banking (“NGB”) initiative.
The efficiency ratio for the third quarter of 2020 was 54.12%.
|
Selected Non-Interest Expense Items ($ in millions) |
3rd Qtr 2020 |
2nd Qtr 2020 |
1st Qtr 2020 |
4th Qtr 2019 |
3rd Qtr 2019 |
| Salaries and employee benefits | $61.1 | $57.6 | $67.9 | $63.2 | $52.1 |
| Merger related costs | $0.9 | $1.8 | $1.1 | $24.8 | $2.6 |
| Other operating expenses | $38.2 | $39.7 | $41.8 | $38.0 | $37.9 |
| Core salaries and employee benefits (1) | $58.7 | $57.2 | $67.9 | $63.2 | $51.9 |
| Core merger related costs (1) | - | - | - | - | - |
| Core other operating expenses (1) | $38.2 | $38.0 | $41.6 | $38.0 | $37.8 |
| (1) | Core figures exclude non-core items and are non-GAAP measurements. Please see “Non-GAAP Financial Measures” and “Reconciliation of Non-GAAP Financial Measures” below. |
Early in 2020, the Company offered qualifying associates an early retirement option resulting in $2.3 million of non-core expense during the third quarter. The Company expects ongoing net annualized savings of approximately $2.9 million.
Management continuously evaluates the Company’s branch network as part of its analysis of the profitability of the Company’s operations and the efficiency with which it delivers banking services to its markets. As a result of this ongoing evaluation, the Company closed 11 branch locations during the second quarter of 2020, with estimated net annual cost savings of approximately $2.4 million related to these locations. The Company closed an additional 23 branch locations on October 9, 2020, with an expected net annual cost savings of approximately $6.7 million.
Asset Quality
| 3rd Qtr 2020 |
2nd Qtr 2020 |
1st Qtr 2020 |
4th Qtr 2019 |
3rd Qtr 2019 | |
| Allowance for credit losses on loans to total loans | 1.77% | 1.59% | 1.69% | 0.47% | 0.51% |
| Allowance for credit losses on loans to non-performing loans | 147% | 175% | 154% | 74% | 78% |
| Non-performing loans to total loans | 1.20% | 0.91% | 1.10% | 0.64% | 0.65% |
| Net charge-off ratio (annualized) | 0.16% | 1.04% | 0.07% | 0.09% | 0.59% |
| Net charge-off ratio YTD (annualized) | 0.43% | 0.56% | 0.07% | 0.24% | 0.30% |
At September 30, 2020, the allowance for credit losses on loans was $248.3 million. Provision for credit losses on loans for the third quarter of 2020 was $22.3 million. Included in total loans was $970.5 million of government guaranteed PPP loans. Excluding the PPP loans, the allowance for credit losses on loans to total loans was 1.90%.
Foreclosed Assets and Other Real Estate Owned
At September 30, 2020, foreclosed assets and other real estate owned were $12.6 million, a decrease of $7.0 million, or 35.7%, compared to the same period in 2019. The composition of these assets is divided into three types:
|
($ in millions)
|
3rd Qtr 2020 |
2nd Qtr 2020 |
1st Qtr 2020 |
4th Qtr 2019 |
3rd Qtr 2019 |
| Closed bank branches and branch sites | $0.6 | $2.7 | $8.8 | $5.7 | $5.9 |
| Foreclosed assets – acquired | $9.3 | $9.2 | $9.2 | $10.3 | $10.1 |
| Foreclosed assets – legacy | $2.7 | $2.2 | $2.8 | $3.1 | $3.6 |
Capital
| 3rd Qtr 2020 |
2nd Qtr 2020 |
1st Qtr 2020 |
4th Qtr 2019 |
3rd Qtr 2019 | |
| Stockholders’ equity to total assets | 13.7% | 13.3% | 13.7% | 14.1% | 14.3% |
| Tangible common equity to tangible assets (1) | 8.7% | 8.3% | 8.4% | 9.0% | 9.1% |
| Regulatory common equity tier 1 ratio | 12.6% | 11.9% | 11.1% | 10.9% | 10.3% |
| Regulatory tier 1 leverage ratio | 9.1% | 8.8% | 9.0% | 9.6% | 9.1% |
| Regulatory tier 1 risk-based capital ratio | 12.6% | 11.9% | 11.1% | 10.9% | 10.3% |
| Regulatory total risk-based capital ratio | 15.8% | 14.9% | 14.1% | 13.7% | 13.2% |
| (1) | Tangible common equity to tangible assets is a non-GAAP measurement. Please see “Non-GAAP Financial Measures” and “Reconciliation of Non-GAAP Financial Measures” below. |
At September 30, 2020, common stockholders' equity was $2.9 billion. Book value per share was $26.98 and tangible book value per share was $16.07 at September 30, 2020. The ratio of stockholders’ equity to total assets was 13.7% at September 30, 2020, while the ratio of tangible common equity to tangible assets was 8.7%. As of September 30, 2020, PPP loans totaled $970.5 million, which are 100% federally guaranteed and have a zero percent risk-weight for regulatory capital ratios. Excluding PPP loans from total assets, equity to total assets was 14.4%, tangible common equity to tangible assets was 9.1% and the regulatory tier 1 leverage ratio was 9.5%.
Simmons First National Corporation
Simmons First National Corporation is a financial holding company headquartered in Pine Bluff, Arkansas, with total consolidated assets of approximately $21.4 billion as of September 30, 2020, conducting financial operations in Arkansas, Illinois, Kansas, Missouri, Oklahoma, Tennessee and Texas. The Company, through its subsidiaries, offers comprehensive financial solutions delivered with a client-centric approach. The Company’s common stock is listed on the NASDAQ Global Select Market under the symbol “SFNC.”
Conference Call
Management will conduct a live conference call to review this information beginning at 9:00 a.m. CDT today, Monday, October 19, 2020. Interested persons can listen to this call by dialing toll-free 1-866-298-7926 (United States and Canada only) and asking for the Simmons First National Corporation conference call, conference ID 6533868. In addition, the call will be available live or in recorded version on the Company’s website at www.simmonsbank.com for at least 60 days.
Non-GAAP Financial Measures
This press release contains financial information determined by methods other than in accordance with generally accepted accounting principles (“GAAP”). The Company’s management uses these non-GAAP financial measures in their analysis of the Company’s performance. These measures adjust GAAP performance measures to, among other things, include the tax benefit associated with revenue items that are tax-exempt, as well as exclude from income available to common shareholders certain expenses related to significant non-core activities, including merger-related expenses, gain on sale of branches, early retirement program expenses and net branch right-sizing expenses. In addition, the Company also presents certain figures based on tangible common stockholders’ equity and tangible book value, which exclude goodwill and other intangible assets. The Company further presents certain figures that are exclusive of PPP loans. The Company’s management believes that these non-GAAP financial measures are useful to investors because they present the results of the Company’s ongoing operations without the effect of mergers or other items not central to the Company’s ongoing business, as well as normalizing for tax effects. Management, therefore, believes presentations of these non-GAAP financial measures provide useful supplemental information that is essential to a proper understanding of the operating results of the Company’s core businesses. These non-GAAP disclosures should not be viewed as a substitute for operating results determined in accordance with GAAP, nor are they necessarily comparable to non-GAAP performance measures that may be presented by other companies. Where non-GAAP financial measures are used, the comparable GAAP financial measure, as well as the reconciliation to the comparable GAAP financial measure, can be found in the tables of this release.
Forward-Looking Statements
Some of the statements in this news release may not be based on historical facts and should be considered “forward-looking statements” within the meaning of the Private Securities Litigation Reform Act of 1995. These forward-looking statements, including, without limitation, statements made in Mr. Makris’s quotes, may be identified by reference to future periods or by the use of forward-looking terminology, such as “believe,” “budget,” “expect,” “foresee,” “anticipate,” “intend,” “indicate,” “target,” “estimate,” “plan,” “project,” “continue,” “contemplate,” “positions,” “prospects,” “predict,” or “potential,” by future conditional verbs such as “will,” “would,” “should,” “could,” “might” or “may,” or by variations of such words or by similar expressions. These forward-looking statements include, without limitation, statements relating to Simmons’ future growth, revenue, assets, asset quality, profitability, net interest margin, non-interest revenue, share repurchase program, acquisition strategy, NGB and other digital banking initiatives, the Company’s ability to recruit and retain key employees, the benefits associated with the Company’s early retirement program and completed and future branch closures, the adequacy of the allowance for credit losses, and the ability of the Company to manage the impact of the COVID-19 pandemic. Any forward-looking statement speaks only as of the date of this news release, and Simmons undertakes no obligation to update these forward-looking statements to reflect events or circumstances that occur after the date of this news release. By nature, forward-looking statements are based on various assumptions and involve inherent risk and uncertainties. Various factors, including, but not limited to, changes in economic conditions, credit quality, interest rates, loan demand, deposit flows, real estate values, the assumptions used in making the forward-looking statements, the securities markets generally or the price of Simmons common stock specifically, and information technology affecting the financial industry; the effect of steps the Company takes in response to COVID-19, the severity and duration of the pandemic, including whether there is a widespread resurgence in COVID-19 infections combined with the seasonal flu, the pace of recovery when the pandemic subsides and the heightened impact it has on many of the risks described herein; the effects of the COVID-19 pandemic on, among other things, the Company’s operations, liquidity, and credit quality; general economic and market conditions; unemployment; claims, damages, and fines related to litigation or government actions, including litigation or actions arising from the Company’s participation in and administration of programs related to the COVID-19 pandemic (including, among other things, the PPP loan program authorized by the CARES Act); changes in accounting principles relating to loan loss recognition (current expected credit losses, or CECL); the Company’s ability to manage and successfully integrate its mergers and acquisitions; cyber threats, attacks or events; reliance on third parties for key services; and other factors, many of which are beyond the control of the Company, could cause actual results to differ materially from those contemplated by the forward-looking statements. Additional information on factors that might affect the Company’s financial results is included in its Form 10-K for the year ended December 31, 2019, and its Form 10-Q for the quarter ended June 30, 2020, which have been filed with, and are available from, the U.S. Securities and Exchange Commission.
####
FOR MORE INFORMATION CONTACT:
Stephen C. Massanelli
EVP, Chief Administrative Officer and Investor Relations Officer
Simmons First National Corporation
| Simmons First National Corporation | SFNC | |||||||||||||||||||
| Consolidated End of Period Balance Sheets | ||||||||||||||||||||
| For the Quarters Ended | Sep 30 | Jun 30 | Mar 31 | Dec 31 | Sep 30 | |||||||||||||||
| (Unaudited) | 2020 | 2020 | 2020 | 2019 | 2019 | |||||||||||||||
| ($ in thousands) | ||||||||||||||||||||
| ASSETS | ||||||||||||||||||||
| Cash and non-interest bearing balances due from banks | $ | 382,691 | $ | 234,998 | $ | 244,123 | $ | 277,208 | $ | 161,440 | ||||||||||
| Interest bearing balances due from banks and federal funds sold | 2,139,440 | 2,310,162 | 1,493,076 | 719,415 | 368,530 | |||||||||||||||
| Cash and cash equivalents | 2,522,131 | 2,545,160 | 1,737,199 | 996,623 | 529,970 | |||||||||||||||
| Interest bearing balances due from banks - time | 4,061 | 4,561 | 4,309 | 4,554 | 5,041 | |||||||||||||||
| Investment securities - held-to-maturity | 47,102 | 51,720 | 53,968 | 40,927 | 42,237 | |||||||||||||||
| Investment securities - available-for-sale | 2,607,288 | 2,496,896 | 2,466,640 | 3,288,343 | 2,210,931 | |||||||||||||||
| Mortgage loans held for sale | 192,729 | 120,034 | 49,984 | 58,102 | 50,099 | |||||||||||||||
| Other assets held for sale | 389 | 399 | 115,315 | 260,332 | 383 | |||||||||||||||
| Loans: | ||||||||||||||||||||
| Loans | 14,017,442 | 14,606,900 | 14,374,277 | 14,425,704 | 13,003,549 | |||||||||||||||
| Allowance for credit losses on loans | (248,251 | ) | (231,643 | ) | (243,195 | ) | (68,244 | ) | (66,590 | ) | ||||||||||
| Net loans | 13,769,191 | 14,375,257 | 14,131,082 | 14,357,460 | 12,936,959 | |||||||||||||||
| Premises and equipment | 470,491 | 478,896 | 484,990 | 492,384 | 378,678 | |||||||||||||||
| Premises held for sale | 4,486 | 4,576 | - | - | - | |||||||||||||||
| Foreclosed assets and other real estate owned | 12,590 | 14,111 | 20,805 | 19,121 | 19,576 | |||||||||||||||
| Interest receivable | 77,352 | 79,772 | 57,039 | 62,707 | 53,966 | |||||||||||||||
| Bank owned life insurance | 257,718 | 256,643 | 255,197 | 254,152 | 234,655 | |||||||||||||||
| Goodwill | 1,075,305 | 1,064,765 | 1,064,978 | 1,055,520 | 926,648 | |||||||||||||||
| Other intangible assets | 114,460 | 117,823 | 121,673 | 127,340 | 101,149 | |||||||||||||||
| Other assets | 282,102 | 293,071 | 278,173 | 241,578 | 268,219 | |||||||||||||||
| Total assets | $ | 21,437,395 | $ | 21,903,684 | $ | 20,841,352 | $ | 21,259,143 | $ | 17,758,511 | ||||||||||
| LIABILITIES AND STOCKHOLDERS' EQUITY | ||||||||||||||||||||
| Deposits: | ||||||||||||||||||||
| Non-interest bearing transaction accounts | $ | 4,451,385 | $ | 4,608,098 | $ | 3,572,244 | $ | 3,741,093 | $ | 3,044,330 | ||||||||||
| Interest bearing transaction accounts and savings deposits | 8,993,255 | 8,978,045 | 8,840,678 | 9,090,878 | 7,337,571 | |||||||||||||||
| Time deposits | 2,802,007 | 3,029,975 | 3,146,811 | 3,276,969 | 3,086,108 | |||||||||||||||
| Total deposits | 16,246,647 | 16,616,118 | 15,559,733 | 16,108,940 | 13,468,009 | |||||||||||||||
| Federal funds purchased and securities sold | ||||||||||||||||||||
| under agreements to repurchase | 313,694 | 387,025 | 377,859 | 150,145 | 116,536 | |||||||||||||||
| Other borrowings | 1,342,769 | 1,393,689 | 1,396,829 | 1,297,599 | 1,098,395 | |||||||||||||||
| Subordinated notes and debentures | 382,739 | 382,604 | 388,396 | 388,260 | 354,223 | |||||||||||||||
| Other liabilities held for sale | - | - | 58,405 | 159,853 | - | |||||||||||||||
| Accrued interest and other liabilities | 209,305 | 219,545 | 214,730 | 165,422 | 174,277 | |||||||||||||||
| Total liabilities | 18,495,154 | 18,998,981 | 17,995,952 | 18,270,219 | 15,211,440 | |||||||||||||||
| Stockholders' equity: | ||||||||||||||||||||
| Preferred stock | 767 | 767 | 767 | 767 | - | |||||||||||||||
| Common stock | 1,090 | 1,090 | 1,090 | 1,136 | 966 | |||||||||||||||
| Surplus | 2,032,372 | 2,029,383 | 2,026,420 | 2,117,282 | 1,708,058 | |||||||||||||||
| Undivided profits | 866,503 | 819,153 | 778,893 | 848,848 | 814,338 | |||||||||||||||
| Accumulated other comprehensive income (loss): | ||||||||||||||||||||
| Unrealized accretion (depreciation) on AFS securities | 41,509 | 54,310 | 38,230 | 20,891 | 23,709 | |||||||||||||||
| Total stockholders' equity | 2,942,241 | 2,904,703 | 2,845,400 | 2,988,924 | 2,547,071 | |||||||||||||||
| Total liabilities and stockholders' equity | $ | 21,437,395 | $ | 21,903,684 | $ | 20,841,352 | $ | 21,259,143 | $ | 17,758,511 | ||||||||||
| Page 1 |
| Simmons First National Corporation | SFNC | |||||||||||||||||||
| Consolidated Statements of Income - Quarter-to-Date | ||||||||||||||||||||
| For the Quarters Ended | Sep 30 | Jun 30 | Mar 31 | Dec 31 | Sep 30 | |||||||||||||||
| (Unaudited) | 2020 | 2020 | 2020 | 2019 | 2019 | |||||||||||||||
| ($ in thousands, except per share data) | ||||||||||||||||||||
| INTEREST INCOME | ||||||||||||||||||||
| Loans | $ | 163,180 | $ | 176,910 | $ | 187,566 | $ | 193,402 | $ | 179,971 | ||||||||||
| Interest bearing balances due from banks and federal funds sold | 623 | 603 | 2,441 | 2,625 | 1,586 | |||||||||||||||
| Investment securities | 14,910 | 13,473 | 18,943 | 16,962 | 14,467 | |||||||||||||||
| Mortgage loans held for sale | 1,012 | 668 | 281 | 402 | 382 | |||||||||||||||
| TOTAL INTEREST INCOME | 179,725 | 191,654 | 209,231 | 213,391 | 196,406 | |||||||||||||||
| INTEREST EXPENSE | ||||||||||||||||||||
| Time deposits | 9,437 | 10,803 | 13,323 | 16,198 | 15,573 | |||||||||||||||
| Other deposits | 6,769 | 7,203 | 17,954 | 20,331 | 21,363 | |||||||||||||||
| Federal funds purchased and securities | ||||||||||||||||||||
| sold under agreements to repurchase | 335 | 337 | 759 | 368 | 249 | |||||||||||||||
| Other borrowings | 4,943 | 4,963 | 4,877 | 4,615 | 5,381 | |||||||||||||||
| Subordinated notes and debentures | 4,631 | 4,667 | 4,835 | 4,813 | 4,576 | |||||||||||||||
| TOTAL INTEREST EXPENSE | 26,115 | 27,973 | 41,748 | 46,325 | 47,142 | |||||||||||||||
| NET INTEREST INCOME | 153,610 | 163,681 | 167,483 | 167,066 | 149,264 | |||||||||||||||
| Provision for credit losses | 22,981 | 21,915 | 23,134 | 4,903 | 21,973 | |||||||||||||||
| NET INTEREST INCOME AFTER PROVISION | ||||||||||||||||||||
| FOR CREDIT LOSSES | 130,629 | 141,766 | 144,349 | 162,163 | 127,291 | |||||||||||||||
| NON-INTEREST INCOME | ||||||||||||||||||||
| Trust income | 6,744 | 7,253 | 7,151 | 7,430 | 6,108 | |||||||||||||||
| Service charges on deposit accounts | 10,385 | 8,570 | 13,328 | 13,332 | 10,825 | |||||||||||||||
| Other service charges and fees | 1,764 | 1,489 | 1,588 | 1,915 | 1,308 | |||||||||||||||
| Mortgage lending income | 13,971 | 12,459 | 5,046 | 4,029 | 4,509 | |||||||||||||||
| SBA lending income | 304 | 245 | 296 | 321 | 956 | |||||||||||||||
| Investment banking income | 557 | 571 | 877 | 822 | 513 | |||||||||||||||
| Debit and credit card fees | 8,850 | 7,996 | 7,914 | 8,920 | 7,059 | |||||||||||||||
| Bank owned life insurance income | 1,591 | 1,445 | 1,298 | 1,411 | 1,302 | |||||||||||||||
| Gain on sale of securities, net | 22,305 | 390 | 32,095 | 377 | 7,374 | |||||||||||||||
| Other income | 5,380 | 9,809 | 12,801 | 7,073 | 44,721 | |||||||||||||||
| TOTAL NON-INTEREST INCOME | 71,851 | 50,227 | 82,394 | 45,630 | 84,675 | |||||||||||||||
| NON-INTEREST EXPENSE | ||||||||||||||||||||
| Salaries and employee benefits | 61,144 | 57,644 | 67,924 | 63,235 | 52,065 | |||||||||||||||
| Occupancy expense, net | 9,647 | 9,217 | 9,510 | 9,272 | 8,342 | |||||||||||||||
| Furniture and equipment expense | 6,231 | 6,144 | 5,723 | 5,758 | 4,898 | |||||||||||||||
| Other real estate and foreclosure expense | 602 | 274 | 325 | 1,089 | 1,125 | |||||||||||||||
| Deposit insurance | 2,244 | 2,838 | 2,475 | (134 | ) | - | ||||||||||||||
| Merger-related costs | 902 | 1,830 | 1,068 | 24,831 | 2,556 | |||||||||||||||
| Other operating expenses | 38,179 | 39,651 | 41,788 | 38,044 | 37,879 | |||||||||||||||
| TOTAL NON-INTEREST EXPENSE | 118,949 | 117,598 | 128,813 | 142,095 | 106,865 | |||||||||||||||
| NET INCOME BEFORE INCOME TAXES | 83,531 | 74,395 | 97,930 | 65,698 | 105,101 | |||||||||||||||
| Provision for income taxes | 17,633 | 15,593 | 20,694 | 12,976 | 23,275 | |||||||||||||||
| NET INCOME | 65,898 | 58,802 | 77,236 | 52,722 | 81,826 | |||||||||||||||
| Preferred stock dividends | 13 | 13 | 13 | 13 | - | |||||||||||||||
| NET INCOME AVAILABLE TO COMMON STOCKHOLDERS | $ | 65,885 | $ | 58,789 | $ | 77,223 | $ | 52,709 | $ | 81,826 | ||||||||||
| BASIC EARNINGS PER SHARE | $ | 0.60 | $ | 0.54 | $ | 0.68 | $ | 0.49 | $ | 0.85 | ||||||||||
| DILUTED EARNINGS PER SHARE | $ | 0.60 | $ | 0.54 | $ | 0.68 | $ | 0.49 | $ | 0.84 | ||||||||||
| Page 2 |
| Simmons First National Corporation | SFNC | |||||||||||||||||||
| Consolidated Risk-Based Capital | ||||||||||||||||||||
| For the Quarters Ended | Sep 30 | Jun 30 | Mar 31 | Dec 31 | Sep 30 | |||||||||||||||
| (Unaudited) | 2020 | 2020 | 2020 | 2019 | 2019 | |||||||||||||||
| ($ in thousands) | ||||||||||||||||||||
| Tier 1 capital | ||||||||||||||||||||
| Stockholders' equity | $ | 2,942,241 | $ | 2,904,703 | $ | 2,845,400 | $ | 2,988,924 | $ | 2,547,071 | ||||||||||
| CECL transition provision (1) | 134,798 | 130,480 | 134,558 | - | - | |||||||||||||||
| Disallowed intangible assets, net of deferred tax | (1,167,357 | ) | (1,160,385 | ) | (1,164,038 | ) | (1,160,079 | ) | (1,013,309 | ) | ||||||||||
| Unrealized (gain) loss on AFS securities | (41,509 | ) | (54,310 | ) | (38,230 | ) | (20,891 | ) | (23,709 | ) | ||||||||||
| Total Tier 1 capital | 1,868,173 | 1,820,488 | 1,777,690 | 1,807,954 | 1,510,053 | |||||||||||||||
| Tier 2 capital | ||||||||||||||||||||
| Trust preferred securities and subordinated debt | 382,739 | 382,604 | 388,396 | 388,260 | 354,223 | |||||||||||||||
| Qualifying allowance for loan losses and | ||||||||||||||||||||
| reserve for unfunded commitments | 96,734 | 83,780 | 96,015 | 76,644 | 74,455 | |||||||||||||||
| Total Tier 2 capital | 479,473 | 466,384 | 484,411 | 464,904 | 428,678 | |||||||||||||||
| Total risk-based capital | $ | 2,347,646 | $ | 2,286,872 | $ | 2,262,101 | $ | 2,272,858 | $ | 1,938,731 | ||||||||||
| Risk weighted assets | $ | 14,878,932 | $ | 15,362,175 | $ | 16,012,233 | $ | 16,554,081 | $ | 14,725,571 | ||||||||||
| Adjusted average assets for leverage ratio | $ | 20,652,454 | $ | 20,742,824 | $ | 19,832,219 | $ | 18,852,798 | $ | 16,681,527 | ||||||||||
| Ratios at end of quarter | ||||||||||||||||||||
| Equity to assets | 13.72 | % | 13.26 | % | 13.65 | % | 14.06 | % | 14.34 | % | ||||||||||
| Tangible common equity to tangible assets (2) | 8.65 | % | 8.31 | % | 8.44 | % | 8.99 | % | 9.08 | % | ||||||||||
| Common equity Tier 1 ratio (CET1) | 12.55 | % | 11.85 | % | 11.10 | % | 10.92 | % | 10.25 | % | ||||||||||
| Tier 1 leverage ratio | 9.05 | % | 8.78 | % | 8.96 | % | 9.59 | % | 9.05 | % | ||||||||||
| Tier 1 risk-based capital ratio | 12.56 | % | 11.85 | % | 11.10 | % | 10.92 | % | 10.25 | % | ||||||||||
| Total risk-based capital ratio | 15.78 | % | 14.89 | % | 14.13 | % | 13.73 | % | 13.17 | % | ||||||||||
(1) The Company has elected to use the CECL transition provision allowed for in the year of adopting ASC 326.
(2) Calculations of tangible common equity to tangible assets and the reconciliations to GAAP are included in the schedules accompanying this release.
| Page 3 |
| Simmons First National Corporation | SFNC | |||||||||||||||||||
| Consolidated Investment Securities | ||||||||||||||||||||
| For the Quarters Ended | Sep 30 | Jun 30 | Mar 31 | Dec 31 | Sep 30 | |||||||||||||||
| (Unaudited) | 2020 | 2020 | 2020 | 2019 | 2019 | |||||||||||||||
| ($ in thousands) | ||||||||||||||||||||
| Investment Securities - End of Period | ||||||||||||||||||||
| Held-to-Maturity | ||||||||||||||||||||
| Mortgage-backed securities | $ | 24,297 | $ | 25,980 | $ | 27,121 | $ | 10,796 | $ | 11,549 | ||||||||||
| State and political subdivisions | 21,930 | 24,777 | 25,985 | 27,082 | 28,692 | |||||||||||||||
| Other securities | 875 | 963 | 862 | 3,049 | 1,996 | |||||||||||||||
| Total held-to-maturity (net of credit losses) | 47,102 | 51,720 | 53,968 | 40,927 | 42,237 | |||||||||||||||
| Available-for-Sale | ||||||||||||||||||||
| U.S. Treasury | $ | - | $ | - | $ | 424,989 | $ | 449,729 | $ | - | ||||||||||
| U.S. Government agencies | 471,973 | 210,921 | 161,289 | 194,249 | 178,139 | |||||||||||||||
| Mortgage-backed securities | 903,687 | 1,154,086 | 1,179,837 | 1,742,945 | 1,337,794 | |||||||||||||||
| State and political subdivisions | 1,133,006 | 1,054,068 | 678,243 | 880,524 | 681,202 | |||||||||||||||
| Other securities | 98,622 | 77,821 | 22,282 | 20,896 | 13,796 | |||||||||||||||
| Total available-for-sale (net of credit losses) | 2,607,288 | 2,496,896 | 2,466,640 | 3,288,343 | 2,210,931 | |||||||||||||||
| Total investment securities (net of credit losses) | $ | 2,654,390 | $ | 2,548,616 | $ | 2,520,608 | $ | 3,329,270 | $ | 2,253,168 | ||||||||||
| Fair value - HTM investment securities | $ | 49,064 | $ | 53,751 | $ | 55,714 | $ | 41,855 | $ | 43,302 | ||||||||||
| Investment Securities - QTD Average | ||||||||||||||||||||
| Taxable securities | $ | 1,534,742 | $ | 1,642,083 | $ | 2,324,188 | $ | 1,940,755 | $ | 1,561,308 | ||||||||||
| Tax exempt securities | 1,155,099 | 866,944 | 900,223 | 825,000 | 681,505 | |||||||||||||||
| Total investment securities - QTD average | $ | 2,689,841 | $ | 2,509,027 | $ | 3,224,411 | $ | 2,765,755 | $ | 2,242,813 | ||||||||||
| Page 4 |
| Simmons First National Corporation | SFNC | |||||||||||||||||||
| Consolidated Loans | ||||||||||||||||||||
| For the Quarters Ended | Sep 30 | Jun 30 | Mar 31 | Dec 31 | Sep 30 | |||||||||||||||
| (Unaudited) | 2020 | 2020 | 2020 | 2019 | 2019 | |||||||||||||||
| ($ in thousands) | ||||||||||||||||||||
| Loan Portfolio - End of Period | ||||||||||||||||||||
| Consumer | ||||||||||||||||||||
| Credit cards | $ | 172,880 | $ | 184,348 | $ | 188,596 | $ | 204,802 | $ | 195,083 | ||||||||||
| Other consumer | 190,736 | 214,024 | 267,870 | 249,195 | 215,283 | |||||||||||||||
| Total consumer | 363,616 | 398,372 | 456,466 | 453,997 | 410,366 | |||||||||||||||
| Real Estate | ||||||||||||||||||||
| Construction | 1,853,360 | 2,010,256 | 2,024,118 | 2,248,673 | 2,081,595 | |||||||||||||||
| Single-family residential | 1,997,070 | 2,207,087 | 2,343,543 | 2,414,753 | 1,951,842 | |||||||||||||||
| Other commercial real estate | 6,132,823 | 6,316,444 | 6,466,104 | 6,358,514 | 5,758,511 | |||||||||||||||
| Total real estate | 9,983,253 | 10,533,787 | 10,833,765 | 11,021,940 | 9,791,948 | |||||||||||||||
| Commercial | ||||||||||||||||||||
| Commercial | 2,907,798 | 3,038,216 | 2,314,472 | 2,451,119 | 2,215,539 | |||||||||||||||
| Agricultural | 241,687 | 217,715 | 191,535 | 191,525 | 214,610 | |||||||||||||||
| Total commercial | 3,149,485 | 3,255,931 | 2,506,007 | 2,642,644 | 2,430,149 | |||||||||||||||
| Other | 521,088 | 418,810 | 578,039 | 307,123 | 371,086 | |||||||||||||||
| Total Loans | $ | 14,017,442 | $ | 14,606,900 | $ | 14,374,277 | $ | 14,425,704 | $ | 13,003,549 | ||||||||||
| Page 5 |
| Simmons First National Corporation | SFNC | |||||||||||||||||||
| Consolidated Allowance and Asset Quality | ||||||||||||||||||||
| For the Quarters Ended | Sep 30 | Jun 30 | Mar 31 | Dec 31 | Sep 30 | |||||||||||||||
| (Unaudited) | 2020 | 2020 | 2020 | 2019 | 2019 | |||||||||||||||
| ($ in thousands) | ||||||||||||||||||||
| Allowance for Credit Losses on Loans | ||||||||||||||||||||
| Beginning balance, prior to adoption of ASC 326 | $ | 68,244 | $ | 66,590 | $ | 64,179 | ||||||||||||||
| Impact of adopting ASC 326 (1) | $ | 151,377 | ||||||||||||||||||
| Beginning balance, after adoption of ASC 326 | $ | 231,641 | $ | 243,195 | $ | 219,621 | ||||||||||||||
| Loans charged off | ||||||||||||||||||||
| Credit cards | 832 | 1,053 | 1,441 | 1,287 | 1,117 | |||||||||||||||
| Other consumer | 1,091 | 592 | 1,379 | 1,425 | 1,065 | |||||||||||||||
| Real estate | 1,153 | 1,824 | 396 | 892 | 1,367 | |||||||||||||||
| Commercial | 4,327 | 35,687 | 523 | 459 | 17,778 | |||||||||||||||
| Total loans charged off | 7,403 | 39,156 | 3,739 | 4,063 | 21,327 | |||||||||||||||
| Recoveries of loans previously charged off | ||||||||||||||||||||
| Credit cards | 276 | 272 | 225 | 287 | 223 | |||||||||||||||
| Other consumer | 366 | 301 | 443 | 304 | 1,422 | |||||||||||||||
| Real estate | 120 | 253 | 101 | 146 | 55 | |||||||||||||||
| Commercial | 936 | 98 | 347 | 77 | 65 | |||||||||||||||
| Total recoveries | 1,698 | 924 | 1,116 | 814 | 1,765 | |||||||||||||||
| Net loans charged off | 5,705 | 38,232 | 2,623 | 3,249 | 19,562 | |||||||||||||||
| Provision for credit losses on loans | 22,315 | 26,678 | 26,197 | 4,903 | 21,973 | |||||||||||||||
| Balance, end of quarter | $ | 248,251 | $ | 231,641 | $ | 243,195 | $ | 68,244 | $ | 66,590 | ||||||||||
| Non-performing assets | ||||||||||||||||||||
| Non-performing loans | ||||||||||||||||||||
| Nonaccrual loans | $ | 168,349 | $ | 131,888 | $ | 156,746 | $ | 91,723 | $ | 84,660 | ||||||||||
| Loans past due 90 days or more | 156 | 537 | 1,305 | 855 | 177 | |||||||||||||||
| Total non-performing loans | 168,505 | 132,425 | 158,051 | 92,578 | 84,837 | |||||||||||||||
| Other non-performing assets | ||||||||||||||||||||
| Foreclosed assets and other real estate owned | 12,590 | 14,111 | 20,805 | 19,121 | 19,576 | |||||||||||||||
| Other non-performing assets | 1,983 | 2,008 | 2,169 | 1,964 | 540 | |||||||||||||||
| Total other non-performing assets | 14,573 | 16,119 | 22,974 | 21,085 | 20,116 | |||||||||||||||
| Total non-performing assets | $ | 183,078 | $ | 148,544 | $ | 181,025 | $ | 113,663 | $ | 104,953 | ||||||||||
| Performing TDRs (troubled debt restructurings) | $ | 2,791 | $ | 3,960 | $ | 4,110 | $ | 4,411 | $ | 6,519 | ||||||||||
| Ratios | ||||||||||||||||||||
| Allowance for credit losses on loans to total loans | 1.77 | % | 1.59 | % | 1.69 | % | 0.47 | % | 0.51 | % | ||||||||||
| Allowance for credit losses to non-performing loans | 147 | % | 175 | % | 154 | % | 74 | % | 78 | % | ||||||||||
| Non-performing loans to total loans | 1.20 | % | 0.91 | % | 1.10 | % | 0.64 | % | 0.65 | % | ||||||||||
| Non-performing assets (including performing TDRs) | ||||||||||||||||||||
| to total assets | 0.87 | % | 0.70 | % | 0.89 | % | 0.56 | % | 0.63 | % | ||||||||||
| Non-performing assets to total assets | 0.85 | % | 0.68 | % | 0.87 | % | 0.53 | % | 0.59 | % | ||||||||||
| Annualized net charge offs to total loans | 0.16 | % | 1.04 | % | 0.07 | % | 0.09 | % | 0.59 | % | ||||||||||
| Annualized net credit card charge offs to | ||||||||||||||||||||
| total credit card loans | 1.26 | % | 1.67 | % | 2.29 | % | 1.99 | % | 1.82 | % | ||||||||||
(1) The Company adopted ASC 326.effective January 1, 2020.
| Page 6 |
| Simmons First National Corporation | SFNC | |||||||||||||||||||||||||||||||||||
| Consolidated - Average Balance Sheet and Net Interest Income Analysis | ||||||||||||||||||||||||||||||||||||
| For the Quarters Ended | ||||||||||||||||||||||||||||||||||||
| (Unaudited) | ||||||||||||||||||||||||||||||||||||
| Three Months Ended Sep 2020 | Three Months Ended Jun 2020 | Three Months Ended Sep 2019 | ||||||||||||||||||||||||||||||||||
| ($ in thousands) | Average Balance | Income/ Expense | Yield/ Rate | Average Balance | Income/ Expense | Yield/ Rate | Average Balance | Income/ Expense | Yield/ Rate | |||||||||||||||||||||||||||
| ASSETS | ||||||||||||||||||||||||||||||||||||
| Earning assets: | ||||||||||||||||||||||||||||||||||||
| Interest bearing balances due from banks | ||||||||||||||||||||||||||||||||||||
| and federal funds sold | $ | 2,265,233 | $ | 623 | 0.11 | % | $ | 2,190,878 | $ | 603 | 0.11 | % | $ | 344,761 | $ | 1,586 | 1.83 | % | ||||||||||||||||||
| Investment securities - taxable | 1,534,742 | 7,193 | 1.86 | % | 1,642,083 | 7,131 | 1.75 | % | 1,561,308 | 9,514 | 2.42 | % | ||||||||||||||||||||||||
| Investment securities - non-taxable (FTE) | 1,155,099 | 10,382 | 3.58 | % | 866,944 | 8,434 | 3.91 | % | 681,505 | 6,687 | 3.89 | % | ||||||||||||||||||||||||
| Mortgage loans held for sale | 145,226 | 1,012 | 2.77 | % | 86,264 | 668 | 3.11 | % | 39,551 | 382 | 3.83 | % | ||||||||||||||||||||||||
| Loans (FTE) | 14,315,014 | 163,379 | 4.54 | % | 14,731,306 | 177,168 | 4.84 | % | 13,053,540 | 180,080 | 5.47 | % | ||||||||||||||||||||||||
| Total interest earning assets (FTE) | 19,415,314 | 182,589 | 3.74 | % | 19,517,475 | 194,004 | 4.00 | % | 15,680,665 | 198,249 | 5.02 | % | ||||||||||||||||||||||||
| Non-earning assets | 2,350,007 | 2,304,798 | 2,039,933 | |||||||||||||||||||||||||||||||||
| Total assets | $ | 21,765,321 | $ | 21,822,273 | $ | 17,720,598 | ||||||||||||||||||||||||||||||
| LIABILITIES AND STOCKHOLDERS' EQUITY | ||||||||||||||||||||||||||||||||||||
| Interest bearing liabilities: | ||||||||||||||||||||||||||||||||||||
| Interest bearing transaction and | ||||||||||||||||||||||||||||||||||||
| savings accounts | $ | 8,977,886 | $ | 6,769 | 0.30 | % | $ | 9,138,563 | $ | 7,203 | 0.32 | % | $ | 7,322,395 | $ | 21,363 | 1.16 | % | ||||||||||||||||||
| Time deposits | 2,998,091 | 9,437 | 1.25 | % | 3,057,153 | 10,803 | 1.42 | % | 3,122,422 | 15,573 | 1.98 | % | ||||||||||||||||||||||||
| Total interest bearing deposits | 11,975,977 | 16,206 | 0.54 | % | 12,195,716 | 18,006 | 0.59 | % | 10,444,817 | 36,936 | 1.40 | % | ||||||||||||||||||||||||
| Federal funds purchased and securities | ||||||||||||||||||||||||||||||||||||
| sold under agreement to repurchase | 386,631 | 335 | 0.34 | % | 392,633 | 337 | 0.35 | % | 123,883 | 249 | 0.80 | % | ||||||||||||||||||||||||
| Other borrowings | 1,357,278 | 4,943 | 1.45 | % | 1,395,109 | 4,963 | 1.43 | % | 1,127,886 | 5,381 | 1.89 | % | ||||||||||||||||||||||||
| Subordinated notes and debentures | 382,672 | 4,631 | 4.81 | % | 387,422 | 4,667 | 4.84 | % | 354,178 | 4,576 | 5.13 | % | ||||||||||||||||||||||||
| Total interest bearing liabilities | 14,102,558 | 26,115 | 0.74 | % | 14,370,880 | 27,973 | 0.78 | % | 12,050,764 | 47,142 | 1.55 | % | ||||||||||||||||||||||||
| Non-interest bearing liabilities: | ||||||||||||||||||||||||||||||||||||
| Non-interest bearing deposits | 4,529,782 | 4,354,781 | 3,012,544 | |||||||||||||||||||||||||||||||||
| Other liabilities | 190,169 | 216,508 | 288,517 | |||||||||||||||||||||||||||||||||
| Total liabilities | 18,822,509 | 18,942,169 | 15,351,825 | |||||||||||||||||||||||||||||||||
| Stockholders' equity | 2,942,812 | 2,880,104 | 2,368,773 | |||||||||||||||||||||||||||||||||
| Total liabilities and stockholders' equity | $ | 21,765,321 | $ | 21,822,273 | $ | 17,720,598 | ||||||||||||||||||||||||||||||
| Net interest income (FTE) | $ | 156,474 | $ | 166,031 | $ | 151,107 | ||||||||||||||||||||||||||||||
| Net interest spread (FTE) | 3.00 | % | 3.22 | % | 3.47 | % | ||||||||||||||||||||||||||||||
| Net interest margin (FTE) - quarter-to-date | 3.21 | % | 3.42 | % | 3.82 | % | ||||||||||||||||||||||||||||||
| Net interest margin (FTE) - year-to-date | 3.43 | % | 3.55 | % | 3.88 | % | ||||||||||||||||||||||||||||||
| Core net interest margin (FTE) - quarter-to-date (1) | 3.02 | % | 3.18 | % | 3.59 | % | ||||||||||||||||||||||||||||||
| Core loan yield (FTE) - quarter-to-date (1) | 4.29 | % | 4.52 | % | 5.19 | % | ||||||||||||||||||||||||||||||
| Core net interest margin (FTE) - year-to-date (1) | 3.20 | % | 3.30 | % | 3.64 | % | ||||||||||||||||||||||||||||||
| Core loan yield (FTE) - year-to-date (1) | 4.56 | % | 4.69 | % | 5.24 | % | ||||||||||||||||||||||||||||||
(1) Calculations of core net interest margin and core loan yield and the reconciliations to GAAP are included in the schedules accompanying this release.
| Page 7 |
| Simmons First National Corporation | SFNC | |||||||||||||||||||
| Consolidated - Selected Financial Data | ||||||||||||||||||||
| For the Quarters Ended | Sep 30 | Jun 30 | Mar 31 | Dec 31 | Sep 30 | |||||||||||||||
| (Unaudited) | 2020 | 2020 | 2020 | 2019 | 2019 | |||||||||||||||
| ($ in thousands, except share data) | ||||||||||||||||||||
| QUARTER-TO-DATE | ||||||||||||||||||||
| Financial Highlights - GAAP | ||||||||||||||||||||
| Net Income | $ | 65,885 | $ | 58,789 | $ | 77,223 | $ | 52,709 | $ | 81,826 | ||||||||||
| Diluted earnings per share | 0.60 | 0.54 | 0.68 | 0.49 | 0.84 | |||||||||||||||
| Return on average assets | 1.20 | % | 1.08 | % | 1.48 | % | 1.04 | % | 1.83 | % | ||||||||||
| Return on average common equity | 8.91 | % | 8.21 | % | 10.83 | % | 8.01 | % | 13.70 | % | ||||||||||
| Return on tangible common equity | 15.45 | % | 14.55 | % | 19.00 | % | 14.62 | % | 24.89 | % | ||||||||||
| Net interest margin (FTE) | 3.21 | % | 3.42 | % | 3.68 | % | 3.78 | % | 3.82 | % | ||||||||||
| FTE adjustment | 2,864 | 2,350 | 2,305 | 2,172 | 1,843 | |||||||||||||||
| Amortization of intangibles | 3,362 | 3,369 | 3,413 | 3,270 | 2,947 | |||||||||||||||
| Amortization of intangibles, net of taxes | 2,483 | 2,489 | 2,521 | 2,416 | 2,176 | |||||||||||||||
| Average diluted shares outstanding | 109,207,294 | 109,130,866 | 113,137,223 | 108,472,559 | 96,968,775 | |||||||||||||||
| Shares repurchased under plan | - | - | 4,922,336 | 390,000 | - | |||||||||||||||
| Average price of shares repurchased | - | - | 18.96 | 25.95 | - | |||||||||||||||
| Cash dividends declared per common share | 0.17 | 0.17 | 0.17 | 0.16 | 0.16 | |||||||||||||||
| Financial Highlights - Core (non-GAAP) | ||||||||||||||||||||
| Core earnings (excludes non-core items) (1) | $ | 68,338 | $ | 60,147 | $ | 73,838 | $ | 71,074 | $ | 83,963 | ||||||||||
| Core diluted earnings per share (1) | 0.63 | 0.55 | 0.65 | 0.66 | 0.87 | |||||||||||||||
| Core net interest margin (FTE) (2) | 3.02 | % | 3.18 | % | 3.42 | % | 3.44 | % | 3.59 | % | ||||||||||
| Accretable yield on acquired loans | 8,948 | 11,723 | 11,837 | 15,100 | 9,322 | |||||||||||||||
| Efficiency ratio (1) | 54.12 | % | 51.46 | % | 57.79 | % | 52.63 | % | 43.77 | % | ||||||||||
| Core return on average assets (1) | 1.25 | % | 1.11 | % | 1.42 | % | 1.41 | % | 1.88 | % | ||||||||||
| Core return on average common equity (1) | 9.24 | % | 8.40 | % | 10.35 | % | 10.80 | % | 14.06 | % | ||||||||||
| Core return on tangible common equity (1) | 16.00 | % | 14.87 | % | 18.19 | % | 19.49 | % | 25.52 | % | ||||||||||
| YEAR-TO-DATE | ||||||||||||||||||||
| Financial Highlights - GAAP | ||||||||||||||||||||
| Net Income | $ | 201,897 | $ | 136,012 | $ | 77,223 | $ | 237,828 | $ | 185,119 | ||||||||||
| Diluted earnings per share | 1.83 | 1.22 | 0.68 | 2.41 | 1.94 | |||||||||||||||
| Return on average assets | 1.25 | % | 1.28 | % | 1.48 | % | 1.33 | % | 1.44 | % | ||||||||||
| Return on average common equity | 9.27 | % | 9.45 | % | 10.83 | % | 9.93 | % | 10.65 | % | ||||||||||
| Return on tangible common equity | 16.19 | % | 16.57 | % | 19.00 | % | 17.99 | % | 19.27 | % | ||||||||||
| Net interest margin (FTE) | 3.43 | % | 3.55 | % | 3.68 | % | 3.85 | % | 3.88 | % | ||||||||||
| FTE adjustment | 7,519 | 4,655 | 2,305 | 7,322 | 5,150 | |||||||||||||||
| Amortization of intangibles | 10,144 | 6,782 | 3,413 | 11,805 | 8,535 | |||||||||||||||
| Amortization of intangibles, net of taxes | 7,493 | 5,010 | 2,521 | 8,720 | 6,304 | |||||||||||||||
| Average diluted shares outstanding | 110,480,508 | 111,083,999 | 113,137,223 | 98,796,628 | 95,450,732 | |||||||||||||||
| Cash dividends declared per common share | 0.51 | 0.34 | 0.17 | 0.64 | 0.48 | |||||||||||||||
| Financial Highlights - Core (non-GAAP) | ||||||||||||||||||||
| Core earnings (excludes non-core items) (1) | $ | 202,323 | $ | 133,985 | $ | 73,838 | $ | 269,566 | $ | 198,492 | ||||||||||
| Core diluted earnings per share (1) | 1.83 | 1.21 | 0.65 | 2.73 | 2.08 | |||||||||||||||
| Core net interest margin (FTE) (2) | 3.20 | % | 3.30 | % | 3.42 | % | 3.59 | % | 3.64 | % | ||||||||||
| Accretable yield on acquired loans | 32,508 | 23,560 | 11,837 | 41,244 | 26,144 | |||||||||||||||
| Efficiency ratio (1) | 54.46 | % | 54.62 | % | 57.79 | % | 50.33 | % | 49.49 | % | ||||||||||
| Core return on average assets (1) | 1.26 | % | 1.26 | % | 1.42 | % | 1.51 | % | 1.55 | % | ||||||||||
| Core return on average common equity (1) | 9.29 | % | 9.31 | % | 10.35 | % | 11.25 | % | 11.42 | % | ||||||||||
| Core return on tangible common equity (1) | 16.22 | % | 16.33 | % | 18.19 | % | 20.31 | % | 20.62 | % | ||||||||||
| END OF PERIOD | ||||||||||||||||||||
| Book value per share | $ | 26.98 | $ | 26.64 | $ | 26.11 | $ | 26.30 | $ | 26.36 | ||||||||||
| Tangible book value per share | 16.07 | 15.79 | 15.22 | 15.89 | 15.73 | |||||||||||||||
| Shares outstanding | 109,023,781 | 108,994,389 | 108,966,331 | 113,628,601 | 96,613,855 | |||||||||||||||
| Full-time equivalent employees | 2,904 | 2,939 | 3,079 | 3,270 | 2,701 | |||||||||||||||
| Total number of financial centers | 226 | 226 | 240 | 251 | 212 | |||||||||||||||
(1) Core earnings exclude non-core items, which is a non-GAAP measurement. Reconciliations to GAAP are included in the schedules accompanying this release.
(2) Excludes accretable yield adjustment on loans, which is a non-GAAP measurement. Reconciliations to GAAP are included in the schedules accompanying this release.
| Page 8 |
| Simmons First National Corporation | SFNC | |||||||||||||||||||
| Consolidated - Reconciliation of Core Earnings (non-GAAP) | ||||||||||||||||||||
| For the Quarters Ended | Sep 30 | Jun 30 | Mar 31 | Dec 31 | Sep 30 | |||||||||||||||
| (Unaudited) | 2020 | 2020 | 2020 | 2019 | 2019 | |||||||||||||||
| ($ in thousands, except per share data) | ||||||||||||||||||||
| QUARTER-TO-DATE | ||||||||||||||||||||
| Net Income | $ | 65,885 | $ | 58,789 | $ | 77,223 | $ | 52,709 | $ | 81,826 | ||||||||||
| Non-core items | ||||||||||||||||||||
| Gain on sale of branches | - | (2,204 | ) | (5,889 | ) | - | - | |||||||||||||
| Merger-related costs | 902 | 1,830 | 1,068 | 24,831 | 2,556 | |||||||||||||||
| Early retirement program | 2,346 | 493 | - | - | 177 | |||||||||||||||
| Branch right-sizing (net) | 72 | 1,721 | 238 | 37 | 160 | |||||||||||||||
| Tax effect (1) | (867 | ) | (482 | ) | 1,198 | (6,503 | ) | (756 | ) | |||||||||||
| Net non-core items | 2,453 | 1,358 | (3,385 | ) | 18,365 | 2,137 | ||||||||||||||
| Core earnings (non-GAAP) | $ | 68,338 | $ | 60,147 | $ | 73,838 | $ | 71,074 | $ | 83,963 | ||||||||||
| Diluted earnings per share | $ | 0.60 | $ | 0.54 | $ | 0.68 | $ | 0.49 | $ | 0.84 | ||||||||||
| Non-core items | ||||||||||||||||||||
| Gain on sale of branches | - | (0.02 | ) | (0.05 | ) | - | - | |||||||||||||
| Merger-related costs | 0.01 | 0.02 | 0.01 | 0.23 | 0.04 | |||||||||||||||
| Early retirement program | 0.02 | - | - | - | - | |||||||||||||||
| Branch right-sizing (net) | - | 0.02 | - | - | - | |||||||||||||||
| Tax effect (1) | - | (0.01 | ) | 0.01 | (0.06 | ) | (0.01 | ) | ||||||||||||
| Net non-core items | 0.03 | 0.01 | (0.03 | ) | 0.17 | 0.03 | ||||||||||||||
| Core diluted earnings per share (non-GAAP) | $ | 0.63 | $ | 0.55 | $ | 0.65 | $ | 0.66 | $ | 0.87 | ||||||||||
| YEAR-TO-DATE | ||||||||||||||||||||
| Net Income | $ | 201,897 | $ | 136,012 | $ | 77,223 | $ | 237,828 | $ | 185,119 | ||||||||||
| Non-core items | ||||||||||||||||||||
| Gain on sale of branches | (8,093 | ) | (8,093 | ) | (5,889 | ) | - | - | ||||||||||||
| Merger-related costs | 3,800 | 2,898 | 1,068 | 36,379 | 11,548 | |||||||||||||||
| Early retirement program | 2,839 | 493 | - | 3,464 | 3,464 | |||||||||||||||
| Branch right-sizing (net) | 2,031 | 1,959 | 238 | 3,129 | 3,092 | |||||||||||||||
| Tax effect (1) | (151 | ) | 716 | 1,198 | (11,234 | ) | (4,731 | ) | ||||||||||||
| Net non-core items | 426 | (2,027 | ) | (3,385 | ) | 31,738 | 13,373 | |||||||||||||
| Core earnings (non-GAAP) | $ | 202,323 | $ | 133,985 | $ | 73,838 | $ | 269,566 | $ | 198,492 | ||||||||||
| Diluted earnings per share | $ | 1.83 | $ | 1.22 | $ | 0.68 | $ | 2.41 | $ | 1.94 | ||||||||||
| Non-core items | ||||||||||||||||||||
| Gain on sale of branches | (0.07 | ) | (0.07 | ) | (0.05 | ) | - | - | ||||||||||||
| Merger-related costs | 0.03 | 0.03 | 0.01 | 0.37 | 0.12 | |||||||||||||||
| Early retirement program | 0.02 | - | - | 0.03 | 0.04 | |||||||||||||||
| Branch right-sizing (net) | 0.02 | 0.02 | - | 0.03 | 0.03 | |||||||||||||||
| Tax effect (1) | - | 0.01 | 0.01 | (0.11 | ) | (0.05 | ) | |||||||||||||
| Net non-core items | - | (0.01 | ) | (0.03 | ) | 0.32 | 0.14 | |||||||||||||
| Core diluted earnings per share (non-GAAP) | $ | 1.83 | $ | 1.21 | $ | 0.65 | $ | 2.73 | $ | 2.08 | ||||||||||
| (1) Effective tax rate of 26.135%. | ||||||||||||||||||||
| Reconciliation of Selected Non-Core Non-Interest Income and Expense Items (non-GAAP) | ||||||||||||||||||||
| QUARTER-TO-DATE | ||||||||||||||||||||
| Other income | $ | 5,380 | $ | 9,809 | $ | 12,801 | $ | 7,073 | $ | 44,721 | ||||||||||
| Non-core items (1) | (370 | ) | (2,204 | ) | (5,889 | ) | - | - | ||||||||||||
| Core other income (non-GAAP) | $ | 5,010 | $ | 7,605 | $ | 6,912 | $ | 7,073 | $ | 44,721 | ||||||||||
| Non-interest expense | $ | 118,949 | $ | 117,598 | $ | 128,813 | $ | 142,095 | $ | 106,865 | ||||||||||
| Non-core items (1) | (3,690 | ) | (4,044 | ) | (1,306 | ) | (24,868 | ) | (2,893 | ) | ||||||||||
| Core non-interest expense (non-GAAP) | $ | 115,259 | $ | 113,554 | $ | 127,507 | $ | 117,227 | $ | 103,972 | ||||||||||
| Salaries and employee benefits | $ | 61,144 | $ | 57,644 | $ | 67,924 | $ | 63,235 | $ | 52,065 | ||||||||||
| Non-core items (1) | (2,448 | ) | (493 | ) | - | - | (176 | ) | ||||||||||||
| Core salaries and employee benefits (non-GAAP) | $ | 58,696 | $ | 57,151 | $ | 67,924 | $ | 63,235 | $ | 51,889 | ||||||||||
| Merger related costs | $ | 902 | $ | 1,830 | $ | 1,068 | $ | 24,831 | $ | 2,556 | ||||||||||
| Non-core items (1) | (902 | ) | (1,830 | ) | (1,068 | ) | (24,831 | ) | (2,556 | ) | ||||||||||
| Core merger related costs (non-GAAP) | $ | - | $ | - | $ | - | $ | - | $ | - | ||||||||||
| Other operating expenses | $ | 38,179 | $ | 39,651 | $ | 41,788 | $ | 38,044 | $ | 37,881 | ||||||||||
| Non-core items (1) | (11 | ) | (1,662 | ) | (212 | ) | (4 | ) | (90 | ) | ||||||||||
| Core other operating expenses (non-GAAP) | $ | 38,168 | $ | 37,989 | $ | 41,576 | $ | 38,040 | $ | 37,791 | ||||||||||
(1) Non-core items include gain on sale of branches, merger related costs, early retirement program expenses and branch right sizing costs.
| Page 9 |
| Simmons First National Corporation | SFNC | |||||||||||||||||||
| Reconciliation Of Non-GAAP Financial Measures - End of Period | ||||||||||||||||||||
| For the Quarters Ended | Sep 30 | Jun 30 | Mar 31 | Dec 31 | Sep 30 | |||||||||||||||
| (Unaudited) | 2020 | 2020 | 2020 | 2019 | 2019 | |||||||||||||||
| ($ in thousands, except per share data) | ||||||||||||||||||||
| Calculation of Tangible Common Equity and the Ratio of Tangible Common Equity to Tangible Assets | ||||||||||||||||||||
| Total common stockholders' equity | $ | 2,941,474 | $ | 2,903,936 | $ | 2,844,633 | $ | 2,988,157 | $ | 2,547,071 | ||||||||||
| Intangible assets: | ||||||||||||||||||||
| Goodwill | (1,075,305 | ) | (1,064,765 | ) | (1,064,978 | ) | (1,055,520 | ) | (926,648 | ) | ||||||||||
| Other intangible assets | (114,460 | ) | (117,823 | ) | (121,673 | ) | (127,340 | ) | (101,149 | ) | ||||||||||
| Total intangibles | (1,189,765 | ) | (1,182,588 | ) | (1,186,651 | ) | (1,182,860 | ) | (1,027,797 | ) | ||||||||||
| Tangible common stockholders' equity | $ | 1,751,709 | $ | 1,721,348 | $ | 1,657,982 | $ | 1,805,297 | $ | 1,519,274 | ||||||||||
| Total assets | $ | 21,437,395 | $ | 21,903,684 | $ | 20,841,352 | $ | 21,259,143 | $ | 17,758,511 | ||||||||||
| Intangible assets: | ||||||||||||||||||||
| Goodwill | (1,075,305 | ) | (1,064,765 | ) | (1,064,978 | ) | (1,055,520 | ) | (926,648 | ) | ||||||||||
| Other intangible assets | (114,460 | ) | (117,823 | ) | (121,673 | ) | (127,340 | ) | (101,149 | ) | ||||||||||
| Total intangibles | (1,189,765 | ) | (1,182,588 | ) | (1,186,651 | ) | (1,182,860 | ) | (1,027,797 | ) | ||||||||||
| Tangible assets | $ | 20,247,630 | $ | 20,721,096 | $ | 19,654,701 | $ | 20,076,283 | $ | 16,730,714 | ||||||||||
| Paycheck protection program ("PPP") loans | (970,488 | ) | (963,712 | ) | ||||||||||||||||
| Total assets less PPP loans | $ | 20,466,907 | $ | 20,939,972 | ||||||||||||||||
| Tangible assets less PPP loans | $ | 19,277,142 | $ | 19,757,384 | ||||||||||||||||
| Ratio of equity to assets | 13.72 | % | 13.26 | % | 13.65 | % | 14.06 | % | 14.34 | % | ||||||||||
| Ratio of equity to assets less PPP loans | 14.38 | % | 13.87 | % | ||||||||||||||||
| Ratio of tangible common equity to tangible assets | 8.65 | % | 8.31 | % | 8.44 | % | 8.99 | % | 9.08 | % | ||||||||||
| Ratio of tangible common equity to tangible assets less PPP loans | 9.09 | % | 8.71 | % | ||||||||||||||||
| Calculation of Tangible Book Value per Share | ||||||||||||||||||||
| Total common stockholders' equity | $ | 2,941,474 | $ | 2,903,936 | $ | 2,844,633 | $ | 2,988,157 | $ | 2,547,071 | ||||||||||
| Intangible assets: | ||||||||||||||||||||
| Goodwill | (1,075,305 | ) | (1,064,765 | ) | (1,064,978 | ) | (1,055,520 | ) | (926,648 | ) | ||||||||||
| Other intangible assets | (114,460 | ) | (117,823 | ) | (121,673 | ) | (127,340 | ) | (101,149 | ) | ||||||||||
| Total intangibles | (1,189,765 | ) | (1,182,588 | ) | (1,186,651 | ) | (1,182,860 | ) | (1,027,797 | ) | ||||||||||
| Tangible common stockholders' equity | $ | 1,751,709 | $ | 1,721,348 | $ | 1,657,982 | $ | 1,805,297 | $ | 1,519,274 | ||||||||||
| Shares of common stock outstanding | 109,023,781 | 108,994,389 | 108,966,331 | 113,628,601 | 96,613,855 | |||||||||||||||
| Book value per common share | $ | 26.98 | $ | 26.64 | $ | 26.11 | $ | 26.30 | $ | 26.36 | ||||||||||
| Tangible book value per common share | $ | 16.07 | $ | 15.79 | $ | 15.22 | $ | 15.89 | $ | 15.73 | ||||||||||
| Calculation of Regulatory Tier 1 Leverage Ratio Less Average PPP Loans | ||||||||||||||||||||
| Total Tier 1 capital | $ | 1,868,173 | $ | 1,820,488 | ||||||||||||||||
| Adjusted average assets for leverage ratio | $ | 20,652,454 | $ | 20,742,824 | ||||||||||||||||
| Average PPP loans | (967,152 | ) | (645,172 | ) | ||||||||||||||||
| Adjusted average assets less average PPP loans | $ | 19,685,302 | $ | 20,097,652 | ||||||||||||||||
| Tier 1 leverage ratio | 9.05 | % | 8.78 | % | ||||||||||||||||
| Tier 1 leverage ratio less average PPP loans | 9.49 | % | 9.06 | % | ||||||||||||||||
| Page 10 |
| Simmons First National Corporation | SFNC | |||||||||||||||||||
| Reconciliation Of Non-GAAP Financial Measures - Quarter-to-Date | ||||||||||||||||||||
| For the Quarters Ended | Sep 30 | Jun 30 | Mar 31 | Dec 31 | Sep 30 | |||||||||||||||
| (Unaudited) | 2020 | 2020 | 2020 | 2019 | 2019 | |||||||||||||||
| ($ in thousands) | ||||||||||||||||||||
| Calculation of Core Return on Average Assets | ||||||||||||||||||||
| Net income | $ | 65,885 | $ | 58,789 | $ | 77,223 | $ | 52,709 | $ | 81,826 | ||||||||||
| Net non-core items, net of taxes, adjustment | 2,453 | 1,358 | (3,385 | ) | 18,365 | 2,137 | ||||||||||||||
| Core earnings | $ | 68,338 | $ | 60,147 | $ | 73,838 | $ | 71,074 | $ | 83,963 | ||||||||||
| Average total assets | $ | 21,765,321 | $ | 21,822,273 | $ | 20,920,223 | $ | 20,041,890 | $ | 17,720,598 | ||||||||||
| Return on average assets | 1.20 | % | 1.08 | % | 1.48 | % | 1.04 | % | 1.83 | % | ||||||||||
| Core return on average assets | 1.25 | % | 1.11 | % | 1.42 | % | 1.41 | % | 1.88 | % | ||||||||||
| Calculation of Return on Tangible Common Equity | ||||||||||||||||||||
| Net income | $ | 65,885 | $ | 58,789 | $ | 77,223 | $ | 52,709 | $ | 81,826 | ||||||||||
| Amortization of intangibles, net of taxes | 2,483 | 2,489 | 2,521 | 2,416 | 2,176 | |||||||||||||||
| Total income available to common stockholders | $ | 68,368 | $ | 61,278 | $ | 79,744 | $ | 55,125 | $ | 84,002 | ||||||||||
| Net non-core items, net of taxes | 2,453 | 1,358 | (3,385 | ) | 18,365 | 2,137 | ||||||||||||||
| Core earnings | 68,338 | 60,147 | 73,838 | 71,074 | 83,963 | |||||||||||||||
| Amortization of intangibles, net of taxes | 2,483 | 2,489 | 2,521 | 2,416 | 2,176 | |||||||||||||||
| Total core income available to common stockholders | $ | 70,821 | $ | 62,636 | $ | 76,359 | $ | 73,490 | $ | 86,139 | ||||||||||
| Average common stockholders' equity | $ | 2,942,045 | $ | 2,879,337 | $ | 2,869,177 | $ | 2,611,143 | $ | 2,368,773 | ||||||||||
| Average intangible assets: | ||||||||||||||||||||
| Goodwill | (1,064,893 | ) | (1,064,955 | ) | (1,055,498 | ) | (997,004 | ) | (926,687 | ) | ||||||||||
| Other intangibles | (116,385 | ) | (120,111 | ) | (125,746 | ) | (118,311 | ) | (103,028 | ) | ||||||||||
| Total average intangibles | (1,181,278 | ) | (1,185,066 | ) | (1,181,244 | ) | (1,115,315 | ) | (1,029,715 | ) | ||||||||||
| Average tangible common stockholders' equity | $ | 1,760,767 | $ | 1,694,271 | $ | 1,687,933 | $ | 1,495,828 | $ | 1,339,058 | ||||||||||
| Return on average common equity | 8.91 | % | 8.21 | % | 10.83 | % | 8.01 | % | 13.70 | % | ||||||||||
| Return on tangible common equity | 15.45 | % | 14.55 | % | 19.00 | % | 14.62 | % | 24.89 | % | ||||||||||
| Core return on average common equity | 9.24 | % | 8.40 | % | 10.35 | % | 10.80 | % | 14.06 | % | ||||||||||
| Core return on tangible common equity | 16.00 | % | 14.87 | % | 18.19 | % | 19.49 | % | 25.52 | % | ||||||||||
| Calculation of Efficiency Ratio (1) | ||||||||||||||||||||
| Non-interest expense | $ | 118,949 | $ | 117,598 | $ | 128,813 | $ | 142,095 | $ | 106,865 | ||||||||||
| Non-core non-interest expense adjustment | (3,690 | ) | (4,044 | ) | (1,306 | ) | (24,868 | ) | (2,893 | ) | ||||||||||
| Other real estate and foreclosure expense adjustment | (600 | ) | (242 | ) | (319 | ) | (1,063 | ) | (1,057 | ) | ||||||||||
| Amortization of intangibles adjustment | (3,362 | ) | (3,369 | ) | (3,413 | ) | (3,270 | ) | (2,947 | ) | ||||||||||
| Efficiency ratio numerator | $ | 111,297 | $ | 109,943 | $ | 123,775 | $ | 112,894 | $ | 99,968 | ||||||||||
| Net-interest income | $ | 153,610 | $ | 163,681 | $ | 167,483 | $ | 167,066 | $ | 149,264 | ||||||||||
| Non-interest income | 71,851 | 50,227 | 82,394 | 45,630 | 84,675 | |||||||||||||||
| Non-core non-interest income adjustment | (370 | ) | (2,204 | ) | (5,889 | ) | - | - | ||||||||||||
| Fully tax-equivalent adjustment (effective tax rate of 26.135%) | 2,864 | 2,350 | 2,305 | 2,172 | 1,843 | |||||||||||||||
| Gain on sale of securities | (22,305 | ) | (390 | ) | (32,095 | ) | (377 | ) | (7,374 | ) | ||||||||||
| Efficiency ratio denominator | $ | 205,650 | $ | 213,664 | $ | 214,198 | $ | 214,491 | $ | 228,408 | ||||||||||
| Efficiency ratio (1) | 54.12 | % | 51.46 | % | 57.79 | % | 52.63 | % | 43.77 | % | ||||||||||
(1) Efficiency ratio is core non-interest expense before foreclosed property expense and amortization of intangibles as a percent of net interest income (fully taxable equivalent) and non-interest revenues, excluding gains and losses from securities transactions and non-core items.
| Page 11 |
| Simmons First National Corporation | SFNC | |||||||||||||||||||
| Reconciliation Of Non-GAAP Financial Measures - Quarter-to-Date (continued) | ||||||||||||||||||||
| For the Quarters Ended | Sep 30 | Jun 30 | Mar 31 | Dec 31 | Sep 30 | |||||||||||||||
| (Unaudited) | 2020 | 2020 | 2020 | 2019 | 2019 | |||||||||||||||
| ($ in thousands) | ||||||||||||||||||||
| Calculation of Core Net Interest Margin | ||||||||||||||||||||
| Net interest income | $ | 153,610 | $ | 163,681 | $ | 167,483 | $ | 167,066 | $ | 149,264 | ||||||||||
| Fully tax-equivalent adjustment (effective tax rate of 26.135%) | 2,864 | 2,350 | 2,305 | 2,172 | 1,843 | |||||||||||||||
| Fully tax-equivalent net interest income | 156,474 | 166,031 | 169,788 | 169,238 | 151,107 | |||||||||||||||
| Total accretable yield | (8,948 | ) | (11,723 | ) | (11,837 | ) | (15,100 | ) | (9,322 | ) | ||||||||||
| Core net interest income | $ | 147,526 | $ | 154,308 | $ | 157,951 | $ | 154,138 | $ | 141,785 | ||||||||||
| PPP loan and excess liquidity interest income | (6,131 | ) | $ | (5,623 | ) | |||||||||||||||
| Net interest income adjusted for PPP loans and liquidity | $ | 150,343 | $ | 160,408 | ||||||||||||||||
| Average earning assets | $ | 19,415,314 | $ | 19,517,475 | $ | 18,581,491 | $ | 17,753,004 | $ | 15,680,665 | ||||||||||
| Average PPP loan balance and excess liquidity | (2,359,928 | ) | (2,071,411 | ) | ||||||||||||||||
| Average earning assets adjusted for PPL loans and liquidity | $ | 17,055,386 | $ | 17,446,064 | ||||||||||||||||
| Net interest margin | 3.21 | % | 3.42 | % | 3.68 | % | 3.78 | % | 3.82 | % | ||||||||||
| Core net interest margin | 3.02 | % | 3.18 | % | 3.42 | % | 3.44 | % | 3.59 | % | ||||||||||
| Net interest margin adjusted for PPP loans and liquidity | 3.51 | % | 3.70 | % | ||||||||||||||||
| Calculation of Core Loan Yield | ||||||||||||||||||||
| Loan interest income (FTE) | $ | 163,379 | $ | 177,168 | $ | 187,566 | $ | 193,402 | $ | 179,971 | ||||||||||
| Total accretable yield | (8,948 | ) | (11,723 | ) | (11,837 | ) | (15,100 | ) | (9,322 | ) | ||||||||||
| Core loan interest income | $ | 154,431 | $ | 165,445 | $ | 175,729 | $ | 178,302 | $ | 170,649 | ||||||||||
| PPP loan interest income | (5,782 | ) | (3,733 | ) | ||||||||||||||||
| Core loan interest income without PPP loans | $ | 148,649 | $ | 161,712 | ||||||||||||||||
| Average loan balance | $ | 14,315,014 | $ | 14,731,306 | $ | 14,548,853 | $ | 14,144,703 | $ | 13,053,540 | ||||||||||
| Average PPP loan balance | (967,152 | ) | $ | (645,172 | ) | |||||||||||||||
| Average loan balance without PPP loans | $ | 13,347,862 | $ | 14,086,134 | ||||||||||||||||
| Core loan yield | 4.29 | % | 4.52 | % | 4.86 | % | 5.00 | % | 5.19 | % | ||||||||||
| Core loan yield without PPP loans | 4.43 | % | 4.62 | % | ||||||||||||||||
| Calculation of Pre-Tax, Pre-Provision (PTPP) Earnings | ||||||||||||||||||||
| Net income available to common stockholders | $ | 65,885 | $ | 58,789 | $ | 77,223 | $ | 52,709 | $ | 81,826 | ||||||||||
| Provision for income taxes | 17,633 | 15,593 | 20,694 | 12,976 | 23,275 | |||||||||||||||
| Provision for credit losses (including provision for unfunded commitments) | 22,981 | 21,915 | 23,134 | 4,903 | 21,973 | |||||||||||||||
| (Gain) loss on sale of securities | (22,305 | ) | (390 | ) | (32,095 | ) | (377 | ) | (7,374 | ) | ||||||||||
| Net pre-tax non-core items | 3,320 | 1,840 | (4,583 | ) | 24,868 | 2,893 | ||||||||||||||
| Pre-tax, pre-provision (PTPP) earnings | $ | 87,514 | $ | 97,747 | $ | 84,373 | $ | 95,079 | $ | 122,593 | ||||||||||
| Page 12 |
| Simmons First National Corporation | SFNC | |||||||||||||||||||
| Reconciliation Of Non-GAAP Financial Measures - Year-to-Date | ||||||||||||||||||||
| For the Quarters Ended | ||||||||||||||||||||
| (Unaudited) | Sep 30 | Jun 30 | Mar 31 | Dec 31 | Sep 30 | |||||||||||||||
| 2020 | 2020 | 2020 | 2019 | 2019 | ||||||||||||||||
| ($ in thousands) | ||||||||||||||||||||
| Calculation of Core Return on Average Assets | ||||||||||||||||||||
| Net income | $ | 201,897 | $ | 136,012 | $ | 77,223 | $ | 237,828 | $ | 185,119 | ||||||||||
| Net non-core items, net of taxes, adjustment | 426 | (2,027 | ) | (3,385 | ) | 31,738 | 13,373 | |||||||||||||
| Core earnings | $ | 202,323 | $ | 133,985 | $ | 73,838 | $ | 269,566 | $ | 198,492 | ||||||||||
| Average total assets | $ | 21,503,564 | $ | 21,371,248 | $ | 20,920,223 | $ | 17,871,748 | $ | 17,140,419 | ||||||||||
| Return on average assets | 1.25 | % | 1.28 | % | 1.48 | % | 1.33 | % | 1.44 | % | ||||||||||
| Core return on average assets | 1.26 | % | 1.26 | % | 1.42 | % | 1.51 | % | 1.55 | % | ||||||||||
| Calculation of Return on Tangible Common Equity | ||||||||||||||||||||
| Net income | $ | 201,897 | $ | 136,012 | $ | 77,223 | $ | 237,828 | $ | 185,119 | ||||||||||
| Amortization of intangibles, net of taxes | 7,493 | 5,010 | 2,521 | 8,720 | 6,304 | |||||||||||||||
| Total income available to common stockholders | $ | 209,390 | $ | 141,022 | $ | 79,744 | $ | 246,548 | $ | 191,423 | ||||||||||
| Net non-core items, net of taxes | 426 | (2,027 | ) | (3,385 | ) | 31,738 | 13,373 | |||||||||||||
| Core earnings | 202,323 | 133,985 | 73,838 | 269,566 | 198,492 | |||||||||||||||
| Amortization of intangibles, net of taxes | 7,493 | 5,010 | 2,521 | 8,720 | 6,304 | |||||||||||||||
| Total core income available to common stockholders | $ | 209,816 | $ | 138,995 | $ | 76,359 | $ | 278,286 | $ | 204,796 | ||||||||||
| Average common stockholders' equity | $ | 2,910,366 | $ | 2,894,351 | $ | 2,869,177 | $ | 2,396,024 | $ | 2,323,530 | ||||||||||
| Average intangible assets: | ||||||||||||||||||||
| Goodwill | (1,061,793 | ) | (1,060,226 | ) | (1,055,498 | ) | (921,635 | ) | (896,236 | ) | ||||||||||
| Other intangibles | (120,731 | ) | (122,928 | ) | (125,746 | ) | (104,000 | ) | (99,178 | ) | ||||||||||
| Total average intangibles | (1,182,524 | ) | (1,183,154 | ) | (1,181,244 | ) | (1,025,635 | ) | (995,414 | ) | ||||||||||
| Average tangible common stockholders' equity | $ | 1,727,842 | $ | 1,711,197 | $ | 1,687,933 | $ | 1,370,389 | $ | 1,328,116 | ||||||||||
| Return on average common equity | 9.27 | % | 9.45 | % | 10.83 | % | 9.93 | % | 10.65 | % | ||||||||||
| Return on tangible common equity | 16.19 | % | 16.57 | % | 19.00 | % | 17.99 | % | 19.27 | % | ||||||||||
| Core return on average common equity | 9.29 | % | 9.31 | % | 10.35 | % | 11.25 | % | 11.42 | % | ||||||||||
| Core return on tangible common equity | 16.22 | % | 16.33 | % | 18.19 | % | 20.31 | % | 20.62 | % | ||||||||||
| Calculation of Efficiency Ratio (1) | ||||||||||||||||||||
| Non-interest expense | $ | 365,360 | $ | 246,411 | $ | 128,813 | $ | 461,112 | $ | 319,017 | ||||||||||
| Non-core non-interest expense adjustment | (9,040 | ) | (5,350 | ) | (1,306 | ) | (42,972 | ) | (18,104 | ) | ||||||||||
| Other real estate and foreclosure expense adjustment | (1,161 | ) | (561 | ) | (319 | ) | (3,282 | ) | (2,219 | ) | ||||||||||
| Amortization of intangibles adjustment | (10,144 | ) | (6,782 | ) | (3,413 | ) | (11,805 | ) | (8,535 | ) | ||||||||||
| Efficiency ratio numerator | $ | 345,015 | $ | 233,718 | $ | 123,775 | $ | 403,053 | $ | 290,159 | ||||||||||
| Net-interest income | $ | 484,774 | $ | 331,164 | $ | 167,483 | $ | 601,753 | $ | 434,687 | ||||||||||
| Non-interest income | 204,472 | 132,621 | 82,394 | 205,031 | 159,401 | |||||||||||||||
| Non-core non-interest income adjustment | (8,463 | ) | (8,093 | ) | (5,889 | ) | - | - | ||||||||||||
| Fully tax-equivalent adjustment (effective tax rate of 26.135%) | 7,519 | 4,655 | 2,305 | 7,322 | 5,150 | |||||||||||||||
| Gain on sale of securities | (54,790 | ) | (32,485 | ) | (32,095 | ) | (13,314 | ) | (12,937 | ) | ||||||||||
| Efficiency ratio denominator | $ | 633,512 | $ | 427,862 | $ | 214,198 | $ | 800,792 | $ | 586,301 | ||||||||||
| Efficiency ratio (1) | 54.46 | % | 54.62 | % | 57.79 | % | 50.33 | % | 49.49 | % | ||||||||||
| Calculation of Core Net Interest Margin | ||||||||||||||||||||
| Net interest income | $ | 484,774 | $ | 331,164 | $ | 167,483 | $ | 601,753 | $ | 434,687 | ||||||||||
| Fully tax-equivalent adjustment (effective tax rate of 26.135%) | 7,519 | 4,655 | 2,305 | 7,322 | 5,150 | |||||||||||||||
| Fully tax-equivalent net interest income | 492,293 | 335,819 | 169,788 | 609,075 | 439,837 | |||||||||||||||
| Total accretable yield | (32,508 | ) | (23,560 | ) | (11,837 | ) | (41,244 | ) | (26,144 | ) | ||||||||||
| Core net interest income | $ | 459,785 | $ | 312,259 | $ | 157,951 | $ | 567,831 | $ | 413,693 | ||||||||||
| Average earning assets | $ | 19,172,318 | $ | 19,049,487 | $ | 18,581,491 | $ | 15,824,571 | $ | 15,174,671 | ||||||||||
| Net interest margin | 3.43 | % | 3.55 | % | 3.68 | % | 3.85 | % | 3.88 | % | ||||||||||
| Core net interest margin | 3.20 | % | 3.30 | % | 3.42 | % | 3.59 | % | 3.64 | % | ||||||||||
| Calculation of Core Loan Yield | ||||||||||||||||||||
| Loan interest income (FTE) | $ | 528,294 | $ | 364,915 | $ | 187,566 | $ | 710,935 | $ | 517,533 | ||||||||||
| Total accretable yield | (32,508 | ) | (23,560 | ) | (11,837 | ) | (41,244 | ) | (26,144 | ) | ||||||||||
| Core loan interest income | $ | 495,786 | $ | 341,355 | $ | 175,729 | $ | 669,691 | $ | 491,389 | ||||||||||
| Average loan balance | $ | 14,530,938 | $ | 14,640,082 | $ | 14,548,853 | $ | 12,938,013 | $ | 12,531,355 | ||||||||||
| Core loan yield | 4.56 | % | 4.69 | % | 4.86 | % | 5.18 | % | 5.24 | % | ||||||||||
(1) Efficiency ratio is core non-interest expense before foreclosed property expense and amortization of intangibles as a percent of net interest income (fully taxable equivalent) and non-interest revenues, excluding gains and losses from securities transactions and non-core items.
Page 13
Exhibit 99.2

NASDAQ: SFNC 3 rd Quarter 2020 Investor Presentation

2 Forward - Looking Statements and Non - GAAP Financial Measures Forward - Looking Statements . Certain statements by Simmons First National Corporation (the “Company”, which where appropriate includes the Company’s wholly - owned banking subsidiary, Simmons Bank) contained in this presentation may not be based on historical facts and should be considered "forward - looking statements" within the meaning of the Private Securities Litigation Reform Act of 1995 . These forward - looking statements may be identified by reference to a future period(s) or by the use of forward - looking terminology, such as "anticipate," "estimate," "expect," "foresee," "may," "might," "will," "would," "could,“ “likely” or "intend," future or conditional verb tenses, and variations or negatives of such terms . These forward - looking statements include, without limitation, those relating to the Company’s future growth ; revenue ; expenses (including interest expense and non - interest expenses) ; assets ; asset quality ; profitability ; earnings ; critical accounting policies ; accretion ; net interest margin ; non - interest revenue ; market conditions related to and impact of the Company's common stock repurchase program ; adequacy of the allowance for loan losses ; income tax deductions ; credit quality ; level of credit losses from lending commitments ; net interest revenue ; interest rate sensitivity ; loan loss experience ; liquidity ; capital resources ; market risk ; the expected benefits, milestones, or costs associated with the Company’s acquisition strategy and Next Generation Bank Program ; the Company’s ability to recruit and retain key employees ; the ability of the Company to manage the impact of the COVID - 19 pandemic ; legal and regulatory limitations and compliance and competition ; anticipated loan principal reductions ; fees associated with the Paycheck Protection Program ; plans for investments in securities ; statements under the caption “Management’s Outlook” on slides 22 and 23 ; the charges and savings associated with completed and future branch closures ; expectations and projections regarding the Company’s COVID - 19 loan modification program ; and projected dividends . Readers are cautioned not to place undue reliance on the forward - looking statements contained in this presentation in that actual results could differ materially from those indicated in such forward - looking statements, due to a variety of factors . These factors include, but are not limited to, changes in the Company's operating or expansion strategy ; the availability of and costs associated with obtaining adequate and timely sources of liquidity ; the ability to maintain credit quality ; the effect of steps the Company takes in response to the COVID - 19 pandemic ; the severity and duration of the pandemic, including whether there is a widespread resurgence in COVID - 19 infections combined with the seasonal flu ; the pace of recovery when the pandemic subsides and the heightened impact it has on many of the risks described herein ; the effects of the pandemic on, among other things, the Company’s operations, liquidity, and credit quality ; general market and economic conditions ; unemployment ; possible adverse rulings, judgments, settlements and other outcomes of pending or future litigation (including litigation arising from the Company’s participation in and administration of programs related to the COVID - 19 pandemic (including PPP loan program authorized by the CARES Act)) ; the ability of the Company to collect amounts due under loan agreements ; changes in consumer preferences and loan demand ; effectiveness of the Company's interest rate risk management strategies ; laws and regulations affecting financial institutions in general or relating to taxes ; the effect of pending or future legislation ; the ability of the Company to repurchase its common stock on favorable terms ; the ability of the Company to successfully implement its acquisition strategy ; changes in interest rates, deposit flows, real estate values, and capital markets ; inflation ; customer acceptance of the Company's products and services ; changes or disruptions in technology and IT systems (including cyber threats, attacks and events) ; changes in accounting principles relating to loan loss recognition (current expected credit losses, or CECL) ; the benefits associated with the Company’s early retirement program and completed and future branch closures ; and other risk factors . Other relevant risk factors may be detailed from time to time in the Company's press releases and filings with the U . S . Securities and Exchange Commission, including, without limitation, the Company’s Form 10 - K for the year ended December 31 , 2019 , and its Form 10 - Q for the quarter ended June 30 , 2020 . Any forward - looking statement speaks only as of the date of this Report, and the Company undertakes no obligation to update these forward - looking statements to reflect events or circumstances that occur after the date of this Report . Annualized, pro forma, projected and estimated numbers are used for illustrative purpose only, are not forecasts and may not reflect actual results . Non - GAAP Financial Measures . This document contains financial information determined by methods other than in accordance with generally accepted accounting principles (GAAP) . The Company's management uses these non - GAAP financial measures in their analysis of the company's performance . These measures adjust GAAP performance measures to, among other things, include the tax benefit associated with revenue items that are tax - exempt, as well as exclude from income available to common shareholders certain expenses related to significant non - core activities, such as merger - related expenses, expenses related to the Company’s early retirement program, gain on sale of branches, and net branch right - sizing expenses . In addition, the Company also presents certain figures based on tangible common stockholders’ equity and tangible book value, which exclude goodwill and other intangible assets . The Company further presents certain figures that are exclusive of PPP loans . The Company’s management believes that these non - GAAP financial measure are useful to investors because they, among other things, present the results of the Company’s ongoing operations without the effect of mergers or other items not central to the Company’s ongoing business, as well as normalizing for tax effects . Management, therefore, believes presentations of these non - GAAP financial measures provide useful supplemental information that is essential to a proper understanding of the operating results of the Company's core businesses . These non - GAAP disclosures should not be viewed as a substitute for operating results determined in accordance with GAAP, nor are they necessarily comparable to non - GAAP performance measures that may be presented by other companies . Where non - GAAP financial measures are used, the comparable GAAP financial measure, as well as the reconciliation to the comparable GAAP financial measure, can be found in the appendix to this presentation .

LOAN PORTFOLIO AND ASSET QUALITY 3

Loans – Including PPP Loans $ in millions Balance $ % of Total Loans Classified $ Non - performing $ ACL % Unfunded Commitment $ Unfunded Commitment Reserve Total Loan Portfolio Consumer - Credit Card 173 1% - - 4.8% - Consumer - Other 191 1% 2 1 3.6% 19 Real Estate - Construction 1,853 13% 5 4 2.0% 823 Real Estate - Commercial 6,133 44% 188 81 2.2% 277 Real Estate - Single - family 1,997 14% 39 33 0.8% 231 Commercial 2,908 21% 88 50 1.6% 930 Agriculture 242 2% 1 1 0.4% 66 Other 521 4% 17 - 0.3% 2 Total Loan Portfolio 14,017 100% 340 170 1.8% 2,348 1.0% Select Loan Categories Retail 1,354 10% 35 2 3.6% 105 Nursing / Extended Care 442 3% - - 1.1% 85 Healthcare 638 5% 14 3 1.3% 98 Multifamily 810 6% 41 19 1.1% 105 Hotel 1,016 7% 51 33 4.1% 46 Restaurant 527 4% 4 3 3.6% 14 Energy Loans Upstream 219 2% 28 9 8.2% 51 Midstream 42 0% 17 17 24.0% 5 Services 12 0% 1 - 0.9% 1 Total Energy 273 2% 46 27 18.3% 57 4 as of September 30, 2020
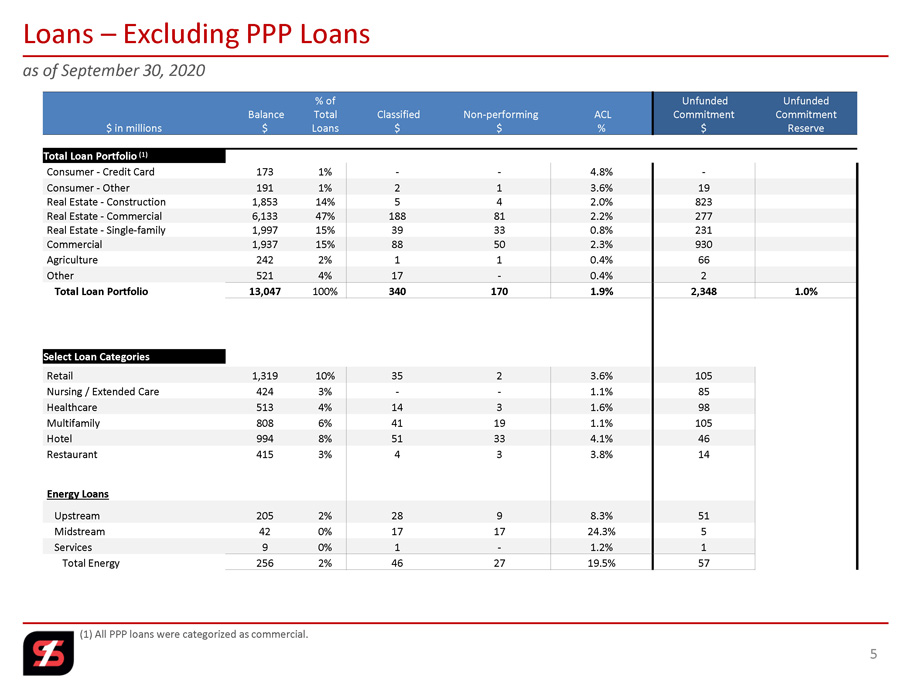
Loans – Excluding PPP Loans $ in millions Balance $ % of Total Loans Classified $ Non - performing $ ACL % Unfunded Commitment $ Unfunded Commitment Reserve Total Loan Portfolio (1) Consumer - Credit Card 173 1% - - 4.8% - Consumer - Other 191 1% 2 1 3.6% 19 Real Estate - Construction 1,853 14% 5 4 2.0% 823 Real Estate - Commercial 6,133 47% 188 81 2.2% 277 Real Estate - Single - family 1,997 15% 39 33 0.8% 231 Commercial 1,937 15% 88 50 2.3% 930 Agriculture 242 2% 1 1 0.4% 66 Other 521 4% 17 - 0.4% 2 Total Loan Portfolio 13,047 100% 340 170 1.9% 2,348 1.0% Select Loan Categories Retail 1,319 10% 35 2 3.6% 105 Nursing / Extended Care 424 3% - - 1.1% 85 Healthcare 513 4% 14 3 1.6% 98 Multifamily 808 6% 41 19 1.1% 105 Hotel 994 8% 51 33 4.1% 46 Restaurant 415 3% 4 3 3.8% 14 Energy Loans Upstream 205 2% 28 9 8.3% 51 Midstream 42 0% 17 17 24.3% 5 Services 9 0% 1 - 1.2% 1 Total Energy 256 2% 46 27 19.5% 57 5 as of September 30, 2020 (1) All PPP loans were categorized as commercial.

By Loan Type # of Loans Loan Balance ($ in millions) % of Loan Balance % of Total Loan Portfolio Hotels 47 $320 58.1% 2.3% Restaurants – Real Estate 13 7 1.3% 0.1% Restaurants – Non - Real Estate 7 2 0.4% 0.0% Retail 16 16 2.9% 0.1% Nursing/Extended Care 3 43 7.8% 0.3% Multifamily 5 62 11.3% 0.4% All Other 137 101 18.3% 0.7% Total 228 $551 100.0% 3.9% COVID - 19 Loan Modifications Update 6 (1) Internal COVID - 19 Loan Status Categories are internal status categories that the Company uses in connection with its COVID - 1 9 loan modification program. These categories were developed for the Company's internal purposes only, are not required by any law or regulation that applies to the Company, and are not a substitute or replacement fo r loan risk ratings used by the Company under generally accepted accounting principles. The Company's internal status categories for its COVID - 19 loan modification program may not be comparable to similar status codes or classifications used by other companies. The Company undertakes no obligation to disclose information about the Company’s internal COVID - 19 status categories as of any future date or for any future period and undertake s no obligation to disclose any future changes to the internal status categories that the Company may use in connection with its COVID - 19 loan modification program. as of October 13, 2020 Internal COVID - 19 Status Categories (1) Categories 1 – 3 : Borrower still in modification, but expect to revert to prior repayment terms at the end of the modification period. Category 4: Borrower still in modification, and expected to need an additional modification. Projections show return to original terms, but not at end of 6 months. Guarantors and Collateral fully support the credit. Category 5: Financial projections do not support return to regular payments OR collateral deterioration is likely, which would not fully support the credit. Guarantors are engaged and cooperative. Category 6: Financial projections do not support return to regular payments AND collateral deterioration is likely, which would not fully support the credit. Guarantors are engaged and cooperative. Category 7: Financial projections do not support return to regular payments OR collateral deterioration is likely, which would not fully support the credit. Guarantors lack capacity and are unwilling / unable to develop new operating strategy. By Internal COVID - 19 Status Category # of Loans Loan Balance ($ in millions) % of Total Loan Portfolio Internal Status Category 1 – 3 Expect to revert to prior repayment terms in less than 30 days 424 $431 3.1% Internal Status Category 1 – 3 Expect to revert to prior repayment terms in more than 30 days 93 $165 1.2% Internal Status Category 4 105 $337 2.4% Internal Status Category 5 71 $195 1.4% Internal Status Category 6 44 $17 0.1% Internal Status Category 7 8 $2 0.0% Internal COVID - 19 Status Category of 4 through 7 Management and loan officers’ focus

Principal Reductions: ▪ Q1 - 20 $78 million ▪ Q2 - 20 $83 million ▪ Q3 - 20 $42 million ▪ Anticipated for the balance of 2020: ▪ Q4 $99 million Outstanding Balance as of September 30, 2020 Energy Lending Update – Excluding PPP Loans (1) (1) Excludes $17 million of PPP loans to energy customers, as these loans are 100% government guaranteed under the SBA PPP Progra m. 7 80.1% 16.4% 3.5% Upstream Midstream Services By Industry Sector 19.2% 10.6% 9.1% 8.6% 7.4% 6.9% 11.6% 26.5% Bakken, North Dakota SCOOP, Oklahoma STACK, NW OK SCOOP/STACK/UTICA/M ARCELLUS Powder River, Wyoming DJ Basin, Colorado Eagle Ford & E. Texas All others $256 million or 2.0% of Total Loan Portfolio By Upstream & Midstream by Play/Field [mix of oil & gas] Energy Shared National Credits: ▪ $44 million or 17% of outstanding energy loan balances ▪ $35 million unfunded commitments

Loan Balance Loan Balance ($ in millions) # of Loans Interest Rate SBA Fee Estimated SBA Fee $ $50,000 or less $ 94 10% 5,216 63% 1.00% 5.00% $ 4.7 Over $50,000 to $350,000 304 31% 2,441 30% 1.00% 5.00% 15.3 Over $350,000 to Less than $2 million 358 37% 481 6% 1.00% 3.00% 10.7 $2 to $10 Million 213 22% 61 1% 1.00% 1.00% 2.1 Total $ 970 100% 8,199 100% 1.00% 1.00% $ 32.8 Simmons’ PPP Loan Portfolio as of September 30, 2020 PPP Loans 8 Simmons’ PPP Loan Portfolio ▪ PPP Loans are assigned a risk weighting of zero percent ▪ Average loan amount $118,000 ▪ Smallest loan amount $195 ▪ Loan yield 2.37% for third quarter 2020 (includes amortization of SBA fee income net of expenses) as of September 30, 2020

ASSET QUALTY TRENDS Credit Quality $ in millions Source: S&P Global Market Intelligence for the metrics for 2013 - 2019 (which metrics are as of December 31 of the relevant year) (1) ALLL for 2013 – 2019 and ACL 9/30/20 Non - performing Loans / Loans 3.33% 2.50% 1.44% 1.68% 0.81% 0.67% 0.65% 1.20% 0.00% 0.50% 1.00% 1.50% 2.00% 2.50% 3.00% 3.50% 2013 2014 2015 2016 2017 2018 2019 09/30/20 ACL/ALLL (1) / Loans 1.14% 1.05% 0.63% 0.66% 0.39% 0.48% 0.46% 1.77% 0.00% 0.20% 0.40% 0.60% 0.80% 1.00% 1.20% 1.40% 1.60% 1.80% 2.00% 2013 2014 2015 2016 2017 2018 2019 09/30/20 as of 9/30/20 SFNC NPL / Loans 1.20% NPA / Assets 0.85% Past Due 30+ Days / Loans 0.13% Net Charge - offs / Loans (QTD) 0.14% Credit Card Portfolio Net Charge - off Ratio (QTD) 1.26% ACL / Loans 1.77% Non - performing Assets / Assets 3.78% 2.71% 1.54% 1.45% 0.83% 0.64% 0.55% 0.85% 0.00% 0.50% 1.00% 1.50% 2.00% 2.50% 3.00% 3.50% 4.00% 2013 2014 2015 2016 2017 2018 2019 09/30/20 9

ALLL or ACL Loan Discount Total Loan Coverage ALLL as of 12/31/19 $ 68.2 $ 87.3 $ 155.5 CECL Day 1 Adoption Impact 151.4 (87.3) 64.1 ACL as of 01/01/20 $ 219.6 $ 0 $ 219.6 Q1 - 20 Provision, net of charge - offs 23.6 23.6 ACL as of 03/31/20 $ 243.2 $ 0 $ 243.2 Q2 - 20 Provision 26.7 26.7 Q2 - 20 Net charge - offs (38.2) (38.2) ACL as of 06/30/20 $ 231.6 $ 0 $ 231.6 Q3 - 20 Provision 22.3 22.3 Q3 - 20 Net charge - offs (5.7) (5.7) ACL as of 09/30/20 $ 248.3 $ 0 $ 248.3 Allowance for Loan Losses and Loan Coverage 10 Allowance for Credit Losses (ACL) CECL = Current Expected Credit Losses methodology for estimating ACL ACL = Allowance for Credit Losses on Loans PCD = Purchased Credit - Deteriorated Financial Assets (1) Figures excluding PPP loans are non - GAAP measurements. See Appendix for non - GAAP reconciliations. CECL Adoption (Day 1 adjustment) 01/01/20 ACL Loans $ 146.1 PCD Loan discount reclassed to ACL 5.4 ACL Securities 0.7 Unfunded commitment reserve 24.0 Total CECL Day 1 adjustment $ 176.2 Retrospective equity adjustment $ 128.1 Loan Discount not associated with loan coverage (Deferred Revenue) 12/31/19 $ 0 01/01/20, CECL adoption 81.8 03/31/20 69.2 06/30/20 58.2 09/30/20 $ 49.1 2020 Scheduled Loan Discount Accretion: Q1 [Actual] $ 11.8 Q2 [Actual] 11.7 Q3 [Actual] 8.9 Q4 [Estimated] $ 3.4 12/31/19 ALLL / Loans 0.47% 01/01/20 ACL / Loans 1.52% 03/31/20 ACL / Loans 1.69% 06/30/20 ACL / Loans 1.59% 09/30/20 ACL / Loans 1.77% $ in millions as of 03/31/20 as of 06/30/20 as of 09/30/20 Unfunded Commitments $2,765 $2,616 $2.344 Reserve $29.4 $24.4 $24.4 Reserve / Unfunded Balance 1.1% 0.9% 1.0% Reserve for Unfunded Commitments (1.70% excluding PPP Loans (1) ) (1.90% excluding PPP Loans (1) ) ACL Methodology as of 9/30/20: ▪ Quantitative allocation: 0.91% Moody’s scenarios with management’s weighting was: S1 (16%) / Baseline (66%) / S2 (18%) ▪ Qualitative allocation: 0.86% ▪ Total ACL / Loans: 1.77%

Acquired Bank Year Acquired Loans Balance Acquired “Day 1” Loan Fair Value Discount $ “Day 1” Loan Fair Value Discount % Gross Charge - offs amount since acquired (1) (2) Gross Charge - offs % since acquired (1) Accretion Income since Acquired (1) Metropolitan 2013 $494 ($37) 7.6% $10 2.0% $37 Delta Trust 2014 327 (15) 4.6% 7 2.0% 15 First State/Liberty Bank 2015 1,954 (37) 1.9% 28 1.4% 34 Citizens Bank 2016 350 (10) 2.7% 3 0.9% 9 First South Bank 2017 258 (6) 2.3% 1 0.4% 6 Bank SNB 2017 2,040 (43) 2.1% 35 1.7% 38 Southwest Bank 2017 2,246 (38) 1.7% 24 1.1% 30 Reliance Bank 2019 1,139 (42) 3.7% 1 0.1% 29 Landmark Bank 2019 2,049 (43) 2.1% 4 0.2% 25 Totals $10,857 ($271) 2.5% $113 1.0% $223 Loans underwritten by acquired banks Credit Quality – Acquired Loans 11 (1) As of 9/30/20 (2) Gross charge - offs do not include recoveries (3) Average quarterly Credit Card charge - off ratio for the period 1/1/13 through 9/30/20 (4) Average quarterly “Simmons Legacy” charge - off ratio excludes acquired loans and credit cards for the period 1/1/13 through 12/31 /19 (pre - CECL implementation) $ in millions Acquired Loans “Day 1” Loan Discount as a % Loans acquired: 2.5% Charge - off % since acquisition: 1.0% Gross Charge - offs Acquired Loans $113 48% Previously Acquired Failed Banks 17 7% Credit Card Portfolio 29 12% “Simmons Legacy” originated loans 75 32% Totals $234 100% Gross Charge - offs from 1/1/13 through 9/30/20 Average Quarterly Credit Card Portfolio charge - off ratio (3) : 1.5% Average Quarterly “Simmons Legacy” Charge - off Ratio (4) : 0.23%

CAPITAL, DEPOSITS, LIQUDITY AND INVESTMENTS 12
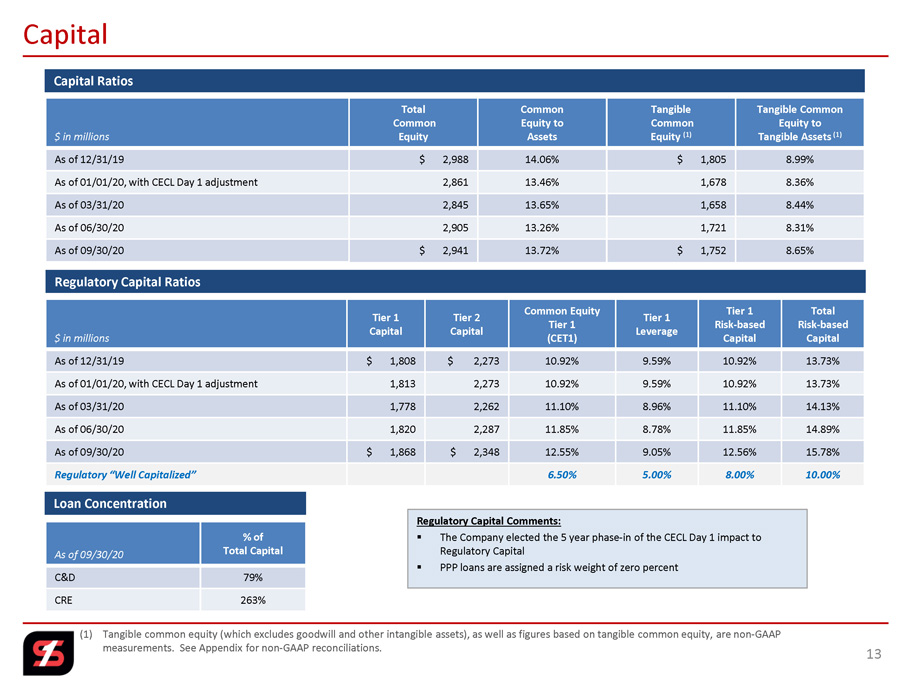
$ in millions Total Common Equity Common Equity to Assets Tangible Common Equity (1) Tangible Common Equity to Tangible Assets (1) As of 12/31/19 $ 2,988 14.06% $ 1,805 8.99% As of 01/01/20, with CECL Day 1 adjustment 2,861 13.46% 1,678 8.36% As of 03/31/20 2,845 13.65% 1,658 8.44% As of 06/30/20 2,905 13.26% 1,721 8.31% As of 09/30/20 $ 2,941 13.72% $ 1,752 8.65% Regulatory Capital Ratios 13 Capital (1) Tangible common equity (which excludes goodwill and other intangible assets), as well as figures based on tangible common equ ity , are non - GAAP measurements. See Appendix for non - GAAP reconciliations. $ in millions Tier 1 Capital Tier 2 Capital Common Equity Tier 1 (CET1) Tier 1 Leverage Tier 1 Risk - based Capital Total Risk - based Capital As of 12/31/19 $ 1,808 $ 2,273 10.92% 9.59% 10.92% 13.73% As of 01/01/20, with CECL Day 1 adjustment 1,813 2,273 10.92% 9.59% 10.92% 13.73% As of 03/31/20 1,778 2,262 11.10% 8.96% 11.10% 14.13% As of 06/30/20 1,820 2,287 11.85% 8.78% 11.85% 14.89% As of 09/30/20 $ 1,868 $ 2,348 12.55% 9.05% 12.56% 15.78% Regulatory “Well Capitalized” 6.50% 5.00% 8.00% 10.00% Capital Ratios As of 09/30/20 % of Total Capital C&D 79% CRE 263% Loan Concentration Regulatory Capital Comments: ▪ The Company elected the 5 year phase - in of the CECL Day 1 impact to Regulatory Capital ▪ PPP loans are assigned a risk weight of zero percent

15.1% 11.4% 13.4% 13.7% 15.8% 9.0% 10.0% 11.0% 12.0% 13.0% 14.0% 15.0% 16.0% 17.0% 2016 2017 2018 2019 FY20 YTD 14.5% 9.8% 10.2% 10.9% 12.6% 3.0% 5.0% 7.0% 9.0% 11.0% 13.0% 15.0% 17.0% 2016 2017 2018 2019 FY20 YTD 13.5% 9.8% 10.2% 10.9% 12.6% 4.0% 5.0% 6.0% 7.0% 8.0% 9.0% 10.0% 11.0% 12.0% 13.0% 14.0% 2016 2017 2018 2019 FY20 YTD 11.0% 9.2% 8.8% 9.6% 9.1% 4.0% 5.0% 6.0% 7.0% 8.0% 9.0% 10.0% 11.0% 12.0% 2016 2017 2018 2019 FY20 YTD (1) As of December 31, except for FY20 Q3, which is as of quarter end. 14 Regulatory Capital Ratios TIER 1 LEVERAGE RATIO (1) TOTAL RISK - BASED CAPITAL RATIO (1) TIER 1 RISK - BASED CAPITAL RATIO (1) CET1 CAPITAL RATIO (1) Well Cap. 5.0% Well Cap. 8.0%

(1) As of December 31, except for FY20 Q3, which is as of quarter end. (2) Figures based on tangible book value (which excludes goodwill and other intangible assets) are non - GAAP measurements. See Append ix for non - GAAP reconciliations. 15 Book Value & Tangible Book Value BOOK VALUE ($ IN MILLIONS) (1) TANGIBLE BOOK VALUE PER SHARE (1)(2) BOOK VALUE PER SHARE (1) TANGIBLE BOOK VALUE ($ IN MILLIONS) (1)(2) $1,151 $2,085 $2,246 $2,988 $2,941 $500 $750 $1,000 $1,250 $1,500 $1,750 $2,000 $2,250 $2,500 $2,750 $3,000 2016 2017 2018 2019 FY20 YTD $750 $1,136 $1,309 $1,805 $1,752 $250 $500 $750 $1,000 $1,250 $1,500 $1,750 $2,000 2016 2017 2018 2019 FY20 YTD $18.40 $22.65 $24.33 $26.30 $26.98 $10.00 $12.00 $14.00 $16.00 $18.00 $20.00 $22.00 $24.00 $26.00 $28.00 2016 2017 2018 2019 FY20 YTD $11.98 $12.34 $14.18 $15.89 $16.07 $10.00 $11.00 $12.00 $13.00 $14.00 $15.00 $16.00 $17.00 2016 2017 2018 2019 FY20 YTD

▪ Interest Rates – In March, the Fed reduced the Fed Funds target rate by 150 basis points. ▪ Interest Bearing Transaction Deposits – Rates were lowered during the latter part of the first quarter. ▪ Time Deposits – Rates were lowered during the latter part of the first quarter. Based on maturities, we expect there will be a continued lag in the impact to interest expense. $ in millions Interest Bearing Deposit Repricing Deposit Composition Deposits (1) Source: S&P Global Market Intelligence Q407 Q408 Q409 Q410 Q411 Q412 Int . Bearing Dep . 3.45% 2.26% 1.24% 0.83% 0.63% 0.42% Cost of Deposits 2.98% 1.96% 1.07% 0.71% 0.50% 0.34% SFNC Cost of Deposits during the “Great Recession” (1) as of 3/31/20 as of 6/30/20 as of 9/30/20 Change from 12/31/19 Balance % Rate Balance % Rate Balance % Rate Balance Rate Non - interest bearing $ 3,572 23% 0.00% $ 4,608 28% 0.00% $ 4,451 28% 0.00% $ 710 0.00% Interest bearing transaction & savings 8,841 57% 0.80% 8,978 54% 0.32% 8,994 55% 0.30% (97) (0.66%) Time deposits 3,147 20% 1.70% 3,030 18% 1.42% 2,802 17% 1.25% (475) (0.64%) Total Deposits $ 15,560 100% 0.80% $ 16,616 100% 0.44% $ 16,247 100% 0.39% $ 138 (0.55%) 16

▪ Over $2.5 billion in Cash and Cash Equivalents as of 9/30/20 – Intentionally increased cash position in Q1 – In Q1, sold investment securities when the 10YR TSY was near historic lows – Increase in deposits ▪ Over $5 billion available in secondary borrowing sources of liquidity as of quarter end ▪ Substantial access to brokered deposits ▪ Loan/Deposit Ratio of 86% as of 9/30/20 (80% excluding PPP loans) Liquidity and Investment Securities Liquidity $491 $655 $530 $997 $1,737 $2,545 $2,522 $0 $500 $1,000 $1,500 $2,000 $2,500 $3,000 Q119 Q219 Q319 Q419 Q120 Q220 Q320 Cash and Cash Equivalents (In millions) 98% 97% 97% 90% 92% 88% 86% 80% 82% 84% 86% 88% 90% 92% 94% 96% 98% 100% Q119 Q219 Q319 Q419 Q120 Q220 Q320 Loans / Deposits ▪ In Q1, sold ~$1 billion of investment securities to – De - risk the balance sheet – Create liquidity – Recognize gains of over $30 million – Increase capital ▪ In Q3, sold ~$500 million of investment securities – Projected calls for the next 12 - 18 months and realized gains – Took advantage of large gains – Recognized gains of over $22 million ▪ Q3 investment security yield was 2.60% ▪ Expect to re - invest approximately $500 million in the investment securities portfolio by year - end Investment Securities Plan 17

3 rd Quarter 2020 Earnings Highlights 18

Note: Core figures (excluding Core NIM) exclude non - core income and expense items (e.g., early retirement program costs, gain on sale of banking operations, merger related costs and branch right - sizing costs). Core NIM excludes purchase accounting interest accretion. Core figures, as well as figures based on tangible common equity (which excl ude s goodwill and other intangible assets), are non - GAAP measurements. See Appendix for non - GAAP reconciliations. (1) Efficiency ratio is core non - interest expense before foreclosed property expense and amortization of intangibles as a percent of net interest income (fully taxable equivalent) and non - interest revenues, excluding gains and losses from securities transactions and non - core items, and is a non - GAAP measurement. See Appendix for non - GAAP reconcilia tions. 19 Financial Highlights QUARTERLY RESULTS Q2 2020 Q3 2020 CHANGE Q2 2020 Q3 2020 CHANGE $ IN MILLIONS, EXCEPT PER SHARE DATA EARNINGS EARNINGS $ % DILUTED EPS DILUTED EPS $ % GAAP Results 58.79$ 65.89$ 7.10$ 12.1% 0.54$ 0.60$ 0.06$ 11.1% Non-Core Items 1.36 2.45 1.10 80.6% 0.01 0.03 0.02 200.0% Non-GAAP Core Results 60.15$ 68.34$ 8.19$ 13.6% 0.55$ 0.63$ 0.08$ 14.5% ROA 1.08% 1.20% Core ROA 1.11% 1.25% ROACE 8.21% 8.91% Core ROACE 8.40% 9.24% ROTCE 14.55% 15.45% Core ROTCE 14.87% 16.00% Efficiency Ratio⁽¹⁾ 51.46% 54.12% NIM 3.42% 3.21% Core NIM 3.18% 3.02% YTD RESULTS (as of September 30) 2019 2020 CHANGE 2019 2020 CHANGE $ IN MILLIONS, EXCEPT PER SHARE DATA EARNINGS EARNINGS $ % DILUTED EPS DILUTED EPS $ % GAAP Results 185.12$ 201.90$ 16.78$ 9.1% 1.94$ 1.83$ (0.11)$ (5.7%) Non-Core Items 13.37 0.43 (12.95) (96.8%) 0.14 - (0.14) (100.0%) Non-GAAP Core Results 198.49$ 202.32$ 3.83$ 1.9% 2.08$ 1.83$ (0.25)$ (12.0%) ROA 1.44% 1.25% Core ROA 1.55% 1.26% ROACE 10.65% 9.27% Core ROACE 11.42% 9.29% ROTCE 19.27% 16.19% Core ROTCE 20.62% 16.22% Efficiency Ratio⁽¹⁾ 49.49% 54.46% NIM 3.88% 3.43% Core NIM 3.64% 3.20%
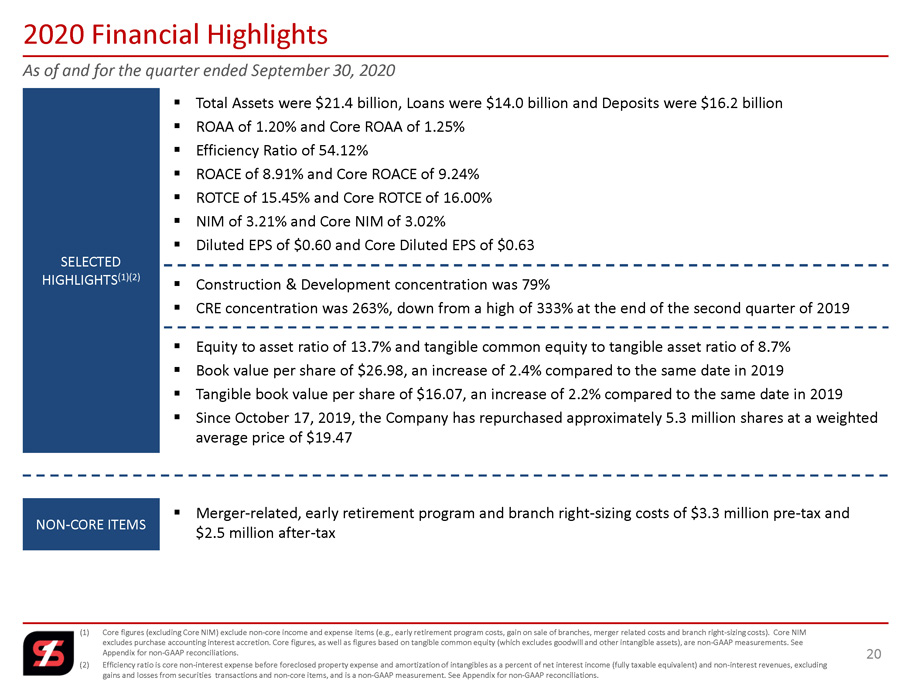
As of and for the quarter ended September 30, 2020 (1) Core figures (excluding Core NIM) exclude non - core income and expense items (e.g., early retirement program costs, gain on sale of branches, merger related costs and branch right - sizing costs). Core NIM excludes purchase accounting interest accretion. Core figures, as well as figures based on tangible common equity (which excl ude s goodwill and other intangible assets), are non - GAAP measurements. See Appendix for non - GAAP reconciliations. (2) Efficiency ratio is core non - interest expense before foreclosed property expense and amortization of intangibles as a percent of net interest income (fully taxable equivalent) and non - interest revenues, excluding gains and losses from securities transactions and non - core items, and is a non - GAAP measurement. See Appendix for non - GAAP reco nciliations. 20 2020 Financial Highlights NON - CORE ITEMS SELECTED HIGHLIGHTS (1)(2) ▪ Merger - related, early retirement program and branch right - sizing costs of $3.3 million pre - tax and $2.5 million after - tax ▪ Total Assets were $21.4 billion, Loans were $14.0 billion and Deposits were $16.2 billion ▪ ROAA of 1.20% and Core ROAA of 1.25% ▪ Efficiency Ratio of 54.12% ▪ ROACE of 8.91% and Core ROACE of 9.24 % ▪ ROTCE of 15.45% and Core ROTCE of 16.00% ▪ NIM of 3.21% and Core NIM of 3.02% ▪ Diluted EPS of $0.60 and Core Diluted EPS of $0.63 ▪ Equity to asset ratio of 13.7% and tangible common equity to tangible asset ratio of 8.7% ▪ Book value per share of $26.98, an increase of 2.4% compared to the same date in 2019 ▪ Tangible book value per share of $16.07, an increase of 2.2% compared to the same date in 2019 ▪ Since October 17, 2019, the Company has repurchased approximately 5.3 million shares at a weighted average price of $19.47 ▪ Construction & Development concentration was 79% ▪ CRE concentration was 263%, down from a high of 333% at the end of the second quarter of 2019

HISTORICAL LOAN DISCOUNT BALANCE & ACCRETION INCOME (1) Fully tax equivalent using an effective tax rate of 26.135%. (2) Core loan yield and core net interest margin exclude accretion and are non - GAAP measurements. See Appendix for non - GAAP reconcil iations. 21 Net Interest Income 2020 SCHEDULED ACCRETION Q1 (Actual) Q2 (Actual) Q4 (Estimated) Q3 (Actual) FY20 (Estimated) $8.9 $11.8 $3.4 $11.7 $35.9 $ in millions $112.0 $114.1 $77.2 $55.7 $35.5 $89.3 $49.3 $87.3 $70.0 $58.2 $49.1 $17.3 $39.6 $37.5 $46.1 $24.3 $27.8 $35.3 $41.2 $11.8 $11.7 $8.9 $- $20.0 $40.0 $60.0 $80.0 $100.0 $120.0 2012 2013 2014 2015 2016 2017 2018 2019 FY20 Q1 FY20 Q2 FY20 Q3 Loan Discount Balance Accretion Income 2019 2020 Q3 Q4 Q1 Q2 Q3 Loan Yield (1) 5.47% 5.43% 5.19% 4.84% 4.54% Core Loan Yield (1)(2) 5.19% 5.00% 4.86% 4.52% 4.29% Security Yield (1) 2.87% 2.73% 2.63% 2.50% 2.60% Cost of Interest Bearing Deposits 1.40% 1.22% 1.03% 0.59% 0.54% Cost of Deposits 1.09% 0.94% 0.80% 0.44% 0.39% Cost of Borrowed Funds 2.52% 2.30% 2.06% 1.84% 1.85% Net Interest Margin (1) 3.82% 3.78% 3.68% 3.42% 3.21% Core Net Interest Margin (1)(2) 3.59% 3.44% 3.42% 3.18% 3.02% Fed Funds Target Rate 2.00% 1.75% 0.25% 0.25% 0.25%

Category Q2 - 20 Linked Quarter Change Q3 - 20 Linked Quarter Change Management’s Outlook Interest Income Down $17.6 million or 8.4% (Decrease was driven by the Q2 Fed rate cut, excess liquidity, and lower security portfolio balance) Down $11.9 million (Decrease was driven by the Q2 Fed rate cut, excess liquidity, lower security portfolio balance and lower loan portfolio balance) Expect continued negative pressure from: - Lower yields on investment securities and interest bearing cash accounts - Loan growth tempered - Timing of PPP Loan repayment Expect to reinvest up to $500 million in the security portfolio in Q4 - 20. Interest Expense Down $13.8 million or 33.0% Down $1.9 million Cost of deposits decreased 55 basis points from 12/31/19 to Q3 - 20. Anticipate deposit cost to remain stable for the balance of the year. Net Interest Income Down $3.8 million or 2.3% Down $10.1 million Expect a flat to slightly declining NIM for the balance of 2020 (PPP Loans and additional liquidity are expected to continue to impact the NIM for the balance of the year). Trust Revenue Up $102,000 or 1.4% Down $509,000 Anticipate flat to slight decrease in Trust revenue due to pricing being based on market value. Service Charges Down $4.8 million or 35.7% (Decrease was driven by lower transaction volume primarily related to COVID - 19) Up $1.8 million Anticipate flat to modest increase in service charge fee income on deposits and ODP fees (dependent on impact from COVID - 19). Mortgage Revenue Up $7.4 million or 146.9% (Increase was driven new mortgage loans and refinancing across the industry) Up $1.5 million For Q4, expect a decrease as new loans and refinancing slows. Debit and Credit Card fees Up $82,000 or 1.0% Up $854,000 Anticipate modest increase for the balance of the year. Gain on Sale of Securities Down $31.7 million Up $21.9 million Management will continue to look for opportunities to maximize the value of the investment portfolio. Other income Down $3.0 million (Decrease was primarily driven by gain on sale of the South TX branches of $5.9 million in Q1 and gain on sale of Colorado branches of $2 million in Q2) Down $4.4 million Management expects other income to modestly decrease due to lower income related to recoveries. Revenue 22

Category Q2 - 20 Linked Quarter Change Q3 - 20 Linked Quarter Change Management’s Outlook Provision Expense Down $1.2 million Up $1.1 million Provision expense expected to be impacted by changes of the following: 1. Loan Growth – expect flat to decreasing 2. Charge - off’s – if not specifically reserved 3. Moody’s Economic Scenario Forecast: Management’s weighting for Q3: • Moody’s S1: 16% • Moody’s Baseline: 66% • Moody’s S2: 18% Salaries and Employee Benefits Down $10.3 million or 15.1% 1) Employee benefits - $3.1 million decrease (payroll taxes, insurance utilization, and other employee benefits) 2) Salaries - $2.3 million decrease 3) Incentive based plans - $4.9 million decrease (executive, lender and retail incentive plans) Up $3.5 million Increase was driven by a lower Q2 - 20 base, due to mid - year accrual adjustments for benefits and incentive plans as of 6/30/20. Expect decrease in Salaries and Benefit Expense due to branch closures that occurred on 10/9/20. Occupancy Expense Down $293,000 or 3.1% Up $430,000 Expect decrease in Salaries and Benefit Expense due to branch closures that occurred on 10/9/20. Other Expense Down $642,000 Down $2.6 million Enhanced emphasis on efficiencies throughout the Company. We will continue to invest in our digital capacity. Non - interest Expense quarterly run - rate estimate for the balance of 2020 Anticipate approximately $115 - $118 million in Q4. Provision and Non - interest Expense 23
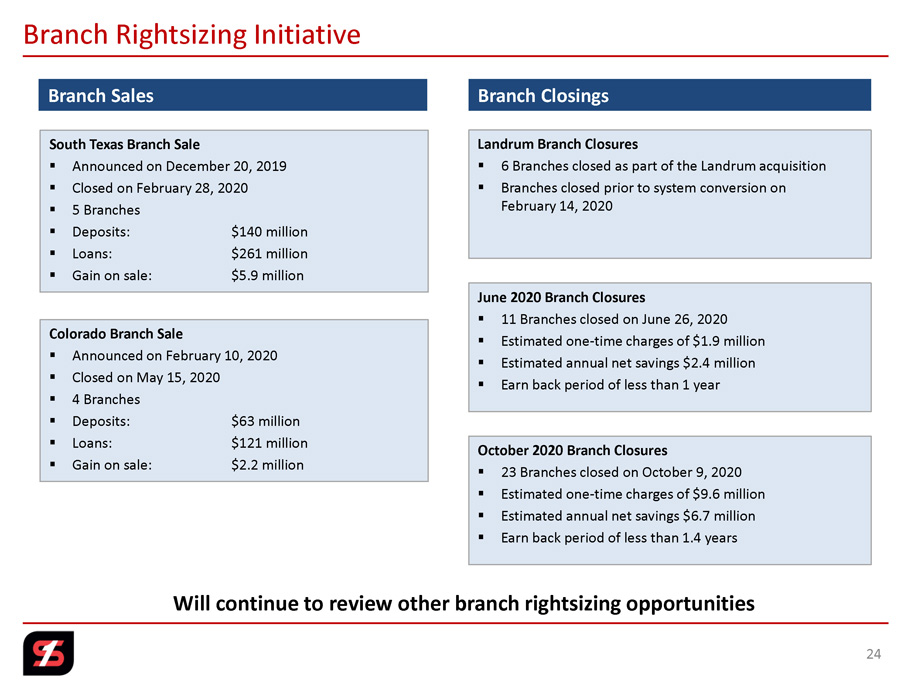
Branch Rightsizing Initiative 24 South Texas Branch Sale ▪ Announced on December 20, 2019 ▪ Closed on February 28, 2020 ▪ 5 Branches ▪ Deposits: $140 million ▪ Loans: $261 million ▪ Gain on sale: $5.9 million June 2020 Branch Closures ▪ 11 Branches closed on June 26, 2020 ▪ Estimated one - time charges of $1.9 million ▪ Estimated annual net savings $2.4 million ▪ Earn back period of less than 1 year Branch Sales Branch Closings Colorado Branch Sale ▪ Announced on February 10, 2020 ▪ Closed on May 15, 2020 ▪ 4 Branches ▪ Deposits: $63 million ▪ Loans: $121 million ▪ Gain on sale: $2.2 million October 2020 Branch Closures ▪ 23 Branches closed on October 9, 2020 ▪ Estimated one - time charges of $9.6 million ▪ Estimated annual net savings $6.7 million ▪ Earn back period of less than 1.4 years Landrum Branch Closures ▪ 6 Branches closed as part of the Landrum acquisition ▪ Branches closed prior to system conversion on February 14, 2020 Will continue to review other branch rightsizing opportunities

Adjusted for PPP Loans Including PPP Loans Excluding PPP Loans (1) Loan yield 4.54% 4.70% Core Loan Yield 4.29% 4.43% Allowance for credit losses to total loans 1.77% 1.90% Stockholders’ equity to total assets 13.72% 14.38% Tangible common equity to tangible assets 8.65% 9.09% Regulatory tier 1 leverage ratio 9.05% 9.49% Loans / Deposits 86% 80% 25 Key Ratios Adjusted for PPP Loans & Additional Liquidity (1) Figures excluding PPP loans are non - GAAP measurements. See Appendix for non - GAAP reconciliations. Net interest margin (FTE) was 3.21% for the quarter ended September 30, 2020, while the core net interest margin, which excludes the accretion, was 3.02% for the same period. The decrease in the net interest margin during the third quarter of 2020 was primarily driven by additional liquidity created in response to the COVID - 19 pandemic and the lower yielding PPP loans originated during the second and third quarters of 2020, which decreased the net interest margin by approximately 30 basis points.

(1) As of December 31, unless otherwise noted. (2) Efficiency ratio is core non - interest expense before foreclosed property expense and amortization of intangibles as a percent of net interest income (fully taxable equivalent) and non - interest revenues, excluding gains and losses from securities transactions and non - core items, and is a non - GAAP measurement. See Appendix for non - GAAP reconciliations. Note: Core figures exclude non - core income and expense items (e.g., early retirement program costs, gain on early retirement of trus t preferred securities, gain on sale of branches, gain on sale of insurance lines of business, donation to the Simmons Foundation, one - time tax adjustment, merger related costs and branch right - sizing costs). Core figures are non - GAAP meas urements. See Appendix for non - GAAP reconciliations. 26 Performance Trends TOTAL ASSETS (1) ($ IN BILLIONS) EFFICIENCY RATIO (2) NON - INTEREST INCOME / REVENUE TOTAL LOANS & DEPOSITS (1) ($ IN BILLIONS) 33.3% 28.1% 20.7% 25.4% 29.7% 33.2% 27.5% 20.7% 25.4% 28.8% 15.0% 17.0% 19.0% 21.0% 23.0% 25.0% 27.0% 29.0% 31.0% 33.0% 35.0% 2016 2017 2018 2019 FY20 YTD GAAP Core 56.3% 55.3% 52.9% 50.3% 54.1% 30.0% 35.0% 40.0% 45.0% 50.0% 55.0% 60.0% 2016 2017 2018 2019 FY20 YTD $5.6 $10.8 $11.7 $14.4 $14.0 $6.7 $11.1 $12.4 $16.1 $16.3 $3.0 $4.5 $6.0 $7.5 $9.0 $10.5 $12.0 $13.5 $15.0 $16.5 $18.0 2016 2017 2018 2019 Sep 30, '20 Loans Deposits $8.4 $15.1 $16.5 $21.3 $21.4 $5.0 $7.0 $9.0 $11.0 $13.0 $15.0 $17.0 $19.0 $21.0 $23.0 2016 2017 2018 2019 Sep 30, '20

Note: Core figures exclude non - core income and expense items (e.g., early retirement program costs, gain on early retirement of trust preferred securities, gain on sale of branches, gain on sale of insurance lines of business, donation to the Simmons Foundation, one - time tax adjustment, merger related costs and branch rig ht - sizing costs). Core figures, as well as figures based on tangible common equity (which excludes goodwill and other intangible assets), are non - GAAP measurements. See Appendix for non - GA AP reconciliations. 27 Performance Trends ROA ROTCE ROACE 1.25% 0.92% 1.37% 1.33% 1.25% 1.31% 1.18% 1.40% 1.51% 1.26% 0.40% 0.60% 0.80% 1.00% 1.20% 1.40% 1.60% 2016 2017 2018 2019 FY20 YTD GAAP Core 13.92% 11.26% 18.44% 17.99% 16.19% 14.56% 14.28% 18.81% 20.31% 16.22% 5.00% 7.00% 9.00% 11.00% 13.00% 15.00% 17.00% 19.00% 21.00% 23.00% 2016 2017 2018 2019 FY20 YTD ROTCE Core 8.75% 6.68% 10.00% 9.93% 9.27% 9.17% 8.56% 10.21% 11.25% 9.29% 5.00% 6.00% 7.00% 8.00% 9.00% 10.00% 11.00% 12.00% 2016 2017 2018 2019 FY20 YTD ROACE Core
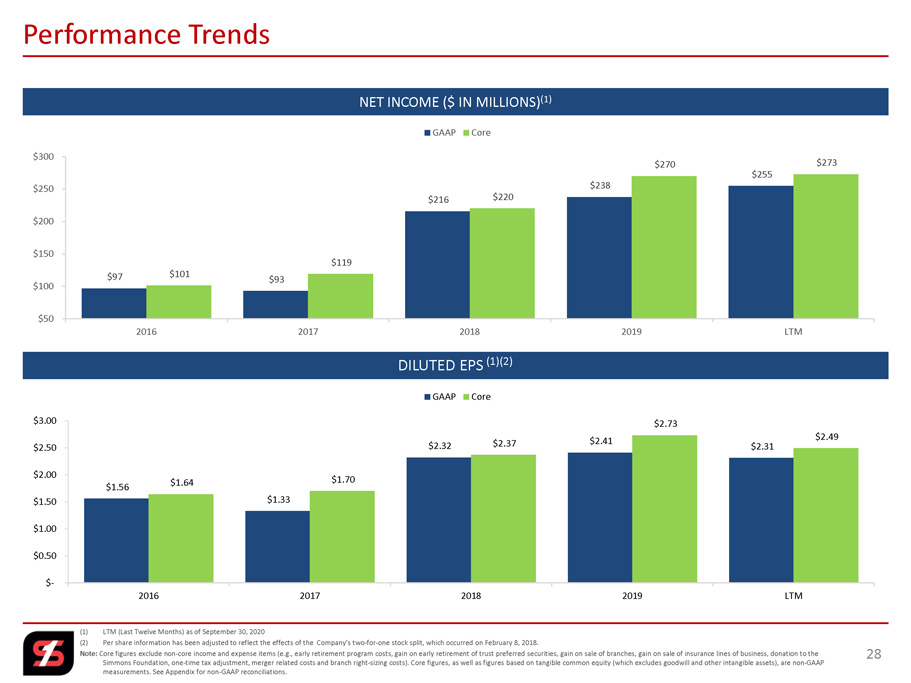
(1) LTM (Last Twelve Months) as of September 30, 2020 (2) Per share information has been adjusted to reflect the effects of the Company’s two - for - one stock split, which occurred on Febr uary 8, 2018. Note: Core figures exclude non - core income and expense items (e.g., early retirement program costs, gain on early retirement of trust preferred securities, gain on sale of branches, gain on sale of insurance lines of business, donation to the Simmons Foundation, one - time tax adjustment, merger related costs and branch right - sizing costs). Core figures, as well as figur es based on tangible common equity (which excludes goodwill and other intangible assets), are non - GAAP measurements. See Appendix for non - GAAP reconciliations. 28 Performance Trends DILUTED EPS (1)(2) NET INCOME ($ IN MILLIONS) (1) $97 $93 $216 $238 $255 $101 $119 $220 $270 $273 $50 $100 $150 $200 $250 $300 2016 2017 2018 2019 LTM GAAP Core $1.56 $1.33 $2.32 $2.41 $2.31 $1.64 $1.70 $2.37 $2.73 $2.49 $- $0.50 $1.00 $1.50 $2.00 $2.50 $3.00 2016 2017 2018 2019 LTM GAAP Core

CORPORATE PROFILE AND COMPANY HIGHLIGHTS 29

(1) Based on September 30, 2020 closing stock price of $15.86 and number of shares outstanding as of that date. (2) As of September 30, 2020. (3) Loan and deposit figures in billions. The balances include only those assigned to the division (The balances do not include o the r business units such as credit cards, equipment finance, energy, brokered and other). Company Profile FINANCIAL HIGHLIGHTS BY DIVISION (2)(3) TICKER: SFNC Founded Footprint Total Assets (2) Market Cap (1) 1903 $1.7 billion $21.4 billion 7 States 30 Division Geographic Footprint Branches Loans Deposits Arkansas Communities Arkansas smaller population markets 46 $1.4 $2.9 Central Arkansas Little Rock/North Little Rock/Benton/Bryant 20 $0.8 $1.4 Western Northwest Arkansas/Oklahoma/Kansas 37 $1.8 $2.5 Missouri Missouri/Illinois 67 $3.0 $3.9 Tennessee Tennessee 42 $1.5 $2.4 Texas Dallas/Fort Worth/North Texas 30 $3.7 $2.0 AR Community Central AR Western Texas Tennessee Missouri

31 2020 Strategy

As of and for the nine months ended September 30, 2020 32 Selected Business Units ▪ $173 million nationwide credit card portfolio ▪ Loan yield (including fees): 13.1% ▪ History of excellent credit quality (1.75% YTD net charge - off ratio) TRUST ▪ Total Assets: $5.9 billion – Managed Assets: $3.6 billion – Non - managed / Custodial Assets: $2.3 billion ▪ Profit Margin: 35.9% ▪ Growing investment management business ROYALTY TRUST ▪ Revenue: $1.6 million ▪ Profit Margin : 32.6% INVESTMENTS ▪ Beginning March 2019, retail investments services provided through networking arrangement with LPL Financial – LPL platform, among other things, provides customers with online self - service trade option – Retail Group: $1.55 billion AUM • $323 million in fee - based / advisory assets INSURANCE (EMPLOYEE BENEFITS & LIFE) ▪ Revenue: $910 thousand ▪ Profit Margin: 32% ▪ Mortgage Originations : $911 million ▪ 45% Purchase vs. 55% Refinance

33 Next Generation Bank Program WHY WHAT ▪ Allows better identification of opportunities for our customers and the ability to offer them proactively vs. waiting for our customer to ask for help ▪ Enhanced customer engagement and interaction across all channels, including digital ▪ Data will be more efficiently entered, accurate and accessible ▪ Many processes will be simplified and automated ▪ Intuitive access to information supporting quick, customer centric, profitable decisions ▪ Associates will have rewarding professional opportunities and internal support to grow along - side Simmons Bank ▪ Business - led, comprehensive IT initiative that is providing new systems and improved processes to help achieve Simmons’ position as a banking leader ▪ NGB will occur primarily during 2019 and 2020 EXPECTED BENEFITS ▪ To remain competitive, we must enhance what our current systems and processes can provide – to our customers and our associates COSTS ▪ Approximately $8 million of CapEx related to “NGB 2.0” in 2020 ▪ Approximately $9 million increase in 2020 IT OpEx compared to 2019 (full - year impact of NGB 1.0 and partial year of NGB 2.0)

(1) Purchase price and ratios as of closed date. Source: S&P Global Market Intelligence. (2) Metropolitan was acquired from Section 363 Bankruptcy. 34 Acquisitions Since 2013 2013 – 2014 Consolidated eight charters to one National to State Charter Conversion (Fed Member Bank) 2015 2016 2017 2019 $ IN MILLIONS SYSTEM TOTAL TRUST PURCHASE PRICE / BANK ANNOUNCED CLOSED CONVERSION ASSETS AUM PRICE⁽¹⁾ EARNINGS⁽¹⁾BOOK VALUE⁽¹⁾ TBV⁽¹⁾ Metropolitan National Bank⁽²⁾ Sep-13 Nov-13 Mar-14 920$ 370$ 54$ 12.5 x 88% 89% Delta Trust & Bank Mar-14 Aug-14 Oct-14 420 815 67 14.9 x 153% 157% First State Bank May-14 Feb-15 Sep-15 1,915 - 272 12.2 x 167% 170% Liberty Bank May-14 Feb-15 Apr-15 1,065 - 213 12.1 x 191% 198% Trust Company of the Ozarks Apr-15 Oct-15 Jan-16 15 1,000 24 NA NA NA Citizens National Bank May-16 Sep-16 Oct-16 585 200 82 18.0 x 130% 130% Hardeman County Investments Nov-16 May-17 Sep-17 462 - 71 17.4 x 138% 179% Southwest Bancorp, Inc (OKSB) Dec-16 Oct-17 May-18 2,468 - 532 24.7 x 180% 190% First Texas BHC, Inc. Jan-17 Oct-17 Feb-18 2,019 430 461 23.2 x 192% 228% Reliance Bancshares, Inc. Nov-18 Apr-19 Apr-19 1,534 - 166 NA 169% 169% The Landrum Company Jul-19 Oct-19 Feb-20 3,407 - 416 12.9 x 165% 165%

$0.14 $0.16 $0.18 $0.20 $0.22 $0.24 $0.27 $0.29 $0.31 $0.34 $0.37 $0.38 $0.38 $0.38 $0.38 $0.40 $0.42 $0.44 $0.46 $0.48 $0.50 $0.60 $0.64 $0.68 $- $0.10 $0.20 $0.30 $0.40 $0.50 $0.60 $0.70 (1) Based on September 30, 2020 closing stock price of $15.86. (2) FY20 Q3 EPS of $0.60. (3) FY20 Q3 Core EPS of $0.63, excludes non - core income and expense items and is a non - GAAP measurement. See Appendix for non - GAAP r econciliations. Note: The future payment of dividends is not guaranteed and is subject to various factors, including approval by the Company’s boar d of directors. 35 111 Years of Consistent Dividend History PROJECTED 2020 CURRENT DIVIDEND YIELD⁽¹⁾ 4.3% FY20 Q3 DIVIDEND PAYOUT RATIO GAAP Earnings⁽²⁾ 28.3% Core Earnings⁽³⁾ 27.0%

(50.0%) (45.0%) (40.0%) (35.0%) (30.0%) (25.0%) (20.0%) (15.0%) (10.0%) (5.0%) 0.0% 5.0% 10.0% 15.0% 20.0% Dividend + Stock Appreciation (10/1/19 – 9/30/20) Note: Based on September 30, 2020 closing stock price of $15.86. Source: S&P Global Market Intelligence 36 1 Year Total Shareholder Return

(80.0%) (60.0%) (40.0%) (20.0%) 0.0% 20.0% 40.0% 60.0% 80.0% 100.0% 120.0% 140.0% 160.0% 180.0% 200.0% 220.0% 240.0% Dividend + Stock Appreciation (12/31/07 – 9/30/20) Note: Based on September 30, 2020 closing stock price of $15.86. Source: S&P Global Market Intelligence 37 Long - term Shareholder Return

Source: S&P Global Market Intelligence (1) LTM Core EPS excludes non - core income and expense items and is a non - GAAP measurement. See Appendix for non - GAAP reconciliations . (2) Based upon the Company’s average six analyst consensus EPS of $1.93 for 2020 and $1.73 for 2021. (3) Tangible book value (which excludes goodwill and other intangible assets) is a non - GAAP measurement. See Appendix for non - GAAP reconciliations. (4) The ratings provided by KBRA are subject to revision or withdrawal by KBRA at any time and are not recommendations to buy, se ll or hold these securities. Each rating should be evaluated independently of any other rating. 38 Investment Profile SENIOR UNSECURED DEBT SHORT - TERM DEBT SUBORDINATED DEBT SENIOR UNSECURED DEBT SHORT - TERM DEBT SUBORDINATED DEBT SHORT - TERM DEPOSIT DEPOSIT BBB+ BBB K2 SIMMONS FIRST NATIONAL CORPORATION SIMMONS BANK A - A - BBB+ K2 K2 KROLL BOND RATING AGENCY (4) SFNC MARKET DATA AS OF SEPTEMBER 30, 2020 VALUATION & PER SHARE DATA Stock Price 52 - Week High Common Shares Out. (millions) 52 - Week Low Market Cap. (billions) % Institutional Own. P / LTM EPS P / LTM Core EPS (1) P / 2021 Consensus EPS (2) P / 2020 Consensus EPS (2) P / Book Value P / Tangible Book Value (3) $13.75 $15.86 109 $27.29 $1.7 7 1% 8 .2 x 6.9 x 9 .2 x 6.4 x 0.6 x 1.0 x

BRANDING PARTNERSHIPS 39

Simmons Bank Open, Team Simmons & Additional PGA Activation 40 A marquee showcase event, Simmons Bank Open, in Nashville, Tennessee. Tournament week includes substantial branding, Pro - Am outings and hospitality. Team Simmons Bank is comprised of four Korn Ferry tour golfers. Braden Thornberry of Memphis, Tennessee; Dawson Armstrong of Nashville, Tennessee; Kevin Dougherty and Will Zalatoris , both of Dallas, Texas. Our agreement includes branding and client engagement events. Additional Korn Ferry Tour and PGA TOUR hospitality tournament activations throughout the year.

41 St. Louis Blues |St. Louis, Missouri Our St. Louis market is excited to be a sponsor of the 2019 Stanley Cup champions, the St. Louis Blues hockey team, during th e 2 019 - 2020 season. As a part of the sponsorship, Simmons Bank signage is featured throughout Enterprise Center during hockey games, as well as concerts and other events held at the venue. With our expanded presence in the St. Louis market, we think this sponsorship is a wonderful avenue for us to further the Sim mon s Bank brand within the community. The team’s recent championship win only adds to the value of this sponsorship.

Dickies Arena: Simmons Bank Plaza & Pavilion | Fort Worth, Texas In October 2019, Simmons Bank became the naming rights holder to the Simmons Bank Plaza and Simmons Bank Pavilion at the newl y constructed Dickies Arena, a 14,000 - seat, multi - purpose venue in Fort Worth, Texas. The Simmons Bank Plaza is an over 200,000 - square - foot outdoor entertainment hub where fan festivals, outdoor concerts, pre - and post - show events, and more are held. The Simmons Bank Pavilion is an indoor facility adjacent to the Plaza that hosts corporate and civic events. Simmons became the official banking partner for Dickies Arena and a major sponsor of the Fort Worth Stock Show & Rodeo, the o lde st continuously running livestock show and rodeo, held annually since 1896. The Stock Show provides millions of dollars in grant s a nd scholarships to support future leaders in agriculture and livestock management. 42

43 Discovery Park: Exhibit & Simmons Bank Ag Center | Union City, Tennessee In December 2019, Simmons Bank was announced as a major sponsor and partner for Discovery Park of America’s permanent exhibit , “ AgriCulture : Innovating for Our Survival.” The exhibit is scheduled to open in fall 2020 in a 8,900 - square - foot building to be named the Simmons Bank Ag Center. Discovery Park of America is a world - class museum and 50 - acre heritage park located in Union City, Tennessee, founded with a vis ion to support farmers and inspire the imaginations of children and adults. With our deep roots in the west Tennessee, Arkansas Delta and a heritage of serving farmers for more than 100 years, Simmons Ban k is honored to help bring this initiative to life.

44 Simmons Bank Field | Pine Bluff, Arkansas In 2018, Simmons announced a $2.5 million gift to the University of Arkansas at Pine Bluff (UAPB) to fund athletics upgrades. Ad ding to our legacy of investing in our hometown and headquarters in Pine Bluff, Arkansas, the gift is the largest in UAPB history and fu nded a new football stadium scoreboard and 90,000 - square - foot IRONTURF field, along with the completion of the baseball pavilion at the Torii Hunter Baseball and Softball Complex.

45 Simmons Bank Arena | North Little Rock, Arkansas In October 2019, Simmons acquired naming rights to Simmons Bank Arena in North Little Rock, Arkansas. The arena is a beacon f or economic vitality and culture in our home state, all while being a destination for nearly 500,000 annual visitors. Simmons Ba nk Arena is ranked #39 in the United States in ticket sales according to Pollstar . Additional sponsorship rights include two suites used for business development, early access ticket sales and a Simmons customer entrance.

46 Simmons Tower | Little Rock, Arkansas At 42 stories and the tallest building in Arkansas, we have a multi - year arrangement with the building’s owner for the tower sig nage and we continue to operate a branch bank in the lobby. Coupled with our River Market building and Simmons Bank Arena signage we effectively created a highly visible brand in downtown Little Rock.

47 River Market Building | Little Rock, Arkansas We were pleased to acquire this beautiful building in the heart of the vibrant city of Little Rock and make it a regional hub ju st an hour from our corporate headquarters in Pine Bluff. We continue to increase our banking operations in new areas of the country, and while we’re now i n s even states, many of our centralized services remain in Arkansas, where we were founded. Amenities of a secured parking deck, wellness center, café providing multiple meal options for breakfast and lunch, and our b eau tiful park get the attention of potential associates and help solidify relationships with existing associates. The building’s location is also convenient to ent ertainment and dining venues, nearby hotels and a short commute to the airport. We wrapped the exterior of the building in 3,000 feet of LED lights. With more than 16 - million color combinations and the abilit y to program them every five inches, these lights can create dynamic color - changing effects, and they are environmentally friendly and energy efficient. We h ave used the lights to support causes such as Breast Cancer Awareness and Prostate Cancer Awareness, as well as celebrating various holidays, including the 4 th of July, Christmas, Valentine’s Day and more.

APPENDIX 48

(1) Effective tax rate of 26.135% for 2018 - 2020 and 39.225% for prior periods, adjusted for non - deductible merger - related costs a nd deferred tax items on P&C insurance sale. (2) Tax adjustment to revalue deferred tax assets and liabilities to account for the future impact of lower corporate tax. 49 Non - GAAP Reconciliations Q2 Q3 YTD YTD $ in thousands 2016 2017 2018 2019 2020 2020 2019 2020 LTM Calculation of Core Earnings Net Income 96,790$ 92,940$ 215,713$ 237,828$ 58,789$ 65,885$ 185,119$ 201,897$ 254,606$ Non-core items Gain on sale of banking operations - - - - (2,204) - - (8,093) (8,093) Gain from early retirement of TRUPS (594) - - - - - - - - Gain on sale of P&C insurance business - (3,708) - - - - - - - Donation to Simmons Foundation - 5,000 - - - - - - - Merger related costs 4,835 21,923 4,777 36,379 1,830 902 11,548 3,800 28,631 Early Retirement Program - - - 3,464 493 2,346 3,464 2,839 2,839 Branch right sizing 3,359 169 1,341 3,129 1,721 72 3,092 2,031 2,068 Tax Effect⁽¹⁾ (2,981) (8,746) (1,598) (11,234) (482) (867) (4,731) (151) (6,654) Net non-core items (before SAB 118 adjustment) 4,619 14,638 4,520 31,738 1,358 2,453 13,373 426 18,791 SAB 118 adjustment⁽²⁾ - 11,471 - - - - - - - Core earnings (non-GAAP) 101,409$ 119,049$ 220,233$ 269,566$ 60,147$ 68,338$ 198,492$ 202,323$ 273,397$
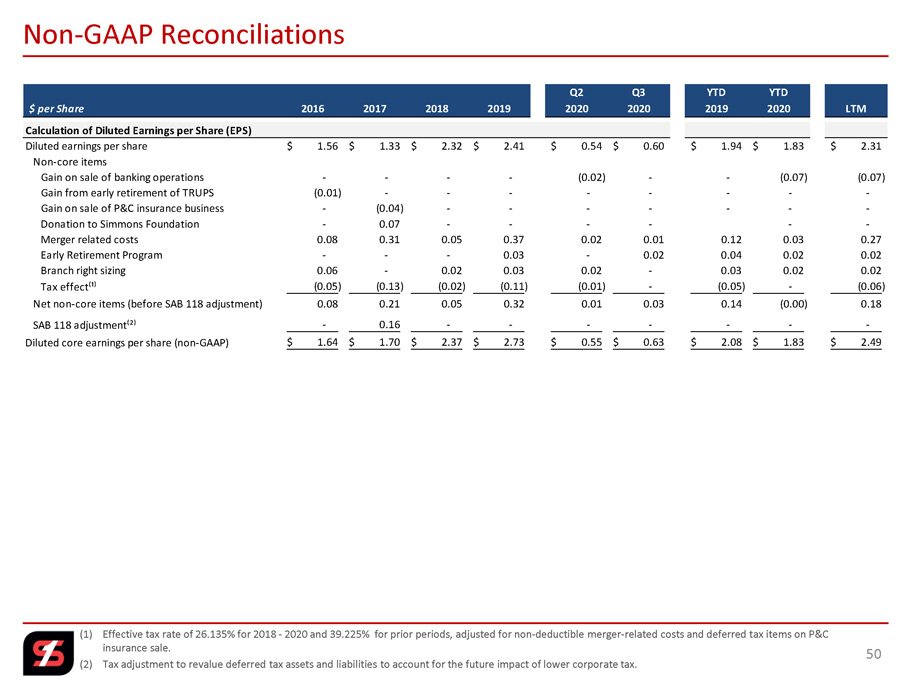
(1) Effective tax rate of 26.135% for 2018 - 2020 and 39.225% for prior periods, adjusted for non - deductible merger - related costs a nd deferred tax items on P&C insurance sale. (2) Tax adjustment to revalue deferred tax assets and liabilities to account for the future impact of lower corporate tax. 50 Non - GAAP Reconciliations Q2 Q3 YTD YTD $ per Share 2016 2017 2018 2019 2020 2020 2019 2020 LTM Calculation of Diluted Earnings per Share (EPS) Diluted earnings per share 1.56$ 1.33$ 2.32$ 2.41$ 0.54$ 0.60$ 1.94$ 1.83$ 2.31$ Non-core items Gain on sale of banking operations - - - - (0.02) - - (0.07) (0.07) Gain from early retirement of TRUPS (0.01) - - - - - - - - Gain on sale of P&C insurance business - (0.04) - - - - - - - Donation to Simmons Foundation - 0.07 - - - - - - Merger related costs 0.08 0.31 0.05 0.37 0.02 0.01 0.12 0.03 0.27 Early Retirement Program - - - 0.03 - 0.02 0.04 0.02 0.02 Branch right sizing 0.06 - 0.02 0.03 0.02 - 0.03 0.02 0.02 Tax effect⁽¹⁾ (0.05) (0.13) (0.02) (0.11) (0.01) - (0.05) - (0.06) Net non-core items (before SAB 118 adjustment) 0.08 0.21 0.05 0.32 0.01 0.03 0.14 (0.00) 0.18 SAB 118 adjustment⁽²⁾ - 0.16 - - - - - - - Diluted core earnings per share (non-GAAP) 1.64$ 1.70$ 2.37$ 2.73$ 0.55$ 0.63$ 2.08$ 1.83$ 2.49$

51 Non - GAAP Reconciliations Q2 Q3 YTD YTD $ in thousands 2016 2017 2018 2019 2020 2020 2019 2020 Calculation of Core Return on Average Assets Net income available to common stockholders 96,790$ 92,940$ 215,713$ 237,828$ 58,789$ 65,885$ 185,119$ 201,897$ Net non-core items, net of taxes, adjustment (non-GAAP) 4,619 26,109 4,520 31,738 1,358 2,453 13,373 426 Core earnings (non-GAAP) 101,409$ 119,049$ 220,233$ 269,566$ 60,147$ 68,338$ 198,492$ 202,323$ Average total assets 7,760,233$ 10,074,951$ 15,771,362$ 17,871,748$ 21,822,273$ 21,765,321$ 17,140,419$ 21,503,564$ Return on average assets 1.25% 0.92% 1.37% 1.33% 1.08% 1.20% 1.44% 1.25% Core return on average assets (non-GAAP) 1.31% 1.18% 1.40% 1.51% 1.11% 1.25% 1.55% 1.26% Calculation of Return on Tangible Common Equity Net income available to common stockholders 96,790$ 92,940$ 215,713$ 237,828$ 58,789$ 65,885$ 185,119$ 201,897$ Amortization of intangibles, net of taxes 3,611 4,659 8,132 8,720 2,489 2,483 6,304 7,493 Total income available to common stockholders (non-GAAP) 100,401$ 97,599$ 223,845$ 246,548$ 61,278$ 68,368$ 191,423$ 209,390$ Net non-core items, net of taxes (non-GAAP) 4,619 26,109 4,520 31,738 1,358 2,453 13,373 426 Core earnings (non-GAAP) 101,409 119,049 220,233 269,566 60,147 68,338 198,492 202,323 Amortization of intangibles, net of taxes 3,611 4,659 8,132 8,720 2,489 2,483 6,304 7,493 Total core income available to common stockholders (non-GAAP) 105,020$ 123,708$ 228,365$ 278,286$ 62,636$ 70,821$ 204,796$ 209,816$ Average common stockholders' equity 1,105,775$ 1,390,815$ 2,157,097$ 2,396,024$ 2,879,337$ 2,942,045$ 2,323,530$ 2,910,366$ Average intangible assets: Goodwill (332,974) (455,453) (845,308) (921,635) (1,064,955) (1,064,893) (896,236) (1,061,793) Other intangibles (51,710) (68,896) (97,820) (104,000) (120,111) (116,385) (99,178) (120,731) Total average intangibles (384,684) (524,349) (943,128) (1,025,635) (1,185,066) (1,181,278) (995,414) (1,182,524) Average tangible common stockholders' equity (non-GAAP) 721,091$ 866,466$ 1,213,969$ 1,370,389$ 1,694,271$ 1,760,767$ 1,328,116$ 1,727,842$ Return on average common equity 8.75% 6.68% 10.00% 9.93% 8.21% 8.91% 10.65% 9.27% Return on tangible common equity (non-GAAP) 13.92% 11.26% 18.44% 17.99% 14.55% 15.45% 19.27% 16.19% Core return on average common equity (non-GAAP) 9.17% 8.56% 10.21% 11.25% 8.40% 9.24% 11.42% 9.29% Core return on tangible common equity (non-GAAP) 14.56% 14.28% 18.81% 20.31% 14.87% 16.00% 20.62% 16.22%

52 Non - GAAP Reconciliations YTD $ in thousands 2016 2017 2018 2019 2020 Calculation of Non-interest Income to Revenue Net Interest Income 279,206$ 354,930$ 552,552$ 601,753$ 484,774$ Non-interest income 139,382 138,765 143,896 205,031 204,472 Total Revenue (GAAP) 418,588$ 493,695$ 696,448$ 806,784$ 689,246$ Non-interest Income (GAAP) 139,382$ 138,765$ 143,896$ 205,031$ 204,472$ Non-core Items (non-GAAP) (835) (3,972) - - (8,463) Core Non-interest Income (non-GAAP) 138,547$ 134,793$ 143,896$ 205,031$ 196,009$ Net Interest Income 279,206$ 354,930$ 552,552$ 601,753$ 484,774$ Core Non-interest Income (non-GAAP) 138,547 134,793 143,896 205,031 196,009 Core Total Revenue (non-GAAP) 417,753$ 489,723$ 696,448$ 806,784$ 680,783$ Non-interest Income / Revenue (GAAP) 33.3% 28.1% 20.7% 25.4% 29.7% Core Non-interest Income / Revenue (non-GAAP) 33.2% 27.5% 20.7% 25.4% 28.8%

(1) Effective tax rate of 26.135% (2) Efficiency ratio is core non - interest expense before foreclosed property expense and amortization of intangibles as a percent of net interest income (fully taxable equivalent) and noninterest revenues, excluding gains and losses from securities transactions and non - core items. 53 Non - GAAP Reconciliations Q2 Q3 YTD YTD $ in thousands 2016 2017 2018 2019 2020 2020 2019 2020 Calculation of Efficiency Ratio Non-interest expense 255,085$ 312,379$ 392,229$ 461,112$ 117,598$ 118,949$ 319,017$ 365,360$ Non-core non-interest expense adjustment (8,435) (27,357) (6,118) (42,972) (4,044) (3,690) (18,104) (9,040) Other real estate and foreclosure expense adjustment (4,389) (3,042) (4,240) (3,282) (242) (600) (2,219) (1,161) Amortization of intangibles adjustment (5,942) (7,666) (11,009) (11,805) (3,369) (3,362) (8,535) (10,144) Efficiency ratio numerator 236,319$ 274,314$ 370,862$ 403,053$ 109,943$ 111,297$ 290,159$ 345,015$ Net-interest income 279,206$ 354,930$ 552,552$ 605,275$ 163,681$ 153,610$ 434,687$ 484,774$ Non-interest income 139,382 138,765 143,896 201,509 50,227 71,851 159,401 204,472 Non-core non-interest income adjustment (835) (3,972) - - (2,204) (370) - (8,463) Fully tax-equivalent adjustment⁽¹⁾ 7,722 7,723 5,297 7,322 2,350 2,864 5,150 7,519 (Gain) loss on sale of securities (5,848) (1,059) (61) (13,314) (390) (22,305) (12,937) (54,790) Efficiency ratio denominator 419,627$ 496,387$ 701,684$ 800,792$ 213,664$ 205,650$ 586,301$ 633,512$ Efficiency ratio⁽²⁾ 56.32% 55.27% 52.85% 50.33% 51.46% 54.12% 49.49% 54.46%
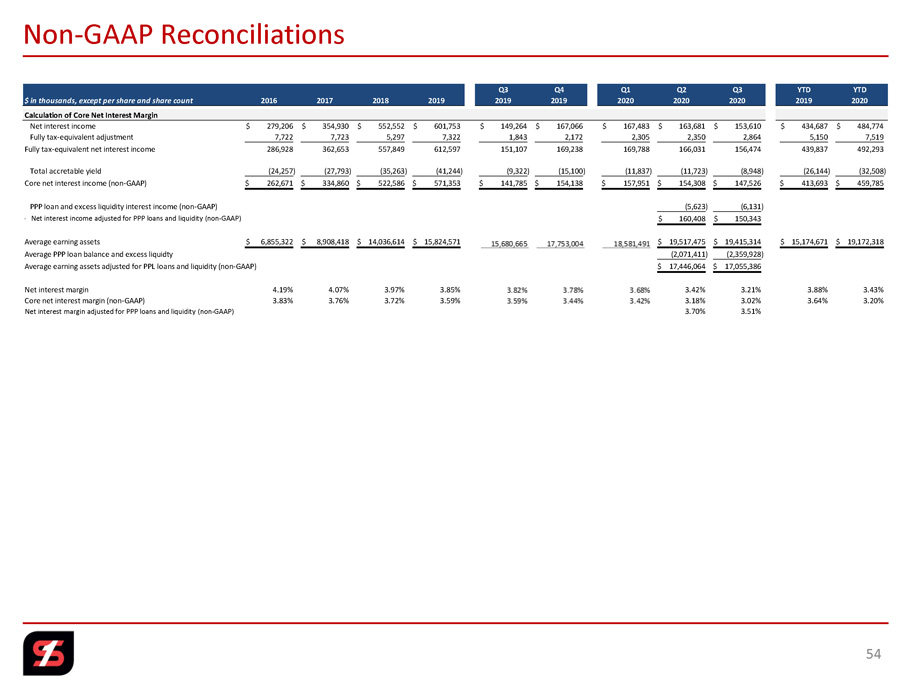
54 Non - GAAP Reconciliations Q3 Q4 Q1 Q2 Q3 YTD YTD $ in thousands, except per share and share count 2016 2017 2018 2019 2019 2019 2020 2020 2020 2019 2020 Calculation of Core Net Interest Margin Net interest income 279,206$ 354,930$ 552,552$ 601,753$ 149,264$ 167,066$ 167,483$ 163,681$ 153,610$ 434,687$ 484,774$ Fully tax-equivalent adjustment 7,722 7,723 5,297 7,322 1,843 2,172 2,305 2,350 2,864 5,150 7,519 Fully tax-equivalent net interest income 286,928 362,653 557,849 612,597 151,107 169,238 169,788 166,031 156,474 439,837 492,293 Total accretable yield (24,257) (27,793) (35,263) (41,244) (9,322) (15,100) (11,837) (11,723) (8,948) (26,144) (32,508) Core net interest income (non-GAAP) 262,671$ 334,860$ 522,586$ 571,353$ 141,785$ 154,138$ 157,951$ 154,308$ 147,526$ 413,693$ 459,785$ PPP loan and excess liquidity interest income (non-GAAP) (5,623) (6,131) Core net interest income adjusted for PPP loans and liquidity (non-GAAP) 160,408$ 150,343$ Average earning assets 6,855,322$ 8,908,418$ 14,036,614$ 15,824,571$ 19,517,475$ 19,415,314$ 15,174,671$ 19,172,318$ Average PPP loan balance and excess liquidty 15,680,665 17,753,004 18,581,491 (2,071,411) (2,359,928) Average earning assets adjusted for PPL loans and liquidity (non-GAAP) 17,446,064$ 17,055,386$ Net interest margin 4.19% 4.07% 3.97% 3.85% 3.42% 3.21% 3.88% 3.43% Core net interest margin (non-GAAP) 3.83% 3.76% 3.72% 3.59% 3.82% 3.78% 3.68% 3.18% 3.02% 3.64% 3.20% Core net interest margin adjusted for PPP loans and liquidity (non-GAAP) 3.59% 3.44% 3.42% 3.70% 3.51% Net interest margin adjusted for PPP loans and liquidity (non - GAAP) Net interest income adjusted for PPP loans and liquidity (non - GAAP)

55 Non - GAAP Reconciliations Q3 $ in thousands, except per share and share count 2016 2017 2018 2019 2020 Calculation of Book Value and Tangible Book Value per Share Total common stockholders' equity 1,151,111$ 2,084,564$ 2,246,434$ 2,988,157$ 2,941,474$ Intangible assets: Goodwill (348,505) (842,651) (845,687) (1,055,520) (1,075,305) Other intangible assets (52,959) (106,071) (91,334) (127,340) (114,460) Total intangibles (401,464) (948,722) (937,021) (1,182,860) (1,189,765) Tangible common stockholders' equity (non-GAAP) 749,647$ 1,135,842$ 1,309,413$ 1,805,297$ 1,751,709$ Shares of common stock outstanding 62,555,446 92,029,118 92,347,643 113,628,601 109,023,781 Book value per common share 18.40$ 22.65$ 24.33$ 26.30$ 26.98$ Tangible book value per common share (non-GAAP) 11.98$ 12.34$ 14.18$ 15.89$ 16.07$ Stock Price as of September 30, 2020 15.86$ Price / Book Value per Share 0.59 x Price / Tangible Book Value per Share (non-GAAP) 0.99 x

56 Non - GAAP Reconciliations Q2 Q3 Q4 Q1 Q2 Q3 $ in thousands 2019 2019 2019 2020 2020 2020 Calculation of Core Loan Yield Loan interest income (FTE) 178,122$ 179,971$ 193,402$ 187,566$ 177,168$ 163,379$ Total accretable yield (10,162) (9,322) (15,100) (11,837) (11,723) (8,948) Core loan interest income (non-GAAP) 167,960 170,649 178,302 175,729 165,445 154,431 PPP loan interest income (3,733) (5,762) Core loan interest income without PPP loans (non-GAAP) 161,712 148,669 Average loan balance 12,814,386 13,053,540 14,144,703 14,548,853 14,731,306 14,315,014 Average PPP loan balance (non-GAAP) (645,172) (967,152) Core loan interest income without PPP loans (non-GAAP) 14,086,134 13,347,862 Core loan yield (non-GAAP) 5.26% 5.19% 5.00% 4.86% 4.52% 4.29% Core loan yield without PPP loans (non-GAAP) 4.62% 4.43% Calculation of Loan Yield Adjusted for PPP Loans Loan interest income (FTE) 163,379$ PPP loan interest income (5,782) Loan interest income without PPP loans 157,597$ Average loan balance 14,315,014$ Average PPP loan balance (967,152) Average loan balance without PPP loans 13,347,862$ Loan yield 4.54% Loan yield without PPP loans 4.70% Calculation of Loans to Deposits without PPP Loans Loans 14,017,442$ PPP loans (970,488) Loans less PPP Loans 13,046,954$ Deposits 16,246,647$ Loans to Deposits 86.28% Loans without PPP Loans to Deposits 80.31%

Non - GAAP Reconciliations 57 Q3 Q4 Q1 Q2 Q3 $ in thousands 2019 2019 2020 2020 2020 Calculation of Tangible Common Equity to Tangible Assets Total stockholders' equity 2,547,071$ 2,988,924$ 2,845,400$ 2,904,703$ 2,942,241$ Preferred stock - (767) (767) (767) (767) Total common stockholders' equity 2,547,071 2,988,157 2,844,633 2,903,936 2,941,474 Intangible assets: Goodwill (926,648) (1,055,520) (1,064,978) (1,064,765) (1,075,305) Other intangible assets (101,149) (127,340) (121,673) (117,823) (114,460) Total intangibles (1,027,797) (1,182,860) (1,186,651) (1,182,588) (1,189,765) Tangible common stockholders' equity (non-GAAP) 1,519,274$ 1,805,297$ 1,657,982$ 1,721,348$ 1,751,709$ Total assets 17,758,511 21,259,143 20,841,352 21,903,684 21,437,395 Intangible assets: Goodwill (926,648) (1,055,520) (1,064,978) (1,064,765) (1,075,305) Other intangible assets (101,149) (127,340) (121,673) (117,823) (114,460) Total intangibles (1,027,797) (1,182,860) (1,186,651) (1,182,588) (1,189,765) Tangible assets (non-GAAP) 16,730,714$ 20,076,283$ 19,654,701$ 20,721,096$ 20,247,630$ Paycheck protection program ("PPP") loans (963,712) (970,488) Total assets less PPP loans (non-GAAP) 20,939,972$ 20,466,907$ Tangible assets less PPP loans (non-GAAP) 19,757,384$ 19,277,142$ Ratio of equity to assets 14.34% 14.06% 13.65% 13.26% 13.72% Ratio of equity to assets less PPP loans (non-GAAP) 13.87% 14.38% Ratio of tangible common equity to tangible assets (non-GAAP) 9.08% 8.99% 8.44% 8.31% 8.65% Ratio of tangible common equity to tangible assets less PPP loans (non-GAAP) 8.71% 9.09%

Non - GAAP Reconciliations 58 Q3 $ in thousands 2020 Calculation of ACL / Loans (exluding PPP Loans) Total loans 14,017,442$ Allowance for credit losses on loans 248,251 ACL / Loans 1.77% Total loans 14,017,442$ PPP Loans 970,488 Total loans, excluding PPP Loans (non-GAAP) 13,046,954 Allowance for credit losses on loans 248,251 ACL / Loans (excluding PPP Loans) (non-GAAP) 1.90%

Non - GAAP Reconciliations 59 Q3 $ in thousands 2020 Calculation of Regulatory Tier 1 Leverage Ratio Less Average PPP Loans Total Tier 1 capital 1,868,173$ Adjusted average assets for leverage ratio 20,652,454$ Average PPP loans (967,152) Adjusted average assets less average PPP loans (non-GAAP) 19,685,302$ Tier 1 leverage ratio 9.05% Tier 1 leverage ratio less average PPP loans (non-GAAP) 9.49%

Serious News for Serious Traders! Try StreetInsider.com Premium Free!
You May Also Be Interested In
- Simmons First National (SFNC) PT Lowered to $21 at Stephens
- International Horticultural Exhibition 2024 Chengdu Opens
- GLOBAL CORD ALERT: Bragar Eagel & Squire, P.C. Announces that a Class Action Lawsuit Has Been Filed Against Global Cord Blood Corporation and Encourages Investors to Contact the Firm
Create E-mail Alert Related Categories
SEC FilingsSign up for StreetInsider Free!
Receive full access to all new and archived articles, unlimited portfolio tracking, e-mail alerts, custom newswires and RSS feeds - and more!
