

Form 8-K RITE AID CORP For: Apr 15
 Tweet
Tweet Share
Share
Exhibit 99.1
Press Release: For Immediate Release
| INVESTORS: | MEDIA: |
| Trent Kruse | Christopher Savarese |
| (717) 975-3710 | (717) 975-5718 |
| [email protected] | [email protected] |
Rite Aid Corporation Reports Fiscal 2021 Fourth Quarter and Full Year Results
| · | Fourth Quarter Net Loss from Continuing Operations of $18.5 Million or $0.34 Per Share, Compared to the Prior Year Fourth Quarter Net Loss of $343.5 Million or $6.43 Per Share |
| · | Fourth Quarter Adjusted EBITDA from Continuing Operations of $41.3 Million, Compared to the Prior Year Adjusted EBITDA of $135.6 Million |
| · | Completed Acquisition of Bartell Drugs |
| · | Company Provides First Quarter Fiscal 2022 Outlook |
| · | Over 2 Million COVID-19 Vaccines Administered in March and April to Date |
CAMP HILL, Pa. (April 15, 2021) - Rite Aid Corporation (NYSE: RAD) today reported operating results for its fourth quarter and fiscal year ended February 27, 2021.
For the fourth quarter, the company reported net loss from continuing operations of $18.5 million, or $0.34 loss per share, Adjusted net loss from continuing operations of $41.8 million, or $0.78 loss per share, and Adjusted EBITDA from continuing operations of $41.3 million, or 0.7 percent of revenues.
“We remain very optimistic about the direction of Rite Aid, despite a fourth quarter that was impacted by a historically soft cough, cold and flu season, the deferral of elective procedures and related acute prescription volume and the impact of COVID-19 on selling, general and administrative expenses,” said Heyward Donigan, president and chief executive officer, Rite Aid. “This past year, we made significant progress in bringing our RxEvolution strategy to life. We redefined the role of the pharmacist, rebranded both our retail pharmacy business and Elixir, completed the strategic acquisition of Bartell’s and moved quickly to deliver solutions to meet customer needs for COVID-19 testing and vaccine administration.”
“As we look ahead, our teams are continuing their heroic efforts to serve our communities and customers during this critical time. I am pleased to announce that we have administered over 2 million COVID-19 vaccines so far in the first quarter. We are also seeing prescription count trends, both acute and maintenance, return to positive levels. At Elixir, we are experiencing growth in our sales pipeline, and have recently been awarded over 200,000 new lives and over 6 million annualized scripts, with additional decisions pending in the current sales cycle. I am so proud of our 50,000 associates and the strategic progress we’re making in our journey to revitalize our brand and elevate the crucial role that pharmacy plays in the health of our customers.”
-More-
Rite Aid FY 2021 Q4 Press Release - page 2
Consolidated Fourth Quarter and Full Year Summary
| (dollars in thousands) | Thirteen Week Period Ended | Fifty-two Week Period Ended | ||||||||||||||
| February 27, 2021 | February 29, 2020 | February 27, 2021 | February 29, 2020 | |||||||||||||
| Revenues from continuing operations | $ | 5,916,856 | $ | 5,727,242 | $ | 24,043,240 | $ | 21,928,393 | ||||||||
| Net loss from continuing operations | (18,495 | ) | (343,461 | ) | (100,070 | ) | (469,219 | ) | ||||||||
| Adjusted EBITDA from continuing operations | 41,265 | 135,584 | 437,665 | 538,211 | ||||||||||||
Revenues from continuing operations increased 3.3 percent and 9.6 percent for the thirteen and fifty-two week periods ended February 27, 2021, respectively, compared to the prior year driven by growth at both the Retail Pharmacy and Pharmacy Services segments.
Fourth quarter net loss from continuing operations was $18.5 million, or $0.34 loss per share, compared to last year’s fourth quarter net loss from continuing operations of $343.5 million, or $6.43 loss per share. Income tax expense in the prior year’s fourth quarter was impacted by a $320.6 million charge to increase the valuation allowance against the company’s deferred tax asset. Other items impacting net loss from continuing operations in the current year’s fourth quarter included a decrease in Adjusted EBITDA and a lower LIFO credit, partially offset by a gain on the acquisition of Bartell Drugs and a gain on sale of assets resulting from the sale leasebacks of the company’s Lancaster, CA and Woodland, CA distribution centers.
Net loss from continuing operations for the fiscal year ended February 27, 2021 was $100.1 million, or $1.87 loss per share, compared to last year’s net loss of $469.2 million, or $8.82 loss per share. The reduction in net loss is due to lower income tax expense, a gain on sale of assets compared to a loss on sale of assets in the prior year, and a gain on the acquisition of Bartell Drugs. These items were partially offset by a decrease in Adjusted EBITDA, a lower gain on debt modifications and retirements, higher intangible asset impairment charges, and a lower LIFO credit.
Fourth quarter Adjusted EBITDA from continuing operations was $41.3 million, or 0.7 percent of revenues, compared to last year’s fourth quarter Adjusted EBITDA of $135.6 million, or 2.4 percent of revenues. The decline in Adjusted EBITDA is due to a decrease in gross profit resulting from lower front-end same store sales, weather disruptions that impacted the supply chain and reimbursement rate pressure and an increase in selling, general and administrative (SG&A) expenses due to incremental costs associated with the COVID-19 pandemic.
Adjusted EBITDA from continuing operations for the fiscal year ended February 27, 2021 was $437.7 million, or 1.8 percent of revenues, compared to last year’s Adjusted EBITDA of $538.2 million, or 2.5 percent of revenues. The decline in Adjusted EBITDA is due to a decrease in gross profit resulting from declines in acute scripts related to the pandemic, reimbursement rate pressure and an increase in SG&A expenses due to the impact of the COVID-19 pandemic and the completion of services provided under the Transition Services Agreement with Walgreens.
Retail Pharmacy Segment
| (dollars in thousands) | Thirteen Week Period Ended | Fifty-two Week Period Ended | ||||||||||||||
| February 27, 2021 | February 29, 2020 | February 27, 2021 | February 29, 2020 | |||||||||||||
| Revenues from continuing operations | $ | 4,114,485 | $ | 3,993,328 | $ | 16,365,260 | $ | 15,616,186 | ||||||||
| Adjusted EBITDA from continuing operations | 6,017 | 85,175 | 279,896 | 370,435 | ||||||||||||
-More-
Rite Aid FY 2021 Q4 Press Release - page 3
Retail Pharmacy Segment revenues from continuing operations increased 3.0 percent over the prior year quarter due primarily to the acquisition of Bartell Drugs. Same store sales from continuing operations for the fourth quarter decreased 0.3 percent over the prior year period, consisting of a 5.6 percent decrease in front-end sales and a 2.0 percent increase in pharmacy sales. Front-end same store sales, excluding cigarettes and tobacco products, decreased 5.0 percent. The decline in front-end same store sales was driven by a decline of nearly 37 percent in cough, cold and flu related categories. Difficult weather conditions also had a negative impact on same store sales for the quarter. The number of prescriptions filled in same stores, adjusted to 30-day equivalents, decreased 0.9 percent over the prior year period driven by an over 14 percent decline in acute prescriptions, partially offset by increases in maintenance prescriptions, as well as the administration of the company’s first allocations of the COVID-19 vaccine. The company increased its front-end market share in both dollars and in unit sales1.
For the fiscal year ended February 27, 2021, Retail Pharmacy Segment revenues from continuing operations increased 4.8 percent over the prior year. Same store sales from continuing operations for the year increased 3.5 percent over the prior year, consisting of a 3.2 percent increase in pharmacy sales and a 3.1 percent increase in front-end sales. Front-end same store sales, excluding cigarettes and tobacco products, increased 4.2 percent. Front-end sales benefited from increases in immunity, first aid and paper products, offset by decreases in over-the-counter products related to cough, cold and flu. The number of prescriptions filled in same stores, adjusted to 30-day equivalents, increased 1.3 percent over the prior year driven by increases in maintenance prescriptions, supported by personalized Medication Therapy Management interventions and home deliveries, partially offset by a pandemic influenced reduction in acute prescriptions of 9.0 percent. Prescription sales from continuing operations accounted for 66.7 percent of total drugstore sales.
Retail Pharmacy Segment Adjusted EBITDA from continuing operations was $6.0 million, or 0.2 percent of revenues, for the fourth quarter compared to last year’s fourth quarter Adjusted EBITDA from continuing operations of $85.2 million, or 2.1 percent of revenues. The decline in Adjusted EBITDA is largely due to a soft cough, cold and flu season, ongoing impacts related to COVID-19 and challenging weather conditions. The Company estimates the following impacts on fourth quarter adjusted EBITDA:
| · | $20 million to $24 million from lower incidence in cough, cold and flu related illnesses; |
| · | $20 million to $24 million due to difficult weather conditions; and |
| · | $10 million to $12 million related to continued effects of COVID-19. |
The total unanticipated impact on the quarter results was approximately $50 million to $60 million.
For the fiscal year ended February 27, 2021, Retail Pharmacy Segment Adjusted EBITDA from continuing operations was $279.9 million, or 1.7 percent of revenues, compared to $370.4 million, or 2.4 percent of revenues, for the prior year. The decline in Adjusted EBITDA is due to a decrease in gross profit resulting from declines in acute scripts resulting from the pandemic and reimbursement rate pressure and an increase in SG&A expenses due to the impact of the COVID-19 pandemic and the completion of services provided under the Transition Services Agreement with Walgreens.
Pharmacy Services Segment
| (dollars in thousands) | Thirteen Week Period Ended | Fifty-two Week Period Ended | ||||||||||||||
| February 27, 2021 | February 29, 2020 | February 27, 2021 | February 29, 2020 | |||||||||||||
| Revenues from continuing operations | $ | 1,870,111 | $ | 1,801,090 | $ | 7,970,137 | $ | 6,559,560 | ||||||||
| Adjusted EBITDA from continuing operations | 35,248 | 50,409 | 157,769 | 167,776 | ||||||||||||
Pharmacy Services Segment revenues were $1.9 billion for the quarter, an increase of 3.8 percent compared to the prior year quarter. The increase in revenues was primarily the result of higher claims revenue due to changes in member mix and benefit packages and Medicare Part D revenue with the new calendar year.
For the fiscal year ended February 27, 2021, Pharmacy Services Segment revenues were $8.0 billion, an increase of 21.5 percent compared to the prior year. The increase in revenues was primarily the result of an increase in Medicare Part D membership.
1 – Source: IRI. Excludes tobacco, cigarettes, greeting cards and online sales. For drug store channel during Rite Aid’s fourth fiscal quarter.
-More-
Rite Aid FY 2021 Q4 Press Release - page 4
Pharmacy Services Segment Adjusted EBITDA from continuing operations was $35.2 million, or 1.9 percent of revenues, for the fourth quarter compared to last year’s fourth quarter Adjusted EBITDA from continuing operations of $50.4 million, or 2.8 percent of revenues. The decline in Adjusted EBITDA is due to a decrease in gross profit associated with contract renewals on our small group business. Going forward, the company expects margins to stabilize across the book of business along with membership growth in target segments.
For the fiscal year ended February 27, 2021, Pharmacy Services Segment Adjusted EBITDA from continuing operations was $157.8 million, or 2.0 percent of revenues, compared to $167.8 million, or 2.6 percent of revenues, for the prior year. The decline in Adjusted EBITDA is due to increased drug costs within Medicare Part D, a decrease in gross profit within the segment’s small group business and SG&A spend related to an increase in Medicare Part D members.
Outlook for First Quarter 2022
The pandemic will continue to have an impact on several factors in Fiscal 2022. Those factors include the number of individuals that receive a COVID-19 vaccine, demand for COVID-19 testing, the timing and extent to which elective procedures increase to pre-pandemic levels, the demand for flu and other immunizations and the length and severity of this year’s cough cold and flu season. As a result, the company is currently only providing guidance for its first quarter of fiscal 2022.
The company’s results for the first quarter of fiscal 2022 will be significantly impacted by the number of COVID-19 vaccinations administered during the quarter, and the related benefit to revenues and gross profit, partially offset by incremental costs to administer these vaccines. Also included in our guidance assumptions are a meaningful reduction in front-end sales compared to last year’s pandemic driven surge and continued deferral of elective procedures and the related impact on acute scripts. The company also expects continued reimbursement rate pressure at retail, and a return of Elixir EBITDA to recent run rate levels due to good network management and expense control initiatives.
Total revenues are projected to be between $6.1 billion and $6.3 billion in the first quarter with Retail Pharmacy Segment same store sales expected to range from a decrease of 9.0 percent to a decrease of 7.0 percent compared to fiscal 2021.
Net income/loss is projected to be between a loss of $10 million and income of $10 million.
Adjusted EBITDA is projected to be between $115 million and $140 million.
Conference Call Broadcast
Rite Aid will hold an analyst call at 8:30 a.m. Eastern Time today with remarks by Rite Aid's management team. The call will be broadcast via the Internet at https://www.riteaid.com/corporate/investor-relations/presentations. The telephone replay will be available beginning at 12:30 p.m. Eastern Time on Thursday, April 15, 2021 and ending at 11:59 p.m. Eastern Time on May 5, 2021. To access the replay of the call, telephone (800) 585-8367 or (416) 621-4642 and enter the seven-digit reservation number 2368577. The webcast replay of the call will also be available at https://www.riteaid.com/corporate/investor-relations/presentations starting at 12 p.m. Eastern Time today. The playback will be available until the company’s next conference call.
About Rite Aid Corporation
Rite Aid Corporation is on the front lines of delivering healthcare services and retail products to Americans 365 days a year. Our pharmacists are uniquely positioned to engage with customers and improve their health outcomes. We provide an array of whole being health products and services for the entire family through over 2,500 retail pharmacy locations across 17 states. Through Elixir, we provide pharmacy benefits and services to millions of members nationwide. For more information, www.riteaid.com.
-More-
Rite Aid FY 2021 Q4 Press Release - page 5
Cautionary Statement Regarding Forward-Looking Statements
Statements in this release that are not historical, are forward-looking statements made pursuant to the safe harbor provisions of the Private Securities Litigation Reform Act of 1995. Such statements include, but are not limited to, statements regarding Rite Aid's outlook and guidance for fiscal 2022 including under the heading “Outlook for First Quarter 2022”, the ability to generate positive free cash flows in fiscal 2022; the impact of the global coronavirus (COVID-19) pandemic on Rite Aid’s business; the ability to accelerate key initiatives and improve the operating performance of our stores; and any assumptions underlying any of the foregoing. Words such as "anticipate," "believe," "continue," "could," "estimate," "expect," "intend," "may," "plan," "predict," "project," "should," and "will" and variations of such words and similar expressions are intended to identify such forward-looking statements.
These forward-looking statements are not guarantees of future performance and involve risks, assumptions and uncertainties, including, but not limited to: risks related to the impact of the COVID-19 global pandemic, such as the scope and duration of the outbreak, government actions and restrictive measures implemented in response, and other impacts to the business, or on the Company’s ability to execute business continuity plans, as a result of the COVID-19 pandemic; the impact of COVID-19 on our workforce, operations, stores, expenses, and supply chain, and the operations or behaviors of our customers, suppliers and business partners; our ability to successfully implement our RxEvolution and other strategies; the impact of our high level of indebtedness, the ability to refinance such indebtedness on acceptable terms and our ability to satisfy our obligations and the other covenants contained in our debt agreements; outcome of pending or new litigation including related to Opioids, “usual and customary” pricing or other matters; our ability to monetize the CMS receivable created in our Part D business; general competitive, economic, industry, market, political (including healthcare reform) and regulatory conditions (including changes to laws or regulations relating to labor or wages), civil unrest (including any resulting store closures, damage, or loss of inventory), as well as other factors that impact the markets in which we operate; the impact of private and public third-party payers continued reduction in prescription drug reimbursements and efforts to encourage mail order; our ability to manage expenses and our investments in working capital; our ability to achieve the benefits of our efforts to reduce the costs of our generic and other drugs; our ability to achieve cost savings and other benefits of our organizational restructuring within our anticipated timeframe, if at all; the outcome of our continuing efforts to monitor and comply with applicable laws, regulations, policies and procedures; and our ability to partner and have relationships with health plans and health systems.
These and other risks, assumptions and uncertainties are more fully described in Item 1A (Risk Factors) of our most recent Annual Report on Form 10-K, in Item 1A (Risk Factors) of our Quarterly Report on Form 10-Q filed on July 2, 2020 and in other documents that we file or furnish with the Securities and Exchange Commission (the “SEC”), which you are encouraged to read. To the extent that COVID-19 adversely affects our business and financial results, it may also have the effect of heightening many of such risk factors.
Should one or more of these risks or uncertainties materialize, or should underlying assumptions prove incorrect, actual results may vary materially from those indicated or anticipated by such forward-looking statements. Accordingly, you are cautioned not to rely on these forward-looking statements, which speak only as of the date they are made.
The degree to which COVID-19 may adversely affect Rite Aid’s results and operations, including its ability to achieve its outlook for the first fiscal quarter of 2022 or fiscal 2022 guidance, will depend on numerous evolving factors and future developments, which are highly uncertain, including, but not limited to, the duration and spread of the COVID-19 outbreak, its severity, the actions to contain the virus or treat its impact (such as travel bans and restrictions, quarantines, shelter- in-place orders and shutdowns), including the reinstitution of more stringent regulations (including mandatory stay at home orders, the availability and rollout of vaccines to treat the virus), and how quickly and to what extent normal economic and operating conditions can resume. As a result, the impact on Rite Aid’s financial and operating results cannot be reasonably estimated with specificity at this time, but the impact could be material. Rite Aid expressly disclaims any current intention, and assumes no duty, to update publicly any forward-looking statement after the distribution of this release, whether as a result of new information, future events, changes in assumptions or otherwise.
All references to “Company” and “Rite Aid” as used throughout this release refer to Rite Aid Corporation and its affiliates.
-More-
Rite Aid FY 2021 Q4 Press Release - page 6
Reconciliation of Non-GAAP Financial Measures
Rite Aid separately reports financial results on the basis of Adjusted Net Income (Loss), Adjusted Net Income (Loss) per Diluted Share and Adjusted EBITDA which are non-GAAP financial measures. See the attached tables for a reconciliation of Adjusted Net Income (Loss), Adjusted Net Income (Loss) per Diluted Share and Adjusted EBITDA to net income (loss), and net income (loss) per diluted share, which are the most directly comparable GAAP financial measures. Adjusted Net Income (Loss) and Adjusted Net Income (Loss) per Diluted Share exclude amortization expense, merger and acquisition-related costs, non-recurring litigation settlement, gains or losses on debt modifications and retirements, LIFO adjustments, goodwill and intangible asset impairment charges, restructuring-related costs, gain on Bartell acquisition, and the WBA merger termination fee.
Adjusted EBITDA is defined as net income (loss) excluding the impact of income taxes, interest expense, depreciation and amortization, LIFO adjustments, charges or credits for facility closing and impairment, goodwill and intangible asset impairment charges, inventory write-downs related to store closings, gains or losses on debt modifications and retirements, the WBA merger termination fee, and other items (including stock-based compensation expense, merger and acquisition-related costs, non-recurring litigation settlement, severance, restructuring-related costs and costs related to facility closures, gain or loss on sale of assets, and gain on Bartell acquisition). The add back of LIFO (credit) charge when calculating Adjusted EBITDA, Adjusted Net Income (Loss) and Adjusted Net Income (Loss) per Diluted Share removes the entire impact of LIFO (credits) charges, and effectively reflects Rite Aid's results as if the company was on a FIFO inventory basis.
###
RITE AID CORPORATION AND SUBSIDIARIES
CONSOLIDATED BALANCE SHEETS
(Dollars in thousands)
(unaudited)
| February 27, 2021 | February 29, 2020 | |||||||
| ASSETS | ||||||||
| Current assets: | ||||||||
| Cash and cash equivalents | $ | 160,902 | $ | 218,180 | ||||
| Accounts receivable, net | 1,462,441 | 1,286,785 | ||||||
| Inventories, net of LIFO reserve of $485,859 and $539,640 | 1,864,890 | 1,921,604 | ||||||
| Prepaid expenses and other current assets | 106,941 | 181,794 | ||||||
| Current assets held for sale | - | 92,278 | ||||||
| Total current assets | 3,595,174 | 3,700,641 | ||||||
| Property, plant and equipment, net | 1,080,499 | 1,215,838 | ||||||
| Operating lease right-of-use assets | 3,064,077 | 2,903,256 | ||||||
| Goodwill | 1,108,136 | 1,108,136 | ||||||
| Other intangibles, net | 340,519 | 359,491 | ||||||
| Deferred tax assets | 14,964 | 16,680 | ||||||
| Other assets | 132,035 | 148,327 | ||||||
| Total assets | $ | 9,335,404 | $ | 9,452,369 | ||||
| LIABILITIES AND STOCKHOLDERS' EQUITY | ||||||||
| Current liabilities: | ||||||||
| Current maturities of long-term debt and lease financing obligations | $ | 6,409 | $ | 8,840 | ||||
| Accounts payable | 1,437,421 | 1,484,081 | ||||||
| Accrued salaries, wages and other current liabilities | 642,364 | 746,318 | ||||||
| Current portion of operating lease liabilities | 516,752 | 490,161 | ||||||
| Current liabilities held for sale | - | 37,063 | ||||||
| Total current liabilities | 2,602,946 | 2,766,463 | ||||||
| Long-term debt, less current maturities | 3,063,087 | 3,077,268 | ||||||
| Long-term operating lease liabilities | 2,829,293 | 2,710,347 | ||||||
| Lease financing obligations, less current maturities | 16,711 | 19,326 | ||||||
| Other noncurrent liabilities | 208,213 | 204,438 | ||||||
| Total liabilities | 8,720,250 | 8,777,842 | ||||||
| Commitments and contingencies | - | - | ||||||
| Stockholders' equity: | ||||||||
| Common stock | 55,143 | 54,716 | ||||||
| Additional paid-in capital | 5,897,168 | 5,890,903 | ||||||
| Accumulated deficit | (5,313,103 | ) | (5,222,194 | ) | ||||
| Accumulated other comprehensive loss | (24,054 | ) | (48,898 | ) | ||||
| Total stockholders' equity | 615,154 | 674,527 | ||||||
| Total liabilities and stockholders' equity | $ | 9,335,404 | $ | 9,452,369 | ||||
RITE AID CORPORATION AND SUBSIDIARIES
CONSOLIDATED STATEMENTS OF OPERATIONS
(Dollars in thousands, except per share amounts)
(unaudited)
| Thirteen weeks ended February 27, 2021 | Thirteen weeks ended February 29, 2020 | |||||||
| Revenues | $ | 5,916,856 | $ | 5,727,242 | ||||
| Costs and expenses: | ||||||||
| Cost of revenues | 4,774,297 | 4,460,621 | ||||||
| Selling, general and administrative expenses | 1,187,541 | 1,154,300 | ||||||
| Lease termination and impairment charges | 35,669 | 40,728 | ||||||
| Interest expense | 49,999 | 53,429 | ||||||
| (Gain) loss on sale of assets, net | (51,827 | ) | 9,896 | |||||
| Gain on Bartell acquisition | (47,705 | ) | - | |||||
| 5,947,974 | 5,718,974 | |||||||
| (Loss) income from continuing operations before income taxes | (31,118 | ) | 8,268 | |||||
| Income tax (benefit) expense | (12,623 | ) | 351,729 | |||||
| Net loss from continuing operations | (18,495 | ) | (343,461 | ) | ||||
| Net income from discontinued operations, net of tax | - | 18,740 | ||||||
| Net loss | $ | (18,495 | ) | $ | (324,721 | ) | ||
| Basic and diluted loss per share: | ||||||||
| Numerator for loss per share: | ||||||||
| Net loss from continuing operations attributable to common stockholders - basic and diluted | $ | (18,495 | ) | $ | (343,461 | ) | ||
| Net income from discontinued operations attributable to common stockholders - basic and diluted | - | 18,740 | ||||||
| Loss attributable to common stockholders - basic and diluted | $ | (18,495 | ) | $ | (324,721 | ) | ||
| Denominator: | ||||||||
| Basic and diluted weighted average shares | 53,812 | 53,434 | ||||||
| Basic and diluted loss per share | ||||||||
| Continuing operations | $ | (0.34 | ) | $ | (6.43 | ) | ||
| Discontinued operations | $ | - | $ | 0.35 | ||||
| Net basic and diluted loss per share | $ | (0.34 | ) | $ | (6.08 | ) | ||
RITE AID CORPORATION AND SUBSIDIARIES
CONSOLIDATED STATEMENTS OF OPERATIONS
(Dollars in thousands, except per share amounts)
(unaudited)
| Fifty-two
weeks ended February 27, 2021 | Fifty-two
weeks ended February 29, 2020 | |||||||
| Revenues | $ | 24,043,240 | $ | 21,928,393 | ||||
| Costs and expenses: | ||||||||
| Cost of revenues | 19,338,918 | 17,201,635 | ||||||
| Selling, general and administrative expenses | 4,657,185 | 4,587,336 | ||||||
| Lease termination and impairment charges | 58,403 | 42,843 | ||||||
| Intangible asset impairment charges | 29,852 | - | ||||||
| Interest expense | 201,388 | 229,657 | ||||||
| Gain on debt modifications and retirements, net | (5,274 | ) | (55,692 | ) | ||||
| (Gain) loss on sale of assets, net | (69,300 | ) | 4,226 | |||||
| Gain on Bartell acquisition | (47,705 | ) | - | |||||
| 24,163,467 | 22,010,005 | |||||||
| Loss from continuing operations before income taxes | (120,227 | ) | (81,612 | ) | ||||
| Income tax (benefit) expense | (20,157 | ) | 387,607 | |||||
| Net loss from continuing operations | (100,070 | ) | (469,219 | ) | ||||
| Net income from discontinued operations, net of tax | 9,161 | 17,045 | ||||||
| Net loss | $ | (90,909 | ) | $ | (452,174 | ) | ||
| Basic and diluted loss per share: | ||||||||
| Numerator for loss per share: | ||||||||
| Net loss from continuing operations attributable to common stockholders - basic and diluted | $ | (100,070 | ) | $ | (469,219 | ) | ||
| Net income from discontinued operations attributable to common stockholders - basic and diluted | 9,161 | 17,045 | ||||||
| Loss attributable to common stockholders - basic and diluted | $ | (90,909 | ) | $ | (452,174 | ) | ||
| Denominator: | ||||||||
| Basic and diluted weighted average shares | 53,653 | 53,228 | ||||||
| Basic and diluted loss per share | ||||||||
| Continuing operations | $ | (1.87 | ) | $ | (8.82 | ) | ||
| Discontinued operations | $ | 0.18 | $ | 0.32 | ||||
| Net basic and diluted loss per share | $ | (1.69 | ) | $ | (8.50 | ) | ||
RITE AID CORPORATION AND SUBSIDIARIES
CONSOLIDATED STATEMENTS OF CASH FLOWS
(Dollars in thousands)
(unaudited)
| Thirteen weeks ended February 27, 2021 | Thirteen weeks ended February 29, 2020 | |||||||
| OPERATING ACTIVITIES: | ||||||||
| Net loss | $ | (18,495 | ) | $ | (324,721 | ) | ||
| Net income from discontinued operations, net of tax | - | 18,740 | ||||||
| Net loss from continuing operations | $ | (18,495 | ) | $ | (343,461 | ) | ||
| Adjustments to reconcile to net cash provided by operating activities of continuing operations: | ||||||||
| Depreciation and amortization | 77,568 | 79,300 | ||||||
| Lease termination and impairment charges | 35,669 | 40,728 | ||||||
| LIFO credit | (21,389 | ) | (72,357 | ) | ||||
| (Gain) loss on sale of assets, net | (51,827 | ) | 9,896 | |||||
| Gain on Bartell acquisition | (47,705 | ) | - | |||||
| Stock-based compensation expense | 4,326 | 2,489 | ||||||
| Changes in deferred taxes | (10,633 | ) | 358,925 | |||||
| Changes in operating assets and liabilities: | ||||||||
| Accounts receivable | 325,374 | 387,065 | ||||||
| Inventories | 196,795 | 107,798 | ||||||
| Accounts payable | (36,832 | ) | (53,817 | ) | ||||
| Operating lease right-of-use assets and operating lease liabilities | (2,725 | ) | (8,691 | ) | ||||
| Other assets | 5,710 | 4,364 | ||||||
| Other liabilities | (96,814 | ) | (95,057 | ) | ||||
| Net cash provided by operating activities of continuing operations | 359,022 | 417,182 | ||||||
| INVESTING ACTIVITIES: | ||||||||
| Payments for property, plant and equipment | (67,752 | ) | (42,570 | ) | ||||
| Intangible assets acquired | (1,097 | ) | (9,246 | ) | ||||
| Acquisition of business, net of cash acquired | (86,230 | ) | - | |||||
| Proceeds from dispositions of assets and investments | 2,358 | 3,687 | ||||||
| Proceeds from sale-leaseback transactions | 88,880 | 4,879 | ||||||
| Net cash used in investing activities of continuing operations | (63,841 | ) | (43,250 | ) | ||||
| FINANCING ACTIVITIES: | ||||||||
| Proceeds from issuance of long-term debt | - | 600,000 | ||||||
| Net payments to revolver | (141,000 | ) | (485,000 | ) | ||||
| Principal payments on long-term debt | (1,161 | ) | (601,401 | ) | ||||
| Change in zero balance cash accounts | (42,008 | ) | 24,420 | |||||
| Net proceeds from the issuance of common stock | 53 | - | ||||||
| Payments for taxes related to net share settlement of equity awards | (921 | ) | (348 | ) | ||||
| Deferred financing costs paid | (55 | ) | (5,466 | ) | ||||
| Net cash used in financing activities of continuing operations | (185,092 | ) | (467,795 | ) | ||||
| Cash flows from discontinued operations: | ||||||||
| Operating activities of discontinued operations | - | (16,688 | ) | |||||
| Investing activities of discontinued operations | - | 39,233 | ||||||
| Net cash provided by discontinued operations | - | 22,545 | ||||||
| Increase (decrease) in cash and cash equivalents | 110,089 | (71,318 | ) | |||||
| Cash and cash equivalents, beginning of period | 50,813 | 289,498 | ||||||
| Cash and cash equivalents, end of period | $ | 160,902 | $ | 218,180 | ||||
RITE AID CORPORATION AND SUBSIDIARIES
CONSOLIDATED STATEMENTS OF CASH FLOWS
(Dollars in thousands)
(unaudited)
| Fifty-two weeks
ended February 27, 2021 | Fifty-two weeks
ended February 29, 2020 | |||||||
| OPERATING ACTIVITIES: | ||||||||
| Net loss | $ | (90,909 | ) | $ | (452,174 | ) | ||
| Net income from discontinued operations, net of tax | 9,161 | 17,045 | ||||||
| Net loss from continuing operations | $ | (100,070 | ) | $ | (469,219 | ) | ||
| Adjustments to reconcile to net cash provided by operating activities of continuing operations: | ||||||||
| Depreciation and amortization | 327,124 | 328,277 | ||||||
| Lease termination and impairment charges | 58,403 | 42,843 | ||||||
| Intangible asset impairment charges | 29,852 | - | ||||||
| LIFO credit | (51,692 | ) | (64,804 | ) | ||||
| (Gain) loss on sale of assets, net | (69,300 | ) | 4,226 | |||||
| Gain on Bartell acquisition | (47,705 | ) | - | |||||
| Stock-based compensation expense | 13,003 | 16,087 | ||||||
| Gain on debt modifications and retirements, net | (5,274 | ) | (55,692 | ) | ||||
| Changes in deferred taxes | (10,633 | ) | 385,904 | |||||
| Changes in operating assets and liabilities: | ||||||||
| Accounts receivable | (182,404 | ) | 486,563 | |||||
| Inventories | 177,263 | 15,141 | ||||||
| Accounts payable | (35,372 | ) | (92,062 | ) | ||||
| Operating lease right-of-use assets and operating lease liabilities | (28,044 | ) | 14,112 | |||||
| Other assets | 80,975 | (38,351 | ) | |||||
| Other liabilities | (50,947 | ) | (62,168 | ) | ||||
| Net cash provided by operating activities of continuing operations | 105,179 | 510,857 | ||||||
| INVESTING ACTIVITIES: | ||||||||
| Payments for property, plant and equipment | (195,141 | ) | (171,705 | ) | ||||
| Intangible assets acquired | (29,800 | ) | (42,681 | ) | ||||
| Acquisition of business, net of cash acquired | (86,230 | ) | - | |||||
| Proceeds from insured loss | 12,500 | - | ||||||
| Proceeds from dispositions of assets and investments | 11,444 | 59,658 | ||||||
| Proceeds from sale-leaseback transactions | 177,892 | 4,879 | ||||||
| Net cash used in investing activities of continuing operations | (109,335 | ) | (149,849 | ) | ||||
| FINANCING ACTIVITIES: | ||||||||
| Proceeds from issuance of long-term debt | 849,918 | 600,000 | ||||||
| Net proceeds from (payments to) revolver | 200,000 | (225,000 | ) | |||||
| Principal payments on long-term debt | (1,058,537 | ) | (706,103 | ) | ||||
| Change in zero balance cash accounts | (36,463 | ) | 12,671 | |||||
| Net proceeds from the issuance of common stock | 53 | - | ||||||
| Payments for taxes related to net share settlement of equity awards | (3,086 | ) | (1,921 | ) | ||||
| Financing fees paid for early debt redemption | (2,399 | ) | (518 | ) | ||||
| Deferred financing costs paid | (14,729 | ) | (5,781 | ) | ||||
| Net cash used in financing activities of continuing operations | (65,243 | ) | (326,652 | ) | ||||
| Cash flows from discontinued operations: | ||||||||
| Operating activities of discontinued operations | (82,189 | ) | (23,836 | ) | ||||
| Investing activities of discontinued operations | 94,310 | 63,307 | ||||||
| Net cash provided by discontinued operations | 12,121 | 39,471 | ||||||
| (Decrease) increase in cash and cash equivalents | (57,278 | ) | 73,827 | |||||
| Cash and cash equivalents, beginning of period | 218,180 | 144,353 | ||||||
| Cash and cash equivalents, end of period | $ | 160,902 | $ | 218,180 | ||||
RITE AID CORPORATION AND SUBSIDIARIES
SUPPLEMENTAL SEGMENT OPERATING INFORMATION
(Dollars in thousands)
(unaudited)
| Thirteen weeks ended February 27, 2021 |
Thirteen weeks ended February 29, 2020 |
|||||||
| Retail Pharmacy Segment | ||||||||
| Revenues from continuing operations (a) | $ | 4,114,485 | $ | 3,993,328 | ||||
| Cost of revenues from continuing operations (a) | 3,081,851 | 2,852,283 | ||||||
| Gross profit from continuing operations | 1,032,634 | 1,141,045 | ||||||
| LIFO credit from continuing operations | (21,389 | ) | (72,357 | ) | ||||
| FIFO gross profit from continuing operations | 1,011,245 | 1,068,688 | ||||||
| Adjusted EBITDA gross profit from continuing operations | 1,009,004 | 1,070,890 | ||||||
| Gross profit as a percentage of revenues - continuing operations | 25.10 | % | 28.57 | % | ||||
| LIFO credit as a percentage of revenues - continuing operations | -0.52 | % | -1.81 | % | ||||
| FIFO gross profit as a percentage of revenues - continuing operations | 24.58 | % | 26.76 | % | ||||
| Adjusted EBITDA gross profit as a percentage of revenues - continuing operations | 24.52 | % | 26.82 | % | ||||
| Selling, general and administrative expenses from continuing operations | 1,093,074 | 1,060,472 | ||||||
| Adjusted EBITDA selling, general and administrative expenses from continuing operations | 1,002,987 | 985,715 | ||||||
| Selling, general and administrative expenses as a percentage of revenues - continuing operations | 26.57 | % | 26.56 | % | ||||
Adjusted EBITDA selling, general and administrative expenses as a percentage of revenues - continuing operations |
24.38 | % | 24.68 | % | ||||
| Cash interest expense | 46,671 | 49,607 | ||||||
| Non-cash interest expense | 3,328 | 3,822 | ||||||
| Total interest expense | 49,999 | 53,429 | ||||||
| Interest expense - continuing operations | 49,999 | 53,429 | ||||||
| Interest expense - discontinued operations | - | - | ||||||
| Adjusted EBITDA - continuing operations | 6,017 | 85,175 | ||||||
| Adjusted EBITDA as a percentage of revenues - continuing operations | 0.15 | % | 2.13 | % | ||||
| Pharmacy Services Segment | ||||||||
| Revenues (a) | $ | 1,870,111 | $ | 1,801,090 | ||||
| Cost of revenues (a) | 1,760,186 | 1,675,514 | ||||||
| Gross profit | 109,925 | 125,576 | ||||||
| Gross profit as a percentage of revenues | 5.88 | % | 6.97 | % | ||||
| Adjusted EBITDA | 35,248 | 50,409 | ||||||
| Adjusted EBITDA as a percentage of revenues | 1.88 | % | 2.80 | % | ||||
(a) - Revenues and cost of revenues include $67,740 and $67,176 of inter-segment activity for the thirteen weeks ended February 27, 2021 and February 29, 2020, respectively, that is eliminated in consolidation.
| RITE AID CORPORATION AND SUBSIDIARIES | ||||||||
| SUPPLEMENTAL SEGMENT OPERATING INFORMATION | ||||||||
| (Dollars in thousands) | ||||||||
| (unaudited) | ||||||||
| Fifty-two weeks ended February 27, 2021 | Fifty-two weeks ended February 29, 2020 | |||||||
| Retail Pharmacy Segment | ||||||||
| Revenues from continuing operations (a) | $ | 16,365,260 | $ | 15,616,186 | ||||
| Cost of revenues from continuing operations (a) | 12,109,469 | 11,341,350 | ||||||
| Gross profit from continuing operations | 4,255,791 | 4,274,836 | ||||||
| LIFO credit from continuing operations | (51,692 | ) | (64,804 | ) | ||||
| FIFO gross profit from continuing operations | 4,204,099 | 4,210,032 | ||||||
| Adjusted EBITDA gross profit from continuing operations | 4,236,200 | 4,221,933 | ||||||
| Gross profit as a percentage of revenues - continuing operations | 26.01 | % | 27.37 | % | ||||
| LIFO credit as a percentage of revenues - continuing operations | -0.32 | % | -0.41 | % | ||||
| FIFO gross profit as a percentage of revenues - continuing operations | 25.69 | % | 26.96 | % | ||||
| Adjusted EBITDA gross profit as a percentage of revenues - continuing operations | 25.89 | % | 27.04 | % | ||||
| Selling, general and administrative expenses from continuing operations | 4,299,152 | 4,220,851 | ||||||
| Adjusted EBITDA selling, general and administrative expenses from continuing operations | 3,956,304 | 3,851,498 | ||||||
| Selling, general and administrative expenses as a percentage of revenues - continuing operations | 26.27 | % | 27.03 | % | ||||
| Adjusted EBITDA selling, general and administrative expenses as a percentage of revenues - continuing operations | 24.18 | % | 24.66 | % | ||||
| Cash interest expense | 188,306 | 214,589 | ||||||
| Non-cash interest expense | 13,082 | 15,068 | ||||||
| Total interest expense | 201,388 | 229,657 | ||||||
| Interest expense - continuing operations | 201,388 | 229,657 | ||||||
| Interest expense - discontinued operations | - | - | ||||||
| Adjusted EBITDA - continuing operations | 279,896 | 370,435 | ||||||
| Adjusted EBITDA as a percentage of revenues - continuing operations | 1.71 | % | 2.37 | % | ||||
| Pharmacy Services Segment | ||||||||
| Revenues (a) | $ | 7,970,137 | $ | 6,559,560 | ||||
| Cost of revenues (a) | 7,521,606 | 6,107,638 | ||||||
| Gross profit | 448,531 | 451,922 | ||||||
| Gross profit as a percentage of revenues | 5.63 | % | 6.89 | % | ||||
| Adjusted EBITDA | 157,769 | 167,776 | ||||||
| Adjusted EBITDA as a percentage of revenues | 1.98 | % | 2.56 | % | ||||
| (a) - | Revenues and cost of revenues include $292,157 and $247,353 of inter-segment activity for the fifty-two weeks ended February 27, 2021 and February 29, 2020, respectively, that is eliminated in consolidation. |
| RITE AID CORPORATION AND SUBSIDIARIES | ||||||||
| SUPPLEMENTAL INFORMATION | ||||||||
| RECONCILIATION OF NET LOSS TO ADJUSTED EBITDA | ||||||||
| (In thousands) | ||||||||
| (unaudited) | ||||||||
| Thirteen weeks ended February 27, 2021 | Thirteen weeks ended February 29, 2020 | |||||||
| Reconciliation of net loss to adjusted EBITDA: | ||||||||
| Net loss - continuing operations | $ | (18,495 | ) | $ | (343,461 | ) | ||
| Adjustments: | ||||||||
| Interest expense | 49,999 | 53,429 | ||||||
| Income tax (benefit) expense | (12,623 | ) | 351,729 | |||||
| Depreciation and amortization | 77,568 | 79,300 | ||||||
| LIFO credit | (21,389 | ) | (72,357 | ) | ||||
| Lease termination and impairment charges | 35,669 | 40,728 | ||||||
| Merger and Acquisition-related costs | 9,413 | - | ||||||
| Stock-based compensation expense | 4,326 | 2,489 | ||||||
| Restructuring-related costs | 13,456 | 11,872 | ||||||
| Inventory write-downs related to store closings | 1,113 | 569 | ||||||
| (Gain) loss on sale of assets, net | (51,827 | ) | 9,896 | |||||
| Gain on Bartell acquisition | (47,705 | ) | - | |||||
| Other | 1,760 | 1,390 | ||||||
| Adjusted EBITDA - continuing operations | $ | 41,265 | $ | 135,584 | ||||
| Percent of revenues - continuing operations | 0.70 | % | 2.37 | % | ||||
RITE AID CORPORATION AND SUBSIDIARIES
SUPPLEMENTAL INFORMATION
RECONCILIATION OF NET LOSS TO ADJUSTED EBITDA
(In thousands)
(unaudited)
| Fifty-two weeks ended February 27, 2021 |
Fifty-two weeks ended February 29, 2020 |
|||||||
| Reconciliation of net loss to adjusted EBITDA: | ||||||||
| Net loss - continuing operations | $ | (100,070 | ) | $ | (469,219 | ) | ||
| Adjustments: | ||||||||
| Interest expense | 201,388 | 229,657 | ||||||
| Income tax (benefit) expense | (20,157 | ) | 387,607 | |||||
| Depreciation and amortization | 327,124 | 328,277 | ||||||
| LIFO credit | (51,692 | ) | (64,804 | ) | ||||
| Lease termination and impairment charges | 58,403 | 42,843 | ||||||
| Intangible asset impairment charges | 29,852 | - | ||||||
| Gain on debt modifications and retirements, net | (5,274 | ) | (55,692 | ) | ||||
| Merger and Acquisition-related costs | 10,549 | 3,599 | ||||||
| Stock-based compensation expense | 13,003 | 16,087 | ||||||
| Restructuring-related costs | 84,552 | 105,642 | ||||||
| Inventory write-downs related to store closings | 3,709 | 4,652 | ||||||
| (Gain) loss on sale of assets, net | (69,300 | ) | 4,226 | |||||
| Gain on Bartell acquisition | (47,705 | ) | - | |||||
| Other | 3,283 | 5,336 | ||||||
| Adjusted EBITDA - continuing operations | $ | 437,665 | $ | 538,211 | ||||
| Percent of revenues - continuing operations | 1.82 | % | 2.45 | % | ||||
RITE AID CORPORATION AND SUBSIDIARIES
SUPPLEMENTAL INFORMATION
ADJUSTED NET LOSS
(Dollars in thousands, except per share amounts)
(unaudited)
| Thirteen
weeks ended February 27, 2021 | Thirteen
weeks ended February 29, 2020 | |||||||
| Net loss from continuing operations | $ | (18,495 | ) | $ | (343,461 | ) | ||
| Add back - Income tax (benefit) expense | (12,623 | ) | 351,729 | |||||
| (Loss) income before income taxes - continuing operations | (31,118 | ) | 8,268 | |||||
| Adjustments: | ||||||||
| Amortization expense | 20,669 | 24,765 | ||||||
| LIFO credit | (21,389 | ) | (72,357 | ) | ||||
| Merger and Acquisition-related costs | 9,413 | - | ||||||
| Restructuring-related costs | 13,456 | 11,872 | ||||||
| Gain on Bartell acquisition | (47,705 | ) | - | |||||
| Adjusted loss before income taxes - continuing operations | (56,674 | ) | (27,452 | ) | ||||
| Adjusted income tax benefit (a) | (14,905 | ) | (7,588 | ) | ||||
| Adjusted net loss from continuing operations | $ | (41,769 | ) | $ | (19,864 | ) | ||
| Adjusted net loss per diluted share - continuing operations: | ||||||||
| Numerator for adjusted net loss per diluted share: | ||||||||
| Adjusted net loss from continuing operations | $ | (41,769 | ) | $ | (19,864 | ) | ||
| Denominator: | ||||||||
| Basic and diluted weighted average shares | 53,812 | 53,434 | ||||||
| Net loss from continuing operations per diluted share - continuing operations | $ | (0.34 | ) | $ | (6.43 | ) | ||
| Adjusted net loss per diluted share - continuing operations | $ | (0.78 | ) | $ | (0.37 | ) | ||
| (a) | The fiscal year 2021 and 2020 annual effective tax rates, calculated using a federal rate plus a net state rate that excluded the impact of state NOL's, state credits and valuation allowance, was used for the thirteen weeks ended February 27, 2021 and February 29, 2020, respectively. |
| RITE AID CORPORATION AND SUBSIDIARIES | ||||||||
| SUPPLEMENTAL INFORMATION | ||||||||
| ADJUSTED NET (LOSS) INCOME | ||||||||
| (Dollars in thousands, except per share amounts) | ||||||||
| (unaudited) | ||||||||
| Fifty-two weeks ended February 27, 2021 | Fifty-two weeks ended February 29, 2020 | |||||||
| Net loss from continuing operations | $ | (100,070 | ) | $ | (469,219 | ) | ||
| Add back - Income tax (benefit) expense | (20,157 | ) | 387,607 | |||||
| Loss before income taxes - continuing operations | (120,227 | ) | (81,612 | ) | ||||
| Adjustments: | ||||||||
| Amortization expense | 89,020 | 103,941 | ||||||
| LIFO credit | (51,692 | ) | (64,804 | ) | ||||
| Intangible asset impairment charges | 29,852 | - | ||||||
| Gain on debt modifications and retirements, net | (5,274 | ) | (55,692 | ) | ||||
| Merger and Acquisition-related costs | 10,549 | 3,599 | ||||||
| Restructuring-related costs | 84,552 | 105,642 | ||||||
| Gain on Bartell acquisition | (47,705 | ) | - | |||||
| Adjusted (loss) income before income taxes - continuing operations | (10,925 | ) | 11,074 | |||||
| Adjusted income tax (benefit) expense (a) | (2,873 | ) | 3,061 | |||||
| Adjusted net (loss) income from continuing operations | $ | (8,052 | ) | $ | 8,013 | |||
| Adjusted net (loss) income per diluted share - continuing operations: | ||||||||
| Numerator for adjusted net (loss) income per diluted share: | ||||||||
| Adjusted net (loss) income from continuing operations | $ | (8,052 | ) | $ | 8,013 | |||
| Denominator: | ||||||||
| Basic weighted average shares | 53,653 | 53,228 | ||||||
| Outstanding options and restricted shares, net | - | 778 | ||||||
| Diluted weighted average shares | 53,653 | 54,006 | ||||||
| Net loss from continuing operations per diluted share - continuing operations | $ | (1.87 | ) | $ | (8.82 | ) | ||
| Adjusted net (loss) income per diluted share - continuing operations | $ | (0.15 | ) | $ | 0.15 | |||
| (a) The fiscal year 2021 and 2020 annual effective tax rates, calculated using a federal rate plus a net state rate that excluded the impact of | |||||||
| state NOL's, state credits and valuation allowance, was used for the fifty-two weeks ended February 27, 2021 and | |||||||
| February 29, 2020, respectively. | |||||||
| RITE AID CORPORATION AND SUBSIDIARIES | ||||||||
| SUPPLEMENTAL INFORMATION | ||||||||
| RECONCILIATION OF ADJUSTED EBITDA GROSS PROFIT AND RECONCILIATION OF ADJUSTED EBITDA SELLING, | ||||||||
| GENERAL AND ADMINISTRATIVE EXPENSES- RETAIL PHARMACY SEGMENT | ||||||||
| (In thousands) | ||||||||
| (unaudited) | ||||||||
| Thirteen weeks ended February 27, 2021 | Thirteen weeks ended February 29, 2020 | |||||||
| Reconciliation of adjusted EBITDA gross profit: | ||||||||
| Revenues | $ | 4,114,485 | $ | 3,993,328 | ||||
| Gross Profit | 1,032,634 | 1,141,045 | ||||||
| Addback: | ||||||||
| LIFO credit | (21,389 | ) | (72,357 | ) | ||||
| Depreciation and amortization (cost of goods sold portion only) | 1,915 | 1,758 | ||||||
| Restructuring-related costs - SKU optimization charges | (4,824 | ) | - | |||||
| Other | 668 | 444 | ||||||
| Adjusted EBITDA gross profit - continuing operations | $ | 1,009,004 | $ | 1,070,890 | ||||
| Percent of revenues - continuing operations | 24.52 | % | 26.82 | % | ||||
| Reconciliation of adjusted EBITDA selling, general and administrative expenses: | ||||||||
| Revenues | $ | 4,114,485 | $ | 3,993,328 | ||||
| Selling, general and administrative expenses | 1,093,074 | 1,060,472 | ||||||
| Less: | ||||||||
| Depreciation and amortization (SG&A portion only) | 61,861 | 62,109 | ||||||
| Stock-based compensation expense | 3,809 | 2,191 | ||||||
| Merger and Acquisition-related costs | 9,413 | - | ||||||
| Restructuring-related costs | 12,641 | 8,887 | ||||||
| Other | 2,363 | 1,570 | ||||||
| Adjusted EBITDA selling, general and administrative expenses - continuing operations | $ | 1,002,987 | $ | 985,715 | ||||
| Percent of revenues - continuing operations | 24.38 | % | 24.68 | % | ||||
| Adjusted EBITDA - continuing operations | $ | 6,017 | $ | 85,175 | ||||
| RITE AID CORPORATION AND SUBSIDIARIES | ||||||||
| SUPPLEMENTAL INFORMATION | ||||||||
| RECONCILIATION OF ADJUSTED EBITDA GROSS PROFIT AND RECONCILIATION OF ADJUSTED EBITDA SELLING, | ||||||||
| GENERAL AND ADMINISTRATIVE EXPENSES- RETAIL PHARMACY SEGMENT | ||||||||
| (In thousands) | ||||||||
| (unaudited) | ||||||||
| Fifty-two weeks ended February 27, 2021 | Fifty-two weeks ended February 29, 2020 | |||||||
| Reconciliation of adjusted EBITDA gross profit: | ||||||||
| Revenues | $ | 16,365,260 | $ | 15,616,186 | ||||
| Gross Profit | 4,255,791 | 4,274,836 | ||||||
| Addback: | ||||||||
| LIFO credit | (51,692 | ) | (64,804 | ) | ||||
| Depreciation and amortization (cost of goods sold portion only) | 8,690 | 8,296 | ||||||
| Restructuring-related costs - SKU optimization charges | 20,939 | - | ||||||
| Other | 2,472 | 3,605 | ||||||
| Adjusted EBITDA gross profit - continuing operations | $ | 4,236,200 | $ | 4,221,933 | ||||
| Percent of revenues - continuing operations | 25.89 | % | 27.04 | % | ||||
| Reconciliation of adjusted EBITDA selling, general and administrative expenses: | ||||||||
| Revenues | $ | 16,365,260 | $ | 15,616,186 | ||||
| Selling, general and administrative expenses | 4,299,152 | 4,220,851 | ||||||
| Less: | ||||||||
| Depreciation and amortization (SG&A portion only) | 261,295 | 257,390 | ||||||
| Stock-based compensation expense | 11,594 | 14,864 | ||||||
| Merger and Acquisition-related costs | 10,549 | 2,828 | ||||||
| Restructuring-related costs | 54,633 | 87,738 | ||||||
| Other | 4,777 | 6,533 | ||||||
| Adjusted EBITDA selling, general and administrative expenses - continuing operations | $ | 3,956,304 | $ | 3,851,498 | ||||
| Percent of revenues - continuing operations | 24.18 | % | 24.66 | % | ||||
| Adjusted EBITDA - continuing operations | $ | 279,896 | $ | 370,435 | ||||
| RITE AID CORPORATION AND SUBSIDIARIES | ||||||||
| SUPPLEMENTAL INFORMATION | ||||||||
| RECONCILIATION OF NET (LOSS) INCOME GUIDANCE TO ADJUSTED EBITDA GUIDANCE | ||||||||
| QUARTER ENDING MAY 29, 2021 | ||||||||
| (In thousands) | ||||||||
| (unaudited) | ||||||||
| Guidance Range | ||||||||
| Low | High | |||||||
| Total Revenues | $ | 6,100,000 | $ | 6,300,000 | ||||
| Same store sales | -9.00 | % | -7.00 | % | ||||
| Reconciliation of net (loss) income to adjusted EBITDA: | ||||||||
| Net (loss) income | $ | (10,000 | ) | $ | 10,000 | |||
| Adjustments: | ||||||||
| Interest expense | 46,000 | 46,000 | ||||||
| Income tax expense | 3,000 | 4,000 | ||||||
| Depreciation and amortization | 78,000 | 78,000 | ||||||
| LIFO credit | (12,000 | ) | (12,000 | ) | ||||
| Lease termination and impairment charges | 1,000 | 1,000 | ||||||
| Merger and Acquisition-related costs | 3,000 | 3,000 | ||||||
| Restructuring-related costs | 3,000 | 7,000 | ||||||
| Other | 3,000 | 3,000 | ||||||
| Adjusted EBITDA | $ | 115,000 | $ | 140,000 | ||||
Exhibit 99.2

April 15, 2021 Heyward Donigan Chief Executive Officer Jim Peters Chief Operating Officer Matt Schroeder Chief Financial Officer

2 Cautionary Statement Regarding Forward Looking Statements Statements in this presentation that are not historical, are forward - looking statements made pursuant to the safe harbor provisions of the Private Securities Litigation Reform Act of 1995 . Such statements include, but are not limited to, statements regarding Rite Aid Corporation’s (the “Company”) guidance for fiscal 2022 ; the continued impact of the global coronavirus (COVID - 19 ) pandemic on the Company’s business ; the ability to accelerate key initiatives and improve and modernize the operating performance of the Company’s stores ; timing for launching all new member portal ; and any assumptions underlying any of the foregoing . Words such as “anticipate,” “believe,” “continue,” “could,” “estimate,” “expect,” “intend,” “may,” “plan,” “predict,” “project,” “should,” and “will” and variations of such words and similar expressions are intended to identify such forward - looking statements . These forward - looking statements are not guarantees of future performance and involve risks, assumptions and uncertainties, including, but not limited to : the continued impact of COVID - 19 on the Company’s workforce, operations, stores, expenses and supply chain, and the operations of the Company’s customers, suppliers and business partners ; the Company’s ability to successfully implement its RxEvolution strategy ; Company’s high level of indebtedness and its ability to satisfy its obligations and the other covenants contained in the Company’s debt agreements ; general competitive, economic, industry, market, political (including healthcare reform) and regulatory conditions, the severity and resulting impact of the cough, cold and flu season, as well as other factors specific to the markets in which we operate ; the impact of private and public third - party payers continued reduction in prescription drug reimbursements and efforts to encourage mail order ; the Company’s ability to manage expenses and its investments in working capital ; the Company’s ability to achieve the benefits of the Company’s efforts to reduce the costs of its generic and other drugs ; the Company’s ability to achieve cost savings and other benefits of its organizational restructuring within the Company’s anticipated timeframe, if at all ; and outcomes of legal and regulatory matters ; the Company’s ability to partner and have relationships with health plans and health systems . These and other risks, assumptions and uncertainties are more fully described in Item 1 A (Risk Factors) of the Company’s most recent Annual Report on Form 10 - K, in Item 1 A (Risk Factors) of the Company’s Quarterly Report on Form 10 - Q filed on July 2 , 2020 and in other documents that it files or furnishes with the Securities and Exchange Commission (the “SEC”), which you are encouraged to read . To the extent that COVID - 19 adversely affects the Company’s business and financial results, it may also have the effect of heightening many of such risk factors . Should one or more of these risks or uncertainties materialize, or should underlying assumptions prove incorrect, actual results may vary materially from those indicated or anticipated by such forward - looking statements . Accordingly, you are cautioned not to place undue reliance on these forward - looking statements, which speak only as of the date they are made . The degree to which COVID - 19 may adversely the Company’s results and operations, including its ability to achieve its outlook for the first fiscal quarter of 2022 or fiscal 2022 guidance, will depend on numerous evolving factors and future developments, which are highly uncertain, including, but not limited to, the duration and spread of the outbreak, its severity, the actions to contain the virus or treat its impact (such as travel bans and restrictions, quarantines, shelter - in - place orders and shutdowns), including the reinstitution of more stringent regulations (including mandatory stay at home orders, the availability and rollout of vaccines to treat the virus), how quickly and to what extent normal economic and operating conditions can resume and the impact on front - end purchases and engaging in voluntary or elective procedures . As a result, the impact on the Company’s financial and operating results cannot be reasonably estimated with specificity at this time, but the impact could be material . The Company expressly disclaims any current intention to update publicly any forward - looking statement after the distribution of this presentation, whether as a result of new information, future events, changes in assumptions or otherwise .
3 The following presentation includes the non - GAAP financial measures, Adjusted EBITDA, Adjusted Net Income (Loss), Adjusted Net Income (Loss) per Diluted Share, Adjusted EBITDA Gross Profit, and Adjusted EBITDA SG&A . The Company defines Adjusted EBITDA as net income (loss) excluding the impact of income taxes, interest expense, depreciation and amortization, LIFO adjustments, charges or credits for facility closing and impairment, goodwill and intangible asset impairment charges, inventory write - downs related to store closings, gains or losses on debt modifications and retirements, the WBA merger termination fee, and other items (including stock - based compensation expense, merger and acquisition - related costs, non - recurring litigation settlement, severance, restructuring - related costs and costs related to facility closures, the gain on Bartell acquisition and gain or loss on sale of assets) . The presentation includes a reconciliation of Adjusted EBITDA to net income (loss), which is the most directly comparable GAAP financial measure . Adjusted Net Income (Loss) and Adjusted Net Income (Loss) per Diluted Share exclude amortization expense, merger and acquisition - related costs, non - recurring litigation settlement, gains or losses on debt modifications and retirements, LIFO adjustments, goodwill and intangible asset impairment charges, restructuring - related costs, the gain on Bartell acquisition and the WBA merger termination fee . Additionally , the add back of LIFO (credit) charge when calculating Adjusted EBITDA, Adjusted Net Income (Loss) and Adjusted Net Income (Loss) per Diluted Share removes the entire impact of LIFO (credits) charges, and effectively reflects the Company’s results as if the Company was on a FIFO inventory basis . The presentation includes a reconciliation of Adjusted Net Income (Loss) to net income (loss), which is the most directly comparable GAAP financial measure . Adjusted EBITDA Gross Profit includes LIFO adjustments, depreciation and amortization (COGS portion only) and other items . The presentation includes a reconciliation of Adjusted EBITDA Gross Profit to Revenue, which is the most directly comparable GAAP financial measure . Adjusted EBITDA SG&A excludes depreciation and amortization (SG&A portion only), stock - based compensation expense, merger and acquisition - related costs, litigation settlement and other items . The presentation includes a reconciliation of Adjusted EBITDA SG&A to Revenue, which is the most directly comparable GAAP financial measure . Non - GAAP Financial Measures


5 $41.3M Adjusted EBITDA* 3.8% Increase in revenues at Elixir 3.3% Increase in total revenues 3.0% Growth in retail pharmacy revenues 2.0% Increase in RX same store sales *Adjusted EBITDA reconciliation located in the Appendix Q4 FY2021 at a Glance

6 Key Fourth Quarter FY2021 Highlights Revenue increased 3.3% Retail Pharmacy: x Increased front - end market share in both dollars and units x Digitally enabled sales increased approximately 170% x Pharmacy comparable sales increased 2.0% x Front end comparable sales decreased 5.0% (excluding tobacco related products) x Began administering COVID vaccines x Completed acquisition of Bartell Drugs Elixir: x Revenue increased 3.8% to $1.9 billion x Mail order revenue up 1.2% x Specialty revenue up 2.3% Ended the year with over $1.7 billion in liquidity

7 FY2021 at a Glance $437.7M Adjusted EBITDA 9.6% Increase in total revenues Increase in RX same store sales 21.5% Increase in revenues at Elixir 4.8% Growth in retail pharmacy revenues 3.2%
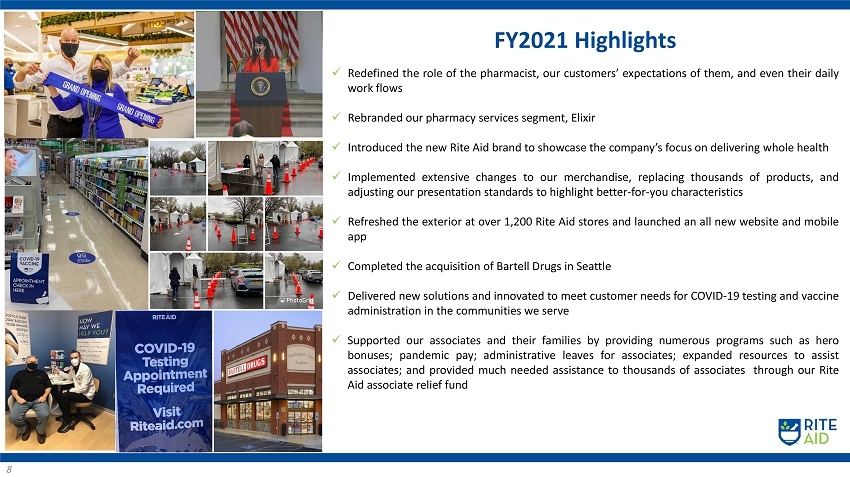
8 FY2021 Highlights x Redefined the role of the pharmacist, our customers’ expectations of them, and even their daily work flows x Rebranded our pharmacy services segment, Elixir x Introduced the new Rite Aid brand to showcase the company’s focus on delivering whole health x Implemented extensive changes to our merchandise, replacing thousands of products, and adjusting our presentation standards to highlight better - for - you characteristics x Refreshed the exterior at over 1 , 200 Rite Aid stores and launched an all new website and mobile app x Completed the acquisition of Bartell Drugs in Seattle x Delivered new solutions and innovated to meet customer needs for COVID - 19 testing and vaccine administration in the communities we serve x Supported our associates and their families by providing numerous programs such as hero bonuses ; pandemic pay ; administrative leaves for associates ; expanded resources to assist associates ; and provided much needed assistance to thousands of associates through our Rite Aid associate relief fund
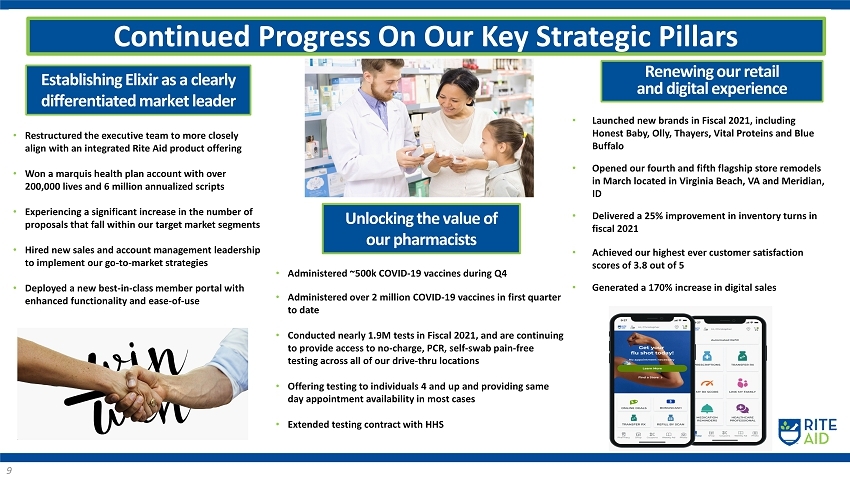
9 • Restructured the executive team to more closely align with an integrated Rite Aid product offering • Won a marquis health plan account with over 200,000 lives and 6 million annualized scripts • Experiencing a significant increase in the number of proposals that fall within our target market segments • Hired new sales and account management leadership to implement our go - to - market strategies • Deployed a new best - in - class member portal with enhanced functionality and ease - of - use Establishing Elixir as a clearly differentiated market leader Continued Progress On Our Key Strategic Pillars Unlocking the value of our pharmacists • Administered ~ 500k COVID - 19 vaccines during Q4 • Administered over 2 million COVID - 19 vaccines in first quarter to date • Conducted nearly 1.9M tests in Fiscal 2021, and are continuing to provide access to no - charge, PCR, self - swab pain - free testing across all of our drive - thru locations • Offering testing to individuals 4 and up and providing same day appointment availability in most cases • Extended testing contract with HHS Renewing our retail and digital experience • Launched new brands in Fiscal 2021, including Honest Baby, Olly, Thayers, Vital Proteins and Blue Buffalo • Opened our fourth and fifth flagship store remodels in March located in Virginia Beach, VA and Meridian, ID • Delivered a 25% improvement in inventory turns in fiscal 2021 • Achieved our highest ever customer satisfaction scores of 3.8 out of 5 • Generated a 170% increase in digital sales
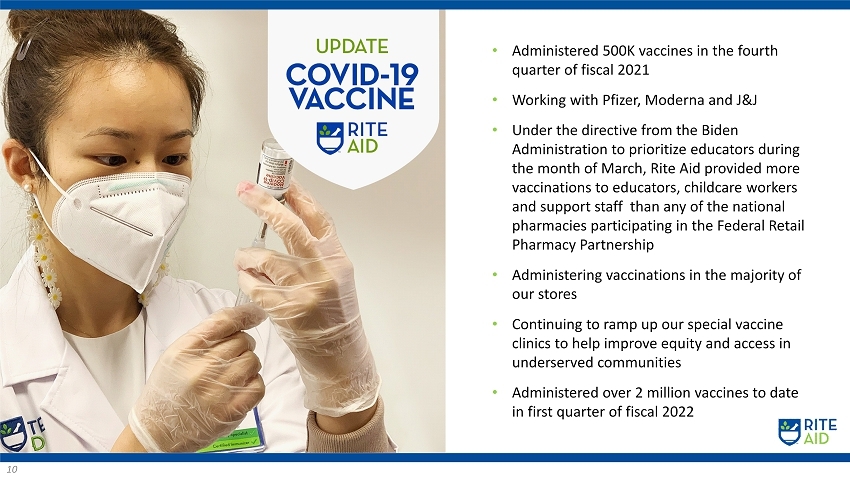
10 • Administered 500K vaccines in the fourth quarter of fiscal 2021 • Working with Pfizer, Moderna and J&J • Under the directive from the Biden Administration to prioritize educators during the month of March, Rite Aid provided more vaccinations to educators, childcare workers and support staff than any of the national pharmacies participating in the Federal Retail Pharmacy Partnership • Administering vaccinations in the majority of our stores • Continuing to ramp up our special vaccine clinics to help improve equity and access in underserved communities • Administered over 2 million vaccines to date in first quarter of fiscal 2022

11 FY2021 Q1 - Hosted analyst day - Launched bond exchange offer - Introduced Rxevolution strategy - COVID testing 97 sites 48k tests per week - Hero pay program initiated - $6m donated through Rite Aid Foundation for healthcare and first responders - Created new store policies for COVID pandemic FY2021 Q2 - Completed bond exchange offer - Introduced key strategic pillars - Completed 200 interior and exterior store refreshes - Launched new brand on web & mobile app with updated experience - Pharmacists training for immunity and holistic care - 300 COVID testing sites - Conducted more than 550,000 COVID tests FY2021 Q3 - Elixir set to launch new member portal - Conducted over 1M COVID tests - Flu immunizations increased by 28% - Completed over 700 store exterior refreshes - Opened 3 stores of the future in Etters, PA, Littleton, NH and Moscow, PA - Officially launched new brand and logo and remerchandised 75% of our categories - Completed the sale leaseback of our Perryman, MD distribution center FY2021 Q4 - Provided COVID vaccine administration at the majority of our stores - Completed over 1,200 store exteriors - Completed acquisition of Bartell Drugs in Seattle, WA - Drove a nearly 170% increase in digital sales - Elixir revenue increased 4% - Expanded COVID testing in all drive thru locations FY2021 TIMELINE

12 Total Revenues $6.1B – $6.3B Same Store Sales (9%) – (7%) Adjusted EBITDA $115M - $140M Net (Loss)/Income ($10M) - $10M FY 2022 First Quarter Guidance

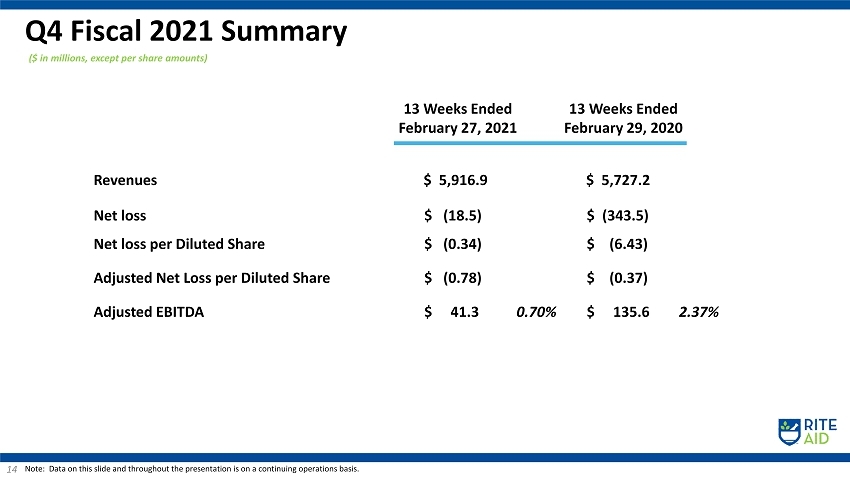
($ in millions, except per share amounts) Q4 Fiscal 2021 Summary 14 Note: Data on this slide and throughout the presentation is on a continuing operations basis. 13 Weeks Ended February 27, 2021 13 Weeks Ended February 29, 2020 Revenues $ 5,916.9 $ 5,727.2 Net loss $ (18.5) $ (343.5) Net loss per Diluted Share $ (0.34) $ ( 6 .43) Adjusted Net Loss per Diluted Share $ (0 .78) $ ( 0.37) Adjusted EBITDA $ 41.3 0.70% $ 135.6 2.37%

($ in thousands) Q 4 - Fiscal 2021 Reconciliation of Net Loss to Adjusted EBITDA 15 13 Weeks Ended February 27, 2021 13 Weeks Ended February 29, 2020 Net loss $ (18,495) $ (343,461) Adjustments: • Interest expense 49,999 53,429 • Income tax (benefit) expense (12,623) 3 51,729 • Depreciation and amortization 77,568 79,300 • LIFO credit (21,389) (72,357) • Lease termination and impairment charges 35,669 40,728 • Merger and Acquisition - related costs 9,413 - • Stock - based compensation expense 4,326 2,489 • Restructuring - related costs 13,456 11,872 • Inventory write - downs related to store closings 1,113 56 9 • (Gain) loss on sale of assets, net (51 ,827) 9,896 • Gain on Bartell acquisition (47,705 ) - • Other 1,760 1,390 Adjusted EBITDA $ 41,265 $ 135,584 Percent of revenues 0.70% 2.37%
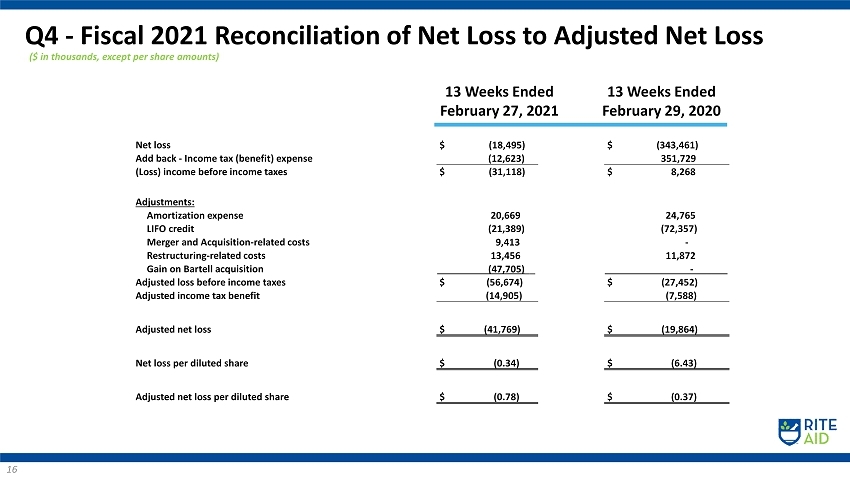
($ in thousands, except per share amounts) Q4 - Fiscal 2021 Reconciliation of Net Loss to Adjusted Net Loss 16 13 Weeks Ended February 27, 2021 13 Weeks Ended February 29, 2020 Net loss $ (18,495) $ (343 ,461) Add back - Income tax (benefit) expense (12,623) 351, 729 (Loss) income before income taxes $ (31,118) $ 8,268 Adjustments: Amortization expense 20,669 24,765 LIFO credit (21,389) (72,357) Merger and Acquisition - related costs 9,413 - Restructuring - related costs 13,456 11,872 Gain on Bartell acquisition (47,705) __ - ______ Adjusted loss before income taxes $ (56,674) $ (27,452) Adjusted income tax benefit (14,905) (7 ,588) Adjusted net loss $ (41,769) $ (19 ,864) Net loss per diluted share $ (0.34) $ (6.43) Adjusted net loss per diluted share $ (0.78) $ ( 0.37)
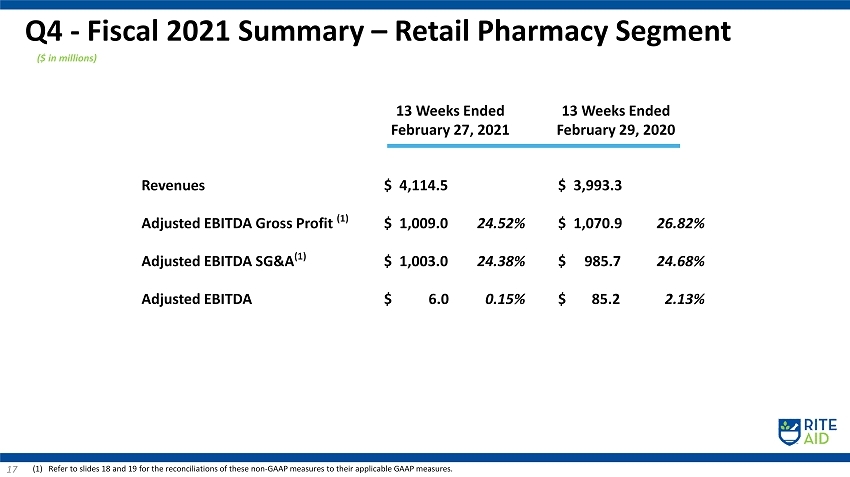
Q4 - Fiscal 2021 Summary – Retail Pharmacy Segment 17 (1) Refer to slides 18 and 19 for the reconciliations of these non - GAAP measures to their applicable GAAP measures. ($ in millions) 13 Weeks Ended February 27, 2021 13 Weeks Ended February 29, 2020 Revenues $ 4,114.5 $ 3,993.3 Adjusted EBITDA Gross Profit (1) $ 1,009.0 24.52% $ 1,070.9 26.82% Adjusted EBITDA SG&A (1) $ 1,003 .0 24.38% $ 985.7 24.68% Adjusted EBITDA $ 6.0 0.15% $ 85.2 2.13%

($ in millions) Reconciliation of Adj. EBITDA Gross Profit – Retail Pharmacy Segment 18 13 Weeks Ended February 27, 2021 13 Weeks Ended February 29, 2020 Revenues $ 4,114.5 $ 3,993.3 Gross Profit 1,032.6 1,141.0 Addback: LIFO credit (21.4) (72.4) Depreciation and amortization (COGS portion only) 2.0 1.8 Restructuring - related costs – SKU optimization charges (4.8) - Other 0.6 0.5 Adjusted EBITDA Gross Profit $ 1,009.0 $ 1,070.9 Adjusted EBITDA Gross Profit as a percent of revenues 24.52% 26.82%
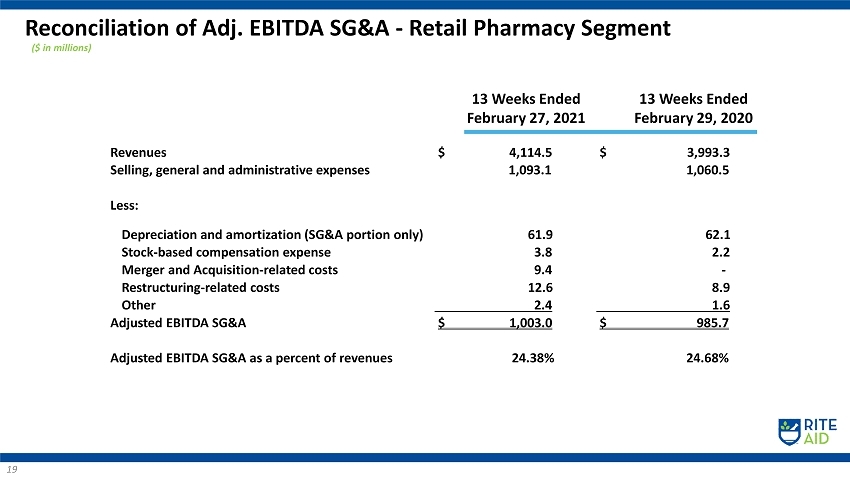
($ in millions) Reconciliation of Adj. EBITDA SG&A - Retail Pharmacy Segment 19 13 Weeks Ended February 27, 2021 13 Weeks Ended February 29, 2020 Revenues $ 4,114.5 $ 3,993.3 Selling, general and administrative expenses 1,093.1 1,060.5 Less: Depreciation and amortization (SG&A portion only) 61.9 62.1 Stock - based compensation expense 3.8 2.2 Merger and Acquisition - related costs 9.4 - Restructuring - related costs 12 .6 8.9 Other 2.4 1.6 Adjusted EBITDA SG&A $ 1,003.0 $ 985.7 Adjusted EBITDA SG&A as a percent of revenues 24.38% 24.68%
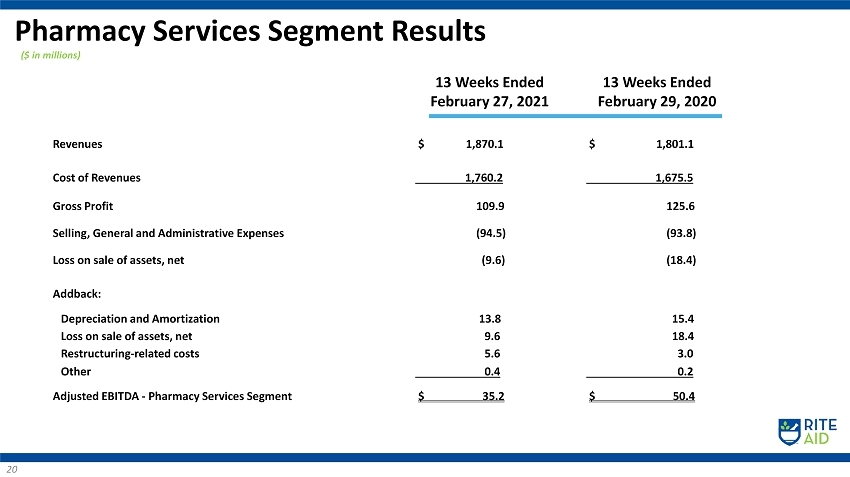
Pharmacy Services Segment Results 20 13 Weeks Ended February 27, 2021 13 Weeks Ended February 29, 2020 Revenues $ 1,870.1 $ 1,801.1 Cost of Revenues 1,760.2 1,675.5 Gross Profit 109 .9 125.6 Selling, General and Administrative Expenses (94.5) (93.8) Loss on sale of assets, net (9.6) (18.4) Addback: Depreciation and Amortization 13.8 15.4 Loss on sale of assets, net 9.6 18.4 Restructuring - related costs 5.6 3.0 Other 0.4 0.2 Adjusted EBITDA - Pharmacy Services Segment $ 35.2 $ 50.4 ($ in millions)

21 2.7% 2.8% 5.0% 0.4% 2.6% 3.1% - 0.9% Q2 2020 Q3 2020 Q4 2020 Q1 2021 Q2 2021 Q3 2021 Q4 2021 SCRIPT COUNT (1) Excluding cigarette and tobacco products Comparable Store Sales Growth Q2 2020 Q4 2020 Q3 2020 (1) Script count growth shown on a 30 - day equivalent basis. Q1 2021 Q2 2021 Q3 2021 1.5% 0.1% 1.6% 2.2% 2.3% 6.1% 2.0% Q2 2020 Q3 2020 Q4 2020 Q1 2021 Q2 2021 Q3 2021 Q4 2021 RX SALES - 1.8% - 0.5% 0.1% 14.2% 4.6% - 0.7% - 5.6% - 0.6% 1.0% 1.5% 16.0% 6.1% 0.3% - 5.0% FRONT END SALES Q4 2021 FY2020 FY2021
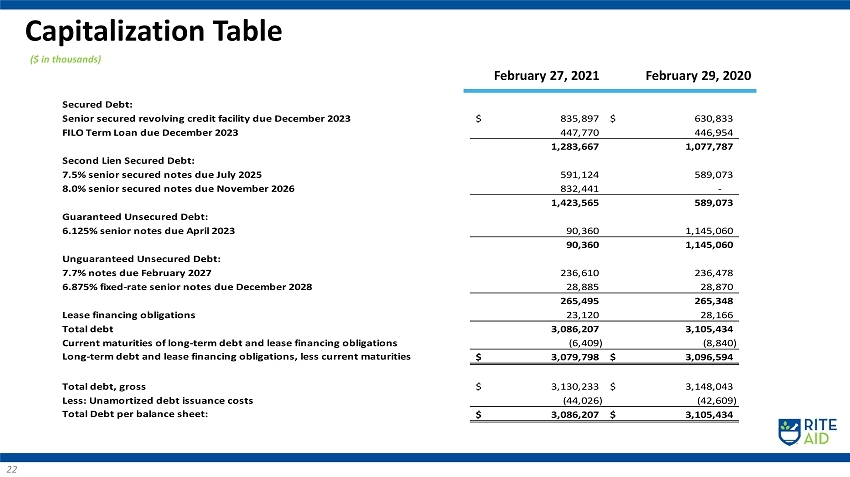
($ in thousands) Capitalization Table 22 February 27, 2021 February 29, 2020 Secured Debt: Senior secured revolving credit facility due December 2023 835,897$ 630,833$ FILO Term Loan due December 2023 447,770 446,954 1,283,667 1,077,787 Second Lien Secured Debt: 7.5% senior secured notes due July 2025 591,124 589,073 8.0% senior secured notes due November 2026 832,441 - 1,423,565 589,073 Guaranteed Unsecured Debt: 6.125% senior notes due April 2023 90,360 1,145,060 90,360 1,145,060 Unguaranteed Unsecured Debt: 7.7% notes due February 2027 236,610 236,478 6.875% fixed-rate senior notes due December 2028 28,885 28,870 265,495 265,348 Lease financing obligations 23,120 28,166 Total debt 3,086,207 3,105,434 Current maturities of long-term debt and lease financing obligations (6,409) (8,840) Long-term debt and lease financing obligations, less current maturities 3,079,798$ 3,096,594$ Total debt, gross 3,130,233$ 3,148,043$ Less: Unamortized debt issuance costs (44,026) (42,609) Total Debt per balance sheet: 3,086,207$ 3,105,434$

($ in thousands) Leverage Ratio 23 Total Debt: $ 3,086,207 Less: Cash and cash equivalents (160,902) Net Debt $ 2,925,305 LTM Adjusted EBITDA: Retail Pharmacy Segment 279,896 Pharmacy Services Segment 157,769 LTM Adjusted EBITDA $ 437,665 Leverage Ratio 6.68 February 27, 2021

Serious News for Serious Traders! Try StreetInsider.com Premium Free!
You May Also Be Interested In
- KE Holdings Inc. to Hold Annual General Meeting on June 14, 2024
- Ocugen to Present on Modifier Gene Therapy Platform at Association for Research in Vision and Ophthalmology 2024 Annual Meeting
- Man Group PLC : Form 8.3 - Tyman plc
Create E-mail Alert Related Categories
SEC FilingsSign up for StreetInsider Free!
Receive full access to all new and archived articles, unlimited portfolio tracking, e-mail alerts, custom newswires and RSS feeds - and more!
