

Form 8-K REGENCY CENTERS CORP For: Aug 01
 Tweet
Tweet Share
Share
UNITED STATES
SECURITIES AND EXCHANGE COMMISSION
Washington, DC 20549
FORM 8-K
CURRENT REPORT
Pursuant to Section 13 or 15(d) of the Securities Exchange Act of 1934
August 1, 2019
Date of Report (Date of earliest event reported)
REGENCY CENTERS CORPORATION
(Exact name of registrant as specified in its charter)
|
|
|
|
|
|
|
Florida |
|
|
|
59-3191743 |
|
(State or other jurisdiction of incorporation) |
|
001-12298 |
|
(IRS Employer Identification No.) |
|
|
|
(Commission File Number) |
|
|

One Independent Drive, Suite 114
Jacksonville, Florida 32202
(Address of principal executive offices) (Zip Code)
(904) 598-7000
(Registrant's telephone number, including area code)
Not Applicable
(Former name or former address, if changed since last report)
Securities registered pursuant to Section 12(b) of the Act:
Regency Centers Corporation
|
Title of each class |
|
Trading Symbol |
|
Name of each exchange on which registered |
|
Common Stock, $.01 par value |
|
REG |
|
The Nasdaq Stock Market LLC |
Check the appropriate box below if the Form 8-K filing is intended to simultaneously satisfy the filing obligation of the registrant under any of the following provisions:
|
☐ |
|
Written communications pursuant to Rule 425 under the Securities Act (17 CFR 230 .425) |
|
☐ |
|
Soliciting material pursuant to Rule 14a-12 under the Exchange Act (17 CFR 240.14a-12) |
|
☐ |
|
Pre-commencement communications pursuant to Rule 14d-2(b) under the Exchange Act (17 CFR 240.14d-2(b)) |
|
☐ |
|
Pre-commencement communications pursuant to Rule 13e-4(c) under the Exchange Act (17 CFR 240.13e-4(c)) |
Indicate by check mark whether the registrant is an emerging growth company as defined in Rule 405 of the Securities Act of 1933 (§230.405 of this chapter) or Rule 12b-2 of the Securities Exchange Act of 1934 (§240.12b-2 of this chapter).
Emerging growth company ☐
If an emerging growth company, indicate by check mark if the registrant has elected not to use the extended transition period for complying with any new or revised financial accounting standards provided pursuant to Section 13(a) of the Exchange Act. ☐
Item 2.02 Disclosure of Results of Operations and Financial Condition
On August 1, 2019, Regency issued an earnings release for the three and six months ended June 30, 2019, which is attached as Exhibit 99.1.
On August 1, 2019, Regency posted on its website, at www.regencycenters.com, the supplemental information for the three and six months ended June 30, 2019, which is attached as Exhibit 99.2.
Item 9.01 Financial Statements and Exhibits
(d) Exhibits
|
Exhibit 99.1 |
|
|
|
|
|
|
|
Exhibit 99.2 |
|
Pursuant to the requirements of the Securities Exchange Act of 1934, the registrant has duly caused this report to be signed on its behalf by the undersigned hereunto duly authorized.
|
|
|
REGENCY CENTERS CORPORATION |
|||
|
|
|
|
|
|
|
|
August 1, 2019 |
|
By: |
|
/s/ J. Christian Leavitt |
|
|
|
|
|
|
J. Christian Leavitt, Senior Vice President and Treasurer (Principal Accounting Officer) |
|

NEWS RELEASE For immediate release Laura Clark 904 598 7831 [email protected] 1 Regency Centers Reports Second Quarter 2019 Results JACKSONVILLE, Fla. (August 1, 2019) – Regency Centers Corporation (“Regency” or the “Company”) today reported financial and operating results for the period ended June 30, 2019. Second Quarter 2019 Highlights •For the three months ended June 30, 2019, Net Income Attributable to Common Stockholders(“Net Income”) of $0.31 per diluted share. •Second quarter NAREIT Funds From Operations (“NAREIT FFO”) of $0.95 per diluted share, whichincludes a $0.02 per share charge from one-time non-cash expenses. •Year-to-date same property Net Operating Income (“NOI”), excluding termination fees, increased2.1%, as compared to the same period in 2018, driven by Base Rent growth of 2.5%. •As of June 30, 2019, the same property portfolio was 95.1% leased. •On a trailing twelve months basis, rent spreads on comparable new and renewal leases were19.8% and 6.9%, respectively, with total rent spreads of 8.9%. •For the three months ended June 30, 2019, total leasing volume of approximately 1.9 millionsquare feet of new and renewal leases, at blended rent spreads of 7.0%. •As of June 30, 2019, a total of 23 properties were in development or redevelopment representinga total investment of approximately $474 million. •Subsequent to the quarter, Regency acquired The Pruneyard in Silicon Valley for a purchase priceof approximately $212.5 million. •During the second quarter, Regency issued its annual Corporate Responsibility Report,highlighting the Company’s accomplishments in key areas of environmental, social, andgovernance initiatives. The Company was also recently included in the S&P 500 ESG index andreceived a rating upgrade to A from MSCI. •On August 1, 2019, Regency announced the transition of Martin E. “Hap” Stein, Jr. from Chairmanand Chief Executive Officer to Executive Chairman, to be succeeded by Lisa Palmer as Presidentand Chief Executive Officer effective January 1, 2020. As part of the Company’s succession plan,Ms. Palmer will vacate her role as Chief Financial Officer, retaining her position as President,effective August 12, 2019, with Mike Mas assuming the position of Executive Vice President, ChiefFinancial Officer, at that time. •On July 31, 2019, Regency’s Board declared a quarterly cash dividend on the Company’s commonstock of $0.585 per share. “I am deeply gratified to work with the best professionals in the business who have been the cornerstone to Regency’s ongoing success in building a wonderful company,” said Martin E. “Hap” Stein, Jr., Chairman and Chief Executive Officer. “Through this seamless transition, I have no doubt that Lisa and the team will continue to execute on our strategic objectives and make even more progress on Regency’s journey from good to great, while generating total returns of 8% to 10%.” Exhibit 99.1
2 Financial Results Regency reported Net Income for the second quarter of $51.7 million, or $0.31 per diluted share compared to the Net Income Attributable to Common Stockholders of $47.8 million, or $0.28 per diluted share, for the same period in 2018. The Company reported NAREIT FFO for the second quarter of $160.0 million, or $0.95 per diluted share, compared to $157.3 million, or $0.93 per diluted share, for the same period in 2018. For the three months ended June 30, 2019, the Company’s results included a negative impact of $3.0 million, or $0.02 per diluted share, from one-time non-cash expenses related to straight-line rent reserves for tenants where it is no longer probable that those tenants will remain in occupancy for the duration of their current lease. The Company reported Core Operating Earnings for the second quarter of $152.4 million, or $0.91 per diluted share, compared to $150.5 million, or $0.89 per diluted share, for the same period in 2018. Core operating earnings per share growth was 4.6% for the second quarter, when adjusted for the adoption of Accounting Standard Codification 842, Leases. The Company views Core Operating Earnings, which excludes certain non-recurring items as well as non-cash components of earnings derived from above and below market rent amortization, straight-line rents, and amortization of debt mark-to-market, as a better measure of business performance as it more closely reflects cash earnings and the Company’s ability to grow the dividend. Portfolio Performance Regency’s portfolio is differentiated in its overall outstanding quality, breadth and scale. The strength of the Company’s merchandising mix, combined with placemaking elements and connection to its communities further differentiate Regency’s high quality portfolio. Regency’s national platform with 22 local market offices offers critical strategic advantages and positions the Company to achieve its strategic objective to average 3% same property NOI growth over the long term. Second quarter same property NOI, excluding termination fees, increased 1.4% compared to the same period in 2018, which was primarily impacted by the Sears bankruptcy and timing of reconciliations. Year-to-date same property NOI, excluding termination fees, increased 2.1%, as compared to the same period in 2018, driven by Base Rent growth of 2.5%. As of June 30, 2019, Regency’s wholly-owned portfolio plus its pro-rata share of co-investment partnerships was 94.7% leased. The same property portfolio was 95.1% leased, which is an increase of 10 basis points sequentially and a decrease of 60 basis points from the same period in 2018, primarily driven by the Sears bankruptcy. For the three months ended June 30, 2019, Regency executed approximately 1.9 million square feet of comparable new and renewal leases at blended rent spreads of 7.0%. Rent spreads on new and renewal leases were 6.9% and 7.0%, respectively. For the trailing twelve months, the Company executed approximately 6.9 million square feet of comparable new and renewal leases at blended rent spreads of 8.9%. Portfolio Enhancement and Capital Allocation Regency’s capital allocation strategy enables the Company to benefit from a self-funding model, in which free cash flow is the source of funding, and supports the development and redevelopment program on Exhibit 99.1

3 a leverage neutral basis. Regency’s development and redevelopment platform is a critical strategic advantage for creating significant value for shareholders. Together with the sales of lower growth assets and equity when priced attractively, free cash flow also enables the Company to invest in high-growth acquisitions and share repurchases when pricing is compelling. This capital allocation strategy preserves Regency’s pristine balance sheet and allows the Company to add value and enhance the quality of the portfolio on a net accretive basis. Developments and Redevelopments At quarter end, the Company had 23 properties in development or redevelopment with, estimated net project costs of approximately $474 million. In-process developments and redevelopments were 89% leased and committed as of June 30, 2019, and are expected to yield an average return of 7.6%. During the quarter, Regency started one ground-up development project and four redevelopment projects. The ground-up development project, Culver Public Market, is a 27,000 - square foot urban retail project located in the dynamic high-barrier-to-entry Culver City submarket of Los Angeles, California. The total project cost is approximately $27 million at a projected 6.0% stabilized yield. As previously reported, Regency started the generational redevelopment of The Abbot, located in the heart of Harvard Square in Cambridge, MA. The project will modernize and expand the iconic property offering flagship retail and office uses. The total project cost is approximately $52 million at a projected incremental 9.3% stabilized yield. Property Transactions During the quarter the Company acquired 6401 Roosevelt in Seattle, WA for $3.6 million. This multi-tenant retail building is adjacent to the Company’s Whole Foods anchored operating property, Roosevelt Square. Subsequent to quarter end, the Company acquired The Pruneyard, a 258,000 square foot center located in Silicon Valley for $212.5 million at a 4.3% cap rate. The center is anchored by Trader Joe’s and Marshalls and sits in close proximity to the West Valley’s most affluent neighborhoods and technology employers. In addition to the retail portion, The Pruneyard also benefits from three adjacent office towers totaling 360,000 square feet and an adjacent 171-key hotel, which were not part of the transaction. On a year-to-date basis, including The Pruneyard acquisition subsequent to the quarter end, the Company has closed on $231.6 million of acquisitions and $136.5 million of dispositions. Balance Sheet Regency benefits from favorable access to capital through the strength of its balance sheet, supported by conservative leverage levels with a Net Debt to EBITDAre ratio of 5.3x. This positions Regency to weather potential challenges and potentially profit from investment opportunities in the future. Dividend On July 31, 2019, Regency’s Board declared a quarterly cash dividend on the Company’s common stock of $0.585 per share. The dividend is payable on August 22, 2019, to shareholders of record as of August 12, 2019. Exhibit 99.1

4 Executive Leadership Changes As reported concurrently with this release, Regency has announced the transition of Martin E. “Hap” Stein, Jr. from Chairman and Chief Executive Officer to Executive Chairman, effective January 1, 2020. Concurrent with this transition, Regency’s Board of Directors is pleased to announce that Lisa Palmer will become President and Chief Executive Officer. As part of the Company’s succession plan, Ms. Palmer will vacate her role as Chief Financial Officer, retaining her position as President, effective August 12, 2019, with Mike Mas assuming the position of Executive Vice President, Chief Financial Officer, at that time. Additionally, to more accurately reflect their roles within the Company, Jim Thompson will become Executive Vice President, Chief Operating Officer, and Mac Chandler will become Executive Vice President, Chief Investment Officer, effective August 12, 2019. 2019 Guidance The Company has updated certain components of its 2019 earnings guidance. Guidance for NAREIT FFO is unchanged at the midpoint. The NAREIT FFO range has been updated to reflect the one-time charge of $3.0 million, or $0.02 per diluted share, related to the one-time non-cash straight-line rent charge. Please refer to the Company’s second quarter 2019 supplemental information package for a complete list of updates. Conference Call Information To discuss Regency’s second quarter results, Management will host a conference call on Friday, August 2, 2019, at 11:00 a.m. EDT. Dial-in and webcast information is listed below. Second Quarter 2019 Earnings Conference Call Date: Friday, August 2, 2019 Time: 11:00 a.m. ET Dial#: 877-407-0789 or 201-689-8563 Webcast: investors.regencycenters.com Current GuidancePrevious GuidanceNet Income Attributable to Common Stockholders (“Net Income”)$1.56 - $1.60$1.41 - $1.47NAREIT Funds From Operations (“NAREIT FFO”) per diluted share$3.81 - $3.85$3.80 - $3.86Same Property Net Operating Income (“SPNOI”) Growth excluding termination fees (pro-rata)2.0% - 2.5%2.0% - 2.5%2019 Guidance All figures pro-rata and in thousands, except per share data Exhibit 99.1

5 Replay Webcast Archive: Investor Relations page under Events & Webcasts Non-GAAP Disclosure The Company uses certain non-GAAP performance measures, in addition to the required GAAP presentations, as we believe these measures improve the understanding of the Company's operational results. We manage our entire real estate portfolio without regard to ownership structure, although certain decisions impacting properties owned through partnerships require partner approval. Therefore, we believe presenting our pro-rata share of operating results regardless of ownership structure, along with other non-GAAP measures, makes comparisons of other REITs' operating results to the Company's more meaningful. We continually evaluate the usefulness, relevance, limitations, and calculation of our reported non-GAAP performance measures to determine how best to provide relevant information to the public, and thus such reported measures could change. NAREIT FFO is a commonly used measure of REIT performance, which the National Association of Real Estate Investment Trusts (“NAREIT”) defines as net income, computed in accordance with GAAP, excluding gains on sale and impairments of real estate, net of tax, plus depreciation and amortization, and after adjustments for unconsolidated partnerships and joint ventures. Regency computes NAREIT FFO for all periods presented in accordance with NAREIT's definition in effect during that period. Effective January 1, 2019, the Company prospectively adopted the NAREIT FFO White Paper – 2018 Restatement (“2018 FFO White Paper”), and elected the option of excluding gains on sale and impairments of land, which are considered incidental to the Company’s main business. Prior period amounts were not restated to conform to the current year presentation, and therefore are calculated as described above, but also include gains on sales and impairments of land. Many companies use different depreciable lives and methods, and real estate values historically fluctuate with market conditions. Since NAREIT FFO excludes depreciation and amortization and gains on sales and impairments of real estate, it provides a performance measure that, when compared year over year, reflects the impact on operations from trends in occupancy rates, rental rates, operating costs, acquisition and development activities, and financing costs. This provides a perspective of the Company’s financial performance not immediately apparent from net income determined in accordance with GAAP. Thus, NAREIT FFO is a supplemental non-GAAP financial measure of the Company's operating performance, which does not represent cash generated from operating activities in accordance with GAAP; and, therefore, should not be considered a substitute measure of cash flows from operations. The Company provides a reconciliation of Net Income Attributable to Common Stockholders to NAREIT FFO. Core Operating Earnings is an additional performance measure that excludes from NAREIT FFO: (i) transaction related income or expenses; (ii) gains or losses from the early extinguishment of debt; (iii) certain non-cash components of earnings derived from above and below market rent amortization, straight-line rents, and amortization of mark-to-market of debt adjustments; and (iv) other amounts as they occur. The Company provides a reconciliation of Net Income to NAREIT FFO to Core Operating Earnings. Exhibit 99.1

6 Reconciliation of Net Income Attributable to Common Stockholders to NAREIT FFO and Core Operating Earnings - Actual (in thousands) Same property NOI is a key non-GAAP measure used by management in evaluating the operating performance of Regency’s properties. The Company provides a reconciliation of net income to pro-rata same property NOI. For the Periods Ended June 30, 2019 and 20182019201820192018Reconciliation of Net Income to NAREIT FFO:Net Income Attributable to Common Stockholders51,728$ 47,841 142,174$ 100,500 Adjustments to reconcile to NAREIT Funds From Operations(1):Depreciation and amortization (excluding FF&E)100,168 97,189 204,665 193,386 Gain on sale of operating properties(2,393) (246) (39,463) (348) Provision for impairment to operating properties10,441 12,440 12,113 28,494 Gain (loss) on sale of land(2)(17) - 1 - Exchangeable operating partnership units109100299212NAREIT Funds From Operations160,036$ 157,324319,789$ 322,244Reconciliation of NAREIT FFO to Core Operating Earnings:NAREIT Funds From Operations160,036$ 157,324 319,789$ 322,244 Adjustments to reconcile to Core Operating Earnings(1):Gain on sale of land(2)- (869) - (976) Provision for impairment to land- 93 - 93 Early extinguishment of debt- 11,010 10,591 11,172 Interest on bonds for period from notice to redemption- - 367 600 Straight line rent, net(505) (4,749) (4,674) (8,830) Above/below market rent amortization, net(6,640) (11,378) (19,975) (19,801) Debt premium/discount amortization(459) (897) (986) (1,795) Core Operating Earnings152,432$ 150,534305,112$ 302,707Weighted Average Shares For Diluted Earnings per Share167,962 169,682 167,877 170,291 Weighted Average Shares For Diluted FFO and Core Operating Earnings per Share168,312 170,032 168,227 170,641 (2) Effective January 1, 2019, Regency prospectively adopted the NAREIT FFO White Paper – 2018 Restatement, and elected the option of excluding gains on sales and impairments of land, which are considered incidental to the Company’s main business. Prior period amounts were not restated to conform to the current year presentation of NAREIT FFO, and therefore include gains on sales and impairments of land.Three Months EndedYear to Date(1) Includes Regency's consolidated entities and its pro-rata share of unconsolidated co-investment partnerships, net of pro-rata share attributable to noncontrolling interests. Exhibit 99.1
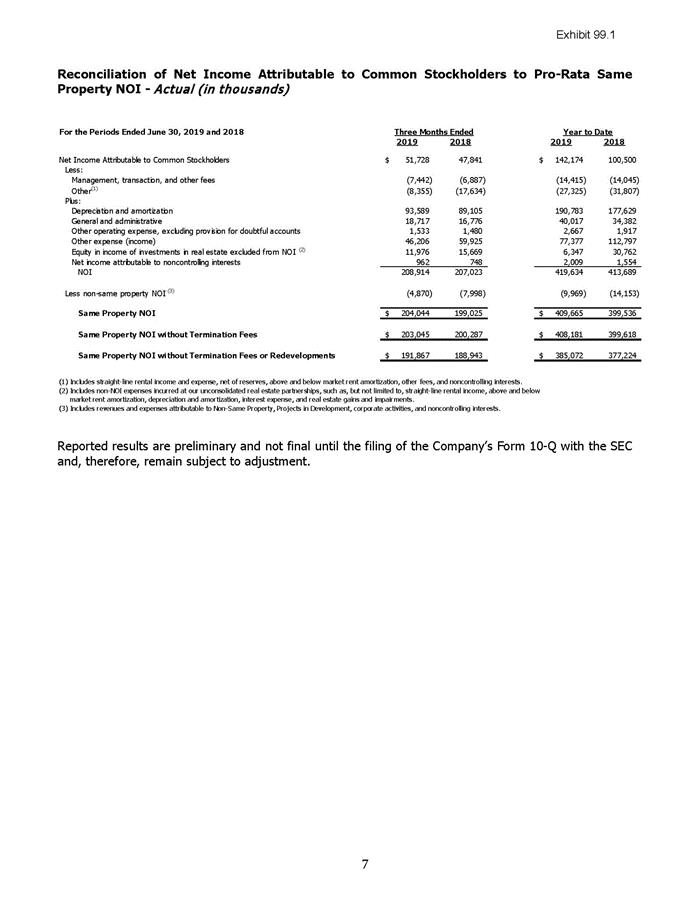
7 Reconciliation of Net Income Attributable to Common Stockholders to Pro-Rata Same Property NOI - Actual (in thousands) Reported results are preliminary and not final until the filing of the Company’s Form 10-Q with the SEC and, therefore, remain subject to adjustment. For the Periods Ended June 30, 2019 and 20182019201820192018Net Income Attributable to Common Stockholders51,728$ 47,841 142,174$ 100,500 Less:Management, transaction, and other fees(7,442) (6,887) (14,415) (14,045) Other(1)(8,355) (17,634) (27,325) (31,807) Plus:Depreciation and amortization93,589 89,105 190,783 177,629 General and administrative18,717 16,776 40,017 34,382 Other operating expense, excluding provision for doubtful accounts1,533 1,480 2,667 1,917 Other expense (income)46,206 59,925 77,377 112,797 Equity in income of investments in real estate excluded from NOI (2)11,976 15,669 6,347 30,762 Net income attributable to noncontrolling interests962 748 2,009 1,554 NOI208,914 207,023 419,634 413,689 Less non-same property NOI (3)(4,870) (7,998) (9,969) (14,153) Same Property NOI204,044$ 199,025 409,665$ 399,536 Same Property NOI without Termination Fees203,045$ 200,287 408,181$ 399,618 Same Property NOI without Termination Fees or Redevelopments191,867$ 188,943 385,072$ 377,224 (1) Includes straight-line rental income and expense, net of reserves, above and below market rent amortization, other fees, and noncontrolling interests.(2) Includes non-NOI expenses incurred at our unconsolidated real estate partnerships, such as, but not limited to, straight-line rental income, above and below market rent amortization, depreciation and amortization, interest expense, and real estate gains and impairments.(3) Includes revenues and expenses attributable to Non-Same Property, Projects in Development, corporate activities, and noncontrolling interests.Three Months EndedYear to Date Exhibit 99.1

8 Reconciliation of Net Income Attributable to Common Stockholders to NAREIT FFO — Guidance (per diluted share) The Company has published forward-looking statements and additional financial information in its second quarter 2019 supplemental information package that may help investors estimate earnings for 2019. A copy of the Company’s second quarter 2019 supplemental information will be available on the Company's website at www.RegencyCenters.com or by written request to: Investor Relations, Regency Centers Corporation, One Independent Drive, Suite 114, Jacksonville, Florida, 32202. The supplemental information package contains more detailed financial and property results including financial statements, an outstanding debt summary, acquisition and development activity, investments in partnerships, information pertaining to securities issued other than common stock, property details, a significant tenant rent report and a lease expiration table in addition to earnings and valuation guidance assumptions. The information provided in the supplemental package is unaudited and there can be no assurance that the information will not vary from the final information in the Company’s Form 10-Q for the quarter ended June 30, 2019. Regency may, but assumes no obligation to, update information in the supplemental package from time to time. About Regency Centers Corporation (NASDAQ: REG) Regency Centers is the preeminent national owner, operator, and developer of shopping centers located in affluent and densely populated trade areas. Our portfolio includes thriving properties merchandised with highly productive grocers, restaurants, service providers, and best-in-class retailers that connect to our neighborhoods, communities, and customers. Operating as a fully integrated real estate company, Regency Centers is a qualified real estate investment trust (REIT) that is self-administered, self-managed, and an S&P 500 Index member. For more information, please visit RegencyCenters.com. ### Forward-looking statements involve risks and uncertainties. Actual future performance, outcomes and results may differ materially from those expressed in forward-looking statements. Please refer to the documents filed by Regency Centers Corporation with the SEC, specifically the most recent reports on Forms 10-K and 10-Q, which identify important risk factors which could cause actual results to differ from those contained in the forward-looking statements. NAREIT FFO Guidance:LowHighNet income attributable to common stockholders1.56$ 1.60 Adjustments to reconcile net income to NAREIT FFO:Depreciation and amortization2.41 2.41 Provision for impairment0.07 0.07 Gain on sale of operating properties(0.23)(0.23)NAREIT Funds From Operations3.81$ 3.85 Full Year2019 Exhibit 99.1

Exhibit 99.2 Quarterly Supplemental 2nd Quarter 2019 Indigo Square Charleston, SC Shops at Erwin Mill Durham, NC Twin Peaks San Diego, CA The Market at Springwoods Village Houston, TX Investor Relations [email protected] One Independent Drive, Suite 114 Jacksonville, FL 32202 RencyCenters.com Regency Centers

Disclosures June 30, 2019 i Accounting and Disclosure Changes FASB Accounting Standards Codification – Topic 842 (Leases) (“Leases Standard”) Effective January 1, 2019, Regency adopted Accounting Standards Codification (ASC) Topic 842, Leases , under the modified retrospective transition approach allowing for initial application at the date of adoption. The Company also elected to reclassify the prior period amounts to conform to the current year presentation. The financial statements have been impacted as follows: Consolidated Statements of Operations • All lease income earned pursuant to tenant leases in 2019, and as reclassified for 2018, which includes but is not limited to Base rent, Recoveries from tenants and Percentage rent, is reflected in Lease income. • Lease income is presented net of revenues deemed uncollectible for the current period. Prior period presentation of this line item was included in Operating expenses as Provision for doubtful accounts. • Real estate revenues earned not specific to tenant leases in 2019 have been reclassified from Recoveries from tenants and other income to Other property income. • Indirect internal leasing and legal costs associated with the execution of lease agreements that were previously capitalized are expensed in General and administrative in Operating expenses in the current period. Consolidated Balance Sheets • Addition of Lease liabilities and corresponding Right of use assets, net of or including the opening balance for straight line rent and above/below market intangibles, for its ground and office leases where Regency is the lessee. NAREIT Funds from Operations Regency prospectively adopted the NAREIT FFO White Paper – 2018 Restatement (“2018 FFO Whitepaper”), and elected the option of excluding gains on the sale and impairments of land from NAREIT FFO, which are considered incidental to the Company’s main business. Prior period amounts were not restated to conform to the current year presentation of NAREIT FFO, and therefore include gains on sales and impairments of land. Non-GAAP Disclosures We use certain non-GAAP performance measures, in addition to the required GAAP presentations, as we believe these measures improve the understanding of the Company's operational results. We manage our entire real estate portfolio without regard to ownership structure, although certain decisions impacting properties owned through partnerships require partner approval. Therefore, we believe presenting our pro-rata share of operating results regardless of ownership structure, along with other non-GAAP measures, makes comparisons of other REITs' operating results to the Company's more meaningful. We continually evaluate the usefulness, relevance, limitations, and calculation of our reported non-GAAP performance measures to determine how best to provide relevant information to the public, and thus such reported measures could change. The pro-rata information provided is not, and is not intended to be, presented in accordance with GAAP. The pro-rata supplemental details of assets and liabilities and supplemental details of operations reflect our proportionate economic ownership of the assets, liabilities and operating results of the properties in our portfolio, regardless of ownership structure. Exhibit 99.2

Disclosures June 30, 2019 ii • The items labeled as "Consolidated" are prepared on a basis consistent with the Company's consolidated financial statements as filed with the SEC on the most recent Form 10-Q or 10-K, as applicable. • The columns labeled "Share of JVs" represent our ownership interest in our unconsolidated (equity method) investments in real estate partnerships, and was derived on a partnership by partnership basis by applying to each financial statement line item our ownership percentage interest used to arrive at our share of investments in real estate partnerships and equity in income or loss of investments in real estate partnerships during the period when applying the equity method of accounting to each of our unconsolidated co-investment partnerships. • A similar calculation was performed for the amounts in columns labeled ''Noncontrolling Interests”, which represent the limited partners’ interests in consolidated partnerships attributable to each financial statement line item. We do not control the unconsolidated investment partnerships, and the presentations of the assets and liabilities and revenues and expenses do not necessarily represent our legal claim to such items. The partners are entitled to profit or loss allocations and distributions of cash flows according to the operating agreements, which provide for such allocations according to their invested capital. Our share of invested capital establishes the ownership interest we use to prepare our pro-rata share. The presentation of pro-rata financial information has limitations as an analytical tool. Some of these limitations include, but are not limited to the following: • The amounts shown on the individual line items were derived by applying our overall economic ownership interest percentage determined when applying the equity method of accounting or allocating noncontrolling interests, and do not necessarily represent our legal claim to the assets and liabilities, or the revenues and expenses; and • Other companies in our industry may calculate their pro-rata interests differently, limiting the comparability of pro-rata information. Because of these limitations, the supplemental details of assets and liabilities and supplemental details of operations should not be considered independently or as a substitute for our financial statements as reported under GAAP. We compensate for these limitations by relying primarily on our GAAP results and using the pro-rata details as a supplement. The following non-GAAP measures, as defined in the Glossary of Terms, are commonly used by management and the investing public to understand and evaluate our operating results and performance: • NAREIT Funds From Operations (NAREIT FFO): The Company believes NAREIT FFO provides a performance measure that, when compared year over year, reflects the impact on operations from trends in occupancy rates, rental rates, operating costs, acquisition and development activities, and financing costs. The Company provides a reconciliation of Net Income Attributable to Common Stockholders to NAREIT FFO. • Net Operating Income (NOI): The Company believes NOI provides useful information to investors to measure the operating performance of its portfolio of properties. The Company provides a reconciliation of Net Income Attributable to Common Stockholders to pro-rata NOI. • Core Operating Earnings (previously Operating FFO): The Company believes Core Operating Earnings, which excludes certain non-cash and non-comparable items from the computation of NAREIT FFO that affect the Company's period-over-period performance, is useful to investors because it is more reflective of the core operating performance of its portfolio of properties. The Company provides a reconciliation of NAREIT FFO to Core Operating Earnings. Exhibit 99.2
Disclosures June 30, 2019 iii • Same Property NOI: The Company provides disclosure of NOI on a same property basis because it believes the measure provides investors with additional information regarding the operating performances of comparable assets. Same Property NOI excludes all development, non-same property and corporate level revenue and expenses. The Company also provides disclosure of NOI excluding termination fees, which excludes both termination fee income and expenses. Exhibit 99.2

NEWS RELEASE For immediate release Laura Clark 904 598 7831 [email protected] iv Regency Centers Reports Second Quarter 2019 Results JACKSONVILLE, Fla. (August 1, 2019) – Regency Centers Corporation (“Regency” or the “Company”) today reported financial and operating results for the period ended June 30, 2019. Second Quarter 2019 Highlights • For the three months ended June 30, 2019, Net Income Attributable to Common Stockholders (“Net Income”) of $0.31 per diluted share. • Second quarter NAREIT Funds From Operations (“NAREIT FFO”) of $0.95 per diluted share, which includes a $0.02 per share charge from one-time non-cash expenses. • Year-to-date same property Net Operating Income (“NOI”), excluding termination fees, increased 2.1%, as compared to the same period in 2018, driven by Base Rent growth of 2.5%. • As of June 30, 2019, the same property portfolio was 95.1% leased. • On a trailing twelve months basis, rent spreads on comparable new and renewal leases were 19.8% and 6.9%, respectively, with total rent spreads of 8.9%. • For the three months ended June 30, 2019, total leasing volume of approximately 1.9 million square feet of new and renewal leases, at blended rent spreads of 7.0%. • As of June 30, 2019, a total of 23 properties were in development or redevelopment representing a total investment of approximately $474 million. • Subsequent to the quarter, Regency acquired The Pruneyard in Silicon Valley for a purchase price of approximately $212.5 million. • During the second quarter, Regency issued its annual Corporate Responsibility Report, highlighting the Company’s accomplishments in key areas of environmental, social, and governance initiatives. The Company was also recently included in the S&P 500 ESG index and received a rating upgrade to A from MSCI. • On August 1, 2019, Regency announced the transition of Martin E. “Hap” Stein, Jr. from Chairman and Chief Executive Officer to Executive Chairman, to be succeeded by Lisa Palmer as President and Chief Executive Officer effective January 1, 2020. As part of the Company’s succession plan, Ms. Palmer will vacate her role as Chief Financial Officer, retaining her position as President, effective August 12, 2019, with Mike Mas assuming the position of Executive Vice President, Chief Financial Officer, at that time. • On July 31, 2019, Regency’s Board declared a quarterly cash dividend on the Company’s common stock of $0.585 per share. “I am deeply gratified to work with the best professionals in the business who have been the cornerstone to Regency’s ongoing success in building a wonderful company,” said Martin E. “Hap” Stein, Jr., Chairman and Chief Executive Officer. “Through this seamless transition, I have no doubt that Lisa and the team will continue to execute on our strategic objectives and make even more progress on Regency’s journey from good to great, while generating total returns of 8% to 10%.” Exhibit 99.2

v Financial Results Regency reported Net Income for the second quarter of $51.7 million, or $0.31 per diluted share compared to the Net Income Attributable to Common Stockholders of $47.8 million, or $0.28 per diluted share, for the same period in 2018. The Company reported NAREIT FFO for the second quarter of $160.0 million, or $0.95 per diluted share, compared to $157.3 million, or $0.93 per diluted share, for the same period in 2018. For the three months ended June 30, 2019, the Company’s results included a negative impact of $3.0 million, or $0.02 per diluted share, from one-time non-cash expenses related to straightline rent reserves for tenants where it is no longer probable that those tenants will remain in occupancy for the duration of their current lease. The Company reported Core Operating Earnings for the second quarter of $152.4 million, or $0.91 per diluted share, compared to $150.5 million, or $0.89 per diluted share, for the same period in 2018. Core operating earnings per share growth was 4.6% for the second quarter, when adjusted for the adoption of Accounting Standard Codification 842, Leases . The Company views Core Operating Earnings, which excludes certain non-recurring items as well as non-cash components of earnings derived from above and below market rent amortization, straight-line rents, and amortization of debt mark-to-market, as a better measure of business performance as it more closely reflects cash earnings and the Company’s ability to grow the dividend. Portfolio Performance Regency’s portfolio is differentiated in its overall outstanding quality, breadth and scale. The strength of the Company’s merchandising mix, combined with placemaking elements and connection to its communities further differentiate Regency’s high quality portfolio. Regency’s national platform with 22 local market offices offers critical strategic advantages and positions the Company to achieve its strategic objective to average 3% same property NOI growth over the long term. Second quarter same property NOI, excluding termination fees, increased 1.4% compared to the same period in 2018, which was primarily impacted by the Sears bankruptcy and timing of reconciliations. Yearto- date same property NOI, excluding termination fees, increased 2.1%, as compared to the same period in 2018, driven by Base Rent growth of 2.5%. As of June 30, 2019, Regency’s wholly-owned portfolio plus its pro-rata share of co-investment partnerships was 94.7% leased. The same property portfolio was 95.1% leased, which is an increase of 10 basis points sequentially and a decrease of 60 basis points from the same period in 2018, primarily driven by the Sears bankruptcy. For the three months ended June 30, 2019, Regency executed approximately 1.9 million square feet of comparable new and renewal leases at blended rent spreads of 7.0%. Rent spreads on new and renewal leases were 6.9% and 7.0%, respectively. For the trailing twelve months, the Company executed approximately 6.9 million square feet of comparable new and renewal leases at blended rent spreads of 8.9%. Portfolio Enhancement and Capital Allocation Regency’s capital allocation strategy enables the Company to benefit from a self-funding model, in which free cash flow is the source of funding, and supports the development and redevelopment program on Exhibit 99.2
vi a leverage neutral basis. Regency’s development and redevelopment platform is a critical strategic advantage for creating significant value for shareholders. Together with the sales of lower growth assets and equity when priced attractively, free cash flow also enables the Company to invest in high-growth acquisitions and share repurchases when pricing is compelling. This capital allocation strategy preserves Regency’s pristine balance sheet and allows the Company to add value and enhance the quality of the portfolio on a net accretive basis. Developments and Redevelopments At quarter end, the Company had 23 properties in development or redevelopment with, estimated net project costs of approximately $474 million. In-process developments and redevelopments were 89% leased and committed as of June 30, 2019, and are expected to yield an average return of 7.6%. During the quarter, Regency started one ground-up development project and four redevelopment projects. The ground-up development project, Culver Public Market, is a 27,000 - square foot urban retail project located in the dynamic high-barrier-to-entry Culver City submarket of Los Angeles, California. The total project cost is approximately $27 million at a projected 6.0% stabilized yield. As previously reported, Regency started the generational redevelopment of The Abbot, located in the heart of Harvard Square in Cambridge, MA. The project will modernize and expand the iconic property offering flagship retail and office uses. The total project cost is approximately $52 million at a projected incremental 9.3% stabilized yield. Property Transactions During the quarter the Company acquired 6401 Roosevelt in Seattle, WA for $3.6 million. This multitenant retail building is adjacent to the Company’s Whole Foods anchored operating property, Roosevelt Square. Subsequent to quarter end, the Company acquired The Pruneyard, a 258,000 square foot center located in Silicon Valley for $212.5 million at a 4.3% cap rate. The center is anchored by Trader Joe’s and Marshalls and sits in close proximity to the West Valley’s most affluent neighborhoods and technology employers. In addition to the retail portion, The Pruneyard also benefits from three adjacent office towers totaling 360,000 square feet and an adjacent 171-key hotel, which were not part of the transaction. On a year-to-date basis, including The Pruneyard acquisition subsequent to the quarter end, the Company has closed on $231.6 million of acquisitions and $136.5 million of dispositions. Balance Sheet Regency benefits from favorable access to capital through the strength of its balance sheet, supported by conservative leverage levels with a Net Debt to EBITDAre ratio of 5.3x. This positions Regency to weather potential challenges and potentially profit from investment opportunities in the future. Dividend On July 31, 2019, Regency’s Board declared a quarterly cash dividend on the Company’s common stock of $0.585 per share. The dividend is payable on August 22, 2019, to shareholders of record as of August 12, 2019. Exhibit 99.2
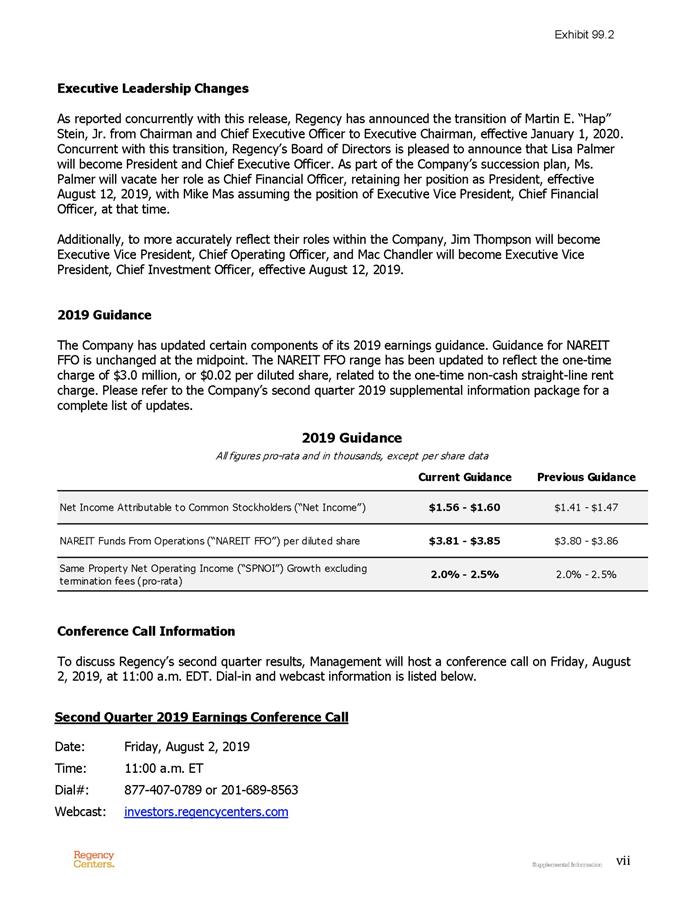
vii Executive Leadership Changes As reported concurrently with this release, Regency has announced the transition of Martin E. “Hap” Stein, Jr. from Chairman and Chief Executive Officer to Executive Chairman, effective January 1, 2020. Concurrent with this transition, Regency’s Board of Directors is pleased to announce that Lisa Palmer will become President and Chief Executive Officer. As part of the Company’s succession plan, Ms. Palmer will vacate her role as Chief Financial Officer, retaining her position as President, effective August 12, 2019, with Mike Mas assuming the position of Executive Vice President, Chief Financial Officer, at that time. Additionally, to more accurately reflect their roles within the Company, Jim Thompson will become Executive Vice President, Chief Operating Officer, and Mac Chandler will become Executive Vice President, Chief Investment Officer, effective August 12, 2019. 2019 Guidance The Company has updated certain components of its 2019 earnings guidance. Guidance for NAREIT FFO is unchanged at the midpoint. The NAREIT FFO range has been updated to reflect the one-time charge of $3.0 million, or $0.02 per diluted share, related to the one-time non-cash straight-line rent charge. Please refer to the Company’s second quarter 2019 supplemental information package for a complete list of updates. Conference Call Information To discuss Regency’s second quarter results, Management will host a conference call on Friday, August 2, 2019, at 11:00 a.m. EDT. Dial-in and webcast information is listed below. Second Quarter 2019 Earnings Conference Call Date: Friday, August 2, 2019 Time: 11:00 a.m. ET Dial#: 877-407-0789 or 201-689-8563 Webcast: investors.regencycenters.com Current Guidance Previous Guidance Net Income Attributable to Common Stockholders (“Net Income”) $1.56 - $1.60 $1.41 - $1.47 NAREIT Funds From Operations (“NAREIT FFO”) per diluted share $3.81 - $3.85 $3.80 - $3.86 Same Property Net Operating Income (“SPNOI”) Growth excluding termination fees (pro-rata) 2.0% - 2.5% 2.0% - 2.5% 2019 Guidance All figures pro-rata and in thousands, except per share data Exhibit 99.2

viii Replay Webcast Archive: Investor Relations page under Events & Webcasts Non-GAAP Disclosure The Company uses certain non-GAAP performance measures, in addition to the required GAAP presentations, as we believe these measures improve the understanding of the Company's operational results. We manage our entire real estate portfolio without regard to ownership structure, although certain decisions impacting properties owned through partnerships require partner approval. Therefore, we believe presenting our pro-rata share of operating results regardless of ownership structure, along with other non-GAAP measures, makes comparisons of other REITs' operating results to the Company's more meaningful. We continually evaluate the usefulness, relevance, limitations, and calculation of our reported non-GAAP performance measures to determine how best to provide relevant information to the public, and thus such reported measures could change. NAREIT FFO is a commonly used measure of REIT performance, which the National Association of Real Estate Investment Trusts (“NAREIT”) defines as net income, computed in accordance with GAAP, excluding gains on sale and impairments of real estate, net of tax, plus depreciation and amortization, and after adjustments for unconsolidated partnerships and joint ventures. Regency computes NAREIT FFO for all periods presented in accordance with NAREIT's definition in effect during that period. Effective January 1, 2019, the Company prospectively adopted the NAREIT FFO White Paper – 2018 Restatement (“2018 FFO White Paper”), and elected the option of excluding gains on sale and impairments of land, which are considered incidental to the Company’s main business. Prior period amounts were not restated to conform to the current year presentation, and therefore are calculated as described above, but also include gains on sales and impairments of land. Many companies use different depreciable lives and methods, and real estate values historically fluctuate with market conditions. Since NAREIT FFO excludes depreciation and amortization and gains on sales and impairments of real estate, it provides a performance measure that, when compared year over year, reflects the impact on operations from trends in occupancy rates, rental rates, operating costs, acquisition and development activities, and financing costs. This provides a perspective of the Company’s financial performance not immediately apparent from net income determined in accordance with GAAP. Thus, NAREIT FFO is a supplemental non-GAAP financial measure of the Company's operating performance, which does not represent cash generated from operating activities in accordance with GAAP; and, therefore, should not be considered a substitute measure of cash flows from operations. The Company provides a reconciliation of Net Income Attributable to Common Stockholders to NAREIT FFO. Core Operating Earnings is an additional performance measure that excludes from NAREIT FFO: (i) transaction related income or expenses; (ii) gains or losses from the early extinguishment of debt; (iii) certain non-cash components of earnings derived from above and below market rent amortization, straight-line rents, and amortization of mark-to-market of debt adjustments; and (iv) other amounts as they occur. The Company provides a reconciliation of Net Income to NAREIT FFO to Core Operating Earnings. Exhibit 99.2
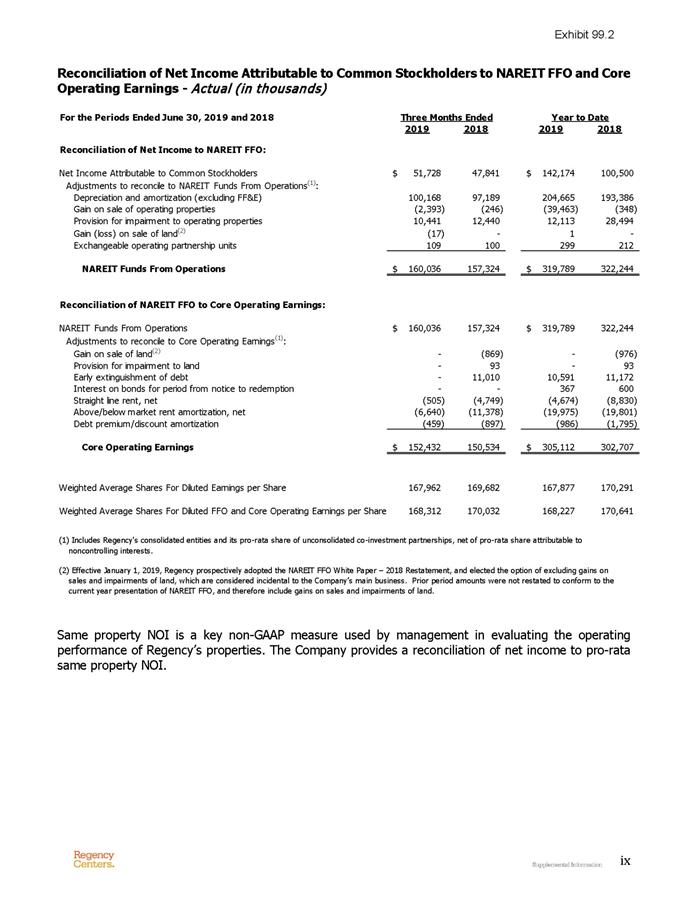
ix Reconciliation of Net Income Attributable to Common Stockholders to NAREIT FFO and Core Operating Earnings - Actual (in thousands) Same property NOI is a key non-GAAP measure used by management in evaluating the operating performance of Regency’s properties. The Company provides a reconciliation of net income to pro-rata same property NOI. For the Periods Ended June 30, 2019 and 2018 2019 2018 2019 2018 Reconciliation of Net Income to NAREIT FFO: Net Income Attributable to Common Stockholders $ 51,728 47,841 $ 142,174 100,500 Adjustments to reconcile to NAREIT Funds From Operations(1): Depreciation and amortization (excluding FF&E) 100,168 97,189 204,665 193,386 Gain on sale of operating properties (2,393) (246) (39,463) (348) Provision for impairment to operating properties 10,441 12,440 12,113 28,494 Gain (loss) on sale of land(2) (17) - 1 - Exchangeable operating partnership units 109 100 299 212 NAREIT Funds From Operations $ 160,036 157,324 $ 319,789 322,244 Reconciliation of NAREIT FFO to Core Operating Earnings: NAREIT Funds From Operations $ 160,036 157,324 $ 319,789 322,244 Adjustments to reconcile to Core Operating Earnings(1): Gain on sale of land(2) - (869) - (976) Provision for impairment to land - 93 - 93 Early extinguishment of debt - 11,010 10,591 11,172 Interest on bonds for period from notice to redemption - - 3 67 6 00 Straight line rent, net (505) (4,749) (4,674) (8,830) Above/below market rent amortization, net (6,640) (11,378) (19,975) (19,801) Debt premium/discount amortization (459) (897) (986) (1,795) Core Operating Earnings $ 152,432 150,534 $ 305,112 302,707 Weighted Average Shares For Diluted Earnings per Share 167,962 169,682 167,877 170,291 Weighted Average Shares For Diluted FFO and Core Operating Earnings per Share 168,312 170,032 168,227 170,641 (2) Effective January 1, 2019, Regency prospectively adopted the NAREIT FFO White Paper – 2018 Restatement, and elected the option of excluding gains on sales and impairments of land, which are considered incidental to the Company’s main business. Prior period amounts were not restated to conform to the current year presentation of NAREIT FFO, and therefore include gains on sales and impairments of land. Three Months Ended Year to Date (1) Includes Regency's consolidated entities and its pro-rata share of unconsolidated co-investment partnerships, net of pro-rata share attributable to noncontrolling interests. Exhibit 99.2

x Reconciliation of Net Income Attributable to Common Stockholders to Pro-Rata Same Property NOI - Actual (in thousands) Reported results are preliminary and not final until the filing of the Company’s Form 10-Q with the SEC and, therefore, remain subject to adjustment. For the Periods Ended June 30, 2019 and 2018 2019 2018 2019 2018 Net Income Attributable to Common Stockholders $ 51,728 47,841 $ 142,174 100,500 Less: Management, transaction, and other fees (7,442) (6,887) (14,415) (14,045) Other(1) (8,355) (17,634) (27,325) (31,807) Plus: Depreciation and amortization 93,589 89,105 190,783 177,629 General and administrative 18,717 16,776 40,017 34,382 Other operating expense, excluding provision for doubtful accounts 1,533 1,480 2,667 1,917 Other expense (income) 46,206 59,925 77,377 112,797 Equity in income of investments in real estate excluded from NOI (2) 11,976 15,669 6,347 30,762 Net income attributable to noncontrolling interests 962 748 2,009 1,554 NOI 208,914 207,023 419,634 413,689 Less non-same property NOI (3) (4,870) (7,998) (9,969) (14,153) Same Property NOI $ 204,044 199,025 $ 409,665 399,536 Same Property NOI without Termination Fees $ 203,045 200,287 $ 408,181 399,618 Same Property NOI without Termination Fees or Redevelopments $ 191,867 188,943 $ 385,072 377,224 (1) Includes straight-line rental income and expense, net of reserves, above and below market rent amortization, other fees, and noncontrolling interests. (2) Includes non-NOI expenses incurred at our unconsolidated real estate partnerships, such as, but not limited to, straight-line rental income, above and below market rent amortization, depreciation and amortization, interest expense, and real estate gains and impairments. (3) Includes revenues and expenses attributable to Non-Same Property, Projects in Development, corporate activities, and noncontrolling interests. Three Months Ended Year to Date Exhibit 99.2

xi Reconciliation of Net Income Attributable to Common Stockholders to NAREIT FFO — Guidance (per diluted share) The Company has published forward-looking statements and additional financial information in its second quarter 2019 supplemental information package that may help investors estimate earnings for 2019. A copy of the Company’s second quarter 2019 supplemental information will be available on the Company's website at www.RegencyCenters.com or by written request to: Investor Relations, Regency Centers Corporation, One Independent Drive, Suite 114, Jacksonville, Florida, 32202. The supplemental information package contains more detailed financial and property results including financial statements, an outstanding debt summary, acquisition and development activity, investments in partnerships, information pertaining to securities issued other than common stock, property details, a significant tenant rent report and a lease expiration table in addition to earnings and valuation guidance assumptions. The information provided in the supplemental package is unaudited and there can be no assurance that the information will not vary from the final information in the Company’s Form 10-Q for the quarter ended June 30, 2019. Regency may, but assumes no obligation to, update information in the supplemental package from time to time. About Regency Centers Corporation (NASDAQ: REG) Regency Centers is the preeminent national owner, operator, and developer of shopping centers located in affluent and densely populated trade areas. Our portfolio includes thriving properties merchandised with highly productive grocers, restaurants, service providers, and best-in-class retailers that connect to our neighborhoods, communities, and customers. Operating as a fully integrated real estate company, Regency Centers is a qualified real estate investment trust (REIT) that is self-administered, self-managed, and an S&P 500 Index member. For more information, please visit RegencyCenters.com. ### Forward-looking statements involve risks and uncertainties. Actual future performance, outcomes and results may differ materially from those expressed in forward-looking statements. Please refer to the documents filed by Regency Centers Corporation with the SEC, specifically the most recent reports on Forms 10-K and 10-Q, which identify important risk factors which could cause actual results to differ from those contained in the forward-looking statements. NAREIT FFO Guidance: Low High Net income attributable to common stockholders $ 1.56 1.60 Adjustments to reconcile net income to NAREIT FFO: Depreciation and amortization 2.41 2.41 Provision for impairment 0.07 0.07 Gain on sale of operating properties (0.23) (0.23) NAREIT Funds From Operations $ 3.81 3.85 Full Year 2019 Exhibit 99.2

2019 2018 2019 2018 Financial Results Net income attributable to common stockholders (page 4) $51,728 $47,841 $142,174 $100,500 Net income per diluted share $0.31 $0.28 $0.85 $0.59 NAREIT Funds From Operations (NAREIT FFO) (page 9) $160,036 $157,324 $319,789 $322,244 NAREIT FFO per diluted share $0.95 $0.93 $1.90 $1.89 Core Operating Earnings (previously Operating FFO) (page 9) $152,432 $150,534 $305,112 $302,707 Core Operating Earnings per diluted share $0.91 $0.89 $1.81 $1.77 Same Property NOI without termination fees (page 8) $203,045 $200,287 $408,181 $399,618 % growth 1.4% 2.1% Operating EBITDAre (page 10) $198,593 $197,616 $398,072 $395,274 Dividends paid per share and unit $0.585 $0.555 $1.170 $1.110 Payout ratio of Core Operating Earnings per share (diluted) 64.3% 62.4% 64.6% 62.7% Diluted share and unit count Weighted average shares (diluted) - Net income 167,962 169,682 167,877 170,291 Weighted average shares (diluted) - NAREIT FFO and Core Operating Earnings 168,312 170,032 168,227 170,641 As of As of As of As of 6/30/19 12/31/18 12/31/17 12/31/16 Capital Information Market price per common share $66.74 $58.47 $69.18 $68.95 Common shares outstanding 167,555 167,905 171,365 104,497 Exchangeable units held by noncontrolling interests 350 350 350 154 Common shares and equivalents issued and outstanding 167,905 168,255 171,715 104,651 Market equity value of common and convertible shares $11,205,994 $9,837,840 $11,879,231 $7,215,718 Non-convertible preferred stock $0 $0 $0 $325,000 Outstanding debt $4,208,504 $4,241,758 $4,115,588 $2,111,450 Less: cash (37,364) (45,190) (49,381) ($17,879) Net debt $4,171,140 $4,196,568 $4,066,207 $2,093,571 Total market capitalization $15,377,134 $14,034,408 $15,945,438 $9,634,289 Debt metrics (pro-rata; trailing 12 months "TTM") Net Debt-to-Operating EBITDAre 5.3x 5.3x 5.4x 4.4x Fixed charge coverage 4.3x 4.2x 4.1x 3.3x Summary Financial Information June 30, 2019 (in thousands, except per share data) Three Months Ended Year to Date 1 Exhibit 99.2
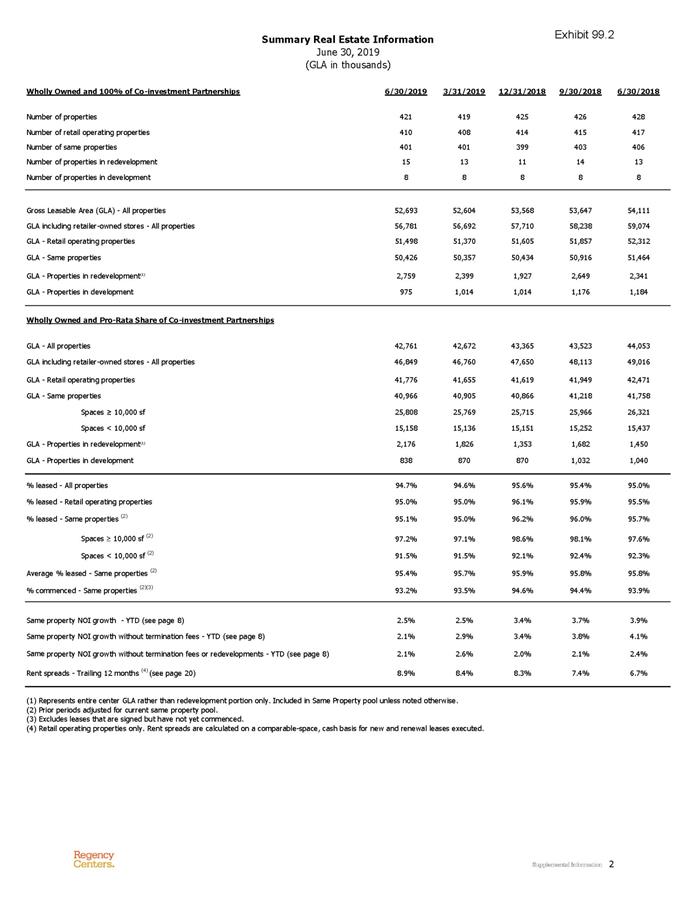
Summary Real Estate Information June 30, 2019 (GLA in thousands) Wholly Owned and 100% of Co-investment Partnerships 6/30/2019 3/31/2019 12/31/2018 9/30/2018 6/30/2018 Number of properties 421 419 425 426 428 Number of retail operating properties 410 408 414 415 417 Number of same properties 401 401 399 403 406 Number of properties in redevelopment 15 13 11 14 13 Number of properties in development 8 8 8 8 8 Gross Leasable Area (GLA) - All properties 52,693 52,604 53,568 53,647 54,111 GLA including retailer-owned stores - All properties 56,781 56,692 57,710 58,238 59,074 GLA - Retail operating properties 51,498 51,370 51,605 51,857 52,312 GLA - Same properties 50,426 50,357 50,434 50,916 51,464 GLA - Properties in redevelopment(1) 2,759 2,399 1,927 2,649 2,341 GLA - Properties in development 975 1,014 1,014 1,176 1,184 Wholly Owned and Pro-Rata Share of Co-investment Partnerships GLA - All properties 42,761 42,672 43,365 43,523 44,053 GLA including retailer-owned stores - All properties 46,849 46,760 47,650 48,113 49,016 GLA - Retail operating properties 41,776 41,655 41,619 41,949 42,471 GLA - Same properties 40,966 40,905 40,866 41,218 41,758 Spaces ≥ 10,000 sf 25,808 25,769 25,715 25,966 26,321 Spaces < 10,000 sf 15,158 15,136 15,151 15,252 15,437 GLA - Properties in redevelopment(1) 2,176 1,826 1,353 1,682 1,450 GLA - Properties in development 838 870 870 1,032 1,040 % leased - All properties 94.7% 94.6% 95.6% 95.4% 95.0% % leased - Retail operating properties 95.0% 95.0% 96.1% 95.9% 95.5% % leased - Same properties (2) 95.1% 95.0% 96.2% 96.0% 95.7% Spaces ≥ 10,000 sf (2) 97.2% 97.1% 98.6% 98.1% 97.6% Spaces < 10,000 sf (2) 91.5% 91.5% 92.1% 92.4% 92.3% Average % leased - Same properties (2) 95.4% 95.7% 95.9% 95.8% 95.8% % commenced - Same properties (2)(3) 93.2% 93.5% 94.6% 94.4% 93.9% Same property NOI growth - YTD (see page 8) 2.5% 2.5% 3.4% 3.7% 3.9% Same property NOI growth without termination fees - YTD (see page 8) 2.1% 2.9% 3.4% 3.8% 4.1% Same property NOI growth without termination fees or redevelopments - YTD (see page 8) 2.1% 2.6% 2.0% 2.1% 2.4% Rent spreads - Trailing 12 months (4) (see page 20) 8.9% 8.4% 8.3% 7.4% 6.7% (1) Represents entire center GLA rather than redevelopment portion only. Included in Same Property pool unless noted otherwise. (2) Prior periods adjusted for current same property pool. (3) Excludes leases that are signed but have not yet commenced. (4) Retail operating properties only. Rent spreads are calculated on a comparable-space, cash basis for new and renewal leases executed. 2 Exhibit 99.2
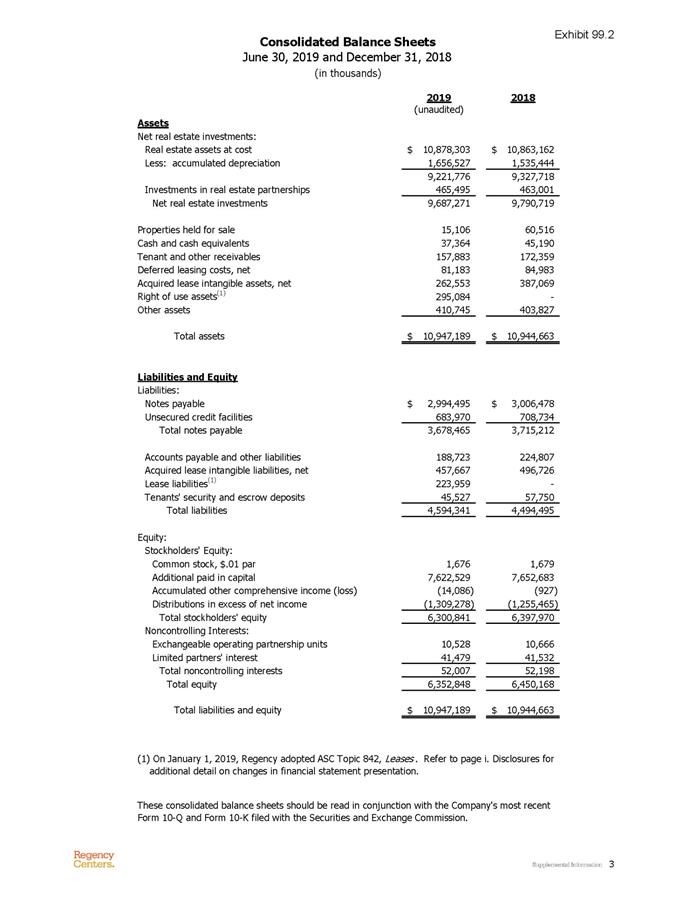
2019 2018 (unaudited) Assets Net real estate investments: Real estate assets at cost $ 10,878,303 $ 10,863,162 Less: accumulated depreciation 1,656,527 1,535,444 9,221,776 9,327,718 Investments in real estate partnerships 465,495 463,001 Net real estate investments 9,687,271 9,790,719 Properties held for sale 15,106 60,516 Cash and cash equivalents 37,364 45,190 Tenant and other receivables 157,883 172,359 Deferred leasing costs, net 81,183 84,983 Acquired lease intangible assets, net 262,553 387,069 Right of use assets(1) 295,084 - Other assets 410,745 403,827 Total assets $ 10,947,189 $ 10,944,663 Liabilities and Equity Liabilities: Notes payable $ 2,994,495 $ 3 ,006,478 Unsecured credit facilities 683,970 708,734 Total notes payable 3,678,465 3,715,212 Accounts payable and other liabilities 188,723 224,807 Acquired lease intangible liabilities, net 457,667 496,726 Lease liabilities(1) 223,959 - Tenants' security and escrow deposits 45,527 57,750 Total liabilities 4,594,341 4,494,495 Equity: Stockholders' Equity: Common stock, $.01 par 1,676 1,679 Additional paid in capital 7,622,529 7,652,683 Accumulated other comprehensive income (loss) (14,086) (927) Distributions in excess of net income (1,309,278) (1,255,465) Total stockholders' equity 6,300,841 6,397,970 Noncontrolling Interests: Exchangeable operating partnership units 10,528 10,666 Limited partners' interest 41,479 41,532 Total noncontrolling interests 52,007 52,198 Total equity 6,352,848 6,450,168 Total liabilities and equity $ 10,947,189 $ 10,944,663 Consolidated Balance Sheets June 30, 2019 and December 31, 2018 (in thousands) (1) On January 1, 2019, Regency adopted ASC Topic 842, Leases . Refer to page i. Disclosures for additional detail on changes in financial statement presentation. These consolidated balance sheets should be read in conjunction with the Company's most recent Form 10-Q and Form 10-K filed with the Securities and Exchange Commission. 3 Exhibit 99.2

2019 2018 2019 2018 Revenues: Lease income(1) $ 2 66,236 272,203 $ 5 43,539 539,713 Other property income(1) 2,194 2,322 4,176 4,347 Management, transaction, and other fees 7,442 6,887 14,415 14,045 Total revenues 275,872 281,412 562,130 558,105 Operating Expenses: Depreciation and amortization 93,589 89,105 190,783 177,629 Operating and maintenance 42,759 41,851 83,397 84,367 General and administrative 18,717 16,776 40,017 34,382 Real estate taxes 33,506 31,541 67,661 61,967 Other operating expense(1) 1,533 2,799 2,667 4,432 Total operating expenses 190,104 182,072 384,525 362,777 Other Expense (Income): Interest expense, net of interest income 37,173 38,074 74,925 74,859 Provision for impairment 10,441 12,533 12,113 28,587 Gain on sale of real estate, net of tax (442) (1,123) (16,932) (1,219) Early extinguishment of debt - 11,010 10,591 11,172 Net investment income (966) (569) (3,320) (602) Total other expense 46,206 59,925 77,377 112,797 Income from operations before equity in income of investments in real estate partnerships 39,562 39,415 100,228 82,531 Equity in income of investments in real estate partnerships 13,128 9,174 43,955 19,523 Net income 52,690 48,589 144,183 102,054 Noncontrolling Interests: Exchangeable operating partnership units (109) (100) (299) (212) Limited partners' interests in consolidated partnerships (853) (648) (1,710) (1,342) Net income attributable to noncontrolling interests (962) (748) (2,009) (1,554) Net income attributable to common stockholders $ 51,728 47,841 $ 1 42,174 100,500 (1) On January 1, 2019, Regency adopted ASC Topic 842, Leases . Refer to page i. Disclosures for additional detail on changes in financial statement presentation. These consolidated statements of operations should be read in conjunction with the Company's most recent Form 10-Q and Form 10-K filed with the Securities and Exchange Commission. Consolidated Statements of Operations For the Periods Ended June 30, 2019 and 2018 (in thousands) (unaudited) Three Months Ended Year to Date 4 Exhibit 99.2
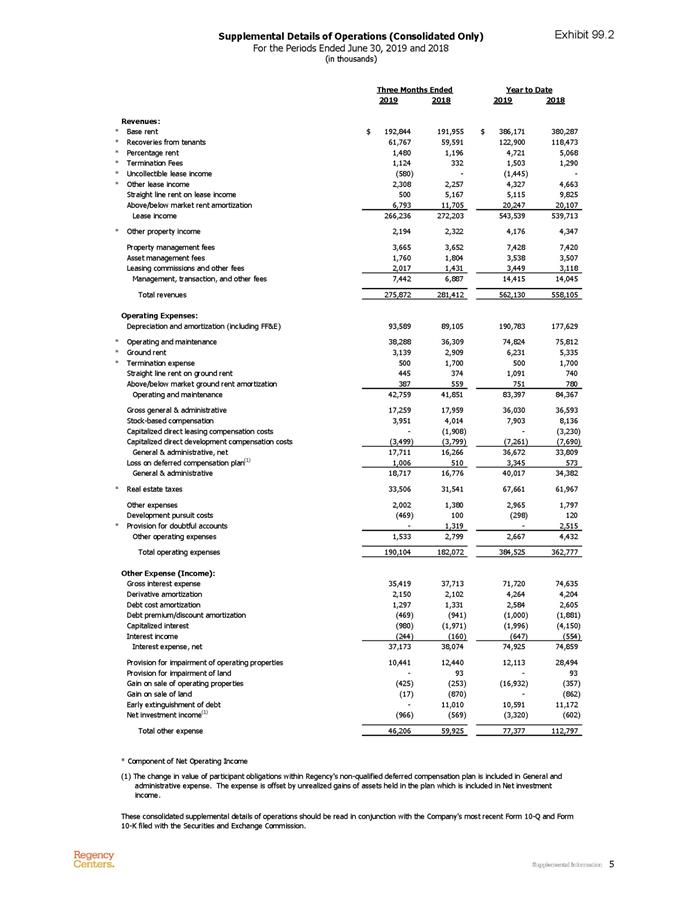
2019 2018 2019 2018 Revenues: * Base rent $ 192,844 191,955 $ 386,171 380,287 * Recoveries from tenants 61,767 59,591 122,900 118,473 * Percentage rent 1,480 1,196 4,721 5,068 * Termination Fees 1,124 332 1,503 1,290 * Uncollectible lease income (580) - (1,445) - * Other lease income 2,308 2,257 4,327 4,663 Straight line rent on lease income 500 5,167 5,115 9,825 Above/below market rent amortization 6,793 11,705 20,247 20,107 Lease income 266,236 272,203 543,539 539,713 * Other property income 2,194 2,322 4,176 4,347 Property management fees 3,665 3,652 7,428 7,420 Asset management fees 1,760 1,804 3,538 3,507 Leasing commissions and other fees 2,017 1,431 3,449 3,118 Management, transaction, and other fees 7,442 6,887 14,415 14,045 Total revenues 275,872 281,412 562,130 558,105 Operating Expenses: Depreciation and amortization (including FF&E) 93,589 89,105 190,783 177,629 * Operating and maintenance 38,288 36,309 74,824 75,812 * Ground rent 3,139 2,909 6,231 5,335 * Termination expense 500 1,700 500 1,700 Straight line rent on ground rent 445 374 1,091 740 Above/below market ground rent amortization 387 559 751 780 Operating and maintenance 42,759 41,851 83,397 84,367 Gross general & administrative 17,259 17,959 36,030 36,593 Stock-based compensation 3,951 4,014 7,903 8,136 Capitalized direct leasing compensation costs - (1,908) - (3,230) Capitalized direct development compensation costs (3,499) (3,799) (7,261) (7,690) General & administrative, net 17,711 16,266 36,672 33,809 Loss on deferred compensation plan(1) 1,006 510 3,345 573 General & administrative 18,717 16,776 40,017 34,382 * Real estate taxes 33,506 31,541 67,661 61,967 Other expenses 2,002 1,380 2,965 1,797 Development pursuit costs (469) 100 (298) 120 * Provision for doubtful accounts - 1,319 - 2,515 Other operating expenses 1,533 2,799 2,667 4,432 Total operating expenses 190,104 182,072 384,525 362,777 Other Expense (Income): Gross interest expense 35,419 37,713 71,720 74,635 Derivative amortization 2,150 2,102 4,264 4,204 Debt cost amortization 1,297 1,331 2,584 2,605 Debt premium/discount amortization (469) (941) (1,000) (1,881) Capitalized interest (980) (1,971) (1,996) (4,150) Interest income (244) (160) (647) (554) Interest expense, net 37,173 38,074 74,925 74,859 Provision for impairment of operating properties 10,441 12,440 12,113 28,494 Provision for impairment of land - 93 - 93 Gain on sale of operating properties (425) (253) (16,932) (357) Gain on sale of land (17) (870) - (862) Early extinguishment of debt - 11,010 10,591 11,172 Net investment income(1) (966) (569) (3,320) (602) Total other expense 46,206 59,925 77,377 112,797 (1) The change in value of participant obligations within Regency's non-qualified deferred compensation plan is included in General and administrative expense. The expense is offset by unrealized gains of assets held in the plan which is included in Net investment income. These consolidated supplemental details of operations should be read in conjunction with the Company's most recent Form 10-Q and Form 10-K filed with the Securities and Exchange Commission. Supplemental Details of Operations (Consolidated Only) For the Periods Ended June 30, 2019 and 2018 (in thousands) Three Months Ended Year to Date * Component of Net Operating Income 5 Exhibit 99.2

2019 2018 2019 2018 Assets Real estate assets at cost $ (92,320) (90,972) $ 1,369,962 1,379,264 Less: accumulated depreciation (13,291) (12,400) 405,885 415,256 Net real estate investments (79,029) (78,572) 964,077 964,008 Cash and cash equivalents ( 2,621) (3,063) 16,059 1 1,806 Tenant and other receivables ( 3,103) (3,053) 24,384 2 4,855 Deferred leasing costs, net ( 1,292) (1,285) 14,345 1 5,008 Acquired lease intangible assets, net (909) (1,060) 12,271 1 4,970 Right of use assets(1) ( 1,727) - 5,814 - Other assets (282) (559) 13,575 1 2,574 Total assets $ (88,963) (87,592) $ 1,050,525 1,043,221 Liabilities Notes payable $ (43,304) (43,739) $ 530,039 533,973 Accounts payable and other liabilities ( 1,645) (1,624) 33,217 2 9,408 Acquired lease intangible liabilities, net (341) (397) 12,226 1 2,458 Lease liabilities(1) ( 1,915) - 4,477 - Tenants' security and escrow deposits (279) (300) 5,071 4,381 Total liabilities $ (47,484) (46,060) $ 585,030 580,220 Noncontrolling Interests Share of JVs (1) On January 1, 2019, Regency adopted ASC Topic 842, Leases . Refer to page i. Disclosures for additional detail on changes in financial statement presentation. Note Noncontrolling interests represent limited partners’ interests in consolidated partnerships’ activities and Share of JVs represents the Company’s share of co-investment partnerships’ activities, of which each are included on a single line presentation in the Company’s consolidated financial statements in accordance with GAAP. Supplemental Details of Assets and Liabilities (Real Estate Partnerships Only) June 30, 2019 and December 31, 2018 (in thousands) 6 Exhibit 99.2

2019 2018 2019 2018 2019 2018 2019 2018 Revenues: * Base rent $ (2,071) (1,853) $ (4,138) (3,676) $ 25,918 25,981 $ 52,022 51,982 * Recoveries from tenants (631) (619) (1,276) (1,265) 8,404 8,533 17,001 17,132 * Percentage rent - (3) (4) (3) 211 288 9 09 861 * Termination Fees - (7) - (9) 407 105 5 13 336 * Uncollectible lease income ( 5) - 9 - (111) - (215) - * Other lease income (30) (32) (62) (67) 291 289 5 92 634 Straight line rent on lease income (82) (41) (177) (106) 557 113 1,072 155 Above/below market rent amortization ( 9) (11) (18) (25) 253 249 5 11 509 Lease income (2,828) (2,566) (5,666) (5,151) 35,930 35,558 72,405 71,609 * Other property income ( 1) (5) (4) (6) 161 205 2 45 303 Asset management fees - - - - (277) (291) (559) (561) Management, transaction, and other fees - - - - (277) (291) (559) (561) Total revenues (2,829) (2,571) (5,670) (5,157) 35,814 35,472 72,091 71,351 Operating Expenses: Depreciation and amortization (including FF&E) (646) (606) (1,342) (1,228) 7,768 9,192 16,257 17,983 * Operating and maintenance (410) (360) (798) (758) 5,376 5,624 11,063 11,365 * Ground rent (28) (27) (55) (55) 116 94 203 188 Straight line rent on ground rent (16) (16) (32) (32) 30 - 247 - Above/below market ground rent amortization - (1) - (1) 10 5 14 11 Operating and maintenance (454) (404) (885) (846) 5,532 5,723 11,527 11,564 Gross general & administrative - - - - 82 73 190 111 General & administrative, net - - - - 82 73 190 111 * Real estate taxes (406) (385) (817) (753) 4,685 4,700 9,499 9,184 Other expenses (14) (18) (34) (31) 326 213 5 50 355 Development pursuit costs - - - - - 19 6 20 * Provision for doubtful accounts - (52) - (65) - 140 - 226 Other operating expenses (14) (70) (34) (96) 326 372 5 56 601 Total operating expenses (1,520) (1,465) (3,078) (2,923) 18,393 20,060 38,029 39,443 Other Expense (Income): Gross interest expense (438) (421) (846) (825) 6,085 6,063 12,272 12,156 Debt cost amortization (18) (37) (36) (67) 166 124 3 51 248 Debt premium/discount amortization - - - - 10 43 14 86 Interest expense, net (456) (458) (882) (892) 6,261 6,230 12,637 12,490 (Gain) loss on sale of operating properties - - - - (1,968) 7 (22,531) 9 (Gain) loss on sale of land - - - - - 1 1 (114) Total other expense (456) (458) (882) (892) 4,293 6,238 (9,893) 12,385 Supplemental Details of Operations (Real Estate Partnerships Only) For the Periods Ended June 30, 2019 and 2018 (in thousands) Noncontrolling Interests Share of JVs Note Noncontrolling interests represent limited partners’ interests in consolidated partnerships’ activities and Share of JVs represents the Company’s share of co-investment partnerships’ activities, of which each are included on a single line presentation in the Company’s consolidated financial statements in accordance with GAAP. Three Months Ended Year to Date Three Months Ended Year to Date * Component of Net Operating Income 7 Exhibit 99.2
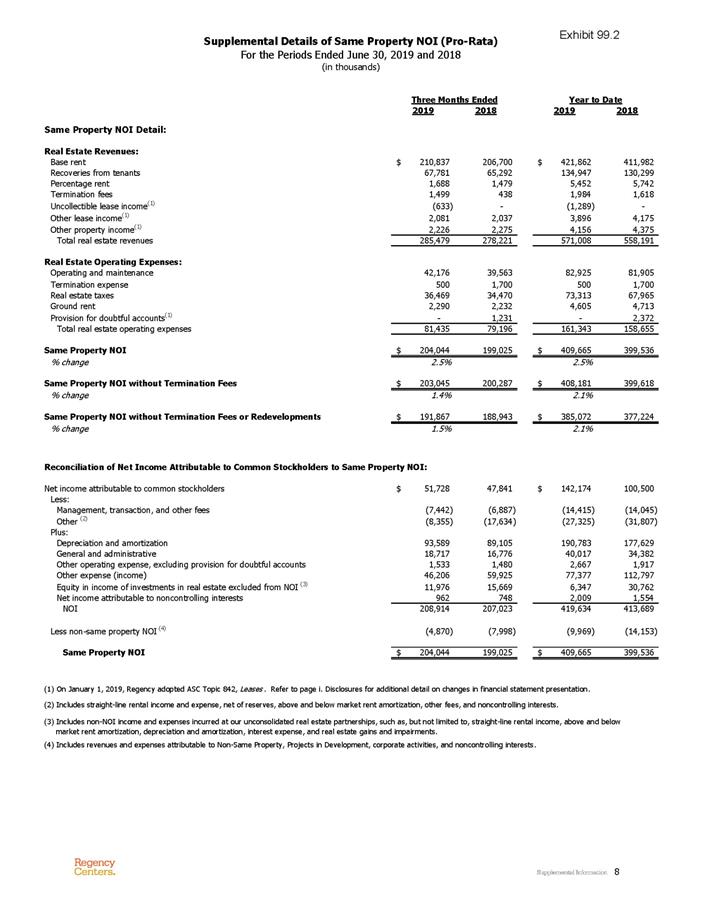
2019 2018 2019 2018 Same Property NOI Detail: Real Estate Revenues: Base rent $ 210,837 2 06,700 $ 421,862 4 11,982 Recoveries from tenants 67,781 65,292 134,947 130,299 Percentage rent 1,688 1,479 5,452 5,742 Termination fees 1,499 438 1,984 1,618 Uncollectible lease income(1) ( 633) - (1,289) - Other lease income(1) 2,081 2,037 3,896 4,175 Other property income(1) 2,226 2,275 4,156 4,375 Total real estate revenues 2 85,479 278,221 571,008 558,191 Real Estate Operating Expenses: Operating and maintenance 42,176 39,563 82,925 81,905 Termination expense 500 1,700 500 1,700 Real estate taxes 36,469 34,470 73,313 67,965 Ground rent 2,290 2,232 4,605 4,713 Provision for doubtful accounts(1) - 1,231 - 2,372 Total real estate operating expenses 81,435 79,196 161,343 158,655 Same Property NOI $ 204,044 1 99,025 $ 409,665 399,536 % change 2.5% 2.5% Same Property NOI without Termination Fees $ 203,045 2 00,287 $ 408,181 399,618 % change 1.4% 2.1% Same Property NOI without Termination Fees or Redevelopments $ 191,867 1 88,943 $ 385,072 377,224 % change 1.5% 2.1% Reconciliation of Net Income Attributable to Common Stockholders to Same Property NOI: Net income attributable to common stockholders $ 5 1,728 47,841 $ 142,174 1 00,500 Less: Management, transaction, and other fees (7,442) (6,887) (14,415) (14,045) Other (2) (8,355) (17,634) (27,325) (31,807) Plus: Depreciation and amortization 93,589 89,105 190,783 177,629 General and administrative 18,717 16,776 40,017 34,382 Other operating expense, excluding provision for doubtful accounts 1,533 1,480 2,667 1,917 Other expense (income) 46,206 59,925 77,377 112,797 Equity in income of investments in real estate excluded from NOI (3) 11,976 15,669 6,347 30,762 Net income attributable to noncontrolling interests 962 748 2,009 1,554 NOI 2 08,914 207,023 419,634 413,689 Less non-same property NOI (4) (4,870) (7,998) (9,969) (14,153) Same Property NOI $ 204,044 1 99,025 $ 409,665 399,536 (2) Includes straight-line rental income and expense, net of reserves, above and below market rent amortization, other fees, and noncontrolling interests. (3) Includes non-NOI income and expenses incurred at our unconsolidated real estate partnerships, such as, but not limited to, straight-line rental income, above and below market rent amortization, depreciation and amortization, interest expense, and real estate gains and impairments. (4) Includes revenues and expenses attributable to Non-Same Property, Projects in Development, corporate activities, and noncontrolling interests. Supplemental Details of Same Property NOI (Pro-Rata) For the Periods Ended June 30, 2019 and 2018 (in thousands) Three Months Ended Year to Date (1) On January 1, 2019, Regency adopted ASC Topic 842, Leases . Refer to page i. Disclosures for additional detail on changes in financial statement presentation. 8 Exhibit 99.2
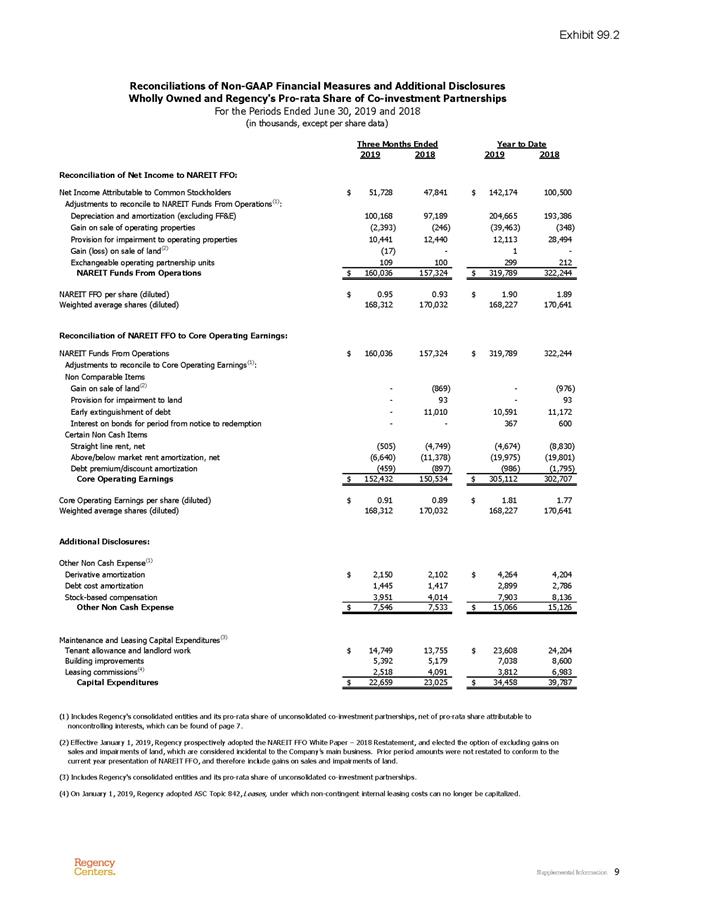
2019 2018 2019 2018 Reconciliation of Net Income to NAREIT FFO: Net Income Attributable to Common Stockholders $ 51,728 4 7,841 $ 142,174 100,500 Adjustments to reconcile to NAREIT Funds From Operations(1): Depreciation and amortization (excluding FF&E) 100,168 9 7,189 204,665 193,386 Gain on sale of operating properties (2,393) (246) (39,463) (348) Provision for impairment to operating properties 1 0,441 1 2,440 1 2,113 2 8,494 Gain (loss) on sale of land(2) (17) - 1 - Exchangeable operating partnership units 109 100 299 212 NAREIT Funds From Operations $ 160,036 157,324 $ 319,789 322,244 NAREIT FFO per share (diluted) $ 0.95 0.93 $ 1.90 1.89 Weighted average shares (diluted) 168,312 170,032 168,227 170,641 Reconciliation of NAREIT FFO to Core Operating Earnings: NAREIT Funds From Operations $ 160,036 157,324 $ 319,789 322,244 Adjustments to reconcile to Core Operating Earnings(1): Non Comparable Items Gain on sale of land(2) - (869) - (976) Provision for impairment to land - 93 - 93 Early extinguishment of debt - 1 1,010 1 0,591 1 1,172 Interest on bonds for period from notice to redemption - - 367 600 Certain Non Cash Items Straight line rent, net (505) (4,749) (4,674) (8,830) Above/below market rent amortization, net (6,640) (11,378) (19,975) (19,801) Debt premium/discount amortization (459) (897) (986) (1,795) Core Operating Earnings $ 152,432 150,534 $ 305,112 302,707 Core Operating Earnings per share (diluted) $ 0.91 0.89 $ 1.81 1.77 Weighted average shares (diluted) 168,312 170,032 168,227 170,641 Additional Disclosures: Other Non Cash Expense(1) Derivative amortization $ 2 ,150 2,102 $ 4 ,264 4,204 Debt cost amortization 1,445 1,417 2,899 2,786 Stock-based compensation 3,951 4,014 7,903 8,136 Other Non Cash Expense $ 7 ,546 7,533 $ 15,066 15,126 Maintenance and Leasing Capital Expenditures(3) Tenant allowance and landlord work $ 14,749 13,755 $ 23,608 24,204 Building improvements 5,392 5,179 7,038 8,600 Leasing commissions(4) 2,518 4,091 3,812 6,983 Capital Expenditures $ 22,659 23,025 $ 34,458 39,787 (1) Includes Regency's consolidated entities and its pro-rata share of unconsolidated co-investment partnerships, net of pro-rata share attributable to noncontrolling interests, which can be found of page 7. Reconciliations of Non-GAAP Financial Measures and Additional Disclosures Wholly Owned and Regency's Pro-rata Share of Co-investment Partnerships For the Periods Ended June 30, 2019 and 2018 (in thousands, except per share data) Three Months Ended Year to Date (2) Effective January 1, 2019, Regency prospectively adopted the NAREIT FFO White Paper – 2018 Restatement, and elected the option of excluding gains on sales and impairments of land, which are considered incidental to the Company’s main business. Prior period amounts were not restated to conform to the current year presentation of NAREIT FFO, and therefore include gains on sales and impairments of land. (3) Includes Regency's consolidated entities and its pro-rata share of unconsolidated co-investment partnerships. (4) On January 1, 2019, Regency adopted ASC Topic 842, Leases, under which non-contingent internal leasing costs can no longer be capitalized. 9 Exhibit 99.2

2019 2018 2019 2018 Reconciliation of Net Income to NAREIT EBITDAre : Net Income $ 52,690 48,589 $ 144,183 102,054 Adjustments to reconcile to NAREIT EBITDAre (1): Interest expense 43,678 44,464 88,209 87,902 Income tax expense 57 - 210 - Depreciation and amortization 101,357 98,297 207,040 195,612 Gain on sale of operating properties (2,393) (246) (39,463) (348) Provision from impairment to operating properties 10,441 12,440 12,113 28,494 Gain (loss) on sale of land(2) (17) - 1 - NAREIT EBITDAre $ 205,813 203,544 $ 412,293 413,714 Reconciliation of NAREIT EBITDAre to Operating EBITDAre : NAREIT EBITDAre $ 205,813 203,544 $ 412,293 413,714 Adjustments to reconcile to Operating EBITDAre (1): Gain on sale of land(2) - (869) - (976) Provision for impairment to land - 93 - 93 Early extinguishment of debt - 11,010 10,591 11,172 Straight line rent, net (571) (4,774) (4,819) (8,904) Above/below market rent amortization, net (6,649) (11,388) (19,993) (19,825) Operating EBITDAre $ 198,593 197,616 $ 398,072 395,274 (2) Effective January 1, 2019, Regency prospectively adopted the NAREIT FFO White Paper – 2018 Restatement, and elected the option of excluding gains on the sales and impairments of land, which are considered incidental to the Company’s main business. Prior period amounts were not restated to conform to the current year presentation of NAREIT FFO, and therefore include gains on sales and impairments of land. Reconciliations of Non-GAAP Financial Measures and Additional Disclosures (continued) For the Periods Ended June 30, 2019 and 2018 (in thousands) Three Months Ended Year to Date (1) Includes Regency's consolidated entities and its pro-rata share of unconsolidated co-investment partnerships. 10 Exhibit 99.2

Summary of Consolidated Debt June 30, 2019 and December 31, 2018 (in thousands) Total Debt Outstanding: 6/30/2019 12/31/18 Notes Payable: Fixed rate mortgage loans $ 434,867 493,263 Variable-rate mortgage loans 37,115 37,893 Fixed rate unsecured public debt 2,332,816 2,286,357 Fixed rate unsecured private debt 189,697 188,965 Unsecured credit facilities: Revolving line of credit 120,000 145,000 Term Loans 563,970 563,734 Total $ 3,678,465 3,715,212 Schedule of Maturities by Year: Scheduled Principal Payments Mortgage Loan Maturities Unsecured Maturities (1) Total Weighted Average Contractual Interest Rate on Maturities 2019 $ 4 ,924 - - 4,924 - 2020 1 1,287 39,074 3 00,000 350,361 2.9% 2021 1 1,599 76,251 - 87,850 4.6% 2022 1 1,798 5 ,848 6 85,000 702,646 3.0% 2023 1 0,077 59,375 - 69,452 3.3% 2024 5 ,301 88,542 2 50,000 343,843 3.7% 2025 4 ,207 - 250,000 254,207 3.9% 2026 4 ,420 88,000 2 00,000 292,420 3.8% 2027 4 ,312 32,915 5 25,000 562,227 3.6% 2028 3 ,350 1 70 3 00,000 303,520 4.1% >10 years 5 ,423 2 19 7 25,000 730,642 4.4% Unamortized debt premium/(discount), net of issuance costs - 4,890 ( 28,517) (23,627) $ 76,698 395,284 3,206,483 3,678,465 3.7% Percentage of Total Debt: 6/30/2019 12/31/18 Fixed 95.7% 95.1% Variable 4.3% 4.9% Current Weighted Average Contractual Interest Rates:(2) Fixed 3.8% 3.8% Variable 3.4% 3.4% Combined 3.7% 3.9% Current Weighted Average Effective Interest Rate:(3) Combined 3.9% 4.1% Average Years to Maturity: Fixed 10.1 8.2 Variable 2.6 3.1 (1) Includes unsecured public and private placement debt, unsecured term loans, and unsecured revolving line of credit. (3) Effective interest rates are calculated in accordance with US GAAP, as of the quarter end, and include the impact of debt premium/(discount) amortization, issuance cost amortization, interest rate swaps, and facility fees. (2) Interest rates are calculated as of the quarter end. 11 Exhibit 99.2
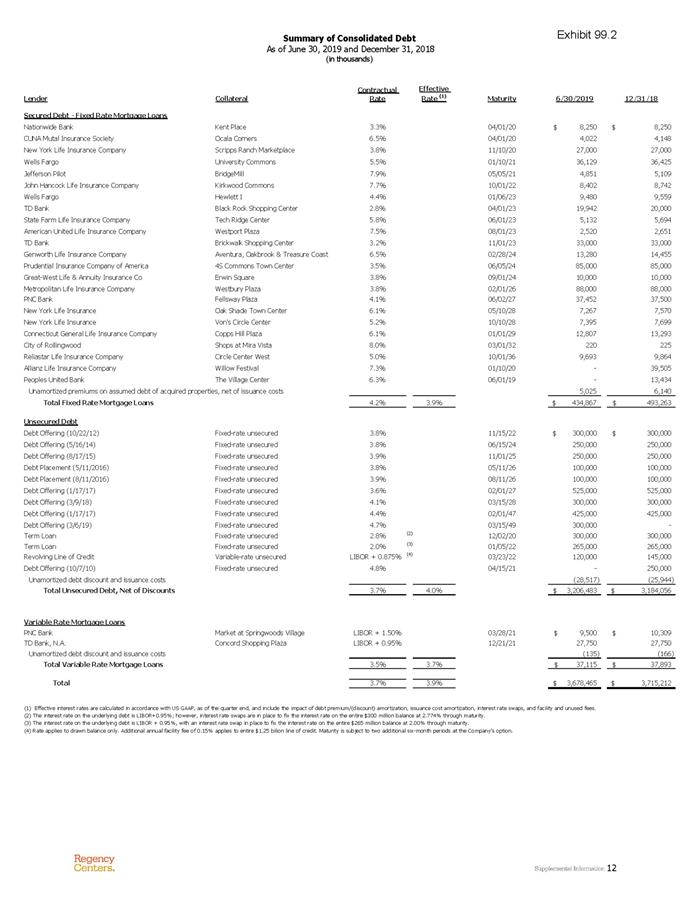
Summary of Consolidated Debt As of June 30, 2019 and December 31, 2018 (in thousands) Lender Collateral Contractual Rate Effective Rate (1) Maturity 6/30/2019 12/31/18 Secured Debt - Fixed Rate Mortgage Loans Nationwide Bank Kent Place 3.3% 04/01/20 $ 8,250 $ 8,250 CUNA Mutal Insurance Society Ocala Corners 6.5% 04/01/20 4,022 4 ,148 New York Life Insurance Company Scripps Ranch Marketplace 3.8% 11/10/20 27,000 27,000 Wells Fargo University Commons 5.5% 01/10/21 36,129 36,425 Jefferson Pilot BridgeMill 7.9% 05/05/21 4,851 5 ,109 John Hancock Life Insurance Company Kirkwood Commons 7.7% 10/01/22 8,402 8 ,742 Wells Fargo Hewlett I 4.4% 01/06/23 9,480 9 ,559 TD Bank Black Rock Shopping Center 2.8% 04/01/23 19,942 20,000 State Farm Life Insurance Company Tech Ridge Center 5.8% 06/01/23 5,132 5 ,694 American United Life Insurance Company Westport Plaza 7.5% 08/01/23 2,520 2 ,651 TD Bank Brickwalk Shopping Center 3.2% 11/01/23 33,000 33,000 Genworth Life Insurance Company Aventura, Oakbrook & Treasure Coast 6.5% 02/28/24 13,280 14,455 Prudential Insurance Company of America 4S Commons Town Center 3.5% 06/05/24 85,000 85,000 Great-West Life & Annuity Insurance Co Erwin Square 3.8% 09/01/24 10,000 10,000 Metropolitan Life Insurance Company Westbury Plaza 3.8% 02/01/26 88,000 88,000 PNC Bank Fellsway Plaza 4.1% 06/02/27 3 7,452 3 7,500 New York Life Insurance Oak Shade Town Center 6.1% 05/10/28 7,267 7 ,570 New York Life Insurance Von's Circle Center 5.2% 10/10/28 7,395 7 ,699 Connecticut General Life Insurance Company Copps Hill Plaza 6.1% 01/01/29 12,807 13,293 City of Rollingwood Shops at Mira Vista 8.0% 03/01/32 2 20 2 25 Reliastar Life Insurance Company Circle Center West 5.0% 10/01/36 9,693 9 ,864 Allianz Life Insurance Company Willow Festival 7.3% 01/10/20 - 39,505 Peoples United Bank The Village Center 6.3% 06/01/19 - 13,434 Unamortized premiums on assumed debt of acquired properties, net of issuance costs 5 ,025 6 ,140 Total Fixed Rate Mortgage Loans 4.2% 3.9% $ 4 34,867 $ 4 93,263 Unsecured Debt Debt Offering (10/22/12) Fixed-rate unsecured 3.8% 11/15/22 $ 3 00,000 $ 300,000 Debt Offering (5/16/14) Fixed-rate unsecured 3.8% 06/15/24 250,000 250,000 Debt Offering (8/17/15) Fixed-rate unsecured 3.9% 11/01/25 250,000 250,000 Debt Placement (5/11/2016) Fixed-rate unsecured 3.8% 05/11/26 100,000 100,000 Debt Placement (8/11/2016) Fixed-rate unsecured 3.9% 08/11/26 100,000 100,000 Debt Offering (1/17/17) Fixed-rate unsecured 3.6% 02/01/27 525,000 525,000 Debt Offering (3/9/18) Fixed-rate unsecured 4.1% 03/15/28 300,000 300,000 Debt Offering (1/17/17) Fixed-rate unsecured 4.4% 02/01/47 425,000 425,000 Debt Offering (3/6/19) Fixed-rate unsecured 4.7% 03/15/49 300,000 - Term Loan Fixed-rate unsecured 2.8% (2) 12/02/20 3 00,000 3 00,000 Term Loan Fixed-rate unsecured 2.0% (3) 01/05/22 2 65,000 2 65,000 Revolving Line of Credit Variable-rate unsecured LIBOR + 0.875% (4) 03/23/22 1 20,000 1 45,000 Debt Offering (10/7/10) Fixed-rate unsecured 4.8% 04/15/21 - 250,000 Unamortized debt discount and issuance costs (28,517) ( 25,944) Total Unsecured Debt, Net of Discounts 3.7% 4.0% $ 3 ,206,483 $ 3 ,184,056 Variable Rate Mortgage Loans PNC Bank Market at Springwoods Village LIBOR + 1.50% 03/28/21 $ 9,500 $ 1 0,309 TD Bank, N.A. Concord Shopping Plaza LIBOR + 0.95% 12/21/21 2 7,750 2 7,750 Unamortized debt discount and issuance costs ( 135) ( 166) Total Variable Rate Mortgage Loans 3.5% 3.7% $ 3 7,115 $ 3 7,893 Total 3.7% 3.9% $ 3 ,678,465 $ 3 ,715,212 (1) Effective interest rates are calculated in accordance with US GAAP, as of the quarter end, and include the impact of debt premium/(discount) amortization, issuance cost amortization, interest rate swaps, and facility and unused fees. (2) The interest rate on the underlying debt is LIBOR+0.95%; however, interest rate swaps are in place to fix the interest rate on the entire $300 million balance at 2.774% through maturity. (4) Rate applies to drawn balance only. Additional annual facility fee of 0.15% applies to entire $1.25 bilion line of credit. Maturity is subject to two additional six-month periods at the Company’s option. (3) The interest rate on the underlying debt is LIBOR + 0.95%, with an interest rate swap in place to fix the interest rate on the entire $265 million balance at 2.00% through maturity. 12 Exhibit 99.2

Outstanding Unsecured Public Debt: Origination Maturity Rate Balance 10/25/12 11/15/22 3.750% $ 300,000 05/16/14 06/15/24 3.750% $ 250,000 08/17/15 11/01/25 3.900% $ 250,000 01/17/17 02/01/27 3.600% $ 525,000 03/09/18 03/15/28 4.125% $ 300,000 01/17/17 02/01/47 4.400% $ 425,000 03/06/19 03/15/49 4.650% $ 300,000 Unsecured Public Debt Covenants: Required 3/31/19 12/31/18 9/30/18 6/30/18 Fair Market Value Calculation Method Covenants(1)(2) Total Consolidated Debt to Total Consolidated Assets ≤ 65% 28% 28% 28% 29% Secured Consolidated Debt to Total Consolidated Assets ≤ 40% 4% 4% 4% 5% Consolidated Income for Debt Service to Consolidated Debt Service ≥ 1.5x 5.4x 5.1x 5.1x 5.0x Unencumbered Consolidated Assets to Unsecured Consolidated Debt >150% 371% 372% 372% 363% Ratios: 6/30/19 3/31/19 12/31/18 9/30/18 6/30/18 Consolidated Only Net debt to total market capitalization 24.5% 24.3% 27.2% 25.1% 26.4% Net debt to real estate assets, before depreciation 32.1% 32.1% 32.2% 32.2% 33.0% Net debt to total assets, before depreciation 29.0% 28.9% 29.5% 29.4% 30.1% Net debt to Operating EBITDAre - TTM 4.8x 4.7x 4.8x 4.8x 5.0x Fixed charge coverage 5.0x 4.9x 4.9x 4.8x 4.8x Interest coverage 5.4x 5.3x 5.2x 5.2x 5.2x Unsecured assets to total real estate assets 88.9% 87.7% 87.8% 87.8% 85.7% Unsecured NOI to total NOI - TTM 90.0% 89.1% 89.3% 89.4% 87.0% Unencumbered assets to unsecured debt 301% 298% 300% 301% 295% Total Pro-Rata Share Net debt to total market capitalization 27.1% 26.9% 29.9% 27.7% 29.0% Net debt to real estate assets, before depreciation 34.0% 34.0% 34.2% 34.1% 34.8% Net debt to total assets, before depreciation 30.8% 30.7% 31.3% 31.1% 31.8% Net debt to Operating EBITDAre - TTM 5.3x 5.3x 5.3x 5.4x 5.6x Fixed charge coverage 4.3x 4.2x 4.2x 4.1x 4.1x Interest coverage 4.7x 4.6x 4.6x 4.6x 4.5x Summary of Unsecured Debt Covenants and Leverage Ratios June 30, 2019 (in thousands) (1) For a complete listing of all Debt Covenants related to the Company's Senior Unsecured Notes, as well as definitions of the above terms, please refer to the Company's filings with the Securities and Exchange Commission. (2) Debt covenant disclosure is in arrears due to current quarter calculations being dependent on the Company's most recent Form 10-Q or Form 10-K filing. 13 Exhibit 99.2

Summary of Unconsolidated Debt June 30, 2019 and December 31, 2018 (in thousands) Total Debt Outstanding: 6/30/19 12/31/18 Mortgage loans payable: Fixed rate secured loans $ 1,460,752 $ 1,487,530 Variable rate secured loans 1 11,861 102,482 Unsecured credit facilities variable rate 19,635 19,635 Total $ 1,592,247 $ 1,609,647 Schedule of Maturities by Year: Scheduled Principal Payments Mortgage Loan Maturities Unsecured Maturities Total Regency's Pro Rata Share 2019 $ 9,568 $ 10,311 $ - $ 19,879 $ 6,183 7.2% 2020 17,043 335,169 - 352,212 114,234 5.4% 2021 11,048 269,942 19,635 300,625 104,375 4.5% 2022 7,811 170,702 - 178,513 68,417 4.4% 2023 2,989 171,608 - 174,597 65,096 4.8% 2024 1,513 33,690 - 35,203 14,160 3.9% 2025 1,339 162,000 - 163,339 49,380 3.6% 2026 1,145 79,286 - 80,431 32,114 3.8% 2027 1,078 115,000 - 116,078 23,378 3.8% 2028 929 62,450 - 63,379 22,088 4.3% >10 Years 2,064 115,497 - 117,561 33,512 4.2% Unamortized debt premium/(discount) and issuance costs (2) - (9,570) - (9,570) (2,898) $ 56,527 $ 1,516,085 $ 19,635 $ 1,592,247 $ 530,039 4.5% Percentage of Total Debt: 6/30/19 12/31/18 Fixed 91.7% 92.4% Variable 8.3% 7.6% Current Weighted Average Contractual Interest Rates:(1) Fixed 4.5% 4.6% Variable 4.7% 4.6% Combined 4.5% 4.6% Current Weighted Average Effective Interest Rates:(2) Combined 4.7% 4.8% Average Years to Maturity: Fixed 4.5 4.7 Variable 1.1 1.6 (1) Interest rates are calculated as of the quarter end. Weighted Average Contractual Interest Rate on Maturities (2) Effective interest rates are calculated in accordance with US GAAP, as of the quarter end, and include the impact of debt premium/(discount) amortization, issuance cost, amortization, interest rate swaps, and facility and unused fees. 14 Exhibit 99.2

Acquisitions:(2) Date Property Name Co-investment Partner (REG %) Market Total GLA Regency's Share of Purchase Price Weighted Average Cap Rate Anchor(s)(1) Feb-19 Melrose Market Seattle, WA 21 $15,500 - Jun-19 6401 Roosevelt Seattle, WA 8 $3,550 (Whole Foods) Total 29 $19,050 3.9% Dispositions: Date Property Name Co-investment Partner (REG %) Market Total GLA Regency's Share of Sales Price Weighted Average Cap Rate Anchor(s)(1) Jan-19 Ashburn Farm Market Center Ashburn, VA 92 $30,850 Giant Food Jan-19 Gayton Crossing GRI (40%) Richmond, VA 158 $11,600 Gold's Gym, (Kroger) Jan-19 Ambassador Row Lafayette, LA 195 $20,150 Big Lots, Jo-Ann Fabrics, Planet Fitness Jan-19 Ambassador Row Courtyards Lafayette, LA 150 $9,950 Bed Bath and Beyond, Tuesday Morning Feb-19 King Farm Village Center CalSTRS (25%) Rockville, MD 118 $10,000 Safeway Mar-19 Phillips Place Other (50%) Charlotte, NC 133 $36,500 Regal Cinemas Mar-19 Siegen Village Baton Rouge, LA 170 $17,450 Big Lots, Office Depot, Planet Fitness, Dollar Tree, Party City Total 1,016 $136,500 7.5% (1) Retailers in parenthesis are shadow anchors and not a part of the owned property. (2) Subsequent to quarter end, Regency acquired The Pruneyard a 258,000 square foot center located in Silicon Valley for $212.5 million at a 4.3% cap rate. Property Transactions June 30, 2019 (in thousands) 15 Exhibit 99.2

Summary of Development and Redevelopment June 30, 2019 (in thousands) In Process Ground Up Developments Shopping Center Name Market Grocer/Anchor Tenant Shopping Center GLA % Leased % Leased & Committed Project Start Estimated Project Completion REG's Estimated Net Project Costs % of Costs Incurred Stabilized Yield Culver Public Market Los Angeles, CA Urbanspace 27 49% 49% Q2-2019 2020 $27,313 14% 6.0% Carytown Exchange (1) Richmond, VA Publix 107 46% 46% Q4-2018 2021 25,580 6% 7.3% The Village at Hunter's Lake Tampa, FL Sprouts 72 85% 99% Q4-2018 2020 22,048 18% 8.0% Ballard Blocks II (2) Seattle, WA PCC Community Markets & West Marine 114 83% 87% Q1-2018 2019 32,717 69% 6.3% Midtown East (3) Raleigh, NC Wegmans 159 87% 96% Q4-2017 2019 22,682 89% 7.9% Mellody Farm Chicago, IL Whole Foods, Nordstrom Rack & REI 259 90% 93% Q2-2017 2019 104,304 89% 6.8% Pinecrest Place Miami, FL Whole Foods (Target) 70 92% 92% Q1-2017 2019 16,367 92% 8.2% The Village at Riverstone Houston, TX Kroger 167 93% 95% Q4-2016 2019 30,874 92% 8.0% Subtotal Ground Up Developments 975 83% 87% $281,884 67% 7.1% In Process Redevelopments Shopping Center Name Market Grocer/Anchor Tenant Shopping Center GLA % Leased % Leased & Committed Project Start Estimated Project Completion REG's Estimated Incremental Project Costs % of Costs Incurred Incremental Stabilized Yield The Abbot Boston, MA Retail/Office users 65 0% 49% Q2-2019 2021 $52,310 8% 9.3% Tech Ridge Austin, TX HEB & Pinstack 214 90% 90% Q1-2019 2020 7,739 5% 5.9% Market Common Clarendon Metro, DC luxury fitness user 422 71% 71% Q4-2018 2021 53,656 14% 8.9% Point 50 Metro, DC Whole Foods 48 62% 71% Q4-2018 2020 17,728 8% 8.0% Pablo Plaza Ph II Jacksonville, FL Whole Foods 161 98% 98% Q4-2018 2020 14,607 39% 6.2% Bloomingdale Square Tampa, FL Publix, LA Fitness 254 94% 94% Q3-2018 2020 19,904 28% 9.1% Various Properties (where estimated incremental costs are less than $5 Million)* Various Various 1,595 95% 95% 25,977 26% 7.2% Subtotal Redevelopments 2,759 88% 90% $191,923 17% 8.4% Total In Process Developments and Redevelopments 3,733 87% 89% $473,807 46% 7.6% Development Completions Indigo Square Charleston, SC Publix Greenwise Market 51 95% 95% Q4-2017 2019 17,111 96% 8.2% Subtotal Development Completions 51 95% 95% $17,111 96% 8.2% Redevelopment Completions Various Properties (where estimated incremental costs are less than $5 Million)* Various Various 220 95% 96% 2019 3,849 92% 5.8% Subtotal Redevelopment Completions 220 95% 96% $3,849 92% 5.8% Total Development and Redevelopment Completions 271 95% 96% $20,960 95% 7.7% * In Process Redevelopments include densification redevelopment, transformative projects and projects where square footage is added. Projects are included in same property NOI unless otherwise noted. (4) Retailers in parenthesis are shadow anchors and not a part of the owned property. Note: NOI from Properties in Development and NOI adjustment for Development Completions not yet stabilized have been relocated to Components of NAV on page 30. **Regency's Estimated Net GAAP Project Costs, after additional interest and overhead capitalization, are $304,273 for Developments In Process with an estimated stabilized yield of 6.4% and $203,047 for Redevelopments In Process with an estimated incremental stabilized yield of 7.9% Percent of costs incurred is 69% for Developments and 17% for Redevelopments In Process. (1) Reflects Regency's share of Estimated Net Development Costs After JV Buyout at 64% controlling interest. (2) Reflects Regency's share of Estimated Net Development Costs After JV Buyout at 49.9% noncontrolling interest. (3) Reflects Regency's share of Estimated Net Development Costs After JV Buyout at 50% noncontrolling interest. 16 Exhibit 99.2

Summary of Development and Redevelopment June 30, 2019 (in thousands) In Process Ground Up Developments Shopping Center Name Market Grocer/Anchor Tenant Shopping Center GLA Description Culver Public Market Los Angeles, CA Urbanspace 27 Located in West LA's high-barrier-to entry trade area, dynamic center to be anchored by a market hall concept with additional inline retail shops. Carytown Exchange Richmond, VA Publix 107 In one of Richmond's most desirable historic neighborhoods, to include Publix on an elevated platform over parking and additional retail fronting Cary Street. The Village at Hunter's Lake Tampa, FL Sprouts 72 Mixed-use project surrounded by 250, separately owned multifamily units in the growing submarket of New Tampa, anchored by natural and organic grocer Sprouts with additional retail. Ballard Blocks II Seattle, WA PCC Community Markets & West Marine 114 Mixed-use project in a vibrant, urban neighborhood in Seattle, to include specialty grocer PCC Community Markets with additional retail and office/medical use tenants. Midtown East Raleigh, NC Wegmans 159 Desirable location with direct access to downtown Raleigh, to include Wegman's first store in North Carolina along with additional retail. Mellody Farm Chicago, IL Whole Foods, Nordstrom Rack & REI 259 Dominant regional center located in an affluent suburb of Chicago and anchored by a best-inclass grocer and other anchors, with a walkable, experiential layout adjacent to 260 non-owned luxury apartments. Pinecrest Place Miami, FL Whole Foods 70 Located in one of the best submarkets of Miami and widely regarded as one of the most desirable residential communities in Miami-Dade County and anchored by Whole Foods and additional retail. The Village at Riverstone Houston, TX Kroger 167 Located in one of Houston's fastest growing master planned communities, anchored by Kroger and additional retail. Subtotal Ground Up Developments 975 In Process Redevelopments Shopping Center Name Market Grocer/Anchor Tenant Shopping Center GLA Description The Abbot Boston, MA Retail/Office users 65 Generational redevelopment and densification of historic buildings in the heart of Harvard Square into mixed-use project with retail and office. Tech Ridge Austin, TX HEB & Pinstack 214 Demolish vacant 21K SF retail building and construct 49K SF retail building for Pinstack, a premier entertainment venue. Market Common Clarendon Metro, DC Luxury fitness user 422 Reconfiguration of vacant office building into a 130K SF modern, mixed-use building anchored by a luxury fitness club user; office building will offer a modern 3rd and 4th floor office space, in addition to retail on ground floor. Point 50 Metro, DC Whole Foods 48 Demolish existing center and construct 30K SF Whole Foods, and 18K SF of shop space. Pablo Plaza Ph II Jacksonville, FL Whole Foods 161 Reconfiguration of Office Depot box for Whole Foods; Office Depot relocation; acquire and lease back restaurant pad; acquire convenience store parcel to renovate/rebuild to release; façade renovations and site enhancements to center. Bloomingdale Square Tampa, FL Publix, LA Fitness 254 Reconfiguration of the former Walmart space for the relocation and expansion of Publix and HOME centric; backfilling the former Publix box with LA Fitness; construction of an additional 14K SF retail shop building; facade renovations and enhancements to remaining center. Various Properties Various Various 1,595 Various properties where estimated incremental costs are less than $5 Million Subtotal Redevelopments 2,759 Total In Process Developments and Redevelopments 3,733 17 Exhibit 99.2
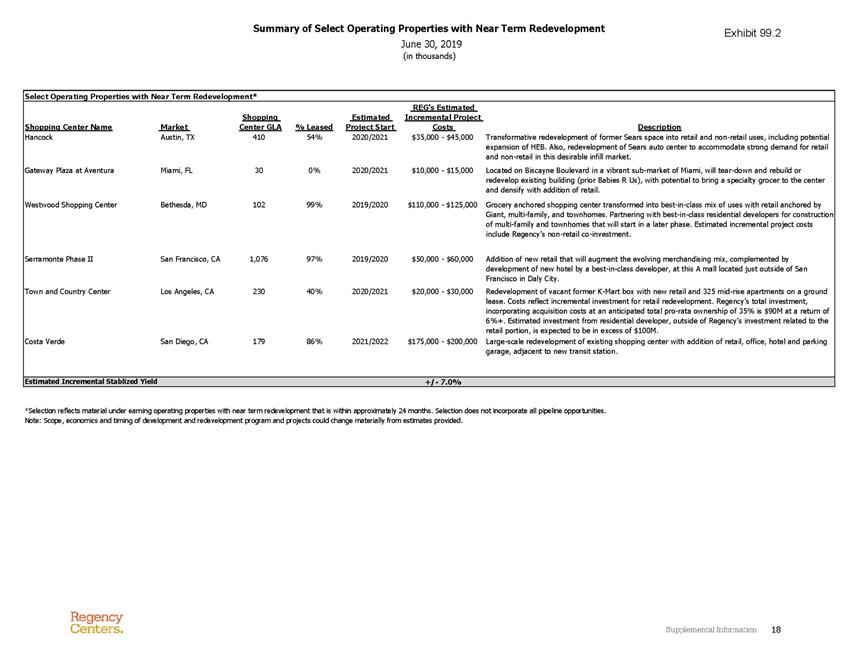
Summary of Select Operating Properties with Near Term Redevelopment June 30, 2019 (in thousands) Select Operating Properties with Near Term Redevelopment* Shopping Center Name Market Shopping Center GLA % Leased Estimated Project Start REG's Estimated Incremental Project Costs Description Hancock Austin, TX 410 54% 2020/2021 $35,000 - $45,000 Transformative redevelopment of former Sears space into retail and non-retail uses, including potential expansion of HEB. Also, redevelopment of Sears auto center to accommodate strong demand for retail and non-retail in this desirable infill market. Gateway Plaza at Aventura Miami, FL 30 0% 2020/2021 $10,000 - $15,000 Located on Biscayne Boulevard in a vibrant sub-market of Miami, will tear-down and rebuild or redevelop existing building (prior Babies R Us), with potential to bring a specialty grocer to the center and densify with addition of retail. Westwood Shopping Center Bethesda, MD 102 99% 2019/2020 $110,000 - $125,000 Grocery anchored shopping center transformed into best-in-class mix of uses with retail anchored by Giant, multi-family, and townhomes. Partnering with best-in-class residential developers for construction of multi-family and townhomes that will start in a later phase. Estimated incremental project costs include Regency's non-retail co-investment. Serramonte Phase II San Francisco, CA 1,076 97% 2019/2020 $50,000 - $60,000 Addition of new retail that will augment the evolving merchandising mix, complemented by development of new hotel by a best-in-class developer, at this A mall located just outside of San Francisco in Daly City. Town and Country Center Los Angeles, CA 230 40% 2020/2021 $20,000 - $30,000 Redevelopment of vacant former K-Mart box with new retail and 325 mid-rise apartments on a ground lease. Costs reflect incremental investment for retail redevelopment. Regency's total investment, incorporating acquisition costs at an anticipated total pro-rata ownership of 35% is $90M at a return of 6%+. Estimated investment from residential developer, outside of Regency's investment related to the retail portion, is expected to be in excess of $100M. Costa Verde San Diego, CA 179 86% 2021/2022 $175,000 - $200,000 Large-scale redevelopment of existing shopping center with addition of retail, office, hotel and parking garage, adjacent to new transit station. Estimated Incremental Stablized Yield +/- 7.0% *Selection reflects material under earning operating properties with near term redevelopment that is within approximately 24 months. Selection does not incorporate all pipeline opportunities. Note: Scope, economics and timing of development and redevelopment program and projects could change materially from estimates provided. 18 Exhibit 99.2

Unconsolidated Investments June 30, 2019 (in thousands) Investment Partner and Number of Total Total Total Ownership Share Investment Equity Portfolio Summary Abbreviation Properties GLA Assets Debt Interest of Debt 6/30/2019 Pick-up State of Oregon (JV-C, JV-C2) 20 2,219 $ 5 27,013 $ 245,979 20.00% $ 49,196 $ 48,857 $ 1 ,571 (JV-CCV) 1 558 9 7,358 59,847 30.00% 17,954 10,949 5 60 21 2,777 6 24,371 305,826 GRI (JV-GRI) 69 8,914 1 ,635,866 9 19,383 40.00% 367,753 182,485 2 1,032 CalSTRS (JV-RC) 6 603 1 09,083 1 0,370 25.00% 2,592 23,829 2 ,964 NYSCRF (JV-NYC) 6 1 ,152 2 75,247 132,229 30.00% 39,669 53,646 6 36 USAA (1) (JV-USA) 7 683 8 8,069 103,956 20.01% 20,800 (3,754) 4 79 Publix (JV-O) 2 211 2 6,463 - 50.00% - 13,084 7 36 Individual Investors (JV-O) 6 869 4 07,721 120,483 18.38% - 50.00% 32,075 132,645 1 5,977 117 15,209 $ 3,166,820 $ 1,592,247 $ 5 30,039 $ 4 61,741 $ 4 3,955 Regency (1) The USAA partnership has distributed proceeds from debt refinancing and real estate sales in excess of Regency's carrying value of its investment resulting in a negative investment balance, which is classified within Accounts Payable and Other Liabilities in the Consolidated Balance Sheets. 19 Exhibit 99.2

Leasing Statistics - Comparable Total Leasing Transactions GLA (in 000s) New Base Rent/Sq. Ft Rent Spread % Weighted Avg. Lease Term Tenant Allowance and Landlord Work /Sq. Ft. 2nd Quarter 2019 371 1,891 $ 1 9.44 7.0% 5.3 $ 3 .95 1st Quarter 2019 240 1,075 2 2.05 8.8% 5.3 4 .01 4th Quarter 2018 379 1,968 2 3.36 9.3% 6.2 4 .87 3rd Quarter 2018 395 1,924 2 1.98 10.1% 6.3 4 .21 Total - 12 months 1,385 6,858 $ 2 1.66 8.9% 5.8 $ 4 .29 New Leases Leasing Transactions GLA (in 000s) New Base Rent/Sq. Ft Rent Spread % Weighted Avg. Lease Term Tenant Allowance and Landlord Work /Sq. Ft. 2nd Quarter 2019 92 227 $ 2 6.93 6.9% 6.8 $ 2 4.12 1st Quarter 2019 53 163 2 8.41 13.2% 8.1 2 5.57 4th Quarter 2018 86 399 2 1.89 22.5% 9.8 2 4.45 3rd Quarter 2018 88 302 2 4.29 35.2% 10.6 2 4.51 Total - 12 months 319 1,091 $ 2 4.76 19.8% 9.1 $ 2 4.55 Renewals Leasing Transactions GLA (in 000s) New Base Rent/Sq. Ft Rent Spread % Weighted Avg. Lease Term Tenant Allowance and Landlord Work /Sq. Ft. 2nd Quarter 2019 279 1,663 $ 1 8.37 7.0% 5.1 $ 1 .09 1st Quarter 2019 187 912 2 1.04 7.9% 4.8 0 .59 4th Quarter 2018 293 1,569 2 3.65 7.2% 5.5 1 .00 3rd Quarter 2018 307 1,622 2 1.55 5.9% 5.5 0 .39 Total - 12 months 1,066 5,766 $ 2 1.13 6.9% 5.3 $ 0 .79 Leasing Statistics - Comparable and Non-comparable Total Leasing Transactions GLA (in 000s) New Base Rent/Sq. Ft Weighted Avg. Lease Term Tenant Allowance and Landlord Work /Sq. Ft. 2nd Quarter 2019 435 2,234 $ 2 0.22 5.4 $ 6 .60 1st Quarter 2019 280 1,217 2 2.11 5.7 7 .36 4th Quarter 2018 426 2,258 2 3.30 6.4 7 .24 3rd Quarter 2018 445 2,336 1 9.53 6.8 4 .98 Total - 12 months 1,586 8,045 $ 2 1.14 6.1 $ 6 .41 Notes: ● All amounts reported at execution. ● Number of leasing transactions and GLA leased reported at 100%; All other statistics reported at pro-rata share. ● Rent spreads are calculated on a comparable-space, cash basis for new and renewal leases executed and include all leasing transactions, including spaces vacant > 12 months. ● Tenant Allowance & Landlord Work are costs required to make the space leasable and include improvements of a space as it relates to a specific lease. These costs include tenant improvements and inducements. ● Excludes Non-Retail Properties Leasing Statistics - Wholly Owned and Regency's Pro-Rata Share of Co-investment Partnerships June 30, 2019 (Retail Operating Properties Only) 20 Exhibit 99.2

Average Base Rent by CBSA - Wholly Owned and Regency's Pro-Rata Share of Co-investment Partnerships June 30, 2019 (in thousands) Largest CBSAs by Population(1) Number of Properties GLA % Leased(2) ABR ABR/Sq. Ft. % of Number of Properties % of GLA % of ABR New York-Newark-Jersey City 16 1,736 97.3% $ 6 5,513 $ 3 8.81 3.8% 4.1% 7.2% Los Angeles-Long Beach-Anaheim 26 2,430 97.3% 6 5,548 2 7.71 6.2% 5.7% 7.2% Chicago-Naperville-Elgin 11 1,622 95.8% 2 9,455 1 8.94 2.6% 3.8% 3.3% Dallas-Fort Worth-Arlington 12 775 97.6% 1 7,041 2 2.53 2.9% 1.8% 1.9% Houston-Woodlands-Sugar Land 13 1,590 97.2% 2 9,502 1 9.09 3.1% 3.7% 3.3% Washington-Arlington-Alexandri 30 2,299 88.6% 5 4,448 2 6.72 7.1% 5.4% 6.0% Philadelphia-Camden-Wilmington 8 694 95.9% 1 5,146 2 2.76 1.9% 1.6% 1.7% Miami-Ft Lauderdale-W Palm Bch 46 5,492 93.2% 1 04,271 2 0.37 10.9% 12.8% 11.5% Atlanta-Sandy Springs-Roswell 22 2,065 94.9% 4 2,305 2 1.59 5.2% 4.8% 4.7% Boston-Cambridge-Newton 10 955 92.7% 2 1,240 2 4.00 2.4% 2.2% 2.3% San Francisco-Oakland-Hayward 22 3,787 95.8% 1 05,711 2 9.15 5.2% 8.9% 11.7% Phoenix-Mesa-Scottsdale - -- - - - - - Detroit-Warren-Dearborn - -- - - - - - Rvrside-San Bernardino-Ontario 2 137 83.9% 3 ,172 2 7.65 0.5% 0.3% 0.4% Minneapol-St. Paul-Bloomington 5 205 97.4% 3 ,277 1 6.44 1.2% 0.5% 0.4% Seattle-Tacoma-Bellevue 16 1,158 97.6% 2 9,824 2 6.39 3.8% 2.7% 3.3% San Diego-Carlsbad 11 1,536 97.3% 4 4,056 2 9.49 2.6% 3.6% 4.9% Tampa-St Petersburg-Clearwater 9 1,280 96.2% 2 1,901 1 7.79 2.1% 3.0% 2.4% Baltimore-Columbia-Towson 5 357 92.8% 7 ,879 2 3.78 1.2% 0.8% 0.9% Denver-Aurora-Lakewood 12 987 95.4% 1 4,699 1 5.61 2.9% 2.3% 1.6% St. Louis 4 408 100.0% 4 ,382 1 0.73 1.0% 1.0% 0.5% Orlando-Kissimmee-Sanford 8 809 95.2% 1 3,561 1 7.60 1.9% 1.9% 1.5% Pittsburgh - 0 -- - - - - - Charlotte-Concord-Gastonia 4 233 97.6% 4 ,641 2 0.38 1.0% 0.5% 0.5% Sacramento-Rosevl-Arden-Arcade 4 318 97.6% 6 ,986 2 2.52 1.0% 0.7% 0.8% Top 25 CBSAs by Population 296 30,874 95.1% $ 704,555 $ 22.73 70.3% 72.2% 77.9% CBSAs Ranked 26 - 50 by Population 62 6,501 92.9% 101,727 1 6.77 14.7% 15.2% 11.2% CBSAs Ranked 51 - 75 by Population 21 2,064 95.9% 48,123 2 3.99 5.0% 4.8% 5.3% CBSAs Ranked 76 - 100 by Population 14 926 98.1% 15,710 1 7.15 3.3% 2.2% 1.7% Other CBSAs 28 2,396 91.2% 34,684 1 5.82 6.7% 5.6% 3.8% Total All Properties 421 42,761 94.7% $ 904,798 $ 22.30 100.0% 100.0% 100.0% (1) 2018 Population Data Source: Synergos Technologies, Inc. (2) Includes Properties in Development and leases that are executed but have not commenced. 21 Exhibit 99.2

Significant Tenant Rents - Wholly Owned and Regency's Pro-Rata Share of Co-investment Partnerships June 30, 2019 (in thousands) Tenant Tenant GLA % of Company- Owned GLA Total Annualized Base Rent % of Total Annualized Base Rent Total # of Leased Stores - 100% Owned and JV # of Leased Stores in JV Publix 2,776 6.5% $ 29,010 3.2% 69 13 Kroger Co.(1) 2,855 6.7% 27,631 3.1% 56 15 Albertsons Companies, Inc.(2) 1,819 4.3% 25,731 2.8% 46 18 Whole Foods 1,062 2.5% 22,349 2.5% 33 11 TJX Companies, Inc.(3) 1,296 3.0% 21,669 2.4% 60 19 CVS 654 1.5% 14,153 1.6% 57 20 Ahold/Delhaize(4) 514 1.2% 12,333 1.4% 15 9 Bed Bath & Beyond Inc.(5) 498 1.2% 9,235 1.0% 19 - Nordstrom(6) 320 0.7% 8,843 1.0% 9 - Ross Dress For Less 551 1.3% 8,621 1.0% 25 9 L.A. Fitness Sports Club 423 1.0% 8,510 0.9% 12 4 Trader Joe's 258 0.6% 8,119 0.9% 26 7 PETCO Animal Supplies, Inc(7) 320 0.7% 7,763 0.9% 38 11 Gap, Inc(8) 216 0.5% 7,182 0.8% 17 2 JAB Holding Company(9) 181 0.4% 6,821 0.8% 60 14 Starbucks 137 0.3% 6,774 0.7% 98 32 Wells Fargo Bank 131 0.3% 6,648 0.7% 51 19 JPMorgan Chase Bank 117 0.3% 6,580 0.7% 36 7 Walgreens 288 0.7% 6,412 0.7% 27 10 Target 570 1.3% 6,365 0.7% 6 2 Bank of America 119 0.3% 6,243 0.7% 42 17 Kohl's 612 1.4% 5,867 0.6% 8 2 H.E. Butt Grocery Company(10) 345 0.8% 5,858 0.6% 5 - Dick's Sporting Goods, Inc.(11) 340 0.8% 5,548 0.6% 7 2 Ulta 170 0.4% 5,081 0.6% 19 3 Top 25 Tenants 16,572 38.7% $ 279,346 30.9% 841 246 (1) Kroger 21 / King Soopers 12 / Harris Teeter 9 / Ralphs 9 / Mariano's Fresh Market 3 / Quality Food Centers 2 (2) Safeway 21 / VONS 7 / Albertson's 4 / Acme Markets 3 / Shaw's 3 / Tom Thumb 3 / Randalls Food & Drug 2 / Star Market 2 / Jewel 1 (3) TJ Maxx 26 / Homegoods 18 / Marshalls 14 / Sierra Trading Post 1 / Homesense 1 (4) Giant 10 / Stop & Shop 4 / Food Lion 1 (5) Bed Bath & Beyond 12 / Cost Plus World Market 5 / Buy Buy Baby 1 / Harmon Face Values 1 (6) Nordstrom Rack 9 (7) Petco 31 / Unleashed by Petco 7 (8) Old Navy 11 / The Gap 3 / Athleta 2 / GAP BR Factory 1 (9) Panera 34 / Einstein Bros Bagels 13 / Peet's' Coffee & Tea 10 / Krispy Kreme 3 (10) H.E.B. 4 / Central Market 1 (11) Dick's Sporting Goods 6 / Golf Galaxy 1 22 Exhibit 99.2
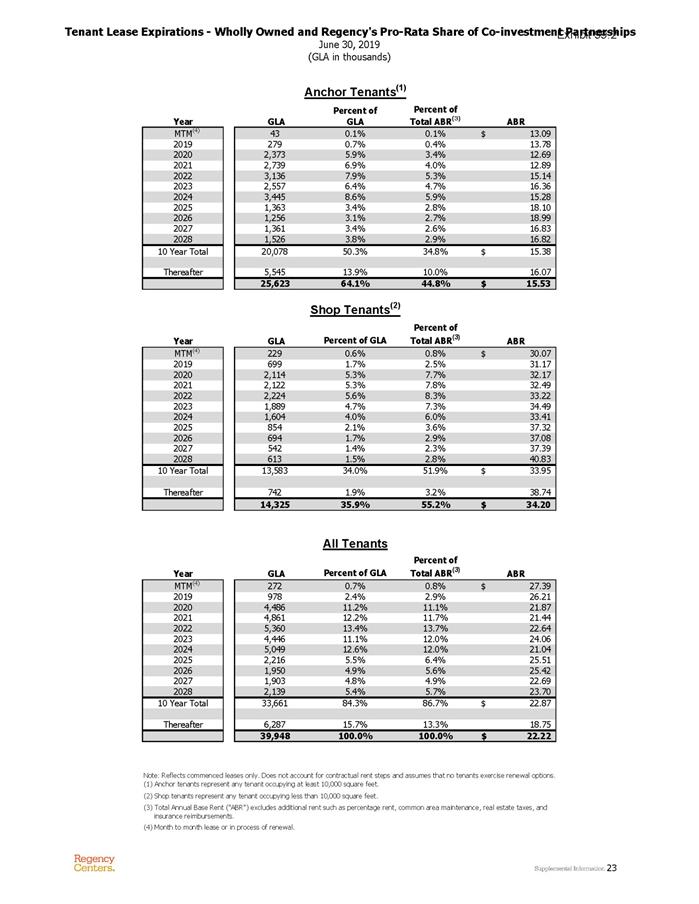
Tenant Lease Expirations - Wholly Owned and Regency's Pro-Rata Share of Co-investment Partnerships June 30, 2019 (GLA in thousands) Year GLA Percent of GLA Percent of Total ABR(3) ABR MTM(4) 43 0.1% 0.1% $ 1 3.09 2019 279 0.7% 0.4% 1 3.78 2020 2,373 5.9% 3.4% 1 2.69 2021 2,739 6.9% 4.0% 1 2.89 2022 3,136 7.9% 5.3% 1 5.14 2023 2,557 6.4% 4.7% 1 6.36 2024 3,445 8.6% 5.9% 1 5.28 2025 1,363 3.4% 2.8% 1 8.10 2026 1,256 3.1% 2.7% 1 8.99 2027 1,361 3.4% 2.6% 1 6.83 2028 1,526 3.8% 2.9% 1 6.82 10 Year Total 20,078 50.3% 34.8% $ 1 5.38 Thereafter 5,545 13.9% 10.0% 1 6.07 25,623 64.1% 44.8% $ 15.53 Year GLA Percent of GLA Percent of Total ABR(3) ABR MTM(4) 229 0.6% 0.8% $ 3 0.07 2019 699 1.7% 2.5% 3 1.17 2020 2,114 5.3% 7.7% 3 2.17 2021 2,122 5.3% 7.8% 3 2.49 2022 2,224 5.6% 8.3% 3 3.22 2023 1,889 4.7% 7.3% 3 4.49 2024 1,604 4.0% 6.0% 3 3.41 2025 854 2.1% 3.6% 3 7.32 2026 694 1.7% 2.9% 3 7.08 2027 542 1.4% 2.3% 3 7.39 2028 613 1.5% 2.8% 4 0.83 10 Year Total 13,583 34.0% 51.9% $ 3 3.95 Thereafter 742 1.9% 3.2% 3 8.74 14,325 35.9% 55.2% $ 34.20 Year GLA Percent of GLA Percent of Total ABR(3) ABR MTM(4) 272 0.7% 0.8% $ 2 7.39 2019 978 2.4% 2.9% 2 6.21 2020 4,486 11.2% 11.1% 2 1.87 2021 4,861 12.2% 11.7% 2 1.44 2022 5,360 13.4% 13.7% 2 2.64 2023 4,446 11.1% 12.0% 2 4.06 2024 5,049 12.6% 12.0% 2 1.04 2025 2,216 5.5% 6.4% 2 5.51 2026 1,950 4.9% 5.6% 2 5.42 2027 1,903 4.8% 4.9% 2 2.69 2028 2,139 5.4% 5.7% 2 3.70 10 Year Total 33,661 84.3% 86.7% $ 2 2.87 Thereafter 6,287 15.7% 13.3% 1 8.75 39,948 100.0% 100.0% $ 22.22 Note: Reflects commenced leases only. Does not account for contractual rent steps and assumes that no tenants exercise renewal options. (1) Anchor tenants represent any tenant occupying at least 10,000 square feet. (2) Shop tenants represent any tenant occupying less than 10,000 square feet. (4) Month to month lease or in process of renewal. Anchor Tenants(1) Shop Tenants(2) All Tenants (3) Total Annual Base Rent ("ABR") excludes additional rent such as percentage rent, common area maintenance, real estate taxes, and insurance reimbursements. 23 Exhibit 99.2
Exhibit 99.2
Portfolio Summary Report By State
June 30, 2019
(GLA in thousands)
|
|
|
|
|
|
JVs at 100% |
REG's pro-rata share |
REG's pro-rata share |
REG's pro-rata share |
|
|
|
|
|
Property Name |
JV |
REG % |
State |
CBSA |
GLA |
GLA |
% Leased |
% Leased - Retail Operating Properties |
Retailer- Owned GLA |
Grocery Anchor GLA |
Major Tenants(1) |
Avg. Base Rent PSF |
|
200 Potrero |
|
|
CA |
San Francisco-Oakland-Hayward |
31 |
31 |
100.0% |
|
|
|
Gizmo Art Production, INC. |
$13.27 |
|
4S Commons Town Center |
M |
85% |
CA |
San Diego-Carlsbad |
240 |
240 |
100.0% |
|
|
68 |
Ralphs, Jimbo's...Naturally!, Bed Bath & Beyond, Cost Plus World Market, CVS, Ace Hardware, Ulta |
$33.79 |
|
Amerige Heights Town Center |
|
|
CA |
Los Angeles-Long Beach-Anaheim |
89 |
89 |
100.0% |
|
143 |
58 |
Albertsons, (Target) |
$29.85 |
|
Balboa Mesa Shopping Center |
|
|
CA |
San Diego-Carlsbad |
207 |
207 |
100.0% |
|
|
42 |
Von's, Kohl's, CVS |
$26.01 |
|
Bayhill Shopping Center |
GRI |
40% |
CA |
San Francisco-Oakland-Hayward |
122 |
49 |
95.7% |
|
|
32 |
Mollie Stone's Market, CVS |
$25.20 |
|
Blossom Valley |
USAA |
20% |
CA |
San Jose-Sunnyvale-Santa Clara |
93 |
19 |
96.7% |
|
|
34 |
Safeway, CVS |
$27.31 |
|
Brea Marketplace |
GRI |
40% |
CA |
Los Angeles-Long Beach-Anaheim |
352 |
141 |
99.2% |
|
|
25 |
Sprout's, Target, 24 Hour Fitness, Big 5 Sporting Goods, Beverages & More!, Childtime Childcare, Golf Galaxy, Old Navy |
$19.37 |
|
Circle Center West |
|
|
CA |
Los Angeles-Long Beach-Anaheim |
64 |
64 |
100.0% |
|
|
|
Marshalls |
$28.12 |
|
Clayton Valley Shopping Center |
|
|
CA |
San Francisco-Oakland-Hayward |
260 |
260 |
92.3% |
|
|
14 |
Grocery Outlet, Orchard Supply Hardware, CVS, Dollar Tree, Ross Dress For Less |
$22.55 |
|
Corral Hollow |
RC |
25% |
CA |
Stockton-Lodi |
167 |
42 |
100.0% |
|
|
66 |
Safeway, Orchard Supply & Hardware, CVS |
$17.51 |
|
Costa Verde Center |
|
|
CA |
San Diego-Carlsbad |
179 |
179 |
86.2% |
|
|
40 |
Bristol Farms, Bookstar, The Boxing Club |
$34.35 |
|
Culver Center |
|
|
CA |
Los Angeles-Long Beach-Anaheim |
217 |
217 |
95.7% |
|
|
37 |
Ralphs, Best Buy, LA Fitness, Sit N' Sleep, Tuesday Morning |
$31.78 |
|
Culver Public Market |
|
|
CA |
Los Angeles-Long Beach-Anaheim |
27 |
27 |
49.4% |
|
|
|
Urbanspace |
$55.95 |
|
Diablo Plaza |
|
|
CA |
San Francisco-Oakland-Hayward |
63 |
63 |
98.5% |
|
53 |
53 |
(Safeway), (CVS), Beverages & More! |
$40.67 |
|
El Camino Shopping Center |
|
|
CA |
Los Angeles-Long Beach-Anaheim |
136 |
136 |
99.5% |
|
|
31 |
Bristol Farms, CVS |
$38.52 |
|
El Cerrito Plaza |
|
|
CA |
San Francisco-Oakland-Hayward |
256 |
256 |
98.1% |
|
67 |
78 |
(Lucky's), Trader Joe's, (CVS), Bed Bath & Beyond, Barnes & Noble, Jo-Ann Fabrics, PETCO, Ross Dress For Less |
$30.07 |
|
El Norte Pkwy Plaza |
|
|
CA |
San Diego-Carlsbad |
91 |
91 |
98.0% |
|
|
42 |
Von's, CVS, Children's Paradise |
$18.75 |
|
Encina Grande |
|
|
CA |
San Francisco-Oakland-Hayward |
106 |
106 |
99.1% |
|
|
38 |
Whole Foods, Walgreens |
$31.67 |
|
Five Points Shopping Center |
GRI |
40% |
CA |
Santa Maria-Santa Barbara |
145 |
58 |
98.7% |
|
|
35 |
Smart & Final, CVS, Ross Dress for Less, Big 5 Sporting Goods, PETCO |
$30.24 |
|
|
Supplemental Information 24 |

Exhibit 99.2
Portfolio Summary Report By State
June 30, 2019
(GLA in thousands)
|
|
|
|
|
|
JVs at 100% |
REG's pro-rata share |
REG's pro-rata share |
REG's pro-rata share |
|
|
|
|
|
Property Name |
JV |
REG % |
State |
CBSA |
GLA |
GLA |
% Leased |
% Leased - Retail Operating Properties |
Retailer- Owned GLA |
Grocery Anchor GLA |
Major Tenants(1) |
Avg. Base Rent PSF |
|
|
|
CA |
Sacramento--Roseville--Arden-Arcade |
90 |
90 |
100.0% |
|
|
55 |
Safeway |
$20.96 |
|
|
French Valley Village Center |
|
|
CA |
Rvrside-San Bernardino-Ontario |
99 |
99 |
97.4% |
|
|
44 |
Stater Bros, CVS |
$26.90 |
|
Friars Mission Center |
|
|
CA |
San Diego-Carlsbad |
147 |
147 |
100.0% |
|
|
55 |
Ralphs, CVS |
$35.89 |
|
Gateway 101 |
|
|
CA |
San Francisco-Oakland-Hayward |
92 |
92 |
100.0% |
|
212 |
|
(Home Depot), (Best Buy), Target, Nordstrom Rack |
$33.00 |
|
Gelson's Westlake Market Plaza |
|
|
CA |
Oxnard-Thousand Oaks-Ventura |
85 |
85 |
98.5% |
|
|
40 |
Gelson's Markets, John of Italy Salon & Spa |
$28.46 |
|
Golden Hills Plaza |
|
|
CA |
San Luis Obispo-Paso Robles-Arroyo Grande |
244 |
244 |
95.4% |
|
|
|
Lowe's, Bed Bath & Beyond, TJ Maxx |
$7.32 |
|
Granada Village |
GRI |
40% |
CA |
Los Angeles-Long Beach-Anaheim |
226 |
91 |
100.0% |
|
|
24 |
Sprout's Markets, Rite Aid, Stein Mart, PETCO, Homegoods |
$24.57 |
|
Hasley Canyon Village |
USAA |
20% |
CA |
Los Angeles-Long Beach-Anaheim |
66 |
13 |
100.0% |
|
|
52 |
Ralphs |
$25.51 |
|
Heritage Plaza |
|
|
CA |
Los Angeles-Long Beach-Anaheim |
230 |
230 |
99.3% |
|
|
44 |
Ralphs, CVS, Daiso, Mitsuwa Marketplace, Total Woman |
$37.76 |
|
Jefferson Square |
|
|
CA |
Rvrside-San Bernardino-Ontario |
38 |
38 |
48.9% |
|
|
|
CVS |
$16.28 |
|
Laguna Niguel Plaza |
GRI |
40% |
CA |
Los Angeles-Long Beach-Anaheim |
42 |
17 |
94.1% |
|
39 |
39 |
(Albertsons), CVS |
$28.26 |
|
Marina Shores |
C |
20% |
CA |
Los Angeles-Long Beach-Anaheim |
68 |
14 |
100.0% |
|
|
26 |
Whole Foods, PETCO |
$36.31 |
|
Mariposa Shopping Center |
GRI |
40% |
CA |
San Jose-Sunnyvale-Santa Clara |
127 |
51 |
94.7% |
|
|
43 |
Safeway, CVS Ross Dress for Less |
$20.98 |
|
Morningside Plaza |
|
|
CA |
Los Angeles-Long Beach-Anaheim |
91 |
91 |
98.4% |
|
|
43 |
Stater Bros. |
$23.56 |
|
Navajo Shopping Center |
GRI |
40% |
CA |
San Diego-Carlsbad |
102 |
41 |
99.1% |
|
|
44 |
Albertsons, Rite Aid, O'Reilly Auto Parts |
$14.55 |
|
Newland Center |
|
|
CA |
Los Angeles-Long Beach-Anaheim |
152 |
152 |
100.0% |
|
|
58 |
Albertsons |
$26.42 |
|
Oak Shade Town Center |
|
|
CA |
Sacramento--Roseville--Arden-Arcade |
104 |
104 |
96.3% |
|
|
40 |
Safeway, Office Max, Rite Aid |
$22.70 |
|
Oakbrook Plaza |
|
|
CA |
Oxnard-Thousand Oaks-Ventura |
83 |
83 |
99.0% |
|
|
44 |
Gelson's Markets, (Longs Drug) |
$20.96 |
|
Parnassus Heights Medical |
RLP |
50% |
CA |
San Francisco-Oakland-Hayward |
146 |
73 |
99.6% |
|
|
|
University of CA |
$85.43 |
|
Persimmon Place |
|
|
CA |
San Francisco-Oakland-Hayward |
153 |
153 |
100.0% |
|
|
40 |
Whole Foods, Nordstrom Rack, Homegoods |
$35.05 |
|
|
Supplemental Information 25 |
Exhibit 99.2
Portfolio Summary Report By State
June 30, 2019
(GLA in thousands)
|
|
|
|
|
|
JVs at 100% |
REG's pro-rata share |
REG's pro-rata share |
REG's pro-rata share |
|
|
|
|
|
Property Name |
JV |
REG % |
State |
CBSA |
GLA |
GLA |
% Leased |
% Leased - Retail Operating Properties |
Retailer- Owned GLA |
Grocery Anchor GLA |
Major Tenants(1) |
Avg. Base Rent PSF |
|
|
|
CA |
San Francisco-Oakland-Hayward |
154 |
154 |
96.4% |
|
|
|
The Container Store, Uniqlo, Forever 21, The Cheesecake Factory,Trufusion |
$45.35 |
|
|
Plaza Hermosa |
|
|
CA |
Los Angeles-Long Beach-Anaheim |
95 |
95 |
92.8% |
|
|
37 |
Von's, CVS |
$26.46 |
|
Pleasant Hill Shopping Center |
GRI |
40% |
CA |
San Francisco-Oakland-Hayward |
227 |
91 |
100.0% |
|
|
|
Target, Burlington, Ross Dress for Less, Homegoods |
$23.06 |
|
Pleasanton Plaza |
|
|
CA |
San Francisco-Oakland-Hayward |
163 |
163 |
75.8% |
|
|
|
JCPenney, OfficeMax, Cost Plus World Market |
$10.69 |
|
Point Loma Plaza |
GRI |
40% |
CA |
San Diego-Carlsbad |
205 |
82 |
94.9% |
|
|
50 |
Von's, 24 Hour Fitness, Jo-Ann Fabrics, Marshalls |
$22.79 |
|
Potrero Center |
|
|
CA |
San Francisco-Oakland-Hayward |
227 |
227 |
99.8% |
|
|
60 |
Safeway, Decathlon Sport, 24 Hour Fitness, Ross Dress for Less, Petco, Party City |
$33.22 |
|
Powell Street Plaza |
|
|
CA |
San Francisco-Oakland-Hayward |
166 |
166 |
91.2% |
|
|
10 |
Trader Joe's, PETCO, Beverages & More!, Ross Dress For Less, Marshalls |
$35.32 |
|
Raley's Supermarket |
C |
20% |
CA |
Sacramento--Roseville--Arden-Arcade |
63 |
13 |
100.0% |
|
|
63 |
Raley's |
$12.50 |
|
Ralphs Circle Center |
|
|
CA |
Los Angeles-Long Beach-Anaheim |
60 |
60 |
100.0% |
|
|
35 |
Ralphs |
$18.41 |
|
Rancho San Diego Village |
GRI |
40% |
CA |
San Diego-Carlsbad |
153 |
61 |
96.5% |
|
|
40 |
Smart & Final, (Longs Drug), 24 Hour Fitness |
$22.45 |
|
Rona Plaza |
|
|
CA |
Los Angeles-Long Beach-Anaheim |
52 |
52 |
100.0% |
|
|
37 |
Superior Super Warehouse |
$21.11 |
|
San Carlos Marketplace |
|
|
CA |
San Francisco-Oakland-Hayward |
154 |
154 |
100.0% |
|
|
|
TJ Maxx, Best Buy, PetSmart, Bassett Furniture |
$35.30 |
|
Scripps Ranch Marketplace |
|
|
CA |
San Diego-Carlsbad |
132 |
132 |
96.9% |
|
|
57 |
Vons, CVS |
$31.29 |
|
San Leandro Plaza |
|
|
CA |
San Francisco-Oakland-Hayward |
50 |
50 |
100.0% |
|
38 |
38 |
(Safeway), (CVS) |
$36.73 |
|
Seal Beach |
C |
20% |
CA |
Los Angeles-Long Beach-Anaheim |
97 |
19 |
94.8% |
|
|
48 |
Safeway, CVS |
$25.70 |
|
Sequoia Station |
|
|
CA |
San Francisco-Oakland-Hayward |
103 |
103 |
100.0% |
|
62 |
62 |
(Safeway), CVS, Barnes & Noble, Old Navy, Pier 1 |
$42.53 |
|
Serramonte Center |
|
|
CA |
San Francisco-Oakland-Hayward |
1,076 |
1,076 |
96.8% |
|
|
|
Macy's, Target, Dick's Sporting Goods, Dave & Buster's, Nordstrom Rack, JCPenney, Buy Buy Baby, Cost Plus World Market, Crunch Gym, DAISO, Forever 21, H&M, Old Navy, Part City, Ross, TJ Maxx, Uniqlo |
$24.58 |
|
Shoppes at Homestead |
|
|
CA |
San Jose-Sunnyvale-Santa Clara |
113 |
113 |
100.0% |
|
53 |
|
(Orchard Supply Hardware), CVS, Crunch Fitness |
$23.56 |
|
Silverado Plaza |
GRI |
40% |
CA |
Napa |
85 |
34 |
99.0% |
|
|
32 |
Nob Hill, CVS |
$17.94 |
|
|
Supplemental Information 26 |
Exhibit 99.2
Portfolio Summary Report By State
June 30, 2019
(GLA in thousands)
|
|
|
|
|
|
JVs at 100% |
REG's pro-rata share |
REG's pro-rata share |
REG's pro-rata share |
|
|
|
|
|
Property Name |
JV |
REG % |
State |
CBSA |
GLA |
GLA |
% Leased |
% Leased - Retail Operating Properties |
Retailer- Owned GLA |
Grocery Anchor GLA |
Major Tenants(1) |
Avg. Base Rent PSF |
|
GRI |
40% |
CA |
San Jose-Sunnyvale-Santa Clara |
92 |
37 |
100.0% |
|
|
53 |
Safeway |
$19.24 |
|
|
South Bay Village |
|
|
CA |
Los Angeles-Long Beach-Anaheim |
108 |
108 |
100.0% |
|
|
30 |
Wal-Mart, Orchard Supply Hardware, Homegoods |
$20.31 |
|
Talega Village Center |
|
|
CA |
Los Angeles-Long Beach-Anaheim |
102 |
102 |
100.0% |
|
|
46 |
Ralphs |
$22.80 |
|
Tassajara Crossing |
|
|
CA |
San Francisco-Oakland-Hayward |
146 |
146 |
99.3% |
|
|
56 |
Safeway, CVS, Alamo Hardware |
$24.49 |
|
The Hub Hillcrest Market |
|
|
CA |
San Diego-Carlsbad |
149 |
149 |
97.7% |
|
|
52 |
Ralphs, Trader Joe's |
$39.14 |
|
The Marketplace Shopping Ctr |
|
|
CA |
Sacramento--Roseville--Arden-Arcade |
111 |
111 |
96.7% |
|
|
35 |
Safeway,CVS, Petco |
$24.87 |
|
Town and Country Center |
O |
18% |
CA |
Los Angeles-Long Beach-Anaheim |
230 |
42 |
40.0% |
|
|
41 |
Whole Foods, CVS, Citibank |
$47.16 |
|
Tustin Legacy |
|
|
CA |
Los Angeles-Long Beach-Anaheim |
112 |
112 |
100.0% |
|
|
44 |
Stater Bros, CVS |
$31.63 |
|
Twin Oaks Shopping Center |
GRI |
40% |
CA |
Los Angeles-Long Beach-Anaheim |
98 |
39 |
93.4% |
|
|
41 |
Ralphs, Rite Aid |
$20.01 |
|
Twin Peaks |
|
|
CA |
San Diego-Carlsbad |
208 |
208 |
99.5% |
|
|
45 |
Atlas International Market, Target |
$20.84 |
|
Valencia Crossroads |
|
|
CA |
Los Angeles-Long Beach-Anaheim |
173 |
173 |
100.0% |
|
|
35 |
Whole Foods, Kohl's |
$27.51 |
|
Village at La Floresta |
|
|
CA |
Los Angeles-Long Beach-Anaheim |
87 |
87 |
100.0% |
|
|
37 |
Whole Foods |
$34.04 |
|
Von's Circle Center |
|
|
CA |
Los Angeles-Long Beach-Anaheim |
151 |
151 |
100.0% |
|
|
45 |
Von's, Ross Dress for Less, Planet Fitness |
$22.00 |
|
West Park Plaza |
|
|
CA |
San Jose-Sunnyvale-Santa Clara |
88 |
88 |
100.0% |
|
|
25 |
Safeway, Rite Aid |
$19.08 |
|
Westlake Village Plaza and Center |
|
|
CA |
Oxnard-Thousand Oaks-Ventura |
201 |
201 |
95.1% |
|
|
72 |
Von's, Sprouts, (CVS) |
$38.33 |
|
Willows Shopping Center |
|
|
CA |
San Francisco-Oakland-Hayward |
249 |
249 |
86.4% |
|
|
|
REI, UFC Gym, Old Navy, Pier 1 Imports, Ulta, ClaimJumper, The Jungle Fun Concord |
$29.79 |
|
Woodman Van Nuys |
|
|
CA |
Los Angeles-Long Beach-Anaheim |
108 |
108 |
100.0% |
|
|
78 |
El Super |
$15.95 |
|
Woodside Central |
|
|
CA |
San Francisco-Oakland-Hayward |
81 |
81 |
98.5% |
|
113 |
|
(Target),Chuck E. Cheese, Marshalls |
$25.23 |
|
Ygnacio Plaza |
GRI |
40% |
CA |
San Francisco-Oakland-Hayward |
110 |
44 |
99.0% |
|
|
|
Sports Basement,TJ Maxx |
$37.55 |
|
|
|
|
CA |
|
11,210 |
9,262 |
95.8% |
96.6% |
780 |
2,687 |
|
|
|
|
Supplemental Information 27 |
Exhibit 99.2
Portfolio Summary Report By State
June 30, 2019
(GLA in thousands)
|
|
|
|
|
|
JVs at 100% |
REG's pro-rata share |
REG's pro-rata share |
REG's pro-rata share |
|
|
|
|
|
Property Name |
JV |
REG % |
State |
CBSA |
GLA |
GLA |
% Leased |
% Leased - Retail Operating Properties |
Retailer- Owned GLA |
Grocery Anchor GLA |
Major Tenants(1) |
Avg. Base Rent PSF |
|
GRI |
40% |
CO |
Denver-Aurora-Lakewood |
353 |
141 |
90.9% |
|
|
71 |
King Soopers, Hobby Lobby, Applejack Liquors, PetSmart, Homegoods, Sierra Trading Post, Ulta |
$14.75 |
|
|
Alcove On Arapahoe |
GRI |
40% |
CO |
Boulder |
159 |
64 |
91.7% |
|
|
44 |
Safeway, Jo-Ann Fabrics, PETCO, Pier 1 Imports, HomeGoods |
$18.36 |
|
Belleview Square |
|
|
CO |
Denver-Aurora-Lakewood |
117 |
117 |
100.0% |
|
|
65 |
King Soopers |
$20.36 |
|
Boulevard Center |
|
|
CO |
Denver-Aurora-Lakewood |
79 |
79 |
79.8% |
|
53 |
53 |
(Safeway), One Hour Optical |
$30.35 |
|
Buckley Square |
|
|
CO |
Denver-Aurora-Lakewood |
116 |
116 |
96.1% |
|
|
62 |
King Soopers, Ace Hardware |
$11.50 |
|
Centerplace of Greeley III |
|
|
CO |
Greeley |
119 |
119 |
100.0% |
|
|
|
Hobby Lobby, Best Buy, TJ Maxx |
$11.33 |
|
Cherrywood Square Shop Ctr |
GRI |
40% |
CO |
Denver-Aurora-Lakewood |
97 |
39 |
96.4% |
|
|
72 |
King Soopers |
$10.41 |
|
Crossroads Commons |
C |
20% |
CO |
Boulder |
143 |
29 |
100.0% |
|
|
66 |
Whole Foods, Barnes & Noble, Bicycle Village |
$27.80 |
|
Crossroads Commons II |
C |
20% |
CO |
Boulder |
20 |
4 |
65.8% |
|
|
|
(Whole Foods), (Barnes & Noble, Bicycle Village) |
$36.02 |
|
Falcon Marketplace |
|
|
CO |
Colorado Springs |
22 |
22 |
93.8% |
|
184 |
50 |
(Wal-Mart) |
$23.25 |
|
Hilltop Village |
|
|
CO |
Denver-Aurora-Lakewood |
100 |
100 |
100.0% |
|
|
66 |
King Soopers |
$11.35 |
|
Kent Place |
M |
50% |
CO |
Denver-Aurora-Lakewood |
48 |
48 |
100.0% |
|
|
30 |
King Soopers |
$20.88 |
|
Littleton Square |
|
|
CO |
Denver-Aurora-Lakewood |
99 |
99 |
97.5% |
|
|
78 |
King Soopers |
$11.02 |
|
Lloyd King Center |
|
|
CO |
Denver-Aurora-Lakewood |
83 |
83 |
98.3% |
|
|
61 |
King Soopers |
$12.21 |
|
Marketplace at Briargate |
|
|
CO |
Colorado Springs |
29 |
29 |
94.4% |
|
66 |
66 |
(King Soopers) |
$32.34 |
|
Monument Jackson Creek |
|
|
CO |
Colorado Springs |
85 |
85 |
100.0% |
|
|
70 |
King Soopers |
$12.30 |
|
Ralston Square Shopping Center |
GRI |
40% |
CO |
Denver-Aurora-Lakewood |
83 |
33 |
97.0% |
|
|
55 |
King Soopers |
$11.59 |
|
Shops at Quail Creek |
|
|
CO |
Denver-Aurora-Lakewood |
38 |
38 |
89.2% |
|
100 |
100 |
(King Soopers) |
$28.94 |
|
Stroh Ranch |
|
|
CO |
Denver-Aurora-Lakewood |
93 |
93 |
98.3% |
|
|
70 |
King Soopers |
$13.23 |
|
Woodmen Plaza |
|
|
CO |
Colorado Springs |
116 |
116 |
93.4% |
|
|
70 |
King Soopers |
$13.16 |
|
|
|
|
CO |
|
2,000 |
1,455 |
95.1% |
95.7% |
403 |
1,149 |
|
|
|
22 Crescent Road |
|
|
CT |
Bridgeport-Stamford-Norwalk |
4 |
4 |
100.0% |
|
|
|
|
$60.00 |
|
91 Danbury Road |
|
|
CT |
Bridgeport-Stamford-Norwalk |
5 |
5 |
100.0% |
|
|
|
|
$27.45 |
|
Black Rock |
M |
80% |
CT |
Bridgeport-Stamford-Norwalk |
98 |
98 |
97.8% |
|
|
|
Old Navy, The Clubhouse |
$30.68 |
|
Brick Walk |
M |
80% |
CT |
Bridgeport-Stamford-Norwalk |
123 |
123 |
86.6% |
|
|
|
|
$46.55 |
|
Brookside Plaza |
|
|
CT |
Hartford-West Hartford-East Hartford |
217 |
217 |
91.4% |
|
|
60 |
ShopRite, Bed, Bath & Beyond, TJ Maxx, PetSmart, Walgreens, Staples |
$14.59 |
|
Compo Acres Shopping Center |
|
|
CT |
Bridgeport-Stamford-Norwalk |
43 |
43 |
100.0% |
|
|
12 |
Trader Joe's |
$50.18 |
|
Copps Hill Plaza |
|
|
CT |
Bridgeport-Stamford-Norwalk |
185 |
185 |
100.0% |
|
|
59 |
Stop & Shop, Kohl's, Rite Aid |
$14.24 |
|
|
Supplemental Information 28 |
Exhibit 99.2
Portfolio Summary Report By State
June 30, 2019
(GLA in thousands)
|
|
|
|
|
|
JVs at 100% |
REG's pro-rata share |
REG's pro-rata share |
REG's pro-rata share |
|
|
|
|
|
Property Name |
JV |
REG % |
State |
CBSA |
GLA |
GLA |
% Leased |
% Leased - Retail Operating Properties |
Retailer- Owned GLA |
Grocery Anchor GLA |
Major Tenants(1) |
Avg. Base Rent PSF |
|
GRI |
40% |
CT |
Hartford-West Hartford-East Hartford |
186 |
74 |
100.0% |
|
|
10 |
Trader Joe's, Best Buy, Edge Fitness, Old Navy, The Tile Shop, Total Wine and More |
$29.17 |
|
|
Danbury Green |
|
|
CT |
Bridgeport-Stamford-Norwalk |
124 |
124 |
100.0% |
|
|
12 |
Trader Joe's, Hilton Garden Inn, DSW, Staples, Rite Aid, Warehouse Wines & Liquors |
$24.03 |
|
Darinor Plaza |
|
|
CT |
Bridgeport-Stamford-Norwalk |
153 |
153 |
100.0% |
|
|
|
Kohl's, Old Navy, Party City |
$19.00 |
|
Fairfield Center |
M |
80% |
CT |
Bridgeport-Stamford-Norwalk |
94 |
94 |
93.2% |
|
|
|
Fairfield University Bookstore, Merril Lynch |
$32.64 |
|
Post Road Plaza |
|
|
CT |
Bridgeport-Stamford-Norwalk |
20 |
20 |
100.0% |
|
|
11 |
Trader Joe's |
$53.92 |
|
Southbury Green |
|
|
CT |
New Haven-Milford |
156 |
156 |
92.9% |
|
|
60 |
ShopRite, Homegoods |
$22.45 |
|
The Village Center |
|
|
CT |
Bridgeport-Stamford-Norwalk |
90 |
90 |
79.8% |
|
|
22 |
The Fresh Market |
$39.95 |
|
Walmart Norwalk |
|
|
CT |
Bridgeport-Stamford-Norwalk |
142 |
142 |
100.0% |
|
|
112 |
WalMart, HomeGoods |
$0.56 |
|
|
|
|
CT |
|
1,639 |
1,528 |
95.5% |
95.2% |
0 |
358 |
|
|
|
Shops at The Columbia |
RC |
25% |
DC |
Washington-Arlington-Alexandri |
23 |
6 |
85.8% |
|
|
12 |
Trader Joe's |
$41.19 |
|
Spring Valley Shopping Center |
GRI |
40% |
DC |
Washington-Arlington-Alexandri |
17 |
7 |
82.4% |
|
|
|
|
$113.49 |
|
|
|
|
DC |
|
40 |
12 |
84.4% |
84.0% |
0 |
12 |
|
|
|
Pike Creek |
|
|
DE |
Philadelphia-Camden-Wilmington |
232 |
232 |
96.5% |
|
|
49 |
Acme Markets, K-Mart |
$15.01 |
|
Shoppes of Graylyn |
GRI |
40% |
DE |
Philadelphia-Camden-Wilmington |
64 |
26 |
92.2% |
|
|
|
Rite Aid |
$24.04 |
|
|
|
|
DE |
|
296 |
257 |
95.5% |
96.1% |
0 |
49 |
|
|
|
Alafaya Village |
|
|
FL |
Orlando-Kissimmee-Sanford |
38 |
38 |
86.5% |
|
58 |
58 |
(Lucky's) |
$22.46 |
|
Anastasia Plaza |
|
|
FL |
Jacksonville |
102 |
102 |
93.5% |
|
|
49 |
Publix |
$13.57 |
|
Atlantic Village |
|
|
FL |
Jacksonville |
105 |
105 |
92.5% |
|
|
|
LA Fitness, Pet Supplies Plus |
$16.95 |
|
Aventura Shopping Center |
|
|
FL |
Miami-Ft Lauderdale-W Palm Bch |
97 |
97 |
98.9% |
|
|
49 |
Publix, CVS |
$36.96 |
|
Aventura Square |
|
|
FL |
Miami-Ft Lauderdale-W Palm Bch |
144 |
144 |
79.3% |
|
|
|
Bed, Bath & Beyond, DSW, Jewelry Exchange, Old Navy |
$39.16 |
|
Banco Popular Building |
|
|
FL |
Miami-Ft Lauderdale-W Palm Bch |
33 |
33 |
27.1% |
|
|
|
|
$26.19 |
|
Berkshire Commons |
|
|
FL |
Naples-Immokalee-Marco Island |
110 |
110 |
97.5% |
|
|
66 |
Publix, Walgreens |
$14.34 |
|
Bird 107 Plaza |
|
|
FL |
Miami-Ft Lauderdale-W Palm Bch |
40 |
40 |
92.9% |
|
|
|
Walgreens |
$19.95 |
|
Bird Ludlam |
|
|
FL |
Miami-Ft Lauderdale-W Palm Bch |
192 |
192 |
98.0% |
|
|
44 |
Winn-Dixie, CVS, Goodwill |
$23.32 |
|
Bloomingdale Square |
|
|
FL |
Tampa-St. Petersburg-Clearwater |
254 |
254 |
93.9% |
|
|
48 |
Publix, Bealls, Dollar Tree, Home Centric, LA Fitness |
$17.74 |
|
|
Supplemental Information 29 |
Exhibit 99.2
Portfolio Summary Report By State
June 30, 2019
(GLA in thousands)
|
|
|
|
|
|
JVs at 100% |
REG's pro-rata share |
REG's pro-rata share |
REG's pro-rata share |
|
|
|
|
|
Property Name |
JV |
REG % |
State |
CBSA |
GLA |
GLA |
% Leased |
% Leased - Retail Operating Properties |
Retailer- Owned GLA |
Grocery Anchor GLA |
Major Tenants(1) |
Avg. Base Rent PSF |
|
|
|
FL |
Miami-Ft Lauderdale-W Palm Bch |
124 |
124 |
98.4% |
|
|
40 |
Publix, Walgreens, Anthony's |
$14.75 |
|
|
Boca Village Square |
|
|
FL |
Miami-Ft Lauderdale-W Palm Bch |
92 |
92 |
97.6% |
|
|
36 |
Publix, CVS |
$22.32 |
|
Boynton Lakes Plaza |
|
|
FL |
Miami-Ft Lauderdale-W Palm Bch |
110 |
110 |
94.9% |
|
|
46 |
Publix, Citi Trends, Pet Supermarket |
$16.70 |
|
Boynton Plaza |
|
|
FL |
Miami-Ft Lauderdale-W Palm Bch |
105 |
105 |
94.4% |
|
|
54 |
Publix, CVS |
$21.07 |
|
Brooklyn Station on Riverside |
|
|
FL |
Jacksonville |
50 |
50 |
97.2% |
|
|
20 |
The Fresh Market |
$26.14 |
|
Caligo Crossing |
|
|
FL |
Miami-Ft Lauderdale-W Palm Bch |
11 |
11 |
61.0% |
|
98 |
|
(Kohl's) |
$47.70 |
|
Carriage Gate |
|
|
FL |
Tallahassee |
73 |
73 |
100.0% |
|
|
13 |
Trader Joe's, TJ Maxx |
$23.39 |
|
Cashmere Corners |
|
|
FL |
Port St. Lucie |
86 |
86 |
76.1% |
|
|
44 |
WalMart |
$13.58 |
|
Charlotte Square |
|
|
FL |
Punta Gorda |
91 |
91 |
77.7% |
|
|
44 |
WalMart |
$10.36 |
|
Chasewood Plaza |
|
|
FL |
Miami-Ft Lauderdale-W Palm Bch |
151 |
151 |
98.2% |
|
|
54 |
Publix, Pet Smart |
$26.00 |
|
Concord Shopping Plaza |
|
|
FL |
Miami-Ft Lauderdale-W Palm Bch |
309 |
309 |
95.4% |
|
|
78 |
Winn-Dixie, Home Depot, Big Lots, Dollar Tree, YouFit Health Club |
$12.50 |
|
Coral Reef Shopping Center |
|
|
FL |
Miami-Ft Lauderdale-W Palm Bch |
75 |
75 |
98.8% |
|
|
25 |
Aldi, Walgreens |
$31.14 |
|
Corkscrew Village |
|
|
FL |
Cape Coral-Fort Myers |
82 |
82 |
97.0% |
|
|
51 |
Publix |
$14.00 |
|
Country Walk Plaza |
NYC |
30% |
FL |
Miami-Ft Lauderdale-W Palm Bch |
101 |
30 |
93.6% |
|
|
40 |
Publix, CVS |
$20.24 |
|
Countryside Shops |
|
|
FL |
Miami-Ft Lauderdale-W Palm Bch |
193 |
193 |
93.1% |
|
|
46 |
Publix, Stein Mart, Ross Dress for Less |
$18.73 |
|
Courtyard Shopping Center |
|
|
FL |
Jacksonville |
137 |
137 |
100.0% |
|
63 |
63 |
(Publix), Target |
$3.50 |
|
Fleming Island |
|
|
FL |
Jacksonville |
132 |
132 |
98.3% |
|
130 |
48 |
Publix, (Target), PETCO, Planet Fitness |
$16.20 |
|
Fountain Square |
|
|
FL |
Miami-Ft Lauderdale-W Palm Bch |
177 |
177 |
95.6% |
|
140 |
46 |
Publix,(Target), Ross Dress for Less, TJ Maxx, Ulta |
$25.66 |
|
Gardens Square |
|
|
FL |
Miami-Ft Lauderdale-W Palm Bch |
90 |
90 |
100.0% |
|
|
42 |
Publix |
$18.20 |
|
Glengary Shoppes |
|
|
FL |
North Port-Sarasota-Bradenton |
93 |
93 |
100.0% |
|
|
|
Best Buy, Barnes & Noble |
$19.67 |
|
Shoppes of Grande Oak |
|
|
FL |
Cape Coral-Fort Myers |
79 |
79 |
100.0% |
|
|
54 |
Publix |
$16.32 |
|
Greenwood Shopping Centre |
|
|
FL |
Miami-Ft Lauderdale-W Palm Bch |
133 |
133 |
93.2% |
|
|
50 |
Publix, Beall's |
$15.56 |
|
|
Supplemental Information 30 |
Exhibit 99.2
Portfolio Summary Report By State
June 30, 2019
(GLA in thousands)
|
|
|
|
|
|
JVs at 100% |
REG's pro-rata share |
REG's pro-rata share |
REG's pro-rata share |
|
|
|
|
|
Property Name |
JV |
REG % |
State |
CBSA |
GLA |
GLA |
% Leased |
% Leased - Retail Operating Properties |
Retailer- Owned GLA |
Grocery Anchor GLA |
Major Tenants(1) |
Avg. Base Rent PSF |
|
|
|
FL |
Miami-Ft Lauderdale-W Palm Bch |
184 |
184 |
98.7% |
|
86 |
40 |
Publix, Metro-Dade Public Library, (Kendall Ice Arena), YouFit Health Club, Goodwill, CVS |
$17.09 |
|
|
Hibernia Pavilion |
|
|
FL |
Jacksonville |
51 |
51 |
89.6% |
|
|
39 |
Publix |
$16.01 |
|
Homestead McDonald's |
|
|
FL |
Miami-Ft Lauderdale-W Palm Bch |
4 |
4 |
100.0% |
|
|
|
|
$27.74 |
|
John's Creek Center |
C |
20% |
FL |
Jacksonville |
75 |
15 |
100.0% |
|
|
45 |
Publix |
$15.50 |
|
Julington Village |
C |
20% |
FL |
Jacksonville |
82 |
16 |
100.0% |
|
|
51 |
Publix, (CVS) |
$16.33 |
|
Kirkman Shoppes |
|
|
FL |
Orlando-Kissimmee-Sanford |
115 |
115 |
95.7% |
|
|
|
LA Fitness, Walgreens |
$23.44 |
|
Lake Mary Centre |
|
|
FL |
Orlando-Kissimmee-Sanford |
360 |
360 |
94.2% |
|
|
25 |
The Fresh Market, Academy Sports, Hobby Lobby, LA Fitness, Ross Dress for Less, Office Depot |
$15.87 |
|
Lantana Outparcels |
|
|
FL |
Miami-Ft Lauderdale-W Palm Bch |
17 |
17 |
100.0% |
|
|
|
|
$18.28 |
|
Mandarin Landing |
|
|
FL |
Jacksonville |
140 |
140 |
90.1% |
|
|
50 |
Whole Foods, Office Depot, Aveda Institute |
$18.01 |
|
Millhopper Shopping Center |
|
|
FL |
Gainesville |
83 |
83 |
100.0% |
|
|
46 |
Publix |
$17.84 |
|
Naples Walk Shopping Center |
|
|
FL |
Naples-Immokalee-Marco Island |
125 |
125 |
96.7% |
|
|
51 |
Publix |
$17.11 |
|
Newberry Square |
|
|
FL |
Gainesville |
181 |
181 |
45.8% |
|
|
40 |
Publix, Dollar Tree |
$10.19 |
|
Nocatee Town Center |
|
|
FL |
Jacksonville |
110 |
110 |
100.0% |
|
|
54 |
Publix |
$20.67 |
|
Northgate Square |
|
|
FL |
Tampa-St. Petersburg-Clearwater |
75 |
75 |
100.0% |
|
|
48 |
Publix |
$15.17 |
|
Oakleaf Commons |
|
|
FL |
Jacksonville |
74 |
74 |
96.2% |
|
|
46 |
Publix |
$15.02 |
|
Ocala Corners |
|
|
FL |
Tallahassee |
87 |
87 |
98.6% |
|
|
61 |
Publix |
$14.99 |
|
Old St Augustine Plaza |
|
|
FL |
Jacksonville |
256 |
256 |
100.0% |
|
|
52 |
Publix, Burlington Coat Factory, Hobby Lobby, LA Fitness, Ross Dress for Less |
$9.97 |
|
Pablo Plaza |
|
|
FL |
Jacksonville |
161 |
161 |
98.4% |
|
|
34 |
Whole Foods, Office Depot, Marshalls, HomeGoods, PetSmart |
$17.23 |
|
Pavillion |
|
|
FL |
Naples-Immokalee-Marco Island |
168 |
168 |
90.2% |
|
|
|
LA Fitness, Paragon Theaters |
$21.59 |
|
Pine Island |
|
|
FL |
Miami-Ft Lauderdale-W Palm Bch |
255 |
255 |
97.9% |
|
|
40 |
Publix, Burlington Coat Factory, Beall's, YouFit Health Club |
$14.66 |
|
Pine Ridge Square |
|
|
FL |
Miami-Ft Lauderdale-W Palm Bch |
118 |
118 |
97.0% |
|
|
17 |
The Fresh Market, Bed, Bath & Beyond, Marshalls, Ulta |
$17.93 |
|
Pine Tree Plaza |
|
|
FL |
Jacksonville |
63 |
63 |
92.9% |
|
|
38 |
Publix |
$14.59 |
|
Pinecrest Place |
|
|
FL |
Miami-Ft Lauderdale-W Palm Bch |
70 |
70 |
92.0% |
|
173 |
47 |
Whole Foods, (Target) |
$39.36 |
|
Plaza Venezia |
C |
20% |
FL |
Orlando-Kissimmee-Sanford |
202 |
40 |
100.0% |
|
|
51 |
Publix |
$26.74 |
|
|
Supplemental Information 31 |
Exhibit 99.2
Portfolio Summary Report By State
June 30, 2019
(GLA in thousands)
|
|
|
|
|
|
JVs at 100% |
REG's pro-rata share |
REG's pro-rata share |
REG's pro-rata share |
|
|
|
|
|
Property Name |
JV |
REG % |
State |
CBSA |
GLA |
GLA |
% Leased |
% Leased - Retail Operating Properties |
Retailer- Owned GLA |
Grocery Anchor GLA |
Major Tenants(1) |
Avg. Base Rent PSF |
|
|
|
FL |
Miami-Ft Lauderdale-W Palm Bch |
202 |
202 |
99.5% |
|
|
45 |
Winn-Dixie, Burlington Coat Factory, Pasteur Medical Center, Tuesday Morning, Planet Fitness |
$15.85 |
|
|
Prosperity Centre |
|
|
FL |
Miami-Ft Lauderdale-W Palm Bch |
124 |
124 |
93.5% |
|
|
|
Bed, Bath & Beyond, Office Depot, TJ Maxx, CVS |
$21.84 |
|
Regency Square |
|
|
FL |
Tampa-St. Petersburg-Clearwater |
352 |
352 |
96.0% |
|
66 |
|
AMC Theater, (Best Buy), (Macdill), Dollar Tree, Five Below, Marshall's, Michael's, PETCO, Shoe Carnival, Staples, TJ Maxx, Ulta |
$18.55 |
|
Ryanwood Square |
|
|
FL |
Sebastian-Vero Beach |
115 |
115 |
88.8% |
|
|
40 |
Publix, Beall's, Harbor Freight Tools |
$11.29 |
|
Salerno Village |
|
|
FL |
Port St. Lucie |
5 |
5 |
100.0% |
|
|
|
|
$16.53 |
|
Sawgrass Promenade |
|
|
FL |
Miami-Ft Lauderdale-W Palm Bch |
107 |
107 |
91.5% |
|
|
36 |
Publix, Walgreens, Dollar Tree |
$12.59 |
|
Seminole Shoppes |
O |
50% |
FL |
Jacksonville |
87 |
44 |
98.4% |
|
|
54 |
Publix |
$22.90 |
|
Sheridan Plaza |
|
|
FL |
Miami-Ft Lauderdale-W Palm Bch |
506 |
506 |
86.0% |
|
|
66 |
Publix, Kohl's, LA Fitness, Office Depot, Ross Dress for Less, Pet Supplies Plus |
$19.15 |
|
Shoppes @ 104 |
|
|
FL |
Miami-Ft Lauderdale-W Palm Bch |
112 |
112 |
98.8% |
|
|
46 |
Winn-Dixie, CVS |
$19.04 |
|
Shoppes at Bartram Park |
O |
50% |
FL |
Jacksonville |
134 |
67 |
100.0% |
|
97 |
45 |
Publix, (Kohl's), (Tutor Time) |
$20.55 |
|
Shoppes at Lago Mar |
|
|
FL |
Miami-Ft Lauderdale-W Palm Bch |
83 |
83 |
95.8% |
|
|
42 |
Publix, YouFit Health Club |
$15.68 |
|
Shoppes at Sunlake Centre |
|
|
FL |
Tampa-St. Petersburg-Clearwater |
98 |
98 |
100.0% |
|
|
46 |
Publix |
$21.39 |
|
Shoppes of Jonathan's Landing |
|
|
FL |
Miami-Ft Lauderdale-W Palm Bch |
27 |
27 |
100.0% |
|
54 |
54 |
(Publix) |
$24.91 |
|
Shoppes of Oakbrook |
|
|
FL |
Miami-Ft Lauderdale-W Palm Bch |
200 |
200 |
95.5% |
|
|
44 |
Publix, Stein Mart, Tuesday Morning, Bassett Furniture, Duffy's Sports Bar, CVS |
$16.54 |
|
Shoppes of Pebblebrook Plaza |
O |
50% |
FL |
Naples-Immokalee-Marco Island |
77 |
38 |
100.0% |
|
|
61 |
Publix, (Walgreens) |
$15.39 |
|
Shoppes of Silver Lakes |
|
|
FL |
Miami-Ft Lauderdale-W Palm Bch |
127 |
127 |
92.5% |
|
|
48 |
Publix, Goodwill |
$19.17 |
|
Shoppes of Sunset |
|
|
FL |
Miami-Ft Lauderdale-W Palm Bch |
22 |
22 |
91.1% |
|
|
|
|
$24.73 |
|
Shoppes of Sunset II |
|
|
FL |
Miami-Ft Lauderdale-W Palm Bch |
28 |
28 |
67.6% |
|
|
|
|
$23.04 |
|
Shops at John's Creek |
|
|
FL |
Jacksonville |
15 |
15 |
100.0% |
|
|
|
|
$23.92 |
|
Shops at Skylake |
|
|
FL |
Miami-Ft Lauderdale-W Palm Bch |
287 |
287 |
93.2% |
|
|
51 |
Publix, LA Fitness, TJ Maxx, Goodwill |
$23.32 |
|
|
Supplemental Information 32 |
Exhibit 99.2
Portfolio Summary Report By State
June 30, 2019
(GLA in thousands)
|
|
|
|
|
|
JVs at 100% |
REG's pro-rata share |
REG's pro-rata share |
REG's pro-rata share |
|
|
|
|
|
Property Name |
JV |
REG % |
State |
CBSA |
GLA |
GLA |
% Leased |
% Leased - Retail Operating Properties |
Retailer- Owned GLA |
Grocery Anchor GLA |
Major Tenants(1) |
Avg. Base Rent PSF |
|
|
|
FL |
Jacksonville |
308 |
308 |
96.8% |
|
|
13 |
Trader Joe's, Home Depot, Stein Mart, Ross Dress for Less, Bed Bath & Beyond, Staples |
$15.02 |
|
|
South Point |
|
|
FL |
Sebastian-Vero Beach |
65 |
65 |
97.8% |
|
|
45 |
Publix |
$16.02 |
|
Starke |
|
|
FL |
Other |
13 |
13 |
100.0% |
|
|
|
CVS |
$25.56 |
|
Suncoast Crossing |
|
|
FL |
Tampa-St. Petersburg-Clearwater |
118 |
118 |
97.6% |
|
143 |
|
Kohl's, (Target) |
$6.79 |
|
Tamarac Town Square |
|
|
FL |
Miami-Ft Lauderdale-W Palm Bch |
125 |
125 |
74.8% |
|
|
38 |
Publix, Dollar Tree |
$13.12 |
|
The Grove |
NYC |
30% |
FL |
Orlando-Kissimmee-Sanford |
152 |
46 |
99.3% |
|
|
52 |
Publix, LA Fitness |
$20.96 |
|
The Plaza at St. Lucie West |
|
|
FL |
Port St. Lucie |
27 |
27 |
95.4% |
|
|
|
|
$23.33 |
|
The Village at Hunter's Lake |
|
|
FL |
Tampa-St. Petersburg-Clearwater |
72 |
72 |
84.8% |
|
|
29 |
Sprouts |
$25.97 |
|
Town and Country |
|
|
FL |
Orlando-Kissimmee-Sanford |
78 |
78 |
100.0% |
|
|
|
Ross Dress for Less |
$10.57 |
|
Town Square |
|
|
FL |
Tampa-St. Petersburg-Clearwater |
44 |
44 |
100.0% |
|
|
|
PETCO, Pier 1 Imports |
$32.08 |
|
Treasure Coast Plaza |
|
|
FL |
Sebastian-Vero Beach |
134 |
134 |
94.6% |
|
|
59 |
Publix, TJ Maxx |
$16.58 |
|
Unigold Shopping Center |
|
|
FL |
Orlando-Kissimmee-Sanford |
115 |
115 |
93.8% |
|
|
31 |
Lucky's, YouFit Health Club, Ross Dress for Less |
$14.98 |
|
University Commons |
|
|
FL |
Miami-Ft Lauderdale-W Palm Bch |
180 |
180 |
100.0% |
|
|
51 |
Whole Foods, Nordstrom Rack, Barnes & Noble, Bed Bath & Beyond |
$31.63 |
|
Veranda Shoppes |
NYC |
30% |
FL |
Miami-Ft Lauderdale-W Palm Bch |
45 |
13 |
97.3% |
|
|
29 |
Publix |
$27.05 |
|
Village Center |
|
|
FL |
Tampa-St. Petersburg-Clearwater |
187 |
187 |
98.9% |
|
|
50 |
Publix, Walgreens, Stein Mart |
$20.27 |
|
Waterstone Plaza |
|
|
FL |
Miami-Ft Lauderdale-W Palm Bch |
61 |
61 |
100.0% |
|
|
46 |
Publix |
$16.72 |
|
Welleby Plaza |
|
|
FL |
Miami-Ft Lauderdale-W Palm Bch |
110 |
110 |
95.9% |
|
|
47 |
Publix, Dollar Tree |
$13.51 |
|
Wellington Town Square |
|
|
FL |
Miami-Ft Lauderdale-W Palm Bch |
112 |
112 |
100.0% |
|
|
45 |
Publix, CVS |
$24.35 |
|
West Bird Plaza |
|
|
FL |
Miami-Ft Lauderdale-W Palm Bch |
100 |
100 |
86.5% |
|
|
38 |
Publix |
$18.61 |
|
West Lake Shopping Center |
|
|
FL |
Miami-Ft Lauderdale-W Palm Bch |
101 |
101 |
95.8% |
|
|
46 |
Winn-Dixie, CVS |
$18.96 |
|
Westchase |
|
|
FL |
Tampa-St. Petersburg-Clearwater |
79 |
79 |
95.2% |
|
|
51 |
Publix |
$16.36 |
|
|
Supplemental Information 33 |
Exhibit 99.2
Portfolio Summary Report By State
June 30, 2019
(GLA in thousands)
|
|
|
|
|
|
JVs at 100% |
REG's pro-rata share |
REG's pro-rata share |
REG's pro-rata share |
|
|
|
|
|
Property Name |
JV |
REG % |
State |
CBSA |
GLA |
GLA |
% Leased |
% Leased - Retail Operating Properties |
Retailer- Owned GLA |
Grocery Anchor GLA |
Major Tenants(1) |
Avg. Base Rent PSF |
|
|
|
FL |
Miami-Ft Lauderdale-W Palm Bch |
47 |
47 |
97.9% |
|
|
28 |
Publix |
$20.05 |
|
|
Willa Springs |
USAA |
20% |
FL |
Orlando-Kissimmee-Sanford |
90 |
18 |
100.0% |
|
|
44 |
Publix |
$21.28 |
|
Young Circle Shopping Center |
|
|
FL |
Miami-Ft Lauderdale-W Palm Bch |
65 |
65 |
59.0% |
|
|
23 |
Walgreens |
$21.07 |
|
|
|
|
FL |
|
11,799 |
11,082 |
94.0% |
93.9% |
1,107 |
3,527 |
|
|
|
Ashford Place |
|
|
GA |
Atlanta-Sandy Springs-Roswell |
53 |
53 |
100.0% |
|
|
|
Harbor Freight Tools |
$21.93 |
|
Briarcliff La Vista |
|
|
GA |
Atlanta-Sandy Springs-Roswell |
43 |
43 |
100.0% |
|
|
|
Michael's |
$21.72 |
|
Briarcliff Village |
|
|
GA |
Atlanta-Sandy Springs-Roswell |
190 |
190 |
98.4% |
|
|
43 |
Publix, Office Depot, Party City, Shoe Carnival, TJ Maxx |
$16.49 |
|
Bridgemill Market |
|
|
GA |
Atlanta-Sandy Springs-Roswell |
89 |
89 |
82.4% |
|
|
38 |
Publix |
$16.80 |
|
Brighten Park |
|
|
GA |
Atlanta-Sandy Springs-Roswell |
137 |
137 |
96.0% |
|
|
25 |
The Fresh Market, Tuesday Morning, Dance 101 |
$26.09 |
|
Buckhead Court |
|
|
GA |
Atlanta-Sandy Springs-Roswell |
49 |
49 |
98.2% |
|
|
|
|
$27.20 |
|
Buckhead Station |
|
|
GA |
Atlanta-Sandy Springs-Roswell |
234 |
234 |
100.0% |
|
|
|
Nordstrom Rack, TJ Maxx, Bed Bath & Beyond, Saks Off Fifth, DSW, Cost Plus World Market, Old Navy, Ulta |
$24.15 |
|
Cambridge Square |
|
|
GA |
Atlanta-Sandy Springs-Roswell |
71 |
71 |
100.0% |
|
|
41 |
Kroger |
$15.71 |
|
Chastain Square |
|
|
GA |
Atlanta-Sandy Springs-Roswell |
92 |
92 |
94.7% |
|
|
37 |
Publix |
$21.45 |
|
Cornerstone Square |
|
|
GA |
Atlanta-Sandy Springs-Roswell |
80 |
80 |
100.0% |
|
|
18 |
Aldi, CVS, HealthMarkets Insurance, Diazo Specialty Blueprint |
$17.33 |
|
Sope Creek Crossing |
|
|
GA |
Atlanta-Sandy Springs-Roswell |
99 |
99 |
100.0% |
|
|
45 |
Publix |
$16.26 |
|
Dunwoody Hall |
USAA |
20% |
GA |
Atlanta-Sandy Springs-Roswell |
86 |
17 |
92.3% |
|
|
44 |
Publix |
$19.74 |
|
Dunwoody Village |
|
|
GA |
Atlanta-Sandy Springs-Roswell |
121 |
121 |
91.7% |
|
|
18 |
The Fresh Market, Walgreens, Dunwoody Prep |
$19.69 |
|
Howell Mill Village |
|
|
GA |
Atlanta-Sandy Springs-Roswell |
92 |
92 |
98.6% |
|
|
31 |
Publix, Walgreens |
$23.22 |
|
Paces Ferry Plaza |
|
|
GA |
Atlanta-Sandy Springs-Roswell |
82 |
82 |
96.9% |
|
|
30 |
Whole Foods |
$38.07 |
|
Piedmont Peachtree Crossing |
|
|
GA |
Atlanta-Sandy Springs-Roswell |
152 |
152 |
83.5% |
|
|
56 |
Kroger, Binders Art Supplies & Frames |
$20.55 |
|
Powers Ferry Square |
|
|
GA |
Atlanta-Sandy Springs-Roswell |
101 |
101 |
100.0% |
|
|
|
HomeGoods, PETCO |
$31.95 |
|
Powers Ferry Village |
|
|
GA |
Atlanta-Sandy Springs-Roswell |
79 |
79 |
87.3% |
|
|
48 |
Publix, The Juice Box |
$9.59 |
|
Russell Ridge |
|
|
GA |
Atlanta-Sandy Springs-Roswell |
101 |
101 |
97.7% |
|
|
63 |
Kroger |
$13.16 |
|
Sandy Springs |
|
|
GA |
Atlanta-Sandy Springs-Roswell |
116 |
116 |
93.3% |
|
|
12 |
Trader Joe's, Pier 1 Imports, Fox's, Flynn O'Hara Uniforms |
$24.13 |
|
The Shops at Hampton Oaks |
|
|
GA |
Atlanta-Sandy Springs-Roswell |
21 |
21 |
56.3% |
|
|
|
(CVS) |
$11.12 |
|
Williamsburg at Dunwoody |
|
|
GA |
Atlanta-Sandy Springs-Roswell |
45 |
45 |
87.2% |
|
|
|
|
$25.36 |
|
|
|
|
GA |
|
2,134 |
2,065 |
94.8% |
94.9% |
0 |
551 |
|
|
|
|
Supplemental Information 34 |
Exhibit 99.2
Portfolio Summary Report By State
June 30, 2019
(GLA in thousands)
|
|
|
|
|
|
JVs at 100% |
REG's pro-rata share |
REG's pro-rata share |
REG's pro-rata share |
|
|
|
|
|
Property Name |
JV |
REG % |
State |
CBSA |
GLA |
GLA |
% Leased |
% Leased - Retail Operating Properties |
Retailer- Owned GLA |
Grocery Anchor GLA |
Major Tenants(1) |
Avg. Base Rent PSF |
|
GRI |
40% |
IL |
Chicago-Naperville-Elgin |
265 |
106 |
97.1% |
|
|
87 |
Super H Mart, Home Depot, O'Reilly Automotive, King Spa |
$11.29 |
|
|
Clybourn Commons |
|
|
IL |
Chicago-Naperville-Elgin |
32 |
32 |
83.3% |
|
|
|
PETCO |
$37.09 |
|
Glen Oak Plaza |
|
|
IL |
Chicago-Naperville-Elgin |
63 |
63 |
96.6% |
|
|
12 |
Trader Joe's, Walgreens, Northshore University Healthsystems |
$24.01 |
|
Hinsdale |
|
|
IL |
Chicago-Naperville-Elgin |
179 |
179 |
94.8% |
|
|
57 |
Whole Foods, Goodwill, Charter Fitness, Petco |
$15.65 |
|
Mellody Farm |
|
|
IL |
Chicago-Naperville-Elgin |
259 |
259 |
89.7% |
|
|
45 |
Whole Foods, Nordstrom Rack, REI, HomeGoods, Barnes & Noble, West Elm |
$27.28 |
|
Riverside Sq & River's Edge |
GRI |
40% |
IL |
Chicago-Naperville-Elgin |
169 |
68 |
95.3% |
|
|
74 |
Mariano's Fresh Market, Dollar Tree, Party City |
$16.98 |
|
Roscoe Square |
GRI |
40% |
IL |
Chicago-Naperville-Elgin |
140 |
56 |
100.0% |
|
|
51 |
Mariano's Fresh Market, Walgreens |
$21.50 |
|
Stonebrook Plaza Shopping Center |
GRI |
40% |
IL |
Chicago-Naperville-Elgin |
96 |
38 |
98.3% |
|
|
63 |
Jewel-Osco, Blink Fitness |
$12.31 |
|
Westchester Commons |
|
|
IL |
Chicago-Naperville-Elgin |
139 |
139 |
92.7% |
|
|
80 |
Mariano's Fresh Market, Goodwill |
$17.90 |
|
Willow Festival |
|
|
IL |
Chicago-Naperville-Elgin |
404 |
404 |
98.2% |
|
|
60 |
Whole Foods, Lowe's, CVS, HomeGoods, REI, Best Buy, Ulta |
$18.05 |
|
|
|
|
IL |
|
1,746 |
1,343 |
95.5% |
96.2% |
0 |
530 |
|
|
|
Shops on Main |
M |
93% |
IN |
Chicago-Naperville-Elgin |
279 |
279 |
100.0% |
|
|
40 |
Whole Foods, Dick's Sporting Goods, Ross Dress for Less, HomeGoods, DSW, Nordstrom Rack, Marshalls |
$15.83 |
|
Willow Lake Shopping Center |
GRI |
40% |
IN |
Indianapolis-Carmel-Anderson |
86 |
34 |
83.1% |
|
64 |
64 |
(Kroger), Tuesday Morning |
$17.62 |
|
Willow Lake West Shopping Center |
GRI |
40% |
IN |
Indianapolis-Carmel-Anderson |
53 |
21 |
97.0% |
|
|
12 |
Trader Joe's |
$26.09 |
|
|
|
|
IN |
|
418 |
335 |
96.1% |
98.1% |
64 |
116 |
|
|
|
Bluebonnet Village |
|
|
LA |
Baton Rouge |
102 |
102 |
90.4% |
|
|
33 |
Rouses Market, Office Depot |
$13.80 |
|
Elmwood Oaks Shopping Center |
|
|
LA |
New Orleans-Metairie |
136 |
136 |
100.0% |
|
|
|
Academy Sports, Dollar Tree, Tuesday Morning, Lifestyle Appliances |
$10.15 |
|
|
|
|
LA |
|
238 |
238 |
95.9% |
95.9% |
0 |
33 |
|
|
|
Fellsway Plaza |
M |
75% |
MA |
Boston-Cambridge-Newton |
155 |
155 |
100.0% |
|
|
61 |
Stop & Shop, Modells Sporting Goods, Planet Fitness |
$24.51 |
|
Northborough Crossing |
NYC |
30% |
MA |
Worcester |
646 |
194 |
98.2% |
|
|
139 |
Wegmans, BJ's Wholesale Club, Kohl's,Dick's Sporting Goods, Pottery Barn Outlet, TJ Maxx, Michael's, PetSmart, Homegoods, Old Navy, Homesense |
$13.12 |
|
Old Connecticut Path |
NYC |
30% |
MA |
Boston-Cambridge-Newton |
80 |
24 |
100.0% |
|
|
66 |
Stop & Shop |
$21.42 |
|
Shaw's at Plymouth |
|
|
MA |
Boston-Cambridge-Newton |
60 |
60 |
100.0% |
|
|
60 |
Shaw's |
$17.58 |
|
Shops at Saugus |
|
|
MA |
Boston-Cambridge-Newton |
87 |
87 |
94.7% |
|
|
11 |
Trader Joe's, La-Z-Boy, PetSmart |
$30.06 |
|
|
Supplemental Information 35 |
Exhibit 99.2
Portfolio Summary Report By State
June 30, 2019
(GLA in thousands)
|
|
|
|
|
|
JVs at 100% |
REG's pro-rata share |
REG's pro-rata share |
REG's pro-rata share |
|
|
|
|
|
Property Name |
JV |
REG % |
State |
CBSA |
GLA |
GLA |
% Leased |
% Leased - Retail Operating Properties |
Retailer- Owned GLA |
Grocery Anchor GLA |
Major Tenants(1) |
Avg. Base Rent PSF |
|
|
|
MA |
Boston-Cambridge-Newton |
66 |
66 |
100.0% |
|
|
66 |
Star Market |
$37.44 |
|
|
Star's at Quincy |
|
|
MA |
Boston-Cambridge-Newton |
101 |
101 |
100.0% |
|
|
101 |
Star Market |
$21.48 |
|
Star's at West Roxbury |
|
|
MA |
Boston-Cambridge-Newton |
76 |
76 |
100.0% |
|
|
55 |
Shaw's |
$24.76 |
|
The Abbot |
|
|
MA |
Boston-Cambridge-Newton |
65 |
65 |
0.0% |
|
|
|
|
$0.00 |
|
Twin City Plaza |
|
|
MA |
Boston-Cambridge-Newton |
285 |
285 |
100.0% |
|
|
63 |
Shaw's, Marshall's, Extra Space Storage, Walgreens, K&G Fashion, Dollar Tree, Gold's Gym, Formlabs |
$20.29 |
|
Whole Foods at Swampscott |
|
|
MA |
Boston-Cambridge-Newton |
36 |
36 |
100.0% |
|
|
36 |
Whole Foods |
$27.20 |
|
|
|
|
MA |
|
1,657 |
1,148 |
95.1% |
93.6% |
0 |
657 |
|
|
|
Burnt Mills |
C |
20% |
MD |
Washington-Arlington-Alexandri |
31 |
6 |
89.1% |
|
|
9 |
Trader Joe's |
$37.81 |
|
Cloppers Mill Village |
GRI |
40% |
MD |
Washington-Arlington-Alexandri |
137 |
55 |
99.0% |
|
|
70 |
Shoppers Food Warehouse, CVS |
$18.28 |
|
Festival at Woodholme |
GRI |
40% |
MD |
Baltimore-Columbia-Towson |
81 |
32 |
98.5% |
|
|
10 |
Trader Joe's |
$39.24 |
|
Firstfield Shopping Center |
GRI |
40% |
MD |
Washington-Arlington-Alexandri |
22 |
9 |
100.0% |
|
|
|
|
$40.79 |
|
Parkville Shopping Center |
GRI |
40% |
MD |
Baltimore-Columbia-Towson |
165 |
66 |
89.9% |
|
|
41 |
Giant, Parkville Lanes, Dollar Tree, Petco |
$16.86 |
|
Southside Marketplace |
GRI |
40% |
MD |
Baltimore-Columbia-Towson |
125 |
50 |
95.5% |
|
|
44 |
Shoppers Food Warehouse |
$20.93 |
|
Takoma Park |
GRI |
40% |
MD |
Washington-Arlington-Alexandri |
104 |
42 |
99.2% |
|
|
64 |
Shoppers Food Warehouse |
$13.49 |
|
Valley Centre |
GRI |
40% |
MD |
Baltimore-Columbia-Towson |
220 |
88 |
81.5% |
|
|
18 |
Aldi,TJ Maxx, Ross Dress for Less, PetSmart, Michael's |
$17.15 |
|
Village at Lee Airpark |
|
|
MD |
Baltimore-Columbia-Towson |
121 |
121 |
100.0% |
|
75 |
63 |
Giant, (Sunrise) |
$28.20 |
|
Watkins Park Plaza |
GRI |
40% |
MD |
Washington-Arlington-Alexandri |
111 |
45 |
98.5% |
|
|
|
LA Fitness, CVS |
$27.15 |
|
Westwood - Manor Care |
|
|
MD |
Washington-Arlington-Alexandri |
41 |
41 |
0.0% |
|
|
|
|
$0.00 |
|
Westwood Shopping Center |
|
|
MD |
Washington-Arlington-Alexandri |
213 |
213 |
94.8% |
|
|
55 |
Giant, Citgo, Bowlmor AMF |
$34.58 |
|
Woodmoor Shopping Center |
GRI |
40% |
MD |
Washington-Arlington-Alexandri |
69 |
28 |
98.1% |
|
|
|
CVS |
$33.03 |
|
|
|
|
MD |
|
1,441 |
795 |
91.3% |
94.8% |
75 |
374 |
|
|
|
Fenton Marketplace |
|
|
MI |
Flint |
97 |
97 |
100.0% |
|
|
|
Family Farm & Home, Michael's |
$8.45 |
|
|
|
|
MI |
|
97 |
97 |
100.0% |
100.0% |
0 |
0 |
|
|
|
Apple Valley Square |
RC |
25% |
MN |
Minneapol-St. Paul-Bloomington |
176 |
44 |
100.0% |
|
87 |
|
Jo-Ann Fabrics, Experience Fitness, (Burlington Coat Factory), (Aldi), Savers, PETCO |
$14.73 |
|
Calhoun Commons |
RC |
25% |
MN |
Minneapol-St. Paul-Bloomington |
66 |
17 |
100.0% |
|
|
50 |
Whole Foods |
$24.46 |
|
Colonial Square |
GRI |
40% |
MN |
Minneapol-St. Paul-Bloomington |
93 |
37 |
100.0% |
|
|
44 |
Lund's |
$24.43 |
|
|
Supplemental Information 36 |
Exhibit 99.2
Portfolio Summary Report By State
June 30, 2019
(GLA in thousands)
|
|
|
|
|
|
JVs at 100% |
REG's pro-rata share |
REG's pro-rata share |
REG's pro-rata share |
|
|
|
|
|
Property Name |
JV |
REG % |
State |
CBSA |
GLA |
GLA |
% Leased |
% Leased - Retail Operating Properties |
Retailer- Owned GLA |
Grocery Anchor GLA |
Major Tenants(1) |
Avg. Base Rent PSF |
|
GRI |
40% |
MN |
Minneapol-St. Paul-Bloomington |
204 |
82 |
96.4% |
|
|
|
Kohl's, PetSmart, HomeGoods, TJ Maxx |
$12.85 |
|
|
Rockridge Center |
C |
20% |
MN |
Minneapol-St. Paul-Bloomington |
125 |
25 |
90.8% |
|
|
89 |
CUB Foods |
$13.33 |
|
|
|
|
MN |
|
665 |
205 |
97.2% |
97.4% |
87 |
183 |
|
|
|
Brentwood Plaza |
|
|
MO |
St. Louis |
60 |
60 |
100.0% |
|
|
52 |
Schnucks |
$10.83 |
|
Bridgeton |
|
|
MO |
St. Louis |
71 |
71 |
100.0% |
|
130 |
63 |
Schnucks, (Home Depot) |
$12.15 |
|
Dardenne Crossing |
|
|
MO |
St. Louis |
67 |
67 |
100.0% |
|
|
63 |
Schnucks |
$11.00 |
|
Kirkwood Commons |
|
|
MO |
St. Louis |
210 |
210 |
100.0% |
|
258 |
136 |
Walmart, (Target), (Lowe's), TJ Maxx, HomeGoods, Famous Footwear |
$10.14 |
|
|
|
|
MO |
|
408 |
408 |
100.0% |
100.0% |
388 |
314 |
|
|
|
Cameron Village |
C |
30% |
NC |
Raleigh |
558 |
167 |
95.8% |
|
|
87 |
Harris Teeter, The Fresh Market, Wake Public Library, Walgreens, Talbots, Great Outdoor Provision Co., York Properties, K&W Cafeteria, Pier 1 Imports, Bevello, The Cheshire Cat Gallery, Crunch Fitness Select Club, Bailey's Fine Jewelry |
$23.60 |
|
Carmel Commons |
|
|
NC |
Charlotte-Concord-Gastonia |
133 |
133 |
98.5% |
|
|
14 |
The Fresh Market, Chuck E. Cheese, Party City, Walgreens, Planet Fitness |
$20.89 |
|
Cochran Commons |
C |
20% |
NC |
Charlotte-Concord-Gastonia |
66 |
13 |
100.0% |
|
|
42 |
Harris Teeter, (Walgreens) |
$16.83 |
|
Market at Colonnade Center |
|
|
NC |
Raleigh |
58 |
58 |
100.0% |
|
|
40 |
Whole Foods |
$27.47 |
|
Glenwood Village |
|
|
NC |
Raleigh |
43 |
43 |
100.0% |
|
|
28 |
Harris Teeter |
$16.83 |
|
Harris Crossing |
|
|
NC |
Raleigh |
65 |
65 |
98.3% |
|
|
53 |
Harris Teeter |
$9.20 |
|
Holly Park |
|
|
NC |
Raleigh |
160 |
160 |
90.5% |
|
|
12 |
Trader Joe's, Ross Dress For Less, Staples, US Fitness Products, Jerry's Arystsms, Pet Supplies Plus, Ulta |
$17.42 |
|
Lake Pine Plaza |
|
|
NC |
Raleigh |
88 |
88 |
98.4% |
|
|
58 |
Harris Teeter |
$12.96 |
|
Midtown East |
O |
50% |
NC |
Raleigh |
159 |
79 |
87.4% |
|
|
120 |
Wegmans |
$21.66 |
|
Providence Commons |
RC |
25% |
NC |
Charlotte-Concord-Gastonia |
74 |
19 |
100.0% |
|
|
50 |
Harris Teeter |
$18.69 |
|
Ridgewood Shopping Center |
C |
20% |
NC |
Raleigh |
93 |
19 |
90.4% |
|
|
30 |
Whole Foods, Walgreens |
$16.99 |
|
Shops at Erwin Mill |
M |
55% |
NC |
Durham-Chapel Hill |
87 |
87 |
100.0% |
|
|
53 |
Harris Teeter |
$18.01 |
|
Shoppes of Kildaire |
GRI |
40% |
NC |
Raleigh |
145 |
58 |
99.5% |
|
|
46 |
Trader Joe's, Aldi, Fitness Connection, Staples |
$18.99 |
|
Southpoint Crossing |
|
|
NC |
Durham-Chapel Hill |
103 |
103 |
100.0% |
|
|
59 |
Harris Teeter |
$16.85 |
|
Sutton Square |
C |
20% |
NC |
Raleigh |
101 |
20 |
88.4% |
|
|
24 |
The Fresh Market, Walgreens |
$19.93 |
|
Village Plaza |
C |
20% |
NC |
Durham-Chapel Hill |
73 |
15 |
90.7% |
|
|
42 |
Whole Foods, PTA Thrift Shop |
$20.49 |
|
Willow Oaks |
|
|
NC |
Charlotte-Concord-Gastonia |
69 |
69 |
94.9% |
|
|
49 |
Publix |
$17.21 |
|
|
Supplemental Information 37 |
Exhibit 99.2
Portfolio Summary Report By State
June 30, 2019
(GLA in thousands)
|
|
|
|
|
|
JVs at 100% |
REG's pro-rata share |
REG's pro-rata share |
REG's pro-rata share |
|
|
|
|
|
Property Name |
JV |
REG % |
State |
CBSA |
GLA |
GLA |
% Leased |
% Leased - Retail Operating Properties |
Retailer- Owned GLA |
Grocery Anchor GLA |
Major Tenants(1) |
Avg. Base Rent PSF |
|
|
|
NC |
Durham-Chapel Hill |
90 |
90 |
100.0% |
|
|
41 |
Food Lion,Triangle ACE Hardware |
$13.73 |
|
|
|
|
|
NC |
|
2,164 |
1,285 |
95.6% |
97.0% |
0 |
848 |
|
|
|
Chimney Rock |
|
|
NJ |
New York-Newark-Jersey City |
218 |
218 |
97.8% |
|
|
50 |
Whole Foods, Nordstrom Rack, Saks Off 5th, The Container Store, Cost Plus World Market, Ulta |
$35.93 |
|
District at Metuchen |
C |
20% |
NJ |
New York-Newark-Jersey City |
67 |
13 |
100.0% |
|
|
44 |
Whole Foods |
$29.29 |
|
Haddon Commons |
GRI |
40% |
NJ |
Philadelphia-Camden-Wilmington |
54 |
22 |
100.0% |
|
|
34 |
Acme Markets |
$13.78 |
|
Plaza Square |
GRI |
40% |
NJ |
New York-Newark-Jersey City |
104 |
42 |
89.0% |
|
|
60 |
Shop Rite |
$22.56 |
|
Riverfront Plaza |
NYC |
30% |
NJ |
New York-Newark-Jersey City |
129 |
39 |
95.9% |
|
|
70 |
ShopRite |
$25.48 |
|
|
|
|
NJ |
|
571 |
333 |
96.2% |
96.7% |
0 |
258 |
|
|
|
101 7th Avenue |
|
|
NY |
New York-Newark-Jersey City |
57 |
57 |
100.0% |
|
|
|
Barney's New York |
$79.13 |
|
1175 Third Avenue |
|
|
NY |
New York-Newark-Jersey City |
25 |
25 |
100.0% |
|
|
25 |
The Food Emporium |
$116.62 |
|
1225-1239 Second Ave |
|
|
NY |
New York-Newark-Jersey City |
18 |
18 |
100.0% |
|
|
|
CVS |
$116.47 |
|
90 - 30 Metropolitan Avenue |
|
|
NY |
New York-Newark-Jersey City |
60 |
60 |
93.9% |
|
|
11 |
Trader Joe's, Staples, Michaels |
$34.27 |
|
Broadway Plaza |
|
|
NY |
New York-Newark-Jersey City |
147 |
147 |
97.2% |
|
|
18 |
Aldi, Bob's Discount Furniture, TJ Maxx, F21 Red, Blink Fitness |
$38.73 |
|
Clocktower Plaza Shopping Ctr |
|
|
NY |
New York-Newark-Jersey City |
79 |
79 |
100.0% |
|
|
63 |
Stop & Shop |
$47.21 |
|
The Gallery at Westbury Plaza |
|
|
NY |
New York-Newark-Jersey City |
312 |
312 |
99.5% |
|
|
13 |
Trader Joe's, Nordstrom Rack, Saks Fifth Avenue, Bloomingdale's, The Container Store, HomeGoods, Old Navy, Gap Outlet, Bassett Home Furnishings, Famous Footwear |
$48.66 |
|
Hewlett Crossing I & II |
|
|
NY |
New York-Newark-Jersey City |
53 |
53 |
96.3% |
|
|
|
Petco |
$37.71 |
|
Rivertowns Square |
|
|
NY |
New York-Newark-Jersey City |
116 |
116 |
93.9% |
|
|
18 |
Brooklyn Harvest Market, Ipic Theaters, Ulta Beauty, The Learning Experience |
$35.19 |
|
The Point at Garden City Park |
|
|
NY |
New York-Newark-Jersey City |
105 |
105 |
100.0% |
|
|
52 |
King Kullen, Ace Hardware |
$24.50 |
|
Lake Grove Commons |
GRI |
40% |
NY |
New York-Newark-Jersey City |
141 |
57 |
100.0% |
|
|
48 |
Whole Foods, LA Fitness, PETCO |
$34.20 |
|
Westbury Plaza |
|
|
NY |
New York-Newark-Jersey City |
394 |
394 |
95.4% |
|
|
110 |
Wal-Mart, Costco, Marshalls, Total Wine and More, Olive Garden |
$24.97 |
|
|
|
|
NY |
|
1509 |
1424 |
97.6% |
97.4% |
0 |
357 |
|
|
|
Cherry Grove |
|
|
OH |
Cincinnati |
196 |
196 |
97.0% |
|
|
66 |
Kroger, Shoe Carnival, TJ Maxx, Tuesday Morning |
$12.04 |
|
East Pointe |
|
|
OH |
Columbus |
107 |
107 |
98.7% |
|
|
76 |
Kroger |
$10.44 |
|
|
Supplemental Information 38 |
Exhibit 99.2
Portfolio Summary Report By State
June 30, 2019
(GLA in thousands)
|
|
|
|
|
|
JVs at 100% |
REG's pro-rata share |
REG's pro-rata share |
REG's pro-rata share |
|
|
|
|
|
Property Name |
JV |
REG % |
State |
CBSA |
GLA |
GLA |
% Leased |
% Leased - Retail Operating Properties |
Retailer- Owned GLA |
Grocery Anchor GLA |
Major Tenants(1) |
Avg. Base Rent PSF |
|
|
|
OH |
Cincinnati |
397 |
397 |
93.1% |
|
|
169 |
Kroger, Remke Markets, Walgreens, Jo-Ann Fabrics, Ace Hardware, Staples |
$16.63 |
|
|
Kroger New Albany Center |
M |
50% |
OH |
Columbus |
93 |
93 |
100.0% |
|
|
65 |
Kroger |
$12.86 |
|
Northgate Plaza (Maxtown Road) |
|
|
OH |
Columbus |
114 |
114 |
100.0% |
|
90 |
91 |
Kroger, (Home Depot) |
$11.58 |
|
Red Bank Village |
|
|
OH |
Cincinnati |
176 |
176 |
100.0% |
|
|
152 |
Wal-Mart |
$7.55 |
|
Regency Commons |
|
|
OH |
Cincinnati |
34 |
34 |
90.3% |
|
|
|
|
$26.55 |
|
West Chester Plaza |
|
|
OH |
Cincinnati |
88 |
88 |
98.4% |
|
|
67 |
Kroger |
$9.89 |
|
|
|
|
OH |
|
1,205 |
1,205 |
96.7% |
96.7% |
90 |
685 |
|
|
|
Corvallis Market Center |
|
|
OR |
Corvallis |
85 |
85 |
100.0% |
|
|
12 |
Trader Joe's, TJ Maxx, Michael's |
$21.27 |
|
Greenway Town Center |
GRI |
40% |
OR |
Portland-Vancouver-Hillsboro |
93 |
37 |
100.0% |
|
|
38 |
Whole Foods, Rite Aid, Dollar Tree |
$15.53 |
|
Murrayhill Marketplace |
|
|
OR |
Portland-Vancouver-Hillsboro |
150 |
150 |
86.9% |
|
|
41 |
Safeway, Planet Fitness |
$19.05 |
|
Northgate Marketplace |
|
|
OR |
Medford |
81 |
81 |
100.0% |
|
|
13 |
Trader Joe's, REI, PETCO |
$23.40 |
|
Northgate Marketplace Ph II |
|
|
OR |
Medford |
177 |
177 |
96.2% |
|
|
|
Dick's Sporting Goods, Homegoods, Marshalls |
$16.90 |
|
Sherwood Crossroads |
|
|
OR |
Portland-Vancouver-Hillsboro |
88 |
88 |
98.4% |
|
|
55 |
Safeway |
$11.51 |
|
Tanasbourne Market |
|
|
OR |
Portland-Vancouver-Hillsboro |
71 |
71 |
100.0% |
|
|
57 |
Whole Foods |
$30.11 |
|
Walker Center |
|
|
OR |
Portland-Vancouver-Hillsboro |
90 |
90 |
100.0% |
|
|
|
Bed Bath & Beyond |
$21.54 |
|
|
|
|
OR |
|
835 |
779 |
96.7% |
96.4% |
0 |
215 |
|
|
|
Allen Street Shopping Ctr |
GRI |
40% |
PA |
Allentown-Bethlehem-Easton |
46 |
18 |
100.0% |
|
|
22 |
Ahart's Market |
$15.45 |
|
City Avenue Shopping Center |
GRI |
40% |
PA |
Philadelphia-Camden-Wilmington |
162 |
65 |
94.0% |
|
|
|
Ross Dress for Less, TJ Maxx, Dollar Tree |
$21.41 |
|
Gateway Shopping Center |
|
|
PA |
Philadelphia-Camden-Wilmington |
221 |
221 |
97.9% |
|
|
11 |
Trader Joe's, Staples, TJ Maxx, Jo-Ann Fabrics |
$32.17 |
|
Hershey |
|
|
PA |
Other |
6 |
6 |
100.0% |
|
|
|
|
$28.00 |
|
Lower Nazareth Commons |
|
|
PA |
Allentown-Bethlehem-Easton |
90 |
90 |
96.5% |
|
244 |
111 |
(Wegmans), (Target), Burlington Coat Factory, PETCO |
$25.55 |
|
Mercer Square Shopping Center |
GRI |
40% |
PA |
Philadelphia-Camden-Wilmington |
91 |
37 |
96.7% |
|
|
51 |
Weis Markets |
$24.20 |
|
Newtown Square Shopping Center |
GRI |
40% |
PA |
Philadelphia-Camden-Wilmington |
143 |
57 |
86.5% |
|
|
56 |
Acme Markets, Michael's |
$18.67 |
|
Stefko Boulevard Shopping Center |
GRI |
40% |
PA |
Allentown-Bethlehem-Easton |
134 |
54 |
96.1% |
|
|
73 |
Valley Farm Market, Dollar Tree, Retro Fitness |
$10.75 |
|
Warwick Square Shopping Center |
GRI |
40% |
PA |
Philadelphia-Camden-Wilmington |
90 |
36 |
97.1% |
|
|
51 |
Giant |
$21.37 |
|
|
|
|
PA |
|
983 |
584 |
95.2% |
95.9% |
244 |
375 |
|
|
|
Indigo Square |
|
|
SC |
Charleston-North Charleston |
51 |
51 |
94.8% |
|
|
22 |
Publix |
$28.63 |
|
|
Supplemental Information 39 |
Exhibit 99.2
Portfolio Summary Report By State
June 30, 2019
(GLA in thousands)
|
|
|
|
|
|
JVs at 100% |
REG's pro-rata share |
REG's pro-rata share |
REG's pro-rata share |
|
|
|
|
|
Property Name |
JV |
REG % |
State |
CBSA |
GLA |
GLA |
% Leased |
% Leased - Retail Operating Properties |
Retailer- Owned GLA |
Grocery Anchor GLA |
Major Tenants(1) |
Avg. Base Rent PSF |
|
GRI |
40% |
SC |
Charleston-North Charleston |
80 |
32 |
100.0% |
|
|
38 |
Publix |
$16.89 |
|
|
|
|
|
SC |
|
131 |
83 |
98.0% |
96.8% |
0 |
59 |
|
|
|
Harpeth Village Fieldstone |
|
|
TN |
Nashville-Davidson--Murfreesboro--Franklin |
70 |
70 |
100.0% |
|
|
55 |
Publix |
$15.66 |
|
Northlake Village |
|
|
TN |
Nashville-Davidson--Murfreesboro--Franklin |
138 |
138 |
100.0% |
|
|
75 |
Kroger, PETCO |
$14.06 |
|
Peartree Village |
|
|
TN |
Nashville-Davidson--Murfreesboro--Franklin |
110 |
110 |
100.0% |
|
|
84 |
Kroger, PETCO |
$19.85 |
|
|
|
|
TN |
|
318 |
318 |
100.0% |
100.0% |
0 |
214 |
|
|
|
Alden Bridge |
USAA |
20% |
TX |
Houston-Woodlands-Sugar Land |
139 |
28 |
98.8% |
|
|
68 |
Kroger, Walgreens |
$20.38 |
|
Bethany Park Place |
USAA |
20% |
TX |
Dallas-Fort Worth-Arlington |
99 |
20 |
98.0% |
|
|
83 |
Kroger |
$11.74 |
|
CityLine Market |
|
|
TX |
Dallas-Fort Worth-Arlington |
81 |
81 |
98.0% |
|
|
40 |
Whole Foods |
$27.59 |
|
CityLine Market Phase II |
|
|
TX |
Dallas-Fort Worth-Arlington |
22 |
22 |
100.0% |
|
|
|
CVS |
$26.66 |
|
Cochran's Crossing |
|
|
TX |
Houston-Woodlands-Sugar Land |
138 |
138 |
96.6% |
|
|
63 |
Kroger, CVS |
$19.10 |
|
Hancock |
|
|
TX |
Austin-Round Rock |
410 |
410 |
53.8% |
|
|
90 |
H.E.B, Twin Liquors, PETCO, 24 Hour Fitness |
$20.87 |
|
Hickory Creek Plaza |
|
|
TX |
Dallas-Fort Worth-Arlington |
28 |
28 |
100.0% |
|
81 |
81 |
(Kroger) |
$27.32 |
|
Hillcrest Village |
|
|
TX |
Dallas-Fort Worth-Arlington |
15 |
15 |
100.0% |
|
|
|
|
$47.53 |
|
Indian Springs Center |
|
|
TX |
Houston-Woodlands-Sugar Land |
137 |
137 |
100.0% |
|
|
79 |
H.E.B. |
$24.61 |
|
Keller Town Center |
|
|
TX |
Dallas-Fort Worth-Arlington |
120 |
120 |
99.0% |
|
|
64 |
Tom Thumb |
$16.26 |
|
Lebanon/Legacy Center |
|
|
TX |
Dallas-Fort Worth-Arlington |
56 |
56 |
92.7% |
|
63 |
63 |
(Wal-Mart) |
$26.64 |
|
Market at Preston Forest |
|
|
TX |
Dallas-Fort Worth-Arlington |
96 |
96 |
98.9% |
|
|
64 |
Tom Thumb |
$20.84 |
|
Market at Round Rock |
|
|
TX |
Austin-Round Rock |
123 |
123 |
98.6% |
|
|
30 |
Sprout's Markets, Office Depot, Tuesday Morning |
$18.53 |
|
Market at Springwoods Village |
M |
53% |
TX |
Houston-Woodlands-Sugar Land |
167 |
167 |
96.3% |
|
|
100 |
Kroger |
$16.26 |
|
Mockingbird Common |
|
|
TX |
Dallas-Fort Worth-Arlington |
120 |
120 |
93.8% |
|
|
49 |
Tom Thumb, Ogle School of Hair Design |
$17.97 |
|
North Hills |
|
|
TX |
Austin-Round Rock |
145 |
145 |
99.1% |
|
|
60 |
H.E.B. |
$23.33 |
|
Panther Creek |
|
|
TX |
Houston-Woodlands-Sugar Land |
166 |
166 |
94.7% |
|
|
66 |
Randalls Food, CVS, The Woodlands Childrens Museum, Gold's Gym |
$22.55 |
|
Prestonbrook |
|
|
TX |
Dallas-Fort Worth-Arlington |
92 |
92 |
100.0% |
|
|
64 |
Kroger |
$14.71 |
|
Preston Oaks |
|
|
TX |
Dallas-Fort Worth-Arlington |
104 |
104 |
99.5% |
|
|
30 |
H.E.B. , Central Market, Talbots |
$33.89 |
|
Shiloh Springs |
USAA |
20% |
TX |
Dallas-Fort Worth-Arlington |
110 |
22 |
89.8% |
|
|
61 |
Kroger |
$14.21 |
|
Shops at Mira Vista |
|
|
TX |
Austin-Round Rock |
68 |
68 |
100.0% |
|
|
15 |
Trader Joe's, Champions Westlake Gymnastics & Cheer |
$23.32 |
|
|
Supplemental Information 40 |
Exhibit 99.2
Portfolio Summary Report By State
June 30, 2019
(GLA in thousands)
|
|
|
|
|
|
JVs at 100% |
REG's pro-rata share |
REG's pro-rata share |
REG's pro-rata share |
|
|
|
|
|
Property Name |
JV |
REG % |
State |
CBSA |
GLA |
GLA |
% Leased |
% Leased - Retail Operating Properties |
Retailer- Owned GLA |
Grocery Anchor GLA |
Major Tenants(1) |
Avg. Base Rent PSF |
|
|
|
TX |
Houston-Woodlands-Sugar Land |
265 |
265 |
97.8% |
|
|
101 |
Kroger, Academy Sports, PETCO, Spec's Liquor and Finder Foods |
$13.61 |
|
|
Sterling Ridge |
|
|
TX |
Houston-Woodlands-Sugar Land |
129 |
129 |
100.0% |
|
|
63 |
Kroger,CVS |
$21.13 |
|
Sweetwater Plaza |
C |
20% |
TX |
Houston-Woodlands-Sugar Land |
134 |
27 |
100.0% |
|
|
65 |
Kroger, Walgreens |
$18.07 |
|
Tech Ridge Center |
|
|
TX |
Austin-Round Rock |
214 |
214 |
89.9% |
|
|
84 |
H.E.B., Pinstack |
$23.33 |
|
The Village at Riverstone |
|
|
TX |
Houston-Woodlands-Sugar Land |
167 |
167 |
92.6% |
|
|
100 |
Kroger |
$15.73 |
|
Weslayan Plaza East |
GRI |
40% |
TX |
Houston-Woodlands-Sugar Land |
169 |
68 |
100.0% |
|
|
|
Berings, Ross Dress for Less, Michaels, The Next Level Fitness, Spec's Liquor, Bike Barn |
$20.27 |
|
Weslayan Plaza West |
GRI |
40% |
TX |
Houston-Woodlands-Sugar Land |
186 |
74 |
96.8% |
|
|
52 |
Randalls Food, Walgreens, PETCO, Jo-Ann's, Tuesday Morning, Homegoods |
$19.68 |
|
Westwood Village |
|
|
TX |
Houston-Woodlands-Sugar Land |
187 |
187 |
97.9% |
|
127 |
|
(Target), Gold's Gym, PetSmart, Office Max, Ross Dress For Less, TJ Maxx |
$19.77 |
|
Woodway Collection |
GRI |
40% |
TX |
Houston-Woodlands-Sugar Land |
97 |
39 |
100.0% |
|
|
45 |
Whole Foods |
$29.29 |
|
|
|
|
TX |
|
3,982 |
3,326 |
92.6% |
91.6% |
271 |
1,682 |
|
|
|
Ashburn Farm Village Center |
GRI |
40% |
VA |
Washington-Arlington-Alexandri |
89 |
36 |
66.6% |
|
|
|
|
$20.34 |
|
Belmont Chase |
|
|
VA |
Washington-Arlington-Alexandri |
91 |
91 |
95.0% |
|
|
40 |
Whole Foods, Cooper's Hawk Winery |
$30.70 |
|
Braemar Village Center |
RC |
25% |
VA |
Washington-Arlington-Alexandri |
96 |
24 |
97.9% |
|
|
58 |
Safeway |
$22.56 |
|
Carytown Exchange |
M |
10% |
VA |
Richmond |
107 |
107 |
46.3% |
|
|
38 |
Publix, CVS |
$14.37 |
|
Centre Ridge Marketplace |
GRI |
40% |
VA |
Washington-Arlington-Alexandri |
107 |
43 |
98.9% |
|
|
55 |
Shoppers Food Warehouse, United States Coast Guard Ex |
$19.37 |
|
Point 50 |
|
|
VA |
Washington-Arlington-Alexandri |
48 |
48 |
62.4% |
|
|
30 |
Whole Foods |
$22.00 |
|
Festival at Manchester Lakes |
GRI |
40% |
VA |
Washington-Arlington-Alexandri |
169 |
67 |
91.0% |
|
|
65 |
Shoppers Food Warehouse |
$27.06 |
|
Fox Mill Shopping Center |
GRI |
40% |
VA |
Washington-Arlington-Alexandri |
103 |
41 |
95.6% |
|
|
50 |
Giant |
$25.19 |
|
Greenbriar Town Center |
GRI |
40% |
VA |
Washington-Arlington-Alexandri |
340 |
136 |
95.4% |
|
|
62 |
Giant, Bob's Discount Furniture, CVS,Ross Dress for Less, Marshalls, Planet Fitness |
$27.03 |
|
Hanover Village Shopping Center |
GRI |
40% |
VA |
Richmond |
90 |
36 |
100.0% |
|
|
18 |
Aldi, Tractor Supply Company, Harbor Freight Tools, Tuesday Morning |
$9.22 |
|
Kamp Washington Shopping Center |
GRI |
40% |
VA |
Washington-Arlington-Alexandri |
71 |
29 |
100.0% |
|
|
20 |
Earth Fare |
$38.01 |
|
Kings Park Shopping Center |
GRI |
40% |
VA |
Washington-Arlington-Alexandri |
93 |
37 |
98.0% |
|
|
51 |
Giant, CVS |
$29.26 |
|
|
Supplemental Information 41 |
Exhibit 99.2
Portfolio Summary Report By State
June 30, 2019
(GLA in thousands)
|
|
|
|
|
|
JVs at 100% |
REG's pro-rata share |
REG's pro-rata share |
REG's pro-rata share |
|
|
|
|
|
Property Name |
JV |
REG % |
State |
CBSA |
GLA |
GLA |
% Leased |
% Leased - Retail Operating Properties |
Retailer- Owned GLA |
Grocery Anchor GLA |
Major Tenants(1) |
Avg. Base Rent PSF |
|
C |
20% |
VA |
Washington-Arlington-Alexandri |
132 |
26 |
90.5% |
|
|
63 |
Shoppers Food Warehouse |
$23.84 |
|
|
Market Common Clarendon |
|
|
VA |
Washington-Arlington-Alexandri |
422 |
422 |
71.4% |
|
|
34 |
Whole Foods, Crate & Barrel, The Container Store, Barnes & Noble, Washington Sports Club, Pottery Barn, Ethan Allen, The Cheesecake Factory, Jumping Joeys, Equinox |
$35.19 |
|
Saratoga Shopping Center |
GRI |
40% |
VA |
Washington-Arlington-Alexandri |
113 |
45 |
100.0% |
|
|
56 |
Giant |
$21.26 |
|
Shops at County Center |
|
|
VA |
Washington-Arlington-Alexandri |
97 |
97 |
91.4% |
|
|
52 |
Harris Teeter |
$19.95 |
|
Shops at Stonewall |
|
|
VA |
Washington-Arlington-Alexandri |
308 |
308 |
100.0% |
|
|
127 |
Wegmans, Dick's Sporting Goods, Staples, Ross Dress For Less, Bed Bath & Beyond, Michaels |
$18.73 |
|
The Field at Commonwealth |
|
|
VA |
Washington-Arlington-Alexandri |
167 |
167 |
98.0% |
|
|
122 |
Wegmans |
$21.36 |
|
Town Center at Sterling Shopping Center |
GRI |
40% |
VA |
Washington-Arlington-Alexandri |
187 |
75 |
85.6% |
|
|
47 |
Giant, Planet Fitness |
$22.41 |
|
Village Center at Dulles |
C |
20% |
VA |
Washington-Arlington-Alexandri |
301 |
60 |
93.1% |
|
|
48 |
Giant, Gold's Gym, CVS, Advance Auto Parts, Chuck E. Cheese, HomeGoods, Goodwill |
$28.18 |
|
Village Shopping Center |
GRI |
40% |
VA |
Richmond |
111 |
44 |
92.4% |
|
|
45 |
Publix, CVS |
$24.74 |
|
Willston Centre I |
GRI |
40% |
VA |
Washington-Arlington-Alexandri |
105 |
42 |
91.7% |
|
|
|
CVS, Fashion K City |
$26.43 |
|
Willston Centre II |
GRI |
40% |
VA |
Washington-Arlington-Alexandri |
136 |
54 |
99.1% |
|
141 |
59 |
Safeway, (Target) |
$26.02 |
|
|
|
|
VA |
|
3,484 |
2,036 |
89.6% |
89.2% |
141 |
1,140 |
|
|
|
6401 Roosevelt |
|
|
WA |
Seattle-Tacoma-Bellevue |
8 |
8 |
69.0% |
|
|
|
|
$18.31 |
|
Aurora Marketplace |
GRI |
40% |
WA |
Seattle-Tacoma-Bellevue |
107 |
43 |
100.0% |
|
|
49 |
Safeway, TJ Maxx |
$16.40 |
|
Ballard Blocks I |
O |
50% |
WA |
Seattle-Tacoma-Bellevue |
132 |
66 |
96.5% |
|
|
12 |
Trader Joe's, LA Fitness, Ross Dress for Less |
$24.09 |
|
Ballard Blocks II |
O |
50% |
WA |
Seattle-Tacoma-Bellevue |
114 |
57 |
82.8% |
|
|
25 |
PCC Community Markets, Bright Horizons, West Marine,Trufusion, Kaiser Permanente |
$34.29 |
|
Broadway Market |
C |
20% |
WA |
Seattle-Tacoma-Bellevue |
140 |
28 |
95.8% |
|
|
64 |
Quality Food Centers, Gold's Gym, Urban Outfitters |
$25.82 |
|
Cascade Plaza |
C |
20% |
WA |
Seattle-Tacoma-Bellevue |
206 |
41 |
95.6% |
|
|
49 |
Safeway, Jo-Ann Fabrics, Ross Dress For Less, Big Lots, Fitness Evolution, Big 5 Sporting Goods, Dollar Tree |
$12.24 |
|
Eastgate Plaza |
GRI |
40% |
WA |
Seattle-Tacoma-Bellevue |
79 |
31 |
100.0% |
|
|
29 |
Safeway, Rite Aid |
$27.57 |
|
Grand Ridge Plaza |
|
|
WA |
Seattle-Tacoma-Bellevue |
331 |
331 |
100.0% |
|
|
45 |
Safeway, Regal Cinemas, Dick's Sporting Goods, Marshalls, Ulta , Bevmo! |
$24.99 |
|
Inglewood Plaza |
|
|
WA |
Seattle-Tacoma-Bellevue |
17 |
17 |
100.0% |
|
|
|
|
$41.31 |
|
Klahanie Shopping Center |
|
|
WA |
Seattle-Tacoma-Bellevue |
67 |
67 |
98.4% |
|
40 |
40 |
(QFC) |
$33.49 |
|
Melrose Market |
|
|
WA |
Seattle-Tacoma-Bellevue |
21 |
21 |
100.0% |
|
|
|
|
$33.94 |
|
|
Supplemental Information 42 |
Exhibit 99.2
Portfolio Summary Report By State
June 30, 2019
(GLA in thousands)
|
|
|
|
|
|
JVs at 100% |
REG's pro-rata share |
REG's pro-rata share |
REG's pro-rata share |
|
|
|
|
|
Property Name |
JV |
REG % |
State |
CBSA |
GLA |
GLA |
% Leased |
% Leased - Retail Operating Properties |
Retailer- Owned GLA |
Grocery Anchor GLA |
Major Tenants(1) |
Avg. Base Rent PSF |
|
GRI |
40% |
WA |
Seattle-Tacoma-Bellevue |
93 |
37 |
91.6% |
|
230 |
13 |
(Sears), Marshalls, Bevmo!, Whole Foods |
$27.84 |
|
|
Pine Lake Village |
|
|
WA |
Seattle-Tacoma-Bellevue |
103 |
103 |
94.2% |
|
|
41 |
Quality Food Centers, Rite Aid |
$23.75 |
|
Roosevelt Square |
|
|
WA |
Seattle-Tacoma-Bellevue |
148 |
148 |
100.0% |
|
|
50 |
Whole Foods, Dania, Bartell, Guitar Center |
$23.27 |
|
Sammamish-Highlands |
|
|
WA |
Seattle-Tacoma-Bellevue |
101 |
101 |
100.0% |
|
55 |
67 |
Trader Joe's, (Safeway), Bartell Drugs |
$34.36 |
|
Southcenter |
|
|
WA |
Seattle-Tacoma-Bellevue |
58 |
58 |
100.0% |
|
112 |
|
(Target) |
$30.66 |
|
|
|
|
WA |
|
1,726 |
1,158 |
96.7% |
98.6% |
437 |
484 |
|
|
|
|
|
|
|
|
|
|
|
|
|
|
|
|
|
Regency Centers Total |
|
|
|
|
52,693 |
42,761 |
94.7% |
95.0% |
4,088 |
16,858 |
|
$22.18 |
(1) Major Tenants are the grocery anchor and any tenant over 35,000 square feet. Retailers in parenthesis are a shadow anchor and not a part of the owned property.
Note: In-process developments are bolded and italicized.
|
C: |
Co-investment Partnership with Oregon |
|
GRI: |
Co-investment Partnership with GRI |
|
M: |
Co-investment Partnership with Minority Partner |
|
NYC: |
Co-investment Partnership with NYCRF |
|
O: |
Other, single property co-investment Partnerships |
|
RC: |
Co-investment Partnership with CalSTRS |
|
RLP: |
Co-investment Partnership with Rider |
|
USAA: |
Co-investment Partnership with USAA |
|
|
Supplemental Information 43 |

Real Estate - Operating Operating Portfolio NOI excluding Straight-line Rent and Above/Below Market Rent - Current Quarter Wholly Owned NOI (page 5) $ 185,704 Share of JV NOI (page 7) $ 25,104 Less: Noncontrolling Interests (page 7) $ (1,894) Base Rent from leases signed but not yet rent-paying - Current Quarter Retail Operating Properties including redevelopments $ 2,479 Select Operating Properties with Near Term Redevelopment Estimated Incremental Project Costs (page 18) $400,000 - $475,000 Estimated Incremental Stabilized Yield (page 18) +/- 7% Development Projects In Process REG's Estimated Net Project Costs (page 16) $ 281,884 Stabilized Yield (page 16) 7.1% Annualized Proforma Stabilized NOI $ 20,014 REG's Estimated Net GAAP Project Costs1 (page 16, footnote) $ 3 04,273 % of Costs Incurred (page 16, footnote) 69% Construction in Progress $ 2 09,948 NOI from Development Projects In Process - Current Quarter Proforma Stabilized NOI $ 122 In-place NOI from Developments In Process $ 1,708 Fee Income Third-Party Management Fees and Commissions - Current Quarter (page 5) $ 7,442 Less: Share of JV's Total fee income - Current Quarter (page 7) $ (277) Estimated Market Value of Undeveloped Land Land held for sale or future development $ 47,801 Outparcels at retail operating properties 14,622 Total Estimated Market Value of Undeveloped Land $ 62,423 Wholly Owned Assets (page 3) Cash and Cash Equivalents $ 37,364 Tenant and other receivables, excluding Straight line rent receivables $ 52,344 Other Assets, excluding Goodwill $ 97,565 Share of JV Assets (page 6) Cash and Cash Equivalents $ 16,059 Tenant and other receivables, excluding Straight line rent receivables $ 6,086 Other Assets $ 13,575 Less: Noncontrolling Interests (page 6) $ (4,253) Wholly Owned Debt Outstanding (page 12) Mortgage Loans $ 467,092 Unsecured Public/Private Notes 2,550,000 Unsecured Credit Facilities 685,000 Total Wholly Owned Debt Outstanding $ 3,702,092 Share of JV Debt Outstanding (page 14) $ 532,937 Other Wholly Owned Liabilities (page 3) Accounts Payable and Other Liabilities $ 188,723 Tenants' Security and Escrow Deposits $ 45,527 Other Share of JV Accounts Liabilities (page 6) Accounts Payable and Other Liabilities $ 33,217 Tenants' Security and Escrow Deposits $ 5,071 Less: Noncontrolling Interests (page 6) $ (45,228) Common Shares and Equivalents Outstanding Common Shares and Equivalents Issued and Outstanding (page 1) 167,905 (1) Includes additional interest and overhead capitalization. Real Estate - In Process Developments Other Assets Liabilities Components of Net Asset Value (NAV) As of June 30, 2019 (unaudited and in thousands) 30 Exhibit 99.2
|
|
Supplemental Information 44 |
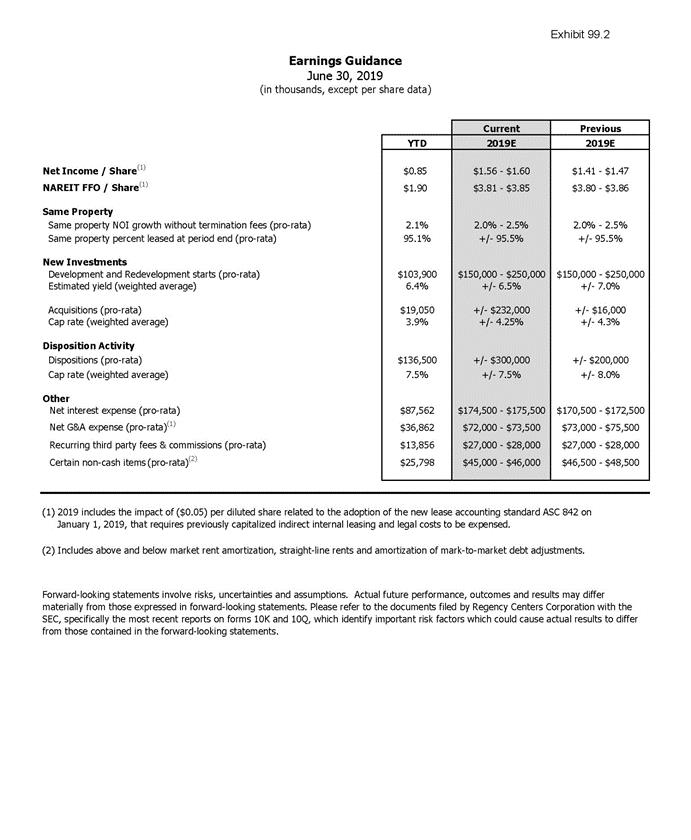
Current Previous YTD 2019E 2019E Net Income / Share(1) $0.85 $1.56 - $1.60 $1.41 - $1.47 NAREIT FFO / Share(1) $1.90 $3.81 - $3.85 $3.80 - $3.86 Same Property Same property NOI growth without termination fees (pro-rata) 2.1% 2.0% - 2.5% 2.0% - 2.5% Same property percent leased at period end (pro-rata) 95.1% +/- 95.5% +/- 95.5% New Investments Development and Redevelopment starts (pro-rata) $103,900 $150,000 - $250,000 $150,000 - $250,000 Estimated yield (weighted average) 6.4% +/- 6.5% +/- 7.0% Acquisitions (pro-rata) $19,050 +/- $232,000 +/- $16,000 Cap rate (weighted average) 3.9% +/- 4.25% +/- 4.3% Disposition Activity Dispositions (pro-rata) $136,500 +/- $300,000 +/- $200,000 Cap rate (weighted average) 7.5% +/- 7.5% +/- 8.0% Other Net interest expense (pro-rata) $87,562 $174,500 - $175,500 $170,500 - $172,500 Net G&A expense (pro-rata)(1) $36,862 $72,000 - $73,500 $73,000 - $75,500 Recurring third party fees & commissions (pro-rata) $13,856 $27,000 - $28,000 $27,000 - $28,000 Certain non-cash items (pro-rata)(2) $25,798 $45,000 - $46,000 $46,500 - $48,500 Forward-looking statements involve risks, uncertainties and assumptions. Actual future performance, outcomes and results may differ materially from those expressed in forward-looking statements. Please refer to the documents filed by Regency Centers Corporation with the SEC, specifically the most recent reports on forms 10K and 10Q, which identify important risk factors which could cause actual results to differ from those contained in the forward-looking statements. Earnings Guidance June 30, 2019 (in thousands, except per share data) (1) 2019 includes the impact of ($0.05) per diluted share related to the adoption of the new lease accounting standard ASC 842 on January 1, 2019, that requires previously capitalized indirect internal leasing and legal costs to be expensed. (2) Includes above and below market rent amortization, straight-line rents and amortization of mark-to-market debt adjustments. 31 Exhibit 99.2
|
|
Supplemental Information 45 |

NAREIT FFO Guidance: Low High Net income attributable to common stockholders $ 1.56 1 .60 Adjustments to reconcile net income to NAREIT FFO: Depreciation and amortization 2 .41 2 .41 Provision for impairment 0 .07 0 .07 Gain on sale of operating properties (0.23) (0.23) NAREIT Funds From Operations $ 3.81 3 .85 Reconciliation of Net Income to Earnings Guidance June 30, 2019 (per diluted share) Full Year 2019 32 Exhibit 99.2
|
|
Supplemental Information 46 |

Glossary of Terms June 30, 2019 Development Completion: A property in development is deemed complete upon the earliest of: (i) 90% of total estimated net development costs have been incurred and percent leased equals or exceeds 95%, or (ii) the property features at least two years of anchor operations, or (iii) three years have passed since the start of construction. Once deemed complete, the property is termed a Retail Operating Property the following calendar year. Fixed Charge Coverage Ratio: Operating EBITDAre divided by the sum of the gross interest and scheduled mortgage principal paid to our lenders plus dividends paid to our preferred stockholders. NAREIT Funds From Operations (NAREIT FFO): NAREIT FFO is a commonly used measure of REIT performance, which the National Association of Real Estate Investment Trusts (“NAREIT”) defines as net income, computed in accordance with GAAP, excluding gains on sales and land impairments of real estate, net of tax, plus depreciation and amortization, and after adjustments for unconsolidated partnerships and joint ventures. Regency computes NAREIT FFO for all periods presented in accordance with NAREIT's definition in effect during that period. Effective January 1, 2019 the Company prospectively adopted the NAREIT FFO White Paper – 2018 Restatement (“2018 FFO Whitepaper”), and elected the option of excluding gains on sale and impairments of land, which are considered incidental to the Company’s main business. Prior period amounts were not restated to conform to the current year presentation, and therefore are calculated as described above, but also include gains on sales and impairments of land. Many companies use different depreciable lives and methods, and real estate values historically fluctuate with market conditions. Since NAREIT FFO excludes depreciation and amortization and gains on sale and impairments of real estate, it provides a performance measure that, when compared year over year, reflects the impact on operations from trends in occupancy rates, rental rates, operating costs, acquisition and development activities, and financing costs. This provides a perspective of the Company’s financial performance not immediately apparent from net income determined in accordance with GAAP. Thus, NAREIT FFO is a supplemental non-GAAP financial measure of the Company's operating performance, which does not represent cash generated from operating activities in accordance with GAAP; and, therefore, should not be considered a substitute measure of cash flows from operations. The Company provides a reconciliation of Net Income Attributable to Common Stockholders to NAREIT FFO. Net Operating Income (NOI): The sum of base rent, percentage rent, recoveries from tenants, other lease income, uncollectible lease income, and other property income, less operating and maintenance, real estate taxes, ground rent, and provision for doubtful accounts. NOI excludes straight-line rental income and expense, above and below market rent and ground rent amortization, tenant lease inducement amortization, and other fees. The Company also provides disclosure of NOI excluding termination fees, which excludes both termination fee income and expenses. Non-Same Property: A property acquired, sold, or a Development Completion during either calendar year period being compared. Non-retail properties and corporate activities, including the captive insurance program, are part of Non-Same Property. Operating EBITDAre : NAREIT EBITDAre is a measure of REIT performance, which the NAREIT defines as net income, computed in accordance with GAAP, excluding (i) interest expense; (ii) income tax expense; (iii) depreciation and amortization; (iv) gains on sales of real estate; (v) impairments of real estate; and (vi) adjustments to reflect the Company’s share of unconsolidated partnerships and joint ventures. Operating EBITDAre excludes from NAREIT EBITDAre certain non-cash components of earnings derived from above and below market rent amortization and straight-line rents. The Company provides a reconciliation of Net Income (Loss) to Operating EBITDAre . Core Operating Earnings: An additional performance measure used by Regency as the computation of NAREIT FFO includes certain non-comparable items that affect the Company's period-over-period performance. Core Operating Earnings excludes from NAREIT FFO: (i) transaction related income or expenses (ii) gains or losses from the early extinguishment of debt; (iii) certain noncash components of earnings derived from above and below market rent amortization, straight-line rents, and amortization of markto- market of debt adjustments; and (iv) other amounts as they occur. The Company provides a reconciliation of NAREIT FFO to Core Operating Earnings. Property In Development: Properties in various stages of development and redevelopment including active pre-development activities. Retail Operating Property: Any retail property not termed a Property In Development. A retail property is any property where the majority of the income is generated from retail uses. Same Property: Retail Operating Properties that were owned and operated for the entirety of both calendar year periods being compared. This term excludes all developments and Non-Same Properties. 33 Exhibit 99.2
|
|
Supplemental Information 47 |
Serious News for Serious Traders! Try StreetInsider.com Premium Free!
You May Also Be Interested In
- Mizuho Starts Regency Centers (REG) at Neutral
- PowerBand Solutions Announces Closing of First Tranche of Private Placement
- Form 8.3 - Lok’n Store Group PLC
Create E-mail Alert Related Categories
SEC FilingsSign up for StreetInsider Free!
Receive full access to all new and archived articles, unlimited portfolio tracking, e-mail alerts, custom newswires and RSS feeds - and more!
