




Form 8-K Quotient Technology Inc. For: Feb 11

FREE Breaking News Alerts from StreetInsider.com!
StreetInsider.com Top Tickers, 10/14/2026
- Nasdaq ends down as chipmakers fall and bank earnings roll in
- Oil prices settle mixed, focus on US-Russia diesel deal, Saudi Yemen attacks
- JPMorgan shares edge lower after third-quarter FICC revenue miss
- Fed’s Waller says US bond yield rise driven by growth, not inflation
- Wells Fargo beats profit estimates despite revenue miss
 Tweet
Tweet Share
Share E-mail
UNITED STATES
SECURITIES AND EXCHANGE COMMISSION
Washington, D.C. 20549
FORM 8-K
CURRENT REPORT
Pursuant to Section 13 or 15(d)
of
the Securities Exchange Act of 1934
Date of Report
(date of earliest event reported)
February 11, 2016
Quotient Technology Inc.
(Exact name of Registrant as specified in its charter)
| Delaware | 001-36331 | 77-0485123 |
| (State or other jurisdiction of incorporation or organization) |
(Commission File Number) | (I.R.S. Employer Identification Number) |
400 Logue Avenue
Mountain View, California 94043
(Address of principal executive offices)
(650) 605-4600
(Registrant’s telephone number, including area code)
Not Applicable
(Former name or former address, if changed since last report)
Check the appropriate box below if the Form 8-K filing is intended to simultaneously satisfy the filing obligation of the registrant under any of the following provisions (see General Instruction A.2. below):
| ¨ | Written communications pursuant to Rule 425 under the Securities Act (17 CFR 230.425) |
| ¨ | Soliciting material pursuant to Rule 14a-12 under the Exchange Act (17 CFR 240.14a-12) |
| ¨ | Pre-commencement communications pursuant to Rule 14d-2(b) under the Exchange Act (17 CFR 240.14d-2(b)) |
| ¨ | Pre-commencement communications pursuant to Rule 13e-4(c) under the Exchange Act (17 CFR 240.13e-4(c)) |
| Item 2.02 | Results of Operations and Financial Condition. |
On February 11, 2016, Quotient Technology Inc. (the “Company”) issued a press release regarding financial results for the fourth quarter and fiscal year ended December 31, 2015. The Company also posted on its website (www.quotient.com) slides with accompanying prepared remarks regarding such financial results. Copies of the press release and slides are attached as Exhibits 99.1 and 99.2, respectively, and the information in Exhibits 99.1 and 99.2 is incorporated herein by reference.
The information in Item 2.02 and Item 9.01 in this Current Report on Form 8-K and the exhibits attached hereto shall not be deemed “filed” for the purposes of Section 18 of the Securities Exchange Act of 1934, as amended, or otherwise subject to the liabilities of that Section, nor shall it be deemed incorporated by reference into any filing under the Securities Act of 1933, as amended, or the Securities Exchange Act of 1934, as amended.
| Item 8.01 | Other Events. |
Quotient Technology Inc. Stock Repurchase Program
On February 11, 2016, the Company announced a stock repurchase program pursuant to which the Company is authorized to repurchase up to $50 million of the Company’s common stock through February 2017, unless earlier terminated by the Board of the Company. Stock repurchases may be made from time-to-time in open market transactions or privately negotiated transactions. The timing of any repurchases and the actual number of shares repurchased will depend on a variety of factors. The Company may suspend, modify or terminate this repurchase program at any time without prior notice. The Company issued a press release to announce the adoption of the stock repurchase program, attached hereto as Exhibit 99.1 and is incorporated herein by reference.
| Item 9.01 | Financial Statements and Exhibits. |
(d) Exhibits
|
Exhibit |
Description | |
| 99.1 | Press release, dated February 11, 2016, regarding financial results of Quotient Technology Inc. for the fourth quarter and fiscal year ended December 31, 2015 and stock repurchase program. | |
|
99.2 |
Slides, dated February 11, 2016, regarding financial results of the fourth quarter and fiscal year ended December 31, 2015. |
SIGNATURES
Pursuant to the requirements of the Securities Exchange Act of 1934, the registrant has duly caused this report to be signed on its behalf by the undersigned hereunto duly authorized.
| Quotient Technology Inc. | ||
| By: | /s/ Jennifer Ceran | |
| Jennifer Ceran | ||
| Chief Financial Officer | ||
| Date: February 11, 2016 | ||
EXHIBIT INDEX
|
Exhibit |
Description | |
| 99.1 | Press release, dated February 11, 2016, regarding financial results of Quotient Technology Inc. for the fourth quarter and fiscal year ended December 31, 2015 and stock repurchase program. | |
|
99.2 |
Slides, dated February 11, 2016, regarding financial results of the fourth quarter and fiscal year ended December 31, 2015. |
Quotient Technology Inc. Reports Fourth Quarter and Full Year 2015 Financial Results
Company delivers 16% revenue growth in the fourth quarter over last year
Digital paperless transactions increased 31% sequentially
MOUNTAIN VIEW, Calif., Feb. 11, 2016 /PRNewswire/ -- Quotient Technology Inc. (NYSE: QUOT), which recently changed its name from Coupons.com Incorporated, a leader in the digital transformation of the multi-billion dollar promotions industry, today reported financial results for the fourth quarter and full year ended December 31, 2015.
Fourth Quarter 2015 Financial Highlights and Key Metrics
- Total revenue was $69.4 million in Q4 2015, a 16% increase over Q4 2014.
- Revenue from media increased 29% from a year ago.
- Adjusted EBITDA was $7.5 million compared to $8.3 million a year ago.
- GAAP net loss for the Q4 2015 was $3.6 million, which included $6.8 million in stock-based compensation expense and a benefit of $253,000 resulting from the change in fair value of contingent consideration related to the Company's acquisition of Eckim. GAAP net loss in Q4 2014 was $1.7 million, which included $7.8 million in stock-based compensation expense and a benefit of $2.9 million resulting from the change in fair value of contingent consideration to the acquisition of Eckim.
- Cash generated by operations in Q4 2015 was $3.7 million, as compared to $6.1 million in the same period of 2014.
- Total digital coupon transactions during Q4 were a record 469 million, up 25% over Q4 2014.
"I'm very pleased with our performance this quarter and the momentum we are seeing across our business," said Steven Boal, CEO of Quotient. "We continued to expand our network as the consumer shift to mobile drove transaction growth in both digital paperless and print. As our network grows, so does our ability to deliver personalized and targeted offers at greater scale, increasing the value of our platform for CPGs, retailers and consumers.
"We are now focused on completing the rollouts of our remaining signed Retailer iQ partners, and helping them build consumer adoption through marketing events," Boal said. "Additionally, we plan to continue to drive greater value through our platform with offerings from Shopmium, our newly acquired cash back mobile app platform, expanded media opportunities, and ongoing investments in data and analytics. Consumers are bringing retailers and CPGs into the digital era at an accelerated pace. As the digital evolution continues, and our mobile traffic increases, we believe it will provide a tailwind to our long-term growth."
Total revenue for the year ended December 31, 2015 was $237.3 million, as compared to $221.8 million for the same period of 2014. GAAP net loss for the year ended December 31, 2015 was $26.7 million, which included $32.3 million in stock-based compensation expense, a loss of $1.2 million resulting from the change in fair value of contingent consideration related to the acquisition of Eckim, and a $4.8 million gain on sale of a right to use a web domain name. For comparison, GAAP net loss for the twelve months ended December 31, 2014 was $23.4 million, which included $35.5 million in stock-based compensation expense and a benefit of $5.7 million resulting from the change in fair value of contingent consideration related to the acquisition of Eckim. Adjusted EBITDA for 2015 was $18.3 million, as compared to $24.0 million for the same period of 2014.
"We ended the year on a positive note, delivering record revenue and transactions. Digital paperless transactions, primarily driven by mobile, increased 58% over last year," said Jennifer Ceran, CFO of Quotient. "Adjusted EBITDA for the fourth quarter was primarily driven by strong top line performance. As we enter 2016, we plan to continue to invest in future opportunities for long term growth, particularly around data and analytics."
Company Authorized New Stock Repurchase Program
On February 4, 2016, the Company's board of directors authorized a new repurchase program of $50.0 million of the Company's common stock through February 2017 in open market or in privately negotiated transactions. The timing and the amount of any repurchases of common stock will be determined based on a variety of factors.
As of December 31, 2015, Quotient had $159.9 million in cash, cash equivalents and short-term investments and generated $9.2 million in cash from operations in that year.
2015 Business Highlights
- The Company changed its corporate name from Coupons.com Incorporated to Quotient Technology Inc. to better reflect its products and services. Its deepening relationships with Fortune 500 CPGs and retailers required a corporate identity that extended beyond its great consumer brands. Coupons.com continues to lead Quotient's consumer portfolio, as it invests in both its enterprise platform and consumer portfolio.
- Traffic from mobile devices now represents approximately 35% of traffic on Quotient's properties, up from less than 20% in fourth quarter 2014, demonstrating an accelerated pace in the shift to mobile.
Quotient Promotions continued to see momentum build across the platform, particularly within Retailer iQ
- Total transactions in the fourth quarter 2015 grew 25% over fourth quarter 2014. Digital paperless transactions represented over 50% of all transactions in 2015. Digital print transactions increased slightly in the fourth quarter as compared to the third quarter, in part due to the ongoing rollout of the Company's new mobile printing experience.
- The Company launched new products on the platform such as digital circular and targeted promotions, designed to drive efficiency in trade spend where CPGs and retailers spend approximately $200 billion annually. In the fourth quarter the Company improved the consumer experience on mobile, enabling printing directly from Coupons.com.
- Consumer adoption continued to build on Retailer iQ as transactions in the fourth quarter 2015 grew 48% over the third quarter. In 2015, Quotient expanded coverage on Retailer iQ, which now includes grocery, drug, dollar and mass channels. At the end of the fourth quarter 2015, the Company had 15 retailer banners live on the platform, with seven marketing their programs.
Quotient Media continued to grow in 2015 while new media offerings expand opportunity
- In the fourth quarter 2015, media revenue grew 29% year over year.
- Earlier in 2015, the Company expanded its media offerings on desktop and mobile to include its Coupons.com app, Retailer iQ partner websites and apps, and Quotient's digital circulars. Quotient also enhanced its ad-serving platform to use significantly more behavioral and transactional data to deliver targeted media.
- In the fourth quarter, Quotient enhanced media capabilities on Brandcaster, the cornerstone of the Quotient Publisher Platform that enables approximately 30,000 of its publisher partners to feature coupon galleries, dynamic offer modules, and media on their sites.
Focus on Coupons.com consumer brand and shopper experience
- In the fourth quarter of 2015, Quotient acquired Shopmium, a mobile, receipt scanning, cash back app platform that bolsters the Company's mobile experience and enhances its data capabilities to deliver personalized and targeted media and promotions. Shopmium recently launched in the U.K. and the Company's U.S. sales team is now leveraging their CPG relationships to bring the offers currently available across its network into the Shopmium experience.
- In the third quarter, Quotient launched a new consumer marketing campaign to increase awareness and drive shoppers to Coupons.com. The campaign ties together both the functional and emotional benefits that Coupons.com savings deliver for the Company's shoppers and included online, mobile, video, and print.
Business Outlook
As of today, Quotient is providing the following business outlook.
For the first quarter 2016, total revenue is expected to be in the range of $59.0 million to $62.0 million. Adjusted EBITDA for the first quarter 2016 is expected to be in the range of $2.0 million to $3.0 million.
For the full year of 2016, total revenue is expected to be in the range of $250.0 million to $260.0 million. Adjusted EBITDA for the full year of 2016 is expected to be in the range of $20.0 million to $25.0 million.
Conference Call Information
Quotient CEO Steven Boal, and CFO Jennifer Ceran will host a conference call and live webcast to discuss the Company's financial results and business outlook today at 4:30 p.m. EST / 1:30 p.m. PST. Questions that investors would like to see asked during the call should be sent to [email protected].
To access the call, please dial (877) 201-0168, or outside the U.S. (647) 788-4901, with Conference ID# 22718210 at least five minutes prior to the 1:30 p.m. PST start time. The live webcast and accompanying presentation can be accessed on the Investor Relations section of the Company website at: http://investors.quotient.com/. A replay of the webcast will be available on the website following the conference call.
Use of Non-GAAP Financial Measures
Quotient has presented Adjusted EBITDA, a non-GAAP financial measure, in this press release, because it is a key measure used by Quotient's management and board of directors to understand and evaluate core operating performance and trends, to prepare and approve its annual budget, to develop short and long-term operational plans, and to determine bonus payouts and executive officer compensation. In particular, the Company believes that the exclusion of the expenses eliminated in calculating Adjusted EBITDA can provide a useful measure for period-to-period comparisons of its core business. Additionally, Adjusted EBITDA is a key financial measure used by the compensation committee of the board of directors in connection with the determination of compensation for its executive officers. Accordingly, Quotient believes that Adjusted EBITDA provides useful information to investors and others in understanding and evaluating the Company's operating results in the same manner as the Company's management and board of directors. Quotient defines Adjusted EBITDA as net income/(loss) adjusted for interest expense, other income (expense) – net, provision for (benefit from) income taxes, depreciation and amortization, stock-based compensation, gain on sale of a right to use a web domain name and change in fair value of contingent consideration.
Quotient's use of Adjusted EBITDA has limitations as an analytical tool, and should not be considered in isolation or as a substitute for analysis of the Company's financial results as reported under GAAP. Some of these limitations are:
- Although depreciation and amortization are non-cash expenses, the assets being depreciated and amortized may have to be replaced in the future, and Adjusted EBITDA does not reflect capital expenditure requirements for such replacements or for new capital expenditure requirements; and
- Adjusted EBITDA does not reflect: (i) changes in, or cash requirements for, working capital needs; (ii) the potentially dilutive impact of stock-based compensation; (iii) tax payments that may represent a reduction in cash available to Quotient; (iv) the effects of interest expense, other income (expense) – net, income taxes, depreciation and amortization, stock-based compensation, gain on sale of right to use a web domain, and change in fair value of contingent consideration; and (v) other companies, including companies in its industry, may calculate Adjusted EBITDA or similarly titled measures differently, which reduces its usefulness as a comparative measure.
These non-GAAP financial measures are not intended to be considered in isolation from, as substitutes for, or as superior to, the corresponding financial measures prepared in accordance with GAAP. Because of these and other limitations, Adjusted EBITDA should be considered along with other GAAP-based financial performance measures, including various cash flow metrics, net loss, and the Company's other GAAP financial results.
For a reconciliation of non-GAAP financial measures to the nearest comparable GAAP financial measures, see "Reconciliation of Projected Net Loss to Adjusted EBITDA" included in this press release.
Forward-Looking Statements
This press release contains forward-looking statements concerning Quotient's current expectations and projections about future events and financial trends affecting its business. Forward looking statements in this press release include Quotient's current expectations with respect to revenues and Adjusted EBITDA for the first quarter and full year 2016, Quotient's expectations for the continued rollout of the Retailer iQ digital platform and other new products and apps, including mobile, media and data and analytics offerings, the expansion of its network and the value proposition of its offerings, Quotient's expectations regarding potential opportunities for Shopmium, Quotient's expectations with respect to its future investments and growth, Quotient's expectations regarding increased leverage in Adjusted EBITDA, and Quotient's expectations regarding industry trends and developments applicable to it. Forward-looking statements should not be read as guarantees of future performance or results, and will not necessarily be accurate indications of the times at, or by, which such performance or results will be achieved. Forward-looking statements are based on information available to Quotient's management at the date of this press release and its management's good faith belief as of such date with respect to future events, and are subject to risks and uncertainties that could cause actual performance or results to differ materially from those expressed in or suggested by the forward-looking statements. Important factors that could cause such differences include, but are not limited to, Quotient's financial performance, including its revenues, margins, costs, expenditures, growth rates and operating expenses, and its ability to generate positive cash flow and become profitable; the amount and timing of digital promotions by CPGs, which are affected by budget cycles, economic conditions and other factors; the Company's ability to adapt to changing market conditions, including the Company's ability to adapt to changes in consumer habits, including mobile device usage; seasonal variations in consumer behavior; the Company's ability to retain and expand its business with existing CPGs and retailers; the Company's ability to negotiate fee arrangements with CPGs and retailers; the impact of mobile on the Company's platform; the Company's ability to maintain and expand the use by consumers of digital promotions on its platforms and add retailers to such platforms; the Company's ability to attract and retain third-party advertising agencies, performance marketing networks and other intermediaries; the Company's ability to effectively manage its growth; the effects of increased competition in the Company's markets and its ability to compete effectively; the Company's ability to effectively grow and train its sales team; the Company's ability to obtain new CPGs and retailers and to do so efficiently; the Company's ability to successfully integrate acquired companies into its business; the Company's ability to maintain, protect and enhance its brand and intellectual property; costs associated with defending intellectual property infringement and other claims; the Company's ability to successfully enter new markets; the Company's ability to develop and launch new services and features; the Company's ability to attract and retain qualified employees and key personnel, and other factors identified in Quotient's filings with the Securities and Exchange Commission (the "SEC"), including its annual report on Form 10-K filed with the SEC on March 19, 2015 and quarterly reports on Form 10-Q filed with the SEC on May 14, 2015 , August 13, 2015 and November 12, 2015 with the SEC. Additional information will also be set forth in Quotient's future quarterly reports on Form 10-Q, annual reports on Form 10-K and other filings that the Company makes with the SEC. Quotient disclaims any obligation to update information contained in these forward-looking statements whether as a result of new information, future events, or otherwise.
About Quotient Technology Inc.
Quotient Technology Inc. (NYSE: QUOT), formerly Coupons.com Incorporated, is a leading digital promotion and media platform that connects brands, retailers and consumers. We distribute digital coupons and media through a variety of products, including: digital printable coupons, digital paperless coupons, coupon codes and card linked offers. We operate Retailer iQ, a real-time digital coupon platform that connects into a retailer's point-of-sale system and provides targeting and analytics for manufacturers and retailers. We also power digital coupon initiatives in online marketing campaigns -- including display and video advertising. Our distribution network includes our flagship site, Coupons.com, approximately 30,000 third-party publishers, as well as our mobile applications, Coupons.com, Grocery iQ, Shopmium, and those of our many partners. Clients include hundreds of consumer packaged goods companies, such as Clorox, Procter & Gamble, General Mills and Kellogg's, as well as top retailers like Albertsons-Safeway, CVS, Dollar General, Kroger, and Walgreens. Founded in 1998, Quotient is based in Mountain View, Calif., and is bringing the multi-billion dollar offline promotions industry into the digital world. Learn more about the Company at http://quotient.com.
QUOTIENT TECHNOLOGY INC. | |||||||
CONDENSED CONSOLIDATED STATEMENTS OF OPERATIONS | |||||||
(Unaudited, in thousands, except per share data) | |||||||
|
|
|
|
|
|
|
|
|
|
| Three Months Ended
|
| Year Ended
| ||||
|
| 2015 |
| 2014 |
| 2015 |
| 2014 |
Revenues | $69,413 |
| $60,001 |
| $237,309 |
| $221,761 |
Costs and expenses: |
|
|
|
|
|
|
|
Cost of revenues (1) | 25,436 |
| 21,722 |
| 92,203 |
| 86,186 |
Sales and marketing (1) | 26,133 |
| 22,686 |
| 92,454 |
| 78,865 |
Research and development (1) | 11,696 |
| 10,984 |
| 48,367 |
| 49,583 |
General and administrative (1) | 10,093 |
| 8,085 |
| 34,833 |
| 33,392 |
Change in fair value of contingent consideration | (253) |
| (2,935) |
| 1,231 |
| (5,741) |
Total costs and expenses | 73,105 |
| 60,542 |
| 269,088 |
| 242,285 |
Loss from operations | (3,692) |
| (541) |
| (31,779) |
| (20,524) |
Interest expense | (2) |
| (79) |
| (290) |
| (922) |
Gain on sale of a right to use a web domain name | — |
| — |
| 4,800 |
| — |
Other income (expense), net | (48) |
| 16 |
| (22) |
| (72) |
Loss before income taxes | (3,742) |
| (604) |
| (27,291) |
| (21,518) |
Provision for (benefit from) income taxes | (173) |
| 1,119 |
| (561) |
| 1,926 |
Net loss | $ (3,569) |
| $ (1,723) |
| $ (26,730) |
| $ (23,444) |
|
|
|
|
|
|
|
|
|
Net loss per share attributable to common stockholders, basic and diluted | $ (0.04) |
| $ (0.02) |
| $ (0.32) |
| $ (0.35) |
Weighted-average number of common shares used in computing net loss per
| 82,744 |
| 80,543 |
| 82,807 |
| 67,828 |
|
|
|
|
|
|
|
|
|
(1) The stock-based compensation expense included above was as follows: |
|
|
|
|
|
|
|
|
|
|
|
|
|
|
|
|
|
| Three Months Ended
|
| Year Ended
| ||||
|
| 2015 |
| 2014 |
| 2015 |
| 2014 |
Cost of revenues | $ 427 |
| $ 492 |
| $ 1,728 |
| $ 3,086 |
Sales and marketing | 1,561 |
| 2,565 |
| 10,658 |
| 9,464 |
Research and development | 2,220 |
| 2,119 |
| 9,680 |
| 11,536 |
General and administrative | 2,625 |
| 2,607 |
| 10,280 |
| 11,424 |
Total stock-based compensation | $ 6,833 |
| $ 7,783 |
| $ 32,346 |
| $ 35,510 |
QUOTIENT TECHNOLOGY INC. | |||
CONDENSED CONSOLIDATED STATEMENTS OF CASH FLOWS | |||
(Unaudited, in thousands) | |||
|
|
|
|
|
|
| Year Ended December 31, | ||
|
| 2015 |
| 2014 |
Cash flows from operating activities: |
|
|
|
Net loss | $ (26,730) |
| $ (23,444) |
Adjustments to reconcile net loss to net cash provided by operating activities: |
|
|
|
Depreciation and amortization | 16,500 |
| 14,737 |
Stock-based compensation | 32,346 |
| 35,510 |
Accretion of debt discount | — |
| 173 |
Amortization of debt issuance cost | 134 |
| 77 |
Loss on disposal of property and equipment | 146 |
| 9 |
Gain on sale of a right to use a web domain name | (4,800) |
| — |
Allowance for doubtful accounts | 680 |
| 136 |
Deferred income taxes | (561) |
| 1,923 |
Change in fair value of contingent consideration | 1,231 |
| (5,741) |
Changes in operating assets and liabilities: |
|
|
|
Accounts receivable | (12,792) |
| (8,863) |
Prepaid expenses and other current assets | (1,231) |
| (4,086) |
Accounts payable and other current liabilities | 2,967 |
| 1,155 |
Accrued compensation and benefits | 146 |
| 1,104 |
Deferred revenues | 1,189 |
| (490) |
Other liabilities | 6 |
| (742) |
Net cash provided by operating activities | 9,231 |
| 11,458 |
|
|
|
|
|
Cash flows from investing activities: |
|
|
|
Purchases of property and equipment | (13,170) |
| (9,580) |
Purchase of intangible assets | (636) |
| (111) |
Proceeds from sale of a right to use a web domain name | 4,800 |
| — |
Acquisitions, net of acquired cash | (16,806) |
| (13,341) |
Purchases of short-term investments | (25,000) |
| — |
Net cash used in investing activities | (50,812) |
| (23,032) |
|
|
|
|
|
Cash flows from financing activities: |
|
|
|
Proceeds from issuance of common stock | 5,680 |
| 10,585 |
Repurchases of common stock | (22,695) |
| — |
Proceeds from initial public offering, net of offering costs | — |
| 176,525 |
Exercise of warrant | — |
| 1,610 |
Repayment of debt obligations, related party | — |
| (15,000) |
Repayment of debt obligation | (7,500) |
| — |
Principal payments on capital lease obligations | (62) |
| (58) |
Net cash (used in) provided by financing activities | (24,577) |
| 173,662 |
Effect of exchange rates on cash and cash equivalents | 30 |
| 15 |
Net (decrease) increase in cash and cash equivalents | (66,128) |
| 162,103 |
Cash and cash equivalents at beginning of period | 201,075 |
| 38,972 |
Cash and cash equivalents at end of period | $134,947 |
| $201,075 |
QUOTIENT TECHNOLOGY INC. | |||
CONDENSED CONSOLIDATED BALANCE SHEETS | |||
(Unaudited, in thousands) | |||
|
|
|
|
|
|
| December 31,
|
| December 31,
|
Assets |
|
|
|
Current assets: |
|
|
|
Cash and cash equivalents | $ 134,947 |
| $ 201,075 |
Short-term investments | 25,000 |
| - |
Accounts receivable, net | 63,239 |
| 51,061 |
Prepaid expenses and other current assets | 5,297 |
| 4,169 |
Total current assets | 228,483 |
| 256,305 |
Property and equipment, net | 25,128 |
| 25,399 |
Intangible assets, net | 14,880 |
| 11,818 |
Goodwill | 43,895 |
| 29,277 |
Other assets | 8,685 |
| 9,008 |
Total assets | $ 321,071 |
| $ 331,807 |
Liabilities and Stockholders' Equity |
|
|
|
Current liabilities: |
|
|
|
Accounts payable | $ 8,187 |
| $ 6,358 |
Accrued compensation and benefits | 15,237 |
| 14,861 |
Other current liabilities | 20,170 |
| 16,530 |
Deferred revenues | 7,342 |
| 6,219 |
Debt obligation | - |
| 7,500 |
Total current liabilities | 50,936 |
| 51,468 |
Other non-current liabilities | 706 |
| 827 |
Contingent consideration related to acquisitions | 1,407 |
| - |
Deferred tax liabilities | 2,532 |
| 2,624 |
Total liabilities | 55,581 |
| 54,919 |
|
|
|
|
|
Stockholders' equity: |
|
|
|
Common stock | 1 |
| 1 |
Additional paid-in capital | 570,588 |
| 531,018 |
Treasury stock, at cost | (85,427) |
| (61,935) |
Accumulated other comprehensive loss | (747) |
| (1) |
Accumulated deficit | (218,925) |
| (192,195) |
Total stockholders' equity | 265,490 |
| 276,888 |
Total liabilities and stockholders' equity | $ 321,071 |
| $ 331,807 |
QUOTIENT TECHNOLOGY INC. | |||||||
RECONCILIATION OF NET LOSS TO ADJUSTED EBITDA AND TRANSACTION DATA | |||||||
(Unaudited, in thousands) | |||||||
|
|
|
|
|
|
|
|
|
|
| Three Months Ended
|
| Year Ended
| ||||
|
| 2015 |
| 2014 |
| 2015 |
| 2014 |
Net loss | $ (3,569) |
| $ (1,723) |
| $ (26,730) |
| $ (23,444) |
Adjustments: |
|
|
|
|
|
|
|
Stock-based compensation | 6,833 |
| 7,783 |
| 32,346 |
| 35,510 |
Depreciation and amortization | 4,621 |
| 3,959 |
| 16,500 |
| 14,737 |
Change in fair value of contingent consideration | (253) |
| (2,935) |
| 1,231 |
| (5,741) |
Interest expense | 2 |
| 79 |
| 290 |
| 922 |
Other income (expense), net | 48 |
| (16) |
| 22 |
| 72 |
Provision for (benefit from) income taxes | (173) |
| 1,119 |
| (561) |
| 1,926 |
Gain on sale of a right to use a web domain name | - |
| — |
| (4,800) |
| — |
|
|
|
|
|
|
|
|
|
Total adjustments | $ 11,078 |
| $ 9,989 |
| $ 45,028 |
| $ 47,426 |
|
|
|
|
|
|
|
|
|
Adjusted EBITDA | $ 7,509 |
| $ 8,266 |
| $ 18,298 |
| $ 23,982 |
|
|
|
|
|
|
|
|
|
Transactions (1) | 469,010 |
| 376,512 |
| 1,657,039 |
| 1,608,082 |
|
| |||||||
(1) A transaction is any action that generates revenue, directly or indirectly, including per item transaction fees, revenue sharing fees, set up fees and volume-based fixed fees. Transactions exclude self-generated retailer offers where no revenue is received. | |||||||
|
|

Logo - http://photos.prnewswire.com/prnh/20151022/279702LOGO
CONTACT: Investor Relations Contact: Stacie Clements, Vice President, Investor Relations, Phone: 650-605-4535, [email protected]; Media Contact: Paul Sloan, Vice President, Communications, Phone: 650-396-8754, [email protected]
Exhibit 99.2
©2016 Quotient Technology Inc. T he Quotient logo is a trademark of Quotient Technology Inc
©2016 Quotient Technology Inc. 2 Forward Looking Statements This presentation and the accompanying oral presentation contain “forward - looking” statements that are based on our management’s beliefs and assumptions and on information currently available to management, including our projections regarding future financial performance, our ability to grow our business, our plans for our future investments and expansion, the continued shifts in our industry, and our expectations with respect to consumers’ and CPG’s fu tur e demand and behavior, our expectations regarding the continued rollout, growth and performance of Retailer iQ platform, as well as the anticipated financial benefits therefrom, our expectation regarding the rollout of Brandcaster , our media offerings, and Quotient Insight and our ability to leverage these capabilities, the integration of Shopmium and t he benefits expected from the acquisition, our plans with respect to future stock repurchases, our digital print initiative and our efforts with respect to at tract additional retailers, and our expectations to successfully leverage our investment and operating expenses. Quotient operates in very competitive and rapidly changing environments, and new risks may emerge from time to time. It is not possible for Quotient’s management to predict all risks, nor can it assess the impact of all factors on our business or the extent to which any factor, or combination of factors, may cause actual results to differ materially from those contained in any forward - looking statements Quo tient may make. Forward - looking statements should not be read as guarantees of future performance or results, and will not necessarily be accurate indications of the ti mes at, or by, which such performance or results will be achieved. Forward - looking statements are based on information available to Quotient’s management at the date of this rel ease and its management’s good faith belief as of such date with respect to future events, and are subject to risks and uncertainties that could cause actual performance or results to differ materially from those expressed in or suggested by the forward - looking statements. Important factors that could cause such differences include, but ar e not limited to, Quotient’s financial performance, including its revenues, margins, costs, expenditures, growth rates and operating expenses, and its ability to ge ner ate positive cash flow and become profitable; the amount and timing of digital promotions by CPGs, which are affected by budget cycles, economic conditions and other facto rs; the company’s ability to adapt to changing market conditions, including the Company’s ability to adapt to changes in consumer habits, including mobile device usage; sea son al variations in consumer behavior; the Company’s ability to retain and expand its business with existing CPGs and retailers; the company’s ability to negotiate fee arr angements with CPGs and retailers; the impact of mobile on the Company’s platform; the Company’s ability to maintain and expand the use by consumers of digital promotions on its platforms and add retailers to such platforms; the Company’s ability to attract and retain third - party advertising agencies, performance marketing networks and othe r intermediaries; the Company’s ability to acquire and integrate new companies; the Company’s ability to effectively manage its growth; the effects of increased competi tio n in the Company’s markets and its ability to compete effectively; the Company’s ability to effectively grow and train its sales team; the Company’s ability to obtain new CPG s and retailers and to do so efficiently; the Company’s ability to successfully integrate acquired companies into its business; the Company’s ability to maintain, protect and enhance its brand and intellectual property; costs associated with defending intellectual property infringement and other claims; the Company’s ability to successfully en ter new markets; the Company’s ability to develop and launch new services and features; and the Company’s ability to attract and retain qualified employees and key personnel. The se factors, together with those described in greater detail in the Company’s annual report on Form 10 - K filed with the SEC on March 19, 2015, the Company’s quarterly reports on Form 10 - Q filed on May 14, 2015, August 13, 2015 and November 12, 2015 and in the Company’s future quarterly reports on Form 10 - Q, annual reports on Form 10 - K a nd other filings made with the SEC, may cause our actual results, performance or achievements to differ materially and adversely from those anticipated or implie d b y our forward - looking statements. Quotient disclaims any obligation to update information contained in these forward - looking statements whether as a result of new informat ion, future events, or otherwise. In addition to the U.S. GAAP financials, this presentation includes certain non - GAAP financial measures. The non - GAAP measures have limitations as analytical tools and you should not consider them in isolation or as a substitute for an analysis of our results under U.S. GAAP. There are a number of limitatio ns related to the use of these non - GAAP financial measures versus their nearest GAAP equivalents. For example, other companies may calculate non - GAAP financial measures different ly or may use other measures to evaluate their performance, all of which could reduce the usefulness of our non - GAAP financial measures as tools for comparison. Quotient considers these non - GAAP financial measures to be important because they provide useful measures of the operating performance of the company, exclusiv e o f unusual events or factors that do not directly affect what we consider to be our core operating performance, and are used by the company's management for that purp ose . The use of non - GAAP measures is further discussed in the accompanying press release, which has been furnished to the SEC on Form 8 - K and posted on Quotient’s we bsite. The press release also defines our non - GAAP financial measure of Adjusted EBITDA. A reconciliation between GAAP and non - GAAP measures can also be found in the accompanying press release and in the Appendix hereto .

©2016 Quotient Technology Inc. Steven Boal CEO 3
©2016 Quotient Technology Inc. Jennifer Ceran CFO 4
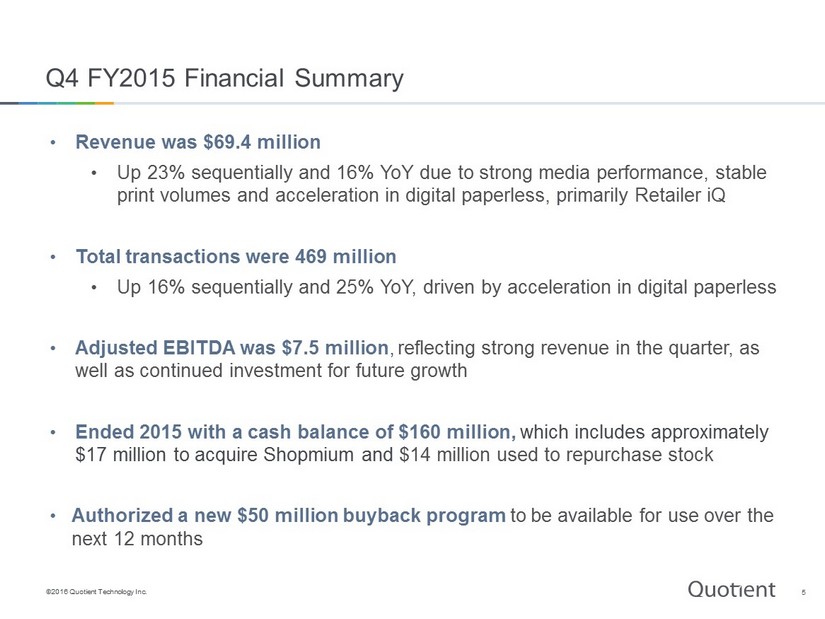
©2016 Quotient Technology Inc. 5 Q4 FY2015 Financial Summary • Revenue was $ 69.4 million • Up 23% sequentially and 16% YoY due to strong media performance, stable print volumes and acceleration in digital paperless, primarily Retailer iQ • Total transactions were 469 million • Up 16% sequentially and 25% YoY, driven by acceleration in digital paperless • Adjusted EBITDA was $7.5 million , reflecting strong revenue in the quarter, as well as continued investment for future growth • Ended 2015 with a cash balance of $160 million, which includes approximately $17 million to acquire Shopmium and $14 million used to repurchase stock • A uthorized a new $50 million buyback program to be available for use over the next 12 months
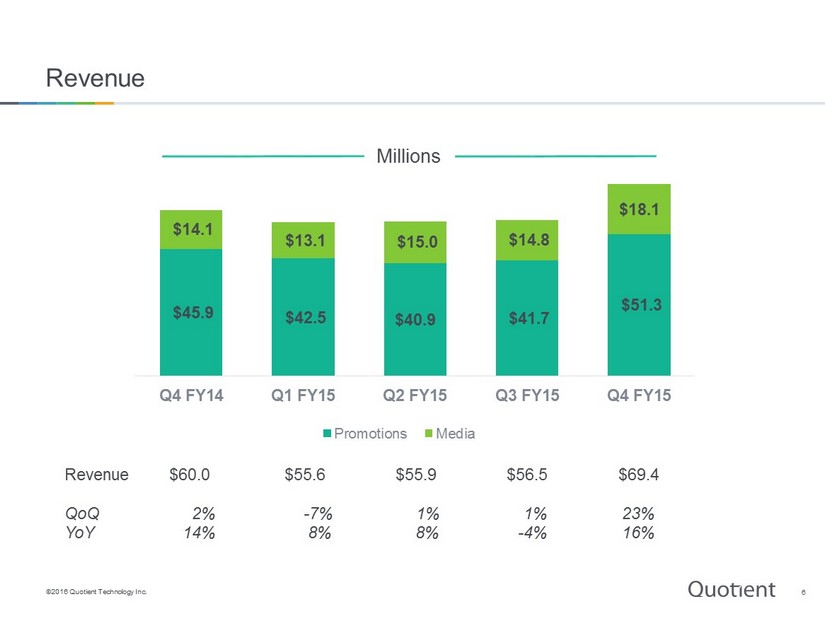
©2016 Quotient Technology Inc. 6 Revenue Revenue $60.0 $55.6 $55.9 $56.5 $ 69.4 QoQ 2% - 7% 1% 1% 23% YoY 14% 8% 8% - 4% 16% Millions $45.9 $42.5 $40.9 $41.7 $51.3 $14.1 $13.1 $15.0 $14.8 $18.1 Q4 FY14 Q1 FY15 Q2 FY15 Q3 FY15 Q4 FY15 Promotions Media
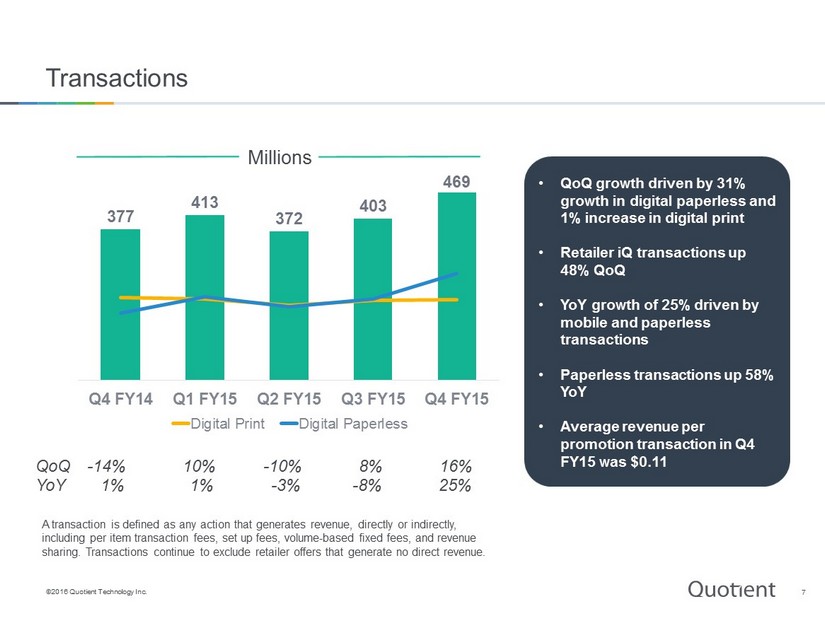
©2016 Quotient Technology Inc. 7 Transactions QoQ - 14% 10% - 10% 8% 16% YoY 1% 1% - 3% - 8% 25% • QoQ growth driven by 31% growth in digital paperless and 1% increase in digital print • Retailer iQ transactions up 48% QoQ • YoY growth of 25% driven by mobile and paperless transactions • Paperless transactions up 58% YoY • Average revenue per promotion transaction in Q4 FY15 was $ 0.11 A transaction is defined as any action that generates revenue, directly or indirectly, including per item transaction fees, set up fees, volume - based fixed fees, and revenue sharing. Transactions continue to exclude retailer offers that generate no direct revenue. Millions 377 413 372 403 469 Q4 FY14 Q1 FY15 Q2 FY15 Q3 FY15 Q4 FY15 Digital Print Digital Paperless
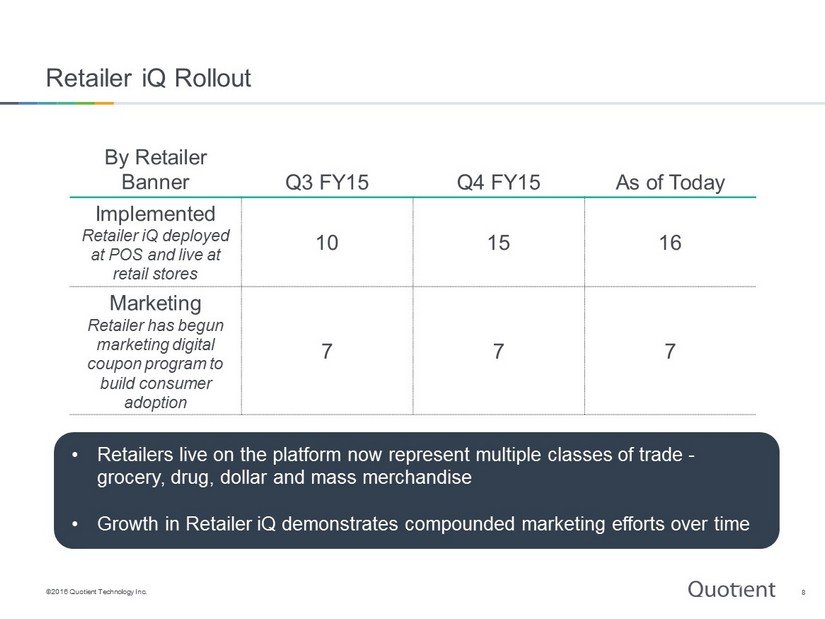
©2016 Quotient Technology Inc. 8 Retailer iQ Rollout By Retailer Banner Q3 FY15 Q4 FY15 As of Today Implemented Retailer iQ deployed at POS and live at retail stores 10 15 16 Marketing Retailer has begun marketing digital coupon program to build consumer adoption 7 7 7 • Retailers live on the platform now represent multiple classes of trade - grocery, drug, dollar and mass merchandise • Growth in Retailer iQ demonstrates compounded marketing efforts over time
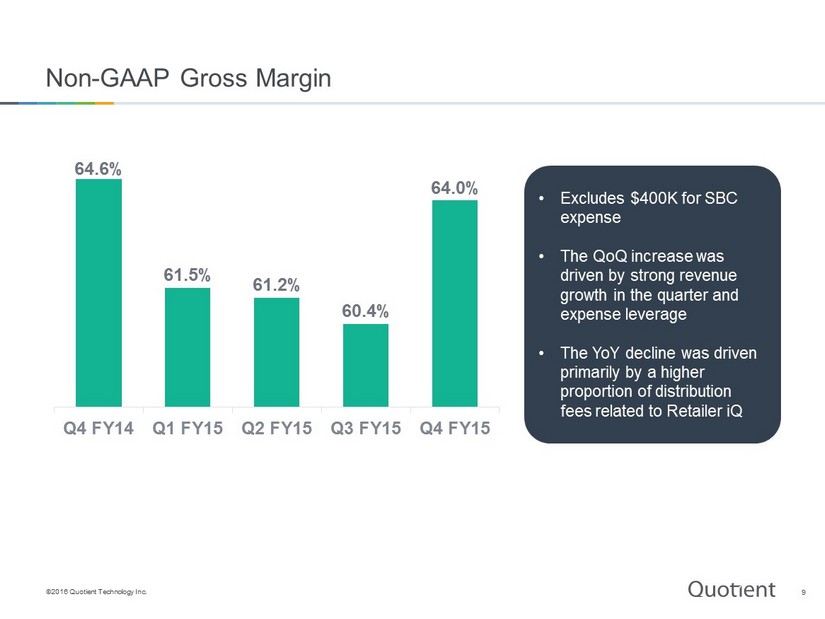
©2016 Quotient Technology Inc. 9 Non - GAAP Gross Margin • Excludes $400K for SBC expense • The QoQ increase was driven by strong revenue growth in the quarter and expense leverage • The YoY decline was driven primarily by a higher proportion of distribution fees related to Retailer iQ 64.6% 61.5% 61.2% 60.4% 64.0% Q4 FY14 Q1 FY15 Q2 FY15 Q3 FY15 Q4 FY15
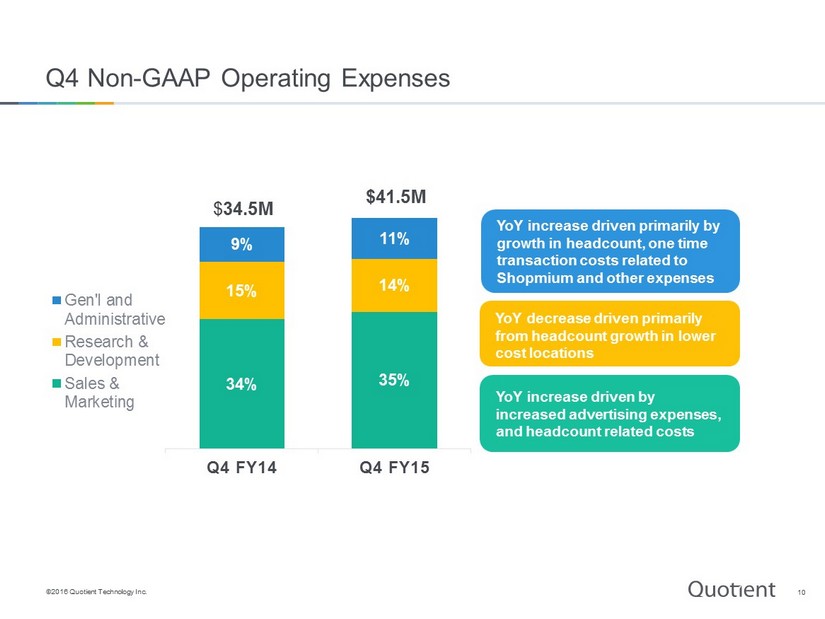
©2016 Quotient Technology Inc. 34% 35% 15% 14% 9% 11% Q4 FY14 Q4 FY15 Gen'l and Administrative Research & Development Sales & Marketing 10 Q4 Non - GAAP Operating Expenses YoY increase driven primarily by growth in headcount, one time transaction costs related to Shopmium and other expenses YoY increase driven by increased advertising expenses, and headcount related costs $41.5M $ 34.5M YoY decrease driven primarily from headcount growth in lower cost locations
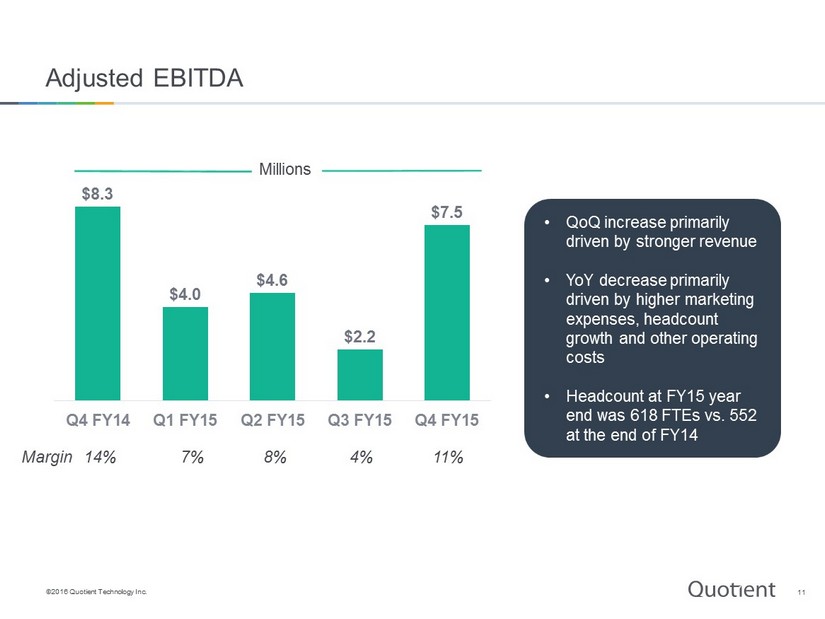
©2016 Quotient Technology Inc. Adjusted EBITDA Margin 14% 7% 8% 4% 11% Millions • QoQ increase primarily driven by stronger revenue • YoY decrease primarily driven by higher marketing expenses, headcount growth and other operating costs • Headcount at FY15 year end was 618 FTEs vs. 552 at the end of FY14 $8.3 $4.0 $4.6 $2.2 $7.5 Q4 FY14 Q1 FY15 Q2 FY15 Q3 FY15 Q4 FY15 11
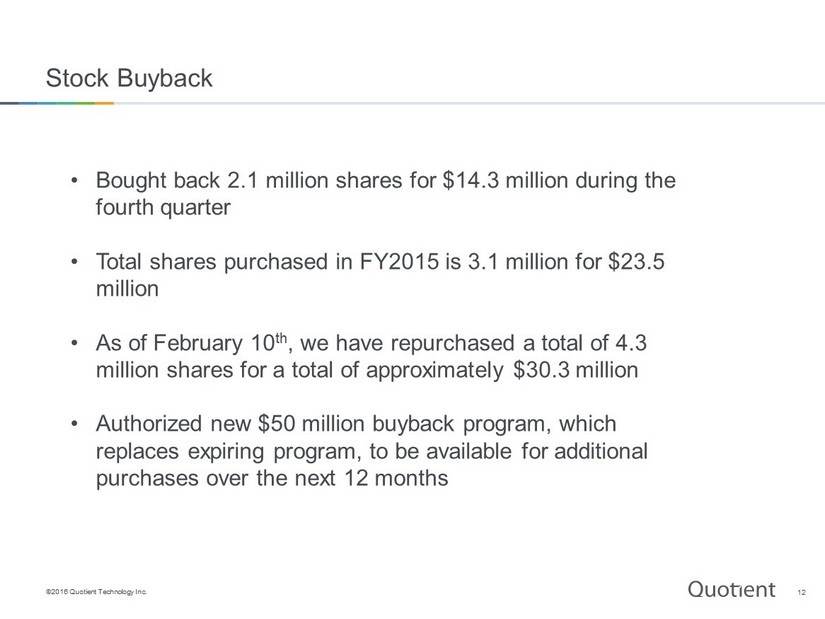
©2016 Quotient Technology Inc. Stock Buyback • Bought back 2.1 million shares for $14.3 million during the fourth quarter • Total shares purchased in FY2015 is 3.1 million for $23.5 million • As of February 10 th , we have repurchased a total of 4.3 million shares for a total of approximately $30.3 million • Authorized new $50 million buyback program, which replaces expiring program, to be available for additional purchases over the next 12 months 12
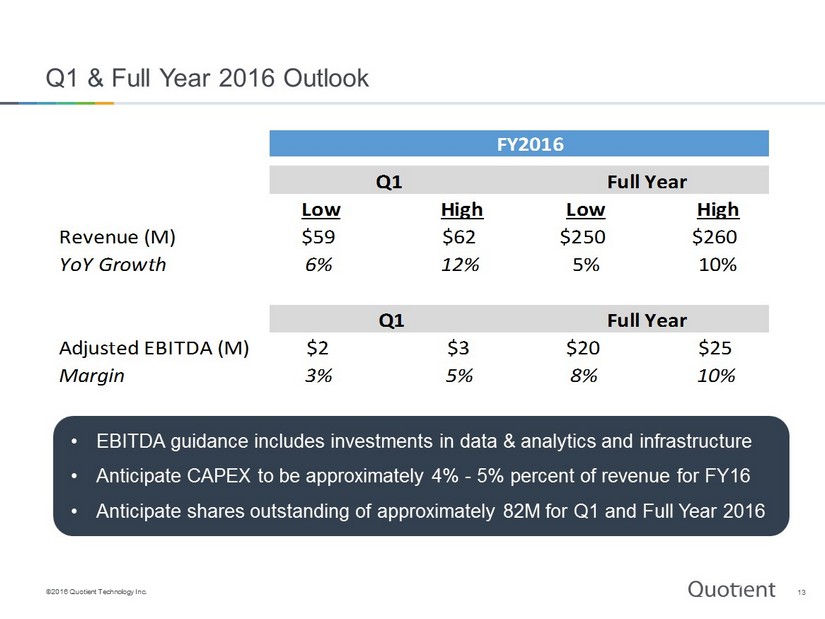
©2016 Quotient Technology Inc. 13 Q1 & Full Year 2016 Outlook • EBITDA guidance includes investments in data & analytics and infrastructure • Anticipate CAPEX to be approximately 4% - 5% percent of revenue for FY16 • A nticipate shares outstanding of approximately 82M for Q1 and F ull Y ear 2016 FY2016 Q1 Full Year Low High Low High Revenue (M) $59 $62 $250 $260 YoY Growth 6% 12% 5% 10% Q1 Full Year Adjusted EBITDA (M) $2 $3 $20 $25 Margin 3% 5% 8% 10%
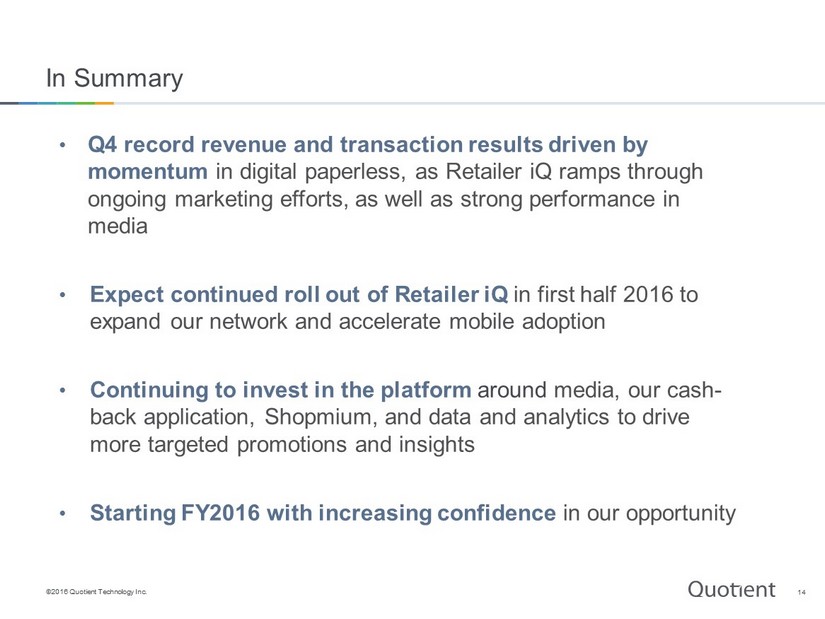
©2016 Quotient Technology Inc. In Summary • Q4 record revenue and transaction results driven by momentum in digital paperless, as Retailer iQ ramps through ongoing marketing efforts, as well as strong performance in media • Expect continued roll out of Retailer iQ in first half 2016 to expand our network and accelerate mobile adoption • Continuing to invest in the platform around media, our cash - back application, Shopmium , and data and analytics to drive more targeted promotions and insights • Starting FY2016 with increasing confidence in our opportunity 14

©2016 Quotient Technology Inc. Q&A 15
©2016 Quotient Technology Inc. Appendix 16
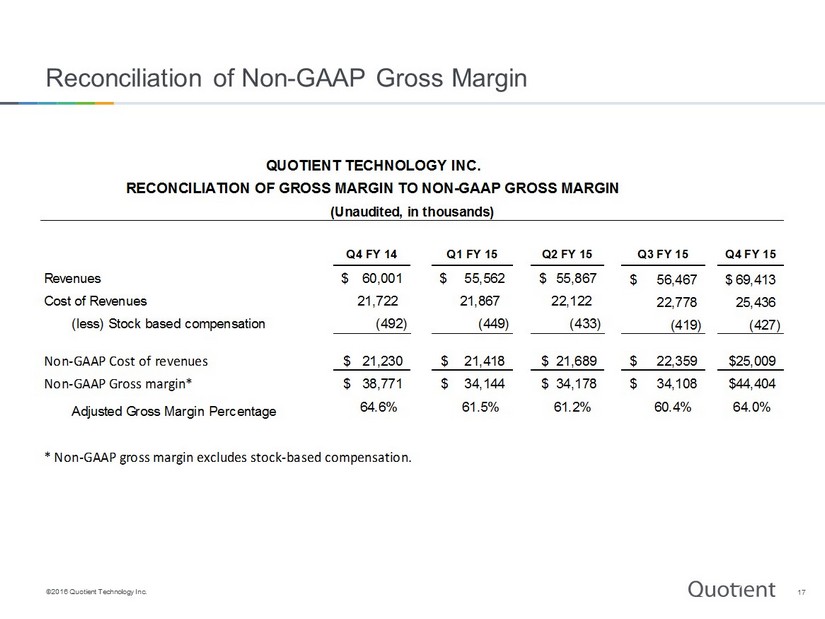
©2016 Quotient Technology Inc. 17 Reconciliation of Non - GAAP Gross Margin Q4 FY 14 Q1 FY 15 Q2 FY 15 Q3 FY 15 Q4 FY 15 Revenues 60,001$ 55,562$ 55,867$ 56,467$ 69,413$ Cost of Revenues 21,722 21,867 22,122 22,778 25,436 (less) Stock based compensation (492) (449) (433) (419) (427) Non-GAAP Cost of revenues 21,230$ 21,418$ 21,689$ 22,359$ 25,009$ Non-GAAP Gross margin* 38,771$ 34,144$ 34,178$ 34,108$ 44,404$ Adjusted Gross Margin Percentage 64.6% 61.5% 61.2% 60.4% 64.0% * Non-GAAP gross margin excludes stock-based compensation. QUOTIENT TECHNOLOGY INC. RECONCILIATION OF GROSS MARGIN TO NON-GAAP GROSS MARGIN (Unaudited, in thousands)
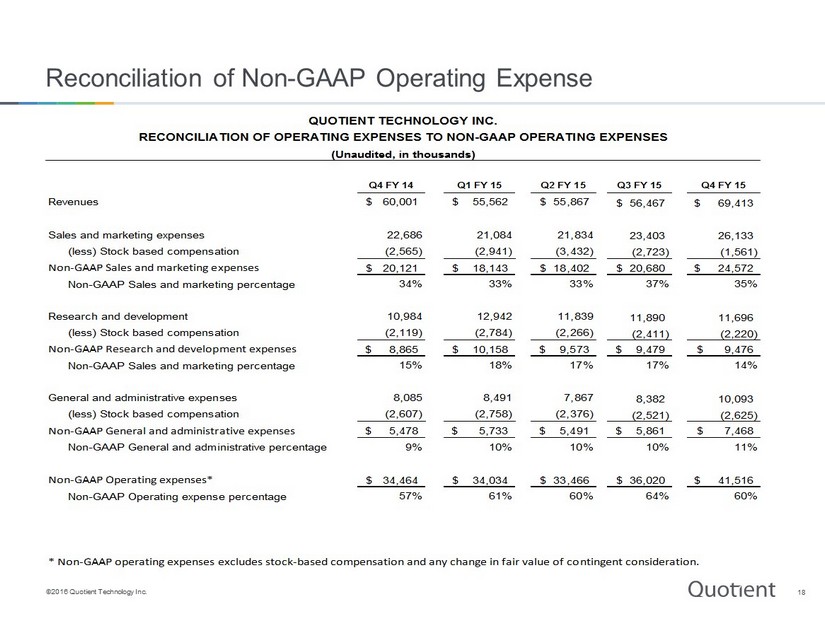
©2016 Quotient Technology Inc. 18 Reconciliation of Non - GAAP Operating Expense Q4 FY 14 Q1 FY 15 Q2 FY 15 Q3 FY 15 Q4 FY 15 Revenues 60,001$ 55,562$ 55,867$ 56,467$ 69,413$ Sales and marketing expenses 22,686 21,084 21,834 23,403 26,133 (less) Stock based compensation (2,565) (2,941) (3,432) (2,723) (1,561) Non-GAAP Sales and marketing expenses 20,121$ 18,143$ 18,402$ 20,680$ 24,572$ Non-GAAP Sales and marketing percentage 34% 33% 33% 37% 35% Research and development 10,984 12,942 11,839 11,890 11,696 (less) Stock based compensation (2,119) (2,784) (2,266) (2,411) (2,220) Non-GAAP Research and development expenses 8,865$ 10,158$ 9,573$ 9,479$ 9,476$ Non-GAAP Sales and marketing percentage 15% 18% 17% 17% 14% General and administrative expenses 8,085 8,491 7,867 8,382 10,093 (less) Stock based compensation (2,607) (2,758) (2,376) (2,521) (2,625) Non-GAAP General and administrative expenses 5,478$ 5,733$ 5,491$ 5,861$ 7,468$ Non-GAAP General and administrative percentage 9% 10% 10% 10% 11% Non-GAAP Operating expenses* 34,464$ 34,034$ 33,466$ 36,020$ 41,516$ Non-GAAP Operating expense percentage 57% 61% 60% 64% 60% * Non-GAAP operating expenses excludes stock-based compensation and any change in fair value of contingent consideration. QUOTIENT TECHNOLOGY INC. RECONCILIATION OF OPERATING EXPENSES TO NON-GAAP OPERATING EXPENSES (Unaudited, in thousands)
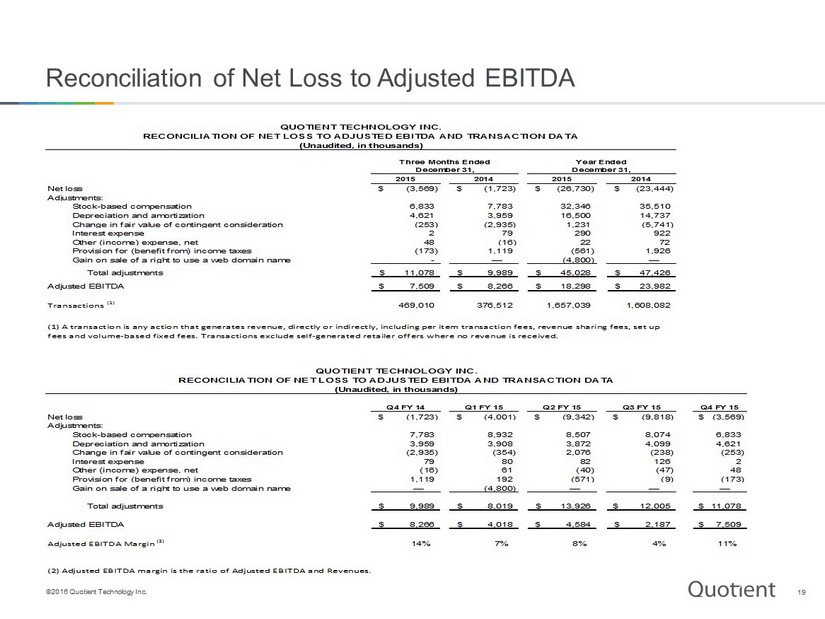
©2016 Quotient Technology Inc. 19 Reconciliation of Net Loss to Adjusted EBITDA 2015 2014 2015 2014 Net loss (3,569)$ (1,723)$ (26,730)$ (23,444)$ Adjustments: Stock-based compensation 6,833 7,783 32,346 35,510 Depreciation and amortization 4,621 3,959 16,500 14,737 Change in fair value of contingent consideration (253) (2,935) 1,231 (5,741) Interest expense 2 79 290 922 Other (income) expense, net 48 (16) 22 72 Provision for (benefit from) income taxes (173) 1,119 (561) 1,926 Gain on sale of a right to use a web domain name - — (4,800) — Total adjustments 11,078$ 9,989$ 45,028$ 47,426$ Adjusted EBITDA 7,509$ 8,266$ 18,298$ 23,982$ Transactions (1) 469,010 376,512 1,657,039 1,608,082 Q4 FY 14 Q1 FY 15 Q2 FY 15 Q3 FY 15 Q4 FY 15 Net loss (1,723)$ (4,001)$ (9,342)$ (9,818)$ (3,569)$ Adjustments: Stock-based compensation 7,783 8,932 8,507 8,074 6,833 Depreciation and amortization 3,959 3,908 3,872 4,099 4,621 Change in fair value of contingent consideration (2,935) (354) 2,076 (238) (253) Interest expense 79 80 82 126 2 Other (income) expense, net (16) 61 (40) (47) 48 Provision for (benefit from) income taxes 1,119 192 (571) (9) (173) Gain on sale of a right to use a web domain name — (4,800) — — — Total adjustments 9,989$ 8,019$ 13,926$ 12,005$ 11,078$ Adjusted EBITDA 8,266$ 4,018$ 4,584$ 2,187$ 7,509$ Adjusted EBITDA Margin (2) 14% 7% 8% 4% 11% (2) Adjusted EBITDA margin is the ratio of Adjusted EBITDA and Revenues. QUOTIENT TECHNOLOGY INC. RECONCILIATION OF NET LOSS TO ADJUSTED EBITDA AND TRANSACTION DATA (Unaudited, in thousands) (1) A transaction is any action that generates revenue, directly or indirectly, including per item transaction fees, revenue sharing fees, set up fees and volume-based fixed fees. Transactions exclude self-generated retailer offers where no revenue is received. Three Months Ended December 31, Year Ended December 31, QUOTIENT TECHNOLOGY INC. RECONCILIATION OF NET LOSS TO ADJUSTED EBITDA AND TRANSACTION DATA (Unaudited, in thousands)
Serious News for Serious Traders! Try StreetInsider.com Premium Free!
You May Also Be Interested In
- Securitas AB to publish the Interim Report July-September 2026 on October 23, 2026
- Nxera Pharma Enters into Exclusive License, Supply and Commercialization Agreement with Synmosa for QUVIVIQ® (daridorexant) Across Eight Asia-Pacific Markets
- Reply Introduces Symbiosis: an AI-Driven Operating Model to Align Business Priorities and AI-Accelerated Delivery
Create E-mail Alert Related Categories
SEC FilingsSign up for StreetInsider Free!
Receive full access to all new and archived articles, unlimited portfolio tracking, e-mail alerts, custom newswires and RSS feeds - and more!
