



Form 8-K Platform Specialty Produ For: Aug 08
 Tweet
Tweet Share
Share E-mail
UNITED STATES
SECURITIES AND EXCHANGE COMMISSION
Washington, D.C. 20549
________________________________________________________
FORM 8-K
________________________________________________________
CURRENT REPORT
Pursuant to Section 13 or 15(d) of
the Securities Exchange Act of 1934
Date of Report (Date of earliest event reported): August 8, 2016
________________________________________________________

________________________________________________________
(Exact name of registrant as specified in its charter)
Delaware | 001-36272 | 37-1744899 |
(State or other jurisdiction of incorporation) | (Commission File Number) | (IRS Employer Identification No.) |
1450 Centrepark Boulevard Suite 210 West Palm Beach, Florida | 33,401 |
(Address of principal executive offices) | (Zip Code) |
Registrant's telephone number, including area code: (561) 207-9600
Not Applicable
________________________________________________________
(Former name or former address, if changed since last report)
Check the appropriate box below if the Form 8-K filing is intended to simultaneously satisfy the filing obligation of the registrant under any of the following provisions:
[ ] | Written communications pursuant to Rule 425 under the Securities Act (17 CFR 230.425) |
[ ] | Soliciting material pursuant to Rule 14a-12 under the Exchange Act (17 CFR 240.14a-12) |
[ ] | Pre-commencement communications pursuant to Rule 14d-2(b) under the Exchange Act (17 CFR 240.14d-2(b)) |
[ ] | Pre-commencement communications pursuant to Rule 13e-4(c) under the Exchange Act (17 CFR 240.13e-4(c)) |
Item 2.02. Results of Operations and Financial Condition.
On August 8, 2016, Platform Specialty Products Corporation ("Platform") issued a press release announcing Platform's financial results for the three and six months ended June 30, 2016 (the "2016 Second Quarter Results"). A copy of this press release is attached hereto as Exhibit 99.1 and is incorporated herein by reference.
To supplement the financial measures prepared in accordance with generally accepted accounting principles in the United States of America ("GAAP"), within the 2016 Second Quarter Results and the Presentation Slides (as defined under Item 7.01 of this Current Report) furnished herewith, Platform has provided the following non-GAAP financial measures: comparable adjusted diluted earnings per share, comparable sales, adjusted EBITDA, adjusted EBITDA margin, adjusted EBITDA guidance, comparable adjusted EBITDA, comparable adjusted EBITDA margin and organic sales. Platform also evaluates and presents its results of operations on a constant currency and comparable constant currency basis. For purposes of Regulation G, a non-GAAP financial measure is a numerical measure of a company's historical or future financial performance, financial position or cash flows that excludes amounts, or is subject to adjustments that have the effect of excluding amounts, that are included in the most directly comparable measure calculated and presented in accordance with GAAP in the statements of income, balance sheets or statements of cash flows (or equivalent statements) of the company, or includes amounts, or is subject to adjustments that have the effect of including amounts, that are excluded from the most directly comparable measure so calculated and presented.
Management believes that these non-GAAP measures provide useful information to investors by excluding certain items that it believes are not representative of Platform's business and including other items that it believes are useful in evaluating Platform's operations; thereby providing to investors a more complete understanding of the long-term profitability trends of Platform's business, and facilitate comparisons of its profitability to prior and future periods and to its peers. These non-GAAP measures may not, however, be indicative of the results that Platform expects to recognize for future periods. Non-GAAP financial measures that Platform uses may also differ from measures that other companies may use. Non-GAAP financial measures should be considered in addition to, and not a substitute for, financial information prepared in accordance with GAAP.
The information in this Item 2.02 of this Current Report on Form 8-K and Exhibit 99.1 attached hereto shall not be deemed to be "filed" for purposes of Section 18 of the Securities Exchange Act of 1934, as amended (the "Exchange Act"), or otherwise subject to the liabilities of that section. The information contained in this Item 2.02 and Exhibit 99.1 attached hereto shall not be incorporated by reference into any filing of Platform, whether made before or after the date hereof, regardless of any general incorporation language in such filing, unless expressly incorporated by specific reference to such filing.
Item 7.01. Regulation FD Disclosure.
Simultaneously with the filing of this Current Report on Form 8-K, Platform posted financial presentation slides (the "Presentation Slides") relating to the 2016 Second Quarter Results. The Presentation Slides, which can be found in the Investor Relations section of Platform's website at www.platformspecialtyproducts.com under Events & Presentations, are attached hereto as Exhibit 99.2 and are incorporated herein by reference.
The furnishing of the Presentation Slides is not an admission as to the materiality of any information therein. The information contained in the slides is summary information that is intended to be considered in the context of more complete information included in Platform’s filings with the Securities and Exchange Commission (the “SEC”) and other public announcements that Platform has made and may make from time to time by press release or otherwise. Platform undertakes no duty or obligation to update or revise the information contained in this presentation, although it may do so from time to time as its management believes is appropriate. Any such updating may be made through the filing of other Current Reports or documents with the SEC, through press releases or through other public disclosures. For important information about forward looking statements, see the slide titled “Safe Harbor” in Exhibit 99.2 attached hereto.
The information in this Item 7.01 of this Current Report on Form 8-K and Exhibit 99.2 attached hereto shall not be deemed to be "filed" for purposes of Section 18 of the Exchange Act, or otherwise subject to the liabilities of that section. The information contained in this Item 7.01 and Exhibit 99.2 attached hereto shall not be incorporated by reference into any filing of Platform, whether made before or after the date hereof, regardless of any general incorporation language in such filing, unless expressly incorporated by specific reference to such filing.
Item 9.01. Financial Statements and Exhibits.
(d) Exhibits.
Exhibit Number | Exhibit Title |
99.1 | Press release dated August 8, 2016 relating to Platform's financial results for the three and six months ended June 30, 2016 (furnished only). |
99.2 | Presentation Slides relating to Platform's financial results for the three and six months ended June 30, 2016 (furnished only). |
SIGNATURE
Pursuant to the requirements of the Securities Exchange Act of 1934, the Registrant has duly caused this report to be signed on its behalf by the undersigned hereunto duly authorized.
PLATFORM SPECIALTY PRODUCTS CORPORATION | ||
(Registrant) | ||
August 8, 2016 | /s/ Sanjiv Khattri | |
(Date) | Sanjiv Khattri | |
Executive Vice President and Chief Financial Officer | ||
Exhibit Index
Exhibit Number | Exhibit Title |
99.1 | Press release dated August 8, 2016 relating to Platform's financial results for the three and six months ended June 30, 2016 (furnished only). |
99.2 | Presentation Slides relating to Platform's financial results for the three and six months ended June 30, 2016 (furnished only). |
EXHIBIT 99.1
Platform Specialty Products Corporation
Announces Second Quarter of 2016 Financial Results
• | Second quarter net sales of $922 million, an increase of 36.5% |
• | Reported net loss attributable to common stockholders of $9 million |
• | Second quarter GAAP EPS of $(0.04) |
• | Second quarter adjusted EBITDA* of $193 million, an increase of 15.0% |
• | Second quarter organic sales* increase of 1.4% |
• | Increasing lower-end of full year adjusted EBITDA* guidance to range of $735 million to $775 million |
West Palm Beach, Fla., August 8, 2016, Platform Specialty Products Corporation (NYSE: PAH) (“Platform” or the “Company”), a global, diversified specialty chemicals company, today announced its financial results for the second quarter and first half of 2016.
For the three months ended June 30, 2016:
• | Net sales on a reported basis for the second quarter of 2016 were $922 million, an increase of 36.5%. On a comparable basis over the second quarter of 2015, excluding the impact of currency changes and divestitures, organic sales increased 1.4% year-over-year; |
◦ | Performance Solutions segment: Net sales were $438 million, an increase of 141.3% compared to the same period of 2015. On a comparable basis, excluding the impact of currency changes, organic sales decreased 2.2% year-over-year; |
◦ | Agricultural Solutions segment: Net sales were $484 million, a decrease of 2.0% over the same period of 2015. On a comparable basis, excluding the impact of currency changes, organic sales increased 4.8% year-over-year; |
• | Reported net loss attributable to common stockholders was $9 million, compared to a net loss of $12 million for the same period in 2015. Diluted loss per share were $0.04 on a GAAP basis compared to a loss of $0.06 in the same period of 2015; |
• | Adjusted diluted earnings per share* were $0.16 compared to comparable adjusted diluted earnings per share of $0.25 in the same period of 2015; |
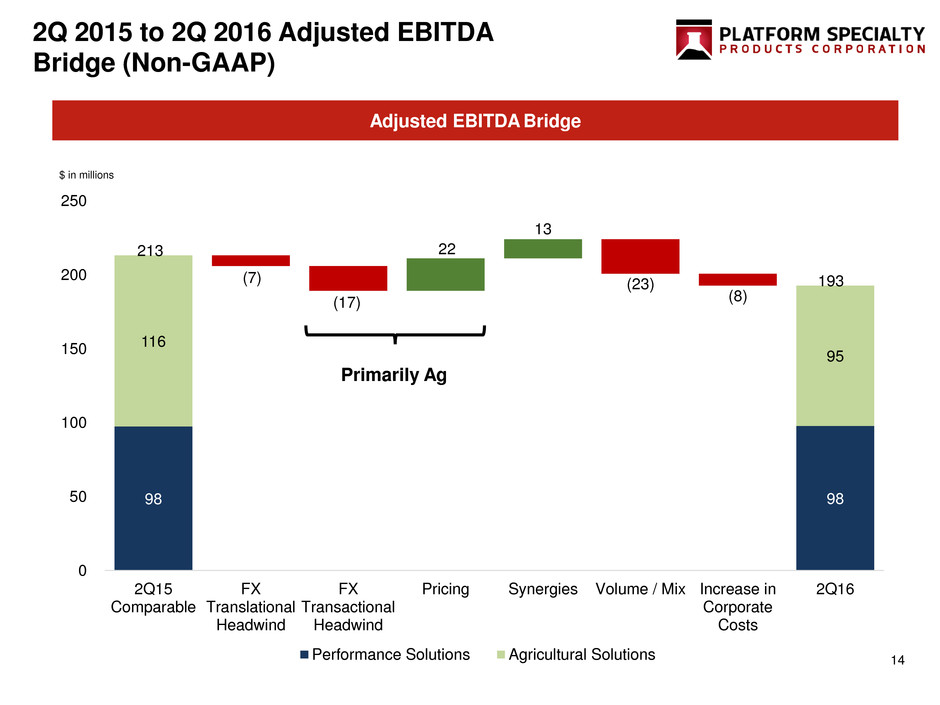
• | Adjusted EBITDA* for the second quarter of 2016 was $193 million, an increase of 15.0% on a reported basis and a decrease of 9.5% on a comparable basis over the second quarter of 2015. Adjusted EBITDA declined 6.1% on a comparable constant currency basis; |
◦ | Performance Solutions segment: Adjusted EBITDA* was $98 million, an increase of 0.4% from comparable adjusted EBITDA in the second quarter of 2015. On a comparable constant currency basis, adjusted EBITDA for this segment increased 4.3%; |
◦ | Agricultural Solutions segment: Adjusted EBITDA* was $95 million, a decline of 17.9% from comparable adjusted EBITDA in the second quarter of 2015. On a comparable constant currency basis, adjusted EBITDA for this segment decreased 14.9%; |
◦ | Overall Adjusted EBITDA margin was 20.9% compared to a reported margin of 24.9% in the second quarter of 2015 and a comparable constant currency margin of 22.4% in the second quarter of 2015; |
• | Additional cost synergies of $13 million were reported in the second quarter of 2016 from the ongoing integrations in the Agricultural Solutions and Performance Solutions segments. The business realized $25 million of new synergies in the first half of 2016 and remains on track to achieve an estimated $40 million of cost synergies in 2016. |
* See VI. Non-U.S. GAAP Measures.
CEO Comment
Chief Executive Officer Rakesh Sachdev said, “This was a strong quarter for Platform despite the weakness we are seeing in several of our end markets. Our businesses are demonstrating their resilience in these growth-starved times for our key industries.
The Ag business continues to post impressive growth outside of North America, and we have plans to stabilize our business in the United States where market conditions are challenging. The Performance business continues to demonstrate strong earnings growth despite a difficult electronics market, and our integrations of recently acquired companies are going well and ahead of schedule. We are half way through what has continued to be a challenging year, but I am happy to report that our businesses are performing well, and I am confident in our teams’ ability to improve our run-rate in the second half of 2016. Therefore, we have decided to increase the lower-end of our adjusted EBITDA guidance to a new range of $735 million to $775 million.”
Conference Call
Platform will host a webcast/dial-in conference call to discuss its second quarter of 2016 financial results at 8:30 a.m. (Eastern Time) on Monday, August 8, 2016. Participants on the call will include Rakesh Sachdev, Chief Executive Officer; Sanjiv Khattri, Chief Financial Officer; and Benjamin Gliklich, Executive Vice President - Operations and Strategy.
To listen to the call by telephone, please dial (855) 357-3116 (domestic) or (484) 365-2867 (international) and provide the Conference ID: 52247884. The call will be simultaneously webcast at www.platformspecialtyproducts.com. A replay of the webcast will be available for three weeks shortly after completion of the live call at www.platformspecialtyproducts.com.
About Platform
Platform is a global, diversified producer of high-technology specialty chemicals and provider of technical services. The business involves the formulation of a broad range of solutions-oriented specialty chemicals, which are sold into multiple industries, including agricultural, animal health, electronics, graphic arts, plating, and offshore oil and gas production and drilling. More information on Platform is available at www.platformspecialtyproducts.com.
Forward-Looking Statements
This release is intended to qualify for the safe harbor from liability established by the Private Securities Litigation Reform Act of 1995 as it contains "forward-looking statements" within the meaning of the federal securities laws, which include statements regarding Platform's adjusted EBITDA, adjusted diluted earnings per share, expected or estimated revenue, meeting financial goals, segment earnings, net interest expense, income tax provision, restructuring costs and other non-cash charges, the outlook for the Company's markets and the demand for its products, consistent profitable growth, free cash flows, full year cash taxes paid, capital expenditures, future revenues and gross, operating and EBITDA margin improvement requirement and expansion, performance trends, bank leverage ratios, the success of new product introductions, growth in costs and expenses, the impact of commodities costs and currencies, and the Company's ability to manage its risk in these areas, the Company’s ability to identify, hire and retain executives and other qualified employees, the Company’s assessment over its internal control over financial reporting, and the impact of acquisitions, divestitures, restructurings, and other unusual items, including the Company's ability to raise new debt and equity and to integrate and obtain the anticipated results and synergies from its consummated and future acquisitions. These projections and statements are based on management's estimates and assumptions with respect to future events and financial performance, and are believed to be reasonable, though are inherently difficult to predict. Actual results could differ materially from those projected as a result of certain factors. A discussion of factors that could cause results to vary is included in Platform's periodic and other reports filed with the Securities and Exchange Commission, including Platform's annual report on Form 10-K for the fiscal year ended December 31, 2015 and quarterly report on Form 10-Q for the three months ended March 31, 2016. Platform undertakes no obligation to update any forward-looking statements, whether as a result of new information, future events or otherwise.
-FINANCIAL TABLES TO FOLLOW-
2
PLATFORM SPECIALTY PRODUCTS CORPORATION
CONDENSED CONSOLIDATED STATEMENTS OF OPERATIONS
(Unaudited)
Three Months Ended June 30, | Six Months Ended June 30, | ||||||||||||||
(amounts in millions, except per share amounts) | 2016 | 2015 | 2016 | 2015 | |||||||||||
Net sales | $ | 922 | $ | 675 | $ | 1,745 | $ | 1,210 | |||||||
Cost of sales | 541 | 407 | 1,009 | 734 | |||||||||||
Gross profit | 381 | 269 | 737 | 476 | |||||||||||
Operating expenses: | |||||||||||||||
Selling, technical, general and administrative | 265 | 206 | 549 | 398 | |||||||||||
Research and development | 21 | 18 | 40 | 31 | |||||||||||
Total operating expenses | 286 | 225 | 590 | 430 | |||||||||||
Operating profit | 95 | 44 | 147 | 46 | |||||||||||
Other (expense) income: | |||||||||||||||
Interest expense, net | (97 | ) | (51 | ) | (191 | ) | (91 | ) | |||||||
Loss on derivative contracts | (5 | ) | (1 | ) | (11 | ) | (1 | ) | |||||||
Foreign exchange gain (loss) | 25 | (15 | ) | (46 | ) | 19 | |||||||||
Other income, net | 2 | 14 | 4 | 16 | |||||||||||
Total other expense | (76 | ) | (53 | ) | (244 | ) | (57 | ) | |||||||
Income (loss) before income taxes and non-controlling interests | 19 | (9 | ) | (97 | ) | (11 | ) | ||||||||
Income tax (expense) benefit | (27 | ) | — | (45 | ) | (25 | ) | ||||||||
Net loss | (8 | ) | (9 | ) | (142 | ) | (35 | ) | |||||||
Net income attributable to the non-controlling interests | (1 | ) | (3 | ) | (1 | ) | (4 | ) | |||||||
Net loss attributable to common stockholders | $ | (9 | ) | $ | (12 | ) | $ | (144 | ) | $ | (39 | ) | |||
Loss per share | |||||||||||||||
Basic | $ | (0.04 | ) | $ | (0.06 | ) | $ | (0.63 | ) | $ | (0.20 | ) | |||
Diluted | $ | (0.04 | ) | $ | (0.06 | ) | $ | (0.63 | ) | $ | (0.20 | ) | |||
Weighted average shares outstanding | |||||||||||||||
Basic | 230 | 193 | 230 | 192 | |||||||||||
Diluted | 230 | 193 | 230 | 192 | |||||||||||
3
PLATFORM SPECIALTY PRODUCTS CORPORATION
CONDENSED CONSOLIDATED BALANCE SHEETS
(Unaudited)
June 30, | December 31, | ||||||
(amounts in millions) | 2016 | 2015 | |||||
Assets | |||||||
Cash and cash equivalents | $ | 342 | $ | 432 | |||
Restricted cash | 1 | — | |||||
Accounts receivable, net of allowance for doubtful accounts of $24.2 and $14.4 at June 30, 2016 and December 31, 2015, respectively | 1,182 | 1,023 | |||||
Inventories | 573 | 518 | |||||
Note receivable | — | 125 | |||||
Prepaid expenses and other current assets | 171 | 173 | |||||
Total current assets | 2,268 | 2,271 | |||||
Property, plant and equipment, net | 480 | 492 | |||||
Goodwill | 4,370 | 4,022 | |||||
Intangible assets, net | 3,454 | 3,314 | |||||
Other assets | 99 | 92 | |||||
Total assets | $ | 10,672 | $ | 10,190 | |||
Liabilities & Stockholders' Equity | |||||||
Accounts payable | 394 | 450 | |||||
Current installments of long-term debt and revolving credit facilities | 162 | 55 | |||||
Accrued salaries, wages and employee benefits | 64 | 78 | |||||
Accrued income taxes payable | 76 | 65 | |||||
Accrued expenses and other current liabilities | 441 | 414 | |||||
Total current liabilities | 1,136 | 1,062 | |||||
Long-term debt and capital lease obligations | 5,187 | 5,174 | |||||
Long-term retirement benefits, less current portion | 76 | 81 | |||||
Long-term deferred income taxes | 734 | 679 | |||||
Long-term contingent consideration | 75 | 71 | |||||
Other long-term liabilities | 251 | 205 | |||||
Total liabilities | 7,458 | 7,271 | |||||
Commitments and contingencies (Note 15) | |||||||
Redeemable preferred stock - Series B | 646 | 646 | |||||
Stockholders' Equity | |||||||
Preferred stock - Series A | — | — | |||||
Common stock 400 shares authorized, 230 and 229 shares issued and outstanding at June 30, 2016 and December 31, 2015, respectively | 2 | 2 | |||||
Additional paid-in capital | 3,524 | 3,520 | |||||
Accumulated deficit | (676 | ) | (533 | ) | |||
Accumulated other comprehensive loss | (474 | ) | (886 | ) | |||
Total stockholders equity | 2,377 | 2,104 | |||||
Non-controlling interests | 191 | 169 | |||||
Total equity | 2,568 | 2,273 | |||||
Total liabilities, redeemable preferred shares and stockholders' equity | $ | 10,672 | $ | 10,190 | |||
4
PLATFORM SPECIALTY PRODUCTS CORPORATION
CONDENSED CONSOLIDATED STATEMENTS OF CASH FLOWS
(Unaudited)
Three Months Ended | Six Months Ended | ||||||||||||||||
(amounts in millions) | March 31, 2016 | June 30, 2016 | June 30, 2016 | June 30, 2015 | |||||||||||||
Cash flows from operating activities: | |||||||||||||||||
Net loss | $ | (134 | ) | $ | (8 | ) | $ | (142 | ) | $ | (35 | ) | |||||
Adjustment to reconcile net loss from operations to net cash flows (used in) provided by operating activities: | |||||||||||||||||
Depreciation and amortization | 83 | 85 | 168 | 114 | |||||||||||||
Deferred income taxes | (14 | ) | (10 | ) | (24 | ) | 18 | ||||||||||
Non-cash fair value adjustment to contingent consideration | 3 | 1 | 4 | 4 | |||||||||||||
Manufacturer's profit in inventory adjustment | 12 | — | 12 | 57 | |||||||||||||
Equity compensation expense | — | 3 | 3 | 3 | |||||||||||||
Foreign exchange loss (gain) | 62 | (28 | ) | 33 | (20 | ) | |||||||||||
Non-cash restructuring charges | 5 | (1 | ) | 4 | 5 | ||||||||||||
Impairment loss | 3 | — | 3 | — | |||||||||||||
Amortization of deferred financing costs | 5 | 2 | 7 | 5 | |||||||||||||
Provision for bad debts | 1 | 2 | 3 | 4 | |||||||||||||
Other, net | 4 | 1 | 5 | (3 | ) | ||||||||||||
Changes in assets & liabilities, net of acquisitions: | |||||||||||||||||
Accounts receivable | (103 | ) | 12 | (91 | ) | (102 | ) | ||||||||||
Inventories | (87 | ) | 45 | (41 | ) | (41 | ) | ||||||||||
Accounts payable and accrued expenses | (53 | ) | (15 | ) | (68 | ) | 80 | ||||||||||
Other changes in assets and liabilities, net | 4 | 8 | 12 | 13 | |||||||||||||
Net cash flows (used in) provided by operating activities | (210 | ) | 97 | (113 | ) | 100 | |||||||||||
Cash flows from investing activities: | |||||||||||||||||
Change in restricted cash | (1 | ) | — | (1 | ) | 600 | |||||||||||
Capital expenditures | (12 | ) | (11 | ) | (23 | ) | (29 | ) | |||||||||
Investment in registrations of products | (8 | ) | (8 | ) | (15 | ) | (15 | ) | |||||||||
Proceeds from disposal of property, plant and equipment | 2 | 10 | 12 | — | |||||||||||||
Derivative payments | (1 | ) | (3 | ) | (5 | ) | — | ||||||||||
Acquisition of businesses, net of acquired cash | (1 | ) | 3 | 1 | (2,857 | ) | |||||||||||
Other, net | — | — | (1 | ) | — | ||||||||||||
Net cash flows used in investing activities | (20 | ) | (10 | ) | (30 | ) | (2,301 | ) | |||||||||
Cash flows from financing activities: | |||||||||||||||||
Debt proceeds (payments), net of discount and premium | 1 | (2 | ) | (1 | ) | 2,083 | |||||||||||
Change in revolving credit facilities, net | 133 | (28 | ) | 104 | 7 | ||||||||||||
Repayments of borrowings | (9 | ) | (9 | ) | (17 | ) | (10 | ) | |||||||||
Proceeds from issuance of common stock, net | — | — | — | 469 | |||||||||||||
Payment of debt financing fees | — | (1 | ) | (1 | ) | (46 | ) | ||||||||||
Change in factored liabilities | (4 | ) | (33 | ) | (37 | ) | (19 | ) | |||||||||
Other, net | (1 | ) | — | (1 | ) | (1 | ) | ||||||||||
Net cash flows provided by (used in) financing activities | 121 | (73 | ) | 48 | 2,484 | ||||||||||||
Effect of exchange rate changes on cash and cash equivalents | 7 | (2 | ) | 6 | (9 | ) | |||||||||||
Net (decrease) increase in cash and cash equivalents | (103 | ) | 12 | (91 | ) | 275 | |||||||||||
Cash and cash equivalents at beginning of period | 432 | 330 | 432 | 397 | |||||||||||||
Cash and cash equivalents at end of period | $ | 330 | $ | 342 | $ | 342 | $ | 672 | |||||||||
Non-cash Investing Activities | |||||||||||||||||
Settlement of Note Receivable in exchange for OMG Malaysia | $ | 125 | $ | — | $ | 125 | $ | — | |||||||||
Acquisition of OMG Malaysia through the settlement of Note Receivable | $ | (125 | ) | $ | — | $ | (125 | ) | $ | — | |||||||
5
PLATFORM SPECIALTY PRODUCTS CORPORATION
RECONCILIATION OF NET LOSS ATTRIBUTABLE TO COMMON STOCKHOLDERS TO
COMPARABLE ADJUSTED DILUTED EARNINGS PER SHARE
(Unaudited)
Three Months Ended | Six Months Ended | |||||||||||||||
(amounts in millions, except per share amounts) | June 30, 2016 | June 30, 2015 | June 30, 2016 | June 30, 2015 | ||||||||||||
Net loss attributable to common stockholders | $ | (9 | ) | $ | (12 | ) | $ | (144 | ) | $ | (39 | ) | ||||
Pre-acquisition activity of acquired companies: | (1) | |||||||||||||||
Net sales | — | 276 | — | 638 | ||||||||||||
Cost of sales | — | (165 | ) | — | (385 | ) | ||||||||||
Selling, technical, general and administrative expense | — | (69 | ) | — | (174 | ) | ||||||||||
Research and development expense | — | (8 | ) | — | (20 | ) | ||||||||||
Other income | — | 4 | — | 5 | ||||||||||||
— | 38 | — | 64 | |||||||||||||
Adjustments: | ||||||||||||||||
Interest expense for pre-acquisition periods | (1) | — | (35 | ) | — | (82 | ) | |||||||||
Reversal of amortization expense | (1, 2) | 67 | 54 | 131 | 104 | |||||||||||
Adjustment for investment in registration of products | (1, 2) | (8 | ) | (6 | ) | (15 | ) | (15 | ) | |||||||
Long-term compensation issued in connection with acquisitions | (3) | — | — | — | 2 | |||||||||||
Restructuring expenses | (4) | 7 | 14 | 12 | 16 | |||||||||||
Manufacturer's profit in inventory purchase accounting adjustments | (5) | — | 21 | 12 | 57 | |||||||||||
Acquisition and integration costs | (6) | 5 | 24 | 24 | 55 | |||||||||||
Non-cash change in fair value of contingent consideration | (7) | 1 | 1 | 4 | 4 | |||||||||||
Foreign exchange (gain) loss on foreign denominated external and internal debt | (1, 8) | (19 | ) | 18 | 47 | (6 | ) | |||||||||
Gain on legal settlement | (3 | ) | (16 | ) | (3 | ) | (16 | ) | ||||||||
Other expenses (income) | (9) | — | — | 3 | (3 | ) | ||||||||||
Adjustment to estimated effective tax rate | (10) | 3 | (36 | ) | 4 | (35 | ) | |||||||||
Adjustment to reverse (loss) income attributable to non-controlling interests resulting from the MacDermid acquisition | (11) | (2 | ) | 2 | (3 | ) | 1 | |||||||||
51 | 41 | 216 | 82 | |||||||||||||
Comparable adjusted net income attributable to common stockholders | $ | 43 | $ | 66 | $ | 73 | $ | 108 | ||||||||
Comparable adjusted diluted earnings per share | (12) | $ | 0.16 | $ | 0.25 | $ | 0.27 | $ | 0.41 | |||||||
Adjusted shares outstanding (in millions) | 266 | 266 | 266 | 266 | ||||||||||||
(1) The Company adjusts for the results of operations of Alent plc ("Alent") and businesses of OM Group, Inc. (the "OMG Businesses"), prior to their acquisition, adjusted to conform with the Company’s accounting policies and adjustments described herein, in order to facilitate comparison against prior and future results. The Company also adjusts interest expense to represent the additional interest expense that the Company would have incurred had the acquisition-related debt had occurred at the beginning of the periods presented in order to be consistent with the inclusion of the results of operations.
(2) The Company eliminates amortization related to (i) intangible assets recognized in purchase accounting for acquisitions and (ii) costs capitalized in connection with obtaining regulatory approval of its products (“registration rights”) as part of ongoing operations, and deducts capital expenditures associated with obtaining these registration rights. The Company believes this adjustment provides insight to the cash flows necessary to maintain and enhance the Company's product portfolio.
(3) Adjustment for the portion of long-term compensation plans associated with the acquisitions of Alent (the "Alent Acquisition") and the OMG Businesses (the "OMG Acquisition," and together with the Alent Acquisition, the "Performance Solutions Acquisitions") for 2016 and the acquisitions of Arysta LifeScience Limited (the "Arysta Acquisition") and the Chemtura AgroSolutions business of Chemtura Corporation (the "CAS Acquisition," and together with the Arysta Acquisition, the "Agricultural Solutions Acquisitions") for 2015. The Company adjusts these costs because they are not reflective of ongoing operations. The Company does not adjust for the cost of non-acquisition related ongoing long-term compensation plans.
NOTE: Totals may not foot due to rounding | 6 | |
(4) Adjusted for cost of restructuring acquired businesses in both the Agricultural Solutions and Performance Solutions segments. The Company adjusts these costs because they are not reflective of ongoing operations.
(5) Adjustment for purchase accounting fair value adjustment to inventory associated with acquisitions charged to cost of sales primarily related to the Performance Solutions Acquisitions in 2016 and the Agricultural Solutions Acquisitions in 2015. The Company adjusts these costs because they are not reflective of ongoing operations.
(6) The Company adjusts for costs associated with acquisitions, including costs of obtaining related financing such as investment banking, legal, and accounting fees; and transfer taxes for 2016 and 2015. 2016 adjustment also includes the costs associated with an investigation related to certain past business practices of Arysta, an acquired company, and costs of integrating acquisitions. 2015 also includes a bonus paid to a member of management of an acquired company related to the completion the Arysta Acquisition. The Company adjusts these costs because they are not reflective of ongoing operations.
(7) The Company adjusts for the change in fair value of the contingent consideration in connection with the acquisition of MacDermid, Incorporated (the "MacDermid Acquisition"). The Company adjusts these costs because they are not reflective of ongoing operations.
(8) The Company adjusts foreign exchanges gains and losses on intercompany and third-party long-term debt because these currencies are out of its control, are expected to offset on a long-term basis and, due to their long-term nature, are not fully realized. The Company does not exclude foreign exchange gains and losses on short-term intercompany and third-party payables and receivables with third parties.
(9) 2016 adjustment primarily corresponds to the write down of certain fixed assets. 2015 adjustment reflects the gain related to the expiration of a put option on Platform's common stock issued in connection with an acquisition during 2014. The Company adjusts these costs because they are not reflective of ongoing operations.
(10) The Company adjusts the effective tax rate to 35%. This adjustment does not reflect the Company’s current or near-term tax structure, including limitations on its ability to utilize net operating losses and foreign tax credits in certain jurisdictions. These factors would increase the effective tax rate above 35%. As a result of current tax structure, the Company’s effective tax rate in accordance with GAAP was 143.1% for the three months ended June 30, 2016, and the Company's paid cash income taxes amounted to $28.0 million. The Company adjusts to the effective tax rate to provide a meaningful comparison of its performance between periods.
(11) The Company adjusts for the non-controlling interest expense or income related to the non-controlling interest created at the time of the MacDermid Acquisition because holders of such equity interest are expected to convert their holdings into shares of Platform's common stock. The Company adjusts these costs because they are not reflective of ongoing operations.
(12) The Company defines "Adjusted Diluted Shares" as the outstanding shares of Platform's common stock at June 30, 2016 plus the number of shares that would be issued if convertible stock were converted to Platform's common stock, vested stock options were exercised, and all awarded equity granted were vested as of June 30, 2016. The Company adjusts the outstanding shares of Platform's common stock for this calculation to provide an understanding of the Company’s results of operations on a per share basis.
PLATFORM SPECIALTY PRODUCTS CORPORATION
CALCULATION OF NON-GAAP ADJUSTED DILUTED SHARES AT JUNE 30, 2016
(Unaudited)
Outstanding shares (millions) | 230 | |
Number of shares issuable upon conversion of Series B Convertible Preferred Stock | 22 | |
Number of shares issuable upon conversion of PDH Common Stock | 8 | |
Number of shares issuable upon conversion of Series A Preferred Stock | 2 | |
Stock options | 1 | |
Equity awards granted | 4 | |
Adjusted Diluted shares | 266 | |
NOTE: Totals may not foot due to rounding | 7 | |
PLATFORM SPECIALTY PRODUCTS CORPORATION
RECONCILIATION OF ADJUSTED NET INCOME ATTRIBUTABLE TO COMMON STOCKHOLDERS TO
COMPARABLE ADJUSTED EBITDA
(Unaudited)
Three Months Ended June 30, | Six Months Ended June 30, | ||||||||||||||
(amounts in millions) | 2016 | 2015 | 2016 | 2015 | |||||||||||
Comparable adjusted net income attributable to common stockholders | $ | 43 | $ | 66 | $ | 73 | $ | 108 | |||||||
Net income attributable to the non-controlling interests | 2 | 1 | 4 | 2 | |||||||||||
Adjusted net income attributable to stockholders | 45 | 67 | 77 | 111 | |||||||||||
Adjustments to reconcile to comparable adjusted EBITDA: | |||||||||||||||
Income tax expense | 24 | 36 | 41 | 60 | |||||||||||
Interest expense, net | 97 | 86 | 191 | 172 | |||||||||||
Depreciation expense | 19 | 18 | 37 | 33 | |||||||||||
Investment in registration of products | 8 | 6 | 15 | 15 | |||||||||||
Comparable Adjusted EBITDA | $ | 193 | $ | 213 | $ | 361 | $ | 392 | |||||||
PLATFORM SPECIALTY PRODUCTS CORPORATION
RECONCILIATION OF NET LOSS ATTRIBUTABLE TO COMMON STOCKHOLDERS TO ADJUSTED EBITDA
(Unaudited)
Three Months Ended June 30, | Six Months Ended June 30, | |||||||||||||||
(amounts in millions) | 2016 | 2015 | 2016 | 2015 | ||||||||||||
Net loss attributable to common stockholders | $ | (9 | ) | $ | (12 | ) | $ | (144 | ) | $ | (39 | ) | ||||
Net income attributable to the non-controlling interests | 1 | 3 | 1 | 4 | ||||||||||||
Income tax expense | 27 | — | 45 | 25 | ||||||||||||
Net income (loss) before income taxes and non-controlling interests | 19 | (9 | ) | (97 | ) | (11 | ) | |||||||||
Adjustments to reconcile to Adjusted EBITDA: | ||||||||||||||||
Interest expense, net | 97 | 51 | 191 | 91 | ||||||||||||
Depreciation expense | 19 | 14 | 37 | 22 | ||||||||||||
Amortization expense | 67 | 53 | 131 | 92 | ||||||||||||
Long-term compensation issued in connection with acquisitions | (3) | — | — | — | 2 | |||||||||||
Restructuring expenses | (4) | 7 | 12 | 12 | 14 | |||||||||||
Manufacturer's profit in inventory purchase accounting adjustments | (5) | — | 21 | 12 | 57 | |||||||||||
Acquisition and integration costs | (6) | 5 | 24 | 24 | 55 | |||||||||||
Non-cash change in fair value of contingent consideration | (7) | 1 | 1 | 4 | 4 | |||||||||||
Legal settlements | (3 | ) | (16 | ) | (3 | ) | (16 | ) | ||||||||
Foreign exchange gains (losses) on foreign denominated external and internal debt | (8) | (19 | ) | 18 | 47 | (6 | ) | |||||||||
Other expense (income) | (9) | — | — | 3 | (3 | ) | ||||||||||
Adjusted EBITDA* | $ | 193 | $ | 168 | $ | 361 | $ | 300 | ||||||||
* See footnote descriptions below the Comparable Adjusted Diluted Earnings Per Share table.
NOTE: Totals may not foot due to rounding | 8 | |
PLATFORM SPECIALTY PRODUCTS CORPORATION
RECONCILIATION OF ORGANIC SALES GROWTH
(Unaudited)
Three Months Ended June 30, 2016 | ||||||||||||||||||||
(amounts in millions) | Performance Solutions | Agricultural Solutions | Total | |||||||||||||||||
Change in net comparable sales | $ | (20 | ) | (4.3 | )% | $ | (10 | ) | (2.1 | )% | $ | (30 | ) | (3.1 | )% | |||||
Dispositions | — | — | 9 | 1.9 | 9 | 1.0 | ||||||||||||||
Foreign exchange impacts | 10 | 2.3 | 24 | 5.0 | 34 | 3.7 | ||||||||||||||
Impact of metal prices | (1 | ) | (0.2 | ) | — | — | (1 | ) | (0.1 | ) | ||||||||||
Organic sales growth | $ | (10 | ) | (2.2 | )% | $ | 23 | 4.8 | % | $ | 13 | 1.4 | % | |||||||
Six Months Ended June 30, 2016 | ||||||||||||||||||||
(amounts in millions) | Performance Solutions | Agricultural Solutions | Total | |||||||||||||||||
Change in net comparable sales | $ | (55 | ) | (6.0 | )% | $ | (48 | ) | (5.2 | )% | $ | (103 | ) | (5.6 | )% | |||||
Acquisitions | 3 | 0.3 | — | — | 3 | 0.2 | ||||||||||||||
Dispositions | — | — | 14 | 1.6 | 14 | 0.8 | ||||||||||||||
Foreign exchange impacts | 27 | 3.0 | 57 | 6.1 | 84 | 4.6 | ||||||||||||||
Impact of metal prices | 7 | 0.8 | — | — | 7 | 0.4 | ||||||||||||||
Organic sales growth | $ | (18 | ) | (2.0 | )% | $ | 23 | 2.5 | % | $ | 5 | 0.3 | % | |||||||
NOTE: Totals may not foot due to rounding | 9 | |
PLATFORM SPECIALTY PRODUCTS CORPORATION
ADDITIONAL FINANCIAL INFORMATION
(Unaudited)
I. | Unaudited Financial Performance | ||||||||||||||
Three Months Ended June 30, | Six Months Ended June 30, | ||||||||||||||
(amounts in millions) | 2016 | 2015 | 2016 | 2015 | |||||||||||
Revenue | |||||||||||||||
Performance Solutions | $ | 438 | $ | 182 | $ | 858 | $ | 362 | |||||||
Agricultural Solutions | 484 | 494 | 887 | 848 | |||||||||||
Total | $ | 922 | $ | 675 | $ | 1,745 | $ | 1,210 | |||||||
Adjusted EBITDA | |||||||||||||||
Performance Solutions | $ | 98 | $ | 54 | $ | 181 | $ | 103 | |||||||
Agricultural Solutions | 95 | 114 | 181 | 197 | |||||||||||
Total | $ | 193 | $ | 168 | $ | 361 | $ | 300 | |||||||
Adjusted EBITDA Margin | |||||||||||||||
Performance Solutions | 22.4 | % | 29.8 | % | 21.1 | % | 28.4 | % | |||||||
Agricultural Solutions | 19.6 | % | 23.1 | % | 20.3 | % | 23.2 | % | |||||||
Total | 20.9 | % | 24.9 | % | 20.7 | % | 24.8 | % | |||||||
II. | Unaudited Comparable Financial Performance | ||||||||||||||
Three Months Ended June 30, | Six Months Ended June 30, | ||||||||||||||
(amounts in millions) | 2016 | 2015 | 2016 | 2015 | |||||||||||
Revenue | |||||||||||||||
Performance Solutions | $ | 438 | $ | 458 | $ | 858 | $ | 913 | |||||||
Agricultural Solutions | 484 | 494 | 887 | 936 | |||||||||||
Total | $ | 922 | $ | 951 | $ | 1,745 | $ | 1,848 | |||||||
Adjusted EBITDA | |||||||||||||||
Performance Solutions | $ | 98 | $ | 98 | $ | 181 | $ | 187 | |||||||
Agricultural Solutions | 95 | 116 | 181 | 205 | |||||||||||
Total | $ | 193 | $ | 213 | $ | 361 | $ | 392 | |||||||
Adjusted EBITDA Margin | |||||||||||||||
Performance Solutions | 22.4 | % | 21.3 | % | 21.1 | % | 20.5 | % | |||||||
Agricultural Solutions | 19.6 | % | 23.4 | % | 20.3 | % | 21.9 | % | |||||||
Total | 20.9 | % | 22.4 | % | 20.7 | % | 21.2 | % | |||||||
NOTE: Totals may not foot due to rounding | 10 | |
PLATFORM SPECIALTY PRODUCTS CORPORATION
ADDITIONAL FINANCIAL INFORMATION (continued)
(Unaudited)
III. | Unaudited Comparable Constant Currency Financial Performance | ||||||||||||||
Three Months Ended June 30, | Six Months Ended June 30, | ||||||||||||||
(amounts in millions) | 2016 | 2015 | 2016 | 2015 | |||||||||||
Revenue | |||||||||||||||
Performance Solutions | $ | 448 | $ | 458 | $ | 885 | $ | 913 | |||||||
Agricultural Solutions | 508 | 494 | 944 | 936 | |||||||||||
Total | $ | 956 | $ | 951 | $ | 1,829 | $ | 1,848 | |||||||
Adjusted EBITDA | |||||||||||||||
Performance Solutions | $ | 102 | $ | 98 | $ | 189 | $ | 187 | |||||||
Agricultural Solutions | 99 | 116 | 190 | 205 | |||||||||||
Total | $ | 200 | $ | 213 | $ | 379 | $ | 392 | |||||||
Adjusted EBITDA Margin | |||||||||||||||
Performance Solutions | 22.7 | % | 21.3 | % | 21.3 | % | 20.5 | % | |||||||
Agricultural Solutions | 19.4 | % | 23.4 | % | 20.1 | % | 21.9 | % | |||||||
Total | 20.9 | % | 22.4 | % | 20.7 | % | 21.2 | % | |||||||
IV. | Unaudited Capital Structure | ||||||
(amounts in millions) | Maturity | Coupon | June 30, 2016 | ||||
Instrument | |||||||
Corporate Revolver ($500M) | 6/7/2019 | $ | 90 | ||||
Term Loan - USD (1) | 6/7/2020 | L + 450 | 2,684 | ||||
Term Loan - EUR (1) | 6/7/2020 | L + 450 | 645 | ||||
Other Debt | 52 | ||||||
Total First Lien Debt | $ | 3,471 | |||||
10.375% Senior Notes due 2021 | 5/1/2021 | 10.375% | 500 | ||||
6.5% Senior Notes due 2022 | 2/1/2022 | 6.5% | 1,100 | ||||
6.0% Senior Notes due 2023 (Euro) | 2/1/2023 | 6.0% | 389 | ||||
Total Unsecured Debt | $ | 1,989 | |||||
Total Debt | $ | 5,460 | |||||
Cash Balance as of 6/30/16 | $ | 342 | |||||
Net Debt | $ | 5,118 | |||||
Series B Make-Whole (2) | $ | 404 | |||||
Shares Outstanding (3) | 266 | ||||||
Market Capitalization (4) | $ | 2,362 | |||||
Total Capitalization | $ | 7,884 | |||||
(1) | Platform has swapped certain amounts of its floating term loans to fixed rate including $1.2 billion of its USD tranches and €283 million of its Euro tranches. At June 30, 2016, approximately 36% of debt was floating and 64% was fixed. | ||||||
(2) | Includes only the potential make-whole “cash” component of the Series B Convertible Preferred Stock as of June 30, 2016. Potential make-whole calculation: ($27.14 – Platform's closing price of $8.88 at June 30, 2016) X 22.1 million shares. | ||||||
(3) | 266 million shares outstanding at June 30, 2016 on a comparable fully diluted basis, including 22.1 million shares related to the Series B Convertible Preferred Stock. | ||||||
(4) | Based on Platform's closing price of $8.88 at June 30, 2016. | ||||||
NOTE: Totals may not foot due to rounding | 11 | |
PLATFORM SPECIALTY PRODUCTS CORPORATION
ADDITIONAL FINANCIAL INFORMATION (continued)
(Unaudited)
V. | Selected Financial Data | |||||||
(amounts in millions) | Three Months Ended June 30, 2016 | Six Months Ended June 30, 2016 | ||||||
Book Interest Expense | $ | 99 | $ | 195 | ||||
Cash Interest Expense | 83 | 183 | ||||||
Book Income Tax Expense | 27 | 45 | ||||||
Cash Income Taxes Paid | 28 | 54 | ||||||
Capital Expenditures | 11 | 23 | ||||||
Investments in Product Registrations | 8 | 15 | ||||||
VI. Non-U.S. GAAP Measures
For purposes of Regulation G, a non-U.S. GAAP financial measure is a numerical measure of a company’s historical or future financial performance, financial position or cash flows that excludes amounts, or is subject to adjustments that have the effect of excluding amounts, that are included in the most directly comparable measure calculated and presented in accordance with U.S. GAAP in the statements of operations, balance sheets, or statements of cash flows of the company; or includes amounts, or is subject to adjustments that have the effect of including amounts, that are excluded from the most directly comparable measure so calculated and presented.
To supplement the financial measures prepared in accordance with U.S. GAAP, Platform has provided in this release the following non-U.S. GAAP financial measures: comparable adjusted diluted earnings per share, comparable sales, adjusted EBITDA, comparable adjusted EBITDA, and organic sales. We also evaluate and present our results of operations on a constant currency and comparable constant currency basis. Management believes that these measures provide useful information to investors by excluding certain items that it believes are not representative of the Company's business and including other items that it believes are useful in evaluating the Company's business; thereby providing a more complete understanding of the Company's operational results and a meaningful comparison of the Company's performance between periods and to its peers. When reconciled to the corresponding U.S. GAAP measures, these non-U.S. GAAP measures also help the Company's investors to understand the long-term profitability trends of its businesses. Finally, these non-U.S. GAAP measures address questions the Company routinely receives from securities analysts, investors and other interested parties in the evaluation of companies in our industry and, in order to assure that all investors have access to the same data, the Company has determined that it is appropriate to make this data available to all. Non-U.S. GAAP financial measures are however not prepared in accordance with GAAP, as they exclude certain items as described herein, and may not be indicative of the results that the Company expects to recognize for future periods. In addition, these non-U.S. GAAP financial measures may differ from measures that other companies may use. As a result, these non-U.S. GAAP financial measures should be considered in addition to, and not a substitute for, financial information prepared in accordance with U.S. GAAP. Investors are encouraged to review the reconciliation of these non-U.S. GAAP measures to their most directly comparable U.S. GAAP financial measure.
A reconciliation of U.S. GAAP to non-U.S. GAAP financial measures has been provided in the financial tables as part of this release. The Company only provides guidance on a non-GAAP basis and does not provide reconciliations of such forward-looking non-GAAP measure to GAAP, due to the inherent difficulty in forecasting and quantifying certain amounts that are necessary for such reconciliations, including adjustments that could be made for restructuring, integration and acquisition-related expenses, share-based compensation amounts, adjustments to inventory and other charges reflected in our reconciliation of historic numbers, the amount of which, based on historical experience, could be significant.
Comparable Sales
Comparable sales is defined as sales adjusted for the sales of our acquisitions as if they had occurred on January 1, 2015. Management believes this measure provides investors with a more complete understanding of sales trends by providing sales on a more consistent basis.
NOTE: Totals may not foot due to rounding | 12 | |
Organic Sales
Organic sales is defined as comparable sales excluding the impact of currency, metals price, divestitures and acquisitions, as applicable. Management believes this measure provides investors with a more complete understanding of the underlying sales trends by providing comparable sales over differing periods on a consistent basis.
Constant Currency and Comparable Constant Currency
Our constant currency presentation excludes the impact of fluctuations in foreign currency exchange rates. We believe providing constant currency information provides valuable supplemental information regarding our results of operations, consistent with how we also evaluate our performance. We calculate constant currency percentages by converting our current-period local currency financial results into U.S. Dollar using the prior period's exchange rates and comparing these adjusted amounts to our prior period reported results. The comparable constant currency presentation includes actual results adjusted to reflect acquisitions and related financings as though they had occurred on January 1, 2015 adjusted for the effects of purchase accounting on actual results. Management believes that this presentation provides a more complete understanding of the Company's operational results and a meaningful comparison of its performance between periods. However, this comparable financial information is provided for informational purposes only and is not necessarily, and should not be assumed to be, an indication of the results that would have been achieved had the Company’s acquisitions been completed as of the dates indicated, or that may be achieved in the future.
Adjusted EBITDA and Comparable Adjusted EBITDA
Adjusted EBITDA is defined as earnings before interest, taxes, depreciation and amortization, as further adjusted for additional items included in earnings that are not representative or indicative of our ongoing business as described in the footnotes to the non-GAAP measures reconciliations. Comparable adjusted EBITDA is defined as Adjusted EBITDA adjusted to reflect acquisitions and the related financings as though they had occurred on January 1, 2015 without the impact of purchase accounting. Adjusted EBITDA and comparable adjusted EBITDA are key metrics used by management to measure operating performance and trends. In particular, the exclusion of certain expenses in calculating adjusted EBITDA and comparable adjusted EBITDA facilitates operating performance comparisons on a period-to-period basis.
Comparable Adjusted Diluted Earnings Per Share
Comparable adjusted diluted earnings per share is defined as net loss attributable to common stockholders adjusted to reflect acquisitions and the related financings as though they had occurred on January 1, 2015 without the impact of purchase accounting, as well as other adjustments consistent with our definition of Adjusted EBITDA. Additionally, we eliminate the amortization associated with (i) intangibles assets recognized in purchase accounting for acquisitions and (ii) costs capitalized in connection with obtaining regulatory approval of our products (“registration rights”) as part of ongoing operations and deduct capital expenditures associated with obtaining these registration rights. Further, we adjust the effective tax rate to 35% as described in the notes to the reconciliation. The resulting comparable adjusted net income available to stockholders is divided by the number of shares of outstanding common stock as of June 30, 2016 plus the number of shares that would be issued if convertible stock were converted to common stock, vested stock options were exercised, and all awarded equity granted were vested as of June 30, 2016. Comparable adjusted diluted earnings per share is a key metric used by management to measure operating performance and trends. In particular, the exclusion of certain expenses in calculating comparable adjusted diluted earnings per share facilitates operating performance comparisons on a period-to-period basis.
CONTACT:
Investor Relations Contact:
Carey Dorman
Director - Corporate Development
Platform Specialty Products Corporation
1-561-406-8465
Media Contact:
Liz Cohen
Weber Shandwick
1-212-445-8044
13

Second Quarter 2016
August 8, 2016

2
Safe Harbor
Please note that in this presentation, we may discuss events or results that have not yet occurred or been realized, commonly referred
to as forward-looking statements. The Private Securities Litigation Reform Act of 1995 provides a safe harbor for forward-looking
statements made by or on behalf of the Company. Such discussion and statements will often contain words such as “expect,”
“anticipate,” “believe,” “intend,” “plan” and “estimate,” and include, without limitations, statements regarding the Company's adjusted
EBITDA and adjusted diluted earnings per share, expected or estimated revenue, meeting financial goals, segment earnings, net
interest expense, income tax provision, cash flow from operations, full year cash taxes, capital expenditures, restructuring costs and
other non-cash charges, the outlook for the Company's markets and the demand for its products, consistent profitable growth, free
cash flows, future revenues, gross, operating and EBITDA margin requirements and expansion, organic net sales growth, performance
trends, bank leverage ratios, the success of new product introductions, growth in costs and expenses, the impact of commodities and
currencies costs, the Company's ability to manage its risk in these areas, the Company’s ability to identify, hire and retain executives
and other qualified employees, the Company’s assessment over its internal control over financial reporting, and the impact of
acquisitions, divestitures, restructurings, and other unusual items, including the Company's ability to raise new debt and equity and to
integrate and obtain the anticipated results and synergies from its consummated acquisitions. These projections and statements are
based on management's estimates and assumptions with respect to future events and financial performance and are believed to be
reasonable, though are inherently uncertain and difficult to predict. Actual results could differ materially from those projected as a result
of certain factors. A discussion of factors that could cause results to vary is included in the Company's periodic and other reports filed
with the Securities and Exchange Commission. The Company undertakes no obligation to update any forward-looking statement,
whether as a result of new information, future events or otherwise.
This presentation also contains unaudited “comparable” financial information which assumes full period contribution of Alent plc and
the Electronic Chemicals and Photomasks businesses of OM Group, Inc. acquired in Q4 2015; and OMG Electronic Chemicals (M)
SdnBhd acquired in 2016. This combined information is provided for informational purposes only and is not necessarily, and should
not be assumed to be, an indication of the results that would have been achieved had the Company’s acquisitions been completed as
of the dates indicated, or that may be achieved in the future. Historical financial results and information included herein relating to
these acquired businesses were derived from public filings, when applicable, and/or information provided by management of these
businesses prior to their acquisitions by the Company. Although we believe it is reliable, this information has not been verified,
internally or independently. In addition, financial information for some of these acquired businesses was historically prepared in
accordance with non-GAAP accounting methods, and may or may not be comparable to the Company’s financial statements.
Consequently, there is no assurance that the financial results and information for these legacy businesses included herein are
accurate or complete, or representative in any way of the Company’s actual or future results as a consolidated company.

3
Non-GAAP Information
To supplement the financial measures prepared in accordance with generally accepted accounting principles in the United States
(“GAAP”), the Company uses the following non-GAAP financial measures: comparable adjusted diluted earnings per share,
comparable sales, adjusted EBITDA, adjusted EBITDA margin, adjusted EBITDA guidance, comparable adjusted EBITDA,
comparable adjusted EBITDA margin and organic sales. The Company also evaluates and presents its results of operations on a
constant currency and comparable constant currency basis.
The reconciliations of these non-GAAP measures to the most directly comparable financial measures calculated and presented in
accordance with GAAP can be found in this presentation and the tables included in the Company’s earnings release dated August 8,
2016 (the “earnings release”), a copy of which can be found on the Company’s website at www.platformspecialtyproducts.com. This
presentation should be read in conjunction with the earnings release. The Company only provides guidance on a non-GAAP basis and
does not provide reconciliations of such forward-looking non-GAAP measure to GAAP, due to the inherent difficulty in forecasting and
quantifying certain amounts that are necessary for such reconciliations, including adjustments that could be made for restructuring,
integration and acquisition-related expenses, share-based compensation amounts, adjustments to inventory and other charges
reflected in our reconciliation of historic numbers, the amount of which, based on historical experience, could be significant.
Management uses these non-GAAP measures as key metrics in the monitoring and evaluation of the Company’s performance and
consolidated financial results and, in part, in the determination of cash bonuses for its executive officers. The Company believes that
these non-GAAP measures provide useful information to investors by excluding certain items that we believe are not representative of
the Company’s business and including other items that the Company believes are useful in evaluating its business; thereby providing a
more complete understanding of the Company’s operational results and a meaningful comparison of the Company’s performance
between periods and to its peers. When reconciled to the corresponding GAAP measures, these non-GAAP measures also help our
investors to understand the long-term profitability trends of our businesses. Finally, these non-GAAP measures address questions the
Company routinely receives from securities analysts, investors and other interested parties in the evaluation of companies in our
industry and, in order to assure that all investors have access to similar data, the Company has determined that it is appropriate to
make this data available to all. Non-GAAP financial measures are however not prepared in accordance with GAAP, as they exclude
certain items as described herein, and may not be indicative of the results that the Company expects to recognize for future periods. In
addition, these non-GAAP financial measures may differ from measures that other companies may use. As a result, these non-GAAP
financial measures should be considered in addition to, and not a substitute for, financial information prepared in accordance with
GAAP. Investors are encouraged to review the reconciliation of these non-GAAP measures to their most directly comparable GAAP
financial measure included herein and in the earnings release.
Please see the Appendix to this presentation for a more detailed description of each non-GAAP financial measure used by the
Company, including the adjustments reflected in each such non-GAAP measure and the reason why we believe such non-GAAP
measures are useful to investors.

4
Q2 2016 Highlights
1. Comparable, on this chart and subsequent charts, assumes full period contribution of all businesses acquired in 2015 and 2016
2. Constant currency, on this chart and subsequent charts, refers to the financial results of the current period restated at the prior period exchange rates
3. Organic sales, on this chart and subsequent charts, excludes the impact of currency, metal prices, divestitures
* THE FINANCIAL MEASURES IN THIS SECTION AND ON SUBSEQUENT CHARTS ARE NOT IN ACCORDANCE WITH GAAP. FOR DEFINITIONS OF THESE NON-GAAP
MEASURES, DISCUSSIONS OF ADJUSTMENTS AND RECONCILIATIONS, PLEASE REFER TO THE APPENDICES OF THIS PRESENTATION
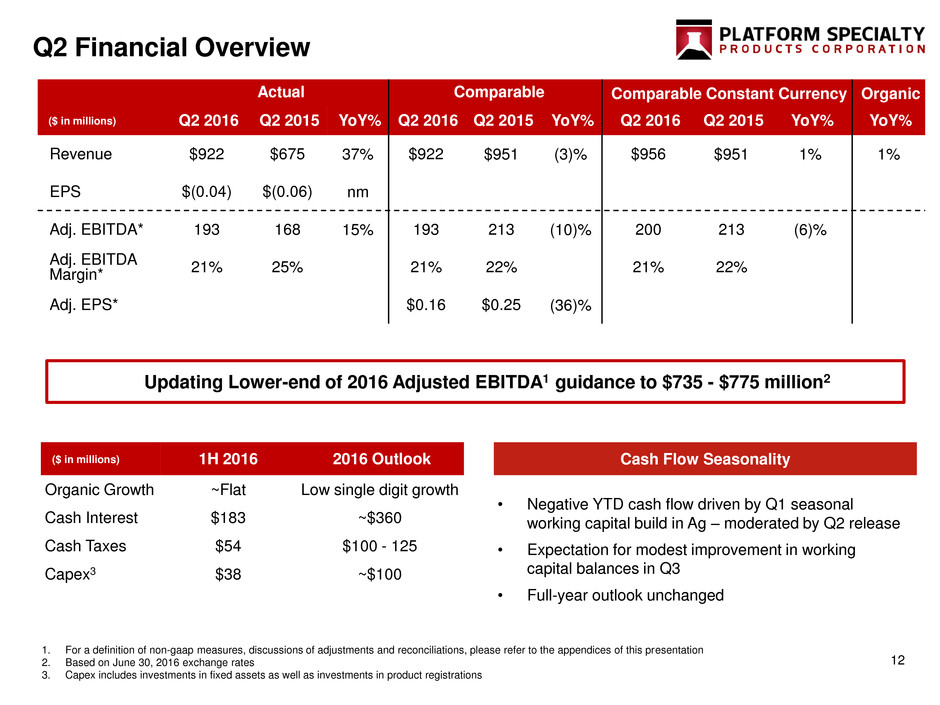
Actual Comparable1* Comparable Constant Currency2* Organic3*
($ in millions) Q2 2016 Q2 2015 YoY% Q2 2016 Q2 2015 YoY% Q2 2016 Q2 2015 YoY% YoY%
Revenue $922 $675 37% $922 $951 (3)% $956 $951 1% 1%
EPS $(0.04) $(0.06) nm
Adj. EBITDA* 193 168 15% 193 213 (10)% 200 213 (6)%
Adj. EBITDA
Margin* 21% 25% 21% 22% 21% 22%
Adj. EPS* $0.16 $0.25 (36)%
• Revenue increased 37% primarily from impact of acquisitions while comparable revenue declined primarily
driven by persisting U.S. dollar strength
• EPS was less negative compared to a year ago period, due partially to higher overall earnings from acquisitions
• Organic sales increased 1% in the quarter
• Strong growth in Latin America and AME Ag despite weak commodity prices
• Declines in North America Ag driven by low farmer incomes, high channel inventories and limited pest
pressure
• Strength in automotive units partially offset by broad softness in electronics and oil and gas markets
• Comparable constant currency adj. EBITDA declined 6% in the quarter
• Year-over-year investment in enterprise development of ~$8 million
• $13 million of incremental synergies realized in the quarter
• Excluding corporate cost adj. EBITDA margins on a comparable basis would have been ~flat year-over-year
5
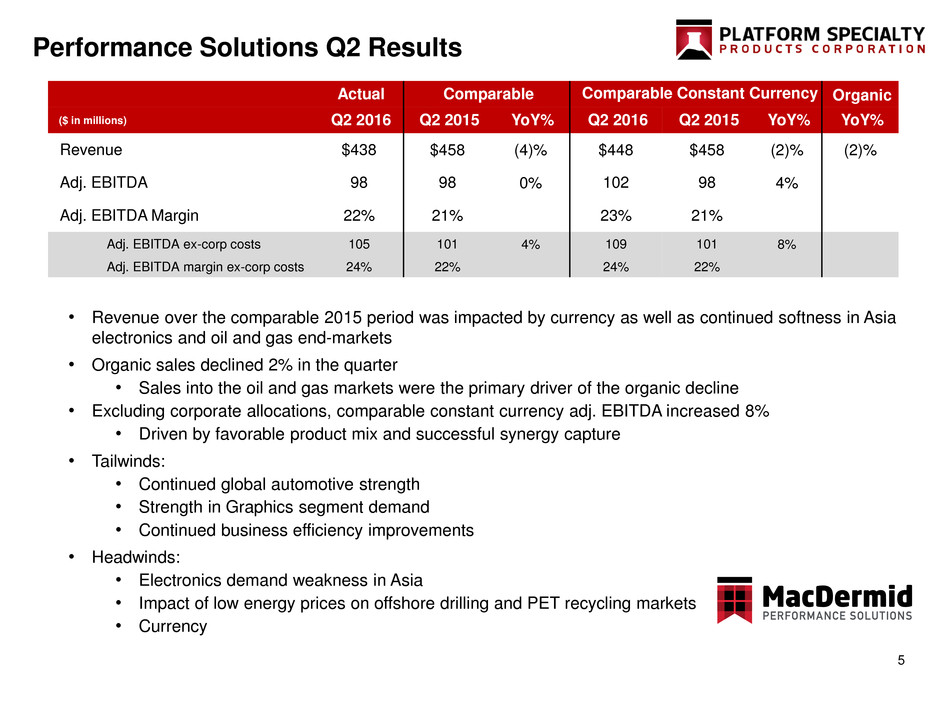
Performance Solutions Q2 Results
Actual Comparable Comparable Constant Currency Organic
($ in millions) Q2 2016 Q2 2015 YoY% Q2 2016 Q2 2015 YoY% YoY%
Revenue $438 $458 (4)% $448 $458 (2)% (2)%
Adj. EBITDA 98 98 0% 102 98 4%
Adj. EBITDA Margin 22% 21% 23% 21%
Adj. EBITDA ex-corp costs 105 101 4% 109 101 8%
Adj. EBITDA margin ex-corp costs 24% 22% 24% 22%
• Revenue over the comparable 2015 period was impacted by currency as well as continued softness in Asia
electronics and oil and gas end-markets
• Organic sales declined 2% in the quarter
• Sales into the oil and gas markets were the primary driver of the organic decline
• Excluding corporate allocations, comparable constant currency adj. EBITDA increased 8%
• Driven by favorable product mix and successful synergy capture
• Tailwinds:
• Continued global automotive strength
• Strength in Graphics segment demand
• Continued business efficiency improvements
• Headwinds:
• Electronics demand weakness in Asia
• Impact of low energy prices on offshore drilling and PET recycling markets
• Currency
6
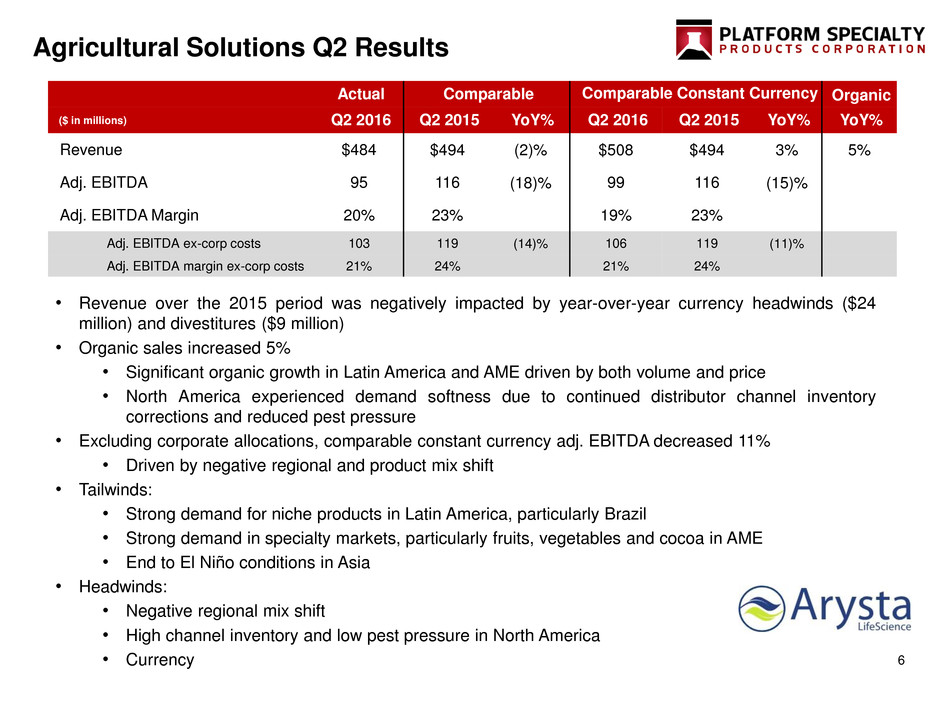
Agricultural Solutions Q2 Results
Actual Comparable Comparable Constant Currency Organic
($ in millions) Q2 2016 Q2 2015 YoY% Q2 2016 Q2 2015 YoY% YoY%
Revenue $484 $494 (2)% $508 $494 3% 5%
Adj. EBITDA 95 116 (18)% 99 116 (15)%
Adj. EBITDA Margin 20% 23% 19% 23%
Adj. EBITDA ex-corp costs 103 119 (14)% 106 119 (11)%
Adj. EBITDA margin ex-corp costs 21% 24% 21% 24%
• Revenue over the 2015 period was negatively impacted by year-over-year currency headwinds ($24
million) and divestitures ($9 million)
• Organic sales increased 5%
• Significant organic growth in Latin America and AME driven by both volume and price
• North America experienced demand softness due to continued distributor channel inventory
corrections and reduced pest pressure
• Excluding corporate allocations, comparable constant currency adj. EBITDA decreased 11%
• Driven by negative regional and product mix shift
• Tailwinds:
• Strong demand for niche products in Latin America, particularly Brazil
• Strong demand in specialty markets, particularly fruits, vegetables and cocoa in AME
• End to El Niño conditions in Asia
• Headwinds:
• Negative regional mix shift
• High channel inventory and low pest pressure in North America
• Currency
7
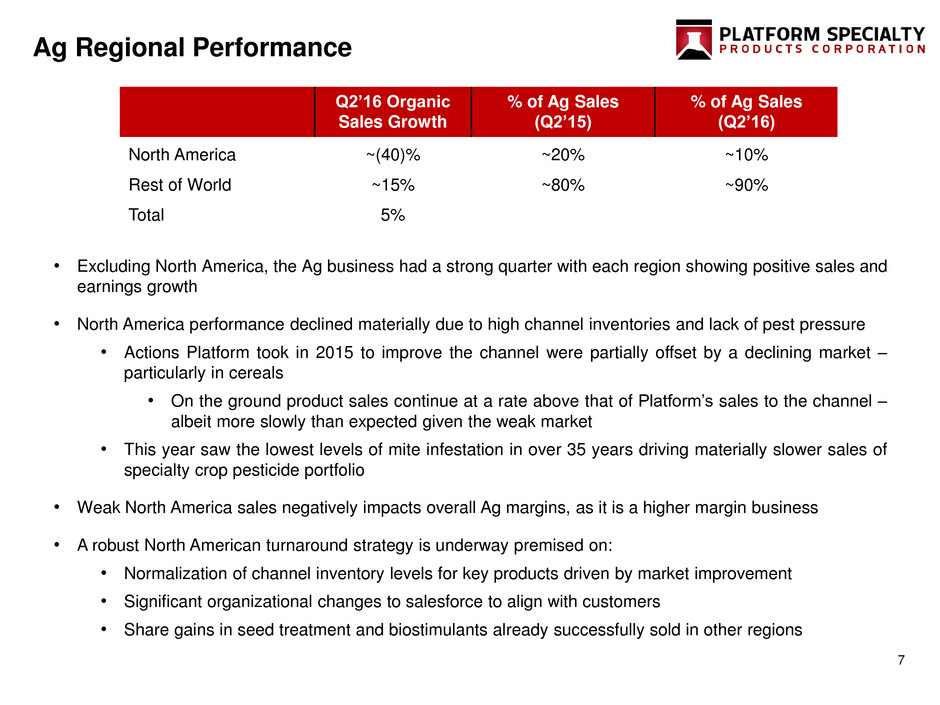
Ag Regional Performance
Q2’16 Organic
Sales Growth
% of Ag Sales
(Q2’15)
% of Ag Sales
(Q2’16)
North America ~(40)% ~20% ~10%
Rest of World ~15% ~80% ~90%
Total 5%
• Excluding North America, the Ag business had a strong quarter with each region showing positive sales and
earnings growth
• North America performance declined materially due to high channel inventories and lack of pest pressure
• Actions Platform took in 2015 to improve the channel were partially offset by a declining market –
particularly in cereals
• On the ground product sales continue at a rate above that of Platform’s sales to the channel –
albeit more slowly than expected given the weak market
• This year saw the lowest levels of mite infestation in over 35 years driving materially slower sales of
specialty crop pesticide portfolio
• Weak North America sales negatively impacts overall Ag margins, as it is a higher margin business
• A robust North American turnaround strategy is underway premised on:
• Normalization of channel inventory levels for key products driven by market improvement
• Significant organizational changes to salesforce to align with customers
• Share gains in seed treatment and biostimulants already successfully sold in other regions

8
~10
722
600
620
640
660
680
700
720
740
760
780
800
1H Annualized 2H Incremental
Synergies
Organic Growth FX Tailwind
(net of price)
2016 Guidance
775
735
Bridging to Updated Guidance
1H 2016 2016 Outlook 2H Expectation
Organic Growth ~Flat Low single digit growth
Continued growth in Ag and recovery to
positive growth in Performance
Solutions
Synergies ~$25 million ~$40 million Continued cost opportunities
FX Translation ~$18 million headwind
Modest headwind at current
rates
Improvement in Brazil and decline in
China. Expect BRL benefit to be
moderated by price reductions in Ag
Updating Lower-end of 2016 Adjusted EBITDA1 guidance to $735 - $775 million2
~$23 million to mid-point
1. For a definition of non-gaap measures, discussions of adjustments and reconciliations, please refer to the appendices of this presentation
2. Based on June 30, 2016 exchange rates
9
Performance SolutionsAgricultural Solutions
$3
$11$7
$20
$0
$5
$10
$15
$20
$25
Q1 Q2 1H 2016 Target
$8
$14$6
$20
$0
$5
$10
$15
$20
$25
Q1 Q2 1H 2016 Target
$ in millions $ in millions
Realized YoY Cost Synergies
$21
$12 $33
$70
$0
$20
$40
$60
$80
Q1 '16 Run Rate of
New Actions
Q2 '16 Total
Estimate
$ in millions $ in millions
$59
$10 $69
$80
$0
$20
$40
$60
$80
$100
Q1 '16 Run Rate of
New Actions
Q2 '16 Total
Estimate
Annualized Run-Rate Annualized Run-Rate
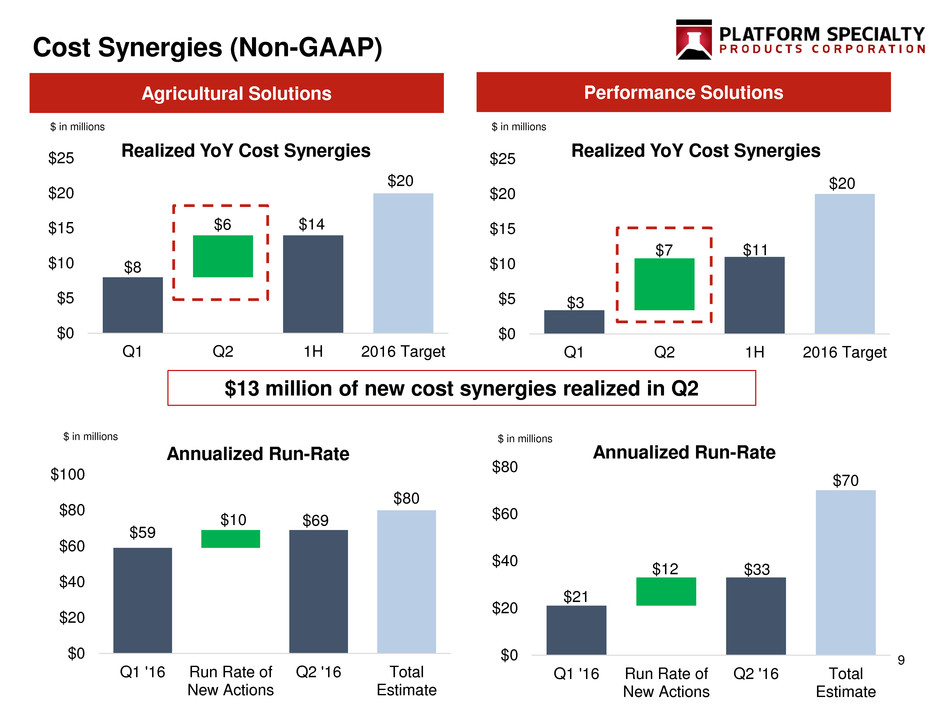
$13 million of new cost synergies realized in Q2
Cost Synergies (Non-GAAP)
Realized YoY Cost Synergies
10
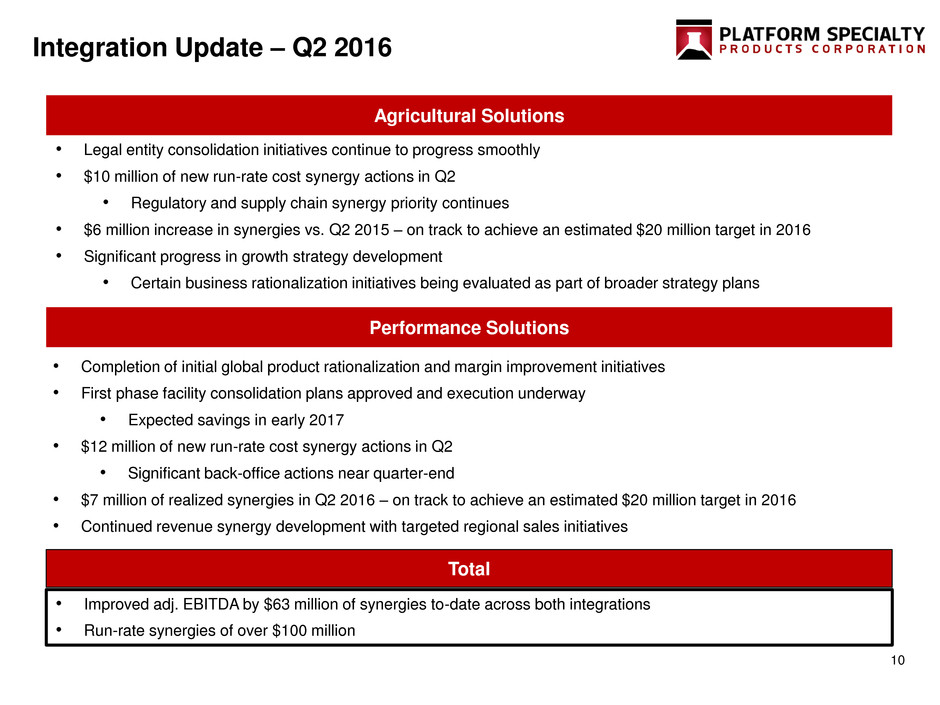
• Completion of initial global product rationalization and margin improvement initiatives
• First phase facility consolidation plans approved and execution underway
• Expected savings in early 2017
• $12 million of new run-rate cost synergy actions in Q2
• Significant back-office actions near quarter-end
• $7 million of realized synergies in Q2 2016 – on track to achieve an estimated $20 million target in 2016
• Continued revenue synergy development with targeted regional sales initiatives
Performance Solutions
Agricultural Solutions
• Legal entity consolidation initiatives continue to progress smoothly
• $10 million of new run-rate cost synergy actions in Q2
• Regulatory and supply chain synergy priority continues
• $6 million increase in synergies vs. Q2 2015 – on track to achieve an estimated $20 million target in 2016
• Significant progress in growth strategy development
• Certain business rationalization initiatives being evaluated as part of broader strategy plans
Integration Update – Q2 2016
Total
• Improved adj. EBITDA by $63 million of synergies to-date across both integrations
• Run-rate synergies of over $100 million

11
Financial Performance
12
Q2 Financial Overview
($ in millions) 1H 2016 2016 Outlook
Organic Growth ~Flat Low single digit growth
Cash Interest $183 ~$360
Cash Taxes $54 $100 - 125
Capex3 $38 ~$100
1. For a definition of non-gaap measures, discussions of adjustments and reconciliations, please refer to the appendices of this presentation
2. Based on June 30, 2016 exchange rates
3. Capex includes investments in fixed assets as well as investments in product registrations
Updating Lower-end of 2016 Adjusted EBITDA1 guidance to $735 - $775 million2
• Negative YTD cash flow driven by Q1 seasonal
working capital build in Ag – moderated by Q2 release
• Expectation for modest improvement in working
capital balances in Q3
• Full-year outlook unchanged
Cash Flow Seasonality
Actual Comparable Comparable Constant Currency Organic
($ in millions) Q2 2016 Q2 2015 YoY% Q2 2016 Q2 2015 YoY% Q2 2016 Q2 2015 YoY% YoY%
Revenue $922 $675 37% $922 $951 (3)% $956 $951 1% 1%
EPS $(0.04) $(0.06) nm
Adj. EBITDA* 193 168 15% 193 213 (10)% 200 213 (6)%
Adj. EBITDA
Margin* 21% 25% 21% 22% 21% 22%
Adj. EPS* $0.16 $0.25 (36)%

13
(9)
(34) (9)
1
22
458 448 438
494
461 484
0
100
200
300
400
500
600
700
800
900
1,000
2Q15
Comparable
Divestitures Metals FX Headwind 2Q15
Normalized
Pricing Volume / Mix 2Q16
Performance Solutions Agricultural Solutions
2Q 2015 to 2Q 2016 Sales Bridge (Non-GAAP)
Sales Bridge
951
922
Organic
sales
growth
of 1%
908
$ in millions
14
(7)
(17)
(23)
(8)
22
13
98 98
116
95
0
50
100
150
200
250
2Q15
Comparable
FX
Translational
Headwind
FX
Transactional
Headwind
Pricing Synergies Volume / Mix Increase in
Corporate
Costs
2Q16
Performance Solutions Agricultural Solutions
2Q 2015 to 2Q 2016 Adjusted EBITDA
Bridge (Non-GAAP)
Adjusted EBITDA Bridge
213
193
Primarily Ag
$ in millions

15
Capital Structure Overview
1. Platform has swapped certain amounts of its floating rate term loans to fixed rate including $1.2bn of its USD tranches and €283m of its Euro tranches. At 6/30/2016, 36% of
debt was floating and 64% was fixed
2. Includes only the potential make-whole ‘cash’ component of the Series B convertible preferred stock. Potential make-whole calculation: ($27.14 – PAH closing price of $8.88)
X 22.1 million shares
3. 266 million shares outstanding at 6/30/2016 on an adjusted fully diluted basis, including 22.1 million shares related to the Series B convertible preferred stock
4. Based on 6/30/2016 PAH closing price of $8.88
$ millions
Instrument Maturity Coupon 6/30/16
Corporate Revolver ($500M) 6/7/2019 $90
Term Loan – USD1 6/7/2020 L + 450 2,684
Term Loan – EUR1 6/7/2020 L + 450 645
Other Debt 52
Total First Lien Debt $3,471
10.375% of '21 Senior Notes 5/1/2021 10.375% 500
6.5% of '22 Senior Notes 2/1/2022 6.500% 1,100
6% of '23 Senior Notes (€) 2/1/2023 6.000% 389
Total Unsecured Debt $1,989
Total Debt $5,460
Cash Balance as of 6/30/16 $342
Net Debt $5,118
Series B Pfd. Make Whole2 404
Shares Outstanding3 266
Market Capitalization4 $2,362
Total Capitalization $7,884
Capital Structure Maturity Profile
0
500
1,000
1,500
2,000
2,500
3,000
3,500
2016 2017 2018 2019 2020 2021 2022 2023
Series B Pfd.
Debt
• At June 30th stock price, Series B Preferred make-
whole potential amount is $404M due in October
2016, though Platform has an option to extend until
April 2017
• No significant debt maturities until June 2020
$
m
ill
io
n
s
16
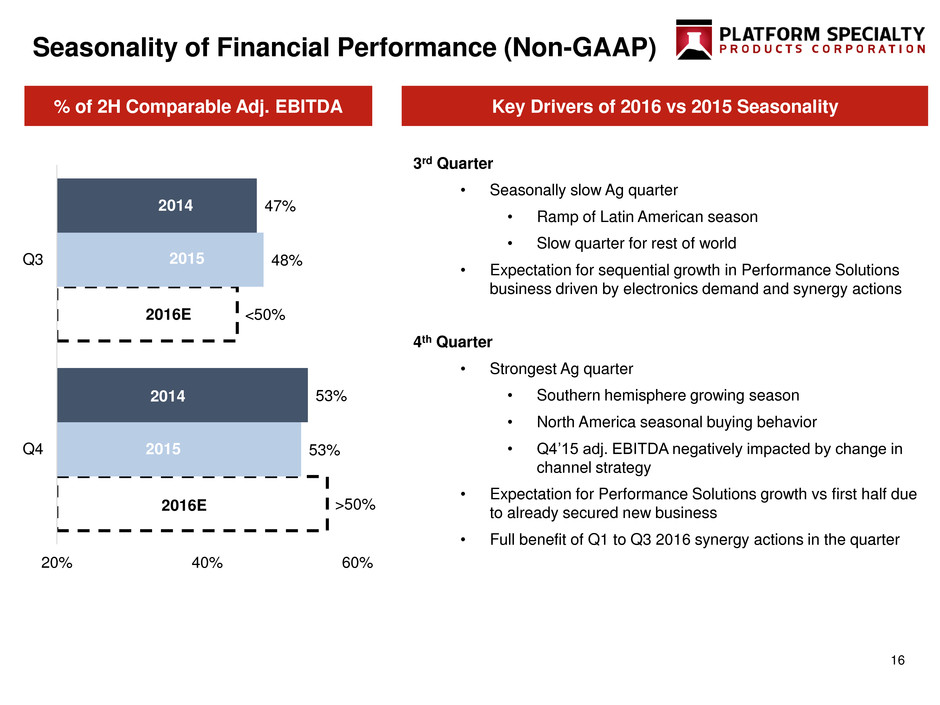
Seasonality of Financial Performance (Non-GAAP)
>50%
<50%
53%
48%
53%
47%
20% 40% 60%
Q4
Q3
3rd Quarter
• Seasonally slow Ag quarter
• Ramp of Latin American season
• Slow quarter for rest of world
• Expectation for sequential growth in Performance Solutions
business driven by electronics demand and synergy actions
4th Quarter
• Strongest Ag quarter
• Southern hemisphere growing season
• North America seasonal buying behavior
• Q4’15 adj. EBITDA negatively impacted by change in
channel strategy
• Expectation for Performance Solutions growth vs first half due
to already secured new business
• Full benefit of Q1 to Q3 2016 synergy actions in the quarter
Key Drivers of 2016 vs 2015 Seasonality% of 2H Comparable Adj. EBITDA
2015
2014
2016E
2014
2015
2016E

17
Conclusions – 2016 Priorities
Integration and Synergy Realization
Focus Commercial Efforts on Fast Growing Niches
Establish Operating Rhythm and Momentum
Generate Free Cash Flow
18
Appendix

19
Covenant Overview
Our capital structure is subject to only one quarterly
maintenance test - 6.25x First Lien Net Debt to
Covenant EBITDA
Covenant EBITDA is defined as LTM comparable adj.
EBITDA plus synergies expected to be realized based
on actions to be taken over the next 12 months1
We have significant headroom under the maintenance
covenant
The Gross First Lien Leverage ratio only limits our ability
to incur debt if we would not satisfy a 2x Fixed Charge
Coverage Ratio test, tested at the time of incurrence
LTM Comparable adj. EBITDA $713
(+) Announced Synergies 150
(-) Realized Synergies (63)
(+) Synergy Adjustment 87
Covenant EBITDA $800
Covenant Calculations3
Leverage Covenants
as of
6/30/16 Covenant
EBITDA
Headroom Headroom %
Maintenance Covenant:
Net First Lien Leverage 3.91x < 6.25x $299 37%
Incurrence Covenants:
Gross First Lien Leverage 4.34x < 4.50x $29 4%
Total Net Leverage 6.40x < 6.75x – 7.00x2 $42 – $69 5% - 9%
Covenant EBITDA
Note: All $ amounts in millions
1. Synergy credit is limited to 15% of underlying EBITDA; See definition of Consolidated EBITDA in the Company’s Credit Agreement dated April 12, 2007, as amended and/or
restated
2. This covenant varies based on use of proceeds – 6.75x applies to acquisitions while 7.00x applies to other uses of debt
3. The covenants do not reflect the impact of any potential Series B preferred make-whole payment

20
Organic Sales Reconciliation
Performance
Solutions
Agricultural
Solutions Total
(amounts I n millions) Q2 2016 YoY% Q2 2016 YoY% Q2 2016 YoY%
Change in net comparable sales $(20) (4.3)% $(10) (2.1)% $(30) (3.1)%
Dispositions - - 9 1.9 9 1.0
Foreign exchange impacts 10 2.3 24 5.0 34 3.7
Impact of metal prices (1) (0.2) - - (1) (0.1)
Organic Sales Growth $(10) (2.2)% $23 4.8% $13 1.4%

21
Net Loss Attributable to Common Stockholders
Reconciliation to Adjusted EBITDA
(amounts in millions) Q2 2016 Q2 2015
Net loss attributable to common stockholders $(9) $(12)
Income tax expense 27 -
Net income attributable to the non-controlling interests 1 3
Income (loss) before income taxes and non-controlling interests 19 (9)
Adjustments to reconcile to Adjusted EBITDA
Interest expense, net 97 51
Depreciation expense 19 14
Amortization expense 67 53
Long-term compensation issued in connection with acquisitions1 - -
Restructuring expenses 7 12
Manufacturer's profit in inventory purchase accounting adjustments - 21
Acquisition and integration costs 5 24
Non-cash change in fair value of contingent consideration 1 1
Legal settlements (3) (16)
Foreign exchange (gains) losses on foreign denominated external and internal debt (19) 18
Adjusted EBITDA $193 $168
Note: Totals may not reconcile due to rounding
1. Rounded down to zero
22
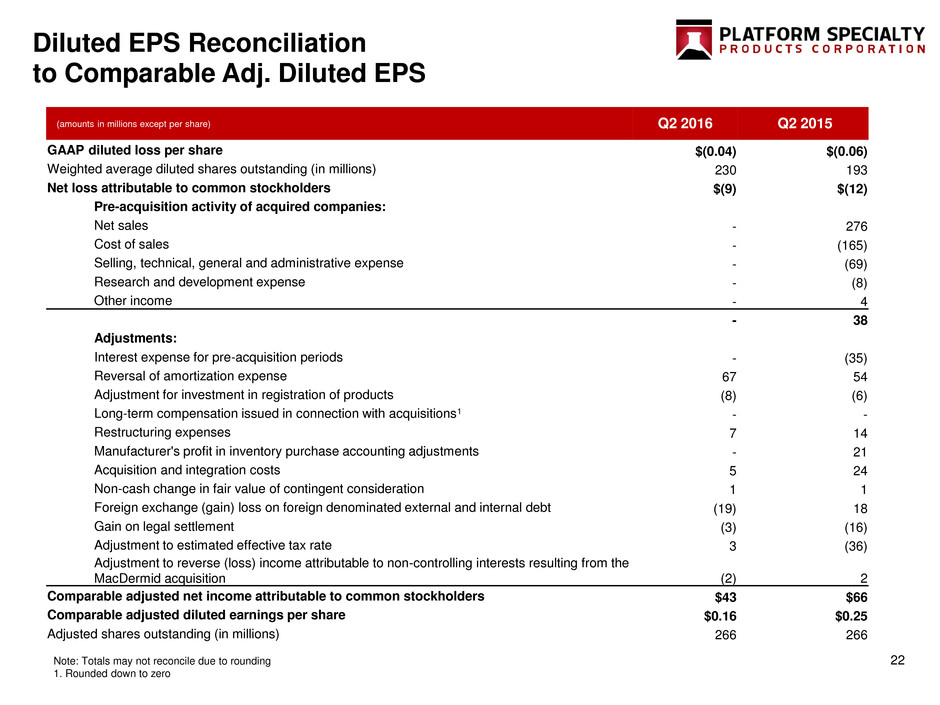
Diluted EPS Reconciliation
to Comparable Adj. Diluted EPS
(amounts in millions except per share) Q2 2016 Q2 2015
GAAP diluted loss per share $(0.04) $(0.06)
Weighted average diluted shares outstanding (in millions) 230 193
Net loss attributable to common stockholders $(9) $(12)
Pre-acquisition activity of acquired companies:
Net sales - 276
Cost of sales - (165)
Selling, technical, general and administrative expense - (69)
Research and development expense - (8)
Other income - 4
- 38
Adjustments:
Interest expense for pre-acquisition periods - (35)
Reversal of amortization expense 67 54
Adjustment for investment in registration of products (8) (6)
Long-term compensation issued in connection with acquisitions1 - -
Restructuring expenses 7 14
Manufacturer's profit in inventory purchase accounting adjustments - 21
Acquisition and integration costs 5 24
Non-cash change in fair value of contingent consideration 1 1
Foreign exchange (gain) loss on foreign denominated external and internal debt (19) 18
Gain on legal settlement (3) (16)
Adjustment to estimated effective tax rate 3 (36)
Adjustment to reverse (loss) income attributable to non-controlling interests resulting from the
MacDermid acquisition (2) 2
Comparable adjusted net income attributable to common stockholders $43 $66
Comparable adjusted diluted earnings per share $0.16 $0.25
Adjusted shares outstanding (in millions) 266 266
Note: Totals may not reconcile due to rounding
1. Rounded down to zero

23
Non-GAAP Definitions
Comparable Sales:
Comparable sales is defined as sales adjusted for the sales of our acquisitions as if they had occurred on January 1, 2015. Management believes this
measure provides investors with a more complete understanding of sales trends by providing sales on a more consistent basis.
Organic Sales:
Organic sales is defined as Comparable sales excluding the impact of currency, metals price, divestitures and acquisitions, as applicable.
Management believes this measure provides investors with a more complete understanding of the underlying sales trends by providing Comparable
sales over differing periods on a consistent basis.
Constant Currency and Comparable Constant Currency:
Our constant currency presentation excludes the impact of fluctuations in foreign currency exchange rates. We believe providing constant currency
information provides valuable supplemental information regarding our results of operations, consistent with how we also evaluate our performance. We
calculate constant currency percentages by converting our current-period local currency financial results into U.S. Dollar using the prior period's
exchange rates and comparing these adjusted amounts to our prior period reported results. The comparable constant currency presentation includes
actual results adjusted to reflect acquisitions and related financings as though they had occurred on January 1, 2015 adjusted for the effects of
purchase accounting on actual results. Management believes that this presentation provides a more complete understanding of the Company's
operational results and a meaningful comparison of its performance between periods. However, this comparable financial information is provided for
informational purposes only and is not necessarily, and should not be assumed to be, an indication of the results that would have been achieved had
the Company’s acquisitions been completed as of the dates indicated, or that may be achieved in the future.
Adjusted EBITDA and Comparable Adjusted EBITDA:
Adjusted EBITDA is defined as earnings before interest, taxes, depreciation and amortization, as further adjusted for additional items included in
earnings that are not representative or indicative of our ongoing business as described in the footnotes to the non-GAAP measures reconciliations.
Comparable adjusted EBITDA is defined as Adjusted EBITDA adjusted to reflect acquisitions and the related financings as though they had occurred
on January 1, 2015 without the impact of purchase accounting. Adjusted EBITDA and comparable adjusted EBITDA are key metrics used by
management to measure operating performance and trends. In particular, the exclusion of certain expenses in calculating adjusted EBITDA and
comparable adjusted EBITDA facilitates operating performance comparisons on a period-to-period basis.
Comparable Adjusted Diluted Earnings Per Share:
Comparable adjusted diluted earnings per share is defined as net loss attributable to common stockholders adjusted to reflect acquisitions and the
related financings as though they had occurred on January 1, 2015 without the impact of purchase accounting, as well as other adjustments consistent
with our definition of Adjusted EBITDA. Additionally, we eliminate the amortization associated with (i) intangibles assets recognized in purchase
accounting for acquisitions and (ii) costs capitalized in connection with obtaining regulatory approval of our products (“registration rights”) as part of
ongoing operations and deduct capital expenditures associated with obtaining these registration rights. Further, we adjust the effective tax rate to 35%
as described in the notes to the reconciliation. The resulting comparable adjusted net income available to stockholders is divided by the number of
shares of outstanding common stock as of June 30, 2016 plus the number of shares that would be issued if convertible stock were converted to
common stock, vested stock options were exercised, and all awarded equity granted were vested as of June 30, 2016. Comparable adjusted diluted
earnings per share is a key metric used by management to measure operating performance and trends. In particular, the exclusion of certain
expenses in calculating comparable adjusted diluted earnings per share facilitates operating performance comparisons on a period-to-period basis.
Serious News for Serious Traders! Try StreetInsider.com Premium Free!
You May Also Be Interested In
- /C O R R E C T I O N -- Wyoming Stable Token Commission/
- PRG Real Estate's Brandon Pierce Earns National Recognition as NAA + HD Supply Maintenance Legends Finalist
- Hanwha Wins U.S. Army Mobile Tactical Cannon Contract
Create E-mail Alert Related Categories
SEC FilingsSign up for StreetInsider Free!
Receive full access to all new and archived articles, unlimited portfolio tracking, e-mail alerts, custom newswires and RSS feeds - and more!
