




Form 8-K Pattern Energy Group For: Feb 29

FREE Breaking News Alerts from StreetInsider.com!
StreetInsider.com Top Tickers, 10/12/2026
- Nasdaq falls ahead of earnings, economic data while oil rallies
- Oil prices rise on Saudi Arabia attacks, overshadowing Trump's diesel deal
- Will surging equity supply derail the U.S. bull market? Goldman Sachs weighs in
- Broadcom CEO says many AI investors are gamblers
- "Not buying Chipotle": Starbucks squashes blockbuster acquisition speculation
 Tweet
Tweet Share
Share E-mail
UNITED STATES
SECURITIES AND EXCHANGE COMMISSION
Washington, D.C. 20549
FORM 8-K
CURRENT REPORT
Pursuant to Section 13 or 15(d)
of the Securities Exchange Act of 1934
Date of Report (Date of Earliest Event Reported): February 29, 2016
PATTERN ENERGY GROUP INC.
(Exact name of registrant as specified in its charter)
Delaware | 001-36087 | 90-0893251 |
(State or other jurisdiction | (Commission | (IRS Employer |
of incorporation) | File Number) | Identification Number) |
Pier 1, Bay 3
San Francisco, CA 94111
(Address and zip code of principal executive offices)
(415) 283-4000
(Registrant’s telephone number, including area code)
Not Applicable
(Former name or former address, if changed since last report)
Check the appropriate box below if the Form 8-K filing is intended to simultaneously satisfy the filing obligation of the registrant under any of the following provisions (see General Instruction A.2. below):
o Written communications pursuant to Rule 425 under the Securities Act (17 CFR 230.425)
o Soliciting material pursuant to Rule 14a-12 under the Exchange Act (17 CFR 240.14a-12)
o Pre-commencement communications pursuant to Rule 14d-2(b) under the Exchange Act (17 CFR 240.14d-2(b))
o Pre-commencement communications pursuant to Rule 13e-4(c) under the Exchange Act (17 CFR 240.13e-4(c))
Item 2.02. Results of Operations and Financial Condition.
On February 29, 2016, we issued a press release announcing our financial results for the fourth quarter and for the year ended December 31, 2015. A copy of our press release is attached hereto as Exhibit 99.1 and is incorporated herein by reference. This information is furnished pursuant to Item 2.02 and shall not be deemed “filed” for any purpose, including for the purposes of Section 18 of the Securities Exchange Act of 1934, as amended (the “Exchange Act”), or otherwise subject to the liabilities of that Section. The information in this Current Report on Form 8-K shall not be deemed incorporated by reference into any filing under the Securities Act of 1933, as amended, or the Exchange Act regardless of any general incorporation language in such filing.
Our press release, included herein, makes reference to non-U.S. GAAP financial measures, which management believes are useful for investors by offering the ability to better evaluate operating performance and to better understand how management evaluates the business. These non-U.S. GAAP financial measures are not prepared in accordance with, and should not be considered in isolation of, or as an alternative to, measurements required by U.S. GAAP. Descriptions of the non-U.S. GAAP financial measures are discussed below.
We define cash available for distribution as net cash provided by operating activities as adjusted for certain other cash flow items that we associate with our operations. Cash available for distribution represents cash provided by operating activities as adjusted to (i) add or subtract changes in operating assets and liabilities, (ii) subtract net deposits into restricted cash accounts, which are required pursuant to the cash reserve requirements of financing agreements, to the extent they are paid from operating cash flows during a period, (iii) subtract cash distributions paid to noncontrolling interests, (iv) subtract scheduled project-level debt repayments in accordance with the related loan amortization schedule, to the extent they are paid from operating cash flows during a period, (v) subtract non-expansionary capital expenditures, to the extent they are paid from operating cash flows during a period, (vi) add cash distributions received from unconsolidated investments, to the extent such distributions were derived from operating cash flows and (vii) add or subtract other items as necessary to present the cash flows we deem representative of our core business operations.
We disclose cash available for distribution because management recognizes that it will be used as a supplemental measure by investors and analysts to evaluate our liquidity. However, cash available for distribution has limitations as an analytical tool because it excludes depreciation, amortization and accretion, does not capture the level of capital expenditures necessary to maintain the operating performance of our projects, is not reduced for principal payments on our project indebtedness except to the extent they are paid from operating cash flows during a period, and excludes the effect of certain other cash flow items, all of which could have a material effect on our financial condition and results from operations. Cash available for distribution is a non-U.S. GAAP measure and should not be considered an alternative to net cash provided by operating activities or any other liquidity measure determined in accordance with U.S. GAAP, nor is it indicative of funds available to fund our cash needs. In addition, our calculation of cash available for distribution is not necessarily comparable to cash available for distribution as calculated by other companies.
We define adjusted EBITDA as net (loss) income before net interest expense, income taxes and depreciation, amortization and accretion, including our proportionate share of net interest expense, income taxes and depreciation, amortization and accretion of joint venture investments that are accounted for under the equity method. Adjusted EBITDA also excludes the effect of certain mark-to-market adjustments and infrequent items not related to normal or ongoing operations, such as early payment of debt and realized derivative gain or loss from refinancing transactions, and gain or loss related to acquisitions or divestitures. In calculating adjusted EBITDA, we exclude mark-to-market adjustments to the value of our derivatives because we believe that it is useful for investors to understand, as a supplement to net (loss) income and other traditional measures of operating results, the results of our operations without regard to periodic, and sometimes material, fluctuations in the market value of such assets or liabilities.
We disclose adjusted EBITDA, which is a non-U.S. GAAP measure, because management believes this metric assists investors and analysts in comparing our operating performance across reporting periods on a consistent basis by excluding items that our management believes are not indicative of our core operating performance. We use adjusted EBITDA to evaluate our operating performance. You should not consider adjusted EBITDA as an alternative to net (loss) income, determined in accordance with U.S. GAAP.
Adjusted EBITDA has limitations as an analytical tool. Some of these limitations are:
Adjusted EBITDA
• | does not reflect our cash expenditures or future requirements for capital expenditures or contractual commitments; |
• | does not reflect changes in, or cash requirements for, our working capital needs; |
• | does not reflect the significant interest expense, or the cash requirements necessary to service interest or principal payments, on our debt; |
• | does not reflect our income tax expense or the cash requirement to pay our taxes; and |
• | does not reflect the effect of certain mark-to-market adjustments and non-recurring items; |
• | although depreciation, amortization and accretion are non-cash charges, the assets being depreciated, amortized and accreted will often have to be replaced in the future, and adjusted EBITDA does not reflect any cash requirements for such replacements; and |
• | other companies in our industry may calculate adjusted EBITDA differently than we do, limiting its usefulness as a comparative measure. |
Because of these limitations, adjusted EBITDA should not be considered in isolation or as a substitute for performance measures calculated in accordance with U.S. GAAP.
Item 7.01 Regulation FD Disclosure
In addition to the earnings press release on February 29, 2016 discussed in Item 2.02 above, we posted supplemental slides containing additional financial information about the us to our website, www.patternenergy.com. A copy of these supplemental slides is furnished herewith as Exhibit 99.2.
Item 9.01 Financial Statements and Exhibits.
(d) Exhibits
Exhibit Number | Description |
99.1 | Press Release issued by Pattern Energy Group Inc. on February 29, 2016. |
99.2 | Supplemental slides dated February 29, 2016. |
SIGNATURE
Pursuant to the requirements of the Securities Exchange Act of 1934, Pattern Energy Group Inc. has duly caused this report to be signed on its behalf by the undersigned hereunto duly authorized.
Dated: February 29, 2016
PATTERN ENERGY GROUP INC. | |||
By: | /s/ Michael J. Lyon | ||
Name: Michael J. Lyon | |||
Title: Chief Financial Officer | |||
(Principal Financial Officer) | |||
Exhibit 99.1

Pattern Energy Reports Fourth Quarter and Year End 2015 Financial Results
- $92.4 million in 2015 CAFD exceeds target -
- Declares increased dividend of $0.3810 per Class A common share for first quarter 2016 -
SAN FRANCISCO, California, February 29, 2016 - Pattern Energy Group Inc. (the “Company” or “Pattern Energy”) (NASDAQ: PEGI) (TSX: PEG) today announced its financial results for the 2015 fourth quarter and year.
Highlights
(Comparisons made between fiscal 2015 and fiscal 2014 results, unless otherwise noted)
• | Cash available for distribution (CAFD) of $92.4 million, up 49% |
• | Adjusted EBITDA of $250.5 million, up 26% |
• | Proportional GWh sold of 5,137 GWh, up 74% |
• | Revenue of $329.8 million, up 24% |
• | Declared a first quarter dividend of $0.3810 per Class A common share or $1.524 on an annualized basis, subsequent to the end of the period, representing a 2.4% increase over the previous quarter’s dividend |
• | Increased owned capacity by 39% to 2,282 MW through the acquisition of interests in five projects |
• | Commenced commercial operations in December 2015 at the 150 MW Amazon Wind Farm Fowler Ridge project in which the Company holds an owned interest of 116 MW |
• | All 16 existing assets are operational with no new capital required to be raised for existing ownership interest levels |
“Our portfolio of 16 projects generated a record $92.4 million of CAFD in 2015, exceeding the midpoint of our guidance by 10%. By reducing certain costs and increasing the operating performance of our projects during 2015, we were able to overcome the challenges of low wind in the first quarter, a weak Canadian dollar and reduced spot market prices. Our portfolio will continue to grow our CAFD in 2016 and the coming years as we ramp up to our run-rate CAFD,” said Mike Garland, President and CEO of Pattern Energy. “The portfolio continues to provide growing, stable cash flow, allowing us to increase our dividend for the first quarter of 2016, our eighth consecutive dividend increase. With this good news we start 2016 in a strong position. We have no requirements to raise capital for our existing business, our list of ROFO assets will continue to grow in 2016, and we believe the market for renewable energy has never been stronger.”
Financial Results
Pattern Energy sold 1,714,884 MWh of electricity on a proportional basis in the fourth quarter of 2015 compared to 918,976 MWh sold in the same period in 2014. Pattern Energy sold 5,136,675 MWh of electricity on a proportional basis for the year ended December 31, 2015, compared to 2,951,233 MWh sold in 2014. The increase in proportional MWh for the quarterly period is due to projects which were acquired and projects that became commercially operable in 2015. The increase in proportional MWh sold for the annual period was primarily attributable to a 1,724,872 MWh increase in volume from controlling interest in consolidated MWh and a 460,570 MWh increase in volume from equity method investments due to the acquisition of K2 in 2015 and commencement of operations of South Kent and Grand in 2014. Overall, production was slightly below the Company's expectations for the fourth quarter compared to its long-term forecast.
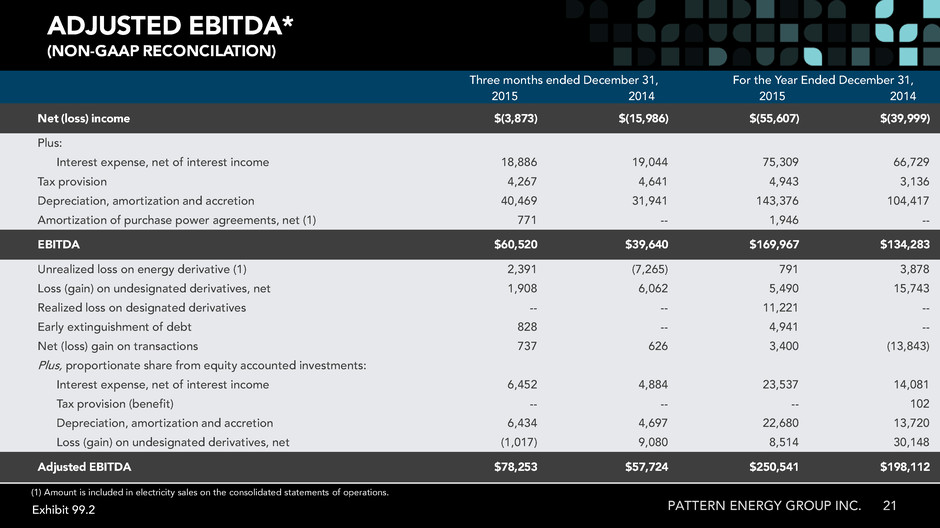
Adjusted EBITDA was $78.3 million for the fourth quarter of 2015 compared to $57.7 million in the same period last year. Adjusted EBITDA for the year 2015 was $250.5 million compared to $198.1 million in 2014. The increase in adjusted EBITDA for the quarterly period was primarily attributable to projects which were acquired and projects that became commercially operable in 2015. The increase in the annual period was primarily due to projects that were acquired or commenced commercial operation in 2014 and 2015. Reconciliations of adjusted EBITDA to net loss determined in accordance with GAAP for both the quarterly and annual periods are shown below.
Net loss was $3.9 million in the fourth quarter of 2015, compared to $16.0 million in the same period last year. The change in the quarterly period was primarily due to projects that were acquired and projects that completed construction during 2015. Also contributing to the decrease in net loss for the quarter was increased equity in earnings from unconsolidated investments primarily due to the acquisition of K2 in 2015.
Net loss was $55.6 million for the year ended 2015 compared to $40.0 million in 2014. The increase in net loss for the annual period was primarily due to increased other expense items related to interest expense, extinguishment of debt and related interest rate swap, and a decrease in net gains on transactions offset by increases in equity in earnings from unconsolidated investments.
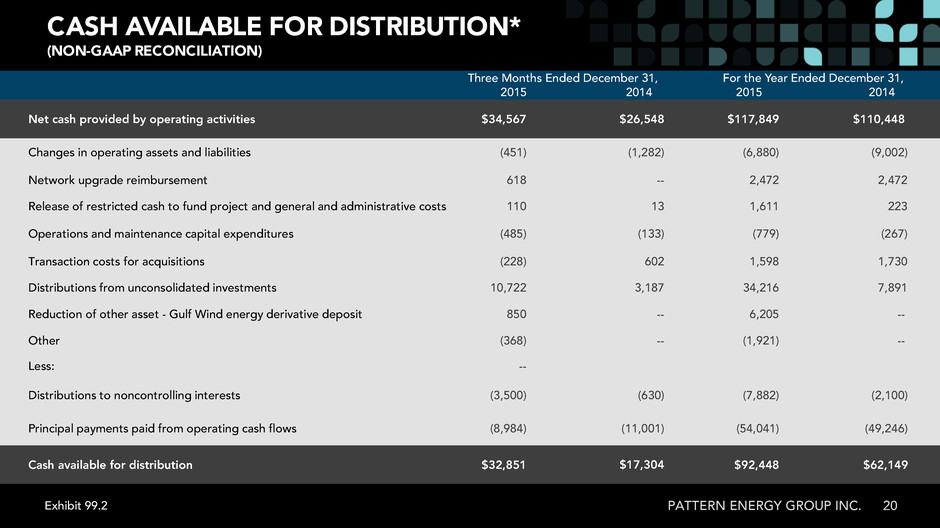
Cash available for distribution was $32.9 million in the fourth quarter of 2015 compared to $17.3 million in the same period last year. The $15.6 million increase in cash available for distribution is due to additional revenues of $21.7 million (excluding unrealized loss on energy derivative and amortization of PPAs) primarily from projects which were acquired or completed construction during 2015, a $7.5 million increase in cash distributions from unconsolidated investments, and decreased principal payments of $2.0 million. These increases were partially offset by increases in project expenses of approximately $11.4 million and operating expenses of $1.6 million primarily from projects which were acquired or completed construction during 2015, and increased distributions to noncontrolling interests of $2.9 million.
Cash available for distribution was $92.4 million for the full year 2015 compared to $62.1 million in 2014. Based on dividends paid during 2015, Pattern Energy's dividend payout ratio was 98% of 2015 cash available for distribution. The $30.3 million increase in cash available for distribution was due to additional revenues of $63.1 million (excluding unrealized loss on energy derivative and amortization of PPAs) primarily from projects which commenced commercial operations or were acquired during 2014 and 2015. In addition, the Company received an increase of $26.3 million in cash distributions from its unconsolidated investments when compared to the same period in the prior year which was due to full year operation at each of South Kent and Grand in 2015 compared to partial year operation in 2014 and the acquisition of K2 in the second quarter of 2015. Cash available for distribution was also impacted by a $6.2 million cash distribution from the partial refund of a deposit associated with the Gulf Wind energy derivative. These increases were partially offset by increases in project expenses of $36.8 million, operating expenses of $9.1 million, interest expense of $10.2 million, primarily from projects which commenced commercial operations during 2014 and 2015. In addition, increases in cash available for distribution were offset by increased distributions to noncontrolling interests of $5.8 million and increased principal payments of $4.8 million.
Reconciliations of cash available for distribution to net cash provided by operating activities determined in accordance with GAAP for both the quarterly and annual periods are shown below.
2016 Financial Guidance
For 2016, Pattern Energy expects annual cash available for distribution in a range of $125 million to $145 million, representing an increase of 46% at the midpoint of the range, compared to cash available for distribution in 2015.(1)
Quarterly Dividend
On February 24, 2016, Pattern Energy declared an increased dividend for the first quarter 2016, payable on April 29, 2016, to holders of record on March 31, 2016 in the amount of $0.3810 per Class A common share, which represents $1.524 on an annualized basis. This is a 2.4% increase from the fourth quarter 2015 dividend of $0.3720.
Acquisition Pipeline
Pattern Energy has the Right of First Offer (ROFO) on a pipeline of acquisition opportunities from Pattern Development.
On October 20, 2015, Pattern Development entered into a 25-year PPA with the Sacramento Municipal Utility District in connection with a 220 MW gross capacity wind power project, referred to as “Grady”, based in Curry County, New Mexico, that was previously added to the identified ROFO list as part of the California/New Mexico project. Upon completion, the 220 MW project will deliver wind power directly into California.
(1) The forward looking measure of cash available for distribution for 2016 is a non-GAAP measure that cannot be reconciled to net cash provided by operating activities as the most directly comparable GAAP financial measure without unreasonable effort. A description of the adjustments to determine CAFD can be found within Item 7, Management's Discussion and Analysis of Financial Condition and Results of Operations-Key Metrics, of Pattern Energy's 2015 Annual Report on Form 10-K.
The identified ROFO list stands at 1,298 MW of total owned capacity. Since its IPO, Pattern Energy has purchased 832 MW from Pattern Development and in aggregate grown the identified ROFO list from 746 MW to a total of 2,130 MW. The table below sets forth the current list of identified ROFO projects:
Asset | Location | Owned MW | Status | |||
Armow | Ontario | 90 | Operational | |||
Meikle | British Columbia | 180 | In construction | |||
Conejo Solar | Chile | 84 | In construction | |||
Belle River | Ontario | 50 | Securing final permits | |||
Henvey Inlet | Ontario | 150 | Late stage development | |||
Mont Sainte-Marguerite | Québec | 147 | Late stage development | |||
North Kent | Ontario | 43 | Late stage development | |||
Broadview projects | New Mexico | 259 | Late stage development | |||
Grady | New Mexico | 176 | Late stage development | |||
Tsugaru | Japan | 63 | Late stage development | |||
Ohorayama | Japan | 31 | Late stage development | |||
Kanagi Solar | Japan | 6 | In construction | |||
Futtsu Solar | Japan | 19 | Operational | |||
Total | 1,298 | |||||
The list of identified ROFO projects represents a portion of Pattern Development’s 5,900 MW pipeline of development projects, all of which are subject to Pattern Energy’s ROFO. The 5,900 MW includes Pattern Development’s interests in both its majority stake in Tokyo-based GPI and its joint venture with CEMEX Energia in Mexico. GPI has up to 1,000 MW of near and longer term wind and solar projects in development. The joint venture between Pattern Development and CEMEX Energia has a goal of developing 1,000 MW of wind and solar generation in Mexico over the next five years where recent reforms set a mandate of 35% of generation to come from clean resources by 2024.
Cash Available for Distribution and Adjusted EBITDA Non-GAAP Reconciliations
The following tables reconcile non-GAAP net cash provided by operating activities to cash available for distribution and net loss to adjusted EBITDA, respectively, for the periods presented (in thousands):
Three Months Ended December 31, | For the Year Ended December 31, | ||||||||||||||
2015 | 2014 | 2015 | 2014 | ||||||||||||
Net cash provided by operating activities | $ | 34,567 | $ | 26,548 | $ | 117,849 | $ | 110,448 | |||||||
Changes in operating assets and liabilities | (451 | ) | (1,282 | ) | (6,880 | ) | (9,002 | ) | |||||||
Network upgrade reimbursement | 618 | — | 2,472 | 2,472 | |||||||||||
Release of restricted cash to fund project and general and administrative costs | 110 | 13 | 1,611 | 223 | |||||||||||
Operations and maintenance capital expenditures | (485 | ) | (133 | ) | (779 | ) | (267 | ) | |||||||
Transaction costs for acquisitions | (228 | ) | 602 | 1,598 | 1,730 | ||||||||||
Distributions from unconsolidated investments | 10,722 | 3,187 | 34,216 | 7,891 | |||||||||||
Reduction of other asset - Gulf Wind energy derivative deposit | 850 | — | 6,205 | — | |||||||||||
Other | (368 | ) | — | (1,921 | ) | — | |||||||||
Less: | — | ||||||||||||||
Distributions to noncontrolling interests | (3,500 | ) | (630 | ) | (7,882 | ) | (2,100 | ) | |||||||
Principal payments paid from operating cash flows | (8,984 | ) | (11,001 | ) | (54,041 | ) | (49,246 | ) | |||||||
Cash available for distribution | $ | 32,851 | $ | 17,304 | $ | 92,448 | $ | 62,149 | |||||||
Three Months Ended December 31, | For the Year Ended December 31, | ||||||||||||||
2015 | 2014 | 2015 | 2014 | ||||||||||||
Net (loss) income | $ | (3,873 | ) | $ | (15,986 | ) | $ | (55,607 | ) | $ | (39,999 | ) | |||
Plus: | |||||||||||||||
Interest expense, net of interest income | 18,886 | 19,044 | 75,309 | 66,729 | |||||||||||
Tax provision | 4,267 | 4,641 | 4,943 | 3,136 | |||||||||||
Depreciation, amortization and accretion | 40,469 | 31,941 | 143,376 | 104,417 | |||||||||||
Amortization of purchase power agreements, net (1) | 771 | — | 1,946 | — | |||||||||||
EBITDA | $ | 60,520 | $ | 39,640 | $ | 169,967 | $ | 134,283 | |||||||
Unrealized loss on energy derivative (1) | 2,391 | (7,265 | ) | 791 | 3,878 | ||||||||||
Loss (gain) on undesignated derivatives, net | 1,908 | 6,062 | 5,490 | 15,743 | |||||||||||
Realized loss on designated derivatives | — | — | 11,221 | — | |||||||||||
Early extinguishment of debt | 828 | — | 4,941 | — | |||||||||||
Net (loss) gain on transactions | 737 | 626 | 3,400 | (13,843 | ) | ||||||||||
Plus, proportionate share from equity accounted investments: | |||||||||||||||
Interest expense, net of interest income | 6,452 | 4,884 | 23,537 | 14,081 | |||||||||||
Tax provision (benefit) | — | — | — | 102 | |||||||||||
Depreciation, amortization and accretion | 6,434 | 4,697 | 22,680 | 13,720 | |||||||||||
Loss (gain) on undesignated derivatives, net | (1,017 | ) | 9,080 | 8,514 | 30,148 | ||||||||||
Adjusted EBITDA | $ | 78,253 | $ | 57,724 | $ | 250,541 | $ | 198,112 | |||||||
(1) Amount is included in electricity sales on the consolidated statements of operations.
Conference Call and Webcast
Pattern Energy will host a conference call and webcast, complete with slide presentation, to discuss these results at 10:30 a.m. Eastern Time on Monday, February 29, 2016. Mike Garland, President and CEO, and Mike Lyon, CFO, will co-chair the call. Participants should call (888) 231-8191 or (647) 427-7450 and ask an operator for the Pattern Energy earnings call. Please dial in 10 minutes prior to the call to secure a line. A replay will be available shortly after the call. To access the replay, please dial (855) 859-2056 or (416) 849-0833 and enter access code 49568100. The replay recording will be available until 11:59 p.m. Eastern Time, March 14, 2016.
A live webcast of the conference call and the accompanying slide presentation will be also available on the events page in the investor section of Pattern’s website at www.patternenergy.com. An archived webcast will be available for one year.
About Pattern Energy
Pattern Energy Group Inc. is an independent power company listed on The NASDAQ Global Select Market and Toronto Stock Exchange. Pattern Energy has a portfolio of 16 operating wind power facilities with a total owned interest of 2,282 MW in the United States, Canada and Chile that use proven, best-in-class technology. Pattern Energy’s wind power facilities generate stable long-term cash flows in attractive markets and provide a solid foundation for the continued growth of the business. For more information, visit www.patternenergy.com.
Cautionary Statement Regarding Forward-Looking Statements
Certain statements contained in this press release constitute "forward-looking statements" within the meaning of the Private Securities Litigation Reform Act of 1995 and "forward-looking information" within the meaning of Canadian securities laws, including statements regarding the ability to grow our CAFD and to achieve the 2016 CAFD estimate, the ability of our portfolio to continue to grow our CAFD in 2016 and the coming years, the ability to not require new capital to be raised for existing business, the ability to continue to grow the list of ROFO assets in 2016, the ability to complete the Grady project and the Broadview projects, and the ability of the joint venture between Pattern Development and CEMEX Energia to achieve its five-year development goal. These forward-looking statements represent the Company’s expectations or beliefs concerning future events, and it is possible that the results described in this press release will not be achieved. These forward-looking statements are subject to risks, uncertainties and other factors, many of which are outside of the Company’s control, which could cause actual results to differ materially from the results discussed in the forward-looking statements.
Any forward-looking statement speaks only as of the date on which it is made, and, except as required by law, the Company does not undertake any obligation to update or revise any forward-looking statement, whether as a result of new information, future events or otherwise. New factors emerge from time to time, and it is not possible for the Company to predict all such factors. When considering these forward-looking statements, you should keep in mind the risk factors and other cautionary statements in the Company's annual report on Form 10-K and any quarterly reports on Form 10-Q. The risk factors and other factors noted therein could cause actual events or the Company's actual results to differ materially from those contained in any forward-looking statement.
# # #
Contacts:
Media Relations Matt Dallas 917-363-1333 | Investor Relations Ross Marshall 416-526-1563 | ||
Pattern Energy Group Inc. Consolidated Balance Sheets (In thousands of U.S. Dollars, except share data) | |||||||
December 31, | |||||||
2015 | 2014 | ||||||
Assets | |||||||
Current assets: | |||||||
Cash and cash equivalents | $ | 94,808 | $ | 101,656 | |||
Restricted cash | 14,609 | 7,945 | |||||
Trade receivables | 45,292 | 35,759 | |||||
Related party receivable | 734 | 671 | |||||
Reimbursable interconnection costs | 38 | 2,532 | |||||
Derivative assets, current | 24,338 | 18,506 | |||||
Current net deferred tax assets | — | 318 | |||||
Prepaid expenses | 14,498 | 15,275 | |||||
Other current assets | 6,891 | 12,679 | |||||
Deferred financing costs, current, net of accumulated amortization of $5,192 and $3,493 as of December 31, 2015 and 2014, respectively | 2,121 | 1,747 | |||||
Total current assets | 203,329 | 197,088 | |||||
Restricted cash | 36,875 | 39,745 | |||||
Turbine advances | — | 79,637 | |||||
Construction in progress | — | 26,195 | |||||
Property, plant and equipment, net of accumulated depreciation of $409,161 and $278,291 as of December 31, 2015 and 2014, respectively | 3,294,620 | 2,350,856 | |||||
Unconsolidated investments | 116,473 | 29,079 | |||||
Derivative assets | 44,014 | 49,369 | |||||
Deferred financing costs | 4,572 | 5,166 | |||||
Net deferred tax assets | 6,804 | 5,474 | |||||
Finite-lived intangible assets, net of accumulated amortization of $4,357 and $154 as of December 31, 2015 and 2014, respectively | 97,722 | 1,257 | |||||
Other assets | 25,183 | 11,421 | |||||
Total assets | $ | 3,829,592 | $ | 2,795,287 | |||
Pattern Energy Group Inc. Consolidated Balance Sheets (In thousands of U.S. Dollars, except share data) | |||||||
December 31, | |||||||
2015 | 2014 | ||||||
Liabilities and equity | |||||||
Current liabilities: | |||||||
Accounts payable and other accrued liabilities | $ | 42,776 | $ | 24,793 | |||
Accrued construction costs | 23,565 | 20,132 | |||||
Related party payable | 1,646 | 5,757 | |||||
Accrued interest | 9,035 | 3,634 | |||||
Dividends payable | 28,022 | 15,734 | |||||
Derivative liabilities, current | 14,343 | 16,307 | |||||
Revolving credit facility | 355,000 | 50,000 | |||||
Current portion of long-term debt, net of financing costs of $3,671 and $11,868 as of December 31, 2015 and 2014, respectively | 44,144 | 109,693 | |||||
Current net deferred tax liabilities | — | 149 | |||||
Other current liabilities | 2,156 | 4,000 | |||||
Total current liabilities | 520,687 | 250,199 | |||||
Long-term debt, net of financing costs of $22,632 and $24,887 as of December 31, 2015 and 2014, respectively | 1,174,380 | 1,304,165 | |||||
Convertible senior notes, net of financing costs of $5,014 and $0 as of December 31, 2015 and 2014, respectively | 197,362 | — | |||||
Derivative liabilities | 28,659 | 17,467 | |||||
Net deferred tax liabilities | 22,183 | 20,418 | |||||
Finite-lived intangible liability, net of accumulated amortization of $2,168 and $0 as of December 31, 2015 and 2014, respectively | 58,132 | — | |||||
Other long-term liabilities | 52,427 | 38,304 | |||||
Total liabilities | 2,053,830 | 1,630,553 | |||||
Commitments and contingencies (Note 18) | |||||||
Equity: | |||||||
Class A common stock, $0.01 par value per share: 500,000,000 shares authorized; 74,644,141 and 62,062,841 shares outstanding as of December 31, 2015 and 2014, respectively | 747 | 621 | |||||
Additional paid-in capital | 982,814 | 723,938 | |||||
Accumulated loss | (77,159 | ) | (44,626 | ) | |||
Accumulated other comprehensive loss | (73,325 | ) | (45,068 | ) | |||
Treasury stock, at cost; 65,301 and 25,465 shares of Class A common stock as of December 31, 2015 and 2014, respectively | (1,577 | ) | (717 | ) | |||
Total equity before noncontrolling interest | 831,500 | 634,148 | |||||
Noncontrolling interest | 944,262 | 530,586 | |||||
Total equity | 1,775,762 | 1,164,734 | |||||
Total liabilities and equity | $ | 3,829,592 | $ | 2,795,287 | |||
Pattern Energy Group Inc.
Consolidated Statements of Operations
(In thousands of U.S. dollars, except per share data)
Three Months Ended December 31, | For the Year Ended December 31, | ||||||||||||||
2015 | 2014 | 2015 | 2014 | ||||||||||||
Revenue: | |||||||||||||||
Electricity sales | $ | 89,023 | $ | 72,328 | $ | 324,275 | $ | 254,669 | |||||||
Related party revenue | 1,010 | 987 | 3,640 | 3,317 | |||||||||||
Other revenue | 564 | 6,103 | 1,916 | 7,507 | |||||||||||
Total revenue | 90,597 | 79,418 | 329,831 | 265,493 | |||||||||||
Cost of revenue: | |||||||||||||||
Project expense | 32,544 | 21,166 | 114,619 | 77,775 | |||||||||||
Depreciation, amortization and accretion | 41,379 | 31,941 | 143,376 | 104,417 | |||||||||||
Total cost of revenue | 73,923 | 53,107 | 257,995 | 182,192 | |||||||||||
Gross profit | 16,674 | 26,311 | 71,836 | 83,301 | |||||||||||
Operating expenses: | |||||||||||||||
General and administrative | 7,498 | 6,570 | 29,807 | 22,533 | |||||||||||
Related party general and administrative | 2,273 | 1,632 | 7,589 | 5,787 | |||||||||||
Total operating expenses | 9,771 | 8,202 | 37,396 | 28,320 | |||||||||||
Operating income | 6,903 | 18,109 | 34,440 | 54,981 | |||||||||||
Other (expense) income: | |||||||||||||||
Interest expense | (19,374 | ) | (19,267 | ) | (77,907 | ) | (67,694 | ) | |||||||
(Loss) gain on undesignated derivatives, net | (1,908 | ) | (6,062 | ) | (5,490 | ) | (15,743 | ) | |||||||
Realized loss on designated derivatives | — | — | (11,221 | ) | — | ||||||||||
Equity in earnings (losses) in unconsolidated investments | 15,351 | (4,057 | ) | 16,119 | (25,295 | ) | |||||||||
Related party income | 636 | 876 | 2,665 | 2,612 | |||||||||||
Early extinguishment of debt | (828 | ) | — | (4,941 | ) | — | |||||||||
Net (loss) gain on transactions | (737 | ) | (626 | ) | (3,400 | ) | 13,843 | ||||||||
Other (expense) income, net | 351 | (318 | ) | (929 | ) | 433 | |||||||||
Total other expense | (6,509 | ) | (29,454 | ) | (85,104 | ) | (91,844 | ) | |||||||
Net (loss) income before income tax | 394 | (11,345 | ) | (50,664 | ) | (36,863 | ) | ||||||||
Tax provision | 4,267 | 4,641 | 4,943 | 3,136 | |||||||||||
Net (loss) income | (3,873 | ) | (15,986 | ) | (55,607 | ) | (39,999 | ) | |||||||
Net (loss) income attributable to noncontrolling interest | (6,327 | ) | 4,406 | (23,074 | ) | (8,709 | ) | ||||||||
Net (loss) income attributable to Pattern Energy | $ | 2,454 | $ | (20,392 | ) | $ | (32,533 | ) | $ | (31,290 | ) | ||||
Loss per share information: | |||||||||||||||
Net (loss) income attributable to Pattern Energy | 2,454 | (20,392 | ) | (32,533 | ) | (31,290 | ) | ||||||||
Dividends declared on Class A common shares | (27,768 | ) | (15,581 | ) | (102,861 | ) | (56,976 | ) | |||||||
Deemed dividends on Class B common shares | — | (7,222 | ) | — | (21,901 | ) | |||||||||
Earnings allocated to participating securities | (8 | ) | — | (32 | ) | — | |||||||||
Undistributed loss attributable to common stockholders | $ | (25,322 | ) | $ | (43,195 | ) | $ | (135,426 | ) | $ | (110,167 | ) | |||
Weighted average number of shares: | |||||||||||||||
Class A common stock - Basic and diluted | 74,398,729 | 46,335,288 | 70,535,568 | 42,361,959 | |||||||||||
Class B common stock - Basic and diluted | — | 15,555,000 | — | 15,555,000 | |||||||||||
Loss per share | |||||||||||||||
Class A common stock: | |||||||||||||||
Basic and diluted loss per share | $ | 0.03 | $ | (0.36 | ) | $ | (0.46 | ) | $ | (0.56 | ) | ||||
Class B common stock: | |||||||||||||||
Basic and diluted loss per share | $ | — | $ | (0.23 | ) | $ | — | $ | (0.49 | ) | |||||
Dividends declared per Class A common share | $ | 0.37 | $ | 0.34 | $ | 1.43 | $ | 1.30 | |||||||
Deemed dividends per Class B common share | $ | — | $ | 0.46 | $ | — | $ | 1.41 | |||||||
Pattern Energy Group Inc.
Consolidated Statements of Cash Flows
(In thousands of U.S. dollars)
Three Months Ended December 31, | For the Year Ended December 31, | ||||||||||||||
2015 | 2014 | 2015 | 2014 | ||||||||||||
Operating activities | |||||||||||||||
Net loss | $ | (3,873 | ) | $ | (15,986 | ) | $ | (55,607 | ) | $ | (39,999 | ) | |||
Adjustments to reconcile net loss to net cash provided by operating activities: | |||||||||||||||
Depreciation, amortization and accretion | 41,268 | 31,941 | 143,376 | 104,417 | |||||||||||
Impairment loss | — | — | 398 | — | |||||||||||
Amortization of financing costs | 1,854 | 2,063 | 7,435 | 6,309 | |||||||||||
Loss (gain) on derivatives, net | 1,426 | (2,196 | ) | 2,219 | 15,546 | ||||||||||
Stock-based compensation | 1,228 | 977 | 4,462 | 4,105 | |||||||||||
Net gain on transactions | — | — | — | (16,526 | ) | ||||||||||
Deferred taxes | 4,154 | 4,453 | 4,494 | 2,948 | |||||||||||
Equity in (earnings) losses in unconsolidated investments | (15,367 | ) | 4,057 | (16,180 | ) | 25,295 | |||||||||
Unrealized loss on exchange rate changes | — | — | 823 | — | |||||||||||
Amortization of power purchase agreements, net | 771 | — | 1,946 | — | |||||||||||
Amortization of debt discount/premium, net | 862 | — | 1,660 | — | |||||||||||
Realized loss on designated derivatives | 1,029 | — | 11,221 | — | |||||||||||
Early extinguishment of debt | 764 | — | 4,722 | — | |||||||||||
Changes in operating assets and liabilities: | |||||||||||||||
Trade receivables | (7,911 | ) | (3,000 | ) | (2,254 | ) | (8,255 | ) | |||||||
Prepaid expenses | (2,722 | ) | (1,401 | ) | 1,272 | (4,100 | ) | ||||||||
Other current assets | 3,654 | 1,178 | (2,929 | ) | 17,016 | ||||||||||
Other assets (non-current) | (314 | ) | (146 | ) | (2,336 | ) | (649 | ) | |||||||
Accounts payable and other accrued liabilities | 536 | 2,025 | 4,716 | 3,667 | |||||||||||
Related party receivable/payable | 205 | 75 | 711 | (942 | ) | ||||||||||
Accrued interest payable | 2,519 | 2,294 | 4,489 | 1,377 | |||||||||||
Contingent liabilities | (249 | ) | — | 515 | — | ||||||||||
Long-term liabilities | 2,613 | 214 | 2,696 | 239 | |||||||||||
Increase in restricted cash | — | — | (2,120 | ) | — | ||||||||||
Decrease in restricted cash | 2,120 | — | 2,120 | — | |||||||||||
Net cash provided by operating activities | 34,567 | 26,548 | 117,849 | 110,448 | |||||||||||
Investing activities | |||||||||||||||
Cash paid for acquisitions, net of cash acquired | $ | (27,508 | ) | $ | (138,999 | ) | $ | (433,792 | ) | $ | (306,584 | ) | |||
Decrease in restricted cash | 20,763 | 22,839 | 62,583 | 46,700 | |||||||||||
Increase in restricted cash | (23,442 | ) | (30,384 | ) | (57,332 | ) | (40,790 | ) | |||||||
Capital expenditures | (64,504 | ) | (100,891 | ) | (380,458 | ) | (119,506 | ) | |||||||
Distribution from unconsolidated investments | 14,746 | 4,915 | 38,240 | 22,019 | |||||||||||
Contribution to unconsolidated investments | (3 | ) | (331 | ) | (3 | ) | (2,651 | ) | |||||||
Reimbursable interconnection receivable | 625 | 2,474 | 2,494 | 3,892 | |||||||||||
Other assets | 284 | 15,068 | 3,065 | 17,540 | |||||||||||
Net cash (used in) provided by investing activities | (79,039 | ) | (225,309 | ) | (765,203 | ) | (379,380 | ) | |||||||
Three Months Ended December 31, | For the Year Ended December 31, | ||||||||||||||
2015 | 2014 | 2015 | 2014 | ||||||||||||
Financing activities | |||||||||||||||
Proceeds from public offering, net of issuance costs | $ | (390 | ) | $ | (77 | ) | $ | 317,432 | $ | 286,757 | |||||
Proceeds from issuance of convertible senior notes, net of issuance costs | (628 | ) | — | 218,929 | — | ||||||||||
Proceeds from exercise of stock options | — | 54 | — | 327 | |||||||||||
Repurchase of shares for employee tax withholding | (529 | ) | (313 | ) | (860 | ) | (693 | ) | |||||||
Dividends paid | (27,127 | ) | (15,240 | ) | (90,582 | ) | (52,344 | ) | |||||||
Payment for deferred equity issuance costs | 1,940 | (550 | ) | — | (550 | ) | |||||||||
Buyout of noncontrolling interests | — | — | (121,224 | ) | — | ||||||||||
Capital contributions - noncontrolling interest | 142,979 | 198,255 | 336,043 | 200,805 | |||||||||||
Capital distributions - noncontrolling interest | (3,500 | ) | (630 | ) | (7,882 | ) | (2,100 | ) | |||||||
Decrease in restricted cash | 14,789 | 6,119 | 56,218 | 19,627 | |||||||||||
Increase in restricted cash | (13,408 | ) | (4,395 | ) | (54,592 | ) | (17,903 | ) | |||||||
Refund of deposit for letters of credit | — | (3,422 | ) | 3,425 | (3,422 | ) | |||||||||
Payment for deferred financing costs | (5,222 | ) | (11,253 | ) | (13,667 | ) | (11,856 | ) | |||||||
Proceeds from revolving credit facility | 110,000 | 50,000 | 405,000 | 50,000 | |||||||||||
Repayment of revolving credit facility | — | — | (100,000 | ) | — | ||||||||||
Proceeds from construction loans | 34,568 | 58,691 | 329,070 | 59,778 | |||||||||||
Proceeds from long-term debt | 164,973 | — | 164,973 | — | |||||||||||
Repayment of long-term debt | (380,887 | ) | (206,352 | ) | (785,923 | ) | (259,437 | ) | |||||||
Payment for interest rate derivatives | — | — | (11,061 | ) | — | ||||||||||
Net cash provided by financing activities | 37,558 | 70,887 | 645,299 | 268,989 | |||||||||||
Effect of exchange rate changes on cash and cash equivalents | (1,474 | ) | (1,128 | ) | (4,793 | ) | (1,970 | ) | |||||||
Net change in cash and cash equivalents | (8,388 | ) | (129,002 | ) | (6,848 | ) | (1,913 | ) | |||||||
Cash and cash equivalents at beginning of period | 103,196 | 230,658 | 101,656 | 103,569 | |||||||||||
Cash and cash equivalents at end of period | $ | 94,808 | $ | 101,656 | $ | 94,808 | $ | 101,656 | |||||||
Supplemental disclosures | |||||||||||||||
Cash payments for income taxes | $ | 342 | $ | 131 | $ | 342 | $ | 131 | |||||||
Cash payments for interest expense, net of capitalized interest | 24,366 | 14,012 | 62,607 | 53,776 | |||||||||||
Acquired property, plant and equipment from acquisitions | 2,122 | 338,622 | 581,834 | 1,013,365 | |||||||||||
Equity issuance costs paid in prior period related to current period offerings | (866 | ) | — | (433 | ) | — | |||||||||
Schedule of non-cash activities | |||||||||||||||
Change in fair value of designated interest rate swaps | $ | 8,700 | $ | (10,604 | ) | $ | 13,210 | $ | (22,847 | ) | |||||
Change in property, plant and equipment | (5,049 | ) | (23,333 | ) | 15,695 | (47,908 | ) | ||||||||
Non-cash deemed dividends on Class B convertible common stock | — | 7,222 | — | 21,901 | |||||||||||
Non-cash increase in additional paid-in capital from buyout of noncontrolling interests | — | — | 16,715 | — | |||||||||||
Amortization of deferred financing costs—included as construction in progress | — | 343 | — | 343 | |||||||||||
Assumption of contingent liability upon acquisition of Logan’s Gap | — | (4,000 | ) | — | (4,000 | ) | |||||||||
PATTERN ENERGY GROUP INC. Q4 2015 Earnings Call | February 29, 2016 Exhibit 99.2
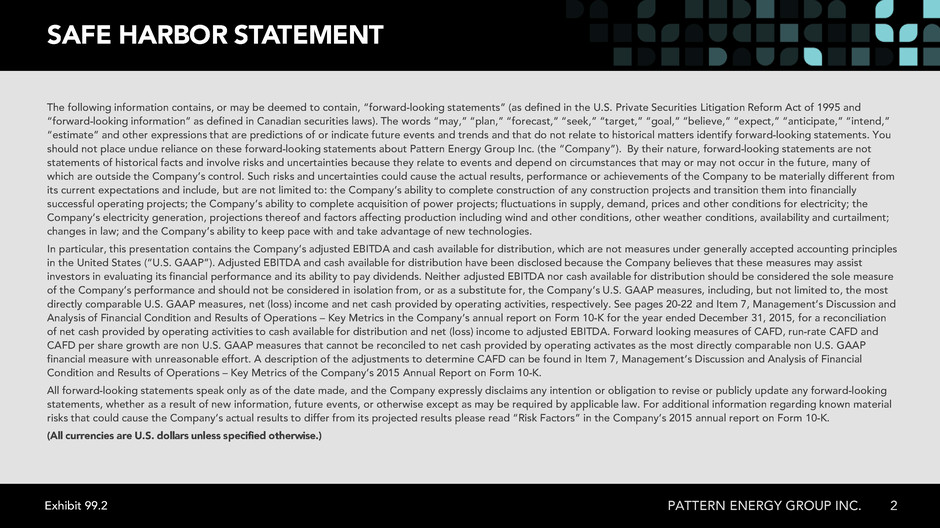
SAFE HARBOR STATEMENT 2PATTERN ENERGY GROUP INC. The following information contains, or may be deemed to contain, “forward-looking statements” (as defined in the U.S. Private Securities Litigation Reform Act of 1995 and “forward-looking information” as defined in Canadian securities laws). The words “may,” “plan,” “forecast,” “seek,” “target,” “goal,” “believe,” “expect,” “anticipate,” “intend,” “estimate” and other expressions that are predictions of or indicate future events and trends and that do not relate to historical matters identify forward-looking statements. You should not place undue reliance on these forward-looking statements about Pattern Energy Group Inc. (the “Company”). By their nature, forward-looking statements are not statements of historical facts and involve risks and uncertainties because they relate to events and depend on circumstances that may or may not occur in the future, many of which are outside the Company’s control. Such risks and uncertainties could cause the actual results, performance or achievements of the Company to be materially different from its current expectations and include, but are not limited to: the Company’s ability to complete construction of any construction projects and transition them into financially successful operating projects; the Company’s ability to complete acquisition of power projects; fluctuations in supply, demand, prices and other conditions for electricity; the Company’s electricity generation, projections thereof and factors affecting production including wind and other conditions, other weather conditions, availability and curtailment; changes in law; and the Company’s ability to keep pace with and take advantage of new technologies. In particular, this presentation contains the Company’s adjusted EBITDA and cash available for distribution, which are not measures under generally accepted accounting principles in the United States (“U.S. GAAP”). Adjusted EBITDA and cash available for distribution have been disclosed because the Company believes that these measures may assist investors in evaluating its financial performance and its ability to pay dividends. Neither adjusted EBITDA nor cash available for distribution should be considered the sole measure of the Company’s performance and should not be considered in isolation from, or as a substitute for, the Company’s U.S. GAAP measures, including, but not limited to, the most directly comparable U.S. GAAP measures, net (loss) income and net cash provided by operating activities, respectively. See pages 20-22 and Item 7, Management’s Discussion and Analysis of Financial Condition and Results of Operations – Key Metrics in the Company’s annual report on Form 10-K for the year ended December 31, 2015, for a reconciliation of net cash provided by operating activities to cash available for distribution and net (loss) income to adjusted EBITDA. Forward looking measures of CAFD, run-rate CAFD and CAFD per share growth are non U.S. GAAP measures that cannot be reconciled to net cash provided by operating activates as the most directly comparable non U.S. GAAP financial measure with unreasonable effort. A description of the adjustments to determine CAFD can be found in Item 7, Management’s Discussion and Analysis of Financial Condition and Results of Operations – Key Metrics of the Company’s 2015 Annual Report on Form 10-K. All forward-looking statements speak only as of the date made, and the Company expressly disclaims any intention or obligation to revise or publicly update any forward-looking statements, whether as a result of new information, future events, or otherwise except as may be required by applicable law. For additional information regarding known material risks that could cause the Company’s actual results to differ from its projected results please read “Risk Factors” in the Company’s 2015 annual report on Form 10-K. (All currencies are U.S. dollars unless specified otherwise.) Exhibit 99.2
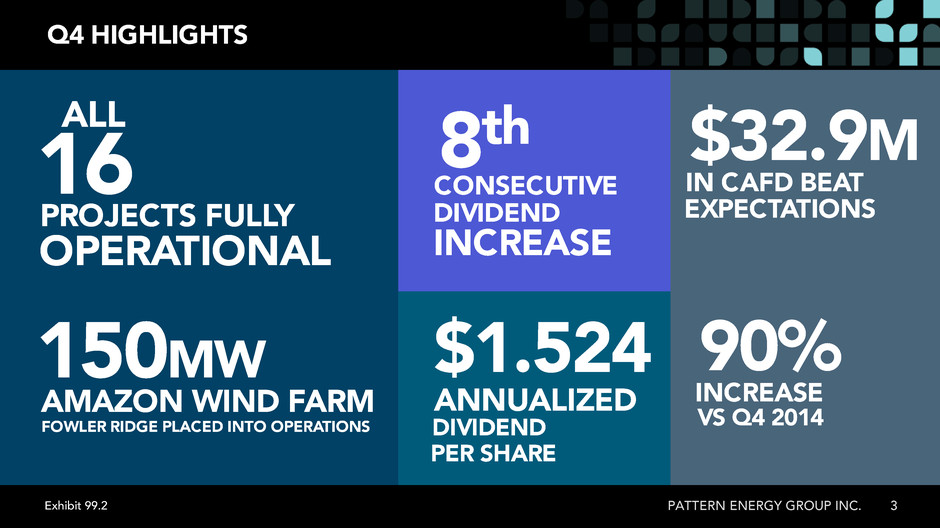
Q4 HIGHLIGHTS 3PATTERN ENERGY GROUP INC. DIVIDEND CONSECUTIVE INCREASE ANNUALIZED PER SHARE OPERATIONAL ALL $1.524 16 8th PROJECTS FULLY 150MW AMAZON WIND FARM FOWLER RIDGE PLACED INTO OPERATIONS DIVIDEND $32.9M IN CAFD BEAT 90% INCREASE EXPECTATIONS VS Q4 2014 Exhibit 99.2
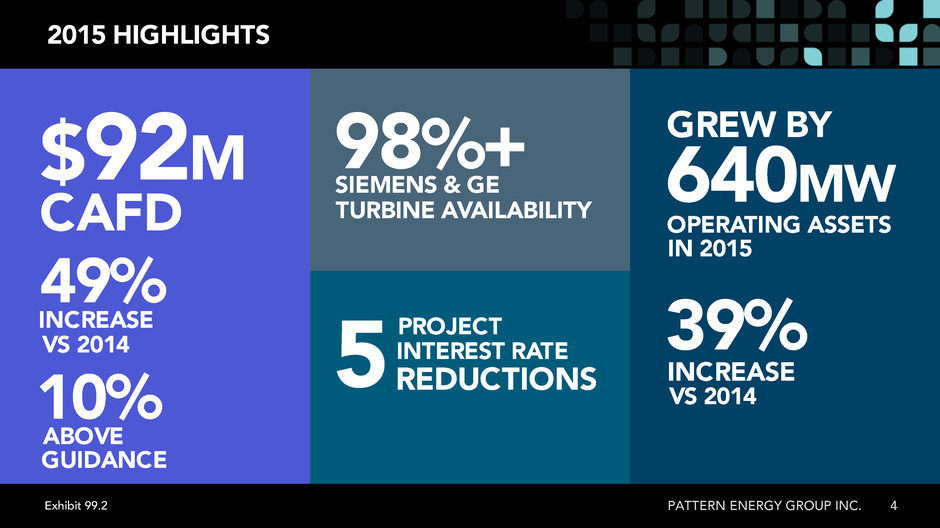
2015 HIGHLIGHTS 4PATTERN ENERGY GROUP INC. $92M CAFD 10% INTEREST RATE PROJECT REDUCTIONS ABOVE GUIDANCE 5 640MW GREW BY OPERATING ASSETS 98%+ TURBINE AVAILABILITY SIEMENS & GE 39% INCREASE 49% INCREASE VS 2014 IN 2015 VS 2014 Exhibit 99.2
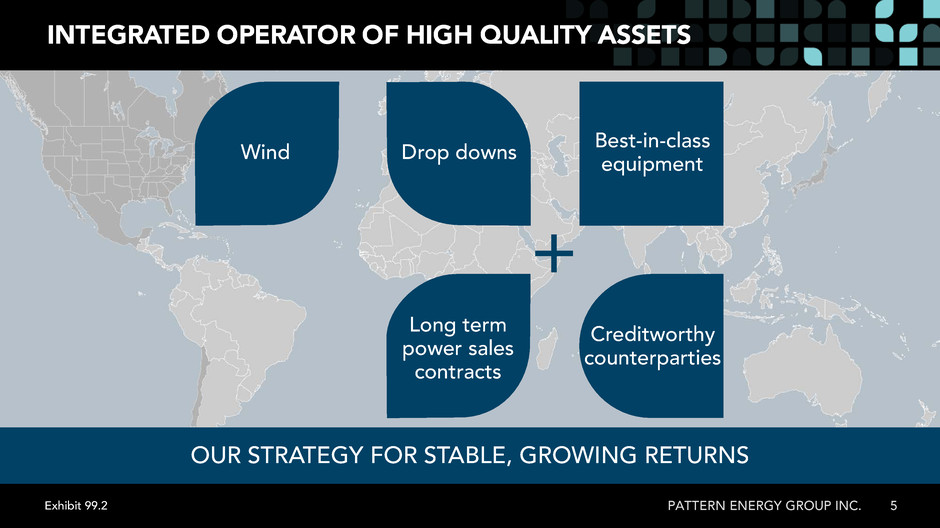
INTEGRATED OPERATOR OF HIGH QUALITY ASSETS 5 + Drop downs Best-in-class equipment OUR STRATEGY FOR STABLE, GROWING RETURNS Creditworthy counterparties Long term power sales contracts PATTERN ENERGY GROUP INC. Wind Exhibit 99.2
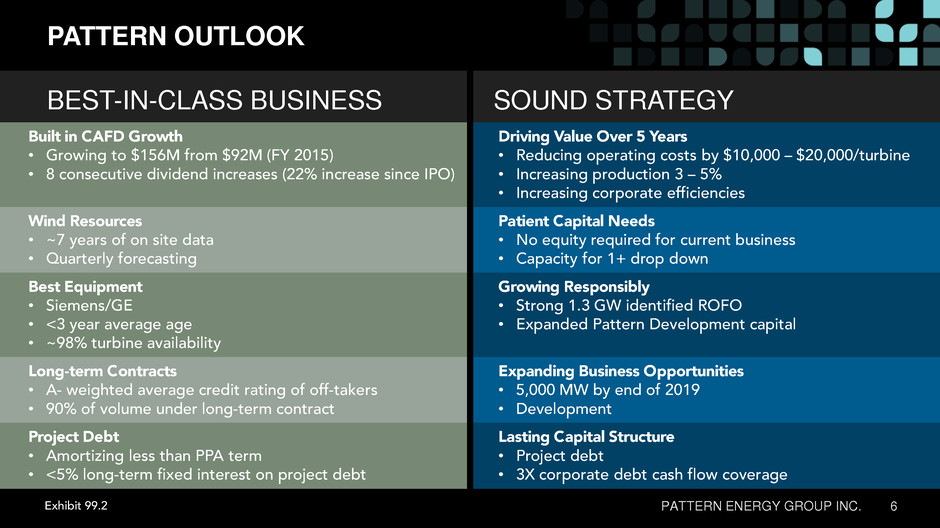
PATTERN OUTLOOK PATTERN ENERGY GROUP INC. 6 SOUND STRATEGYBEST-IN-CLASS BUSINESS Built in CAFD Growth • Growing to $156M from $92M (FY 2015) • 8 consecutive dividend increases (22% increase since IPO) Driving Value Over 5 Years • Reducing operating costs by $10,000 – $20,000/turbine • Increasing production 3 – 5% • Increasing corporate efficiencies Wind Resources • ~7 years of on site data • Quarterly forecasting Patient Capital Needs • No equity required for current business • Capacity for 1+ drop down Best Equipment • Siemens/GE • <3 year average age • ~98% turbine availability Growing Responsibly • Strong 1.3 GW identified ROFO • Expanded Pattern Development capital Long-term Contracts • A- weighted average credit rating of off-takers • 90% of volume under long-term contract Expanding Business Opportunities • 5,000 MW by end of 2019 • Development Project Debt • Amortizing less than PPA term • <5% long-term fixed interest on project debt Lasting Capital Structure • Project debt • 3X corporate debt cash flow coverage Exhibit 99.2
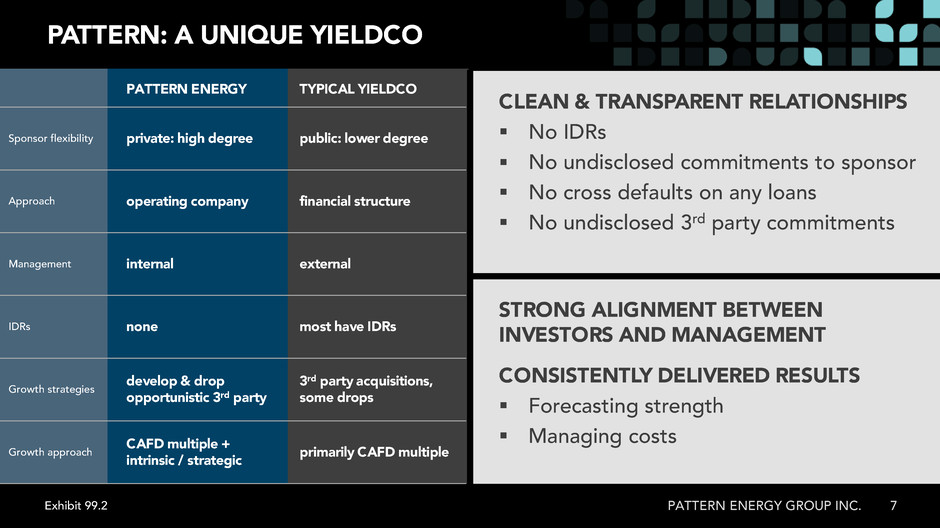
PATTERN: A UNIQUE YIELDCO 7PATTERN ENERGY GROUP INC. PATTERN ENERGY TYPICAL YIELDCO Sponsor flexibility private: high degree public: lower degree Approach operating company financial structure Management internal external IDRs none most have IDRs Growth strategies develop & drop opportunistic 3rd party 3rd party acquisitions, some drops Growth approach CAFD multiple + intrinsic / strategic primarily CAFD multiple CLEAN & TRANSPARENT RELATIONSHIPS No IDRs No undisclosed commitments to sponsor No cross defaults on any loans No undisclosed 3rd party commitments STRONG ALIGNMENT BETWEEN INVESTORS AND MANAGEMENT CONSISTENTLY DELIVERED RESULTS Forecasting strength Managing costs Exhibit 99.2
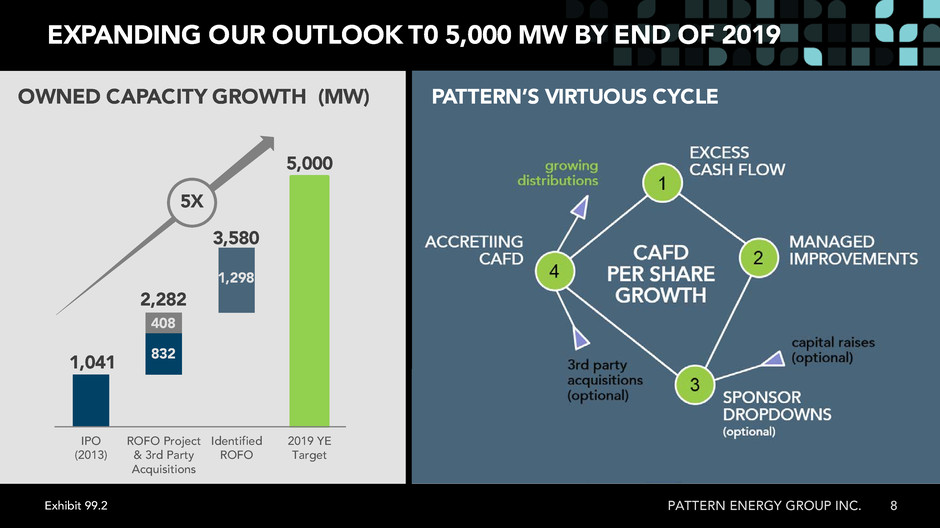
EXPANDING OUR OUTLOOK T0 5,000 MW BY END OF 2019 PATTERN ENERGY GROUP INC. 8 1,041 IPO (2013) ROFO Project & 3rd Party Acquisitions Identified ROFO 2019 YE Target 3,580 5,000 OWNED CAPACITY GROWTH (MW) 5X 2,282 408 832 1,298 PATTERN’S VIRTUOUS CYCLE Exhibit 99.2
FINANCIALS Exhibit 99.2
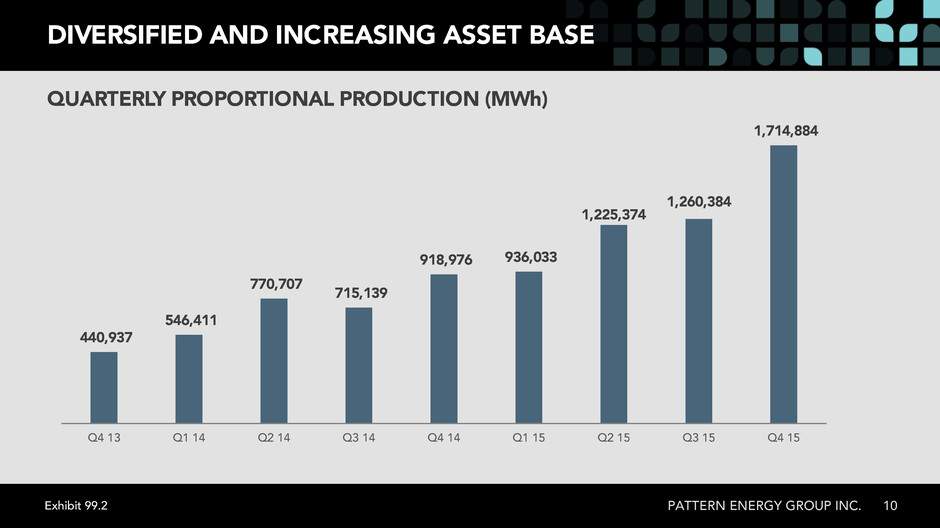
DIVERSIFIED AND INCREASING ASSET BASE 10PATTERN ENERGY GROUP INC. 440,937 546,411 770,707 715,139 918,976 936,033 1,225,374 1,260,384 1,714,884 Q4 13 Q1 14 Q2 14 Q3 14 Q4 14 Q1 15 Q2 15 Q3 15 Q4 15 QUARTERLY PROPORTIONAL PRODUCTION (MWh) Exhibit 99.2
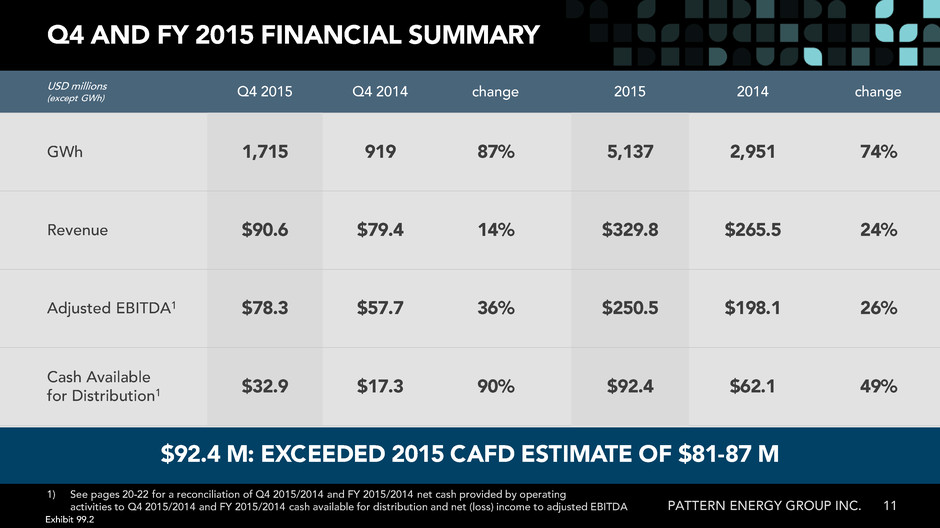
Q4 AND FY 2015 FINANCIAL SUMMARY 11PATTERN ENERGY GROUP INC. 1) See pages 20-22 for a reconciliation of Q4 2015/2014 and FY 2015/2014 net cash provided by operating activities to Q4 2015/2014 and FY 2015/2014 cash available for distribution and net (loss) income to adjusted EBITDA $92.4 M: EXCEEDED 2015 CAFD ESTIMATE OF $81-87 M USD millions (except GWh) Q4 2015 Q4 2014 change 2015 2014 change GWh 1,715 919 87% 5,137 2,951 74% Revenue $90.6 $79.4 14% $329.8 $265.5 24% Adjusted EBITDA1 $78.3 $57.7 36% $250.5 $198.1 26% Cash Available for Distribution1 $32.9 $17.3 90% $92.4 $62.1 49% Exhibit 99.2
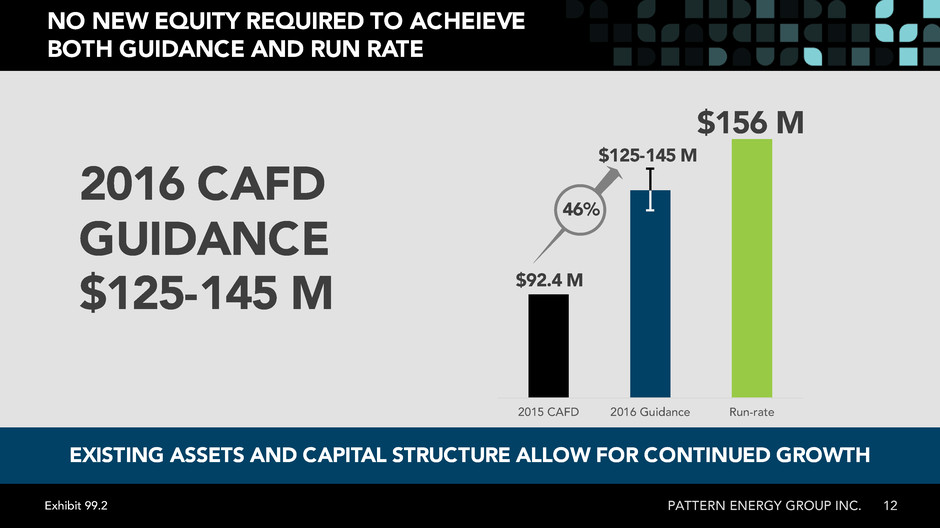
2015 CAFD 2016 Guidance Run-rate NO NEW EQUITY REQUIRED TO ACHEIEVE BOTH GUIDANCE AND RUN RATE PATTERN ENERGY GROUP INC. 12 EXISTING ASSETS AND CAPITAL STRUCTURE ALLOW FOR CONTINUED GROWTH $92.4 M $156 M 2016 CAFD $125-145 M GUIDANCE 46% $125-145 M Exhibit 99.2
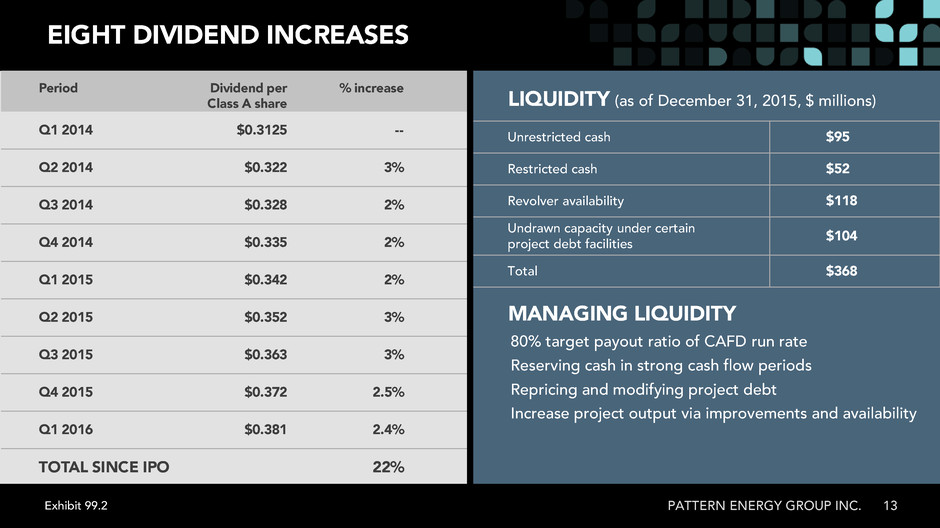
EIGHT DIVIDEND INCREASES 13PATTERN ENERGY GROUP INC. LIQUIDITY (as of December 31, 2015, $ millions) MANAGING LIQUIDITY Unrestricted cash $95 Restricted cash $52 Revolver availability $118 Undrawn capacity under certain project debt facilities $104 Total $368 80% target payout ratio of CAFD run rate Reserving cash in strong cash flow periods Repricing and modifying project debt Increase project output via improvements and availability Period Dividend per Class A share % increase Q1 2014 $0.3125 -- Q2 2014 $0.322 3% Q3 2014 $0.328 2% Q4 2014 $0.335 2% Q1 2015 $0.342 2% Q2 2015 $0.352 3% Q3 2015 $0.363 3% Q4 2015 $0.372 2.5% Q1 2016 $0.381 2.4% TOTAL SINCE IPO 22% Exhibit 99.2
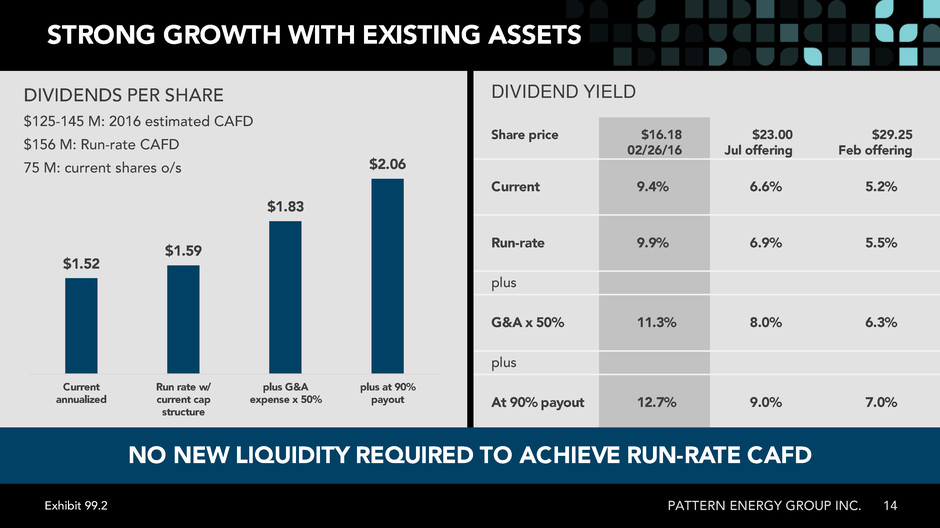
STRONG GROWTH WITH EXISTING ASSETS 14PATTERN ENERGY GROUP INC. DIVIDEND YIELD Share price $16.18 02/26/16 $23.00 Jul offering $29.25 Feb offering Current 9.4% 6.6% 5.2% Run-rate 9.9% 6.9% 5.5% plus G&A x 50% 11.3% 8.0% 6.3% plus At 90% payout 12.7% 9.0% 7.0% $1.52 $1.59 $1.83 $2.06 Current annualized Run rate w/ current cap structure plus G&A expense x 50% plus at 90% payout NO NEW LIQUIDITY REQUIRED TO ACHIEVE RUN-RATE CAFD DIVIDENDS PER SHARE $125-145 M: 2016 estimated CAFD $156 M: Run-rate CAFD 75 M: current shares o/s Exhibit 99.2

CLOSING REMARKS Exhibit 99.2
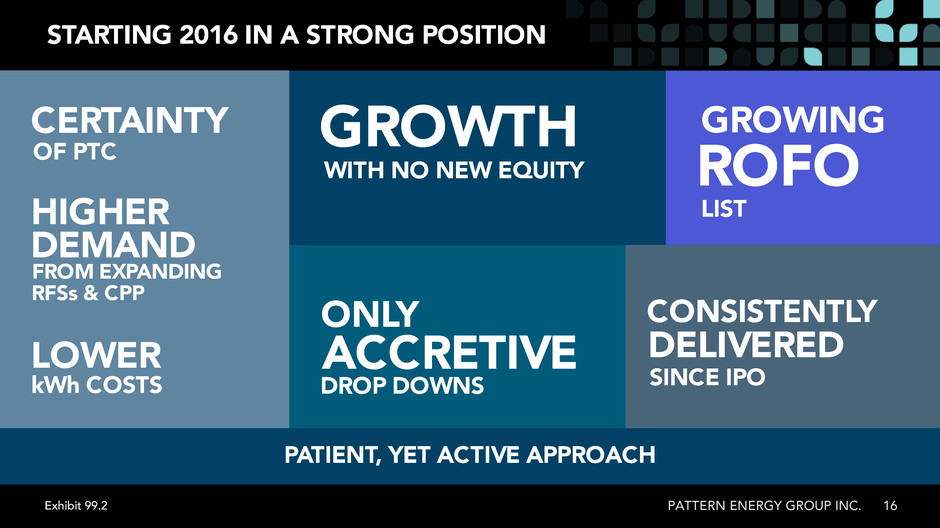
STARTING 2016 IN A STRONG POSITION 16PATTERN ENERGY GROUP INC. CERTAINTY GROWTH WITH NO NEW EQUITY ROFO GROWING LIST DELIVERED SINCE IPO CONSISTENTLY OF PTC HIGHER PATIENT, YET ACTIVE APPROACH DEMAND FROM EXPANDING DROP DOWNS ACCRETIVE RFSs & CPP LOWER kWh COSTS ONLY Exhibit 99.2
PATTERN ENERGY GROUP INC. Q&A | FEBRUARY 29, 2016 Exhibit 99.2
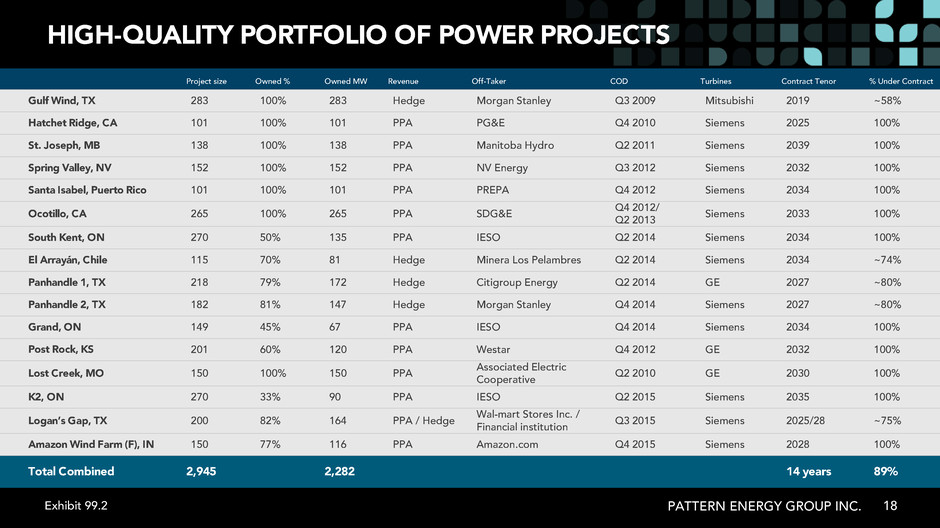
Project size Owned % Owned MW Revenue Off-Taker COD Turbines Contract Tenor % Under Contract Gulf Wind, TX 283 100% 283 Hedge Morgan Stanley Q3 2009 Mitsubishi 2019 ~58% Hatchet Ridge, CA 101 100% 101 PPA PG&E Q4 2010 Siemens 2025 100% St. Joseph, MB 138 100% 138 PPA Manitoba Hydro Q2 2011 Siemens 2039 100% Spring Valley, NV 152 100% 152 PPA NV Energy Q3 2012 Siemens 2032 100% Santa Isabel, Puerto Rico 101 100% 101 PPA PREPA Q4 2012 Siemens 2034 100% Ocotillo, CA 265 100% 265 PPA SDG&E Q4 2012/ Q2 2013 Siemens 2033 100% South Kent, ON 270 50% 135 PPA IESO Q2 2014 Siemens 2034 100% El Arrayán, Chile 115 70% 81 Hedge Minera Los Pelambres Q2 2014 Siemens 2034 ~74% Panhandle 1, TX 218 79% 172 Hedge Citigroup Energy Q2 2014 GE 2027 ~80% Panhandle 2, TX 182 81% 147 Hedge Morgan Stanley Q4 2014 Siemens 2027 ~80% Grand, ON 149 45% 67 PPA IESO Q4 2014 Siemens 2034 100% Post Rock, KS 201 60% 120 PPA Westar Q4 2012 GE 2032 100% Lost Creek, MO 150 100% 150 PPA Associated Electric Cooperative Q2 2010 GE 2030 100% K2, ON 270 33% 90 PPA IESO Q2 2015 Siemens 2035 100% Logan’s Gap, TX 200 82% 164 PPA / Hedge Wal-mart Stores Inc. / Financial institution Q3 2015 Siemens 2025/28 ~75% Amazon Wind Farm (F), IN 150 77% 116 PPA Amazon.com Q4 2015 Siemens 2028 100% Total Combined 2,945 2,282 14 years 89% 18PATTERN ENERGY GROUP INC. HIGH-QUALITY PORTFOLIO OF POWER PROJECTS Exhibit 99.2
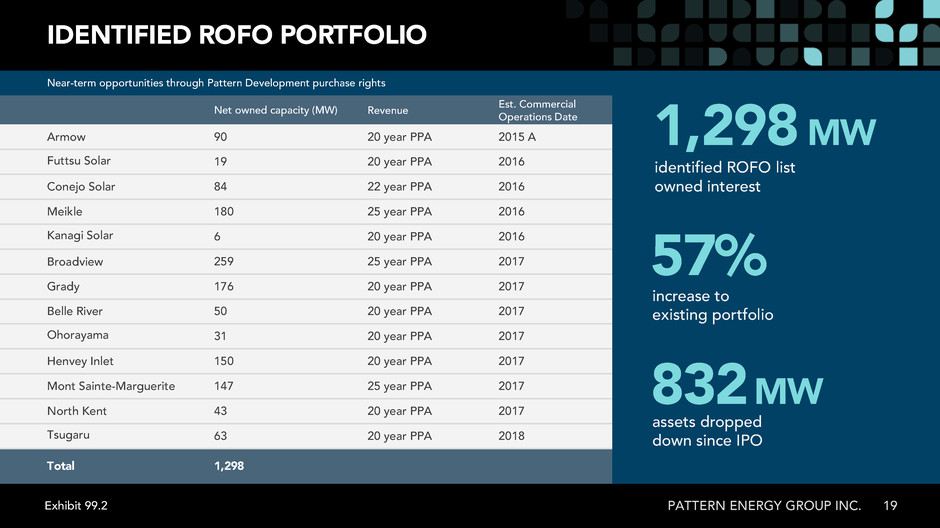
IDENTIFIED ROFO PORTFOLIO 19 Near-term opportunities through Pattern Development purchase rights Net owned capacity (MW) Revenue Est. Commercial Operations Date Armow 90 20 year PPA 2015 A Futtsu Solar 19 20 year PPA 2016 Conejo Solar 84 22 year PPA 2016 Meikle 180 25 year PPA 2016 Kanagi Solar 6 20 year PPA 2016 Broadview 259 25 year PPA 2017 Grady 176 20 year PPA 2017 Belle River 50 20 year PPA 2017 Ohorayama 31 20 year PPA 2017 Henvey Inlet 150 20 year PPA 2017 Mont Sainte-Marguerite 147 25 year PPA 2017 North Kent 43 20 year PPA 2017 Tsugaru 63 20 year PPA 2018 Total 1,298 PATTERN ENERGY GROUP INC. 1,298 MW identified ROFO list owned interest assets dropped down since IPO 832MW 57% increase to existing portfolio Exhibit 99.2
CASH AVAILABLE FOR DISTRIBUTION* (NON-GAAP RECONCILIATION) PATTERN ENERGY GROUP INC. 20 Three Months Ended December 31, For the Year Ended December 31, 2015 2014 2015 2014 Net cash provided by operating activities $34,567 $26,548 $117,849 $110,448 Changes in operating assets and liabilities (451) (1,282) (6,880) (9,002) Network upgrade reimbursement 618 -- 2,472 2,472 Release of restricted cash to fund project and general and administrative costs 110 13 1,611 223 Operations and maintenance capital expenditures (485) (133) (779) (267) Transaction costs for acquisitions (228) 602 1,598 1,730 Distributions from unconsolidated investments 10,722 3,187 34,216 7,891 Reduction of other asset - Gulf Wind energy derivative deposit 850 -- 6,205 -- Other (368) -- (1,921) -- Less: -- Distributions to noncontrolling interests (3,500) (630) (7,882) (2,100) Principal payments paid from operating cash flows (8,984) (11,001) (54,041) (49,246) Cash available for distribution $32,851 $17,304 $92,448 $62,149 Exhibit 99.2
ADJUSTED EBITDA* (NON-GAAP RECONCILATION) PATTERN ENERGY GROUP INC. 21 Three months ended December 31, For the Year Ended December 31, 2015 2014 2015 2014 Net (loss) income $(3,873) $(15,986) $(55,607) $(39,999) Plus: Interest expense, net of interest income 18,886 19,044 75,309 66,729 Tax provision 4,267 4,641 4,943 3,136 Depreciation, amortization and accretion 40,469 31,941 143,376 104,417 Amortization of purchase power agreements, net (1) 771 -- 1,946 -- EBITDA $60,520 $39,640 $169,967 $134,283 Unrealized loss on energy derivative (1) 2,391 (7,265) 791 3,878 Loss (gain) on undesignated derivatives, net 1,908 6,062 5,490 15,743 Realized loss on designated derivatives -- -- 11,221 -- Early extinguishment of debt 828 -- 4,941 -- Net (loss) gain on transactions 737 626 3,400 (13,843) Plus, proportionate share from equity accounted investments: Interest expense, net of interest income 6,452 4,884 23,537 14,081 Tax provision (benefit) -- -- -- 102 Depreciation, amortization and accretion 6,434 4,697 22,680 13,720 Loss (gain) on undesignated derivatives, net (1,017) 9,080 8,514 30,148 Adjusted EBITDA $78,253 $57,724 $250,541 $198,112 (1) Amount is included in electricity sales on the consolidated statements of operations. Exhibit 99.2
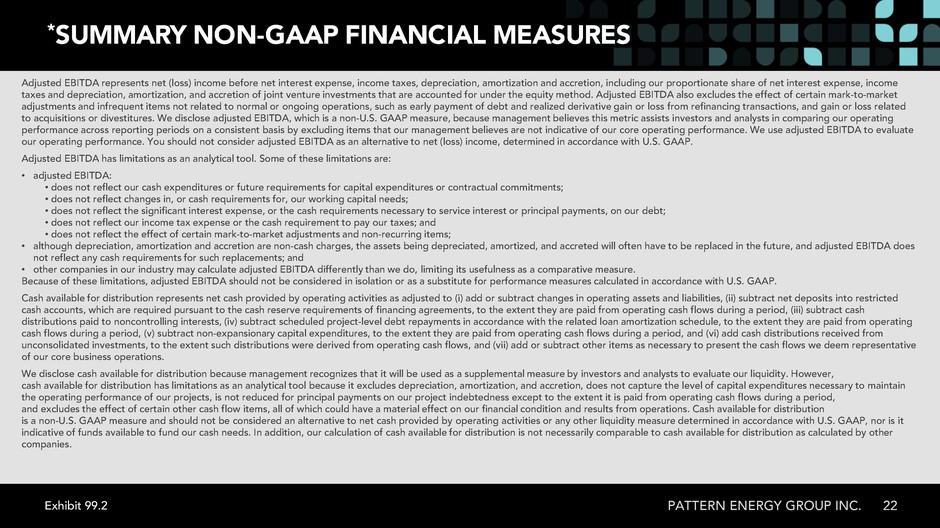
*SUMMARY NON-GAAP FINANCIAL MEASURES Adjusted EBITDA represents net (loss) income before net interest expense, income taxes, depreciation, amortization and accretion, including our proportionate share of net interest expense, income taxes and depreciation, amortization, and accretion of joint venture investments that are accounted for under the equity method. Adjusted EBITDA also excludes the effect of certain mark-to-market adjustments and infrequent items not related to normal or ongoing operations, such as early payment of debt and realized derivative gain or loss from refinancing transactions, and gain or loss related to acquisitions or divestitures. We disclose adjusted EBITDA, which is a non-U.S. GAAP measure, because management believes this metric assists investors and analysts in comparing our operating performance across reporting periods on a consistent basis by excluding items that our management believes are not indicative of our core operating performance. We use adjusted EBITDA to evaluate our operating performance. You should not consider adjusted EBITDA as an alternative to net (loss) income, determined in accordance with U.S. GAAP. Adjusted EBITDA has limitations as an analytical tool. Some of these limitations are: • adjusted EBITDA: • does not reflect our cash expenditures or future requirements for capital expenditures or contractual commitments; • does not reflect changes in, or cash requirements for, our working capital needs; • does not reflect the significant interest expense, or the cash requirements necessary to service interest or principal payments, on our debt; • does not reflect our income tax expense or the cash requirement to pay our taxes; and • does not reflect the effect of certain mark-to-market adjustments and non-recurring items; • although depreciation, amortization and accretion are non-cash charges, the assets being depreciated, amortized, and accreted will often have to be replaced in the future, and adjusted EBITDA does not reflect any cash requirements for such replacements; and • other companies in our industry may calculate adjusted EBITDA differently than we do, limiting its usefulness as a comparative measure. Because of these limitations, adjusted EBITDA should not be considered in isolation or as a substitute for performance measures calculated in accordance with U.S. GAAP. Cash available for distribution represents net cash provided by operating activities as adjusted to (i) add or subtract changes in operating assets and liabilities, (ii) subtract net deposits into restricted cash accounts, which are required pursuant to the cash reserve requirements of financing agreements, to the extent they are paid from operating cash flows during a period, (iii) subtract cash distributions paid to noncontrolling interests, (iv) subtract scheduled project-level debt repayments in accordance with the related loan amortization schedule, to the extent they are paid from operating cash flows during a period, (v) subtract non-expansionary capital expenditures, to the extent they are paid from operating cash flows during a period, and (vi) add cash distributions received from unconsolidated investments, to the extent such distributions were derived from operating cash flows, and (vii) add or subtract other items as necessary to present the cash flows we deem representative of our core business operations. We disclose cash available for distribution because management recognizes that it will be used as a supplemental measure by investors and analysts to evaluate our liquidity. However, cash available for distribution has limitations as an analytical tool because it excludes depreciation, amortization, and accretion, does not capture the level of capital expenditures necessary to maintain the operating performance of our projects, is not reduced for principal payments on our project indebtedness except to the extent it is paid from operating cash flows during a period, and excludes the effect of certain other cash flow items, all of which could have a material effect on our financial condition and results from operations. Cash available for distribution is a non-U.S. GAAP measure and should not be considered an alternative to net cash provided by operating activities or any other liquidity measure determined in accordance with U.S. GAAP, nor is it indicative of funds available to fund our cash needs. In addition, our calculation of cash available for distribution is not necessarily comparable to cash available for distribution as calculated by other companies. PATTERN ENERGY GROUP INC. 22Exhibit 99.2
Serious News for Serious Traders! Try StreetInsider.com Premium Free!
You May Also Be Interested In
- In HelloNation, Automotive Expert Carl Krause Explains Arizona Heat Tires and Highway Driving Tire Selection
- Gelato Strain Guide Examines Numbered Cuts, Reported Lineage and Historical Lab Data
- Breakthrough T1D Concludes Inaugural Clinical & Research Congress, Highlighting Global Advances in Type 1 Diabetes Research
Create E-mail Alert Related Categories
SEC FilingsSign up for StreetInsider Free!
Receive full access to all new and archived articles, unlimited portfolio tracking, e-mail alerts, custom newswires and RSS feeds - and more!
