




Form 8-K Noranda Aluminum Holding For: May 06

FREE Breaking News Alerts from StreetInsider.com!
StreetInsider.com Top Tickers, 10/8/2026
- Wall Street ends lower, off record highs, as Treasury yields climb
- Want to be a stock market bear? BCA says watch potential U.S. tax increases
- SpaceX seeks $40bn in financing for Nvidia chip purchase
- Chip stock could soar nearly 200%, analyst says: "If you don’t buy it, they will"
- Musk rules out TSMC role in Terafab operations; Intel gains
 Tweet
Tweet Share
Share E-mail
UNITED STATES
SECURITIES AND EXCHANGE COMMISSION
Washington, DC 20549
FORM 8-K
CURRENT REPORT
Pursuant to Section 13 or 15(d) of the
Securities Exchange Act of 1934
Date of Report (Date of earliest reported event): May 6, 2015
NORANDA ALUMINUM HOLDING CORPORATION
(Exact Name of Registrant as Specified in Its Charter)
Delaware | 001-34741 | 20-8908550 | |
(State or Other Jurisdiction of Incorporation) | (Commission File Number) | (IRS Employer Identification Number) | |
801 Crescent Centre Drive, Suite 600, Franklin, Tennessee 37067 | |||
(Address of Principal Executive Offices) (Zip Code) | |||
Registrant's telephone number, including area code: (615) 771-5700 | |||
Check the appropriate box below if the Form 8-K filing is intended to simultaneously satisfy the filing obligation of the registrant under any of the following provisions:
o Written communications pursuant to Rule 425 under the Securities Act (17 CFR 230.425)
o Soliciting material pursuant to Rule 14a-12 under the Exchange Act (17 CFR 240.14a-12)
o Pre-commencement communications pursuant to Rule 14d-2(b) under the Exchange Act (17 CFR 240.14d-2(b))
o Pre-commencement communications pursuant to Rule 13e-4(c) under the Exchange Act (17 CFR 240.13e-4(c))
Item 2.02. Results of Operations and Financial Condition.
The following information is furnished pursuant to Item 2.02, “Results of Operations and Financial Condition.” Consequently, it is not deemed “filed” for purposes of Section 18 of the Securities Exchange Act of 1934, or otherwise subject to the liabilities of that section. It may only be incorporated by reference in another filing under the Securities Exchange Act of 1934 or Securities Act of 1933 if such subsequent filing specifically references this Form 8-K.
Today, Noranda Aluminum Holding Corporation (“the Company”) issued a press release regarding its financial results for the quarter ended March 31, 2015. A copy of the press release is furnished as Exhibit 99.1 to this Form 8-K and is incorporated by reference herein in its entirety. A copy of investor presentation materials relating to such financial results is attached hereto as Exhibit 99.2 and is incorporated by reference herein in its entirety. The press release and presentation materials use the following non-GAAP financial measures: “Adjusted EBITDA,” “Free cash flow,” “Integrated net cash cost,” and “Diluted earnings per share, excluding special items.” A reconciliation of each measure to the most directly comparable U.S. GAAP measure will be available in the presentation slides filed as Exhibit 99.2 to our Current Report on Form 8-K furnished to the SEC concurrent with the issuance of this press release.
Item 8.01. Other Events.
On May 6, 2015, the Board of Directors declared a regular quarterly cash dividend of $0.01 per share on the Company's outstanding shares of common stock to be paid on June 10, 2015 to shareholders of record as of May 18, 2015. The Board anticipates declaring this dividend in future quarters on a regular basis; however, changes in the Company's financial condition and cash needs could result in dividends being declared in different amounts, or not at all.
A copy of the press release is attached hereto as Exhibit 99.3 and incorporated by reference herein in its entirety.
Item 9.01. Financial Statements and Exhibits.
Exhibit Number | Description |
99.1 | Press release, dated May 6, 2015 |
99.2 | Presentation materials, dated May 6, 2015 |
99.3 | Dividend release, dated May 6, 2015 |
SIGNATURES
Pursuant to the requirements of the Securities Exchange Act of 1934, the registrant has duly caused this report to be signed on its behalf by the undersigned hereunto duly authorized.
NORANDA ALUMINUM HOLDING CORPORATION | ||||
Date | May 6, 2015 | |||
By: | /s/ Dale W. Boyles | |||
Dale W. Boyles | ||||
Chief Financial Officer | ||||
EXHIBIT INDEX
Exhibit Number | Description |
99.1 | Press release, dated May 6, 2015 |
99.2 | Presentation materials, dated May 6, 2015 |
99.3 | Dividend release, dated May 6, 2015 |
Exhibit 99.1
Noranda Reports First Quarter 2015 Performance
and Completion of Key Productivity Initiatives
First Quarter 2015 and Other Highlights
• | Total segment profit was $33.9 million versus $49.6 million in fourth quarter 2014 and $10.7 million in first quarter 2014 |
• | Completed in April key productivity initiatives that structurally reduce Noranda’s cash costs by $22 to $30 million per year |
• | Cash and cash equivalents totaled $23.5 million and total available liquidity was $165.4 million as of March 31, 2015 |
• | Excluding special items, EPS was a $0.03 loss versus a $0.25 loss in first quarter 2014; reported EPS was a $0.04 loss versus a $0.25 loss in the first quarter 2014 |
Franklin, Tennessee – May 6, 2015 – Noranda Aluminum Holding Corporation (NYSE: NOR) today reported results for first quarter 2015.
“We are pleased to report the successful completion of two important initiatives to improve our cost structure,” Layle K. Smith, Noranda’s President and Chief Executive Officer. “Specifically, we established a new and reduced electricity rate structure at our aluminum smelter and we completed our port expansion project in Jamaica. Collectively, we expect these initiatives will structurally reduce our cash costs, independent of fluctuations in aluminum prices, by $22 to $30 million per annum or $0.04 to $0.05 per pound of primary aluminum sold.”
“The achievement of these key initiatives is part of our ongoing CORE (Cost-Out, Reliability and Effectiveness) program which provides Noranda a solid foundation from which to operate sustainably and grow through the aluminum cycle. Despite continued volatility in prices, we believe aluminum’s long-term fundamentals remain positive. As we look forward, we remain focused on achieving operational excellence, making further improvements to our cost structure, and making accretive investments in our integrated platform.”
Reduced Electricity Rate Secured for New Madrid Smelter
On April 29, 2015 the PSC established a new and reduced electricity rate structure for the Company’s aluminum smelter in New Madrid, Missouri. At full production, the new structure is expected to reduce New Madrid’s annual power cost by approximately $17 to $25 million or $0.03 to $0.04 per pound of primary aluminum sold. The lower rate structure becomes effective on or around June 1, 2015 and carries a term of at least three years. The PSC’s ruling requires Noranda to meet certain ongoing conditions, including workforce and capital spending levels at the smelter that are consistent with historical amounts.
Port Expansion Completed in Jamaica
The Company completed a port expansion project in Jamaica during the first quarter of 2015. The project increased the depth and breadth of the port, which allows Noranda to load approximately 10-15% more bauxite onto existing vessels. This result, which began to be realized in April 2015, is expected to reduce shipping costs in the Bauxite and Alumina segments by more than $5 million per year. Although the economics of this investment are supported by the savings in shipping costs, the project also provides the opportunity to increase our third party bauxite volume based on demand at a sufficient price and approval by the Government of Jamaica.
First Quarter 2015 Results
Sales were $345.6 million in first quarter 2015, $336.2 million in fourth quarter 2014 and $311.6 million in first quarter 2014.
• | Sequentially (comparing first quarter 2015 to fourth quarter 2014) sales increased $9.4 million, or 2.8%, primarily driven by the seasonal recovery from fourth quarter customer de-stocking in Flat-Rolled Aluminum Products (“Flat-Rolled”). These positive effects were partially offset by sequentially lower prices in Alumina, Primary and Flat-Rolled. |
• | In first quarter 2015, the average realized Midwest transaction price for aluminum products was $1.05 per pound, which was the combination of a $0.83 per pound LME aluminum price and a $0.22 per pound Midwest Premium. This compares to an average price of $1.12 per pound for fourth quarter 2014 ($0.89 per pound LME component and $0.23 per pound Midwest premium) and $0.95 per pound for first quarter 2014 ($0.77 per pound LME component and $0.18 per pound Midwest premium). |
• | Year-over-year (comparing first quarter 2015 to first quarter 2014) sales increased $34.0 million, or 10.9%. Substantially all of this increase was due to higher LME aluminum prices and Midwest premiums. |
Total segment profit was $33.9 million in first quarter 2015, $49.6 million in fourth quarter 2014 and $10.7 million in first quarter 2014.
• | Sequentially, total segment profit decreased $15.7 million. This decline came primarily in the integrated upstream business, where a $0.06 per pound sequential decrease in LME aluminum prices negatively impacted Alumina and Primary results. |
1
• | Year-over-year, segment profit increased $23.2 million largely due to improved pricing ($14.0 million impact) and a lower Net Cash Cost per pound ($7.9 million impact) in the integrated upstream business. |
Reported net loss was $2.7 million ($0.04 per share) in first quarter 2015 versus a $1.7 million profit in fourth quarter 2014 ($0.02 per diluted share) and a $16.8 million loss in first quarter 2014 ($0.25 loss per share). Excluding special items, net loss was $1.9 million in first quarter 2015 ($0.03 per share) versus a $9.6 million profit ($0.14 per diluted share) in fourth quarter 2014 and a $16.9 million loss ($0.25 loss per share) in first quarter 2014. The $11.5 million sequential decline in profit primarily reflects a $15.7 million ($14.7 million after-tax) decline in segment profit. The $15.0 million year-over-year improvement in profitability (excluding special items) reflects a $23.2 million improvement in segment profit ($21.7 million after-tax).
Segment Information
Three months ended | |||||||||
March 31, 2015 | December 31, 2014 | March 31, 2014 | |||||||
Key Primary Aluminum segment metrics: | |||||||||
Average realized Midwest transaction price (per pound) | $ | 1.05 | $ | 1.12 | $ | 0.95 | |||
Net Cash Cost (per pound shipped) | $ | 0.83 | $ | 0.80 | $ | 0.90 | |||
Total primary aluminum shipments (pounds, in millions) | 131.1 | 131.4 | 141.9 | ||||||
Segment profit (loss) (in millions): | |||||||||
Total integrated upstream business segment profit | $ | 29.0 | $ | 42.3 | $ | 7.6 | |||
Flat-Rolled | 12.7 | 12.3 | 10.9 | ||||||
Corporate | (7.8 | ) | (5.0 | ) | (7.8 | ) | |||
Total segment profit | $ | 33.9 | $ | 49.6 | $ | 10.7 | |||
Bauxite segment profit was $2.1 million in first quarter 2015, $6.3 million loss in fourth quarter 2014, and $2.5 million profit in first quarter 2014.
• | Sequentially, Bauxite results primarily reflect the fact that fourth quarter 2014 results included the $8.4 million impact from our semi-annual internal bauxite transfer price adjustment between Bauxite and Alumina. |
• | Year-over year, Bauxite results reflect $0.4 million in higher demurrage fees. |
Alumina segment profit was $3.7 million in first quarter 2015, $17.1 million profit in fourth quarter 2014, and $11.9 million loss in first quarter 2014.
• | Sequentially, the $13.4 million decrease in segment profit primarily results from the transfer price adjustment discussed above and the negative $3.8 million impact of lower alumina prices following the sequential decline in LME aluminum prices to which the majority of alumina sales prices are linked. The remaining decrease is due to higher operating costs at the refinery primarily due to a sequential increase in planned maintenance outages and higher benefit accruals partially offset by the favorable $4.0 million benefit from lower natural gas prices. |
• | Year-over-year, Alumina results reflect a net improvement in costs and selling prices. In first quarter 2014, Alumina incurred $9.3 million of costs and lost margins from extreme winter weather conditions. Alumina costs also improved $7.6 million as natural gas prices were lower in first quarter 2015, although that benefit was partially offset by higher operating costs at the refinery primarily due to an increase in planned maintenance outages. The positive impact from improved sales prices totaled $4.0 million and followed the year over-year improvement in the LME aluminum price to which the majority of alumina sales prices are linked. |
Primary segment profit was $23.1 million in first quarter 2015, $31.7 million in fourth quarter 2014, and $18.4 million in first quarter 2014.
• | The sequential decline in Primary results reflects the negative impact of the decline in realized aluminum prices from fourth quarter 2014 to first quarter 2015. Fourth quarter 2014 and first quarter 2015 include approximately the same impact from operating the smelter below capacity, as the Company has not yet returned the smelter to full production. |
• | Year-over-year, Primary results reflect a net $14.0 million favorable impact from higher realized aluminum prices, partially offset by the effect of higher LME-linked alumina costs ($2.2 million) and the negative impact of higher costs of $7.6 million associated with operating the smelter below capacity. These factors were partially offset by the smelter not incurring costs associated with extreme weather conditions in first quarter 2015, where those conditions cost the segment $1.9 million in first quarter 2014. |
2
Net Integrated Aluminum Cash Cost (“Net Cash Cost”) was $0.83 per pound in first quarter 2015, $0.80 per pound in fourth quarter 2014, and $0.90 per pound in first quarter 2014.
• | Sequentially, Net Cash Cost increased by $0.03 per pound, as the unfavorable impact of sequentially lower LME-linked alumina prices and unfavorable usage rates in Alumina were only partially offset by lower natural gas prices in Alumina and lower fuel costs in Bauxite. |
• | Year-over-year, Net Cash Cost decreased $0.07 per pound primarily due to lower natural gas prices in Alumina and lower fuel costs in Bauxite. These benefits were partially offset by the net negative impact of higher costs of $0.02 per pound associated with operating the smelter below capacity in first quarter 2015 and avoiding the negative impact from extreme winter weather conditions in Alumina and Primary. |
Flat-Rolled profit was $12.7 million in first quarter 2015, $12.3 million in fourth quarter 2014, and $10.9 million in first quarter 2014.
• | Sequentially, Flat-Rolled results improved due to a 9% increase in shipments with the seasonal recovery from fourth quarter customer de-stocking. |
• | Year-over-year, Flat-Rolled results improved $1.8 million due primarily to lower unit costs associated with lower natural gas prices ($1.1 million impact) and productivity savings. |
Corporate expenses in first quarter 2015 were $7.8 million, $5.0 million in fourth quarter 2014, and $7.8 million in first quarter 2014.
• | Sequentially, corporate expenses increased primarily due to accrual-related employee benefits costs which are typically at their highest in first quarter, as well as higher professional fees. |
Liquidity and Capital Resources
At March 31, 2015, the Company had $23.5 million of cash and cash equivalents. As of March 31, 2015, available borrowing capacity under the Company’s asset-based revolving credit facility was $141.9 million, which is net of $39.5 million in outstanding letters of credit. The Company’s total available liquidity as of March 31, 2015 was $165.4 million. The $7.1 million increase in total liquidity from December 31, 2014 was achieved by our focus on operations, overall spending and working capital management.
The table below summarizes the key drivers behind changes in the Company’s cash positions for each period:
Three months ended | |||||||||
(in millions) | March 31, 2015 | December 31, 2014 | March 31, 2014 | ||||||
Segment profit | $ | 33.9 | $ | 49.6 | $ | 10.7 | |||
Prepaid expenses and other | 5.5 | (5.7 | ) | (5.8 | ) | ||||
Interest paid | (8.0 | ) | (17.5 | ) | (7.5 | ) | |||
Taxes (paid) refunded | 3.0 | (4.0 | ) | 0.5 | |||||
Operating working capital (deficit) | (4.9 | ) | 4.0 | (17.4 | ) | ||||
Cash provided by (used in) operating activities | 29.5 | 26.4 | (19.5 | ) | |||||
Cash used in investing activities | (23.4 | ) | (33.5 | ) | (12.9 | ) | |||
Cash provided by (used in) financing activities | (3.1 | ) | 3.3 | 4.2 | |||||
Change in cash and cash equivalents | $ | 3.0 | $ | (3.8 | ) | $ | (28.2 | ) | |
3
NORANDA ALUMINUM HOLDING CORPORATION
CONSOLIDATED STATEMENTS OF OPERATIONS
(dollars in millions, except per share data and where noted)
(unaudited)
Three months ended March 31, | ||||||
2015 | 2014 | |||||
Sales | $ | 345.6 | $ | 311.6 | ||
Operating costs and expenses: | ||||||
Cost of sales | 312.0 | 302.0 | ||||
Selling, general and administrative expenses | 22.3 | 20.7 | ||||
Total operating costs and expenses | 334.3 | 322.7 | ||||
Operating income (loss) | 11.3 | (11.1 | ) | |||
Other (income) expense: | ||||||
Interest expense, net | 13.2 | 12.5 | ||||
Loss on hedging activities, net | 0.3 | 0.3 | ||||
Total other expense, net | 13.5 | 12.8 | ||||
Loss before income taxes | (2.2 | ) | (23.9 | ) | ||
Income tax expense (benefit) | 0.5 | (7.1 | ) | |||
Net loss | $ | (2.7 | ) | $ | (16.8 | ) |
Net loss per common share: | ||||||
Basic | $ | (0.04 | ) | $ | (0.25 | ) |
Diluted | $ | (0.04 | ) | $ | (0.25 | ) |
Weighted-average common shares outstanding: | ||||||
Basic (shares, in millions) | 68.97 | 68.23 | ||||
Diluted (shares, in millions) | 68.97 | 68.23 | ||||
Cash dividends declared per common share | $ | 0.01 | $ | 0.01 | ||
External sales by segment: | ||||||
Bauxite | $ | 11.7 | $ | 11.7 | ||
Alumina | 55.0 | 45.8 | ||||
Primary | 130.9 | 120.8 | ||||
Flat-Rolled | 148.0 | 133.3 | ||||
Total | $ | 345.6 | $ | 311.6 | ||
Segment profit (loss): | ||||||
Bauxite | $ | 2.1 | $ | 2.5 | ||
Alumina | 3.7 | (11.9 | ) | |||
Primary | 23.1 | 18.4 | ||||
Flat-Rolled | 12.7 | 10.9 | ||||
Corporate | (7.8 | ) | (7.8 | ) | ||
Eliminations | 0.1 | (1.4 | ) | |||
Total | $ | 33.9 | $ | 10.7 | ||
Financial and other data: | ||||||
Average realized Midwest transaction price (per pound) | $ | 1.05 | $ | 0.95 | ||
Net Cash Cost (per pound shipped) | $ | 0.83 | $ | 0.90 | ||
Shipments: | ||||||
External shipments: | ||||||
Bauxite (kMts) | 512.8 | 520.7 | ||||
Alumina (kMts) | 171.2 | 150.6 | ||||
Primary (pounds, in millions) | 109.4 | 111.7 | ||||
Flat-Rolled (pounds, in millions) | 93.3 | 92.4 | ||||
Intersegment shipments: | ||||||
Bauxite (kMts) | 726.1 | 622.7 | ||||
Alumina (kMts) | 104.8 | 127.3 | ||||
Primary (pounds, in millions) | 21.7 | 30.2 | ||||
4
NORANDA ALUMINUM HOLDING CORPORATION
CONSOLIDATED BALANCE SHEETS
(in millions, except par value)
(unaudited)
March 31, 2015 | December 31, 2014 | |||
$ | $ | |||
ASSETS | ||||
Current assets: | ||||
Cash and cash equivalents | 23.5 | 20.5 | ||
Accounts receivable, net | 112.6 | 102.5 | ||
Inventories, net | 187.8 | 196.7 | ||
Other current assets | 29.2 | 27.4 | ||
Total current assets | 353.1 | 347.1 | ||
Property, plant and equipment, net | 698.8 | 695.0 | ||
Goodwill | 137.6 | 137.6 | ||
Other intangible assets, net | 47.8 | 49.3 | ||
Other assets | 87.8 | 89.1 | ||
Total assets | 1,325.1 | 1,318.1 | ||
LIABILITIES AND EQUITY | ||||
Current liabilities: | ||||
Accounts payable | 115.6 | 122.6 | ||
Accrued liabilities | 73.0 | 59.1 | ||
Deferred tax liabilities | 11.6 | 11.7 | ||
Current portion of long-term debt | 12.1 | 11.6 | ||
Total current liabilities | 212.3 | 205.0 | ||
Long-term debt, net | 653.9 | 656.4 | ||
Pension and other post-retirement benefit (“OPEB”) liabilities | 195.8 | 195.4 | ||
Other long-term liabilities | 44.8 | 45.9 | ||
Long-term deferred tax liabilities | 146.9 | 143.3 | ||
Shareholders’ equity: | ||||
Preferred stock (25.0 shares authorized, $0.01 par value; no shares issued and outstanding at March 31, 2015 and December 31, 2014) | — | — | ||
Common stock (200.0 shares authorized; $0.01 par value; 69.2 shares issued and outstanding at March 31, 2015; 68.9 shares issued and outstanding at December 31, 2014) | 0.7 | 0.7 | ||
Capital in excess of par value | 244.4 | 243.6 | ||
Accumulated deficit | (71.8 | ) | (68.2 | ) |
Accumulated other comprehensive loss | (107.9 | ) | (110.0 | ) |
Total shareholders’ equity | 65.4 | 66.1 | ||
Non-controlling interest | 6.0 | 6.0 | ||
Total equity | 71.4 | 72.1 | ||
Total liabilities and equity | 1,325.1 | 1,318.1 | ||
5
NORANDA ALUMINUM HOLDING CORPORATION
CONSOLIDATED STATEMENTS OF CASH FLOWS
(in millions)
(unaudited)
Three months ended March 31, | ||||
2015 | 2014 | |||
$ | $ | |||
OPERATING ACTIVITIES | ||||
Net loss | (2.7 | ) | (16.8 | ) |
Adjustments to reconcile net loss to cash provided by operating activities: | ||||
Depreciation and amortization | 23.0 | 21.7 | ||
Non-cash interest expense | 0.7 | 0.7 | ||
Last in, first out and lower of cost or market inventory adjustments | (4.8 | ) | (0.2 | ) |
(Gain) loss on disposal of assets | 0.1 | (0.1 | ) | |
Loss on hedging activities, excluding cash settlements | — | (0.5 | ) | |
Deferred income taxes | 2.4 | (14.3 | ) | |
Share-based compensation expense | 0.8 | 0.7 | ||
Changes in other assets | (1.0 | ) | (1.6 | ) |
Changes in pension, other post-retirement and other long-term liabilities | 2.7 | 0.7 | ||
Changes in current operating assets and liabilities: | ||||
Accounts receivable, net | (10.1 | ) | (26.0 | ) |
Inventories, net | 13.4 | (12.8 | ) | |
Taxes receivable and taxes payable | 1.3 | 7.7 | ||
Other current assets | (0.9 | ) | (1.2 | ) |
Accounts payable | (8.2 | ) | 21.4 | |
Accrued liabilities | 12.8 | 1.1 | ||
Cash provided by (used in) operating activities | 29.5 | (19.5 | ) | |
INVESTING ACTIVITIES | ||||
Capital expenditures | (23.5 | ) | (13.1 | ) |
Proceeds from sale of property, plant and equipment | 0.1 | 0.2 | ||
Cash used in investing activities | (23.4 | ) | (12.9 | ) |
FINANCING ACTIVITIES | ||||
Shares tendered for taxes, net of proceeds from issuance of common shares for share-based payment arrangements | (0.2 | ) | (0.4 | ) |
Dividends paid to shareholders | (0.7 | ) | (0.7 | ) |
Repayments of long-term debt | (2.6 | ) | (1.2 | ) |
Borrowings on revolving credit facility | 72.0 | — | ||
Repayments on revolving credit facility | (72.0 | ) | — | |
Borrowings on long-term debt, net | 0.4 | 6.5 | ||
Cash provided by (used in) financing activities | (3.1 | ) | 4.2 | |
Change in cash and cash equivalents | 3.0 | (28.2 | ) | |
Cash and cash equivalents, beginning of period | 20.5 | 79.4 | ||
Cash and cash equivalents, end of period | 23.5 | 51.2 | ||
6
NORANDA ALUMINUM HOLDING CORPORATION
SEGMENT RESULTS
(in millions)
(unaudited)
Three months ended March 31, 2015 | ||||||||||||||
Bauxite | Alumina | Primary Aluminum | Flat-Rolled | Corporate | Eliminations | Consolidated | ||||||||
$ | $ | $ | $ | $ | $ | $ | ||||||||
Sales: | ||||||||||||||
External customers | 11.7 | 55.0 | 130.9 | 148.0 | — | — | 345.6 | |||||||
Intersegment | 19.6 | 27.4 | 22.0 | — | — | (69.0 | ) | — | ||||||
Total sales | 31.3 | 82.4 | 152.9 | 148.0 | — | (69.0 | ) | 345.6 | ||||||
Capital expenditures | 3.3 | 1.4 | 17.0 | 1.3 | 0.5 | — | 23.5 | |||||||
Reconciliation of segment profit (loss) to operating income (loss): | ||||||||||||||
Segment profit (loss) | 2.1 | 3.7 | 23.1 | 12.7 | (7.8 | ) | 0.1 | 33.9 | ||||||
Depreciation and amortization | (3.0 | ) | (5.2 | ) | (10.0 | ) | (4.3 | ) | (0.5 | ) | — | (23.0 | ) | |
Last in, first out and lower of cost or market inventory adjustments | — | — | 0.8 | 4.0 | — | — | 4.8 | |||||||
Gain (loss) on disposal of assets | — | — | (0.1 | ) | — | — | — | (0.1 | ) | |||||
Non-cash pension, accretion and stock compensation | — | (0.3 | ) | (1.7 | ) | (1.3 | ) | (1.1 | ) | — | (4.4 | ) | ||
Relocation and severance | — | (0.2 | ) | (0.2 | ) | 0.3 | (0.1 | ) | — | (0.2 | ) | |||
Consulting fees | — | — | (0.1 | ) | — | (0.2 | ) | — | (0.3 | ) | ||||
Cash settlements paid (received) on hedging transactions | — | — | 0.2 | 1.2 | — | — | 1.4 | |||||||
Other, net | — | (0.1 | ) | — | — | (0.1 | ) | (0.6 | ) | (0.8 | ) | |||
Operating income (loss) | (0.9 | ) | (2.1 | ) | 12.0 | 12.6 | (9.8 | ) | (0.5 | ) | 11.3 | |||
Interest expense, net | 13.2 | |||||||||||||
Loss on hedging activities, net | 0.3 | |||||||||||||
Total other expense, net | 13.5 | |||||||||||||
Loss before income taxes | (2.2 | ) | ||||||||||||
7
NORANDA ALUMINUM HOLDING CORPORATION
SEGMENT RESULTS
(in millions)
(unaudited)
Three months ended March 31, 2014 | ||||||||||||||
Bauxite | Alumina | Primary | Flat-Rolled | Corporate | Eliminations | Consolidated | ||||||||
$ | $ | $ | $ | $ | $ | $ | ||||||||
Sales: | ||||||||||||||
External customers | 11.7 | 45.8 | 120.8 | 133.3 | — | — | 311.6 | |||||||
Intersegment | 18.4 | 31.4 | 28.7 | — | — | (78.5 | ) | — | ||||||
Total sales | 30.1 | 77.2 | 149.5 | 133.3 | — | (78.5 | ) | 311.6 | ||||||
Capital expenditures | 0.8 | 2.0 | 7.0 | 3.1 | 0.2 | — | 13.1 | |||||||
Reconciliation of segment profit (loss) to operating income (loss): | ||||||||||||||
Segment profit (loss) | 2.5 | (11.9 | ) | 18.4 | 10.9 | (7.8 | ) | (1.4 | ) | 10.7 | ||||
Depreciation and amortization | (2.5 | ) | (5.0 | ) | (9.7 | ) | (4.3 | ) | (0.2 | ) | — | (21.7 | ) | |
Last in, first out and lower of cost or market inventory adjustments | — | — | (0.1 | ) | 0.3 | — | — | 0.2 | ||||||
Gain (loss) on disposal of assets | — | — | 0.1 | — | — | — | 0.1 | |||||||
Non-cash pension, accretion and stock compensation | — | (0.2 | ) | (1.0 | ) | (0.7 | ) | (0.9 | ) | — | (2.8 | ) | ||
Relocation and severance | 0.1 | (0.1 | ) | (0.1 | ) | 0.4 | 0.1 | — | 0.4 | |||||
Consulting fees | — | — | — | — | (0.2 | ) | — | (0.2 | ) | |||||
Cash settlements paid (received) on hedging transactions | — | — | 0.2 | 0.7 | — | — | 0.9 | |||||||
Other, net | — | (0.1 | ) | 0.1 | (0.1 | ) | — | 1.4 | 1.3 | |||||
Operating income (loss) | 0.1 | (17.3 | ) | 7.9 | 7.2 | (9.0 | ) | — | (11.1 | ) | ||||
Interest expense, net | 12.5 | |||||||||||||
Loss on hedging activities, net | 0.3 | |||||||||||||
Total other expense, net | 12.8 | |||||||||||||
Loss before income taxes | (23.9 | ) | ||||||||||||
8
ADJUSTED EBITDA
(in millions)
(unaudited)
Management uses “Adjusted EBITDA”, referred to as “EBITDA” in the Company’s debt agreements, as a liquidity measure. The Company’s debt agreements do not require it to achieve any specified level of Adjusted EBITDA, or ratio of Adjusted EBITDA to any other financial metric, in order to avoid a default (subject, in the case of the senior secured revolving credit facility, to its maintaining minimum availability thereunder). As used herein, Adjusted EBITDA means net income before income taxes, net interest expense, depreciation and amortization, adjusted to eliminate certain non-cash expenses and other specified items of income or expense as outlined below (in millions):
Three months ended March 31, | Twelve months ended | |||||||
2015 | 2014 | March 31 2015 | December 31, 2014 | |||||
$ | $ | $ | $ | |||||
Adjusted EBITDA | 33.9 | 10.7 | 150.5 | 127.3 | ||||
Last in, first out and lower of cost or market inventory adjustments (a) | 4.8 | 0.2 | (0.3 | ) | (4.9 | ) | ||
Gain (loss) on disposal of assets | (0.1 | ) | 0.1 | (0.6 | ) | (0.4 | ) | |
Non-cash pension, accretion and stock compensation | (4.4 | ) | (2.8 | ) | (11.2 | ) | (9.6 | ) |
Restructuring, relocation and severance | (0.2 | ) | 0.4 | (1.9 | ) | (1.3 | ) | |
Consulting fees | (0.3 | ) | (0.2 | ) | (0.8 | ) | (0.7 | ) |
Non-cash derivative gains (losses) (b) | 1.1 | 0.6 | 0.2 | (0.3 | ) | |||
Other, net | (0.8 | ) | 1.3 | (1.0 | ) | 1.1 | ||
Depreciation and amortization | (23.0 | ) | (21.7 | ) | (90.8 | ) | (89.5 | ) |
Interest expense, net | (13.2 | ) | (12.5 | ) | (51.1 | ) | (50.4 | ) |
Income tax benefit (expense) | (0.5 | ) | 7.1 | (5.5 | ) | 2.1 | ||
Net income (loss) | (2.7 | ) | (16.8 | ) | (12.5 | ) | (26.6 | ) |
(a) | The New Madrid smelter and rolling mills use the LIFO method of inventory accounting for financial reporting and tax purposes. This adjustment restates net income to the FIFO method by eliminating LIFO expenses related to inventories held at the New Madrid smelter and the rolling mills. Product inventories at Gramercy and St. Ann and supplies inventories at New Madrid are stated at lower of weighted-average cost or market, and are not subject to the LIFO adjustment. The Company also reduces inventories to the lower of cost (adjusted for purchase accounting) or market value. |
(b) | The Company uses derivative financial instruments to mitigate effects of fluctuations in aluminum prices. This adjustment eliminates the non-cash gains and losses resulting from fair market value changes of aluminum swaps. Cash settlements (received) or paid, except settlements on hedge terminations, related to derivatives are included in Adjusted EBITDA. |
Adjusted EBITDA is not a measure of financial performance under U.S. GAAP, and may not be comparable to similarly titled measures used by other companies in the Company’s industry. Adjusted EBITDA should not be considered in isolation from or as an alternative to net income (loss), income (loss) from continuing operations, operating income (loss) or any other performance measures derived in accordance with U.S. GAAP. Adjusted EBITDA has limitations as an analytical tool and you should not consider it in isolation or as a substitute for analysis of the Company’s results as reported under U.S. GAAP. For example, Adjusted EBITDA excludes certain tax payments that may represent a reduction in cash available to the Company; does not reflect any cash requirements for the assets being depreciated and amortized that may have to be replaced in the future; does not reflect capital cash expenditures, future requirements for capital expenditures or contractual commitments; does not reflect changes in, or cash requirements for, the Company’s working capital needs; and does not reflect the significant interest expense, or the cash requirements necessary to service interest or principal payments on the Company’s indebtedness. Adjusted EBITDA also includes incremental stand-alone costs and adds back non-cash hedging gains and losses, and certain other non-cash charges that are deducted in calculating net income. However, these are expenses that may recur, vary greatly and are difficult to predict. In addition, certain of these expenses can represent the reduction of cash that could be used for other corporate purposes. You should not consider the Company’s Adjusted EBITDA as an alternative to operating income or net income, determined in accordance with U.S. GAAP, as an indicator of the Company’s operating performance, or as an alternative to cash flows from operating activities, determined in accordance with U.S. GAAP, as an indicator of the Company’s cash flows or as a measure of liquidity.
9
The following table reconciles Adjusted EBITDA to cash flow from operating activities for the periods presented (in millions):
Three months ended March 31, | Twelve months ended | |||||||
2015 | 2014 | March 31 2015 | December 31 2014 | |||||
$ | $ | $ | $ | |||||
Adjusted EBITDA | 33.9 | 10.7 | 150.5 | 127.3 | ||||
Share-based compensation expense | 0.8 | 0.7 | 3.5 | 3.4 | ||||
Changes in other assets | (1.0 | ) | (1.6 | ) | (9.8 | ) | (10.4 | ) |
Changes in pension, other post-retirement liabilities and other long-term liabilities | 2.7 | 0.7 | (0.4 | ) | (2.4 | ) | ||
Changes in current operating assets and liabilities | 8.3 | (9.8 | ) | (0.5 | ) | (18.6 | ) | |
Changes in current income taxes | 1.9 | (7.2 | ) | (0.4 | ) | (9.5 | ) | |
Changes in accrued interest | (12.5 | ) | (11.8 | ) | (48.4 | ) | (47.7 | ) |
Non-cash pension, accretion and stock compensation | (4.4 | ) | (2.8 | ) | (11.2 | ) | (9.6 | ) |
Restructuring, relocation and severance | (0.2 | ) | 0.4 | (1.9 | ) | (1.3 | ) | |
Consulting and sponsor fees | (0.3 | ) | (0.2 | ) | (0.8 | ) | (0.7 | ) |
Other, net | 0.3 | 1.4 | (1.0 | ) | 0.1 | |||
Cash provided by (used in) operating activities | 29.5 | (19.5 | ) | 79.6 | 30.6 | |||
10
NORANDA ALUMINUM HOLDING CORPORATION
NET CASH COST OF PRIMARY
(unaudited)
Net cash cost of Primary per pound represents the costs of producing commodity grade aluminum net of value-added premiums on Primary sales. The Company has provided net cash cost per pound of aluminum shipped because it provides investors with additional information to measure operating performance. Using this metric, investors are able to assess the prevailing LME price plus Midwest premium per pound versus unit net costs per pound shipped. Net cash cost per pound is positively or negatively impacted by changes in primary, alumina and bauxite production and sales volumes, natural gas and oil related costs, seasonality in electrical contract rates, and increases or decreases in other production related costs. Net cash cost per pound is not a measure of financial performance under U.S. GAAP and may not be comparable to similarly titled measures used by other companies. Net cash cost per pound shipped should not be considered in isolation from or as an alternative to any performance measures derived in accordance with U.S. GAAP. The following table shows the calculation of net cash cost of Primary:
Three months ended March 31, | ||||||
2015 | 2014 | |||||
Total Primary cash cost (in millions)(a) | $ | 109.3 | $ | 127.2 | ||
Total shipments (pounds in millions) | 131.1 | 141.9 | ||||
Net Cash Cost (per pound shipped) (b) | $ | 0.83 | $ | 0.90 | ||
(a) Total Primary cash cost is calculated below (in millions): | ||||||
Total Primary revenue | $ | 152.9 | $ | 149.5 | ||
Less fabrication premiums and other revenue | (14.6 | ) | (14.7 | ) | ||
Realized Midwest transaction price revenue | 138.3 | 134.8 | ||||
Primary segment profit (loss) | 23.1 | 18.4 | ||||
Alumina segment profit (loss) | 3.7 | (11.9 | ) | |||
Bauxite segment profit (loss) | 2.1 | 2.5 | ||||
Profit eliminations | 0.1 | (1.4 | ) | |||
Total | 29.0 | 7.6 | ||||
Total Primary cash cost (in millions) | $ | 109.3 | $ | 127.2 | ||
(b) | Net Cash Cost may not recalculate precisely as shown due to rounding. |
11
NORANDA ALUMINUM HOLDING CORPORATION
CALCULATION OF DILUTED EARNINGS (LOSS) PER SHARE,
EXCLUDING SPECIAL ITEMS
(in millions, except per share information)
(unaudited)
“Net income (loss), excluding special items” means net income (loss) adjusted to eliminate the impact of certain transactions and events referred to as “special items,” as listed herein. “Diluted earnings (loss) per share, excluding special items” refers to net income (loss) excluding special items, divided by the number of diluted weighted-average common shares outstanding. Management has provided net income (loss), excluding special items and diluted earnings (loss) per share, excluding special items because the measure provides investors with additional information with which to measure operating results. Using these metrics, investors are able to assess the impact of certain transactions and events on earnings and to compare net income (loss) from period to period with the impact of those transactions and events removed from all periods. Management believes this metric is a valuable tool in assisting investors to compare financial results from period to period.
Net loss, excluding special items may not be comparable to similarly titled measures used by other companies. Net loss, excluding special items should not be considered in isolation from or as an alternative to net income (loss) or any other performance measures derived in accordance with U.S. GAAP. Net loss, excluding special items has limitations as an analytical tool and you should not consider it in isolation or as a substitute for analysis of results as reported under U.S. GAAP.
Special items and diluted earnings (loss) per share, excluding special items are outlined below (in millions):
Three months ended March 31, | ||||
2015 | 2014 | |||
$ | $ | |||
Increase (decrease) to net income | ||||
Special items: | ||||
Gain (loss) on hedging activities: (3) | ||||
GAAP mark-to-market loss | (0.3 | ) | (0.3 | ) |
Cash settlements paid | (1.4 | ) | (0.9 | ) |
Amount treated as special item | 1.1 | 0.6 | ||
Other termination expenses | (0.2 | ) | 0.5 | |
Non-recurring consulting fees | (0.3 | ) | (0.2 | ) |
Non-recurring employee benefits | (0.7 | ) | — | |
Other, net | (0.1 | ) | (0.1 | ) |
Pre-tax gain (loss) from special items | (0.2 | ) | 0.8 | |
Diluted loss per share, excluding special items: | ||||
Pre-tax loss | (2.2 | ) | (23.9 | ) |
Exclude pre-tax impact of special items | 0.2 | (0.8 | ) | |
Pre-tax loss, excluding special items | (2.0 | ) | (24.7 | ) |
Income tax benefit, excluding special items (1) | (0.1 | ) | (7.8 | ) |
Net loss, excluding special items | (1.9 | ) | (16.9 | ) |
Weighted-average common shares outstanding, diluted (shares, in millions) (2) | 68.97 | 68.23 | ||
Diluted loss per share, excluding special items | (0.03 | ) | (0.25 | ) |
(1) | Income taxes, excluding special items were calculated using the Company’s estimated annual effective tax rate from continuing operations 6.5% for the three months ended March 31, 2015 and 31.7% for the three months ended March 31, 2014. |
(2) | For periods with a net loss, potential common shares were excluded from the weighted-average common shares outstanding because these potential shares would have been antidilutive. |
(3) | Prior periods have been recalculated to conform to the current period calculation of the special items impact of gain (loss) on hedging activities. |
12
Forward-Looking Statements
This press release contains “forward-looking statements” within the meaning of the Private Securities Litigation Reform Act of 1995. Forward-looking statements are statements about future, not past, events and involve certain important risks and uncertainties, any of which could cause the Company’s actual results to differ materially from those expressed in forward-looking statements, including, without limitation: the cyclical nature of the aluminum industry and fluctuating commodity prices, which cause variability in earnings and cash flows; a downturn in general economic conditions, including changes in interest rates, as well as a downturn in the end-use markets for certain of the Company’s products; fluctuations in the relative cost of certain raw materials and energy compared to the price of primary aluminum and aluminum rolled products; the effects of competition in Noranda’s business lines; Noranda’s ability to retain customers, a substantial number of which do not have long-term contractual arrangements with the Company; failure to maintain a competitive and sustainable power rate at the smelter in Missouri, with consequent risk of smelter closure; the ability to fulfill the business’s substantial capital investment needs; labor relations (i.e. disruptions, strikes or work stoppages) and labor costs; unexpected issues arising in connection with Noranda’s operations outside of the United States; the ability to retain key management personnel; environmental, safety, production and product regulations or concerns; eliminate change legislation or regulations; natural disaster and Noranda’s expectations with respect to its acquisition activity, or difficulties encountered in connection with acquisitions, dispositions or similar transactions.
Forward-looking statements contain words such as “believes,” “expects,” “will,” “may,” “should,” “seeks,” “approximately,” “intends,” “plans,” “estimates,” or “anticipates” or similar expressions that relate to Noranda’s strategy, plans or intentions. All statements Noranda makes relating to its estimated and projected earnings, margins, costs, expenditures, cash flows, growth rates and financial results or to the Company’s expectations regarding future industry trends are forward-looking statements. Noranda undertakes no obligation to publicly update or revise any forward-looking statement as a result of new information, future events or otherwise except as otherwise required by law. Readers are cautioned not to place undue reliance on forward-looking statements, which speak only as of the date on which they are made and which reflect management’s current estimates, projections, expectations or beliefs.
For a discussion of additional risks and uncertainties that may affect the future results of Noranda, please see the Company’s filings with the Securities and Exchange Commission, including its Annual Report on Form 10-K and its Quarterly Reports on Form 10-Q.
Non-GAAP Financial Measures
This press release and the presentation slides for the earnings call contain non-GAAP financial measures as defined by SEC rules. Management believes that these measures are helpful to investors in measuring financial performance and comparing performance to that of its peers. However, these non-GAAP financial measures may not be comparable to similarly titled non-GAAP financial measures used by other companies. These non-GAAP financial measures have limitations as an analytical tool and should not be considered in isolation or as a substitute for U.S. GAAP financial measures. To the extent non-GAAP financial measures are discussed on the earnings call, a reconciliation of each measure to the most directly comparable U.S. GAAP measure will be available within this press release or within the presentation slides filed as Exhibit 99.2 to the Current Report on Form 8-K furnished to the SEC concurrent with the issuance of this press release.
About the Company
Noranda Aluminum Holding Corporation is a leading North American integrated producer of value-added Primary Aluminum Products, as well as high quality rolled aluminum coils. Noranda is a public company affiliated with its private equity sponsor.
Earnings Conference Call
At 10:00 AM Eastern / 9:00 AM Central on May 6, 2015, Noranda Aluminum Holding Corporation (NYSE: NOR) will host a conference call to discuss results for first quarter 2015. The call will be broadcast over the Internet on the Company’s homepage at www.norandaaluminum.com/investor. The webcast will be archived shortly after the conference call concludes and will be available for replay. Please dial the appropriate number below at least 15 minutes prior to the start of the call to participate in the question-and-answer session.
Conference Call Information
U.S. participants: (855) 232-8956
International participants: (315) 625-6978
Participant Passcode: 34290207
Contact
Noranda Aluminum Holding Corporation
Dale W. Boyles
Chief Financial Officer
(615) 771-5789
John A. Parker
Vice President of Communication and Investor Relations
13
(615) 771-5734
14

1st Quarter 2015 Earnings Conference Call Noranda Aluminum Holding Corp May 6, 2015 10:00 AM Eastern Exhibit 99.2

The presentation and comments made by Noranda’s management on the quarterly conference call contain “forward-looking statements” within the meaning of the Private Securities Litigation Reform Act of 1995. Forward-looking statements are statements about future, not past, events and involve certain important risks and uncertainties, any of which could cause the Company’s actual results to differ materially from those expressed in forward-looking statements, including, without limitation: the cyclical nature of the aluminum industry and fluctuating commodity prices, which cause variability in earnings and cash flows; a downturn in general economic conditions, including changes in interest rates, as well as a downturn in the end-use markets for certain of the Company’s products; fluctuations in the relative cost of certain raw materials and energy compared to the price of primary aluminum and aluminum rolled products; the effects of competition in Noranda’s business lines; Noranda’s ability to retain customers, a substantial number of which do not have long-term contractual arrangements with the Company; failure to maintain a competitive and sustainable power rate at the smelter in Missouri, with consequent risk of smelter closure; the ability to fulfill the business’ substantial capital investment needs; labor relations (i.e. disruptions, strikes or work stoppages) and labor costs; unexpected issues arising in connection with Noranda’s operations outside of the United States; the ability to retain key management personnel; and Noranda’s expectations with respect to its acquisition activity, or difficulties encountered in connection with acquisitions, dispositions or similar transactions. Forward-looking statements contain words such as “believes,” “expects,” “may,” “should,” “seeks,” “approximately,” “intends,” “plans,” “estimates,” “anticipates” or similar expressions that relate to Noranda’s strategy, plans or intentions. All statements Noranda makes relating to its estimated and projected earnings, margins, costs, expenditures, cash flows, growth rates and financial results or to the Company’s expectations regarding future industry trends are forward-looking statements. Noranda undertakes no obligation to publicly update or revise any forward-looking statement as a result of new information, future events or otherwise, except as otherwise required by law. Readers are cautioned not to place undue reliance on forward-looking statements, which speak only as of the date on which they are made and which reflect management's current estimates, projections, expectations or beliefs. For a discussion of additional risks and uncertainties that may affect the future results of Noranda, please see the Company’s filings with the Securities and Exchange Commission, including its Annual Report on Form 10-K and Quarterly Reports on Form 10-Q. Forward-Looking Statements & Non-GAAP Measures This presentation contains non-GAAP financial measures as defined by SEC rules. We believe these measures are helpful to investors in measuring our financial performance and comparing our performance to our peers. However, our non-GAAP financial measures may not be comparable to similarly titled non-GAAP financial measures used by other companies. These non-GAAP financial measures have limitations as an analytical tool and should not be considered in isolation or as a substitute for U.S. GAAP financial measures. To the extent we disclose any non-GAAP financial measures, a reconciliation of each measure to the most directly comparable U.S. GAAP measure is available in the Press Release included as an exhibit to the Current Report on Form 8-K to which this presentation is also an exhibit. As such, this presentation should be read in conjunction with our Press Release. 2

Key Takeaways • Completed in April key initiatives to structurally reduce Noranda’s costs by $22-$30 million annually – Secured new and reduced power rate at smelter – Completed port expansion project in Jamaica • Q1 results demonstrate year-over-year improvements and positive cash flow • Remain focused on operational excellence, improving our cost structure, and investing in the growth of our integrated platform • Despite continued volatility in prices, aluminum’s long-term fundamentals remain positive Financial Overview • Total segment profit—$33.9 million(1) • Net loss, excluding special items—$0.03 per share • Average realized Midwest Transaction Price—$1.05/pound • Net Cash Cost—$0.83/lb • Operating cash flow—$29.5 million; Cash used in investing activities—$23.4 million • Total liquidity(2)— $165.4 million 1st Quarter 2015 Summary (1) Segment profit (in which certain items, primarily non-recurring costs or non-cash expenses, are not allocated to the segments and in which certain items, primarily the income statement effects of current period cash settlements of hedges, are allocated to the segments) is a measure used by management as a basis for resource allocation. See slide 11 for a reconciliation of segment profit to net loss, excluding special items. (2) Liquidity includes $141.9 million available, net, borrowing capacity under the revolving credit facility plus $23.5 million cash. 3

Overview of New Rate Structure New Madrid Rate Decomposition Expected annual savings range from $17 to $25 million 4 • On April 29, 2015 the Missouri Public Service Commission (the “PSC”) established a new and reduced electricity rate structure for Noranda’s aluminum smelter in New Madrid – Establishes new rate class, Industrial Aluminum Smelter, which includes only Noranda • The new rate structure is expected to result in $17 to $25 million2 in annual savings – Initial base rate set at $36 per MWh – Increases from fuel adjustment charges (“FAC”) are capped at $2 per MWh • Additionally, avoids a ~ 5% rate increase from recent general rate case • New structure contains provisions for escalations and ongoing commitments – Capital spending and employment commitments are consistent with historical levels 1 FAC prior to new rate was $3.96. FAC is re-based with new rate case, and for Noranda is capped at $2. At a $0 FAC, total savings would be $25 million per year. 2 Compared to actual rates, and assuming smelter at full production. New Previous Savings Amounts in millions except $ per MWh Base Rate ($ per MWh) $36.00 $37.94 $ 1.94 + FAC1 ($ per MWH) Up to 2.00 3.96 1.96 to 3.96 = Total Rate ($ per MWH) $38.00 $41.90 $ 3.90 to 5.90 x Annual MWh Usage2 4.24 = Total Annual Savings $ 17 to 25
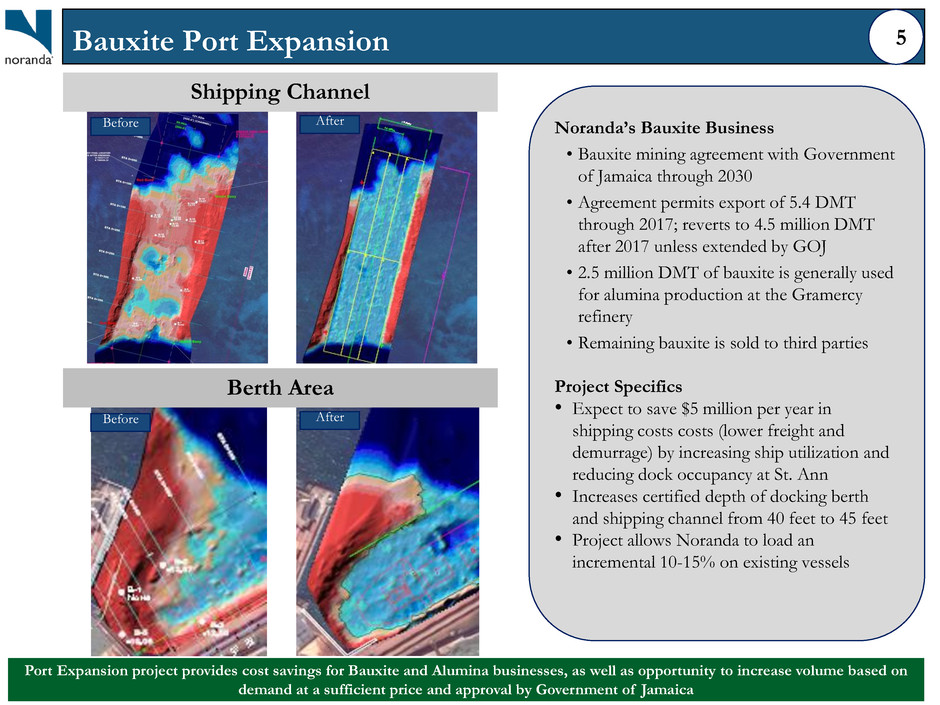
Bauxite Port Expansion 5 Port Expansion project provides cost savings for Bauxite and Alumina businesses, as well as opportunity to increase volume based on demand at a sufficient price and approval by Government of Jamaica Noranda’s Bauxite Business • Bauxite mining agreement with Government of Jamaica through 2030 • Agreement permits export of 5.4 DMT through 2017; reverts to 4.5 million DMT after 2017 unless extended by GOJ • 2.5 million DMT of bauxite is generally used for alumina production at the Gramercy refinery • Remaining bauxite is sold to third parties Project Specifics • Expect to save $5 million per year in shipping costs costs (lower freight and demurrage) by increasing ship utilization and reducing dock occupancy at St. Ann • Increases certified depth of docking berth and shipping channel from 40 feet to 45 feet • Project allows Noranda to load an incremental 10-15% on existing vessels Shipping Channel Berth Area Before After Before After

Progress on Transformation Path 6 These transformational productivity projects target $85 million incremental segment profit over 2013, independent of aluminum price and other commodity price impact. Initiative Power Port Labor Annual Savings $17 to $25 million $5 million $15 million Date of First Impact June 2015 April 2015 January 2014 Completed $37 to $45 million of structural initiatives to improve cost profile Steps In-Progress In-Progress Capital Projects-- $15 million Debottlenecking, Other-- ~$8 to $12 million Alternative Sourcing, Improved Usage-- ~$20 to $25 million

Primary Aluminum Shipments Bauxite Shipments Quarterly Shipment Information Flat-Rolled Product Shipments Alumina Shipments 7 Primary and Flat-Rolled aluminum products demand remains stable. Aluminum reduction cell issues at smelter has had a temporary negative affect on primary shipments. We expect to return smelter to full production in the near term. 0 20 40 60 80 100 120 140 160 Q4-13 Q1-14 Q2-14 Q3-14 Q4-14 Q1-15 P o u n d s in m il li on s Value-Added External sow Intercompany 0 20 40 60 80 100 120 Q4-13 Q1-14 Q2-14 Q3-14 Q4-14 Q1-15 P o u n d s in m il li on s 0 50 100 150 200 250 300 350 Q4-13 Q1-14 Q2-14 Q3-14 Q4-14 Q1-15 K il o m et ri c tonne s SGA Intercompany SGA External CGA External 0 200 400 600 800 1,000 1,200 1,400 1,600 Q4-13 Q1-14 Q2-14 Q3-14 Q4-14 Q1-15 K il o m et ri c T o n n e s Internal External

US Aluminum Demand Growth Outlook Sector Noranda Product End-Use Applications US Demand Growth Outlook 1 Building & construction • Doors and windows • Curtain wall and store fronts • Shower and tub enclosures • Stadium seating 5% to 7% Electrical • Power transmission units and lines • Electrical wire • Various types of cable 1% to 4% Consumer durables • HVAC equipment • Recreational equipment (boats, golf-carts, etc.) 3% to 6% Foil & packaging • Semi-rigid containers • Flexible packaging • Household foil Flat Transportation • Component parts • Automotive HVAC • Trailers and semi’s • High purity for aerospace 8% to 11% 1 Based on CRU forecasts of US semi-finished goods consumption from 2015 to 2019; source: CRU Aluminum Market Outlook, April 2015 8 Strong demand provides opportunities to grow with our current customers and to follow the spread of aluminum into new applications.

Restarted; 14% Expect to restart before 2017; 24% Possible restart after 2016; 22% Likely to be permanent; 39% Majority of 5.8 MMT Closures Since 2013 Unlikely to Restart in Near-Term Aluminum’s demand fundamentals continue to be strong • Global aluminum consumption growth expected to outpace most other metals • Outlook for aluminum demand remains attractive, despite slowing growth in China – Global economy continues to become more aluminum- intensive – Emerging economies remain poised to enter a rapid period of industrialization, population growth and urbanization Majority of recent capacity closures unlikely to restart near- term • 5.8 MMT of smelting capacity curtailed since beginning of 2013 • Capacity restarts not expected to be a significant factor – ~85% of capacity curtailed since 2013 remains closed – Only 28% of remainder expected to restart before 2017 • Further smelter closures are expected in China as their marginal smelters still dominate the top half of the global cost curve • Lack of greenfield projects outside China indicates production growth will be modest over the next ten years • Certain global producers have announced reviews of existing capacity with potential for closures Near-term price volatility does not change positive underlying industry fundamentals Aluminum Fundamentals 9 Aluminum’s demand fundamentals continue to be strong, and recent capacity closures unlikely to restart in near-term. Near-term price volatility does not change positive underlying industry fundamentals. Source: CRU Aluminum Market Outlook, April 2015 Sources: Company; CRU Long-Term Market Outlook, December 2014; CRU Aluminum Market Outlook, April 2015 3.3 2.1 2.7 3.5 4.2 1.5 2.5 3.5 4.5 1970 1980 1990 2000 2010 2020 2030 2040 (thou sand tons of a lu m in u m c onsu m pt ion p e r bi ll io n do ll ar o f g loba l WAP I) The Global Economy Continues to Become More Aluminum-Intensive Source: Harbor Aluminum, February 2015

Quarterly Results Last Four Quarters (amounts in millions except per pound data) Q1-14 Q4-14 Q1-15 Q1-14 Q1-15 Integrated Upstream Business: Primary shipments (lbs) 141.9 131.4 131.1 589.3 546.6 Integrated Upstream margin/lb: Midwest Transaction Price/lb $ 0.95 $ 1.12 $ 1.05 0.93 1.06 Integrated net cash cost /lb 0.90 0.80 0.83 0.85 0.84 0.05 0.32 0.22 0.08 0.22 Integrated Upstream segment profit $ 7.6 $ 42.3 $ 29.0 $ 50.6 $ 117.8 Flat-Rolled Products Business: Flat-Rolled shipments (lbs) 92.4 85.7 93.3 371.1 383.9 EBITDA margin/lb $ 0.12 $ 0.14 $ 0.14 $ 0.13 $ 0.15 Flat-Rolled Products segment profit $ 10.9 $ 12.3 $ 12.7 $ 47.1 $ 57.7 Corporate Cost $ (7.8) $ (5.0) $ (7.8) $ (30.2) $ (25.0) Total segment profit $ 10.7 $ 49.6 $ 33.9 $ 67.5 $ 150.5 Segment Profit Summary 10 Trend of improved results is due to (i) higher integrated upstream margin per pound, driven by higher aluminum prices, (ii) strong flat-rolled product volumes and margin, and (iii) lower corporate costs.

Sequential Net Cash Cost and Segment Profit Bridges 11 Sequential total segment profit decline due primarily to a sequential decrease in aluminum prices, which negatively impacted Alumina and Primary results. $0.83 $- $0.03 $0.02 $0.04 $0.80 4Q14 Net Cash Cost LME Price for 3rd Party Alumina Shipments Natural gas Maintenance and related impact on usage rates 1Q15 Net Cash Cost Net Cash Cost Per Pound $33.9 $10.3 $2.3 $3.1 $49.6 4Q14 Segment Profit LME & MWP Impact on Primary Aluminum Shipments, and LME Impact on 3rd Party Alumina Sales Impact of Net Cash Cost Items Above, Excluding LME Price from 3rd Party Alumina Shipments Corporate, Flat-Rolled, and Other 1Q 2015 Segment Profit Segment Profit (in millions)

Year-over-Year Net Cash Cost and Segment Profit Bridges 12 Year-over-year total segment profit increase largely due to improved pricing and lower costs related to weather-related disruptions in the integrated upstream business last year. $0.81 $0.83 $0.09 $0.03 $0.06 $0.01 $0.06 $0.06 $0.90 1Q-14 Net Cash Cost 1Q-14 Alumina/Primary Weather-Related Disruptions Q4 2014 Net Cash Cost (Ex. Weather- Related Disruptions) LME Price for 3rd Party Alumina Shipments Natural Gas Price Commodity-Based Input Prices Maintenance and related impact on usage rates Impact of operating smelter below capacity 1Q-15 Net Cash Cost Net Cash Cost Per Pound $22.0 $33.9 $6.4 $11.3 $16.5 $1.8 $10.7 1Q-14 Segment Profit 1Q-14 Alumina/Primary Weather- Related Disruptions 1Q-14 Segment Profit (Ex. Weather-Related Disruptions) LME & MWP Impact on Primary Aluminum Shipments, and LME Impact on 3rd Party Alumina Sales Impact of Net Cash Cost Items Above, Excluding LME Price from 3rd Party Alumina Shipments Improved Flat-Rolled Products Fabrication Premiums and Margins 1Q-15 Segment Profit Total Segment Profit (in millions)

(amounts in millions) Q1 2014 Q4 2014 Q1 2015 Segment profit $ 10.7 $ 49.6 $ 33.9 LIFO/LCM 0.2 (1.7) 4.8 Other recurring non-cash items (1.4) (1.3) (4.2) EBITDA, excluding special items 9.5 46.6 34.5 Depreciation & amortization (21.7) (23.8) (23.0) Interest expense, net (12.5) (12.7) (13.5) Pre-tax income (loss), excluding special items (24.7) 10.1 (2.0) Income tax (benefit), expense (7.8) 0.5 (0.1) Net income (loss), excluding special items $ (16.9) $ 9.6 $ (1.9) EPS, excluding special items $ (0.25) $ 0.14 $ (0.03) Bridge of Segment Profit to Net Income, Ex. Special Items 13 The $11.5 million sequential decrease in net income (ex. special items) reflects lower segment profit, offset by favorable change in LIFO impact. The $15.0 million year-over-year improvement reflects higher segment profit plus favorable LIFO impact.

Cash and Financial Management Overview $50.0 $23.5 $4.9 $8.0 $23.4 $3.1 $33.9 $3.0 $5.5 $20.5 Cash, December 2014 Segment profit Operating working capital Cash Interest payments Tax payments, net Prepaid expenses & other Beginning cash plus cashfrom operating activities Capital spending Financing activities, net Cash, March 2015 $ in m illi o n (1) Liquidity includes $141.9 million available borrowing capacity under the revolving credit facility plus $23.5 million cash. Net debt (debt minus cash) – $642.5 million Total liquidity – $165.4 million (1) 14 Achieving positive cash flow in first quarter 2015 while spending $24 million on sustaining and growth capital projects demonstrates our commitment to improving our cash flow and liquidity while making the necessary investments in the business.

Key Takeaways 15 • $17 to $25 million annual savings from reduced electricity rate at smelter • $5 million annual shipping cost savings from port expansion project in Jamaica • Savings are independent from fluctuations in aluminum prices Completed in April key initiatives to structurally reduce Noranda’s costs by $22-30 million annually • 1Q-15 operating cash flow was $30 million vs. $20 million use in 1Q-14 • 1Q-15 integrated primary margin/pound was $0.22 vs. $0.05 in 1Q-14 • Working capital investment held flat despite seasonal volume increases Q1 results demonstrate year- over-year improvements and positive cash flow • Focused on implementing specific capital, raw material sourcing and usage, and reliability projects to achieve remaining CORE targets • Invested $24 million in sustaining and growth capital in Q1 • Expect smelter to return to full production in mid Q3-15, following setbacks in late Q1-15 Remain focused on operational excellence, improving our cost structure, and investing in the growth of our integrated platform • Aluminum consumption fundamentals remain solid, and near-term price headwinds represent normal volatility • Strong flat-rolled product volumes and margin • Substantially all our value added and fabricated aluminum products volumes are sold under requirements-based supply agreements (vs. spot) Despite continued volatility in prices, aluminum’s long-term fundamentals remain positive “The achievement of these key initiatives is part of our ongoing CORE productivity program, which provides Noranda a solid foundation from which to operate sustainably and grow through the aluminum cycle. We remain focused on achieving operational excellence, making further improvements to our cost structure, and making prudent investments in our integrated platform.” 1 2 3 4
Exhibit 99.3
Noranda Declares Quarterly Dividend on Common Stock
Franklin, Tennessee—May 6, 2015—Noranda Aluminum Holding Corporation (NYSE: NOR) announced today that its Board of Directors has declared a regular quarterly dividend of $0.01 per share to be paid on June 10, 2015 to shareholders of record as of May 18, 2015. The Board anticipates declaring this dividend in future quarters on a regular basis; however, changes in the Company's financial condition and cash needs could result in dividends being declared in different amounts, or not at all.
About the Company
Noranda Aluminum Holding Corporation is a leading North American integrated producer of value-added primary aluminum products, as well as high quality rolled aluminum coils. Noranda is a public company affiliated with its private equity sponsor.
Contact Information
John A. Parker
Vice President of Communication and Investor Relations
(615) 771-5734
john.parker@ noralinc.com
Serious News for Serious Traders! Try StreetInsider.com Premium Free!
You May Also Be Interested In
- Northern Discovery Metals Completes Fieldwork at the Vent Copper Project
- argenx Provides Update on Phase 3 UNITY Study of Efgartigimod SC in Sjögren's Disease
- TGS Q3 2026 Operational Update
Create E-mail Alert Related Categories
SEC FilingsSign up for StreetInsider Free!
Receive full access to all new and archived articles, unlimited portfolio tracking, e-mail alerts, custom newswires and RSS feeds - and more!
