Form 8-K MedAvail Holdings, Inc. For: Sep 13

Corporate Presentation
2 Safe Harbor Statements Forward-Looking Statements. MedAvail, Inc. (“MedAvail”) cautions you that the statements in this presentation that are not a description of historical fact are forward- looking statements which may be identified by use of the words such as “anticipate,” “believe,” “expand,” “expect,” “grow,” “intend,” “opportunity,” “plan,” “potential,” “project”, “target” and “will” among others. These forward-looking statements are based on MedAvail’s current expectations and involve assumptions that may never materialize or may prove to be incorrect. Actual results and the timing of events could differ materially from those anticipated in such forward-looking statements as a result of the ability to project future cash utilization and resources need for contingent future liabilities and business operations, the availability of sufficient resources for combined company operations and to conduct or continue planned product development activities, the ability to execute on commercial objectives, regulatory developments and the timing and ability of MedAvail to raise additional capital to fund operations, and other factors , including, but not limited to, those factors discussed in the section entitled “Risk Factors” of our Current Report on Form 10-Q filed August 12, 2021. Although we believe the expectations reflected in the forward-looking statements are reasonable, we cannot guarantee future results, level of activity, performance or achievements. We undertake no obligation to update any of these forward-looking statements for any reason, even if new information becomes available in the future, except as may be required by law The risks and uncertainties may be amplified by the COVID-19 pandemic, which has caused significant economic uncertainty. The extent to which the COVID-19 pandemic impacts MedAvail’s businesses, operations, and financial results, including the duration and magnitude of such effects, will depend on numerous factors, which are unpredictable, including, but not limited to, the duration and spread of the outbreak, its severity, the actions to contain the virus or treat its impact, and how quickly and to what extent normal economic and operating conditions can resume. You are cautioned not to place undue reliance on forward-looking statements, which speak only as of the date on which they were made. MedAvail undertakes no obligation to update such statements to reflect events that occur or circumstances that exist after the date on which they were made, except as may be required by law.

3 Investment Highlights $16B TAM - Medicare Part D revenues across 7,000 clinics in six initial states Embedded pharmacy model delivers unique value proposition Proprietary technology platform provides additional growth opportunities Highly scalable hub & spoke model; low capital cost Track record of delivering higher medication adherence and 5 star ratings

4MedAvail: Transforming Full Service Pharmacy Legacy Pharmacy MedAvail Brick and mortar retail location Proliferation of superfluous non-pharma products Pharmacy wait-times; confusing mail order delivery High capital (~$500K) and operating costs No proactive data sharing with care providers LOCATION FOCUS SERVICE COST FEEDBACK/DATA Embedded at point-of-care Therapeutics High touch in-clinic and delivery service Low capital (~$50K) and operating costs Medication adherence data to providers Better Health OUTCOMES Outstanding Patient EXPERIENCE* *(Aguilar et al, 2015)

5 MedAvail – Our Business Model Sell/License Technology Technology Vendor • 20% of revenue1 • Sell and license our technology to a select list of large enterprise customers • Customers use their back-end pharmacy operations (pharmacists, inventory) • 80% of revenue1 • Turnkey full-stack pharmacy offering • Telehealth platform delivering remote pharmacist consultation through onsite dispensing kiosk, supplemented with home delivery capability Telehealth Pharmacy Platform, Medicare Focused Pharmacy 1 Long-term target
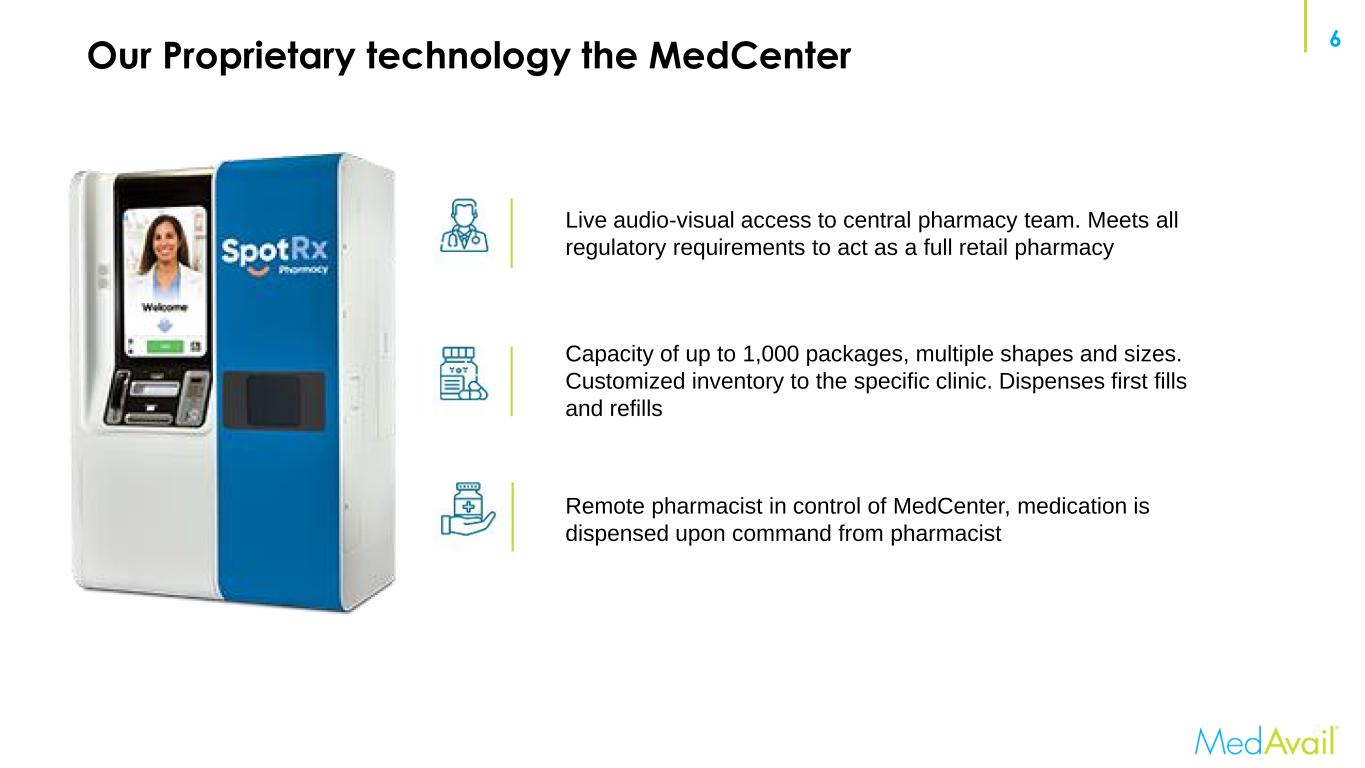
6 Capacity of up to 1,000 packages, multiple shapes and sizes. Customized inventory to the specific clinic. Dispenses first fills and refills Live audio-visual access to central pharmacy team. Meets all regulatory requirements to act as a full retail pharmacy Remote pharmacist in control of MedCenter, medication is dispensed upon command from pharmacist Our Proprietary technology the MedCenter 6

7 We license and sell our proprietary hardware and software to health systems, retailers and other industry players • Integrated into back-end pharmacy systems • Customized patient workflow • 24/7 help desk support • On-site maintenance support • Customer branding • Manufactured in the USA MedAvail Technology Offers Pharmacy Efficiencies to Third Parties • 19 sites deployed • 350 points of care, 27 hospitals • 9 Initial sites in 2 states • Sam’s Club: 600 stores • 3 hospitals deployed, • 150+ hospitals, 1,800 sites of care

8 SpotRx Achieves Scale Through Technology and Centralized Hubs Unique Pharmacy Model Results in Superior Medication Adherence and Satisfaction 1 Open CENTRALIZED PHARMACY HUB in Each SpotRx Service Area SPOTRX DEPLOYMENTS at Each Clinic Site 2 ✓ Live A/V connection to Hub pharmacist ✓ Localized inventory replenishment ✓ Access to first fill and refills through on-site SpotRx MedCenter or home delivery ✓ On-site SpotRx account manager for patients and clinic staff ✓ Opportunities to drive adherence and satisfaction among clinic patients

9 SpotRx Pharmacy Model Provides Differentiated Value Proposition On-site support with clinic account manager results in pharmacy as part of care team and customer acquisition Customized medication inventory by clinic with on-site dispensing and access to pharmacy team via MedCenter helps improve adherence Proactive adherence programs driving 5 Star performance Multiple avenues to receive medication, including free courier delivery Patient level data sharing and reporting for providers
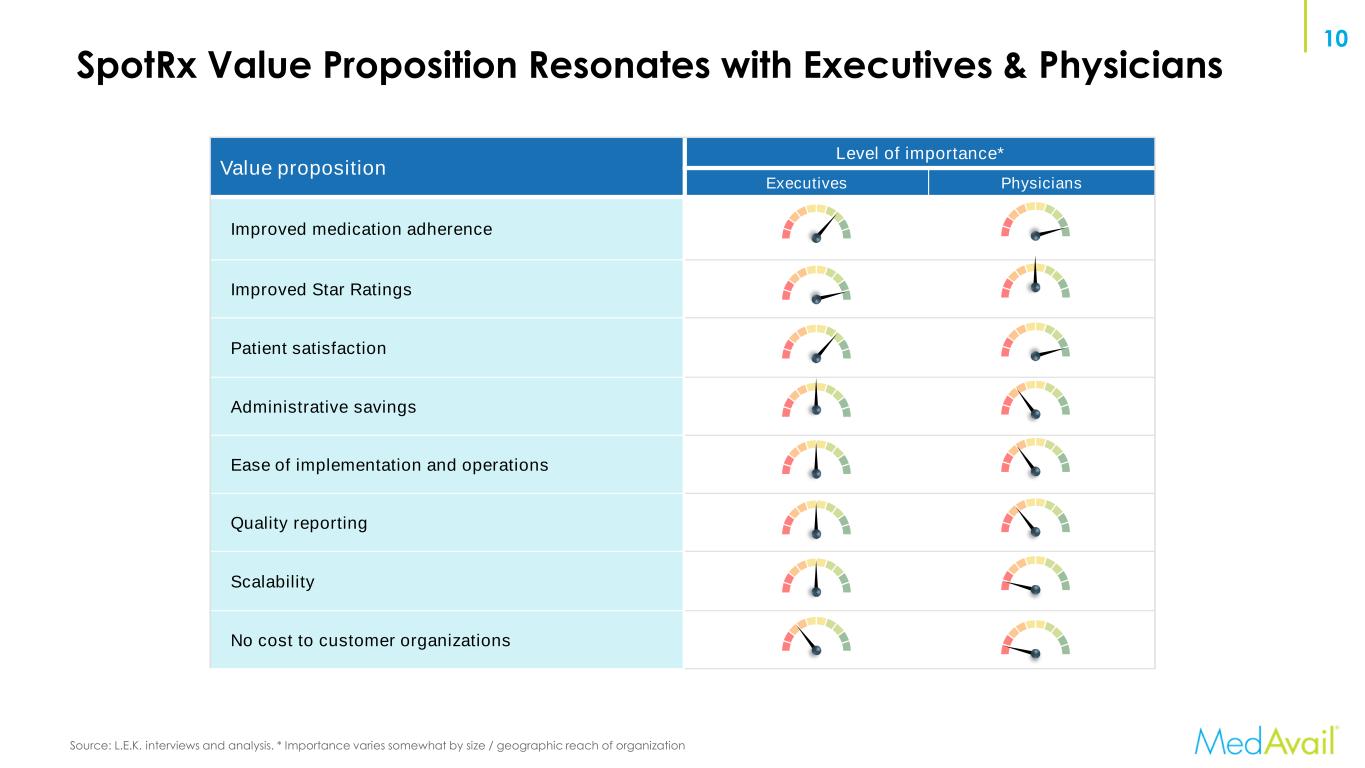
10 SpotRx Value Proposition Resonates with Executives & Physicians Source: L.E.K. interviews and analysis. * Importance varies somewhat by size / geographic reach of organization Value proposition Level of importance* Executives Physicians Improved medication adherence Improved Star Ratings Patient satisfaction Administrative savings Ease of implementation and operations Quality reporting Scalability No cost to customer organizations
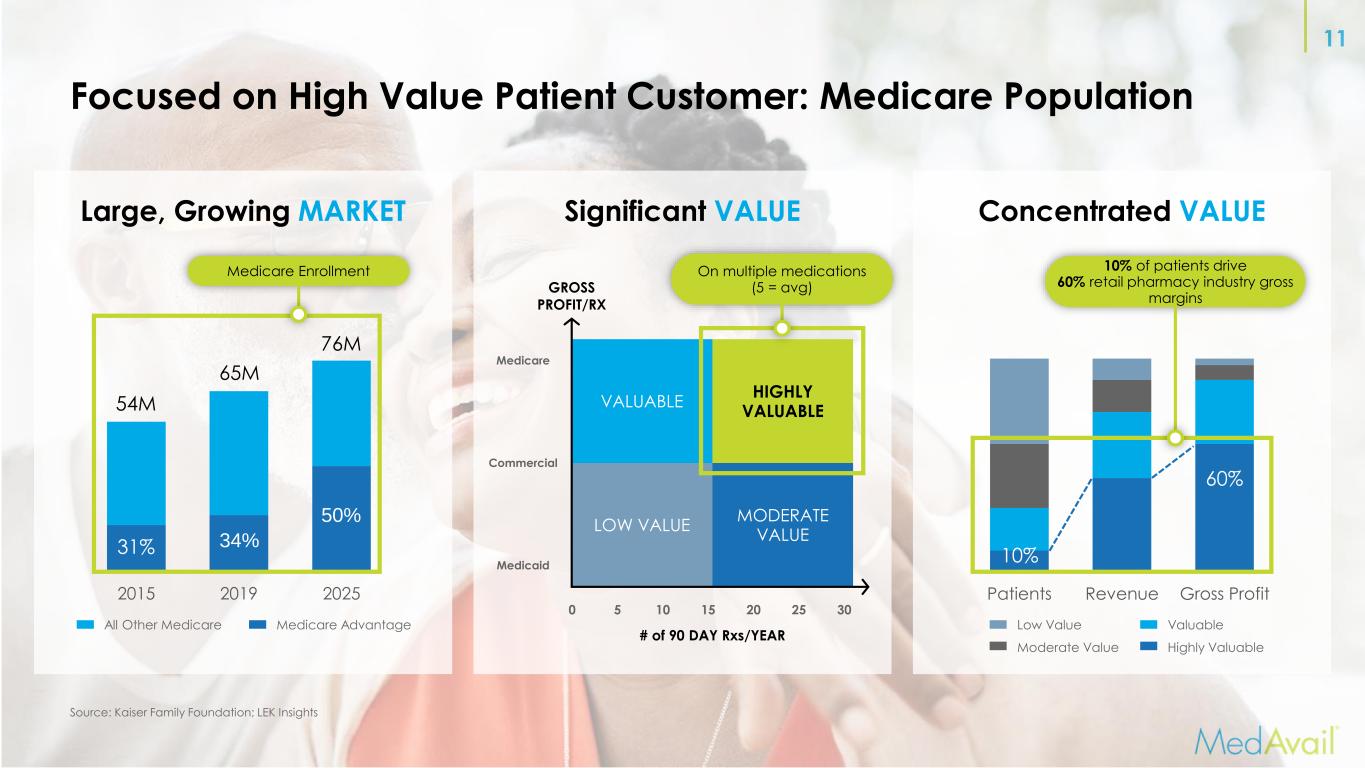
11 Focused on High Value Patient Customer: Medicare Population Significant VALUE # of 90 DAY Rxs/YEAR GROSS PROFIT/RX Medicare Commercial Medicaid 0 10 15 20 25 305 VALUABLE LOW VALUE HIGHLY VALUABLE MODERATE VALUE On multiple medications (5 = avg) Source: Kaiser Family Foundation; LEK Insights Large, Growing MARKET 2015 2019 2025 54M 65M 76M 31% 34% 50% Medicare Enrollment All Other Medicare Medicare Advantage Concentrated VALUE Patients Revenue Gross Profit 10% of patients drive 60% retail pharmacy industry gross margins Low Value Moderate Value Valuable Highly Valuable 10% 60%

12 Medication adherence impact on Star rating and PMPY cost “… Physicians in particular want medication compliance as high as possible because they are really interested most in clinical outcomes and ensuring a patient is getting what they need to get better …” -VP of Medical Group Operations, CA clinic client “… From a corporate standpoint, increased medication adherence is beneficial because it directly improves the ratings that payers use to determine reimbursements and decreases costs by reducing hospitalizations of patients not taking their medications …” -Medical Director, MI clinic client 32% 58% Other 10% Direct impact1 Indirect impact Clinics benefit from reduced cost-of-care and improved Star Ratings as a result of adherence, which results in MA bonuses for capitated and integrated payer-providers Star Ratings / Financial Impact Adherence impacts 42% of Star Ratings1 Net annual healthcare savings of $1-8k per member as a result of adherence2 ⚫ ~$8k for heart failure ⚫ ~$4k for hypertension ⚫ ~$4k for diabetes ⚫ ~$1k for cholesterol Source: L.E.K. interviews and analysis. 1 Based on CMS; direct includes medication adherence for cholesterol, hypertension, and diabetes medications 2 Based on CVS Caremark study annual health care savings per member Large, vertically-integrated players embracing embedded pharmacy Embedded physical pharmacies Retail pharmacies in MOB Acquires Behavioral health retail pharmacy

13 Our Solution is Driving Better Adherence Our Customers are Happy SpotRx 5 Star Threshold 4 Star Threshold U.S. Industry Average Patient ADHERENCE Patient / Provider / Payor SATISFACTION Patients Net Promoter Score (NPS) ~90 * CMS Star Rating Bands 2020, SpotRx measure over 12 month period from January 2020 to December 2020 ** NPS measured from January 2020 to December 2020, N=6962 *** US average from CMS data Acute Maintenance Diabetes Hypertension Cholesterol 85% 82.6% 92.4% 92.4% 91.5% 88% 85% 90% 88% 88% 86% First Fill Adherence Chronic Adherence* ** “… I think SpotRx is fantastic. I am so glad they are here. I think a lot of patients that use it benefit from this service. I constantly recommend their product because I see the patient satisfaction …” Practice Manager, AZ clinic client “… The feedback from customers is that they are so satisfied with the product and the level of service provided. Overall, we have had a really good experience …” Practice Manager, CA clinic client “… I have only had good experiences with SpotRx, and I know our patients feel the same. There is no request that is not met with a solution or plan. They are a great partner …” Director of Clinical Operations, CA clinic client 75%75% 85% 83% 82%
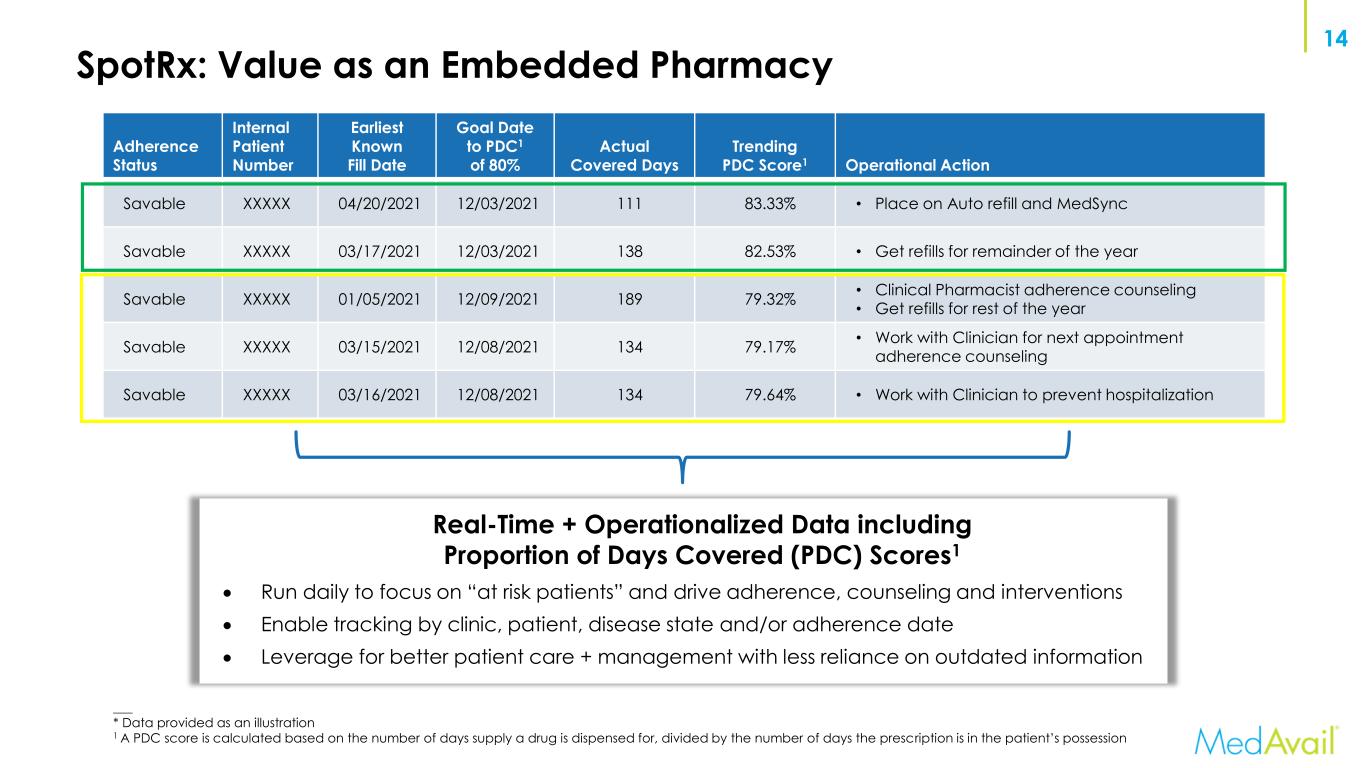
14 SpotRx: Value as an Embedded Pharmacy ___ * Data provided as an illustration 1 A PDC score is calculated based on the number of days supply a drug is dispensed for, divided by the number of days the prescription is in the patient’s possession Adherence Status Internal Patient Number Earliest Known Fill Date Goal Date to PDC1 of 80% Actual Covered Days Trending PDC Score1 Operational Action Savable XXXXX 04/20/2021 12/03/2021 111 83.33% • Place on Auto refill and MedSync Savable XXXXX 03/17/2021 12/03/2021 138 82.53% • Get refills for remainder of the year Savable XXXXX 01/05/2021 12/09/2021 189 79.32% • Clinical Pharmacist adherence counseling • Get refills for rest of the year Savable XXXXX 03/15/2021 12/08/2021 134 79.17% • Work with Clinician for next appointment adherence counseling Savable XXXXX 03/16/2021 12/08/2021 134 79.64% • Work with Clinician to prevent hospitalization • Run daily to focus on “at risk patients” and drive adherence, counseling and interventions • Enable tracking by clinic, patient, disease state and/or adherence date • Leverage for better patient care + management with less reliance on outdated information Real-Time + Operationalized Data including Proportion of Days Covered (PDC) Scores1

15 Initial Target Markets – $16.5B of Annual Prescription Revenue STATE SELECTION CRITERIA • Large markets • Favorable regulatory environment for automated dispensing technology • Concentrated prescriber groups OPPORTUNITY $100B Part D medication spend in 2018 $40B Part D spend in our target states $16.5B within 7,000 large clinics seeing ~6.5M Medicare patients/year % of Rx’s Written by Top 20 Groups Concentration enables efficient expansion via enterprise deals ARIZONA 27% CALIFORNIA 23% ILLINOIS 29% TEXAS 26% FLORIDA 50% MICHIGAN 30% CALIFORNIA $4.5B Live 2020 ARIZONA $0.6B Live 2019 ILLINOIS $2.2B Targeting FLORIDA $3.7B Expansion 2021TEXAS $3.6B Targeting MICHIGAN $2.0B Live 2020

16 Enterprise Focused Business Development Strategy ARIZONA CALIFORNIA MICHIGAN Business Development Process Lead with large group enterprise deals multiple initial clinic deployments/group Expand within groups and add groups FLORIDA
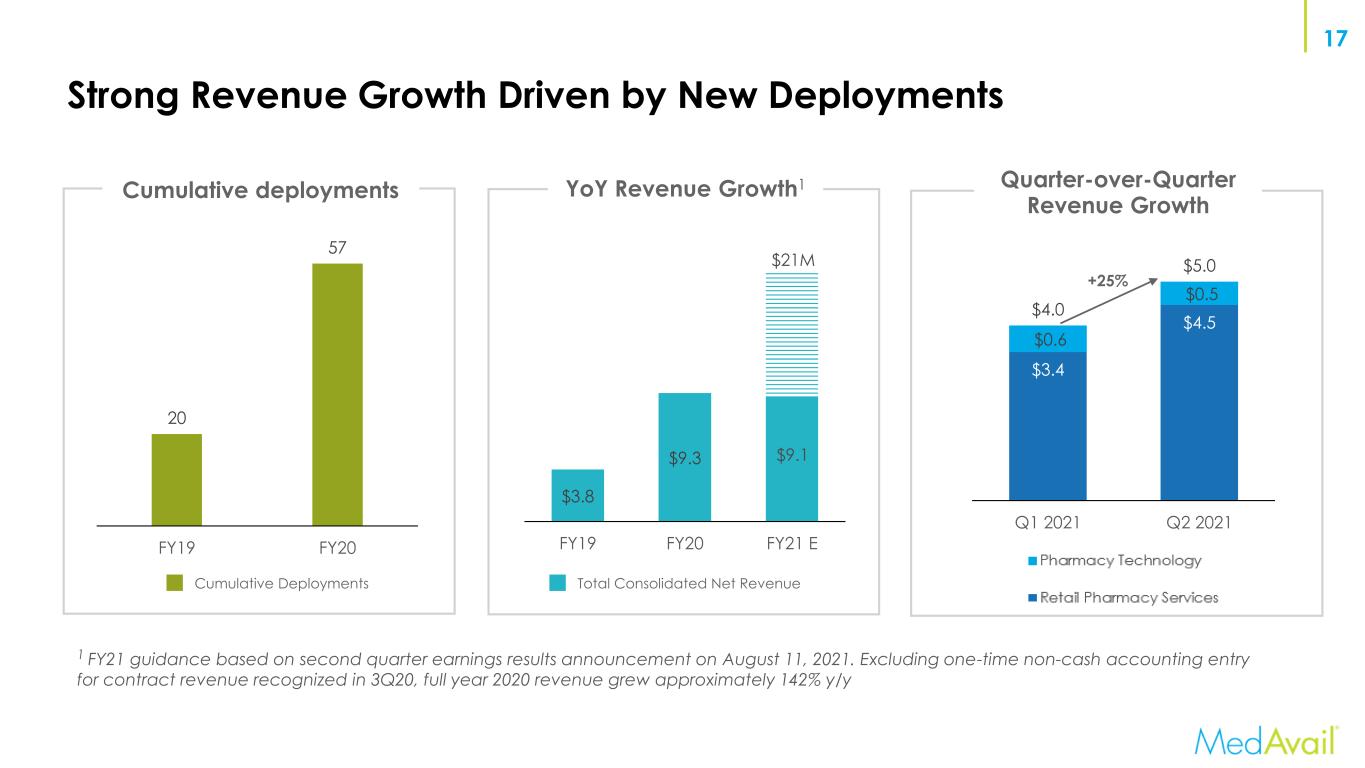
17 Strong Revenue Growth Driven by New Deployments Cumulative deployments Cumulative Deployments 1 FY21 guidance based on second quarter earnings results announcement on August 11, 2021. Excluding one-time non-cash accounting entry for contract revenue recognized in 3Q20, full year 2020 revenue grew approximately 142% y/y 20 57 FY19 FY20 YoY Revenue Growth1 $3.8 $9.3 FY19 FY20 FY21 E $21M Total Consolidated Net Revenue Quarter-over-Quarter Revenue Growth $3.4 $4.5 $0.6 $0.5 $4.0 $5.0 Q1 2021 Q2 2021 +25% $9.1

18 Target Business Model Target Pharmacy Revenue (SpotRx) 80%-85% of revenue HW/SW Revenue 15%-20% of revenue Gross Margin 20-25% EBITDA ~12-14%

19 Proven Team, Advisors and Investors Ed Kilroy CEO Will Misloski CMO Redmile Group Neil Prezioso CPO David Feinberg Advisor MANAGEMENT TEAM ADVISOR INVESTORS David Rawlins CCO Joan O’Rourke PRESIDENT OF SPOTRX Brian Schlerf INTERIM CFO

20 Appendix

21 Supplemental Financial Summary Consolidated Statement of Operations (Unaudited) (In thousands) Q1 2020 Q2 2020 Q3 2020 Q4 2020 Q1 2021 Q2 2021 Sales: Pharmacy and hardware sales 1,402$ 2,259$ 3,926$ 3,009$ 3,781$ 4,725$ Service sales (1) 10 52 3,219 92 246 305 Total sales 1,412 2,311 7,145 3,101 4,027 5,030 Cost of sales: Pharmacy and hardware cost of sales (1) 1,385 1,826 2,132 3,250 3,526 4,679 Service cost of sales 47 39 30 96 181 178 Total cost of sales 1,432 1,865 2,162 3,346 3,707 4,857 Gross profit (20) 446 4,983 (245) 320 173 Pharmacy operations 1,089 1,116 1,450 2,032 1,911 2,292 General and administrative 3,500 3,580 3,464 6,019 6,515 6,646 Selling and marketing 703 570 624 1,146 1,377 1,497 Research and development 215 163 154 150 168 201 Merger expenses - 1,283 1,324 2,084 - - Operating loss (5,527) (6,266) (2,033) (11,676) (9,651) (10,463) Other gain (loss), net 8 - - (110) 161 38 Interest income 8 7 - 29 40 27 Interest expense (179) (277) (455) (328) (2) (66) Loss before income taxes (5,690) (6,536) (2,488) (12,085) (9,452) (10,464) Income tax - - - - - - Net loss (5,690)$ (6,536)$ (2,488)$ (12,085)$ (9,452)$ (10,464)$ (1) Includes aggregate one-time contract revenue of $4.7 million recognized in Q3 2020.

22 Supplemental Financial Summary Sales and Cost of Sales by Segment (Unaudited) (In thousands) Retail Pharmacy Services Pharmacy Technology Total Retail Pharmacy Services Pharmacy Technology Total Retail Pharmacy Services Pharmacy Technology Total Retail Pharmacy Services Pharmacy Technology Total Sales: Pharmacy and hardware sales: Retail pharmacy revenue 1,297$ -$ 1,297$ 1,713$ -$ 1,713$ 2,185$ -$ 2,185$ 2,533$ -$ 2,533$ Hardware (1) - - - - 423 423 - 1,626 1,626 - 352 352 Subscription revenue - 105 105 - 123 123 - 115 115 - 125 125 Total pharmacy and hardware sales 1,297 105 1,402 1,713 546 2,259 2,185 1,741 3,926 2,533 477 3,010 Service sales: Software integration (1) - - - - - - - 3,185 3,185 - (17) (17) Software - - - - 10 10 - 15 15 - 20 20 Maintenance and support - 10 10 - 13 13 - 17 17 - 18 18 Installation - - - - 28 28 - - - - 27 27 Professional services and other - - - - 1 1 - 2 2 - 43 43 Total service sales - 10 10 - 52 52 - 3,219 3,219 - 91 91 Total sales 1,297 115 1,412 1,713 598 2,311 2,185 4,960 7,145 2,533 568 3,101 Cost of sales 1,338 94 1,432 1,679 186 1,865 2,042 120 2,162 2,685 661 3,346 Gross profit (loss) (41)$ 21$ (20)$ 34$ 412$ 446$ 143$ 4,840$ 4,983$ (152)$ (93)$ (245)$ (1) Includes aggregate one-time contract revenue of $4.7 million recognized in Q3 2020. Q1 2020 Q2 2020 Q3 2020 Q4 2020

23 Supplemental Financial Summary Sales and Cost of Sales by Segment (Unaudited) (In thousands) Retail Pharmacy Services Pharmacy Technology Total Retail Pharmacy Services Pharmacy Technology Total Sales: Pharmacy and hardware sales: Retail pharmacy revenue 3,418$ -$ 3,418$ 1,713$ -$ 1,713$ Hardware (1) - 241 241 - 423 423 Subscription revenue - 122 122 - 123 123 Total pharmacy and hardware sales 3,418 363 3,781 1,713 546 2,259 Service sales: - - - Software integration (1) - - - - - - Software - 33 33 - 10 10 Maintenance and support - 31 31 - 13 13 Installation - 16 16 - 28 28 Professional services and other - 166 166 - 1 1 Total service sales - 246 246 - 52 52 Total sales 3,418 609 4,027 1,713 598 2,311 Cost of sales 3,329 378 3,707 1,679 186 1,865 Gross profit (loss) 89$ 231$ 320$ 34$ 412$ 446$ Q1 2021 Q2 2021

24 Supplemental Financial Summary Adjusted EBITDA – Non-GAAP Reconciliation (Unaudited) (In thousands) Q1 2020 Q2 2020 Q3 2020 Q4 2020 Q1 2021 Q2 2021 Net loss (5,690)$ (6,536)$ (2,488)$ (12,085)$ (9,452)$ (10,464)$ Adjustments to calculate EBITDA: Interest expense, net 171 270 455 299 (38) 39 Income tax - - - - - - Depreciation and amortization 243 279 271 298 340 380 EBITDA (5,276) (5,987) (1,762) (11,488) (9,150) (10,045) Adjustments as follows: Bad debt & service fees - - - 75 - - Share-based compensation expense 84 86 65 145 260 323 Merger related expense - 1,283 1,324 2,084 - - Other (income) loss, net (8) - - 110 (161) - Inventory impairment charges - - - 352 - - One-time contract revenue (1) - - (4,729) - - - Adjusted EBITDA (5,200)$ (4,618)$ (5,102)$ (8,722)$ (9,051)$ (9,722)$ (1) One-time contract revenue of $4.7 million recognized in Q3 2020.

25 Supplemental Financial Summary Non-GAAP Measures To supplement our consolidated financial statements, which are prepared and presented in accordance with GAAP, we use the following non- GAAP financial measures: EBITDA, and adjusted EBITDA. The presentation of this financial information is not intended to be considered in isolation or as a substitute for, or superior to, the financial information prepared and presented in accordance with GAAP. We define Adjusted EBITDA for a particular period as net (loss) income before interest, taxes, depreciation and amortization, and as further adjusted for bad debt and service fees, share-based compensation expense, merger related expenses, other (income) loss, net, non-recurring inventory impairment charges, and one-time contract revenue. We use these non-GAAP financial measures for financial and operational decision-making and as a means to evaluate period-to-period comparisons. We believe that these non-GAAP financial measures provide meaningful supplemental information regarding our performance by excluding certain items that may not be indicative of our recurring core business operating results, like one-time transaction costs related to the reverse merger. We believe that both management and investors benefit from referring to these non-GAAP financial measures in assessing our performance and when planning, forecasting, and analyzing future periods. These non-GAAP financial measures also facilitate management's internal comparisons to our historical performance and liquidity as well as comparisons to our competitors' operating results. We believe these non-GAAP financial measures are useful to investors both because (1) they allow for greater transparency with respect to key metrics used by management in its financial and operational decision-making and (2) they are used by our institutional investors and the analyst community to help them analyze the health of our business. There are a number of limitations related to the use of non-GAAP financial measures. We compensate for these limitations by providing specific information regarding the GAAP amounts excluded from these non-GAAP financial measures and evaluating these non-GAAP financial measures together with their relevant financial measures in accordance with GAAP.
Serious News for Serious Traders! Try StreetInsider.com Premium Free!
You May Also Be Interested In
- Spar Nord repays Tier 2 capital with ISINs DK0030431341 and DK0030432075
- Konsolidator maintains its financial expectations for 2024
- Adevinta (ASA) publishes its 2023 Annual Report
Create E-mail Alert Related Categories
SEC FilingsSign up for StreetInsider Free!
Receive full access to all new and archived articles, unlimited portfolio tracking, e-mail alerts, custom newswires and RSS feeds - and more!


 Tweet
Tweet Share
Share