



Form 8-K Mead Johnson Nutrition For: Oct 22
 Tweet
Tweet Share
Share E-mail
UNITED STATES
SECURITIES AND EXCHANGE COMMISSION
Washington, D.C. 20549
FORM 8-K
CURRENT REPORT
Pursuant to Section 13 or 15(d) of
the Securities Exchange Act of 1934
Date of report (Date of earliest event reported): October 22, 2015 (October 22, 2015)
MEAD JOHNSON NUTRITION COMPANY
(Exact Name of Registrant as Specified in Charter)
|
Delaware |
|
001-34251 |
|
80-0318351 |
|
(State or Other Jurisdiction of Incorporation) |
|
(Commission File Number) |
|
(IRS Employer Identification No.) |
|
2701 Patriot Blvd., Glenview, Illinois |
|
60026 |
|
(Address of Principal Executive Offices) |
|
(Zip Code) |
Registrant’s telephone number, including area code: (847) 832-2420
Not Applicable
(Former Name or Former Address, if Changed Since Last Report)
Check the appropriate box below if the Form 8-K filing is intended to simultaneously satisfy the filing obligation of the registrant under any of the following provisions:
o Written communications pursuant to Rule 425 under the Securities Act (17 CFR 230.425)
o Soliciting material pursuant to Rule 14a-12 under the Exchange Act (17 CFR 240.14a-12)
o Pre-commencement communications pursuant to Rule 14d-2(b) under the Exchange Act (17 CFR 240.14d-2(b))
o Pre-commencement communications pursuant to Rule 13e-4(c) under the Exchange Act (17 CFR 240.13e-4(c))
Item 7.01: Regulation FD Disclosure
In a press release dated October 2, 2015, Mead Johnson Nutrition Company (the “Company”) announced that it will hold its Investor Day in Chicago, Illinois on October 22, 2015. Investor Day will be broadcast live on the Internet and can be accessed in the manner set forth in the press release.
The Company is furnishing herewith as exhibits copies materials that it expects to present at Investor Day.
Item 9.01: Financial Statements and Exhibits
(d) Exhibits
99.1 Mead Johnson Nutrition Company Presentation dated October 22, 2015
99.2 Mead Johnson Nutrition Company Presentation dated October 22, 2015
99.3 Mead Johnson Nutrition Company Presentation dated October 22, 2015
99.4 Mead Johnson Nutrition Company Presentation dated October 22, 2015
99.5 Mead Johnson Nutrition Company Presentation dated October 22, 2015
99.6 Mead Johnson Nutrition Company Presentation dated October 22, 2015
99.7 Mead Johnson Nutrition Company Presentation dated October 22, 2015
99.8 Mead Johnson Nutrition Company Presentation dated October 22, 2015
99.9 Mead Johnson Nutrition Company Presentation dated October 22, 2015
SIGNATURES
Pursuant to the requirements of the Securities Exchange Act of 1934, the registrant has duly caused this report to be signed on its behalf by the undersigned hereunto duly authorized.
|
|
|
MEAD JOHNSON NUTRITION COMPANY |
|
|
|
|
|
|
|
|
|
Date: October 22, 2015 |
By: |
/s/ Michel Cup |
|
|
|
Michel Cup |
|
|
|
Executive Vice President and Chief Financial Officer |
Exhibit 99.1
Welcome to MJN Investor Day Investor Day 2015

Safe Harbor Statement 2 Forward-Looking Statements Certain statements in this presentation are forward-looking as defined in the Private Securities Litigation Reform Act of 1995. These forward-looking statements may be identified by the fact they use words such as “should,” “expect,” “anticipate,” “estimate,” “target,” “may,” “project,” “guidance,” “intend,” “plan,” “believe” and other words and terms of similar meaning and expression. Such statements are likely to relate to, among other things, a discussion of goals, plans and projections regarding financial position, results of operations, cash flows, market position, market growth and trends, product development, product approvals, sales efforts, expenses, capital expenditures, performance or results of current and anticipated products and the outcome of contingencies such as legal proceedings and financial results. Forward-looking statements can also be identified by the fact that they do not relate strictly to historical or current facts. Such forward-looking statements are based on current expectations that involve inherent risks, uncertainties and assumptions that may cause actual results to differ materially from expectations as of the date of this presentation. These risks include, but are not limited to: (1) the ability to sustain brand strength, particularly the Enfa family of brands; (2) the effect on the company's reputation of real or perceived quality issues; (3) the effect of regulatory restrictions related to the company’s products; (4) the adverse effect of commodity costs; (5) increased competition from branded, private label, store and economy-branded products; (6) the effect of an economic downturn on consumers' purchasing behavior and customers' ability to pay for product; (7) inventory reductions by customers; (8) the adverse effect of changes in foreign currency exchange rates; (9) the effect of changes in economic, political and social conditions in the markets where we operate; (10) changing consumer preferences; (11) the possibility of changes in the Women, Infant and Children (WIC) program, or participation in WIC; (12) legislative, regulatory or judicial action that may adversely affect the company's ability to advertise its products, maintain product margins, or negatively impact the company’s reputation or result in fines or penalties that decrease earnings; and (13) the ability to develop and market new, innovative products. For additional information regarding these and other factors, see the company’s filings with the United States Securities and Exchange Commission (the SEC), including its most recent Annual Report on Form 10-K, which filings are available upon request from the SEC or at www.meadjohnson.com. The company cautions readers not to place undue reliance on any forward-looking statements, which speak only as of the date made. The company undertakes no obligation to publicly update any forward-looking statement, whether as a result of new information, future events or otherwise.
Safe Harbor Statement 3 Factors Affecting Comparability – Non-GAAP Financial Measures This presentation contains non-GAAP financial measures, including non-GAAP net sales, EBIT, earnings, earnings per share information, and effective tax rates. Non-GAAP information, at times, excludes the impact of foreign currency translation. Specified Items are terms included in GAAP measures, but excluded for the purpose of determining non-GAAP net sales, EBIT, earnings and earnings per share. In addition, other items include the tax impact on Specified Items. Non-GAAP net sales, EBIT, earnings and earnings per share information adjusted for these items is an indication of the company’s underlying operating results and intended to enhance an investor’s overall understanding of the company’s financial performance. In addition, this information is among the primary indicators the company uses as a basis for evaluating company performance, setting incentive compensation targets and planning and forecasting of future periods. This information is not intended to be considered in isolation or as a substitute for financial measures prepared in accordance with GAAP. Tables that reconcile non-GAAP to GAAP disclosure are included in the Appendix. For more information: Kathy MacDonald, Vice President – Investor Relations Mead Johnson Nutrition Company 847-832-2182 [email protected] October 2015
[LOGO]

Exhibit 99.2
Kasper Jakobsen President & Chief Executive Officer Investor Day 2015

Safe Harbor Statement 2 Forward-Looking Statements Certain statements in this presentation are forward-looking as defined in the Private Securities Litigation Reform Act of 1995. These forward-looking statements may be identified by the fact they use words such as “should,” “expect,” “anticipate,” “estimate,” “target,” “may,” “project,” “guidance,” “intend,” “plan,” “believe” and other words and terms of similar meaning and expression. Such statements are likely to relate to, among other things, a discussion of goals, plans and projections regarding financial position, results of operations, cash flows, market position, market growth and trends, product development, product approvals, sales efforts, expenses, capital expenditures, performance or results of current and anticipated products and the outcome of contingencies such as legal proceedings and financial results. Forward-looking statements can also be identified by the fact that they do not relate strictly to historical or current facts. Such forward-looking statements are based on current expectations that involve inherent risks, uncertainties and assumptions that may cause actual results to differ materially from expectations as of the date of this presentation. These risks include, but are not limited to: (1) the ability to sustain brand strength, particularly the Enfa family of brands; (2) the effect on the company's reputation of real or perceived quality issues; (3) the effect of regulatory restrictions related to the company’s products; (4) the adverse effect of commodity costs; (5) increased competition from branded, private label, store and economy-branded products; (6) the effect of an economic downturn on consumers' purchasing behavior and customers' ability to pay for product; (7) inventory reductions by customers; (8) the adverse effect of changes in foreign currency exchange rates; (9) the effect of changes in economic, political and social conditions in the markets where we operate; (10) changing consumer preferences; (11) the possibility of changes in the Women, Infant and Children (WIC) program, or participation in WIC; (12) legislative, regulatory or judicial action that may adversely affect the company's ability to advertise its products, maintain product margins, or negatively impact the company’s reputation or result in fines or penalties that decrease earnings; and (13) the ability to develop and market new, innovative products. For additional information regarding these and other factors, see the company’s filings with the United States Securities and Exchange Commission (the SEC), including its most recent Annual Report on Form 10-K, which filings are available upon request from the SEC or at www.meadjohnson.com. The company cautions readers not to place undue reliance on any forward-looking statements, which speak only as of the date made. The company undertakes no obligation to publicly update any forward-looking statement, whether as a result of new information, future events or otherwise. Factors Affecting Comparability – Non-GAAP Financial Measures This presentation contains non-GAAP financial measures, including non-GAAP net sales, EBIT, earnings, earnings per share information, and effective tax rates. Specified Items are terms included in GAAP measures, but excluded for the purpose of determining non-GAAP net sales, EBIT, earnings and earnings per share. In addition, other items include the tax impact on Specified Items. Non-GAAP net sales, EBIT, earnings and earnings per share information adjusted for these items is an indication of the company’s underlying operating results and intended to enhance an investor’s overall understanding of the company’s financial performance. In addition, this information is among the primary indicators the company uses as a basis for evaluating company performance, setting incentive compensation targets and planning and forecasting of future periods. This information is not intended to be considered in isolation or as a substitute for financial measures prepared in accordance with GAAP. Tables that reconcile non-GAAP to GAAP disclosure are included in the Appendix. For more information: Kathy MacDonald, Vice President – Investor Relations Mead Johnson Nutrition Company 847-832-2182 [email protected] October 2015 MJN Confidential and Proprietary Information
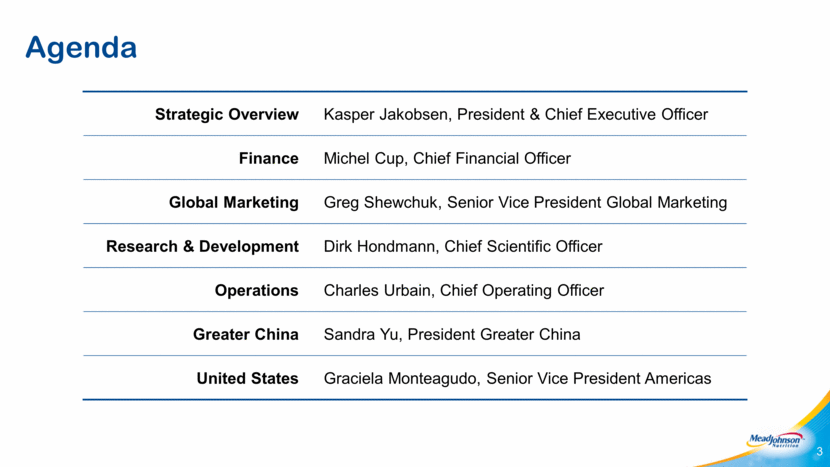
Agenda 3 Strategic Overview Kasper Jakobsen, President & Chief Executive Officer Finance Michel Cup, Chief Financial Officer Global Marketing Greg Shewchuk, Senior Vice President Global Marketing Research & Development Dirk Hondmann, Chief Scientific Officer Operations Charles Urbain, Chief Operating Officer Greater China Sandra Yu, President Greater China United States Graciela Monteagudo, Senior Vice President Americas
Global Growth, Strategy and Innovation Fuel For Growth Initiative Creating Value Using Capital Structure Key Market Updates China United States Focus of Investor Day 4
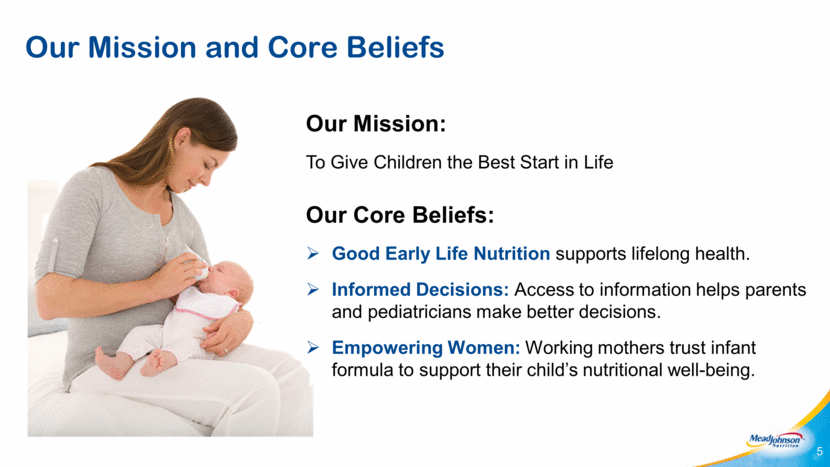
Our Mission and Core Beliefs 5 Our Mission: To Give Children the Best Start in Life Our Core Beliefs: Good Early Life Nutrition supports lifelong health. Informed Decisions: Access to information helps parents and pediatricians make better decisions. Empowering Women: Working mothers trust infant formula to support their child’s nutritional well-being.
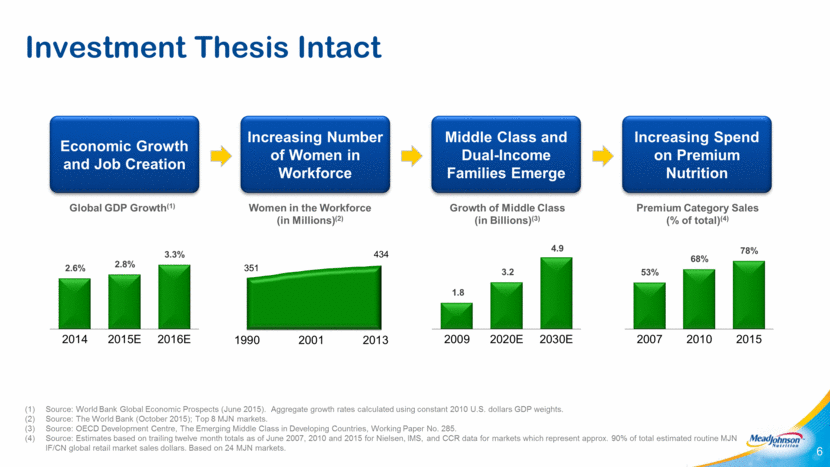
Investment Thesis Intact 6 Source: World Bank Global Economic Prospects (June 2015). Aggregate growth rates calculated using constant 2010 U.S. dollars GDP weights. Source: The World Bank (October 2015); Top 8 MJN markets. Source: OECD Development Centre, The Emerging Middle Class in Developing Countries, Working Paper No. 285. Source: Estimates based on trailing twelve month totals as of June 2007, 2010 and 2015 for Nielsen, IMS, and CCR data for markets which represent approx. 90% of total estimated routine MJN IF/CN global retail market sales dollars. Based on 24 MJN markets. Global GDP Growth(1) Growth of Middle Class (in Billions)(3) Economic Growth and Job Creation Middle Class and Dual-Income Families Emerge Increasing Spend on Premium Nutrition Premium Category Sales (% of total)(4) Women in the Workforce (in Millions)(2) Increasing Number of Women in Workforce 2.6% 2.8% 3.3% 2014 2015E 2016E 1.8 3.2 4.9 2009 2020E 2030E 53% 68% 78% 2007 2010 2015 351 434 1990 2001 2013
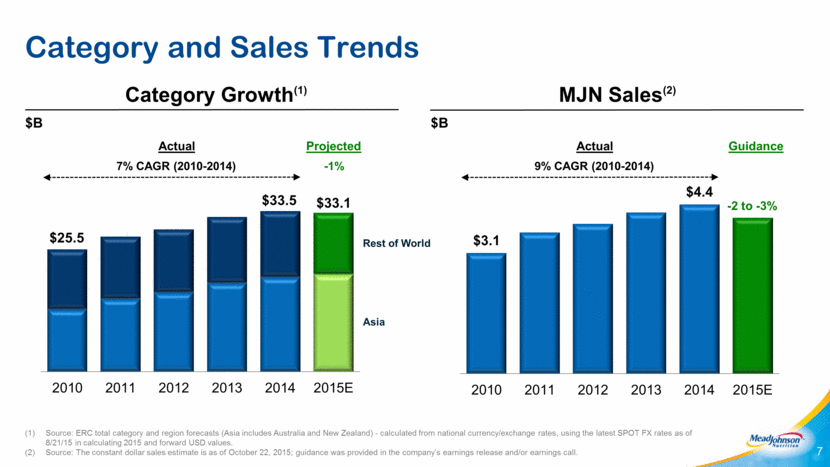
Category and Sales Trends 7 Category Growth(1) MJN Sales(2) 7% CAGR (2010-2014) Source: ERC total category and region forecasts (Asia includes Australia and New Zealand) - calculated from national currency/exchange rates, using the latest SPOT FX rates as of 8/21/15 in calculating 2015 and forward USD values. Source: The constant dollar sales estimate is as of October 22, 2015; guidance was provided in the company’s earnings release and/or earnings call. Guidance $B Asia Rest of World $B 9% CAGR (2010-2014) Projected Actual Actual -1% -2 to -3% $25.5 $33.5 $33.1 2010 2011 2012 2013 2014 2015E $3.1 $4.4 2010 2011 2012 2013 2014 2015E
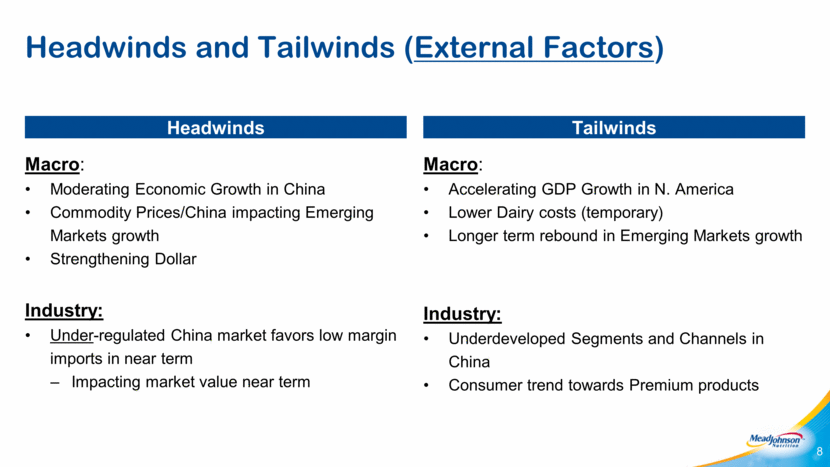
Headwinds Macro: Moderating Economic Growth in China Commodity Prices/China impacting Emerging Markets growth Strengthening Dollar Industry: Under-regulated China market favors low margin imports in near term Impacting market value near term Tailwinds Macro: Accelerating GDP Growth in N. America Lower Dairy costs (temporary) Longer term rebound in Emerging Markets growth Industry: Underdeveloped Segments and Channels in China Consumer trend towards Premium products Headwinds and Tailwinds (External Factors) 8
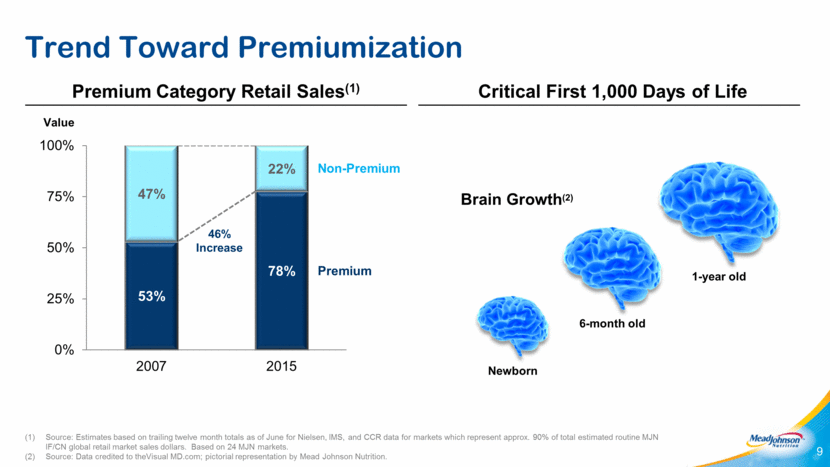
Trend Toward Premiumization 9 Source: Estimates based on trailing twelve month totals as of June for Nielsen, IMS, and CCR data for markets which represent approx. 90% of total estimated routine MJN IF/CN global retail market sales dollars. Based on 24 MJN markets. Source: Data credited to theVisual MD.com; pictorial representation by Mead Johnson Nutrition. Premium Category Retail Sales(1) Critical First 1,000 Days of Life Premium Non-Premium 46% Increase Value Brain Growth(2) Newborn 6-month old 1-year old 53% 78% 47% 22% 0% 25% 50% 75% 100% 2007 2015
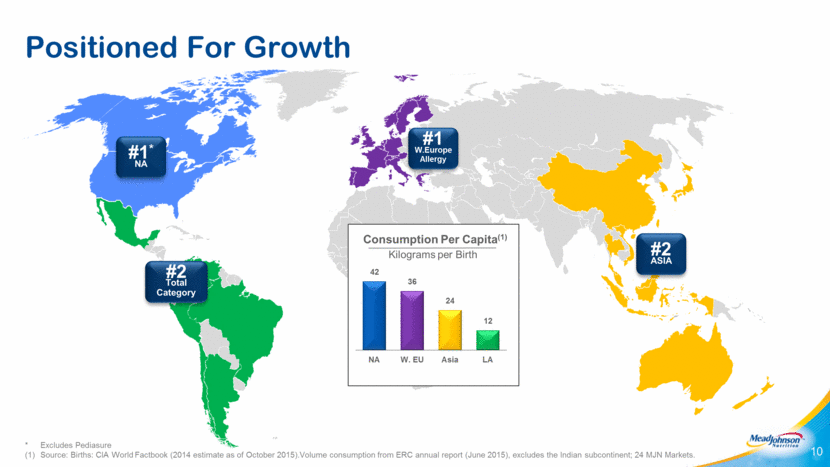
Positioned For Growth 10 * Excludes Pediasure (1) Source: Births: CIA World Factbook (2014 estimate as of October 2015).Volume consumption from ERC annual report (June 2015), excludes the Indian subcontinent; 24 MJN Markets. #1* NA #2 ASIA #1 W.Europe Allergy #2 Total Category Kilograms per Birth Consumption Per Capita(1)
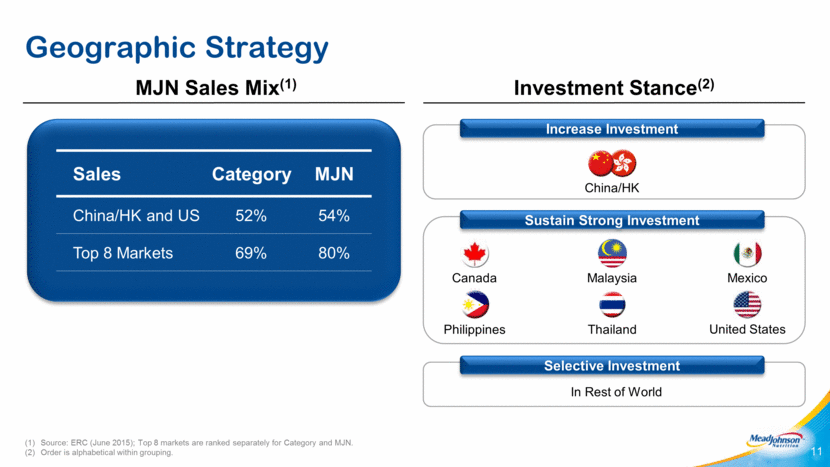
Geographic Strategy 11 MJN Sales Mix(1) Source: ERC (June 2015); Top 8 markets are ranked separately for Category and MJN. (2) Order is alphabetical within grouping. Investment Stance(2) Increase Investment Mexico Canada Malaysia Philippines Thailand United States China/HK Selective Investment In Rest of World Sustain Strong Investment Sales Category MJN China/HK and US 52% 54% Top 8 Markets 69% 80%
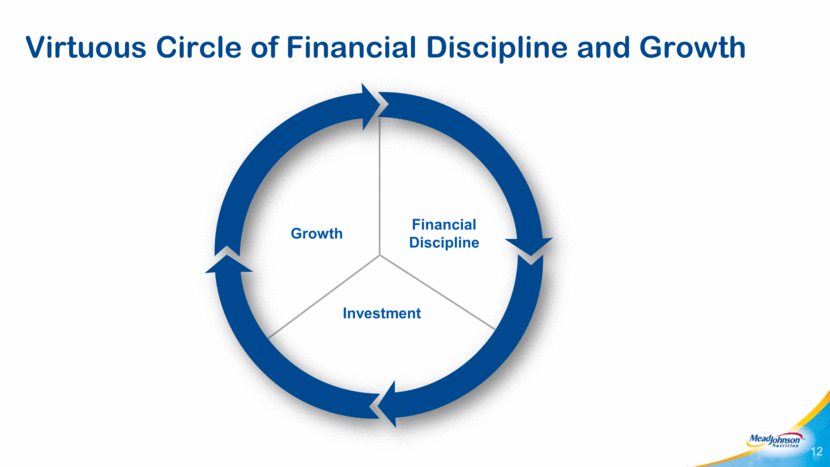
12 Virtuous Circle of Financial Discipline and Growth Financial Discipline Investment Growth
Continue Investment in Science and Innovation Create Compelling, Value Added Propositions for Consumers Build Toddler Category in North America Lead Digital Conversion and Create New Platforms Create Superior Brand(s) Growth Strategies supported by Productivity and Balance Sheet Initiatives Core Growth Strategies 13 Integrated Approach to Long Term Shareholder Value Creation
Strategy remains compelling Commitment to value creation in challenging environment Continued investment in our future Disciplined approach to cost management Creating an even stronger, faster and more agile company Commitment to Shareholder Value Creation Key Messages 14
[LOGO]

Exhibit 99.3
Michel Cup Executive Vice President and Chief Financial Officer Investor Day 2015

Safe Harbor Statement 2 Forward-Looking Statements Certain statements in this presentation are forward-looking as defined in the Private Securities Litigation Reform Act of 1995. These forward-looking statements may be identified by the fact they use words such as “should,” “expect,” “anticipate,” “estimate,” “target,” “may,” “project,” “guidance,” “intend,” “plan,” “believe” and other words and terms of similar meaning and expression. Such statements are likely to relate to, among other things, a discussion of goals, plans and projections regarding financial position, results of operations, cash flows, market position, market growth and trends, product development, product approvals, sales efforts, expenses, capital expenditures, performance or results of current and anticipated products and the outcome of contingencies such as legal proceedings and financial results. Forward-looking statements can also be identified by the fact that they do not relate strictly to historical or current facts. Such forward-looking statements are based on current expectations that involve inherent risks, uncertainties and assumptions that may cause actual results to differ materially from expectations as of the date of this presentation. These risks include, but are not limited to: (1) the ability to sustain brand strength, particularly the Enfa family of brands; (2) the effect on the company's reputation of real or perceived quality issues; (3) the effect of regulatory restrictions related to the company’s products; (4) the adverse effect of commodity costs; (5) increased competition from branded, private label, store and economy-branded products; (6) the effect of an economic downturn on consumers' purchasing behavior and customers' ability to pay for product; (7) inventory reductions by customers; (8) the adverse effect of changes in foreign currency exchange rates; (9) the effect of changes in economic, political and social conditions in the markets where we operate; (10) changing consumer preferences; (11) the possibility of changes in the Women, Infant and Children (WIC) program, or participation in WIC; (12) legislative, regulatory or judicial action that may adversely affect the company's ability to advertise its products, maintain product margins, or negatively impact the company’s reputation or result in fines or penalties that decrease earnings; and (13) the ability to develop and market new, innovative products. For additional information regarding these and other factors, see the company’s filings with the United States Securities and Exchange Commission (the SEC), including its most recent Annual Report on Form 10-K, which filings are available upon request from the SEC or at www.meadjohnson.com. The company cautions readers not to place undue reliance on any forward-looking statements, which speak only as of the date made. The company undertakes no obligation to publicly update any forward-looking statement, whether as a result of new information, future events or otherwise. Factors Affecting Comparability – Non-GAAP Financial Measures This presentation contains non-GAAP financial measures, including non-GAAP net sales, EBIT, earnings, earnings per share information, and effective tax rates. Specified Items are terms included in GAAP measures, but excluded for the purpose of determining non-GAAP net sales, EBIT, earnings and earnings per share. In addition, other items include the tax impact on Specified Items. Non-GAAP net sales, EBIT, earnings and earnings per share information adjusted for these items is an indication of the company’s underlying operating results and intended to enhance an investor’s overall understanding of the company’s financial performance. In addition, this information is among the primary indicators the company uses as a basis for evaluating company performance, setting incentive compensation targets and planning and forecasting of future periods. This information is not intended to be considered in isolation or as a substitute for financial measures prepared in accordance with GAAP. Tables that reconcile non-GAAP to GAAP disclosure are included in the Appendix. For more information: Kathy MacDonald, Vice President – Investor Relations Mead Johnson Nutrition Company 847-832-2182 [email protected] October 2015 MJN Confidential and Proprietary Information
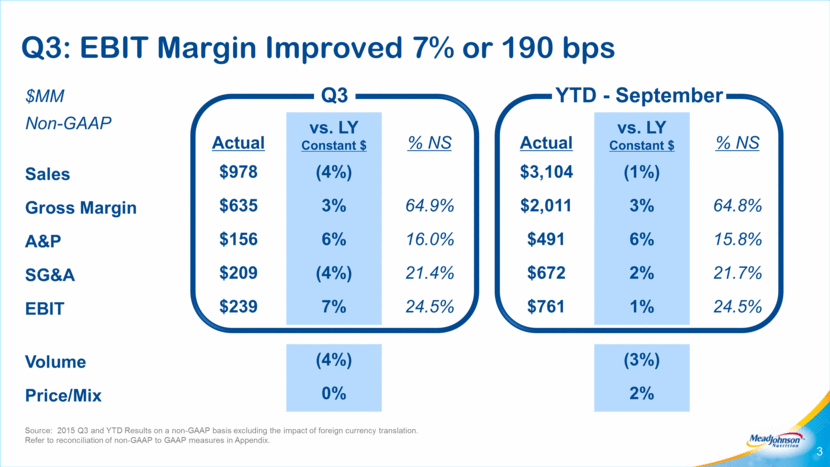
Source: 2015 Q3 and YTD Results on a non-GAAP basis excluding the impact of foreign currency translation. Refer to reconciliation of non-GAAP to GAAP measures in Appendix. Q3: EBIT Margin Improved 7% or 190 bps 3 $MM Non-GAAP Actual vs. LY Constant $ % NS Actual vs. LY Constant $ % NS Sales $978 (4%) $3,104 (1%) Gross Margin $635 3% 64.9% $2,011 3% 64.8% A&P $156 6% 16.0% $491 6% 15.8% SG&A $209 (4%) 21.4% $672 2% 21.7% EBIT $239 7% 24.5% $761 1% 24.5% Volume (4%) (3%) Price/Mix 0% 2% Q3 YTD - September
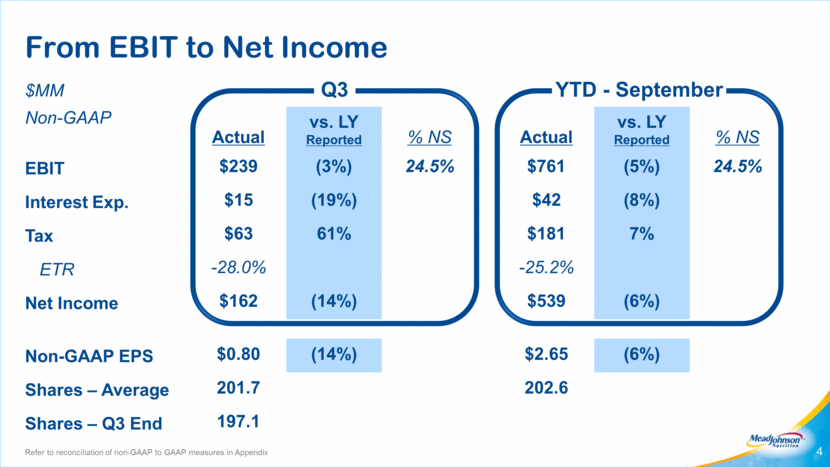
From EBIT to Net Income 4 $MM Non-GAAP Actual vs. LY Reported % NS Actual vs. LY Reported % NS EBIT $239 (3%) 24.5% $761 (5%) 24.5% Interest Exp. $15 (19%) $42 (8%) Tax $63 61% $181 7% ETR -28.0% -25.2% Net Income $162 (14%) $539 (6%) Non-GAAP EPS $0.80 (14%) $2.65 (6%) Shares – Average 201.7 202.6 Shares – Q3 End 197.1 Q3 YTD - September Refer to reconciliation of non-GAAP to GAAP measures in Appendix
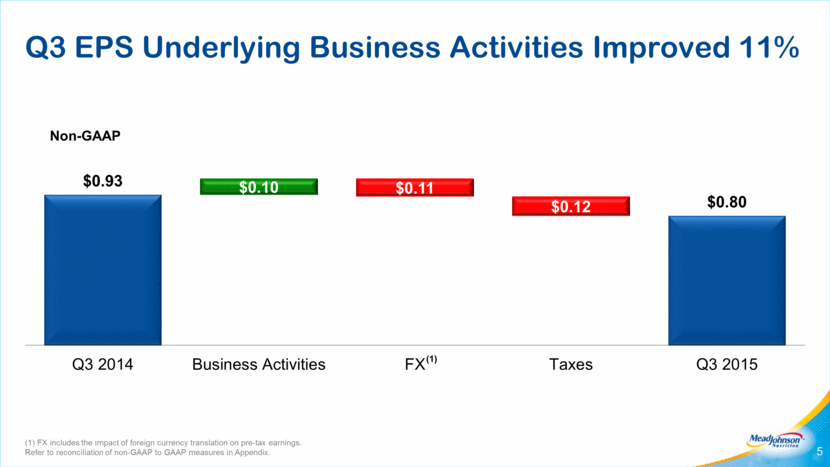
(1) FX includes the impact of foreign currency translation on pre-tax earnings. Refer to reconciliation of non-GAAP to GAAP measures in Appendix. Q3 EPS Underlying Business Activities Improved 11% 5 Non-GAAP (1) $0.93 $0.80 $0.10 $0.11 $0.12 Q3 2014 Business Activities FX Taxes Q3 2015
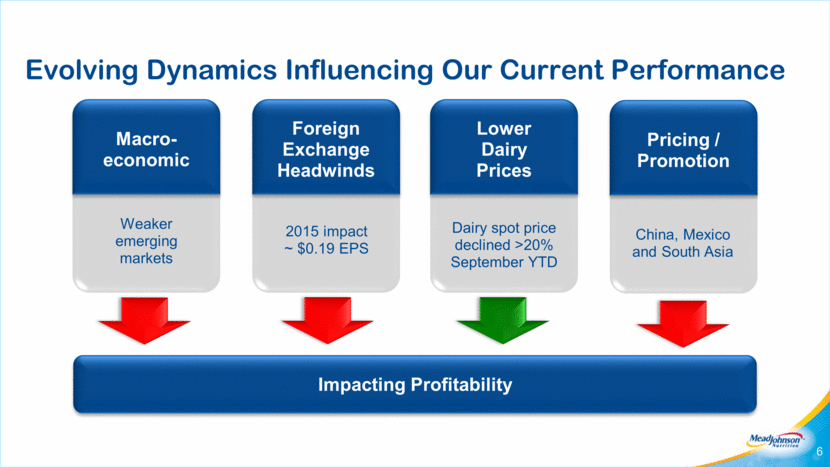
Evolving Dynamics Influencing Our Current Performance 6 Impacting Profitability Dairy spot price declined >20% September YTD Lower Dairy Prices Pricing / Promotion Foreign Exchange Headwinds China, Mexico and South Asia 2015 impact ~ $0.19 EPS Weaker emerging markets Macro-economic
Refer to reconciliation of non-GAAP to GAAP measures in Appendix Foreign Exchange Headwinds 7 $ in Millions 2013 2014 2015E Sales ($41) ($177) ($230) EBIT ($36) ($73) ($50) EPS ($0.13) ($0.27) ($0.19) $ Favorable Unfavorable FX Impact on EPS Asia Other LatAm Ven/Arg Europe North America/Other
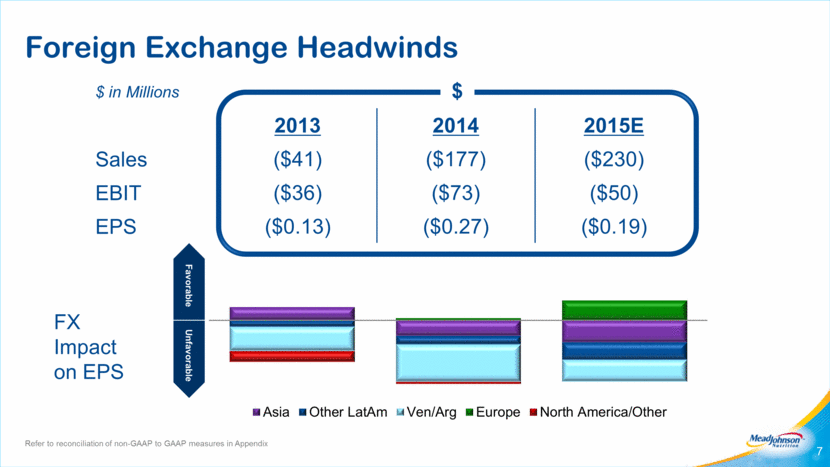
*Source: Weighted average dairy prices, USDA dairy indices Lower Dairy Prices Improve COGS by ~8% in 2015 8 Lower dairy cost benefit expected in 1H 2016, to be reinvested in selective markets Dairy Price Trend* Dairy % Impact on Total COGS $Cost / KG 3% 0% 7% - 8% 2012 2013 2014 2015E 2011 2012 2013 2014 2015
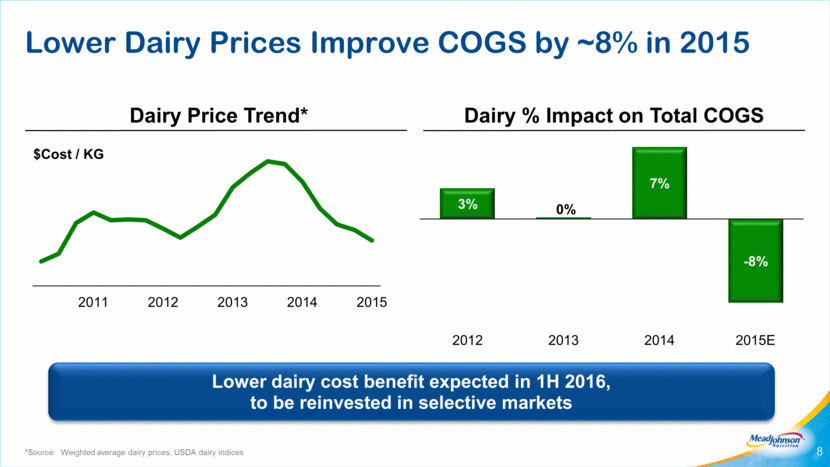
9 Virtuous Circle of Financial Discipline and Growth Gross Margin SG&A EBIT Margin A&P Net Sales Productivity Effectiveness Fuel for Growth
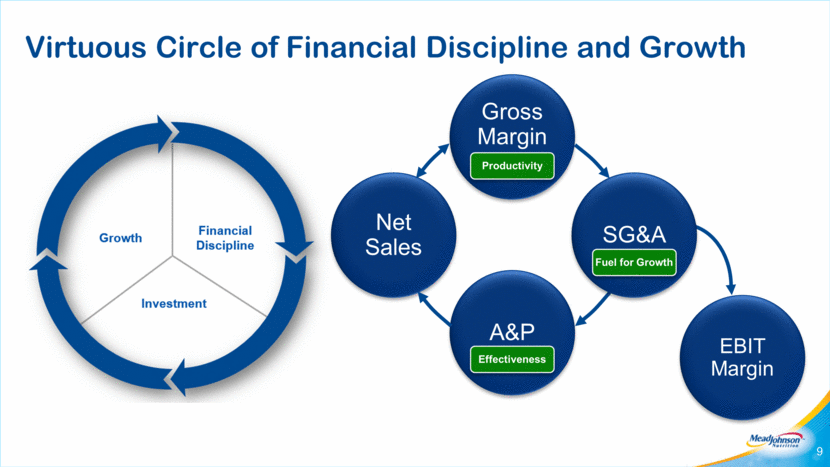
Consistent Productivity Initiatives Exceeding 4% of COGS 10 Productivity needed to mitigate cost inflation Raw Materials and Packaging Fixed Costs 4.6% 4.8% 4.2% 3.5% Productivity as % of COGS ~4-5% ~4.5%
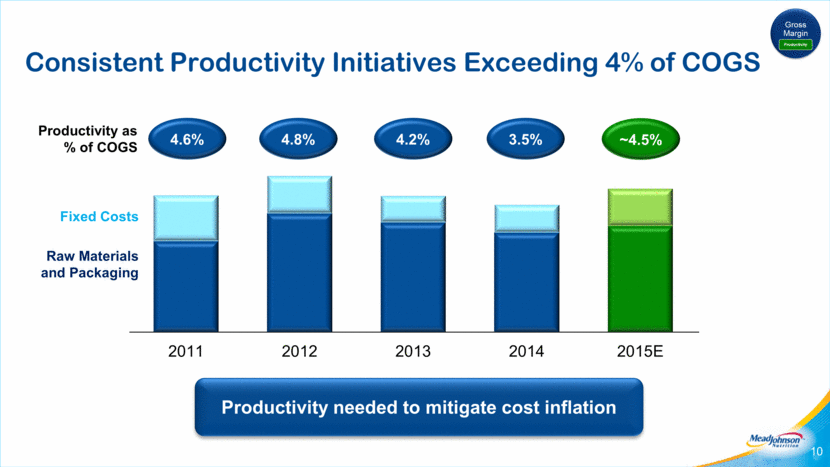
Productivity Initiatives in Place for 2016 11 Optimizing organization Creating flexible manufacturing Fixed Costs Dairy Other Materials Enhancing procurement capabilities Diversifying of supplier base Insourcing of certain dairy processes Packaging and formulation innovations Yield improvement Contract negotiations
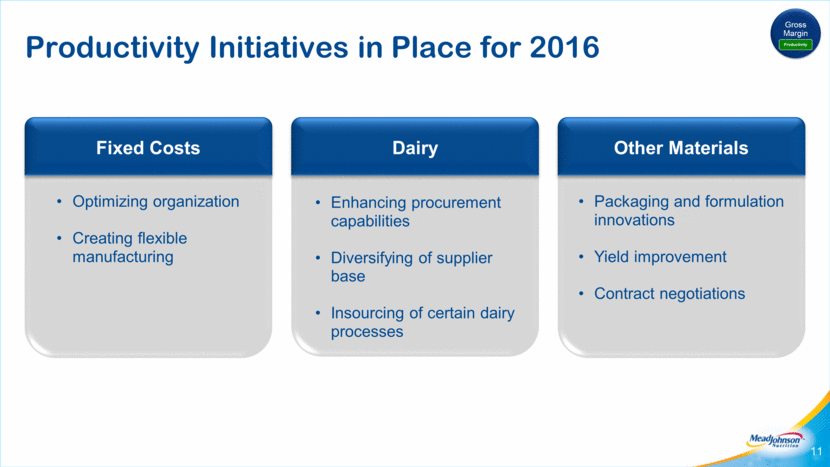
Focus on Optimizing Marketing Organization and Support Functions Fuel for Growth to Deliver $120 Million by 2018 12 Sales Force & Distribution Support Functions & Marketing Organization R & D Constrain growth below rate of sales Fuel for Growth Marketing Org. Other Support Functions Finance and IM ~ $ 1.0B R & D In Scope 2015E
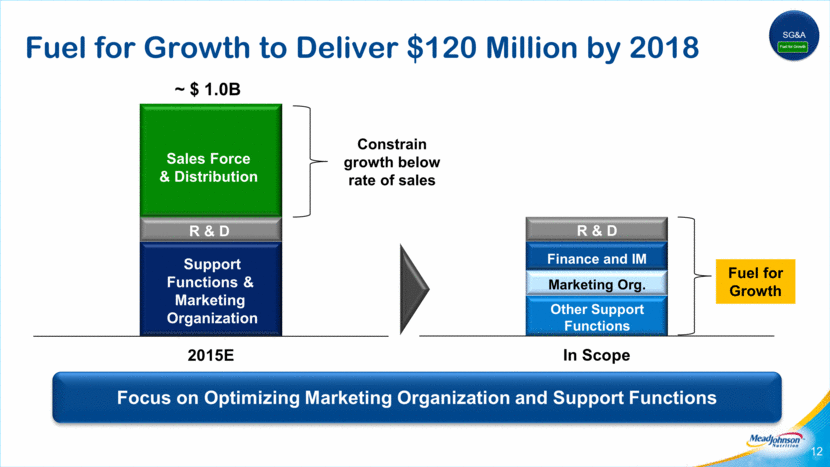
Key Initiatives Identified to Deliver Savings 13 Other Support Functions Finance and IM Marketing Organization 3.0% 4.5% 2.5% 2.5% 3.0% 2.0% 2015E 2018E Simplification and standardization Zero-based budgeting, focused on variable spending Optimize the organization Metrics shown above are percentage (%) of net sales
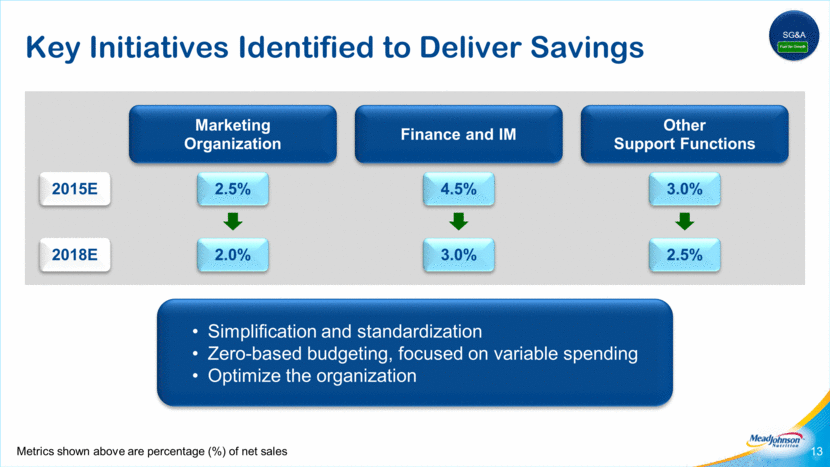
Expecting to Deliver Significant Portion of “Fuel for Growth” in 2016 14 An estimated $25 MM charge is expected in Q4 2015, with additional charges expected in Q1 2016 2016 ~ $60 MM 2017 ~ $30 MM 2018 ~ $30 MM
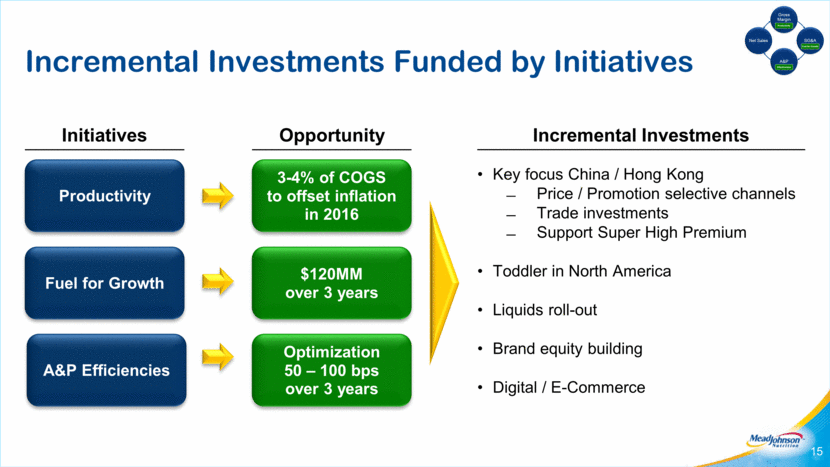
Incremental Investments Funded by Initiatives 15 Incremental Investments Initiatives Productivity Fuel for Growth A&P Efficiencies Key focus China / Hong Kong Price / Promotion selective channels Trade investments Support Super High Premium Toddler in North America Liquids roll-out Brand equity building Digital / E-Commerce 3-4% of COGS to offset inflation in 2016 $120MM over 3 years Optimization 50 – 100 bps over 3 years Opportunity
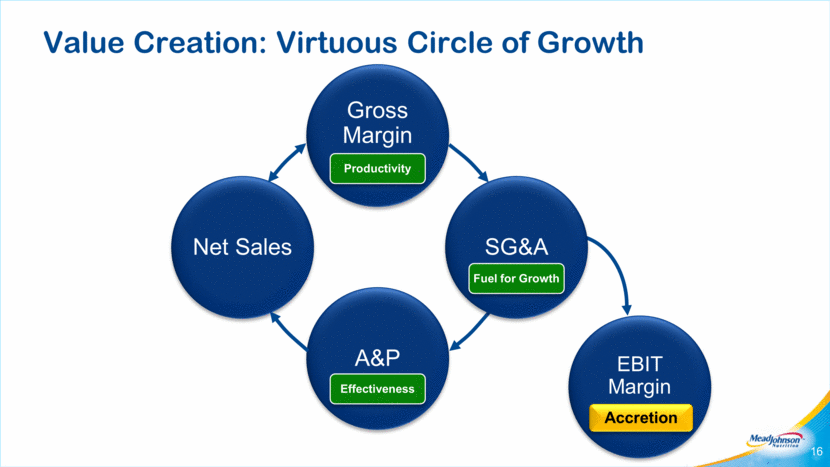
Value Creation: Virtuous Circle of Growth 16 Gross Margin SG&A EBIT Margin A&P Net Sales Productivity Effectiveness Fuel for Growth Accretion
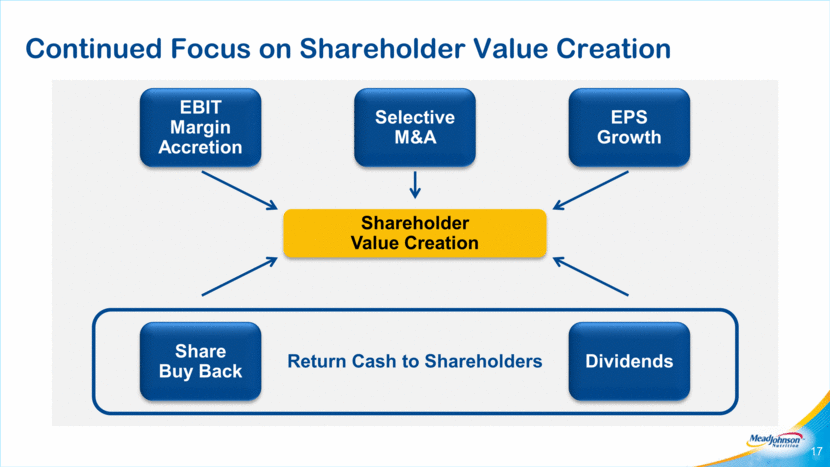
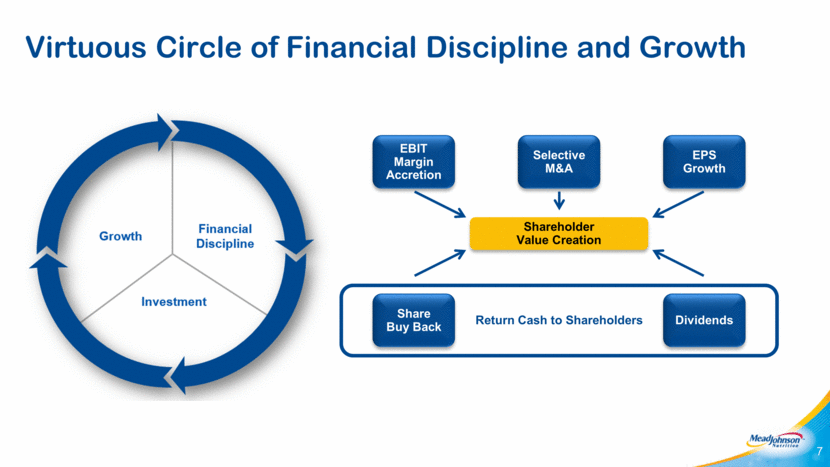
Shareholder Value Creation Return Cash to Shareholders Selective M&A EPS Growth Dividends Share Buy Back EBIT Margin Accretion Continued Focus on Shareholder Value Creation 17
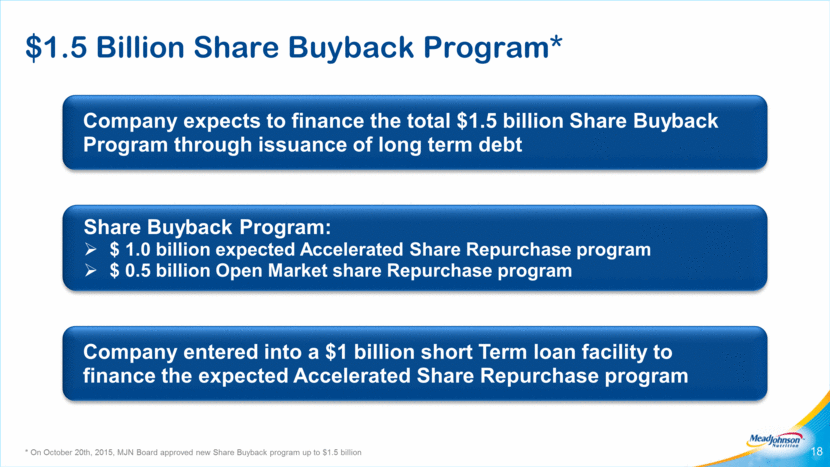
$1.5 Billion Share Buyback Program* 18 Company expects to finance the total $1.5 billion Share Buyback Program through issuance of long term debt Company entered into a $1 billion short Term loan facility to finance the expected Accelerated Share Repurchase program Share Buyback Program: $ 1.0 billion expected Accelerated Share Repurchase program $ 0.5 billion Open Market share Repurchase program * On October 20th, 2015, MJN Board approved new Share Buyback program up to $1.5 billion
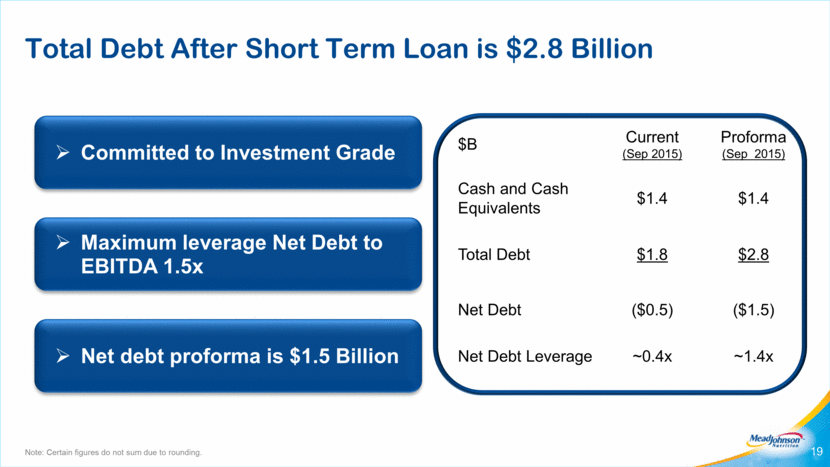
Total Debt After Short Term Loan is $2.8 Billion 19 Net debt proforma is $1.5 Billion Maximum leverage Net Debt to EBITDA 1.5x Committed to Investment Grade $B Current (Sep 2015) Proforma (Sep 2015) Cash and Cash Equivalents $1.4 $1.4 Total Debt $1.8 $2.8 Net Debt ($0.5) ($1.5) Net Debt Leverage ~0.4x ~1.4x Note: Certain figures do not sum due to rounding.
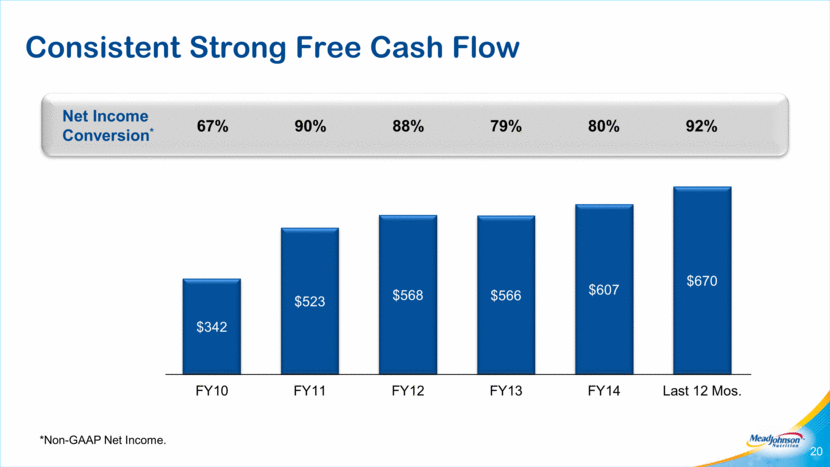
Consistent Strong Free Cash Flow 67% 79% 80% Net Income Conversion* 92% *Non-GAAP Net Income. 90% 88% 20 $481 $342 $523 $568 $566 $607 $670 FY09 FY10 FY11 FY12 FY13 FY14 Last 12 Mos.
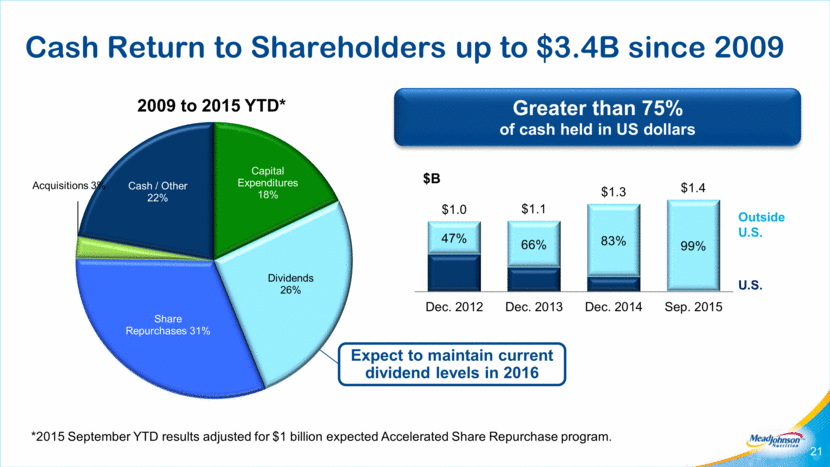
Expect to maintain current dividend levels in 2016 Cash Return to Shareholders up to $3.4B since 2009 21 Greater than 75% of cash held in US dollars U.S. Outside U.S. $B *2015 September YTD results adjusted for $1 billion expected Accelerated Share Repurchase program. Capital Expenditures 18% Dividends 26% Share Repurchases 31% Acquisitions 3% Cash / Other 22% 2009 to 2015 YTD*
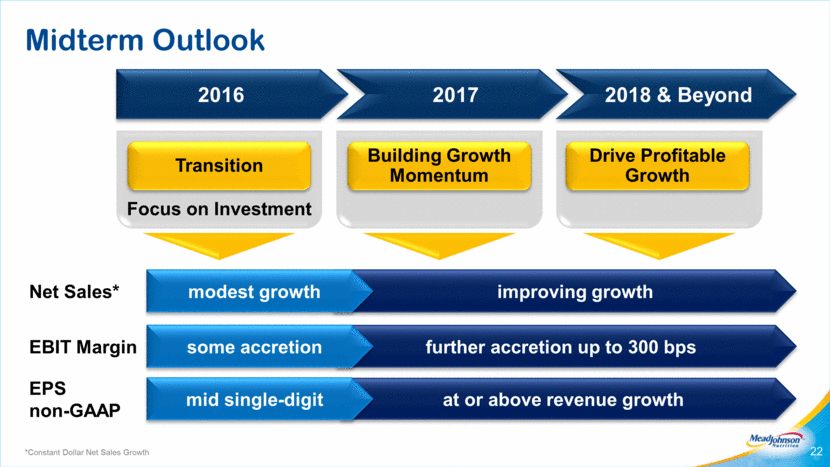
22 2017 2018 & Beyond 2016 Building Growth Momentum Drive Profitable Growth Net Sales* EBIT Margin EPS non-GAAP at or above revenue growth mid single-digit improving growth modest growth *Constant Dollar Net Sales Growth Transition Focus on Investment further accretion up to 300 bps some accretion Midterm Outlook
Appendix 23

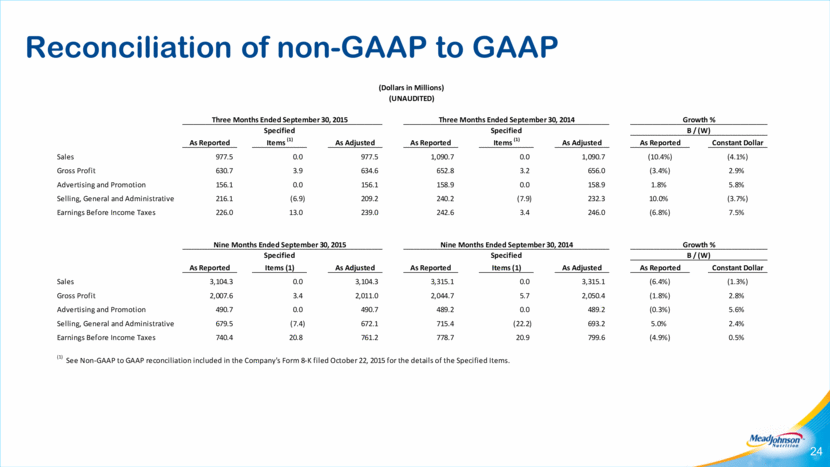
Reconciliation of non-GAAP to GAAP 24 (Dollars in Millions) (UNAUDITED) Three Months Ended September 30, 2015 Three Months Ended September 30, 2014 Growth % Specified Specified B / (W) As Reported Items (1) As Adjusted As Reported Items (1) As Adjusted As Reported Constant Dollar Sales 977.5 0.0 977.5 1,090.7 0.0 1,090.7 (10.4%) (4.1%) Gross Profit 630.7 3.9 634.6 652.8 3.2 656.0 (3.4%) 2.9% Advertising and Promotion 156.1 0.0 156.1 158.9 0.0 158.9 1.8% 5.8% Selling, General and Administrative 216.1 (6.9) 209.2 240.2 (7.9) 232.3 10.0% (3.7%) Earnings Before Income Taxes 226.0 13.0 239.0 242.6 3.4 246.0 (6.8%) 7.5% Nine Months Ended September 30, 2015 Nine Months Ended September 30, 2014 Growth % Specified Specified B / (W) As Reported Items (1) As Adjusted As Reported Items (1) As Adjusted As Reported Constant Dollar Sales 3,104.3 0.0 3,104.3 3,315.1 0.0 3,315.1 (6.4%) (1.3%) Gross Profit 2,007.6 3.4 2,011.0 2,044.7 5.7 2,050.4 (1.8%) 2.8% Advertising and Promotion 490.7 0.0 490.7 489.2 0.0 489.2 (0.3%) 5.6% Selling, General and Administrative 679.5 (7.4) 672.1 715.4 (22.2) 693.2 5.0% 2.4% Earnings Before Income Taxes 740.4 20.8 761.2 778.7 20.9 799.6 (4.9%) 0.5% (1) See Non-GAAP to GAAP reconciliation included in the Company's Form 8-K filed October 22, 2015 for the details of the Specified Items.
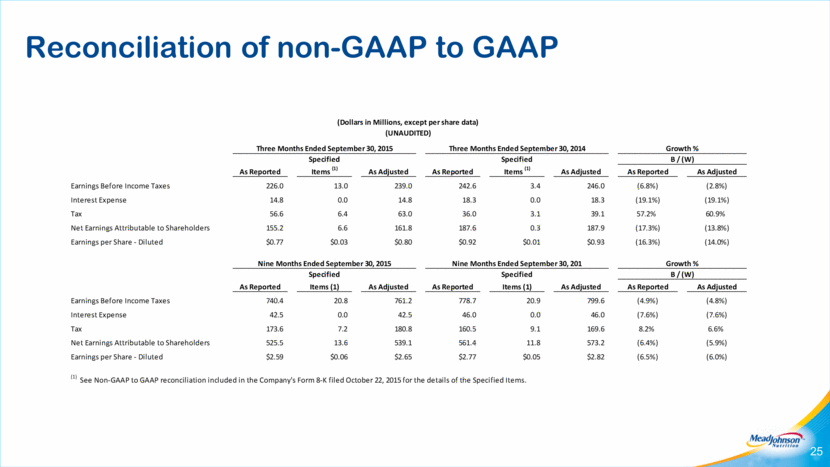
Reconciliation of non-GAAP to GAAP 25 (Dollars in Millions, except per share data) (UNAUDITED) Three Months Ended September 30, 2015 Three Months Ended September 30, 2014 Growth % Specified Specified B / (W) As Reported Items (1) As Adjusted As Reported Items (1) As Adjusted As Reported As Adjusted Earnings Before Income Taxes 226.0 13.0 239.0 242.6 3.4 246.0 (6.8%) (2.8%) Interest Expense 14.8 0.0 14.8 18.3 0.0 18.3 (19.1%) (19.1%) Tax 56.6 6.4 63.0 36.0 3.1 39.1 57.2% 60.9% Net Earnings Attributable to Shareholders 155.2 6.6 161.8 187.6 0.3 187.9 (17.3%) (13.8%) Earnings per Share - Diluted $0.77 $0.03 $0.80 $0.92 $0.01 $0.93 (16.3%) (14.0%) Nine Months Ended September 30, 2015 Nine Months Ended September 30, 201 Growth % Specified Specified B / (W) As Reported Items (1) As Adjusted As Reported Items (1) As Adjusted As Reported As Adjusted Earnings Before Income Taxes 740.4 20.8 761.2 778.7 20.9 799.6 (4.9%) (4.8%) Interest Expense 42.5 0.0 42.5 46.0 0.0 46.0 (7.6%) (7.6%) Tax 173.6 7.2 180.8 160.5 9.1 169.6 8.2% 6.6% Net Earnings Attributable to Shareholders 525.5 13.6 539.1 561.4 11.8 573.2 (6.4%) (5.9%) Earnings per Share - Diluted $2.59 $0.06 $2.65 $2.77 $0.05 $2.82 (6.5%) (6.0%) (1) See Non-GAAP to GAAP reconciliation included in the Company's Form 8-K filed October 22, 2015 for the details of the Specified Items.
[LOGO]

Exhibit 99.4
Greg Shewchuk Vice President, Head of Global Marketing Investor Day 2015

Safe Harbor Statement 2 Forward-Looking Statements Certain statements in this presentation are forward-looking as defined in the Private Securities Litigation Reform Act of 1995. These forward-looking statements may be identified by the fact they use words such as “should,” “expect,” “anticipate,” “estimate,” “target,” “may,” “project,” “guidance,” “intend,” “plan,” “believe” and other words and terms of similar meaning and expression. Such statements are likely to relate to, among other things, a discussion of goals, plans and projections regarding financial position, results of operations, cash flows, market position, market growth and trends, product development, product approvals, sales efforts, expenses, capital expenditures, performance or results of current and anticipated products and the outcome of contingencies such as legal proceedings and financial results. Forward-looking statements can also be identified by the fact that they do not relate strictly to historical or current facts. Such forward-looking statements are based on current expectations that involve inherent risks, uncertainties and assumptions that may cause actual results to differ materially from expectations as of the date of this presentation. These risks include, but are not limited to: (1) the ability to sustain brand strength, particularly the Enfa family of brands; (2) the effect on the company's reputation of real or perceived quality issues; (3) the effect of regulatory restrictions related to the company’s products; (4) the adverse effect of commodity costs; (5) increased competition from branded, private label, store and economy-branded products; (6) the effect of an economic downturn on consumers' purchasing behavior and customers' ability to pay for product; (7) inventory reductions by customers; (8) the adverse effect of changes in foreign currency exchange rates; (9) the effect of changes in economic, political and social conditions in the markets where we operate; (10) changing consumer preferences; (11) the possibility of changes in the Women, Infant and Children (WIC) program, or participation in WIC; (12) legislative, regulatory or judicial action that may adversely affect the company's ability to advertise its products, maintain product margins, or negatively impact the company’s reputation or result in fines or penalties that decrease earnings; and (13) the ability to develop and market new, innovative products. For additional information regarding these and other factors, see the company’s filings with the United States Securities and Exchange Commission (the SEC), including its most recent Annual Report on Form 10-K, which filings are available upon request from the SEC or at www.meadjohnson.com. The company cautions readers not to place undue reliance on any forward-looking statements, which speak only as of the date made. The company undertakes no obligation to publicly update any forward-looking statement, whether as a result of new information, future events or otherwise. Factors Affecting Comparability – Non-GAAP Financial Measures This presentation contains non-GAAP financial measures, including non-GAAP net sales, EBIT, earnings, earnings per share information, and effective tax rates. Specified Items are terms included in GAAP measures, but excluded for the purpose of determining non-GAAP net sales, EBIT, earnings and earnings per share. In addition, other items include the tax impact on Specified Items. Non-GAAP net sales, EBIT, earnings and earnings per share information adjusted for these items is an indication of the company’s underlying operating results and intended to enhance an investor’s overall understanding of the company’s financial performance. In addition, this information is among the primary indicators the company uses as a basis for evaluating company performance, setting incentive compensation targets and planning and forecasting of future periods. This information is not intended to be considered in isolation or as a substitute for financial measures prepared in accordance with GAAP. Tables that reconcile non-GAAP to GAAP disclosure are included in the Appendix. For more information: Kathy MacDonald, Vice President – Investor Relations Mead Johnson Nutrition Company 847-832-2182 [email protected] October 2015 MJN Confidential and Proprietary Information
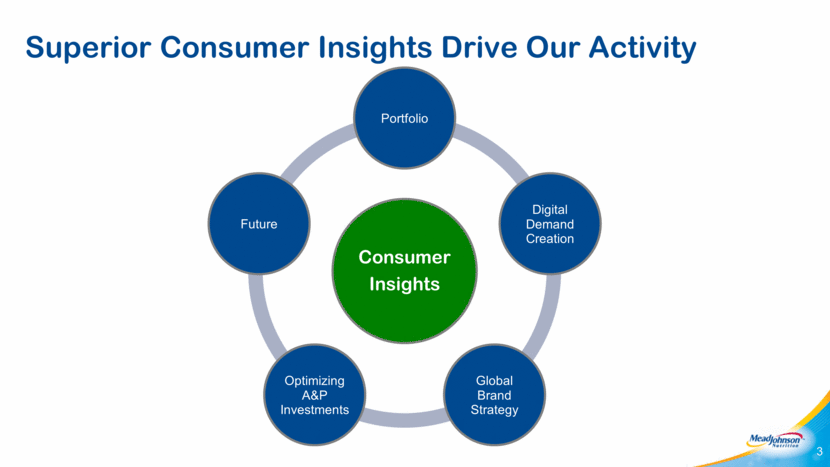
Superior Consumer Insights Drive Our Activity 3 Consumer Insights Portfolio Digital Demand Creation Global Brand Strategy Optimizing A&P Investments Future
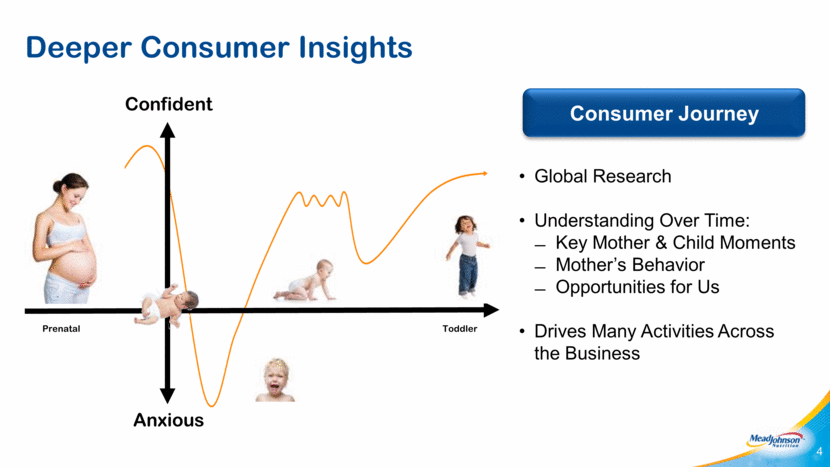
Deeper Consumer Insights 4 Confident Anxious Prenatal Consumer Journey Global Research Understanding Over Time: Key Mother & Child Moments Mother’s Behavior Opportunities for Us Drives Many Activities Across the Business Toddler
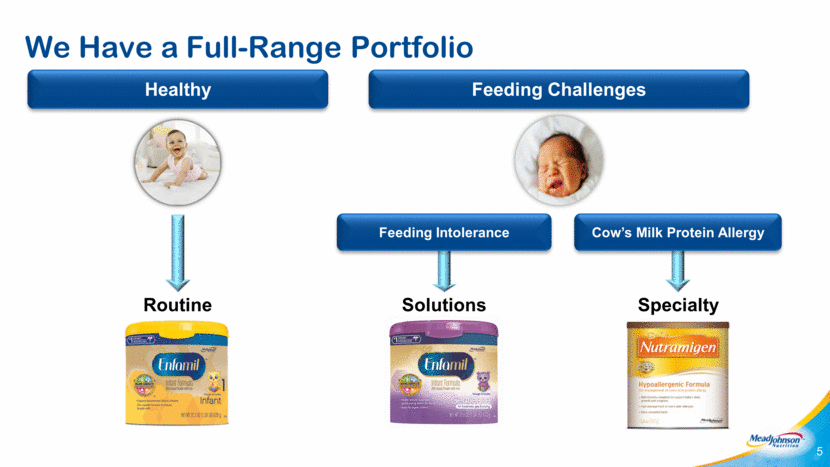
We Have a Full-Range Portfolio 5 Healthy Feeding Challenges Routine Feeding Intolerance Cow’s Milk Protein Allergy Solutions Specialty
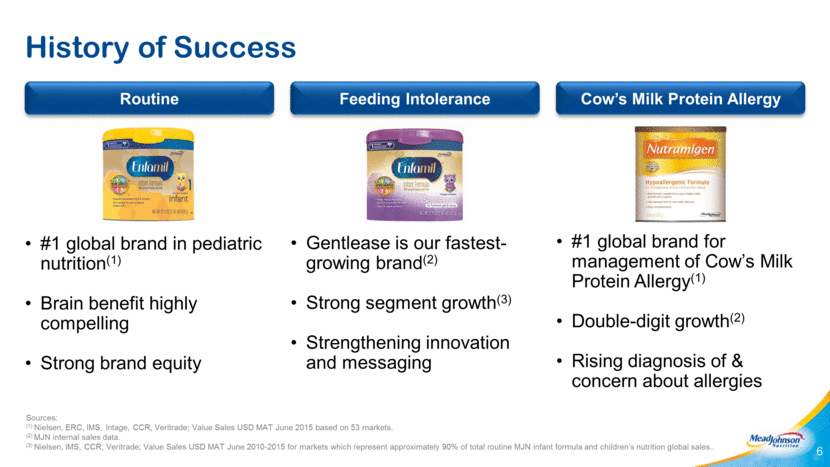
History of Success 6 Routine #1 global brand in pediatric nutrition(1) Brain benefit highly compelling Strong brand equity Feeding Intolerance Cow’s Milk Protein Allergy #1 global brand for management of Cow’s Milk Protein Allergy(1) Double-digit growth(2) Rising diagnosis of & concern about allergies Sources: (1) Nielsen, ERC, IMS, Intage, CCR, Veritrade; Value Sales USD MAT June 2015 based on 53 markets. (2) MJN internal sales data. (3) Nielsen, IMS, CCR, Veritrade; Value Sales USD MAT June 2010-2015 for markets which represent approximately 90% of total routine MJN infant formula and children’s nutrition global sales.. Gentlease is our fastest-growing brand(2) Strong segment growth(3) Strengthening innovation and messaging
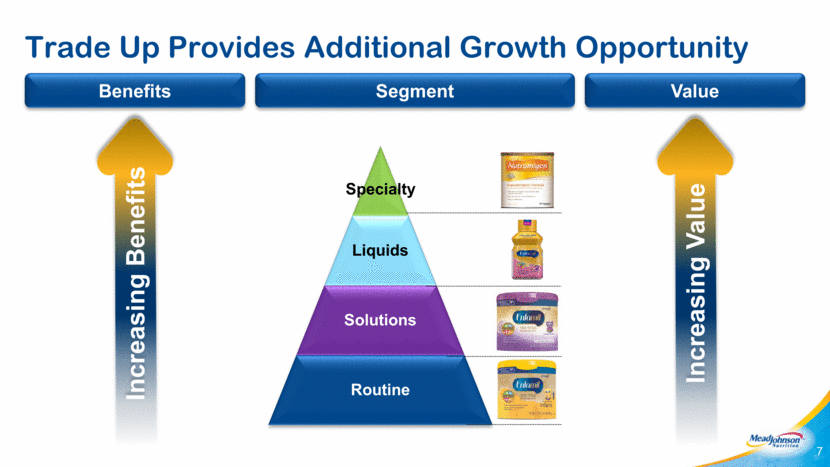
7 Trade Up Provides Additional Growth Opportunity Increasing Benefits Segment Benefits Value Increasing Value Specialty
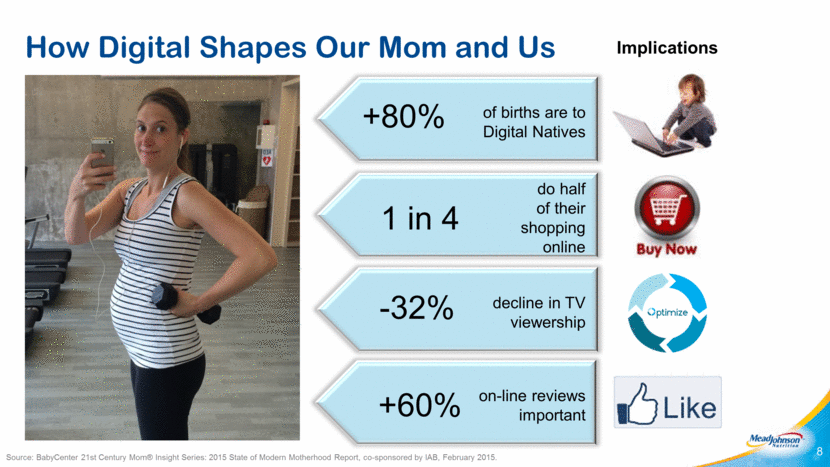
How Digital Shapes Our Mom and Us 8 Implications +80% of births are to Digital Natives 1 in 4 do half of their shopping online +60% on-line reviews important -32% decline in TV viewership Source: BabyCenter 21st Century Mom® Insight Series: 2015 State of Modern Motherhood Report, co-sponsored by IAB, February 2015.
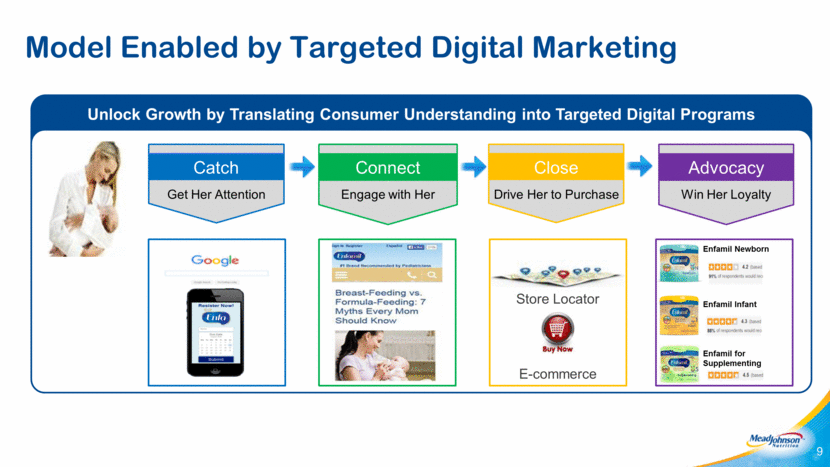
Model Enabled by Targeted Digital Marketing 9 Unlock Growth by Translating Consumer Understanding into Targeted Digital Programs E-commerce Store Locator Catch Get Her Attention Connect Engage with Her Close Drive Her to Purchase Advocacy Win Her Loyalty Enfamil Newborn Enfamil Infant Enfamil for Supplementing
10 United States China Latin America Southeast Asia Locally Executed Global Brand Strategy

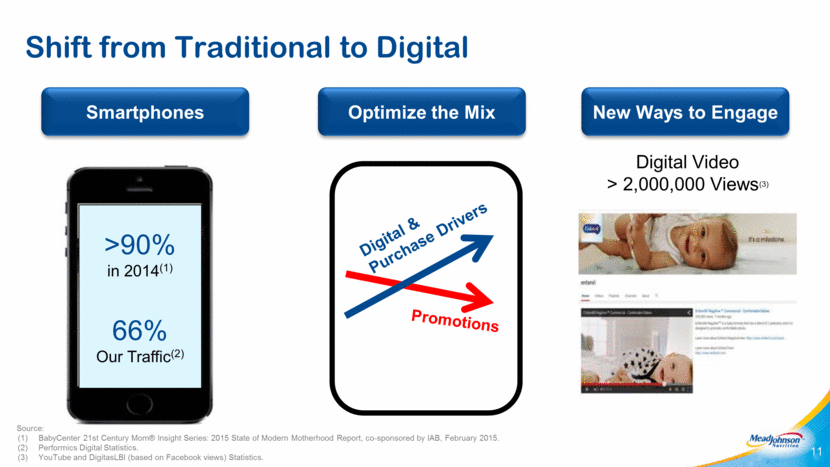
Shift from Traditional to Digital 11 >90% in 2014(1) 66% Our Traffic(2) Digital & Purchase Drivers Promotions Digital Video > 2,000,000 Views(3) Smartphones Optimize the Mix New Ways to Engage Source: BabyCenter 21st Century Mom® Insight Series: 2015 State of Modern Motherhood Report, co-sponsored by IAB, February 2015. Performics Digital Statistics. YouTube and DigitasLBI (based on Facebook views) Statistics.
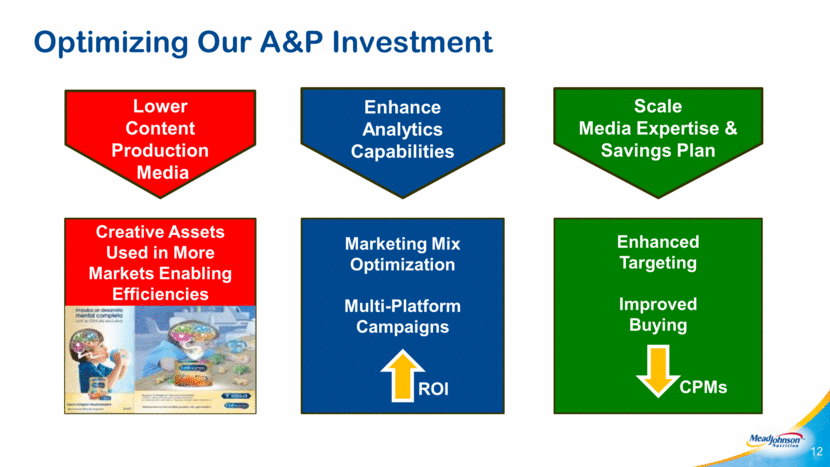
12 Optimizing Our A&P Investment Lower Content Production Media Creative Assets Used in More Markets Enabling Efficiencies Enhance Analytics Capabilities Marketing Mix Optimization Multi-Platform Campaigns ROI Scale Media Expertise & Savings Plan Enhanced Targeting Improved Buying CPMs
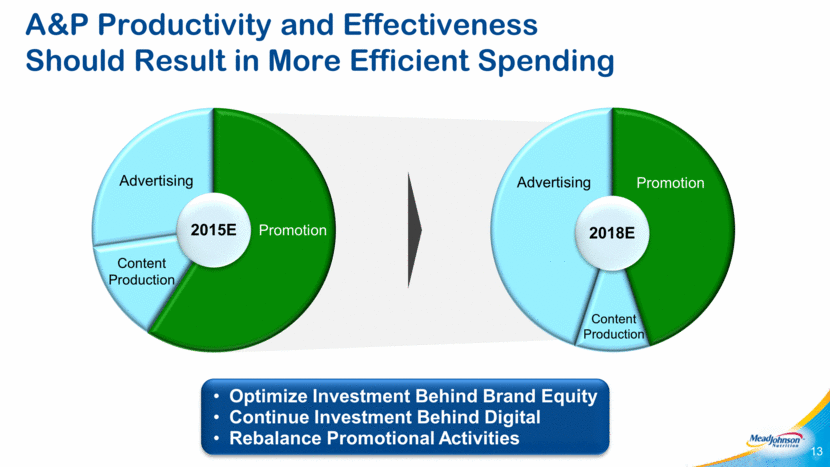
A&P Productivity and Effectiveness Should Result in More Efficient Spending 13 Optimize Investment Behind Brand Equity Continue Investment Behind Digital Rebalance Promotional Activities 2015E 2018E Advertising Content Production Promotion Advertising Content Production Promotion
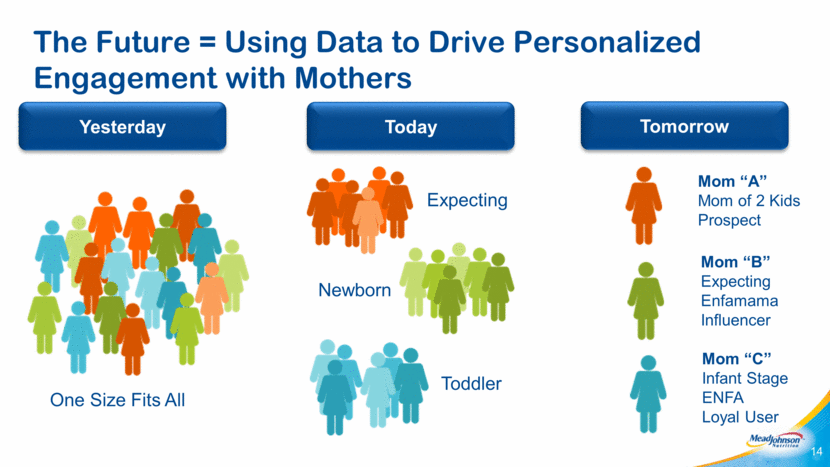
14 The Future = Using Data to Drive Personalized Engagement with Mothers One Size Fits All Mom “A” Mom of 2 Kids Prospect Mom “B” Expecting Enfamama Influencer Mom “C” Infant Stage ENFA Loyal User Yesterday Expecting Newborn Toddler Today Tomorrow
Key Messages 15 Deep Understanding of Our Consumers Powerful Brands and History of Success Global Demand Creation Model, Digitally Driven Optimized A&P Spend for Efficiency and Effectiveness Data-Driven Personalization Expected to be a Competitive Advantage
[LOGO]

Exhibit 99.5
1 Dirk Hondmann, PhD Chief Scientific Officer Investor Day 2015

Safe Harbor Statement 2 Forward-Looking Statements Certain statements in this presentation are forward-looking as defined in the Private Securities Litigation Reform Act of 1995. These forward-looking statements may be identified by the fact they use words such as “should,” “expect,” “anticipate,” “estimate,” “target,” “may,” “project,” “guidance,” “intend,” “plan,” “believe” and other words and terms of similar meaning and expression. Such statements are likely to relate to, among other things, a discussion of goals, plans and projections regarding financial position, results of operations, cash flows, market position, market growth and trends, product development, product approvals, sales efforts, expenses, capital expenditures, performance or results of current and anticipated products and the outcome of contingencies such as legal proceedings and financial results. Forward-looking statements can also be identified by the fact that they do not relate strictly to historical or current facts. Such forward-looking statements are based on current expectations that involve inherent risks, uncertainties and assumptions that may cause actual results to differ materially from expectations as of the date of this presentation. These risks include, but are not limited to: (1) the ability to sustain brand strength, particularly the Enfa family of brands; (2) the effect on the company's reputation of real or perceived quality issues; (3) the effect of regulatory restrictions related to the company’s products; (4) the adverse effect of commodity costs; (5) increased competition from branded, private label, store and economy-branded products; (6) the effect of an economic downturn on consumers' purchasing behavior and customers' ability to pay for product; (7) inventory reductions by customers; (8) the adverse effect of changes in foreign currency exchange rates; (9) the effect of changes in economic, political and social conditions in the markets where we operate; (10) changing consumer preferences; (11) the possibility of changes in the Women, Infant and Children (WIC) program, or participation in WIC; (12) legislative, regulatory or judicial action that may adversely affect the company's ability to advertise its products, maintain product margins, or negatively impact the company’s reputation or result in fines or penalties that decrease earnings; and (13) the ability to develop and market new, innovative products. For additional information regarding these and other factors, see the company’s filings with the United States Securities and Exchange Commission (the SEC), including its most recent Annual Report on Form 10-K, which filings are available upon request from the SEC or at www.meadjohnson.com. The company cautions readers not to place undue reliance on any forward-looking statements, which speak only as of the date made. The company undertakes no obligation to publicly update any forward-looking statement, whether as a result of new information, future events or otherwise. Factors Affecting Comparability – Non-GAAP Financial Measures This presentation contains non-GAAP financial measures, including non-GAAP net sales, EBIT, earnings, earnings per share information, and effective tax rates. Specified Items are terms included in GAAP measures, but excluded for the purpose of determining non-GAAP net sales, EBIT, earnings and earnings per share. In addition, other items include the tax impact on Specified Items. Non-GAAP net sales, EBIT, earnings and earnings per share information adjusted for these items is an indication of the company’s underlying operating results and intended to enhance an investor’s overall understanding of the company’s financial performance. In addition, this information is among the primary indicators the company uses as a basis for evaluating company performance, setting incentive compensation targets and planning and forecasting of future periods. This information is not intended to be considered in isolation or as a substitute for financial measures prepared in accordance with GAAP. Tables that reconcile non-GAAP to GAAP disclosure are included in the Appendix. For more information: Kathy MacDonald, Vice President – Investor Relations Mead Johnson Nutrition Company 847-832-2182 [email protected] October 2015 MJN Confidential and Proprietary Information
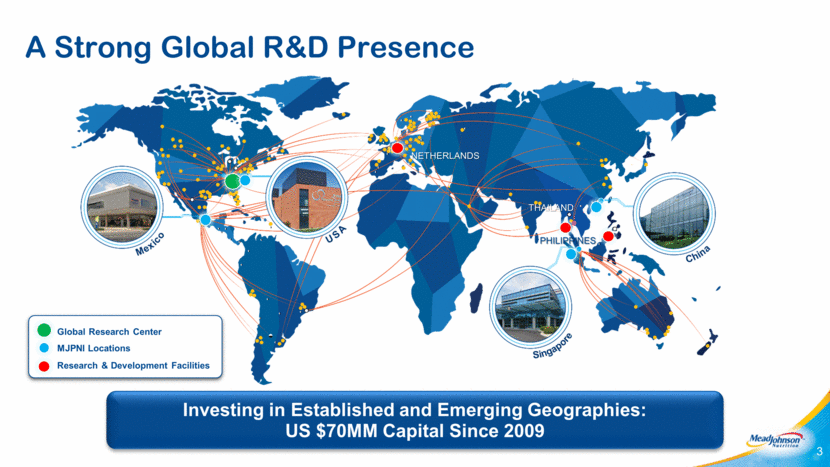
A Strong Global R&D Presence 3 Global Research Center MJPNI Locations Research & Development Facilities NETHERLANDS THAILAND PHILIPPINES Investing in Established and Emerging Geographies: US $70MM Capital Since 2009
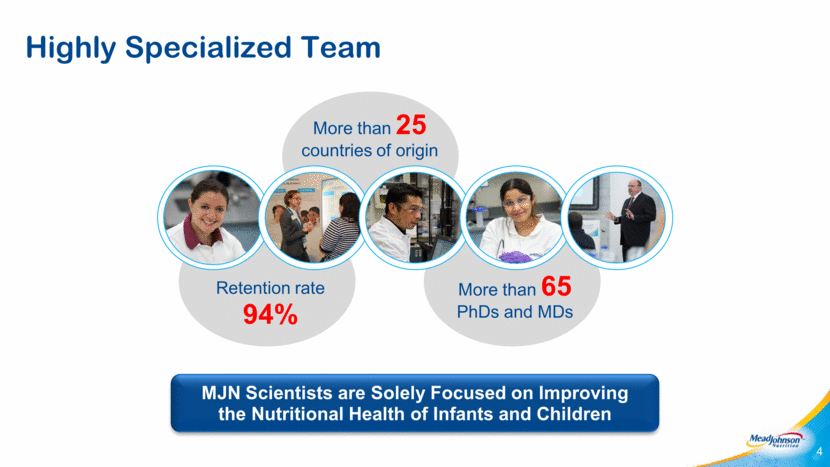
Highly Specialized Team 4 MJN Scientists are Solely Focused on Improving the Nutritional Health of Infants and Children More than 25 countries of origin Retention rate 94% More than 65 PhDs and MDs
Research Platforms Align to Consumer Insights A Long History of Leadership in Each of These Benefit Areas 5 BENEFITS AREAS OF EXPERTISE Pediatric Nutrition Neonatology Healthy Growth Sensory Science Product Development Taste and Form Immunology Food Technology Natural Defense Protein Biochemistry Pediatric Gastroenterology Allergy Management Cognitive Neuroscience Screening Platform Brain Development

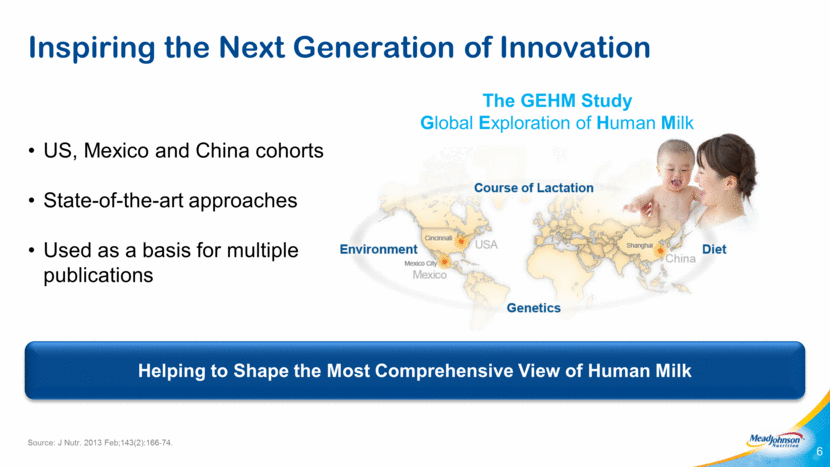
Inspiring the Next Generation of Innovation 6 Source: J Nutr. 2013 Feb;143(2):166-74. Helping to Shape the Most Comprehensive View of Human Milk The GEHM Study Global Exploration of Human Milk US, Mexico and China cohorts State-of-the-art approaches Used as a basis for multiple publications
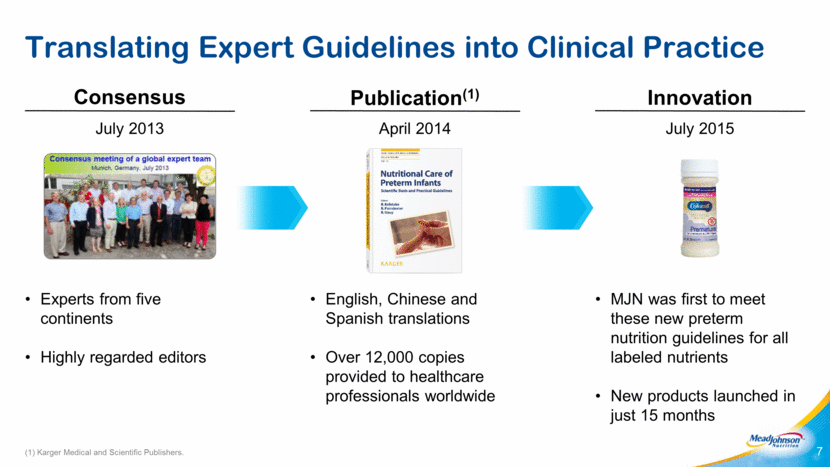
(1) Karger Medical and Scientific Publishers. Translating Expert Guidelines into Clinical Practice 7 Consensus Innovation Publication(1) MJN was first to meet these new preterm nutrition guidelines for all labeled nutrients New products launched in just 15 months English, Chinese and Spanish translations Over 12,000 copies provided to healthcare professionals worldwide Experts from five continents Highly regarded editors July 2013 July 2015 April 2014
Key Messages 8 Uniquely equipped to translate insights into nutrition solutions Strong collaborative network leads to strength in emerging research Able to adapt and be successful in a changing regulatory environment Leveraging consumer insights to amplify our science advancements Well positioned to bring leading innovations to market using a strong science foundation
9

Exhibit 99.6
Charles Urbain Executive Vice President and Chief Operating Officer Investor Day 2015

Safe Harbor Statement 2 Forward-Looking Statements Certain statements in this presentation are forward-looking as defined in the Private Securities Litigation Reform Act of 1995. These forward-looking statements may be identified by the fact they use words such as “should,” “expect,” “anticipate,” “estimate,” “target,” “may,” “project,” “guidance,” “intend,” “plan,” “believe” and other words and terms of similar meaning and expression. Such statements are likely to relate to, among other things, a discussion of goals, plans and projections regarding financial position, results of operations, cash flows, market position, market growth and trends, product development, product approvals, sales efforts, expenses, capital expenditures, performance or results of current and anticipated products and the outcome of contingencies such as legal proceedings and financial results. Forward-looking statements can also be identified by the fact that they do not relate strictly to historical or current facts. Such forward-looking statements are based on current expectations that involve inherent risks, uncertainties and assumptions that may cause actual results to differ materially from expectations as of the date of this presentation. These risks include, but are not limited to: (1) the ability to sustain brand strength, particularly the Enfa family of brands; (2) the effect on the company's reputation of real or perceived quality issues; (3) the effect of regulatory restrictions related to the company’s products; (4) the adverse effect of commodity costs; (5) increased competition from branded, private label, store and economy-branded products; (6) the effect of an economic downturn on consumers' purchasing behavior and customers' ability to pay for product; (7) inventory reductions by customers; (8) the adverse effect of changes in foreign currency exchange rates; (9) the effect of changes in economic, political and social conditions in the markets where we operate; (10) changing consumer preferences; (11) the possibility of changes in the Women, Infant and Children (WIC) program, or participation in WIC; (12) legislative, regulatory or judicial action that may adversely affect the company's ability to advertise its products, maintain product margins, or negatively impact the company’s reputation or result in fines or penalties that decrease earnings; and (13) the ability to develop and market new, innovative products. For additional information regarding these and other factors, see the company’s filings with the United States Securities and Exchange Commission (the SEC), including its most recent Annual Report on Form 10-K, which filings are available upon request from the SEC or at www.meadjohnson.com. The company cautions readers not to place undue reliance on any forward-looking statements, which speak only as of the date made. The company undertakes no obligation to publicly update any forward-looking statement, whether as a result of new information, future events or otherwise. Factors Affecting Comparability – Non-GAAP Financial Measures This presentation contains non-GAAP financial measures, including non-GAAP net sales, EBIT, earnings, earnings per share information, and effective tax rates. Specified Items are terms included in GAAP measures, but excluded for the purpose of determining non-GAAP net sales, EBIT, earnings and earnings per share. In addition, other items include the tax impact on Specified Items. Non-GAAP net sales, EBIT, earnings and earnings per share information adjusted for these items is an indication of the company’s underlying operating results and intended to enhance an investor’s overall understanding of the company’s financial performance. In addition, this information is among the primary indicators the company uses as a basis for evaluating company performance, setting incentive compensation targets and planning and forecasting of future periods. This information is not intended to be considered in isolation or as a substitute for financial measures prepared in accordance with GAAP. Tables that reconcile non-GAAP to GAAP disclosure are included in the Appendix. For more information: Kathy MacDonald, Vice President – Investor Relations Mead Johnson Nutrition Company 847-832-2182 [email protected] October 2015 MJN Confidential and Proprietary Information
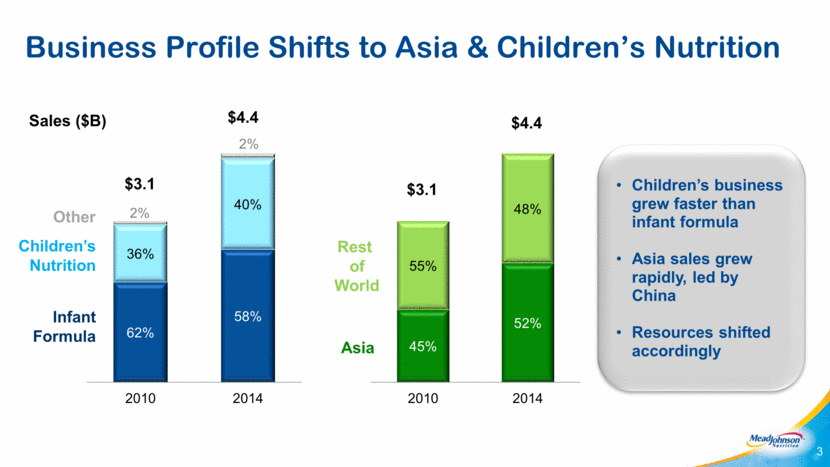
Business Profile Shifts to Asia & Children’s Nutrition Children’s Nutrition Infant Formula Sales ($B) Children’s business grew faster than infant formula Asia sales grew rapidly, led by China Resources shifted accordingly Rest of World Asia $3.1 $4.4 $3.1 $4.4 Other 3 45% 52% 55% 48% 2010 2014 62% 58% 36% 40% 2% 2% 2010 2014
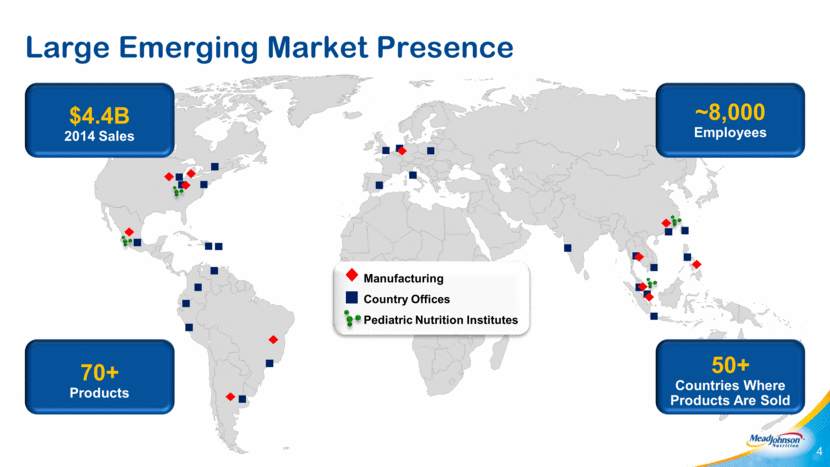
Large Emerging Market Presence Manufacturing Country Offices Pediatric Nutrition Institutes $4.4B 2014 Sales ~8,000 Employees 50+ Countries Where Products Are Sold 70+ Products 4
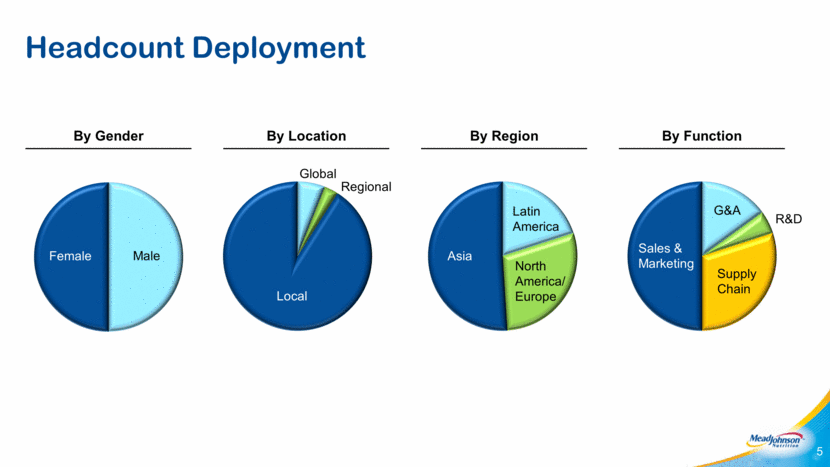
Headcount Deployment By Gender By Location By Region By Function Female Global Local Male Regional Asia Latin America North America/ Europe Sales & Marketing G&A R&D Supply Chain 5
Standalone Imperative Post-IPO Support Services from BMS Deployment Local Regional Global BMS MJN MJN At IPO(1) YTD 2015 24.2% (+260 bps) IT Corporate Finance Human Resources Shared Services Public Affairs Internal Audit IT Finance Human Resources Shared Services Public Affairs Internal Audit Sales Marketing R&D HR FP&A Supply Chain Sales Marketing R&D Human Resources FP&A Supply Chain Cost % of Sales (1) Source: Cost as percentage of sales, 2008 pro forma. 6 3.2% 18.4% = 21.6% +

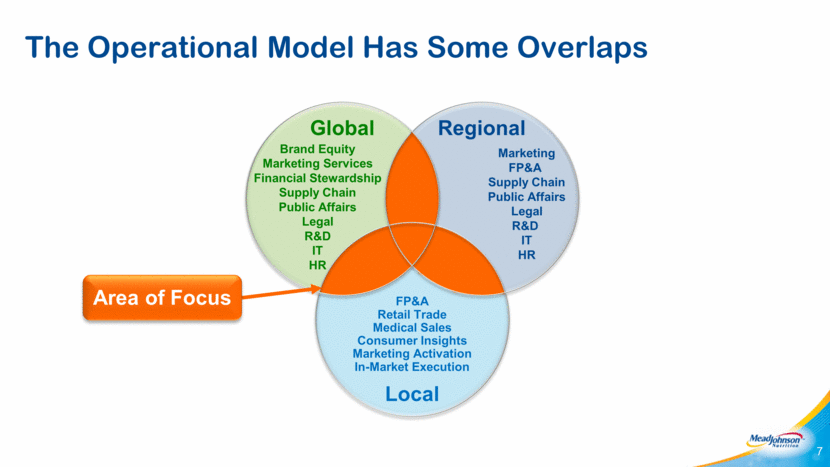
The Operational Model Has Some Overlaps Global Regional Local Brand Equity Marketing Services Financial Stewardship Supply Chain Public Affairs Legal R&D IT HR FP&A Retail Trade Medical Sales Consumer Insights Marketing Activation In-Market Execution Area of Focus Marketing FP&A Supply Chain Public Affairs Legal R&D IT HR 7
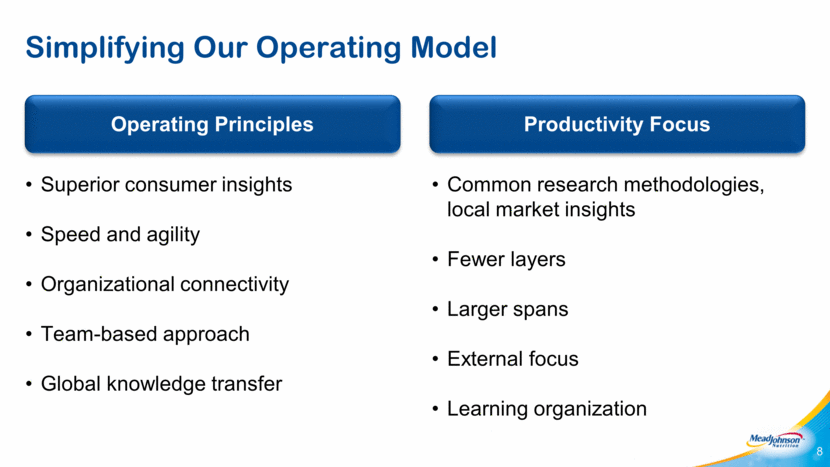
Simplifying Our Operating Model Productivity Focus Operating Principles Superior consumer insights Speed and agility Organizational connectivity Team-based approach Global knowledge transfer Common research methodologies, local market insights Fewer layers Larger spans External focus Learning organization 8
[LOGO]

Exhibit 99.7
Sandra Yu President, Greater China Investor Day 2015

Safe Harbor Statement 2 Forward-Looking Statements Certain statements in this presentation are forward-looking as defined in the Private Securities Litigation Reform Act of 1995. These forward-looking statements may be identified by the fact they use words such as “should,” “expect,” “anticipate,” “estimate,” “target,” “may,” “project,” “guidance,” “intend,” “plan,” “believe” and other words and terms of similar meaning and expression. Such statements are likely to relate to, among other things, a discussion of goals, plans and projections regarding financial position, results of operations, cash flows, market position, market growth and trends, product development, product approvals, sales efforts, expenses, capital expenditures, performance or results of current and anticipated products and the outcome of contingencies such as legal proceedings and financial results. Forward-looking statements can also be identified by the fact that they do not relate strictly to historical or current facts. Such forward-looking statements are based on current expectations that involve inherent risks, uncertainties and assumptions that may cause actual results to differ materially from expectations as of the date of this presentation. These risks include, but are not limited to: (1) the ability to sustain brand strength, particularly the Enfa family of brands; (2) the effect on the company's reputation of real or perceived quality issues; (3) the effect of regulatory restrictions related to the company’s products; (4) the adverse effect of commodity costs; (5) increased competition from branded, private label, store and economy-branded products; (6) the effect of an economic downturn on consumers' purchasing behavior and customers' ability to pay for product; (7) inventory reductions by customers; (8) the adverse effect of changes in foreign currency exchange rates; (9) the effect of changes in economic, political and social conditions in the markets where we operate; (10) changing consumer preferences; (11) the possibility of changes in the Women, Infant and Children (WIC) program, or participation in WIC; (12) legislative, regulatory or judicial action that may adversely affect the company's ability to advertise its products, maintain product margins, or negatively impact the company’s reputation or result in fines or penalties that decrease earnings; and (13) the ability to develop and market new, innovative products. For additional information regarding these and other factors, see the company’s filings with the United States Securities and Exchange Commission (the SEC), including its most recent Annual Report on Form 10-K, which filings are available upon request from the SEC or at www.meadjohnson.com. The company cautions readers not to place undue reliance on any forward-looking statements, which speak only as of the date made. The company undertakes no obligation to publicly update any forward-looking statement, whether as a result of new information, future events or otherwise. Factors Affecting Comparability – Non-GAAP Financial Measures This presentation contains non-GAAP financial measures, including non-GAAP net sales, EBIT, earnings, earnings per share information, and effective tax rates. Specified Items are terms included in GAAP measures, but excluded for the purpose of determining non-GAAP net sales, EBIT, earnings and earnings per share. In addition, other items include the tax impact on Specified Items. Non-GAAP net sales, EBIT, earnings and earnings per share information adjusted for these items is an indication of the company’s underlying operating results and intended to enhance an investor’s overall understanding of the company’s financial performance. In addition, this information is among the primary indicators the company uses as a basis for evaluating company performance, setting incentive compensation targets and planning and forecasting of future periods. This information is not intended to be considered in isolation or as a substitute for financial measures prepared in accordance with GAAP. Tables that reconcile non-GAAP to GAAP disclosure are included in the Appendix. For more information: Kathy MacDonald, Vice President – Investor Relations Mead Johnson Nutrition Company 847-832-2182 [email protected] October 2015 MJN Confidential and Proprietary Information
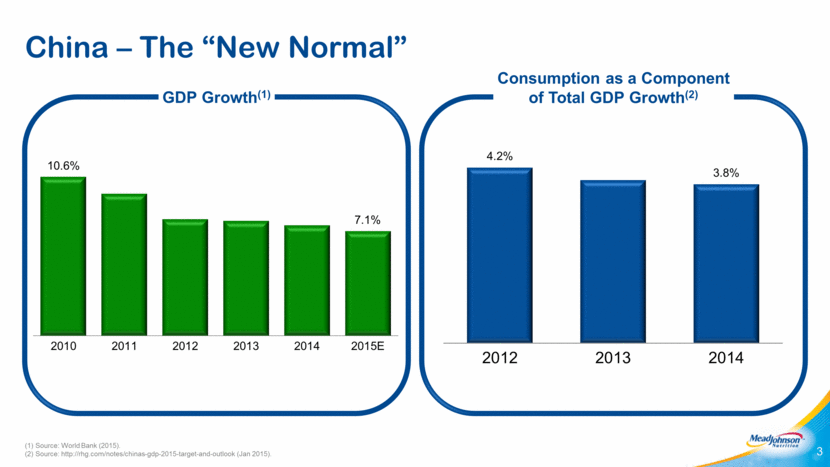
China – The “New Normal” 3 GDP Growth(1) Consumption as a Component of Total GDP Growth(2) (1) Source: World Bank (2015). (2) Source: http://rhg.com/notes/chinas-gdp-2015-target-and-outlook (Jan 2015). 10.6% 7.1% 2010 2011 2012 2013 2014 2015E 4.2% 3.8% 2012 2013 2014
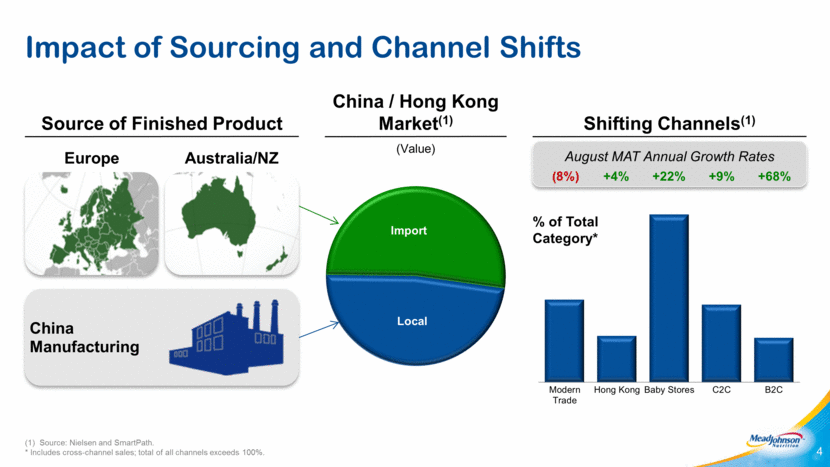
(1) Source: Nielsen and SmartPath. * Includes cross-channel sales; total of all channels exceeds 100%. Impact of Sourcing and Channel Shifts 4 Europe Australia/NZ Source of Finished Product China / Hong Kong Market(1) (Value) China Manufacturing Shifting Channels(1) August MAT Annual Growth Rates +9% +22% (8%) +4% +68% % of Total Category* Local Import Modern Trade Hong Kong Baby Stores C2C B2C
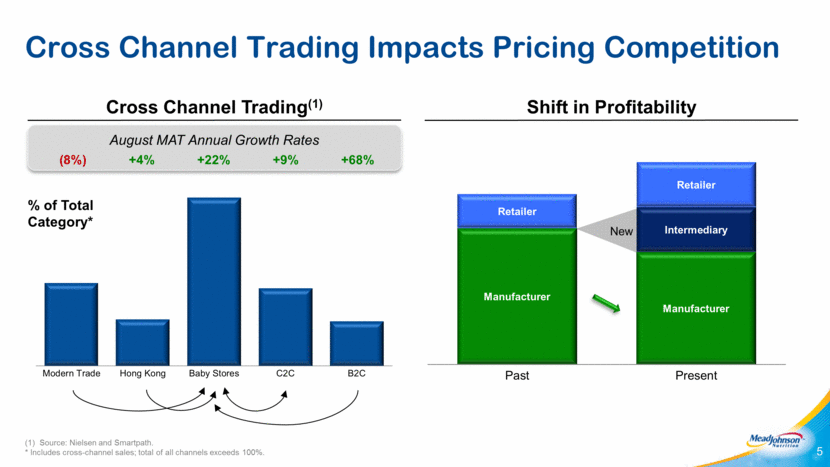
(1) Source: Nielsen and Smartpath. * Includes cross-channel sales; total of all channels exceeds 100%. Cross Channel Trading Impacts Pricing Competition 5 Shift in Profitability Cross Channel Trading(1) August MAT Annual Growth Rates +9% +22% (8%) +4% +68% % of Total Category* New Manufacturer Manufacturer Intermediary Retailer Retailer Past Present Modern Trade Hong Kong Baby Stores C2C B2C
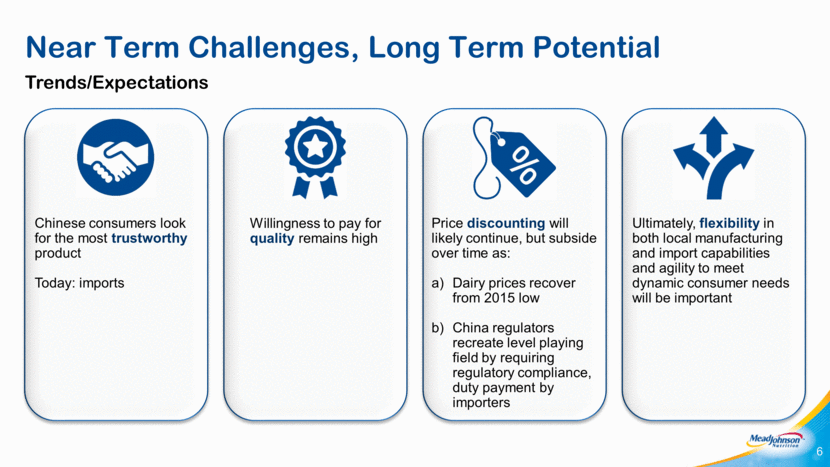
Near Term Challenges, Long Term Potential Trends/Expectations 6 Chinese consumers look for the most trustworthy product Today: imports Willingness to pay for quality remains high Price discounting will likely continue, but subside over time as: Dairy prices recover from 2015 low China regulators recreate level playing field by requiring regulatory compliance, duty payment by importers Ultimately, flexibility in both local manufacturing and import capabilities and agility to meet dynamic consumer needs will be important
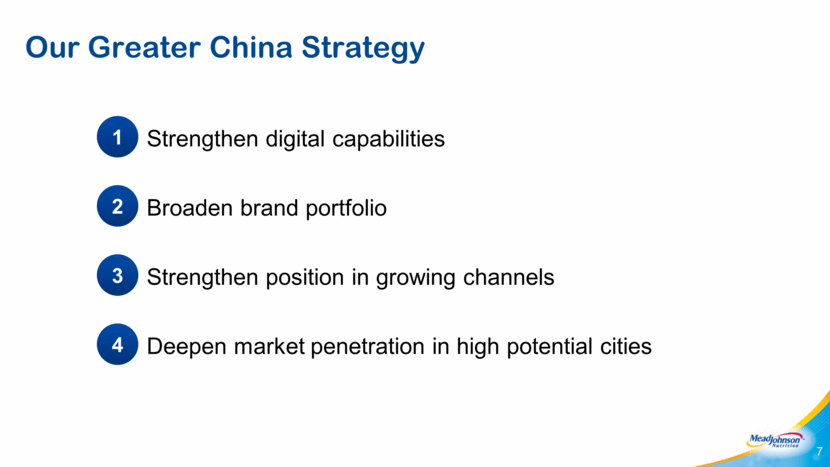
Our Greater China Strategy 7 Strengthen digital capabilities Broaden brand portfolio Strengthen position in growing channels Deepen market penetration in high potential cities 1 2 3 4
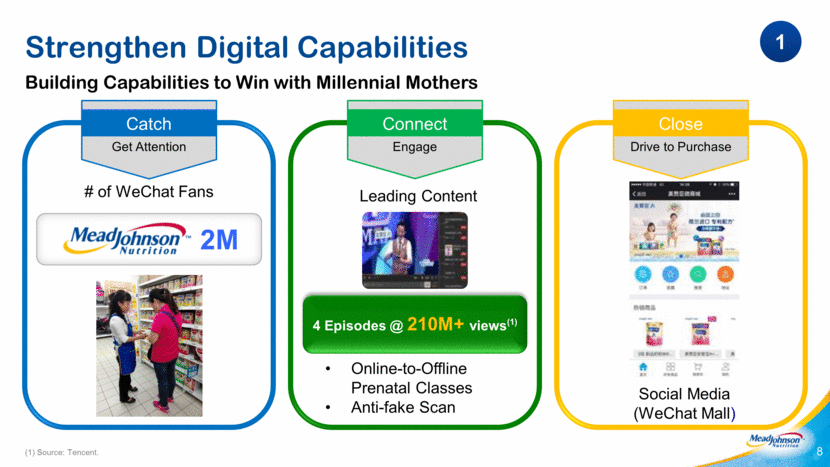
2M Strengthen Digital Capabilities (1) Source: Tencent. 8 # of WeChat Fans Leading Content Online-to-Offline Prenatal Classes Anti-fake Scan Social Media (WeChat Mall) 4 Episodes @ 210M+ views(1) Catch Get Attention Connect Engage Close Drive to Purchase Building Capabilities to Win with Millennial Mothers 1
WECHAT Demo 9

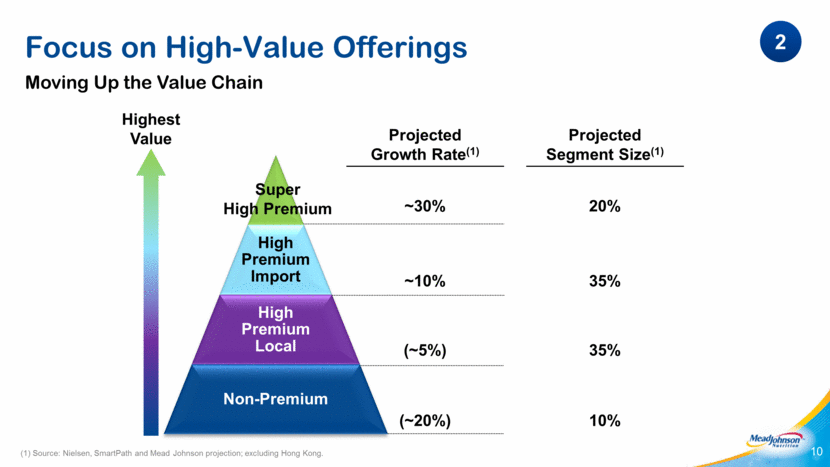
Focus on High-Value Offerings 10 Highest Value Projected Growth Rate(1) Super High Premium ~30% ~10% (~5%) (~20%) (1) Source: Nielsen, SmartPath and Mead Johnson projection; excluding Hong Kong. 20% 35% 35% 10% Projected Segment Size(1) Moving Up the Value Chain 2 High Premium Import High Premium Local Non-Premium
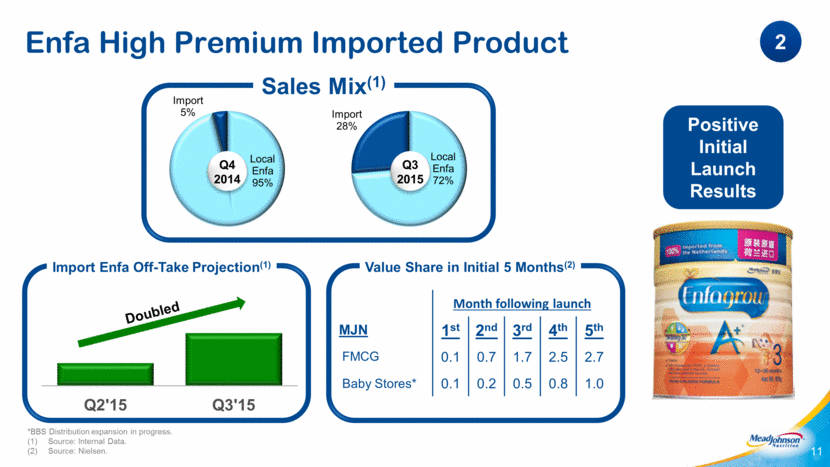
Enfa High Premium Imported Product *BBS Distribution expansion in progress. Source: Internal Data. Source: Nielsen. 11 Sales Mix(1) Import Enfa Off-Take Projection(1) Value Share in Initial 5 Months(2) Doubled Month following launch MJN 1st 2nd 3rd 4th 5th FMCG 0.1 0.7 1.7 2.5 2.7 Baby Stores* 0.1 0.2 0.5 0.8 1.0 Positive Initial Launch Results Q4 2014 Q3 2015 2 Local Enfa 72% Import 28% Local Enfa 95% Import 5% Q2'15 Q3'15
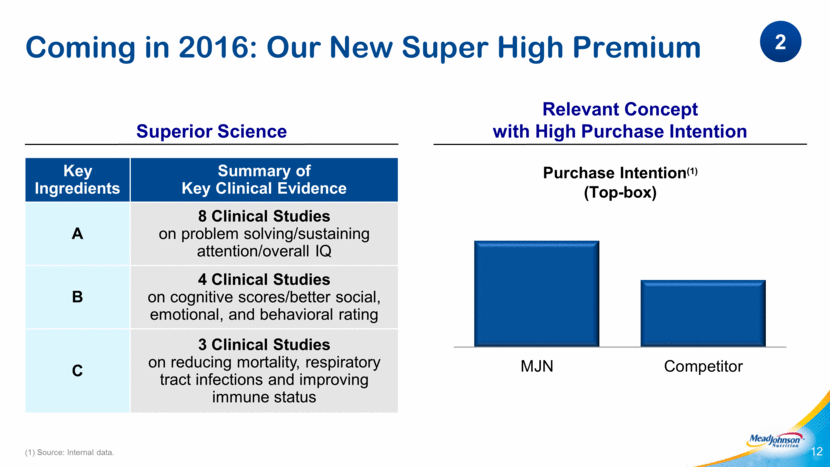
(1) Source: Internal data. 12 Key Ingredients Summary of Key Clinical Evidence A 8 Clinical Studies on problem solving/sustaining attention/overall IQ B 4 Clinical Studies on cognitive scores/better social, emotional, and behavioral rating C 3 Clinical Studies on reducing mortality, respiratory tract infections and improving immune status Relevant Concept with High Purchase Intention Superior Science Coming in 2016: Our New Super High Premium 2 MJN Competitor Purchase Intention (1) (Top - box)
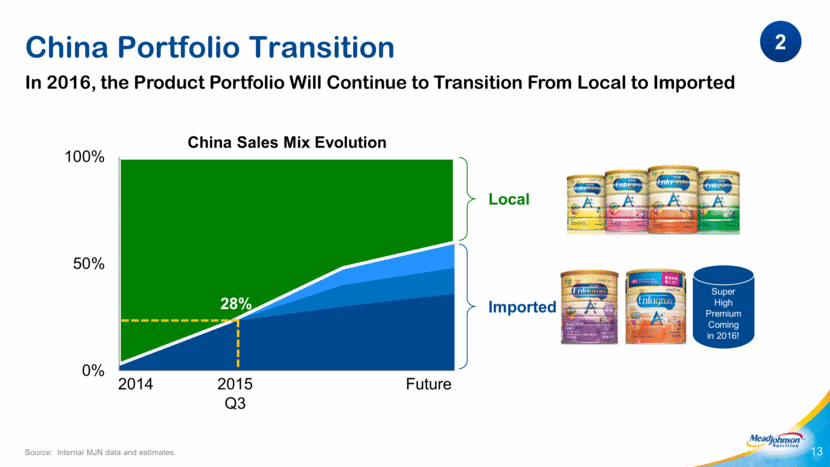
China Portfolio Transition In 2016, the Product Portfolio Will Continue to Transition From Local to Imported Source: Internal MJN data and estimates. 13 2014 Future 2015 Q3 28% Imported Local China Sales Mix Evolution Super High Premium Coming in 2016! 2 0% 50% 100% Hundreds
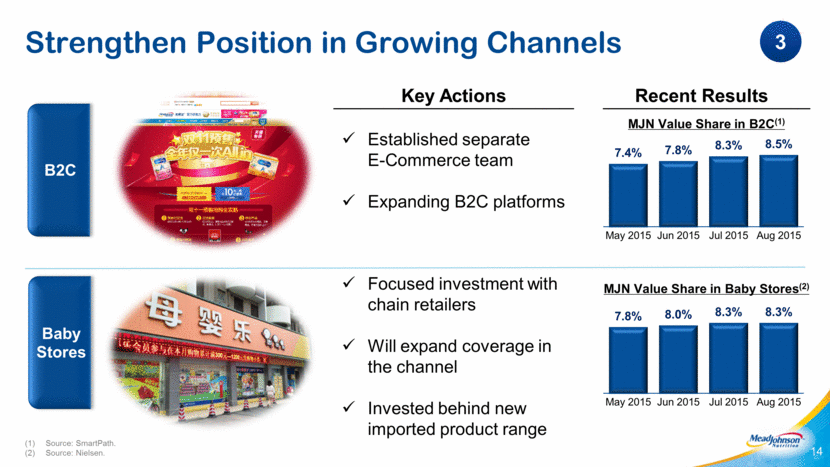
Strengthen Position in Growing Channels B2C Baby Stores Established separate E-Commerce team Expanding B2C platforms Focused investment with chain retailers Will expand coverage in the channel Invested behind new imported product range Key Actions 14 Source: SmartPath. Source: Nielsen. MJN Value Share in B2C(1) MJN Value Share in Baby Stores(2) Recent Results 3 7.4% 7.8% 8.3% 8.5% May 2015 Jun 2015 Jul 2015 Aug 2015 7.8% 8.0% 8.3% 8.3% May 2015 Jun 2015 Jul 2015 Aug 2015
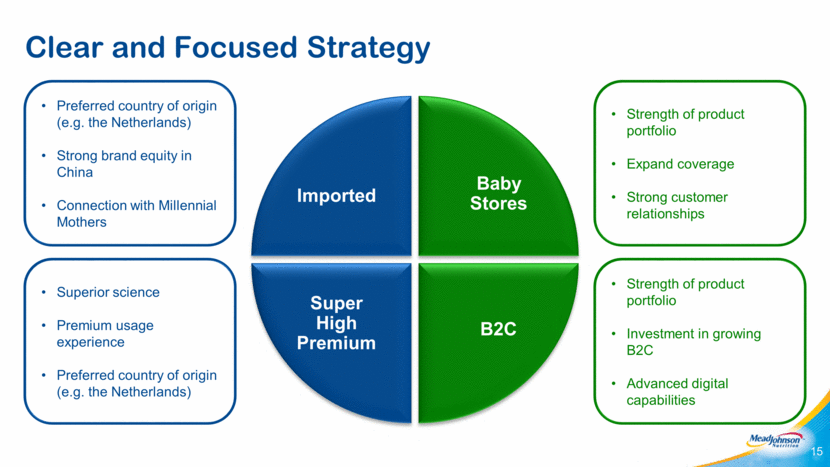
Clear and Focused Strategy 15 Imported Baby Stores B2C Super High Premium Preferred country of origin (e.g. the Netherlands) Strong brand equity in China Connection with Millennial Mothers Superior science Premium usage experience Preferred country of origin (e.g. the Netherlands) Strength of product portfolio Expand coverage Strong customer relationships Strength of product portfolio Investment in growing B2C Advanced digital capabilities
[LOGO]

Exhibit 99.8
Graciela Monteagudo Senior Vice President and President, Americas and Global Marketing Investor Day 2015

Safe Harbor Statement 2 Forward-Looking Statements Certain statements in this presentation are forward-looking as defined in the Private Securities Litigation Reform Act of 1995. These forward-looking statements may be identified by the fact they use words such as “should,” “expect,” “anticipate,” “estimate,” “target,” “may,” “project,” “guidance,” “intend,” “plan,” “believe” and other words and terms of similar meaning and expression. Such statements are likely to relate to, among other things, a discussion of goals, plans and projections regarding financial position, results of operations, cash flows, market position, market growth and trends, product development, product approvals, sales efforts, expenses, capital expenditures, performance or results of current and anticipated products and the outcome of contingencies such as legal proceedings and financial results. Forward-looking statements can also be identified by the fact that they do not relate strictly to historical or current facts. Such forward-looking statements are based on current expectations that involve inherent risks, uncertainties and assumptions that may cause actual results to differ materially from expectations as of the date of this presentation. These risks include, but are not limited to: (1) the ability to sustain brand strength, particularly the Enfa family of brands; (2) the effect on the company's reputation of real or perceived quality issues; (3) the effect of regulatory restrictions related to the company’s products; (4) the adverse effect of commodity costs; (5) increased competition from branded, private label, store and economy-branded products; (6) the effect of an economic downturn on consumers' purchasing behavior and customers' ability to pay for product; (7) inventory reductions by customers; (8) the adverse effect of changes in foreign currency exchange rates; (9) the effect of changes in economic, political and social conditions in the markets where we operate; (10) changing consumer preferences; (11) the possibility of changes in the Women, Infant and Children (WIC) program, or participation in WIC; (12) legislative, regulatory or judicial action that may adversely affect the company's ability to advertise its products, maintain product margins, or negatively impact the company’s reputation or result in fines or penalties that decrease earnings; and (13) the ability to develop and market new, innovative products. For additional information regarding these and other factors, see the company’s filings with the United States Securities and Exchange Commission (the SEC), including its most recent Annual Report on Form 10-K, which filings are available upon request from the SEC or at www.meadjohnson.com. The company cautions readers not to place undue reliance on any forward-looking statements, which speak only as of the date made. The company undertakes no obligation to publicly update any forward-looking statement, whether as a result of new information, future events or otherwise. Factors Affecting Comparability – Non-GAAP Financial Measures This presentation contains non-GAAP financial measures, including non-GAAP net sales, EBIT, earnings, earnings per share information, and effective tax rates. Specified Items are terms included in GAAP measures, but excluded for the purpose of determining non-GAAP net sales, EBIT, earnings and earnings per share. In addition, other items include the tax impact on Specified Items. Non-GAAP net sales, EBIT, earnings and earnings per share information adjusted for these items is an indication of the company’s underlying operating results and intended to enhance an investor’s overall understanding of the company’s financial performance. In addition, this information is among the primary indicators the company uses as a basis for evaluating company performance, setting incentive compensation targets and planning and forecasting of future periods. This information is not intended to be considered in isolation or as a substitute for financial measures prepared in accordance with GAAP. Tables that reconcile non-GAAP to GAAP disclosure are included in the Appendix. For more information: Kathy MacDonald, Vice President – Investor Relations Mead Johnson Nutrition Company 847-832-2182 [email protected] October 2015 MJN Confidential and Proprietary Information
Investment Through Recession Provided Strong Platform for Growth North America/Europe 3 3 (1) Reconciliation of Non-GAAP to GAAP is included in the Appendix. Note: YTD indicates 9-months ended 9.30.2015. EBIT Margin Ex-FX Sales Growth(1) Invested Through Recession Leveraging Growth Strategy (3%) (2%) 10% 5% 2012 2013 2014 2015YTD 25% 21% 22% 23% 28% 2011 2012 2013 2014 2015YTD

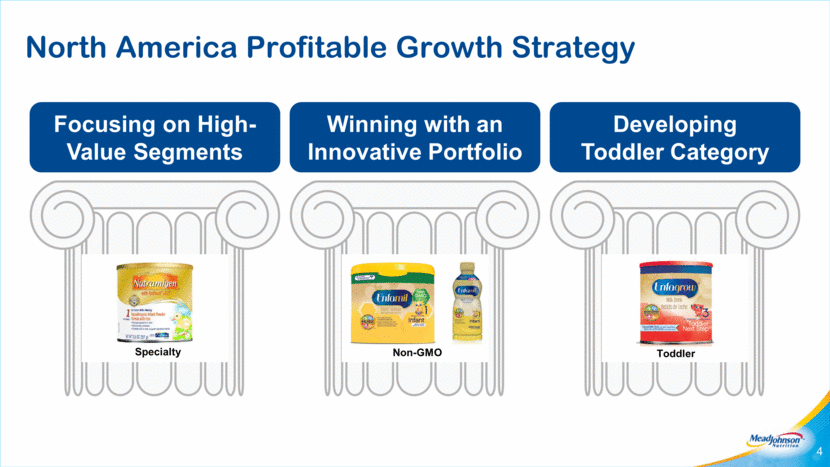
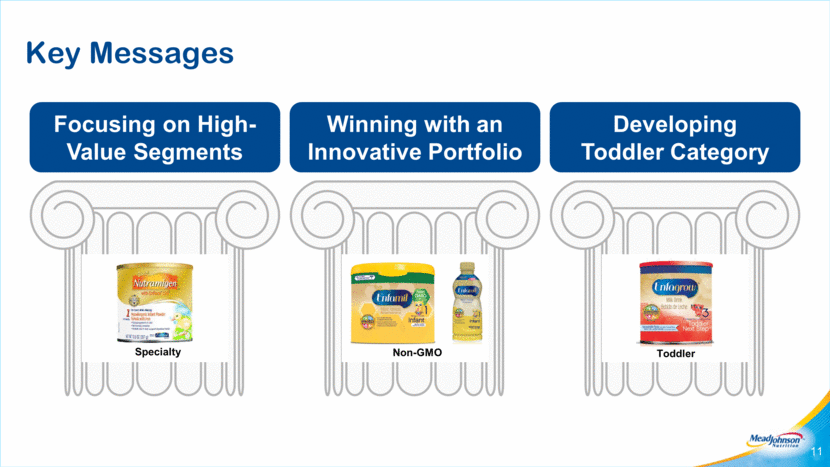
North America Profitable Growth Strategy 4 Developing Toddler Category Winning with an Innovative Portfolio Non-GMO Focusing on High-Value Segments Specialty Toddler
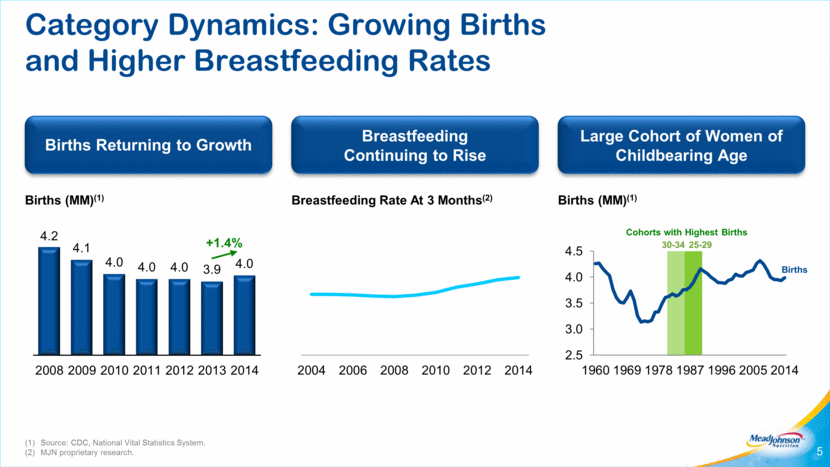
Category Dynamics: Growing Births and Higher Breastfeeding Rates 5 Large Cohort of Women of Childbearing Age Breastfeeding Continuing to Rise Births Returning to Growth Source: CDC, National Vital Statistics System. MJN proprietary research. Births (MM)(1) +1.4% Breastfeeding Rate At 3 Months(2) Cohorts with Highest Births Births (MM)(1) Births 30-34 25-29 2.5 3.0 3.5 4.0 4.5 1960 1969 1978 1987 1996 2005 2014 2004 2006 2008 2010 2012 2014 4.2 4.1 4.0 4.0 4.0 3.9 4.0 2008 2009 2010 2011 2012 2013 2014
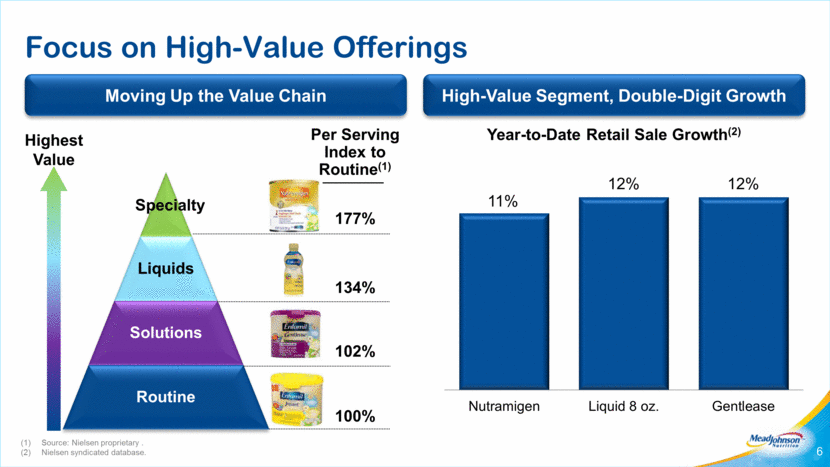
High-Value Segment, Double-Digit Growth Moving Up the Value Chain Source: Nielsen proprietary . Nielsen syndicated database. Focus on High-Value Offerings 6 Highest Value Per Serving Index to Routine(1) Specialty 177% 134% 102% 100% Year-to-Date Retail Sale Growth(2) Liquids Solutions Routine 11% 12% 12% Nutramigen Liquid 8 oz. Gentlease
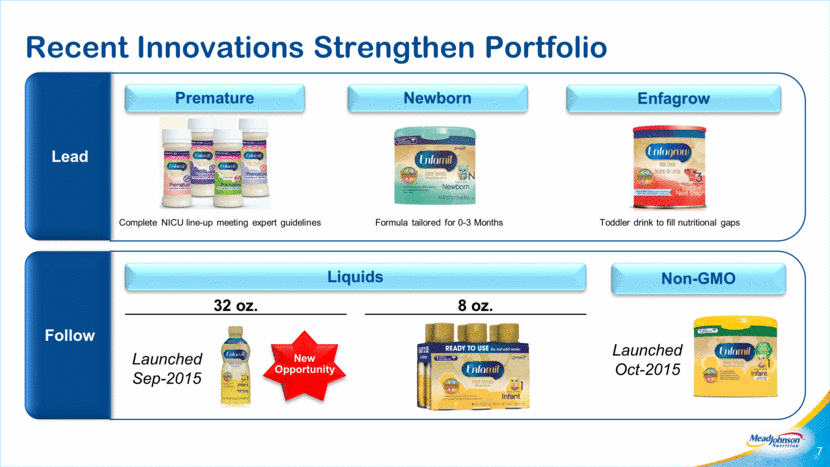
Recent Innovations Strengthen Portfolio 7 Lead Follow Premature Enfagrow Newborn Complete NICU line-up meeting expert guidelines Formula tailored for 0-3 Months Toddler drink to fill nutritional gaps Launched Oct-2015 Non-GMO 32 oz. 8 oz. Launched Sep-2015 New Opportunity Liquids
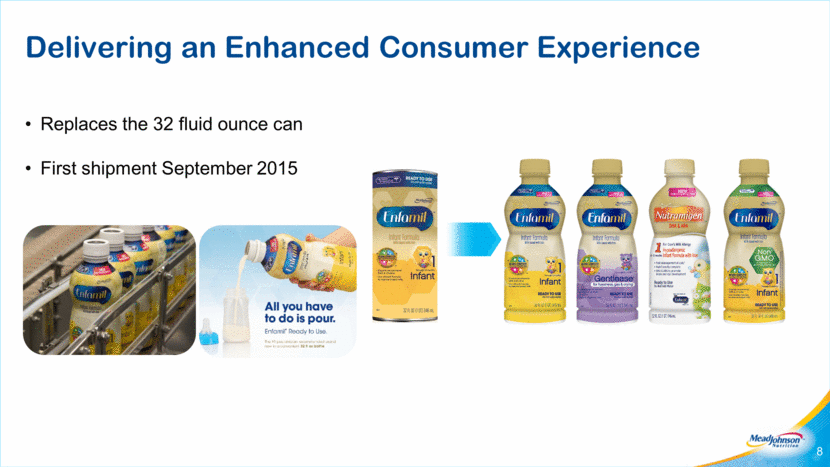
Delivering an Enhanced Consumer Experience 8 Replaces the 32 fluid ounce can First shipment September 2015
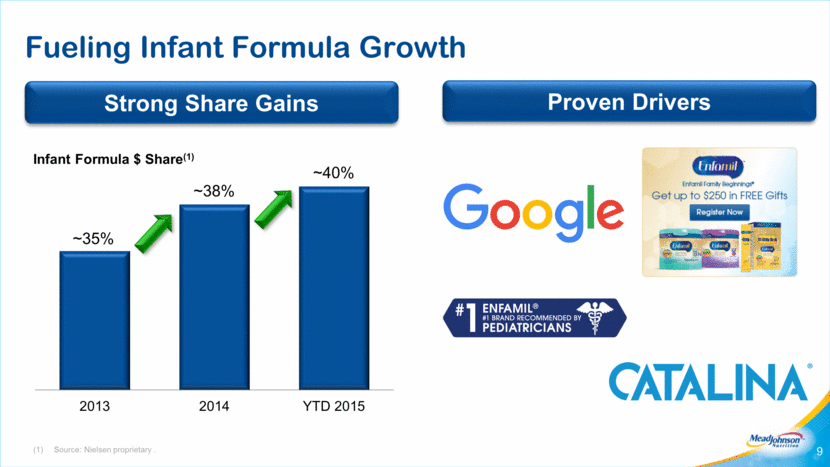
Fueling Infant Formula Growth 9 Proven Drivers Strong Share Gains Infant Formula $ Share(1) Source: Nielsen proprietary . ~35 % ~38 % ~40 % 2013 2014 YTD 2015
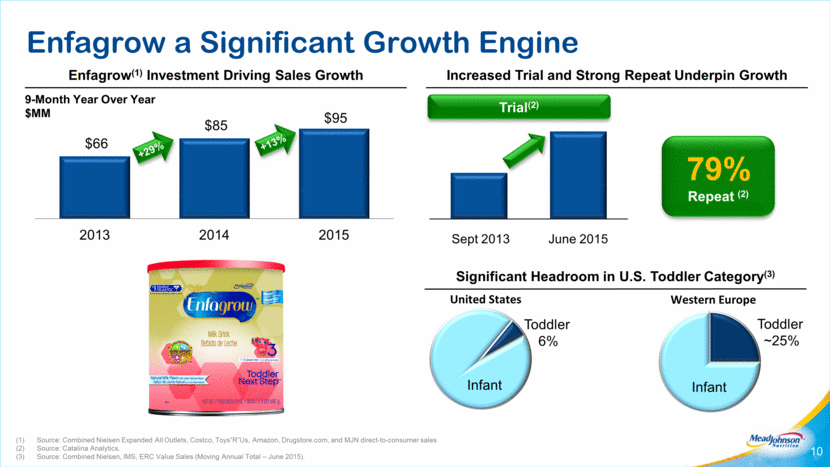
Enfagrow a Significant Growth Engine 10 Source: Combined Nielsen Expanded All Outlets, Costco, Toys”R”Us, Amazon, Drugstore.com, and MJN direct-to-consumer sales Source: Catalina Analytics. Source: Combined Nielsen, IMS, ERC Value Sales (Moving Annual Total – June 2015). Toddler 6% Toddler ~25% Enfagrow(1) Investment Driving Sales Growth Trial(2) 79% Repeat (2) Infant Infant Increased Trial and Strong Repeat Underpin Growth Significant Headroom in U.S. Toddler Category(3) +29% +13% 9-Month Year Over Year $MM United States Western Europe Enfagrow Sept 2013 Enfagrow June 2015 Sept 2013 Sept 2013 June 2015 $66 $85 $95 2013 2014 2015
Key Messages 11 Developing Toddler Category Winning with an Innovative Portfolio Non-GMO Focusing on High-Value Segments Specialty Toddler
Appendix 12

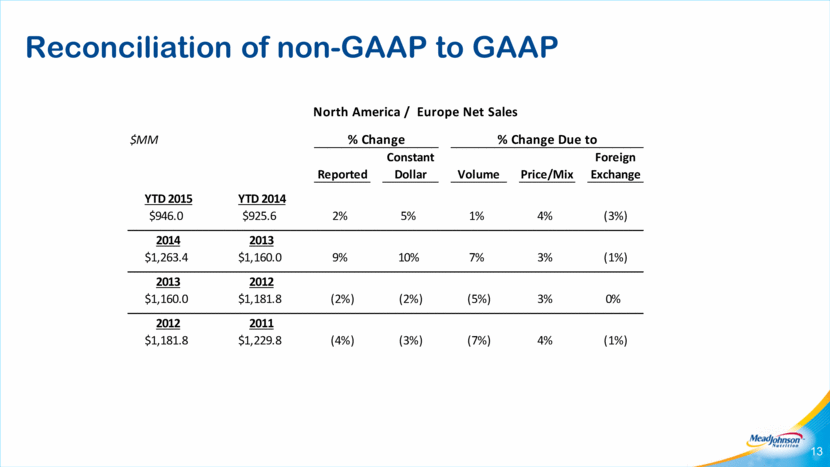
Reconciliation of non-GAAP to GAAP 13 $MM % Change % Change Due to Constant Foreign Reported Dollar Volume Price/Mix Exchange YTD 2015 YTD 2014 $946.0 $925.6 2% 5% 1% 4% (3%) 2014 2013 $1,263.4 $1,160.0 9% 10% 7% 3% (1%) 2013 2012 $1,160.0 $1,181.8 (2%) (2%) (5%) 3% 0% 2012 2011 $1,181.8 $1,229.8 (4%) (3%) (7%) 4% (1%) North America / Europe Net Sales
14

Exhibit 99.9
Kasper Jakobsen President & Chief Executive Officer Investor Day 2015

Safe Harbor Statement 2 Forward-Looking Statements Certain statements in this presentation are forward-looking as defined in the Private Securities Litigation Reform Act of 1995. These forward-looking statements may be identified by the fact they use words such as “should,” “expect,” “anticipate,” “estimate,” “target,” “may,” “project,” “guidance,” “intend,” “plan,” “believe” and other words and terms of similar meaning and expression. Such statements are likely to relate to, among other things, a discussion of goals, plans and projections regarding financial position, results of operations, cash flows, market position, market growth and trends, product development, product approvals, sales efforts, expenses, capital expenditures, performance or results of current and anticipated products and the outcome of contingencies such as legal proceedings and financial results. Forward-looking statements can also be identified by the fact that they do not relate strictly to historical or current facts. Such forward-looking statements are based on current expectations that involve inherent risks, uncertainties and assumptions that may cause actual results to differ materially from expectations as of the date of this presentation. These risks include, but are not limited to: (1) the ability to sustain brand strength, particularly the Enfa family of brands; (2) the effect on the company's reputation of real or perceived quality issues; (3) the effect of regulatory restrictions related to the company’s products; (4) the adverse effect of commodity costs; (5) increased competition from branded, private label, store and economy-branded products; (6) the effect of an economic downturn on consumers' purchasing behavior and customers' ability to pay for product; (7) inventory reductions by customers; (8) the adverse effect of changes in foreign currency exchange rates; (9) the effect of changes in economic, political and social conditions in the markets where we operate; (10) changing consumer preferences; (11) the possibility of changes in the Women, Infant and Children (WIC) program, or participation in WIC; (12) legislative, regulatory or judicial action that may adversely affect the company's ability to advertise its products, maintain product margins, or negatively impact the company’s reputation or result in fines or penalties that decrease earnings; and (13) the ability to develop and market new, innovative products. For additional information regarding these and other factors, see the company’s filings with the United States Securities and Exchange Commission (the SEC), including its most recent Annual Report on Form 10-K, which filings are available upon request from the SEC or at www.meadjohnson.com. The company cautions readers not to place undue reliance on any forward-looking statements, which speak only as of the date made. The company undertakes no obligation to publicly update any forward-looking statement, whether as a result of new information, future events or otherwise. Factors Affecting Comparability – Non-GAAP Financial Measures This presentation contains non-GAAP financial measures, including non-GAAP net sales, EBIT, earnings, earnings per share information, and effective tax rates. Specified Items are terms included in GAAP measures, but excluded for the purpose of determining non-GAAP net sales, EBIT, earnings and earnings per share. In addition, other items include the tax impact on Specified Items. Non-GAAP net sales, EBIT, earnings and earnings per share information adjusted for these items is an indication of the company’s underlying operating results and intended to enhance an investor’s overall understanding of the company’s financial performance. In addition, this information is among the primary indicators the company uses as a basis for evaluating company performance, setting incentive compensation targets and planning and forecasting of future periods. This information is not intended to be considered in isolation or as a substitute for financial measures prepared in accordance with GAAP. Tables that reconcile non-GAAP to GAAP disclosure are included in the Appendix. For more information: Kathy MacDonald, Vice President – Investor Relations Mead Johnson Nutrition Company 847-832-2182 [email protected] October 2015 MJN Confidential and Proprietary Information
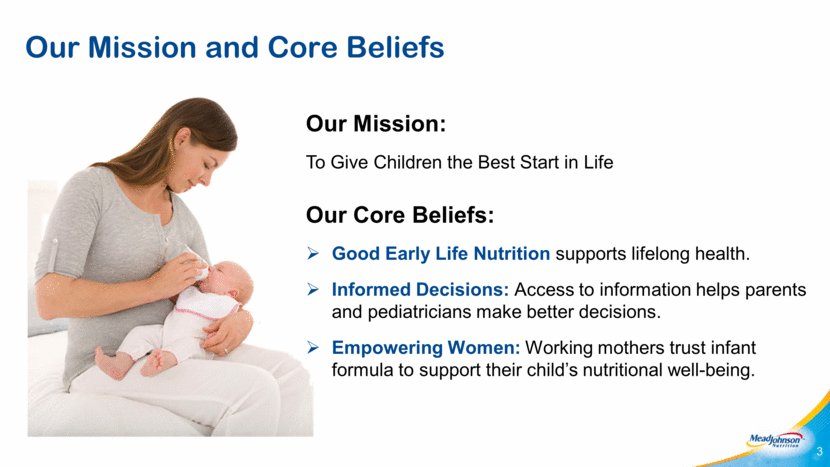
Our Mission and Core Beliefs 3 Our Mission: To Give Children the Best Start in Life Our Core Beliefs: Good Early Life Nutrition supports lifelong health. Informed Decisions: Access to information helps parents and pediatricians make better decisions. Empowering Women: Working mothers trust infant formula to support their child’s nutritional well-being.
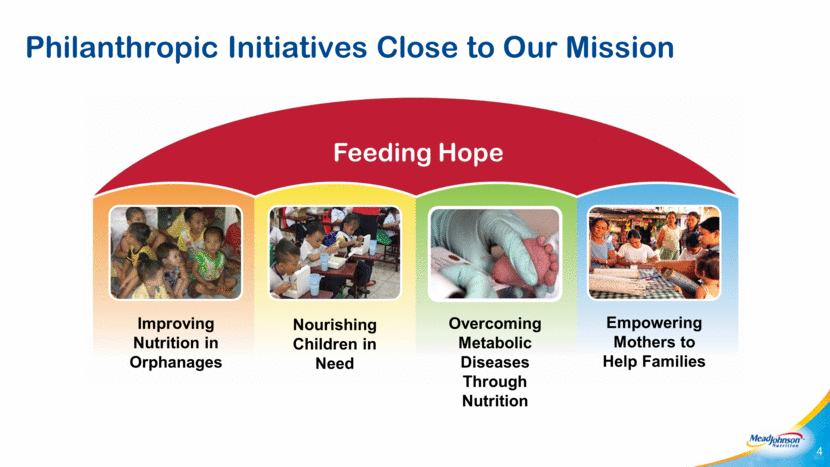
Philanthropic Initiatives Close to Our Mission 4 Improving Nutrition in Orphanages Overcoming Metabolic Diseases Through Nutrition Empowering Mothers to Help Families Feeding Hope Nourishing Children in Need
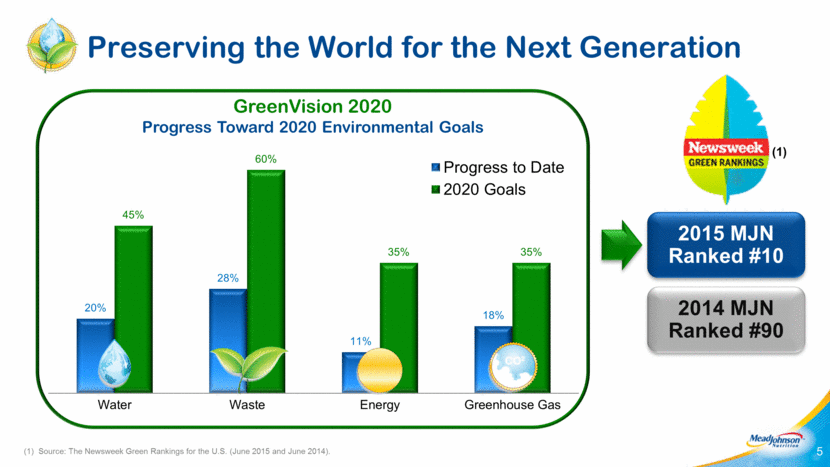
(1) Source: The Newsweek Green Rankings for the U.S. (June 2015 and June 2014). Preserving the World for the Next Generation 5 2014 MJN Ranked #90 2015 MJN Ranked #10 GreenVision 2020 Progress Toward 2020 Environmental Goals (1) 20% 28% 11% 18% 45% 60% 35% 35% Water Waste Energy Greenhouse Gas Progress to Date 2020 Goals
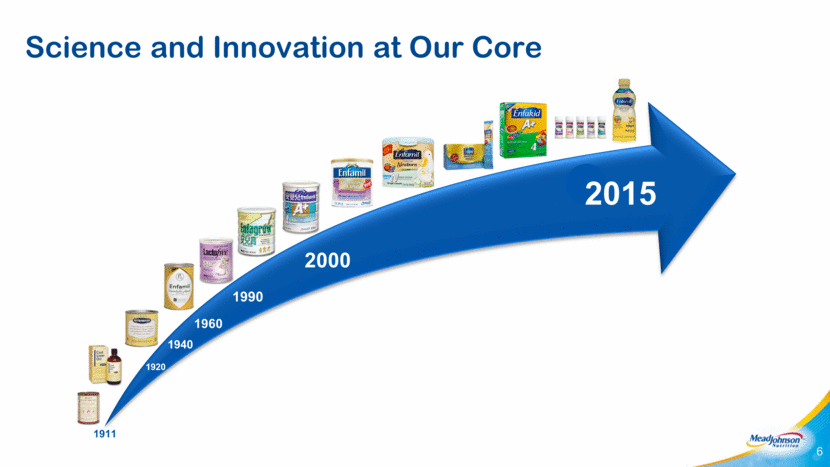
Science and Innovation at Our Core 6 1911 1960 2000 2015 1990 1940 1920
7 Virtuous Circle of Financial Discipline and Growth Shareholder Value Creation Return Cash to Shareholders Selective M&A EPS Growth Dividends Share Buy Back EBIT Margin Accretion
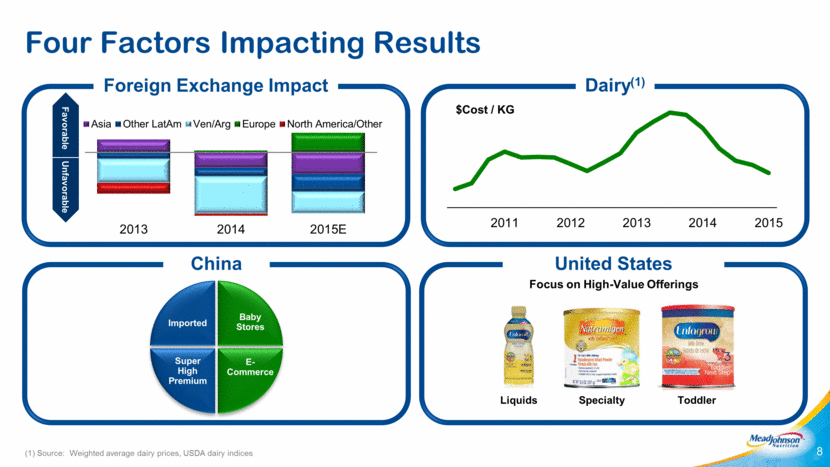
Dairy(1) China United States (1) Source: Weighted average dairy prices, USDA dairy indices Four Factors Impacting Results 8 Favorable Unfavorable Focus on High-Value Offerings Specialty Liquids Toddler Foreign Exchange Impact $Cost / KG Imported Baby Stores E- Commerce Super High Premium 2011 2012 2013 2014 2015 2013 2014 2015E Asia Other LatAm Ven/Arg Europe North America/Other
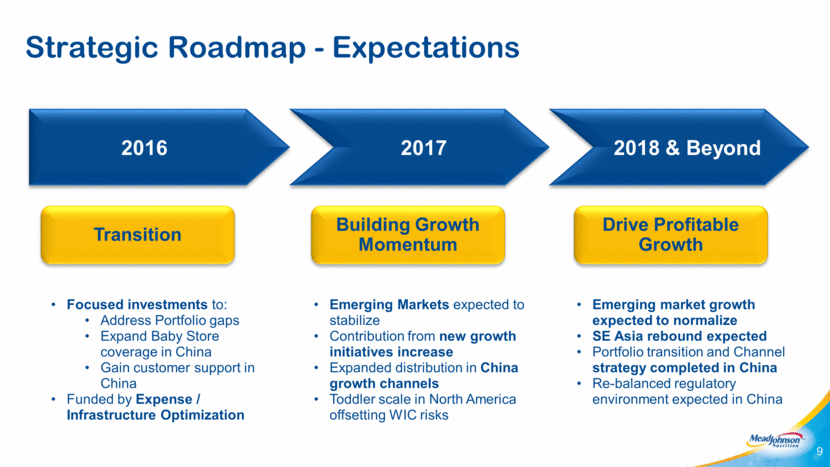
Strategic Roadmap - Expectations 9 2017 2018 & Beyond 2016 Focused investments to: Address Portfolio gaps Expand Baby Store coverage in China Gain customer support in China Funded by Expense / Infrastructure Optimization Emerging Markets expected to stabilize Contribution from new growth initiatives increase Expanded distribution in China growth channels Toddler scale in North America offsetting WIC risks Emerging market growth expected to normalize SE Asia rebound expected Portfolio transition and Channel strategy completed in China Re-balanced regulatory environment expected in China Transition Building Growth Momentum Drive Profitable Growth
Q&A 10

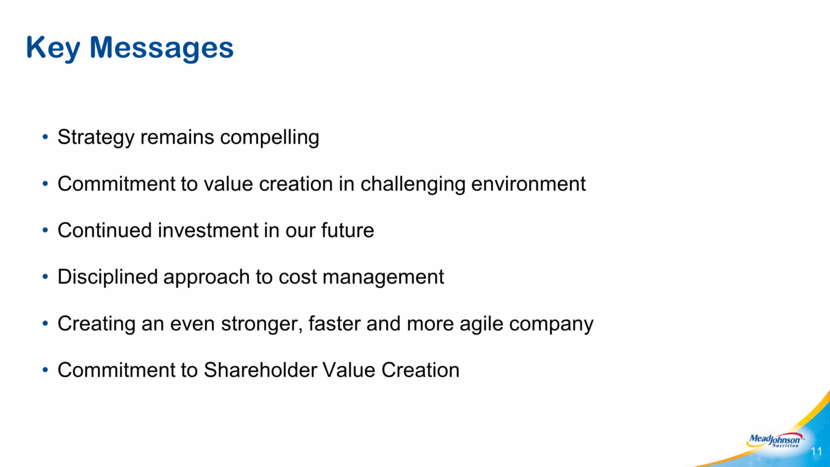
Strategy remains compelling Commitment to value creation in challenging environment Continued investment in our future Disciplined approach to cost management Creating an even stronger, faster and more agile company Commitment to Shareholder Value Creation Key Messages 11
[LOGO]

Serious News for Serious Traders! Try StreetInsider.com Premium Free!
You May Also Be Interested In
- June Announces Pet Grooming Software to Simplify Booking and Client Communication
- Corboy & Demetrio files Lawsuit for Family of Frankfort Girl Killed by School Bus
- Ethereum Price Prediction: ETH Faces $2,800 Resistance as AlphaPepe Builds a $2.87M Presale Around AI Trading
Create E-mail Alert Related Categories
SEC FilingsSign up for StreetInsider Free!
Receive full access to all new and archived articles, unlimited portfolio tracking, e-mail alerts, custom newswires and RSS feeds - and more!
