




Form 8-K Manitex International, For: Mar 05

FREE Breaking News Alerts from StreetInsider.com!
StreetInsider.com Top Tickers, 10/25/2026
- Wall Street closes lower to end rocky week
- Meta's capital-raising plans expose a major weakness in the AI boom
- Oil prices jump $3 on Houthi attacks, oil spill, highest settlement since April
- BofA flags further downside risk for stocks, yields and dollar
- SpaceX cell-site ambitions lift tower stocks and weigh on carriers
 Tweet
Tweet Share
Share E-mail
STATES
SECURITIES AND EXCHANGE COMMISSION
WASHINGTON, D.C. 20549
FORM 8-K
CURRENT REPORT
Pursuant to Section 13 or 15(d)
of the Securities Exchange Act of 1934
Date of report (Date of the earliest event reported) March 5, 2015
MANITEX INTERNATIONAL, INC.
(Exact Name of Registrant as Specified in Its Charter)
| Michigan | 001-32401 | 42-1628978 | ||
| (State or Other Jurisdiction of Incorporation) |
(Commission File Number) |
(IRS Employer Identification No.) |
| 9725 Industrial Drive, Bridgeview, Illinois | 60455 | |
| (Address of Principal Executive Offices) | (Zip Code) |
(708) 430-7500
(Registrant’s Telephone Number, Including Area Code)
9725 Industrial Drive, Bridgeview, Illinois
(Former Name or Former Address, if Changed Since Last Report)
Check the appropriate box below if the Form 8-K filing is intended to simultaneously satisfy the filing obligation of the registrant under any of the following provisions:
| ¨ | Written communications pursuant to Rule 425 under the Securities Act (17 CFR 230.425) |
| ¨ | Soliciting material pursuant to Rule 14a-12 under the Exchange Act (17 CFR 240.14a-12) |
| ¨ | Pre-commencement communications pursuant to Rule 14d-2(b) under the Exchange Act (17 CFR 240.14d-2(b)) |
| ¨ | Pre-commencement communications pursuant to Rule 13e-4(c) under the Exchange Act (17 CFR 240.13e-4(c)) |
Item 2.02 Results of Operations and Financial Condition.
On March 5, 2015, Manitex International, Inc. (the “Company”) issued a press release announcing its unaudited financial results for the fourth quarter and the year ended December 31, 2014 (the “Press Release”). The full text of the Press Release is being furnished as Exhibit 99.1 to this Current Report. The Company also posted presentation slides (Exhibit 99.2) that will be referenced during the conference call and webcast which will take place today March 5, 2015 at 4:30 pm eastern time to discuss the fourth quarter and full year 2014 results. Both Exhibits can be accessed from the Investor Relations section of the Company’s website at www.ManitexInternational.com.
The information in this Current Report (including Exhibit 99.1 and 99.2) is being furnished and shall not be deemed “filed” for the purposes of Section 18 of the Securities Exchange Act of 1934, as amended (the “Exchange Act”), or otherwise subject to the liabilities of that Section. The information in this Current Report shall not be incorporated by reference into any registration statement or other document pursuant to the Securities Act of 1933, as amended or the Exchange Act, except as shall be expressly set forth by specific reference in such filing.
The Company references certain non-GAAP financial measures. A reconciliation of these non-GAAP financial measures to the comparable GAAP financial measures is contained in the attached Press Release. Disclosures regarding definitions of these financial measures used by the Company and why the Company’s management believes these financial measures provide useful information to investors is also included in the Press Release.
Item 9.01 Financial Statements and Exhibits.
(a) Financial Statements of Businesses Acquired.
Not applicable.
(b) Pro Forma Financial Information.
Not applicable.
(c) Shell Company Transactions.
Not applicable.
(d) Exhibits.
See the Exhibit Index set forth below for a list of exhibits included with this Current Report on Form 8-K.
SIGNATURE
Pursuant to the requirements of the Securities Exchange Act of 1934, the Company has duly caused this report to be signed on its behalf by the undersigned thereunder duly authorized.
| MANITEX INTERNATIONAL, INC. | ||
| By: | /s/ DAVID GRANSEE | |
| Name: | David Gransee | |
| Title: | VP and CFO | |
Date: March 5, 2015
EXHIBIT INDEX
| Exhibit Number |
Description | |
| 99.1 | Press release dated March 5, 2015 | |
| 99.2 | Webcast presentation slides dated March 5, 2015 | |
Exhibit 99.1
Manitex International, Inc. Reports Fourth Quarter and Full Year 2014 Results
Reports Record Annual Net Revenues of $264.1 Million
New Acquisitions of PM Group and ASV Advance Manitex into 2015
Bridgeview, IL, March 5, 2015 — Manitex International, Inc. (Nasdaq: MNTX), a leading international provider of cranes and specialized material and container handling equipment, today announced fourth quarter and full year 2014 results.
Full Year 2014 Financial Highlights:
| • | Net revenues for 2014 rose 7.8% to a record $264.1 million, compared to the prior year’s revenue of $245.1 million. |
| • | Adjusted EBITDA (1)(2) (i.e. excluding $2.4 million of transaction related expenses) for the full year 2014 was $20.9 million, or 7.9% of sales, compared to $21.5 million and 8.8% of sales for 2013. |
| • | Net income was $7.1 million or $0.51 per share, compared to net income of $10.2 million or $0.80 per share for the full year of 2013. |
| • | Adjusted net income (1)(2) (i.e. excluding $2.5 million of transaction related expenses) of $8.8 million or $0.63 per share, compared to net income of $10.2 million for 2013 or $0.80 per share |
| • | Consolidated backlog at December 31, 2014 was $107.3 million, compared to $77.3 million at December 31, 2013. |
Fourth Quarter 2014 Financial Highlights:
| • | Net revenues of $66.9 million, represented a 2.3% year-over-year increase from $65.4 million. |
| • | Adjusted EBITDA (1)(2) was $5.3 million or 8.0% of sales, compared to the fourth quarter 2013 of $6.2 million and 9.5% of sales. Adjusted net income(1)(2) was $2.2 million or $0.16 per share, compared to the fourth quarter 2013 net income and earnings per share of $3.0 million and $0.22 respectively. |
Transactions:
| • | On December 19th 2014 completed the acquisition of 51% of ASV Inc., a joint venture with Terex Corp. |
| • | Subsequent to the end of the year, on January 15th 2015, completed the acquisition of PM Group. |
| (1) | Adjusted EBITDA and adjusted net income are non-GAAP (generally accepted accounting principles in the United States of America) financial measures. These measures may be different from non-GAAP financial measures used by other companies. We encourage investors to review the section below entitled “Non-GAAP Financial Measures.” |
| (2) | Adjustments include approximately $2.4 million in transaction costs associated with ASV Joint Venture and PM- Group Acquisition and other expense, reconciled in tables below |
Chairman and Chief Executive Officer, David Langevin, commented, “While we achieved record net sales and maintained our track record of profitability and ebitda generation even in a difficult equipment operating environment, our Company’s biggest achievements in the year were the transactions we consummated, which have positioned us for continued long term shareholder growth. ASV has an excellent track record in serving the housing industry and we believe that there is substantial value that our shareholders will recognize from ASV’s contribution, with margins that are higher than ours and exposure to the growing construction market. Further, the PM Group brings to Manitex shareholders a similar opportunity with its product extension in our most profitable crane category and a restructured balance sheet. We welcome the excellent and devoted PM and ASV employees to the Manitex family. The addition of PM and ASV, along with the many other Manitex product brands further establishes Manitex as a premier specialized niche equipment provider serving a broad range of end markets.”
— more —
2014 revenues increased $19.0 million or 7.8% from 2013 to $264.1 million, including $2.3 million from the ASV JV that commenced operations in mid-December of 2014. Excluding ASV, 2014 revenues increased 6.8%, driven substantially by growth in container handling equipment, material handling equipment and equipment distribution revenues that grew year over year by 20%, 14% and 24% respectively. Crane revenues decreased in line with the reduction in our largest market, the boom and truck crane market that was down almost 8% year over year and shipments of larger tonnage cranes being down almost 19% reflecting a softer oil and gas market. Our CVS container handling products benefited from a modest strengthening in Europe as well as expansion and improved distribution into overseas markets.
In the fourth quarter of 2014, revenues were $66.9 million, including $2.3 million of revenues from the previously referenced ASV JV, and were an increase year over year of $1.5 million or 2.3%. Container handling increased approximately 2% year over year but both cranes and material handling equipment showed year over year reductions of three to four percent. Partially offsetting the reduction in the material handling equipment was an increase in shipments of military material handling equipment. Equipment distribution sales were up almost 70% from a relatively low level in the fourth quarter of 2013.
Adjusted net income for 2014 of $8.8 million or $0.63 per share was a decrease of $1.4 million, or $0.17 per share, over 2013. A $19.0 million year over year improvement in revenues resulted in a gross profit increase of $1.8 million which partially offset additional operating expenses of $0.1 million, operating expenses from acquired businesses of $2.9 million, and increased tax expense of $0.2 million. Adjusted net income excludes $2.5 million pre-tax of acquisition related and other costs. Included in these costs is approximately $0.5 million of costs related to the PM Group acquisition that was completed in January of 2015. Gross profit of $48.3 million was equal to 18.3% of sales, a slight reduction from the 19.0% gross profit percent for 2013, principally a result of changes in product mix in sales, particularly from the reduction in higher tonnage crane sales. The increase in operating expense was principally increased sales expense from expanding and reorganizing the sales organization offsetting reduced performance compensation and reduced R&D expenses as a number of new products were now launched into production. In total, after adjustments for deal and other related costs SG&A as a percent of revenue was 11.1% compared to 10.6% in 2013.
Excluding $2.5 million pretax of acquisition related and other costs, adjusted net income for the fourth quarter of 2014 was $2.2 million or $0.16 per share compared to net income of $3.0 million and $0.22 per share for the fourth quarter of 2013. A sales improvement of $1.5 million resulted in a gross profit decrease of $0.1 million from the impact of a change in the sales mix between the two periods. Additional operating expenses of $0.2 million, operating expenses from acquired businesses of $0.6 million, and reduced tax expense of $0.1 million resulted in adjusted net income for the period of $2.2 million. Gross profit was equal to 18.9% of sales, an increase from 2014 quarter three of 240 basis points and a decrease from 2013 quarter four of 60 basis points, resulting from mix in sales. Operating expenses excluding the impact of newly acquired businesses increased $0.2 million compared to the fourth quarter of 2013 largely from increased selling expenses. In total, adjusted SG&A in quarter four of 2014 was 11.8% of sales compared to 10.6% in the same period of 2013.
Andrew Rooke, Manitex International President and Chief Operating Officer, commented, “2014 was another year of significant progress for the Company, in an environment that continued to be challenging, particularly in the second half of the year, and where our principal market, boom and truck cranes, was adversely impacted by a slower oil and gas sector and was down approximately 8% year over year. It would not be an overstatement to say that the acquisition of the PM Group and the ASV joint venture with Terex made 2014 a transformational year for Manitex. Consistent with our legacy, we found opportunities to significantly diversify our market and geographic exposures. Operationally, the fourth quarter was an improvement from the third, as our mix of sales improved benefiting gross profit percent which came in at 18.9%, and we started with ASV operations in the last two weeks of the year.
Mr. Rooke continued, “The year was behind the levels of 2013 in terms of our profitability, but we are pleased with our long-term business position and we believe that the underlying fundamentals of our strategy are sound. In closing the two large transactions, PM and ASV, we incurred some additional debt and issued some shares. On the debt side, our projected average debt servicing cost is approximately 6%, which is very favorable for a company our size. That said, we’re conscious of this debt and our plan is to pay much of this down with cash flow we generate this year and beyond. Additional acquisition related costs are expected to be charged in the first quarter of 2015, approximating $1.3 million, and beyond that we would expect cleaner quarterly comparisons going forward.”
Mr. Langevin concluded, “We believe that 2015 will be another challenging year for the equipment sector in general although we will continue to work hard to achieve our long term growth targets. We are implementing cost saving actions that could save us approximately $4 million this year and approximately $15 million over the next three years. These benefits will assist us in margin protection and we believe we will realize further benefits from production and integration efficiencies as well as new sales opportunities resulting from the PM and ASV additions. We’re optimistic that the line of knuckle boom cranes we added form the PM Group could be a very meaningful contributor to orders and to our financial performance in 2015 and beyond, and we believe that ASV will be a significant contributor to long term value enhancement for our shareholders.”
Conference Call:
Management will host a conference call at 4:30 PM Eastern Time today to discuss the results with the investment community. Anyone interested in participating in the call should dial 1-888-430-8690 if calling within the United States or 719-325-2186 if calling internationally. A replay will be available until March 12, 2015 which can be accessed by dialing 877-870-5176 if calling within the United States or 858-384-5517 if calling internationally. Please use passcode 2115556 to access the replay. The call will also be accompanied by a webcast over the Internet with slides, which are also accessible at the Investor Relations section of the Company’s corporate website at www.manitexinternational.com.
About Manitex International, Inc.
Manitex International, Inc. is a leading worldwide provider of highly engineered specialized equipment including boom trucks, cranes, container handling equipment and reach stackers, rough terrain forklifts, and other related equipment. Our products, which are manufactured in facilities located in the USA, Canada, and Italy, are targeted to selected niche markets where their unique designs and engineering excellence fill the needs of our customers and provide a competitive advantage. We have consistently added to our portfolio of branded products and equipment both through internal development and focused acquisitions to diversify and expand our sales and profit base while remaining committed to our niche market strategy. Our brands include Manitex, CVS Ferrari, PM, Badger, Liftking, Load King, Sabre, and Valla. ASV, our Joint Venture with Terex Corporation, manufactures and sells a line of high quality compact track and skid steer loaders.
Forward-Looking Statement
Safe Harbor Statement under the U.S. Private Securities Litigation Reform Act of 1995: This release contains statements that are forward-looking in nature which express the beliefs and expectations of management including statements regarding the Company’s expected results of operations or liquidity; statements concerning projections, predictions, expectations, estimates or forecasts as to our business, financial and operational results and future economic performance; and statements of management’s goals and objectives and other similar expressions concerning matters that are not historical facts. In some cases, you can identify forward-looking statements by terminology such as “anticipate,” “estimate,” “plan,” “project,” “continuing,” “ongoing,” “expect,” “we believe,” “we intend,” “may,” “will,” “should,” “could,” and similar expressions. Such statements are based on current plans, estimates and expectations and involve a number of known and unknown risks, uncertainties and other factors that could cause the Company’s future results, performance or achievements to differ significantly from the results, performance or achievements expressed or implied by such forward-looking statements. These factors and additional information are discussed in the Company’s filings with the Securities and Exchange Commission and statements in this release should be evaluated in light of these important factors. Although we
believe that these statements are based upon reasonable assumptions, we cannot guarantee future results. Forward-looking statements speak only as of the date on which they are made, and the Company undertakes no obligation to update publicly or revise any forward-looking statement, whether as a result of new information, future developments or otherwise.
| Company Contact |
||||
| Manitex International, Inc. David Langevin Chairman and Chief Executive Officer (708) 237-2060 |
Darrow Associates Inc. Peter Seltzberg, Managing Director Investor Relations (516) 510-8768 |
MANITEX INTERNATIONAL, INC.
CONSOLIDATED STATEMENTS OF INCOME
(In thousands, except for share and per share amounts)
| Three Months Ended December 31, |
Twelve Months Ended December 31, |
|||||||||||||||
| 2014 | 2013 | 2014 | 2013 | |||||||||||||
| Unaudited | Unaudited | Unaudited | Unaudited | |||||||||||||
| Net revenues |
$ | 66,909 | $ | 65,431 | $ | 264,081 | $ | 245,072 | ||||||||
| Cost of sales |
54,308 | 52,652 | 215,817 | 198,596 | ||||||||||||
|
|
|
|
|
|
|
|
|
|||||||||
| Gross profit |
12,601 | 12,779 | 48,264 | 46,476 | ||||||||||||
| Operating expenses |
||||||||||||||||
| Research and development costs |
643 | 828 | 2,552 | 2,912 | ||||||||||||
| Selling, general and administrative expenses |
10,222 | 6,931 | 31,776 | 26,026 | ||||||||||||
|
|
|
|
|
|
|
|
|
|||||||||
| Total operating expenses |
10,865 | 7,759 | 34,328 | 28,938 | ||||||||||||
|
|
|
|
|
|
|
|
|
|||||||||
| Operating income |
1,736 | 5,020 | 13,936 | 17,538 | ||||||||||||
| Other income (expense) |
||||||||||||||||
| Interest expense |
(958 | ) | (765 | ) | (3,150 | ) | (2,946 | ) | ||||||||
| Foreign currency transaction (loss) gain |
(80 | ) | (23 | ) | (107 | ) | (95 | ) | ||||||||
| Other income |
31 | (59 | ) | (36 | ) | (50 | ) | |||||||||
|
|
|
|
|
|
|
|
|
|||||||||
| Total other expense |
(1,007 | ) | (847 | ) | (3,293 | ) | (3,091 | ) | ||||||||
|
|
|
|
|
|
|
|
|
|||||||||
| Income before income taxes |
729 | 4,173 | 10,643 | 14,447 | ||||||||||||
| Income tax |
393 | 1,182 | 3,676 | 4,269 | ||||||||||||
|
|
|
|
|
|
|
|
|
|||||||||
| Net income |
336 | 2,991 | 6,967 | 10,178 | ||||||||||||
| Add: Net loss attributable to noncontrolling interest |
136 | — | 136 | — | ||||||||||||
|
|
|
|
|
|
|
|
|
|||||||||
| $ | 472 | $ | 2,991 | $ | 7,103 | $ | 10,178 | |||||||||
|
|
|
|
|
|
|
|
|
|||||||||
| Earnings Per Share |
||||||||||||||||
| Basic |
$ | 0.03 | $ | 0.22 | $ | 0.51 | $ | 0.80 | ||||||||
| Diluted |
$ | 0.03 | $ | 0.22 | $ | 0.51 | $ | 0.80 | ||||||||
| Weighted average common share outstanding |
||||||||||||||||
| Basic |
13,980,142 | 13,760,918 | 13,858,189 | 12,671,205 | ||||||||||||
| Diluted |
14,029,205 | 13,821,352 | 13,904,289 | 12,717,575 | ||||||||||||
MANITEX INTERNATIONAL, INC.
CONSOLIDATED BALANCE SHEETS
(In thousands, except share and per share data)
| As of December 31, | ||||||||
| 2014 | 2013 | |||||||
| Unaudited | Unaudited | |||||||
| ASSETS |
||||||||
| Current assets |
||||||||
| Cash |
$ | 4,370 | $ | 6,091 | ||||
| Trade receivables (net) |
68,439 | 38,165 | ||||||
| Accounts receivable finance |
— | 326 | ||||||
| Accounts receivable from related party |
1,025 | — | ||||||
| Other receivables |
243 | 1,541 | ||||||
| Inventory (net) |
96,367 | 72,734 | ||||||
| Deferred tax asset |
1,325 | 1,272 | ||||||
| Prepaid expense and other |
1,733 | 1,669 | ||||||
|
|
|
|
|
|||||
| Total current assets |
173,502 | 121,798 | ||||||
|
|
|
|
|
|||||
| Total fixed assets (net) |
28,846 | 11,143 | ||||||
| Intangible assets (net) |
51,922 | 24,036 | ||||||
| Deferred tax asset |
2,081 | 2,117 | ||||||
| Goodwill |
50,830 | 22,489 | ||||||
| Other long-term assets |
4,176 | 1,031 | ||||||
| Investments in equity interest |
5,951 | — | ||||||
|
|
|
|
|
|||||
| Total assets |
$ | 317,308 | $ | 182,614 | ||||
|
|
|
|
|
|||||
| LIABILITIES AND SHAREHOLDERS’ EQUITY |
||||||||
| Current liabilities |
||||||||
| Notes payable—short term |
$ | 11,999 | $ | 6,910 | ||||
| Revolving credit facilities |
2,798 | 2,707 | ||||||
| Current portion of capital lease obligations |
1,631 | 1,812 | ||||||
| Accounts payable |
35,191 | 24,974 | ||||||
| Accounts payable related parties |
503 | 789 | ||||||
| Tax payable on conversion of ASV |
16,500 | — | ||||||
| Accrued expenses |
13,003 | 8,808 | ||||||
| Other current liabilities |
2,407 | 1,930 | ||||||
|
|
|
|
|
|||||
| Total current liabilities |
84,032 | 47,930 | ||||||
|
|
|
|
|
|||||
| Long-term liabilities |
||||||||
| Revolving term credit facilities |
46,457 | 37,306 | ||||||
| Notes payable |
40,088 | 2,482 | ||||||
| Capital lease obligations |
2,710 | 2,984 | ||||||
| Convertible notes |
6,611 | — | ||||||
| Deferred gain on sale of building |
1,268 | 1,648 | ||||||
| Deferred tax liability |
4,163 | 4,074 | ||||||
| Other long-term liabilities |
1,973 | 1,199 | ||||||
|
|
|
|
|
|||||
| Total long-term liabilities |
103,270 | 49,693 | ||||||
|
|
|
|
|
|||||
| Total liabilities |
187,302 | 97,623 | ||||||
|
|
|
|
|
|||||
| Commitments and contingencies |
||||||||
| Shareholders’ equity |
||||||||
| Preferred Stock—Authorized 150,000 shares, no shares issued or outstanding at December 31, 2014 and December 31, 2013 |
— | — | ||||||
| Common Stock—no par value, authorized, 20,000,000 shares issued and outstanding, 14,989,694 and 13,801,277 shares at December 31, 2014 and December 31, 2013, respectively |
82,040 | 68,554 | ||||||
| Paid in capital |
1,789 | 1,191 | ||||||
| Retained earnings |
21,960 | 14,857 | ||||||
| Accumulated other comprehensive (loss) income |
(1,023 | ) | 389 | |||||
|
|
|
|
|
|||||
| Equity attributable to shareholders of Manitex International, Inc. |
104,766 | 84,991 | ||||||
| Equity attributable to noncontrolling interest |
25,240 | — | ||||||
|
|
|
|
|
|||||
| Total Equity |
||||||||
| 130,006 | 84,991 | |||||||
|
|
|
|
|
|||||
| Total liabilities and shareholders’ equity |
$ | 317,308 | $ | 182,614 | ||||
|
|
|
|
|
|||||
MANITEX INTERNATIONAL, INC.
CONSOLIDATED STATEMENT OF CASH FLOWS
(Thousands of Dollars)
| For the years ended December 31, | ||||||||||||
| 2014 | 2013 | 2012 | ||||||||||
| Unaudited | Unaudited | Unaudited | ||||||||||
| Cash flows from operating activities: |
||||||||||||
| Net income |
$ | 6,967 | $ | 10,178 | $ | 8,077 | ||||||
| Adjustments to reconcile net income to cash provided by operating activities: |
||||||||||||
| Depreciation and amortization |
4,572 | 3,945 | 3,498 | |||||||||
| Provisions for allowance for doubtful accounts |
165 | 172 | 17 | |||||||||
| Acquisition expenses financed by the seller |
183 | — | — | |||||||||
| (Gain) loss on disposal of assets |
3 | (100 | ) | (119 | ) | |||||||
| Deferred income taxes |
(254 | ) | (168 | ) | 181 | |||||||
| Inventory reserves |
(39 | ) | 47 | 1 | ||||||||
| Reserves for uncertain tax positions |
(35 | ) | (83 | ) | 183 | |||||||
| Stock based deferred compensation |
1,104 | 664 | 226 | |||||||||
| Changes in operating assets and liabilities: |
||||||||||||
| (Increase) decrease in accounts receivable |
(13,172 | ) | 1,653 | (12,494 | ) | |||||||
| (Increase) decrease in accounts receivable finance |
315 | 271 | 378 | |||||||||
| (Increase) decrease in inventory |
(5,849 | ) | (8,852 | ) | (17,187 | ) | ||||||
| (Increase) decrease in prepaid expenses |
(58 | ) | (424 | ) | 117 | |||||||
| (Increase) decrease in other assets |
141 | (892 | ) | 11 | ||||||||
| Increase (decrease) in accounts payable |
3,125 | (4,079 | ) | 6,702 | ||||||||
| Increase (decrease) in accrued expense |
711 | (89 | ) | 2,765 | ||||||||
| Increase (decrease) in other current liabilities |
650 | (131 | ) | 1,168 | ||||||||
| Increase (decrease) in other long-term liabilities |
(30 | ) | (36 | ) | (8 | ) | ||||||
|
|
|
|
|
|
|
|||||||
| Net cash (used) provided by for operating activities |
(1,501 | ) | 2,076 | (6,484 | ) | |||||||
|
|
|
|
|
|
|
|||||||
| Cash flows from investing activities: |
||||||||||||
| Proceeds from sale of fixed assets |
— | 139 | 212 | |||||||||
| Purchase of property and equipment |
(924 | ) | (1,215 | ) | (1,125 | ) | ||||||
| Acquisition of business assets, net of cash acquired |
(24,998 | ) | (13,000 | ) | (345 | ) | ||||||
|
|
|
|
|
|
|
|||||||
| Net cash used for investing activities |
(25,922 | ) | (14,076 | ) | (1,258 | ) | ||||||
|
|
|
|
|
|
|
|||||||
| Cash flows from financing activities: |
||||||||||||
| New borrowings term loan |
— | 15,000 | — | |||||||||
| Repayment of term loan |
— | (15,000 | ) | — | ||||||||
| Net proceeds of stock offering |
12,500 | 13,927 | 3,781 | |||||||||
| Proceeds from issuance of convertible note payable |
7,500 | |||||||||||
| Borrowing on revolving credit facilities |
5,563 | 5,409 | 9,221 | |||||||||
| Net borrowings (repayments) on working capital facilities |
2,532 | (1,960 | ) | 4,181 | ||||||||
| Payment of fees related to new financing |
(519 | ) | — | — | ||||||||
| New borrowings—notes payable |
677 | 809 | 764 | |||||||||
| Note payments |
(1,060 | ) | (916 | ) | (7,884 | ) | ||||||
| Proceeds from capital leases |
942 | — | — | |||||||||
| Repayment on capital lease obligations |
(1,397 | ) | (1,185 | ) | (795 | ) | ||||||
| Excess tax benefits related to vesting of restricted stock |
22 | 86 | ||||||||||
| Shares repurchased for income tax withholding on share-based compensation |
(114 | ) | (70 | ) | — | |||||||
|
|
|
|
|
|
|
|||||||
| Net cash provided by financing activities |
26,646 | 16,100 | 9,268 | |||||||||
|
|
|
|
|
|
|
|||||||
| Effect of exchange rate change on cash |
(944 | ) | 102 | 292 | ||||||||
| Net (decrease) increase in cash and cash equivalents |
(777 | ) | 4,100 | 1,526 | ||||||||
| Cash and cash equivalents at the beginning of the year |
6,091 | 1,889 | 71 | |||||||||
|
|
|
|
|
|
|
|||||||
| Cash and cash equivalents at end of year |
$ | 4,370 | $ | 6,091 | $ | 1,889 | ||||||
|
|
|
|
|
|
|
|||||||
Supplemental Information
In an effort to provide investors with additional information regarding the Company’s results, Manitex International refers to various non-GAAP (U.S. generally accepted accounting principles) financial measures which management believes provides useful information to investors. These non-GAAP measures may not be comparable to similarly titled measures being disclosed by other companies. In addition, the Company believes that non-GAAP financial measures should be considered in addition to, and not in lieu of, GAAP financial measures. Manitex International believes that this information is useful to understanding its operating results and the ongoing performance of its underlying businesses. Management of Manitex International uses both GAAP and non–GAAP financial measures to establish internal budgets and targets and to evaluate the Company’s financial performance against such budgets and targets.
The amounts described below are unaudited, are reported in thousands of U.S. dollars, and are as of, or for the three and twelve month periods ended December 31, 2014, unless otherwise indicated.
Non-GAAP Financial Measures
This press release includes the following non-GAAP financial measures: “Adjusted EBITDA” (earnings before interest, tax, foreign exchange transaction gain / losses, other income / expense acquisition related expense and other exceptional costs and depreciation and amortization) and Adjusted Net Income. These non-GAAP terms, as defined by the Company, may not be comparable to similarly titled measures used by other companies. Neither Adjusted Net Income nor Adjusted EBITDA are a measure of financial performance under generally accepted accounting principles. Items excluded from Adjusted EBITDA and Adjusted Net Income are significant components in understanding and assessing financial performance. Adjusted EBITDA and Adjusted Net Income should not be considered in isolation or as a substitute for net earnings, operating income and other consolidated earnings data prepared in accordance with GAAP or as a measure of our profitability. A reconciliation of net income to Adjusted EBITDA and Adjusted Net Income is provided below.
The Company’s management believes that Adjusted EBITDA and Adjusted EBITDA as a percentage of sales and Adjusted Net Income represent key operating metrics for its business. Adjusted Earnings Before Interest, Taxes, foreign exchange transaction gain / losses, other income / expense, acquisition related expense and other exceptional costs and Depreciation and Amortization (Adjusted EBITDA) and Adjusted Net Income, GAAP net income adjusted for acquisition and certain other one off items are a key indicator used by management to evaluate operating performance. While Adjusted EBITDA and Adjusted Net Income are not intended to replace any presentation included in our consolidated financial statements under generally accepted accounting principles (GAAP) and should not be considered an alternative to operating performance or an alternative to cash flow as a measure of liquidity, we believe these measures are useful to investors in assessing our operating results, capital expenditure and working capital requirements and the ongoing performance of its underlying businesses. These calculations may differ in method of calculation from similarly titled measures used by other companies. A reconciliation of Adjusted EBITDA and Adjusted Net Income to GAAP financial measures for the three and twelve month periods ended December 31, 2014 and 2013 is included with this press release below and with the Company’s related Form 8-K.
Acquisition of 51% of ASV Inc.
On December 19, 2014, the Company acquired 51% of A.S.V., Inc. from Terex Corporation (“Terex”). Subsequent to the acquisition date ASV was converted to an LLC and its name was changed to A.S.V., LLC (ASV). ASV located in Grand Rapids, Minnesota manufactures a line of high quality compact rubber tracked and skid steer loaders. The ASV products will be distributed through the Terex distribution channels as well as through Manitex and other independent dealers. The products are used in the site clearing, general construction, forestry, golf course maintenance and landscaping industries, with general construction being the largest market.
ASV’s financial results are included in the Company’s consolidated results beginning on December 20, 2014.
Reconciliation of GAAP Net Income to Adjusted EBITDA (in thousands)
| Three Months Ended | Twelve Months Ended | |||||||||||||||
| December 31, 2014 |
December 31, 2013 |
December 31, 2014 |
December 31, 2013 |
|||||||||||||
| Net income |
472 | 2,991 | 7,103 | 10,178 | ||||||||||||
| Net loss attributable to noncontrolling interest |
(136 | ) | — | (136 | ) | — | ||||||||||
| Income tax |
393 | 1,182 | 3,676 | 4,269 | ||||||||||||
| Interest expense |
958 | 765 | 3,150 | 2,946 | ||||||||||||
| Foreign currency transaction losses (gain) |
80 | 23 | 107 | 95 | ||||||||||||
| Other (income) expense |
(31 | ) | 59 | 36 | 50 | |||||||||||
| Acquisition and other expense |
2,356 | — | 2,356 | — | ||||||||||||
| Depreciation & Amortization |
1,238 | 1,205 | 4,572 | 3,945 | ||||||||||||
| Adjusted Earnings before interest, taxes, depreciation and amortization (Adjusted EBITDA) |
$ | 5,330 | $ | 6,225 | $ | 20,864 | $ | 21,483 | ||||||||
| Adjusted EBITDA % to sales |
8.0 | % | 9.5 | % | 7.9 | % | 8.8 | % | ||||||||
Reconciliation of GAAP Net Income to Adjusted Net Income (in thousands)
| Three Months Ended | Twelve Months Ended | |||||||||||||||
| December 31, 2014 |
December 31, 2013 |
December 31, 2014 |
December 31, 2013 |
|||||||||||||
| Net income as reported |
472 | 2,991 | 7,103 | 10,178 | ||||||||||||
| Pre – tax acquisition and other expenses |
2,517 | — | 2,517 | — | ||||||||||||
| Tax effect based on jurisdictional blend |
(804 | ) | — | (804 | ) | — | ||||||||||
| Adjusted Net Income |
$ | 2,185 | $ | 2,991 | $ | 8,816 | $ | 10,178 | ||||||||
| Weighted average diluted shares outstanding |
14,029,205 | 13,821,352 | 13,904,289 | 12,717,575 | ||||||||||||
| Diluted earnings per share as reported |
$ | 0.03 | $ | 0.22 | $ | 0.51 | $ | 0.80 | ||||||||
| Total EPS Effect |
$ | 0.13 | — | $ | 0.12 | — | ||||||||||
| Adjusted Diluted earnings per share |
$ | 0.16 | $ | 0.22 | $ | 0.63 | $ | 0.80 | ||||||||
Acquisition and other expense
After tax expense and per share amounts (Adjusted Net Income) are calculated using pre-tax amounts, applying a tax rate based on jurisdictional rates to arrive at an after-tax amount. This number is divided by the weighted average diluted shares to provide the impact on earnings per share. The company assesses the impact of these items because when discussing earnings per share, the Company adjusts for items it believes are not reflective of operating activities in the periods.
| Fourth Quarter 2014 |
Pre-tax | After-tax | EPS | |||||||||
| Deal transaction related |
$ | 2,176 | $ | 1,481 | $ | 0.11 | ||||||
| Exceptional operating cost |
341 | 232 | 0.02 | |||||||||
|
|
|
|
|
|
|
|||||||
| Total |
$ | 2,517 | $ | 1,713 | $ | 0.12 | ||||||
There were no items adjusting Fourth Quarter 2013 or Full Year 2013
Backlog
Backlog is defined as purchase orders that have been received by the Company. The disclosure of backlog aids in the analysis the Company’s customers’ demand for product, as well as the ability of the Company to meet that demand. Backlog is not necessarily indicative of sales to be recognized in a specified future period.
| December 31, 2014 |
September 30, 2014 |
December 31, 2013 |
September 30, 2013 |
|||||||||||||
| Backlog |
$ | 107,327 | $ | 102,056 | $ | 77,281 | $ | 96,684 | ||||||||
| 12/31/2014 increase v prior period |
5.2 | % | 38.9 | % | 11.0 | % | ||||||||||
Current Ratio is calculated by dividing current assets by current liabilities.
| December 31, 2014 | December 31, 2013 | |||||||
| Current Assets |
$ | 173,502 | $ | 121,798 | ||||
| Current Liabilities |
$ | 84,032 | $ | 47,930 | ||||
| Current Ratio |
2.1 | 2.5 | ||||||
Days Sales Outstanding, (DSO), is calculated by taking the sum of net trade and related party receivables divided by annualized sales per day (sales for the quarter, multiplied by 4, and the sum divided by 365).
Days Payables Outstanding, (DPO), is calculated by taking the sum of net trade and related party payables divided by annualized cost of sales per day (cost of goods sold for the quarter, multiplied by 4, and the sum divided by 365).
Debt is calculated using the Condensed Consolidated Balance Sheet amounts for current and long term portion of long term debt, capital lease obligations, notes payable and lines of credit. Debt to Adjusted EBITDA ratio is calculated by dividing total debt at the balance sheet date by trailing twelve month Adjusted EBITDA.
| December 31, 2014 | December 31, 2013 | |||||||
| Current portion of long term debt |
11,999 | $ | 6,910 | |||||
| Current portion of capital lease obligations |
1,631 | 1,812 | ||||||
| Revolving credit facilities |
2,798 | 2,707 | ||||||
| Revolving term credit facilities |
46,457 | 37,306 | ||||||
| Notes payable – long term |
40,088 | 2,482 | ||||||
| Capital lease obligations |
2,710 | 2,984 | ||||||
| Convertible Notes |
6,611 | — | ||||||
| Debt |
$ | 112,294 | $ | 54,201 | ||||
|
|
|
|
|
|||||
| Trailing 12 month Adjusted EBITDA |
$ | 20,864 | $ | 21,483 | ||||
| Debt to Adjusted EBITDA Ratio |
5.4 | * | 2.5 | |||||
| * | The ASV acquisition has been included in the consolidated results for the period from December 20, 2014, the date of the transaction. Consequently, included in trailing twelve month adjusted EBITDA are only 12 days from December 20 to December 31 2014 therefore excluding $14.3 million in EBITDA from ASV for 2014. Full year of ASV contribution would have resulted in a Debt/Adjusted EBITDA ratio of approximately 3.2x for the year. |
Interest Cover is calculated by dividing Adjusted EBITDA (Earnings before interest, tax, foreign exchange transaction gain / losses, other income / expense and depreciation and amortization) for the trailing twelve month period (January 1 to December 31) by interest expense as reported in the Consolidated Statement of Income for the same period.
| 12 Month Period January 1, 2014 to December 31, 2014 |
12 Month Period January 1, 2013 to December 31, 2013 |
|||||||
| Adjusted EBITDA |
$ | 20,864 | $ | 21,483 | ||||
| Interest Expense |
3,150 | 2,946 | ||||||
| Interest Cover Ratio |
6.6 | 7.3 | ||||||
Inventory turns are calculated by multiplying cost of goods sold for the referenced three month period by 4 and dividing that figure by inventory as at the referenced period.
Manufacturing Expenses include manufacturing wages, salaries, fixed and variable overhead costs.
Operating Working Capital is calculated using the Consolidated Balance Sheet amounts for Trade receivables (net of allowance) plus inventories, less Accounts payable. The Company considers excessive working capital as an inefficient use of resources, and seeks to minimize the level of investment without adversely impacting the ongoing operations of the business.
| December 31, 2014 |
December 31, 2013 |
|||||||
| Trade receivables (net) |
$ | 68,439 | $ | 38,165 | ||||
| Inventory (net) |
96,367 | 72,734 | ||||||
| Less: Accounts payable |
35,694 | 25,763 | ||||||
| Total Operating Working Capital |
$ | 129,112 | $ | 85,136 | ||||
| % of Trailing Three Month Annualized Net Sales |
48.2 | % | 32.5 | % | ||||
Trailing Twelve Months Adjusted EBITDA is calculated by adding the reported Adjusted EBITDA for the past 4 quarters.
| Three Months Ended: |
Adjusted EBITDA |
|||
| March 31, 2014 |
$ | 4,722 | ||
| June 30, 2014 |
6,293 | |||
| September 30, 2014 |
4,519 | |||
| December 31, 2014 |
5,330 | |||
| Trailing Twelve Months Adjusted EBITDA |
$ | 20,864 | ||
Trailing Three Month Annualized Net Sales is calculated using the net sales for quarter, multiplied by four.
| Three Months Ended | ||||||||
| December 31, 2014 |
December 31, 2013 |
|||||||
| Net sales |
66,909 | $ | 65,431 | |||||
| Multiplied by 4 |
4 | 4 | ||||||
| Trailing Three Month Annualized Net Sales |
$ | 267,636 | $ | 261,724 | ||||
Working capital is calculated as total current assets less total current liabilities
| December 31, 2014 | December 31, 2013 | |||||||
| Total Current Assets |
$ | 173,502 | $ | 121,798 | ||||
| Less: Total Current Liabilities |
84,032 | 47,930 | ||||||
| Working Capital |
$ | 89,470 | $ | 73,868 | ||||
 “Focused manufacturer
of engineered lifting
equipment”
Manitex International, Inc.
(NASDAQ: MNTX)
Conference Call
Fourth Quarter and Full Year 2014
March 5th, 2015
Exhibit 99.2 |
 2
Forward Looking Statements &
Non GAAP Measures
“Focused manufacturer
of engineered lifting
equipment”
Safe Harbor Statement under the U.S. Private Securities Litigation Reform Act of
1995: This presentation contains statements that are forward-looking in
nature which express the beliefs and expectations of management including
statements regarding the Company’s expected results of operations or liquidity;
statements concerning projections, predictions, expectations, estimates or forecasts
as to our business, financial and operational results and future economic
performance; and statements of management’s goals and objectives and
other similar expressions concerning matters that are not historical facts. In some
cases,
you
can
identify
forward-looking
statements
by
terminology
such
as
“anticipate,”
“estimate,”
“plan,”
“project,”
“continuing,”
“ongoing,”
“expect,”
“we
believe,”
“we
intend,”
“may,”
“will,”
“should,”
“could,”
and similar expressions. Such statements are based on current plans, estimates and
expectations and involve a number of known and unknown risks, uncertainties
and other factors that could cause the Company's future results, performance
or achievements to differ significantly from the results, performance or
achievements expressed or implied by such forward-looking statements. These factors and additional
information are discussed in the Company's filings with the Securities and Exchange
Commission and statements in this presentation should be evaluated in light of
these important factors. Although we believe that these statements are based
upon reasonable assumptions, we cannot guarantee future results.
Forward-looking statements speak only as of the date on which they are made, and
the Company undertakes no obligation to update publicly or revise any
forward-looking statement, whether as a result of new information, future
developments or otherwise. Non-GAAP
Measures:
Manitex
International
from
time
to
time
refers
to
various
non-GAAP
(generally
accepted accounting principles) financial measures in this presentation.
Manitex believes that this information is useful to understanding its
operating results without the impact of special items. See Manitex’s Full
Year and Fourth Quarter 2014 Earnings Release on the Investor Relations section of our
website
www.manitexinternational.com
for
a
description
and/or
reconciliation
of
these
measures. |
 3
“Focused manufacturer
of engineered lifting
equipment”
Overview
2014 operationally was a year of many positives in an uncertain market
environment
Record sales of $264 million
Increased backlog (excluding ASV transaction) by 27%
Additional military contracts secured to provide total $75-125
million value over 5 years
Generated $1.2 million cash from operations in Q4-2014*
ASV transaction in December of 2014 and PM Group acquisition in January
of 2015 are transformative for the Company
Pro-forma 2014 revenues including PM and ASV ~$500 million
Enhanced product, end-market and geographic diversification
Market challenges from oil and gas sector demand and from euro currency
weakness (impacting translation of profit to USD)
2015 focus is integration and distribution leverage of acquisitions,
cost reduction and cash flow generation to repay debt
*Excluding ASV and transaction and other expenses |
 4
“Focused manufacturer
of engineered lifting
equipment”
Commercial Overview
2014
market
conditions
did
not
meet
original
growth
expectations
and
in
our
principal
market,
boom
trucks,
demand
was
down
almost
8%
year
over
year:
Oil and gas demand did not strengthen during the year as expected and
in Q4 there was considerable uncertainty affecting demand.
N. American general construction demand for our equipment
continued to grow at an incremental rate.
European markets continued to be adversely impacted from economic
conditions and lack of credit. CVS
however
were
able
to
exploit
certain
opportunities
in
Europe
and
internationally.
Product revenue profile changed during the year
More specialized, higher tonnage units or industry specific product
(e.g. energy) demand slowed and was replaced by lower capacity
cranes and more construction related product such as material
handling equipment. CVS container handling equipment and
distribution consistently stronger during the year. 12/31/14
Backlog of $107.3 million (12/31/13, $77.3 million): Growth of
39% over 2013 Broad based order book although boom trucks
continue to be heavily represented. 12/31/14 includes ~9% of ASV
product |
 5
Key Figures -
Annual
“Focused manufacturer
of engineered lifting
equipment”
USD thousands
2014*
2013
2012
Net sales
$264,081
$245,072
$205,249
% change in 2014 to prior period
7.8%
28.7%
Gross profit
48,287
46,476
40,464
Gross margin %
18.3%
19.0%
19.7%
Operating expenses
31,995
28,938
26,005
Adjusted Net Income
8,816
10,178
8,077
Adjusted Earnings per share
$0.63
$0.80
$0.68
Adjusted Ebitda
20,864
21,483
17,957
Adjusted Ebitda % of Sales
7.9%
8.8%
8.7%
Working capital
89,470
73,868
61,426
Current ratio
2.1
2.5
2.4
Backlog
107,327
77,281
130,352
% change in 2014 to prior period
38.9%
(40.7%)
2014 as adjusted. See reconciliation to US GAAP on appendix
|
 6
Key Figures -
Quarterly
“Focused manufacturer
of engineered lifting
equipment”
USD thousands
Q4-2014*
Q4-2013
Q3-2014
Net sales
$66,909
$65,431
66,197
% change in Q4-2014 to prior period
2.3%
1.1%
Gross profit
12,623
12,779
10,915
Gross margin %
18.9%
19.5%
16.5%
Operating expenses
8,531
7,759
7,504
Adjusted Net Income
2,185
2,991
1,768
Adjusted Earnings Per Share
$0.16
$0.22
$0.13
Adjusted Ebitda
5,330
6,225
4,519
Adjusted Ebitda % of Sales
8.0%
9.5%
6.8%
*Q4-2014 as adjusted. See reconciliation to US GAAP on appendix
|
 7
“Focused manufacturer
of engineered lifting
equipment”
2014
Adjusted Operating Performance
Full Year
Quarter ended
December 31
$m
$m
$m
$m
2013 Net income
10.2
3.0
Gross profit impact of increased sales
(2014 sales for the period less 2013 sales at 2013 gross profit
% ).
3.6
0.3
Impact from lower margin
(2014 gross profit % for the period less 2013 gross profit %
multiplied by 2014 sales for the period)
(1.8)
(0.4)
Increase / (decrease) in gross profit
1.8
(0.1)
Decrease in R&D expense
Increase in SG&A expenses
SG&A expense from acquired business
0.4
(0.5)
(2.9)
0.2
(0.4)
(0.6)
Tax
(0.2)
0.1
2014 Adjusted Net income
$8.8
$2.2 |
 8
Working Capital
“Focused manufacturer
of engineered lifting
equipment”
$000
2014
2013
2012
Working Capital
$89,470
$73,868
$61,426
Days sales outstanding (DSO)
95
53
58
Days payable outstanding (DPO)
60
45
51
Inventory turns
2.3
2.9
3.0
Current ratio
2.1
2.5
2.4
Operating working capital
129,112
85,136
74,300
Operating working capital % of
annualized LQS
48.2%
32.5%
32.9%
Working capital ratios skewed by annualized quarters sales and cost of
goods sold only include 12 days for ASV from acquisition.
Excluding impact of ASV transaction, DSO, DPO and inventory turns were
71 days, 43 days, and 3.1 days respectively
|
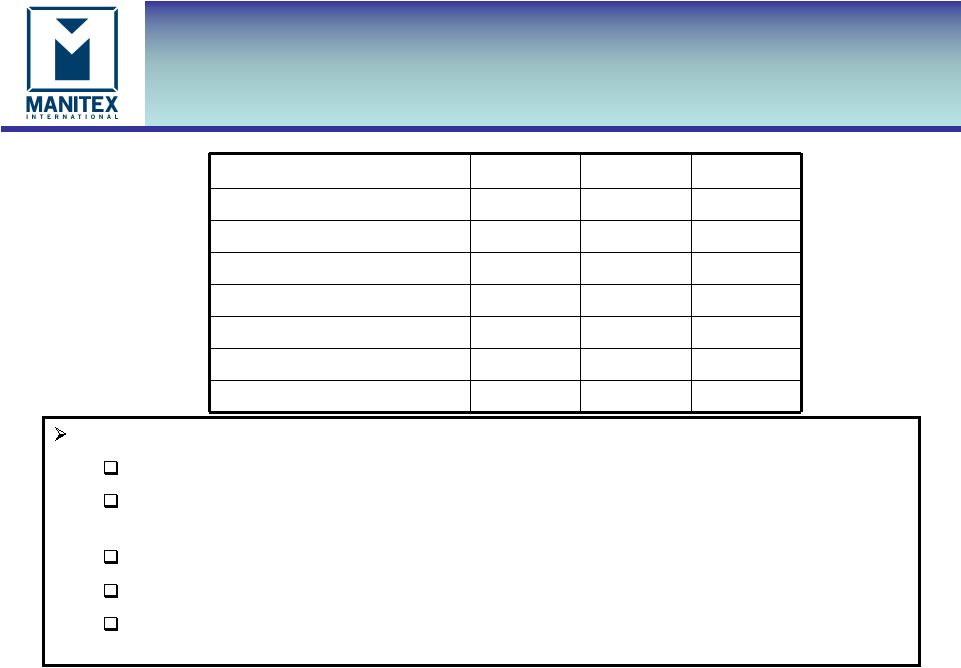 9
“Focused manufacturer
of engineered lifting
equipment”
$000
2014
2013
2012
Total Cash
4,370
6,091
1,889
Total Debt
112,294
54,201
49,138
Total Equity
130,006
84,991
59,533
Net capitalization
237,930
133,101
106,782
Net debt / capitalization
45.4%
36.2%
44.2%
Adjusted EBITDA
20,864
21,483
17,957
Adjusted EBITDA % of sales
7.9%
8.8%
8.7%
Debt at 12/31/14 includes:
Non recourse debt at ASV $43.6 million (term and revolving credit
facilities) Fair value of convertible debt for ASV transaction
$6.6 million and $1.6 million note for transaction fees paid by
Terex Manitex revolving credit facilities and Italian working
capital facilities ($53.7 million) Average Debt Cost approximates
6% Full
year
of
ASV
contribution
would
have
resulted
in
a
Debt/Adjusted
EBITDA
ratio
of
approximately
3.2x
for
the
year
Debt & Liquidity
•
Net capitalization is the sum of debt plus equity minus cash
•
Net debt is total debt less cash |
 10
Summary
“Focused manufacturer
of engineered lifting
equipment”
We
enter
2015
a
much
larger
and
more
diversified
Company
than
we
were
in 2014
Markets remain difficult to predict and uncertain, with oil and gas in
particular showing slowdown
Weaker Euro adversely impacts translation of overseas profit, but
does provide sales and margin opportunity
No. American housing starts provide opportunity for ASV
Focus for 2015:
Integration of acquisitions
Accelerate No. American production of knuckle boom product to take
advantage of growth
Leverage distribution opportunities for PM in No. America and
Manitex in PM distribution
Cost reduction and cash flow generation to repay debt
|
 11
APPENDIX
“Focused manufacturer
of engineered lifting
equipment”
Reconciliation of Adjusted net income and adjusted EPS
Reconciliation of Adjusted EBITDA to GAAP net income
Acquisition and other expense |
Serious News for Serious Traders! Try StreetInsider.com Premium Free!
You May Also Be Interested In
- XRP Price Prediction: Patient Holders Wait on $1.49 as Pepeto Buyers Chase Returns Before Listing
- BNB Price Prediction: A $1.2 Billion Burn Draws Interest, and Analysts Map a Run for Pepeto
- Top Custom and OEM Security Camera Manufacturers for Project-Based Deployments.
Create E-mail Alert Related Categories
SEC FilingsSign up for StreetInsider Free!
Receive full access to all new and archived articles, unlimited portfolio tracking, e-mail alerts, custom newswires and RSS feeds - and more!
