




Form 8-K KCG Holdings, Inc. For: Jan 29

FREE Breaking News Alerts from StreetInsider.com!
StreetInsider.com Top Tickers, 10/24/2026
- Wall Street closes lower to end rocky week
- Meta's capital-raising plans expose a major weakness in the AI boom
- Oil prices jump $3 on Houthi attacks, oil spill, highest settlement since April
- BofA flags further downside risk for stocks, yields and dollar
- SpaceX cell-site ambitions lift tower stocks and weigh on carriers
 Tweet
Tweet Share
Share E-mail
UNITED STATES
SECURITIES AND EXCHANGE COMMISSION
Washington, D.C. 20549
FORM 8-K
CURRENT REPORT
Pursuant to Section 13 or 15(d) of the
Securities Exchange Act of 1934
Date of Report (Date of earliest event reported): January 29, 2016
KCG HOLDINGS, INC.
(Exact name of registrant as specified in its charter)
| DELAWARE | 000-54991 | 38-3898306 | ||
| (State or other jurisdiction of incorporation) |
(Commission File Number) |
(IRS Employer Identification No. |
545 Washington Boulevard, Jersey City, NJ 07310
(Address of principal executive offices) (Zip Code)
(201) 222-9400
(Registrant’s telephone number, including area code)
Check the appropriate box below if the Form 8-K filing is intended to simultaneously satisfy the filing obligation of the registrant under any of the following provisions (see General Instruction A.2. below):
| ¨ | Written communications pursuant to Rule 425 under the Securities Act (17 CFR 230.425) | |
| ¨ | Soliciting material pursuant to Rule 14a-12 under the Exchange Act (17 CFR 240.14a-12) | |
| ¨ | Pre-commencement communications pursuant to Rule 14d-2(b) under the Exchange Act (17 CFR 240.14d-2(b)) | |
| ¨ | Pre-commencement communications pursuant to Rule 13e-4(c) under the Exchange Act (17 CFR 240.13e-4(c)) | |
| Item 2.02 | Results of Operation and Financial Condition |
See Item 9.01
| Item 7.01 | Regulation FD Disclosure |
The following information is furnished under Item 2.02, “Results of Operations and Financial Condition”, Item 7.01, “Regulation FD Disclosure”, and Item 9.01 “Financial Statements and Exhibits.” This information, including Exhibits 99.1 and 99.2, shall not be deemed “filed” for purposes of Section 18 of the Securities Exchange Act of 1934, as amended (the “Exchange Act”), or incorporated by reference in any filing under the Securities Act of 1933, as amended, or the Exchange Act, except as shall be expressly set forth by specific reference in such a filing.
On January 29, 2016, KCG Holdings, Inc. (the “Company” or “KCG”) issued a press release announcing its earnings for the fourth quarter of 2015. The press release did not include certain financial statements, related footnotes and certain other financial information relating to the Company that will be filed with the Securities and Exchange Commission as part of the Company’s Annual Report on Form 10-K. A copy of the press release is attached hereto as Exhibit 99.1. Executives from KCG will review the earnings via teleconference and live audio webcast at 9:00 a.m. Eastern time on January 29, 2016. A copy of a visual presentation that will be a part of that review is attached as Exhibit 99.2. Exhibits 99.1 and 99.2 are incorporated by reference into this Current Report on Form 8-K.
| Item 9.01 | Financial Statements and Exhibits |
| (a) | Financial Statements of Businesses Acquired |
| Not Applicable |
| (b) | Pro Forma Financial Information |
| Not Applicable |
| (c) | Shell Company Transactions |
| Not Applicable |
| (d) | Exhibits |
| Exhibit 99.1 – Press Release of KCG Holdings, Inc., dated January 29, 2016. |
| Exhibit 99.2 – KCG Holdings, Inc. Earnings Presentation, dated January 29, 2016. |
SIGNATURE
Pursuant to the requirements of the Securities Exchange Act of 1934, the Registrant has duly caused this report to be signed on its behalf by the undersigned’s duly authorized signatory.
Dated: January 29, 2016
| KCG HOLDINGS, INC. | ||
| By: |
/s/ John McCarthy | |
|
| ||
| Name: |
John McCarthy | |
| Title: |
General Counsel | |
EXHIBIT INDEX
| Exhibit No. |
Description | |
| 99.1 | Press Release of KCG Holdings, Inc., dated January 29, 2016. | |
| 99.2 | KCG Holdings, Inc. Earnings Presentation, dated January 29, 2016. | |
Exhibit 99.1
KCG ANNOUNCES CONSOLIDATED LOSS OF $0.05 PER DILUTED SHARE
FOR THE FOURTH QUARTER OF 2015
KCG reports consolidated revenues of $262.7 million
and pre-tax loss of $7.1 million for the quarter
KCG increases tangible book value to $14.89 per share
and book value to $16.00 per share
JERSEY CITY, New Jersey – January 29, 2016 – KCG Holdings, Inc. (NYSE: KCG) today reported a consolidated loss of $4.6 million, or $0.05 per diluted share, for the fourth quarter of 2015. The fourth quarter consolidated loss includes a net tax benefit of approximately $1.3 million or $0.01 per diluted share primarily related to federal tax credits.
KCG also reported a pre-tax loss of $7.1 million. Included in this pre-tax loss are $19.8 million of gains on the sales of investments, $17.4 million of writedowns primarily related to assets of businesses held for sale and $3.2 million of writedowns of investments. Excluding these items, on a non-GAAP basis, fourth quarter 2015 pre-tax loss was $6.2 million. A reconciliation of GAAP to non-GAAP results is included in Exhibit 4.
| Select Financial Results | ($ in thousands, except EPS) | |||||||||||
| From Continuing Operations |
4Q15 | 3Q15 | 4Q14 | |||||||||
| GAAP Revenues |
262,661 | 377,036 | 346,139 | |||||||||
| Non-GAAP revenues* |
246,134 | 377,036 | 344,023 | |||||||||
| Trading revenues, net |
145,959 | 277,677 | 221,415 | |||||||||
| Commissions and fees |
94,315 | 95,027 | 117,326 | |||||||||
| GAAP pre-tax (loss) income |
(7,096 | ) | 35,419 | 26,531 | ||||||||
| GAAP EPS |
(0.05 | ) | 0.24 | 0.23 | ||||||||
| Non-GAAP pre-tax (loss) income* |
(6,220 | ) | 69,448 | 30,532 | ||||||||
| * | See Exhibit 4 for a reconciliation of GAAP to non-GAAP results |
Fourth Quarter Highlights
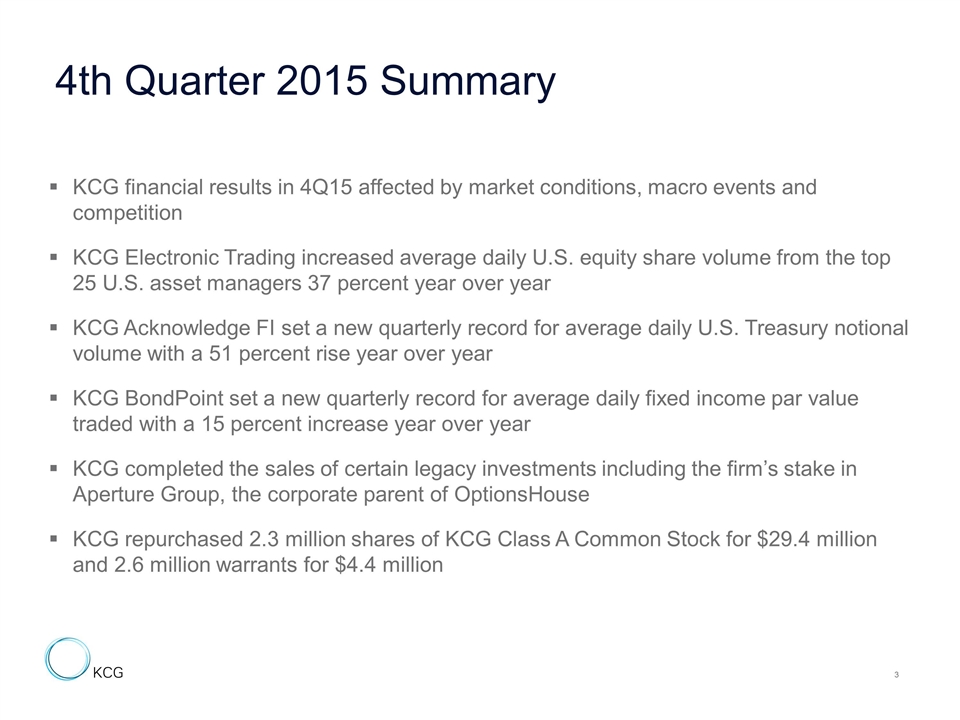
| • | KCG Electronic Trading increased average daily U.S. equity share volume from the 25 largest U.S. asset managers 37 percent year over year |
| • | KCG Acknowledge FI set a new quarterly record for average daily U.S. Treasury notional volume with a 51 percent rise year over year |
| • | KCG BondPoint set a new quarterly record for average daily fixed income par value traded with a 15 percent increase year over year |
| • | KCG completed the sales of investments including Aperture Group, the corporate parent of OptionsHouse |
| • | KCG repurchased 2.3 million shares of KCG Class A Common Stock for $29.4 million and 2.6 million warrants for $4.4 million |
Daniel Coleman, Chief Executive Officer of KCG, said, “KCG’s financial results for the fourth quarter of 2015 reflect a more difficult operating environment for market making due largely to macro market events as well as competitive pressures in U.S. equity wholesaling. In the fourth
quarter, we made progress in growing KCG Electronic Trading among the largest U.S. asset managers. In addition, we continued to execute on our program of returning excess capital to our stockholders when conditions warrant.”
Full Year 2015
In 2015, KCG continued to build an intermediary firm capable of directly addressing the urgent need for liquidity across the global securities markets through principal and agency-based trading. A renewed focus on strategic clients contributed to a market share gain in retail U.S. equity order flow from brokers as well as increased algorithmic U.S. equity share volume from asset managers year over year. In terms of cost control, KCG reduced non-GAAP, non-transaction-based expenses by $60.2 million or 7.6 percent from a year ago (Exhibit 4). Following a strategic review of assets, the firm sold KCG Hotspot in the first quarter of 2015. The firm allocated a significant portion of available free cash toward capital return, repurchasing 27.0 million shares of KCG Class A Common Stock for $371.7 million, equivalent to approximately 23 percent of all shares outstanding at the beginning of 2015. For the year, KCG increased tangible book value by $3.17 to $14.89 per share and book value by $2.97 to $16.00 per share.
Mr. Coleman commented, “As the year came to a close, KCG initiated a more fundamental reengineering of operations. Preparations are underway to achieve greater efficiencies from the front to the back office. In addition, we’re consolidating corporate headquarters in lower Manhattan to facilitate greater collaboration across teams. In the coming year, we’ll focus on that which we can control in terms of reducing costs, adding scale and continuing the capital return program as we work to achieve a double-digit return on equity in 2017.”
Market Making
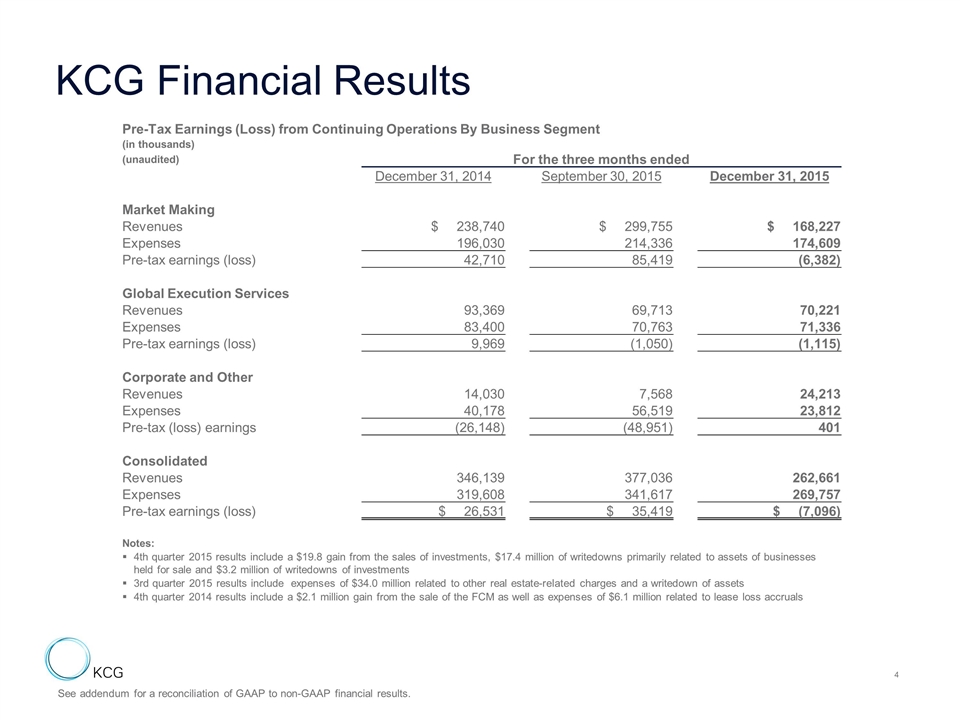
The Market Making segment encompasses direct-to-client and non-client, exchange-based market making across multiple asset classes and is an active participant in all major cash, options and futures markets in the U.S., Europe and Asia. During the fourth quarter of 2015, the segment generated total revenues of $168.2 million and a pre-tax loss of $6.4 million. Excluding charges related to asset writedowns of $15.5 million, the segment generated non-GAAP pre-tax income of $9.1 million.
During the fourth quarter of 2015, average daily consolidated U.S. equity dollar volume along with U.S. equity futures and options contracts declined year over year. In addition, market-wide gross retail U.S. equity dollar volume decreased an estimated 21.8 percent from a year ago, which negatively affected KCG direct-to-client market making. Despite the operating environment, KCG gained market share of retail order flow from leading U.S. brokers year over year amid continued strong competition. The results for the segment were also affected by the deterioration in market volumes of U.S. Treasuries and foreign exchange from a year ago as well as macro events affecting Asian equities.
Mr. Coleman commented, “The decline in consolidated U.S. equity market volumes and volatility was exacerbated by continuing strong competition, tight spreads and the weakest quarterly gross retail dollar volume in a year and a half. Retail investors pulled money from the U.S. equity market in December and we saw evidence of institutional-size portfolio liquidations late in the quarter. In fixed income market making, KCG Acknowledge FI set a new quarterly record for average daily U.S. Treasury notional volume with a 51 percent rise year over year despite a decline in market volumes.”
In the third quarter of 2015, the segment generated total revenues of $299.8 million and pre-tax income of $85.4 million. Excluding expenses related to asset writedowns of $4.4 million, the segment generated non-GAAP pre-tax income of $89.8 million.
In the fourth quarter of 2014, the segment generated total revenues of $238.7 million and pre-tax income of $42.7 million.
Select Trade Statistics: U.S. Equity Market Making
| 4Q15 | 3Q15 | 4Q14 | ||||||||||
| Average daily dollar volume traded ($ millions) |
28,842 | 31,517 | 31,621 | |||||||||
| Average daily trades (thousands) |
3,667 | 4,025 | 4,036 | |||||||||
| Average daily shares traded (millions) |
4,698 | 4,823 | 5,241 | |||||||||
| NYSE and NASDAQ shares traded |
922 | 985 | 933 | |||||||||
| OTC Bulletin Board and OTC Market shares traded |
3,775 | 3,838 | 4,308 | |||||||||
| Average revenue capture per U.S. equity dollar value traded (bps) |
0.77 | 1.27 | 0.93 | |||||||||
Global Execution Services
The Global Execution Services segment comprises agency execution services and trading venues. During the fourth quarter of 2015, the segment generated total revenues of $70.2 million and pre-tax loss of $1.1 million. Excluding a writedown of goodwill of $0.9 million, the segment generated a non-GAAP pre-tax loss of $0.2 million.
During the fourth quarter of 2015, institutional trading activity in U.S. equities and ETFs declined year over year given the uncertain market outlook. The sustained domestic equity mutual fund outflows during the course of the year presaged to an extent the change in investment sentiment. Despite the environment, KCG grew average daily algorithmic U.S. equity share volume from the 25 largest U.S. asset managers 37 percent from a year ago. In addition, KCG BondPoint grew average daily fixed income par value traded 15.1 percent from a year ago.
Mr. Coleman commented, “During the quarter, we continued to deepen relationships with the leading U.S. asset managers, which account for a disproportionate amount of institutional trading activity. KCG Electronic Trading offers algorithms that leverage the firm’s exceptional intellectual capital, trading models, technology and data to generate alpha on behalf of clients. During the quarter, KCG BondPoint produced a new quarterly record for fixed income trade volume by continually providing the leading U.S. brokers with effective price discovery, centralized liquidity, cost-efficient trade execution and best execution for the retail investor.”
In the third quarter of 2015, the segment generated total revenues of $69.7 million and a pre-tax loss of $1.1 million.
In the fourth quarter of 2014, which included the results of KCG Hotspot which was sold in the first quarter of 2015, the segment generated total revenues of $93.4 million and pre-tax income of $10.0 million. Excluding a gain of $2.1 million related to the completion of the sale of the FCM, the segment generated non-GAAP pre-tax income of $7.9 million.
Select Trade Statistics: Agency Execution and Trading Venues
| 4Q15 | 3Q15 | 4Q14 | ||||||||||
| Average daily KCG algorithmic trading and order routing U.S. equities shares traded (millions) |
311.7 | 316.8 | 334.3 | |||||||||
| Average daily KCG BondPoint fixed income par value traded ($ millions) |
150.7 | 130.5 | 130.8 | |||||||||
Corporate and Other
The Corporate and Other segment includes strategic investments and corporate overhead expenses. During the fourth quarter of 2015, the segment generated total revenues of $24.2 million and pre-tax income of $0.4 million. Excluding gains on sales and writedowns of investments of $19.8 million and $3.2 million, respectively and a $1.0 million writedown of an intangible asset, the segment generated a non-GAAP pre-tax loss of $15.1 million.
In the third quarter of 2015, the segment generated total revenues of $7.6 million and a pre-tax loss of $49.0 million. Excluding the writedown of assets and other real estate related charges of $29.7 million, the segment generated a non-GAAP pre-tax loss of $19.3 million in the third quarter.
In the fourth quarter of 2014, the segment generated total revenues of $14.0 million and a pre-tax loss of $26.1 million. Excluding lease loss expenses of $6.1 million, the segment generated a non-GAAP pre-tax loss of $20.0 million.
Financial Condition
As of December 31, 2015, KCG had $581.3 million in cash and cash equivalents. Total outstanding debt was $495.6 million. KCG had $1.44 billion in stockholders’ equity, equivalent to a book value of $16.00 per share and tangible book value, which includes the value of its assets of businesses held for sale, of $14.89 per share based on total shares outstanding of 90.2 million, including restricted stock units.
KCG’s headcount was 1,006 full-time employees at December 31, 2015 compared to 1,033 at September 30, 2015.
During the fourth quarter of 2015, KCG repurchased 2.3 million shares for approximately $29.4 million and 2.6 million warrants for $4.4 million under the Company’s stock repurchase program.
Management from time to time conducts a strategic review of its businesses and evaluates their potential value in the marketplace relative to their current and expected returns. As a result of such a review, KCG determined that certain of its businesses are no longer considered core to its strategy, and KCG is currently seeking the opportunity to exit or divest of these businesses. KCG believes that this current course of action does not represent a strategic shift that will have a major effect on its operations and financial results, but does meet the requirements to be considered held-for-sale at December 31, 2015. As part of this review, KCG determined that the carrying value of certain assets that are considered held for sale exceeded their fair value, and, as a result, recorded a charge totaling $16.3 million as it relates to such held-for-sale businesses. The fair value of such assets, of $24.7 million, are included within assets of businesses held-for-sale on the December 31, 2015 Statement of Financial Condition. In aggregate, these businesses accounted for less than 1.5% of consolidated revenues in 2015.
Conference Call
KCG will hold a conference call to discuss fourth quarter 2015 financial results starting at 9:00 a.m. Eastern Time today, January 29, 2016. To access the call, dial 800-967-0627 (domestic) or 913-312-0689 (international) and enter passcode 749088. In addition, the call will be webcast at http://edge.media-server.com/m/p/xge9rvfo. Following the conclusion of the call, a replay will be available by selecting a number based on country of origin from a list posted at: https://replaynumbers.conferencinghub.com/index.aspx?confid=749088&passcode=749088 and entering passcode 749088.
Additional information for investors, including a presentation of the fourth quarter financial results, can be found at http://investors.kcg.com.
Non-GAAP Financial Presentations
KCG believes that certain non-GAAP financial presentations, when taken into consideration with the corresponding GAAP financial presentations, are important in understanding operating results. Selected financial information is included in the non-GAAP financial presentations for the three months ended December 31, 2015, September 30, 2015 and December 31, 2014 and for the years ended December 31, 2015 and December 31, 2014. KCG believes the presentations provide a meaningful summary of revenues and results of operations for each of the three and twelve month periods. Reconciliations of GAAP to non-GAAP results are included in the schedules in Exhibit 4.
About KCG
KCG is a leading independent securities firm offering investors and clients a range of services designed to address trading needs across asset classes, product types and time zones. The firm combines advanced technology with exceptional client service across market making, agency execution and venues. KCG has multiple access points to trade global equities, fixed income, currencies and commodities via voice or automated execution. www.kcg.com
Certain statements contained herein may constitute “forward-looking statements” within the meaning of the safe harbor provisions of the U.S. Private Securities Litigation Reform Act of 1995. Forward-looking statements are typically identified by words such as “believe,” “expect,” “anticipate,” “intend,” “target,” “estimate,” “continue,” “positions,” “prospects” or “potential,” by future conditional verbs such as “will,” “would,” “should,” “could” or “may,” or by variations of such words or by similar expressions. These “forward-looking statements” are not historical facts and are based on current expectations, estimates and projections about KCG’s industry, management’s beliefs and certain assumptions made by management, many of which, by their nature, are inherently uncertain and beyond our control. Any forward-looking statement contained herein speaks only as of the date on which it is made. Accordingly, readers are cautioned that any such forward-looking statements are not guarantees of future performance and are subject to certain risks, uncertainties and assumptions that are difficult to predict including, without limitation, risks associated with: (i) the inability to manage trading strategy performance and sustain revenue and earnings growth; (ii) the sale of KCG Hotspot; (iii) changes in market structure, legislative, regulatory or financial reporting rules, including the increased focus by Congress, federal and state regulators, the SRO’s and the media on market structure issues, and in particular, the scrutiny of high frequency trading, alternative trading systems, market fragmentation, colocation, access to market data feeds, and remuneration arrangements such as payment for order flow and exchange fee structures; (iv) past or future changes to KCG’s organizational structure and management; (v) KCG’s ability to develop competitive new products and services in a timely manner and the acceptance of such products and services by KCG’s customers and potential customers; (vi) KCG’s ability to keep up with technological changes; (vii) KCG’s ability to effectively identify and manage market risk, operational and technology risk, cybersecurity risk, legal risk, liquidity risk, reputational risk, counterparty and credit risk, international risk, regulatory risk, and compliance risk; (viii) the cost and other effects of material contingencies, including litigation contingencies, and any adverse judicial, administrative or arbitral rulings or proceedings; (ix) the effects of increased competition and KCG’s ability to maintain and expand market share; (x) the announced plan to relocate KCG’s global headquarters from Jersey City, NJ to New York, NY; and (xi) KCG’s ability to complete the sale or disposition of any or all of the assets or businesses that are classified as held for sale. The list above is not exhaustive. Because forward looking statements involve risks and uncertainties, the actual results and performance of KCG may materially differ from the results expressed or implied by such statements. Given these uncertainties, readers are cautioned not to place undue reliance on such forward-looking statements. Unless otherwise required by law, KCG also disclaims any obligation to update its view of any such risks or uncertainties or to announce publicly the result of any revisions to the forward-looking statements made herein. Readers should carefully review the risks and uncertainties disclosed in KCG’s reports with the U.S. Securities and Exchange Commission (“SEC”), including those detailed under “Certain Factors Affecting Results of Operations” in the MD&A and in “Risk Factors” in Part I, Item 1A of KCG ‘s Annual Report on Form 10-K for the year ended December 31, 2014, and in Part II, Item 1A of the Company’s Quarterly Report on Form 10-Q for the quarter ended September 30, 2015, and in other reports or documents KCG files with, or furnishes to, the SEC from time to time. This information should be read in conjunction with KCG’s Consolidated Financial Statements and the Notes thereto contained in the Quarterly Report on Form 10-Q for the quarter-ended September 30, 2015, and in other reports or documents KCG files with, or furnishes to, the SEC from time to time.
CONTACTS
| Sophie Sohn | Jonathan Mairs | |
| Communications & Marketing | Investor Relations | |
| 312-931-2299 | 201-356-1529 | |
| [email protected] | [email protected] |
| KCG HOLDINGS, INC. | Exhibit 1 | |||
| CONSOLIDATED STATEMENTS OF OPERATIONS | ||||
| (Unaudited) |
| For the three months ended | ||||||||||||
| December 31, 2015 | September 30, 2015 | December 31, 2014 | ||||||||||
| (In thousands, except per share amounts) | ||||||||||||
| Revenues |
||||||||||||
| Trading revenues, net |
$ | 145,959 | $ | 277,677 | $ | 221,415 | ||||||
| Commissions and fees |
94,315 | 95,027 | 117,326 | |||||||||
| Interest, net |
(429 | ) | (1,080 | ) | (177 | ) | ||||||
| Investment income and other, net |
22,816 | 5,412 | 7,575 | |||||||||
|
|
|
|
|
|
|
|||||||
| Total revenues |
262,661 | 377,036 | 346,139 | |||||||||
|
|
|
|
|
|
|
|||||||
| Expenses |
||||||||||||
| Employee compensation and benefits |
67,823 | 121,597 | 116,214 | |||||||||
| Execution and clearance fees |
66,613 | 67,502 | 82,377 | |||||||||
| Communications and data processing |
36,003 | 35,256 | 36,945 | |||||||||
| Depreciation and amortization |
25,077 | 23,813 | 21,224 | |||||||||
| Payments for order flow |
14,464 | 17,121 | 14,698 | |||||||||
| Debt interest expense |
9,186 | 9,117 | 7,721 | |||||||||
| Collateralized financing interest |
8,746 | 8,617 | 7,973 | |||||||||
| Occupancy and equipment rentals |
7,842 | 7,472 | 8,514 | |||||||||
| Professional fees |
5,774 | 4,406 | 5,695 | |||||||||
| Business development |
1,751 | 1,846 | 2,308 | |||||||||
| Writedown of assets and other real estate related charges |
17,404 | 34,029 | 6,117 | |||||||||
| Other |
9,074 | 10,841 | 9,822 | |||||||||
|
|
|
|
|
|
|
|||||||
| Total expenses |
269,757 | 341,617 | 319,608 | |||||||||
|
|
|
|
|
|
|
|||||||
| (Loss) income from continuing operations before income taxes |
(7,096 | ) | 35,419 | 26,531 | ||||||||
| Income tax (benefit) expense |
(2,500 | ) | 13,482 | 562 | ||||||||
|
|
|
|
|
|
|
|||||||
| (Loss) income from continuing operations, net of tax |
(4,596 | ) | 21,937 | 25,969 | ||||||||
| Loss from discontinued operations, net of tax |
— | — | 165 | |||||||||
|
|
|
|
|
|
|
|||||||
| Net (loss) income |
$ | (4,596 | ) | $ | 21,937 | $ | 26,134 | |||||
|
|
|
|
|
|
|
|||||||
| Basic (loss) earnings per share from continuing operations |
$ | (0.05 | ) | $ | 0.24 | $ | 0.24 | |||||
|
|
|
|
|
|
|
|||||||
| Diluted (loss) earnings per share from continuing operations |
$ | (0.05 | ) | $ | 0.24 | $ | 0.23 | |||||
|
|
|
|
|
|
|
|||||||
| Basic loss per share from discontinued operations |
$ | — | $ | — | $ | — | ||||||
|
|
|
|
|
|
|
|||||||
| Diluted loss per share from discontinued operations |
$ | — | $ | — | $ | — | ||||||
|
|
|
|
|
|
|
|||||||
| Basic (loss) earnings per share |
$ | (0.05 | ) | $ | 0.24 | $ | 0.24 | |||||
|
|
|
|
|
|
|
|||||||
| Diluted (loss) earnings per share |
$ | (0.05 | ) | $ | 0.24 | $ | 0.23 | |||||
|
|
|
|
|
|
|
|||||||
| Shares used in computation of basic earnings (loss) per share |
89,184 | 91,134 | 109,654 | |||||||||
|
|
|
|
|
|
|
|||||||
| Shares used in computation of diluted earnings (loss) per share |
89,184 | 92,079 | 112,224 | |||||||||
|
|
|
|
|
|
|
|||||||
| KCG HOLDINGS, INC. | Exhibit 1 | |||
| CONSOLIDATED STATEMENTS OF OPERATIONS | (Continued | ) | ||
| (Unaudited) |
| For the years ended | ||||||||
| December 31, 2015 | December 31, 2014 | |||||||
| (In thousands, except per share amounts) | ||||||||
| Revenues |
||||||||
| Trading revenues, net |
$ | 803,181 | 837,357 | |||||
| Commissions and fees |
376,673 | 437,022 | ||||||
| Interest, net |
(2,128 | ) | 621 | |||||
| Investment income and other, net |
420,009 | 41,232 | ||||||
|
|
|
|
|
|||||
| Total revenues |
1,597,735 | 1,316,232 | ||||||
|
|
|
|
|
|||||
| Expenses |
||||||||
| Employee compensation and benefits |
405,609 | 437,269 | ||||||
| Execution and clearance fees |
265,186 | 305,177 | ||||||
| Communications and data processing |
139,263 | 150,595 | ||||||
| Depreciation and amortization |
90,231 | 81,448 | ||||||
| Payments for order flow |
61,741 | 70,183 | ||||||
| Debt interest expense |
36,755 | 32,456 | ||||||
| Collateralized financing interest |
34,678 | 27,860 | ||||||
| Occupancy and equipment rentals |
30,128 | 32,707 | ||||||
| Professional fees |
27,055 | 25,596 | ||||||
| Business development |
8,479 | 9,763 | ||||||
| Debt extinguishment charges |
25,006 | 9,552 | ||||||
| Writedown of assets and other real estate related charges |
57,892 | 8,625 | ||||||
| Other |
38,375 | 39,814 | ||||||
|
|
|
|
|
|||||
| Total expenses |
1,220,398 | 1,231,045 | ||||||
|
|
|
|
|
|||||
| Income from continuing operations before income taxes |
377,337 | 85,187 | ||||||
| Income tax expense |
129,857 | 22,753 | ||||||
|
|
|
|
|
|||||
| Income from continuing operations, net of tax |
247,480 | 62,434 | ||||||
| Loss from discontinued operations, net of tax |
— | (1,332 | ) | |||||
|
|
|
|
|
|||||
| Net Income |
$ | 247,480 | $ | 61,102 | ||||
|
|
|
|
|
|||||
| Basic earnings per share from continuing operations |
$ | 2.46 | $ | 0.55 | ||||
|
|
|
|
|
|||||
| Diluted earnings per share from continuing operations |
$ | 2.40 | $ | 0.54 | ||||
|
|
|
|
|
|||||
| Basic loss per share from discontinued operations |
$ | — | $ | (0.01 | ) | |||
|
|
|
|
|
|||||
| Diluted loss per share from discontinued operations |
$ | — | $ | (0.01 | ) | |||
|
|
|
|
|
|||||
| Basic earnings per share |
$ | 2.46 | $ | 0.54 | ||||
|
|
|
|
|
|||||
| Diluted earnings per share |
$ | 2.40 | $ | 0.52 | ||||
|
|
|
|
|
|||||
| Shares used in computation of basic earnings (loss) per share |
100,437 | 112,854 | ||||||
|
|
|
|
|
|||||
| Shares used in computation of diluted earnings (loss) per share |
102,922 | 116,534 | ||||||
|
|
|
|
|
|||||
| KCG HOLDINGS, INC. | Exhibit 2 | |||
| CONSOLIDATED STATEMENTS OF FINANCIAL CONDITION | ||||
| (In thousands) | ||||
| (Unaudited) |
| December 31, 2015 | December 31, 2014 | |||||||
| ASSETS |
||||||||
| Cash and cash equivalents |
$ | 581,313 | $ | 578,768 | ||||
| Cash and cash equivalents segregated under federal and other regulations |
3,000 | 3,361 | ||||||
| Financial instruments owned, at fair value: |
||||||||
| Equities |
2,129,208 | 2,479,910 | ||||||
| Listed options |
178,360 | 144,586 | ||||||
| Debt securities |
136,387 | 82,815 | ||||||
| Other financial instruments |
445 | 60 | ||||||
|
|
|
|
|
|||||
| Total financial instruments owned, at fair value |
2,444,400 | 2,707,371 | ||||||
| Collateralized agreements: |
||||||||
| Securities borrowed |
1,636,284 | 1,632,062 | ||||||
| Receivable from brokers, dealers and clearing organizations |
681,211 | 1,188,833 | ||||||
| Fixed assets and leasehold improvements, less accumulated depreciation and amortization |
94,858 | 134,051 | ||||||
| Investments |
98,943 | 100,726 | ||||||
| Goodwill and Intangible assets, less accumulated amortization |
100,471 | 152,594 | ||||||
| Deferred tax asset, net |
151,703 | 154,759 | ||||||
| Income taxes receivable |
18,054 | 17,771 | ||||||
| Assets of businesses held for sale |
24,749 | 40,484 | ||||||
| Other assets |
215,943 | 119,874 | ||||||
|
|
|
|
|
|||||
| Total assets |
$ | 6,050,929 | $ | 6,830,654 | ||||
|
|
|
|
|
|||||
| LIABILITIES & EQUITY |
||||||||
| Liabilities |
||||||||
| Financial instruments sold, not yet purchased, at fair value: |
||||||||
| Equities |
$ | 1,856,171 | $ | 2,069,342 | ||||
| Listed options |
151,893 | 115,362 | ||||||
| Debt securities |
105,340 | 101,003 | ||||||
|
|
|
|
|
|||||
| Total financial instruments sold, not yet purchased, at fair value |
2,113,404 | 2,285,707 | ||||||
| Collateralized financings: |
||||||||
| Securities loaned |
463,377 | 707,744 | ||||||
| Financial instruments sold under agreements to repurchase |
954,902 | 933,576 | ||||||
|
|
|
|
|
|||||
| Total collateralized financings |
1,418,279 | 1,641,320 | ||||||
| Payable to brokers, dealers and clearing organizations |
273,805 | 676,089 | ||||||
| Payable to customers |
17,387 | 22,110 | ||||||
| Accrued compensation expense |
154,547 | 114,559 | ||||||
| Accrued expenses and other liabilities |
135,401 | 143,677 | ||||||
| Liabilities of businesses held for sale |
— | 2,356 | ||||||
| Debt |
495,632 | 422,259 | ||||||
|
|
|
|
|
|||||
| Total liabilities |
4,608,455 | 5,308,077 | ||||||
|
|
|
|
|
|||||
| Equity |
||||||||
| Class A Common Stock |
1,060 | 1,275 | ||||||
| Additional paid-in capital |
1,436,671 | 1,369,298 | ||||||
| Retained earnings |
190,496 | 272,780 | ||||||
| Treasury stock, at cost |
(186,103 | ) | (122,909 | ) | ||||
| Accumulated other comprehensive income |
350 | 2,133 | ||||||
|
|
|
|
|
|||||
| Total equity |
1,442,474 | 1,522,577 | ||||||
|
|
|
|
|
|||||
| Total liabilities and equity |
$ | 6,050,929 | $ | 6,830,654 | ||||
|
|
|
|
|
|||||
| KCG HOLDINGS, INC. | Exhibit 3 |
PRE-TAX EARNINGS (LOSS) FROM CONTINUING OPERATIONS BY BUSINESS SEGMENT*
(In thousands)
(Unaudited)
| For the three months ended | ||||||||||||
| December 31, 2015 | September 30, 2015 | December 31, 2014 | ||||||||||
| Market Making |
||||||||||||
| Revenues |
$ | 168,227 | $ | 299,755 | $ | 238,740 | ||||||
| Expenses |
174,609 | 214,336 | 196,030 | |||||||||
|
|
|
|
|
|
|
|||||||
| Pre-tax earnings (loss) |
(6,382 | ) | 85,419 | 42,710 | ||||||||
|
|
|
|
|
|
|
|||||||
| Global Execution Services |
||||||||||||
| Revenues |
70,221 | 69,713 | 93,369 | |||||||||
| Expenses |
71,336 | 70,763 | 83,400 | |||||||||
|
|
|
|
|
|
|
|||||||
| Pre-tax earnings (loss) |
(1,115 | ) | (1,050 | ) | 9,969 | |||||||
|
|
|
|
|
|
|
|||||||
| Corporate and Other |
||||||||||||
| Revenues |
24,213 | 7,568 | 14,030 | |||||||||
| Expenses |
23,812 | 56,519 | 40,178 | |||||||||
|
|
|
|
|
|
|
|||||||
| Pre-tax earnings (loss) |
401 | (48,951 | ) | (26,148 | ) | |||||||
|
|
|
|
|
|
|
|||||||
| Consolidated |
||||||||||||
| Revenues |
262,661 | 377,036 | 346,139 | |||||||||
| Expenses |
269,757 | 341,617 | 319,608 | |||||||||
|
|
|
|
|
|
|
|||||||
| Pre-tax earnings (loss) |
$ | (7,096 | ) | $ | 35,419 | $ | 26,531 | |||||
|
|
|
|
|
|
|
|||||||
| * | Totals may not add due to rounding. |
| KCG HOLDINGS, INC. | Exhibit 3 (Continued) |
PRE-TAX EARNINGS (LOSS) FROM CONTINUING OPERATIONS BY BUSINESS SEGMENT*
(In thousands)
(Unaudited)
| For the twelve months ended | ||||||||
| December 31, 2015 | December 31, 2014 | |||||||
| Market Making |
||||||||
| Revenues |
$ | 884,858 | $ | 901,152 | ||||
| Expenses |
762,080 | 754,439 | ||||||
|
|
|
|
|
|||||
| Pre-tax earnings |
122,778 | 146,713 | ||||||
|
|
|
|
|
|||||
| Global Execution Services |
||||||||
| Revenues |
667,723 | 345,710 | ||||||
| Expenses |
298,766 | 334,654 | ||||||
|
|
|
|
|
|||||
| Pre-tax earnings |
368,957 | 11,056 | ||||||
|
|
|
|
|
|||||
| Corporate and Other |
||||||||
| Revenues |
45,154 | 69,369 | ||||||
| Expenses |
159,552 | 141,951 | ||||||
|
|
|
|
|
|||||
| Pre-tax loss |
(114,398 | ) | (72,582 | ) | ||||
|
|
|
|
|
|||||
| Consolidated |
||||||||
| Revenues |
1,597,735 | 1,316,232 | ||||||
| Expenses |
1,220,398 | 1,231,045 | ||||||
|
|
|
|
|
|||||
| Pre-tax earnings |
$ | 377,337 | $ | 85,187 | ||||
|
|
|
|
|
|||||
| * | Totals may not add due to rounding. |
| KCG HOLDINGS, INC. | Exhibit 4 | |||
| Regulation G Reconciliation of Non-GAAP financial measures (Continuing operations)* | ||||
| (in thousands) | ||||
| (Unaudited) |
| Three months ended December 31, 2015 |
Market Making | Global Execution Services |
Corporate and Other | Consolidated | ||||||||||||
| Reconciliation of GAAP Revenues to Non-GAAP Revenues: |
||||||||||||||||
| GAAP Revenues |
$ | 168,227 | $ | 70,221 | $ | 24,213 | $ | 262,661 | ||||||||
| Gain on sales of investments |
— | — | (19,751 | ) | (19,751 | ) | ||||||||||
| Writedowns of investments |
— | — | 3,224 | 3,224 | ||||||||||||
|
|
|
|
|
|
|
|
|
|||||||||
| Non- GAAP Revenues |
$ | 168,227 | $ | 70,221 | $ | 7,686 | $ | 246,134 | ||||||||
|
|
|
|
|
|
|
|
|
|||||||||
| Three months ended December 31, 2015 |
Market Making | Global Execution Services |
Corporate and Other | Consolidated | ||||||||||||
| Reconciliation of GAAP Pre-Tax to Non-GAAP Pre-Tax: |
||||||||||||||||
| GAAP (Loss) income from continuing operations before income taxes |
$ | (6,382 | ) | $ | (1,115 | ) | $ | 401 | $ | (7,096 | ) | |||||
| Gain on sales of investments |
— | — | (19,751 | ) | (19,751 | ) | ||||||||||
| Writedowns of investments |
— | — | 3,224 | 3,224 | ||||||||||||
| Writedown of goodwill and intangible assets |
15,266 | 907 | 1,014 | 17,187 | ||||||||||||
| Writedown of assets |
216 | — | — | 216 | ||||||||||||
|
|
|
|
|
|
|
|
|
|||||||||
| Non GAAP Income (loss) from continuing operations before income taxes |
$ | 9,100 | $ | (208 | ) | $ | (15,112 | ) | $ | (6,220 | ) | |||||
|
|
|
|
|
|
|
|
|
|||||||||
| Three months ended September 30, 2015 |
Market Making | Global Execution Services |
Corporate and Other | Consolidated | ||||||||||||
| Reconciliation of GAAP Pre-Tax to Non-GAAP Pre-Tax: |
||||||||||||||||
| GAAP Income (loss) from continuing operations before income taxes |
$ | 85,419 | $ | (1,050 | ) | $ | (48,951 | ) | $ | 35,419 | ||||||
| Other real estate related charges |
— | — | 28,825 | 28,825 | ||||||||||||
| Writedown of assets |
4,379 | — | 825 | 5,204 | ||||||||||||
|
|
|
|
|
|
|
|
|
|||||||||
| Non-GAAP Income (loss) from continuing operations before income taxes |
$ | 89,798 | $ | (1,050 | ) | $ | (19,301 | ) | $ | 69,448 | ||||||
|
|
|
|
|
|
|
|
|
|||||||||
| Three months ended December 31, 2014 |
Market Making | Global Execution Services |
Corporate and Other | Consolidated | ||||||||||||
| Reconciliation of GAAP Revenues to Non-GAAP Revenues: |
||||||||||||||||
| GAAP Revenues |
$ | 238,740 | $ | 93,369 | $ | 14,030 | $ | 346,139 | ||||||||
| Gain on sale of FCM |
— | (2,116 | ) | — | (2,116 | ) | ||||||||||
|
|
|
|
|
|
|
|
|
|||||||||
| Non- GAAP Revenues |
$ | 238,740 | $ | 91,253 | $ | 14,030 | $ | 344,023 | ||||||||
|
|
|
|
|
|
|
|
|
|||||||||
| Three months ended December 31, 2014 |
Market Making | Global Execution Services |
Corporate and Other | Consolidated | ||||||||||||
| Reconciliation of GAAP Pre-Tax to Non-GAAP Pre-Tax: |
||||||||||||||||
| GAAP Income (loss) from continuing operations before income taxes |
$ | 42,710 | $ | 9,969 | $ | (26,148 | ) | $ | 26,531 | |||||||
| Gain on sale of FCM |
— | (2,116 | ) | — | (2,116 | ) | ||||||||||
| Writedown of assets and lease loss accrual, net |
— | — | 6,117 | 6,117 | ||||||||||||
|
|
|
|
|
|
|
|
|
|||||||||
| Non-GAAP Income (loss) from continuing operations before income taxes |
$ | 42,710 | $ | 7,853 | $ | (20,031 | ) | $ | 30,532 | |||||||
|
|
|
|
|
|
|
|
|
|||||||||
| Year ended December 31, 2015 |
Market Making | Global Execution Services |
Corporate and Other | Consolidated | ||||||||||||
| Reconciliation of GAAP Revenues to Non-GAAP Revenues: |
||||||||||||||||
| GAAP Revenues |
$ | 884,858 | $ | 667,723 | $ | 45,154 | $ | 1,597,735 | ||||||||
| Gain on sale of KCG Hotspot |
— | (385,026 | ) | — | (385,026 | ) | ||||||||||
| Gain on sales of investments |
— | — | (19,751 | ) | (19,751 | ) | ||||||||||
| Writedowns of investments |
— | — | 3,224 | 3,224 | ||||||||||||
|
|
|
|
|
|
|
|
|
|||||||||
| Non- GAAP Revenues |
$ | 884,858 | $ | 282,697 | $ | 28,627 | $ | 1,196,182 | ||||||||
|
|
|
|
|
|
|
|
|
|||||||||
| Year ended December 31, 2015 |
Market Making | Global Execution Services |
Corporate and Other | Consolidated | ||||||||||||
| Reconciliation of GAAP Pre-Tax to Non-GAAP Pre-Tax: |
||||||||||||||||
| GAAP Income (loss) from continuing operations before income taxes |
$ | 122,778 | $ | 368,957 | $ | (114,398 | ) | $ | 377,337 | |||||||
| Gain on sale of KCG Hotspot |
— | (385,026 | ) | — | (385,026 | ) | ||||||||||
| Gain on sales of investments |
— | — | (19,751 | ) | (19,751 | ) | ||||||||||
| Writedowns of investments |
— | — | 3,224 | 3,224 | ||||||||||||
| Other real estate related charges |
— | — | 35,284 | 35,284 | ||||||||||||
| Accelerated stock-based compensation |
19,844 | 8,202 | 803 | 28,849 | ||||||||||||
| Writedown of goodwill and intangible assets |
15,266 | 907 | 1,014 | 17,187 | ||||||||||||
| Debt make-whole premium |
— | — | 16,500 | 16,500 | ||||||||||||
| Writedown of capitalized debt costs |
— | — | 8,506 | 8,506 | ||||||||||||
| Professional fees related to the sale of KCG Hotspot |
— | 6,736 | — | 6,736 | ||||||||||||
| Writedown of assets |
4,595 | — | 825 | 5,420 | ||||||||||||
| Compensation expense related to the sale of KCG Hotspot |
— | 4,457 | — | 4,457 | ||||||||||||
|
|
|
|
|
|
|
|
|
|||||||||
| Non-GAAP Income (loss) from continuing operations before income taxes |
$ | 162,483 | $ | 4,233 | $ | (67,993 | ) | $ | 98,723 | |||||||
|
|
|
|
|
|
|
|
|
|||||||||
| Year ended December 31, 2014 |
Market Making | Global Execution Services |
Corporate and Other | Consolidated | ||||||||||||
| Reconciliation of GAAP Revenues to Non-GAAP Revenues: |
||||||||||||||||
| GAAP Revenues |
$ | 901,152 | $ | 345,710 | $ | 69,369 | $ | 1,316,232 | ||||||||
| Net gain related to tradeMONSTER combination with OptionsHouse |
— | — | (15,105 | ) | (15,105 | ) | ||||||||||
| Income resulting from the merger of BATS and Direct Edge, net |
— | — | (9,644 | ) | (9,644 | ) | ||||||||||
| Gain on sale of FCM |
— | (2,116 | ) | — | (2,116 | ) | ||||||||||
|
|
|
|
|
|
|
|
|
|||||||||
| Non- GAAP Revenues |
$ | 901,152 | $ | 343,594 | $ | 44,620 | $ | 1,289,367 | ||||||||
|
|
|
|
|
|
|
|
|
|||||||||
| Year ended December 31, 2014 |
Market Making | Global Execution Services |
Corporate and Other | Consolidated | ||||||||||||
| Reconciliation of GAAP Pre-Tax to Non-GAAP Pre-Tax: |
||||||||||||||||
| GAAP Income (loss) from continuing operations before income taxes |
$ | 146,713 | $ | 11,056 | $ | (72,582 | ) | $ | 85,187 | |||||||
| Net gain related to tradeMONSTER combination with OptionsHouse |
— | — | (15,105 | ) | (15,105 | ) | ||||||||||
| Income resulting from the merger of BATS and Direct Edge, net |
— | — | (9,644 | ) | (9,644 | ) | ||||||||||
| Gain on sale of FCM |
— | (2,116 | ) | — | (2,116 | ) | ||||||||||
| Compensation related to reduction in workforce and other employee separations |
3,169 | 5,463 | 4,958 | 13,590 | ||||||||||||
| Writedown of capitalized debt costs |
— | — | 9,552 | 9,552 | ||||||||||||
| Writedown of assets and lease loss accrual, net |
811 | — | 7,814 | 8,625 | ||||||||||||
|
|
|
|
|
|
|
|
|
|||||||||
| Non GAAP Income (Loss) from continuing operations before income taxes |
$ | 150,693 | $ | 14,403 | $ | (75,007 | ) | $ | 90,089 | |||||||
|
|
|
|
|
|
|
|
|
|||||||||
| Year ended December 31, 2015 |
GAAP | Adjustments for non-GAAP presentation |
Non-GAAP expenses |
|||||||||
| Reconciliation of GAAP non transactional based expenses to Non GAAP non transactional based expenses** |
||||||||||||
| Employee compensation and benefits |
$ | 405,609 | $ | 33,306 | $ | 372,303 | ||||||
| Communications and data processing |
139,263 | — | 139,263 | |||||||||
| Depreciation and amortization |
90,231 | — | 90,231 | |||||||||
| Debt interest expense |
36,755 | — | 36,755 | |||||||||
| Occupancy and equipment rentals |
30,128 | — | 30,128 | |||||||||
| Professional fees |
27,055 | 6,736 | 20,319 | |||||||||
| Business development |
8,479 | — | 8,479 | |||||||||
| Debt extinguishment charges |
25,006 | 25,006 | — | |||||||||
| Writedown of assets and other real estate related charges |
57,892 | 57,892 | — | |||||||||
| Other |
38,375 | — | 38,375 | |||||||||
|
|
|
|
|
|
|
|||||||
| Total non-GAAP Expense |
$ | 858,793 | $ | 122,940 | $ | 735,853 | ||||||
|
|
|
|
|
|
|
|||||||
| Year ended December 31, 2014 |
GAAP | Adjustments for non-GAAP presentation |
Non-GAAP expenses |
|||||||||
| Reconciliation of GAAP non transactional based expenses to Non GAAP non transactional based expenses** |
||||||||||||
| Employee compensation and benefits |
$ | 437,269 | $ | 13,590 | $ | 423,679 | ||||||
| Communications and data processing |
150,595 | — | 150,595 | |||||||||
| Depreciation and amortization |
81,448 | — | 81,448 | |||||||||
| Occupancy and equipment rentals |
32,707 | — | 32,707 | |||||||||
| Debt interest expense |
32,456 | — | 32,456 | |||||||||
| Professional fees |
25,596 | — | 25,596 | |||||||||
| Business development |
9,763 | — | 9,763 | |||||||||
| Debt extinguishment charges |
9,552 | 9,552 | — | |||||||||
| Writedown of assets and other real estate related charges |
8,625 | 8,625 | — | |||||||||
| Other |
39,814 | — | 39,814 | |||||||||
|
|
|
|
|
|
|
|||||||
| Total non-GAAP Expense |
$ | 827,825 | $ | 31,767 | $ | 796,058 | ||||||
|
|
|
|
|
|
|
|||||||
| ** | Transactional based expenses refer to Execution and clearance fees, Payments for order flow and Collateralized financing interest |
| * | Totals may not add due to rounding |
KCG Holdings, Inc. (KCG) 4th Quarter 2015 Earnings Presentation January 29, 2016 Exhibit 99.2
Safe Harbor Certain statements contained herein may constitute “forward-looking statements” within the meaning of the safe harbor provisions of the U.S. Private Securities Litigation Reform Act of 1995. Forward-looking statements are typically identified by words such as “believe,” “expect,” “anticipate,” “intend,” “target,” “estimate,” “continue,” “positions,” “prospects” or “potential,” by future conditional verbs such as “will,” “would,” “should,” “could” or “may,” or by variations of such words or by similar expressions. These “forward-looking statements” are not historical facts and are based on current expectations, estimates and projections about KCG's industry, management's beliefs and certain assumptions made by management, many of which, by their nature, are inherently uncertain and beyond our control. Any forward-looking statement contained herein speaks only as of the date on which it is made. Accordingly, readers are cautioned that any such forward-looking statements are not guarantees of future performance and are subject to certain risks, uncertainties and assumptions that are difficult to predict including, without limitation, risks associated with: (i) the inability to manage trading strategy performance and sustain revenue and earnings growth; (ii) the sale of KCG Hotspot; (iii) changes in market structure, legislative, regulatory or financial reporting rules, including the increased focus by Congress, federal and state regulators, the SRO’s and the media on market structure issues, and in particular, the scrutiny of high frequency trading, alternative trading systems, market fragmentation, colocation, access to market data feeds, and remuneration arrangements such as payment for order flow and exchange fee structures; (iv) past or future changes to KCG's organizational structure and management; (v) KCG's ability to develop competitive new products and services in a timely manner and the acceptance of such products and services by KCG's customers and potential customers; (vi) KCG's ability to keep up with technological changes; (vii) KCG's ability to effectively identify and manage market risk, operational and technology risk, cybersecurity risk, legal risk, liquidity risk, reputational risk, counterparty and credit risk, international risk, regulatory risk, and compliance risk; (viii) the cost and other effects of material contingencies, including litigation contingencies, and any adverse judicial, administrative or arbitral rulings or proceedings; (ix) the effects of increased competition and KCG's ability to maintain and expand market share; (x) the announced plan to relocate KCG’s global headquarters from Jersey City, NJ to New York, NY; and (xi) KCG’s ability to complete the sale or disposition of any or all of the assets or businesses that are classified as held for sale. The list above is not exhaustive. Because forward looking statements involve risks and uncertainties, the actual results and performance of KCG may materially differ from the results expressed or implied by such statements. Given these uncertainties, readers are cautioned not to place undue reliance on such forward-looking statements. Unless otherwise required by law, KCG also disclaims any obligation to update its view of any such risks or uncertainties or to announce publicly the result of any revisions to the forward-looking statements made herein. Readers should carefully review the risks and uncertainties disclosed in KCG’s reports with the U.S. Securities and Exchange Commission (“SEC”), including those detailed under “Certain Factors Affecting Results of Operations” in the MD&A and in “Risk Factors” in Part I, Item 1A of KCG 's Annual Report on Form 10-K for the year ended December 31, 2014, and in Part II, Item 1A of the Company's Quarterly Report on Form 10-Q for the quarter ended September 30, 2015, and in other reports or documents KCG files with, or furnishes to, the SEC from time to time. This information should be read in conjunction with KCG’s Consolidated Financial Statements and the Notes thereto contained in the Quarterly Report on Form 10-Q for the quarter-ended September 30, 2015, and in other reports or documents KCG files with, or furnishes to, the SEC from time to time. For additional disclosures, please see https://www.kcg.com/legal/global-disclosures.
KCG financial results in 4Q15 affected by market conditions, macro events and competition KCG Electronic Trading increased average daily U.S. equity share volume from the top 25 U.S. asset managers 37 percent year over year KCG Acknowledge FI set a new quarterly record for average daily U.S. Treasury notional volume with a 51 percent rise year over year KCG BondPoint set a new quarterly record for average daily fixed income par value traded with a 15 percent increase year over year KCG completed the sales of certain legacy investments including the firm’s stake in Aperture Group, the corporate parent of OptionsHouse KCG repurchased 2.3 million shares of KCG Class A Common Stock for $29.4 million and 2.6 million warrants for $4.4 million 4th Quarter 2015 Summary
KCG Financial Results Pre-Tax Earnings (Loss) from Continuing Operations By Business Segment (in thousands) (unaudited) For the three months ended December 31, 2014 September 30, 2015 December 31, 2015 Market Making Revenues $ 238,740 $ 299,755 $ 168,227 Expenses 196,030 214,336 174,609 Pre-tax earnings (loss) 42,710 85,419 (6,382) Global Execution Services Revenues 93,369 69,713 70,221 Expenses 83,400 70,763 71,336 Pre-tax earnings (loss) 9,969 (1,050) (1,115) Corporate and Other Revenues 14,030 7,568 24,213 Expenses 40,178 56,519 23,812 Pre-tax (loss) earnings (26,148) (48,951) 401 Consolidated Revenues 346,139 377,036 262,661 Expenses 319,608 341,617 269,757 Pre-tax earnings (loss) $ 26,531 $ 35,419 $ (7,096) Notes: 4th quarter 2015 results include a $19.8 gain from the sales of investments, $17.4 million of writedowns primarily related to assets of businesses held for sale and $3.2 million of writedowns of investments 3rd quarter 2015 results include expenses of $34.0 million related to other real estate-related charges and a writedown of assets 4th quarter 2014 results include a $2.1 million gain from the sale of the FCM as well as expenses of $6.1 million related to lease loss accruals See addendum for a reconciliation of GAAP to non-GAAP financial results.
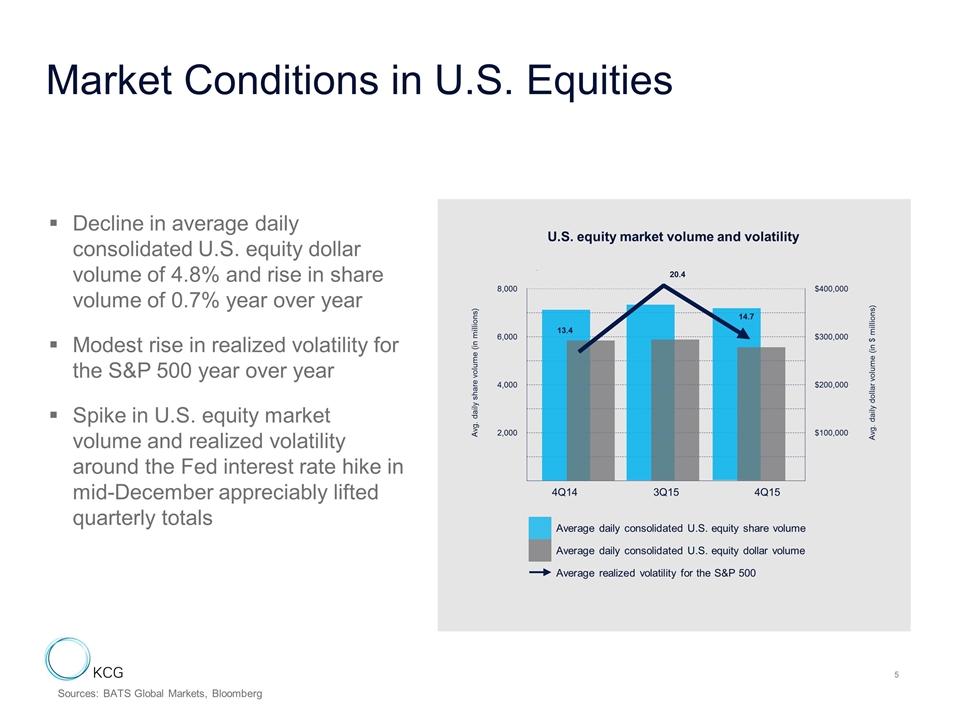
Market Conditions in U.S. Equities Decline in average daily consolidated U.S. equity dollar volume of 4.8% and rise in share volume of 0.7% year over year Modest rise in realized volatility for the S&P 500 year over year Spike in U.S. equity market volume and realized volatility around the Fed interest rate hike in mid-December appreciably lifted quarterly totals Average daily consolidated U.S. equity share volume Average daily consolidated U.S. equity dollar volume Average realized volatility for the S&P 500 U.S. equity market volume and volatility Avg. daily share volume (in millions) 8,000 2 $400,000 Avg. daily dollar volume (in $ millions) 6,000 $300,000 4,000 $200,000 2,000 $100,000 4Q14 3Q15 4Q15 13.4 20.4 14.7 Sources: BATS Global Markets, Bloomberg
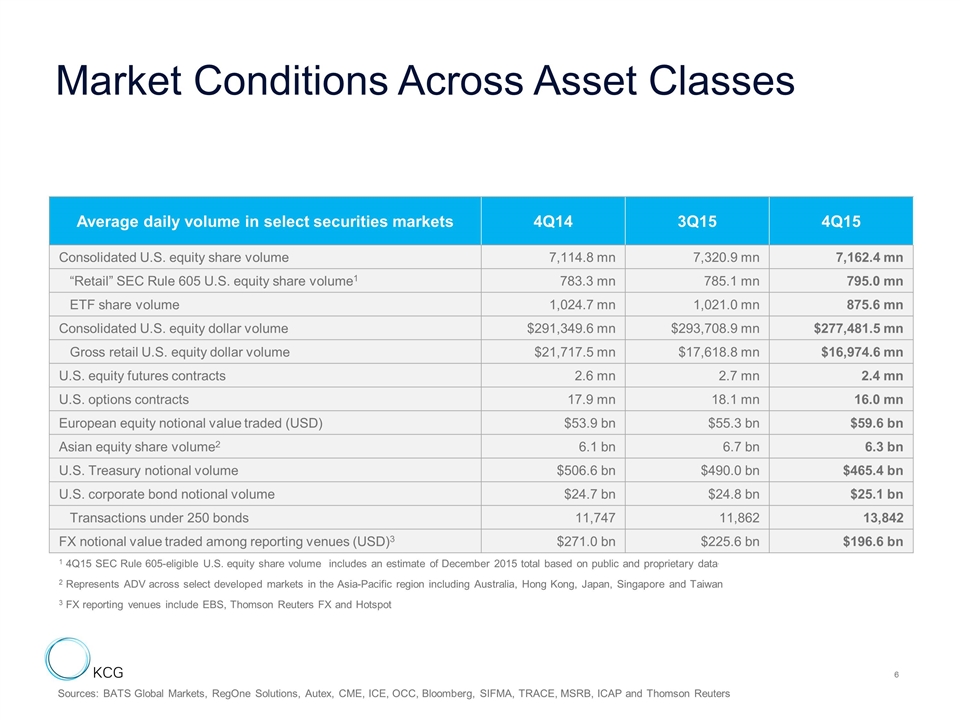
Market Conditions Across Asset Classes Average daily volume in select securities markets 4Q14 3Q15 4Q15 Consolidated U.S. equity share volume 7,114.8 mn 7,320.9 mn 7,162.4 mn “Retail” SEC Rule 605 U.S. equity share volume1 783.3 mn 785.1 mn 795.0 mn ETF share volume 1,024.7 mn 1,021.0 mn 875.6 mn Consolidated U.S. equity dollar volume $291,349.6 mn $293,708.9 mn $277,481.5 mn Gross retail U.S. equity dollar volume $21,717.5 mn $17,618.8 mn $16,974.6 mn U.S. equity futures contracts 2.6 mn 2.7 mn 2.4 mn U.S. options contracts 17.9 mn 18.1 mn 16.0 mn European equity notional value traded (USD) $53.9 bn $55.3 bn $59.6 bn Asian equity share volume2 6.1 bn 6.7 bn 6.3 bn U.S. Treasury notional volume $506.6 bn $490.0 bn $465.4 bn U.S. corporate bond notional volume $24.7 bn $24.8 bn $25.1 bn Transactions under 250 bonds 11,747 11,862 13,842 FX notional value traded among reporting venues (USD)3 $271.0 bn $225.6 bn $196.6 bn 1 4Q15 SEC Rule 605-eligible U.S. equity share volume includes an estimate of December 2015 total based on public and proprietary data. 2 Represents ADV across select developed markets in the Asia-Pacific region including Australia, Hong Kong, Japan, Singapore and Taiwan 3 FX reporting venues include EBS, Thomson Reuters FX and Hotspot Sources: BATS Global Markets, RegOne Solutions, Autex, CME, ICE, OCC, Bloomberg, SIFMA, TRACE, MSRB, ICAP and Thomson Reuters
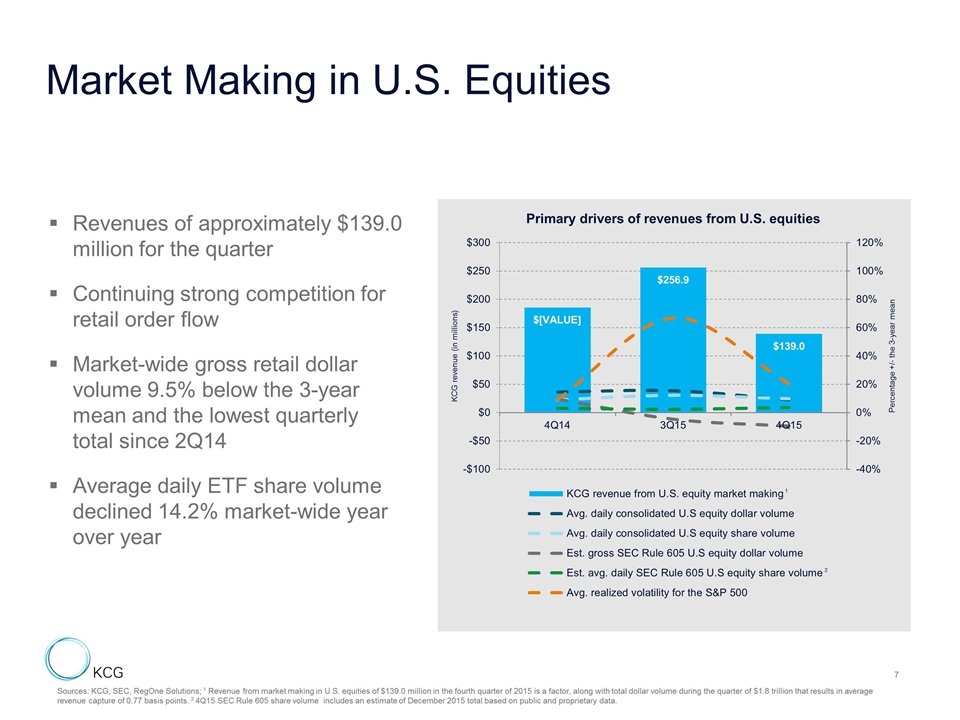
Market Making in U.S. Equities Sources: KCG, SEC, RegOne Solutions; 1 Revenue from market making in U.S. equities of $139.0 million in the fourth quarter of 2015 is a factor, along with total dollar volume during the quarter of $1.8 trillion that results in average revenue capture of 0.77 basis points. 2 4Q15 SEC Rule 605 share volume includes an estimate of December 2015 total based on public and proprietary data. Revenues of approximately $139.0 million for the quarter Continuing strong competition for retail order flow Market-wide gross retail dollar volume 9.5% below the 3-year mean and the lowest quarterly total since 2Q14 Average daily ETF share volume declined 14.2% market-wide year over year 1 2
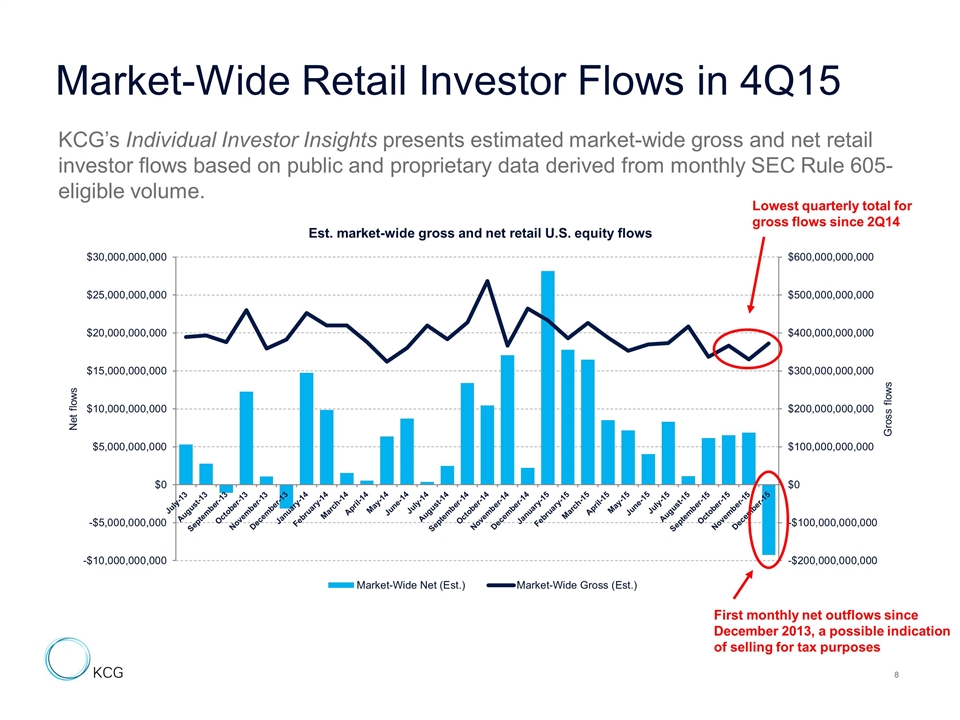
Market-Wide Retail Investor Flows in 4Q15 KCG’s Individual Investor Insights presents estimated market-wide gross and net retail investor flows based on public and proprietary data derived from monthly SEC Rule 605-eligible volume. Lowest quarterly total for gross flows since 2Q14 First monthly net outflows since December 2013, a possible indication of selling for tax purposes
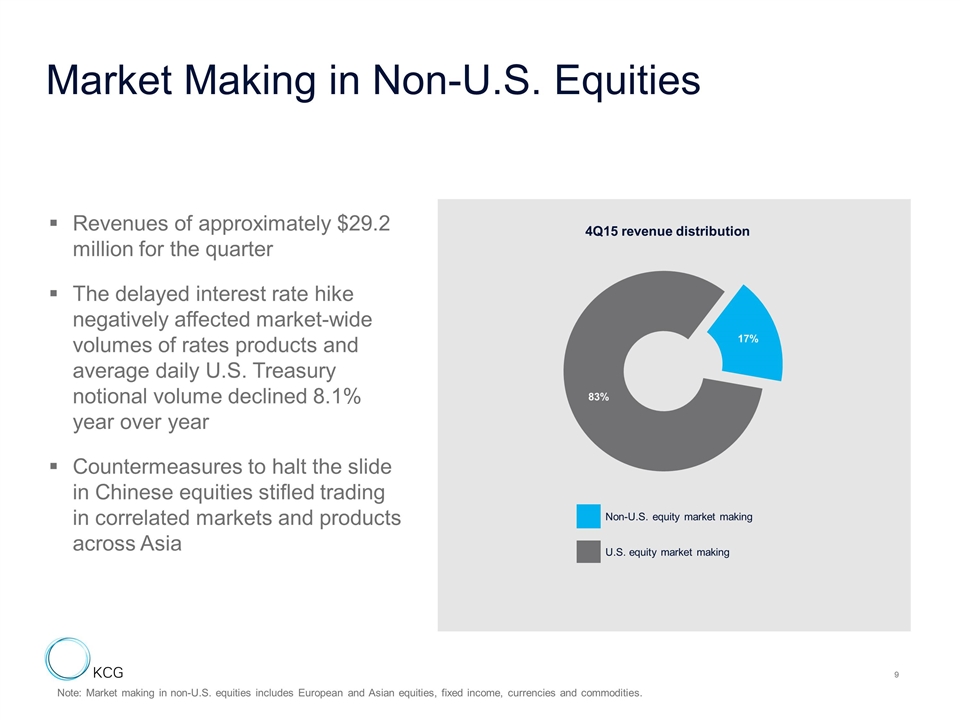
Market Making in Non-U.S. Equities Note: Market making in non-U.S. equities includes European and Asian equities, fixed income, currencies and commodities. Revenues of approximately $29.2 million for the quarter The delayed interest rate hike negatively affected market-wide volumes of rates products and average daily U.S. Treasury notional volume declined 8.1% year over year Countermeasures to halt the slide in Chinese equities stifled trading in correlated markets and products across Asia Non-U.S. equity market making U.S. equity market making 4Q15 revenue distribution
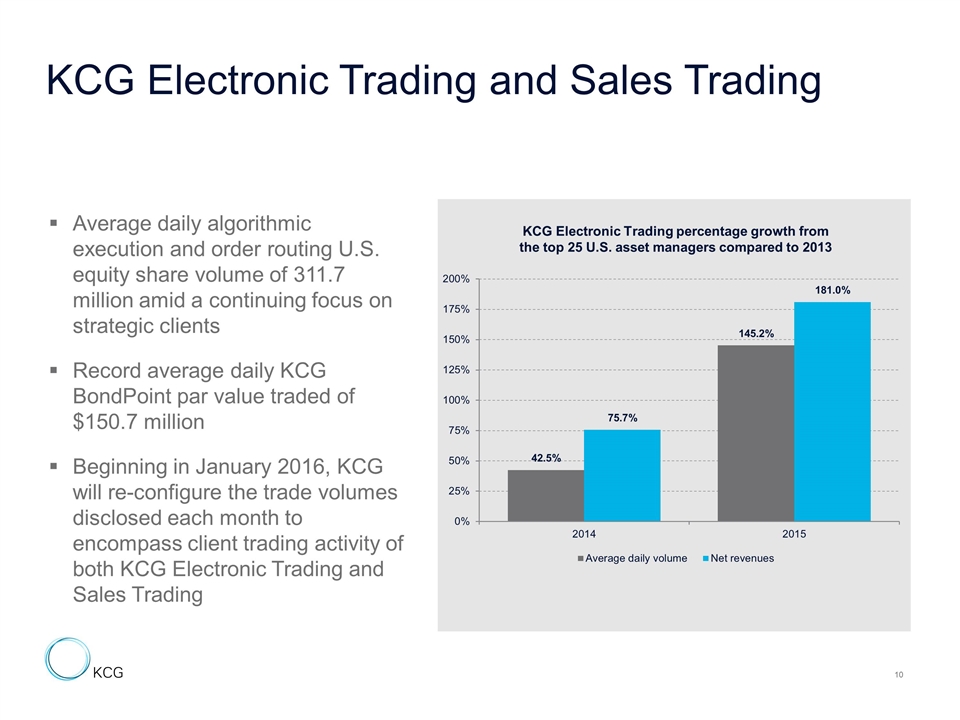
KCG Electronic Trading and Sales Trading Average daily algorithmic execution and order routing U.S. equity share volume of 311.7 million amid a continuing focus on strategic clients Record average daily KCG BondPoint par value traded of $150.7 million Beginning in January 2016, KCG will re-configure the trade volumes disclosed each month to encompass client trading activity of both KCG Electronic Trading and Sales Trading KCG Electronic Trading percentage growth from the top 25 U.S. asset managers compared to 2013
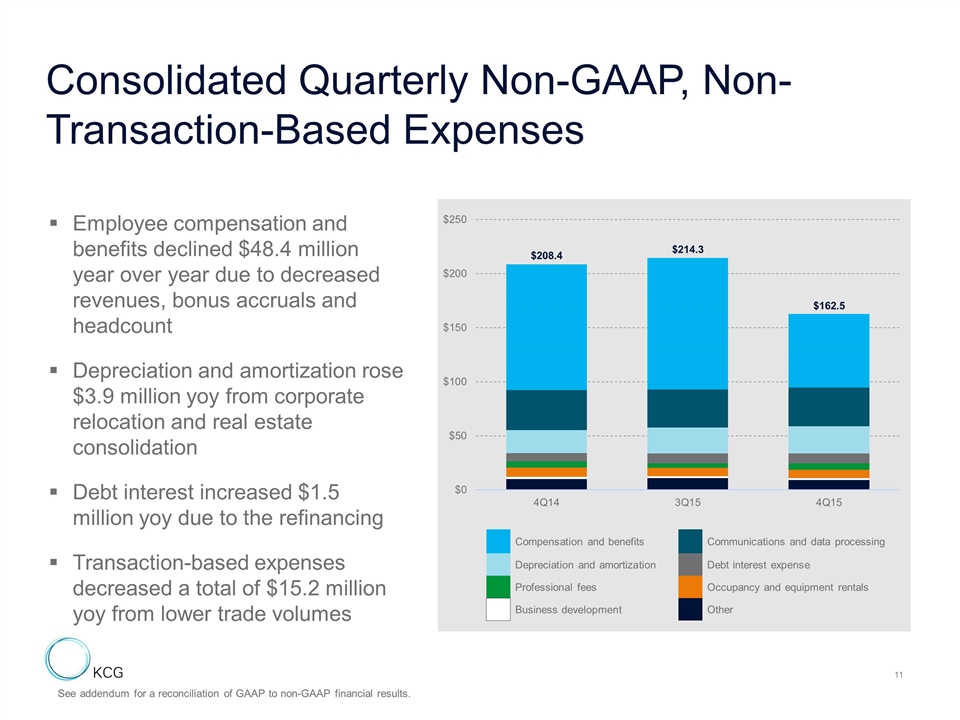
Consolidated Quarterly Non-GAAP, Non-Transaction-Based Expenses Employee compensation and benefits declined $48.4 million year over year due to decreased revenues, bonus accruals and headcount Depreciation and amortization rose $3.9 million yoy from corporate relocation and real estate consolidation Debt interest increased $1.5 million yoy due to the refinancing Transaction-based expenses decreased a total of $15.2 million yoy from lower trade volumes Compensation and benefits Communications and data processing Depreciation and amortization Debt interest expense Professional fees Occupancy and equipment rentals Business development Other See addendum for a reconciliation of GAAP to non-GAAP financial results.
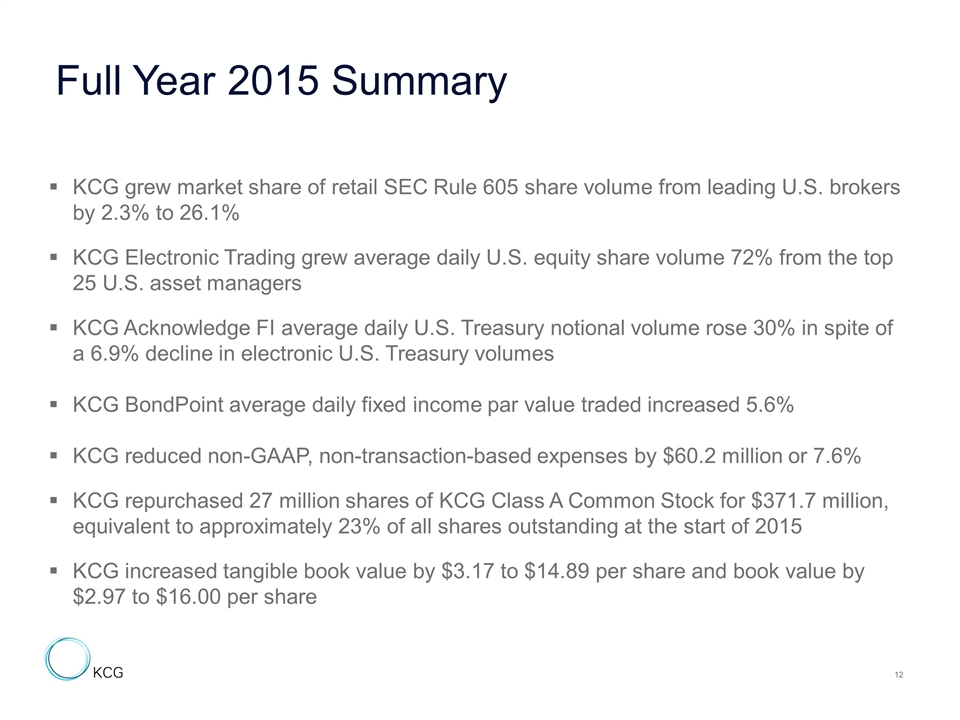
KCG grew market share of retail SEC Rule 605 share volume from leading U.S. brokers by 2.3% to 26.1% KCG Electronic Trading grew average daily U.S. equity share volume 72% from the top 25 U.S. asset managers KCG Acknowledge FI average daily U.S. Treasury notional volume rose 30% in spite of a 6.9% decline in electronic U.S. Treasury volumes KCG BondPoint average daily fixed income par value traded increased 5.6% KCG reduced non-GAAP, non-transaction-based expenses by $60.2 million or 7.6% KCG repurchased 27 million shares of KCG Class A Common Stock for $371.7 million, equivalent to approximately 23% of all shares outstanding at the start of 2015 KCG increased tangible book value by $3.17 to $14.89 per share and book value by $2.97 to $16.00 per share Full Year 2015 Summary
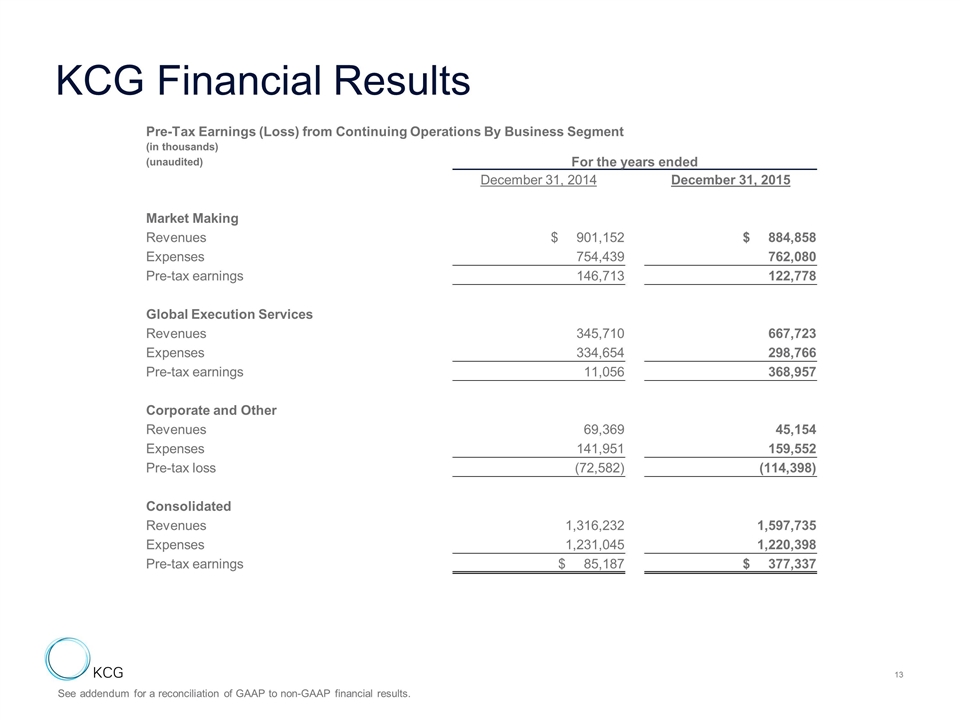
KCG Financial Results Pre-Tax Earnings (Loss) from Continuing Operations By Business Segment (in thousands) (unaudited) For the years ended December 31, 2014 December 31, 2015 Market Making Revenues $ 901,152 $ 884,858 Expenses 754,439 762,080 Pre-tax earnings 146,713 122,778 Global Execution Services Revenues 345,710 667,723 Expenses 334,654 298,766 Pre-tax earnings 11,056 368,957 Corporate and Other Revenues 69,369 45,154 Expenses 141,951 159,552 Pre-tax loss (72,582) (114,398) Consolidated Revenues 1,316,232 1,597,735 Expenses 1,231,045 1,220,398 Pre-tax earnings $ 85,187 $ 377,337 See addendum for a reconciliation of GAAP to non-GAAP financial results.
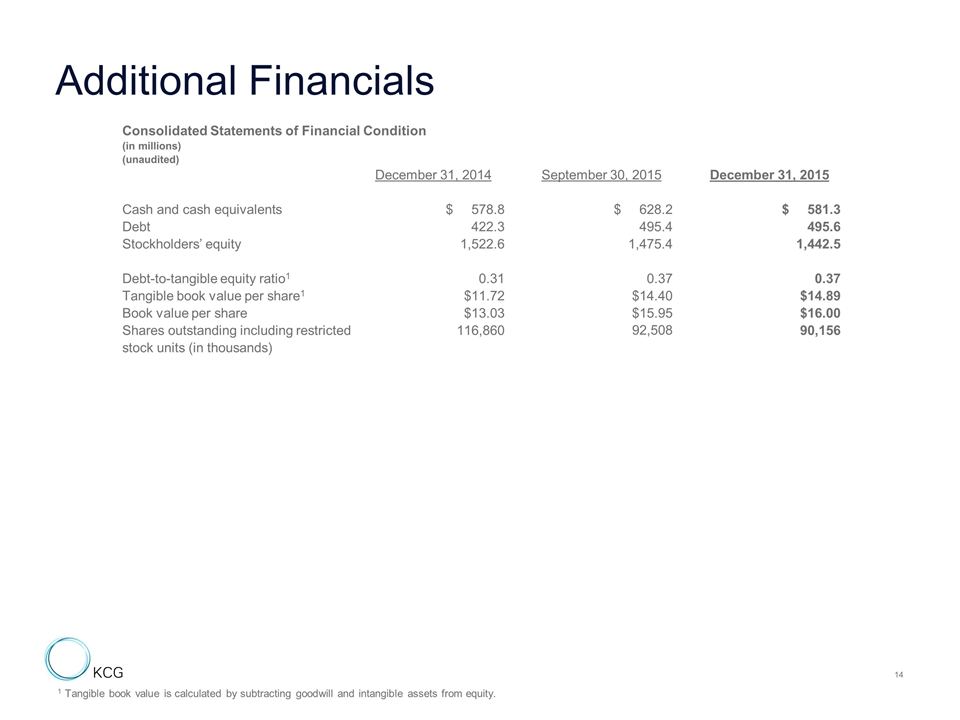
Additional Financials Consolidated Statements of Financial Condition (in millions) (unaudited) December 31, 2014 September 30, 2015 December 31, 2015 Cash and cash equivalents $ 578.8 $ 628.2 $ 581.3 Debt 422.3 495.4 495.6 Stockholders’ equity 1,522.6 1,475.4 1,442.5 Debt-to-tangible equity ratio1 0.31 0.37 0.37 Tangible book value per share1 $11.72 $14.40 $14.89 Book value per share $13.03 $15.95 $16.00 Shares outstanding including restricted 116,860 92,508 90,156 stock units (in thousands) 1 Tangible book value is calculated by subtracting goodwill and intangible assets from equity.
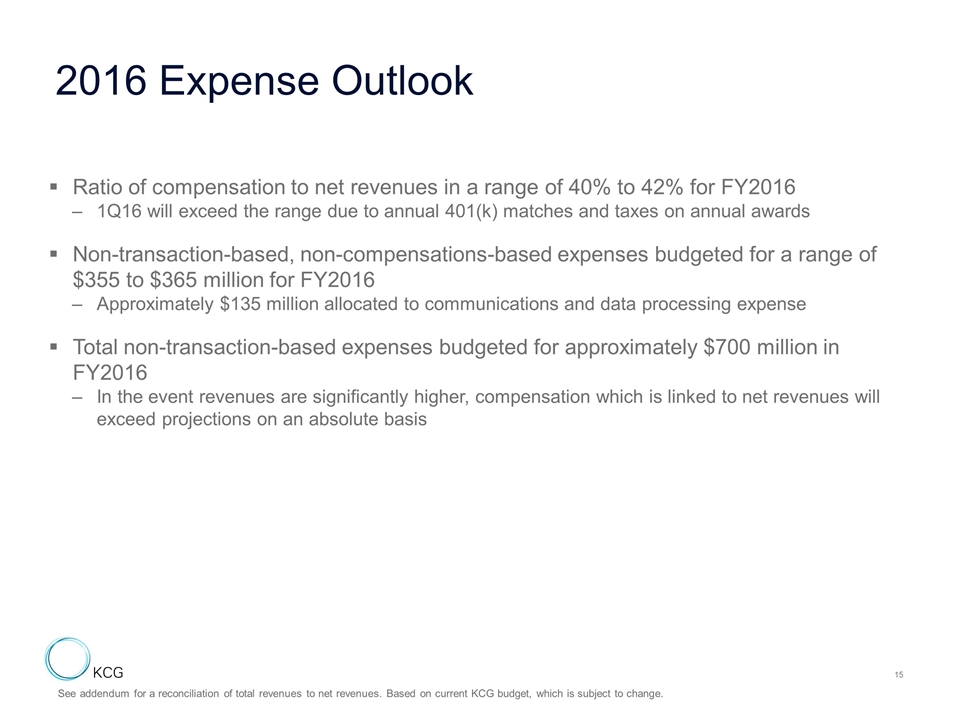
Ratio of compensation to net revenues in a range of 40% to 42% for FY2016 1Q16 will exceed the range due to annual 401(k) matches and taxes on annual awards Non-transaction-based, non-compensations-based expenses budgeted for a range of $355 to $365 million for FY2016 Approximately $135 million allocated to communications and data processing expense Total non-transaction-based expenses budgeted for approximately $700 million in FY2016 In the event revenues are significantly higher, compensation which is linked to net revenues will exceed projections on an absolute basis 2016 Expense Outlook See addendum for a reconciliation of total revenues to net revenues. Based on current KCG budget, which is subject to change.
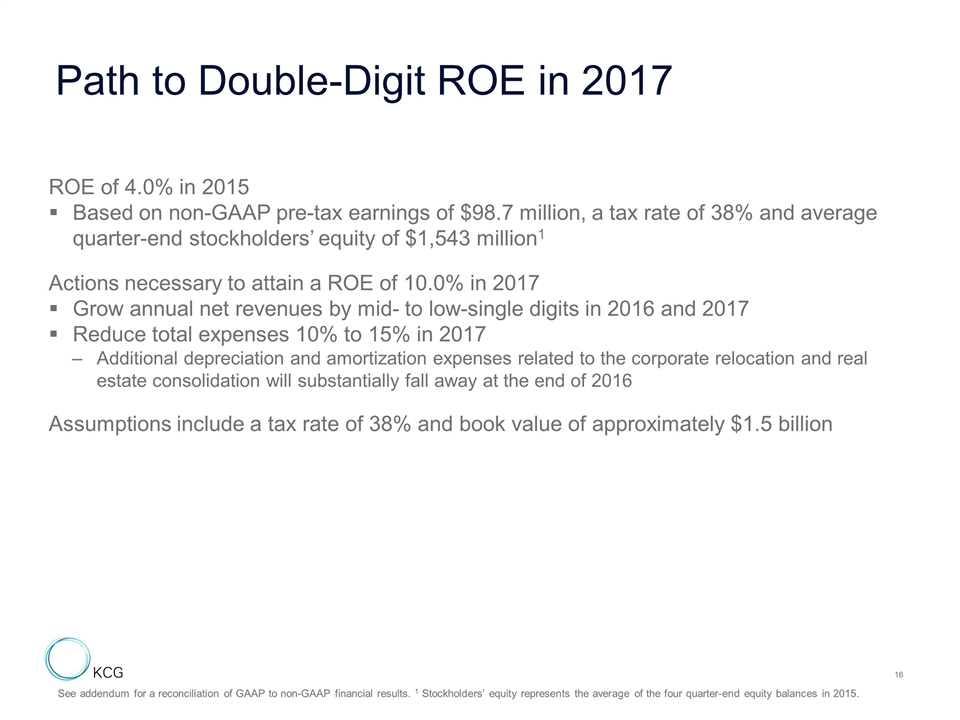
ROE of 4.0% in 2015 Based on non-GAAP pre-tax earnings of $98.7 million, a tax rate of 38% and average quarter-end stockholders’ equity of $1,543 million1 Actions necessary to attain a ROE of 10.0% in 2017 Grow annual net revenues by mid- to low-single digits in 2016 and 2017 Reduce total expenses 10% to 15% in 2017 Additional depreciation and amortization expenses related to the corporate relocation and real estate consolidation will substantially fall away at the end of 2016 Assumptions include a tax rate of 38% and book value of approximately $1.5 billion Path to Double-Digit ROE in 2017 See addendum for a reconciliation of GAAP to non-GAAP financial results. 1 Stockholders’ equity represents the average of the four quarter-end equity balances in 2015.

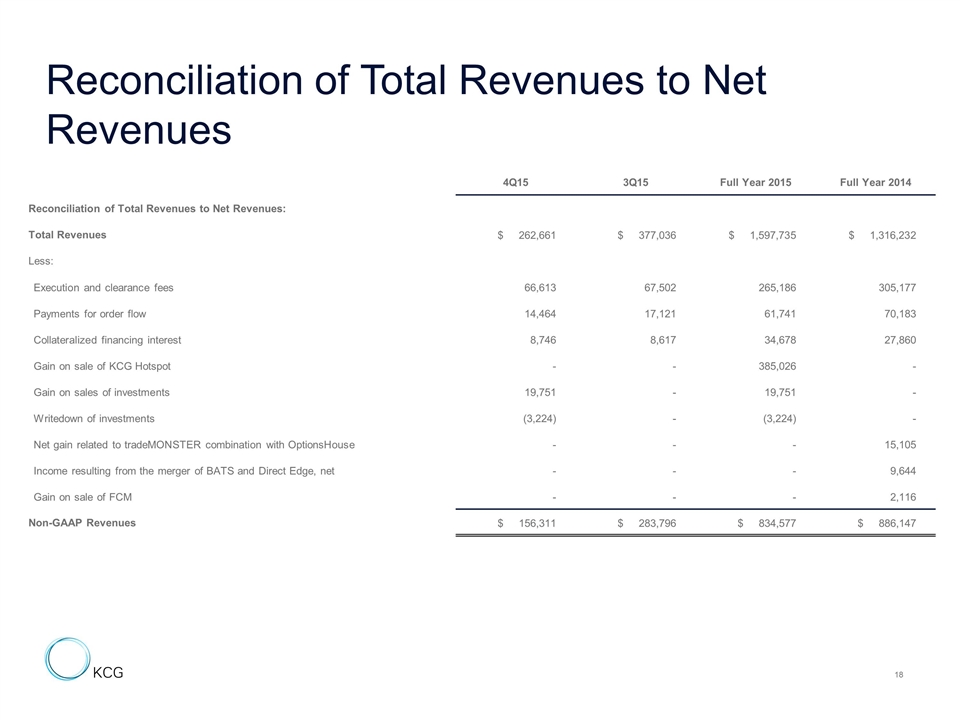
Reconciliation of Total Revenues to Net Revenues 4Q15 3Q15 Full Year 2015 Full Year 2014 Reconciliation of Total Revenues to Net Revenues: Total Revenues $ 262,661 $ 377,036 $ 1,597,735 $ 1,316,232 Less: Execution and clearance fees 66,613 67,502 265,186 305,177 Payments for order flow 14,464 17,121 61,741 70,183 Collateralized financing interest 8,746 8,617 34,678 27,860 Gain on sale of KCG Hotspot - - 385,026 - Gain on sales of investments 19,751 - 19,751 - Writedown of investments (3,224) - (3,224) - Net gain related to tradeMONSTER combination with OptionsHouse - - - 15,105 Income resulting from the merger of BATS and Direct Edge, net - - - 9,644 Gain on sale of FCM - - - 2,116 Non-GAAP Revenues $ 156,311 $ 283,796 $ 834,577 $ 886,147
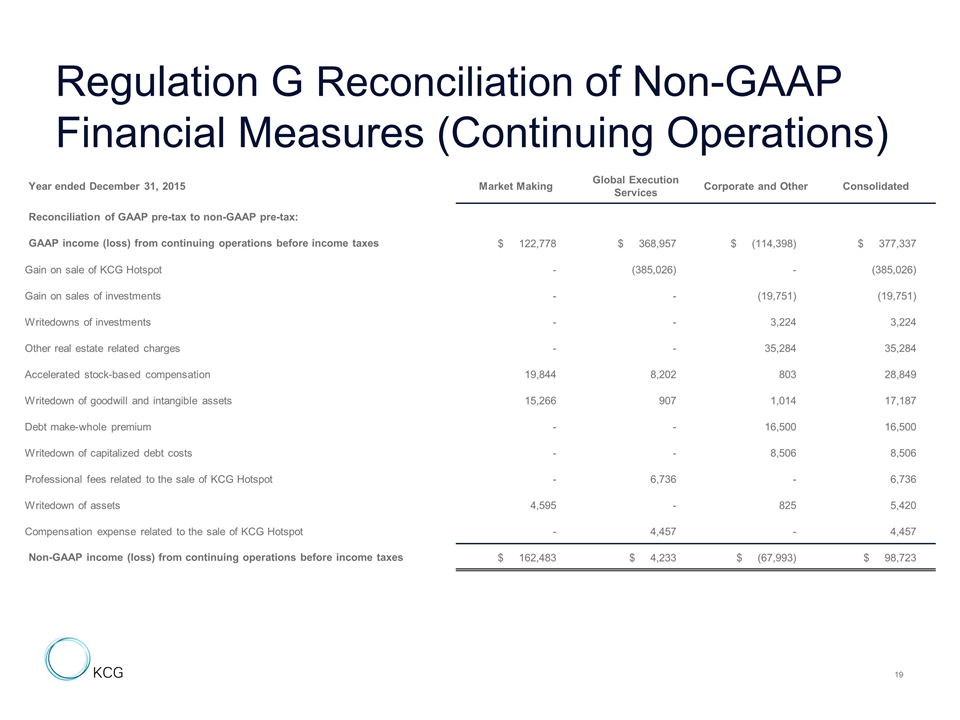
Year ended December 31, 2015 Market Making Global Execution Services Corporate and Other Consolidated Reconciliation of GAAP pre-tax to non-GAAP pre-tax: GAAP income (loss) from continuing operations before income taxes $ 122,778 $ 368,957 $ (114,398) $ 377,337 Gain on sale of KCG Hotspot - (385,026) - (385,026) Gain on sales of investments - - (19,751) (19,751) Writedowns of investments - - 3,224 3,224 Other real estate related charges - - 35,284 35,284 Accelerated stock-based compensation 19,844 8,202 803 28,849 Writedown of goodwill and intangible assets 15,266 907 1,014 17,187 Debt make-whole premium - - 16,500 16,500 Writedown of capitalized debt costs - - 8,506 8,506 Professional fees related to the sale of KCG Hotspot - 6,736 - 6,736 Writedown of assets 4,595 - 825 5,420 Compensation expense related to the sale of KCG Hotspot - 4,457 - 4,457 Non-GAAP income (loss) from continuing operations before income taxes $ 162,483 $ 4,233 $ (67,993) $ 98,723 Regulation G Reconciliation of Non-GAAP Financial Measures (Continuing Operations)
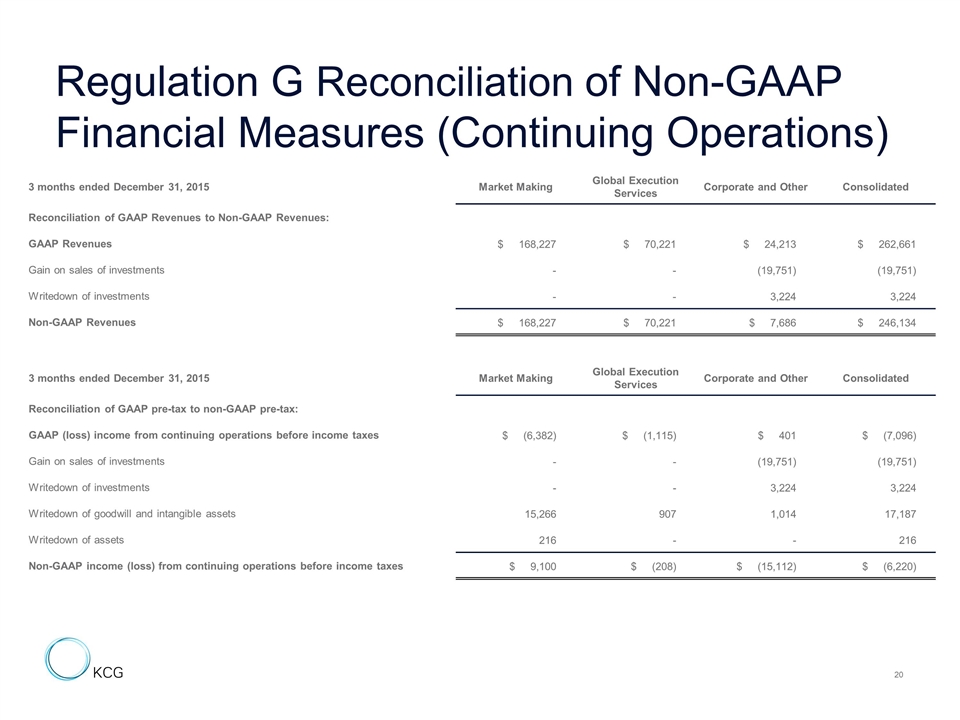
Regulation G Reconciliation of Non-GAAP Financial Measures (Continuing Operations) 3 months ended December 31, 2015 Market Making Global Execution Services Corporate and Other Consolidated Reconciliation of GAAP Revenues to Non-GAAP Revenues: GAAP Revenues $ 168,227 $ 70,221 $ 24,213 $ 262,661 Gain on sales of investments - - (19,751) (19,751) Writedown of investments - - 3,224 3,224 Non-GAAP Revenues $ 168,227 $ 70,221 $ 7,686 $ 246,134 3 months ended December 31, 2015 Market Making Global Execution Services Corporate and Other Consolidated Reconciliation of GAAP pre-tax to non-GAAP pre-tax: GAAP (loss) income from continuing operations before income taxes $ (6,382) $ (1,115) $ 401 $ (7,096) Gain on sales of investments - - (19,751) (19,751) Writedown of investments - - 3,224 3,224 Writedown of goodwill and intangible assets 15,266 907 1,014 17,187 Writedown of assets 216 - - 216 Non-GAAP income (loss) from continuing operations before income taxes $ 9,100 $ (208) $ (15,112) $ (6,220)
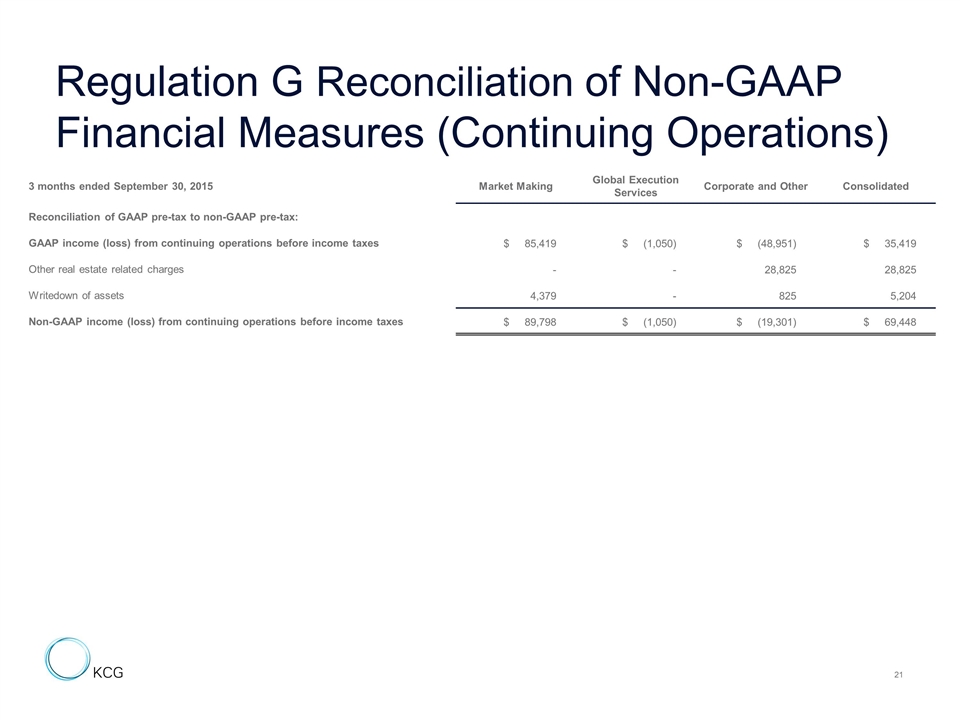
Regulation G Reconciliation of Non-GAAP Financial Measures (Continuing Operations) 3 months ended September 30, 2015 Market Making Global Execution Services Corporate and Other Consolidated Reconciliation of GAAP pre-tax to non-GAAP pre-tax: GAAP income (loss) from continuing operations before income taxes $ 85,419 $ (1,050) $ (48,951) $ 35,419 Other real estate related charges - - 28,825 28,825 Writedown of assets 4,379 - 825 5,204 Non-GAAP income (loss) from continuing operations before income taxes $ 89,798 $ (1,050) $ (19,301) $ 69,448
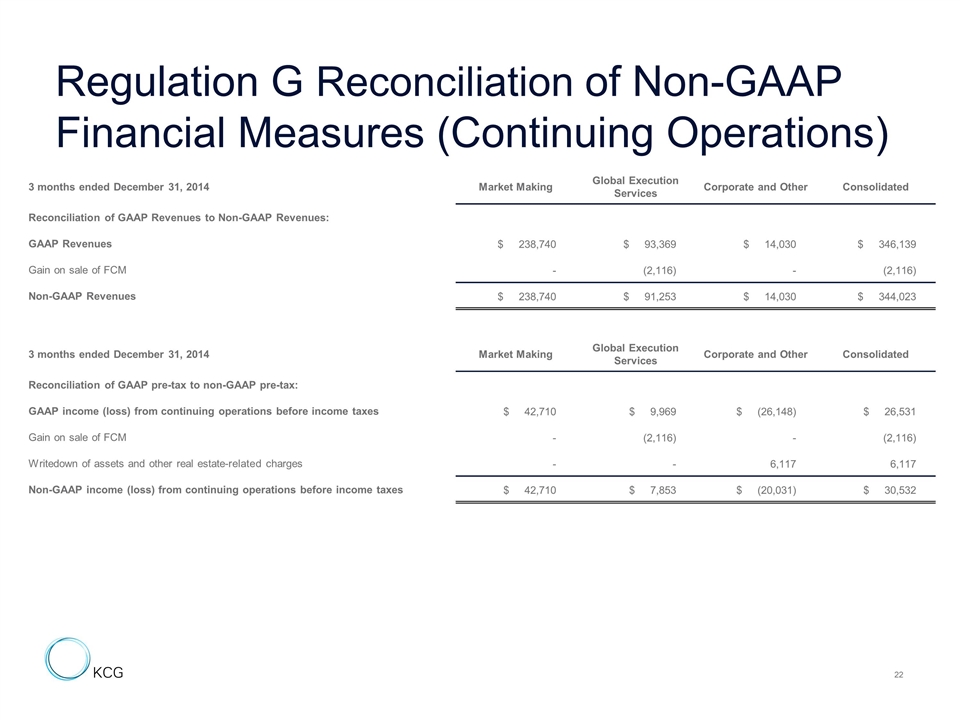
Regulation G Reconciliation of Non-GAAP Financial Measures (Continuing Operations) 3 months ended December 31, 2014 Market Making Global Execution Services Corporate and Other Consolidated Reconciliation of GAAP pre-tax to non-GAAP pre-tax: GAAP income (loss) from continuing operations before income taxes $ 42,710 $ 9,969 $ (26,148) $ 26,531 Gain on sale of FCM - (2,116) - (2,116) Writedown of assets and other real estate-related charges - - 6,117 6,117 Non-GAAP income (loss) from continuing operations before income taxes $ 42,710 $ 7,853 $ (20,031) $ 30,532 3 months ended December 31, 2014 Market Making Global Execution Services Corporate and Other Consolidated Reconciliation of GAAP Revenues to Non-GAAP Revenues: GAAP Revenues $ 238,740 $ 93,369 $ 14,030 $ 346,139 Gain on sale of FCM - (2,116) - (2,116) Non-GAAP Revenues $ 238,740 $ 91,253 $ 14,030 $ 344,023
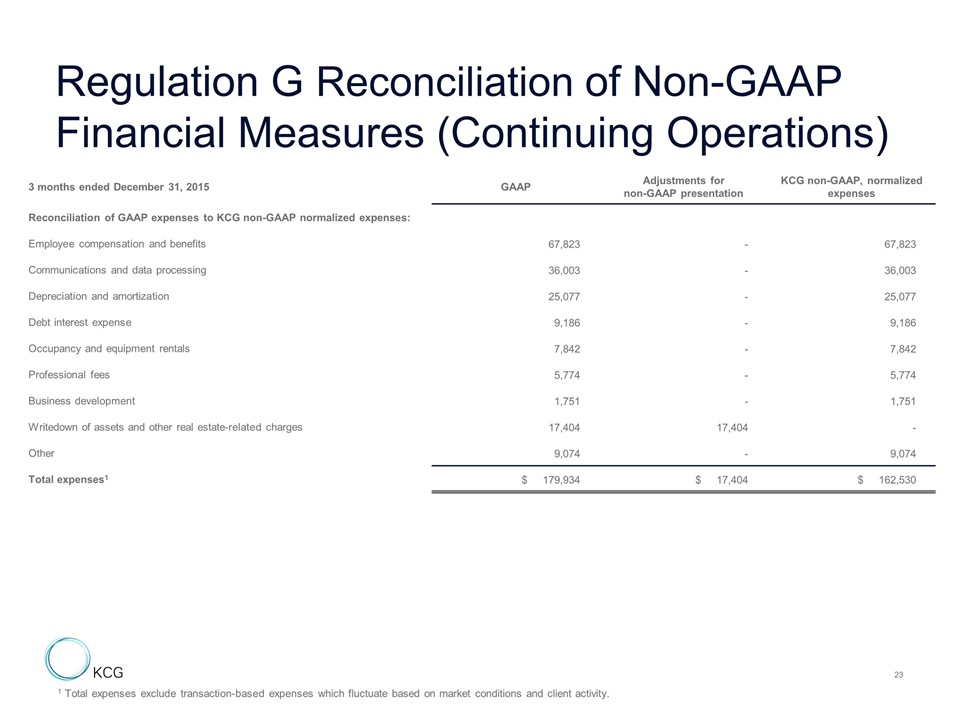
3 months ended December 31, 2015 GAAP Adjustments for non-GAAP presentation KCG non-GAAP, normalized expenses Reconciliation of GAAP expenses to KCG non-GAAP normalized expenses: Employee compensation and benefits 67,823 - 67,823 Communications and data processing 36,003 - 36,003 Depreciation and amortization 25,077 - 25,077 Debt interest expense 9,186 - 9,186 Occupancy and equipment rentals 7,842 - 7,842 Professional fees 5,774 - 5,774 Business development 1,751 - 1,751 Writedown of assets and other real estate-related charges 17,404 17,404 - Other 9,074 - 9,074 Total expenses1 $ 179,934 $ 17,404 $ 162,530 Regulation G Reconciliation of Non-GAAP Financial Measures (Continuing Operations) 1 Total expenses exclude transaction-based expenses which fluctuate based on market conditions and client activity.
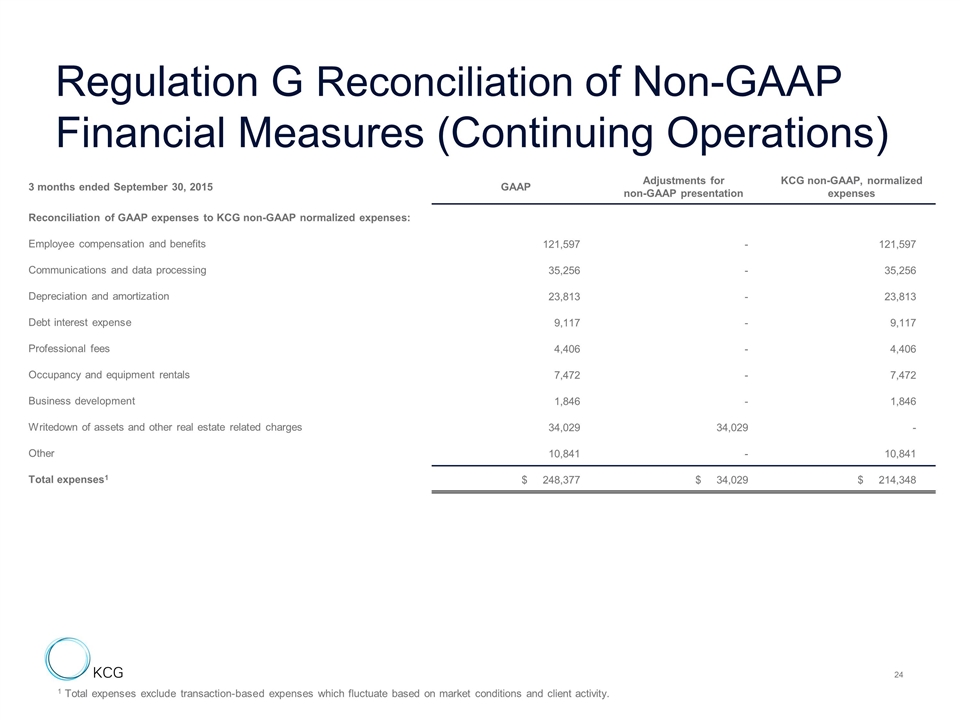
Regulation G Reconciliation of Non-GAAP Financial Measures (Continuing Operations) 3 months ended September 30, 2015 GAAP Adjustments for non-GAAP presentation KCG non-GAAP, normalized expenses Reconciliation of GAAP expenses to KCG non-GAAP normalized expenses: Employee compensation and benefits 121,597 - 121,597 Communications and data processing 35,256 - 35,256 Depreciation and amortization 23,813 - 23,813 Debt interest expense 9,117 - 9,117 Professional fees 4,406 - 4,406 Occupancy and equipment rentals 7,472 - 7,472 Business development 1,846 - 1,846 Writedown of assets and other real estate related charges 34,029 34,029 - Other 10,841 - 10,841 Total expenses1 $ 248,377 $ 34,029 $ 214,348 1 Total expenses exclude transaction-based expenses which fluctuate based on market conditions and client activity.
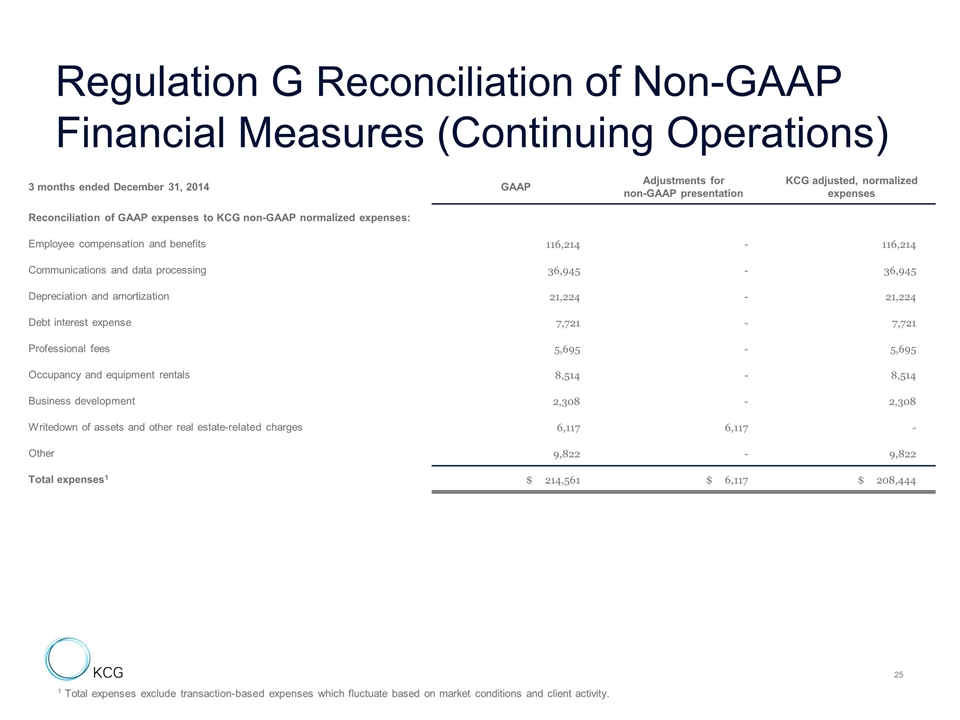
Regulation G Reconciliation of Non-GAAP Financial Measures (Continuing Operations) 3 months ended December 31, 2014 GAAP Adjustments for non-GAAP presentation KCG adjusted, normalized expenses Reconciliation of GAAP expenses to KCG non-GAAP normalized expenses: Employee compensation and benefits 116,214 - 116,214 Communications and data processing 36,945 - 36,945 Depreciation and amortization 21,224 - 21,224 Debt interest expense 7,721 - 7,721 Professional fees 5,695 - 5,695 Occupancy and equipment rentals 8,514 - 8,514 Business development 2,308 - 2,308 Writedown of assets and other real estate-related charges 6,117 6,117 - Other 9,822 - 9,822 Total expenses1 $ 214,561 $ 6,117 $ 208,444 1 Total expenses exclude transaction-based expenses which fluctuate based on market conditions and client activity.

Serious News for Serious Traders! Try StreetInsider.com Premium Free!
You May Also Be Interested In
- Cantein Launches Organic Hemp Protein Powder
- Get Cricket IDs Announces Online Information Resources for Live Cricket Updates, Match Statistics and Mobile Platform Access
- Denise Janette Bruneau Author Announces Never Gone
Create E-mail Alert Related Categories
SEC FilingsSign up for StreetInsider Free!
Receive full access to all new and archived articles, unlimited portfolio tracking, e-mail alerts, custom newswires and RSS feeds - and more!
