




Form 8-K KAPSTONE PAPER & PACKAGI For: Feb 09

FREE Breaking News Alerts from StreetInsider.com!
StreetInsider.com Top Tickers, 10/13/2026
- Nasdaq ends down as chipmakers fall and bank earnings roll in
- Oil prices settle mixed, focus on US-Russia diesel deal, Saudi Yemen attacks
- JPMorgan shares edge lower after third-quarter FICC revenue miss
- Fed’s Waller says US bond yield rise driven by growth, not inflation
- Wells Fargo beats profit estimates despite revenue miss
 Tweet
Tweet Share
Share E-mail
�
�
UNITED STATES
SECURITIES AND EXCHANGE COMMISSION
Washington, D.C. 20549
�
�
FORM�8-K
�
CURRENT REPORT
Pursuant to Section�13 or 15(d)�of the
Securities Exchange Act of 1934
�
February�9, 2015
Date of Report (Date of earliest event reported)
�
KapStone Paper and Packaging Corporation
(Exact Name of Registrant as Specified in its Charter)
�
|
Delaware |
� |
001-33494 |
� |
20-2699372 |
|
(State or other jurisdiction |
� |
(Commission |
� |
(IRS Employer |
�
1101 Skokie Boulevard, Suite�300
Northbrook,�Illinois 60062
(Address of principal executive offices)
�
(847)�239-8800
(Registrant�s telephone number, including area code)
�
Check the appropriate box below if the Form�8-K filing is intended to simultaneously satisfy the filing obligation of the registrant under any of the following provisions:
�
o����������� Written communications pursuant to Rule�425 under the Securities Act (17 CFR 230.425)
�
o����������� Soliciting material pursuant to Rule�14a-12 under the Exchange Act (17 CFR 240.14a-12)
�
o����������� Pre-commencement communications pursuant to Rule�14d-2(b)�under the Exchange Act (17 CFR 240.14d-2(b))
�
o����������� Pre-commencement communications pursuant to Rule�13e-4(c)�under the Exchange Act (17 CFR 240.13e-4(c))
�
�
�
�
Item 2.02������������������������������������������ Results of Operations and Financial Condition.
�
On February�9, 2015, KapStone Paper and Packaging Corporation (�KapStone�) issued a press release announcing fourth quarter and full year 2014 financial results. A copy of the press release is attached hereto as Exhibit�99.1.
�
The information is being furnished under Item 2.02 �Results of Operations and Financial Condition� of Form�8-K. Such information, including the Exhibits attached hereto, shall not be deemed �filed� for purposes of Section�18 of the Securities Exchange Act of 1934, as amended, nor shall it be deemed incorporated by reference in any filing under the Securities Act of 1933, as amended, except as shall be expressly set forth by specific reference in such filing.
�
Item 7.01������������������������������������������ Regulation FD Disclosure
�
On February�10, 2015, the management of KapStone will participate in a conference call discussing KapStone�s earnings for the fourth quarter and year ended December�31, 2014. A copy of a presentation entitled �KapStone�s Fourth Quarter 2014 Financial Review� to be used in the call is attached as Exhibit�99.2 to this report.
�
Item 9.01������������������������������������������ Financial Statements and Exhibits
�
(d)�������������������������������� Exhibits
�
Exhibit�99.1���������������� Fourth quarter and full year 2014 Earnings Press Release dated February�9, 2015
�
Exhibit�99.2���������������� Slides of KapStone Paper and Packaging Corporation dated February�9, 2015
�
�
SIGNATURE
�
Pursuant to the requirements of the Securities and Exchange Act of 1934, the registrant has duly caused this report to be signed on its behalf by the undersigned hereunto duly authorized.
�
|
Date:� February�9, 2015 |
� | ||
|
� |
� | ||
|
� |
KAPSTONE PAPER AND PACKAGING CORPORATION | ||
|
� |
� | ||
|
� |
� |
� | |
|
� |
By: |
/s/ Andrea K. Tarbox | |
|
� |
Name: |
Andrea K. Tarbox | |
|
� |
Title: |
Vice President and Chief Financial Officer | |
�
Exhibit�99.1
�
�
|
FOR FURTHER INFORMATION: |
� |
FOR IMMEDIATE RELEASE |
|
Andrea K. Tarbox |
� |
Monday, February�9, 2015 |
|
Vice President and Chief Financial Officer |
� |
� |
|
847.239.8812 |
� |
� |
�
KAPSTONE REPORTS
FOURTH QUARTER AND RECORD FULL YEAR RESULTS
�
NORTHBROOK,�IL � February�9, 2015 � KapStone Paper and Packaging Corporation (NYSE: KS) today reported preliminary results for the fourth quarter and year ended December�31, 2014.
�
As compared to 2013�s fourth quarter, results for 2014�s fourth quarter are below:
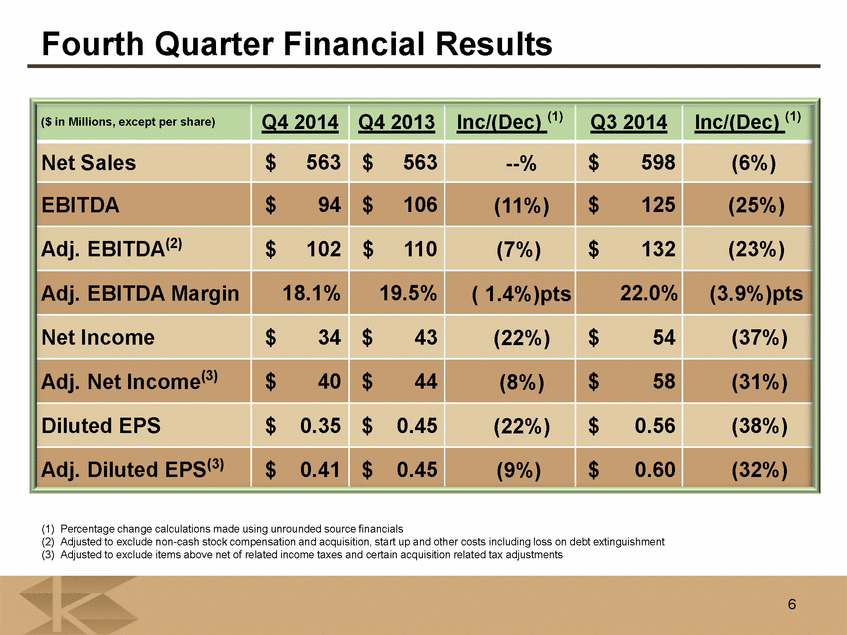
������������������ Net sales of $563 million flat to the prior year
������������������ Net income of $34 million down $9 million, or 22 percent
������������������ Adjusted net income of $40 million down $4 million, or 8 percent
������������������ Adjusted EBITDA of $102 million down $8 million, or 7 percent
������������������ Adjusted EBITDA margin of 18.1 percent, down from 19.5 percent
������������������ Diluted EPS of $0.35 down $0.10 per share, or 22 percent
������������������ Adjusted diluted EPS of $0.41 down $0.04 per share, or 9 percent
�
As compared to the year ended December�31, 2013, results for the year ended December�31, 2014:
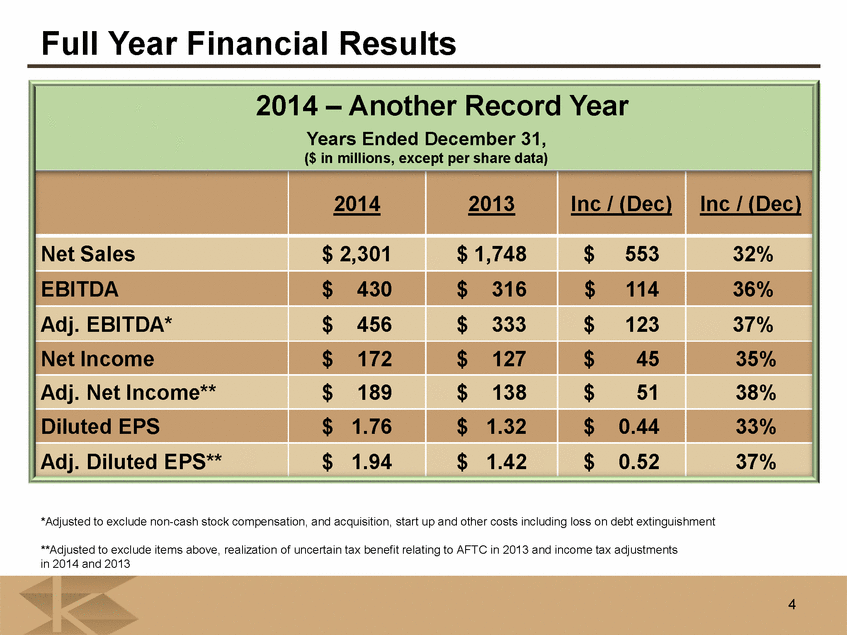
������������������ Net sales of $2,301 million up $553 million, or 32 percent
������������������ Net income of $172 million up $45 million, or 35 percent
������������������ Adjusted net income of $189 million up $51 million, or 38 percent
������������������ Adjusted EBITDA of $456 million up $123 million, or 37 percent
������������������ Adjusted EBITDA margin of 19.8 percent up from 19.1 percent
������������������ Diluted EPS of $1.76 up $0.44 per share, or 33 percent
������������������ Adjusted diluted EPS of $1.94 up $0.52 per share, or 37 percent
�
Roger W. Stone, Chairman and Chief Executive Officer, stated, �Almost every year has been transformational for KapStone, and 2014 was no exception with the successful integration of Longview.� The fourth quarter is typically a weaker quarter for KapStone with annual planned maintenance outages at both our Roanoke Rapids and Cowpens mills and the unfavorable seasonal impacts.� As a result of the seasonality, we took 12,000 tons of market downtime at our Cowpens recycled containerboard mill.� In addition, weak European markets reduced demand for saturating kraft, and therefore, KapStone decreased saturating kraft production by 8,500 tons.� The west coast port slowdown hurt our operations in the fourth quarter and continues to be disruptive.� On a more optimistic note, we are already seeing improvements in our product mix as we move further into this year and have a sound order backlog.
�
�
�KapStone�s strength is best evidenced by its robust operating cash flows which delivered $107 million in the fourth quarter.� The strong cash flows were used to make a $150 million debt prepayment, and the Company initiated a cash dividend plan in December.�
�
Fourth Quarter Operating Highlights
�
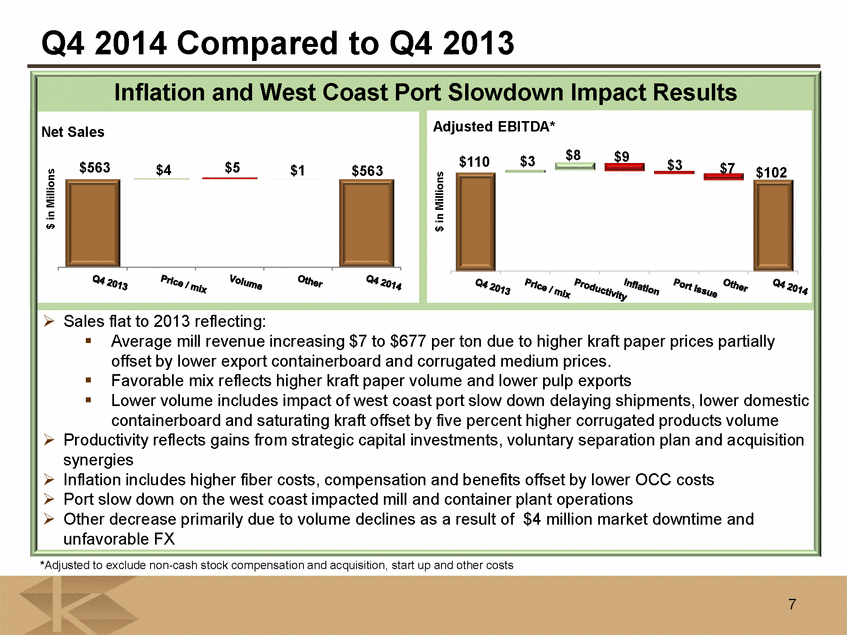
Consolidated net sales of $563 million in the fourth quarter of 2014 were flat compared to 2013. During the current quarter, we experienced some price pressure on exports.� Work slow-downs at west coast ports delayed or reduced some shipments.� The Company sold 687,000 tons of paper during the fourth quarter of 2014 compared to 703,000 tons a year earlier. The Company�s average mill selling price of $677 per ton in the fourth quarter of 2014 increased by $7 per ton compared to the fourth quarter of 2013 due to the combined impact of the 2014 kraft paper and 2013 containerboard price increases, partially offset by lower export containerboard prices and a weaker Euro.� Average mill selling prices decreased $12 per ton from the third quarter of 2014, reflecting the seasonally less favorable product mix and lower export containerboard prices.
�
Operating income of $62 million for the 2014 fourth quarter decreased by $12 million, or 16 percent, compared to the 2013 fourth quarter. Financial performance in the current quarter was down from 2013 mainly due to inflation on fiber and compensation costs, lower export containerboard prices and market downtime for saturating kraft and cycycled containerboard, partially offset by higher prices on kraft paper and productivity improvements.� In addition, work slowdowns at west coast ports reduced operating income by $3 million from lower sales and production volumes, operating inefficiencies, higher freight and distribution costs, and a less favorable product mix.
�
Interest expense was $6 million for the fourth quarter of 2014, down $3 million from a year ago as a result of lower interest rates. At December�31, 2014, the average interest rate on our debt was 1.8 percent compared to 2.5 percent at the end of 2013. Due to the $150 million debt prepayment the Company incurred a $3 million loss on debt extinguishment.
�
The effective income tax rate for the 2014 fourth quarter was 34.6 percent compared to 31.6 percent for the 2013 fourth quarter. The higher effective income tax rate in the 2014 fourth quarter reflects higher state income taxes and a favorable tax reserve reversal in the fourth quarter of 2013.
�
Full Year Operating Highlights
�
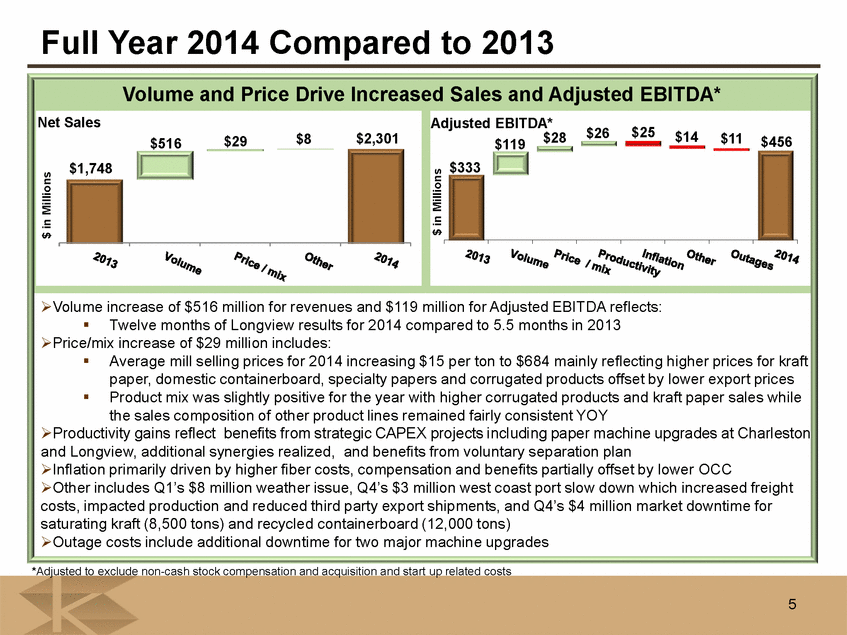
Consolidated net sales for the year ended December�31, 2014, were $2,301 million, an increase of 32 percent, compared to 2013 sales of $1,748 million.� The increase was primarily due to the volume resulting from the Longview acquisition, higher prices and improved mix.
�
Operating income of $300 million for the year ended December�31, 2014 was higher than 2013�s $220 million by 36%.� The increase was due to the full year of Longview results compared to 6 months in 2013, higher selling prices and productivity gains from recent strategic capital investments, partially offset by inflation on fiber and compensation costs and higher maintenance outage costs.
�
�
Interest expense for the year ended December�31, 2014 was $27 million, up $6 million from a year ago due to the full year effect of borrowings relating to the Longview acquisition partially offset by lower interest rates in 2014.� Amortization of debt issuance costs of $6 million for 2014 increased by $2 million from the prior year due to amortization on the $20 million of debt issuance costs paid to finance the Longview acquisition. Loss on debt extinguishment totaled $6 million in 2014 reflecting voluntary debt prepayments.
�
The effective income tax rate for the year ended December�31, 2014 was 34.0 percent compared to 34.7 percent for 2013.� Favorable discrete tax adjustments in 2014 were partially offset by higher state income taxes. For 2014, the Company�s cash tax rate was 30 percent compared to 2 percent in 2013. In 2013, the Company benefitted from the utilization of cellulosic biofuel tax credits.
�
Cash Flow and Working Capital
�
Cash and cash equivalents decreased by $77 million in the quarter ended December�31, 2014, from September�30, 2014 to $28 million.�� The Company generated $107 million of net cash from operating activities during the fourth quarter and made a voluntary debt prepayment of $150 million reducing the debt leverage ratio to 2.38 times, down from 3.8 times at the time of the Longview acquisition.� Capital expenditures in the fourth quarter reached $25 million.
�
For the year ended December�31, 2014, cash and cash equivalents increased by $16 million from December�31, 2013 reflecting cash provided by operating activities of $313 million, cash used for capital expenditures of $137 million and $160 million of cash used for financing activities. Major capital projects completed in the year include paper machine upgrades at the Charleston and Longview mills and upgrades to certain corrugating machines.
�
At December�31, 2014, the Company had approximately $237 million of working capital and $396 million of revolver borrowing capacity.
�
Conclusion
�
In summary, Stone commented, �Our balance sheet and cash flow generation are very strong, and we are well-poised and determined to continue to grow this company profitably.�
�
Conference Call
�
KapStone will host a conference call at 11�a.m. ET, Tuesday, February�10, 2015, to discuss the Company�s financial results for the 2014 fourth quarter. All interested parties are invited to listen and may do so by either accessing a simultaneous broadcast webcast on KapStone�s website, http://www.kapstonepaper.com, or for those unable to access the webcast, the following dial-in numbers are available:
�
Domestic: �866.318.8616
International: �617.399.5135
Participant Passcode: �52085066
�
�
A presentation to be viewed in conjunction with the call will also be available on our website, http://www.kapstonepaper.com, in the �Investors� section.
�
Replay of the webcast will be available for 30 days on the Company�s website following the call.
�
About the Company
�
Headquartered in Northbrook,�IL, KapStone Paper and Packaging Corporation is the fifth largest producer of containerboard and corrugated packaging products and is the largest kraft paper producer in the United States. The Company is the parent company of KapStone Kraft Paper Corporation and KapStone Container Corporation which includes four paper mills and 21 converting plants, respectively, across the US. The business employs approximately 4,700 people.
�
Non-GAAP Financial Measures
�
This press release includes certain non-GAAP financial measures, including �EBITDA�, �Adjusted EBITDA�, �Adjusted Net Income�, and �Adjusted Diluted EPS� to measure our operating performance. Management uses these measures to focus on the on-going operations, and believes it is useful to investors because they enable them to perform meaningful comparisons of past and present operating results. The Company believes that EBITDA and Adjusted EBITDA provide useful information to investors because they improve the comparability of the financial results between periods and provide for greater transparency to key measures used to evaluate the performance and liquidity of the Company. Management uses EBITDA and Adjusted EBITDA for evaluating the Company�s performance against competitors and as a primary measure for employees� incentive programs. Reconciliations of Net Income to EBITDA, EBITDA to Adjusted EBITDA, Net Income to Adjusted Net Income, Basic EPS to Adjusted Basic EPS, and Diluted EPS to Adjusted Diluted EPS are included in the financial schedules contained in this press release. However, these measures should not be construed as an alternative to any other measure of performance determined in accordance with GAAP.
�
Forward-Looking Statements
�
Statements in this news release that are not historical are forward-looking statements within the meaning of the Private Securities Litigation Reform Act of 1995. Forward-looking statements can often be identified by words such as �may,� �will,� �should,� �would,� �expect,� �project,� �anticipate,� �intend,� �plan,� �believe,� �estimate,� �potential,� �outlook,� or �continue,� the negative of these terms or other similar expressions. These statements reflect management�s current views and are subject to risks, uncertainties and assumptions, many of which are beyond the Company�s control that could cause actual results to differ materially from those expressed or implied in these statements. Factors that could cause actual results to differ materially include, but are not limited to: (1)�industry conditions, including changes in cost, competition, changes in the Company�s product mix and demand and pricing for the Company�s products; (2)�market and economic factors, including changes in raw material and healthcare costs, exchange rates and interest rates; (3)�results of legal proceedings and compliance costs, including unanticipated expenditures related to the cost of compliance with environmental and other governmental
�
�
regulations; (4)�the ability to achieve and effectively manage growth; (5)�the ability to pay the Company�s debt obligations; (6)�the ability to carry out the Company�s strategic initiatives and manage associated costs and (7)�the integration of the Longview acquisition. Further information on these and other risks and uncertainties is provided under Item 1A �Risk Factors� in the Company�s Annual Report on Form�10-K for the year ended December�31, 2013 and elsewhere in reports that the Company files with the SEC. These filings can be found on KapStone�s Web site at http://www.kapstonepaper.com and the SEC�s Web site at www.sec.gov. Forward-looking statements included herein speak only as of the date hereof and the Company disclaims any obligation to revise or update such statements to reflect events or circumstances after the date hereof or to reflect the occurrence of unanticipated events or circumstances.
�
�
KapStone Paper and Packaging Corporation
Consolidated Statements of Income
(In thousands, except share and per share amounts)
(preliminary and unaudited)
�
|
� |
� |
� |
� |
� |
� |
Fav�/�(Unfav) |
� |
� |
� |
� |
� |
Fav�/�(Unfav) |
� | ||||
|
� |
� |
Quarter�Ended�December�31, |
� |
Variance |
� |
Year�Ended�December�31, |
� |
Variance |
� | ||||||||
|
� |
� |
2014 |
� |
2013 |
� |
% |
� |
2014 |
� |
2013 |
� |
% |
� | ||||
|
Net sales |
� |
$ |
563,413 |
� |
$ |
563,425 |
� |
0.0 |
% |
$ |
2,300,920 |
� |
$ |
1,748,162 |
� |
31.6 |
% |
|
Cost and expenses: |
� |
� |
� |
� |
� |
� |
� |
� |
� |
� |
� |
� |
� | ||||
|
Cost of sales, excluding depreciation and amortization |
� |
387,397 |
� |
383,885 |
� |
-0.9 |
% |
1,551,531 |
� |
1,186,930 |
� |
-30.7 |
% | ||||
|
Depreciation and amortization |
� |
34,968 |
� |
32,436 |
� |
-7.8 |
% |
136,548 |
� |
95,435 |
� |
-43.1 |
% | ||||
|
Freight and distribution expenses |
� |
44,072 |
� |
40,524 |
� |
-8.8 |
% |
175,901 |
� |
135,972 |
� |
-29.4 |
% | ||||
|
Selling, general and administrative expenses |
� |
34,638 |
� |
32,874 |
� |
-5.4 |
% |
137,009 |
� |
110,612 |
� |
-23.9 |
% | ||||
|
Other operating income |
� |
� |
� |
100 |
� |
-100.0 |
% |
� |
� |
675 |
� |
-100.0 |
% | ||||
|
Operating income |
� |
62,338 |
� |
73,806 |
� |
-15.5 |
% |
299,931 |
� |
219,888 |
� |
36.4 |
% | ||||
|
� |
� |
� |
� |
� |
� |
� |
� |
� |
� |
� |
� |
� |
� | ||||
|
Foreign exchange gain / (loss) |
� |
(363 |
) |
95 |
� |
-482.1 |
% |
(1,222 |
) |
232 |
� |
-626.7 |
% | ||||
|
Loss on debt extinguishment |
� |
2,654 |
� |
� |
� |
n/a |
� |
5,617 |
� |
� |
� |
n/a |
� | ||||
|
Interest expense, net |
� |
5,911 |
� |
8,823 |
� |
33.0 |
% |
26,795 |
� |
20,641 |
� |
-29.8 |
% | ||||
|
Amortization of debt issuance costs |
� |
1,281 |
� |
1,485 |
� |
13.7 |
% |
5,696 |
� |
4,489 |
� |
-26.9 |
% | ||||
|
Income before provision for income taxes |
� |
52,129 |
� |
63,593 |
� |
-18.0 |
% |
260,601 |
� |
194,990 |
� |
33.6 |
% | ||||
|
Provision for income taxes |
� |
18,026 |
� |
20,119 |
� |
10.4 |
% |
88,686 |
� |
67,652 |
� |
-31.1 |
% | ||||
|
Net income |
� |
$ |
34,103 |
� |
$ |
43,474 |
� |
-21.6 |
% |
$ |
171,915 |
� |
$ |
127,338 |
� |
35.0 |
% |
|
� |
� |
� |
� |
� |
� |
� |
� |
� |
� |
� |
� |
� |
� | ||||
|
Net income per share: |
� |
� |
� |
� |
� |
� |
� |
� |
� |
� |
� |
� |
� | ||||
|
Basic |
� |
$ |
0.36 |
� |
$ |
0.45 |
� |
� |
� |
$ |
1.79 |
� |
$ |
1.34 |
� |
� |
� |
|
Diluted |
� |
$ |
0.35 |
� |
$ |
0.45 |
� |
� |
� |
$ |
1.76 |
� |
$ |
1.32 |
� |
� |
� |
|
� |
� |
� |
� |
� |
� |
� |
� |
� |
� |
� |
� |
� |
� | ||||
|
Weighted-average number of shares outstanding: |
� |
� |
� |
� |
� |
� |
� |
� |
� |
� |
� |
� |
� | ||||
|
Basic |
� |
96,025,480 |
� |
95,552,335 |
� |
� |
� |
95,900,179 |
� |
95,258,756 |
� |
� |
� | ||||
|
Diluted |
� |
97,562,816 |
� |
97,112,699 |
� |
� |
� |
97,459,184 |
� |
96,739,482 |
� |
� |
� | ||||
|
� |
� |
� |
� |
� |
� |
� |
� |
� |
� |
� |
� |
� |
� | ||||
|
Effective income tax rate |
� |
34.6 |
% |
31.6 |
% |
� |
� |
34.0 |
% |
34.7 |
% |
� |
� | ||||
|
� |
� |
� |
� |
� |
� |
� |
� |
� |
� |
� |
� |
� |
� | ||||
|
Net Income (GAAP) to EBITDA (Non-GAAP) to Adjusted EBITDA (Non-GAAP): |
� |
� |
� |
� |
� | ||||||||||||
|
� |
� |
� |
� |
� |
� |
� |
� |
� |
� |
� |
� |
� |
� | ||||
|
Net income (GAAP) |
� |
$ |
34,103 |
� |
$ |
43,474 |
� |
-21.6 |
% |
$ |
171,915 |
� |
$ |
127,338 |
� |
35.0 |
% |
|
Interest expense, net |
� |
5,911 |
� |
8,823 |
� |
33.0 |
% |
26,795 |
� |
20,641 |
� |
-29.8 |
% | ||||
|
Amortization of debt issuance costs |
� |
1,281 |
� |
1,485 |
� |
13.7 |
% |
5,696 |
� |
4,489 |
� |
-26.9 |
% | ||||
|
Provision for income taxes |
� |
18,026 |
� |
20,119 |
� |
10.4 |
% |
88,686 |
� |
67,652 |
� |
-31.1 |
% | ||||
|
Depreciation and amortization |
� |
34,968 |
� |
32,436 |
� |
-7.8 |
% |
136,548 |
� |
95,435 |
� |
-43.1 |
% | ||||
|
EBITDA (Non-GAAP) |
� |
$ |
94,289 |
� |
$ |
106,337 |
� |
-11.3 |
% |
$ |
429,640 |
� |
$ |
315,555 |
� |
36.2 |
% |
|
� |
� |
� |
� |
� |
� |
� |
� |
� |
� |
� |
� |
� |
� | ||||
|
Acquisition, start up and other expenses |
� |
3,174 |
� |
2,698 |
� |
-17.6 |
% |
6,524 |
� |
12,238 |
� |
46.7 |
% | ||||
|
Voluntary separation plan |
� |
563 |
� |
� |
� |
� |
� |
6,846 |
� |
� |
� |
� |
� | ||||
|
Stock-based compensation expense |
� |
1,326 |
� |
932 |
� |
-42.3 |
% |
6,956 |
� |
5,203 |
� |
-33.7 |
% | ||||
|
Loss on debt extinguishment |
� |
2,654 |
� |
� |
� |
� |
� |
5,617 |
� |
� |
� |
� |
� | ||||
|
Adjusted EBITDA (Non-GAAP) |
� |
$ |
102,006 |
� |
$ |
109,967 |
� |
-7.2 |
% |
$ |
455,583 |
� |
$ |
332,996 |
� |
36.8 |
% |
|
� |
� |
� |
� |
� |
� |
� |
� |
� |
� |
� |
� |
� |
� | ||||
|
Net Income (GAAP) to Adjusted Net Income (Non-GAAP): |
� |
� |
� |
� |
� |
� |
� | ||||||||||
|
Net income (GAAP) |
� |
$ |
34,103 |
� |
$ |
43,474 |
� |
� |
� |
$ |
171,915 |
� |
$ |
127,338 |
� |
� |
� |
|
Acquisition, start up and other expenses |
� |
2,079 |
� |
1,740 |
� |
� |
� |
4,273 |
� |
7,894 |
� |
� |
� | ||||
|
Voluntary separation plan |
� |
369 |
� |
� |
� |
� |
� |
4,484 |
� |
� |
� |
� |
� | ||||
|
Stock-based compensation expense |
� |
869 |
� |
601 |
� |
� |
� |
4,556 |
� |
3,356 |
� |
� |
� | ||||
|
Loss on debt extinguishment |
� |
1,738 |
� |
� |
� |
� |
� |
3,679 |
� |
� |
� |
� |
� | ||||
|
Reversal of uncertain tax position |
� |
� |
� |
(5,001 |
) |
� |
� |
� |
� |
(5,001 |
) |
� |
� | ||||
|
Deferred tax adjustment due to rate change |
� |
1,235 |
� |
2,296 |
� |
� |
� |
1,235 |
� |
2,296 |
� |
� |
� | ||||
|
Tax adjustment - Longview acquisition |
� |
(405 |
) |
475 |
� |
� |
� |
(684 |
) |
1,881 |
� |
� |
� | ||||
|
Adjusted Net Income (Non-GAAP) |
� |
$ |
39,988 |
� |
$ |
43,585 |
� |
� |
� |
$ |
189,458 |
� |
$ |
137,764 |
� |
� |
� |
|
� |
� |
� |
� |
� |
� |
� |
� |
� |
� |
� |
� |
� |
� | ||||
|
Basic EPS (GAAP) to Adjusted Basic EPS (Non-GAAP): |
� |
� |
� |
� |
� |
� |
� |
� |
� | ||||||||
|
Basic EPS (GAAP) |
� |
$ |
0.36 |
� |
$ |
0.45 |
� |
� |
� |
$ |
1.79 |
� |
$ |
1.34 |
� |
� |
� |
|
Acquisition, start up and other expenses |
� |
0.02 |
� |
0.02 |
� |
� |
� |
0.04 |
� |
0.08 |
� |
� |
� | ||||
|
Voluntary separation plan |
� |
� |
� |
� |
� |
� |
� |
0.05 |
� |
� |
� |
� |
� | ||||
|
Stock-based compensation expense |
� |
0.01 |
� |
0.02 |
� |
� |
� |
0.05 |
� |
0.04 |
� |
� |
� | ||||
|
Loss on debt extinguishment |
� |
0.02 |
� |
� |
� |
� |
� |
0.04 |
� |
� |
� |
� |
� | ||||
|
Reversal of uncertain tax position |
� |
� |
� |
(0.05 |
) |
� |
� |
� |
� |
(0.05 |
) |
� |
� | ||||
|
Deferred tax adjustment due to rate change |
� |
0.01 |
� |
0.02 |
� |
� |
� |
0.01 |
� |
0.02 |
� |
� |
� | ||||
|
Tax adjustment - Longview acquisition |
� |
� |
� |
� |
� |
� |
� |
� |
� |
0.02 |
� |
� |
� | ||||
|
Adjusted Basic EPS (Non-GAAP) |
� |
$ |
0.42 |
� |
$ |
0.46 |
� |
� |
� |
$ |
1.98 |
� |
$ |
1.45 |
� |
� |
� |
|
� |
� |
� |
� |
� |
� |
� |
� |
� |
� |
� |
� |
� |
� | ||||
|
Diluted EPS (GAAP) to Adjusted Diluted EPS (Non-GAAP): |
� |
� |
� |
� |
� |
� |
� | ||||||||||
|
Diluted earnings per share (GAAP) |
� |
$ |
0.35 |
� |
$ |
0.45 |
� |
� |
� |
$ |
1.76 |
� |
$ |
1.32 |
� |
� |
� |
|
Acquisition, start up and other expenses |
� |
0.02 |
� |
0.02 |
� |
� |
� |
0.04 |
� |
0.08 |
� |
� |
� | ||||
|
Voluntary separation plan |
� |
� |
� |
� |
� |
� |
� |
0.05 |
� |
� |
� |
� |
� | ||||
|
Stock-based compensation expense |
� |
0.01 |
� |
0.01 |
� |
� |
� |
0.05 |
� |
0.03 |
� |
� |
� | ||||
|
Loss on debt extinguishment |
� |
0.02 |
� |
� |
� |
� |
� |
0.04 |
� |
� |
� |
� |
� | ||||
|
Reversal of uncertain tax position |
� |
� |
� |
(0.05 |
) |
� |
� |
� |
� |
(0.05 |
) |
� |
� | ||||
|
Deferred tax adjustment due to rate change |
� |
0.01 |
� |
0.02 |
� |
� |
� |
0.01 |
� |
0.02 |
� |
� |
� | ||||
|
Tax adjustment - Longview acquisition |
� |
� |
� |
� |
� |
� |
� |
(0.01 |
) |
0.02 |
� |
� |
� | ||||
|
Adjusted Diluted EPS (Non-GAAP) |
� |
$ |
0.41 |
� |
$ |
0.45 |
� |
� |
� |
$ |
1.94 |
� |
$ |
1.42 |
� |
� |
� |
�
�
KapStone Paper and Packaging Corporation
Consolidated Balance Sheets
(In thousands)
�
|
� |
� |
December�31, |
� |
December�31, |
� | ||
|
� |
� |
2014 |
� |
2013 |
� | ||
|
� |
� |
(preliminary�and�unaudited) |
� |
� |
� | ||
|
Assets |
� |
� |
� |
� |
� | ||
|
Current assets: |
� |
� |
� |
� |
� | ||
|
Cash and cash equivalents |
� |
$ |
28,467 |
� |
$ |
12,967 |
� |
|
Trade accounts receivable, net of allowances |
� |
228,740 |
� |
232,347 |
� | ||
|
Other receivables |
� |
12,833 |
� |
11,399 |
� | ||
|
Inventories |
� |
238,329 |
� |
217,382 |
� | ||
|
Prepaid expenses and other current assets |
� |
7,172 |
� |
6,405 |
� | ||
|
Total current assets |
� |
515,541 |
� |
480,500 |
� | ||
|
� |
� |
� |
� |
� |
� | ||
|
Plant, property and equipment, net |
� |
1,386,670 |
� |
1,389,609 |
� | ||
|
Other assets |
� |
10,135 |
� |
129,493 |
� | ||
|
Intangible assets, net |
� |
110,077 |
� |
123,745 |
� | ||
|
Goodwill |
� |
533,851 |
� |
528,515 |
� | ||
|
Total assets |
� |
$ |
2,556,274 |
� |
$ |
2,651,862 |
� |
|
� |
� |
� |
� |
� |
� | ||
|
Liabilities and Stockholders� Equity |
� |
� |
� |
� |
� | ||
|
Current liabilities: |
� |
� |
� |
� |
� | ||
|
Current portion of long-term debt |
� |
$ |
� |
� |
$ |
4,950 |
� |
|
Other current borrowings |
� |
� |
� |
� |
� | ||
|
Dividend payable |
� |
9,911 |
� |
� |
� | ||
|
Accounts payable |
� |
149,600 |
� |
159,127 |
� | ||
|
Accrued expenses |
� |
48,340 |
� |
45,885 |
� | ||
|
Accrued compensation costs |
� |
62,491 |
� |
54,871 |
� | ||
|
Accrued income taxes |
� |
6,477 |
� |
� |
� | ||
|
Deferred income taxes |
� |
1,990 |
� |
5,445 |
� | ||
|
Total current liabilities |
� |
278,809 |
� |
270,278 |
� | ||
|
� |
� |
� |
� |
� |
� | ||
|
Long-term debt, net of current portion |
� |
1,046,063 |
� |
1,192,413 |
� | ||
|
Pension and post-retirement benefits |
� |
32,800 |
� |
69,611 |
� | ||
|
Deferred income taxes |
� |
412,293 |
� |
444,672 |
� | ||
|
Other liabilities |
� |
8,182 |
� |
8,808 |
� | ||
|
Total other liabilities |
� |
1,499,338 |
� |
1,715,504 |
� | ||
|
� |
� |
� |
� |
� |
� | ||
|
Stockholders� equity: |
� |
� |
� |
� |
� | ||
|
Common stock $0.0001 par value |
� |
10 |
� |
10 |
� | ||
|
Additional paid-in capital |
� |
255,505 |
� |
246,186 |
� | ||
|
Retained earnings |
� |
574,601 |
� |
412,349 |
� | ||
|
Accumulated other comprehensive (loss) income |
� |
(51,989 |
) |
7,535 |
� | ||
|
Total stockholders� equity |
� |
778,127 |
� |
666,080 |
� | ||
|
Total liabilities and stockholders� equity |
� |
$ |
2,556,274 |
� |
$ |
2,651,862 |
� |
�
�
KapStone Paper and Packaging Corporation
Consolidated Statements of Cash Flows
(In thousands)
(unaudited)
�
|
� |
� |
Quarter�Ended�December�31, |
� |
Yrear�Ended�December�31, |
� | ||||||||
|
� |
� |
2014 |
� |
2013 |
� |
2014 |
� |
2013 |
� | ||||
|
Operating activities: |
� |
� |
� |
� |
� |
� |
� |
� |
� | ||||
|
Net income |
� |
$ |
34,103 |
� |
$ |
43,474 |
� |
$ |
171,915 |
� |
$ |
127,338 |
� |
|
Adjustments to reconcile net income to net cash provided by operating activities: |
� |
� |
� |
� |
� |
� |
� |
� |
� | ||||
|
Depreciation and amortization |
� |
34,968 |
� |
32,436 |
� |
136,548 |
� |
95,435 |
� | ||||
|
Stock-based compensation expense |
� |
1,326 |
� |
932 |
� |
6,956 |
� |
5,203 |
� | ||||
|
Pension and postretirement |
� |
(1,584 |
) |
(2,595 |
) |
(11,523 |
) |
(3,908 |
) | ||||
|
Excess tax benefits from stock-based compensation |
� |
311 |
� |
(984 |
) |
(2,649 |
) |
(3,531 |
) | ||||
|
Amortization of debt issuance costs |
� |
1,281 |
� |
1,485 |
� |
5,696 |
� |
4,489 |
� | ||||
|
Loss on debt extinguishment |
� |
2,654 |
� |
� |
� |
5,617 |
� |
� |
� | ||||
|
Loss on disposal of fixed assets |
� |
3,049 |
� |
622 |
� |
4,252 |
� |
1,012 |
� | ||||
|
Deferred income taxes |
� |
3,622 |
� |
25,352 |
� |
2,455 |
� |
59,865 |
� | ||||
|
Changes in operating assets and liabilities |
� |
27,419 |
� |
29,089 |
� |
(6,069 |
) |
12,791 |
� | ||||
|
Net cash provided by operating activities |
� |
$ |
107,149 |
� |
$ |
129,811 |
� |
$ |
313,198 |
� |
$ |
298,694 |
� |
|
� |
� |
� |
� |
� |
� |
� |
� |
� |
� | ||||
|
Investing activities: |
� |
� |
� |
� |
� |
� |
� |
� |
� | ||||
|
Longview acquisition, net of cash acquired |
� |
� |
� |
(774 |
) |
� |
� |
(538,239 |
) | ||||
|
Capital expenditures |
� |
(24,865 |
) |
(40,435 |
) |
(137,232 |
) |
(96,706 |
) | ||||
|
Net cash used in investing activities |
� |
$ |
(24,865 |
) |
$ |
(41,209 |
) |
$ |
(137,232 |
) |
$ |
(634,945 |
) |
|
� |
� |
� |
� |
� |
� |
� |
� |
� |
� | ||||
|
Financing activities: |
� |
� |
� |
� |
� |
� |
� |
� |
� | ||||
|
Proceeds from revolving credit facility |
� |
$ |
� |
� |
$ |
32,500 |
� |
$ |
97,900 |
� |
$ |
321,613 |
� |
|
Repayments on revolving credit facility |
� |
� |
� |
(69,000 |
) |
(97,900 |
) |
(385,113 |
) | ||||
|
Proceeds from receivables credit facility |
� |
� |
� |
� |
� |
175,000 |
� |
� |
� | ||||
|
Repayments on receivables credit facility |
� |
(8,000 |
) |
� |
� |
(8,000 |
) |
� |
� | ||||
|
Proceeds from long-term debt |
� |
� |
� |
� |
� |
� |
� |
1,275,000 |
� | ||||
|
Repayments on long-term debt |
� |
(150,000 |
) |
(51,237 |
) |
(328,525 |
) |
(356,550 |
) | ||||
|
Redemption of Longview senior notes |
� |
� |
� |
� |
� |
� |
� |
(507,520 |
) | ||||
|
Special cash dividend |
� |
(223 |
) |
� |
� |
(223 |
) |
� |
� | ||||
|
Payment of loan amendment and debt issuance costs |
� |
� |
� |
� |
� |
(1,081 |
) |
(19,654 |
) | ||||
|
Proceeds from other current borrowings |
� |
� |
� |
� |
� |
6,300 |
� |
5,115 |
� | ||||
|
Repayments on other current borrowings |
� |
(1,162 |
) |
(1,376 |
) |
(6,300 |
) |
(5,115 |
) | ||||
|
Payment of withholding taxes on stock awards |
� |
� |
� |
� |
� |
(1,755 |
) |
(860 |
) | ||||
|
Proceeds from exercises of stock options |
� |
230 |
� |
307 |
� |
869 |
� |
1,934 |
� | ||||
|
Proceeds from issuance of shares to ESPP |
� |
� |
� |
� |
� |
600 |
� |
349 |
� | ||||
|
Excess tax benefits from stock-based compensation |
� |
(311 |
) |
984 |
� |
2,649 |
� |
3,531 |
� | ||||
|
Net cash provided by (used in) financing activities |
� |
$ |
(159,466 |
) |
$ |
(87,822 |
) |
$ |
(160,466 |
) |
$ |
332,730 |
� |
|
� |
� |
� |
� |
� |
� |
� |
� |
� |
� | ||||
|
Net increase / (decrease) in cash and cash equivalents |
� |
(77,182 |
) |
780 |
� |
15,500 |
� |
(3,521 |
) | ||||
|
Cash and cash equivalents-beginning of period |
� |
105,649 |
� |
12,187 |
� |
12,967 |
� |
16,488 |
� | ||||
|
Cash and cash equivalents-end of period |
� |
$ |
28,467 |
� |
$ |
12,967 |
� |
$ |
28,467 |
� |
$ |
12,967 |
� |
�
Exhibit 99.2
�
|
|
2014 Fourth Quarter and Full Year Review Roger W. Stone Chairman and Chief Executive Officer Andrea K. Tarbox Vice President and Chief Financial Officer February 9, 2015 |
�
|
|
Forward Looking Statements Forward-Looking Statements The information in this presentation and statements made during this presentation may contain certain forward-looking statements within the meaning of federal securities laws. These statements reflect management�s expectations regarding future events and operating performance. Risk Factors These forward-looking statements involve a number of risks and uncertainties. A list of the factors that could cause actual results to differ materially from those expressed in, or underlying, any forward-looking statements can be found in the Company�s filings with the Securities and Exchange Commission, such as its annual and quarterly reports. The Company disclaims any obligation to revise or update such statements to reflect the occurrence of events after the date of this presentation. Non-GAAP Financial Measures This presentation refers to non-U.S. GAAP financial information. A reconciliation of non-U.S. GAAP to U.S. GAAP financial measures is available on the company�s website at KapStonepaper.com under Investors. 2 |
�
|
|
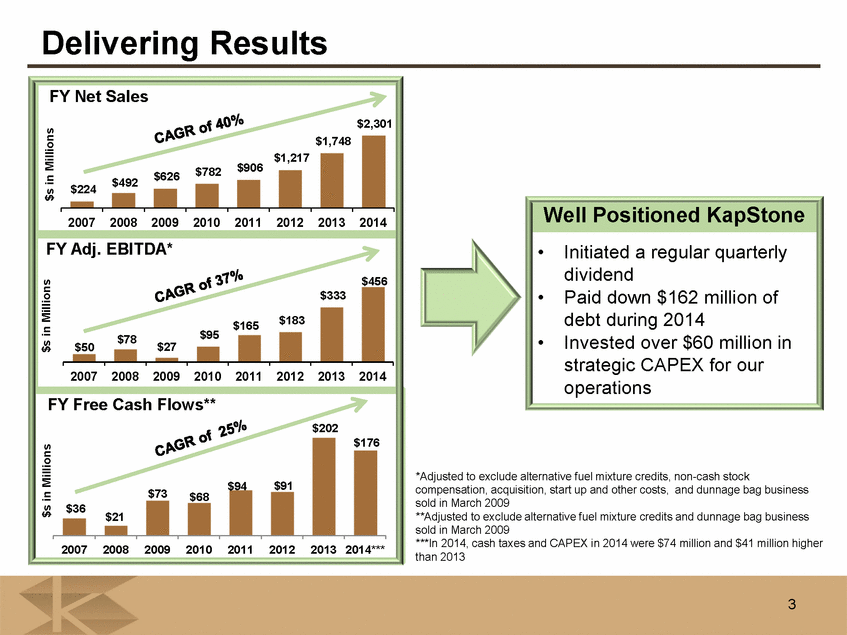
�Delivering Results Well Positioned KapStone Initiated a regular quarterly dividend Paid down $162 million of debt during 2014 Invested over $60 million in strategic CAPEX for our operations *Adjusted to exclude alternative fuel mixture credits, non-cash stock compensation, acquisition, start up and other costs, and dunnage bag business sold in March 2009 **Adjusted to exclude alternative fuel mixture credits and dunnage bag business sold in March 2009 ***In 2014, cash taxes and CAPEX in 2014 were $74 million and $41 million higher than 2013 3 |
�
|
|
�Full Year Financial Results 2014 � Another Record Year Years Ended December 31, ($�in millions, except per share data) 2014 2013 Inc / (Dec) Inc / (Dec) Net Sales $�2,301 $�1,748 $�553 32% EBITDA $�430 $�316 $�114 36% Adj. EBITDA* $�456 $�333 $�123 37% Net Income $�172 $�127 $�45 35% Adj. Net Income** $�189 $�138 $�51 38% Diluted EPS $�1.76 $�1.32 $�0.44 33% Adj. Diluted EPS** $�1.94 $�1.42 $�0.52 37% **Adjusted to exclude items above, realization of uncertain tax benefit relating to AFTC in 2013 and income tax adjustments in 2014 and 2013 *Adjusted to exclude non-cash stock compensation, and acquisition, start up and other costs including loss on debt extinguishment 4 |
�
|
|
�Full Year 2014 Compared to 2013 olume increase of $516 million for revenues and $119 million for Adjusted EBITDA reflects: � Twelve months of Longview results for 2014 compared to 5.5 months in 2013 >Price/mix increase of $29 million includes: � Average mill selling prices for 2014 increasing $15 per ton to $684 mainly reflecting higher prices for kraft paper, domestic containerboard, specialty papers and corrugated products offset by lower export prices � Product mix was slightly positive for the year with higher corrugated products and kraft paper sales while the sales composition of other product lines remained fairly consistent YOY >Productivity gains reflect benefits from strategic CAPEX projects including paper machine upgrades at Charleston and Longview, additional synergies realized, and benefits from voluntary separation plan >Inflation primarily driven by higher fiber costs, compensation and benefits partially offset by lower OCC >Other includes Q1 �s $8 million weather issue, Q4�s $3 million west coast port slow down which increased freight costs, impacted production and reduced third party export shipments, and Q4�s $4 million market downtime for saturating kraft (8,500 tons) and recycled containerboard (12,000 tons) >Outage costs include additional downtime for two major machine upgrades *Adjusted to exclude non-cash stock compensation and acquisition and start up related costs 5 |
�
|
|
�Fourth Quarter Financial Results ($�in Millions, except per share) Q4 2014 Q4 2013 Inc/(Dec) (1) Q3 2014 Inc/(Dec) (1) Net Sales $�563 $�563 --% $�598 (6%) EBITDA $�94 $�106 (11%) $�125 (25%) Adj. EBITDA(2) $�102 $�110 (7%) $�132 (23%) Adj. EBITDA Margin 18.1% 19.5% ( 1.4%)pts 22.0% (3.9%)pts Net Income $�34 $�43 (22%) $�54 (37%) Adj. Net Income(3) $�40 $�44 (8%) $�58 (31%) Diluted EPS $�0.35 $�0.45 (22%) $�0.56 (38%) Adj. Diluted EPS(3) $�0.41 $�0.45 (9%) $�0.60 (32%) (1) Percentage change calculations made using unrounded source financials (2) Adjusted to exclude non-cash stock compensation and acquisition, start up and other costs including loss on debt extinguishment (3) Adjusted to exclude items above net of related income taxes and certain acquisition related tax adjustments 6 |
�
|
|
Q4 2014 Compared to Q4 2013 Sales flat to 2013 reflecting: Average mill revenue increasing $7 to $677 per ton due to higher kraft paper prices partially offset by lower export containerboard and corrugated medium prices. Favorable mix reflects higher kraft paper volume and lower pulp exports Lower volume includes impact of west coast port slow down delaying shipments, lower domestic containerboard and saturating kraft offset by five percent higher corrugated products volume Productivity reflects gains from strategic capital investments, voluntary separation plan and acquisition synergies Inflation includes higher fiber costs, compensation and benefits offset by lower OCC costs Port slow down on the west coast impacted mill and container plant operations Other decrease primarily due to volume declines as a result of $4 million market downtime and unfavorable FX *Adjusted to exclude non-cash stock compensation and acquisition, start up and other costs 7 |
�
|
|
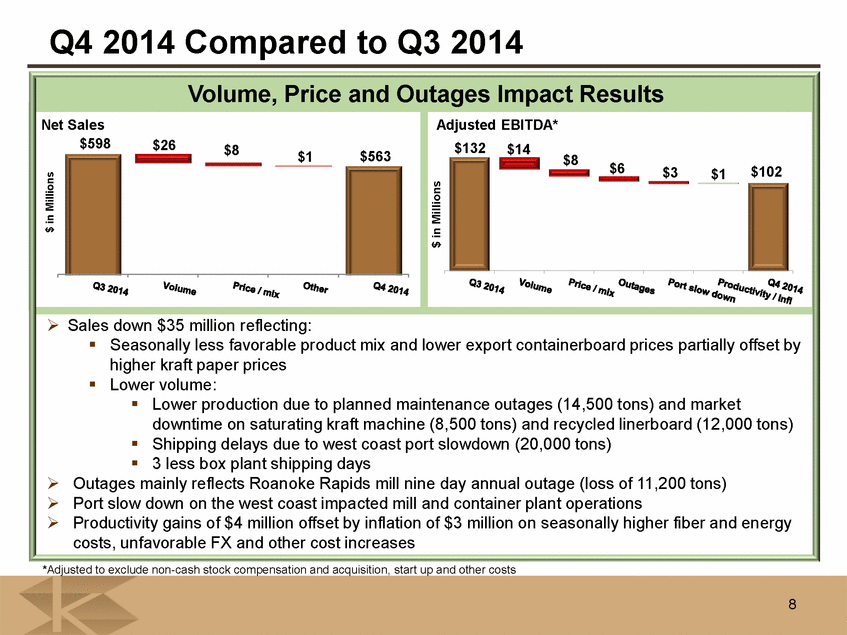
Q4 2014 Compared to Q3 2014 Volume, Price and Outages Impact Results Net Sales Adjusted EBITDA* $598 $26 $132 $14 $8 $1 $563 $8 $6 $3 $1 $102 $�in Millions $�in Millions Sales down $35 million reflecting: Seasonally less favorable product mix and lower export containerboard prices partially offset by higher kraft paper prices Lower volume: Lower production due to planned maintenance outages (14,500 tons) and market downtime on saturating kraft machine (8,500 tons) and recycled linerboard (12,000 tons) Shipping delays due to west coast port slowdown (20,000 tons) 3 less box plant shipping days Outages mainly reflects Roanoke Rapids mill nine day annual outage (loss of 11,200 tons) Port slow down on the west coast impacted mill and container plant operations Productivity gains of $4 million offset by inflation of $3 million on seasonally higher fiber and energy costs, unfavorable FX and other cost increases *Adjusted to exclude non-cash stock compensation and acquisition, start up and other costs 8 |
�
|
|
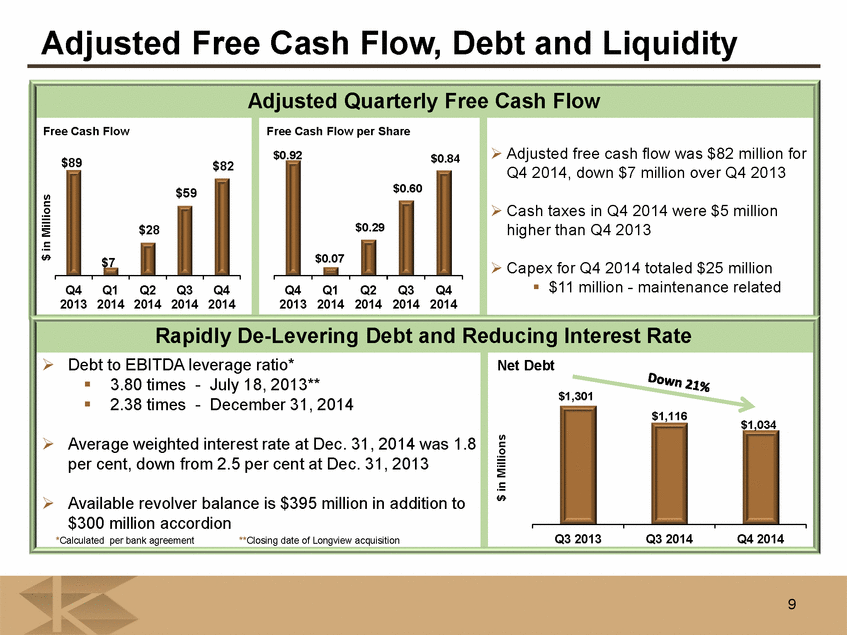
�Adjusted Free Cash Flow, Debt and Liquidity Adjusted Quarterly Free Cash Flow Adjusted free cash flow was $82 million for Q4 2014, down $7 million over Q4 2013 Cash taxes in Q4 2014 were $5 million higher than Q4 2013 Capex for Q4 2014 totaled $25 million $11 million - maintenance related Rapidly De-Levering Debt and Reducing Interest Rate Debt to EBITDA leverage ratio* Net Debt 3.80 times - July 18, 2013** $1,301 2.38 times - December 31, 2014 $1,116 $1,034 Average weighted interest rate at Dec. 31, 2014 was 1.8 per cent, down from 2.5 per cent at Dec. 31, 2013 $�in Millions Available revolver balance is $395 million in addition to $300 million accordion * Calculated per bank agreement **Closing date of Longview acquisition Q3 2013 Q3 2014 Q4 2014 9 |
�
|
|
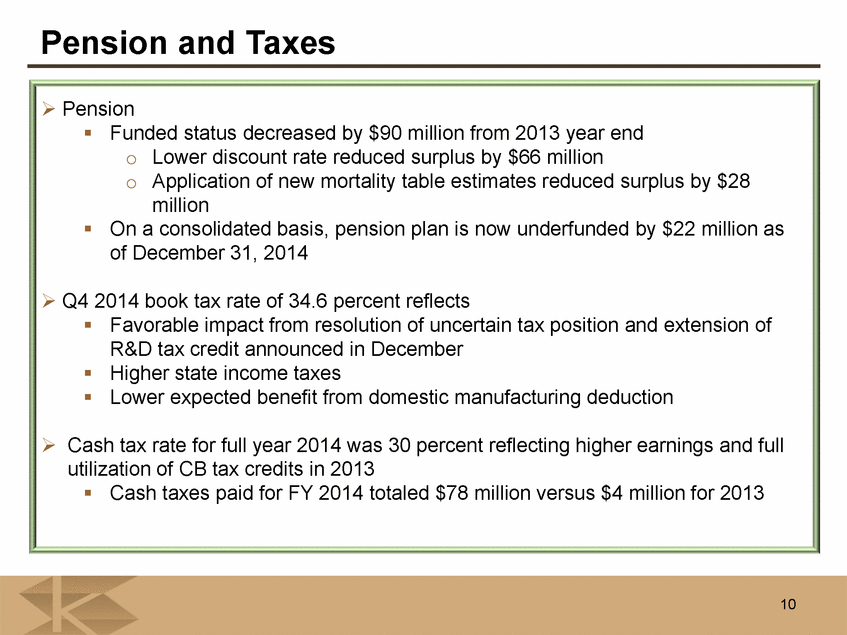
�Pension and Taxes Pension Funded status decreased by $90 million from 2013 year end o Lower discount rate reduced surplus by $66 million o Application of new mortality table estimates reduced surplus by $28 million On a consolidated basis, pension plan is now underfunded by $22 million as of December 31, 2014 Q4 2014 book tax rate of 34.6 percent reflects Favorable impact from resolution of uncertain tax position and extension of R&D tax credit announced in December Higher state income taxes Lower expected benefit from domestic manufacturing deduction Cash tax rate for full year 2014 was 30 percent reflecting higher earnings and full utilization of CB tax credits in 2013 Cash taxes paid for FY 2014 totaled $78 million versus $4 million for 2013 10 |
�
|
|
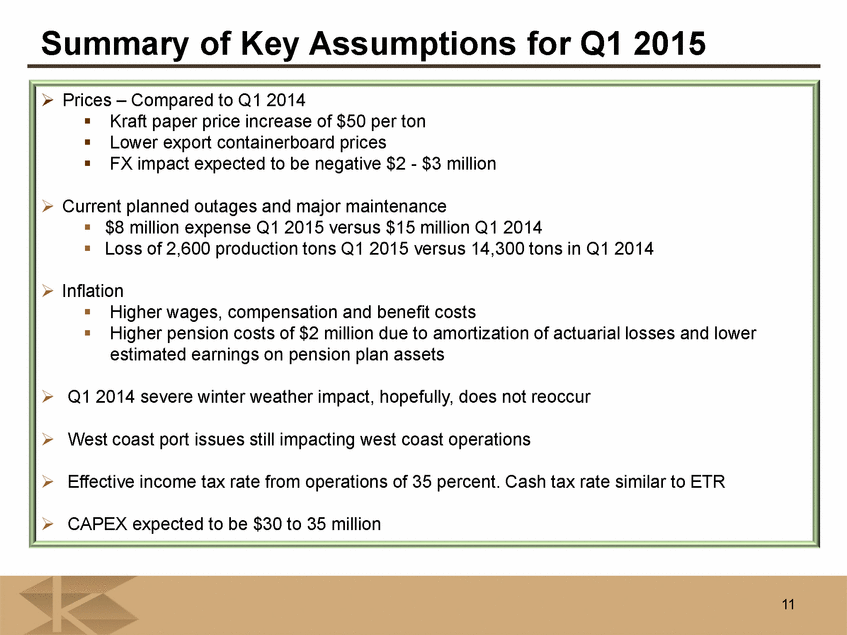
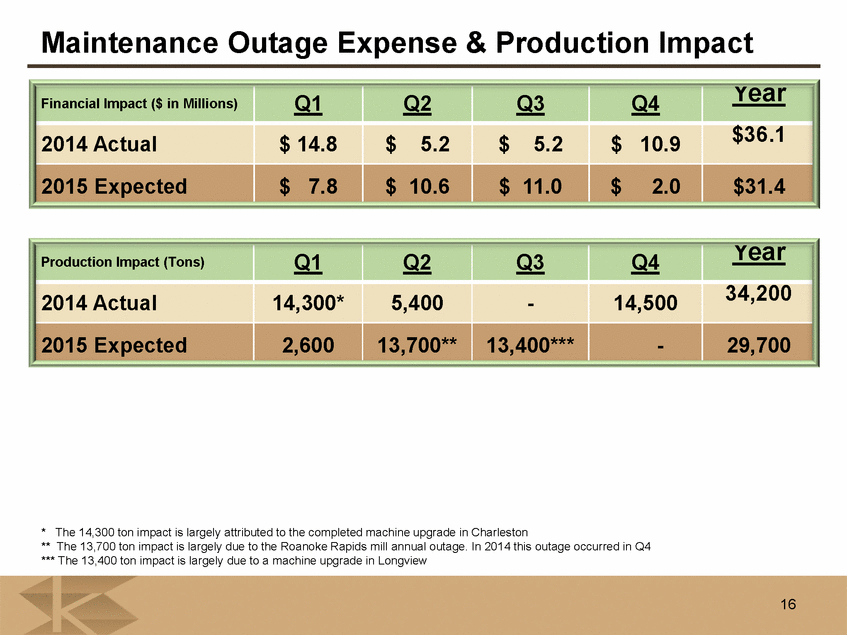
Summary of Key Assumptions for Q1 2015 Prices � Compared to Q1 2014 � Kraft paper price increase of $50 per ton � Lower export containerboard prices � FX impact expected to be negative $2 - $3 million > Current planned outages and major maintenance � $8 million expense Q1 2015 versus $15 million Q1 2014 � Loss of 2,600 production tons Q1 2015 versus 14,300 tons in Q1 2014 > Inflation � Higher wages, compensation and benefit costs � Higher pension costs of $2 million due to amortization of actuarial losses and lower estimated earnings on pension plan assets > Q1 2014 severe winter weather impact, hopefully, does not reoccur > West coast port issues still impacting west coast operations > Effective income tax rate from operations of 35 percent. Cash tax rate similar to ETR > CAPEX expected to be $30 to 35 million 11 |
�
|
|
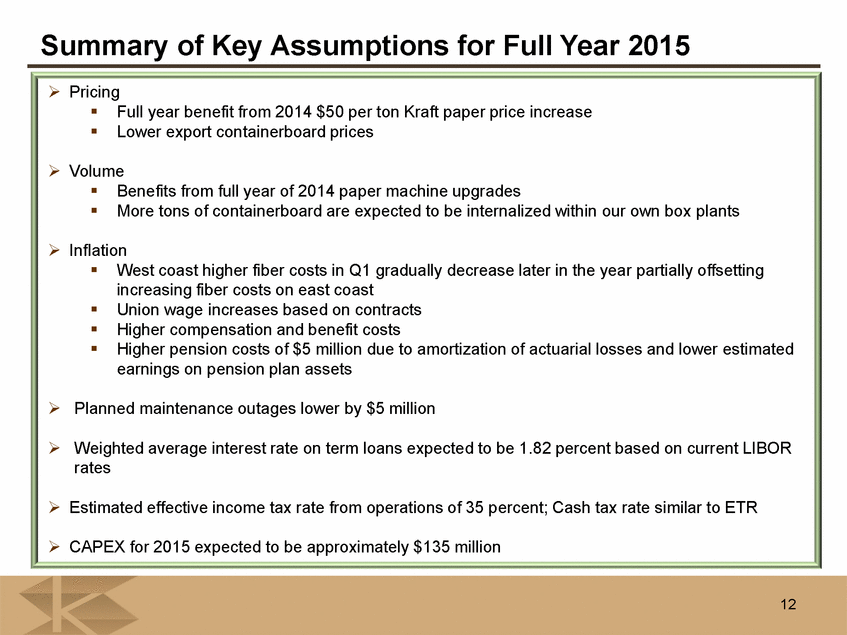
�Summary of Key Assumptions for Full Year 2015 Pricing � Full year benefit from 2014 $50 per ton Kraft paper price increase � Lower export containerboard prices Volume � Benefits from full year of 2014 paper machine upgrades � More tons of containerboard are expected to be internalized within our own box plants Inflation � West coast higher fiber costs in Q1 gradually decrease later in the year partially offsetting increasing fiber costs on east coast � Union wage increases based on contracts � Higher compensation and benefit costs � Higher pension costs of $5 million due to amortization of actuarial losses and lower estimated earnings on pension plan assets Planned maintenance outages lower by $5 million Weighted average interest rate on term loans expected to be 1.82 percent based on current LIBOR rates > Estimated effective income tax rate from operations of 35 percent; Cash tax rate similar to ETR > CAPEX for 2015 expected to be approximately $135 million 12 |
�
|
|
�Appendix |
|
|
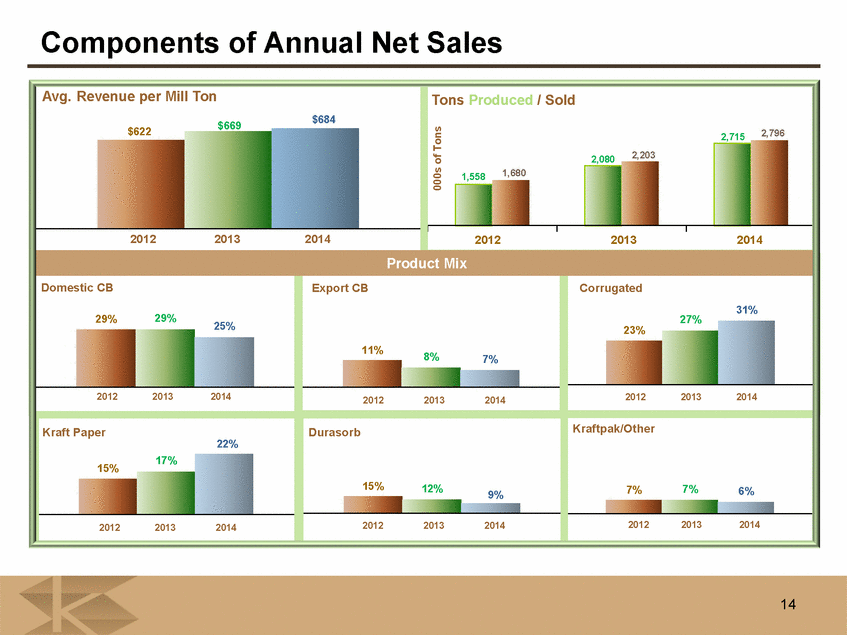
Components of Annual Net Sales Avg. Revenue per Mill Ton Tons Produced / Sold $684 $669 $622 2,796 2,715 2,080 2,203 000s of Tons 1,558 1,680 2012 2013 2014 2012 2013 2014 Product Mix Domestic CB Export CB Corrugated 31% 29% 29% 27% 25% 23% 11% 8% 7% 2012 2013 2014 2012 2013 2014 2012 2013 2014 Kraft Paper Durasorb Kraftpak/Other 22% 17% 15% 15% 12% 7% 7% 9% 6% 2012 2013 2014 2012 2013 2014 2012 2013 2014 14 |
�
|
|
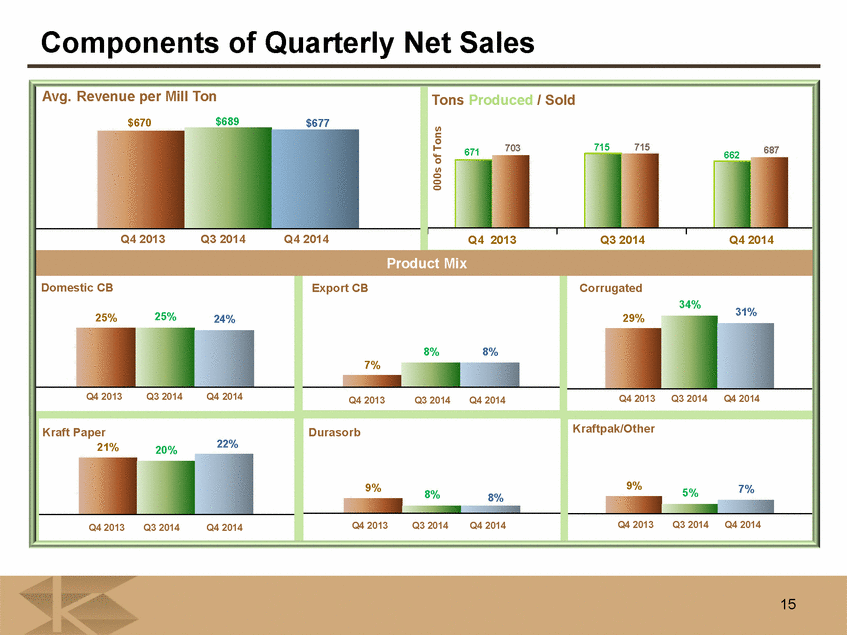
�Components of Annual Net Sales Avg. Revenue per Mill Ton Tons Produced / Sold $684 $669 $622 2,796 2,715 2,080 2,203 000s of Tons 1,558 1,680 2012 2013 2014 2012 2013 2014 Product Mix Domestic CB Export CB Corrugated 31% 29% 29% 27% 25% 23% 11% 8% 7% 2012 2013 2014 2012 2013 2014 2012 2013 2014 Kraft Paper Durasorb Kraftpak/Other 22% 17% 15% 15% 12% 7% 7% 9% 6% 2012 2013 2014 2012 2013 2014 2012 2013 2014 13 Components of Quarterly Net Sales Avg. Revenue per Mill Ton Tons Produced / Sold $670 $689 $677 703 715 715 687 000s of Tons 671 662 Q4 2013 Q3 2014 Q4 2014 Q4 2013 Q3 2014 Q4 2014 Product Mix Domestic CB Export CB Corrugated 34% 25% 31% 25% 24% 29% 8% 8% 7% Q4 2013 Q3 2014 Q4 2014 Q4 2013 Q3 2014 Q4 2014 Q4 2013 Q3 2014 Q4 2014 Kraft Paper Durasorb Kraftpak/Other 21% 22% 20% 9% 9% 7% 8% 5% 8% Q4 2013 Q3 2014 Q4 2014 Q4 2013 Q3 2014 Q4 2014 Q4 2013 Q3 2014 Q4 2014 15 |
�
|
|
�Maintenance Outage Expense & Production Impact Year Financial Impact ($�in Millions) Q1 Q2 Q3 Q4 $36.1 2014 Actual $�14.8 $�5.2 $�5.2 $�10.9 2015 Expected $�7.8 $�10.6 $�11.0 $�2.0 $31.4 Year Production Impact (Tons) Q1 Q2 Q3 Q4 34,200 2014 Actual 14,300* 5,400 - 14,500 2015 Expected 2,600 13,700** 13,400*** - 29,700 * The 14,300 ton impact is largely attributed to the completed machine upgrade in Charleston ** The 13,700 ton impact is largely due to the Roanoke Rapids mill annual outage. In 2014 this outage occurred in Q4 *** The 13,400 ton impact is largely due to a machine upgrade in Longview 16 |
�
Serious News for Serious Traders! Try StreetInsider.com Premium Free!
You May Also Be Interested In
- S&H Rugs Launches Fall 2027 Collection at High Point Market in North Carolina
- Ocular Hypertension Clinical Trial Pipeline: DelveInsight Highlights Major Advances, Transformative Therapies, and 50+ Leading Players Wheeling the Therapeutics Landscape
- Graft Versus Host Disease Clinical Trial Drug Development Pipeline Expands with Contributions from 45+ Key Companies | DelveInsight
Create E-mail Alert Related Categories
SEC FilingsSign up for StreetInsider Free!
Receive full access to all new and archived articles, unlimited portfolio tracking, e-mail alerts, custom newswires and RSS feeds - and more!
