



Form 8-K Interval Leisure Group, For: Nov 09
 Tweet
Tweet Share
Share E-mail
UNITED STATES
SECURITIES AND EXCHANGE COMMISSION
WASHINGTON, D.C. 20549
FORM 8-K
CURRENT REPORT
Pursuant to Section 13 or 15(d) of the Securities Exchange Act of 1934
Date of Report (Date of earliest event reported): November 9, 2015
Interval Leisure Group, Inc.
(Exact name of registrant as specified in charter)
|
Delaware |
|
001-34062 |
|
26-2590997 |
|
(State or other jurisdiction |
|
(Commission |
|
(IRS Employer |
|
of incorporation) |
|
File Number) |
|
Identification No.) |
|
6262 Sunset Drive, Miami, FL |
|
33143 |
|
(Address of principal executive offices) |
|
(Zip Code) |
Registrant’s telephone number, including area code: (305) 666-1861
(Former name or former address, if changed since last report)
Check the appropriate box below if the Form 8-K filing is intended to simultaneously satisfy the filing obligation of the registrant under any of the following provisions:
x Written communications pursuant to Rule 425 under the Securities Act (17 CFR 230.425)
o Soliciting material pursuant to Rule 14a-12 under the Exchange Act (17 CFR 240.14a-12)
o Pre-commencement communications pursuant to Rule 14d-2(b) under the Exchange Act (17 CFR 240.14d-2(b))
o Pre-commencement communications pursuant to Rule 13e-4(c) under the Exchange Act (17 CFR 240.13e-4(c))
ITEM 2.02. Results of Operations and Financial Condition.
Financial Results for the Quarter Ended September 30, 2015
Interval Leisure Group, Inc. (“ILG”) today issued a press release reporting financial results for the quarter ended September 30, 2015.
A copy of the press release is attached as Exhibit 99.1 to this Current Report on Form 8-K. Exhibit 99.1 to this Report is being furnished and is not “filed” with the Securities and Exchange Commission and is not incorporated by reference into any registration statement under the Securities Act of 1933 or other filing under the Securities Exchange Act of 1934.
ITEM 7.01. Regulation FD Disclosure.
On November 9, 2015, ILG posted on its website, www.iilg.com, under “Investor Relations Home” “ — Presentations & Events,” an investor presentation (the “Investor Presentation”), that includes, among other matters, information related to ILG’s acquisition of the vacation ownership business of Starwood Hotels & Resorts Worldwide, Inc. A copy of the Investor Presentation posted by ILG is furnished as Exhibit 99.2 hereto and is incorporated into this Item 7.01 by reference but shall not be deemed incorporated by reference into any registration statement under the Securities Act of 1933 or other filing under the Securities Exchange Act of 1934.
ITEM 8.01. Other Events.
On November 9, 2015, ILG announced that its Board of Directors declared a quarterly dividend of $0.12 per common share. The dividend is payable on December 16, 2015 to shareholders of record as of December 2, 2015. The actual declaration of any future cash dividends, and the establishment of record and payment dates, will be subject to final determination by the Board of Directors each quarter and will depend upon our results of operations, cash requirements and surplus, financial condition, legal requirements, capital requirements related to business initiatives, investments and acquisitions and other factors the Board of Directors may deem relevant.
ITEM 9.01. Financial Statements and Exhibits.
(d) Exhibits to this Form 8-K
|
Exhibit No. |
|
Description |
|
99.1 |
|
Press release of ILG, dated November 9, 2015, reporting financial results for the quarter ended September 30, 2015 |
|
99.2 |
|
Investor Presentation dated November 9, 2015 |
SIGNATURES
Pursuant to the requirements of the Securities Exchange Act of 1934, the Registrant has duly caused this report to be signed on its behalf by the undersigned hereunto duly authorized.
|
|
Interval Leisure Group, Inc. | |
|
|
| |
|
|
|
|
|
|
By: |
/s/ Victoria J. Kincke |
|
|
Name: |
Victoria J. Kincke |
|
|
Title: |
Senior Vice President, General Counsel and Secretary |
Date: November 9, 2015
EXHIBIT LIST
|
Exhibit No. |
|
Description |
|
99.1 |
|
Press release of ILG, dated November 9, 2015, reporting financial results for the quarter ended September 30, 2015 |
|
99.2 |
|
Investor Presentation dated November 9, 2015 |
Exhibit 99.1

INTERVAL LEISURE GROUP REPORTS THIRD QUARTER 2015 RESULTS
MIAMI — (BUSINESS WIRE) November 9, 2015 — Interval Leisure Group (Nasdaq: IILG) (“ILG”) today announced results for the three months ended September 30, 2015.
THIRD QUARTER 2015 HIGHLIGHTS
· ILG consolidated revenue increased by 18.7% year-over-year, and 11.7% excluding pass-through revenue
· Diluted earnings per share was $0.33
· Adjusted EBITDA increased by 4.8% to $46.5 million compared to the prior year
· In constant currency:
· Revenue increased by 20.4% year-over-year, and 13.9% excluding pass-through revenue
· Diluted earnings per share was $0.34
· Adjusted EBITDA was $47.4 million, an increase of 6.7% compared to the prior year
· Free cash flow for the first nine months of 2015 increased by 58.2% to $122.1 million
· On October 28, 2015 we announced a definitive agreement to acquire Starwood Hotels & Resorts’ and Vacation Ownership business, Vistana Signature Experiences
“We are continuing to drive positive momentum in our business, by broadening our footprint in non-traditional lodging with a focus on shared ownership and investing in platforms for long-term growth. While we made progress in the third quarter, with continued revenue and adjusted EBITDA growth from the prior year, we have more work to do to reach our full potential” said Craig M. Nash, chairman, president and CEO of Interval Leisure Group. “In addition to our focus on organic growth initiatives, the recently announced Vistana acquisition will further transform our business and growth profile as well as position us at the forefront of a rapidly evolving industry. This combination reinforces ILG’s balance sheet and conservative leverage so we may continue to prudently grow the business and create significant shareholder value.”
Financial Summary & Operating Metrics (USD in millions except per share amounts)
|
|
|
Three Months Ended |
|
Year |
|
Three Months Ended |
|
Year |
| |||||
|
METRICS |
|
2015 |
|
2014 |
|
Change |
|
(in constant currency) |
|
Change |
| |||
|
Revenue |
|
174.0 |
|
146.7 |
|
18.7 |
% |
176.7 |
|
20.4 |
% | |||
|
Exchange and Rental revenue |
|
124.9 |
|
120.2 |
|
3.9 |
% |
125.3 |
|
4.2 |
% | |||
|
Vacation Ownership revenue |
|
49.2 |
|
26.5 |
|
85.7 |
% |
51.3 |
|
94.0 |
% | |||
|
Gross profit |
|
98.4 |
|
87.7 |
|
12.2 |
% |
99.5 |
|
13.5 |
% | |||
|
Net income attributable to common stockholders |
|
19.1 |
|
21.3 |
|
(10.3 |
)% |
19.8 |
|
(6.9 |
)% | |||
|
Adjusted net income* |
|
18.7 |
|
21.5 |
|
(12.8 |
)% |
19.5 |
|
(9.4 |
)% | |||
|
Diluted EPS |
|
$ |
0.33 |
|
$ |
0.37 |
|
(10.8 |
)% |
$ |
0.34 |
|
(8.1 |
)% |
|
Adjusted diluted EPS* |
|
$ |
0.32 |
|
$ |
0.37 |
|
(13.5 |
)% |
$ |
0.34 |
|
(8.1 |
)% |
|
Adjusted EBITDA* |
|
46.5 |
|
44.4 |
|
4.8 |
% |
47.4 |
|
6.7 |
% | |||
|
BALANCE SHEET DATA |
|
September 30, 2015 |
|
December 31, 2014 |
|
|
|
|
|
|
Cash and cash equivalents |
|
101.4 |
|
80.5 |
|
|
|
|
|
|
Debt |
|
415.3 |
|
484.4 |
|
|
|
|
|
|
|
|
Nine Months Ended |
|
Year |
|
|
|
|
| ||
|
CASH FLOW DATA |
|
2015 |
|
2014 |
|
Change |
|
|
|
|
|
|
Net cash provided by operating activities |
|
135.4 |
|
91.5 |
|
48.0 |
% |
|
|
|
|
|
Free cash flow* |
|
122.1 |
|
77.2 |
|
58.2 |
% |
|
|
|
|
* “Adjusted net income”, “Adjusted EPS”, “Adjusted EBITDA”, “Free cash flow” and “Constant currency” are non-GAAP measures as defined by the U.S. Securities and Exchange Commission (the “SEC”). Please see “Presentation of Financial Information,” “Glossary of Terms” and “Reconciliations of Non-GAAP Measures” below for an explanation of non-GAAP measures used throughout this release.
DISCUSSION OF RESULTS
Third Quarter 2015 Consolidated Operating Results
Consolidated revenue for the quarter ended September 30, 2015 was $174.0 million, an increase of 18.7% compared to the third quarter of 2014. In constant currency (defined below), consolidated revenue increased by 20.4% to $176.7 million. Excluding pass-through revenue, consolidated revenue increased by $14.2 million, or 11.7%, and by $16.9 million, or 13.9%, in constant currency.
Net income attributable to common stockholders for the three months ended September 30, 2015 was $19.1 million, a decrease of 10.3% from the third quarter of 2014. Diluted earnings per share (EPS) were $0.33 compared to diluted EPS of $0.37 for the same period of 2014. In constant currency, diluted EPS was $0.34 and net income attributable to common stockholders was $19.8 million. Contributing to the results are $3.1 million of incremental after-tax interest expense from the senior notes issued in April 2015 and an after-tax increase of $0.5 million related to acquisition-related expenses. Adjusted net income (defined below) for the quarter ended September 30, 2015 was $18.7 million and, in constant currency, was $19.5 million. Excluding the increase in after-tax interest expense, net income attributable to common stockholders for the quarter would have been $22.2 million and diluted EPS would have been $0.38, and in constant currency these would have been $23.0 million and $0.40, respectively.
Adjusted EBITDA (defined below) for the quarter ended September 30, 2015 was $46.5 million, a 4.8% increase from $44.4 million for the same period of 2014. On a constant currency basis, adjusted EBITDA would have been $47.4 million, an increase of 6.7% over the prior year quarter.
Business Segment Results
The Exchange and Rental segment offers access to vacation accommodations and other travel-related transactions and services to leisure travelers, by providing vacation exchange services and vacation rentals, working with resort developers and managing vacation properties. The Vacation Ownership segment engages in the management, sales, marketing, and financing of vacation ownership interests and related services to owners and associations.
Exchange and Rental
Exchange and Rental segment revenue for the three months ended September 30, 2015 was $124.9 million, an increase of 3.9% from the comparable period in 2014. The increase is primarily due to revenue attributable to our Hyatt Residence Club (HRC) business — acquired in October 2014 — which contributed an increase of $2.0 million in other revenue, as well as higher rental management revenue of $0.7 million, an increase of 5.0% compared to the prior year, and an increase of $3.1 million in pass-through revenue to $23.7 million for the quarter.
For the third quarter of 2015, membership fee revenue (defined below) was $31.3 million, a decrease of 2.2% compared to the third quarter of 2014, and transaction revenue (defined below) was $46.7 million, flat compared with the prior year.
Total active members at September 30, 2015 were approximately 1.82 million, relatively consistent with the prior year. Average revenue per member for the third quarter of 2015 was $43.83, a decrease of 1.7% compared to $44.57 from the third quarter of 2014. In constant currency, average revenue per member was $44.06.
During the third quarter, the Interval Network affiliated 20 vacation ownership resorts in domestic and international markets. Membership mix as of September 30, 2015 included 58% traditional and 42% corporate members, compared to 59% and 41%, respectively, as of September 30, 2014.
Year-over-year, rental management revenue was $13.6 million, an increase of $0.7 million, or 5.0%. Rental RevPAR (defined below) was $123.86, a slight decrease compared to the prior year’s RevPAR of $124.46. The decrease in RevPAR was driven by a 3.8% decline in occupancy rate, largely offset by a 3.4% higher average daily rate. Hawaii-only RevPAR increased 1.1% to $128.48 for the third quarter of 2015 compared to $127.10 in the prior year. The increase in Hawaii-only RevPAR was driven by a 3.8% increase in average daily rate, partly offset by a 2.6% decrease in occupancy, compared to the prior year. Regarding the RevPAR numbers reported prior to 2015, a change in industry reporting standards effective January 1, 2015 excludes certain resort fees from gross lodging revenue (defined below). Consequently, this reporting change impacts the year-over-year comparability of RevPAR so we have recast prior year RevPAR, figures for the purposes of this comparison.
Exchange and Rental segment adjusted EBITDA was $39.3 million in the third quarter of 2015, an increase of 1.2% from the prior year due to incremental contributions from our recently acquired HRC business and lower call center-related costs, partly offset by membership fee revenue compression, higher employee-related costs, attributable in part to a rise in health and welfare costs, and an increase in professional fees.
Vacation Ownership
Vacation Ownership segment revenue for the three months ended September 30, 2015 was $49.2 million, including $25.8 million of management fee revenue (defined below). The increase over the prior year of $22.7 million, or 85.7% reflects increases of $9.0 million of vacation ownership sales and financing revenue and $10.0 million in pass-through revenue, related entirely to the Hyatt Vacation Ownership (HVO) acquisition, as well as $3.6 million in incremental management fee revenue. The increase in management fee revenue is a result of incremental revenue from the HVO acquisition, partly offset by a $2.2 million negative impact in the results of VRI Europe resulting from the appreciation of the U.S. dollar against the euro and the British pound.
On a constant currency basis, total revenue and revenue excluding pass-through for this segment would have been $51.3 million and $36.9 million, respectively, an increase of 94.0% and 67.0%, over the prior year.
Vacation Ownership segment adjusted EBITDA was $7.2 million in the third quarter, an increase of 29.4% from the prior year. The growth in this segment is driven by the management and sales and financing activities from the HVO business acquired in October 2014, partly offset by the negative impact of the appreciation of the U.S. dollar against the euro and the British pound. In constant currency, segment adjusted EBITDA was $7.9 million for the third quarter of 2015, an increase of 43.2% over the prior year.
CAPITAL RESOURCES AND LIQUIDITY
As of September 30, 2015, ILG’s cash and cash equivalents totaled $101.4 million, compared to $80.5 million as of December 31, 2014.
Debt outstanding as of September 30, 2015 was $415.3 million, compared to $484.4 million as of December 31, 2014. On April 10, 2015, we completed a private offering of $350 million in aggregate principal amount of 5.625% senior notes due in 2023. The net proceeds from the offering, after deducting estimated offering related expenses, were approximately $343 million. We used the proceeds to repay indebtedness outstanding on our revolving credit facility.
For the nine months ended September 30, 2015, ILG’s capital expenditures totaled $13.2 million, or 2.5% of revenue. For the nine months ended September 30, 2015, net cash provided by operating activities was $135.4 million and free cash flow (defined below) was $122.1 million, an increase of $44.9 million, or 58.2% compared to the same period in 2014. This increase was principally due to higher net cash receipts driven in part by the inclusion of HVO in our results following the acquisition in October 2014, lower income tax payments of $14.2 million resulting from the deferral of certain tax payments and $11.0 million of lower net payments made in connection with long-term developer contracts.
Dividend
For the third quarter 2015, ILG paid $6.9 million, or $0.12 cents per share in dividends.
In November 2015 our Board of Directors declared a $0.12 per share dividend payable December 16, 2015 to shareholders of record on December 2, 2015.
BUSINESS OUTLOOK AND GUIDANCE
“For the remainder of 2015, we remain focused on new product development in exchange and rental as well as effecting substantive improvements to HVO’s sales and marketing infrastructure for the consolidated properties. Consequently, the company is tightening the revenue and adjusted EBITDA ranges. However, the projection for free cash flow increases to $105 million to $115 million resulting primarily from a decrease in projected 2015 capital expenditures.” said Mr. Nash.
|
Guidance |
|
Current |
|
Prior |
|
Consolidated Revenue |
|
$690 - $700 million |
|
$690 - $705 million |
|
Adjusted EBITDA |
|
$182 - $186 million |
|
$182 - $192 million |
|
Free cash flow |
|
$105 - $115 million |
|
$100 - $110 million |
|
Capital expenditures (% of consolidated revenue) |
|
3.0% – 3.5% |
|
3.0% – 4.5% |
These expectations of future performance are for continuing operations and exclude the impact of the proposed Vistana acquisition and any other potential acquisitions or restructuring activities. Revenue and adjusted EBITDA guidance reflects the expectation of an adverse impact of foreign exchange. Based on actual result year-to-date and projected rates for the remainder of 2015, foreign exchange movements are expected to adversely impact 2015 revenue and adjusted EBITDA by $10.0-12.5 million and $3.0-3.5 million, respectively, when compared with 2014 full year results. Adjusted EBITDA will be computed on a basis consistent with the reconciliation of the third quarter 2015 and 2014 results in the tables at the end of this release.
VISTANA ACQUISITION
On October 28, 2015, ILG announced it had entered into an agreement to acquire Vistana Signature Experiences, Inc. (“Vistana”), the vacation ownership business of Starwood Hotels and Resorts Worldwide, Inc., in a transaction valued at approximately $1.5 billion. Highlights of the transaction and business combination include:
· A more diverse portfolio and a strengthened position as a leader in the vacation ownership industry with an expansive combined portfolio of approximately 200 managed resorts encompassing over 500,000 owners;
· Worldwide exclusive rights to use the Sheraton® and Westin® brands in vacation ownership, while allowing Sheraton Vacation Club and Westin Vacation Club owners to continue enjoying access to the Starwood Preferred Guest (SPG) program;
· Improved scale, global reach, assets, inventory, and sales and marketing infrastructure to support increased growth;
· Enhanced financial profile, with a strong balance sheet and substantial free cash flow from recurring fee-for-service revenues to drive sales and earnings growth
· The combined company is expected to have approximately 1.5x nebt debt/Adjusted EBITDA, including the estimated $132 million debt associated with the cash distribution from Vistana to Starwood, but excluding securitizations.
· A significant platform to drive growth initiatives, including:
· Approximately $5.5 billion of sales expected to be generated from the inventory
embedded in Vistana’s completed projects(1) ($1.2 billion), expansions of existing projects and projects currently in development(2) ($3.1 billion) and conversions of five transferred hotel properties to vacation ownership(2) ($1.3 billion);
· Vistana’s significant portfolio of net unsecuritized receivables, totaling $415 million as of September 30, 2015;
· Transfer of five resort hotels, valued at approximately $200 million, to be converted to timeshare properties; and
· Approximately $21 million in annual revenue and cost synergies by the third year following the acquisition.
The acquisition will be effected through a “Reverse Morris Trust” transaction pursuant to which Vistana, a wholly-owned subsidiary of Starwood is expected to be distributed tax-free to Starwood shareholders and immediately thereafter merge with a wholly-owned subsidiary of ILG, with Vistana surviving as a wholly-owned subsidiary of ILG. The combination will result in Starwood shareholders owning at closing approximately 55% of the combined company on a fully diluted basis, with existing shareholders of ILG owning approximately 45% of the combined company on a fully diluted basis, based on a fixed exchange ratio. Both pending and following completion of the transaction, ILG expects to continue its current dividend policy.
The transaction, which is subject to shareholder and regulatory approvals, is expected to close in the second quarter of 2016. More information about the transaction can be found on the ILG website: http://www.iilg.com
PRESENTATION OF FINANCIAL INFORMATION
ILG management believes that the presentation of non-generally accepted accounting principles (non-GAAP) financial measures, including, among others, EBITDA, adjusted EBITDA, adjusted net income, adjusted basic and diluted EPS, free cash flow and constant currency, serves to enhance the understanding of ILG’s performance. These non-GAAP financial measures should be considered in addition to and not as substitutes for, or superior to, measures of financial performance prepared in accordance with generally accepted accounting principles (GAAP). In addition, adjusted EBITDA (with certain additional add-backs) is used to calculate compliance with certain financial covenants in ILG’s credit agreement and indenture. Management believes that these non-GAAP measures improve the transparency of our disclosures, provide meaningful presentations of our results from our business operations excluding the impact of certain items not related to our core business operations and improve the period to period comparability of results from business operations. These measures may also be useful in comparing our results to those of other companies; however, our calculations may differ from the calculations of these measures used by other companies. More information about the non-GAAP financial measures, including reconciliations of historical GAAP results to the non-GAAP measures, is available in the financial tables that accompany this press release.
(1) Completed Inventory yield based on pricing as of year-end 2014 and includes inventory on hand, projected returns due to mortgage receivable defaults in the future as well as projected purchases through 2018 from existing third party agreements and other third party sources.
(2) Projections for “In Development and Future Phases” and “Transferred Properties” are based on inventory from build out of current active development projects and future conversion of transferred properties. Projected yield for these categories include 2% annual price growth and excludes future returns pursuant to GAAP accounting methodology. Yield projections are subject to change due to market dynamics, ongoing review of development, and operational performance within mortgage portfolio, sales and marketing and resort business lines
CONFERENCE CALL
ILG will host a conference call today at 4:30 p.m. Eastern Daylight Time to discuss its results for the third quarter 2015, with access via the Internet and telephone. Investors and analysts may participate in the live conference call by dialing (844) 826-0618 (toll-free domestic) or (973) 638-3062 (international); Conference ID: 66659513. Please register at least 10 minutes before the conference call begins. A replay of the call will be available for 7 days via telephone starting approximately two hours after the call ends. The replay can be accessed at (855) 859-2056 (toll-free domestic) or (404) 537-3406 (international); Conference ID: 66659513. The webcast will be archived on Interval Leisure Group’s website for 90 days after the call. A transcript of the call will also be available on the website.
ABOUT INTERVAL LEISURE GROUP
Interval Leisure Group (ILG) is a leading global provider of non-traditional lodging, encompassing a portfolio of leisure businesses from exchange and vacation rental to vacation ownership. In its exchange and rental segment, Interval International and Trading Places International (TPI) offer vacation exchange and travel-related products to more than 2 million member families worldwide, while Hyatt Residence Club provides exchanges among its branded resorts in addition to its participation in the Interval Network. Aqua-Aston Hospitality provides hotel and condominium rentals and resort management. In its vacation ownership segment, Vacation Resorts International, VRI Europe, Hyatt Vacation Ownership (HVO), and TPI provide management services to timeshare resorts and clubs, as well as homeowners’ associations. HVO also sells, markets, and finances vacation ownership interests. ILG through its subsidiaries independently owns and manages the Hyatt Residence Club program and uses the Hyatt Vacation Ownership name and other Hyatt marks under license from affiliates of Hyatt Hotels Corporation. Headquartered in Miami, Florida, ILG has offices in 16 countries and approximately 6,000 employees. For more information, visit www.iilg.com.
CAUTIONARY LANGUAGE CONCERNING FORWARD-LOOKING STATEMENTS
Information set forth in this communication, including statements regarding our future financial performance, our business prospects and strategy, anticipated financial position, liquidity, capital needs and other similar matters, as well as financial estimates and statements as to the expected timing, completion and effects of the proposed merger between a wholly-owned subsidiary of Interval Leisure Group, Inc. (“ILG”) and Vistana Signature Experiences, Inc. (“Vistana”), which will immediately follow the proposed spin-off of Vistana from Starwood Hotels & Resorts Worldwide, Inc. (“Starwood”), constitute forward-looking statements within the meaning of the safe harbor provisions of the Private Securities Litigation Reform Act of 1995. These estimates and statements are subject to risks and uncertainties, and actual results might differ materially. Such estimates and statements include, but are not limited to, statements about the benefits of the proposed merger, including future financial and operating results, the combined company’s plans, objectives, expectations and intentions, and other statements that are not historical facts. Such statements are based upon the current beliefs and expectations of the management of ILG and are subject to significant risks and uncertainties outside of ILG’s control.
Among the risks and uncertainties that could cause actual results to differ from those described in the forward-looking statements are the following: (1) the occurrence of any event, change or other circumstances that could give rise to the termination of the merger agreement, (2) the risk that ILG stockholders may not approve the issuance of ILG common stock in connection with the proposed merger, (3) the risk that the necessary regulatory approvals may not be obtained or may be obtained subject to conditions that are not anticipated, (4) risks that any of the closing conditions to the proposed merger, including Starwood’s spin-off of Vistana, may not be satisfied in a timely manner, (5) risks related to disruption of management time from ongoing business operations due to the proposed
merger, (6) failure to realize the benefits expected from the proposed merger, (7) the effect of the announcement of the proposed merger on the ability of ILG and Starwood to retain and hire key personnel and maintain relationships with their key business partners, and on their operating results and businesses generally, (8) adverse trends in economic conditions generally or in the vacation ownership, vacation rental and travel industries, or adverse events or trends in key vacation destinations, (9) adverse changes to, or interruptions in, relationships with third parties unrelated to the announcement, (10) lack of available financing for, or insolvency or consolidation of developers, (11) decreased demand from prospective purchasers of vacation interests, (12) travel related health concerns, (13) ILG’s ability to compete effectively and successfully and to add new products and services, (14) ILG’s ability to successfully manage and integrate acquisitions, (15) the occurrence of a termination event under the master license agreement with Hyatt, (16) ILG’s ability to market vacation ownership interests successfully and efficiently, (17) impairment of ILG’s assets, (18) the restrictive covenants in ILG’s revolving credit facility and indenture; (19) business interruptions in connection with ILG’s technology systems, (20) the ability of managed homeowners associations to collect sufficient maintenance fees, (21) third parties not repaying advances or extensions of credit, (22) fluctuations in currency exchange rates and (23) ILG’s ability to expand successfully in international markets and manage risks specific to international operations. Discussions of additional risks and uncertainties are contained in ILG’s filings with the U.S. Securities and Exchange Commission. ILG is not under any obligation, and each expressly disclaim any obligation, to update, alter, or otherwise revise any forward-looking statements, whether written or oral, that may be made from time to time, whether as a result of new information, future events, or otherwise. Persons reading this announcement are cautioned not to place undue reliance on these forward-looking statements which speak only as of the date hereof.
ADDITIONAL INFORMATION AND WHERE TO FIND IT
This communication does not constitute an offer to sell or the solicitation of an offer to buy any securities or a solicitation of any vote or approval. This communication may be deemed to be solicitation material in respect of the proposed merger between a wholly-owned subsidiary of ILG and Vistana. In connection with the proposed merger, ILG intends to file a registration statement on Form S-4, containing a proxy statement/prospectus with the Securities and Exchange Commission (“SEC”). STOCKHOLDERS OF ILG AND STARWOOD ARE URGED TO READ ALL RELEVANT DOCUMENTS FILED WITH THE SEC, INCLUDING THE PROXY STATEMENT/PROSPECTUS, BECAUSE THEY WILL CONTAIN IMPORTANT INFORMATION ABOUT THE PROPOSED MERGER. Investors and security holders will be able to obtain copies of the proxy statement/prospectus as well as other filings containing information about ILG, Starwood and Vistana without charge, at the SEC’s website, http://www.sec.gov. Copies of documents filed with the SEC by ILG will be made available free of charge on ILG’s investor relations website. Copies of documents filed with the SEC by Starwood will be made available free of charge on Starwood’s investor relations website.
PARTICIPANTS IN SOLICITATION
ILG and its directors and executive officers, and Starwood and its directors and officers, may be deemed to be participants in the solicitation of proxies from the holders of ILG common stock in respect of ILG’s stock issuance in connection with the proposed merger. Information about the directors and executive officers of ILG is set forth in the proxy statement for ILG’s 2015 Annual Meeting of Stockholders, which was filed with the SEC on April 6, 2015. Information about the directors and executive officers of Starwood is set forth in the proxy statement for Starwood’s 2015 Annual Meeting of Stockholders, which was filed with the SEC on April 17, 2015. Investors may obtain additional information regarding the interest of such participants by reading the proxy statement/prospectus regarding the proposed merger when it becomes available.
INTERVAL LEISURE GROUP, INC. AND SUBSIDIARIES
CONDENSED CONSOLIDATED STATEMENTS OF INCOME
(In thousands, except per share data)
|
|
|
Three Months Ended |
|
Nine Months Ended |
| ||||||||
|
|
|
September 30, |
|
September 30, |
| ||||||||
|
|
|
2015 |
|
2014 |
|
2015 |
|
2014 |
| ||||
|
|
|
|
|
|
|
|
|
|
| ||||
|
Revenue |
|
$ |
174,040 |
|
$ |
146,683 |
|
$ |
532,337 |
|
$ |
447,252 |
|
|
Cost of sales |
|
75,613 |
|
58,995 |
|
238,393 |
|
182,606 |
| ||||
|
Gross profit |
|
98,427 |
|
87,688 |
|
293,944 |
|
264,646 |
| ||||
|
Selling and marketing expense |
|
18,133 |
|
14,799 |
|
54,919 |
|
43,177 |
| ||||
|
General and administrative expense |
|
39,360 |
|
31,340 |
|
110,796 |
|
94,028 |
| ||||
|
Amortization expense of intangibles |
|
3,517 |
|
2,879 |
|
10,532 |
|
8,740 |
| ||||
|
Depreciation expense |
|
4,394 |
|
3,765 |
|
12,991 |
|
11,434 |
| ||||
|
Operating income |
|
33,023 |
|
34,905 |
|
104,706 |
|
107,267 |
| ||||
|
Other income (expense): |
|
|
|
|
|
|
|
|
| ||||
|
Interest income |
|
276 |
|
55 |
|
819 |
|
154 |
| ||||
|
Interest expense |
|
(6,386 |
) |
(1,529 |
) |
(15,113 |
) |
(4,481 |
) | ||||
|
Other income, net |
|
2,197 |
|
511 |
|
3,313 |
|
95 |
| ||||
|
Equity in earnings from unconsolidated entities |
|
1,322 |
|
— |
|
3,771 |
|
— |
| ||||
|
Total other expense, net |
|
(2,591 |
) |
(963 |
) |
(7,210 |
) |
(4,232 |
) | ||||
|
Earnings before income taxes and noncontrolling interests |
|
30,432 |
|
33,942 |
|
97,496 |
|
103,035 |
| ||||
|
Income tax provision |
|
(10,743 |
) |
(11,838 |
) |
(34,891 |
) |
(36,843 |
) | ||||
|
Net income |
|
19,689 |
|
22,104 |
|
62,605 |
|
66,192 |
| ||||
|
Net income attributable to noncontrolling interest |
|
(589 |
) |
(809 |
) |
(1,602 |
) |
(2,822 |
) | ||||
|
Net income attributable to common stockholders |
|
$ |
19,100 |
|
$ |
21,295 |
|
$ |
61,003 |
|
$ |
63,370 |
|
|
|
|
|
|
|
|
|
|
|
| ||||
|
Earnings per share attributable to common stockholders: |
|
|
|
|
|
|
|
|
| ||||
|
Basic |
|
$ |
0.33 |
|
$ |
0.37 |
|
$ |
1.06 |
|
$ |
1.10 |
|
|
Diluted |
|
$ |
0.33 |
|
$ |
0.37 |
|
$ |
1.05 |
|
$ |
1.09 |
|
|
Weighted average number of shares of common stock outstanding: |
|
|
|
|
|
|
|
|
| ||||
|
Basic |
|
57,477 |
|
57,098 |
|
57,369 |
|
57,424 |
| ||||
|
Diluted |
|
58,055 |
|
57,683 |
|
57,948 |
|
57,976 |
| ||||
|
Dividends declared per share of common stock |
|
$ |
0.12 |
|
$ |
0.11 |
|
$ |
0.36 |
|
$ |
0.33 |
|
|
|
|
|
|
|
|
|
|
|
| ||||
|
|
|
|
|
|
|
|
|
|
| ||||
|
Adjusted net income(1) |
|
$ |
18,736 |
|
$ |
21,493 |
|
$ |
60,230 |
|
$ |
65,112 |
|
|
Adjusted earnings per share(1): |
|
|
|
|
|
|
|
|
| ||||
|
Basic |
|
$ |
0.33 |
|
$ |
0.38 |
|
$ |
1.05 |
|
$ |
1.13 |
|
|
Diluted |
|
$ |
0.32 |
|
$ |
0.37 |
|
$ |
1.04 |
|
$ |
1.12 |
|
(1) “Adjusted net income” and “Adjusted earnings per share” are non-GAAP measures as defined by the SEC. Please see “Reconciliations of Non-GAAP Measures” for a reconciliation to the comparable GAAP measure.
INTERVAL LEISURE GROUP, INC. AND SUBSIDIARIES
CONDENSED CONSOLIDATED BALANCE SHEETS
(In thousands)
|
|
|
As of |
| ||||
|
|
|
September 30, 2015 |
|
December 31, 2014 |
| ||
|
|
|
|
|
|
| ||
|
ASSETS |
|
|
|
|
| ||
|
Cash and cash equivalents |
|
$ |
101,417 |
|
$ |
80,493 |
|
|
Vacation ownership mortgages receivable, net |
|
6,093 |
|
7,169 |
| ||
|
Vacation ownership inventory |
|
48,843 |
|
54,061 |
| ||
|
Deferred membership costs |
|
8,497 |
|
8,716 |
| ||
|
Prepaid income taxes |
|
7,776 |
|
22,029 |
| ||
|
Other current assets |
|
108,637 |
|
112,505 |
| ||
|
Total current assets |
|
281,263 |
|
284,973 |
| ||
|
Vacation ownership mortgages receivable, net |
|
26,180 |
|
29,333 |
| ||
|
Investments in unconsolidated entities |
|
37,190 |
|
33,486 |
| ||
|
Goodwill and intangible assets, net |
|
817,787 |
|
831,125 |
| ||
|
Deferred membership costs |
|
10,082 |
|
10,948 |
| ||
|
Other non-current assets |
|
129,900 |
|
134,137 |
| ||
|
TOTAL ASSETS |
|
$ |
1,302,402 |
|
$ |
1,324,002 |
|
|
|
|
|
|
|
| ||
|
LIABILITIES AND EQUITY |
|
|
|
|
| ||
|
LIABILITIES: |
|
|
|
|
| ||
|
Accounts payable, trade |
|
$ |
23,798 |
|
$ |
39,082 |
|
|
Deferred revenue |
|
95,786 |
|
89,850 |
| ||
|
Other current liabilities |
|
104,824 |
|
85,036 |
| ||
|
Total current liabilities |
|
224,408 |
|
213,968 |
| ||
|
Long-term debt |
|
415,260 |
|
484,383 |
| ||
|
Deferred revenue |
|
90,017 |
|
93,730 |
| ||
|
Other long-term liabilities |
|
111,814 |
|
111,116 |
| ||
|
TOTAL LIABILITIES |
|
841,499 |
|
903,197 |
| ||
|
Redeemable noncontrolling interest |
|
707 |
|
457 |
| ||
|
Total ILG stockholders’ equity |
|
426,238 |
|
384,043 |
| ||
|
Noncontrolling interests |
|
33,958 |
|
36,305 |
| ||
|
TOTAL EQUITY |
|
460,196 |
|
420,348 |
| ||
|
TOTAL LIABILITIES AND EQUITY |
|
$ |
1,302,402 |
|
$ |
1,324,002 |
|
INTERVAL LEISURE GROUP, INC. AND SUBSIDIARIES
CONDENSED CONSOLIDATED STATEMENTS OF CASH FLOWS
(In thousands)
|
|
|
Nine months ended September 30, |
| ||||
|
|
|
2015 |
|
2014 |
| ||
|
|
|
|
|
|
| ||
|
Cash flows from operating activities: |
|
|
|
|
| ||
|
Net income |
|
$ |
62,605 |
|
$ |
66,192 |
|
|
Adjustments to reconcile net income to net cash provided by operating activities: |
|
|
|
|
| ||
|
Amortization expense of intangibles |
|
10,532 |
|
8,740 |
| ||
|
Amortization of debt issuance costs |
|
1,088 |
|
617 |
| ||
|
Depreciation expense |
|
12,991 |
|
11,434 |
| ||
|
Provision for loan losses |
|
1,713 |
|
— |
| ||
|
Non-cash compensation expense |
|
10,182 |
|
8,297 |
| ||
|
Non-cash interest expense |
|
4 |
|
11 |
| ||
|
Deferred income taxes |
|
795 |
|
140 |
| ||
|
Equity in earnings from unconsolidated entities |
|
(3,771 |
) |
— |
| ||
|
Excess tax benefits from stock-based awards |
|
(1,893 |
) |
(1,912 |
) | ||
|
Loss on disposal of property and equipment |
|
217 |
|
17 |
| ||
|
Change in fair value of contingent consideration |
|
— |
|
(1,606 |
) | ||
|
Changes in operating assets and liabilities |
|
40,895 |
|
(474 |
) | ||
|
Net cash provided by operating activities |
|
135,358 |
|
91,456 |
| ||
|
Cash flows from investing activities: |
|
|
|
|
| ||
|
Capital expenditures |
|
(13,243 |
) |
(14,266 |
) | ||
|
Investment in financing receivables |
|
(250 |
) |
(750 |
) | ||
|
Other |
|
(35 |
) |
— |
| ||
|
Net cash used in investing activities |
|
(13,528 |
) |
(15,016 |
) | ||
|
Cash flows from financing activities: |
|
|
|
|
| ||
|
Proceeds from the issuance of senior notes |
|
350,000 |
|
— |
| ||
|
Borrowing (payments) on revolving credit facility, net |
|
(413,000 |
) |
5,000 |
| ||
|
Payments of debt issuance costs |
|
(6,703 |
) |
(1,711 |
) | ||
|
Dividend payments to stockholders |
|
(20,687 |
) |
(18,961 |
) | ||
|
Dividend payments to noncontrolling interests |
|
(3,030 |
) |
— |
| ||
|
Payments of contingent consideration |
|
— |
|
(7,272 |
) | ||
|
Purchases of treasury stock |
|
— |
|
(14,120 |
) | ||
|
Withholding taxes on vesting of restricted stock units |
|
(4,333 |
) |
(3,948 |
) | ||
|
Proceeds from the exercise of stock options |
|
221 |
|
311 |
| ||
|
Excess tax benefits from stock-based awards |
|
1,893 |
|
1,912 |
| ||
|
Net cash used in financing activities |
|
(95,639 |
) |
(38,789 |
) | ||
|
Effect of exchange rate changes on cash and cash equivalents |
|
(5,267 |
) |
(2,166 |
) | ||
|
Net increase in cash and cash equivalents |
|
20,924 |
|
35,485 |
| ||
|
Cash and cash equivalents at beginning of period |
|
80,493 |
|
48,462 |
| ||
|
Cash and cash equivalents at end of period |
|
$ |
101,417 |
|
$ |
83,947 |
|
|
|
|
|
|
|
| ||
|
Supplemental disclosures of cash flow information: |
|
|
|
|
| ||
|
Cash paid during the period for: |
|
|
|
|
| ||
|
Interest, net of amounts capitalized |
|
$ |
4,533 |
|
$ |
3,768 |
|
|
Income taxes, net of refunds |
|
$ |
19,007 |
|
$ |
33,215 |
|
OPERATING STATISTICS
|
|
|
Three Months Ended September 30, |
|
Nine Months Ended September 30, |
| ||||||||||||
|
|
|
2015 |
|
% Change |
|
2014 |
|
2015 |
|
% Change |
|
2014 |
| ||||
|
Exchange and Rental |
|
|
|
|
|
|
|
|
|
|
|
|
| ||||
|
Total active members at end of period (000’s) |
|
1,823 |
|
0.6 |
% |
1,812 |
|
1,823 |
|
0.6 |
% |
1,812 |
| ||||
|
Average revenue per member |
|
$ |
43.83 |
|
(1.7 |
)% |
$ |
44.57 |
|
$ |
137.89 |
|
(0.3 |
)% |
$ |
138.28 |
|
|
Available room nights (000’s) |
|
754 |
|
(0.9 |
)% |
761 |
|
2,321 |
|
1.0 |
% |
2,298 |
| ||||
|
RevPAR(1) |
|
$ |
123.86 |
|
(0.5 |
)% |
$ |
124.46 |
|
$ |
119.14 |
|
(0.2 |
)% |
$ |
119.39 |
|
|
|
|
|
|
|
|
|
|
|
|
|
|
|
| ||||
|
Vacation Ownership |
|
|
|
|
|
|
|
|
|
|
|
|
| ||||
|
Contract sales (000’s)(2) |
|
$ |
25,576 |
|
N/M |
|
$ |
— |
|
$ |
76,580 |
|
N/M |
|
$ |
— |
|
|
Average transaction price(2) |
|
$ |
32,457 |
|
N/M |
|
$ |
— |
|
$ |
34,872 |
|
N/M |
|
$ |
— |
|
|
Volume per guest(2) |
|
$ |
3,374 |
|
N/M |
|
$ |
— |
|
$ |
3,579 |
|
N/M |
|
$ |
— |
|
(1) Due to a change in industry reporting standards (effective January 1, 2015) and certain revisions resulting from a refinement in our calculation of RevPAR pursuant to industry reporting standards, RevPAR for the three and nine months ended September 30, 2014 has been recast from $130.82 and $127.51, respectively.
(2) Applicable solely for the period subsequent to the acquisition of HVO on October 1, 2014.
ADDITIONAL DATA
|
|
|
Three Months Ended September 30, |
|
Nine Months Ended September 30, |
| ||||||||||||
|
|
|
2015 |
|
% Change |
|
2014 |
|
2015 |
|
% Change |
|
2014 |
| ||||
|
|
|
(Dollars in thousands) |
|
(Dollars in thousands) |
| ||||||||||||
|
Exchange and Rental |
|
|
|
|
|
|
|
|
|
|
|
|
| ||||
|
Transaction revenue |
|
$ |
46,728 |
|
(0.3 |
)% |
$ |
46,868 |
|
$ |
150,931 |
|
0.4 |
% |
$ |
150,294 |
|
|
Membership fee revenue |
|
31,326 |
|
(2.2 |
)% |
32,017 |
|
94,453 |
|
(1.0 |
)% |
95,437 |
| ||||
|
Ancillary member revenue |
|
1,689 |
|
(10.9 |
)% |
1,896 |
|
4,490 |
|
(14.1 |
)% |
5,228 |
| ||||
|
Total member revenue |
|
79,743 |
|
(1.3 |
)% |
80,781 |
|
249,874 |
|
(0.4 |
)% |
250,959 |
| ||||
|
Other revenue |
|
7,815 |
|
34.2 |
% |
5,825 |
|
25,386 |
|
41.6 |
% |
17,932 |
| ||||
|
Rental management revenue |
|
13,626 |
|
5.0 |
% |
12,973 |
|
39,236 |
|
6.2 |
% |
36,932 |
| ||||
|
Pass-through revenue |
|
23,704 |
|
14.9 |
% |
20,638 |
|
70,625 |
|
15.2 |
% |
61,284 |
| ||||
|
Total revenue |
|
$ |
124,888 |
|
3.9 |
% |
$ |
120,217 |
|
$ |
385,121 |
|
4.9 |
% |
$ |
367,107 |
|
|
Exchange and Rental gross margin |
|
61.9 |
% |
(2.1 |
)% |
63.2 |
% |
61.5 |
% |
(1.4 |
)% |
62.4 |
% | ||||
|
Exchange and Rental gross margin without Pass-through Revenue |
|
76.4 |
% |
0.0 |
% |
76.4 |
% |
75.3 |
% |
0.5 |
% |
74.9 |
% | ||||
|
|
|
|
|
|
|
|
|
|
|
|
|
|
| ||||
|
Vacation Ownership |
|
|
|
|
|
|
|
|
|
|
|
|
| ||||
|
Management fee revenue |
|
$ |
25,759 |
|
16.4 |
% |
$ |
22,123 |
|
$ |
75,672 |
|
12.7 |
% |
$ |
67,118 |
|
|
Sales and financing revenue |
|
9,002 |
|
N/M |
|
— |
|
28,473 |
|
N/M |
|
— |
| ||||
|
Pass-through revenue |
|
14,391 |
|
231.4 |
% |
4,343 |
|
43,071 |
|
230.6 |
% |
13,027 |
| ||||
|
Total revenue |
|
$ |
49,152 |
|
85.7 |
% |
$ |
26,466 |
|
$ |
147,216 |
|
83.7 |
% |
$ |
80,145 |
|
|
Vacation Ownership gross margin |
|
42.9 |
% |
(2.5 |
)% |
44.0 |
% |
38.8 |
% |
(12.4 |
)% |
44.3 |
% | ||||
|
Vacation Ownership gross margin without Pass-through Revenue |
|
60.7 |
% |
15.2 |
% |
52.7 |
% |
54.9 |
% |
3.8 |
% |
52.9 |
% | ||||
RECONCILIATIONS OF NON-GAAP MEASURES
|
|
|
Nine Months Ended September 30, |
|
|
| ||||||
|
|
|
2015 |
|
% Change |
|
2014 |
|
|
| ||
|
|
|
(Dollars in thousands) |
|
|
| ||||||
|
|
|
|
|
|
|
|
|
|
| ||
|
Net cash provided by operating activities |
|
$ |
135,358 |
|
48.0 |
% |
$ |
91,456 |
|
|
|
|
Less: Capital expenditures |
|
(13,243 |
) |
(7.2 |
)% |
(14,266 |
) |
|
| ||
|
Free cash flow |
|
$ |
122,115 |
|
58.2 |
% |
$ |
77,190 |
|
|
|
|
|
|
Three Months Ended September 30, |
|
Nine Months Ended September 30, |
| ||||||||
|
|
|
2015 |
|
2014 |
|
2015 |
|
2014 |
| ||||
|
|
|
(Dollars in thousands, except per share data) |
| ||||||||||
|
|
|
|
|
|
|
|
|
|
| ||||
|
Net income attributable to common stockholders |
|
$ |
19,100 |
|
$ |
21,295 |
|
$ |
61,003 |
|
$ |
63,370 |
|
|
Acquisition related and restructuring costs |
|
1,599 |
|
843 |
|
2,081 |
|
3,249 |
| ||||
|
Other non-operating foreign currency remeasurements |
|
(2,197 |
) |
(518 |
) |
(3,523 |
) |
(382 |
) | ||||
|
Other special items |
|
— |
|
— |
|
171 |
|
— |
| ||||
|
Income tax impact of adjusting items(1) |
|
234 |
|
(127 |
) |
498 |
|
(1,125 |
) | ||||
|
Adjusted net income |
|
$ |
18,736 |
|
$ |
21,493 |
|
$ |
60,230 |
|
$ |
65,112 |
|
|
Adjusted earnings per share: |
|
|
|
|
|
|
|
|
| ||||
|
Basic |
|
$ |
0.33 |
|
$ |
0.38 |
|
$ |
1.05 |
|
$ |
1.13 |
|
|
Diluted |
|
$ |
0.32 |
|
$ |
0.37 |
|
$ |
1.04 |
|
$ |
1.12 |
|
(1) Tax rate utilized is the applicable effective tax rate respective to the period to the extent amounts are deductible.
|
|
|
Three Months Ended September 30, |
| ||||||||||||||||
|
|
|
2015 |
|
2014 |
| ||||||||||||||
|
|
|
Exchange and |
|
Vacation |
|
Consolidated |
|
Exchange and |
|
Vacation |
|
Consolidated |
| ||||||
|
|
|
(Dollars in thousands) |
| ||||||||||||||||
|
|
|
|
|
|
|
|
|
|
|
|
|
|
| ||||||
|
Adjusted EBITDA |
|
$ |
39,335 |
|
$ |
7,179 |
|
$ |
46,514 |
|
$ |
38,854 |
|
$ |
5,546 |
|
$ |
44,400 |
|
|
Non-cash compensation expense |
|
(2,660 |
) |
(588 |
) |
(3,248 |
) |
(2,423 |
) |
(394 |
) |
(2,817 |
) | ||||||
|
Other non-operating income (expense), net |
|
2,177 |
|
20 |
|
2,197 |
|
535 |
|
(24 |
) |
511 |
| ||||||
|
Acquisition related and restructuring costs |
|
(195 |
) |
(1,404 |
) |
(1,599 |
) |
(385 |
) |
(458 |
) |
(843 |
) | ||||||
|
EBITDA |
|
38,657 |
|
5,207 |
|
43,864 |
|
36,581 |
|
4,670 |
|
41,251 |
| ||||||
|
Amortization expense of intangibles |
|
(2,155 |
) |
(1,362 |
) |
(3,517 |
) |
(1,739 |
) |
(1,140 |
) |
(2,879 |
) | ||||||
|
Depreciation expense |
|
(3,958 |
) |
(436 |
) |
(4,394 |
) |
(3,587 |
) |
(178 |
) |
(3,765 |
) | ||||||
|
Less: Net income attributable to noncontrolling interests |
|
8 |
|
581 |
|
589 |
|
9 |
|
800 |
|
809 |
| ||||||
|
Less: Other non-operating income (expense), net |
|
(2,177 |
) |
(20 |
) |
(2,197 |
) |
(535 |
) |
24 |
|
(511 |
) | ||||||
|
Equity in earnings in unconsolidated entities |
|
(23 |
) |
(1,299 |
) |
(1,322 |
) |
— |
|
— |
|
— |
| ||||||
|
Operating income |
|
$ |
30,352 |
|
$ |
2,671 |
|
33,023 |
|
$ |
30,729 |
|
$ |
4,176 |
|
34,905 |
| ||
|
Interest income |
|
|
|
|
|
276 |
|
|
|
|
|
55 |
| ||||||
|
Interest expense |
|
|
|
|
|
(6,386 |
) |
|
|
|
|
(1,529 |
) | ||||||
|
Other non-operating income, net |
|
|
|
|
|
2,197 |
|
|
|
|
|
511 |
| ||||||
|
Equity in earnings in unconsolidated entities |
|
|
|
|
|
1,322 |
|
|
|
|
|
— |
| ||||||
|
Income tax provision |
|
|
|
|
|
(10,743 |
) |
|
|
|
|
(11,838 |
) | ||||||
|
Net income |
|
|
|
|
|
19,689 |
|
|
|
|
|
22,104 |
| ||||||
|
Net income attributable to noncontrolling interest |
|
|
|
|
|
(589 |
) |
|
|
|
|
(809 |
) | ||||||
|
Net income attributable to common stockholders |
|
|
|
|
|
$ |
19,100 |
|
|
|
|
|
$ |
21,295 |
| ||||
|
|
|
Nine Months Ended September 30, |
| ||||||||||||||||
|
|
|
2015 |
|
2014 |
| ||||||||||||||
|
|
|
Exchange and |
|
Vacation |
|
Consolidated |
|
Exchange and |
|
Vacation |
|
Consolidated |
| ||||||
|
|
|
(Dollars in thousands) |
| ||||||||||||||||
|
|
|
|
|
|
|
|
|
|
|
|
|
|
| ||||||
|
Adjusted EBITDA |
|
$ |
121,705 |
|
$ |
21,127 |
|
$ |
142,832 |
|
$ |
119,484 |
|
$ |
16,681 |
|
$ |
136,165 |
|
|
Non-cash compensation expense |
|
(8,062 |
) |
(2,120 |
) |
(10,182 |
) |
(7,163 |
) |
(1,134 |
) |
(8,297 |
) | ||||||
|
Other non-operating income (expense), net |
|
3,385 |
|
(72 |
) |
3,313 |
|
273 |
|
(178 |
) |
95 |
| ||||||
|
Acquisition related and restructuring costs |
|
(363 |
) |
(1,718 |
) |
(2,081 |
) |
(1,724 |
) |
(1,525 |
) |
(3,249 |
) | ||||||
|
Other special items |
|
(144 |
) |
(27 |
) |
(171 |
) |
— |
|
— |
|
— |
| ||||||
|
EBITDA |
|
116,521 |
|
17,190 |
|
133,711 |
|
110,870 |
|
13,844 |
|
124,714 |
| ||||||
|
Amortization expense of intangibles |
|
(6,465 |
) |
(4,067 |
) |
(10,532 |
) |
(5,319 |
) |
(3,421 |
) |
(8,740 |
) | ||||||
|
Depreciation expense |
|
(11,680 |
) |
(1,311 |
) |
(12,991 |
) |
(10,892 |
) |
(542 |
) |
(11,434 |
) | ||||||
|
Less: Net income attributable to noncontrolling interest |
|
19 |
|
1,583 |
|
1,602 |
|
27 |
|
2,795 |
|
2,822 |
| ||||||
|
Less: Other non-operating income (expense), net |
|
(3,385 |
) |
72 |
|
(3,313 |
) |
(273 |
) |
178 |
|
(95 |
) | ||||||
|
Equity in earnings in unconsolidated entities |
|
(54 |
) |
(3,717 |
) |
(3,771 |
) |
— |
|
— |
|
— |
| ||||||
|
Operating income |
|
$ |
94,956 |
|
$ |
9,750 |
|
104,706 |
|
$ |
94,413 |
|
$ |
12,854 |
|
107,267 |
| ||
|
Interest income |
|
|
|
|
|
819 |
|
|
|
|
|
154 |
| ||||||
|
Interest expense |
|
|
|
|
|
(15,113 |
) |
|
|
|
|
(4,481 |
) | ||||||
|
Other non-operating income, net |
|
|
|
|
|
3,313 |
|
|
|
|
|
95 |
| ||||||
|
Equity in earnings in unconsolidated entities |
|
|
|
|
|
3,771 |
|
|
|
|
|
— |
| ||||||
|
Income tax provision |
|
|
|
|
|
(34,891 |
) |
|
|
|
|
(36,843 |
) | ||||||
|
Net income |
|
|
|
|
|
62,605 |
|
|
|
|
|
66,192 |
| ||||||
|
Net income attributable to noncontrolling interests |
|
|
|
|
|
(1,602 |
) |
|
|
|
|
(2,822 |
) | ||||||
|
Net income attributable to common stockholders |
|
|
|
|
|
$ |
61,003 |
|
|
|
|
|
$ |
63,370 |
| ||||
RECONCILIATIONS OF NON-GAAP MEASURES
2015 OUTLOOK
|
|
|
Current Guidance |
| ||||
|
|
|
Low |
|
High |
| ||
|
|
|
(In millions) |
| ||||
|
Adjusted EBITDA |
|
$ |
182 |
|
$ |
186 |
|
|
Non-cash compensation expense |
|
(14 |
) |
(14 |
) | ||
|
Other non-operating income, net |
|
3 |
|
3 |
| ||
|
Acquisition related and restructuring costs |
|
(2 |
) |
(2 |
) | ||
|
Amortization expense of intangibles |
|
(14 |
) |
(14 |
) | ||
|
Depreciation expense |
|
(17 |
) |
(17 |
) | ||
|
Interest, net |
|
(20 |
) |
(20 |
) | ||
|
Income tax provision |
|
(44 |
) |
(46 |
) | ||
|
Net income attributable to common stockholders |
|
$ |
74 |
|
$ |
76 |
|
|
|
|
Current Guidance |
| ||||
|
|
|
Low |
|
High |
| ||
|
|
|
(In millions) |
| ||||
|
Net cash provided by operating activities |
|
$ |
126 |
|
$ |
140 |
|
|
Less: Capital expenditures |
|
(21 |
) |
(25 |
) | ||
|
Free cash flow |
|
$ |
105 |
|
$ |
115 |
|
GLOSSARY OF TERMS
Acquisition related and restructuring costs - Represents transaction fees, costs incurred in connection with performing due diligence, subsequent adjustments to our initial estimate of contingent consideration obligations associated with business acquisitions, and other direct costs related to acquisition activities. Additionally, this item includes certain restructuring charges primarily related to workforce reductions and estimated costs of exiting contractual commitments.
Adjusted earnings per share (EPS) is defined as adjusted net income divided by the weighted average number of shares of common stock outstanding during the period for basic EPS and, additionally, inclusive of dilutive securities for diluted EPS.
Adjusted EBITDA - EBITDA, excluding, if applicable: (1) non-cash compensation expense, (2) goodwill and asset impairments, (3) acquisition related and restructuring costs, (4) other non-operating income and expense, and (5) other special items. The Company’s presentation of adjusted EBITDA may not be comparable to similarly-titled measures used by other companies.
Adjusted net income is defined as net income attributable to common stockholders, excluding the impact of (1) acquisition related and restructuring costs, (2) other non-operating foreign currency remeasurements, and (3) other special items.
Ancillary member revenue - Other Interval Network member related revenue including insurance and travel related services.
Available room nights - Number of nights available for rental by Aqua-Aston at managed vacation properties, which excludes all rooms under renovation.
Average revenue per member - Membership fee revenue, transaction revenue and ancillary member revenue for the Interval Network and Hyatt Residence Club for the applicable period, divided by the monthly weighted average number of Interval Network active members during the applicable period. Hyatt Residence Club revenue is included herein only since its date of acquisition.
Average transaction price — Contract Sales divided by the net number of transactions during the period subsequent to HVO’s October 1, 2014 acquisition.
Constant currency — Represents current period results of operations determined by translating the functional currency results into dollars (the reporting currency) using the actual blended rate of translation from the comparable prior period. Management believes that the presentation of results of operations excluding the effect of foreign currency translations serves to enhance the understanding of ILG’s performance and improves period to period comparability of results from business operations.
Contract sales — Total vacation ownership interests sold at consolidated and unconsolidated projects pursuant to purchase agreements, net of actual cancellations and rescissions, where we have met a minimum threshold amounting to a 10% down payment of the contract purchase price during the period. Contract sales are included herein only since HVO’s October 1, 2014 acquisition.
EBITDA - Net income attributable to common stockholders excluding, if applicable: (1) non-operating interest income and interest expense, (2) income taxes, (3) depreciation expense, and (4) amortization expense of intangibles.
Free cash flow - Cash provided by operating activities less capital expenditures.
Gross lodging revenue - Total room revenue collected from all Aqua-Aston-managed occupied
rooms.
Management fee revenue — Represents vacation ownership property management revenue earned by our Vacation Ownership segment exclusive of pass-through revenue.
Membership fee revenue — Represents fees paid for membership in the Interval Network and Hyatt Residence Club.
Other special items — consist of other items that we believe are not related to our core business operations. For the nine months of 2015, such item relates to legal proceedings as described in our prior filings with the SEC.
Other revenue — includes revenue related primarily to exchange and rental transaction activity and membership programs outside of the Interval Network and Hyatt Residence Club, sales of marketing materials primarily for point-of-sale developer use, and certain financial services-related fee income.
Pass-through revenue - Represents the compensation and other employee-related costs directly associated with managing properties that are included in both revenue and cost of sales and that are passed on to the property owners or homeowner associations without mark-up. Pass-through revenue of the Vacation Ownership segment also includes reimbursement of sales and marketing expenses, without mark-up, pursuant to contractual arrangements. Management believes presenting gross margin without these expenses provides management and investors a relevant period-over-period comparison
Rental management revenue — Represents rental management revenue earned by our vacation rental businesses within our Exchange and Rental segment, exclusive of pass-through revenue.
RevPAR - Gross Lodging Revenue divided by Available Room Nights for Aqua-Aston.
Total active members - Active members of the Interval Network as of the end of the period. Active members are members in good standing that have paid membership fees and any other applicable charges in full as of the end of the period or are within the allowed grace period. All Hyatt Residence Club members are also members of the Interval Network.
Transaction revenue — Interval Network and Hyatt Residence Club transactional and service fees paid primarily for exchanges, Getaways, reservation servicing and related transactions.
Volume per guest — Contract sales divided by the total number of tours during the period subsequent to HVO’s October 1, 2014 acquisition.
Interval Leisure Group
Investor Contact:
Lily Arteaga, 305 925-7302
Investor Relations
[email protected]
Or
Media Contact:
Christine Boesch, 305-925-7267
Corporate Communications
[email protected]\
Exhibit 99.2
ILG’s Proposed Acquisition of Starwood’s Vacation Ownership Business November 9, 2015 Creating a Leading, Integrated Shared Ownership Company SUPPLEMENTAL MATERIALS
2 Cautionary Language Concerning Forward-Looking Statements Information set forth in this communication, including financial estimates and statements as to the expected timing, completion and effects of the proposed merger between a wholly-owned subsidiary of Interval Leisure Group, Inc. (“ILG”) and Vistana Signature Experiences, Inc. (“Vistana”), which will immediately follow the proposed spin-off of Vistana from Starwood Hotels & Resorts Worldwide, Inc. (“Starwood”), constitute forward-looking statements within the meaning of the safe harbor provisions of the Private Securities Litigation Reform Act of 1995. These estimates and statements are subject to risks and uncertainties, and actual results might differ materially. Such estimates and statements include, but are not limited to, statements about the benefits of the proposed merger, including future financial and operating results, the combined company’s plans, objectives, expectations and intentions, and other statements that are not historical facts. Such statements are based upon the current beliefs and expectations of the management of ILG and are subject to significant risks and uncertainties outside of ILG’s control. Among the risks and uncertainties that could cause actual results to differ from those described in the forward-looking statements are the following: (1) the occurrence of any event, change or other circumstances that could give rise to the termination of the merger agreement, (2) the risk that ILG stockholders may not approve the issuance of ILG common stock in connection with the proposed merger, (3) the risk that the necessary regulatory approvals may not be obtained or may be obtained subject to conditions that are not anticipated, (4) risks that any of the closing conditions to the proposed merger, including Starwood’s spin-off of Vistana, may not be satisfied in a timely manner, (5) risks related to disruption of management time from ongoing business operations due to the proposed merger, (6) failure to realize the benefits expected from the proposed merger, (7) the effect of the announcement of the proposed merger on the ability of ILG to retain and hire key personnel and maintain relationships with its key business partners, and on its operating results and businesses generally, (8) adverse trends in economic conditions generally or in the vacation ownership, vacation rental and travel industries, or adverse events or trends in key vacation destinations, (9) adverse changes to, or interruptions in, relationships with third parties unrelated to the announcement, (10) lack of available financing for, or insolvency or consolidation of developers, (11) decreased demand from prospective purchasers of vacation interests, (12) travel related health concerns, (13) ILG’s ability to compete effectively and successfully and to add new products and services, (14) ILG’s ability to successfully manage and integrate acquisitions, (15) the occurrence of a termination event under the master license agreement with Hyatt, (16) ILG’s ability to market vacation ownership interests successfully and efficiently, (17) impairment of ILG’s assets, (18) the restrictive covenants in ILG’s revolving credit facility and indenture; (19) business interruptions in connection with ILG’s technology systems, (20) the ability of managed homeowners associations to collect sufficient maintenance fees, (21) third parties not repaying advances or extensions of credit, (22) fluctuations in currency exchange rates and (23) ILG’s ability to expand successfully in international markets and manage risks specific to international operations. Discussions of additional risks and uncertainties are contained in ILG’s filings with the U.S. Securities and Exchange Commission. ILG is not under any obligation, and each expressly disclaim any obligation, to update, alter, or otherwise revise any forward-looking statements, whether written or oral, that may be made from time to time, whether as a result of new information, future events, or otherwise. Persons reading this announcement are cautioned not to place undue reliance on these forward-looking statements which speak only as of the date hereof. Safe Harbor
3 Additional Information and Where to Find It This communication does not constitute an offer to sell or the solicitation of an offer to buy any securities or a solicitation of any vote or approval. This communication may be deemed to be solicitation material in respect of the proposed merger between a wholly-owned subsidiary of ILG and Vistana. In connection with the proposed merger, ILG intends to file a registration statement on Form S-4, containing a proxy statement/prospectus with the Securities and Exchange Commission (“SEC”). STOCKHOLDERS OF ILG AND STARWOOD ARE URGED TO READ ALL RELEVANT DOCUMENTS FILED WITH THE SEC, INCLUDING THE PROXY STATEMENT/PROSPECTUS, BECAUSE THEY WILL CONTAIN IMPORTANT INFORMATION ABOUT THE PROPOSED MERGER. Investors and security holders will be able to obtain copies of the proxy statement/prospectus as well as other filings containing information about ILG, Starwood and Vistana, without charge, at the SEC’s website, http://www.sec.gov. Copies of documents filed with the SEC by ILG will be made available free of charge on ILG’s investor relations website. Copies of documents filed with the SEC by Starwood will be made available free of charge on Starwood’s investor relations website. Participants in Solicitation ILG and its directors and executive officers, and Starwood and its directors and executive officers may be deemed to be participants in the solicitation of proxies from the holders of ILG common stock in respect of ILG’s stock issuance in connection with the proposed merger. Information about the directors and executive officers of ILG is set forth in the proxy statement for ILG’s 2015 Annual Meeting of Stockholders, which was filed with the SEC on April 6, 2015. Information about the directors and executive officers of Starwood is set forth in the proxy statement for Starwood’s 2015 Annual Meeting of Stockholders, which was filed with the SEC on April 17, 2015. Investors may obtain additional information regarding the interest of such participants by reading the proxy statement/prospectus regarding the proposed merger when it becomes available. Safe Harbor
Stronger financial profile to drive growth Leading diversified vacation ownership company with complementary product offerings Improved financial strength and flexibility Embedded growth opportunities with over $5 billion of future inventory yield Significant cost savings and revenue synergies Enhanced membership and exchange growth opportunities ILG & Vistana: A Powerful Combination 1 Derived from ILG SEC filings 2 Derived from the pro forma data in Vistana’s Form 10 filed September 22, 2015; excludes the revenues related to the residential segment. 3 Equivalent to ILG’s pass-through revenue 4 Sales of vacation ownership products Resort operations and ancillary services Cost reimbursements3 Consumer financing Resort and vacation network management Exchange & Rental Vacation Ownership ILG / $672 million1 LTM Revenues June 30, 2015 Vistana / $923 million2 Diversified & Complementary Businesses Pass-through revenue Industry-Leading Brands
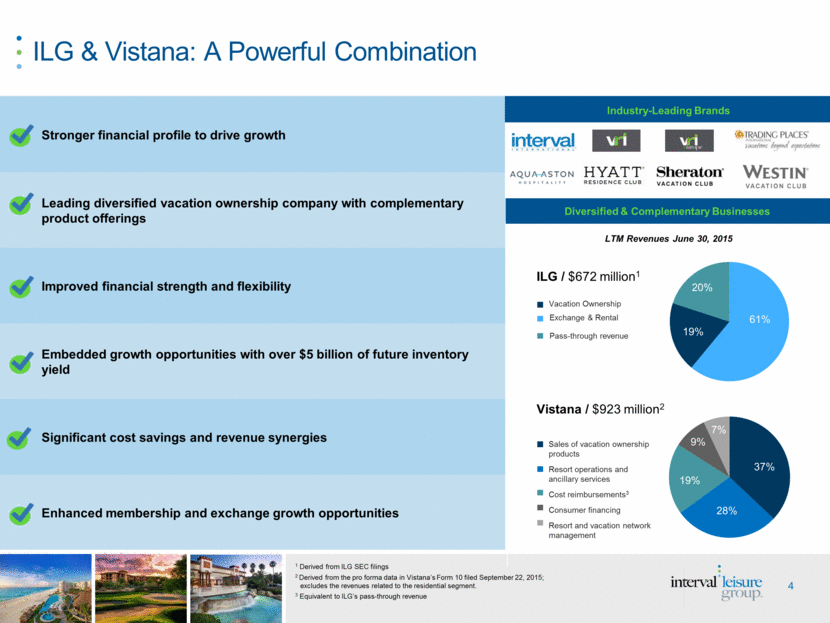
Vistana: Attractive Collection of Assets Includes: Notes: All amounts as of 9/30/15, in accordance with the basis of presentation used in Vistana’s Form 10 filed September 22, 2015. Net of allowances as of 9/30/2015 Estimated Fair Value Excludes land to be retained by Starwood $415M Unsecuritized vacation ownership notes1 Securitizations of existing and future receivables to fund future developments Recent branded securitizations have achieved >90% advance rates with interest rates of ~ 2.5% $240M Balance sheet value of inventory In villa- style resorts with high levels of owner/guest satisfaction ~$200M2 5 transferred world-class resorts Centered on proven vacation ownership markets Future development with capital-efficient inventory management with phased construction and pre-construction financing Provides new distribution points to support revenue growth ~$30M Additional land held for development3 Hawaii, Florida, Colorado, South Carolina, California, Mexico and St. John, USVI 14 Active sales centers Generated $739M of originated sales in peak sales year (2006) Strategic marketing channels deliver predictable flow of qualified guests Focus on resort guests with high propensity to tour and purchase vacation ownership products Six new distribution points expected to be added through 2018 5
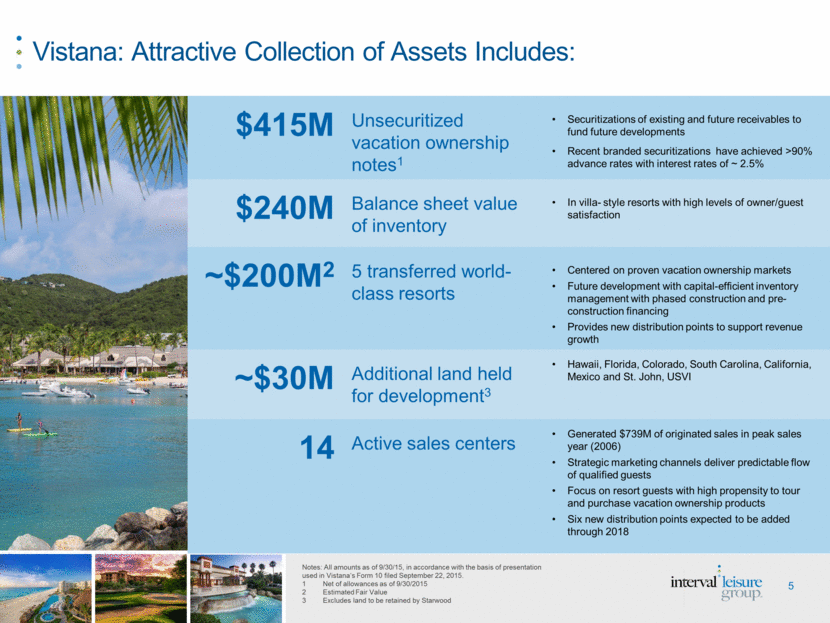
Vistana: Attractive and Growing Resort Portfolio $1.2B Completed Inventory1 $3.1B In Development & Future Phases2 $1.3B Transferred Properties2 $5.5B Future Inventory Yield Opportunity 6 Completed Inventory yield based on pricing as of year-end 2014 and includes inventory on hand, projected returns due to mortgage receivable defaults in the future as well as projected purchases through 2018 from existing third party agreements and other third party sources. Projections for “In Development and Future Phases” and “Transferred Properties” are based on inventory from build out of current active development projects and future conversion of transferred properties. Projected yield for these categories include 2% annual price growth and excludes future returns pursuant to GAAP accounting methodology. Yield projections are subject to change due to market dynamics, ongoing review of development, and operational performance within mortgage portfolio, sales and marketing and resort business lines
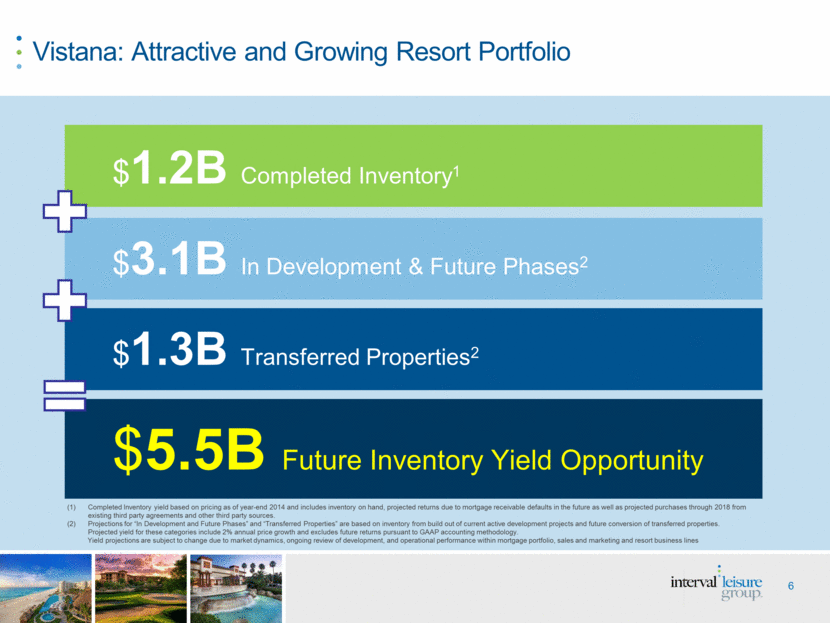
Business has delivered strong performance YTD 2015 Modified Adjusted EBITDA1 for 2015 expected to be approximately $140M -$145M based on 8%-10% originated sales2 growth and ADR/occupancy growth in management and resort operations 2018 Modified Adjusted EBITDA includes $21 million in targeted synergies Vistana Signature Experiences Growth Potential Notes: All financial information (other than targeted synergies) on this slide prepared by Vistana. Financial information presented excludes any impact related to the acquisition method of accounting. Please see appendix for non-GAAP financial measures reconciliation for Modified Adjusted EBITDA. Modified Adjusted EBITDA equals Pro forma Adjusted EBITDA excluding non-cash compensation ($4M for all scenarios) and including targeted synergies in 2018. Pro forma Adjusted EBITDA is in accordance with the basis of presentation used in the Vistana Form 10 filed with September 22, 2015 and excludes the impact of the deferral adjustment associated with percentage of completion accounting guidelines reflecting its net impact on Vistana’s GAAP revenues and expenses and the operations of Starwood’s residential business, and includes the impact of pro forma adjustments related to royalty fees, management fees and credit facility fees. Originated sales represent the total amount of vacation ownership products under purchase agreements signed during the period where a down payment of at least ten percent of the contract price has been received, reduced by actual rescissions and cancellations as well as adjustments for incentives and other administrative fee revenues during the period. 7 2014 Originated Sales $323M Modified Adjusted EBITDA $116M 2015 Originated Sales $350M - $355M Modified Adjusted EBITDA $140M - $145M 2018 Originated Sales $440M - $550M Modified Adjusted EBITDA $185M - $220M
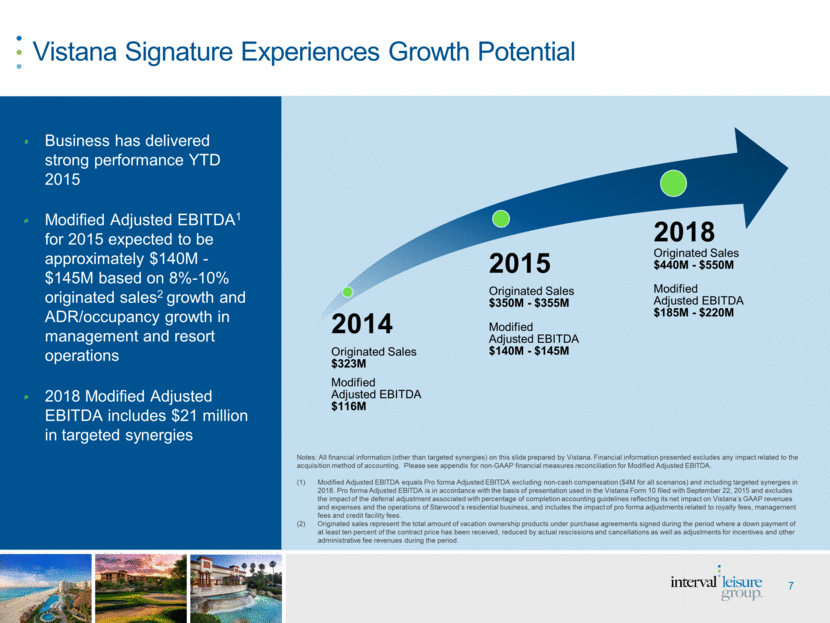
Vistana Signature Experiences – 2018 Potential Growth Scenarios Notes: All financial information (other than targeted synergies) on this slide provided by Vistana and excludes any impact related to the acquisition method of accounting. 1 Originated sales represent the total amount of vacation ownership products under purchase agreements signed during the period where a down payment of at least ten percent of the contract price has been received, reduced by actual rescissions and cancellations as well as adjustments for incentives and other administrative fee revenues during the period. 2 Pro forma Adjusted EBITDA is in accordance with the basis of presentation used in the Vistana Form 10 filed September 22, 2015 and excludes the impact of the deferral adjustment associated with percentage of completion accounting guidelines reflecting its net impact on Vistana’s GAAP revenues and expenses, the operations of Starwood’s residential business and includes the impact of the pro-forma adjustments related to royalty fees, management fees and credit facility fees. Financial information presented excludes any impact related to the acquisition method of accounting as ILG is considered the accounting acquirer of VSE. 3 Modified Adjusted EBITDA equals Pro forma Adjusted EBITDA excluding non-cash compensation and including targeted synergies. Annualized originated sales growth scenarios 2015 Estimated Growth Case Based on the estimated growth rate between 2014 and 2015 Higher Growth Case Based on embedded inventory and expected additional distribution points Existing distribution capacity and infrastructure supports sales growth targets Historical peak sales reached $739M in 2006 Complementary growth in other segments based on historical performance Resort and Vacation Network Management increasing with growth in owner base, new development and inflation; Revenue stream is contract based, predictable and recurring Resort Operations and Ancillary Services increasing with unit growth, investment in transferred properties and inflation Sales Growth Scenarios: Year ended 2018E (in millions) 2015 Estimated growth case Higher growth case 2018 Originated Sales1 $440 $550 Pro Forma Adjusted EBITDA2 $160 $195 Non-cash compensation 4 4 Targeted Synergies 21 21 Modified Adjusted EBITDA Including Synergies3 $185 $220 8
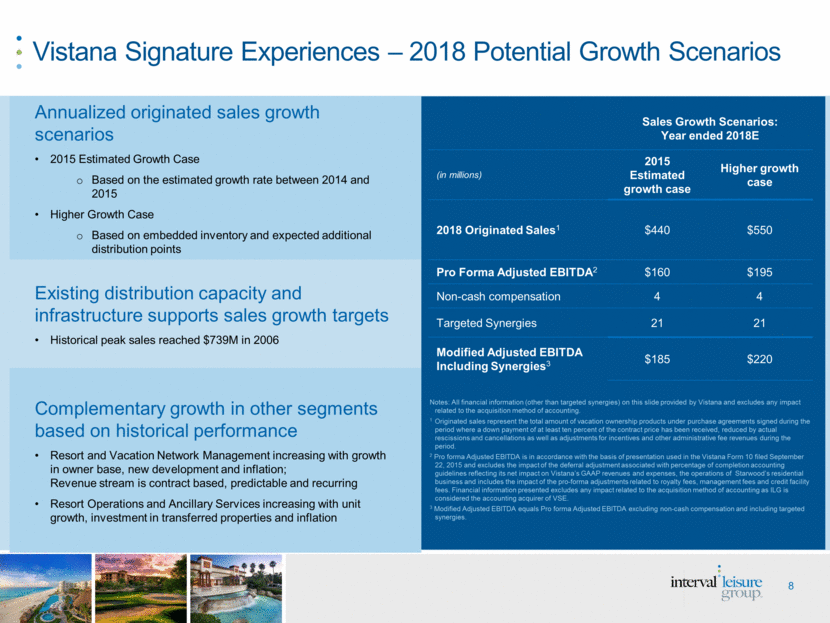
Appendix 9

Vistana Signature Experiences – Non-GAAP to GAAP Reconciliations (in millions) Year Ended 2015E Year Ended 2018E Year Ended 2014 Low High 2015 Estimated growth case Higher growth case Income before income taxes $127 $133 $138 $154 $191 Depreciation and amortization 38 39 39 48 48 Percentage of completion deferral 1 8 8 3 3 Residential (12) Adjusted EBITDA1 154 180 185 205 242 Royalty Fees (36) (37) (37) (38) (40) Management Fees (2) (3) (3) (3) (3) Expenses for Credit Facilities (4) (4) (4) (4) (4) Pro-Forma Adjusted EBITDA2 112 136 141 160 195 Non-cash compensation 4 4 4 4 4 Targeted synergies 21 21 Modified Adjusted EBITDA3 $116 $140 $145 $185 $220 Note: Financial information (other than targeted synergies) on this slide prepared by Vistana. Financial information presented excludes any impact related to the acquisition method of accounting. Adjusted EBITDA is in accordance with the basis of presentation used in the Vistana Form 10 filed September 22, 2015 and excludes the impact of deferral adjustment associated with percentage of completion accounting guidelines reflecting its net impact on Vistana’s GAAP revenues and expenses and the operations of Starwood’s residential business. Pro forma Adjusted EBITDA includes the impact of the pro forma adjustments related to royalty fees, management fees and credit facility fees. Modified Adjusted EBITDA equals Pro forma Adjusted EBITDA excluding non-cash compensation expense and includes targeted synergies in 2018. 10
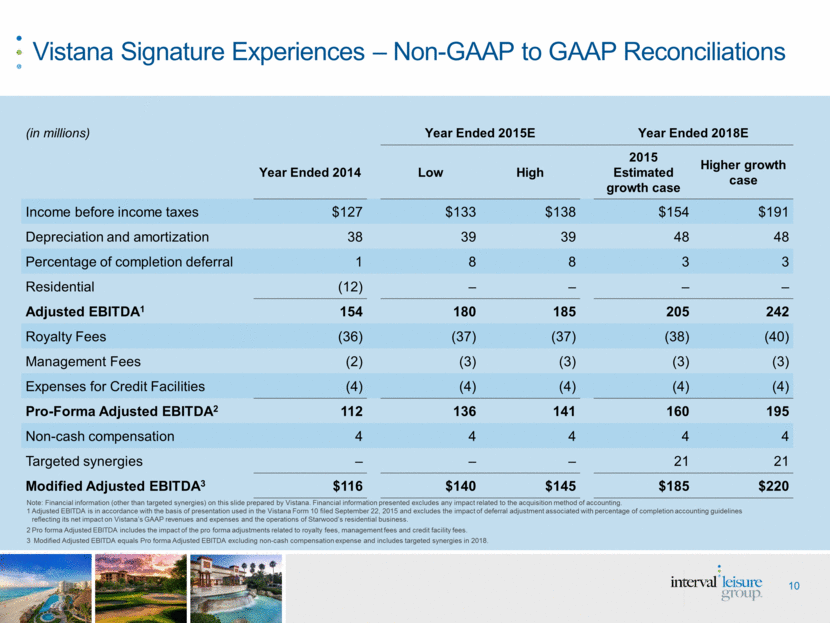
Resort Name Location Experience Completed Units Planned Units Total Units Sheraton Vistana Resort Orlando, FL Theme park 1,566 — 1,566 Sheraton Vistana Villages Orlando, FL Theme park 892 734 1,626 Vistana’s BeachClub Jensen Beach, FL Beach 76 — 76 Sheraton PGA Vacation Resort Port St. Lucie, FL Golf 30 — 30 The Westin Nanea Ocean Villas Maui, HI Beach — 390 390 The Westin Ka’anapali Ocean Resort Villas Maui, HI Beach 280 — 280 The Westin Ka’anapali Ocean Resort Villas North Maui, HI Beach 258 — 258 The Westin Princeville Ocean Resort Villas Kauai, HI Beach 173 — 173 The Westin Lagunamar Ocean Resort Villas & Spa Cancun, MX Beach 290 — 290 The Westin St. John Resort & Villas St. John, USVI Beach 164 88 252 Harborside Resort at Atlantis Nassau, Bahamas Beach/Casino 198 — 198 Sheraton Broadway Plantation Myrtle Beach, SC Golf/Beach 342 160 502 The Westin Mission Hills Resort Villas Rancho Mirago, CA Golf/Desert 158 — 158 The Westin Desert Willow Villas, Palm Desert Palm Desert, CA Golf/Desert 134 166 300 The Westin Kierland Villas Scottsdale, AZ Golf/Desert 149 — 149 Sheraton Desert Oasis Villas Scottsdale, AZ Golf/Desert 150 — 150 Sheraton Mountain Vista Vail Calley, CO Ski/Mountain 78 — 78 The Westin Riverfront Mountain Villas Vail Calley, CO Ski/Mountain 34 — 34 Lakeside Terrace Villas Vail Calley, CO Ski/Mountain 23 — 23 Sheraton Steamboat Resort Steamboat Springs, CO Ski/Mountain 21 — 21 Total 5,016 1,538 6,554 Bolstering ILG’s Vacation Ownership Portfolio Vistana’s Vacation Ownership Resorts 11
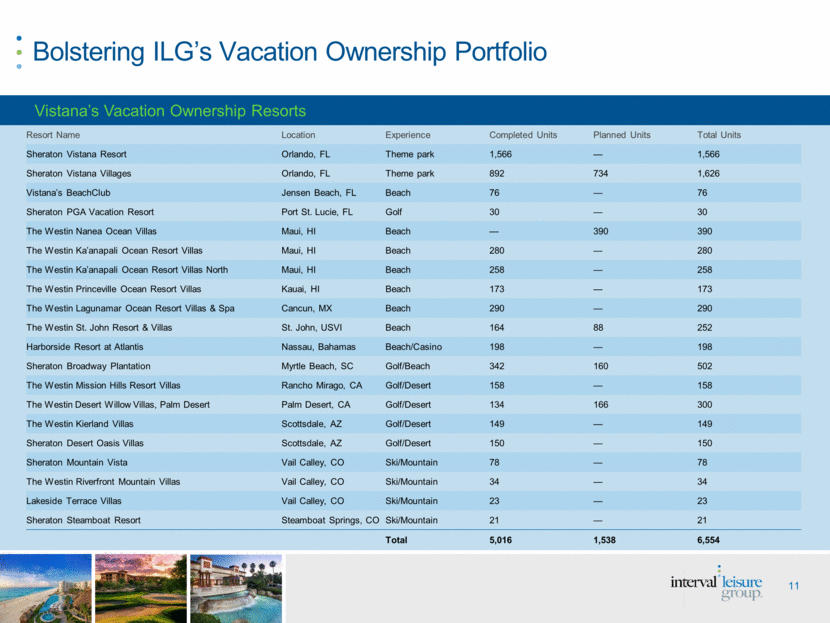
Resort Name Location Experience Completed Units Planned Units Total Units The Phoenician Residences, The Luxury Collection Residence Club Scottsdale, AZ Golf/Desert 6 — 6 The St. Regis Residence Club, Aspen Aspen, CO Ski/Mountain 25 — 25 The St. Regis Residence Club, New York New York, NY City/Cultural 31 — 31 Total 62 — 62 Bolstering ILG’s Vacation Ownership Portfolio Vistana’s Fractional Residence Properties Resort Name Location Experience Hotel Rooms The Westin Resort & Spa, Cancun Cancun, MX Beach 379 The Westin Resort & Spa, Puerto Vallarta Puerto Vallarta, MX Beach 280 The Westin Resort & Spa, Los Cabos Los Cabos, MX Beach 243 Sheraton Kauai Resort Kauai, HI Beach 394 Sheraton Steamboat Resort Steamboat Springs, CO Ski/Mountain 264 Total 1,560 Vistana’s Transferred Properties 12
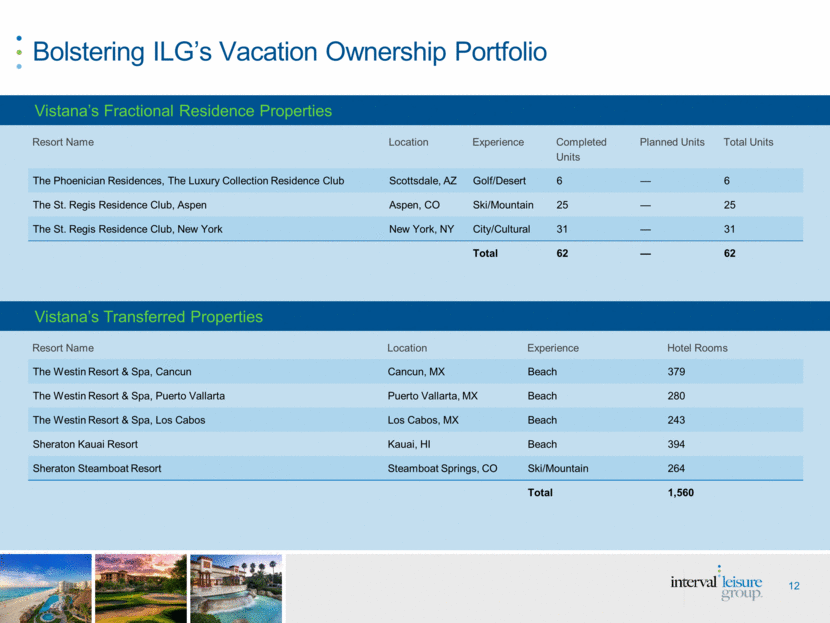
Serious News for Serious Traders! Try StreetInsider.com Premium Free!
You May Also Be Interested In
- Venus Aerospace Opens New Propulsion Test Stand at Houston Spaceport
- Bernabei & Kabat: Current KB Home Sales Agent Sues, Alleging Years of Sexual Harassment, Retaliation and Unequal Pay
- Lancet Publication Marks Important Advance in Influenza Prevention for Older Adults
Create E-mail Alert Related Categories
SEC FilingsSign up for StreetInsider Free!
Receive full access to all new and archived articles, unlimited portfolio tracking, e-mail alerts, custom newswires and RSS feeds - and more!
