



Form 8-K Higher One Holdings, For: Feb 26
 Tweet
Tweet Share
Share E-mail
UNITED STATES
SECURITIES AND EXCHANGE COMMISSION
Washington, D.C. 20549
FORM 8-K
CURRENT REPORT
Pursuant to Section 13 or 15(d) of the
Securities Exchange Act of 1934
Date of Report (Date of earliest event reported): February 26, 2015
HIGHER ONE HOLDINGS, INC.
(Exact name of registrant as specified in its charter)
|
|
|
|
|
|
|
Delaware
|
|
001-34779
|
|
26-3025501
|
|
(State or other jurisdiction
of incorporation)
|
|
(Commission
File Number)
|
|
(I.R.S. Employer
Identification No.)
|
115 Munson Street
New Haven, CT 06511
(Address of principal executive offices and zip code)
(203) 776-7776
(Registrant's telephone number, including area code)
Check the appropriate box below if the Form 8-K filing is intended to simultaneously satisfy the filing obligation of the registrant under any of the following provisions (see General Instruction A.2. below):
|
¨
|
Written communications pursuant to Rule 425 under the Securities Act (17 CFR 230.425)
|
|
¨
|
Soliciting material pursuant to Rule 14a-12 under the Exchange Act (17 CFR 240.14a-12)
|
|
¨
|
Pre-commencement communications pursuant to Rule 14d-2(b) under the Exchange Act (17 CFR 240.14d-2(b))
|
|
¨
|
Pre-commencement communications pursuant to Rule 13e-4(c) under the Exchange Act (17 CFR 240.13e-4(c))
|
Item 2.02. Results of Operations and Financial Condition
On February 26, 2015, Higher One Holdings, Inc. ("Higher One") issued a press release announcing its financial results for the fourth quarter ended December 31, 2014. A copy of the press release is attached hereto as Exhibit 99.1.
Item 7.01. Regulation FD Disclosure
On February 26, 2015, at 8:30 am ET, Higher One will host a conference call to discuss fourth quarter results. Interested parties, including analysts, investors and the media, may listen live via the internet by logging onto the Investor Relations section of Higher One's website at http://www.higherone.com.
As part of the conference call, Marc Sheinbaum, President and Chief Executive Officer, and Christopher Wolf, Chief Financial Officer, will present items not previously disclosed in reports filed by Higher One with the SEC. A copy of the PowerPoint slides that will accompany Higher One's presentation is attached hereto as Exhibit 99.2.
The information in this Form 8-K shall not be deemed to be "filed" for the purposes of Section 18 of the Securities and Exchange Act of 1934, as amended (the "Exchange Act"), or otherwise subject to the liabilities of such section, nor shall such information be deemed incorporated by reference in any filing under the Securities Act of 1933, as amended, or the Exchange Act, except as shall be expressly set forth by specific reference in such a filing.
Use of Non-GAAP Financial Measures
The press release, PowerPoint slides and presentation described above include certain metrics presented on a non-GAAP basis, including non-GAAP adjusted EBITDA, non-GAAP adjusted net income, and non-GAAP adjusted net income per share. Higher One believes that these non-GAAP measures, which exclude amortization of intangibles, stock based compensation, certain one-time or non-cash impacts or other adjustments to Higher One's results, all net of taxes, provide useful information regarding normalized trends relating to the company's financial condition and results of operations. Reconciliations of these non-GAAP measures to their closest comparable GAAP measures are included in the press release, PowerPoint slides and presentation.
This Current Report on Form 8-K contains statements that constitute "forward-looking statements" within the meaning of the Private Securities Litigation Reform Act of 1995. Management's projections and expectations are subject to a number of risks and uncertainties that could cause actual performance to differ materially from that predicted or implied. Forward-looking statements may be identified by the use of words such as "expect," "anticipate," "believe," "estimate," "potential," "should" or similar words intended to identify information that is not historical in nature. Forward-looking statements contained herein include, among others, statements concerning management's expectations about future events and Higher One's operating plans and performance, bank partners, the regulatory environment, banking fees, litigation, sales, and the expected benefits of acquisitions, and such statements are based on the current beliefs and expectations of Higher One management, as applicable, and are subject to known and unknown risks and uncertainties. There are a number of risks and uncertainties that could cause actual results to differ materially from those contemplated by the forward-looking statements. These statements speak only as of the date they are made, and the company does not intend to update or otherwise revise the forward-looking information to reflect actual results of operations, changes in financial condition, changes in estimates, expectations or assumptions, changes in general economic or industry conditions or other circumstances arising and/or existing since the preparation of this Current Report on Form 8-K or to reflect the occurrence of any unanticipated events. The forward-looking statements in this Current Report on Form 8-K do not include the potential impact of any acquisitions or divestitures that may be announced and/or completed after the date hereof. For further information regarding the risks associated with Higher One's business, please refer to Higher One's filings with the Securities and Exchange Commission, including our Annual Report on Form 10-K for the most recent fiscal year end, Quarterly Reports on Form 10-Q and Current Reports on Form 8-K.
Item 9.01. Financial Statements and Exhibits
(d) Exhibits.
|
Exhibits
|
Description
|
|
|
|
|
99.1
|
Press Release of Higher One Holdings, Inc., dated February 26, 2015
|
|
|
|
|
99.2
|
PowerPoint slides, Higher One Holdings, Inc. Q4' 14 Earnings Results, dated February 26, 2015
|
1
SIGNATURE
Pursuant to the requirements of the Securities Exchange Act of 1934, the registrant has duly caused this report to be signed on its behalf by the undersigned hereunto duly authorized.
Dated: February 26, 2015
HIGHER ONE HOLDINGS, INC.
By: /s/ Marc Sheinbaum
Marc Sheinbaum
Chief Executive Officer
2
EXHIBIT 99.1
Higher One Holdings, Inc. Reports Fourth Quarter and Full Year 2014 Financial Results
|
·
|
Fourth quarter gross revenue equals $57.1 million and full year gross revenue equals $228.9 million
|
|
·
|
Payments transaction volume grows 25% year-over-year
|
|
·
|
Free cash flow of $7.6 million in the quarter
|
New Haven, CT, February 26, 2015 – Higher One Holdings, Inc. (NYSE: ONE) ("Higher One" or the "Company"), today announced financial results for the fourth quarter and full year 2014. The Company reported fourth quarter 2014 revenue of $57.1 million, an increase of 0.8% from $56.6 million reported in the fourth quarter of 2013. Non-GAAP adjusted diluted EPS was $0.14, compared to $0.17 for the fourth quarter of 2013.
Marc Sheinbaum, Chief Executive Officer, said, "Despite the headwinds we faced going into the fourth quarter of 2014, I am proud of how we performed across the business. We continue to diversify our business and our revenue streams, with organic growth in both our payments and Campus Labs business lines, while also managing our costs in a challenging operating environment."
Sheinbaum added, "We remain excited about our prospects for the payments and data analytics businesses. However, it is apparent that certain trends that we saw in 2014 will continue into 2015 for our disbursement services business and OneAccount product, including lower deposit and spending volumes. In addition, we are reviewing our fee schedule for the OneAccount, which may lead to a reduction or elimination of certain fees. When taking these factors into consideration, our expectations are that the disbursement services business and OneAccount product will experience a decline in revenue in 2015 compared to 2014. As such, our current expectation for 2015 is for consolidated gross revenues to be in the range of $205 million to $215 million. We will continue to manage our expenses and spending closely, and expect annual non-GAAP adjusted diluted EPS to be in the range of $0.40 to $0.45 in 2015."
Sheinbaum concluded, "We will continue to invest in and enhance critical parts of our business in an effort to bring long-term value to the colleges and universities, as well as the students, we serve."
GAAP financial results for the fourth quarter of 2014 compared to the fourth quarter of 2013:
|
·
|
Revenue increased 0.8% to $57.1 million in the fourth quarter of 2014 compared to revenue of $56.6 million for the fourth quarter of 2013
|
|
·
|
GAAP diluted EPS was $0.09 for the fourth quarter of 2014, compared to $0.13 for the fourth quarter of 2013
|
|
·
|
The Company recorded net income of $4.1 million for the fourth quarter of 2014, compared to $6.3 million recorded for the fourth quarter of 2013
|
Non-GAAP financial results for the fourth quarter of 2014 compared to the fourth quarter of 2013:
|
·
|
Non-GAAP adjusted EBITDA was $14.7 million in the fourth quarter of 2014, compared to $16.0 million in the fourth quarter of 2013
|
|
·
|
Non-GAAP adjusted net income was $6.7 million for the fourth quarter of 2014, compared to $8.1 million for the fourth quarter of 2013
|
|
·
|
Non-GAAP adjusted diluted EPS was $0.14 for the fourth quarter of 2014, compared to $0.17 for the fourth quarter of 2013
|
Full Year
Full year 2014 gross revenue was $228.9 million, an increase of 8% from $211.1 million in 2013. Net income increased 5.9% to $15.0 million for full year 2014, as compared to $14.1 million in 2013. Adjusted net income was $28.4 million for the full year 2014, as compared to $29.2 million for 2013. Non-GAAP adjusted EPS was $0.59 for the full year 2014, as compared to $0.60 for 2013. GAAP diluted EPS for the full year 2014 was $0.31 compared to $0.29 for the full year 2013. Adjusted EBITDA increased 3% to $59.6 million for the full year 2014, as compared to $57.8 million in 2013.
1
Conference Call Information
Higher One will host a conference call at 8:30 a.m. EST today to discuss fourth quarter and full year 2014 results. The dial in phone number is 877-280-4956 for domestic listeners and 857-244-7313 for international listeners. The conference ID number is 33097363. A live webcast of the conference call, together with a slide presentation that includes supplemental financial information and reconciliations of certain non-GAAP measures to their nearest comparable GAAP measures can be accessed through Higher One's investor relations website at http://www.ir.higherone.com. In addition, an archive of the webcast will be available for 90 days through the same link. A replay of the call will be available at 888-286-8010 for domestic listeners and 617-801-6888 for international listeners. Please use the passcode 11097037 to access the replay.
About Higher One Holdings
Higher One Holdings, Inc. (NYSE: ONE) partners with colleges and universities to lower their administrative costs and to improve graduation rates. We provide a broad array of payment, refund disbursement and data analytics and management tools to institutions that help them save money and enhance institutional effectiveness. And for students, we offer financial literacy programs and convenient, flexible and affordable transaction options to help them manage their finances. Higher One's products and services support more than 1,900 schools and approximately 13 million enrolled students. More information about Higher One can be found at www.ir.higherone.com.
Forward-Looking Statements
This press release contains statements that constitute "forward-looking statements" within the meaning of the Private Securities Litigation Reform Act of 1995. Management's projections and expectations are subject to a number of risks and uncertainties that could cause actual performance to differ materially from that predicted or implied. Forward-looking statements may be identified by the use of words such as "expect," "anticipate," "believe," "estimate," "potential," "should" or similar words intended to identify information that is not historical in nature. Forward-looking statements contained herein include, among others, statements concerning management's expectations about future events and Higher One's operating plans and performance, bank partners, the regulatory environment, banking fees, litigation, sales, and the expected benefits of acquisitions, and such statements are based on the current beliefs and expectations of Higher One management, as applicable, and are subject to known and unknown risks and uncertainties. There are a number of risks and uncertainties that could cause actual results to differ materially from those contemplated by the forward-looking statements. These statements speak only as of the date they are made, and the Company does not intend to update or otherwise revise the forward-looking information to reflect actual results of operations, changes in financial condition, changes in estimates, expectations or assumptions, changes in general economic or industry conditions or other circumstances arising and/or existing since the preparation of this press release or to reflect the occurrence of any unanticipated events. The forward-looking statements in this press release do not include the potential impact of any acquisitions or divestitures that may be announced and/or completed after the date hereof. For further information regarding the risks associated with Higher One's business, please refer to Higher One's filings with the Securities and Exchange Commission, including our Annual Report on Form 10-K for the most recent fiscal year end, Quarterly Reports on Form 10-Q and Current Reports on Form 8-K.
Use of Non-GAAP Financial Measures
This release includes certain metrics presented on a non-GAAP basis, including non-GAAP adjusted EBITDA, non-GAAP adjusted net income, and non-GAAP adjusted EPS. We believe that these non-GAAP measures, which exclude amortization of intangibles, stock-based compensation, and certain non-recurring, non-cash impacts and other adjustments to our results, all net of taxes, provide useful information regarding normalized trends relating to the company's financial condition and results of operations. Reconciliations of these non-GAAP measures to their closest comparable GAAP measure are included in this press release.
Contacts
|
Investor Relations:
|
Patrick Pearson, 203-776-7776 x4421, [email protected]
|
|
Media Relations:
|
Lauren Perry, 203-776-7776 x 4495, [email protected]
|
2
|
Higher One Holdings, Inc.
|
||||||||||||||||
|
Consolidated Income Statement
|
||||||||||||||||
|
(In thousands of dollars, except share and per share amounts)
|
||||||||||||||||
|
|
||||||||||||||||
|
|
Three Months Ended
|
Year Ended
|
||||||||||||||
|
|
December 31,
|
December 31,
|
||||||||||||||
|
|
2014
|
2013
|
2014
|
2013
|
||||||||||||
|
Revenue:
|
||||||||||||||||
|
Account revenue
|
$
|
31,578
|
$
|
33,306
|
$
|
131,053
|
$
|
135,847
|
||||||||
|
Payment transaction revenue
|
15,579
|
13,707
|
58,231
|
41,109
|
||||||||||||
|
Higher education institution revenue
|
9,709
|
9,281
|
38,667
|
33,155
|
||||||||||||
|
Other revenue
|
187
|
314
|
910
|
1,012
|
||||||||||||
|
Gross revenue
|
57,053
|
56,608
|
228,861
|
211,123
|
||||||||||||
|
Less: allowance for customer restitution
|
–
|
–
|
(8,750
|
)
|
–
|
|||||||||||
|
Revenue
|
57,053
|
56,608
|
220,111
|
211,123
|
||||||||||||
|
Cost of revenue
|
25,511
|
23,631
|
102,389
|
88,824
|
||||||||||||
|
Gross margin
|
31,542
|
32,977
|
117,722
|
122,299
|
||||||||||||
|
Operating expenses:
|
||||||||||||||||
|
General and administrative
|
16,949
|
15,486
|
65,292
|
58,555
|
||||||||||||
|
Product development
|
1,677
|
2,144
|
7,194
|
9,305
|
||||||||||||
|
Sales and marketing
|
4,342
|
4,335
|
18,098
|
17,058
|
||||||||||||
|
Litigation settlement and related costs
|
–
|
–
|
–
|
16,320
|
||||||||||||
|
Merger and acquisition related expenses
|
–
|
–
|
–
|
(4,791
|
)
|
|||||||||||
|
Total operating expenses
|
22,968
|
21,965
|
90,584
|
96,447
|
||||||||||||
|
Income from operations
|
8,574
|
11,012
|
27,138
|
25,852
|
||||||||||||
|
Interest income
|
19
|
30
|
92
|
88
|
||||||||||||
|
Interest expense
|
(823
|
)
|
(830
|
)
|
(3,266
|
)
|
(3,082
|
)
|
||||||||
|
Other income (loss)
|
(883
|
)
|
61
|
678
|
622
|
|||||||||||
|
Net income before income taxes
|
6,887
|
10,273
|
24,642
|
23,480
|
||||||||||||
|
Income tax expense
|
2,775
|
4,012
|
9,675
|
9,352
|
||||||||||||
|
Net income
|
$
|
4,112
|
$
|
6,261
|
$
|
14,967
|
$
|
14,128
|
||||||||
|
|
||||||||||||||||
|
Net income available to common stockholders:
|
||||||||||||||||
|
Basic
|
$
|
4,112
|
$
|
6,261
|
$
|
14,967
|
$
|
14,128
|
||||||||
|
Diluted
|
$
|
4,112
|
$
|
6,261
|
$
|
14,967
|
$
|
14,128
|
||||||||
|
|
||||||||||||||||
|
Weighted average shares outstanding
|
||||||||||||||||
|
Basic
|
47,295,685
|
46,975,571
|
47,209,780
|
46,717,359
|
||||||||||||
|
Diluted
|
47,696,315
|
48,391,409
|
48,050,039
|
48,368,365
|
||||||||||||
|
|
||||||||||||||||
|
Net income available to common stockholders per common share:
|
||||||||||||||||
|
Basic
|
$
|
0.09
|
$
|
0.13
|
$
|
0.32
|
$
|
0.30
|
||||||||
|
Diluted
|
$
|
0.09
|
$
|
0.13
|
$
|
0.31
|
$
|
0.29
|
||||||||
3
|
Higher One Holdings, Inc.
|
||||||||
|
Consolidated Balance Sheet
|
||||||||
|
(In thousands of dollars, except share and per share amounts)
|
||||||||
|
|
December 31, 2014
|
December 31, 2013
|
||||||
|
Assets
|
||||||||
|
Current assets:
|
||||||||
|
Cash and cash equivalents
|
$
|
40,022
|
$
|
6,268
|
||||
|
Investments in marketable securities
|
249
|
247
|
||||||
|
Accounts receivable
|
8,929
|
8,747
|
||||||
|
Income receivable
|
9,053
|
6,680
|
||||||
|
Deferred tax assets
|
3,719
|
5,895
|
||||||
|
Prepaid expenses and other current assets
|
7,805
|
7,725
|
||||||
|
Restricted cash
|
-
|
250
|
||||||
|
Total current assets
|
69,777
|
35,812
|
||||||
|
Deferred costs
|
4,187
|
4,373
|
||||||
|
Fixed assets, net
|
46,768
|
49,888
|
||||||
|
Intangible assets, net
|
56,255
|
59,834
|
||||||
|
Goodwill
|
67,403
|
67,403
|
||||||
|
Loan receivable related to New Markets Tax Credit financing
|
7,633
|
7,633
|
||||||
|
Other assets
|
2,523
|
4,940
|
||||||
|
Restricted cash
|
2,725
|
2,500
|
||||||
|
Total assets
|
$
|
257,271
|
$
|
232,383
|
||||
|
|
||||||||
|
Liabilities and Stockholders' Equity
|
||||||||
|
Current liabilities:
|
||||||||
|
Accounts payable
|
$
|
3,339
|
$
|
3,787
|
||||
|
Accrued expenses
|
25,872
|
30,322
|
||||||
|
Deferred revenue
|
25,174
|
22,392
|
||||||
|
Total current liabilities
|
54,385
|
56,501
|
||||||
|
Deferred revenue and other non-current liabilities
|
4,019
|
2,342
|
||||||
|
Loan payable and deferred contribution related to New Markets Tax Credit financing
|
8,871
|
9,181
|
||||||
|
Debt
|
94,000
|
89,000
|
||||||
|
Deferred tax liabilities
|
3,814
|
2,393
|
||||||
|
Total liabilities
|
165,089
|
159,417
|
||||||
|
Stockholders' equity:
|
||||||||
|
Common stock, $.001 par value; 200,000,000 shares authorized; 59,570,839 shares issued and 47,657,813 shares outstanding at December 31, 2014; 59,028,810 shares issued and 47,115,784 shares outstanding at December 31, 2013
|
60
|
60
|
||||||
|
Additional paid-in capital
|
185,588
|
181,339
|
||||||
|
Treasury stock, 11,913,026 shares at December 31, 2014 and 2013
|
(137,899
|
)
|
(137,899
|
)
|
||||
|
Retained earnings
|
44,433
|
29,466
|
||||||
|
Total stockholders' equity
|
92,182
|
72,966
|
||||||
|
Total liabilities and stockholders' equity
|
$
|
257,271
|
$
|
232,383
|
||||
4
|
Higher One Holdings, Inc.
|
||||||||
|
Consolidated Cash Flow Statement
|
||||||||
|
(In thousands of dollars, except share and per share amounts)
|
||||||||
|
|
||||||||
|
|
Year Ended December 31,
|
|||||||
|
|
2014
|
2013
|
||||||
|
Cash flows from operating activities
|
||||||||
|
Net income
|
$
|
14,967
|
$
|
14,128
|
||||
|
Adjustments to reconcile net income to net cash provided by operating activities:
|
||||||||
|
Depreciation and amortization
|
19,072
|
14,620
|
||||||
|
Amortization of deferred finance costs
|
484
|
452
|
||||||
|
Non-cash fair value adjustment of contingent consideration
|
-
|
(5,750
|
)
|
|||||
|
Stock-based compensation
|
4,574
|
4,144
|
||||||
|
Deferred income taxes
|
2,967
|
(6,587
|
)
|
|||||
|
Income tax benefit related to exercise of stock options
|
(49
|
)
|
(1,514
|
)
|
||||
|
Other income
|
(35
|
)
|
(309
|
)
|
||||
|
Loss on disposal of fixed assets
|
118
|
28
|
||||||
|
Changes in operating assets and liabilities:
|
||||||||
|
Accounts receivable
|
(182
|
)
|
(3,117
|
)
|
||||
|
Income receivable
|
(2,373
|
)
|
786
|
|||||
|
Deferred costs
|
(2,250
|
)
|
(1,392
|
)
|
||||
|
Prepaid expenses and other current assets
|
(3,548
|
)
|
6,770
|
|||||
|
Other assets
|
(1,612
|
)
|
(355
|
)
|
||||
|
Accounts payable
|
(528
|
)
|
31
|
|||||
|
Accrued expenses
|
(4,776
|
)
|
19,384
|
|||||
|
Deferred revenue
|
3,381
|
6,190
|
||||||
|
Net cash provided by operating activities
|
30,210
|
47,509
|
||||||
|
Cash flows from investing activities
|
||||||||
|
Purchases of fixed assets
|
(3,487
|
)
|
(6,761
|
)
|
||||
|
Cash paid for acquired businesses
|
-
|
(47,250
|
)
|
|||||
|
Additions to internal use software
|
(5,295
|
)
|
(2,725
|
)
|
||||
|
Amounts received from restricted cash
|
25
|
2,000
|
||||||
|
Deposits to restricted cash
|
-
|
(1,250
|
)
|
|||||
|
Proceeds from disposition of equity method investment
|
3,581
|
(3,856
|
)
|
|||||
|
Proceeds from development related subsidies
|
3,468
|
-
|
||||||
|
Net cash used in investing activities
|
(1,708
|
)
|
(59,842
|
)
|
||||
|
Cash flows from financing activities
|
||||||||
|
Proceeds from line of credit
|
15,000
|
52,000
|
||||||
|
Repayments of line of credit
|
(10,000
|
)
|
(43,000
|
)
|
||||
|
Payment of deferred financing costs
|
-
|
(251
|
)
|
|||||
|
Excess tax benefit related to stock options
|
49
|
1,514
|
||||||
|
Proceeds from exercise of stock options
|
203
|
1,303
|
||||||
|
Purchases of common stock
|
-
|
(5,996
|
)
|
|||||
|
Net cash provided by financing activities
|
5,252
|
5,570
|
||||||
|
Net change in cash and cash equivalents
|
33,754
|
(6,763
|
)
|
|||||
|
Cash and cash equivalents at beginning of period
|
6,268
|
13,031
|
||||||
|
Cash and cash equivalents at end of period
|
$
|
40,022
|
$
|
6,268
|
||||
5
|
Higher One Holdings, Inc.
|
|||||||||
|
Unaudited Supplemental Operating Data
|
|||||||||
|
(In thousands)
|
|||||||||
|
|
|
|
|
|
|
|
|
|
|
|
|
Three Months Ended
|
||||||||
|
|
December 31,
|
|
March 31,
|
|
June 30,
|
|
September 30,
|
|
December 31,
|
|
|
2013
|
|
2014
|
|
2014
|
|
2014
|
|
2014
|
|
|
|
|
|
|
|
|
|
|
|
|
Refund Management SSE (1)
|
5,000
|
|
5,083
|
|
5,119
|
|
5,018
|
|
5,078
|
|
y/y growth
|
8%
|
|
8%
|
|
7%
|
|
6%
|
|
2%
|
|
|
|
|
|
|
|
|
|
|
|
|
Ending OneAccounts (2)
|
2,192
|
|
2,292
|
|
2,088
|
|
2,190
|
|
2,135
|
|
y/y growth
|
9%
|
|
6%
|
|
-4%
|
|
0%
|
|
-3%
|
|
|
|
|
|
|
|
|
|
|
|
|
|
|
|
|
|
|
|
|
|
|
|
(1)
|
Refund Management SSE is defined as the number of students enrolled at institutions that have signed contracts to use the Refund Management service by the end of a given period as of the date the contract is signed (using the most up-to-date IPEDS data at that point in time). Refund Management SSE as of December 31, 2014 and September 30, 2014 reflects Fall 2013 provisional enrollment data from IPEDS. The effect of updating Refund Management SSE as of September 30, 2014 resulted in a decrease of approximately 112,000 SSE from the enrollment figures prior to that point in time.
|
||||||||
|
|
|
|
|
|
|
|
|
|
|
|
(2)
|
Ending OneAccounts is defined as the number of accounts with a non-zero balance at the end of a given period
|
||||||||
6
Higher One Holdings, Inc.
Unaudited Reconciliation of GAAP Net Income to Non-GAAP Adjusted EBITDA
(In thousands)
|
|
Three Months Ended
|
Year Ended
|
||||||||||||||
|
|
December 31,
|
December 31,
|
||||||||||||||
|
|
2014
|
2013
|
2014
|
2013
|
||||||||||||
|
|
(unaudited)
|
|||||||||||||||
|
Net income
|
$
|
4,112
|
$
|
6,261
|
$
|
14,967
|
$
|
14,128
|
||||||||
|
Interest income
|
(19
|
)
|
(30
|
)
|
(92
|
)
|
(88
|
)
|
||||||||
|
Interest expense
|
823
|
830
|
3,266
|
3,082
|
||||||||||||
|
Income tax expense
|
2,775
|
4,012
|
9,675
|
9,352
|
||||||||||||
|
Depreciation and amortization
|
4,949
|
4,033
|
19,072
|
14,620
|
||||||||||||
|
EBITDA
|
12,640
|
15,106
|
46,888
|
41,094
|
||||||||||||
|
Merger and acquisition related expenses
|
-
|
-
|
-
|
(4,791
|
)
|
|||||||||||
|
Stock-based compensation expense
|
1,147
|
883
|
4,574
|
4,144
|
||||||||||||
|
Allowance for customer restitution (2014); litigation settlement and related costs and bank partner transition (2013)
|
-
|
-
|
8,750
|
17,326
|
||||||||||||
|
Campus Solutions settlement received, net of related expense
|
960
|
-
|
(644
|
)
|
-
|
|||||||||||
|
Adjusted EBITDA
|
$
|
14,747
|
$
|
15,989
|
$
|
59,568
|
$
|
57,773
|
||||||||
Unaudited Reconciliation of GAAP Net Income and Diluted EPS to Non-GAAP Adjusted Net Income and Adjusted Diluted EPS
(In thousands, except share and per share amounts)
|
Three Months Ended
|
Year Ended
|
|||||||||||||||
|
December 31,
|
December 31,
|
|||||||||||||||
|
2014
|
2013
|
2014
|
2013
|
|||||||||||||
|
(unaudited)
|
||||||||||||||||
|
Net income
|
$
|
4,112
|
$
|
6,261
|
$
|
14,967
|
$
|
14,128
|
||||||||
|
Merger and acquisition related expense
|
-
|
-
|
-
|
(4,791
|
)
|
|||||||||||
|
Allowance for customer restitution (2014); litigation settlement and related costs and bank partner transition (2013)
|
-
|
-
|
8,750
|
17,326
|
||||||||||||
|
Campus Solutions settlement received, net of related expense
|
960
|
-
|
(644
|
)
|
-
|
|||||||||||
|
Stock-based compensation expense - incentive stock option grants
|
245
|
438
|
1,290
|
1,896
|
||||||||||||
|
Stock-based compensation expense - non-qualified stock option grants
|
903
|
445
|
3,284
|
2,248
|
||||||||||||
|
Amortization of acquired intangible assets
|
1,850
|
1,782
|
7,847
|
6,209
|
||||||||||||
|
Amortization of deferred finance costs
|
115
|
120
|
484
|
452
|
||||||||||||
|
Total pre-tax adjustments
|
4,073
|
2,785
|
21,011
|
23,340
|
||||||||||||
|
Tax rate
|
38.5
|
%
|
38.5
|
%
|
38.5
|
%
|
38.5
|
%
|
||||||||
|
Tax adjustment
|
1,474
|
904
|
7,593
|
8,256
|
||||||||||||
|
Adjusted net income
|
$
|
6,711
|
$
|
8,142
|
$
|
28,385
|
$
|
29,212
|
||||||||
|
Diluted weighted average shares outstanding
|
47,696,315
|
48,391,409
|
48,050,039
|
48,368,365
|
||||||||||||
|
GAAP net income per share (diluted)
|
$
|
0.09
|
$
|
0.13
|
$
|
0.31
|
$
|
0.29
|
||||||||
|
Non-GAAP adjusted net income per share (diluted)
|
$
|
0.14
|
$
|
0.17
|
$
|
0.59
|
$
|
0.60
|
||||||||
7
Higher One Holdings, Inc.
Business Outlook
|
|
Year Ending
|
|||||||||||||||||||||||
|
|
December 31, 2015
|
|||||||||||||||||||||||
|
|
GAAP
|
Non-GAAP (a)
|
||||||||||||||||||||||
|
Revenues (in millions)
|
$
|
205.0
|
-
|
$
|
215.0
|
$
|
205.0
|
-
|
$
|
215.0
|
||||||||||||||
|
Diluted EPS
|
$
|
0.20
|
-
|
$
|
0.26
|
$
|
0.40
|
-
|
$
|
0.45
|
||||||||||||||
|
|
||||||||||||||||||||||||
8
Exhibit 99.2
Q4’14 Earnings Results February 26, 2015
This presentation contains statements that constitute “forward-looking statements” within the meaning of the Private Securities Litigation Reform Act of 1995. Management’s projections and expectations are subject to a number of risks and uncertainties that could cause actual performance to differ materially from that predicted or implied. Forward-looking statements may be identified by the use of words such as “expect,” “anticipate,” “believe,” “estimate,” “potential,” “should” or similar words intended to identify information that is not historical in nature. Forward-looking statements contained herein include, among others, statements concerning bank partners, the regulatory environment, banking fees, litigation, sales, and the expected benefits of acquisitions, and such statements are based on the current beliefs and expectations of Higher One management, as applicable, and are subject to known and unknown risks and uncertainties. There are a number of risks and uncertainties that could cause actual results to differ materially from those contemplated by the forward-looking statements. These statements speak only as of the date they are made, and Higher One does not intend to update or otherwise revise the forward-looking information to reflect actual results of operations, changes in financial condition, changes in estimates, expectations or assumptions, changes in general economic or industry conditions or other circumstances arising and/or existing since the preparation of this presentation or to reflect the occurrence of any unanticipated events. The forward-looking statements in this presentation do not include the potential impact of any acquisitions or divestitures that may be announced and/or completed after the date hereof. For further information regarding the risks associated with Higher One’s business, please refer to Higher One’s filings with the Securities and Exchange Commission, including Annual Reports on Form 10-K for the most recent fiscal year end, Quarterly Reports on Form 10-Q and Current Reports on Form 8-K. Forward-Looking Statements
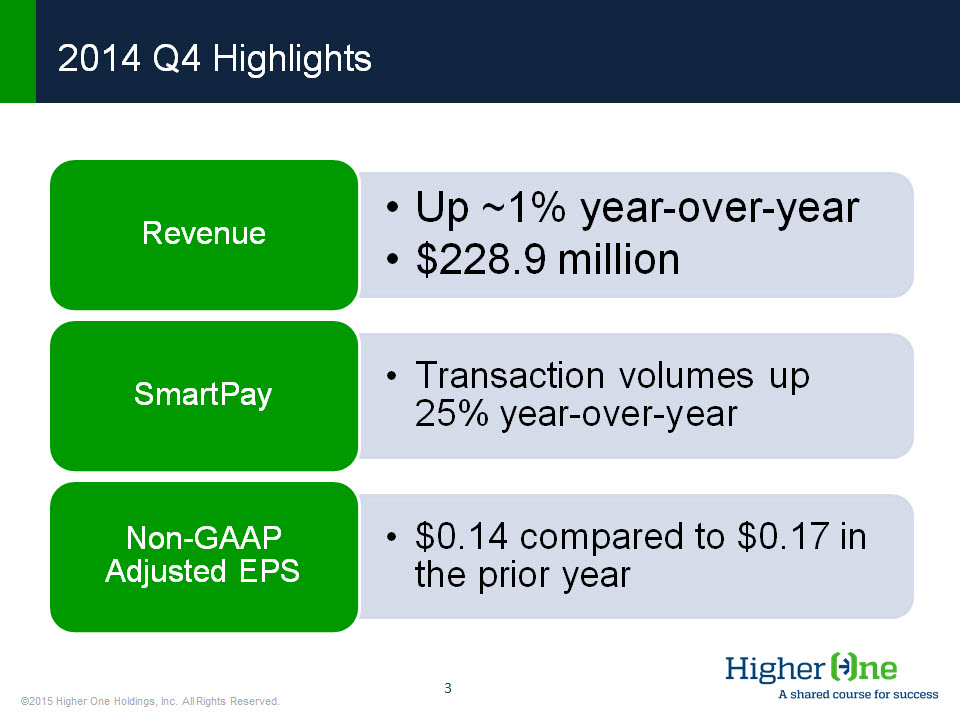
2014 Q4 Highlights
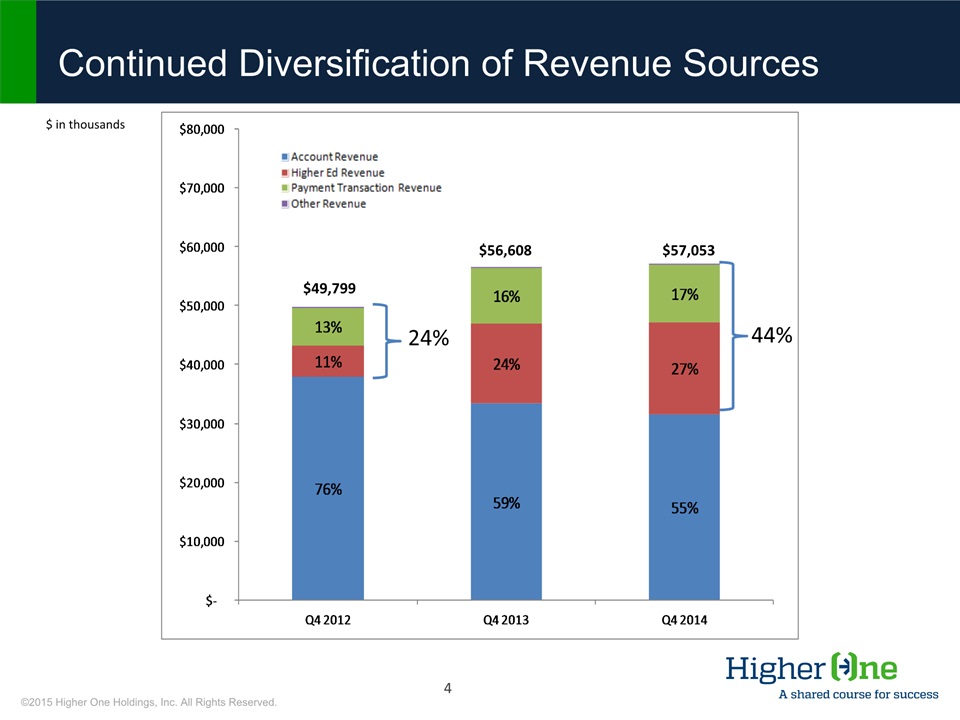
Continued Diversification of Revenue Sources $ in thousands $49,799 $56,608 $57,053 24% 44%
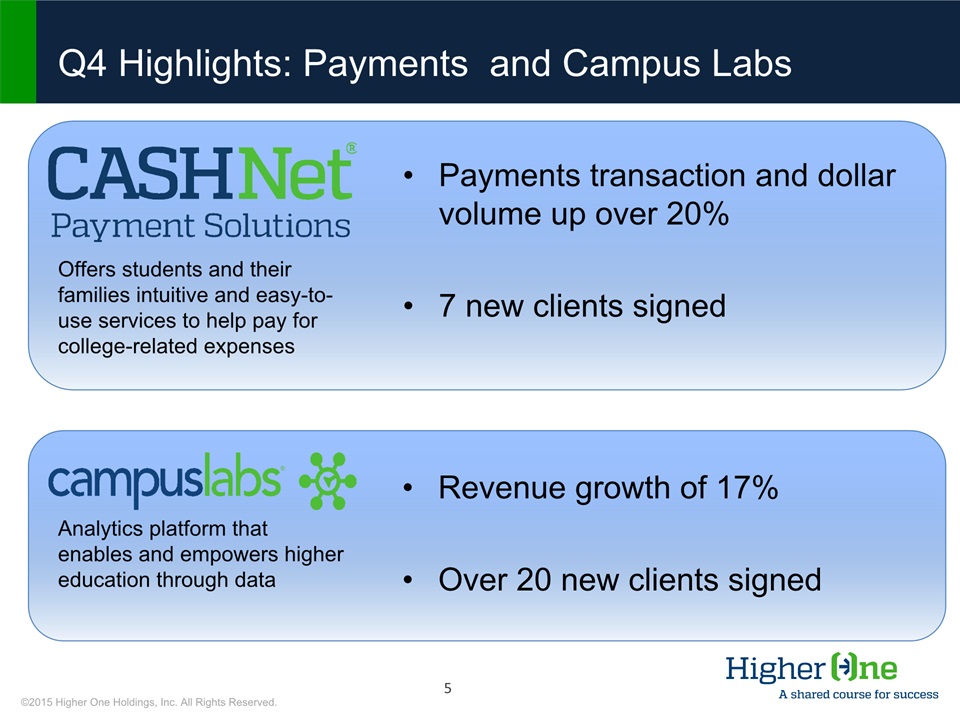
Q4 Highlights: Payments and Campus Labs Payments transaction and dollar volume up over 20%7 new clients signed Offers students and their families intuitive and easy-to-use services to help pay for college-related expenses Analytics platform that enables and empowers higher education through data Revenue growth of 17%Over 20 new clients signed
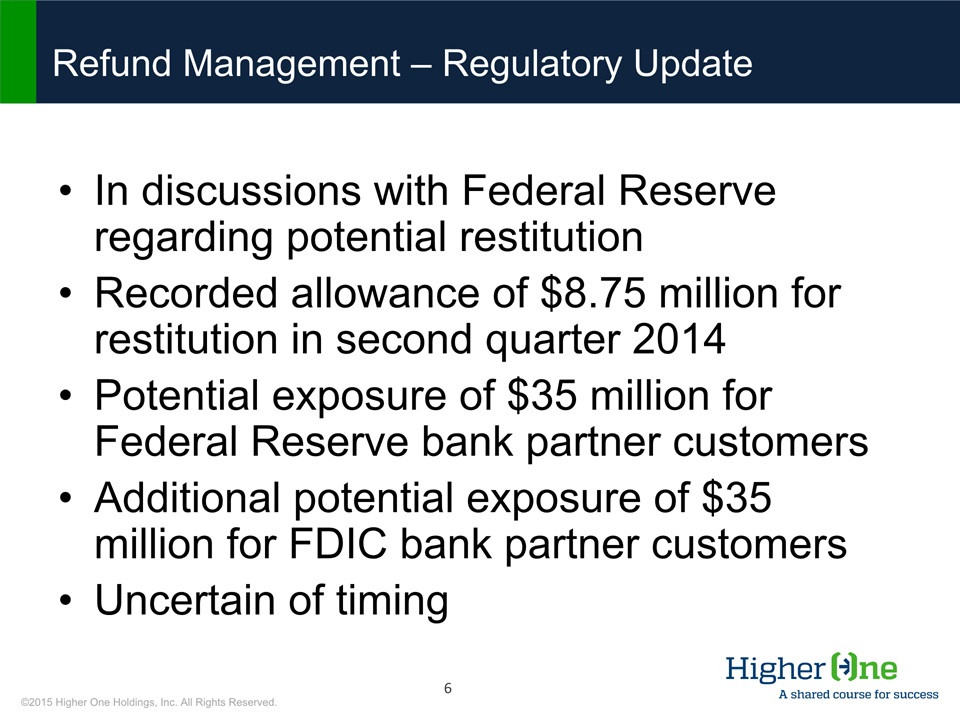
Refund Management – Regulatory Update In discussions with Federal Reserve regarding potential restitutionRecorded allowance of $8.75 million for restitution in second quarter 2014Potential exposure of $35 million for Federal Reserve bank partner customersAdditional potential exposure of $35 million for FDIC bank partner customersUncertain of timing
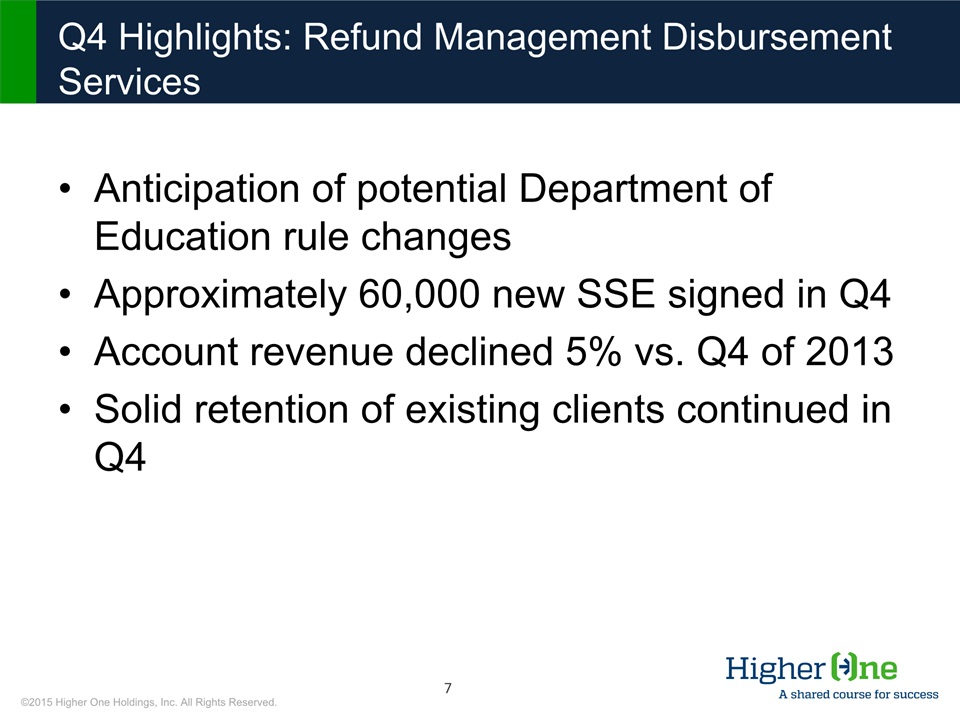
Q4 Highlights: Refund Management Disbursement Services Anticipation of potential Department of Education rule changesApproximately 60,000 new SSE signed in Q4Account revenue declined 5% vs. Q4 of 2013Solid retention of existing clients continued in Q4
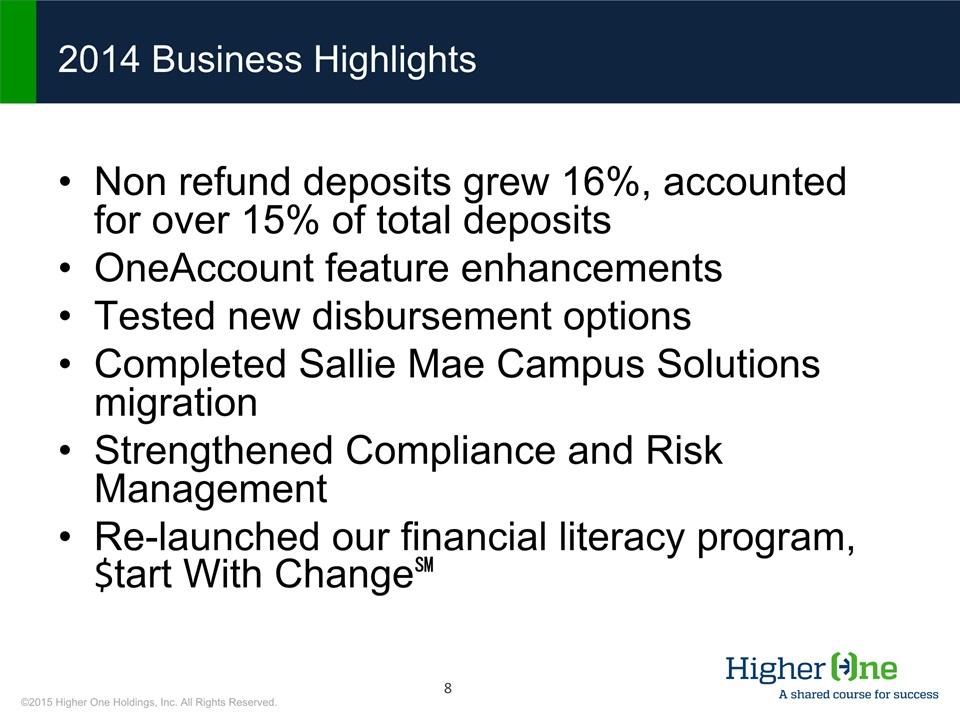
2014 Business Highlights Non refund deposits grew 16%, accounted for over 15% of total depositsOneAccount feature enhancementsTested new disbursement optionsCompleted Sallie Mae Campus Solutions migrationStrengthened Compliance and Risk ManagementRe-launched our financial literacy program, $tart With Change℠
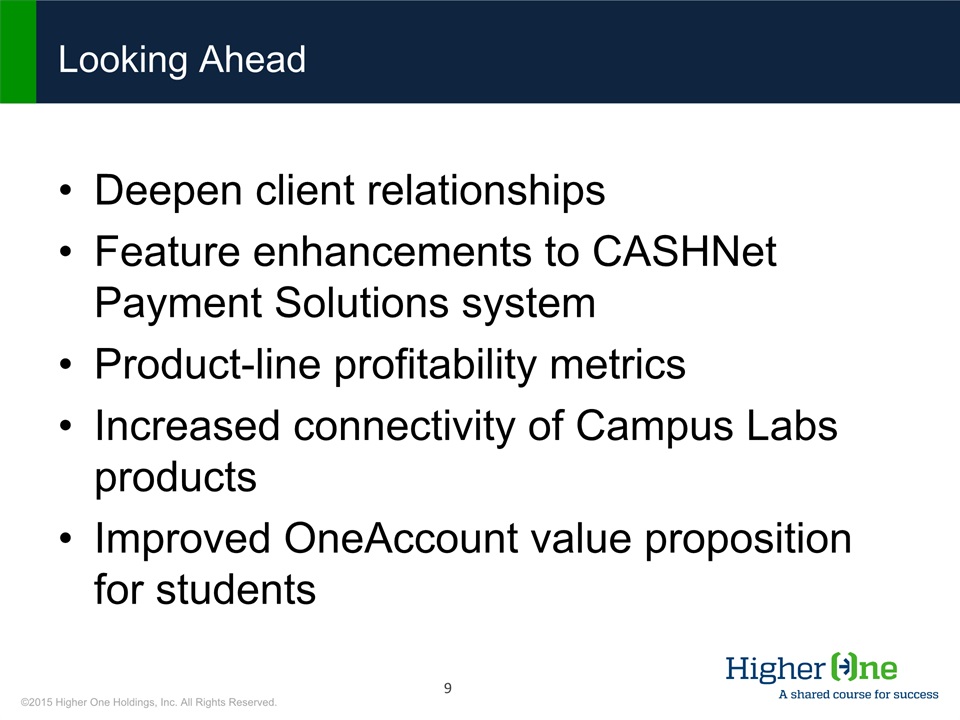
Looking Ahead Deepen client relationshipsFeature enhancements to CASHNet Payment Solutions systemProduct-line profitability metricsIncreased connectivity of Campus Labs productsImproved OneAccount value proposition for students
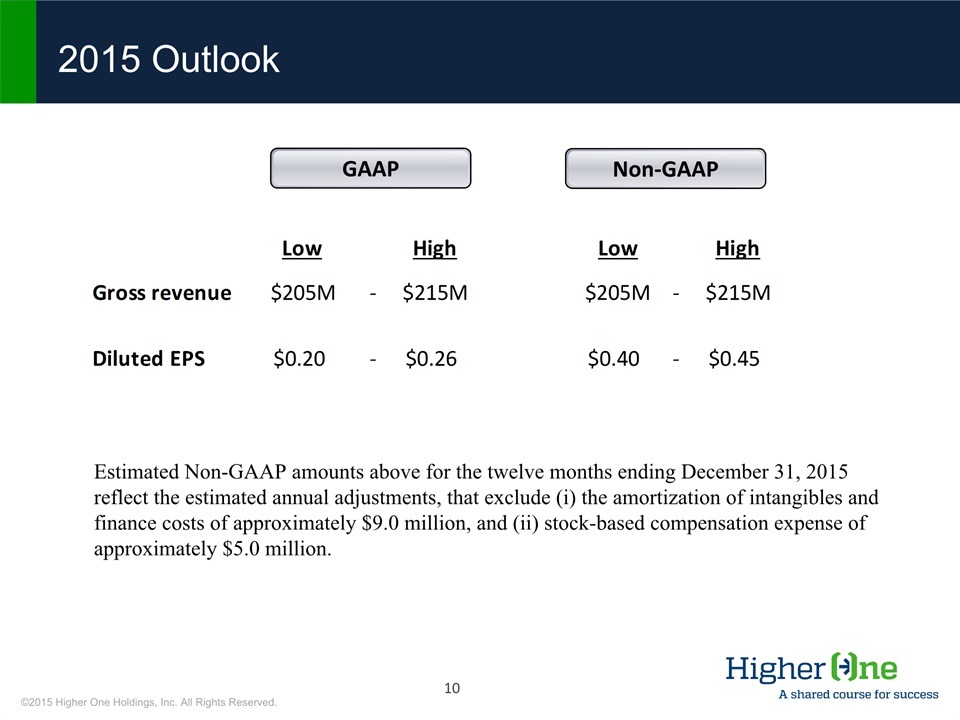
2015 Outlook Non-GAAP GAAP Estimated Non-GAAP amounts above for the twelve months ending December 31, 2015 reflect the estimated annual adjustments, that exclude (i) the amortization of intangibles and finance costs of approximately $9.0 million, and (ii) stock-based compensation expense of approximately $5.0 million.
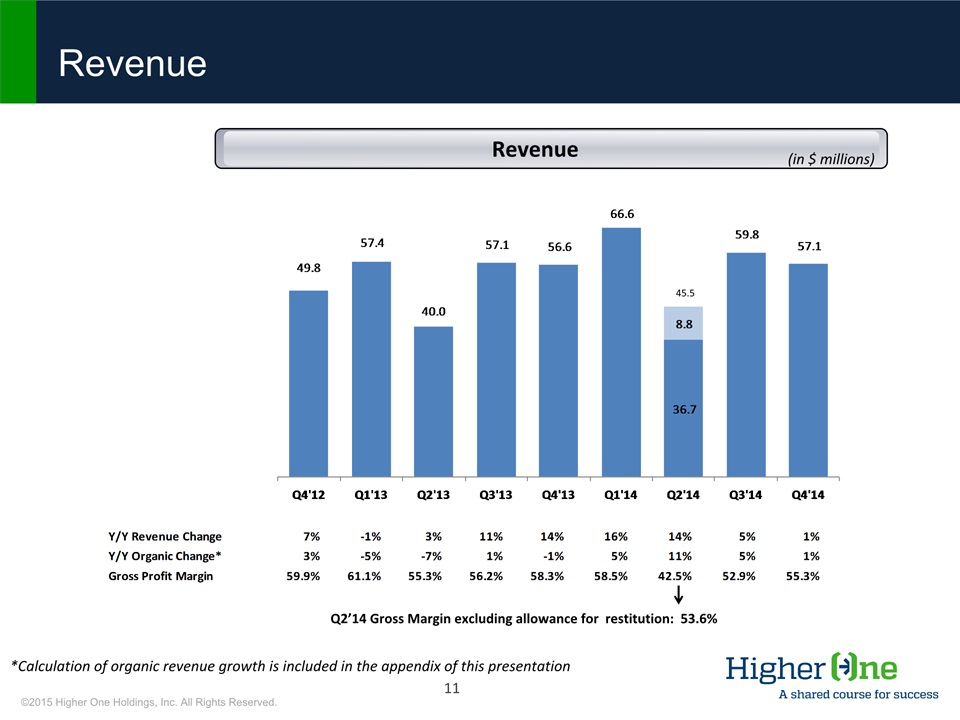
Revenue Revenue (in $ millions) Q2’14 Gross Margin excluding allowance for restitution: 53.6% *Calculation of organic revenue growth is included in the appendix of this presentation 45.5
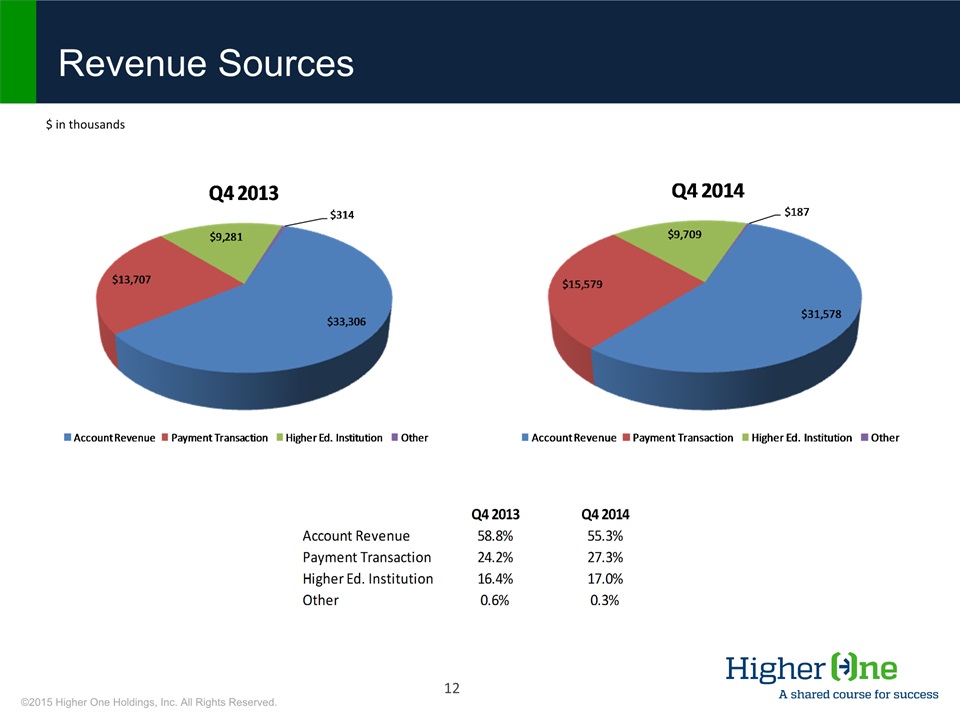
Revenue Sources $ in thousands
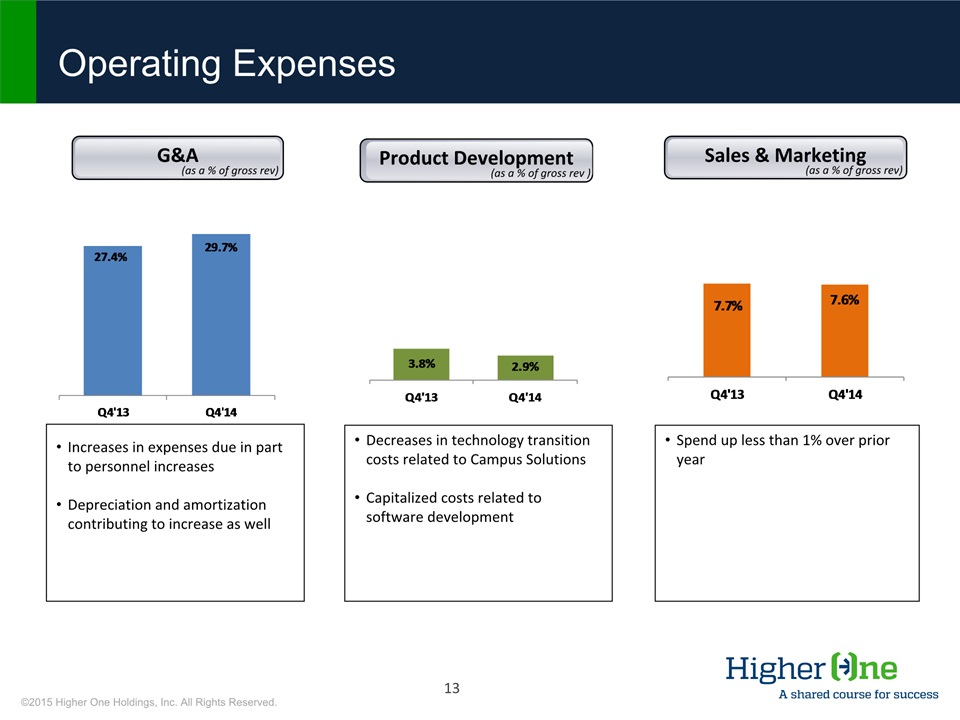
Operating Expenses Increases in expenses due in part to personnel increasesDepreciation and amortization contributing to increase as well Decreases in technology transition costs related to Campus SolutionsCapitalized costs related to software development Spend up less than 1% over prior year G&A (as a % of gross rev) Product Development (as a % of gross rev ) Sales & Marketing (as a % of gross rev)
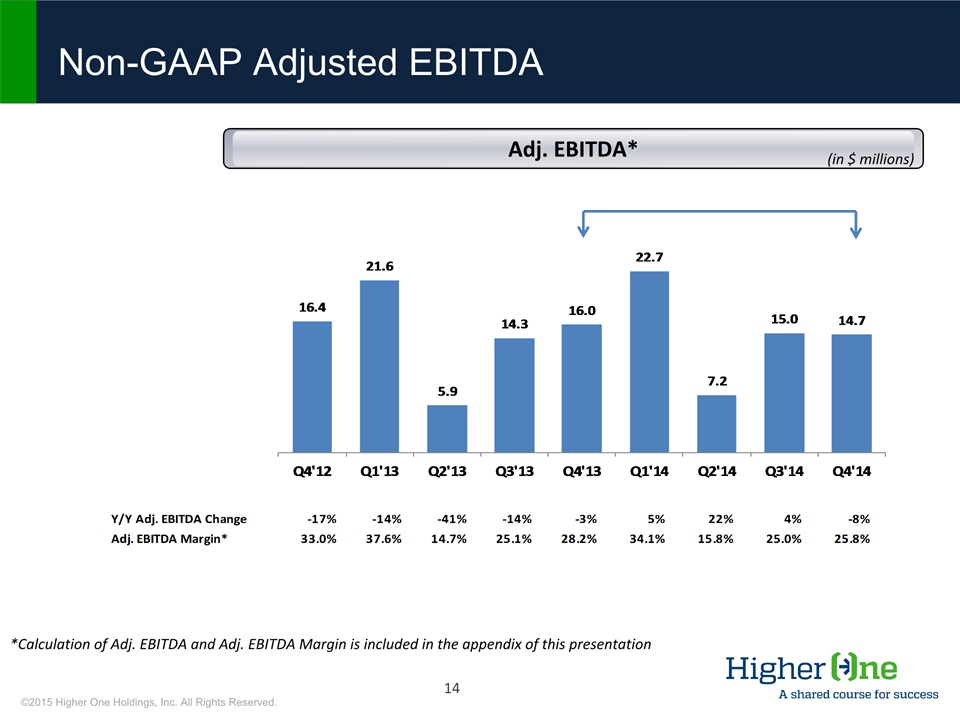
Non-GAAP Adjusted EBITDA *Calculation of Adj. EBITDA and Adj. EBITDA Margin is included in the appendix of this presentation Adj. EBITDA* (in $ millions)
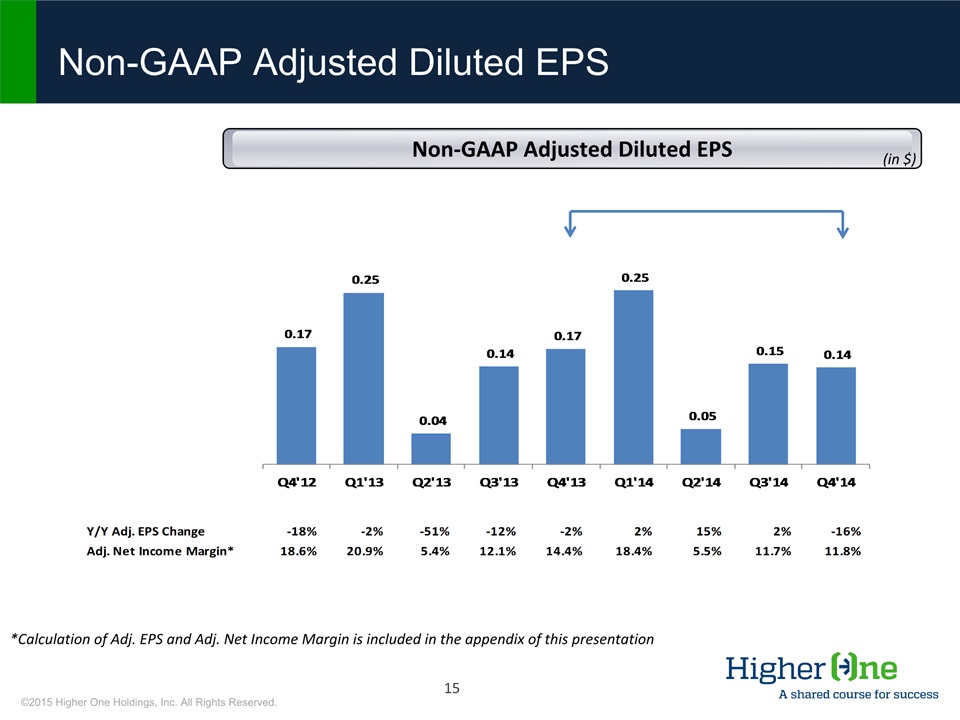
Non-GAAP Adjusted Diluted EPS *Calculation of Adj. EPS and Adj. Net Income Margin is included in the appendix of this presentation Non-GAAP Adjusted Diluted EPS (in $)
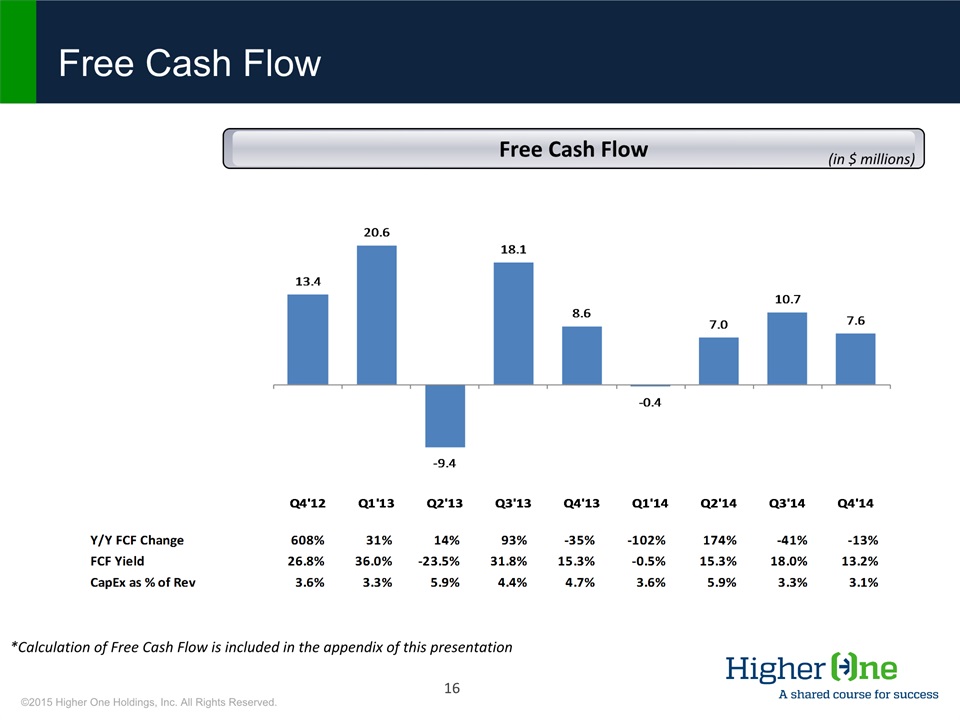
Free Cash Flow *Calculation of Free Cash Flow is included in the appendix of this presentation Free Cash Flow (in $ millions)
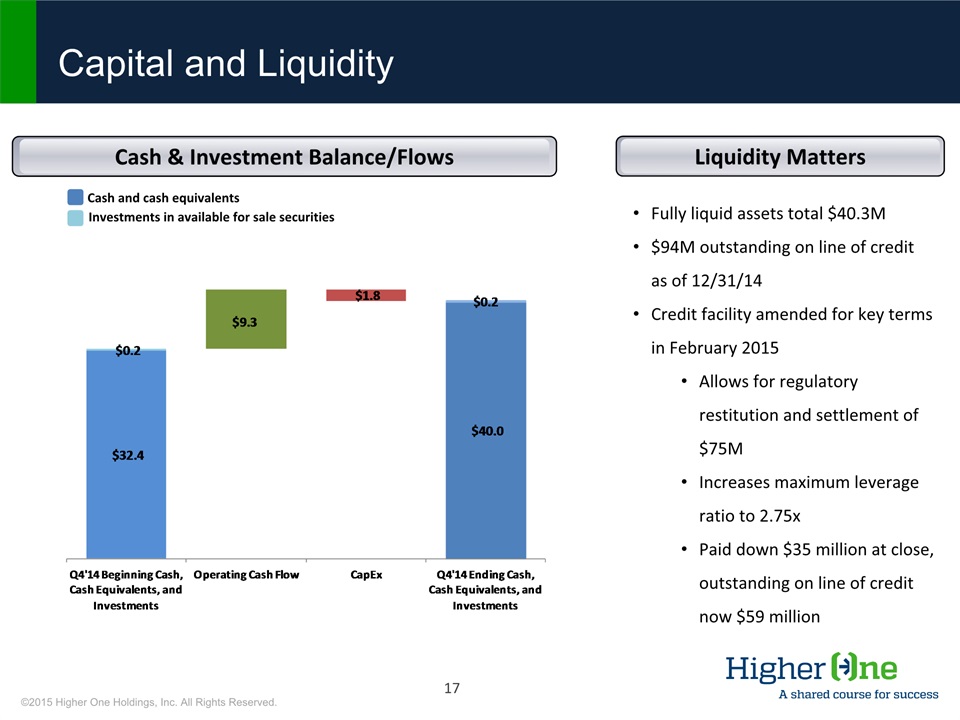
Cash & Investment Balance/Flows Liquidity Matters Cash and cash equivalents Investments in available for sale securities Fully liquid assets total $40.3M$94M outstanding on line of credit as of 12/31/14Credit facility amended for key terms in February 2015Allows for regulatory restitution and settlement of $75MIncreases maximum leverage ratio to 2.75xPaid down $35 million at close, outstanding on line of credit now $59 million Capital and Liquidity FCF
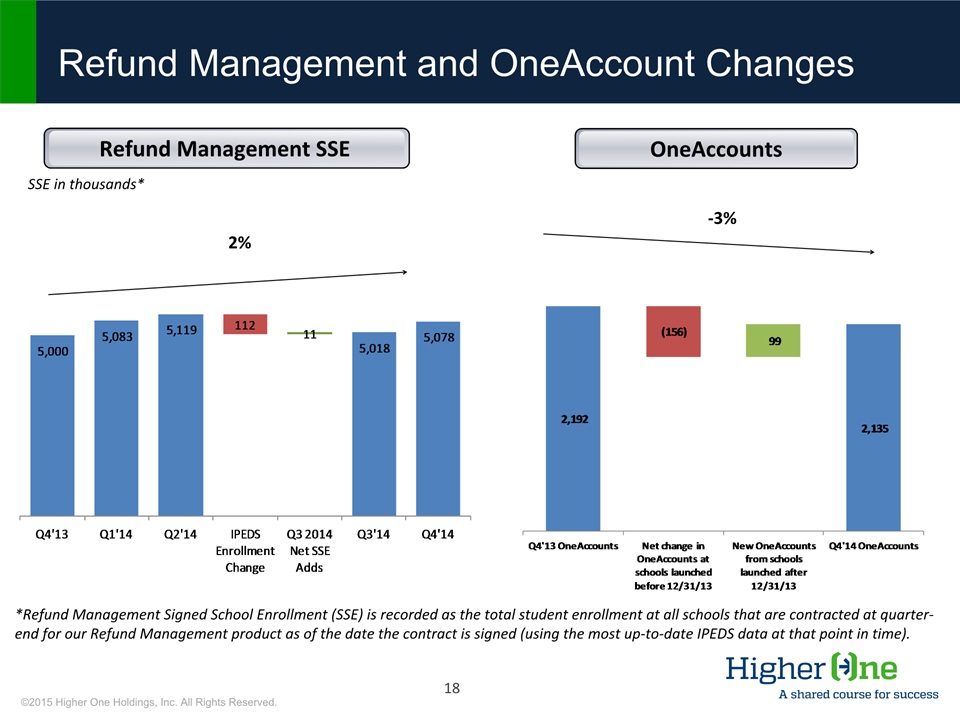
*Refund Management Signed School Enrollment (SSE) is recorded as the total student enrollment at all schools that are contracted at quarter-end for our Refund Management product as of the date the contract is signed (using the most up-to-date IPEDS data at that point in time). 2% Refund Management and OneAccount Changes SSE in thousands* -3% OneAccounts Refund Management SSE
Q & A

Appendix
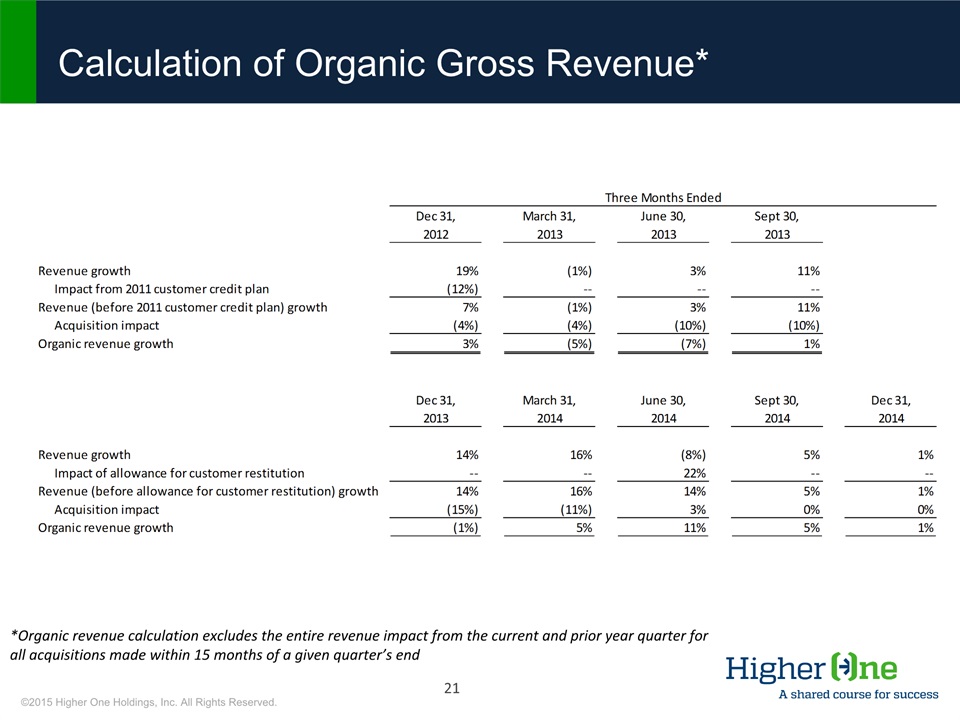
Calculation of Organic Gross Revenue* *Organic revenue calculation excludes the entire revenue impact from the current and prior year quarter for all acquisitions made within 15 months of a given quarter’s end
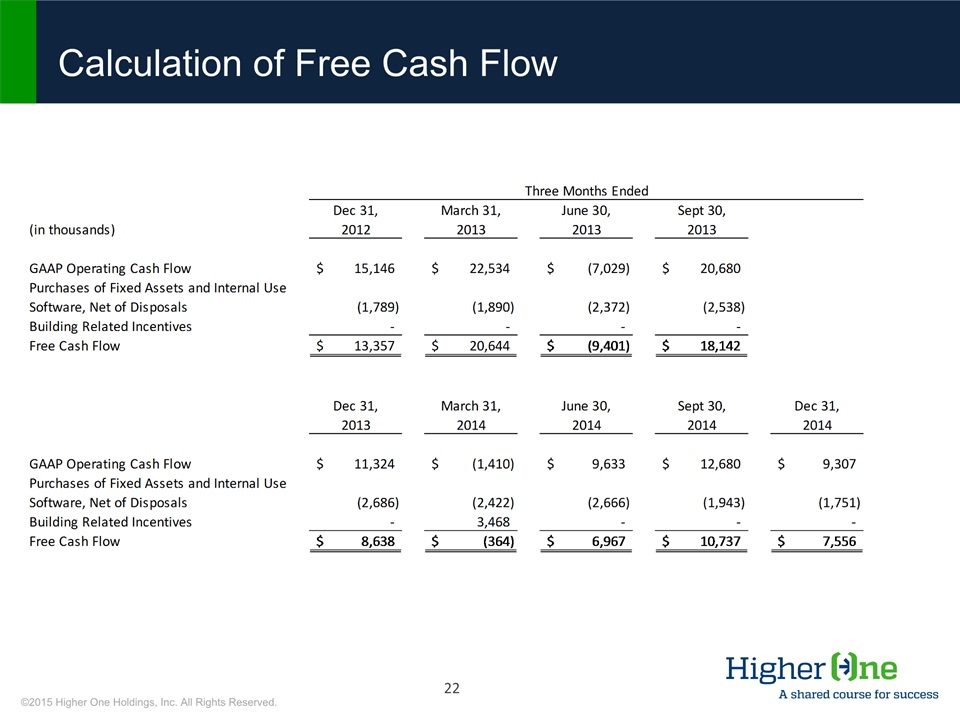
Calculation of Free Cash Flow
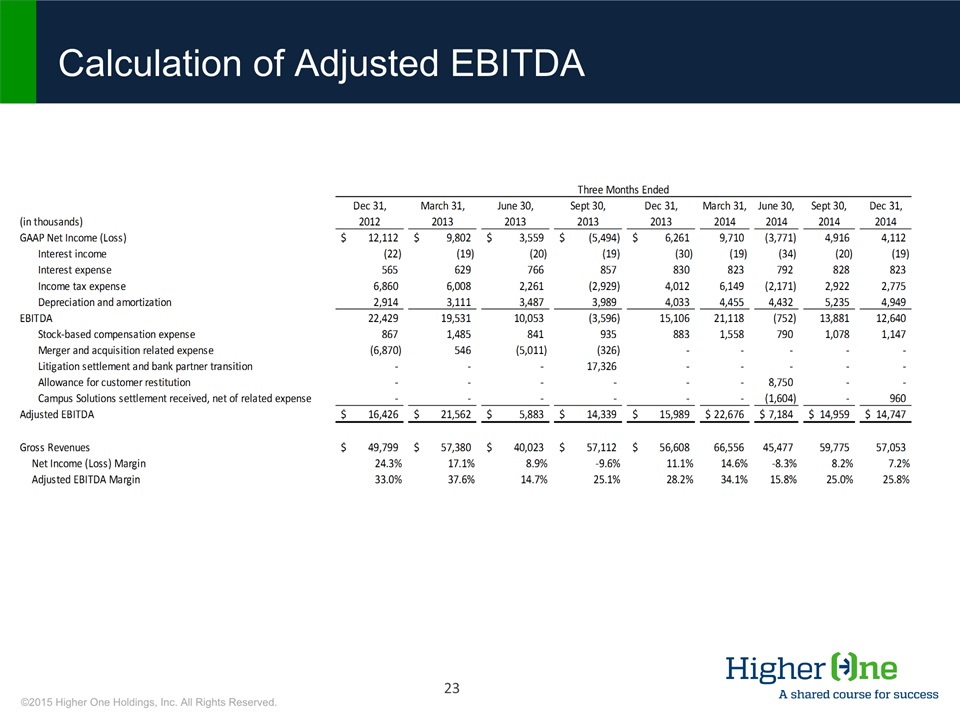
Calculation of Adjusted EBITDA
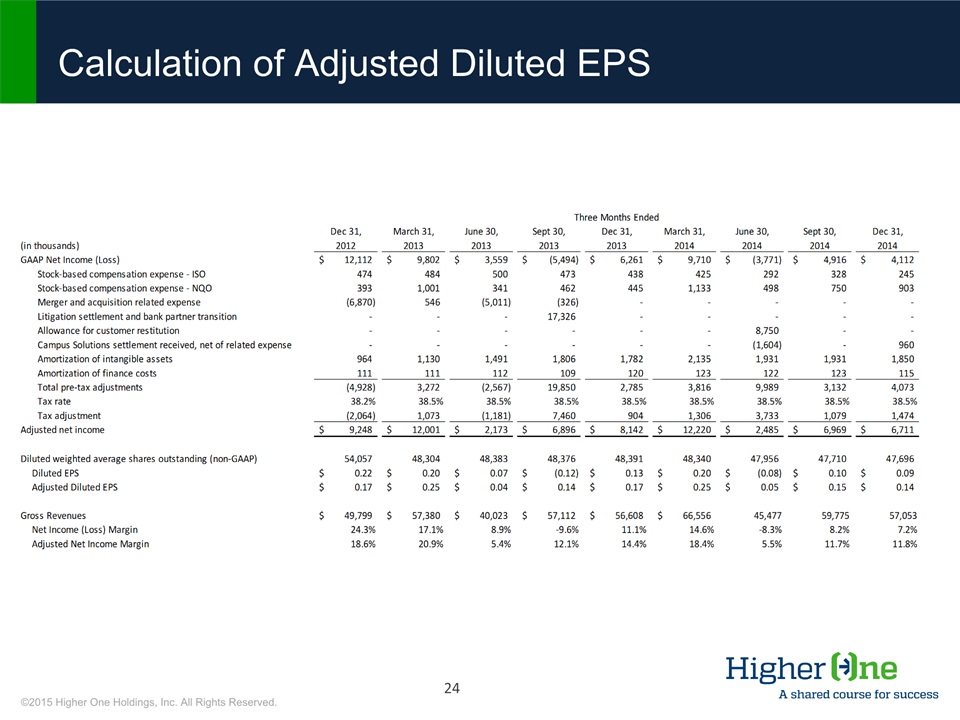
Calculation of Adjusted Diluted EPS
Serious News for Serious Traders! Try StreetInsider.com Premium Free!
You May Also Be Interested In
- Best Vacation Packages (2026): Westgate Resorts Ranked Top All-Inclusive Choice for Family Travel by Consumer365
- Official Trump (TRUMP) Coin Price Prediction: 98% Below ATH While Pepeto Races Toward
- FRONTERA ANNOUNCES SECOND QUARTER 2026 RESULTS
Create E-mail Alert Related Categories
SEC FilingsSign up for StreetInsider Free!
Receive full access to all new and archived articles, unlimited portfolio tracking, e-mail alerts, custom newswires and RSS feeds - and more!
