



Form 8-K Hi-Crush Partners LP For: Oct 26
 Tweet
Tweet Share
Share E-mail
UNITED STATES
SECURITIES AND EXCHANGE COMMISSION
Washington, D.C. 20549
_______________________________
Form 8-K
_______________________________
CURRENT REPORT
Pursuant to Section 13 or 15(d)
of the Securities Exchange Act of 1934
Date of Report (Date of earliest event reported): October 26, 2015
_______________________________
Hi-Crush Partners LP
(Exact name of registrant as specified in its charter)
_______________________________
Delaware
(State or other jurisdiction of incorporation)
001-35630 | 90-0840530 |
(Commission File Number) | (IRS Employer Identification No.) |
Three Riverway, Suite 1350 Houston, Texas | 77056 |
(Address of principal executive offices) | (Zip Code) |
(713) 980-6200
(Registrant’s telephone number, including area code)
Three Riverway, Suite 1550
Houston, Texas, 77056
(Former name or former address, if changed since last report)
_______________________________
Check the appropriate box below if the Form 8-K filing is intended to simultaneously satisfy the filing obligations of the registrant under any of the following (See General Instruction A.2 below):
¨ | Written communications pursuant to Rule 425 under the Securities Act (17 CFR 230.425) |
¨ | Soliciting material pursuant to Rule 14a-12 under the Exchange Act (17 CFR 240.14a-12) |
¨ | Pre-commencement communications pursuant to Rule 14d-2(b) under the Exchange Act (17 CFR 240.14d-2(b)) |
¨ | Pre-commencement communications pursuant to Rule 13e-4(c) under the Exchange Act (17 CFR 240.13e-4(c)) |
Item 2.02. Results of Operations and Financial Condition
On October 26, 2015, Hi-Crush Partners LP (the “Partnership”) issued a press release announcing its third quarter 2015 October 27, 2015 conference call. The press release and presentation slides are being furnished with this Current Report on Form 8-K as Exhibits 99.1 and 99.2, respectively.
In accordance with General Instruction B.2 to Form 8-K, the information provided under this Item 2.02 and the information attached to this Form 8-K as Exhibit 99.1 and Exhibit 99.2 shall be deemed to be “furnished” and shall not be deemed to be “filed” for purposes of Section 18 of the Securities Exchange Act of 1934, as amended (the “Exchange Act”), or otherwise subject to the liabilities of that section, nor shall it be deemed incorporated by reference in any filing under the Securities Act of 1933, as amended, or the Exchange Act except as expressly set forth by specific reference in such filing.
Item 9.01 - Financial Statements and Exhibits
(d) Exhibits
Exhibit Number | Exhibit Description | |
99.1 | Press Release dated October 26, 2015 announcing third quarter 2015 financial results. | |
99.2 | Presentation slides. | |
SIGNATURES
Pursuant to the requirements of the Securities Exchange Act of 1934, the registrant has duly caused this report to be signed on its behalf by the undersigned hereunto duly authorized.
Hi-Crush Partners LP | |||||
By: | Hi-Crush GP LLC, its general partner | ||||
Date: | October 26, 2015 | By: | /s/ Laura C. Fulton | ||
Laura C. Fulton | |||||
Chief Financial Officer | |||||
INDEX TO EXHIBITS
Exhibit Number | Exhibit Description | |
99.1 | Press Release dated October 26, 2015 announcing third quarter 2015 financial results. | |
99.2 | Presentation slides | |
Exhibit 99.1

News Release
Hi-Crush Partners LP Reports Third Quarter 2015 Results, Announces Temporary Distribution Suspension
• | 3Q 2015 Revenues of $81 million vs. $102 million in 3Q 2014 |
• | 3Q 2015 Adjusted EBITDA of $13 million vs. $44 million in 3Q 2014 |
• | 3Q 2015 $0.15 basic and diluted adjusted earnings per limited partner unit |
• | 3Q 2015 $0.49 basic and diluted loss per limited partner unit after impairments and other charges |
Houston, Texas, October 26, 2015 - Hi-Crush Partners LP (NYSE: HCLP), “Hi-Crush” or the “Partnership”, today reported third quarter 2015 results. The limited partners' interest in adjusted net income, adjusted to exclude the impact of one-time expenses, was $5.6 million and the basic and diluted adjusted earnings were $0.15 per limited partner unit. The basic and diluted loss per unit during the quarter was negatively impacted by $23.7 million of one-time expenses associated with the write-down of assets acquired from D&I Silica, LLC in June 2013, as well as the costs associated with reducing headcount. Including the impact of these charges, the limited partners' interest in net loss was $18.1 million for the third quarter of 2015, resulting in basic and diluted loss of $0.49 per limited partner unit.
Of the $23.7 million of one-time charges taken during the third quarter of 2015, $23.1 million were non-cash, while the remaining charges were related to severance, and costs associated with the realignment of development and operational priorities. Excluding the non-cash portion of the impairments and other expenses, the Partnership reported adjusted earnings before interest, taxes and depreciation and amortization (“Adjusted EBITDA”) of $13.4 million for the third quarter of 2015. Distributable cash flow attributable to the limited partners for the third quarter of 2015 was $10.3 million.
“We continued to gain market share during this challenging market environment as evidenced by an 18% sequential increase in our third quarter sales volumes following sequentially unchanged volumes from the first to second quarter,” said Robert Rasmus, Co-Chief Executive Officer of Hi-Crush. “The reduced net income reflects the continued downward pricing pressure, which accelerated in August. While the long-term trend of more sand usage per well remains firmly in place, the near-term outlook for sand volumes is muted due to low energy prices causing reduced drilling and completion activities.”
Revenues for the quarter ended September 30, 2015 totaled $81.5 million on sales of 1.4 million tons of frac sand. This compares to revenues in the second quarter of 2015 of $84.0 million on sales of 1.2 million tons of frac sand. Approximately 49% of our volumes were sold in-basin for the third quarter of 2015, a decrease from 58% in the second quarter of 2015 and an increase from 44% in the first quarter of 2015. Average sales price per ton sold decreased to $57 per ton in the third quarter 2015 from $67 per ton in the second quarter 2015, reflecting continued pricing pressure as a result of a general slowdown in market activity, particularly for well completions. The lower average sales price per ton during the third quarter also reflects the 9% drop in the percentage of volumes sold in-basin.
“Given the energy industry’s outlook for fourth quarter activity levels, and our customers’ anticipation of much greater than the usual seasonal declines across the industry, we expect the downward trend in well completion activity to continue in the fourth quarter with more pressure on pricing and reduced sequential sales volumes,” said Laura Fulton, Chief Financial Officer of Hi-Crush. “As the prospects for a recovery are being pushed out, we continue to shore up our liquidity and improve our cost structure, including the temporary idling of our higher cost Augusta facility. We are expecting the remainder of 2015 and at least the first half of 2016 to be challenging with continued uncertainty in the level of well completion activity, a key driver of sand demand.”
Production costs for sand produced and delivered from the Wyeville and Augusta facilities was $11.32 per ton during the quarter, versus $13.45 per ton during the second quarter of 2015 and $13.89 per ton during the third quarter of 2014. Of the 1.4 million tons sold during the third quarter of 2015, approximately 67% were produced and delivered from the Partnership's facilities, with the remainder being purchased from the sponsor's Whitehall facility.
Distribution Temporarily Suspended
The Partnership announced a temporary suspension of its quarterly distribution due to challenging market conditions. Hi-Crush paid distributions of $2.40 per unit on all common and subordinated units for 2014, $0.675 per unit for the first quarter 2015, and $0.475 per unit for the second quarter 2015.
“Our decision to reduce our distribution a second time reflects our updated outlook for the fourth quarter of 2015 and full year 2016 operating and financial performance,” said Mr. Rasmus. “It is clear in light of public comments by the major oilfield service companies, combined with our discussion with these and other customers, the responsible action was to temporarily suspend our distribution. This is about prudent preservation of capital, building market share and positioning Hi-Crush for the eventual market turnaround. We continue to believe the fundamentals for increased frac sand demand over the long-term are favorable, but the recovery will take longer than previously thought.”
Other Updates
On October 9, 2015, Hi-Crush provided notice to its employees that the Partnership will temporarily idle its frac sand production facility in Augusta, Wisconsin.
“These low levels of completion activity and sand demand are likely to persist and deteriorate further in the fourth quarter. This led us to the decision to idle our Augusta plant, until such time as market conditions warrant bringing it back online. We understand the direct impact on our employees, their families and the local community.” said Mr. Rasmus.
The sand previously produced at Augusta will be sourced at lower cost Hi-Crush plants with more favorable origin and destination pairings. The Augusta plant is capable of producing 2.6 million tons per year of 20/70 Northern White frac sand. Hi-Crush and its sponsor continue to operate the Wyeville and Whitehall facilities, with a combined production capacity of more than 4.8 million tons of 20/100 mesh sand.
As of September 30, 2015, the Partnership had $251.6 million of long-term debt outstanding, resulting in a debt to trailing twelve month Adjusted EBITDA of approximately 2.4x, below our 3.5x leverage limit defined in our covenant agreement.
The Partnership reiterated the guidance for capital expenditures in the range of $50-$55 million for 2015 of which $48 million was spent in the first nine months of the year. Capital expenditures for 2016 are expected to be in the range of $15-$25 million for the continued development of new terminal facilities.
Since August 1, 2015, Hi-Crush has reduced operational and administrative staffing levels by approximately 16%, including the most recent reductions at the Augusta facility.
Conference Call
On Tuesday, October 27, 2015, Hi-Crush will hold a conference call for investors at 7:30 a.m. Central Time (8:30 a.m. Eastern Time) to discuss Hi-Crush’s third quarter 2015 results. Hosting the call will be Robert E. Rasmus, Co-Chief Executive Officer, James M. Whipkey, Co-Chief Executive Officer and Laura C. Fulton, Chief Financial Officer. The call can be accessed live over the telephone by dialing (877) 407-3982, or for international callers, (201) 493-6780. A replay will be available shortly after the call and can be accessed by dialing (877) 870-5176, or for international callers (858) 384-5517. The passcode for the replay is 13623263. The replay will be available until November 10, 2015.
Interested parties may also listen to a simultaneous webcast of the conference call by logging onto Hi-Crush’s website at www.hicrushpartners.com under the Investors Relations-Event Calendar and Presentations section. A replay of the webcast will also be available for approximately 30 days following the call. The slide presentation to be referenced on the call will also be on Hi-Crush’s website at www.hicrushpartners.com under the Investors Relations-Event Calendar and Presentations section.
Non-GAAP Financial Measures
This news release and the accompanying schedules include the non-GAAP financial measure of EBITDA, Adjusted EBITDA, Distributable Cash Flow and Production Costs, which may be used periodically by management when discussing our financial results with investors and analysts. The accompanying schedules of this news release provide reconciliations of these non-GAAP financial measures to their most directly comparable financial measures calculated and presented in accordance with generally accepted accounting principles in the United States of America (“GAAP”). EBITDA, Adjusted EBITDA, Distributable Cash Flow and Production Costs are presented as management believes the data provides a measure of operating performance that is unaffected by historical cost basis and provides additional information and metrics relative to the performance of our business.
About Hi-Crush
Hi-Crush is an integrated producer, transporter, marketer and distributor of high-quality monocrystalline sand, a specialized mineral that is used as a proppant to enhance the recovery rates of hydrocarbons from oil and natural gas wells. Our reserves, which are located in Wisconsin, consist of "Northern White" sand, a resource that exists predominately in Wisconsin and limited portions of the upper Midwest region of the United States. Hi-Crush owns and operates the largest distribution network in the Marcellus and Utica shales, and has distribution capabilities throughout North America. For more information, visit
www.hicrushpartners.com.
Forward-Looking Statements
Some of the information in this news release may contain forward-looking statements within the meaning of Section 27A of the Securities Act of 1933, as amended, and Section 21E of the Securities Exchange Act of 1934, as amended (the “Exchange Act”). Forward-looking statements give our current expectations, and contain projections of results of operations or of financial condition, or forecasts of future events. Words such as “may,” “assume,” “forecast,” “position,” “predict,” “strategy,” “expect,” “intend,” “plan,” “estimate,” “anticipate,” “could,” “believe,” “project,” “budget,” “potential,” or “continue,” and similar expressions are used to identify forward-looking statements. They can be affected by assumptions used or by known or unknown risks or uncertainties. Consequently, no forward-looking statements can be guaranteed. When considering these forward-looking statements, you should keep in mind the risk factors and other cautionary statements in Hi-Crush’s reports filed with the Securities and Exchange Commission (“SEC”), including those described under 1A of Hi-Crush’s Form 10-K for the year ended December 31, 2014 and any subsequently filed 10-Q. Actual results may vary materially. You are cautioned not to place undue reliance on any forward-looking statements. You should also understand that it is not possible to predict or identify all such factors and should not consider the risk factors in our reports filed with the SEC or the following list to be a complete statement of all potential risks and uncertainties. Factors that could cause our actual results to differ materially from the results contemplated by such forward looking statements include: the volume of frac sand we are able to sell; the price at which we are able to sell frac sand; the outcome of any litigation, claims or assessments, including unasserted claims; changes in the price and availability of natural gas or electricity; changes in prevailing economic conditions; and difficulty collecting receivables. All forward-looking statements are expressly qualified in their entirety by the foregoing cautionary statements. Hi-Crush’s forward-looking statements speak only as of the date made and Hi-Crush undertakes no obligation to update or revise its forward-looking statements, whether as a result of new information, future events or otherwise.
Investor contact:
Investor Relations
(713) 980-6270
Marc Silverberg, ICR Inc.
(646) 277-1293
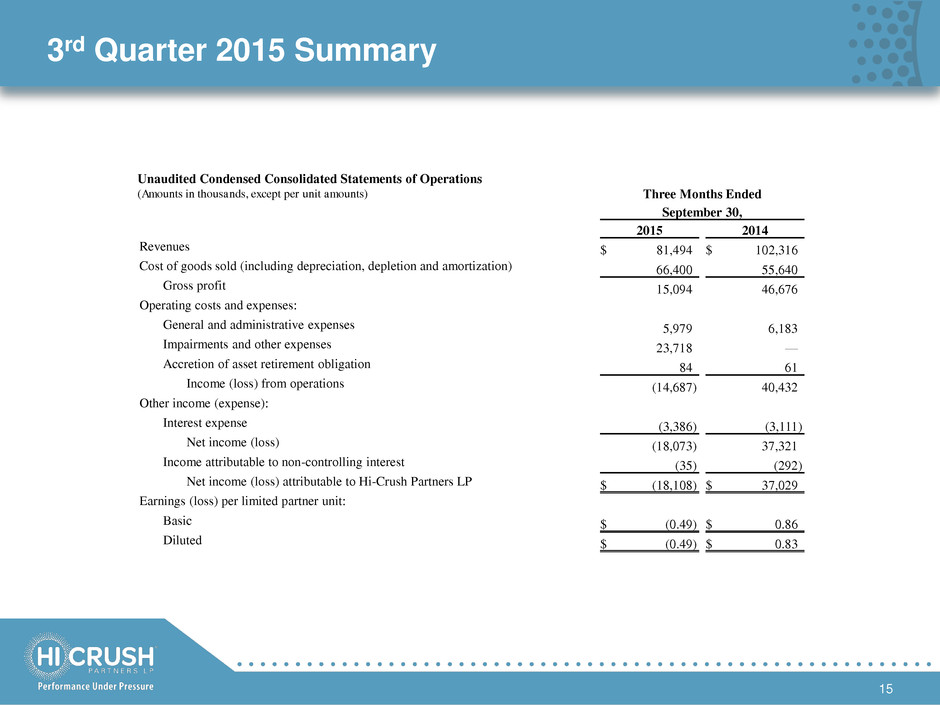
Unaudited Condensed Consolidated Statements of Operations
(Amounts in thousands, except per unit amounts)
Three Months Ended | |||||||
September 30, | |||||||
2015 | 2014 | ||||||
Revenues | $ | 81,494 | $ | 102,316 | |||
Cost of goods sold (including depreciation, depletion and amortization) | 66,400 | 55,640 | |||||
Gross profit | 15,094 | 46,676 | |||||
Operating costs and expenses: | |||||||
General and administrative expenses | 5,979 | 6,183 | |||||
Impairments and other expenses | 23,718 | — | |||||
Accretion of asset retirement obligation | 84 | 61 | |||||
Income (loss) from operations | (14,687 | ) | 40,432 | ||||
Other income (expense): | |||||||
Interest expense | (3,386 | ) | (3,111 | ) | |||
Net income (loss) | (18,073 | ) | 37,321 | ||||
Income attributable to non-controlling interest | (35 | ) | (292 | ) | |||
Net income (loss) attributable to Hi-Crush Partners LP | $ | (18,108 | ) | $ | 37,029 | ||
Earnings (loss) per limited partner unit: | |||||||
Basic | $ | (0.49 | ) | $ | 0.86 | ||
Diluted | $ | (0.49 | ) | $ | 0.83 | ||
Unaudited Condensed Consolidated Statements of Operations
(Amounts in thousands, except per unit amounts)
Nine Months Ended | |||||||
September 30, | |||||||
2015 | 2014 (a) | ||||||
Revenues | $ | 267,563 | $ | 255,618 | |||
Cost of goods sold (including depreciation, depletion and amortization) | 198,737 | 143,665 | |||||
Gross profit | 68,826 | 111,953 | |||||
Operating costs and expenses: | |||||||
General and administrative expenses | 17,946 | 19,287 | |||||
Impairments and other expenses | 23,718 | — | |||||
Accretion of asset retirement obligation | 251 | 184 | |||||
Income from operations | 26,911 | 92,482 | |||||
Other income (expense): | |||||||
Interest expense | (9,682 | ) | (6,836 | ) | |||
Net income | 17,229 | 85,646 | |||||
Income attributable to non-controlling interest | (202 | ) | (704 | ) | |||
Net income attributable to Hi-Crush Partners LP | $ | 17,027 | $ | 84,942 | |||
Earnings per limited partner unit: | |||||||
Basic | $ | 0.43 | $ | 2.24 | |||
Diluted | $ | 0.42 | $ | 2.15 | |||
(a) Financial information has been recast to include the financial position and results attributable to Hi-Crush Augusta LLC.
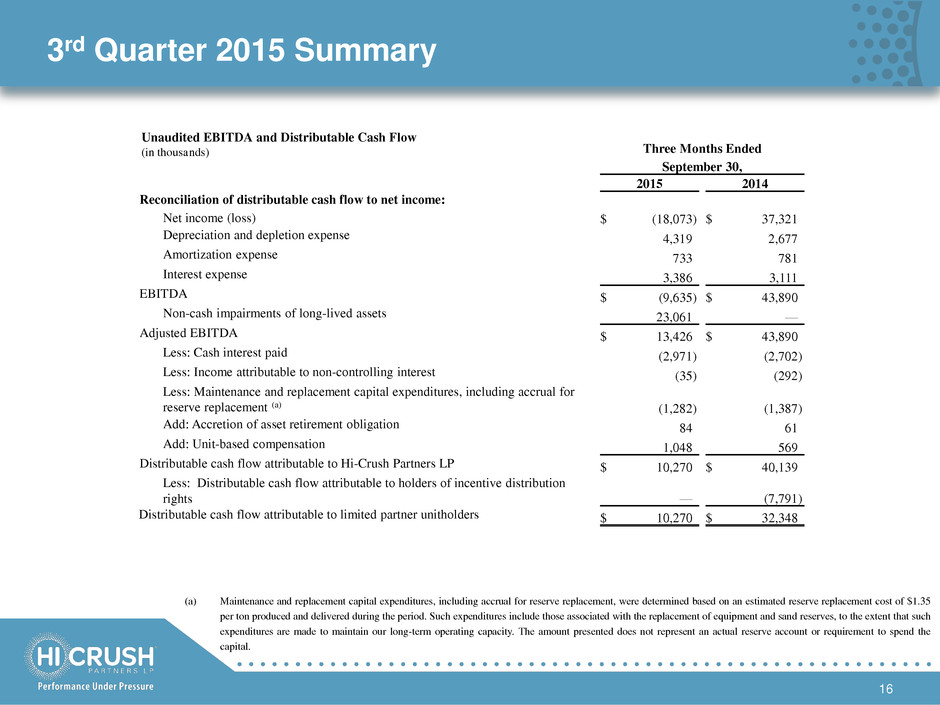
Unaudited EBITDA, Adjusted EBITDA and Distributable Cash Flow
(in thousands)
Three Months Ended | |||||||
September 30, | |||||||
2015 | 2014 | ||||||
Reconciliation of distributable cash flow to net income: | |||||||
Net income (loss) | $ | (18,073 | ) | $ | 37,321 | ||
Depreciation and depletion expense | 4,319 | 2,677 | |||||
Amortization expense | 733 | 781 | |||||
Interest expense | 3,386 | 3,111 | |||||
EBITDA | $ | (9,635 | ) | $ | 43,890 | ||
Non-cash impairments of long-lived assets | 23,061 | — | |||||
Adjusted EBITDA | $ | 13,426 | $ | 43,890 | |||
Less: Cash interest paid | (2,971 | ) | (2,702 | ) | |||
Less: Income attributable to non-controlling interest | (35 | ) | (292 | ) | |||
Less: Maintenance and replacement capital expenditures, including accrual for reserve replacement (a) | (1,282 | ) | (1,387 | ) | |||
Add: Accretion of asset retirement obligation | 84 | 61 | |||||
Add: Unit-based compensation | 1,048 | 569 | |||||
Distributable cash flow attributable to Hi-Crush Partners LP | $ | 10,270 | $ | 40,139 | |||
Less: Distributable cash flow attributable to holders of incentive distribution rights | — | (7,791 | ) | ||||
Distributable cash flow attributable to limited partner unitholders | $ | 10,270 | $ | 32,348 | |||
(a) | Maintenance and replacement capital expenditures, including accrual for reserve replacement, were determined based on an estimated reserve replacement cost of $1.35 per ton produced and delivered during the period. Such expenditures include those associated with the replacement of equipment and sand reserves, to the extent that such expenditures are made to maintain our long-term operating capacity. The amount presented does not represent an actual reserve account or requirement to spend the capital. |
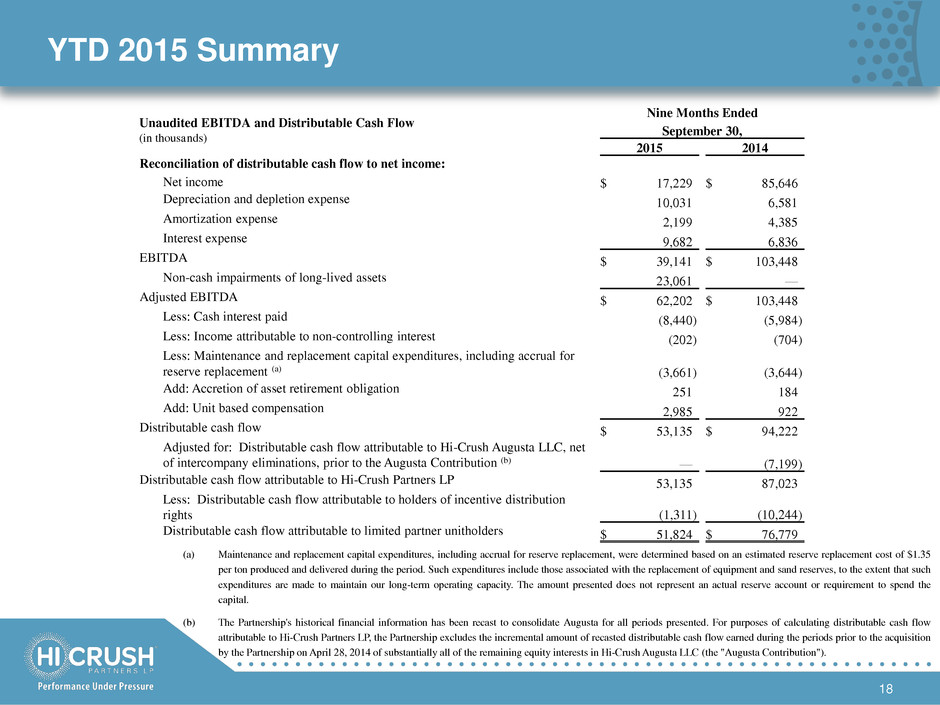
Unaudited EBITDA, Adjusted EBITDA and Distributable Cash Flow
(in thousands)
Nine Months Ended | |||||||
September 30, | |||||||
2015 | 2014 | ||||||
Reconciliation of distributable cash flow to net income: | |||||||
Net income | $ | 17,229 | $ | 85,646 | |||
Depreciation and depletion expense | 10,031 | 6,581 | |||||
Amortization expense | 2,199 | 4,385 | |||||
Interest expense | 9,682 | 6,836 | |||||
EBITDA | $ | 39,141 | $ | 103,448 | |||
Non-cash impairments of long-lived assets | 23,061 | — | |||||
Adjusted EBITDA | $ | 62,202 | $ | 103,448 | |||
Less: Cash interest paid | (8,440 | ) | (5,984 | ) | |||
Less: Income attributable to non-controlling interest | (202 | ) | (704 | ) | |||
Less: Maintenance and replacement capital expenditures, including accrual for reserve replacement (a) | (3,661 | ) | (3,644 | ) | |||
Add: Accretion of asset retirement obligation | 251 | 184 | |||||
Add: Unit-based compensation | 2,985 | 922 | |||||
Distributable cash flow | $ | 53,135 | $ | 94,222 | |||
Adjusted for: Distributable cash flow attributable to Hi-Crush Augusta LLC, net of intercompany eliminations, prior to the Augusta Contribution (b) | — | (7,199 | ) | ||||
Distributable cash flow attributable to Hi-Crush Partners LP | 53,135 | 87,023 | |||||
Less: Distributable cash flow attributable to holders of incentive distribution rights | (1,311 | ) | (10,244 | ) | |||
Distributable cash flow attributable to limited partner unitholders | $ | 51,824 | $ | 76,779 | |||
(a) | Maintenance and replacement capital expenditures, including accrual for reserve replacement, were determined based on an estimated reserve replacement cost of $1.35 per ton produced and delivered during the period. Such expenditures include those associated with the replacement of equipment and sand reserves, to the extent that such expenditures are made to maintain our long-term operating capacity. The amount presented does not represent an actual reserve account or requirement to spend the capital. |
(b) | The Partnership's historical financial information has been recast to consolidate Augusta for all periods presented. For purposes of calculating distributable cash flow attributable to Hi-Crush Partners LP, the Partnership excludes the incremental amount of recasted distributable cash flow earned during the periods prior to the acquisition by the Partnership on April 28, 2014 of substantially all of the remaining equity interests in Hi-Crush Augusta LLC (the "Augusta Contribution"). |
Unaudited Condensed Consolidated Cash Flow Information
(Amounts in thousands)
Nine Months Ended | |||||||
September 30, | |||||||
2015 | 2014 (a) | ||||||
Operating activities | $ | 67,138 | $ | 77,838 | |||
Investing activities | (47,576 | ) | (246,571 | ) | |||
Financing activities | (19,173 | ) | 168,750 | ||||
Net increase in cash | $ | 389 | $ | 17 | |||
(a) Financial information has been recast to include the financial position and results attributable to Hi-Crush Augusta LLC.
Unaudited Condensed Consolidated Balance Sheets
(Amounts in thousands, except unit amounts)
September 30, | December 31, | ||||||
2015 | 2014 | ||||||
Assets | |||||||
Current assets: | |||||||
Cash | $ | 5,035 | $ | 4,646 | |||
Restricted cash | — | 691 | |||||
Accounts receivable, net | 53,504 | 82,117 | |||||
Inventories | 33,380 | 23,684 | |||||
Prepaid expenses and other current assets | 3,975 | 4,081 | |||||
Total current assets | 95,894 | 115,219 | |||||
Property, plant and equipment, net | 262,272 | 241,325 | |||||
Goodwill and intangible assets, net | 45,945 | 66,750 | |||||
Other assets | 13,701 | 12,826 | |||||
Total assets | $ | 417,812 | $ | 436,120 | |||
Liabilities, Equity and Partners’ Capital | |||||||
Current liabilities: | |||||||
Accounts payable | $ | 13,844 | $ | 24,878 | |||
Accrued and other current liabilities | 7,894 | 12,248 | |||||
Due to sponsor | 9,276 | 13,459 | |||||
Current portion of long-term debt | 2,436 | 2,000 | |||||
Total current liabilities | 33,450 | 52,585 | |||||
Long-term debt | 249,140 | 198,364 | |||||
Asset retirement obligation | 6,981 | 6,730 | |||||
Total liabilities | 289,571 | 257,679 | |||||
Commitments and contingencies | |||||||
Equity and partners’ capital: | |||||||
General partner interest | — | — | |||||
Limited partner interests, 36,959,270 and 36,952,426 units outstanding, respectively | 125,560 | 175,962 | |||||
Total partners’ capital | 125,560 | 175,962 | |||||
Non-controlling interest | 2,681 | 2,479 | |||||
Total equity and partners' capital | 128,241 | 178,441 | |||||
Total liabilities, equity and partners’ capital | $ | 417,812 | $ | 436,120 | |||
Unaudited Per Ton Operating Activity
Three Months Ended | Nine Months Ended | ||||||||||||||
September 30, | September 30, | ||||||||||||||
2015 | 2014 | 2015 | 2014 | ||||||||||||
Sand sold (in tons) | 1,409,032 | 1,180,602 | 3,794,531 | 3,102,897 | |||||||||||
Sand produced and delivered (in tons) | 949,238 | 1,027,611 | 2,711,806 | 2,699,138 | |||||||||||
Production costs ($ in thousands) | $ | 10,744 | $ | 14,274 | $ | 37,091 | $ | 42,644 | |||||||
Production costs per ton | $ | 11.32 | $ | 13.89 | $ | 13.68 | $ | 15.80 | |||||||
Unaudited Net Income (Loss) per Limited Partner Unit
(Amounts in thousands, except units and per unit amounts)
Three Months Ended | Nine Months Ended | ||||||||||
September 30, | September 30, | ||||||||||
Weighted average limited partner units outstanding: | 2015 | 2014 | 2015 | 2014 | |||||||
Basic | 36,959,020 | 35,077,527 | 36,958,692 | 32,162,763 | |||||||
Diluted | 36,959,020 | 37,033,959 | 37,200,426 | 35,362,327 | |||||||
Reconciliation of net income (loss) and the assumed allocation of net income (loss) under the two-class method for purposes of computing earnings (loss) per limited partner unit:
Three Months Ended September 30, 2015 | |||||||||||
General Partner and IDRs | Limited Partner Units | Total | |||||||||
Declared distribution | $ | — | $ | — | $ | — | |||||
Assumed allocation of distributions in excess of loss | — | (18,108 | ) | (18,108 | ) | ||||||
Assumed allocation of net loss | $ | — | $ | (18,108 | ) | $ | (18,108 | ) | |||
Loss per limited partner unit - basic | $ | (0.49 | ) | ||||||||
Loss per limited partner unit - diluted | $ | (0.49 | ) | ||||||||
Nine Months Ended September 30, 2015 | |||||||||||
General Partner and IDRs | Limited Partner Units | Total | |||||||||
Declared distribution | $ | 1,311 | $ | 42,502 | $ | 43,813 | |||||
Assumed allocation of distributions in excess of earnings | — | (26,786 | ) | (26,786 | ) | ||||||
Assumed allocation of net income | $ | 1,311 | $ | 15,716 | $ | 17,027 | |||||
Earnings per limited partner unit - basic | $ | 0.43 | |||||||||
Earnings per limited partner unit - diluted | $ | 0.42 | |||||||||
Reconciliation of adjusted earnings per limited partner unit to the most directly comparable GAAP financial measure:
September 30, 2015 | |||||||
Three Months Ended | Nine Months Ended | ||||||
Net income (loss) attributable to Hi-Crush Partners LP | $ | (18,108 | ) | $ | 17,027 | ||
Add: Impairments and other expenses | 23,718 | 23,718 | |||||
Adjusted net income attributable to Hi-Crush Partners LP | $ | 5,610 | $ | 40,745 | |||
Adjusted earnings per limited partner unit - basic | $ | 0.15 | $ | 1.07 | |||
Adjusted earnings per limited partner unit - diluted (a) | $ | 0.15 | $ | 1.06 | |||
(a) | Diluted earnings per limited partner unit for the three and nine months ended September 30, 2015 includes the dilutive effect of 240,404 awards granted and outstanding which would have vested if the performance period had ended on September 30, 2015. |

3RD QUARTER 2015 EARNINGS PRESENTATION OCTOBER 2015

Forward Looking Statements Some of the information included herein may contain forward-looking statements within the meaning of the federal securities laws. Forward- looking statements give our current expectations and may contain projections of results of operations or of financial condition, or forecasts of future events. Words such as “may,” “assume,” “forecast,” “position,” “predict,” “strategy,” “expect,” “intend,” “plan,” “estimate,” “anticipate,” “could,” “believe,” “project,” “budget,” “potential,” or “continue,” and similar expressions are used to identify forward-looking statements. They can be affected by assumptions used or by known or unknown risks or uncertainties. Consequently, no expected results of operations or financial condition or other forward-looking statements can be guaranteed. When considering these forward-looking statements, you should keep in mind the risk factors and other cautionary statements in Hi-Crush Partners LP’s (“Hi-Crush”) reports filed with the Securities and Exchange Commission (“SEC”), including those described under Item 1A, “Risk Factors” of Hi-Crush’s Annual Report on Form 10-K for the fiscal year ended December 31, 2014 and any subsequently filed Quarterly Report on Form 10-Q. Actual results may vary materially. You are cautioned not to place undue reliance on any forward-looking statements. You should also understand that it is not possible to predict or identify all such factors and should not consider the risk factors in our reports filed with the SEC or the following list to be a complete statement of all potential risks and uncertainties. Factors that could cause our actual results to differ materially from the results contemplated by such forward-looking statements include: the volume of frac sand we are able to sell; the price at which we are able to sell frac sand; the outcome of any pending litigation; changes in the price and availability of natural gas or electricity; changes in prevailing economic conditions; and difficulty collecting receivables. All forward-looking statements are expressly qualified in their entirety by the foregoing cautionary statements. Hi-Crush’s forward-looking statements speak only as of the date made and Hi-Crush undertakes no obligation to update or revise its forward-looking statements, whether as a result of new information, future events or otherwise. 2
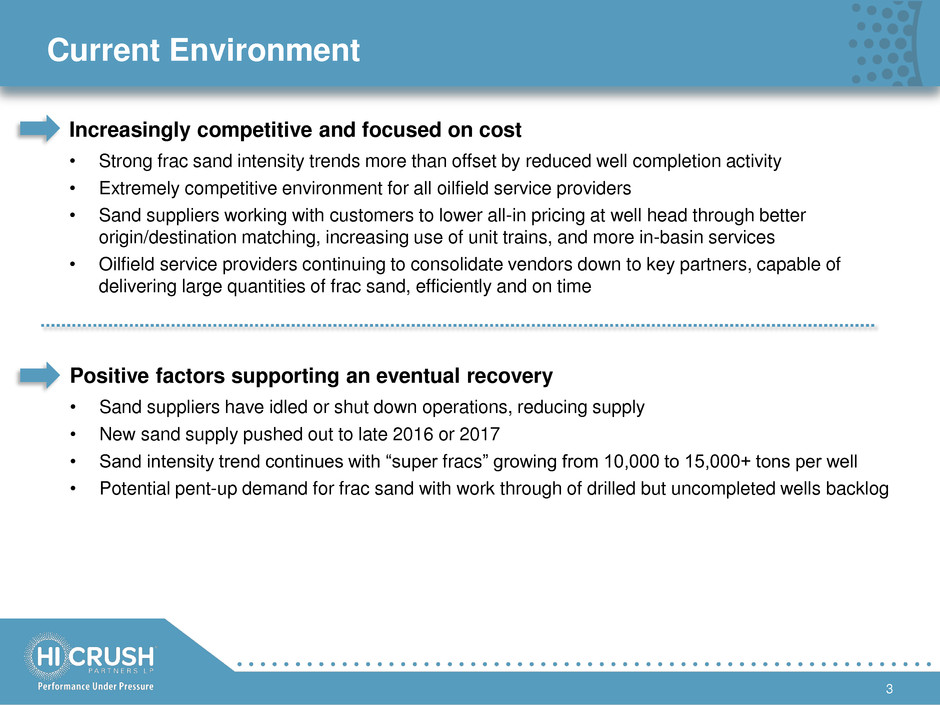
Current Environment 3 Increasingly competitive and focused on cost • Strong frac sand intensity trends more than offset by reduced well completion activity • Extremely competitive environment for all oilfield service providers • Sand suppliers working with customers to lower all-in pricing at well head through better origin/destination matching, increasing use of unit trains, and more in-basin services • Oilfield service providers continuing to consolidate vendors down to key partners, capable of delivering large quantities of frac sand, efficiently and on time Positive factors supporting an eventual recovery • Sand suppliers have idled or shut down operations, reducing supply • New sand supply pushed out to late 2016 or 2017 • Sand intensity trend continues with “super fracs” growing from 10,000 to 15,000+ tons per well • Potential pent-up demand for frac sand with work through of drilled but uncompleted wells backlog

Managing the Downturn 4 Temporary measures to address contract customer market factors • Pricing discounts to contract customers, in certain circumstances in exchange for additional term and/or volume • Extended price discounts through 2015; pricing pressure expected to continue into 2016 Maintaining liquidity and capital flexibility • Distribution temporarily suspended • Capex budget of $15-25 million in 2016 is flexible Focused on internal cost reductions • Key focus on reducing logistics costs and improving origin/destination pairings • Temporary idling of Augusta facility to maximize production from lowest cost plants while optimizing origin/destination pairings to lower delivered costs • Reducing headcount for more efficient operations (~16% reduction YTD) • Receiving discounts and increased efficiency from vendors and suppliers
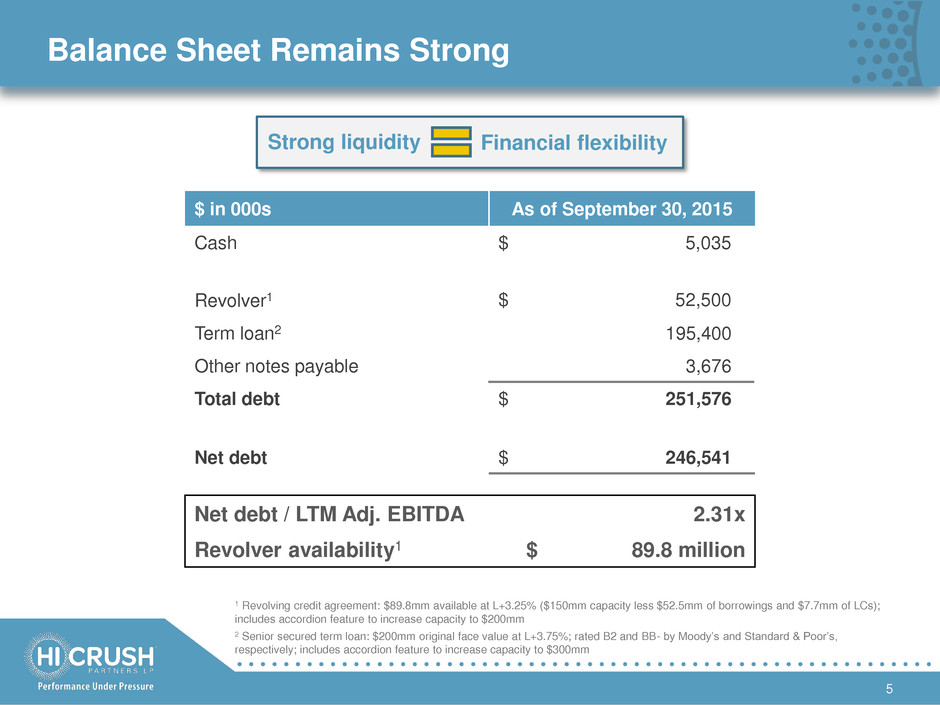
Balance Sheet Remains Strong 5 $ in 000s As of September 30, 2015 Cash $ 5,035 Revolver1 $ 52,500 Term loan2 195,400 Other notes payable 3,676 Total debt $ 251,576 Net debt $ 246,541 Net debt / LTM Adj. EBITDA 2.31x Revolver availability1 $ 89.8 million 1 Revolving credit agreement: $89.8mm available at L+3.25% ($150mm capacity less $52.5mm of borrowings and $7.7mm of LCs); includes accordion feature to increase capacity to $200mm 2 Senior secured term loan: $200mm original face value at L+3.75%; rated B2 and BB- by Moody’s and Standard & Poor’s, respectively; includes accordion feature to increase capacity to $300mm Strong liquidity Financial flexibility
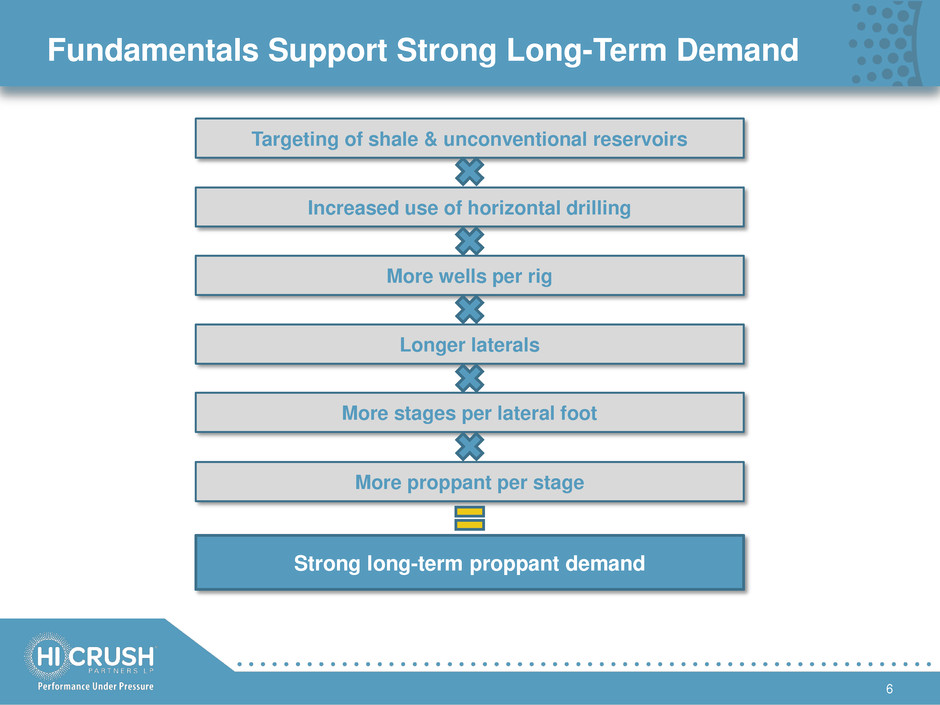
Fundamentals Support Strong Long-Term Demand 6 Targeting of shale & unconventional reservoirs Increased use of horizontal drilling More wells per rig Longer laterals More stages per lateral foot More proppant per stage Strong long-term proppant demand
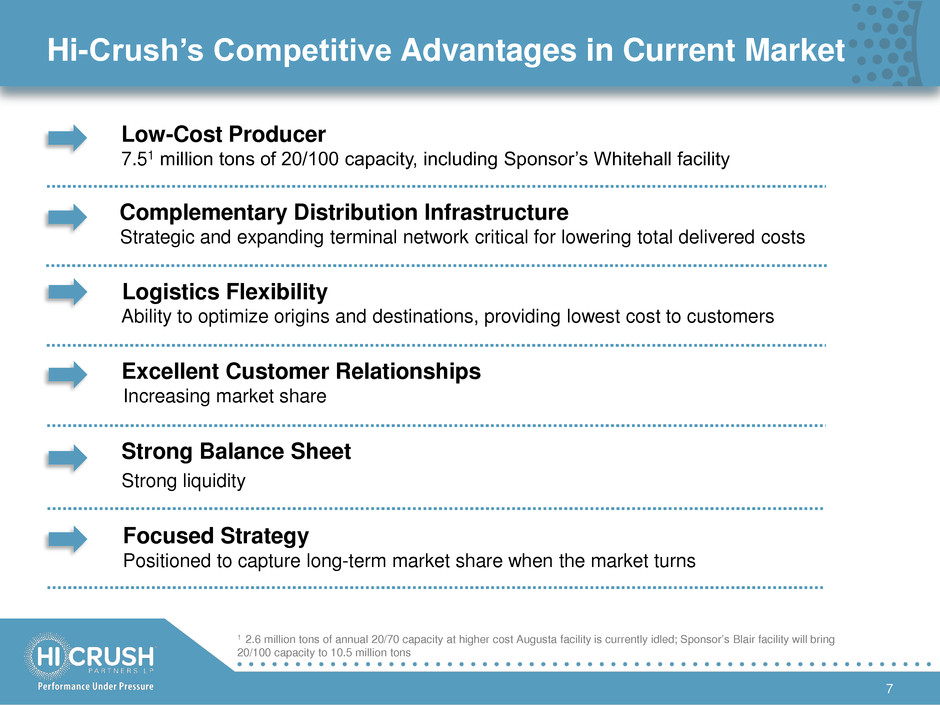
Hi-Crush’s Competitive Advantages in Current Market 7 1 2.6 million tons of annual 20/70 capacity at higher cost Augusta facility is currently idled; Sponsor’s Blair facility will bring 20/100 capacity to 10.5 million tons Low-Cost Producer 7.51 million tons of 20/100 capacity, including Sponsor’s Whitehall facility Complementary Distribution Infrastructure Strategic and expanding terminal network critical for lowering total delivered costs Logistics Flexibility Ability to optimize origins and destinations, providing lowest cost to customers Excellent Customer Relationships Increasing market share Strong Balance Sheet Strong liquidity Focused Strategy Positioned to capture long-term market share when the market turns

Hi-Crush Operations
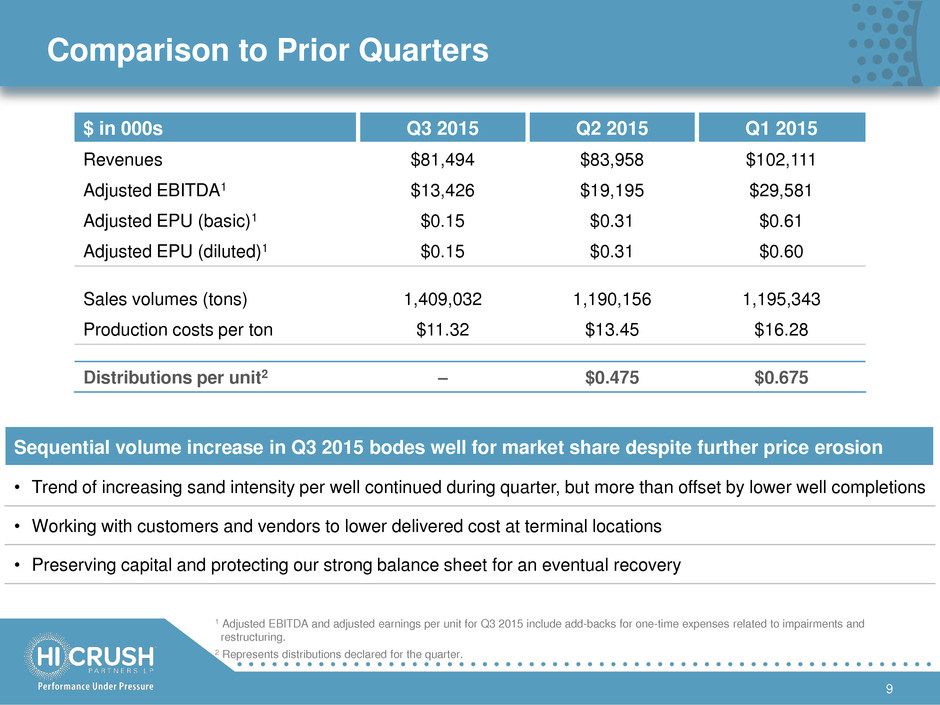
Comparison to Prior Quarters 9 $ in 000s Q3 2015 Q2 2015 Q1 2015 Revenues $81,494 $83,958 $102,111 Adjusted EBITDA1 $13,426 $19,195 $29,581 Adjusted EPU (basic)1 $0.15 $0.31 $0.61 Adjusted EPU (diluted)1 $0.15 $0.31 $0.60 Sales volumes (tons) 1,409,032 1,190,156 1,195,343 Production costs per ton $11.32 $13.45 $16.28 Distributions per unit2 – $0.475 $0.675 1 Adjusted EBITDA and adjusted earnings per unit for Q3 2015 include add-backs for one-time expenses related to impairments and restructuring. 2 Represents distributions declared for the quarter. Sequential volume increase in Q3 2015 bodes well for market share despite further price erosion • Trend of increasing sand intensity per well continued during quarter, but more than offset by lower well completions • Working with customers and vendors to lower delivered cost at terminal locations • Preserving capital and protecting our strong balance sheet for an eventual recovery
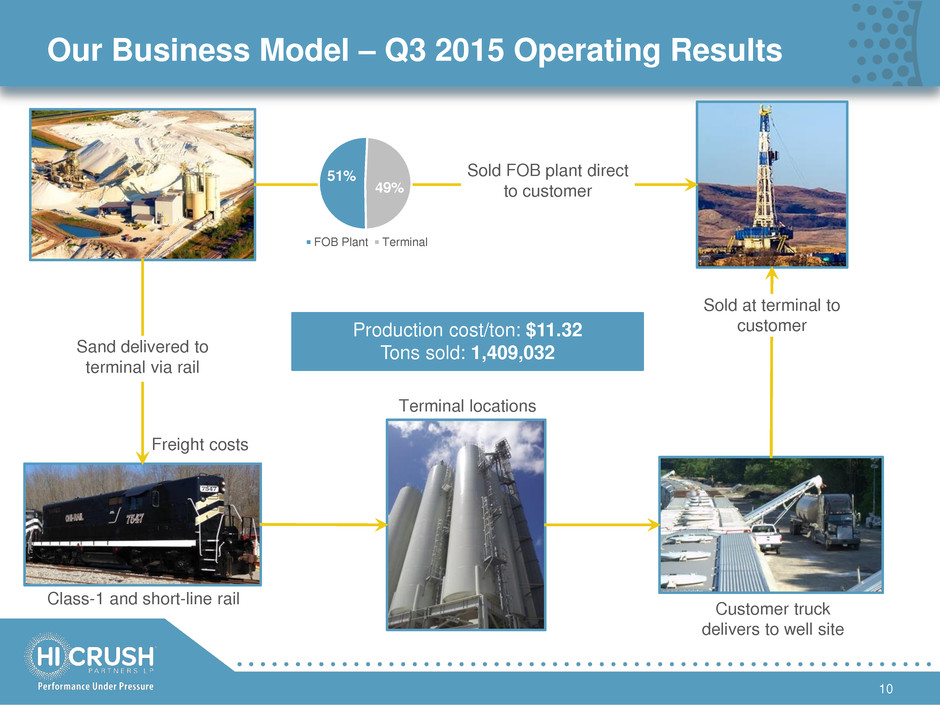
Our Business Model – Q3 2015 Operating Results 10 Sold FOB plant direct to customer Sand delivered to terminal via rail Customer truck delivers to well site Sold at terminal to customer Freight costs Class-1 and short-line rail Production cost/ton: $11.32 Tons sold: 1,409,032 Terminal locations 51% 49% FOB Plant Terminal

Hi-Crush Ranks Among Largest in Industry 11 #1 in Wisconsin #4 in World Largest production capacity of frac sand in Wisconsin Fourth largest production capacity of frac sand in the world3 Source: Internal estimates 7.5 million1 tons current capacity2 1 2.6mm tons of 20/70 capacity at higher cost Augusta facility is currently idled 2 20/100 mesh capacity, including Sponsor’s Whitehall facility 3 With completion of Blair at the Sponsor level, total capacity will rank 2nd in world
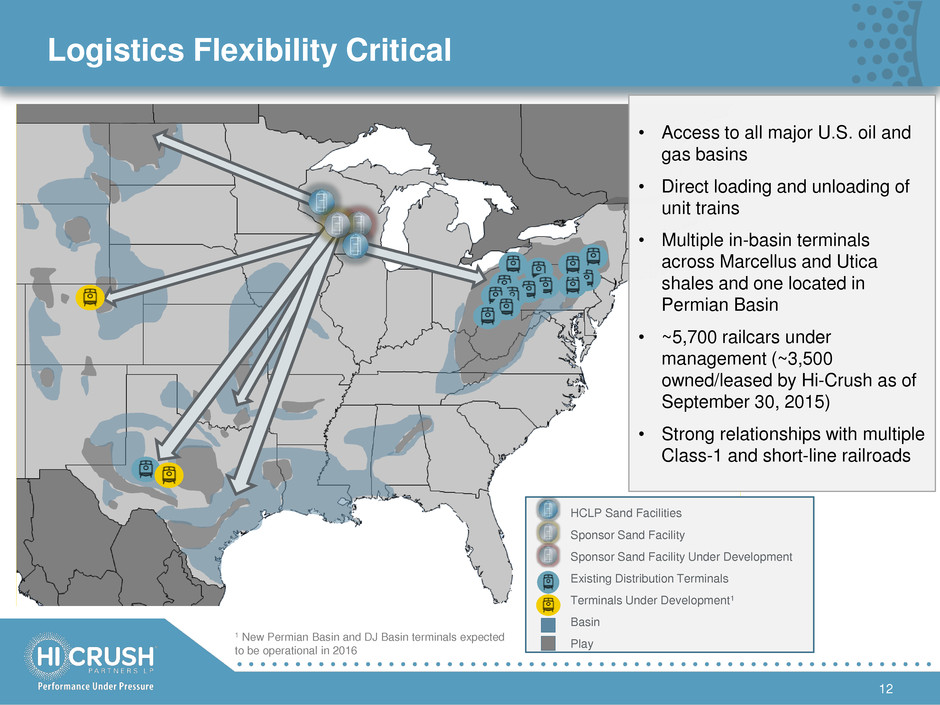
Logistics Flexibility Critical 12 Sandstone Formations Sponsor’s Whitehall Facility • Access to all major U.S. oil and gas basins • Direct loading and unloading of unit trains • Multiple in-basin terminals across Marcellus and Utica shales and one located in Permian Basin • ~5,700 railcars under management (~3,500 owned/leased by Hi-Crush as of September 30, 2015) • Strong relationships with multiple Class-1 and short-line railroads HCLP Sand Facilities Sponsor Sand Facility Existing Distribution Terminals Basin Play Terminals Under Development1 1 New Permian Basin and DJ Basin terminals expected to be operational in 2016 Sponsor Sand Facility Under Development
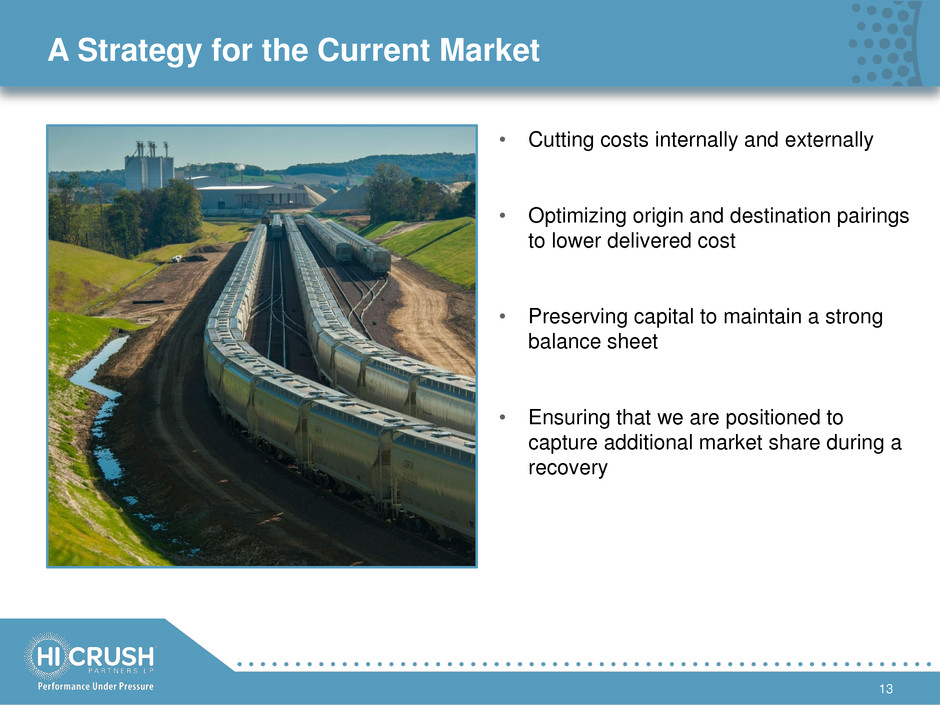
A Strategy for the Current Market 13 • Cutting costs internally and externally • Optimizing origin and destination pairings to lower delivered cost • Preserving capital to maintain a strong balance sheet • Ensuring that we are positioned to capture additional market share during a recovery
Financial Results
3rd Quarter 2015 Summary 15 Unaudited Condensed Consolidated Statements of Operations (Amounts in thousands, except per unit amounts) Three Months Ended September 30, 2015 2014 Revenues $ 81,494 $ 102,316 Cost of goods sold (including depreciation, depletion and amortization) 66,400 55,640 Gross profit 15,094 46,676 Operating costs and expenses: General and administrative expenses 5,979 6,183 Impairments and other expenses 23,718 — Accretion of asset retirement obligation 84 61 Income (loss) from operations (14,687 ) 40,432 Other income (expense): Interest expense (3,386 ) (3,111 ) Net income (loss) (18,073 ) 37,321 Income attributable to non-controlling interest (35 ) (292 ) Net income (loss) attributable to Hi-Crush Partners LP $ (18,108 ) $ 37,029 Earnings (loss) per limited partner unit: Basic $ (0.49 ) $ 0.86 Diluted $ (0.49 ) $ 0.83
3rd Quarter 2015 Summary 16 (a) Maintenance and replacement capital expenditures, including accrual for reserve replacement, were determined based on an estimated reserve replacement cost of $1.35 per ton produced and delivered during the period. Such expenditures include those associated with the replacement of equipment and sand reserves, to the extent that such expenditures are made to maintain our long-term operating capacity. The amount presented does not represent an actual reserve account or requirement to spend the capital. Unaudited EBITDA and Distributable Cash Flow (in thousands) Three Months Ended September 30, 2015 2014 Reconciliation of distributable cash flow to net income: Net income (loss) $ (18,073 ) $ 37,321 Depreciation and depletion expense 4,319 2,677 Amortization expense 733 781 Interest expense 3,386 3,111 EBITDA $ (9,635 ) $ 43,890 Non-cash impairments of long-lived assets 23,061 — Adjusted EBITDA $ 13,426 $ 43,890 Less: Cash interest paid (2,971 ) (2,702 ) Less: Income attributable to non-controlling interest (35 ) (292 ) Less: Maintenance and replacement capital expenditures, including accrual for reserve replacement (a) (1,282 ) (1,387 ) Add: Accretion of asset retirement obligation 84 61 Add: Unit-based compensation 1,048 569 Distributable cash flow attributable to Hi-Crush Partners LP $ 10,270 $ 40,139 Less: Distributable cash flow attributable to holders of incentive distribution rights — (7,791 ) Distributable cash flow attributable to limited partner unitholders $ 10,270 $ 32,348

YTD 2015 Summary 17 Unaudited Condensed Consolidated Statements of Operations (Amounts in thousands, except per unit amounts) (a) Financial information has been recast to include the financial position and results attributable to Hi-Crush Augusta LLC. Nine Months Ended September 30, 2015 2014 (a) Revenues $ 267,563 $ 255,618 Cost of goods sold (including depreciation, depletion and amortization) 198,737 143,665 Gross profit 68,826 111,953 Operating costs and expenses: General and administrative expenses 17,946 19,287 Impairments and other expenses 23,718 — Accretion of asset retirement obligation 251 184 Income from operations 26,911 92,482 Other income (expense): Interest expense (9,682 ) (6,836 ) Net income 17,229 85,646 Income attributable to non-controlling interest (202 ) (704 ) Net income attributable to Hi-Crush Partners LP $ 17,027 $ 84,942 Earnings per limited partner unit: Basic $ 0.43 $ 2.24 Diluted $ 0.42 $ 2.15
YTD 2015 Summary 18 (a) Maintenance and replacement capital expenditures, including accrual for reserve replacement, were determined based on an estimated reserve replacement cost of $1.35 per ton produced and delivered during the period. Such expenditures include those associated with the replacement of equipment and sand reserves, to the extent that such expenditures are made to maintain our long-term operating capacity. The amount presented does not represent an actual reserve account or requirement to spend the capital. (b) The Partnership's historical financial information has been recast to consolidate Augusta for all periods presented. For purposes of calculating distributable cash flow attributable to Hi-Crush Partners LP, the Partnership excludes the incremental amount of recasted distributable cash flow earned during the periods prior to the acquisition by the Partnership on April 28, 2014 of substantially all of the remaining equity interests in Hi-Crush Augusta LLC (the "Augusta Contribution"). Unaudited EBITDA and Distributable Cash Flow (in thousands) Nine Months Ended September 30, 2015 2014 Reconciliation of distributable cash flow to net income: Net income $ 17,229 $ 85,646 Depreciation and depletion expense 10,031 6,581 Amortization expense 2,199 4,385 Interest expense 9,682 6,836 EBITDA $ 39,141 $ 103,448 Non-cash impairments of long-lived assets 23,061 — Adjusted EBITDA $ 62,202 $ 103,448 Less: Cash interest paid (8,440 ) (5,984 ) Less: Income attributable to non-controlling interest (202 ) (704 ) Less: Maintenance and replacement capital expenditures, including accrual for reserve replacement (a) (3,661 ) (3,644 ) Add: Accretion of asset retirement obligation 251 184 Add: Unit based compensation 2,985 922 Distributable cash flow $ 53,135 $ 94,222 Adjusted for: Distributable cash flow attributable to Hi-Crush Augusta LLC, net of intercompany eliminations, prior to the Augusta Contribution (b) — (7,199 ) Distributable cash flow attributable to Hi-Crush Partners LP 53,135 87,023 Less: Distributable cash flow attributable to holders of incentive distribution rights (1,311 ) (10,244 ) Distributable cash flow attributable to limited partner unitholders $ 51,824 $ 76,779

Reconciliation of Adj. Net Income & EPU 19 September 30, 2015 Three Months Ended Nine Months Ended Net income (loss) attributable to Hi-Crush Partners LP $ (18,108 ) $ 17,027 Add: Impairments and other expenses 23,718 23,718 Adjusted net income attributable to Hi-Crush Partners LP $ 5,610 $ 40,745 Adjusted earnings per limited partner unit - basic $ 0.15 $ 1.07 Adjusted earnings per limited partner unit - diluted (a) $ 0.15 $ 1.06 (a) Diluted earnings per limited partner unit for the three and nine months ended September 30, 2015 includes the dilutive effect of 240,404 awards granted and outstanding which are estimated to have vested if the performance period had ended on September 30, 2015. Reconciliation of adjusted earnings per limited partner unit to the most directly comparable GAAP financial measure: (Amounts in thousands, except per unit amounts)
Serious News for Serious Traders! Try StreetInsider.com Premium Free!
You May Also Be Interested In
- NUU Introduces the All-New X10 5G: Fully Unlocked. Nationwide 5G. Exceptional Value.
- Dogecoin Price Prediction: $0.15 Bull Case Would More Than Double DOGE as AlphaPepe $1 Roadmap Talk Targets Bigger Upside
- New Listing Buzz Explodes as ADA and DOGE Bleed While Pepeto Storms Toward Its Debut
Create E-mail Alert Related Categories
SEC FilingsSign up for StreetInsider Free!
Receive full access to all new and archived articles, unlimited portfolio tracking, e-mail alerts, custom newswires and RSS feeds - and more!
