



Form 8-K HEALTHSOUTH CORP For: Jan 11
 Tweet
Tweet Share
Share E-mail
UNITED STATES
SECURITIES AND EXCHANGE COMMISSION
WASHINGTON, D.C. 20549
FORM 8-K
CURRENT REPORT
Pursuant To Section 13 or 15(d) of the Securities Exchange Act of 1934
Date of Report (date of earliest event reported): January 11, 2016
HealthSouth Corporation
(Exact Name of Registrant as Specified in its Charter)
Delaware
(State or Other Jurisdiction of Incorporation)
001-10315 | 63-0860407 |
(Commission File Number) | (I.R.S. Employer Identification No.) |
3660 Grandview Parkway, Suite 200, Birmingham, Alabama 35243
(Address of Principal Executive Offices, Including Zip Code)
(205) 967-7116
(Registrant's Telephone Number, Including Area Code)
Check the appropriate box below if the Form 8-K filing is intended to simultaneously satisfy the filing obligation of the registrant under any of the following provisions:
¨ | Written communication pursuant to Rule 425 under the Securities Act (17 CFR 230.425) |
¨ | Soliciting material pursuant to Rule 14a-12 under the Exchange Act (17 CFR 240.14a-12) |
¨ | Pre-commencement communications pursuant to Rule 14d-2(b) under the Exchange Act (17 CFR 240.14d-2(b)) |
¨ | Pre-commencement communications pursuant to Rule 13e-4(c) under the Exchange Act (17 CFR 240.13e-4(c)) |
ITEM 7.01. Regulation FD Disclosure.
HealthSouth Corporation (the “Company” or “HealthSouth”) will participate in the 34th Annual J.P. Morgan Healthcare Conference in San Francisco, California on January 11-14, 2016. HealthSouth President and Chief Executive Officer, Jay Grinney, will make a presentation on Tuesday, January 12th, at 10:30 a.m. PT/1:30 p.m. ET using the slides attached to this Current Report on Form 8-K as Exhibit 99.1 (the “Conference Slides”) and incorporated herein by reference. The presentation will address, among other things, the Company's strategy and financial performance and discuss industry trends and dynamics. The presentation will be webcast live and will be available at http://investor.healthsouth.com by clicking on an available link.
The Company also has assembled an Investor Reference Book, which is attached to this Current Report on Form 8‑K as Exhibit 99.2 (the “Investor Reference Book”). The Investor Reference Book addresses, among other things, an overview of the Company and its industry, it’s business outlook, it’s financial and operational metrics and initiatives, and it’s value proposition. The Investor Reference Book is available at http://investor.healthsouth.com by clicking on an available link.
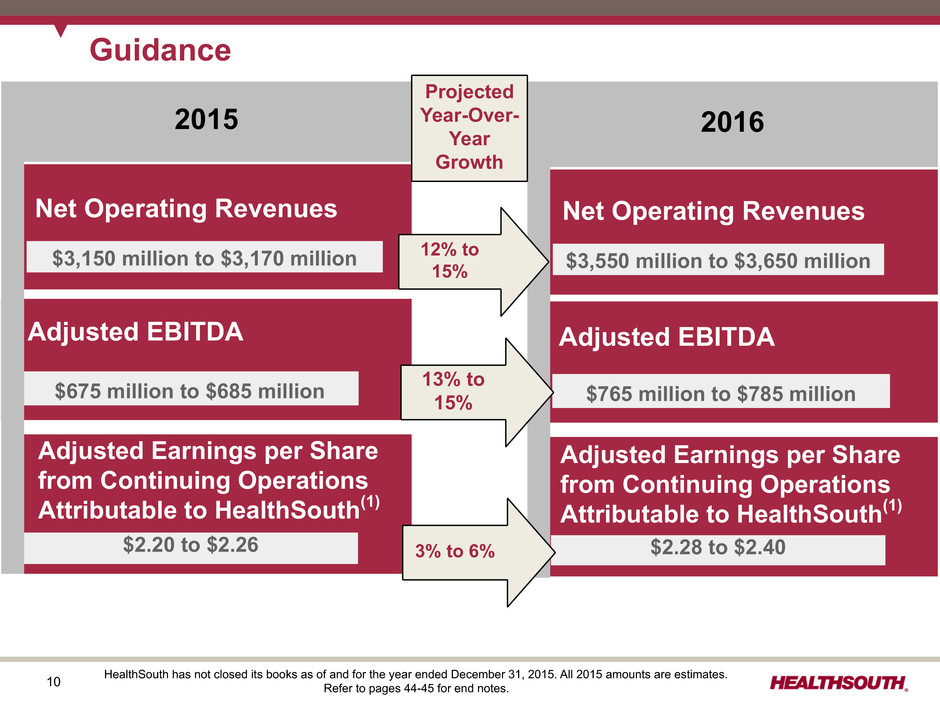
While the Company has not closed its books for the year ended December 31, 2015, the Company shares its preliminary estimate of net operating revenues and adjusted free cash flow for the year ended December 31, 2015 as well as the amount of common stock repurchases for the three months ended December 31, 2015 in the Conference Slides and Investor Reference Book. In addition, the Company provides pro forma debt and leverage information. The Company reiterates as of the date hereof its Adjusted EBITDA guidance range of $675 million to $685 million for 2015, as previously reported in the Current Report on Form 8-K, dated October 28, 2015, and during the Company’s earnings conference call held on October 29, 2015.
The Company is transitioning from providing guidance on earnings per share, a measure in accordance with generally accepted accounting principles in the United States of America (“GAAP”), to adjusted earnings per share, a non-GAAP measure. An explanation and definition of adjusted earnings per share are provided below. As of the date hereof, the Company reiterates its previously reported earnings per share guidance range and provides the following corresponding adjusted earnings per share guidance range for 2015:
Earnings per Share (GAAP measure) | Adjusted Earnings per Share (non-GAAP measure) | ||
Guidance Range | $1.94 to $1.99 | $2.20 to $2.26 | |
The Company is also providing the following initial guidance ranges for 2016:
• | Net operating revenues: $3,550 million to $3,650 million |
• | Adjusted EBITDA: $765 million to $785 million |
• | Adjusted earnings per share: $2.28 to $2.40 |
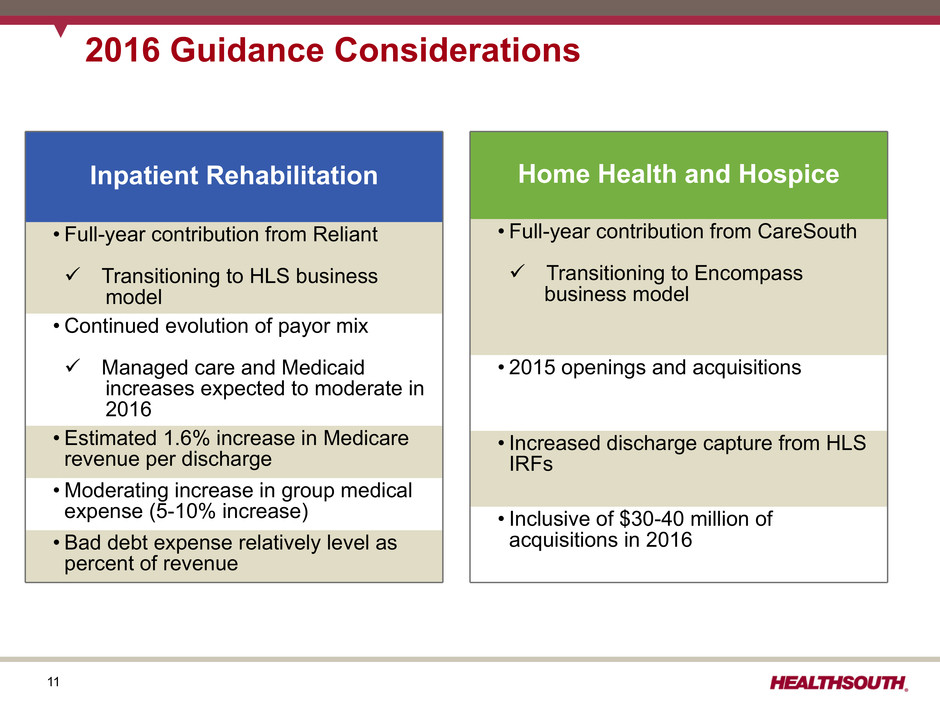
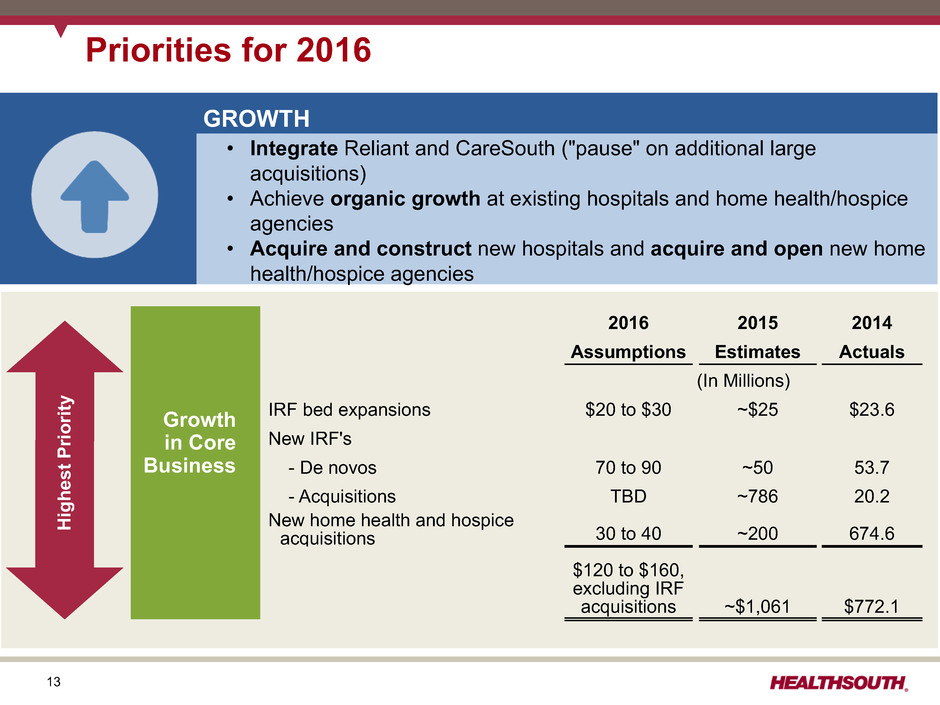
In addition, the Company shares its 2016 guidance considerations, preliminary assumptions around adjusted free cash flow for 2016, and opportunities for deploying its free cash flow in the Conference Slides and Investor Reference Book. While the Company's deployment priorities may shift based on prevailing market conditions, it continues to focus primarily on growth, debt reduction, and shareholder distribution. The Company also provides its updated business model for 2016 through 2018 in the Investor Reference Book. This business model includes a compound annual growth rate for Adjusted EBITDA that continues to have a range of 5% to 9%.
The Company uses “same-store” comparisons to explain the changes in certain performance metrics and line items within its financial statements. Same-store comparisons are calculated based on hospitals open throughout both the full current and prior periods presented. These comparisons include the financial results of market consolidation transactions in existing markets, as it is difficult to determine, with precision, the incremental impact of these transactions on the Company's results of operations.
The information contained herein is being furnished pursuant to Item 7.01 of Form 8-K, “Regulation FD Disclosure.” This information shall not be deemed “filed” for purposes of Section 18 of the Securities Exchange Act of 1934, as amended (the “Exchange Act”), or incorporated by reference in any filing under the Securities Act of 1933, as amended, or the Exchange Act, except as shall be expressly set forth by specific reference in such a filing.
Note Regarding Presentation of Non-GAAP Financial Measures
The financial data contained in the Conference Slides attached hereto as Exhibit 99.1 and the Investor Reference Book attached hereto as Exhibit 99.2 includes non-GAAP financial measures, including the Company’s adjusted earnings per share, leverage ratio, Adjusted EBITDA, and adjusted free cash flow.
The Company is providing adjusted earnings per share from continuing operations attributable to HealthSouth (“adjusted earnings per share”). The Company believes the presentation of adjusted earnings per share provides a better measure of its ongoing performance and provides better comparability of that performance to prior periods because it excludes the impact of government, class action, and related settlements, professional fees—accounting, tax, and legal, gains or losses related to hedging instruments, loss on early extinguishment of debt, adjustments to its income tax provision (such as valuation allowance adjustments and settlements of income tax claims), items related to corporate and facility restructurings, and certain other items. Adjusted earnings per share should not be considered as a measure of financial performance under generally accepted accounting principles in the United States as the items excluded from it are significant components in understanding and assessing financial performance. Because adjusted earnings per share is not a measurement determined in accordance with GAAP and is thus susceptible to varying calculations, it may not be comparable as presented to other similarly titled measures of other companies. The Company reconciles adjusted earnings per share to earnings per share in the Conference Slides and the Investor Reference Book attached hereto as Exhibit 99.1 and Exhibit 99.2, respectively.
The leverage ratio referenced therein is defined as the ratio of consolidated total debt to Adjusted EBITDA for the trailing four quarters. The Company believes its leverage ratio and Adjusted EBITDA are measures of its ability to service its debt and its ability to make capital expenditures. Additionally, the leverage ratio is a standard measurement used by investors to gauge the creditworthiness of an institution. The Company’s credit agreement also includes a maximum leverage ratio financial covenant which allows the Company to deduct up to $75 million of cash on hand from consolidated total debt. The Company reconciles Adjusted EBITDA to net income in the Conference Slides and the Investor Reference Book attached hereto as Exhibit 99.1 and Exhibit 99.2, respectively, and to net cash provided by operating activities below. Adjusted EBITDA for the Company’s reportable segments is reconciled to net income from continuing operations before income tax expense the Investor Reference Book attached hereto as Exhibit 99.1 and below.
The Company uses Adjusted EBITDA on a consolidated basis as a liquidity measure. The Company believes this financial measure on a consolidated basis is important in analyzing its liquidity because it is the key component of certain material covenants contained within the Company’s credit agreement, which is discussed in more detail in Item 7, Management’s Discussion and Analysis of Financial Condition and Results of Operations, “Liquidity and Capital Resources,” and Note 8, Long-term Debt, to the consolidated financial statements included in its Annual Report on Form 10‑K for the year ended December 31, 2014 (the “2014 Form 10‑K”) and Note 4, Long-term Debt, to the condensed consolidated financial statements included in Part I, Item 1, Financial Statements (Unaudited), of the Company’s quarterly report on Form 10-Q for the quarterly period ended September 30, 2015 (the “September 2015 Form 10-Q”). These covenants are material terms of the credit agreement. Noncompliance with these financial covenants under the credit agreement—its interest coverage ratio and its leverage ratio—could result in the Company’s lenders requiring the Company to immediately repay all amounts borrowed. If the Company anticipated a potential covenant violation, it would seek relief from its lenders, which would have some cost to the Company, and such relief might be on terms less favorable to those in the Company’s existing credit agreement. In addition, if the Company cannot satisfy these financial covenants, it would be prohibited under the credit agreement from engaging in certain activities, such as incurring additional indebtedness, paying common stock dividends, making certain payments, and acquiring and disposing of assets. Consequently, Adjusted EBITDA is critical to the Company’s assessment of its liquidity.
In general terms, the credit agreement definition of Adjusted EBITDA, therein referred to as “Adjusted Consolidated EBITDA,” allows the Company to add back to consolidated net income interest expense, income taxes, and depreciation and amortization and then add back to consolidated net income (1) all unusual or nonrecurring items reducing consolidated net income (of which only up to $10 million in a year may be cash expenditures), (2) costs and expenses related to refinancing transactions (in years prior to 2012), (3) any losses from discontinued operations and closed locations, (4) costs and expenses, including legal fees and expert witness fees, incurred with respect to litigation associated with stockholder derivative litigation, including the matters related to Ernst & Young LLP and Richard Scrushy discussed in Note 18, Contingencies and Other Commitments, to the consolidated financial statements accompanying the 2014 Form 10‑K, and (5) share-based compensation expense. The Company also subtracts from consolidated net income all unusual or nonrecurring items to the extent they increase consolidated net income.
Under the credit agreement, the Adjusted EBITDA calculation does not include net income attributable to noncontrolling interests and includes (1) gain or loss on disposal of assets, (2) professional fees unrelated to the stockholder derivative litigation, and (3) unusual or nonrecurring cash expenditures in excess of $10 million. These items may not be
indicative of the Company’s ongoing performance, so the Adjusted EBITDA calculation presented here includes adjustments for them.
Adjusted EBITDA is not a measure of financial performance under GAAP, and the items excluded from Adjusted EBITDA are significant components in understanding and assessing financial performance. Therefore, Adjusted EBITDA should not be considered a substitute for net income or cash flows from operating, investing, or financing activities. Because Adjusted EBITDA is not a measurement determined in accordance with GAAP and is thus susceptible to varying calculations, Adjusted EBITDA, as presented, may not be comparable to other similarly titled measures of other companies. Revenues and expenses are measured in accordance with the policies and procedures described in Note 1, Summary of Significant Accounting Policies, to the consolidated financial statements accompanying the 2014 Form 10‑K and Note 1, Basis of Presentation, “Net Operating Revenues,” and “Accounts Receivable and Allowance for Doubtful Accounts,” to the condensed consolidated financial statements included in Part I, Item 1, Financial Statements (Unaudited), of the September 2015 Form 10-Q.
The Company also uses adjusted free cash flow as an analytical indicator to assess its performance. Management believes the presentation of adjusted free cash flow provides investors an efficient means by which they can evaluate the Company’s capacity to reduce debt, pursue development activities, and return capital to its common stockholders. The calculation of adjusted free cash flow and a reconciliation of net cash provided by operating activities to adjusted free cash flow are included in the Conference Slides attached hereto as Exhibit 99.1 and the Investor Reference Book attached hereto as Exhibit 99.2. This measure is not a defined measure of financial performance under GAAP and should not be considered as an alternative to net cash provided by operating activities. The Company’s definition of adjusted free cash flow is limited and does not represent residual cash flows available for discretionary spending. Because this measure is not determined in accordance with GAAP and is susceptible to varying calculations, it may not be comparable to other similarly titled measures presented by other companies. See the consolidated statements of cash flows included in the 2014 Form 10-K and the condensed consolidated statements of cash flows included in the September 2015 Form 10-Q for the GAAP measures of cash flows from operating, investing, and financing activities.
Reconciliation of Net Cash Provided by Operating Activities to Adjusted EBITDA
Three Months Ended | Nine Months Ended | ||||||||||||||||||||||||||||||||||
September 30, | September 30, | Year Ended December 31, | |||||||||||||||||||||||||||||||||
2015 | 2014 | 2015 | 2014 | 2014 | 2013 | 2012 | 2011 | 2010 | |||||||||||||||||||||||||||
(In Millions) | |||||||||||||||||||||||||||||||||||
Net cash provided by operating activities | $ | 163.3 | $ | 139.6 | $ | 368.2 | $ | 374.7 | $ | 444.9 | $ | 470.3 | $ | 411.5 | $ | 342.7 | $ | 331.0 | |||||||||||||||||
Provision for doubtful accounts | (10.7 | ) | (8.2 | ) | (33.2 | ) | (25.0 | ) | (31.6 | ) | (26.0 | ) | (27.0 | ) | (21.0 | ) | (16.4 | ) | |||||||||||||||||
Professional fees—accounting, tax, and legal | 0.4 | 4.0 | 2.7 | 7.6 | 9.3 | 9.5 | 16.1 | 21.0 | 17.2 | ||||||||||||||||||||||||||
Interest expense and amortization of debt | |||||||||||||||||||||||||||||||||||
discounts and fees | 35.6 | 27.8 | 98.3 | 83.5 | 109.2 | 100.4 | 94.1 | 119.4 | 125.6 | ||||||||||||||||||||||||||
Equity in net income of nonconsolidated affiliates | 2.4 | 1.9 | 6.3 | 8.8 | 10.7 | 11.2 | 12.7 | 12.0 | 10.1 | ||||||||||||||||||||||||||
Net income attributable to noncontrolling interests | |||||||||||||||||||||||||||||||||||
in continuing operations | (17.1 | ) | (14.7 | ) | (50.9 | ) | (44.3 | ) | (59.7 | ) | (57.8 | ) | (50.9 | ) | (47.0 | ) | (40.9 | ) | |||||||||||||||||
Amortization of debt discounts and fees | (4.6 | ) | (3.2 | ) | (10.9 | ) | (9.5 | ) | (12.7 | ) | (5.0 | ) | (3.7 | ) | (4.2 | ) | (6.3 | ) | |||||||||||||||||
Distributions from nonconsolidated affiliates | (0.8 | ) | (2.9 | ) | (4.5 | ) | (9.4 | ) | (12.6 | ) | (11.4 | ) | (11.0 | ) | (13.0 | ) | (8.1 | ) | |||||||||||||||||
Current portion of income tax expense | 3.5 | 3.2 | 10.4 | 9.8 | 13.3 | 6.3 | 5.9 | 0.6 | 2.9 | ||||||||||||||||||||||||||
Change in assets and liabilities | (7.8 | ) | (0.8 | ) | 93.3 | 43.7 | 90.1 | 48.9 | 58.1 | 41.4 | 5.7 | ||||||||||||||||||||||||
Net premium (received) paid on bond issuance/redemption | (1.8 | ) | (6.3 | ) | 2.0 | (6.3 | ) | 4.3 | 1.7 | 1.9 | 22.8 | — | |||||||||||||||||||||||
Cash used in (provided by) operating activities | |||||||||||||||||||||||||||||||||||
of discontinued operations | 0.5 | (0.2 | ) | 0.8 | 1.0 | 1.2 | 1.9 | (2.0 | ) | (9.1 | ) | (13.2 | ) | ||||||||||||||||||||||
Reliant/CareSouth transaction costs | 2.3 | — | 5.6 | — | — | — | — | — | — | ||||||||||||||||||||||||||
Encompass transaction costs | — | — | — | — | 9.3 | — | — | — | — | ||||||||||||||||||||||||||
Other | 0.2 | (0.2 | ) | 2.9 | 2.2 | 1.9 | 1.6 | 0.2 | 0.6 | 2.0 | |||||||||||||||||||||||||
Adjusted EBITDA | $ | 165.4 | $ | 140.0 | $ | 491.0 | $ | 436.8 | $ | 577.6 | $ | 551.6 | $ | 505.9 | $ | 466.2 | $ | 409.6 | |||||||||||||||||
For the three months ended September 30, 2015, net cash used in investing activities was $52.7 million and resulted primarily from capital expenditures, acquisitions of businesses, and the net change in restricted cash offset by proceeds received from the sale of common stock in Surgical Care Affiliates (our former surgery centers division). Net cash provided by financing activities during the three months ended September 30, 2015 was $645.5 million and resulted primarily from the issuance of an additional $350 million of the Company's existing 5.75% Senior Notes due 2024 in August 2015 and the issuance of $350 million of 5.75% Senior Notes due 2025 in September 2015.
For the three months ended September 30, 2014, net cash used in investing activities was $55.3 million and resulted primarily from capital expenditures. Net cash provided by financing activities during the three months ended September 30, 2014 was $122.2 million and resulted primarily from the issuance of an additional $175 million of the Company's existing 5.75% Senior Notes due 2024 in September 2014.
For the nine months ended September 30, 2015, net cash used in investing activities was $179.4 million and resulted primarily from capital expenditures and acquisitions of businesses offset by proceeds received from the sale of common stock in Surgical Care Affiliates. Net cash used in financing activities during the nine months ended September 30, 2015 was $546.1 million and resulted primarily from net debt issuances offset by cash dividends on common stock and distributions paid to noncontrolling interests of consolidated affiliates.
For the nine months ended September 30, 2014, net cash used in investing activities was $162.3 million and resulted primarily from capital expenditures and acquisition activity. Net cash used in financing activities during the nine months ended September 30, 2014 was $4.6 million and resulted primarily from dividends paid on the Company's common stock and convertible perpetual preferred stock, repurchases of the Company's common stock in the open market, and distributions paid to noncontrolling interests of consolidated affiliates offset by net debt issuances during the period.
For the year ended December 31, 2014, net cash used in investing activities was $876.9 million and resulted primarily from the acquisition of Encompass. Net cash provided by financing activities during the year ended December 31, 2014 was $434.2 million and resulted primarily from draws under the revolving and expanded term loan facilities of the Company's credit agreement to fund the acquisition of Encompass offset by the redemption of the Company's existing 7.25% Senior Notes due 2018.
For the year ended December 31, 2013, net cash used in investing activities was $226.2 million and resulted primarily from increased capital expenditures and acquisition activity. Net cash used in financing activities during the year ended December 31, 2013 was $312.4 million and resulted primarily from repurchases of common stock as part of the tender offer completed in the first quarter of 2013.
For the year ended December 31, 2012, net cash used in investing activities was $178.8 million and resulted primarily from capital expenditures. Net cash used in financing activities during the year ended December 31, 2012 was $130.0 million and resulted primarily from distributions paid to noncontrolling interests of consolidated affiliates, repurchases of 46,645 shares of the Company's convertible perpetual preferred stock, dividends paid on the Company's convertible perpetual preferred stock, and net principal payments on debt offset by capital contributions from consolidated affiliates.
For the year ended December 31, 2011, net cash used in investing activities was $24.6 million and resulted primarily from capital expenditures, net settlement payments related to interest rate swaps, and purchases of restricted investments offset by proceeds from the sale of five long-term acute care hospitals in August 2011. Net cash used in financing activities during the year ended December 31, 2011 was $336.3 million and resulted primarily from net debt payments, including the optional redemption of the Company’s 10.75% Senior Notes due 2016, distributions paid to noncontrolling interests of consolidated affiliates, and dividends paid on the Company’s convertible perpetual preferred stock.
For the year ended December 31, 2010, net cash used in investing activities was $125.9 million and resulted primarily from capital expenditures, net settlement payments related to interest rate swaps, acquisitions of businesses, and net purchases of restricted investments offset by a decrease in restricted cash and proceeds from the sale of the Company’s hospital in Baton Rouge. Net cash used in financing activities during the year ended December 31, 2010 was $237.5 million and resulted primarily from net debt payments, distributions paid to noncontrolling interests of consolidated affiliates, dividends paid on the Company’s convertible perpetual preferred stock, and debt amendment and issuance costs.
Reconciliation of Segment Adjusted EBITDA to Income from Continuing Operations Before Income Tax Expense
Q3 2015 | Q2 2015 | Q1 2015 | Q4 2014 | Q3 2014 | Q2 2014 | Q1 2014 | Full-Year 2014 | ||||||||||||||||||||||||
In Millions | |||||||||||||||||||||||||||||||
Total segment Adjusted EBITDA | $ | 186.9 | $ | 189.5 | $ | 181.3 | $ | 163.3 | $ | 162.5 | $ | 175.9 | $ | 167.5 | $ | 669.2 | |||||||||||||||
General and administrative expenses | (30.6 | ) | (32.1 | ) | (34.6 | ) | (36.4 | ) | (27.5 | ) | (30.2 | ) | (30.7 | ) | (124.8 | ) | |||||||||||||||
Depreciation and amortization | (33.7 | ) | (32.7 | ) | (31.9 | ) | (27.5 | ) | (27.4 | ) | (26.4 | ) | (26.4 | ) | (107.7 | ) | |||||||||||||||
(Loss) gain on disposal or impairment of assets | (0.9 | ) | (0.8 | ) | 1.5 | (1.0 | ) | (2.7 | ) | (1.7 | ) | (1.3 | ) | (6.7 | ) | ||||||||||||||||
Government, class action, and related settlements | — | — | (8.0 | ) | 0.9 | — | 0.8 | — | 1.7 | ||||||||||||||||||||||
Professional fees - accounting, tax, and legal | (0.4 | ) | (0.1 | ) | (2.2 | ) | (1.7 | ) | (4.0 | ) | (2.0 | ) | (1.6 | ) | (9.3 | ) | |||||||||||||||
Loss on early extinguishment of debt | — | (18.8 | ) | (1.2 | ) | (13.2 | ) | — | — | — | (13.2 | ) | |||||||||||||||||||
Interest expense and amortization of debt discounts and fees | (35.6 | ) | (30.9 | ) | (31.8 | ) | (25.7 | ) | (27.8 | ) | (27.8 | ) | (27.9 | ) | (109.2 | ) | |||||||||||||||
Gain on consolidation of former equity method hospital | — | — | — | — | — | 27.2 | — | 27.2 | |||||||||||||||||||||||
Net income attributable to noncontrolling interests | 17.1 | 17.3 | 16.5 | 15.4 | 14.7 | 14.8 | 14.8 | 59.7 | |||||||||||||||||||||||
Gain related to SCA equity interests | 0.6 | 2.6 | — | — | — | — | — | — | |||||||||||||||||||||||
Income from continuing operations before income tax expense | $ | 103.4 | $ | 94.0 | $ | 89.6 | $ | 74.1 | $ | 87.8 | $ | 130.6 | $ | 94.4 | $ | 386.9 | |||||||||||||||
Forward-Looking Statements
Statements contained in this document, the Conference Slides attached hereto as Exhibit 99.1, and the Investor Reference Book attached hereto as Exhibit 99.2, which are not historical facts, such as those relating to the financial guidance, business strategy, and the positioning of services for the system of healthcare delivery in the future, are forward-looking statements. In addition, HealthSouth, through its senior management, may from time to time make forward-looking public statements concerning the matters described herein. All such estimates, projections, and forward-looking information speak only as of the date hereof, and HealthSouth undertakes no duty to publicly update or revise such forward-looking information, whether as a result of new information, future events, or otherwise. Such forward-looking statements are necessarily estimates based upon current information, involve a number of risks and uncertainties, and relate to, among other things, future events, HealthSouth’s plan to repurchase its debt or equity securities, dividend strategies, effective income tax rates, HealthSouth’s business strategy, its financial plans, its future financial performance, its projected business results or model, its ability to return value to shareholders, its projected capital expenditures, its leverage ratio, its acquisition opportunities, and the impact of future legislation or regulation. Actual events or results may differ materially from those anticipated in these forward-looking statements as a result of a variety of factors. While it is impossible to identify all such factors, factors which could cause actual events or results to differ materially from those estimated by HealthSouth include, but are not limited to, the price of HealthSouth’s common stock as it affects the Company’s willingness and ability to repurchase shares and the financial and accounting effects of any repurchases; any adverse outcome of various lawsuits, claims, and legal or regulatory proceedings involving HealthSouth, including its pending DOJ and HHS-OIG investigations and any matters related to yet undiscovered issues, if any, at Reliant or CareSouth; any adverse effects on operating performance of HealthSouth’s stock price resulting from the integration of those acquisitions; potential disruptions, breaches, or other incidents affecting the proper operation, availability, or security of HealthSouth’s information systems, including unauthorized access to or theft of patient or other sensitive information as well as unforeseen issues, if any, related to integration of systems of any acquired companies; the ability to successfully integrate acquired companies, including realization of anticipated tax benefits, revenues, and cost savings, minimizing the negative impact on margins arising from the changes in staffing and other operating practices, and avoidance of unforeseen exposure to liabilities; significant changes in HealthSouth’s management team; HealthSouth’s ability to successfully complete and integrate de novo developments, acquisitions, investments, and joint ventures consistent with its growth strategy; changes, delays in (including in connection with resolution of Medicare payment reviews or appeals), or suspension of reimbursement for HealthSouth’s services by governmental or private payors; changes in the regulation of the healthcare industry at either or both of the federal and state levels, including as part of national healthcare reform and deficit reduction; competitive pressures in the healthcare industry and HealthSouth’s response thereto; HealthSouth’s ability to obtain and retain favorable arrangements with third-party payors; HealthSouth's ability to control costs, particularly labor and employee benefit costs, including group medical expenses; adverse effects resulting from coverage determinations made by Medicare Administrative Contractors regarding its Medicare reimbursement claims and lengthening delays in HealthSouth's
ability to recover improperly denied claims through the administrative appeals process on a timely basis; HealthSouth's ability to adapt to changes in the healthcare delivery system, including involvement in coordinated care initiatives or programs that may arise with its referral sources; HealthSouth’s ability to attract and retain nurses, therapists, and other healthcare professionals in a highly competitive environment with often severe staffing shortages and the impact on HealthSouth’s labor expenses from potential union activity and staffing shortages; general conditions in the economy and capital markets, including any crisis resulting from uncertainty in the sovereign debt market; the increase in the costs of defending and insuring against alleged professional liability claims and HealthSouth’s ability to predict the estimated costs related to such claims; and other factors which may be identified from time to time in HealthSouth’s SEC filings and other public announcements, including HealthSouth’s Form 10‑K for the year ended December 31, 2014 and Form 10-Q for the quarters ended March 31, 2015, June 30, 2015, and September 30, 2015.
ITEM 9.01. Financial Statements and Exhibits.
(d) Exhibits
99.1 | Conference Slides of HealthSouth Corporation used in connection with its January 12, 2016 presentation at the 34th Annual J.P. Morgan Healthcare Conference in San Francisco. |
99.2 | HealthSouth Corporation Investor Reference Book. |
SIGNATURES
Pursuant to the requirements of the Securities Exchange Act of 1934, the Registrant has duly caused this Report to be signed on its behalf by the undersigned hereunto duly authorized.
HEALTHSOUTH CORPORATION
By: | /S/ JOHN P. WHITTINGTON | |
Name: | John P. Whittington | |
Title: | Executive Vice President, General Counsel and Corporate Secretary | |
Dated: January 11, 2016

2 The information contained in this presentation includes certain estimates, projections and other forward- looking information that reflect our current outlook, views and plans with respect to future events, including legislative and regulatory developments, strategy, capital expenditures, development activities, dividend strategies, repurchases of securities, effective tax rates, financial performance, and business model. These estimates, projections and other forward-looking information are based on assumptions that HealthSouth believes, as of the date hereof, are reasonable. Inevitably, there will be differences between such estimates and actual events or results, and those differences may be material. There can be no assurance that any estimates, projections or forward-looking information will be realized. All such estimates, projections and forward-looking information speak only as of the date hereof. HealthSouth undertakes no duty to publicly update or revise the information contained herein. You are cautioned not to place undue reliance on the estimates, projections and other forward-looking information in this presentation as they are based on current expectations and general assumptions and are subject to various risks, uncertainties and other factors, including those set forth in the Form 10-K for the year ended December 31, 2014, the Form 10-Q for the quarters ended March 31, 2015, June 30, 2015, and September 30, 2015, and in other documents we previously filed with the SEC, many of which are beyond our control, that may cause actual events or results to differ materially from the views, beliefs and estimates expressed herein. Note Regarding Presentation of Non-GAAP Financial Measures The following presentation includes certain “non-GAAP financial measures” as defined in Regulation G under the Securities Exchange Act of 1934. Schedules are attached that reconcile the non-GAAP financial measures included in the following presentation to the most directly comparable financial measures calculated and presented in accordance with Generally Accepted Accounting Principles in the United States. Our Form 8-K, dated January 11, 2016 to which the following supplemental slides are attached as Exhibit 99.1, provides further explanation and disclosure regarding our use of non-GAAP financial measures and should be read in conjunction with these supplemental slides. Forward-Looking Statements
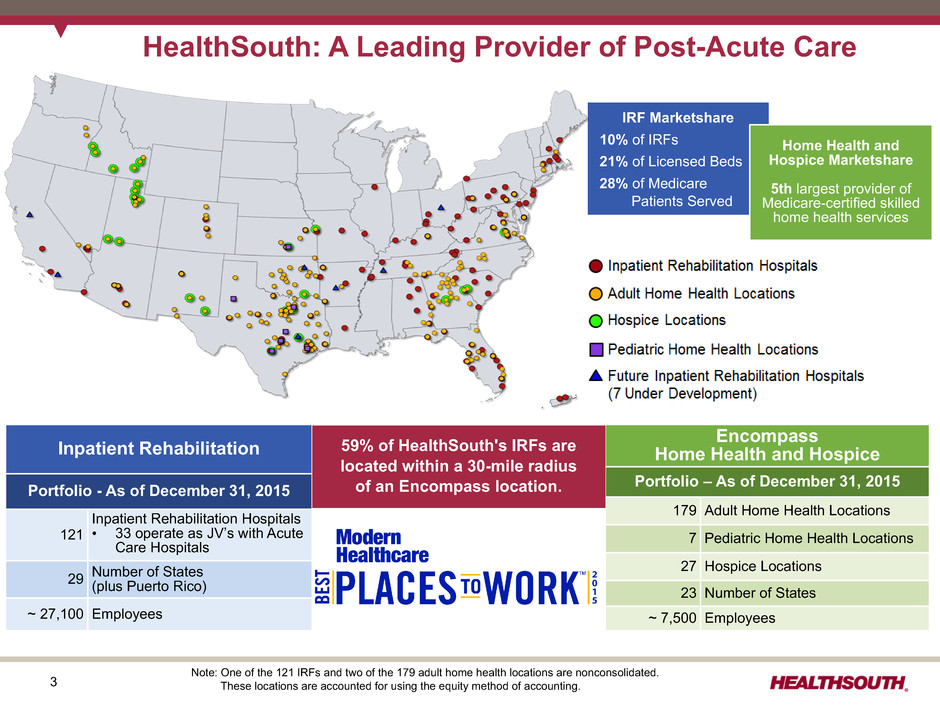
3 Inpatient Rehabilitation Portfolio - As of December 31, 2015 121 Inpatient Rehabilitation Hospitals • 33 operate as JV’s with Acute Care Hospitals 29 Number of States(plus Puerto Rico) ~ 27,100 Employees HealthSouth: A Leading Provider of Post-Acute Care Encompass Home Health and Hospice Portfolio – As of December 31, 2015 179 Adult Home Health Locations 7 Pediatric Home Health Locations 27 Hospice Locations 23 Number of States ~ 7,500 Employees IRF Marketshare 10% of IRFs 21% of Licensed Beds 28% of Medicare Patients Served Home Health and Hospice Marketshare 5th largest provider of Medicare-certified skilled home health services 59% of HealthSouth's IRFs are located within a 30-mile radius of an Encompass location. Note: One of the 121 IRFs and two of the 179 adult home health locations are nonconsolidated. These locations are accounted for using the equity method of accounting.
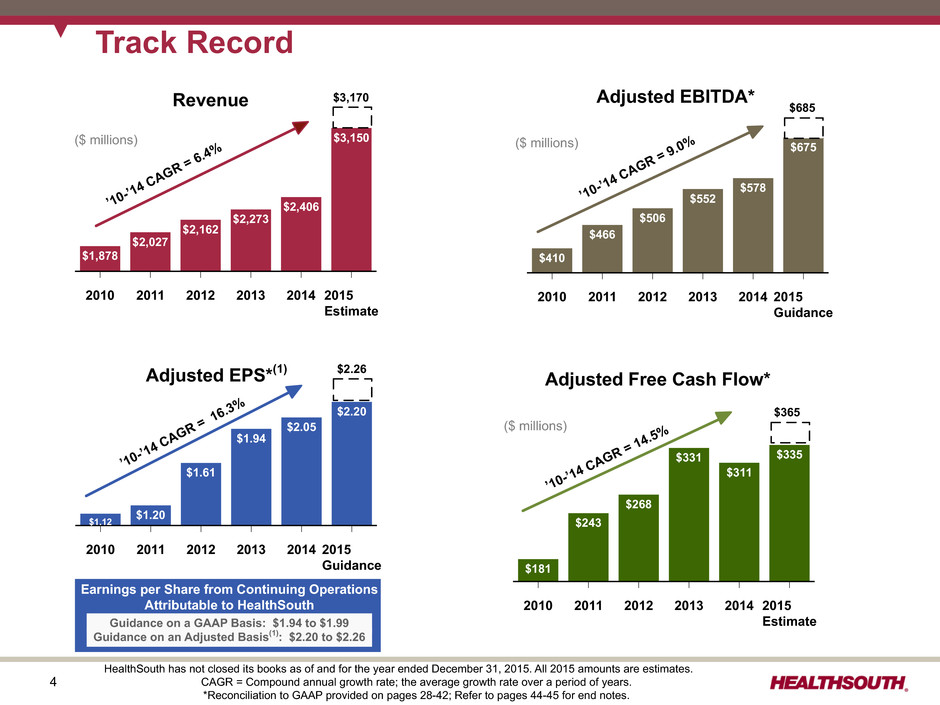
4 Adjusted EPS*(1) Track Record 2010 2011 2012 2013 2014 2015 Estimate $1,878 $2,027 $2,162 $2,273 $2,406 $3,150($ millions) 2010 2011 2012 2013 2014 2015 Guidance $410 $466 $506 $552 $578 $675 ’10-’14 CAGR = 9.0 %($ millions) ’10-’14 CAGR = 6.4 % Adjusted EBITDA* HealthSouth has not closed its books as of and for the year ended December 31, 2015. All 2015 amounts are estimates. CAGR = Compound annual growth rate; the average growth rate over a period of years. *Reconciliation to GAAP provided on pages 28-42; Refer to pages 44-45 for end notes. 2010 2011 2012 2013 2014 2015 Guidance $1.12 $1.20 $1.61 $1.94 $2.05 $2.20 ’10-’14 CAGR = 16.3 % Earnings per Share from Continuing Operations Attributable to HealthSouth Guidance on a GAAP Basis: $1.94 to $1.99 Guidance on an Adjusted Basis(1): $2.20 to $2.26 $3,170 $685 $2.26 2010 2011 2012 2013 2014 2015 Estimate $181 $243 $268 $331 $311 $335 Adjusted Free Cash Flow* ($ millions) $365 ’10-’14 CAGR = 14.5 % Revenue
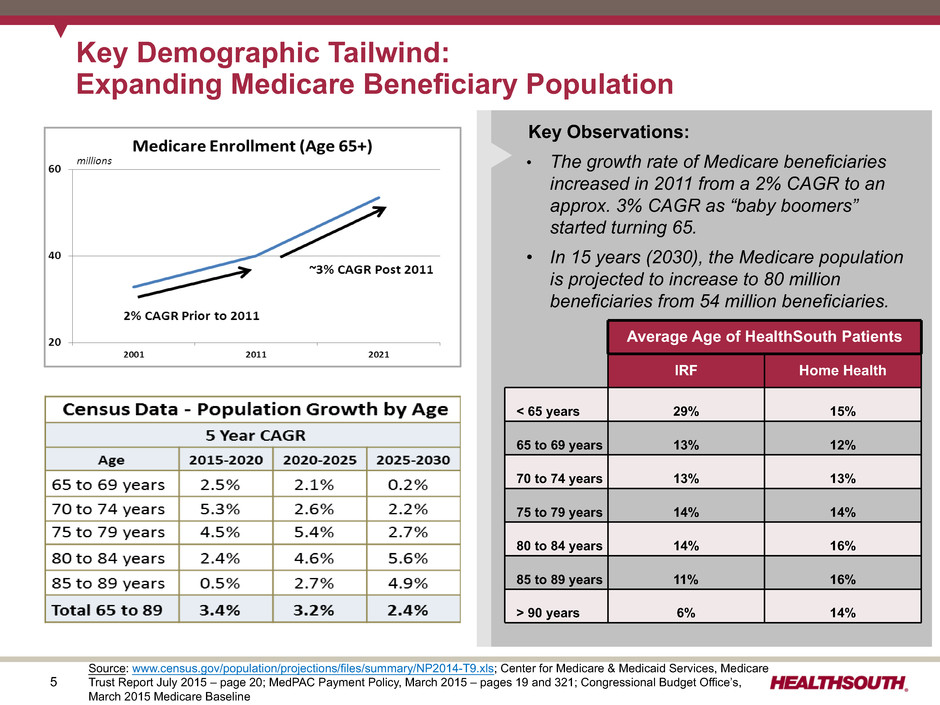
5 Key Demographic Tailwind: Expanding Medicare Beneficiary Population Key Observations: • The growth rate of Medicare beneficiaries increased in 2011 from a 2% CAGR to an approx. 3% CAGR as “baby boomers” started turning 65. • In 15 years (2030), the Medicare population is projected to increase to 80 million beneficiaries from 54 million beneficiaries. Source: www.census.gov/population/projections/files/summary/NP2014-T9.xls; Center for Medicare & Medicaid Services, Medicare Trust Report July 2015 – page 20; MedPAC Payment Policy, March 2015 – pages 19 and 321; Congressional Budget Office’s, March 2015 Medicare Baseline Average Age of HealthSouth Patients IRF Home Health < 65 years 29% 15% 65 to 69 years 13% 12% 70 to 74 years 13% 13% 75 to 79 years 14% 14% 80 to 84 years 14% 16% 85 to 89 years 11% 16% > 90 years 6% 14%
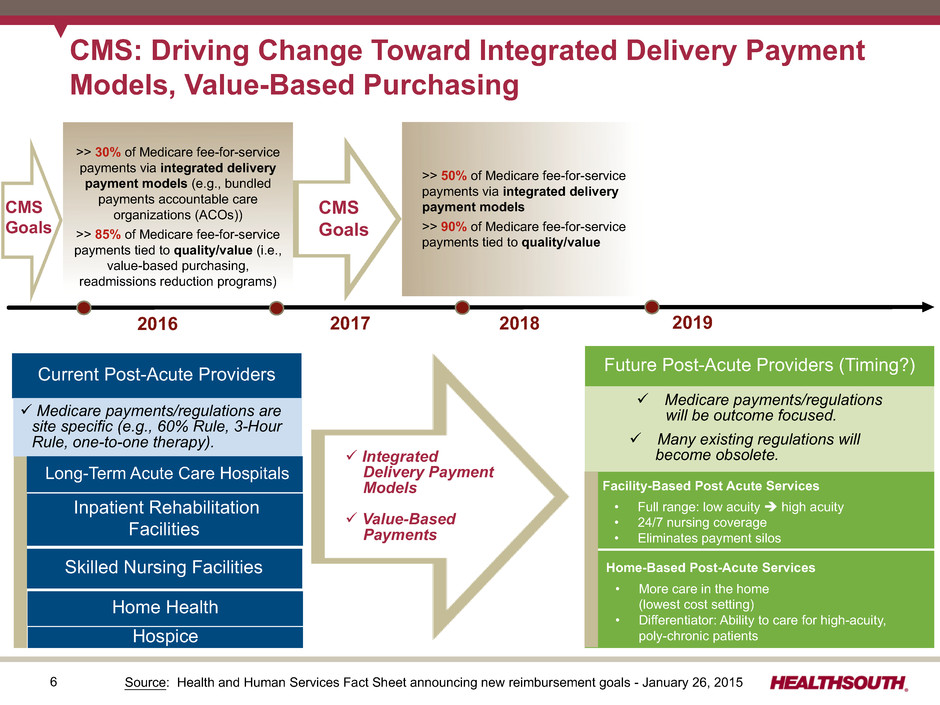
6 CMS: Driving Change Toward Integrated Delivery Payment Models, Value-Based Purchasing Future Post-Acute Providers (Timing?) Inpatient Rehabilitation Facilities Home Health Skilled Nursing Facilities Hospice • Full range: low acuity è high acuity • 24/7 nursing coverage • Eliminates payment silos Home-Based Post-Acute Services • More care in the home (lowest cost setting) • Differentiator: Ability to care for high-acuity, poly-chronic patients >> 50% of Medicare fee-for-service payments via integrated delivery payment models >> 90% of Medicare fee-for-service payments tied to quality/value ü Integrated Delivery Payment Models ü Value-Based Payments Current Post-Acute Providers ü Medicare payments/regulations are site specific (e.g., 60% Rule, 3-Hour Rule, one-to-one therapy). ü Medicare payments/regulations will be outcome focused. ü Many existing regulations will become obsolete. Facility-Based Post Acute Services >> 30% of Medicare fee-for-service payments via integrated delivery payment models (e.g., bundled payments accountable care organizations (ACOs)) >> 85% of Medicare fee-for-service payments tied to quality/value (i.e., value-based purchasing, readmissions reduction programs) 2017 Long-Term Acute Care Hospitals 2016 Source: Health and Human Services Fact Sheet announcing new reimbursement goals - January 26, 2015 CMS Goals 2018 2019 CMS Goals
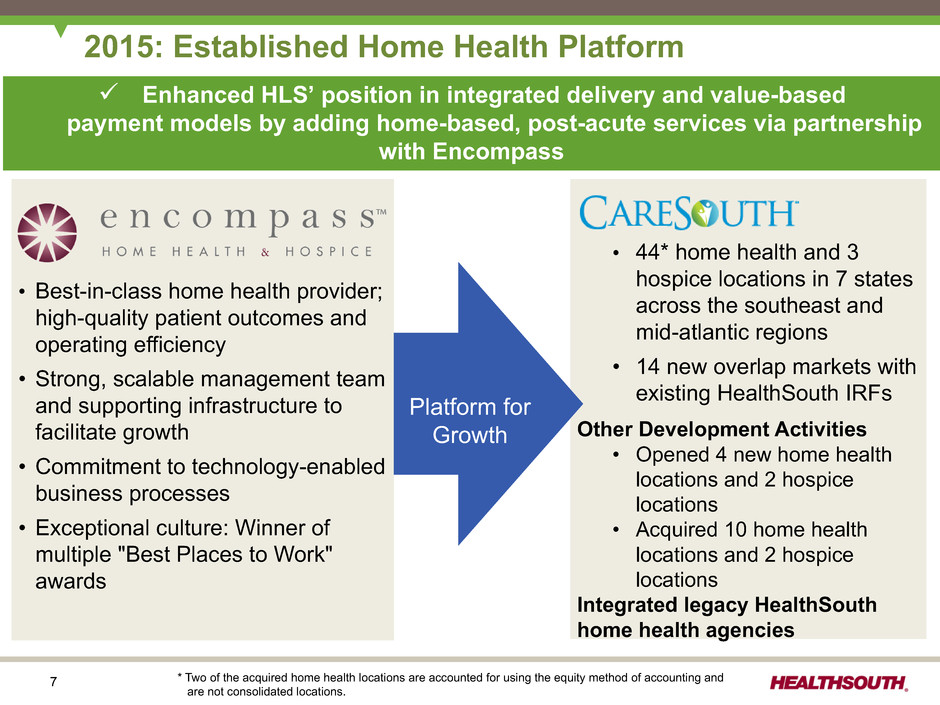
7 2015: Established Home Health Platform ü Enhanced HLS’ position in integrated delivery and value-based payment models by adding home-based, post-acute services via partnership with Encompass • Best-in-class home health provider; high-quality patient outcomes and operating efficiency • Strong, scalable management team and supporting infrastructure to facilitate growth • Commitment to technology-enabled business processes • Exceptional culture: Winner of multiple "Best Places to Work" awards • 44* home health and 3 hospice locations in 7 states across the southeast and mid-atlantic regions • 14 new overlap markets with existing HealthSouth IRFs Other Development Activities • Opened 4 new home health locations and 2 hospice locations • Acquired 10 home health locations and 2 hospice locations Integrated legacy HealthSouth home health agencies * Two of the acquired home health locations are accounted for using the equity method of accounting and are not consolidated locations. Platform for Growth
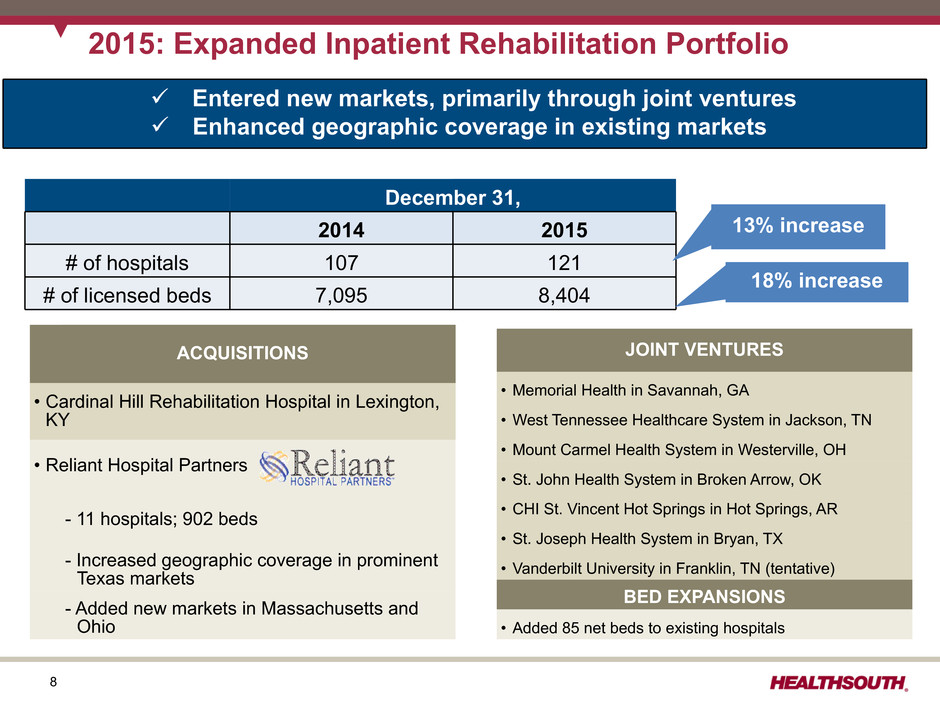
8 2015: Expanded Inpatient Rehabilitation Portfolio ü Entered new markets, primarily through joint ventures ü Enhanced geographic coverage in existing markets December 31, 2014 2015 # of hospitals 107 121 # of licensed beds 7,095 8,404 ACQUISITIONS • Cardinal Hill Rehabilitation Hospital in Lexington, KY • Reliant Hospital Partners - 11 hospitals; 902 beds - Increased geographic coverage in prominent Texas markets - Added new markets in Massachusetts and Ohio JOINT VENTURES • Memorial Health in Savannah, GA • West Tennessee Healthcare System in Jackson, TN • Mount Carmel Health System in Westerville, OH • St. John Health System in Broken Arrow, OK • CHI St. Vincent Hot Springs in Hot Springs, AR • St. Joseph Health System in Bryan, TX • Vanderbilt University in Franklin, TN (tentative) BED EXPANSIONS • Added 85 net beds to existing hospitals 13% increase 18% increase
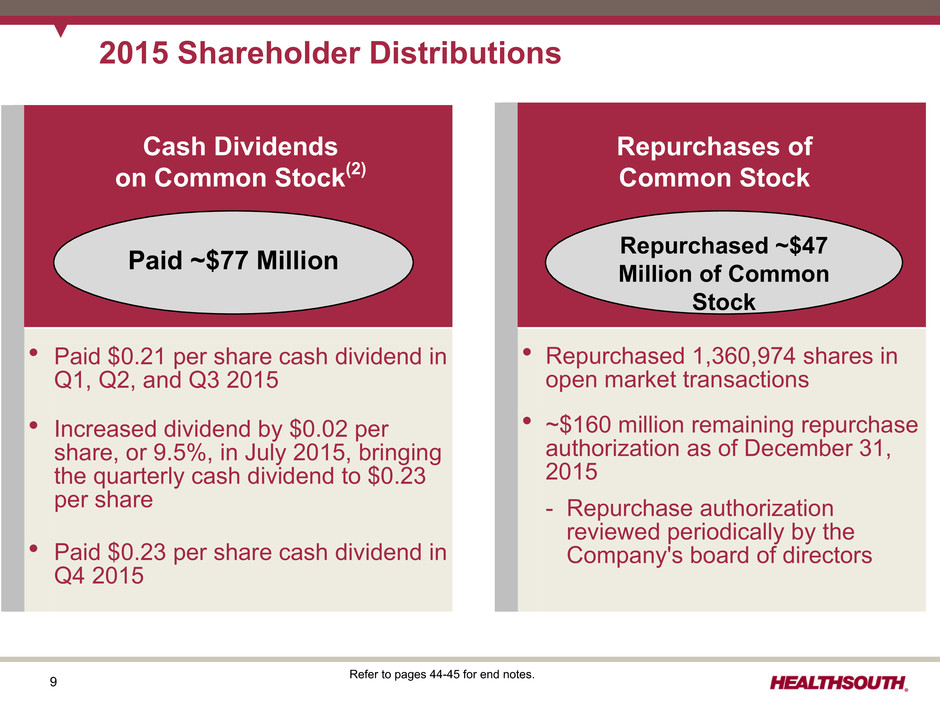
9 __ Cash Dividends on Common Stock(2) Earnings per Share from Continuing Operations Attributable to HealthSouth 2015 Shareholder Distributions l Paid $0.21 per share cash dividend in Q1, Q2, and Q3 2015 l Increased dividend by $0.02 per share, or 9.5%, in July 2015, bringing the quarterly cash dividend to $0.23 per share l Paid $0.23 per share cash dividend in Q4 2015 Repurchases of Common Stock l Repurchased 1,360,974 shares in open market transactions l ~$160 million remaining repurchase authorization as of December 31, 2015 - Repurchase authorization reviewed periodically by the Company's board of directors Paid ~$77 Million Repurchased ~$47Million of Common Stock Refer to pages 44-45 for end notes.
10 $675 million to $685 million $2.20 to $2.26 Adjusted EBITDA Adjusted Earnings per Share from Continuing Operations Attributable to HealthSouth(1) Guidance $3,150 million to $3,170 million Net Operating Revenues 2015 2016 Net Operating Revenues $3,550 million to $3,650 million Adjusted EBITDA $765 million to $785 million Adjusted Earnings per Share from Continuing Operations Attributable to HealthSouth(1) $2.28 to $2.40 12% to 15% Projected Year-Over- Year Growth 13% to 15% 3% to 6% HealthSouth has not closed its books as of and for the year ended December 31, 2015. All 2015 amounts are estimates. Refer to pages 44-45 for end notes.
11 2016 Guidance Considerations Inpatient Rehabilitation • Full-year contribution from Reliant ü Transitioning to HLS business model • Continued evolution of payor mix ü Managed care and Medicaid increases expected to moderate in 2016 • Estimated 1.6% increase in Medicare revenue per discharge • Moderating increase in group medical expense (5-10% increase) • Bad debt expense relatively level as percent of revenue Home Health and Hospice • Full-year contribution from CareSouth ü Transitioning to Encompass business model • 2015 openings and acquisitions • Increased discharge capture from HLS IRFs • Inclusive of $30-40 million of acquisitions in 2016

12 Adjusted Free Cash Flow*(3) and Tax Assumptions Certain Cash Flow Items (millions) 2016 Assumptions 2015 Estimates 2014 Actual • Cash interest expense (net of amortization of debt discounts and fees) $165 to $175 ~$130 $96.5 • Cash payments for taxes, net of refunds $20 to $40 ~$12 $16.4 • Working Capital and Other $60 to $80 $90 to $110 $55.0 • Maintenance CAPEX(4) $95 to $110 ~$85 $92.0 • Dividends paid on preferred stock(5) $0 $3 $6.3 • Adjusted Free Cash Flow $360 to $445 $335 to $365 $311 HealthSouth has not closed its books as of and for the year ended December 31, 2015. All 2015 amounts are estimates. *Reconciliation to GAAP provided on page 42; Refer to pages 44-45 for end notes. Working capital increase in 2015 driven primarily by growth in accounts receivable Q4 2015 increase in accounts receivable impacted by timing issues that are expected to reverse in 2016 • staffing issues at the Company's largest MAC that resulted in delayed payments in Q4 • transition of billing for Reliant and Cardinal Hill in Q4 2015 GAAP Tax Considerations: • gross federal NOL of ~$393 million as of 9/30/15
13 Priorities for 2016 • Integrate Reliant and CareSouth ("pause" on additional large acquisitions) • Achieve organic growth at existing hospitals and home health/hospice agencies • Acquire and construct new hospitals and acquire and open new home health/hospice agencies GROWTH 2016 2015 2014 Assumptions Estimates Actuals (In Millions) IRF bed expansions $20 to $30 ~$25 $23.6 New IRF's - De novos 70 to 90 ~50 53.7 - Acquisitions TBD ~786 20.2 New home health and hospice acquisitions 30 to 40 ~200 674.6 $120 to $160, excluding IRF acquisitions ~$1,061 $772.1 Growth in Core Business Highest Priorit y
14 IRF Growth Pipeline Typical Development Pipeline Factors: • CON process/timeline • Fair market valuation of contributed assets (joint ventures only) • Partnership complexities HLS Value Proposition CAPEX to build free-standing IRF, freeing up space for medical / surgical beds Increased acute care hospital flow-through by taking appropriate higher acuity patients faster than other post- acute settings Proprietary rehabilitation-specific clinical information system ("ACE-IT") integrated with acute care hospitals' clinical information systems to facilitate patient transfers, reduce readmissions, and enhance outcomes Proprietary real-time performance management systems (care management, labor productivity, quality reporting, therapy analysis and expense management) to improve profitability Proven track record of efficient management of regulatory process (CON, licensure, occupancy, etc.) Experienced transaction/integration team National leader in post-acute policy activities Disciplined Approach to Joint Ventures / De Novos / Acquisitions – Attractive demographics – Strong forecasted growth in the number of patients requiring rehab-level of care – Presence of other IRFs; SNFs – Bed need – Geographic proximity to other HLS IRFs and Encompass agencies – Willingness of seller; interest of joint venture partners – HLS confidence in ability to close No. of Projects Exploratory / CA Executed 40 - 50 Actively Working 10 - 12 Near-term Actionable 4 - 6 CA = confidentiality agreement
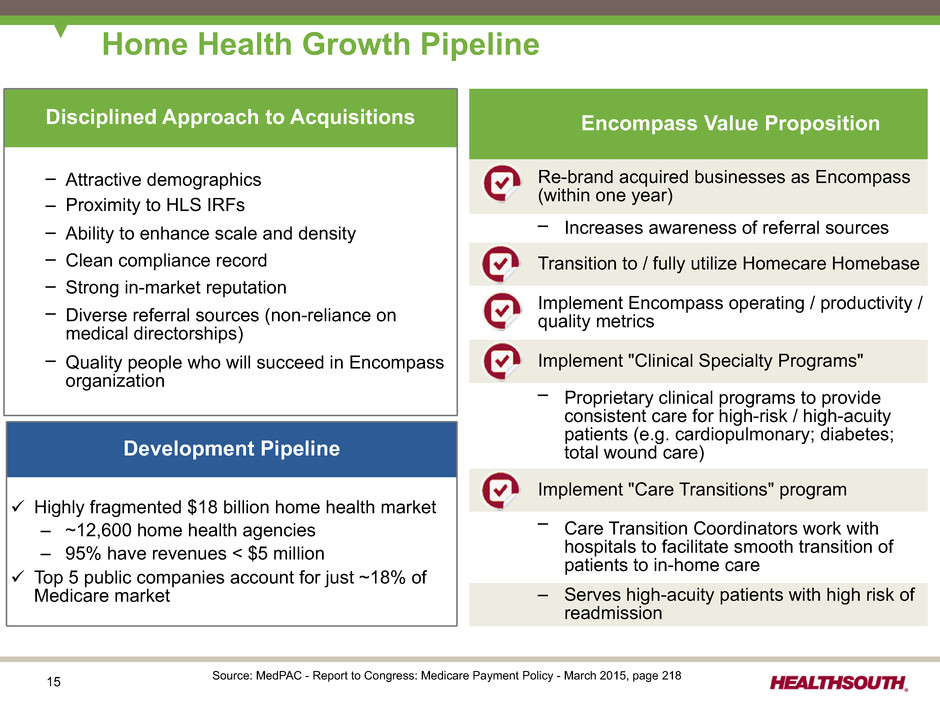
15 Home Health Growth Pipeline Development Pipeline Encompass Value Proposition Re-brand acquired businesses as Encompass (within one year) – Increases awareness of referral sources Transition to / fully utilize Homecare Homebase Implement Encompass operating / productivity / quality metrics Implement "Clinical Specialty Programs" – Proprietary clinical programs to provide consistent care for high-risk / high-acuity patients (e.g. cardiopulmonary; diabetes; total wound care) Implement "Care Transitions" program – Care Transition Coordinators work with hospitals to facilitate smooth transition of patients to in-home care – Serves high-acuity patients with high risk of readmission Disciplined Approach to Acquisitions – Attractive demographics – Proximity to HLS IRFs – Ability to enhance scale and density – Clean compliance record – Strong in-market reputation – Diverse referral sources (non-reliance on medical directorships) – Quality people who will succeed in Encompass organization Development Pipeline ü Highly fragmented $18 billion home health market – ~12,600 home health agencies – 95% have revenues < $5 million ü Top 5 public companies account for just ~18% of Medicare market Source: MedPAC - Report to Congress: Medicare Payment Policy - March 2015, page 218
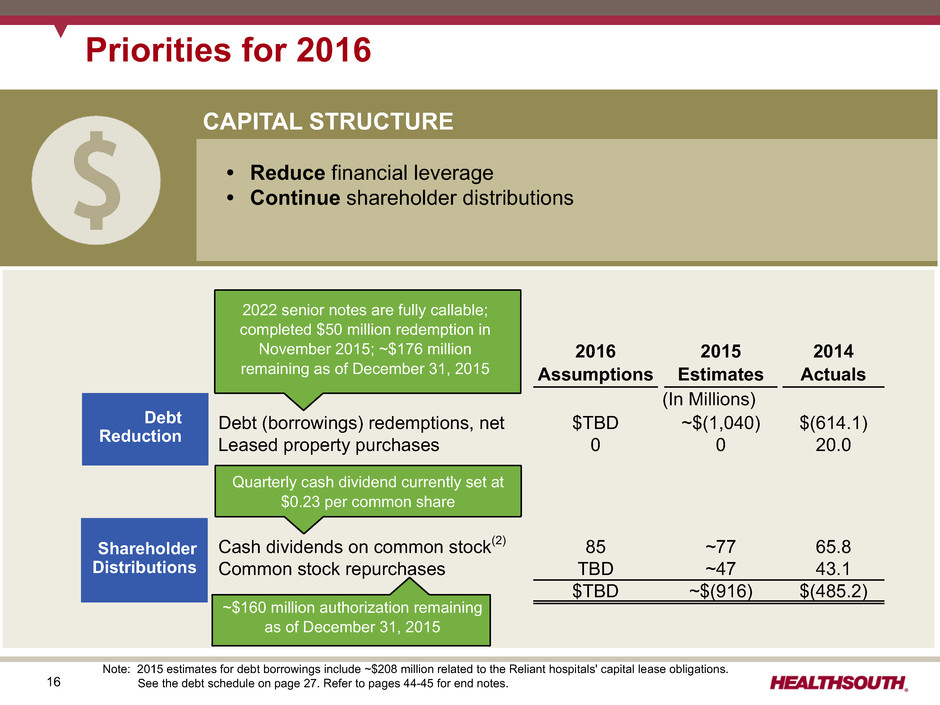
16 Priorities for 2016 • Reduce financial leverage • Continue shareholder distributions CAPITAL STRUCTURE 2016 2015 2014 Assumptions Estimates Actuals (In Millions) Debt (borrowings) redemptions, net $TBD ~$(1,040) $(614.1) Leased property purchases 0 0 20.0 Cash dividends on common stock(2) 85 ~77 65.8 Common stock repurchases TBD ~47 43.1 $TBD ~$(916) $(485.2) Shareholder Distributions Debt Reduction Note: 2015 estimates for debt borrowings include ~$208 million related to the Reliant hospitals' capital lease obligations. See the debt schedule on page 27. Refer to pages 44-45 for end notes. 2022 senior notes are fully callable; completed $50 million redemption in November 2015; ~$176 million remaining as of December 31, 2015 Quarterly cash dividend currently set at $0.23 per common share ~$160 million authorization remaining as of December 31, 2015
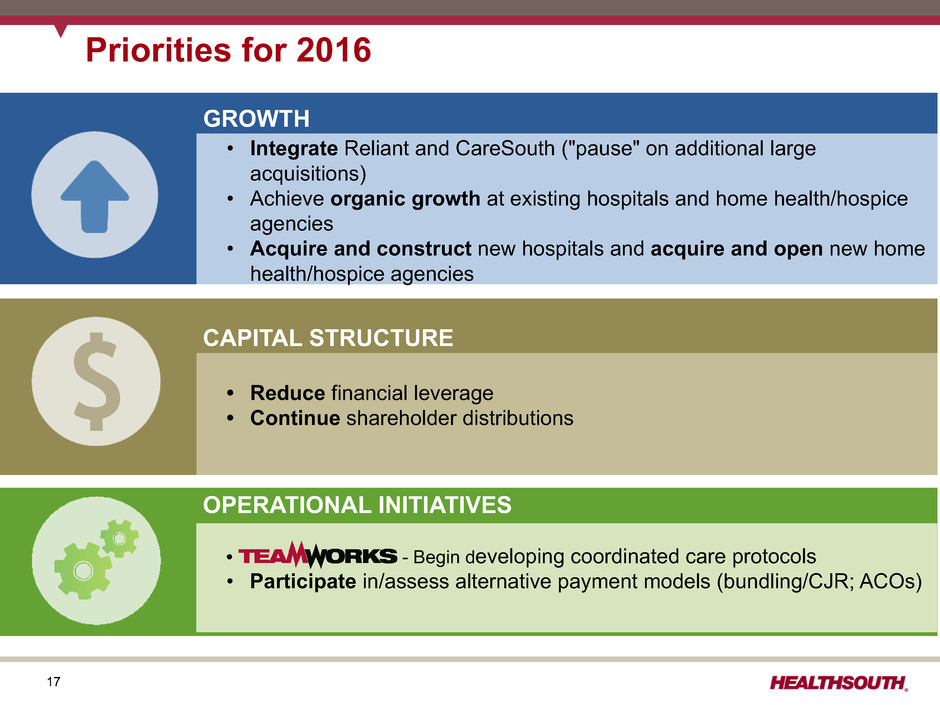
17 Priorities for 2016 • Integrate Reliant and CareSouth ("pause" on additional large acquisitions) • Achieve organic growth at existing hospitals and home health/hospice agencies • Acquire and construct new hospitals and acquire and open new home health/hospice agencies • Reduce financial leverage • Continue shareholder distributions GROWTH OPERATIONAL INITIATIVES • - Begin developing coordinated care protocols • Participate in/assess alternative payment models (bundling/CJR; ACOs) CAPITAL STRUCTURE
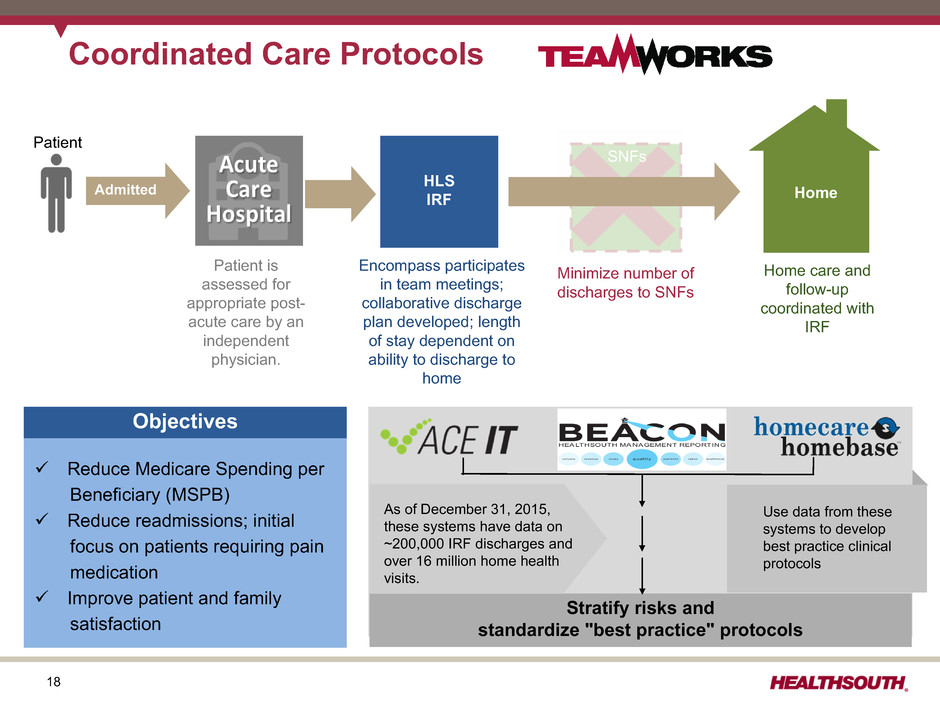
18 Coordinated Care Protocols Admitted HLSIRF Patient SNFs Home Objectives Stratify risks and standardize "best practice" protocols ü Reduce Medicare Spending per Beneficiary (MSPB) ü Reduce readmissions; initial focus on patients requiring pain medication ü Improve patient and family satisfaction As of December 31, 2015, these systems have data on ~200,000 IRF discharges and over 16 million home health visits. Use data from these systems to develop best practice clinical protocols Patient is assessed for appropriate post- acute care by an independent physician. Encompass participates in team meetings; collaborative discharge plan developed; length of stay dependent on ability to discharge to home Minimize number of discharges to SNFs Home care and follow-up coordinated with IRF
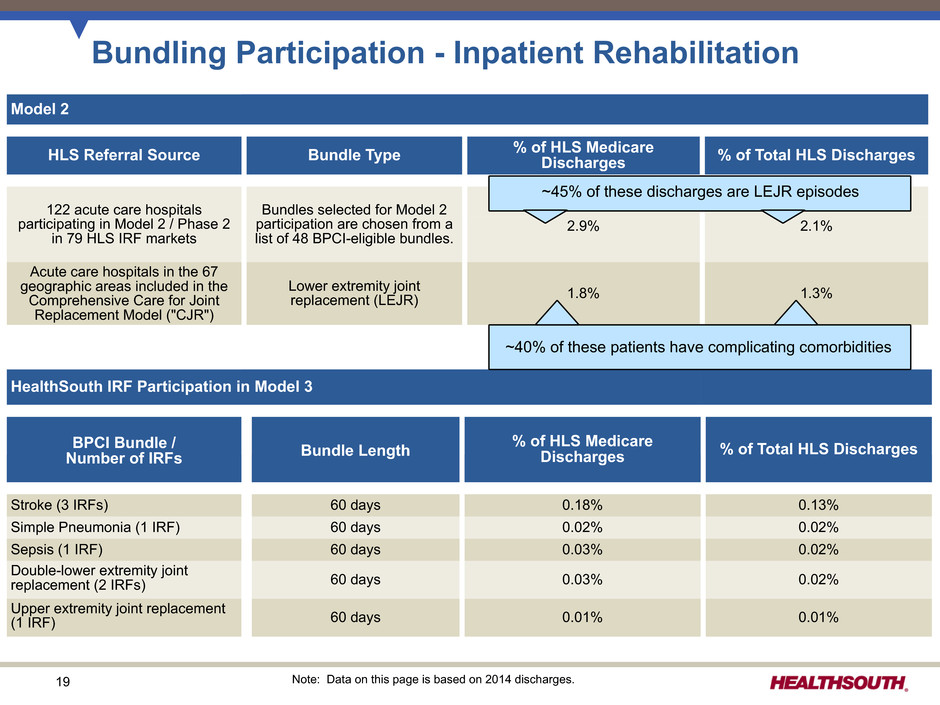
19 Bundling Participation - Inpatient Rehabilitation Model 2 HLS Referral Source Bundle Type % of HLS MedicareDischarges % of Total HLS Discharges 122 acute care hospitals participating in Model 2 / Phase 2 in 79 HLS IRF markets Bundles selected for Model 2 participation are chosen from a list of 48 BPCI-eligible bundles. 2.9% 2.1% Acute care hospitals in the 67 geographic areas included in the Comprehensive Care for Joint Replacement Model ("CJR") Lower extremity joint replacement (LEJR) 1.8% 1.3% HealthSouth IRF Participation in Model 3 BPCI Bundle / Number of IRFs Bundle Length % of HLS Medicare Discharges % of Total HLS Discharges Stroke (3 IRFs) 60 days 0.18% 0.13% Simple Pneumonia (1 IRF) 60 days 0.02% 0.02% Sepsis (1 IRF) 60 days 0.03% 0.02% Double-lower extremity joint replacement (2 IRFs) 60 days 0.03% 0.02% Upper extremity joint replacement (1 IRF) 60 days 0.01% 0.01% Note: Data on this page is based on 2014 discharges. ~40% of these patients have complicating comorbidities ~45% of these discharges are LEJR episodes
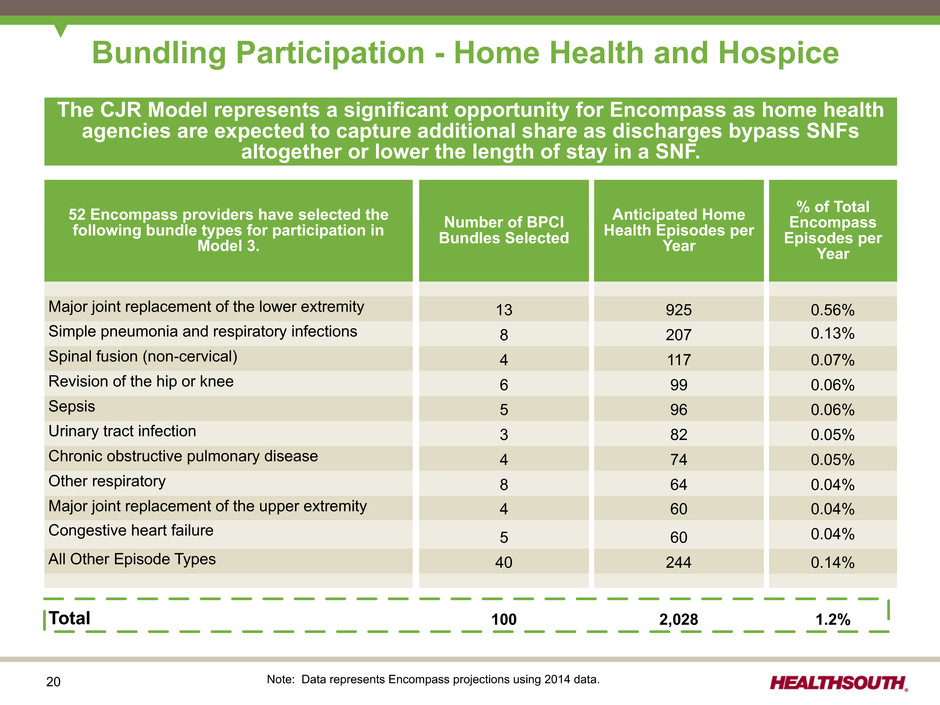
20 Bundling Participation - Home Health and Hospice The CJR Model represents a significant opportunity for Encompass as home health agencies are expected to capture additional share as discharges bypass SNFs altogether or lower the length of stay in a SNF. 52 Encompass providers have selected the following bundle types for participation in Model 3. Number of BPCI Bundles Selected Anticipated Home Health Episodes per Year % of Total Encompass Episodes per Year Major joint replacement of the lower extremity 13 925 0.56% Simple pneumonia and respiratory infections 8 207 0.13% Spinal fusion (non-cervical) 4 117 0.07% Revision of the hip or knee 6 99 0.06% Sepsis 5 96 0.06% Urinary tract infection 3 82 0.05% Chronic obstructive pulmonary disease 4 74 0.05% Other respiratory 8 64 0.04% Major joint replacement of the upper extremity 4 60 0.04% Congestive heart failure 5 60 0.04% All Other Episode Types 40 244 0.14% Total 100 2,028 1.2% Note: Data represents Encompass projections using 2014 data.
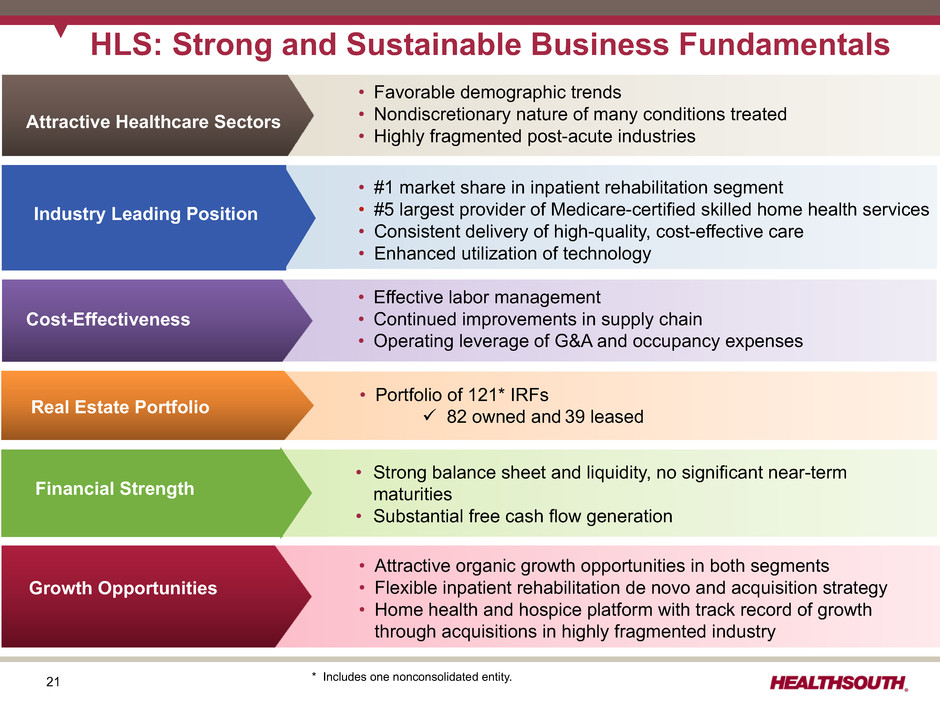
21 HLS: Strong and Sustainable Business Fundamentals • Effective labor management • Continued improvements in supply chain • Operating leverage of G&A and occupancy expenses Cost-Effectiveness • Strong balance sheet and liquidity, no significant near-term maturities • Substantial free cash flow generation • #1 market share in inpatient rehabilitation segment • #5 largest provider of Medicare-certified skilled home health services • Consistent delivery of high-quality, cost-effective care • Enhanced utilization of technology • Attractive organic growth opportunities in both segments • Flexible inpatient rehabilitation de novo and acquisition strategy • Home health and hospice platform with track record of growth through acquisitions in highly fragmented industry • Portfolio of 121* IRFs ü 82 owned and 39 leasedReal Estate Portfolio Attractive Healthcare Sectors Growth Opportunities Cost-Effectiveness • Favorable demographic trends • Nondiscretionary nature of many conditions treated • Highly fragmented post-acute industries Industry Leading Position Financial Strength * Includes one nonconsolidated entity.
22 Appendix
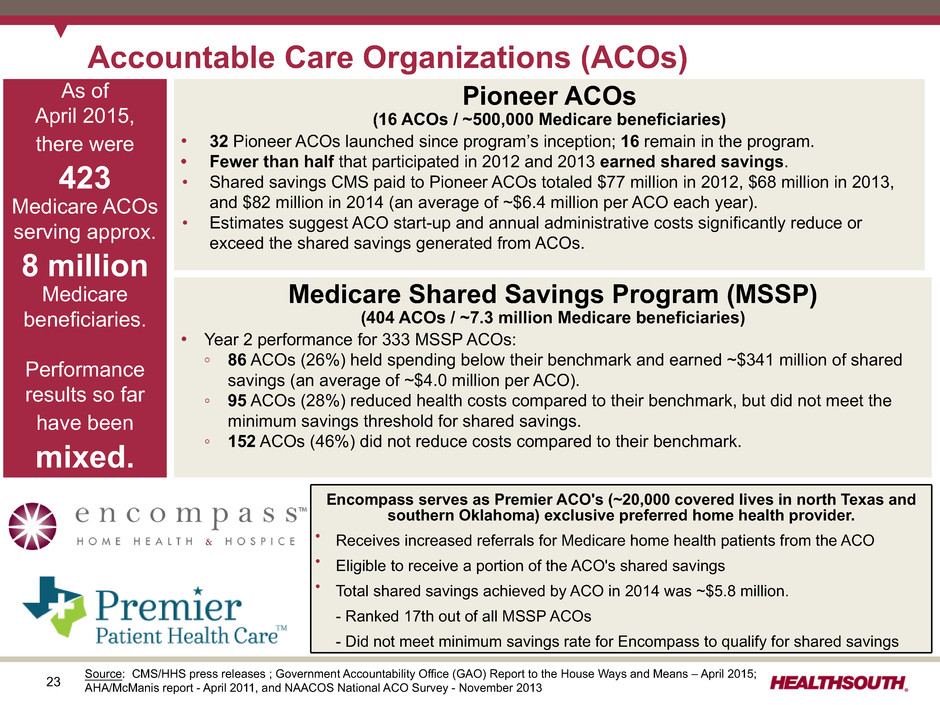
23 Accountable Care Organizations (ACOs) As of April 2015, there were 423 Medicare ACOs serving approx. 8 million Medicare beneficiaries. Performance results so far have been mixed. Pioneer ACOs (16 ACOs / ~500,000 Medicare beneficiaries) • 32 Pioneer ACOs launched since program’s inception; 16 remain in the program. • Fewer than half that participated in 2012 and 2013 earned shared savings. • Shared savings CMS paid to Pioneer ACOs totaled $77 million in 2012, $68 million in 2013, and $82 million in 2014 (an average of ~$6.4 million per ACO each year). • Estimates suggest ACO start-up and annual administrative costs significantly reduce or exceed the shared savings generated from ACOs. Medicare Shared Savings Program (MSSP) (404 ACOs / ~7.3 million Medicare beneficiaries) • Year 2 performance for 333 MSSP ACOs: ◦ 86 ACOs (26%) held spending below their benchmark and earned ~$341 million of shared savings (an average of ~$4.0 million per ACO). ◦ 95 ACOs (28%) reduced health costs compared to their benchmark, but did not meet the minimum savings threshold for shared savings. ◦ 152 ACOs (46%) did not reduce costs compared to their benchmark. Source: CMS/HHS press releases ; Government Accountability Office (GAO) Report to the House Ways and Means – April 2015; AHA/McManis report - April 2011, and NAACOS National ACO Survey - November 2013 Encompass serves as Premier ACO's (~20,000 covered lives in north Texas and southern Oklahoma) exclusive preferred home health provider. Ÿ Receives increased referrals for Medicare home health patients from the ACO Ÿ Eligible to receive a portion of the ACO's shared savings Ÿ Total shared savings achieved by ACO in 2014 was ~$5.8 million. - Ranked 17th out of all MSSP ACOs - Did not meet minimum savings rate for Encompass to qualify for shared savings
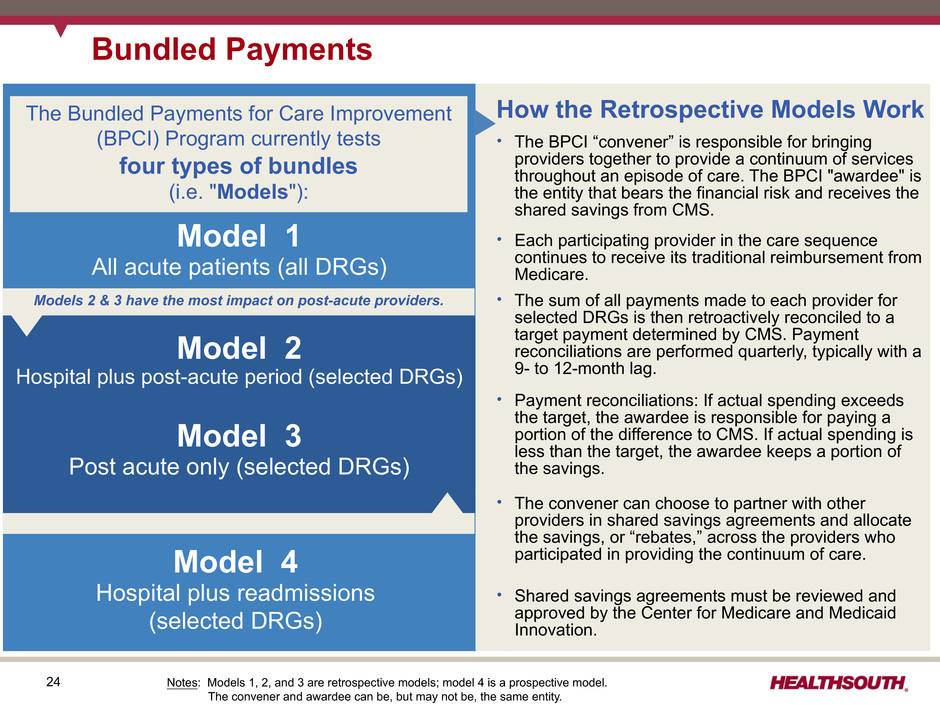
24 Bundled Payments How the Retrospective Models Work Ÿ The BPCI “convener” is responsible for bringing providers together to provide a continuum of services throughout an episode of care. The BPCI "awardee" is the entity that bears the financial risk and receives the shared savings from CMS. Ÿ Each participating provider in the care sequence continues to receive its traditional reimbursement from Medicare. Ÿ The sum of all payments made to each provider for selected DRGs is then retroactively reconciled to a target payment determined by CMS. Payment reconciliations are performed quarterly, typically with a 9- to 12-month lag. Ÿ Payment reconciliations: If actual spending exceeds the target, the awardee is responsible for paying a portion of the difference to CMS. If actual spending is less than the target, the awardee keeps a portion of the savings. Ÿ The convener can choose to partner with other providers in shared savings agreements and allocate the savings, or “rebates,” across the providers who participated in providing the continuum of care. Ÿ Shared savings agreements must be reviewed and approved by the Center for Medicare and Medicaid Innovation. Model 1 All acute patients (all DRGs) The Bundled Payments for Care Improvement (BPCI) Program currently tests four types of bundles (i.e. "Models"): Models 2 & 3 have the most impact on post-acute providers. Model 2 Hospital plus post-acute period (selected DRGs) Model 3 Post acute only (selected DRGs) Model 4 Hospital plus readmissions (selected DRGs) Notes: Models 1, 2, and 3 are retrospective models; model 4 is a prospective model. The convener and awardee can be, but may not be, the same entity.
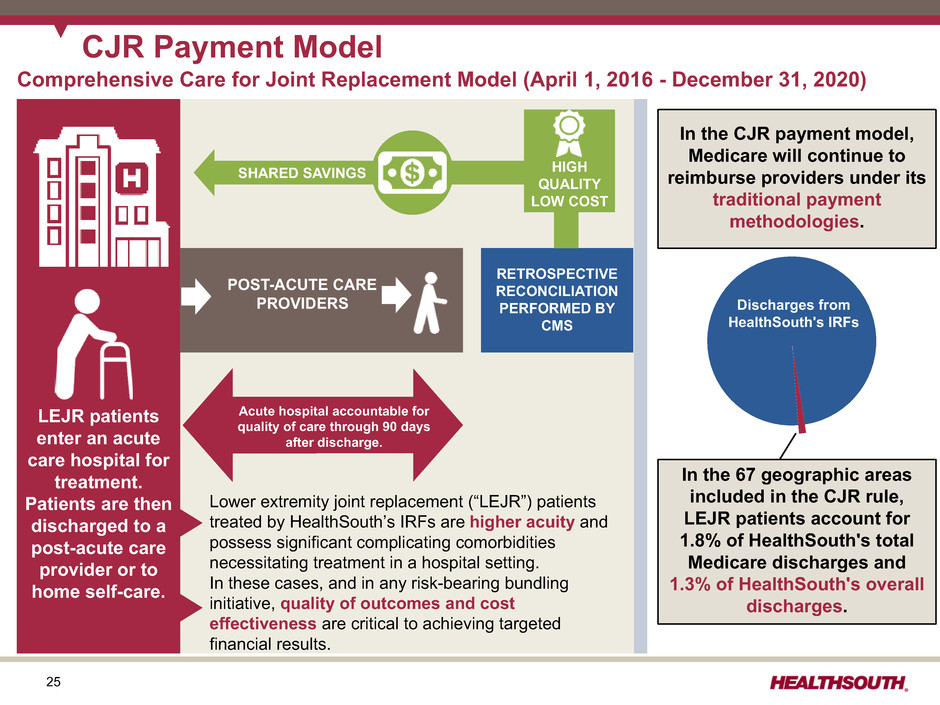
25 CJR Payment Model In the 67 geographic areas included in the CJR rule, LEJR patients account for 1.8% of HealthSouth's total Medicare discharges and 1.3% of HealthSouth's overall discharges. Discharges from HealthSouth's IRFs In the CJR payment model, Medicare will continue to reimburse providers under its traditional payment methodologies. Comprehensive Care for Joint Replacement Model (April 1, 2016 - December 31, 2020) LEJR patients enter an acute care hospital for treatment. Patients are then discharged to a post-acute care provider or to home self-care. RETROSPECTIVE RECONCILIATION PERFORMED BY CMS HIGH QUALITY LOW COST POST-ACUTE CARE PROVIDERS SHARED SAVINGS Lower extremity joint replacement (“LEJR”) patients treated by HealthSouth’s IRFs are higher acuity and possess significant complicating comorbidities necessitating treatment in a hospital setting. In these cases, and in any risk-bearing bundling initiative, quality of outcomes and cost effectiveness are critical to achieving targeted financial results. Acute hospital accountable for quality of care through 90 days after discharge.
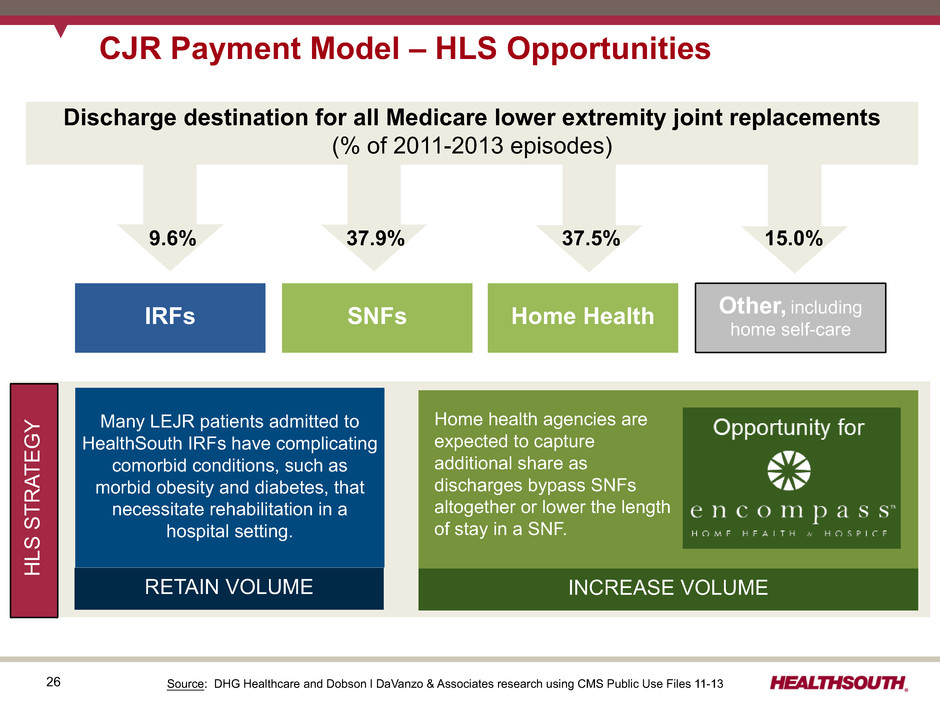
26 CJR Payment Model – HLS Opportunities Source: DHG Healthcare and Dobson l DaVanzo & Associates research using CMS Public Use Files 11-13 Discharge destination for all Medicare lower extremity joint replacements (% of 2011-2013 episodes) IRFs SNFs Home Health Other, includinghome self-care 9.6% 37.9% 15.0%37.5% HLS STR ATEG Y Many LEJR patients admitted to HealthSouth IRFs have complicating comorbid conditions, such as morbid obesity and diabetes, that necessitate rehabilitation in a hospital setting. RETAIN VOLUME INCREASE VOLUME Home health agencies are expected to capture additional share as discharges bypass SNFs altogether or lower the length of stay in a SNF.
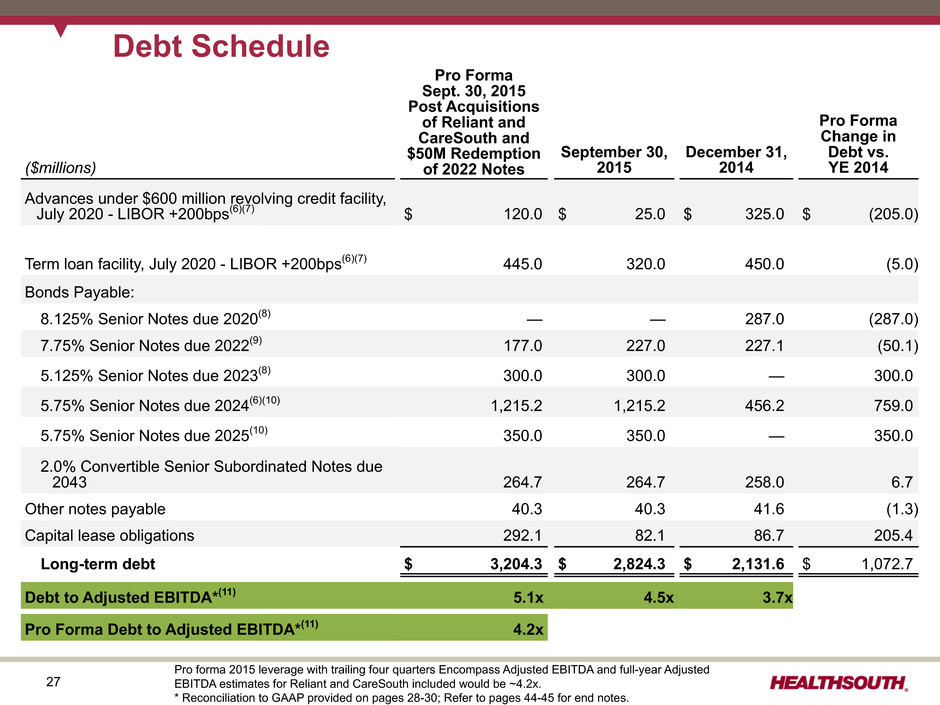
27 Debt Schedule Pro Forma Sept. 30, 2015 Post Acquisitions of Reliant and CareSouth and $50M Redemption of 2022 Notes Pro Forma Change in Debt vs. YE 2014($millions) September 30, 2015 December 31, 2014 Advances under $600 million revolving credit facility, July 2020 - LIBOR +200bps(6)(7) $ 120.0 $ 25.0 $ 325.0 $ (205.0) Term loan facility, July 2020 - LIBOR +200bps(6)(7) 445.0 320.0 450.0 (5.0) Bonds Payable: 8.125% Senior Notes due 2020(8) — — 287.0 (287.0) 7.75% Senior Notes due 2022(9) 177.0 227.0 227.1 (50.1) 5.125% Senior Notes due 2023(8) 300.0 300.0 — 300.0 5.75% Senior Notes due 2024(6)(10) 1,215.2 1,215.2 456.2 759.0 5.75% Senior Notes due 2025(10) 350.0 350.0 — 350.0 2.0% Convertible Senior Subordinated Notes due 2043 264.7 264.7 258.0 6.7 Other notes payable 40.3 40.3 41.6 (1.3) Capital lease obligations 292.1 82.1 86.7 205.4 Long-term debt $ 3,204.3 $ 2,824.3 $ 2,131.6 $ 1,072.7 Debt to Adjusted EBITDA*(11) 5.1x 4.5x 3.7x Pro Forma Debt to Adjusted EBITDA*(11) 4.2x Pro forma 2015 leverage with trailing four quarters Encompass Adjusted EBITDA and full-year Adjusted EBITDA estimates for Reliant and CareSouth included would be ~4.2x. * Reconciliation to GAAP provided on pages 28-30; Refer to pages 44-45 for end notes.
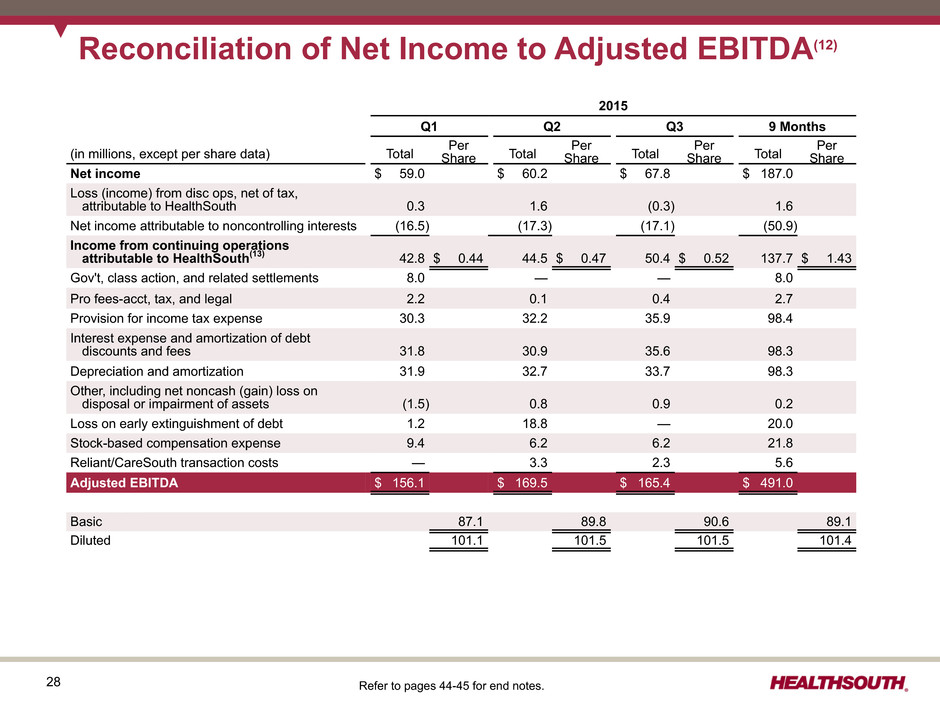
28 Reconciliation of Net Income to Adjusted EBITDA(12) 2015 Q1 Q2 Q3 9 Months (in millions, except per share data) Total PerShare Total Per Share Total Per Share Total Per Share Net income $ 59.0 $ 60.2 $ 67.8 $ 187.0 Loss (income) from disc ops, net of tax, attributable to HealthSouth 0.3 1.6 (0.3) 1.6 Net income attributable to noncontrolling interests (16.5) (17.3) (17.1) (50.9) Income from continuing operations attributable to HealthSouth(13) 42.8 $ 0.44 44.5 $ 0.47 50.4 $ 0.52 137.7 $ 1.43 Gov't, class action, and related settlements 8.0 — — 8.0 Pro fees-acct, tax, and legal 2.2 0.1 0.4 2.7 Provision for income tax expense 30.3 32.2 35.9 98.4 Interest expense and amortization of debt discounts and fees 31.8 30.9 35.6 98.3 Depreciation and amortization 31.9 32.7 33.7 98.3 Other, including net noncash (gain) loss on disposal or impairment of assets (1.5) 0.8 0.9 0.2 Loss on early extinguishment of debt 1.2 18.8 — 20.0 Stock-based compensation expense 9.4 6.2 6.2 21.8 Reliant/CareSouth transaction costs — 3.3 2.3 5.6 Adjusted EBITDA $ 156.1 $ 169.5 $ 165.4 $ 491.0 Weighted average common shares outstanding: Total Per Share 108.1 Basic 87.1 89.8 90.6 89.1 Diluted 101.1 101.5 101.5 101.4 Refer to pages 44-45 for end notes.
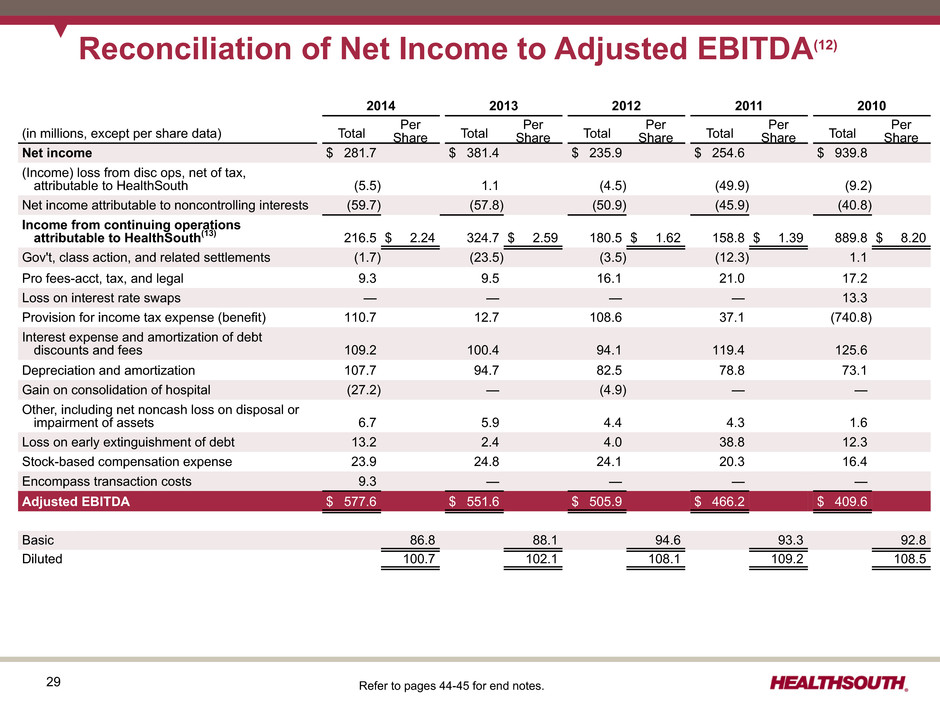
29 Reconciliation of Net Income to Adjusted EBITDA(12) 2014 2013 2012 2011 2010 (in millions, except per share data) Total PerShare Total Per Share Total Per Share Total Per Share Total Per Share Net income $ 281.7 $ 381.4 $ 235.9 $ 254.6 $ 939.8 (Income) loss from disc ops, net of tax, attributable to HealthSouth (5.5) 1.1 (4.5) (49.9) (9.2) Net income attributable to noncontrolling interests (59.7) (57.8) (50.9) (45.9) (40.8) Income from continuing operations attributable to HealthSouth(13) 216.5 $ 2.24 324.7 $ 2.59 180.5 $ 1.62 158.8 $ 1.39 889.8 $ 8.20 Gov't, class action, and related settlements (1.7) (23.5) (3.5) (12.3) 1.1 Pro fees-acct, tax, and legal 9.3 9.5 16.1 21.0 17.2 Loss on interest rate swaps — — — — 13.3 Provision for income tax expense (benefit) 110.7 12.7 108.6 37.1 (740.8) Interest expense and amortization of debt discounts and fees 109.2 100.4 94.1 119.4 125.6 Depreciation and amortization 107.7 94.7 82.5 78.8 73.1 Gain on consolidation of hospital (27.2) — (4.9) — — Other, including net noncash loss on disposal or impairment of assets 6.7 5.9 4.4 4.3 1.6 Loss on early extinguishment of debt 13.2 2.4 4.0 38.8 12.3 Stock-based compensation expense 23.9 24.8 24.1 20.3 16.4 Encompass transaction costs 9.3 — — — — Adjusted EBITDA $ 577.6 $ 551.6 $ 505.9 $ 466.2 $ 409.6 Weighted average common shares outstanding: Total Per Share 108.1 Basic 86.8 88.1 94.6 93.3 92.8 Diluted 100.7 102.1 108.1 109.2 108.5 Refer to pages 44-45 for end notes.
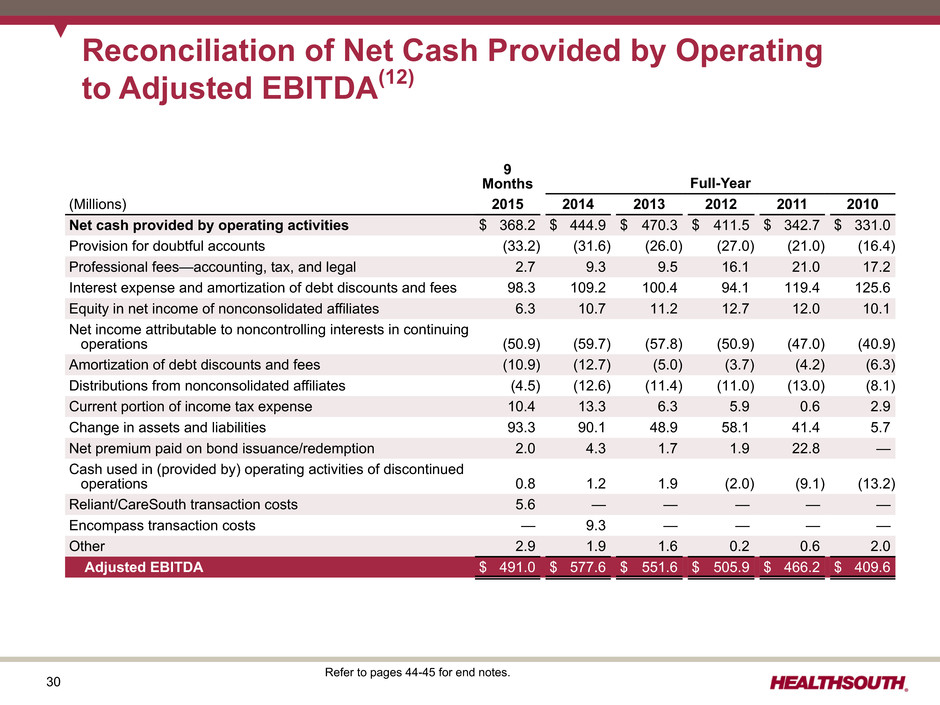
30 Reconciliation of Net Cash Provided by Operating to Adjusted EBITDA(12) 9 Months Full-Year (Millions) 2015 2014 2013 2012 2011 2010 Net cash provided by operating activities $ 368.2 $ 444.9 $ 470.3 $ 411.5 $ 342.7 $ 331.0 Provision for doubtful accounts (33.2) (31.6) (26.0) (27.0) (21.0) (16.4) Professional fees—accounting, tax, and legal 2.7 9.3 9.5 16.1 21.0 17.2 Interest expense and amortization of debt discounts and fees 98.3 109.2 100.4 94.1 119.4 125.6 Equity in net income of nonconsolidated affiliates 6.3 10.7 11.2 12.7 12.0 10.1 Net income attributable to noncontrolling interests in continuing operations (50.9) (59.7) (57.8) (50.9) (47.0) (40.9) Amortization of debt discounts and fees (10.9) (12.7) (5.0) (3.7) (4.2) (6.3) Distributions from nonconsolidated affiliates (4.5) (12.6) (11.4) (11.0) (13.0) (8.1) Current portion of income tax expense 10.4 13.3 6.3 5.9 0.6 2.9 Change in assets and liabilities 93.3 90.1 48.9 58.1 41.4 5.7 Net premium paid on bond issuance/redemption 2.0 4.3 1.7 1.9 22.8 — Cash used in (provided by) operating activities of discontinued operations 0.8 1.2 1.9 (2.0) (9.1) (13.2) Reliant/CareSouth transaction costs 5.6 — — — — — Encompass transaction costs — 9.3 — — — — Other 2.9 1.9 1.6 0.2 0.6 2.0 Adjusted EBITDA $ 491.0 $ 577.6 $ 551.6 $ 505.9 $ 466.2 $ 409.6 Refer to pages 44-45 for end notes.
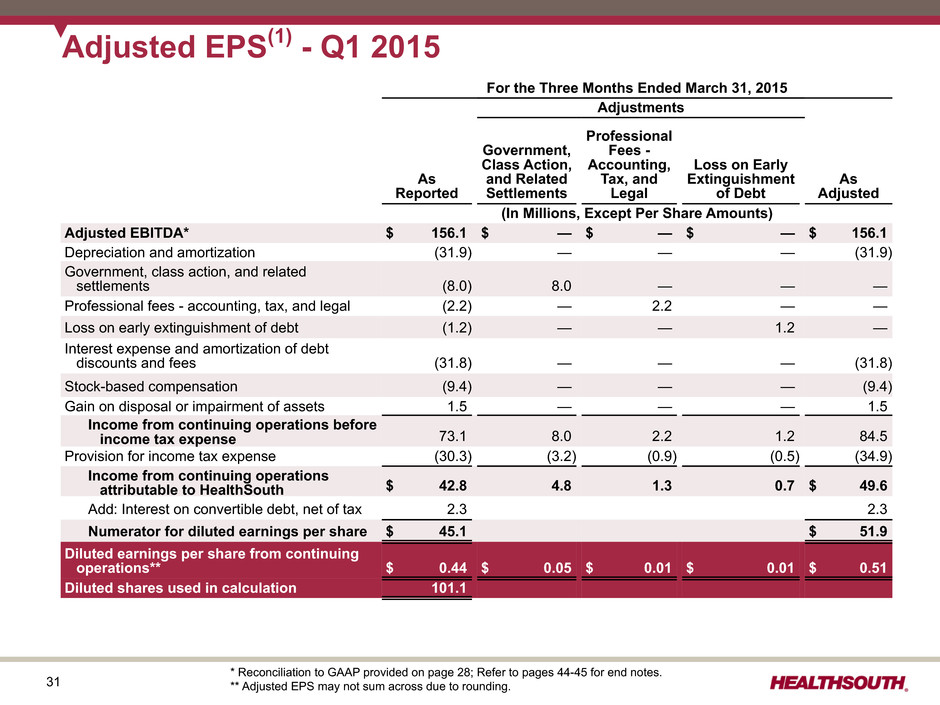
31 For the Three Months Ended March 31, 2015 Adjustments As Reported Government, Class Action, and Related Settlements Professional Fees - Accounting, Tax, and Legal Loss on Early Extinguishment of Debt As Adjusted (In Millions, Except Per Share Amounts) Adjusted EBITDA* $ 156.1 $ — $ — $ — $ 156.1 Depreciation and amortization (31.9) — — — (31.9) Government, class action, and related settlements (8.0) 8.0 — — — Professional fees - accounting, tax, and legal (2.2) — 2.2 — — Loss on early extinguishment of debt (1.2) — — 1.2 — Interest expense and amortization of debt discounts and fees (31.8) — — — (31.8) Stock-based compensation (9.4) — — — (9.4) Gain on disposal or impairment of assets 1.5 — — — 1.5 Income from continuing operations before income tax expense 73.1 8.0 2.2 1.2 84.5 Provision for income tax expense (30.3) (3.2) (0.9) (0.5) (34.9) Income from continuing operations attributable to HealthSouth $ 42.8 4.8 1.3 0.7 $ 49.6 Add: Interest on convertible debt, net of tax 2.3 2.3 Numerator for diluted earnings per share $ 45.1 $ 51.9 Diluted earnings per share from continuing operations** $ 0.44 $ 0.05 $ 0.01 $ 0.01 $ 0.51 Diluted shares used in calculation 101.1 Adjusted EPS(1) - Q1 2015 * Reconciliation to GAAP provided on page 28; Refer to pages 44-45 for end notes. ** Adjusted EPS may not sum across due to rounding.
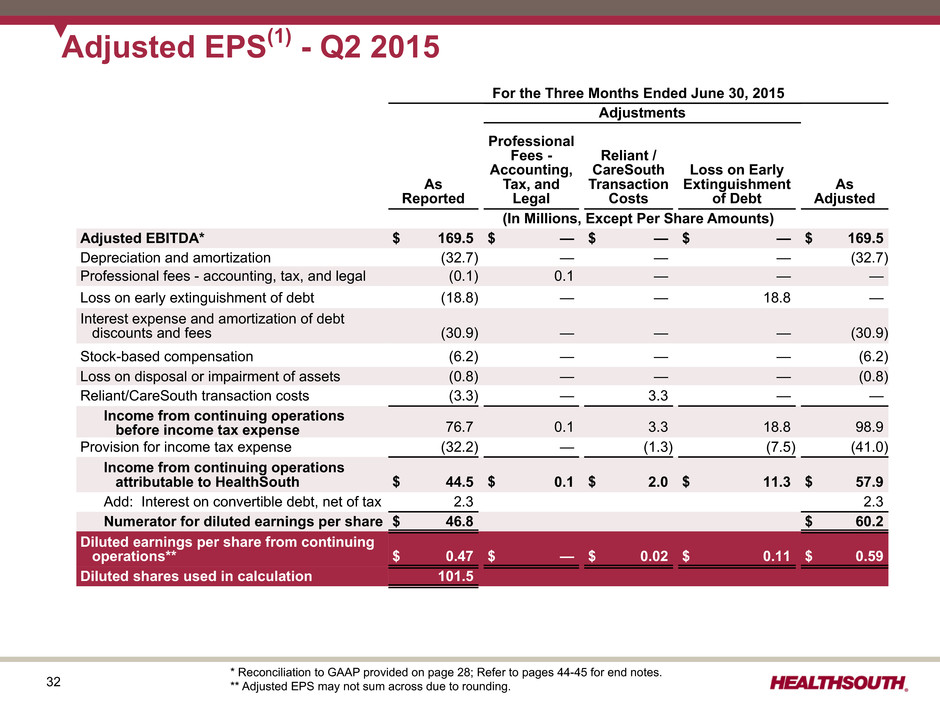
32 For the Three Months Ended June 30, 2015 Adjustments As Reported Professional Fees - Accounting, Tax, and Legal Reliant / CareSouth Transaction Costs Loss on Early Extinguishment of Debt As Adjusted (In Millions, Except Per Share Amounts) Adjusted EBITDA* $ 169.5 $ — $ — $ — $ 169.5 Depreciation and amortization (32.7) — — — (32.7) Professional fees - accounting, tax, and legal (0.1) 0.1 — — — Loss on early extinguishment of debt (18.8) — — 18.8 — Interest expense and amortization of debt discounts and fees (30.9) — — — (30.9) Stock-based compensation (6.2) — — — (6.2) Loss on disposal or impairment of assets (0.8) — — — (0.8) Reliant/CareSouth transaction costs (3.3) — 3.3 — — Income from continuing operations before income tax expense 76.7 0.1 3.3 18.8 98.9 Provision for income tax expense (32.2) — (1.3) (7.5) (41.0) Income from continuing operations attributable to HealthSouth $ 44.5 $ 0.1 $ 2.0 $ 11.3 $ 57.9 Add: Interest on convertible debt, net of tax 2.3 2.3 Numerator for diluted earnings per share $ 46.8 $ 60.2 Diluted earnings per share from continuing operations** $ 0.47 $ — $ 0.02 $ 0.11 $ 0.59 Diluted shares used in calculation 101.5 Adjusted EPS(1) - Q2 2015 * Reconciliation to GAAP provided on page 28; Refer to pages 44-45 for end notes. ** Adjusted EPS may not sum across due to rounding.
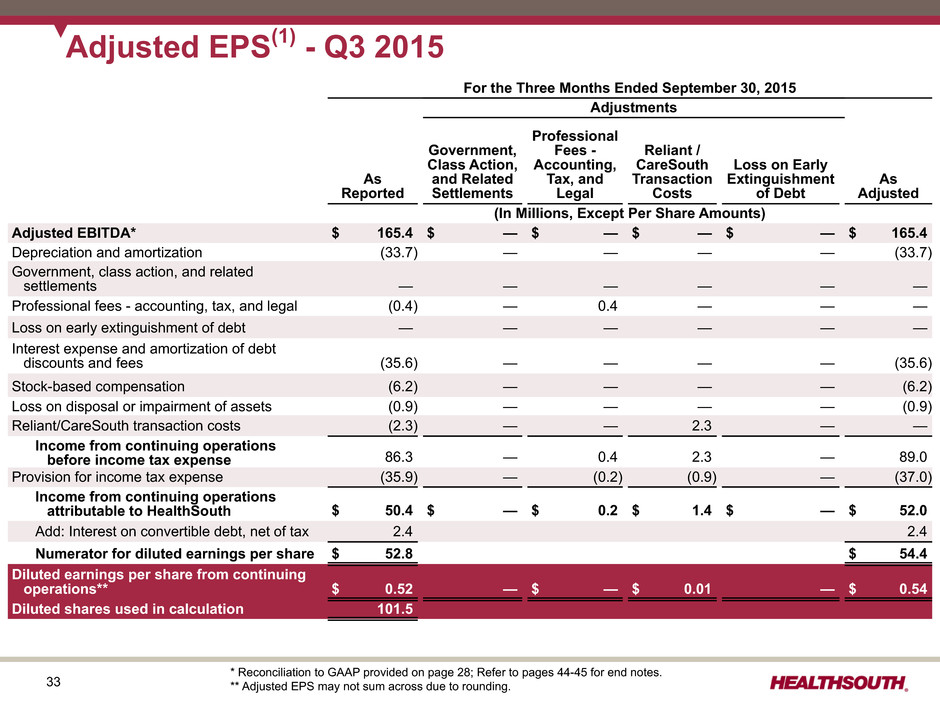
33 For the Three Months Ended September 30, 2015 Adjustments As Reported Government, Class Action, and Related Settlements Professional Fees - Accounting, Tax, and Legal Reliant / CareSouth Transaction Costs Loss on Early Extinguishment of Debt As Adjusted (In Millions, Except Per Share Amounts) Adjusted EBITDA* $ 165.4 $ — $ — $ — $ — $ 165.4 Depreciation and amortization (33.7) — — — — (33.7) Government, class action, and related settlements — — — — — — Professional fees - accounting, tax, and legal (0.4) — 0.4 — — — Loss on early extinguishment of debt — — — — — — Interest expense and amortization of debt discounts and fees (35.6) — — — — (35.6) Stock-based compensation (6.2) — — — — (6.2) Loss on disposal or impairment of assets (0.9) — — — — (0.9) Reliant/CareSouth transaction costs (2.3) — — 2.3 — — Income from continuing operations before income tax expense 86.3 — 0.4 2.3 — 89.0 Provision for income tax expense (35.9) — (0.2) (0.9) — (37.0) Income from continuing operations attributable to HealthSouth $ 50.4 $ — $ 0.2 $ 1.4 $ — $ 52.0 Add: Interest on convertible debt, net of tax 2.4 2.4 Numerator for diluted earnings per share $ 52.8 $ 54.4 Diluted earnings per share from continuing operations** $ 0.52 — $ — $ 0.01 — $ 0.54 Diluted shares used in calculation 101.5 Adjusted EPS(1) - Q3 2015 * Reconciliation to GAAP provided on page 28; Refer to pages 44-45 for end notes. ** Adjusted EPS may not sum across due to rounding.
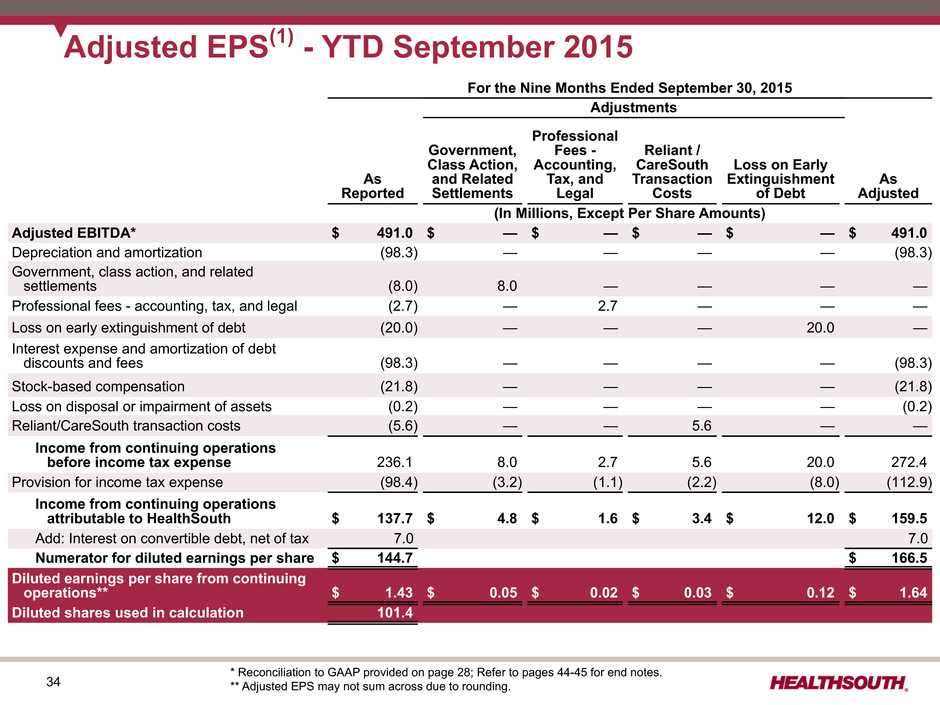
34 For the Nine Months Ended September 30, 2015 Adjustments As Reported Government, Class Action, and Related Settlements Professional Fees - Accounting, Tax, and Legal Reliant / CareSouth Transaction Costs Loss on Early Extinguishment of Debt As Adjusted (In Millions, Except Per Share Amounts) Adjusted EBITDA* $ 491.0 $ — $ — $ — $ — $ 491.0 Depreciation and amortization (98.3) — — — — (98.3) Government, class action, and related settlements (8.0) 8.0 — — — — Professional fees - accounting, tax, and legal (2.7) — 2.7 — — — Loss on early extinguishment of debt (20.0) — — — 20.0 — Interest expense and amortization of debt discounts and fees (98.3) — — — — (98.3) Stock-based compensation (21.8) — — — — (21.8) Loss on disposal or impairment of assets (0.2) — — — — (0.2) Reliant/CareSouth transaction costs (5.6) — — 5.6 — — Income from continuing operations before income tax expense 236.1 8.0 2.7 5.6 20.0 272.4 Provision for income tax expense (98.4) (3.2) (1.1) (2.2) (8.0) (112.9) Income from continuing operations attributable to HealthSouth $ 137.7 $ 4.8 $ 1.6 $ 3.4 $ 12.0 $ 159.5 Add: Interest on convertible debt, net of tax 7.0 7.0 Numerator for diluted earnings per share $ 144.7 $ 166.5 Diluted earnings per share from continuing operations** $ 1.43 $ 0.05 $ 0.02 $ 0.03 $ 0.12 $ 1.64 Diluted shares used in calculation 101.4 Adjusted EPS(1) - YTD September 2015 * Reconciliation to GAAP provided on page 28; Refer to pages 44-45 for end notes. ** Adjusted EPS may not sum across due to rounding.
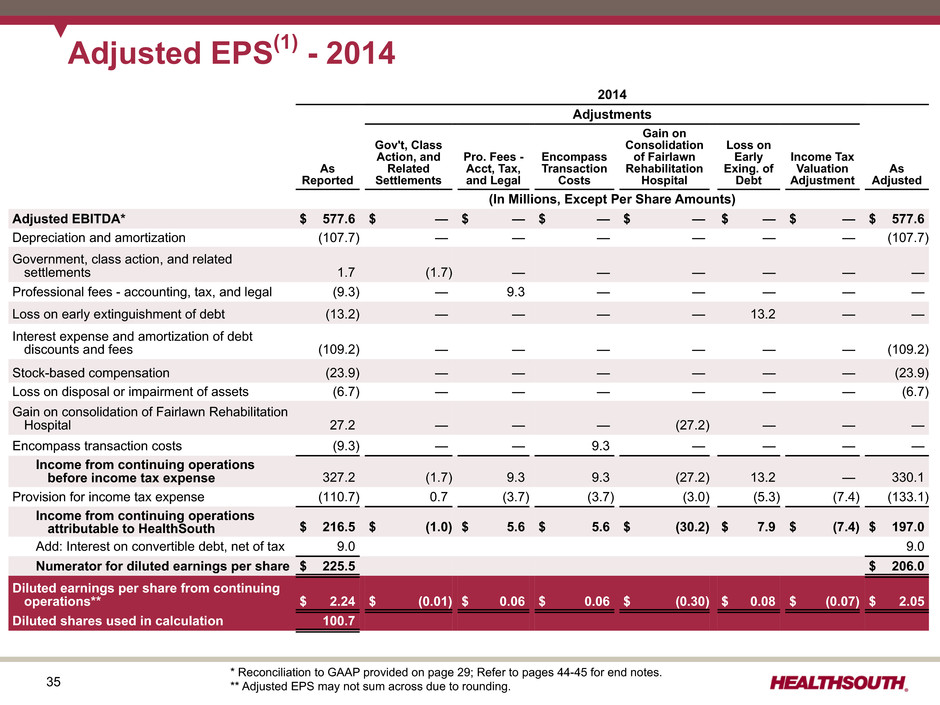
35 2014 Adjustments As Reported Gov't, Class Action, and Related Settlements Pro. Fees - Acct, Tax, and Legal Encompass Transaction Costs Gain on Consolidation of Fairlawn Rehabilitation Hospital Loss on Early Exing. of Debt Income Tax Valuation Adjustment As Adjusted (In Millions, Except Per Share Amounts) Adjusted EBITDA* $ 577.6 $ — $ — $ — $ — $ — $ — $ 577.6 Depreciation and amortization (107.7) — — — — — — (107.7) Government, class action, and related settlements 1.7 (1.7) — — — — — — Professional fees - accounting, tax, and legal (9.3) — 9.3 — — — — — Loss on early extinguishment of debt (13.2) — — — — 13.2 — — Interest expense and amortization of debt discounts and fees (109.2) — — — — — — (109.2) Stock-based compensation (23.9) — — — — — — (23.9) Loss on disposal or impairment of assets (6.7) — — — — — — (6.7) Gain on consolidation of Fairlawn Rehabilitation Hospital 27.2 — — — (27.2) — — — Encompass transaction costs (9.3) — — 9.3 — — — — Income from continuing operations before income tax expense 327.2 (1.7) 9.3 9.3 (27.2) 13.2 — 330.1 Provision for income tax expense (110.7) 0.7 (3.7) (3.7) (3.0) (5.3) (7.4) (133.1) Income from continuing operations attributable to HealthSouth $ 216.5 $ (1.0) $ 5.6 $ 5.6 $ (30.2) $ 7.9 $ (7.4) $ 197.0 Add: Interest on convertible debt, net of tax 9.0 9.0 Numerator for diluted earnings per share $ 225.5 $ 206.0 Diluted earnings per share from continuing operations** $ 2.24 $ (0.01) $ 0.06 $ 0.06 $ (0.30) $ 0.08 $ (0.07) $ 2.05 Diluted shares used in calculation 100.7 Adjusted EPS(1) - 2014 * Reconciliation to GAAP provided on page 29; Refer to pages 44-45 for end notes. ** Adjusted EPS may not sum across due to rounding.
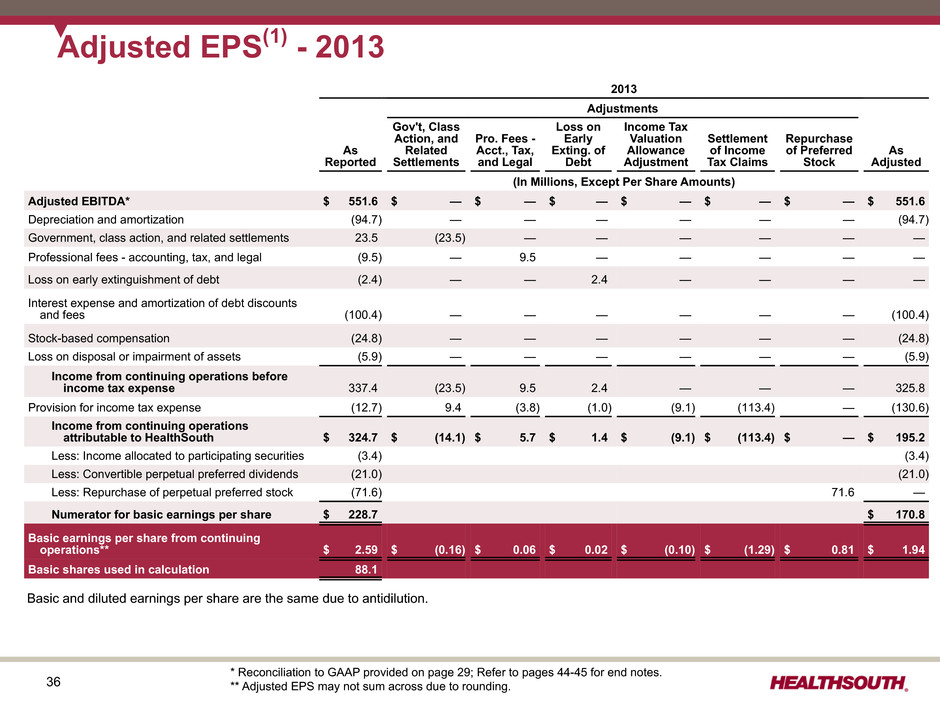
36 2013 Adjustments As Reported Gov't, Class Action, and Related Settlements Pro. Fees - Acct., Tax, and Legal Loss on Early Exting. of Debt Income Tax Valuation Allowance Adjustment Settlement of Income Tax Claims Repurchase of Preferred Stock As Adjusted (In Millions, Except Per Share Amounts) Adjusted EBITDA* $ 551.6 $ — $ — $ — $ — $ — $ — $ 551.6 Depreciation and amortization (94.7) — — — — — — (94.7) Government, class action, and related settlements 23.5 (23.5) — — — — — — Professional fees - accounting, tax, and legal (9.5) — 9.5 — — — — — Loss on early extinguishment of debt (2.4) — — 2.4 — — — — Interest expense and amortization of debt discounts and fees (100.4) — — — — — — (100.4) Stock-based compensation (24.8) — — — — — — (24.8) Loss on disposal or impairment of assets (5.9) — — — — — — (5.9) Income from continuing operations before income tax expense 337.4 (23.5) 9.5 2.4 — — — 325.8 Provision for income tax expense (12.7) 9.4 (3.8) (1.0) (9.1) (113.4) — (130.6) Income from continuing operations attributable to HealthSouth $ 324.7 $ (14.1) $ 5.7 $ 1.4 $ (9.1) $ (113.4) $ — $ 195.2 Less: Income allocated to participating securities (3.4) (3.4) Less: Convertible perpetual preferred dividends (21.0) (21.0) Less: Repurchase of perpetual preferred stock (71.6) 71.6 — Numerator for basic earnings per share $ 228.7 $ 170.8 Basic earnings per share from continuing operations** $ 2.59 $ (0.16) $ 0.06 $ 0.02 $ (0.10) $ (1.29) $ 0.81 $ 1.94 Basic shares used in calculation 88.1 Adjusted EPS(1) - 2013 Basic and diluted earnings per share are the same due to antidilution. * Reconciliation to GAAP provided on page 29; Refer to pages 44-45 for end notes. ** Adjusted EPS may not sum across due to rounding.
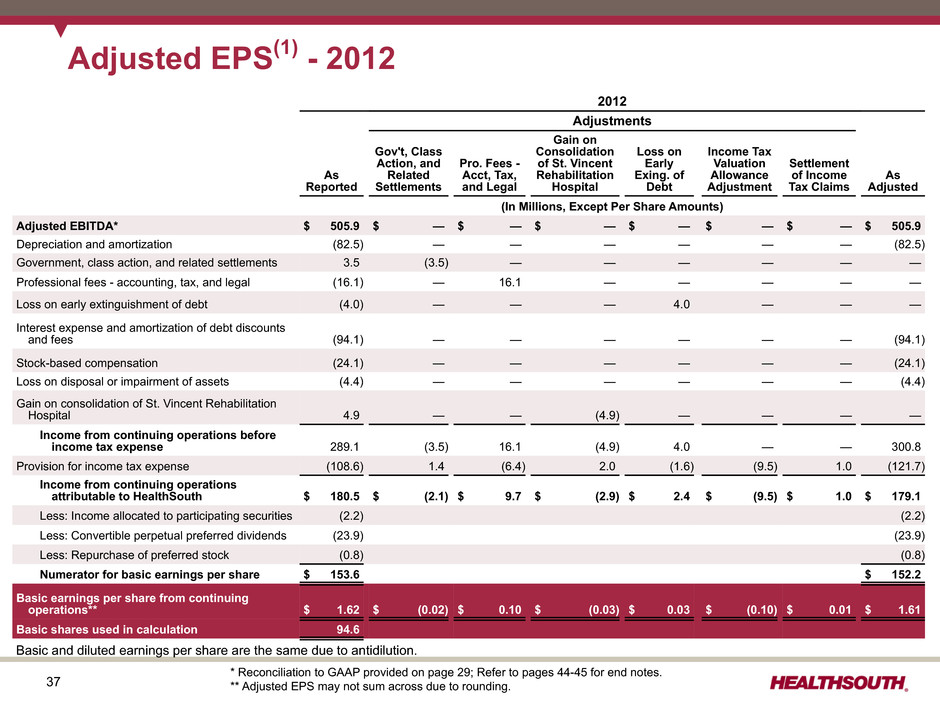
37 2012 Adjustments As Reported Gov't, Class Action, and Related Settlements Pro. Fees - Acct, Tax, and Legal Gain on Consolidation of St. Vincent Rehabilitation Hospital Loss on Early Exing. of Debt Income Tax Valuation Allowance Adjustment Settlement of Income Tax Claims As Adjusted (In Millions, Except Per Share Amounts) Adjusted EBITDA* $ 505.9 $ — $ — $ — $ — $ — $ — $ 505.9 Depreciation and amortization (82.5) — — — — — — (82.5) Government, class action, and related settlements 3.5 (3.5) — — — — — — Professional fees - accounting, tax, and legal (16.1) — 16.1 — — — — — Loss on early extinguishment of debt (4.0) — — — 4.0 — — — Interest expense and amortization of debt discounts and fees (94.1) — — — — — — (94.1) Stock-based compensation (24.1) — — — — — — (24.1) Loss on disposal or impairment of assets (4.4) — — — — — — (4.4) Gain on consolidation of St. Vincent Rehabilitation Hospital 4.9 — — (4.9) — — — — Income from continuing operations before income tax expense 289.1 (3.5) 16.1 (4.9) 4.0 — — 300.8 Provision for income tax expense (108.6) 1.4 (6.4) 2.0 (1.6) (9.5) 1.0 (121.7) Income from continuing operations attributable to HealthSouth $ 180.5 $ (2.1) $ 9.7 $ (2.9) $ 2.4 $ (9.5) $ 1.0 $ 179.1 Less: Income allocated to participating securities (2.2) (2.2) Less: Convertible perpetual preferred dividends (23.9) (23.9) Less: Repurchase of preferred stock (0.8) (0.8) Numerator for basic earnings per share $ 153.6 $ 152.2 Basic earnings per share from continuing operations** $ 1.62 $ (0.02) $ 0.10 $ (0.03) $ 0.03 $ (0.10) $ 0.01 $ 1.61 Basic shares used in calculation 94.6 Adjusted EPS(1) - 2012 Basic and diluted earnings per share are the same due to antidilution. * Reconciliation to GAAP provided on page 29; Refer to pages 44-45 for end notes. ** Adjusted EPS may not sum across due to rounding.
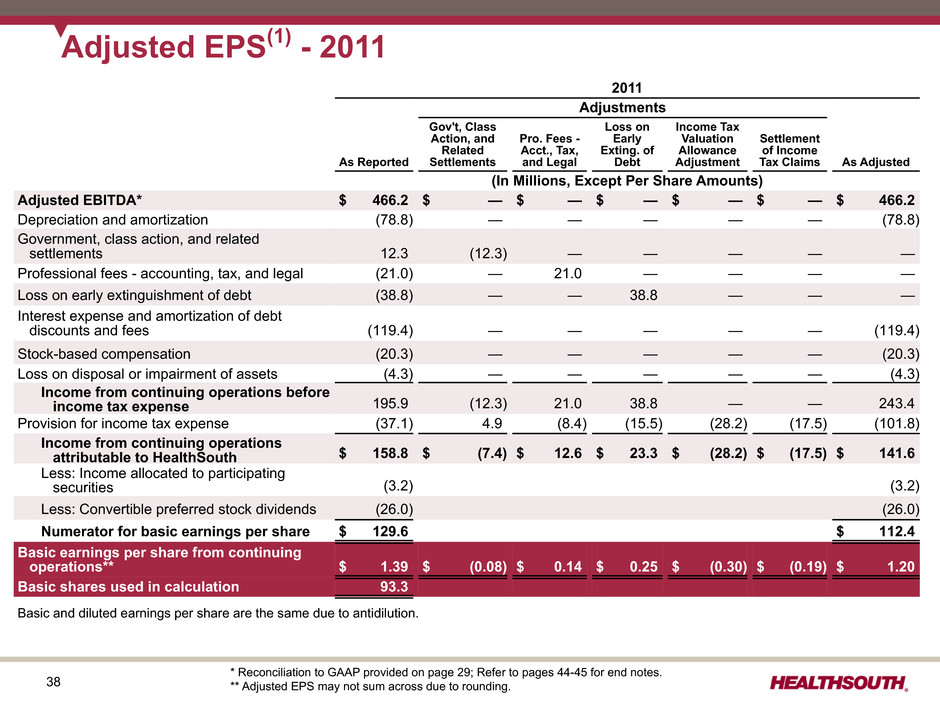
38 2011 Adjustments As Reported Gov't, Class Action, and Related Settlements Pro. Fees - Acct., Tax, and Legal Loss on Early Exting. of Debt Income Tax Valuation Allowance Adjustment Settlement of Income Tax Claims As Adjusted (In Millions, Except Per Share Amounts) Adjusted EBITDA* $ 466.2 $ — $ — $ — $ — $ — $ 466.2 Depreciation and amortization (78.8) — — — — — (78.8) Government, class action, and related settlements 12.3 (12.3) — — — — — Professional fees - accounting, tax, and legal (21.0) — 21.0 — — — — Loss on early extinguishment of debt (38.8) — — 38.8 — — — Interest expense and amortization of debt discounts and fees (119.4) — — — — — (119.4) Stock-based compensation (20.3) — — — — — (20.3) Loss on disposal or impairment of assets (4.3) — — — — — (4.3) Income from continuing operations before income tax expense 195.9 (12.3) 21.0 38.8 — — 243.4 Provision for income tax expense (37.1) 4.9 (8.4) (15.5) (28.2) (17.5) (101.8) Income from continuing operations attributable to HealthSouth $ 158.8 $ (7.4) $ 12.6 $ 23.3 $ (28.2) $ (17.5) $ 141.6 Less: Income allocated to participating securities (3.2) (3.2) Less: Convertible preferred stock dividends (26.0) (26.0) Numerator for basic earnings per share $ 129.6 $ 112.4 Basic earnings per share from continuing operations** $ 1.39 $ (0.08) $ 0.14 $ 0.25 $ (0.30) $ (0.19) $ 1.20 Basic shares used in calculation 93.3 Adjusted EPS(1) - 2011 Basic and diluted earnings per share are the same due to antidilution. * Reconciliation to GAAP provided on page 29; Refer to pages 44-45 for end notes. ** Adjusted EPS may not sum across due to rounding.
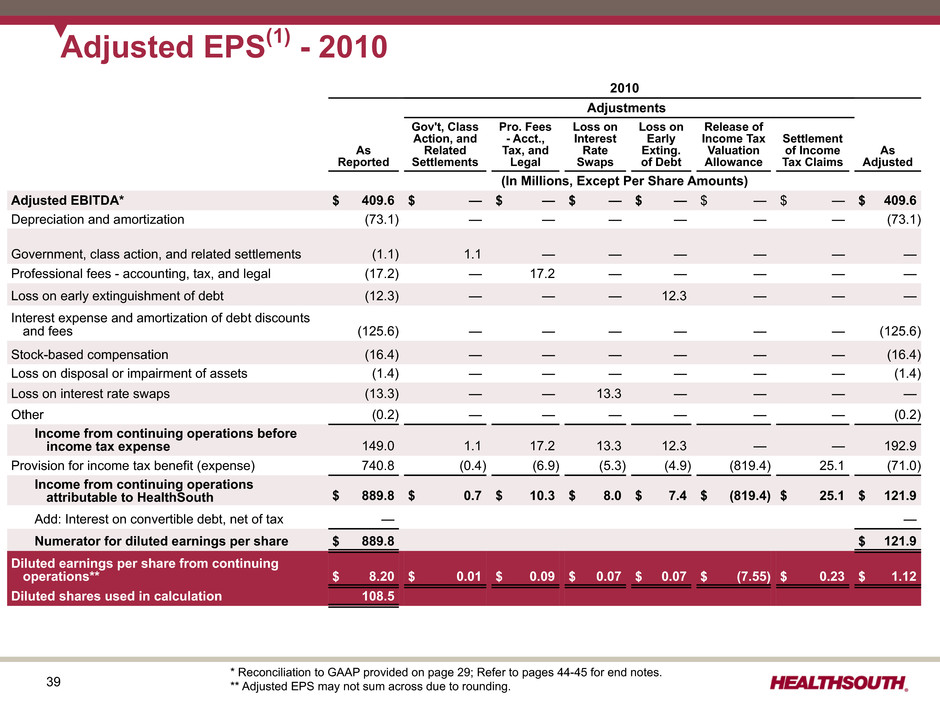
39 2010 Adjustments As Reported Gov't, Class Action, and Related Settlements Pro. Fees - Acct., Tax, and Legal Loss on Interest Rate Swaps Loss on Early Exting. of Debt Release of Income Tax Valuation Allowance Settlement of Income Tax Claims As Adjusted (In Millions, Except Per Share Amounts) Adjusted EBITDA* $ 409.6 $ — $ — $ — $ — $ — $ — $ 409.6 Depreciation and amortization (73.1) — — — — — — (73.1) Government, class action, and related settlements (1.1) 1.1 — — — — — — Professional fees - accounting, tax, and legal (17.2) — 17.2 — — — — — Loss on early extinguishment of debt (12.3) — — — 12.3 — — — Interest expense and amortization of debt discounts and fees (125.6) — — — — — — (125.6) Stock-based compensation (16.4) — — — — — — (16.4) Loss on disposal or impairment of assets (1.4) — — — — — — (1.4) Loss on interest rate swaps (13.3) — — 13.3 — — — — Other (0.2) — — — — — — (0.2) Income from continuing operations before income tax expense 149.0 1.1 17.2 13.3 12.3 — — 192.9 Provision for income tax benefit (expense) 740.8 (0.4) (6.9) (5.3) (4.9) (819.4) 25.1 (71.0) Income from continuing operations attributable to HealthSouth $ 889.8 $ 0.7 $ 10.3 $ 8.0 $ 7.4 $ (819.4) $ 25.1 $ 121.9 Add: Interest on convertible debt, net of tax — — Numerator for diluted earnings per share $ 889.8 $ 121.9 Diluted earnings per share from continuing operations** $ 8.20 $ 0.01 $ 0.09 $ 0.07 $ 0.07 $ (7.55) $ 0.23 $ 1.12 Diluted shares used in calculation 108.5 Adjusted EPS(1) - 2010 * Reconciliation to GAAP provided on page 29; Refer to pages 44-45 for end notes. ** Adjusted EPS may not sum across due to rounding.
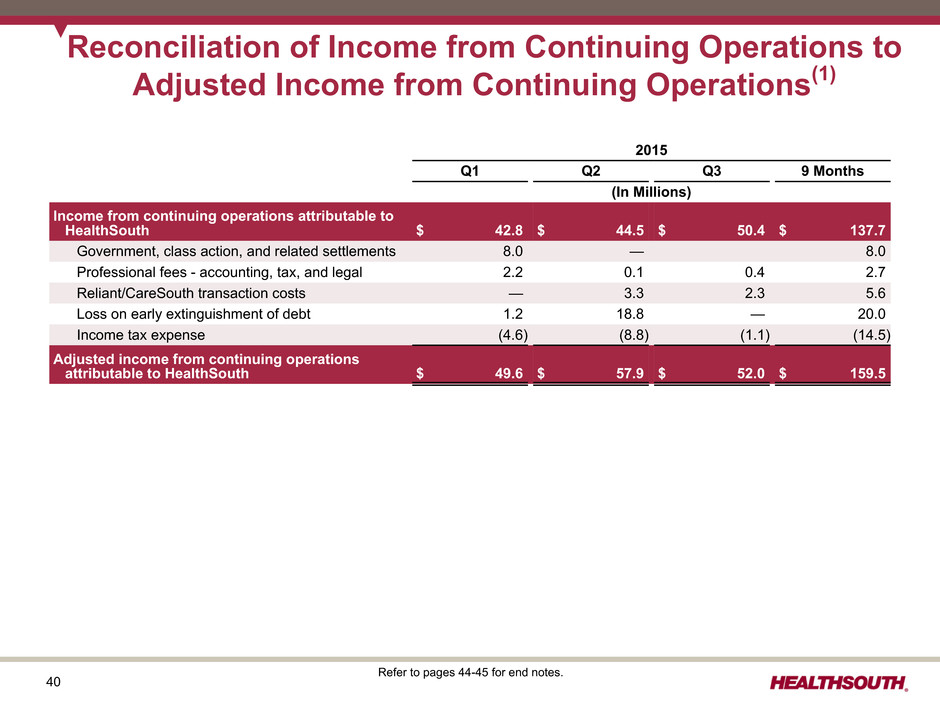
40 2015 Q1 Q2 Q3 9 Months (In Millions) Income from continuing operations attributable to HealthSouth $ 42.8 $ 44.5 $ 50.4 $ 137.7 Government, class action, and related settlements 8.0 — 8.0 Professional fees - accounting, tax, and legal 2.2 0.1 0.4 2.7 Reliant/CareSouth transaction costs — 3.3 2.3 5.6 Loss on early extinguishment of debt 1.2 18.8 — 20.0 Income tax expense (4.6) (8.8) (1.1) (14.5) Adjusted income from continuing operations attributable to HealthSouth $ 49.6 $ 57.9 $ 52.0 $ 159.5 Reconciliation of Income from Continuing Operations to Adjusted Income from Continuing Operations(1) Refer to pages 44-45 for end notes.
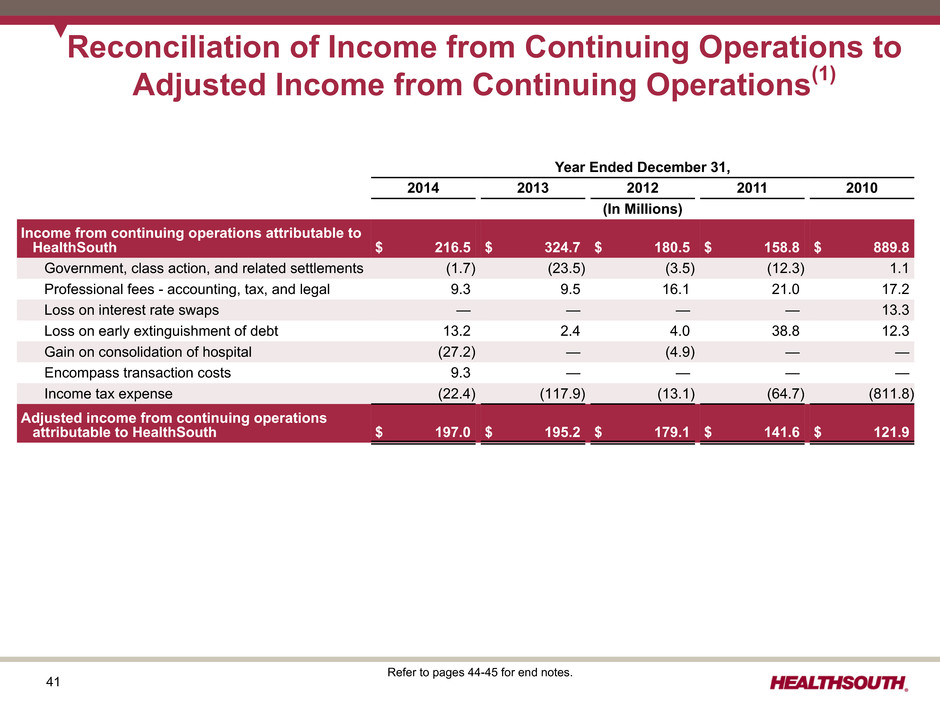
41 Year Ended December 31, 2014 2013 2012 2011 2010 (In Millions) Income from continuing operations attributable to HealthSouth $ 216.5 $ 324.7 $ 180.5 $ 158.8 $ 889.8 Government, class action, and related settlements (1.7) (23.5) (3.5) (12.3) 1.1 Professional fees - accounting, tax, and legal 9.3 9.5 16.1 21.0 17.2 Loss on interest rate swaps — — — — 13.3 Loss on early extinguishment of debt 13.2 2.4 4.0 38.8 12.3 Gain on consolidation of hospital (27.2) — (4.9) — — Encompass transaction costs 9.3 — — — — Income tax expense (22.4) (117.9) (13.1) (64.7) (811.8) Adjusted income from continuing operations attributable to HealthSouth $ 197.0 $ 195.2 $ 179.1 $ 141.6 $ 121.9 Reconciliation of Income from Continuing Operations to Adjusted Income from Continuing Operations(1) Refer to pages 44-45 for end notes.
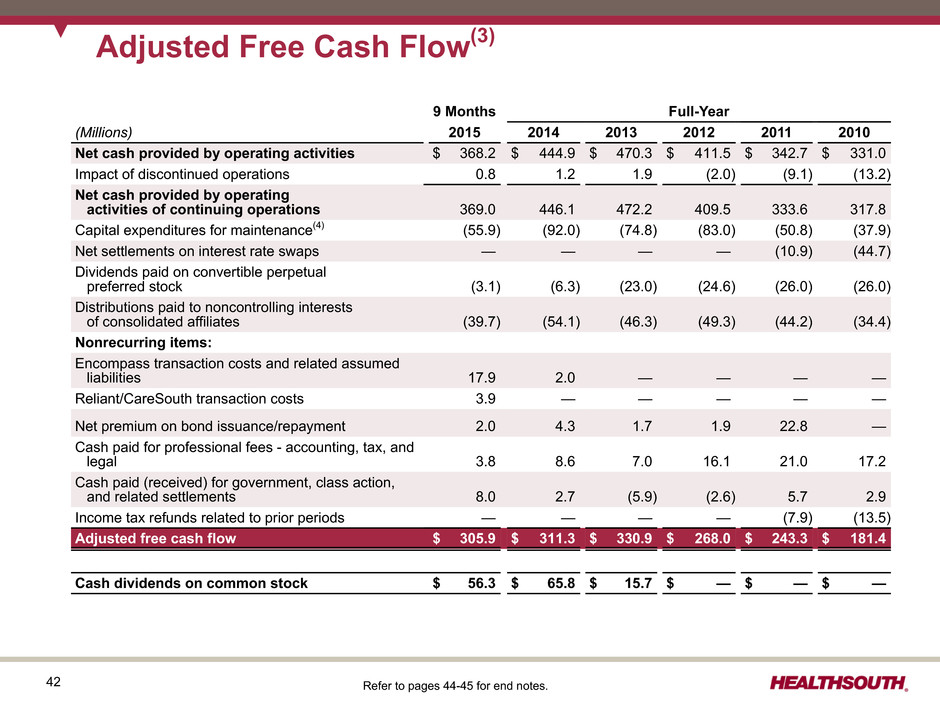
42 Adjusted Free Cash Flow(3) Refer to pages 44-45 for end notes. 9 Months Full-Year (Millions) 2015 2014 2013 2012 2011 2010 Net cash provided by operating activities $ 368.2 $ 444.9 $ 470.3 $ 411.5 $ 342.7 $ 331.0 Impact of discontinued operations 0.8 1.2 1.9 (2.0) (9.1) (13.2) Net cash provided by operating activities of continuing operations 369.0 446.1 472.2 409.5 333.6 317.8 Capital expenditures for maintenance(4) (55.9) (92.0) (74.8) (83.0) (50.8) (37.9) Net settlements on interest rate swaps — — — — (10.9) (44.7) Dividends paid on convertible perpetual preferred stock (3.1) (6.3) (23.0) (24.6) (26.0) (26.0) Distributions paid to noncontrolling interests of consolidated affiliates (39.7) (54.1) (46.3) (49.3) (44.2) (34.4) Nonrecurring items: Encompass transaction costs and related assumed liabilities 17.9 2.0 — — — — Reliant/CareSouth transaction costs 3.9 — — — — — Net premium on bond issuance/repayment 2.0 4.3 1.7 1.9 22.8 — Cash paid for professional fees - accounting, tax, and legal 3.8 8.6 7.0 16.1 21.0 17.2 Cash paid (received) for government, class action, and related settlements 8.0 2.7 (5.9) (2.6) 5.7 2.9 Income tax refunds related to prior periods — — — — (7.9) (13.5) Adjusted free cash flow $ 305.9 $ 311.3 $ 330.9 $ 268.0 $ 243.3 $ 181.4 Cash dividends on common stock $ 56.3 $ 65.8 $ 15.7 $ — $ — $ —
43 End Notes
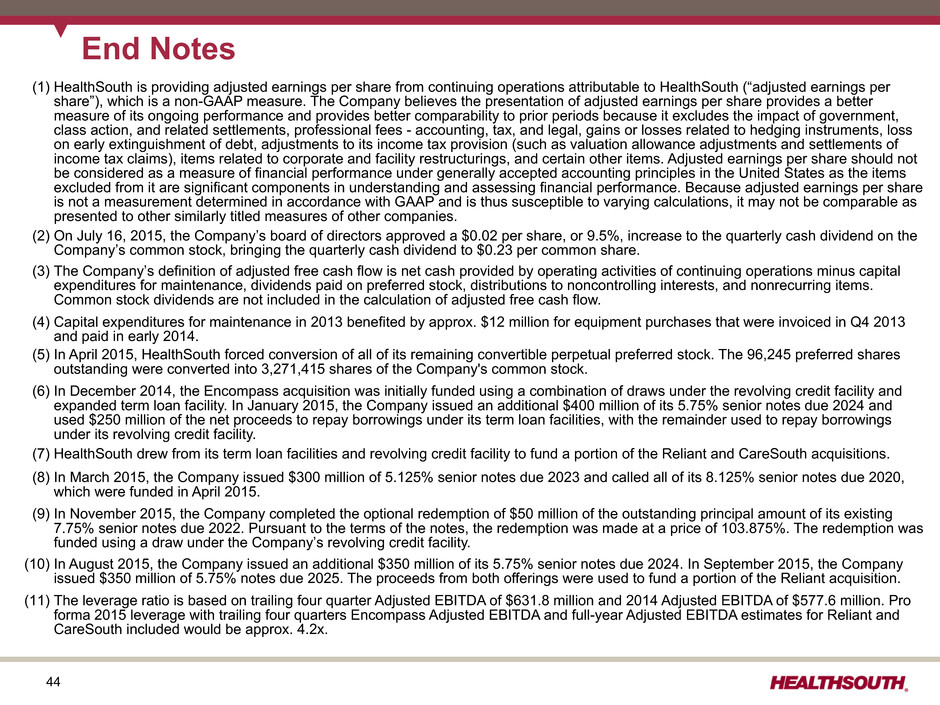
44 (1) HealthSouth is providing adjusted earnings per share from continuing operations attributable to HealthSouth (“adjusted earnings per share”), which is a non-GAAP measure. The Company believes the presentation of adjusted earnings per share provides a better measure of its ongoing performance and provides better comparability to prior periods because it excludes the impact of government, class action, and related settlements, professional fees - accounting, tax, and legal, gains or losses related to hedging instruments, loss on early extinguishment of debt, adjustments to its income tax provision (such as valuation allowance adjustments and settlements of income tax claims), items related to corporate and facility restructurings, and certain other items. Adjusted earnings per share should not be considered as a measure of financial performance under generally accepted accounting principles in the United States as the items excluded from it are significant components in understanding and assessing financial performance. Because adjusted earnings per share is not a measurement determined in accordance with GAAP and is thus susceptible to varying calculations, it may not be comparable as presented to other similarly titled measures of other companies. (2) On July 16, 2015, the Company’s board of directors approved a $0.02 per share, or 9.5%, increase to the quarterly cash dividend on the Company’s common stock, bringing the quarterly cash dividend to $0.23 per common share. (3) The Company’s definition of adjusted free cash flow is net cash provided by operating activities of continuing operations minus capital expenditures for maintenance, dividends paid on preferred stock, distributions to noncontrolling interests, and nonrecurring items. Common stock dividends are not included in the calculation of adjusted free cash flow. (4) Capital expenditures for maintenance in 2013 benefited by approx. $12 million for equipment purchases that were invoiced in Q4 2013 and paid in early 2014. (5) In April 2015, HealthSouth forced conversion of all of its remaining convertible perpetual preferred stock. The 96,245 preferred shares outstanding were converted into 3,271,415 shares of the Company's common stock. (6) In December 2014, the Encompass acquisition was initially funded using a combination of draws under the revolving credit facility and expanded term loan facility. In January 2015, the Company issued an additional $400 million of its 5.75% senior notes due 2024 and used $250 million of the net proceeds to repay borrowings under its term loan facilities, with the remainder used to repay borrowings under its revolving credit facility. (7) HealthSouth drew from its term loan facilities and revolving credit facility to fund a portion of the Reliant and CareSouth acquisitions. (8) In March 2015, the Company issued $300 million of 5.125% senior notes due 2023 and called all of its 8.125% senior notes due 2020, which were funded in April 2015. (9) In November 2015, the Company completed the optional redemption of $50 million of the outstanding principal amount of its existing 7.75% senior notes due 2022. Pursuant to the terms of the notes, the redemption was made at a price of 103.875%. The redemption was funded using a draw under the Company’s revolving credit facility. (10) In August 2015, the Company issued an additional $350 million of its 5.75% senior notes due 2024. In September 2015, the Company issued $350 million of 5.75% notes due 2025. The proceeds from both offerings were used to fund a portion of the Reliant acquisition. (11) The leverage ratio is based on trailing four quarter Adjusted EBITDA of $631.8 million and 2014 Adjusted EBITDA of $577.6 million. Pro forma 2015 leverage with trailing four quarters Encompass Adjusted EBITDA and full-year Adjusted EBITDA estimates for Reliant and CareSouth included would be approx. 4.2x. End Notes
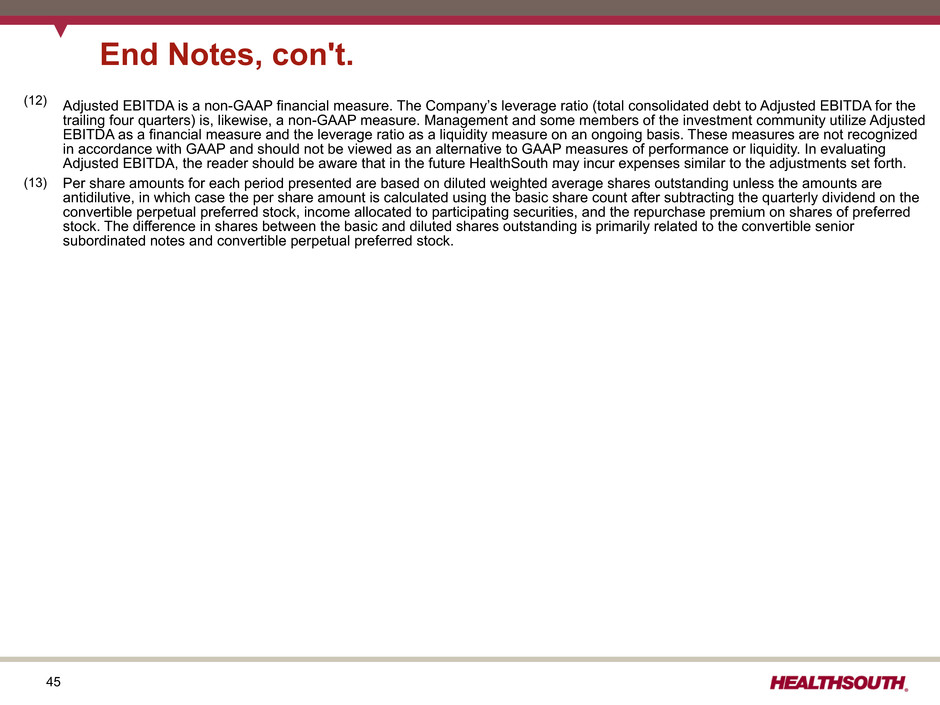
45 (12) Adjusted EBITDA is a non-GAAP financial measure. The Company’s leverage ratio (total consolidated debt to Adjusted EBITDA for the trailing four quarters) is, likewise, a non-GAAP measure. Management and some members of the investment community utilize Adjusted EBITDA as a financial measure and the leverage ratio as a liquidity measure on an ongoing basis. These measures are not recognized in accordance with GAAP and should not be viewed as an alternative to GAAP measures of performance or liquidity. In evaluating Adjusted EBITDA, the reader should be aware that in the future HealthSouth may incur expenses similar to the adjustments set forth. (13) Per share amounts for each period presented are based on diluted weighted average shares outstanding unless the amounts are antidilutive, in which case the per share amount is calculated using the basic share count after subtracting the quarterly dividend on the convertible perpetual preferred stock, income allocated to participating securities, and the repurchase premium on shares of preferred stock. The difference in shares between the basic and diluted shares outstanding is primarily related to the convertible senior subordinated notes and convertible perpetual preferred stock. End Notes, con't.

INVESTOR REFERENCE BOOK Last updated January 11, 2016 HealthSouth is a leading provider of post-acute healthcare services, offering both facility-based and home-based post-acute services in 34 states and Puerto Rico through its network of inpatient rehabilitation hospitals, home health agencies, and hospice agencies.
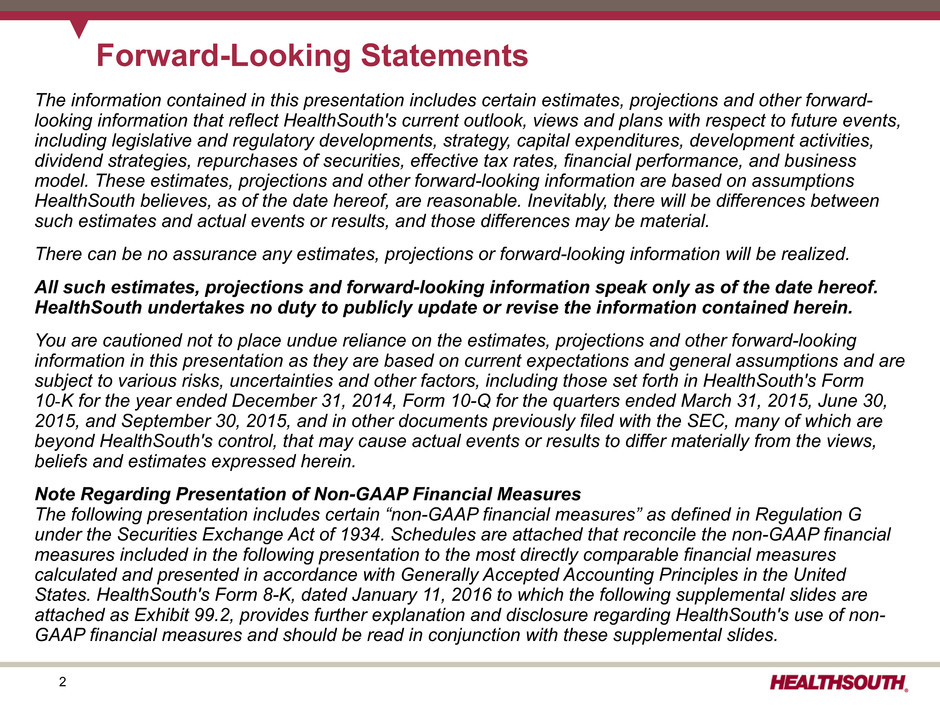
2 The information contained in this presentation includes certain estimates, projections and other forward- looking information that reflect HealthSouth's current outlook, views and plans with respect to future events, including legislative and regulatory developments, strategy, capital expenditures, development activities, dividend strategies, repurchases of securities, effective tax rates, financial performance, and business model. These estimates, projections and other forward-looking information are based on assumptions HealthSouth believes, as of the date hereof, are reasonable. Inevitably, there will be differences between such estimates and actual events or results, and those differences may be material. There can be no assurance any estimates, projections or forward-looking information will be realized. All such estimates, projections and forward-looking information speak only as of the date hereof. HealthSouth undertakes no duty to publicly update or revise the information contained herein. You are cautioned not to place undue reliance on the estimates, projections and other forward-looking information in this presentation as they are based on current expectations and general assumptions and are subject to various risks, uncertainties and other factors, including those set forth in HealthSouth's Form 10‑K for the year ended December 31, 2014, Form 10-Q for the quarters ended March 31, 2015, June 30, 2015, and September 30, 2015, and in other documents previously filed with the SEC, many of which are beyond HealthSouth's control, that may cause actual events or results to differ materially from the views, beliefs and estimates expressed herein. Note Regarding Presentation of Non-GAAP Financial Measures The following presentation includes certain “non-GAAP financial measures” as defined in Regulation G under the Securities Exchange Act of 1934. Schedules are attached that reconcile the non-GAAP financial measures included in the following presentation to the most directly comparable financial measures calculated and presented in accordance with Generally Accepted Accounting Principles in the United States. HealthSouth's Form 8-K, dated January 11, 2016 to which the following supplemental slides are attached as Exhibit 99.2, provides further explanation and disclosure regarding HealthSouth's use of non- GAAP financial measures and should be read in conjunction with these supplemental slides. Forward-Looking Statements
3 Table of Contents Guidance. . . . . . . . . . . . . . . . . . . . . . . . . . . . . . . . . . . . . . . . . . . . . . . . . . . . . . . . . . . . . . . . . . . . . . . . 4-6 The Company . . . . . . . . . . . . . . . . . . . . . . . . . . . . . . . . . . . . . . . . . . . . . . . . . . . . . . . . . . . . . . . . . . . . 7-23 Business Outlook: 2016 to 2018 . . . . . . . . . . . . . . . . . . . . . . . . . . . . . . . . . . . . . . . . . . . . . . . . . . . . . . 24-29 Free Cash Flow. . . . . . . . . . . . . . . . . . . . . . . . . . . . . . . . . . . . . . . . . . . . . . . . . . . . . . . . . . . . . . . . . . . 30-34 Growth. . . . . . . . . . . . . . . . . . . . . . . . . . . . . . . . . . . . . . . . . . . . . . . . . . . . . . . . . . . . . . . . . . . . . . . . . . 35-48 Capital Structure . . . . . . . . . . . . . . . . . . . . . . . . . . . . . . . . . . . . . . . . . . . . . . . . . . . . . . . . . . . . . . . . . . 49-55 Information Technology . . . . . . . . . . . . . . . . . . . . . . . . . . . . . . . . . . . . . . . . . . . . . . . . . . . . . . . . . . . . . 56-62 Operational Metrics . . . . . . . . . . . . . . . . . . . . . . . . . . . . . . . . . . . . . . . . . . . . . . . . . . . . . . . . . . . . . . . . 63-67 History Recast by Segment. . . . . . . . . . . . . . . . . . . . . . . . . . . . . . . . . . . . . . . . . . . . . . . . . . . . . . . . . . 68-75 Alternative Payment Models . . . . . . . . . . . . . . . . . . . . . . . . . . . . . . . . . . . . . . . . . . . . . . . . . . . . . . . . . 76-84 Industry Structure . . . . . . . . . . . . . . . . . . . . . . . . . . . . . . . . . . . . . . . . . . . . . . . . . . . . . . . . . . . . . . . . . 85-100 Reconciliations to GAAP. . . . . . . . . . . . . . . . . . . . . . . . . . . . . . . . . . . . . . . . . . . . . . . . . . . . . . . . . . . . 101-118 End Notes . . . . . . . . . . . . . . . . . . . . . . . . . . . . . . . . . . . . . . . . . . . . . . . . . . . . . . . . . . . . . . . . . . . . . . . 119-123
4 Guidance (as of January 11, 2016)
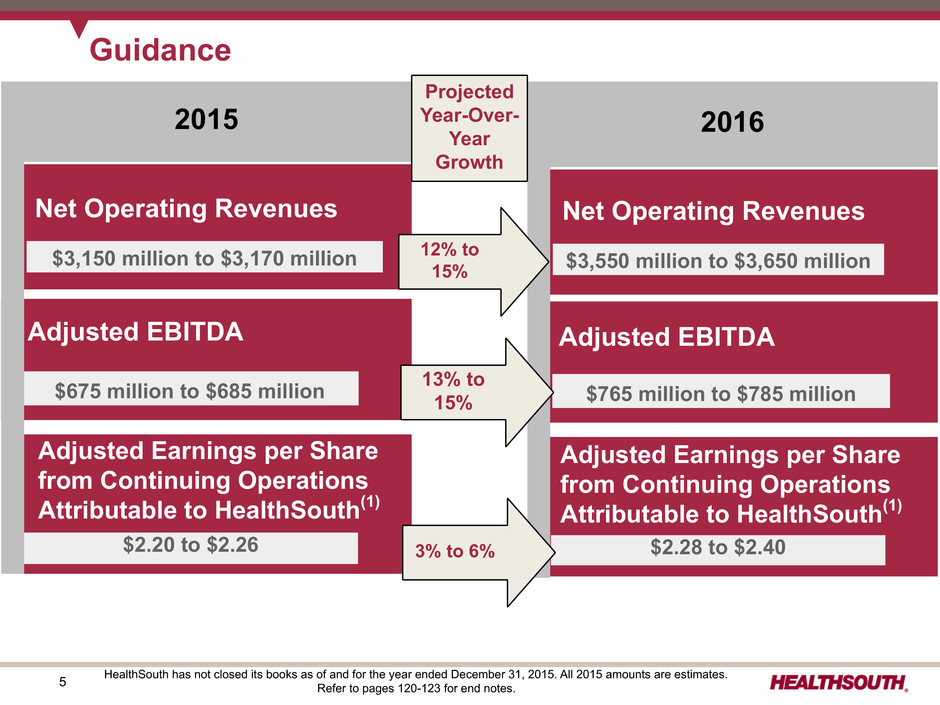
5 $675 million to $685 million $2.20 to $2.26 Adjusted EBITDA Adjusted Earnings per Share from Continuing Operations Attributable to HealthSouth(1) Guidance $3,150 million to $3,170 million Net Operating Revenues 2015 2016 Net Operating Revenues $3,550 million to $3,650 million Adjusted EBITDA $765 million to $785 million Adjusted Earnings per Share from Continuing Operations Attributable to HealthSouth(1) $2.28 to $2.40 12% to 15% Projected Year-Over- Year Growth 13% to 15% 3% to 6% HealthSouth has not closed its books as of and for the year ended December 31, 2015. All 2015 amounts are estimates. Refer to pages 120-123 for end notes.
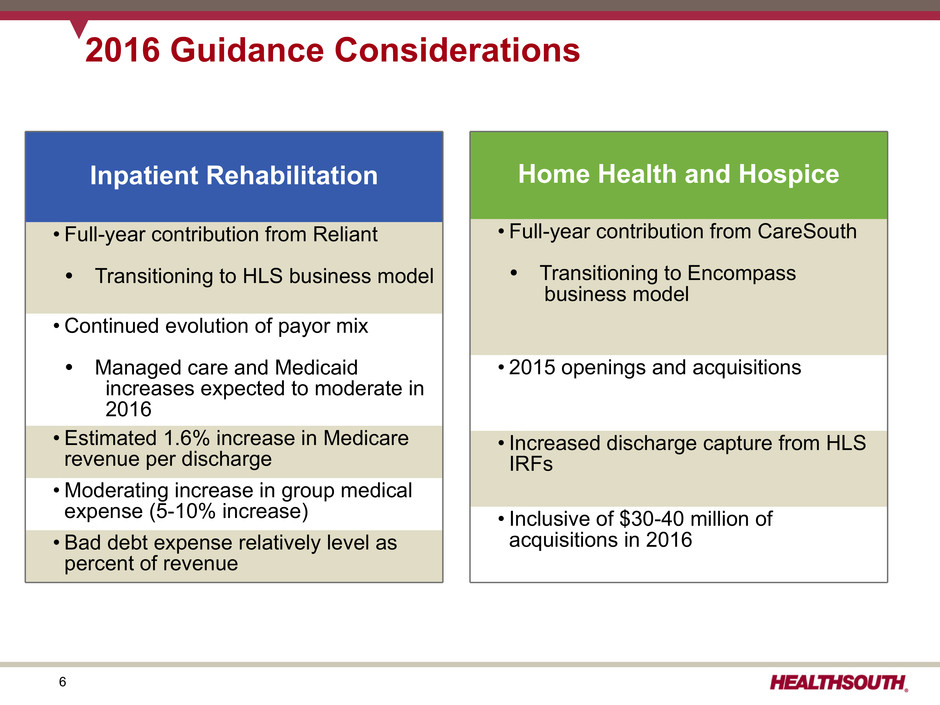
6 2016 Guidance Considerations Inpatient Rehabilitation • Full-year contribution from Reliant Ÿ Transitioning to HLS business model • Continued evolution of payor mix Ÿ Managed care and Medicaid increases expected to moderate in 2016 • Estimated 1.6% increase in Medicare revenue per discharge • Moderating increase in group medical expense (5-10% increase) • Bad debt expense relatively level as percent of revenue Home Health and Hospice • Full-year contribution from CareSouth Ÿ Transitioning to Encompass business model • 2015 openings and acquisitions • Increased discharge capture from HLS IRFs • Inclusive of $30-40 million of acquisitions in 2016
7 The Company
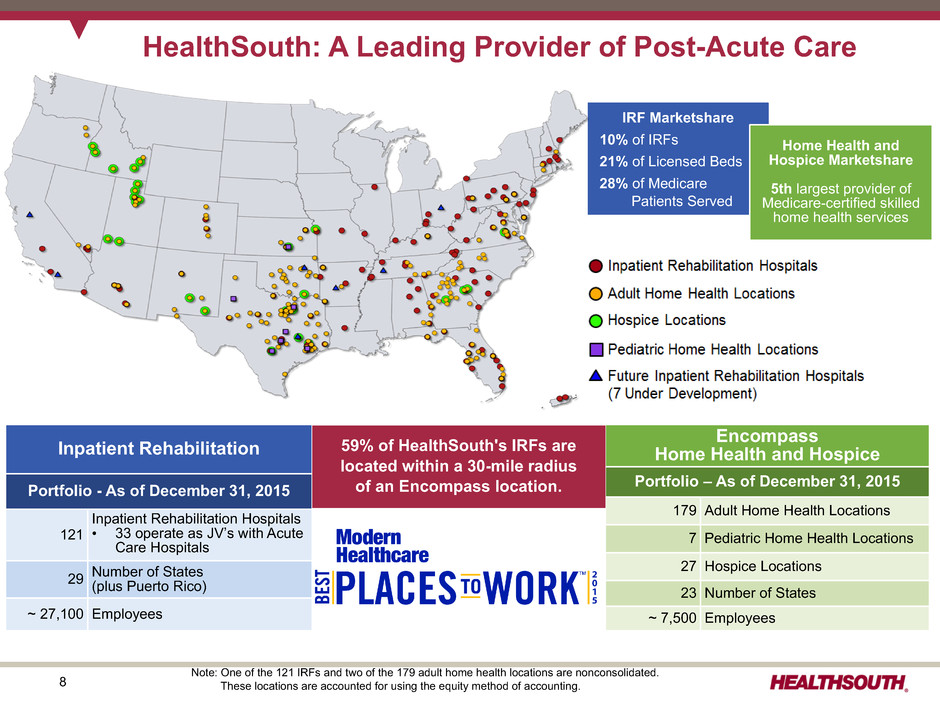
8 Inpatient Rehabilitation Portfolio - As of December 31, 2015 121 Inpatient Rehabilitation Hospitals • 33 operate as JV’s with Acute Care Hospitals 29 Number of States(plus Puerto Rico) ~ 27,100 Employees HealthSouth: A Leading Provider of Post-Acute Care Encompass Home Health and Hospice Portfolio – As of December 31, 2015 179 Adult Home Health Locations 7 Pediatric Home Health Locations 27 Hospice Locations 23 Number of States ~ 7,500 Employees IRF Marketshare 10% of IRFs 21% of Licensed Beds 28% of Medicare Patients Served Home Health and Hospice Marketshare 5th largest provider of Medicare-certified skilled home health services 59% of HealthSouth's IRFs are located within a 30-mile radius of an Encompass location. Note: One of the 121 IRFs and two of the 179 adult home health locations are nonconsolidated. These locations are accounted for using the equity method of accounting.
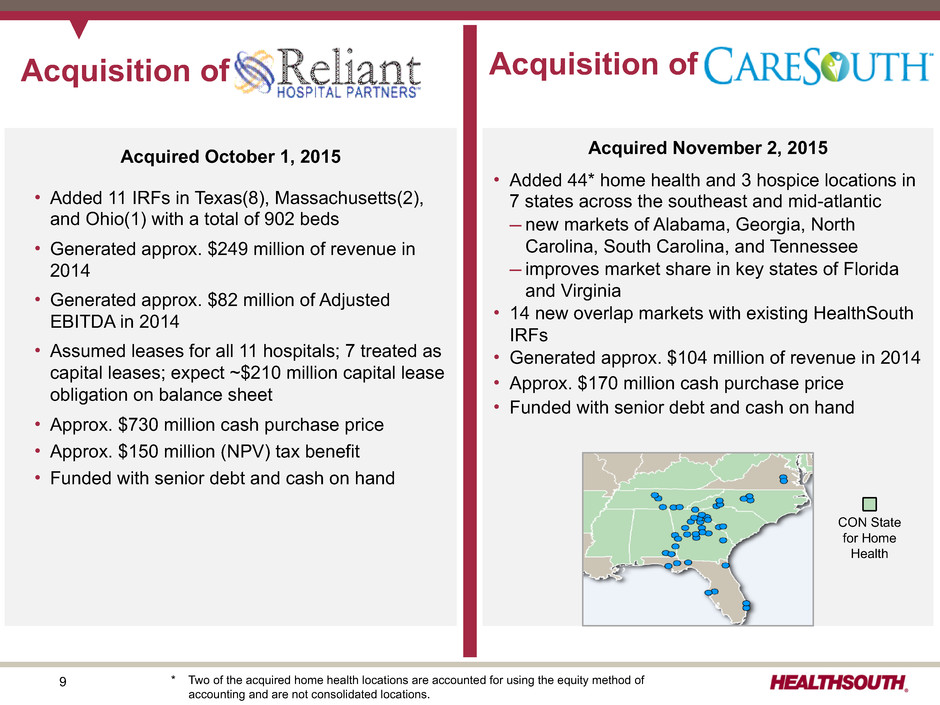
9 Acquisition of Acquired November 2, 2015 Ÿ Added 44* home health and 3 hospice locations in 7 states across the southeast and mid-atlantic —new markets of Alabama, Georgia, North Carolina, South Carolina, and Tennessee —improves market share in key states of Florida and Virginia Ÿ 14 new overlap markets with existing HealthSouth IRFs Ÿ Generated approx. $104 million of revenue in 2014 Ÿ Approx. $170 million cash purchase price Ÿ Funded with senior debt and cash on hand Acquired October 1, 2015 Ÿ Added 11 IRFs in Texas(8), Massachusetts(2), and Ohio(1) with a total of 902 beds Ÿ Generated approx. $249 million of revenue in 2014 Ÿ Generated approx. $82 million of Adjusted EBITDA in 2014 Ÿ Assumed leases for all 11 hospitals; 7 treated as capital leases; expect ~$210 million capital lease obligation on balance sheet Ÿ Approx. $730 million cash purchase price Ÿ Approx. $150 million (NPV) tax benefit Ÿ Funded with senior debt and cash on hand Acquisition of CON State for Home Health * Two of the acquired home health locations are accounted for using the equity method of accounting and are not consolidated locations.
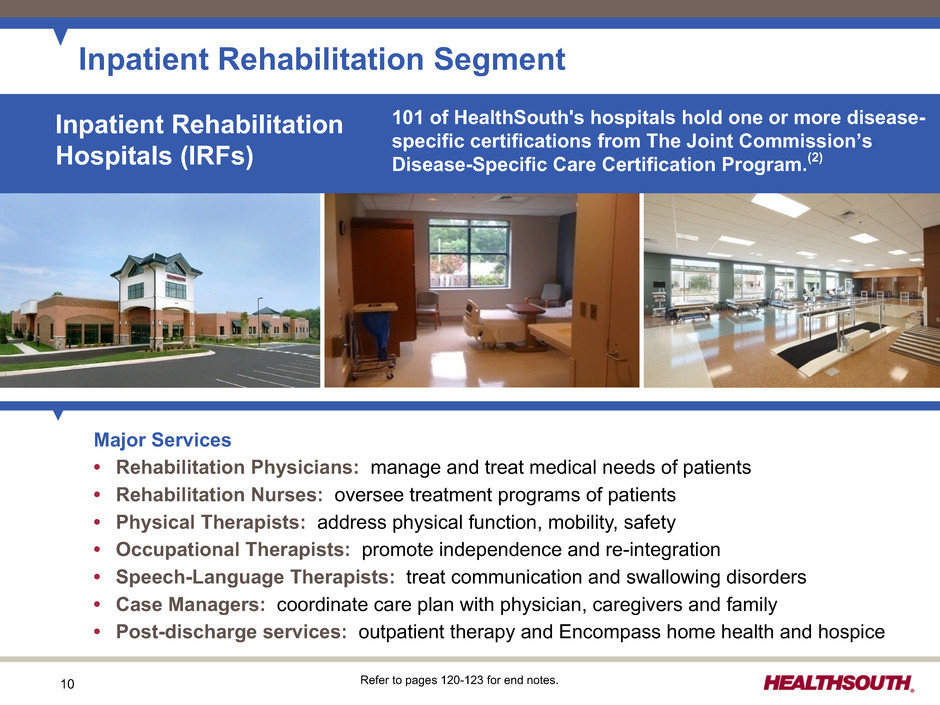
10 Inpatient Rehabilitation Segment Major Services • Rehabilitation Physicians: manage and treat medical needs of patients • Rehabilitation Nurses: oversee treatment programs of patients • Physical Therapists: address physical function, mobility, safety • Occupational Therapists: promote independence and re-integration • Speech-Language Therapists: treat communication and swallowing disorders • Case Managers: coordinate care plan with physician, caregivers and family • Post-discharge services: outpatient therapy and Encompass home health and hospice Inpatient Rehabilitation Hospitals (IRFs) Refer to pages 120-123 for end notes. 101 of HealthSouth's hospitals hold one or more disease- specific certifications from The Joint Commission’s Disease-Specific Care Certification Program.(2)
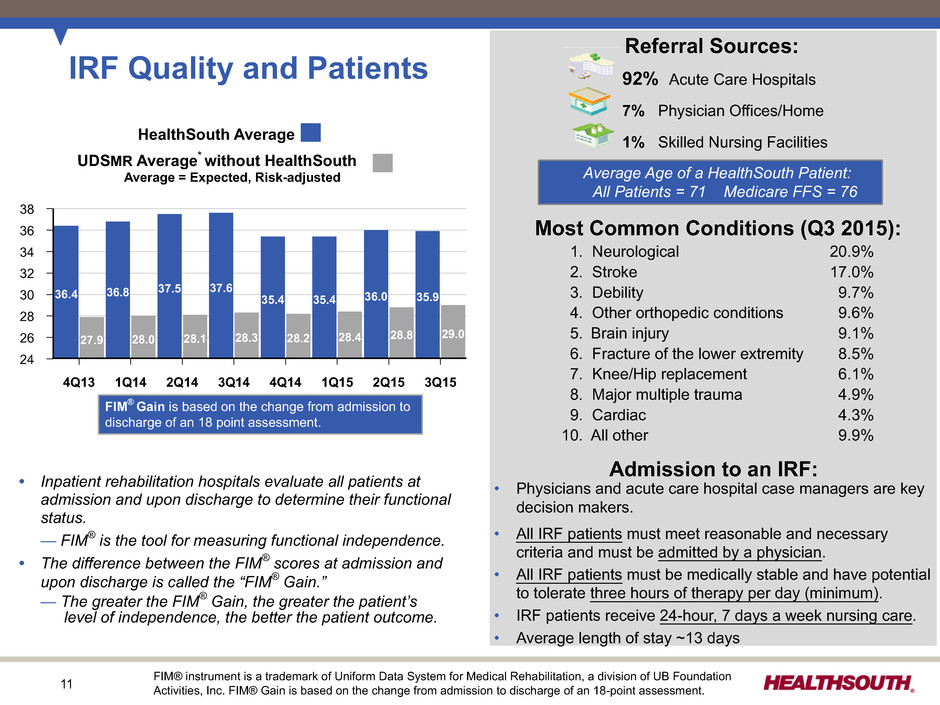
11 IRF Quality and Patients • Inpatient rehabilitation hospitals evaluate all patients at admission and upon discharge to determine their functional status. — FIM® is the tool for measuring functional independence. • The difference between the FIM® scores at admission and upon discharge is called the “FIM® Gain.” — The greater the FIM® Gain, the greater the patient’s level of independence, the better the patient outcome. HealthSouth Average UDSMR Average* without HealthSouth Average = Expected, Risk-adjusted 38 36 34 32 30 28 26 24 4Q13 1Q14 2Q14 3Q14 4Q14 1Q15 2Q15 3Q15 36.4 36.8 37.5 37.6 35.4 35.4 36.0 35.9 27.9 28.0 28.1 28.3 28.2 28.4 28.8 29.0 FIM® instrument is a trademark of Uniform Data System for Medical Rehabilitation, a division of UB Foundation Activities, Inc. FIM® Gain is based on the change from admission to discharge of an 18-point assessment. Referral Sources: 92% Acute Care Hospitals 7% Physician Offices/Home 1% Skilled Nursing Facilities 1. Neurological 20.9% 2. Stroke 17.0% 3. Debility 9.7% 4. Other orthopedic conditions 9.6% 5. Brain injury 9.1% 6. Fracture of the lower extremity 8.5% 7. Knee/Hip replacement 6.1% 8. Major multiple trauma 4.9% 9. Cardiac 4.3% 10. All other 9.9% Most Common Conditions (Q3 2015): • Physicians and acute care hospital case managers are key decision makers. • All IRF patients must meet reasonable and necessary criteria and must be admitted by a physician. • All IRF patients must be medically stable and have potential to tolerate three hours of therapy per day (minimum). • IRF patients receive 24-hour, 7 days a week nursing care. • Average length of stay ~13 days Admission to an IRF: Average Age of a HealthSouth Patient: All Patients = 71 Medicare FFS = 76 FIM® Gain is based on the change from admission to discharge of an 18 point assessment.
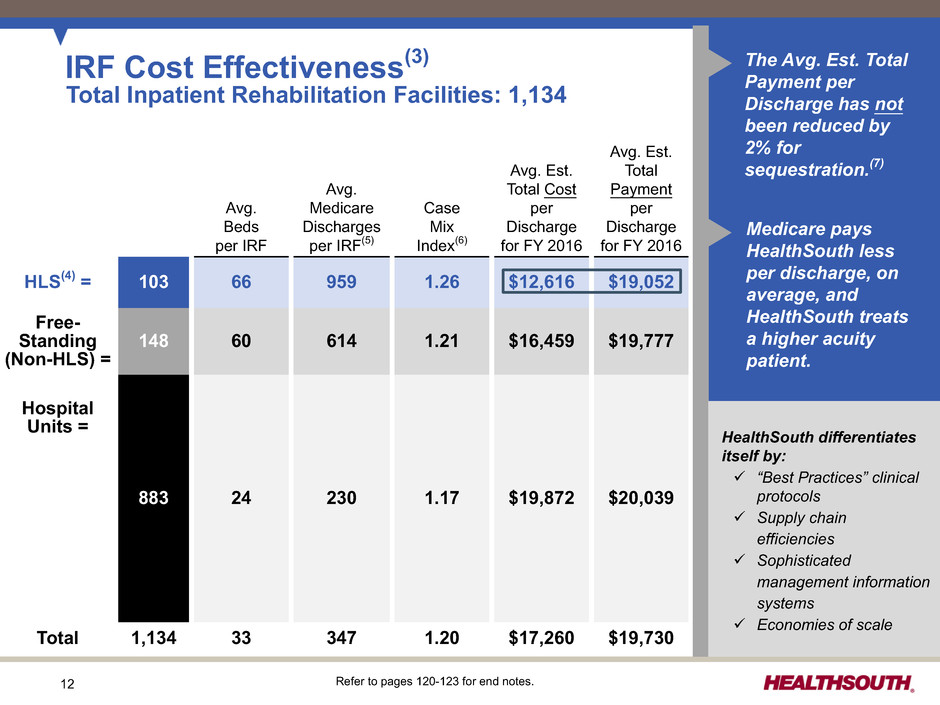
12 Total Inpatient Rehabilitation Facilities: 1,134 IRF Cost Effectiveness(3) The Avg. Est. TotalPayment per Discharge has not been reduced by 2% for sequestration.(7) Medicare pays HealthSouth less per discharge, on average, and HealthSouth treats a higher acuity patient. Avg. Beds per IRF Avg. Medicare Discharges per IRF(5) Case Mix Index(6) Avg. Est. Total Cost per Discharge for FY 2016 Avg. Est. Total Payment per Discharge for FY 2016 HLS(4) = 103 66 959 1.26 $12,616 $19,052 Free- Standing (Non-HLS) = 148 60 614 1.21 $16,459 $19,777 883 24 230 1.17 $19,872 $20,039 Hospital Units = Total 1,134 33 347 1.20 $17,260 $19,730 Refer to pages 120-123 for end notes. HealthSouth differentiates itself by: ü “Best Practices” clinical protocols ü Supply chain efficiencies ü Sophisticated management information systems ü Economies of scale
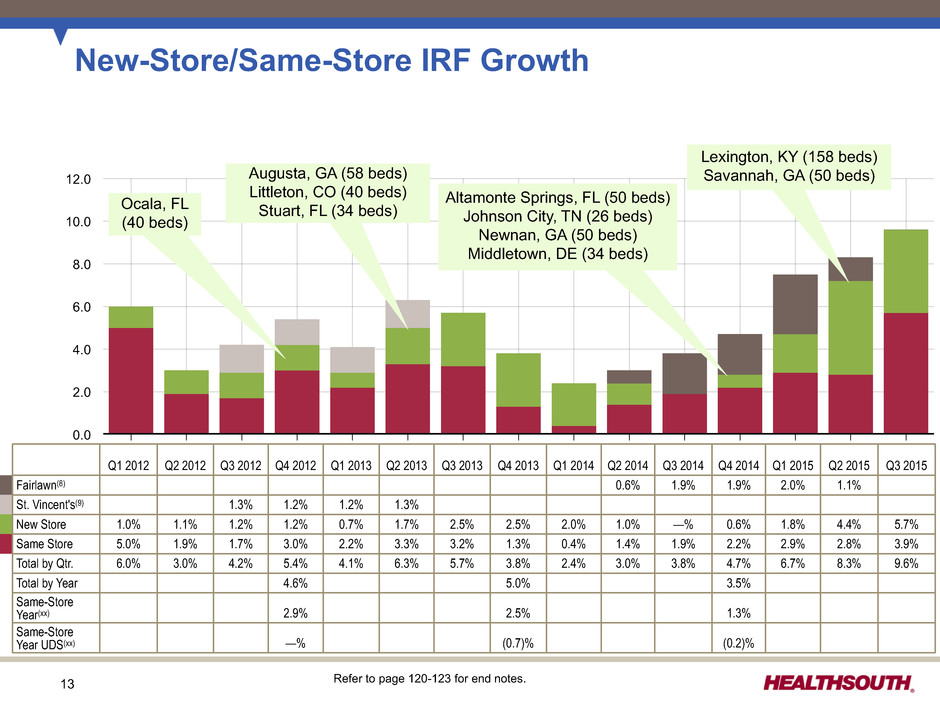
13 Refer to page 120-123 for end notes. 12.0 10.0 8.0 6.0 4.0 2.0 0.0 Q1 2012 Q2 2012 Q3 2012 Q4 2012 Q1 2013 Q2 2013 Q3 2013 Q4 2013 Q1 2014 Q2 2014 Q3 2014 Q4 2014 Q1 2015 Q2 2015 Q3 2015 New-Store/Same-Store IRF Growth Q1 2012 Q2 2012 Q3 2012 Q4 2012 Q1 2013 Q2 2013 Q3 2013 Q4 2013 Q1 2014 Q2 2014 Q3 2014 Q4 2014 Q1 2015 Q2 2015 Q3 2015 Fairlawn(8) 0.6% 1.9% 1.9% 2.0% 1.1% St. Vincent's(9) 1.3% 1.2% 1.2% 1.3% New Store 1.0% 1.1% 1.2% 1.2% 0.7% 1.7% 2.5% 2.5% 2.0% 1.0% —% 0.6% 1.8% 4.4% 5.7% Same Store 5.0% 1.9% 1.7% 3.0% 2.2% 3.3% 3.2% 1.3% 0.4% 1.4% 1.9% 2.2% 2.9% 2.8% 3.9% Total by Qtr. 6.0% 3.0% 4.2% 5.4% 4.1% 6.3% 5.7% 3.8% 2.4% 3.0% 3.8% 4.7% 6.7% 8.3% 9.6% Total by Year 4.6% 5.0% 3.5% Same-Store Year(xx) 2.9% 2.5% 1.3% Same-Store Year UDS(xx) —% (0.7)% (0.2)% Altamonte Springs, FL (50 beds) Johnson City, TN (26 beds) Newnan, GA (50 beds) Middletown, DE (34 beds) Ocala, FL (40 beds) Augusta, GA (58 beds) Littleton, CO (40 beds) Stuart, FL (34 beds) Lexington, KY (158 beds) Savannah, GA (50 beds)
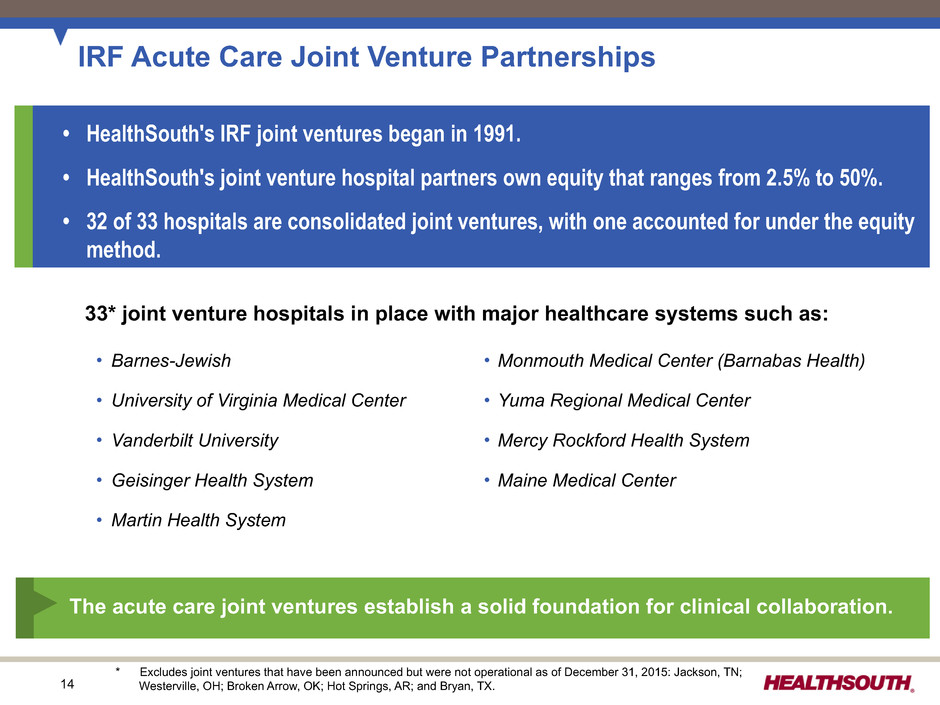
14 • • HealthSouth's IRF joint ventures began in 1991. • HealthSouth's joint venture hospital partners own equity that ranges from 2.5% to 50%. • 32 of 33 hospitals are consolidated joint ventures, with one accounted for under the equity method. IRF Acute Care Joint Venture Partnerships 33* joint venture hospitals in place with major healthcare systems such as: The acute care joint ventures establish a solid foundation for clinical collaboration. • Barnes-Jewish • Monmouth Medical Center (Barnabas Health) • University of Virginia Medical Center • Yuma Regional Medical Center • Vanderbilt University • Mercy Rockford Health System • Geisinger Health System • Maine Medical Center • Martin Health System * Excludes joint ventures that have been announced but were not operational as of December 31, 2015: Jackson, TN; Westerville, OH; Broken Arrow, OK; Hot Springs, AR; and Bryan, TX.
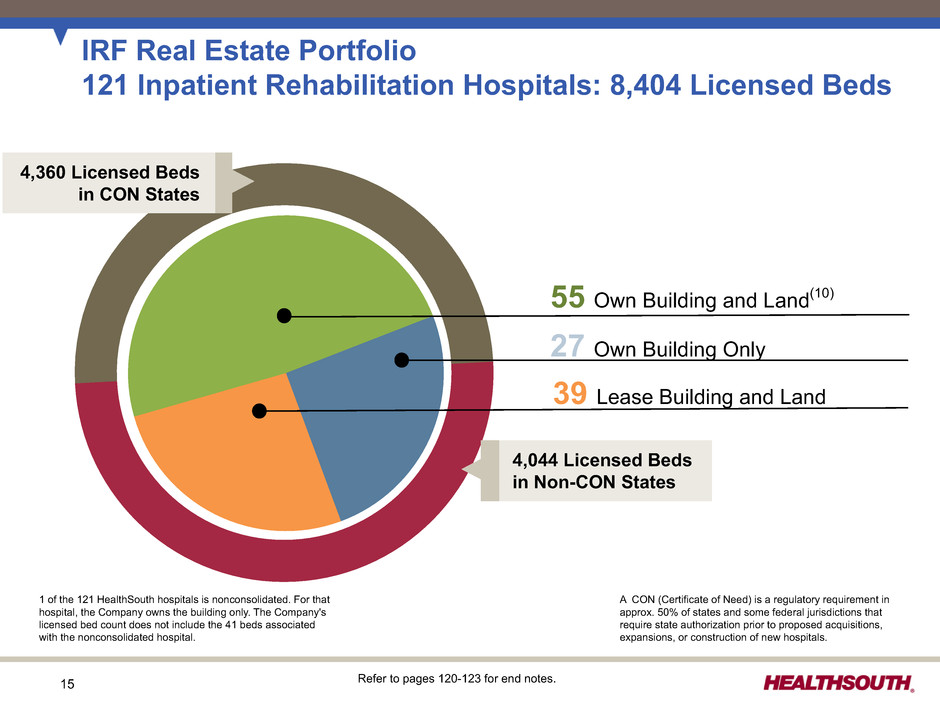
15 39 Lease Building and Land A CON (Certificate of Need) is a regulatory requirement in approx. 50% of states and some federal jurisdictions that require state authorization prior to proposed acquisitions, expansions, or construction of new hospitals. 55 Own Building and Land(10) 27 Own Building Only Refer to pages 120-123 for end notes. IRF Real Estate Portfolio 121 Inpatient Rehabilitation Hospitals: 8,404 Licensed Beds 4,360 Licensed Beds in CON States 4,044 Licensed Beds in Non-CON States 1 of the 121 HealthSouth hospitals is nonconsolidated. For that hospital, the Company owns the building only. The Company's licensed bed count does not include the 41 beds associated with the nonconsolidated hospital.
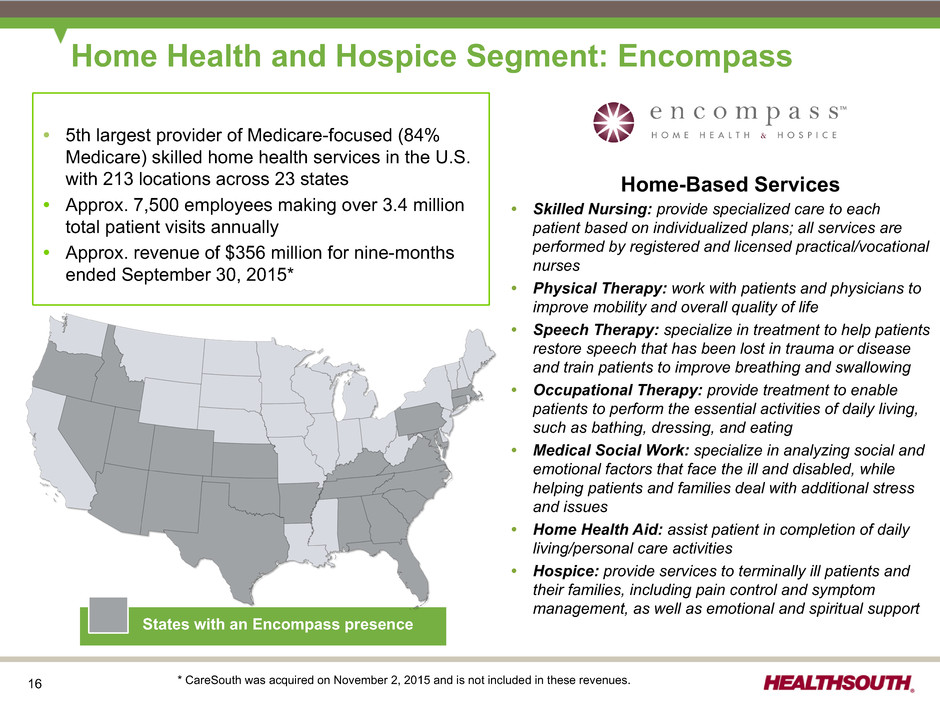
16 Home-Based Services • Skilled Nursing: provide specialized care to each patient based on individualized plans; all services are performed by registered and licensed practical/vocational nurses • Physical Therapy: work with patients and physicians to improve mobility and overall quality of life • Speech Therapy: specialize in treatment to help patients restore speech that has been lost in trauma or disease and train patients to improve breathing and swallowing • Occupational Therapy: provide treatment to enable patients to perform the essential activities of daily living, such as bathing, dressing, and eating • Medical Social Work: specialize in analyzing social and emotional factors that face the ill and disabled, while helping patients and families deal with additional stress and issues • Home Health Aid: assist patient in completion of daily living/personal care activities • Hospice: provide services to terminally ill patients and their families, including pain control and symptom management, as well as emotional and spiritual support States with an Encompass presence Home Health and Hospice Segment: Encompass • 5th largest provider of Medicare-focused (84% Medicare) skilled home health services in the U.S. with 213 locations across 23 states • Approx. 7,500 employees making over 3.4 million total patient visits annually • Approx. revenue of $356 million for nine-months ended September 30, 2015* * CareSouth was acquired on November 2, 2015 and is not included in these revenues.
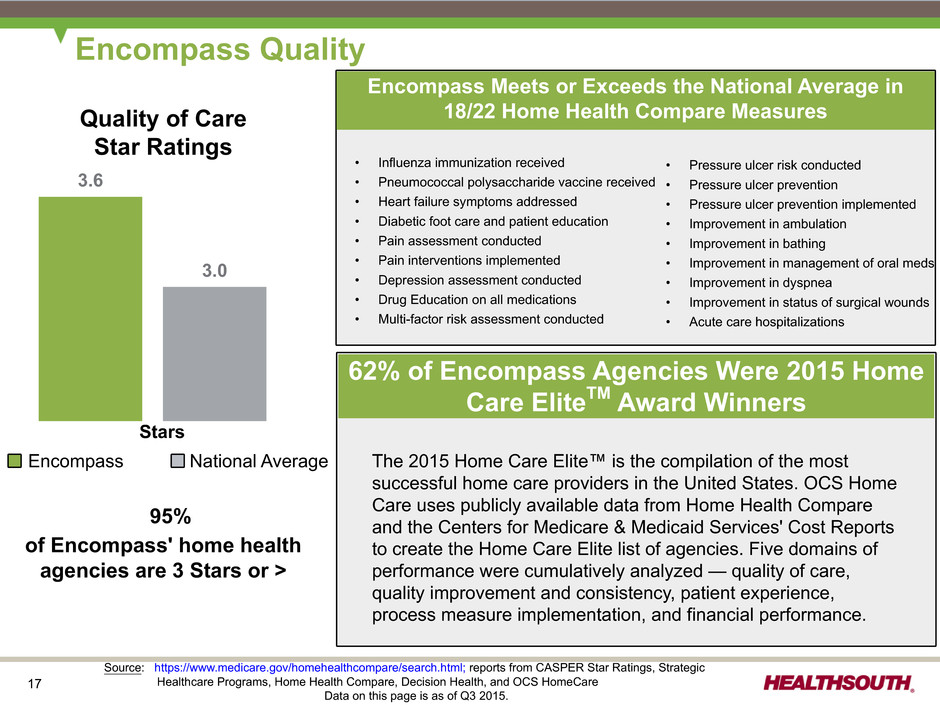
17 Encompass Meets or Exceeds the National Average in 18/22 Home Health Compare Measures • Influenza immunization received • Pneumococcal polysaccharide vaccine received • Heart failure symptoms addressed • Diabetic foot care and patient education • Pain assessment conducted • Pain interventions implemented • Depression assessment conducted • Drug Education on all medications • Multi-factor risk assessment conducted • Pressure ulcer risk conducted • Pressure ulcer prevention • Pressure ulcer prevention implemented • Improvement in ambulation • Improvement in bathing • Improvement in management of oral meds • Improvement in dyspnea • Improvement in status of surgical wounds • Acute care hospitalizations Quality of Care Star Ratings 62% of Encompass Agencies Were 2015 Home Care EliteTM Award Winners 95% of Encompass' home health agencies are 3 Stars or > 3.6 3.0 The 2015 Home Care Elite™ is the compilation of the most successful home care providers in the United States. OCS Home Care uses publicly available data from Home Health Compare and the Centers for Medicare & Medicaid Services' Cost Reports to create the Home Care Elite list of agencies. Five domains of performance were cumulatively analyzed — quality of care, quality improvement and consistency, patient experience, process measure implementation, and financial performance. Source: https://www.medicare.gov/homehealthcompare/search.html; reports from CASPER Star Ratings, Strategic Healthcare Programs, Home Health Compare, Decision Health, and OCS HomeCare Data on this page is as of Q3 2015. Encompass National Average Stars Encompass Quality
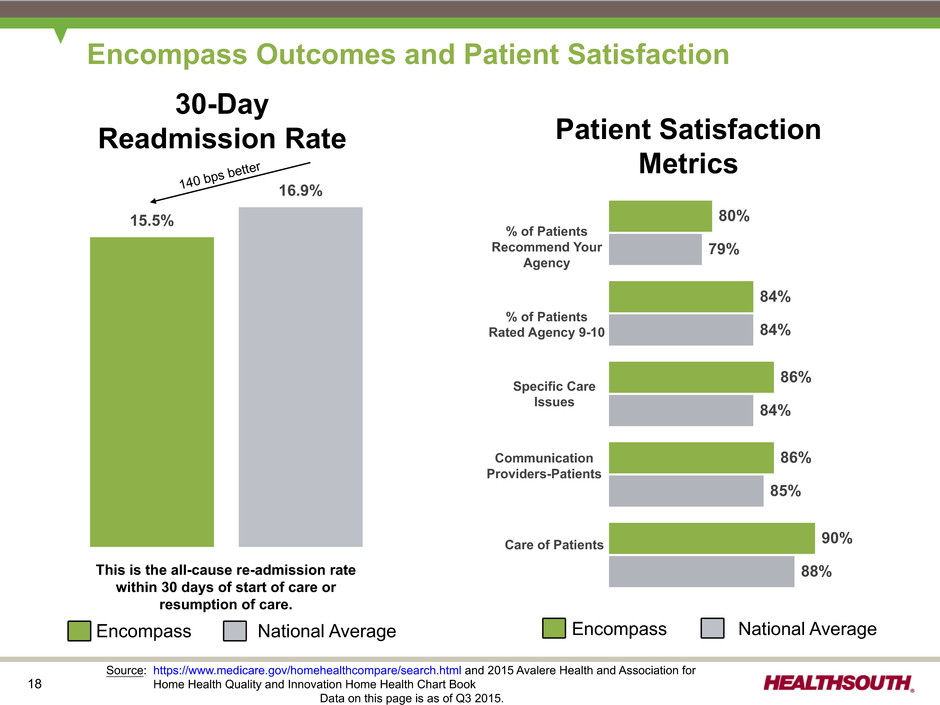
18 30-Day Readmission Rate Patient Satisfaction Metrics 15.5% 16.9% Encompass National Average This is the all-cause re-admission rate within 30 days of start of care or resumption of care. 80% 84% 86% 86% 90% 79% 84% 84% 85% 88% % of Patients Recommend Your Agency % of Patients Rated Agency 9-10 Specific Care Issues Communication Providers-Patients Care of Patients Encompass National Average Source: https://www.medicare.gov/homehealthcompare/search.html and 2015 Avalere Health and Association for Home Health Quality and Innovation Home Health Chart Book Data on this page is as of Q3 2015. Encompass Outcomes and Patient Satisfaction 140 bps bette r
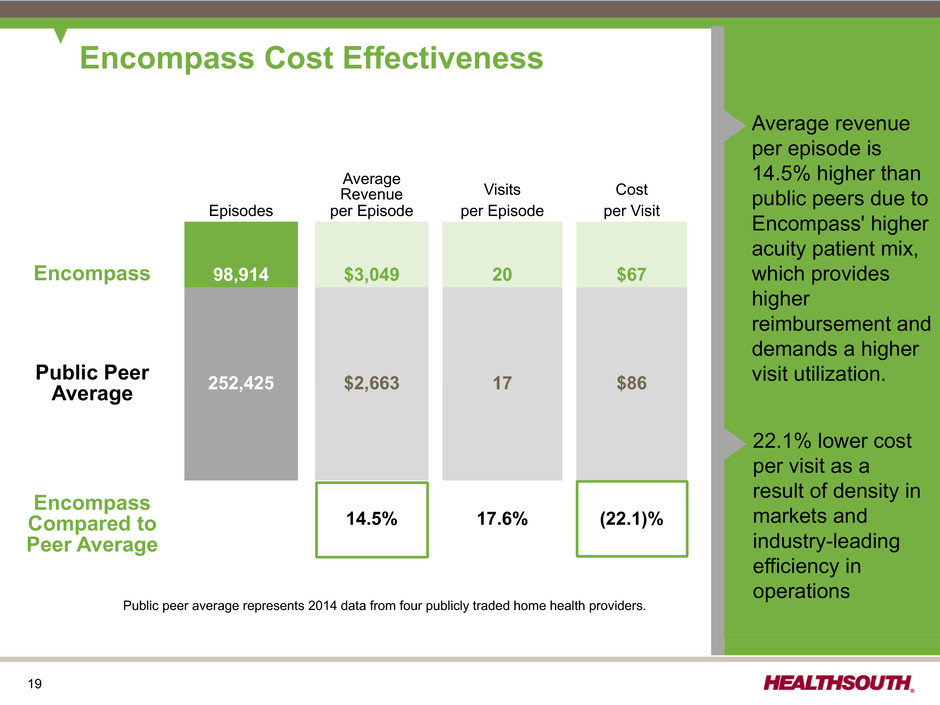
19 Encompass Cost Effectiveness Average revenue per episode is 14.5% higher than public peers due to Encompass' higher acuity patient mix, which provides higher reimbursement and demands a higher visit utilization. 22.1% lower cost per visit as a result of density in markets and industry-leading efficiency in operations Average Revenue Visits Cost Episodes per Episode per Episode per Visit Encompass 98,914 $3,049 20 $67 Public Peer Average 252,425 $2,663 17 $86 Encompass Compared to Peer Average 14.5% 17.6% (22.1)% Public peer average represents 2014 data from four publicly traded home health providers.
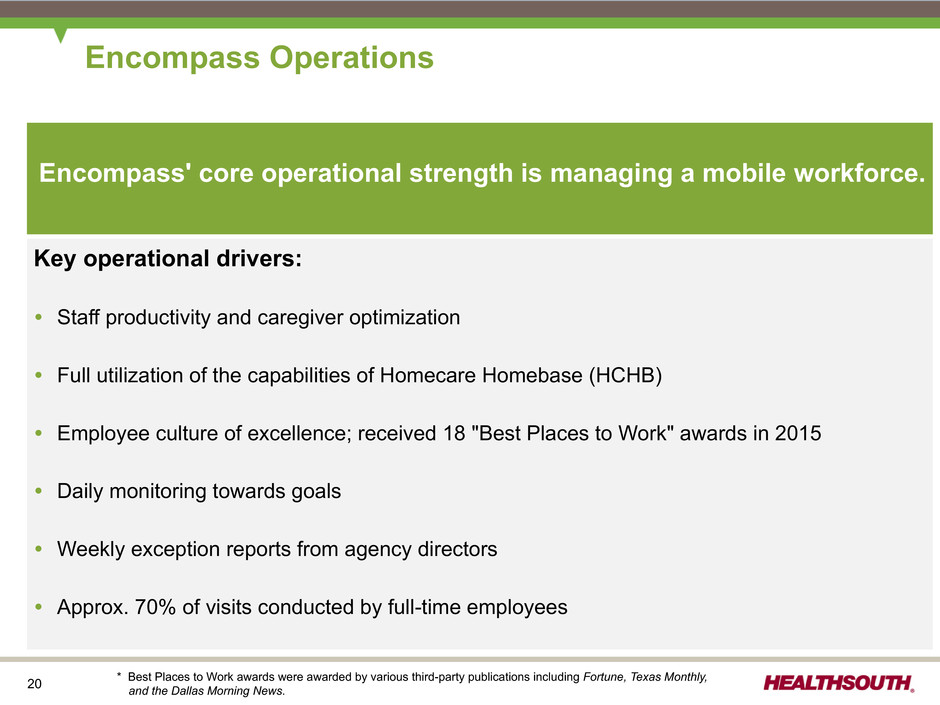
20 Key operational drivers: • Staff productivity and caregiver optimization • Full utilization of the capabilities of Homecare Homebase (HCHB) • Employee culture of excellence; received 18 "Best Places to Work" awards in 2015 • Daily monitoring towards goals • Weekly exception reports from agency directors • Approx. 70% of visits conducted by full-time employees Encompass Operations Encompass' core operational strength is managing a mobile workforce. * Best Places to Work awards were awarded by various third-party publications including Fortune, Texas Monthly, and the Dallas Morning News.
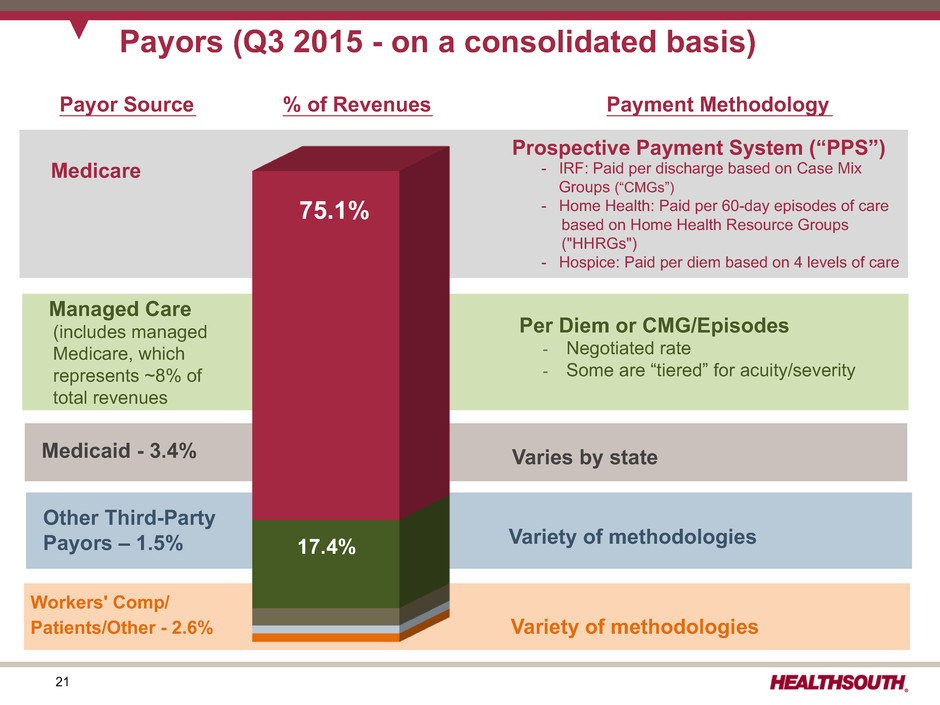
21 Workers' Comp/ Patients/Other - 2.6% Variety of methodologies Medicaid - 3.4% Prospective Payment System (“PPS”) - IRF: Paid per discharge based on Case Mix Groups (“CMGs”) - Home Health: Paid per 60-day episodes of care based on Home Health Resource Groups ("HHRGs") - Hospice: Paid per diem based on 4 levels of care Medicare Per Diem or CMG/Episodes - Negotiated rate - Some are “tiered” for acuity/severity Varies by state Variety of methodologies Managed Care (includes managed Medicare, which represents ~8% of total revenues Other Third-Party Payors – 1.5% 17.4% 75.1% Payors (Q3 2015 - on a consolidated basis) Payor Source Payment Methodology% of Revenues
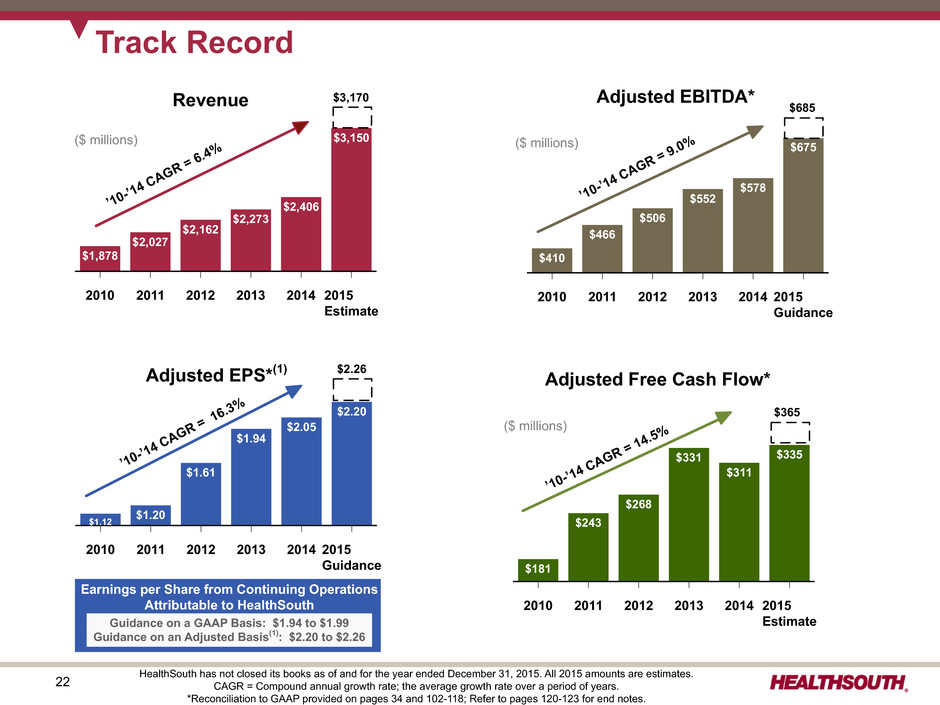
22 Adjusted EPS*(1) Track Record 2010 2011 2012 2013 2014 2015 Estimate $1,878 $2,027 $2,162 $2,273 $2,406 $3,150($ millions) 2010 2011 2012 2013 2014 2015 Guidance $410 $466 $506 $552 $578 $675 ’10-’14 CAGR = 9.0 %($ millions) ’10-’14 CAGR = 6.4 % Adjusted EBITDA* 2010 2011 2012 2013 2014 2015 Guidance $1.12 $1.20 $1.61 $1.94 $2.05 $2.20 ’10-’14 CAGR = 16.3 % Earnings per Share from Continuing Operations Attributable to HealthSouth Guidance on a GAAP Basis: $1.94 to $1.99 Guidance on an Adjusted Basis(1): $2.20 to $2.26 $3,170 $685 $2.26 2010 2011 2012 2013 2014 2015 Estimate $181 $243 $268 $331 $311 $335 Adjusted Free Cash Flow* ($ millions) $365 ’10-’14 CAGR = 14.5 % Revenue HealthSouth has not closed its books as of and for the year ended December 31, 2015. All 2015 amounts are estimates. CAGR = Compound annual growth rate; the average growth rate over a period of years. *Reconciliation to GAAP provided on pages 34 and 102-118; Refer to pages 120-123 for end notes.
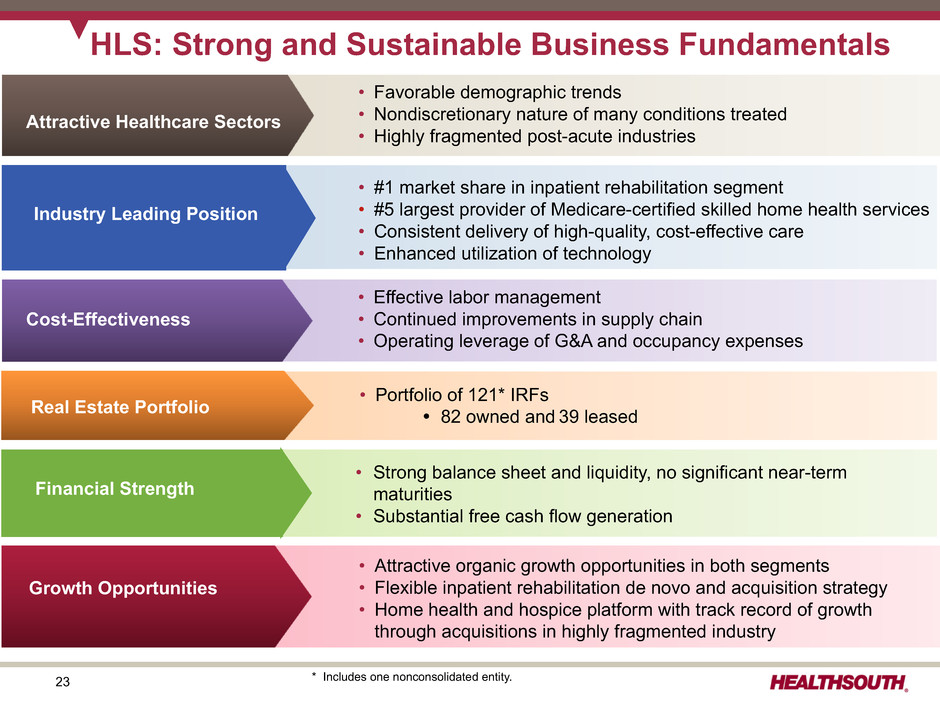
23 HLS: Strong and Sustainable Business Fundamentals • Effective labor management • Continued improvements in supply chain • Operating leverage of G&A and occupancy expenses Cost-Effectiveness • Strong balance sheet and liquidity, no significant near-term maturities • Substantial free cash flow generation • #1 market share in inpatient rehabilitation segment • #5 largest provider of Medicare-certified skilled home health services • Consistent delivery of high-quality, cost-effective care • Enhanced utilization of technology • Attractive organic growth opportunities in both segments • Flexible inpatient rehabilitation de novo and acquisition strategy • Home health and hospice platform with track record of growth through acquisitions in highly fragmented industry • Portfolio of 121* IRFs Ÿ 82 owned and 39 leasedReal Estate Portfolio Attractive Healthcare Sectors Growth Opportunities Cost-Effectiveness • Favorable demographic trends • Nondiscretionary nature of many conditions treated • Highly fragmented post-acute industries Industry Leading Position Financial Strength * Includes one nonconsolidated entity.
24 Business Outlook 2016 to 2018 (as of January 11, 2016)
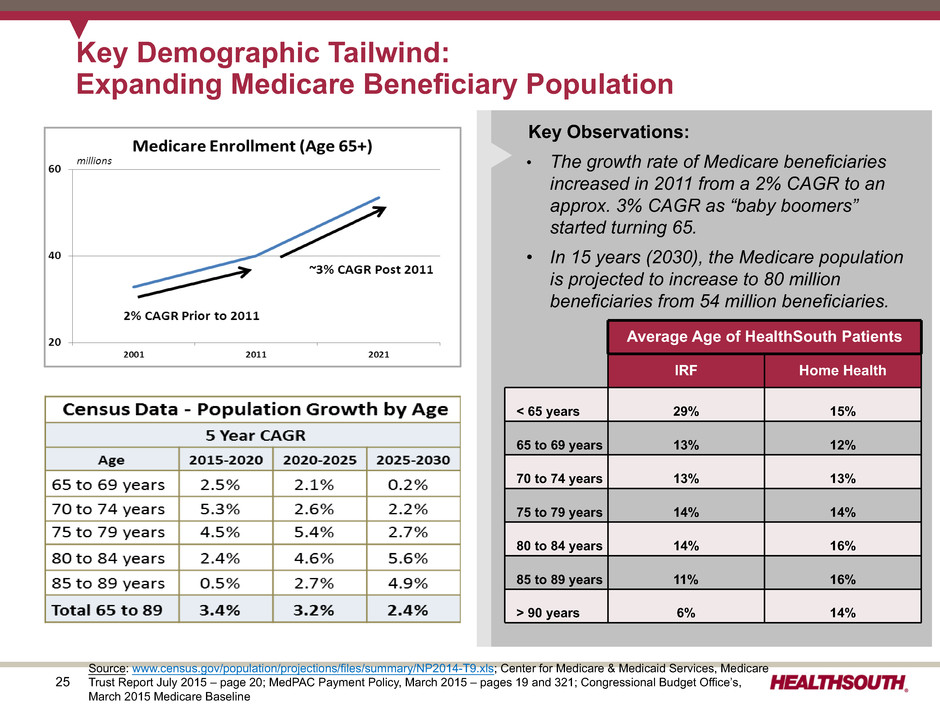
25 Key Demographic Tailwind: Expanding Medicare Beneficiary Population Key Observations: • The growth rate of Medicare beneficiaries increased in 2011 from a 2% CAGR to an approx. 3% CAGR as “baby boomers” started turning 65. • In 15 years (2030), the Medicare population is projected to increase to 80 million beneficiaries from 54 million beneficiaries. Source: www.census.gov/population/projections/files/summary/NP2014-T9.xls; Center for Medicare & Medicaid Services, Medicare Trust Report July 2015 – page 20; MedPAC Payment Policy, March 2015 – pages 19 and 321; Congressional Budget Office’s, March 2015 Medicare Baseline Average Age of HealthSouth Patients IRF Home Health < 65 years 29% 15% 65 to 69 years 13% 12% 70 to 74 years 13% 13% 75 to 79 years 14% 14% 80 to 84 years 14% 16% 85 to 89 years 11% 16% > 90 years 6% 14%
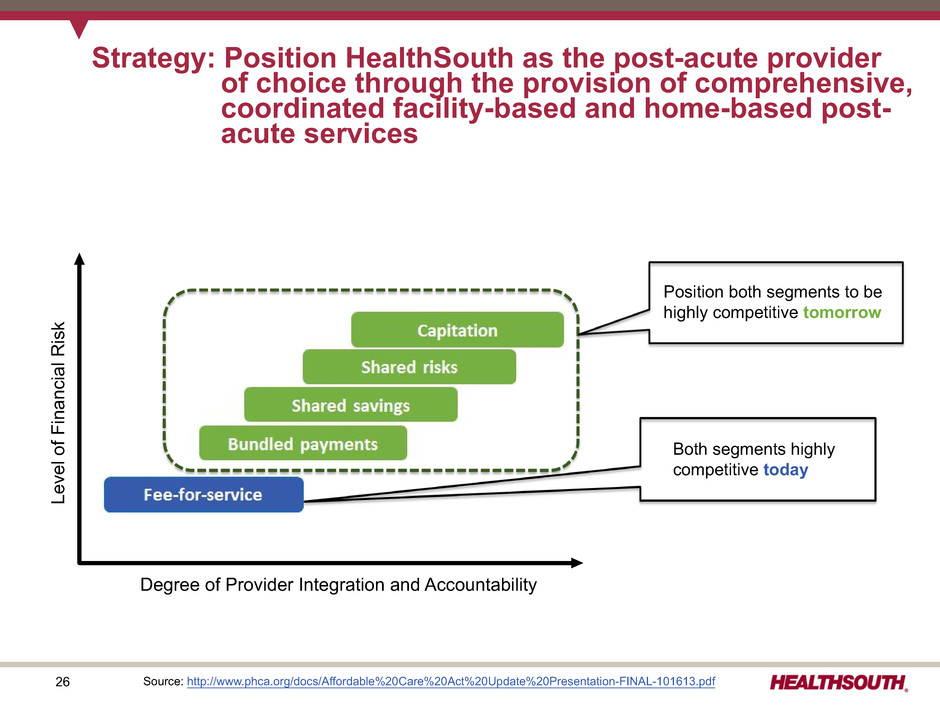
26 Strategy: Position HealthSouth as the post-acute provider of choice through the provision of comprehensive, coordinated facility-based and home-based post- acute services Source: http://www.phca.org/docs/Affordable%20Care%20Act%20Update%20Presentation-FINAL-101613.pdf Degree of Provider Integration and Accountability Level of Financial Ris k Both segments highly competitive today Position both segments to be highly competitive tomorrow
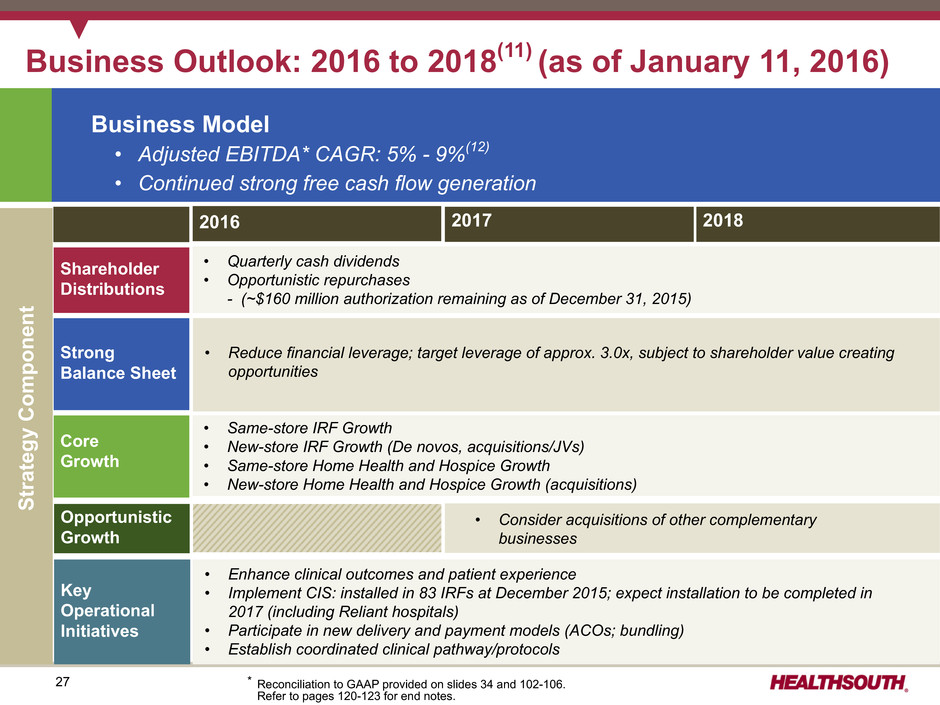
27 • Same-store IRF Growth • New-store IRF Growth (De novos, acquisitions/JVs) • Same-store Home Health and Hospice Growth • New-store Home Health and Hospice Growth (acquisitions) Core Growth Strong Balance Sheet Key Operational Initiatives Shareholder Distributions Opportunistic Growth Business Outlook: 2016 to 2018(11) (as of January 11, 2016) 2016 2017 2018 Business Model • Adjusted EBITDA* CAGR: 5% - 9%(12) • Continued strong free cash flow generation • Quarterly cash dividends • Opportunistic repurchases - (~$160 million authorization remaining as of December 31, 2015) • Enhance clinical outcomes and patient experience • Implement CIS: installed in 83 IRFs at December 2015; expect installation to be completed in 2017 (including Reliant hospitals) • Participate in new delivery and payment models (ACOs; bundling) • Establish coordinated clinical pathway/protocols • Reduce financial leverage; target leverage of approx. 3.0x, subject to shareholder value creating opportunities Strategy Componen t * Reconciliation to GAAP provided on slides 34 and 102-106. Refer to pages 120-123 for end notes. • Consider acquisitions of other complementary businesses
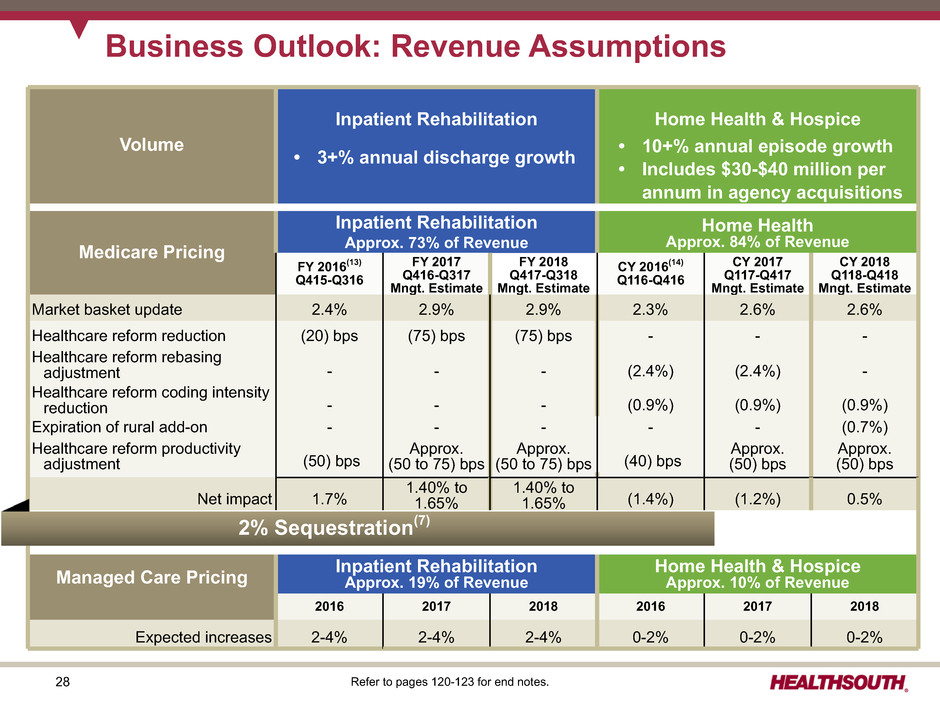
28 • 10% to15% annual episode growth • Includes $35-$40 million per annum in agency acquisitions Volume Inpatient Rehabilitation Home Health & Hospice Medicare Pricing Inpatient Rehabilitation Approx. 73% of Revenue Home Health Approx. 84% of Revenue FY 2016(13) Q415-Q316 FY 2017 Q416-Q317 Mngt. Estimate FY 2018 Q417-Q318 Mngt. Estimate CY 2016(14) Q116-Q416 CY 2017 Q117-Q417 Mngt. Estimate CY 2018 Q118-Q418 Mngt. Estimate Market basket update 2.4% 2.9% 2.9% 2.3% 2.6% 2.6% Healthcare reform reduction (20) bps (75) bps (75) bps - - - Healthcare reform rebasing adjustment - - - (2.4%) (2.4%) - Healthcare reform coding intensity reduction - - - (0.9%) (0.9%) (0.9%) Expiration of rural add-on - - - - - (0.7%) Healthcare reform productivity adjustment (50) bps Approx. (50 to 75) bps Approx. (50 to 75) bps (40) bps Approx. (50) bps Approx. (50) bps Net impact 1.7% 1.40% to 1.65% 1.40% to 1.65% (1.4%) (1.2%) 0.5% Managed Care Pricing Inpatient Rehabilitation Approx. 19% of Revenue Home Health & Hospice Approx. 10% of Revenue 2016 2017 2018 2016 2017 2018 Expected increases 2-4% 2-4% 2-4% 0-2% 0-2% 0-2% Business Outlook: Revenue Assumptions 2% Sequestration(7) • 3+% annual discharge growth • 10+% annual episode growth• Includes $30-$40 million per annum in agency acquisitions Refer to pages 120-123 for end notes.
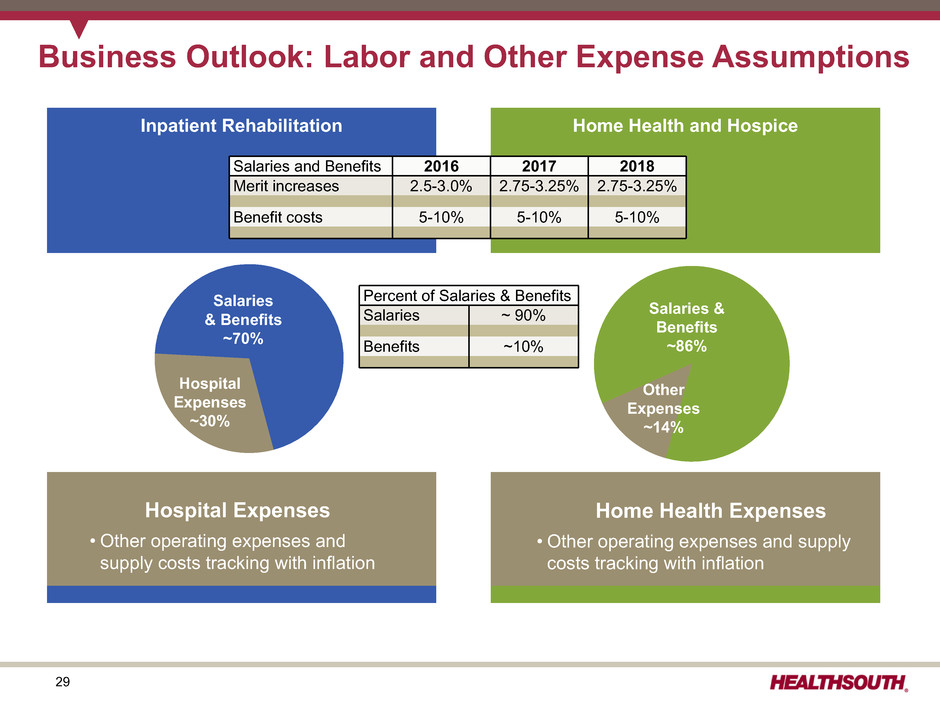
29 Inpatient Rehabilitation Home Health and Hospice Business Outlook: Labor and Other Expense Assumptions Salaries & Benefits ~70% Hospital Expenses ~30% Salaries and Benefits 2016 2017 2018 Merit increases 2.5-3.0% 2.75-3.25% 2.75-3.25% Benefit costs 5-10% 5-10% 5-10% Hospital Expenses • Other operating expenses and supply costs tracking with inflation Salaries & Benefits ~86% Other Expenses ~14% Home Health Expenses • Other operating expenses and supply costs tracking with inflation Percent of Salaries & Benefits Salaries ~ 90% Benefits ~10%
30 Free Cash Flow
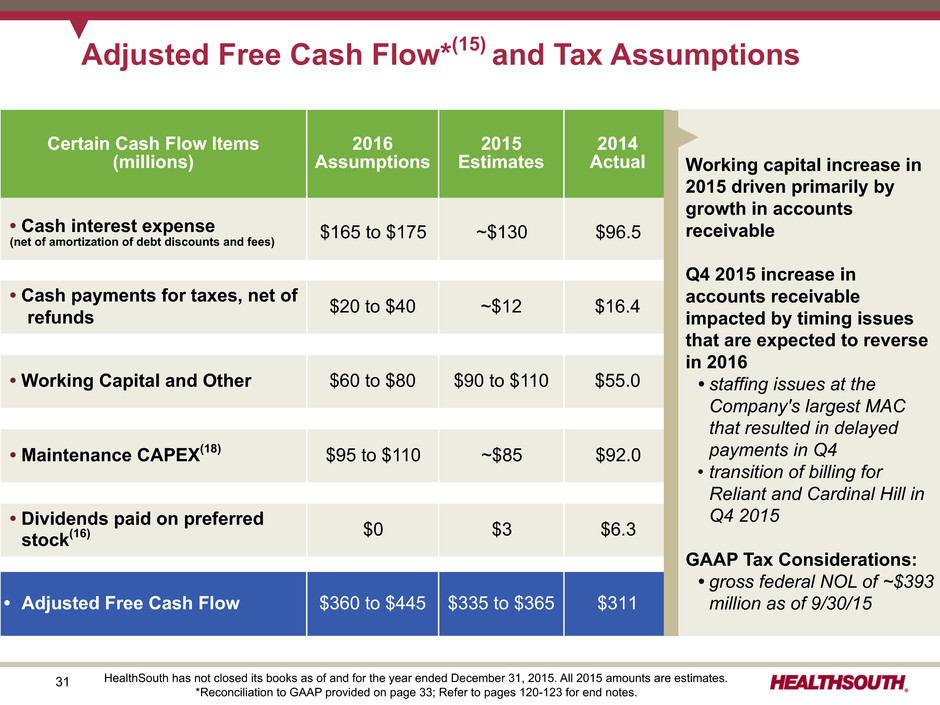
31 Adjusted Free Cash Flow*(15) and Tax Assumptions Certain Cash Flow Items (millions) 2016 Assumptions 2015 Estimates 2014 Actual • Cash interest expense (net of amortization of debt discounts and fees) $165 to $175 ~$130 $96.5 • Cash payments for taxes, net of refunds $20 to $40 ~$12 $16.4 • Working Capital and Other $60 to $80 $90 to $110 $55.0 • Maintenance CAPEX(18) $95 to $110 ~$85 $92.0 • Dividends paid on preferred stock(16) $0 $3 $6.3 • Adjusted Free Cash Flow $360 to $445 $335 to $365 $311 Working capital increase in 2015 driven primarily by growth in accounts receivable Q4 2015 increase in accounts receivable impacted by timing issues that are expected to reverse in 2016 • staffing issues at the Company's largest MAC that resulted in delayed payments in Q4 • transition of billing for Reliant and Cardinal Hill in Q4 2015 GAAP Tax Considerations: • gross federal NOL of ~$393 million as of 9/30/15 HealthSouth has not closed its books as of and for the year ended December 31, 2015. All 2015 amounts are estimates. *Reconciliation to GAAP provided on page 33; Refer to pages 120-123 for end notes.
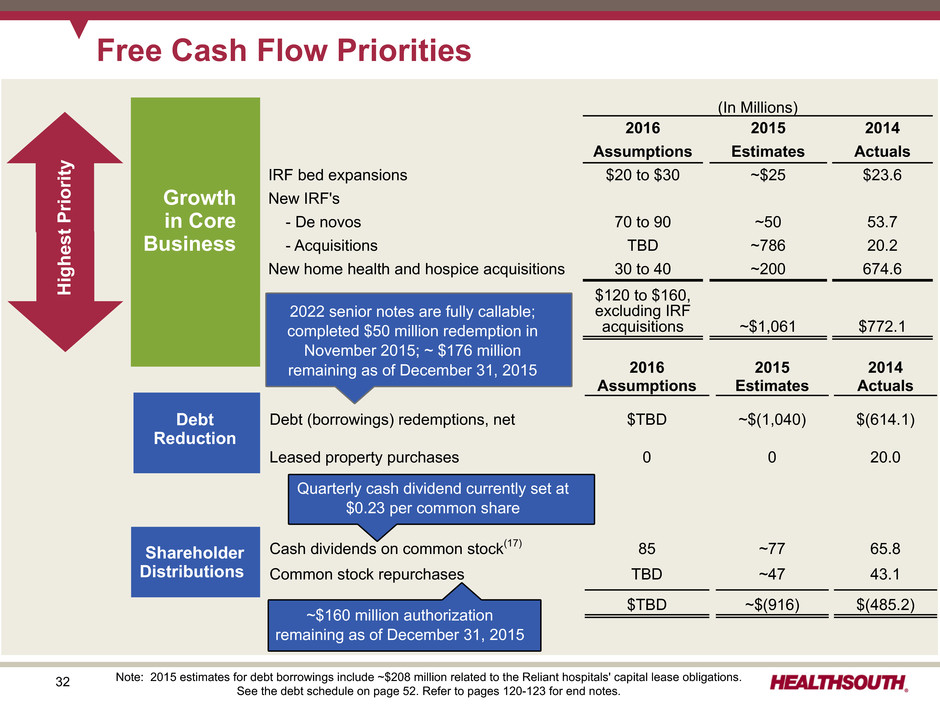
32 Free Cash Flow Priorities (In Millions) 2016 2015 2014 Assumptions Estimates Actuals IRF bed expansions $20 to $30 ~$25 $23.6 New IRF's - De novos 70 to 90 ~50 53.7 - Acquisitions TBD ~786 20.2 New home health and hospice acquisitions 30 to 40 ~200 674.6 $120 to $160, excluding IRF acquisitions ~$1,061 $772.1 2016 2015 2014 Assumptions Estimates Actuals Debt (borrowings) redemptions, net $TBD ~$(1,040) $(614.1) Leased property purchases 0 0 20.0 Cash dividends on common stock(17) 85 ~77 65.8 Common stock repurchases TBD ~47 43.1 $TBD ~$(916) $(485.2) Debt Reduction Growth in Core Business Shareholder Distributions Highest Priorit y 2022 senior notes are fully callable; completed $50 million redemption in November 2015; ~ $176 million remaining as of December 31, 2015 Quarterly cash dividend currently set at $0.23 per common share Note: 2015 estimates for debt borrowings include ~$208 million related to the Reliant hospitals' capital lease obligations. See the debt schedule on page 52. Refer to pages 120-123 for end notes. ~$160 million authorization remaining as of December 31, 2015
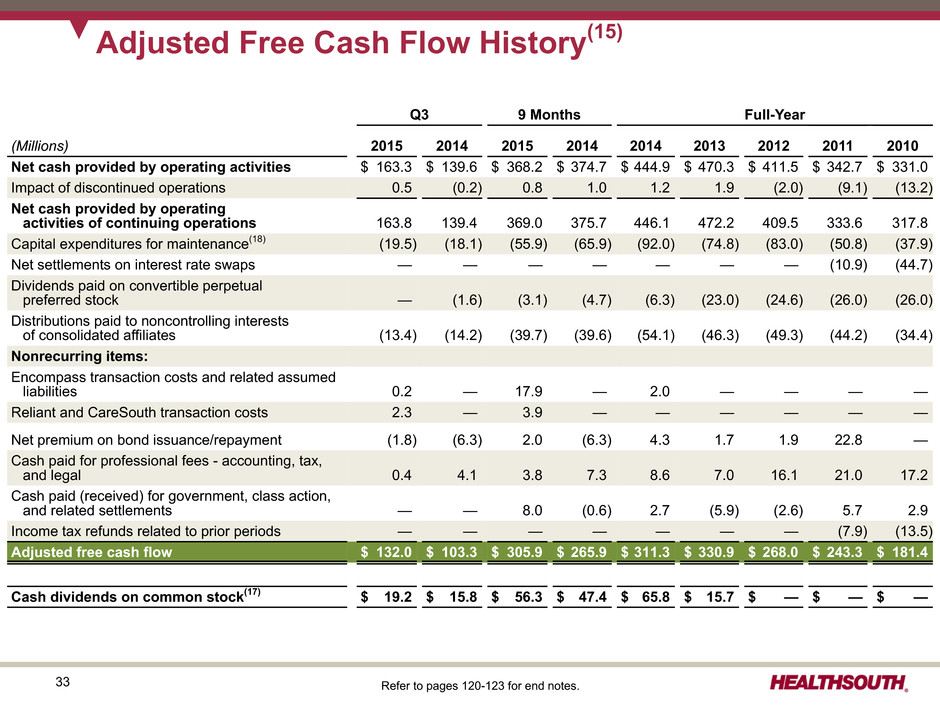
33 Adjusted Free Cash Flow History(15) Q3 9 Months Full-Year (Millions) 2015 2014 2015 2014 2014 2013 2012 2011 2010 Net cash provided by operating activities $ 163.3 $ 139.6 $ 368.2 $ 374.7 $ 444.9 $ 470.3 $ 411.5 $ 342.7 $ 331.0 Impact of discontinued operations 0.5 (0.2) 0.8 1.0 1.2 1.9 (2.0) (9.1) (13.2) Net cash provided by operating activities of continuing operations 163.8 139.4 369.0 375.7 446.1 472.2 409.5 333.6 317.8 Capital expenditures for maintenance(18) (19.5) (18.1) (55.9) (65.9) (92.0) (74.8) (83.0) (50.8) (37.9) Net settlements on interest rate swaps — — — — — — — (10.9) (44.7) Dividends paid on convertible perpetual preferred stock — (1.6) (3.1) (4.7) (6.3) (23.0) (24.6) (26.0) (26.0) Distributions paid to noncontrolling interests of consolidated affiliates (13.4) (14.2) (39.7) (39.6) (54.1) (46.3) (49.3) (44.2) (34.4) Nonrecurring items: Encompass transaction costs and related assumed liabilities 0.2 — 17.9 — 2.0 — — — — Reliant and CareSouth transaction costs 2.3 — 3.9 — — — — — — Net premium on bond issuance/repayment (1.8) (6.3) 2.0 (6.3) 4.3 1.7 1.9 22.8 — Cash paid for professional fees - accounting, tax, and legal 0.4 4.1 3.8 7.3 8.6 7.0 16.1 21.0 17.2 Cash paid (received) for government, class action, and related settlements — — 8.0 (0.6) 2.7 (5.9) (2.6) 5.7 2.9 Income tax refunds related to prior periods — — — — — — — (7.9) (13.5) Adjusted free cash flow $ 132.0 $ 103.3 $ 305.9 $ 265.9 $ 311.3 $ 330.9 $ 268.0 $ 243.3 $ 181.4 Cash dividends on common stock(17) $ 19.2 $ 15.8 $ 56.3 $ 47.4 $ 65.8 $ 15.7 $ — $ — $ — Refer to pages 120-123 for end notes.
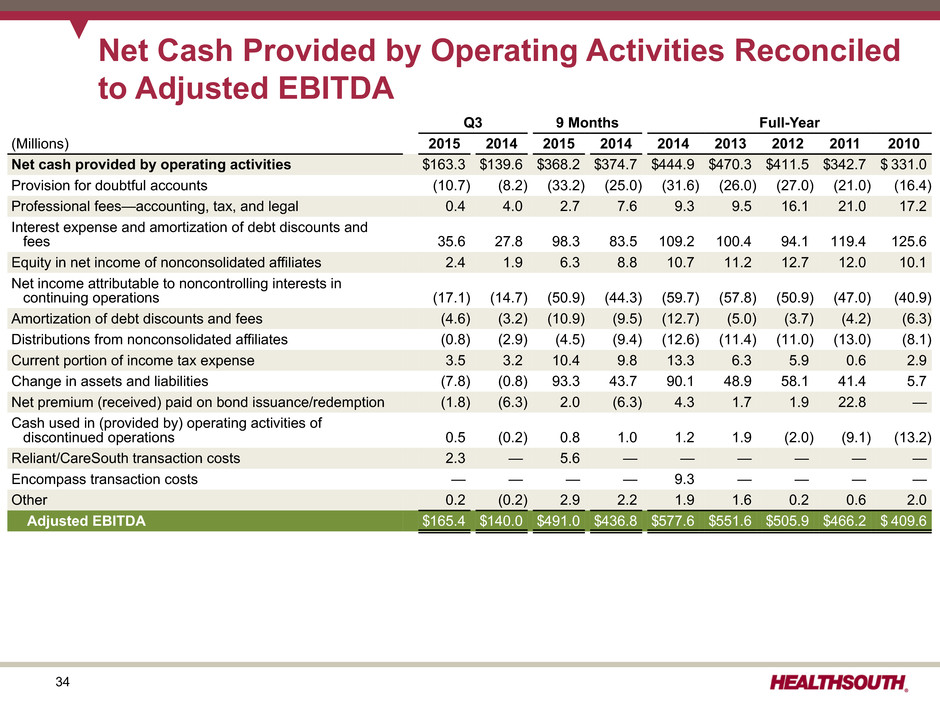
34 Net Cash Provided by Operating Activities Reconciled to Adjusted EBITDA Q3 9 Months Full-Year (Millions) 2015 2014 2015 2014 2014 2013 2012 2011 2010 Net cash provided by operating activities $163.3 $139.6 $368.2 $374.7 $444.9 $470.3 $411.5 $342.7 $ 331.0 Provision for doubtful accounts (10.7) (8.2) (33.2) (25.0) (31.6) (26.0) (27.0) (21.0) (16.4) Professional fees—accounting, tax, and legal 0.4 4.0 2.7 7.6 9.3 9.5 16.1 21.0 17.2 Interest expense and amortization of debt discounts and fees 35.6 27.8 98.3 83.5 109.2 100.4 94.1 119.4 125.6 Equity in net income of nonconsolidated affiliates 2.4 1.9 6.3 8.8 10.7 11.2 12.7 12.0 10.1 Net income attributable to noncontrolling interests in continuing operations (17.1) (14.7) (50.9) (44.3) (59.7) (57.8) (50.9) (47.0) (40.9) Amortization of debt discounts and fees (4.6) (3.2) (10.9) (9.5) (12.7) (5.0) (3.7) (4.2) (6.3) Distributions from nonconsolidated affiliates (0.8) (2.9) (4.5) (9.4) (12.6) (11.4) (11.0) (13.0) (8.1) Current portion of income tax expense 3.5 3.2 10.4 9.8 13.3 6.3 5.9 0.6 2.9 Change in assets and liabilities (7.8) (0.8) 93.3 43.7 90.1 48.9 58.1 41.4 5.7 Net premium (received) paid on bond issuance/redemption (1.8) (6.3) 2.0 (6.3) 4.3 1.7 1.9 22.8 — Cash used in (provided by) operating activities of discontinued operations 0.5 (0.2) 0.8 1.0 1.2 1.9 (2.0) (9.1) (13.2) Reliant/CareSouth transaction costs 2.3 — 5.6 — — — — — — Encompass transaction costs — — — — 9.3 — — — — Other 0.2 (0.2) 2.9 2.2 1.9 1.6 0.2 0.6 2.0 Adjusted EBITDA $165.4 $140.0 $491.0 $436.8 $577.6 $551.6 $505.9 $466.2 $ 409.6

35 Growth

36 % Increase in beds 3% 3% 4% 18% Total number of beds 6,461 6,656 6,825 7,095 8,404 Total number of IRFs 99 100 103 107 121 1,600 1,400 1,200 1,000 800 600 400 200 0 130 120 110 100 90 80 70 60 50 2011 2012 2013 2014 2015 est. Multi-faceted IRF Growth Strategy 2015 projected total bed count increase of approx. 18% Ÿ Reliant (857 IRF beds; 45 SNF beds) Ÿ Cardinal Hill (158 IRF beds;74 SNF beds) Ÿ Savannah, GA (50 beds) Ÿ Franklin, TN (40 beds) Ÿ Bed expansions, net (85 beds) De Novos Acquisitions/JVs Bed Expansions Total IRFsIncremental Beds 2016 projected bed additions Ÿ Modesto, CA (50 beds) Ÿ Broken Arrow, OK (40beds) Ÿ Hot Springs, AR (40 beds) Ÿ Bryan, TX (30 beds)
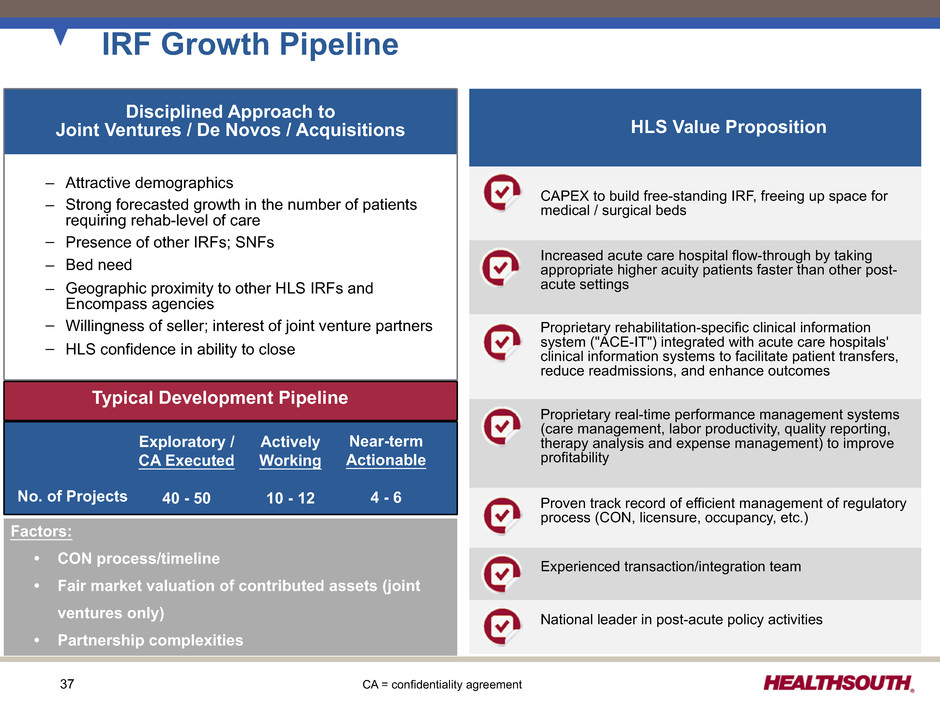
37 IRF Growth Pipeline Typical Development Pipeline Factors: • CON process/timeline • Fair market valuation of contributed assets (joint ventures only) • Partnership complexities HLS Value Proposition CAPEX to build free-standing IRF, freeing up space for medical / surgical beds Increased acute care hospital flow-through by taking appropriate higher acuity patients faster than other post- acute settings Proprietary rehabilitation-specific clinical information system ("ACE-IT") integrated with acute care hospitals' clinical information systems to facilitate patient transfers, reduce readmissions, and enhance outcomes Proprietary real-time performance management systems (care management, labor productivity, quality reporting, therapy analysis and expense management) to improve profitability Proven track record of efficient management of regulatory process (CON, licensure, occupancy, etc.) Experienced transaction/integration team National leader in post-acute policy activities Disciplined Approach to Joint Ventures / De Novos / Acquisitions – Attractive demographics – Strong forecasted growth in the number of patients requiring rehab-level of care – Presence of other IRFs; SNFs – Bed need – Geographic proximity to other HLS IRFs and Encompass agencies – Willingness of seller; interest of joint venture partners – HLS confidence in ability to close No. of Projects Exploratory / CA Executed 40 - 50 Actively Working 10 - 12 Near-term Actionable 4 - 6 CA = confidentiality agreement
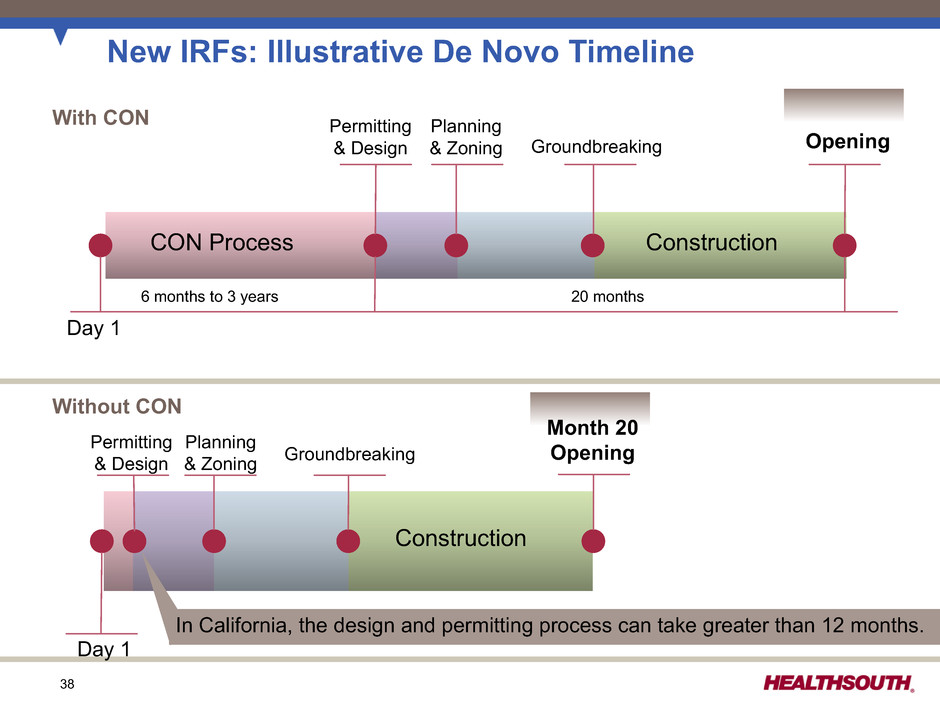
38 New IRFs: Illustrative De Novo Timeline Day 1 With CON Permitting & Design Planning & Zoning Groundbreaking Permitting & Design Planning & Zoning Groundbreaking Day 1 Without CON 6 months to 3 years 20 months CON Process Construction Construction Opening Month 20 Opening In California, the design and permitting process can take greater than 12 months.
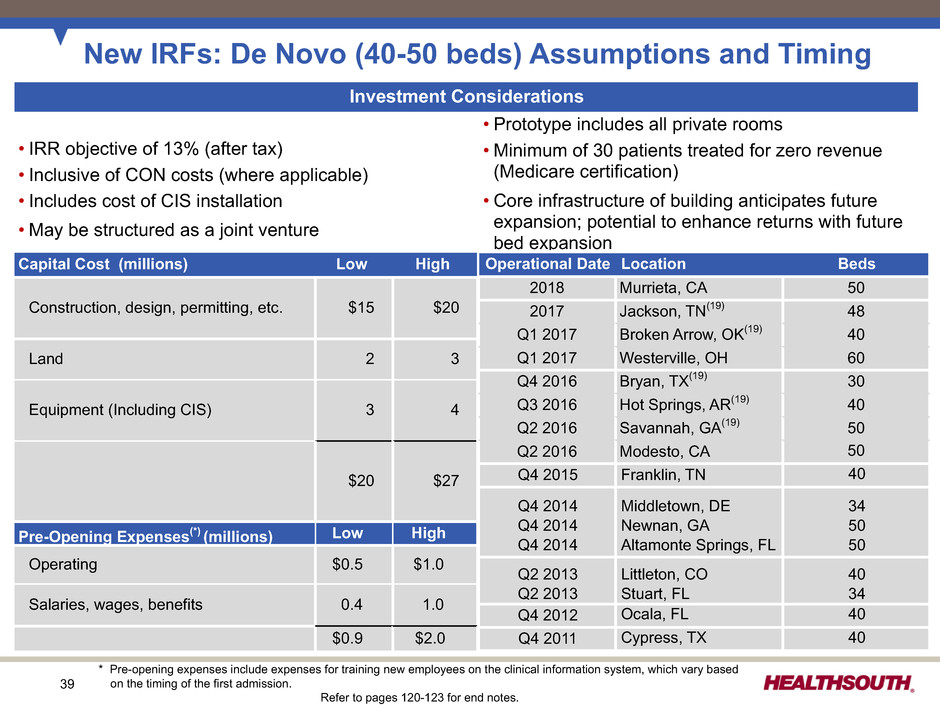
39 Investment Considerations • IRR objective of 13% (after tax) • Inclusive of CON costs (where applicable) • Includes cost of CIS installation • May be structured as a joint venture • Prototype includes all private rooms • Minimum of 30 patients treated for zero revenue (Medicare certification) • Core infrastructure of building anticipates future expansion; potential to enhance returns with future bed expansion Capital Cost (millions) Low High Operational Date Location Beds Construction, design, permitting, etc. $15 $20 2018 Murrieta, CA 50 2017 Bryan, TX 30 2017 Jackson, TN(34) 48 Land 2 3 Q1 2017 Westerville, OH 60Q4 2016 Broken Arrow, OK(34) 40 Equipment (Including CIS) 3 4 Q2 2016 Hot Springs, AR(34) 40 Q2 2016 Savannah, GA(34) 50 Q2 2016 Modesto, CA 50 $20 $27 Q4 2015 Franklin, TN 40 Q4 2014 Q4 2014 Q4 2014 Middletown, DE Newnan, GA Altamonte Springs, FL 34 50 50 Pre-Opening Expenses(*) (millions) Low High Q2 2013 Q2 2013 Littleton, CO Stuart, FL 40 34Operating $0.5 $1.0 Q4 2012 Ocala, FL 40 Salaries, wages, benefits 0.4 1.0 Q4 2011 Cypress, TX 40 $0.9 $2.0 New IRFs: De Novo (40-50 beds) Assumptions and Timing * Pre-opening expenses include expenses for training new employees on the clinical information system, which vary based on the timing of the first admission. Refer to pages 120-123 for end notes. Operational Date Location Beds 2018 Murrieta, CA 50 2017 Jackson, TN(19) 48 Q1 2017 Broken Arrow, OK(19) 40 Q1 2017 Westerville, OH 60 Q4 2016 Bryan, TX(19) 30 Q3 2016 Hot Springs, AR(19) 40 Q2 2016 Savannah, GA(19) 50 Q2 2016 Modesto, CA 50 Q4 2015 Franklin, TN 40 Q4 2014 Q4 2014 Q4 2014 Middletown, DE Newnan, GA Altamonte Springs, FL 34 50 50 Q2 2013 Q2 2013 Littleton, CO Stuart, FL 40 34 Q4 2012 Ocala, FL 40 Q4 2011 Cypress, TX 40
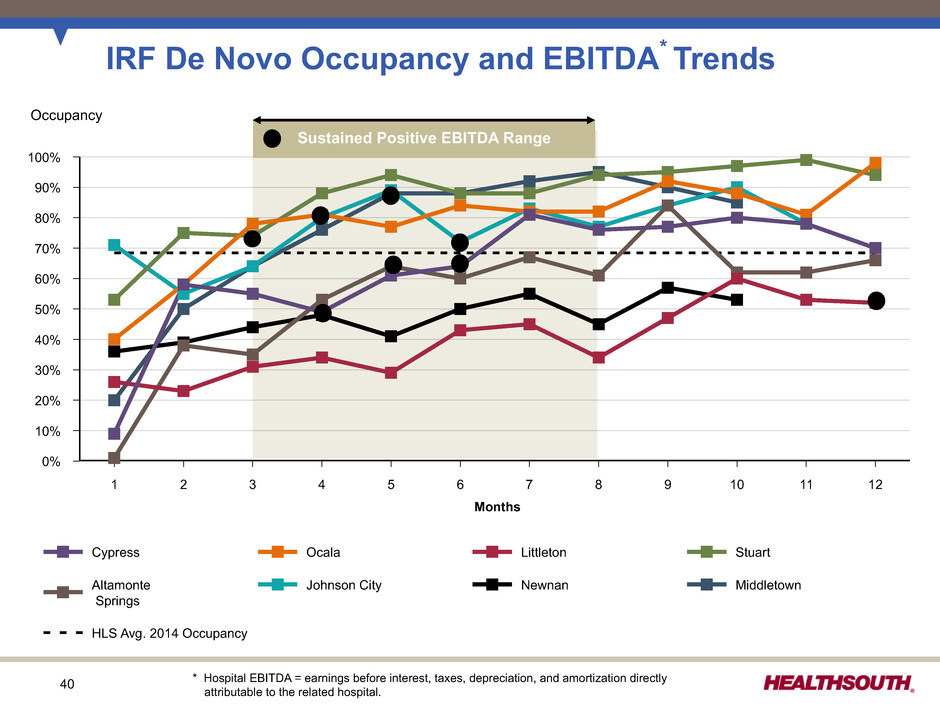
40 Cypress Ocala Littleton Stuart Altamonte Springs Johnson City Newnan Middletown HLS Avg. 2014 Occupancy 100% 90% 80% 70% 60% 50% 40% 30% 20% 10% 0% 1 2 3 4 5 6 7 8 9 10 11 12 Months IRF De Novo Occupancy and EBITDA* Trends Occupancy Sustained Positive EBITDA Range * Hospital EBITDA = earnings before interest, taxes, depreciation, and amortization directly attributable to the related hospital.
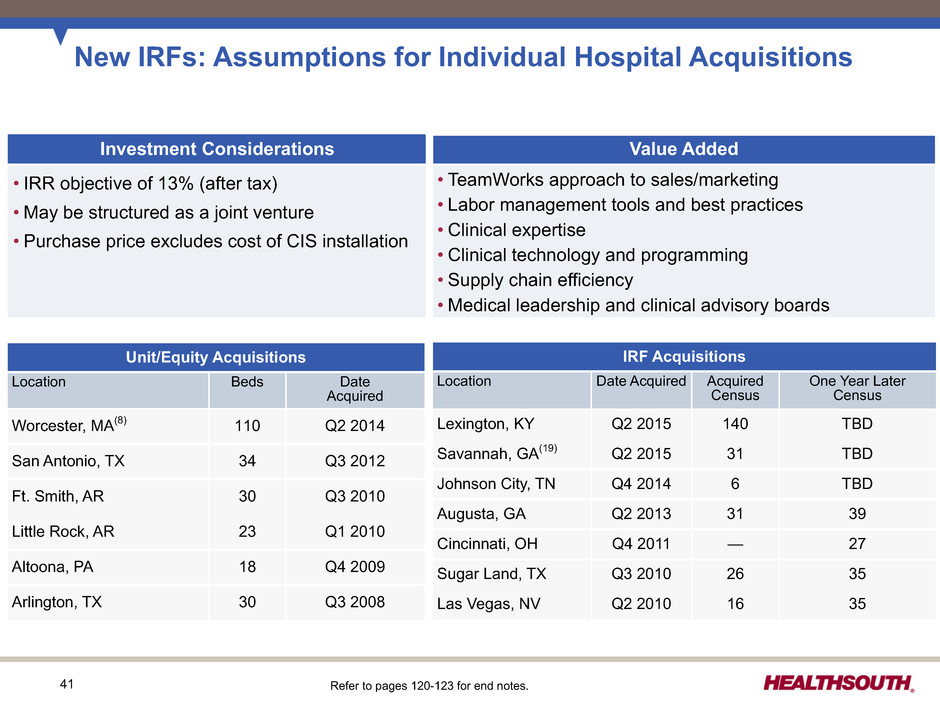
41 New IRFs: Assumptions for Individual Hospital Acquisitions Unit/Equity Acquisitions Location Beds Date Acquired Worcester, MA(8) 110 Q2 2014 San Antonio, TX 34 Q3 2012 Ft. Smith, AR 30 Q3 2010 Little Rock, AR 23 Q1 2010 Altoona, PA 18 Q4 2009 Arlington, TX 30 Q3 2008 IRF Acquisitions Location Date Acquired Acquired Census One Year Later Census Lexington, KY Q2 2015 140 TBD Savannah, GA(19) Q2 2015 31 TBD Johnson City, TN Q4 2014 6 TBD Augusta, GA Q2 2013 31 39 Cincinnati, OH Q4 2011 — 27 Sugar Land, TX Q3 2010 26 35 Las Vegas, NV Q2 2010 16 35 Investment Considerations Value Added • IRR objective of 13% (after tax) • May be structured as a joint venture • Purchase price excludes cost of CIS installation • TeamWorks approach to sales/marketing • Labor management tools and best practices • Clinical expertise • Clinical technology and programming • Supply chain efficiency • Medical leadership and clinical advisory boards Refer to pages 120-123 for end notes.
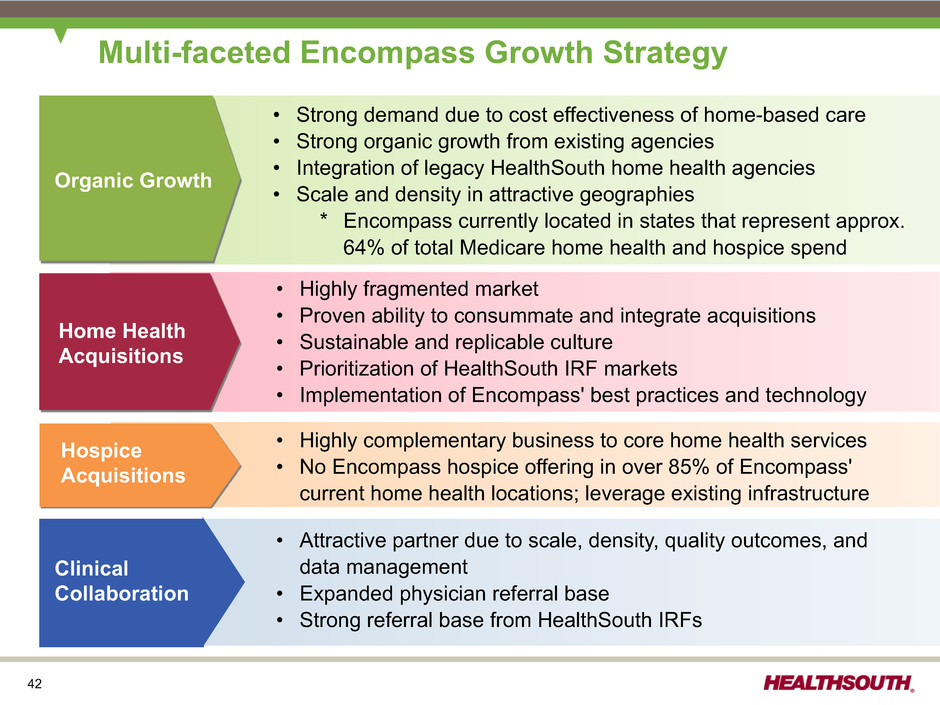
42 Organic Growth • Strong demand due to cost effectiveness of home-based care • Strong organic growth from existing agencies • Integration of legacy HealthSouth home health agencies • Scale and density in attractive geographies * Encompass currently located in states that represent approx. 64% of total Medicare home health and hospice spend • Attractive partner due to scale, density, quality outcomes, and data management • Expanded physician referral base • Strong referral base from HealthSouth IRFs Cost Assessment • Highly fragmented market • Proven ability to consummate and integrate acquisitions • Sustainable and replicable culture • Prioritization of HealthSouth IRF markets • Implementation of Encompass' best practices and technology Home Health Acquisitions Hospice Acquisitions Clinical Collaboration Multi-faceted Encompass Growth Strategy • Highly complementary business to core home health services • No Encompass hospice offering in over 85% of Encompass' current home health locations; leverage existing infrastructure
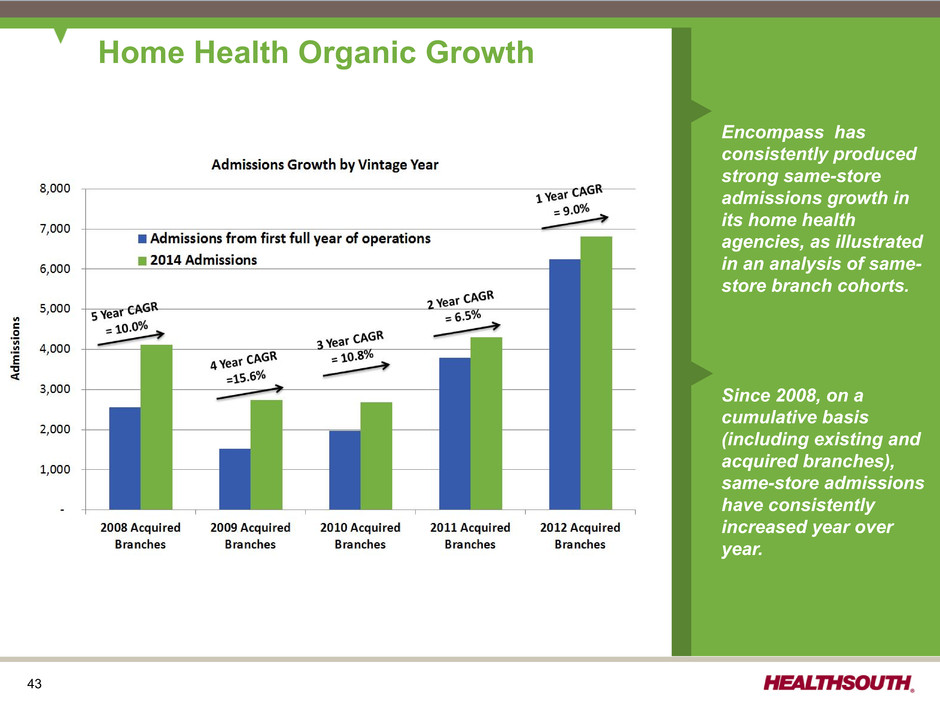
43 Home Health Organic Growth Encompass has consistently produced strong same-store admissions growth in its home health agencies, as illustrated in an analysis of same- store branch cohorts. Since 2008, on a cumulative basis (including existing and acquired branches), same-store admissions have consistently increased year over year.
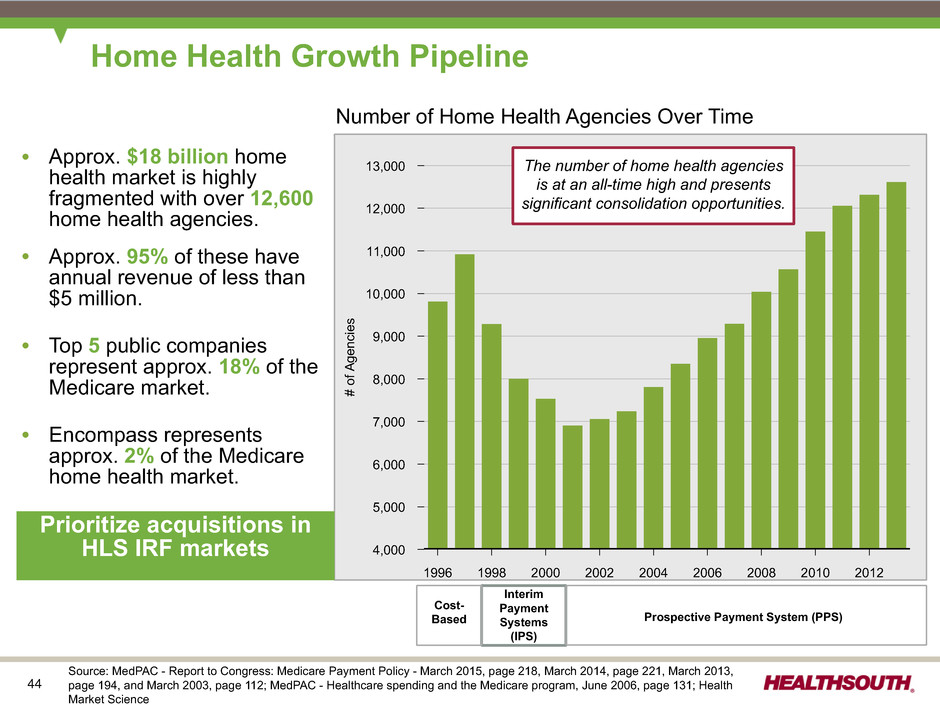
44 13,000 12,000 11,000 10,000 9,000 8,000 7,000 6,000 5,000 4,000 # of Ag en ci es 1996 1998 2000 2002 2004 2006 2008 2010 2012 Home Health Growth Pipeline Ÿ Approx. $18 billion home health market is highly fragmented with over 12,600 home health agencies. Ÿ Approx. 95% of these have annual revenue of less than $5 million. Ÿ Top 5 public companies represent approx. 18% of the Medicare market. Ÿ Encompass represents approx. 2% of the Medicare home health market. Prioritize acquisitions in HLS IRF markets Number of Home Health Agencies Over Time Cost- Based Interim Payment Systems (IPS) Prospective Payment System (PPS) The number of home health agencies is at an all-time high and presents significant consolidation opportunities. Source: MedPAC - Report to Congress: Medicare Payment Policy - March 2015, page 218, March 2014, page 221, March 2013, page 194, and March 2003, page 112; MedPAC - Healthcare spending and the Medicare program, June 2006, page 131; Health Market Science
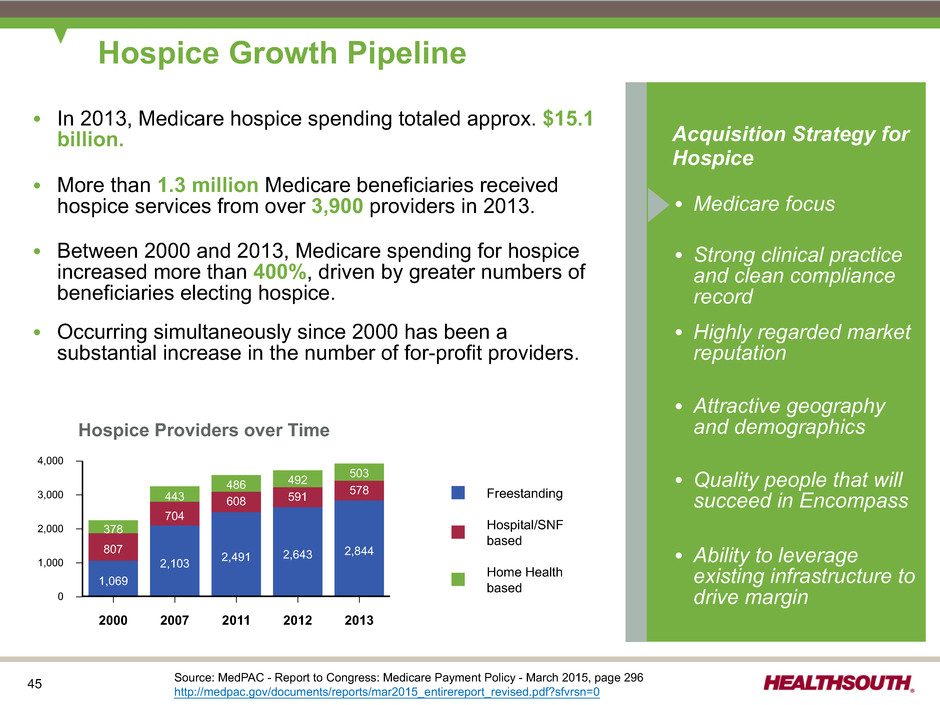
45 Hospice Growth Pipeline Ÿ In 2013, Medicare hospice spending totaled approx. $15.1 billion. Ÿ More than 1.3 million Medicare beneficiaries received hospice services from over 3,900 providers in 2013. Ÿ Between 2000 and 2013, Medicare spending for hospice increased more than 400%, driven by greater numbers of beneficiaries electing hospice. Ÿ Occurring simultaneously since 2000 has been a substantial increase in the number of for-profit providers. Acquisition Strategy for Hospice Ÿ Medicare focus Ÿ Strong clinical practice and clean compliance record Ÿ Highly regarded market reputation Ÿ Attractive geography and demographics Ÿ Quality people that will succeed in Encompass Ÿ Ability to leverage existing infrastructure to drive margin Freestanding Hospital/SNF based Home Health based 4,000 3,000 2,000 1,000 0 2000 2007 2011 2012 2013 1,069 2,103 2,491 2,643 2,844807 704 608 591 578 378 443 486 492 503 Hospice Providers over Time Source: MedPAC - Report to Congress: Medicare Payment Policy - March 2015, page 296 http://medpac.gov/documents/reports/mar2015_entirereport_revised.pdf?sfvrsn=0
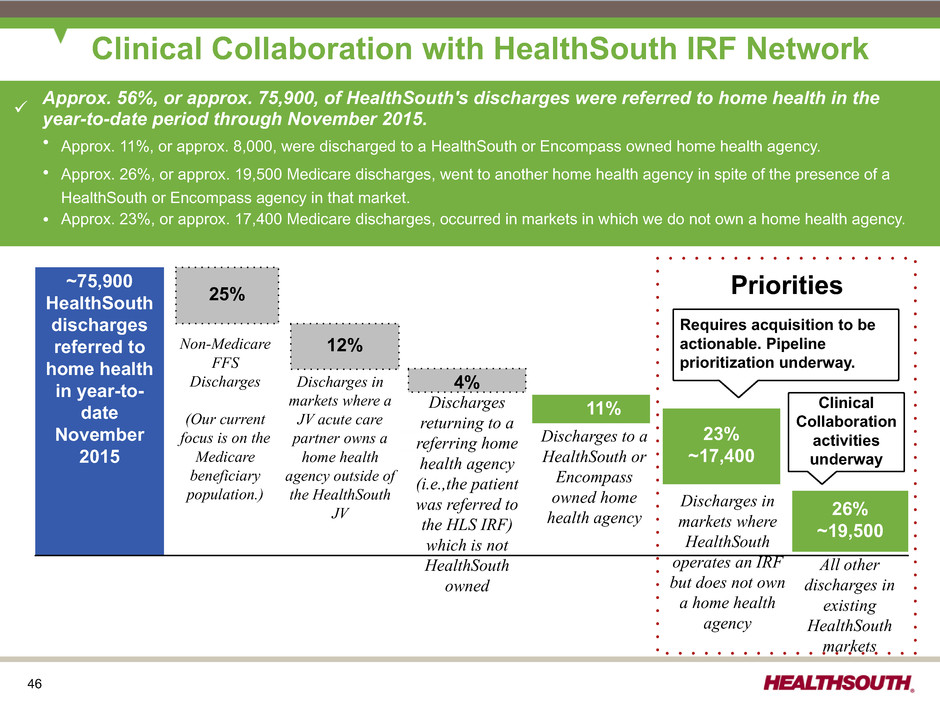
46 HealthSouth 70% non-overlap 25% Clinical Collaboration with HealthSouth IRF Network ~75,900 HealthSouth discharges referred to home health in year-to- date November 2015 Non-Medicare FFS Discharges (Our current focus is on the Medicare beneficiary population.) 12% 4%Discharges in markets where a JV acute care partner owns a home health agency outside of the HealthSouth JV Discharges returning to a referring home health agency (i.e.,the patient was referred to the HLS IRF) which is not HealthSouth owned 11% 23% ~17,400 26% ~19,500 Discharges to a HealthSouth or Encompass owned home health agency Discharges in markets where HealthSouth operates an IRF but does not own a home health agency All other discharges in existing HealthSouth markets Priorities Requires acquisition to be actionable. Pipeline prioritization underway. Clinical Collaboration activities underway ü Approx. 56%, or approx. 75,900, of HealthSouth's discharges were referred to home health in theyear-to-date period through November 2015. Ÿ Approx. 11%, or approx. 8,000, were discharged to a HealthSouth or Encompass owned home health agency. Ÿ Approx. 26%, or approx. 19,500 Medicare discharges, went to another home health agency in spite of the presence of a HealthSouth or Encompass agency in that market. Ÿ Approx. 23%, or approx. 17,400 Medicare discharges, occurred in markets in which we do not own a home health agency.
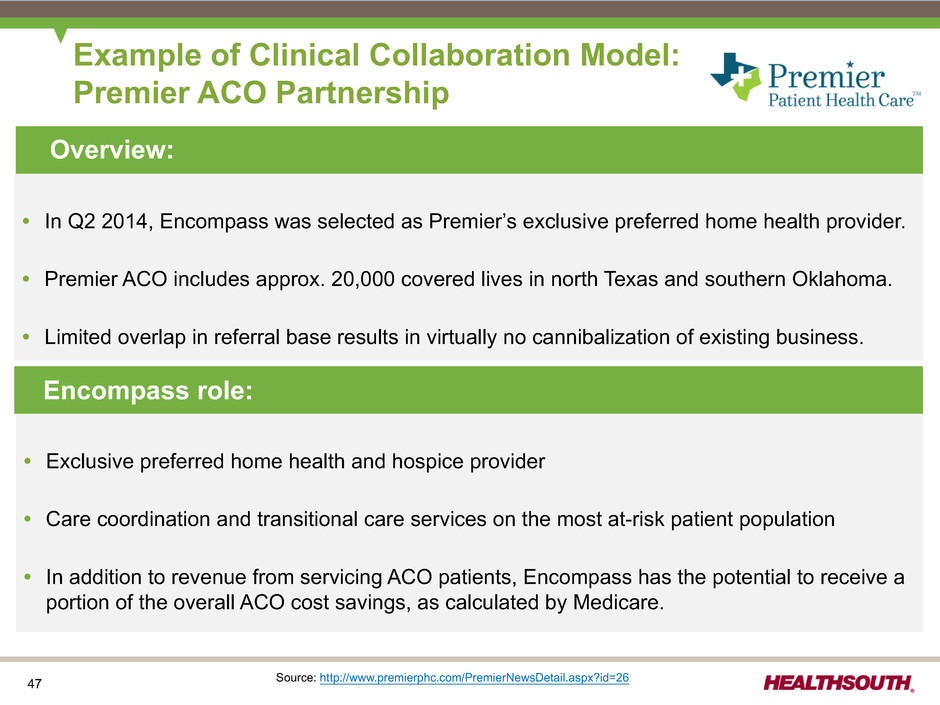
47 • In Q2 2014, Encompass was selected as Premier’s exclusive preferred home health provider. • Premier ACO includes approx. 20,000 covered lives in north Texas and southern Oklahoma. • Limited overlap in referral base results in virtually no cannibalization of existing business. Example of Clinical Collaboration Model: Premier ACO Partnership Overview: • Exclusive preferred home health and hospice provider • Care coordination and transitional care services on the most at-risk patient population • In addition to revenue from servicing ACO patients, Encompass has the potential to receive a portion of the overall ACO cost savings, as calculated by Medicare. Encompass role: Source: http://www.premierphc.com/PremierNewsDetail.aspx?id=26
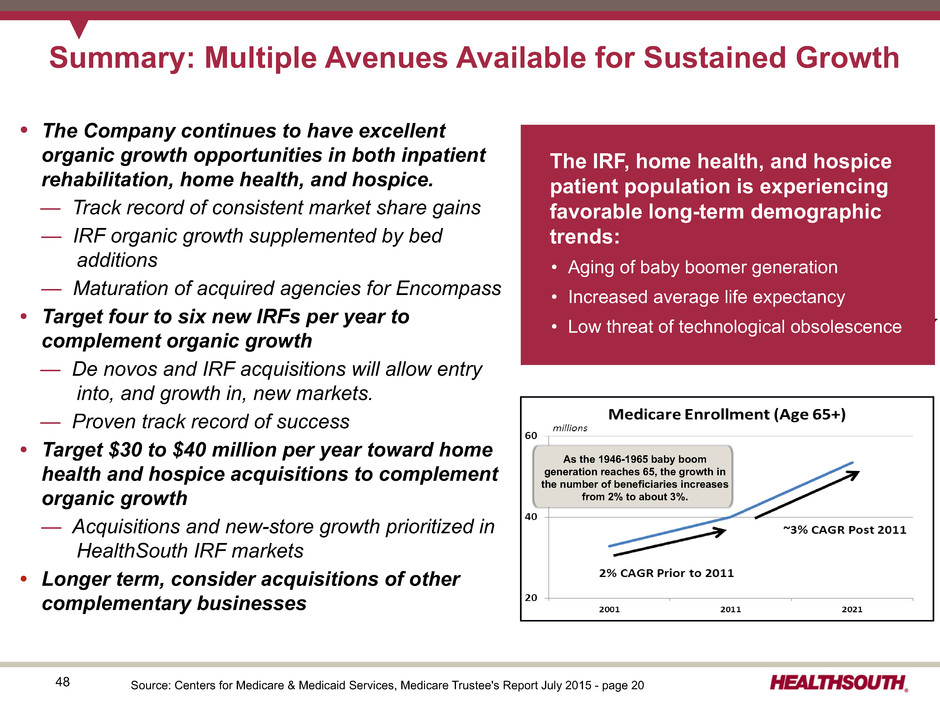
48 Summary: Multiple Avenues Available for Sustained Growth • The Company continues to have excellent organic growth opportunities in both inpatient rehabilitation, home health, and hospice. — Track record of consistent market share gains — IRF organic growth supplemented by bed additions — Maturation of acquired agencies for Encompass • Target four to six new IRFs per year to complement organic growth — De novos and IRF acquisitions will allow entry into, and growth in, new markets. — Proven track record of success • Target $30 to $40 million per year toward home health and hospice acquisitions to complement organic growth — Acquisitions and new-store growth prioritized in HealthSouth IRF markets • Longer term, consider acquisitions of other complementary businesses As the 1946-1965 baby boom generation reaches 65, the growth in the number of beneficiaries increases from 2% to about 3%. Source: Centers for Medicare & Medicaid Services, Medicare Trustee's Report July 2015 - page 20 The IRF, home health, and hospice patient population is experiencing favorable long-term demographic trends: • Aging of baby boomer generation • Increased average life expectancy • Low threat of technological obsolescence
49 Capital Structure
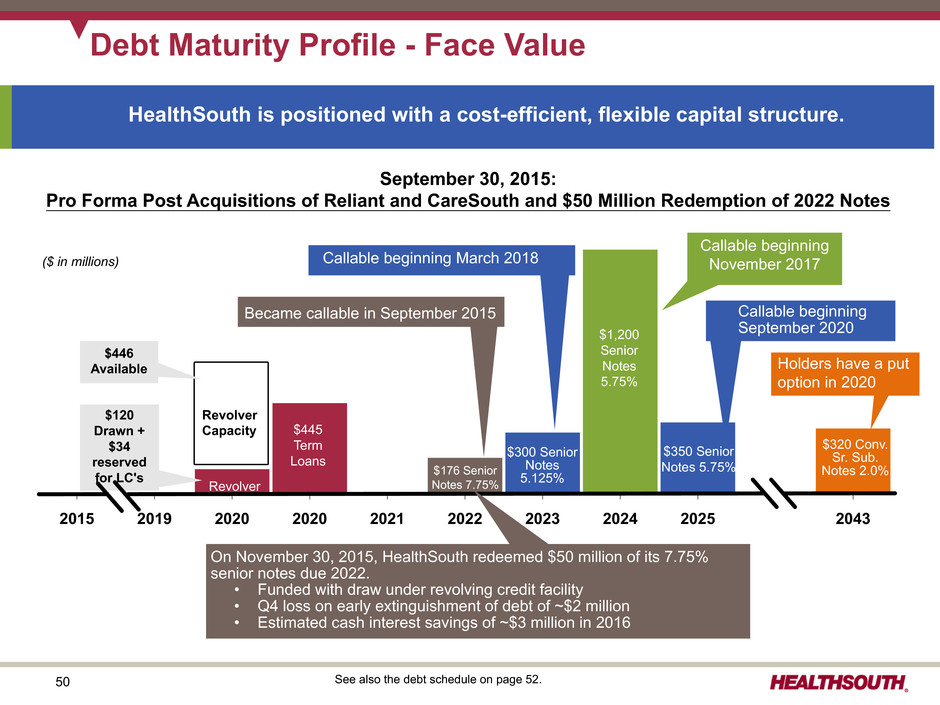
50 2015 2019 2020 2020 2021 2022 2023 2024 2025 2043 $350 Senior Notes 5.75% $1,200 Senior Notes 5.75% $320 Conv. Sr. Sub. Notes 2.0% $300 Senior Notes 5.125% $120 Drawn + $34 reserved for LC's Holders have a put option in 2020 September 30, 2015: Pro Forma Post Acquisitions of Reliant and CareSouth and $50 Million Redemption of 2022 Notes Debt Maturity Profile - Face Value ($ in millions) $446 Available $176 Senior Notes 7.75% See also the debt schedule on page 52. Callable beginning November 2017 HealthSouth is positioned with a cost-efficient, flexible capital structure. Callable beginning March 2018 Revolver Revolver Capacity $445 Term Loans Became callable in September 2015 On November 30, 2015, HealthSouth redeemed $50 million of its 7.75% senior notes due 2022. • Funded with draw under revolving credit facility • Q4 loss on early extinguishment of debt of ~$2 million • Estimated cash interest savings of ~$3 million in 2016 Callable beginning September 2020
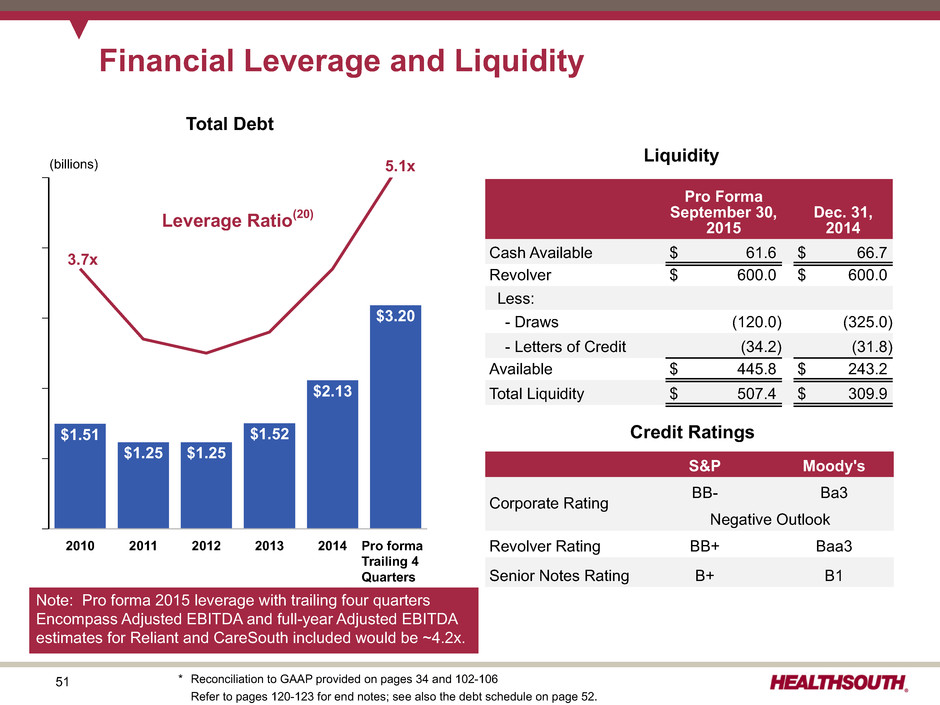
51 S&P Moody's Corporate Rating BB- Ba3 Negative Outlook Revolver Rating BB+ Baa3 Senior Notes Rating B+ B1 Financial Leverage and Liquidity (1) Liquidity Credit Ratings 2010 2011 2012 2013 2014 Pro forma Trailing 4 Quarters $1.51 $1.25 $1.25 $1.52 $2.13 $3.20 (billions) Leverage Ratio(20) Total Debt 3.7x 5.1x Pro Forma September 30, 2015 Dec. 31, 2014 Cash Available $ 61.6 $ 66.7 Revolver $ 600.0 $ 600.0 Less: - Draws (120.0) (325.0) - Letters of Credit (34.2) (31.8) Available $ 445.8 $ 243.2 Total Liquidity $ 507.4 $ 309.9 * Reconciliation to GAAP provided on pages 34 and 102-106 Refer to pages 120-123 for end notes; see also the debt schedule on page 52. Note: Pro forma 2015 leverage with trailing four quarters Encompass Adjusted EBITDA and full-year Adjusted EBITDA estimates for Reliant and CareSouth included would be ~4.2x.
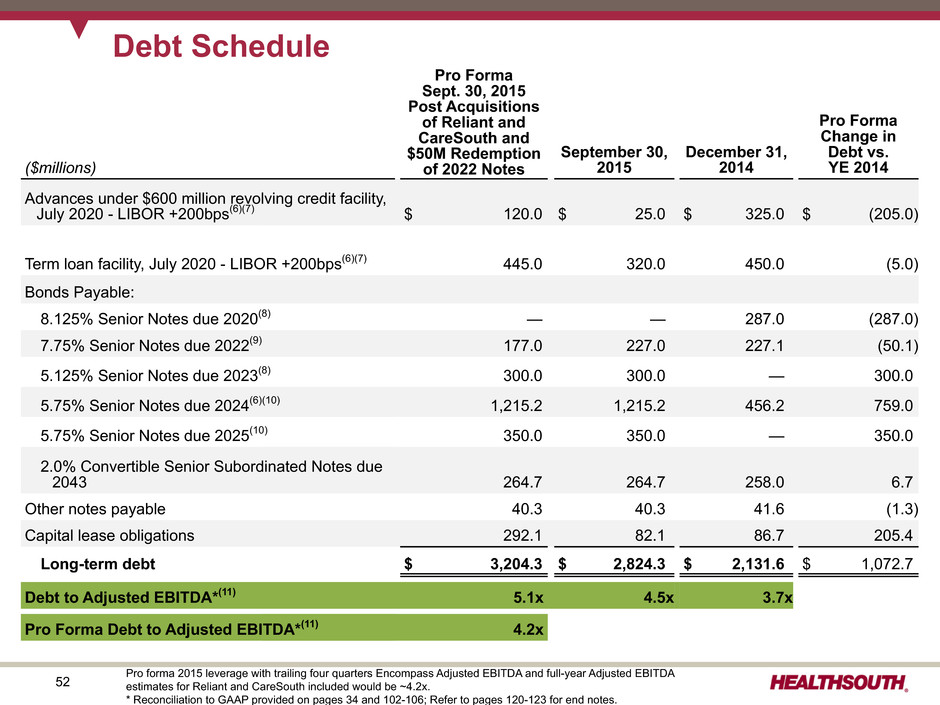
52 Debt Schedule Pro Forma Sept. 30, 2015 Post Acquisitions of Reliant and CareSouth and $50M Redemption of 2022 Notes Pro Forma Change in Debt vs. YE 2014($millions) September 30, 2015 December 31, 2014 Advances under $600 million revolving credit facility, July 2020 - LIBOR +200bps(6)(7) $ 120.0 $ 25.0 $ 325.0 $ (205.0) Term loan facility, July 2020 - LIBOR +200bps(6)(7) 445.0 320.0 450.0 (5.0) Bonds Payable: 8.125% Senior Notes due 2020(8) — — 287.0 (287.0) 7.75% Senior Notes due 2022(9) 177.0 227.0 227.1 (50.1) 5.125% Senior Notes due 2023(8) 300.0 300.0 — 300.0 5.75% Senior Notes due 2024(6)(10) 1,215.2 1,215.2 456.2 759.0 5.75% Senior Notes due 2025(10) 350.0 350.0 — 350.0 2.0% Convertible Senior Subordinated Notes due 2043 264.7 264.7 258.0 6.7 Other notes payable 40.3 40.3 41.6 (1.3) Capital lease obligations 292.1 82.1 86.7 205.4 Long-term debt $ 3,204.3 $ 2,824.3 $ 2,131.6 $ 1,072.7 Debt to Adjusted EBITDA*(11) 5.1x 4.5x 3.7x Pro Forma Debt to Adjusted EBITDA*(11) 4.2x Pro forma 2015 leverage with trailing four quarters Encompass Adjusted EBITDA and full-year Adjusted EBITDA estimates for Reliant and CareSouth included would be ~4.2x. * Reconciliation to GAAP provided on pages 34 and 102-106; Refer to pages 120-123 for end notes.
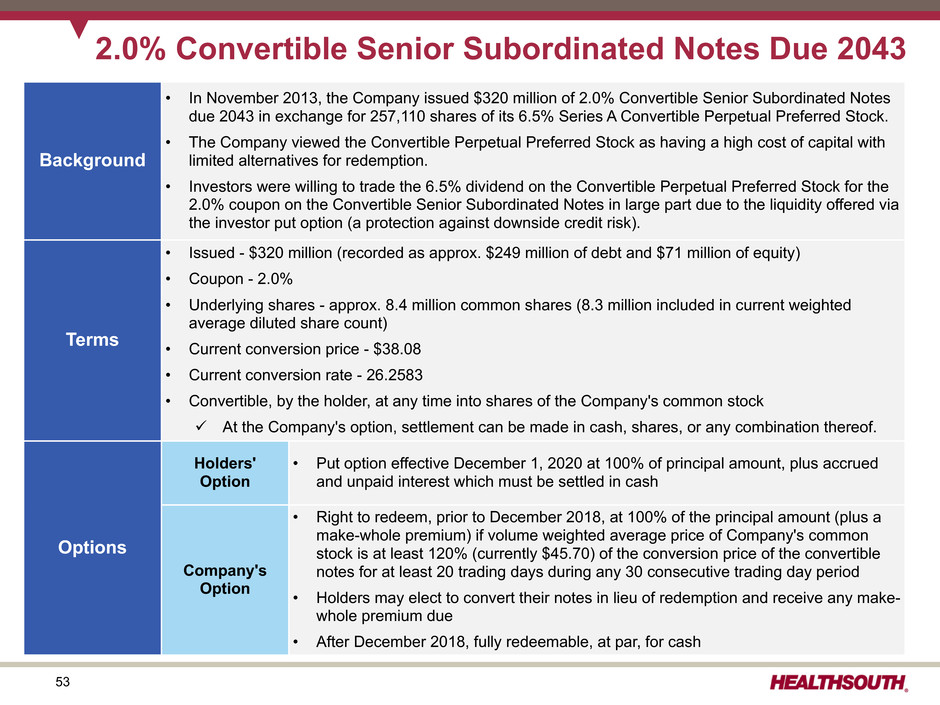
53 2.0% Convertible Senior Subordinated Notes Due 2043 Background • In November 2013, the Company issued $320 million of 2.0% Convertible Senior Subordinated Notes due 2043 in exchange for 257,110 shares of its 6.5% Series A Convertible Perpetual Preferred Stock. • The Company viewed the Convertible Perpetual Preferred Stock as having a high cost of capital with limited alternatives for redemption. • Investors were willing to trade the 6.5% dividend on the Convertible Perpetual Preferred Stock for the 2.0% coupon on the Convertible Senior Subordinated Notes in large part due to the liquidity offered via the investor put option (a protection against downside credit risk). Terms • Issued - $320 million (recorded as approx. $249 million of debt and $71 million of equity) • Coupon - 2.0% • Underlying shares - approx. 8.4 million common shares (8.3 million included in current weighted average diluted share count) • Current conversion price - $38.08 • Current conversion rate - 26.2583 • Convertible, by the holder, at any time into shares of the Company's common stock ü At the Company's option, settlement can be made in cash, shares, or any combination thereof. Options Holders' Option • Put option effective December 1, 2020 at 100% of principal amount, plus accrued and unpaid interest which must be settled in cash Company's Option • Right to redeem, prior to December 2018, at 100% of the principal amount (plus a make-whole premium) if volume weighted average price of Company's common stock is at least 120% (currently $45.70) of the conversion price of the convertible notes for at least 20 trading days during any 30 consecutive trading day period • Holders may elect to convert their notes in lieu of redemption and receive any make- whole premium due • After December 2018, fully redeemable, at par, for cash
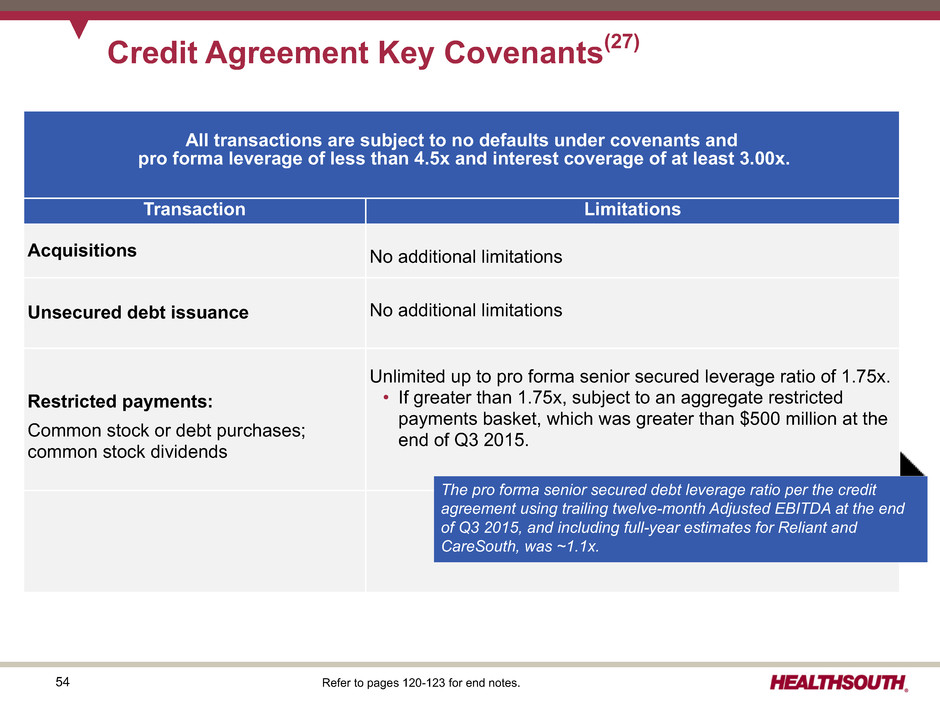
54 Credit Agreement Key Covenants(27) All transactions are subject to no defaults under covenants and pro forma leverage of less than 4.5x and interest coverage of at least 3.00x. Transaction Limitations Acquisitions No additional limitations Unsecured debt issuance No additional limitations Restricted payments: Common stock or debt purchases; common stock dividends Unlimited up to pro forma senior secured leverage ratio of 1.75x. • If greater than 1.75x, subject to an aggregate restricted payments basket, which was greater than $500 million at the end of Q3 2015. The pro forma senior secured debt leverage ratio per the credit agreement using trailing twelve-month Adjusted EBITDA at the end of Q3 2015, and including full-year estimates for Reliant and CareSouth, was ~1.1x. Refer to pages 120-123 for end notes.
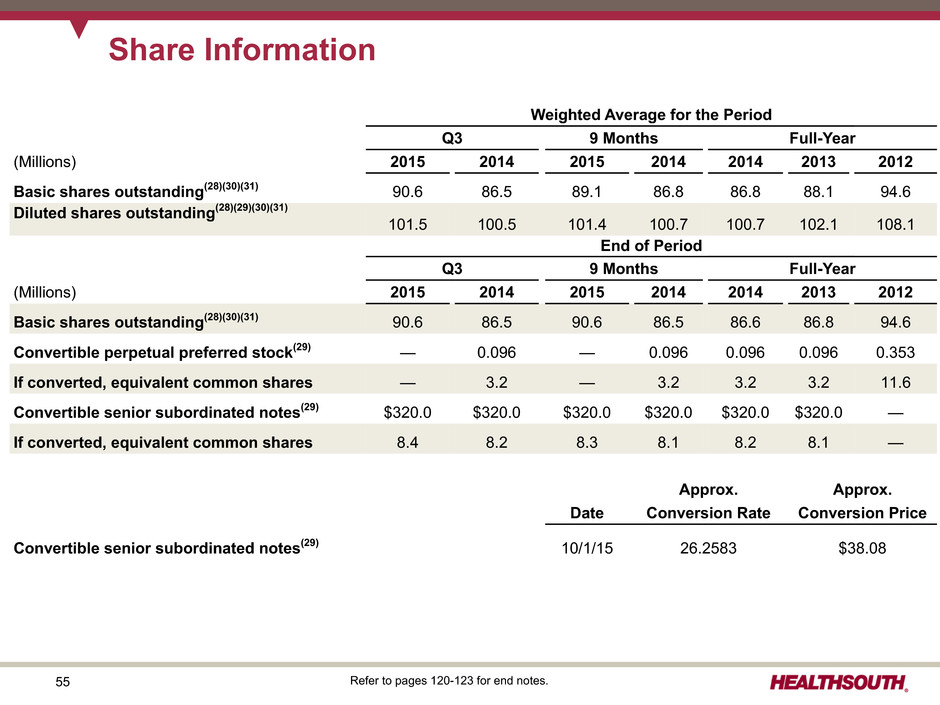
55 Share Information Weighted Average for the Period Q3 9 Months Full-Year (Millions) 2015 2014 2015 2014 2014 2013 2012 Basic shares outstanding(28)(30)(31) 90.6 86.5 89.1 86.8 86.8 88.1 94.6 Diluted shares outstanding(28)(29)(30)(31) 101.5 100.5 101.4 100.7 100.7 102.1 108.1 End of Period Q3 9 Months Full-Year (Millions) 2015 2014 2015 2014 2014 2013 2012 Basic shares outstanding(28)(30)(31) 90.6 86.5 90.6 86.5 86.6 86.8 94.6 Convertible perpetual preferred stock(29) — 0.096 — 0.096 0.096 0.096 0.353 If converted, equivalent common shares — 3.2 — 3.2 3.2 3.2 11.6 Convertible senior subordinated notes(29) $320.0 $320.0 $320.0 $320.0 $320.0 $320.0 — If converted, equivalent common shares 8.4 8.2 8.3 8.1 8.2 8.1 — Approx. Approx. Date Conversion Rate Conversion Price Convertible senior subordinated notes(29) 10/1/15 26.2583 $38.08 Refer to pages 120-123 for end notes.
56 Information Technology
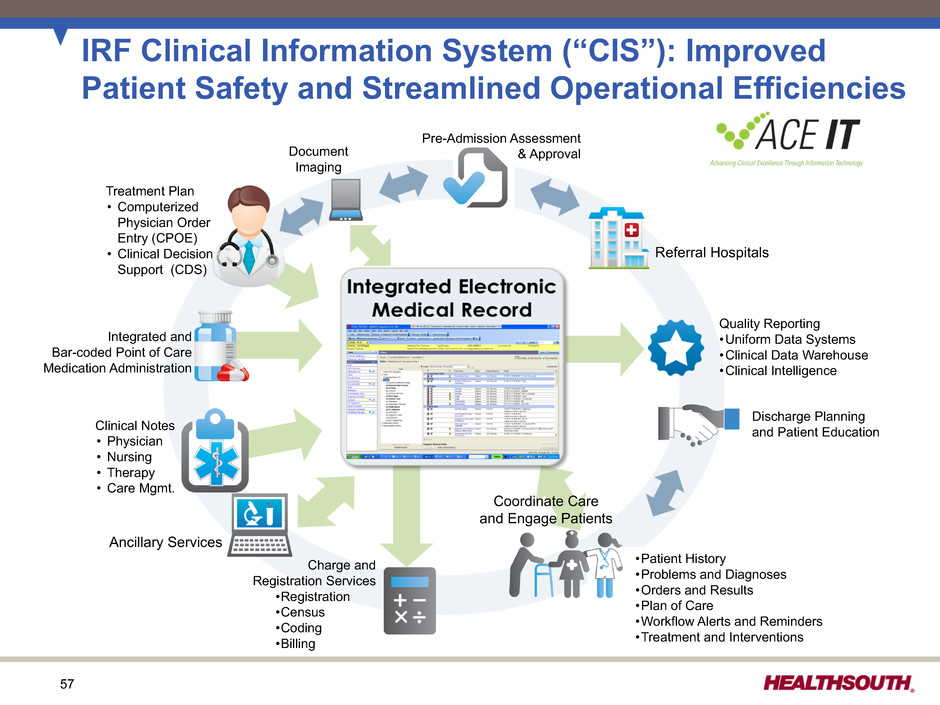
57 IRF Clinical Information System (“CIS”): Improved Patient Safety and Streamlined Operational Efficiencies Pre-Admission Assessment & Approval Discharge Planning and Patient Education •Patient History •Problems and Diagnoses •Orders and Results •Plan of Care •Workflow Alerts and Reminders •Treatment and Interventions Document Imaging Charge and Registration Services •Registration •Census •Coding •Billing Quality Reporting •Uniform Data Systems •Clinical Data Warehouse •Clinical Intelligence Referral Hospitals Ancillary Services Clinical Notes • Physician • Nursing • Therapy • Care Mgmt. Integrated and Bar-coded Point of Care Medication Administration Treatment Plan • Computerized Physician Order Entry (CPOE) • Clinical Decision Support (CDS) Coordinate Care and Engage Patients
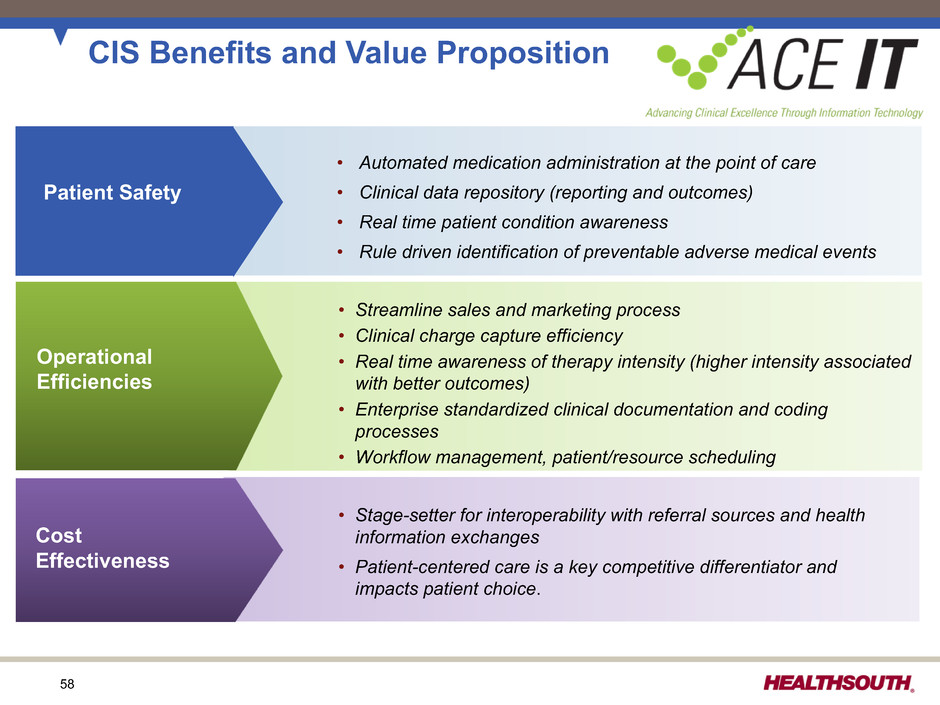
58 CIS Benefits and Value Proposition Operational Efficiencies Cost Effectiveness • Automated medication administration at the point of care • Clinical data repository (reporting and outcomes) • Real time patient condition awareness • Rule driven identification of preventable adverse medical events • Streamline sales and marketing process • Clinical charge capture efficiency • Real time awareness of therapy intensity (higher intensity associated with better outcomes) • Enterprise standardized clinical documentation and coding processes • Workflow management, patient/resource scheduling • Stage-setter for interoperability with referral sources and health information exchanges • Patient-centered care is a key competitive differentiator and impacts patient choice. Patient Safety
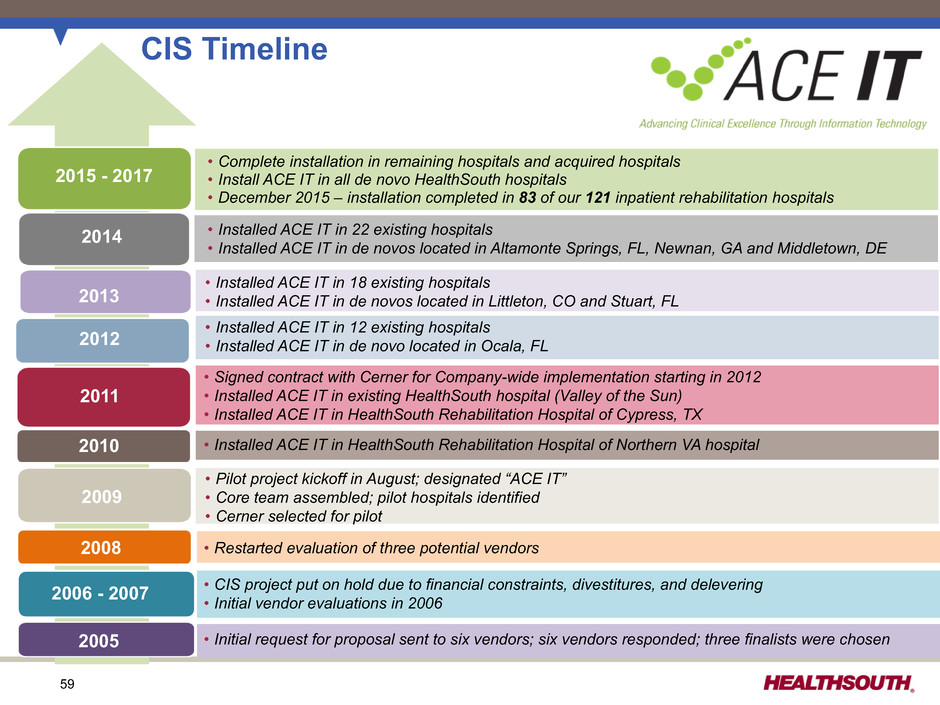
59 • Installed ACE IT in HealthSouth Rehabilitation Hospital of Northern VA hospital • Pilot project kickoff in August; designated “ACE IT” • Core team assembled; pilot hospitals identified • Cerner selected for pilot • Signed contract with Cerner for Company-wide implementation starting in 2012 • Installed ACE IT in existing HealthSouth hospital (Valley of the Sun) • Installed ACE IT in HealthSouth Rehabilitation Hospital of Cypress, TX • Installed ACE IT in 12 existing hospitals • Installed ACE IT in de novo located in Ocala, FL • Complete installation in remaining hospitals and acquired hospitals • Install ACE IT in all de novo HealthSouth hospitals • December 2015 – installation completed in 83 of our 121 inpatient rehabilitation hospitals CIS Timeline • Restarted evaluation of three potential vendors • CIS project put on hold due to financial constraints, divestitures, and delevering • Initial vendor evaluations in 2006 • Initial request for proposal sent to six vendors; six vendors responded; three finalists were chosen • Installed ACE IT in 18 existing hospitals • Installed ACE IT in de novos located in Littleton, CO and Stuart, FL 2015 - 2017 2013 2012 2011 2010 2009 2008 2006 - 2007 2005 2014 • Installed ACE IT in 22 existing hospitals• Installed ACE IT in de novos located in Altamonte Springs, FL, Newnan, GA and Middletown, DE
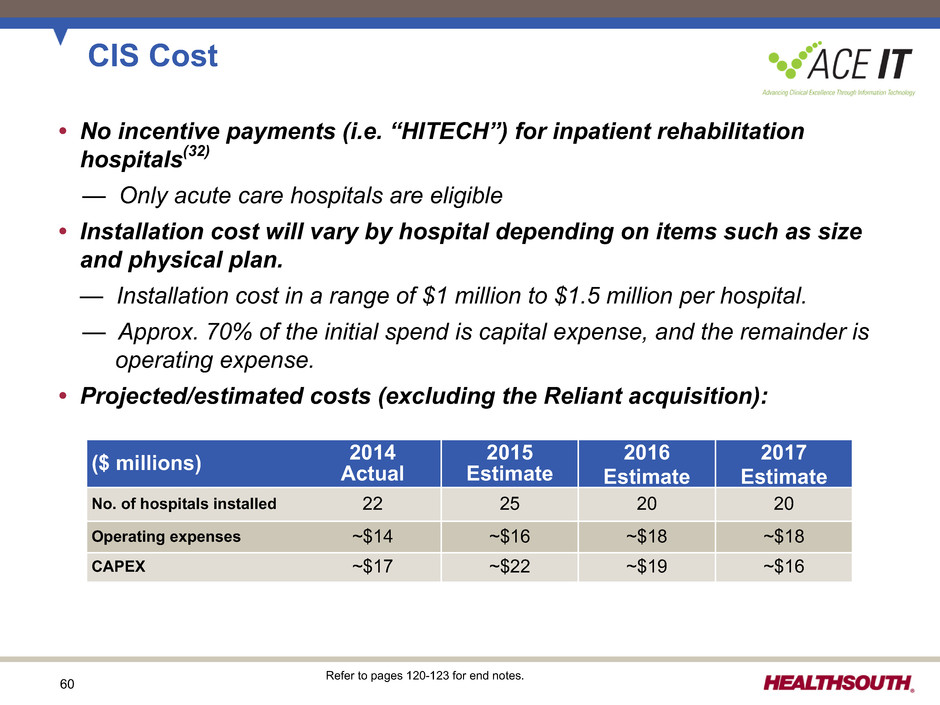
60 CIS Cost • No incentive payments (i.e. “HITECH”) for inpatient rehabilitation hospitals(32) — Only acute care hospitals are eligible • Installation cost will vary by hospital depending on items such as size and physical plan. — Installation cost in a range of $1 million to $1.5 million per hospital. — Approx. 70% of the initial spend is capital expense, and the remainder is operating expense. • Projected/estimated costs (excluding the Reliant acquisition): ($ millions) 2014Actual 2015 Estimate 2016 Estimate 2017 Estimate No. of hospitals installed 22 25 20 20 Operating expenses ~$14 ~$16 ~$18 ~$18 CAPEX ~$17 ~$22 ~$19 ~$16 Refer to pages 120-123 for end notes.
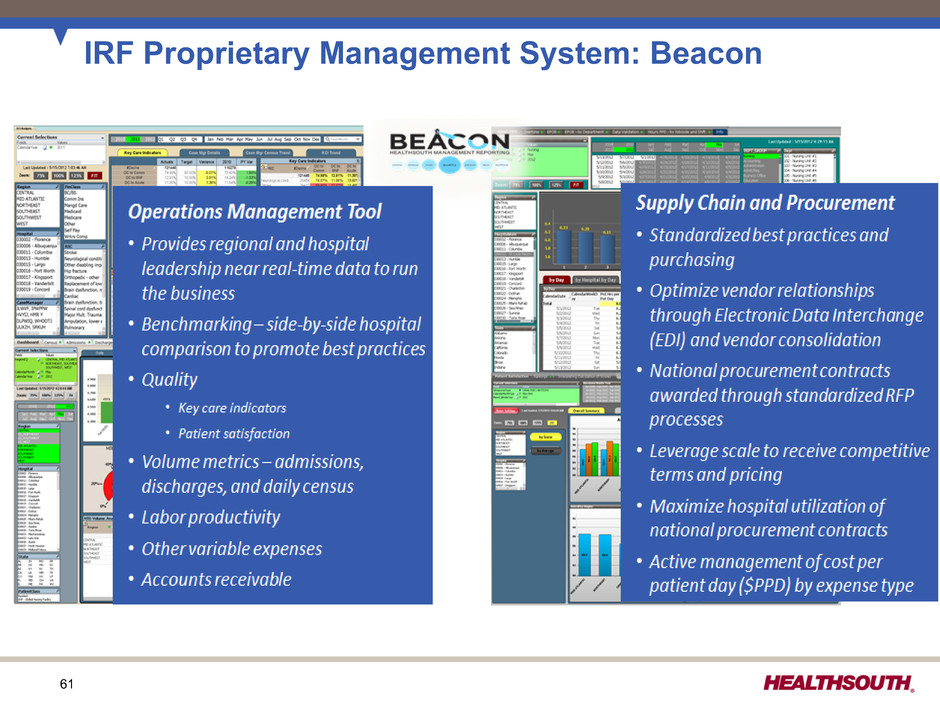
61 IRF Proprietary Management System: Beacon
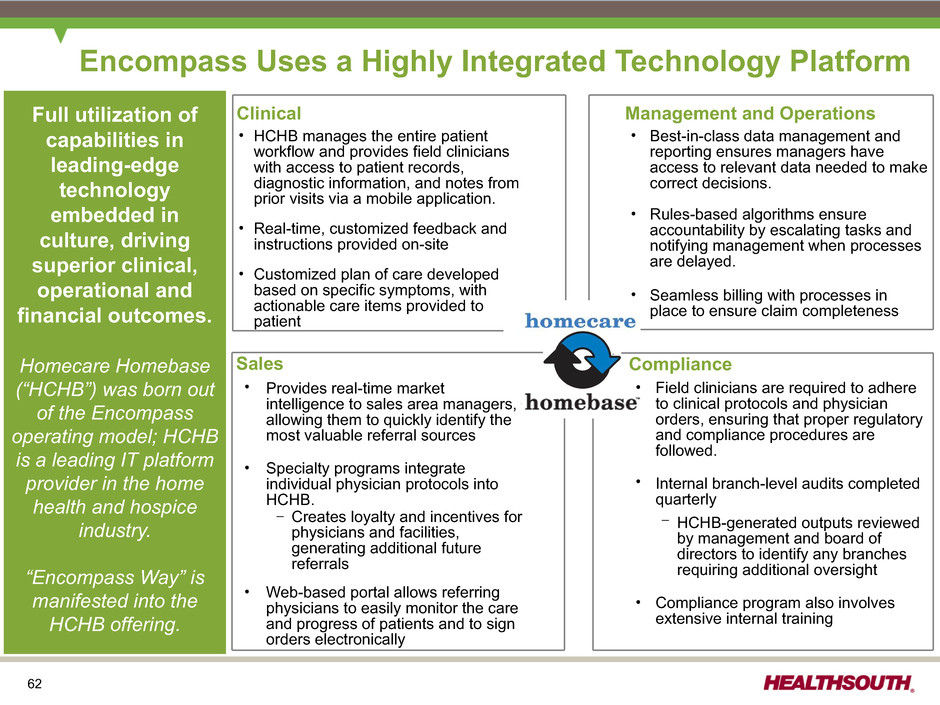
62 Encompass Uses a Highly Integrated Technology Platform Clinical Ÿ HCHB manages the entire patient workflow and provides field clinicians with access to patient records, diagnostic information, and notes from prior visits via a mobile application. Ÿ Real-time, customized feedback and instructions provided on-site Ÿ Customized plan of care developed based on specific symptoms, with actionable care items provided to patient Sales Ÿ Provides real-time market intelligence to sales area managers, allowing them to quickly identify the most valuable referral sources Ÿ Specialty programs integrate individual physician protocols into HCHB. – Creates loyalty and incentives for physicians and facilities, generating additional future referrals Ÿ Web-based portal allows referring physicians to easily monitor the care and progress of patients and to sign orders electronically Compliance Ÿ Field clinicians are required to adhere to clinical protocols and physician orders, ensuring that proper regulatory and compliance procedures are followed. Ÿ Internal branch-level audits completed quarterly – HCHB-generated outputs reviewed by management and board of directors to identify any branches requiring additional oversight Ÿ Compliance program also involves extensive internal training Management and Operations Ÿ Best-in-class data management and reporting ensures managers have access to relevant data needed to make correct decisions. Ÿ Rules-based algorithms ensure accountability by escalating tasks and notifying management when processes are delayed. Ÿ Seamless billing with processes in place to ensure claim completeness Full utilization of capabilities in leading-edge technology embedded in culture, driving superior clinical, operational and financial outcomes. Homecare Homebase (“HCHB”) was born out of the Encompass operating model; HCHB is a leading IT platform provider in the home health and hospice industry. “Encompass Way” is manifested into the HCHB offering.
63 Operational Metrics
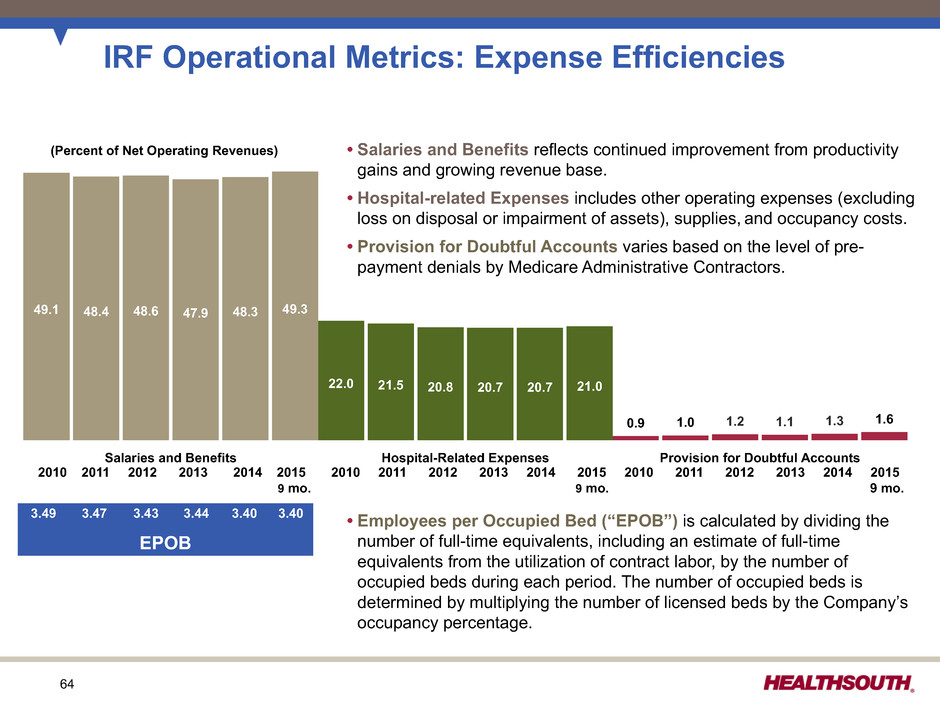
64 Salaries and Benefits Hospital-Related Expenses Provision for Doubtful Accounts 49.1 22.0 0.9 48.4 21.5 1.0 48.6 20.8 1.2 47.9 20.7 1.1 48.3 20.7 1.3 49.3 21.0 1.6 • Salaries and Benefits reflects continued improvement from productivity gains and growing revenue base. • Hospital-related Expenses includes other operating expenses (excluding loss on disposal or impairment of assets), supplies, and occupancy costs. • Provision for Doubtful Accounts varies based on the level of pre- payment denials by Medicare Administrative Contractors. • Employees per Occupied Bed (“EPOB”) is calculated by dividing the number of full-time equivalents, including an estimate of full-time equivalents from the utilization of contract labor, by the number of occupied beds during each period. The number of occupied beds is determined by multiplying the number of licensed beds by the Company’s occupancy percentage. IRF Operational Metrics: Expense Efficiencies 2010 2011 2012 2013 2014 2015 2010 2011 2012 2013 2014 2015 2010 2011 2012 2013 2014 2015 9 mo. 9 mo. 9 mo. 3.49 3.47 3.43 3.44 3.40 3.40 EPOB (Percent of Net Operating Revenues)
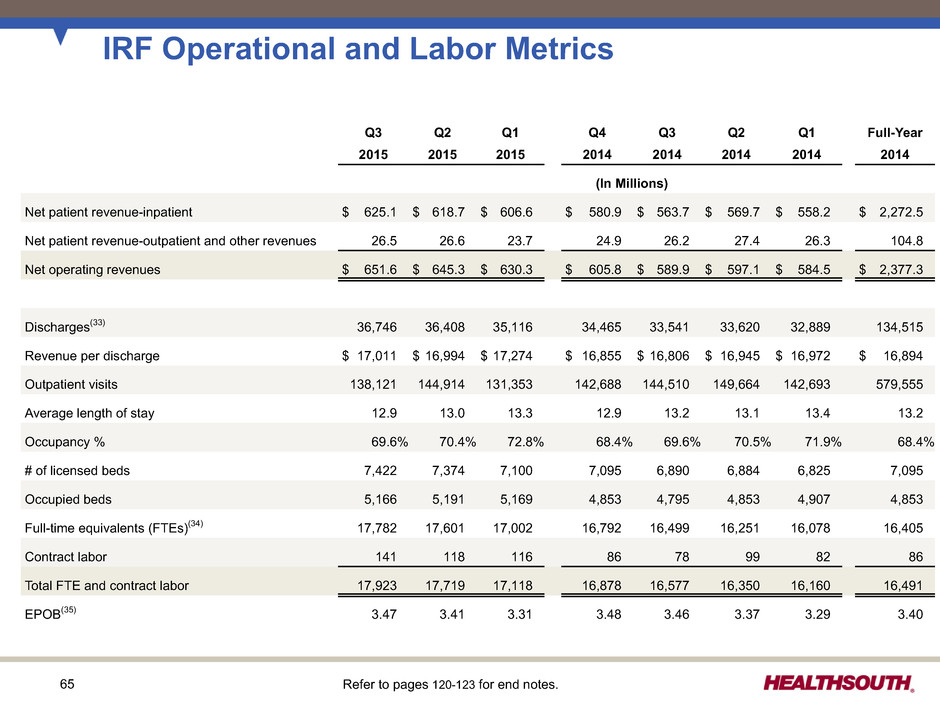
65 IRF Operational and Labor Metrics Refer to pages 120-123 for end notes. Q3 Q2 Q1 Q4 Q3 Q2 Q1 Full-Year 2015 2015 2015 2014 2014 2014 2014 2014 (In Millions) Net patient revenue-inpatient $ 625.1 $ 618.7 $ 606.6 $ 580.9 $ 563.7 $ 569.7 $ 558.2 $ 2,272.5 Net patient revenue-outpatient and other revenues 26.5 26.6 23.7 24.9 26.2 27.4 26.3 104.8 Net operating revenues $ 651.6 $ 645.3 $ 630.3 $ 605.8 $ 589.9 $ 597.1 $ 584.5 $ 2,377.3 Discharges(33) 36,746 36,408 35,116 34,465 33,541 33,620 32,889 134,515 Revenue per discharge $ 17,011 $ 16,994 $ 17,274 $ 16,855 $ 16,806 $ 16,945 $ 16,972 $ 16,894 Outpatient visits 138,121 144,914 131,353 142,688 144,510 149,664 142,693 579,555 Average length of stay 12.9 13.0 13.3 12.9 13.2 13.1 13.4 13.2 Occupancy % 69.6% 70.4% 72.8% 68.4% 69.6% 70.5% 71.9% 68.4% # of licensed beds 7,422 7,374 7,100 7,095 6,890 6,884 6,825 7,095 Occupied beds 5,166 5,191 5,169 4,853 4,795 4,853 4,907 4,853 Full-time equivalents (FTEs)(34) 17,782 17,601 17,002 16,792 16,499 16,251 16,078 16,405 Contract labor 141 118 116 86 78 99 82 86 Total FTE and contract labor 17,923 17,719 17,118 16,878 16,577 16,350 16,160 16,491 EPOB(35) 3.47 3.41 3.31 3.48 3.46 3.37 3.29 3.40
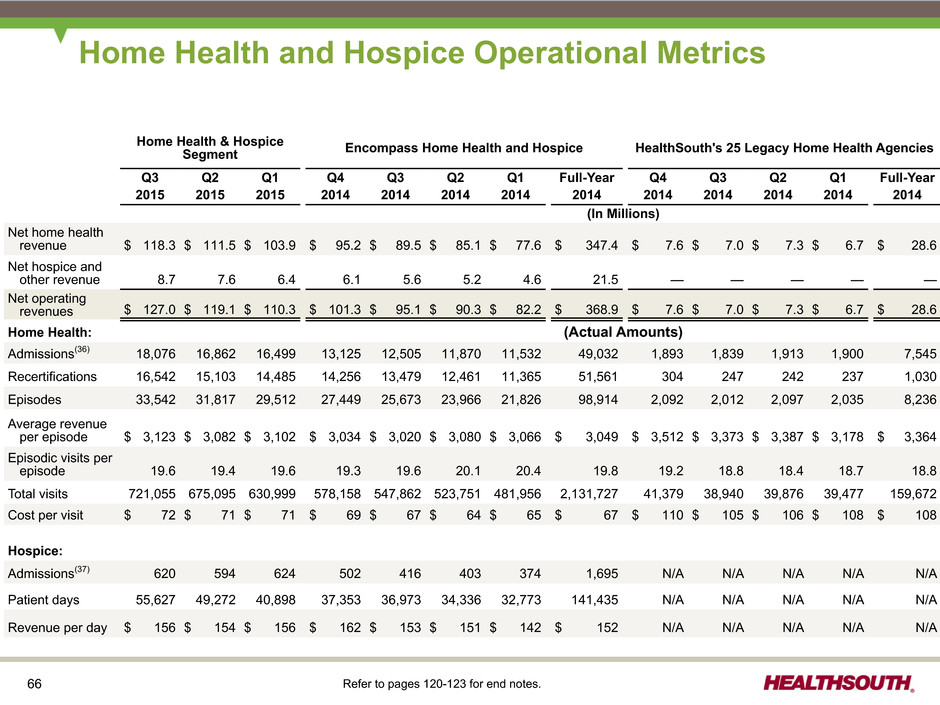
66 Home Health and Hospice Operational Metrics Refer to pages 120-123 for end notes. Home Health & Hospice Segment Encompass Home Health and Hospice HealthSouth's 25 Legacy Home Health Agencies Q3 Q2 Q1 Q4 Q3 Q2 Q1 Full-Year Q4 Q3 Q2 Q1 Full-Year 2015 2015 2015 2014 2014 2014 2014 2014 2014 2014 2014 2014 2014 (In Millions) Net home health revenue $ 118.3 $ 111.5 $ 103.9 $ 95.2 $ 89.5 $ 85.1 $ 77.6 $ 347.4 $ 7.6 $ 7.0 $ 7.3 $ 6.7 $ 28.6 Net hospice and other revenue 8.7 7.6 6.4 6.1 5.6 5.2 4.6 21.5 — — — — — Net operating revenues $ 127.0 $ 119.1 $ 110.3 $ 101.3 $ 95.1 $ 90.3 $ 82.2 $ 368.9 $ 7.6 $ 7.0 $ 7.3 $ 6.7 $ 28.6 Home Health: (Actual Amounts) Admissions(36) 18,076 16,862 16,499 13,125 12,505 11,870 11,532 49,032 1,893 1,839 1,913 1,900 7,545 Recertifications 16,542 15,103 14,485 14,256 13,479 12,461 11,365 51,561 304 247 242 237 1,030 Episodes 33,542 31,817 29,512 27,449 25,673 23,966 21,826 98,914 2,092 2,012 2,097 2,035 8,236 Average revenue per episode $ 3,123 $ 3,082 $ 3,102 $ 3,034 $ 3,020 $ 3,080 $ 3,066 $ 3,049 $ 3,512 $ 3,373 $ 3,387 $ 3,178 $ 3,364 Episodic visits per episode 19.6 19.4 19.6 19.3 19.6 20.1 20.4 19.8 19.2 18.8 18.4 18.7 18.8 Total visits 721,055 675,095 630,999 578,158 547,862 523,751 481,956 2,131,727 41,379 38,940 39,876 39,477 159,672 Cost per visit $ 72 $ 71 $ 71 $ 69 $ 67 $ 64 $ 65 $ 67 $ 110 $ 105 $ 106 $ 108 $ 108 Hospice: Admissions(37) 620 594 624 502 416 403 374 1,695 N/A N/A N/A N/A N/A Patient days 55,627 49,272 40,898 37,353 36,973 34,336 32,773 141,435 N/A N/A N/A N/A N/A Revenue per day $ 156 $ 154 $ 156 $ 162 $ 153 $ 151 $ 142 $ 152 N/A N/A N/A N/A N/A
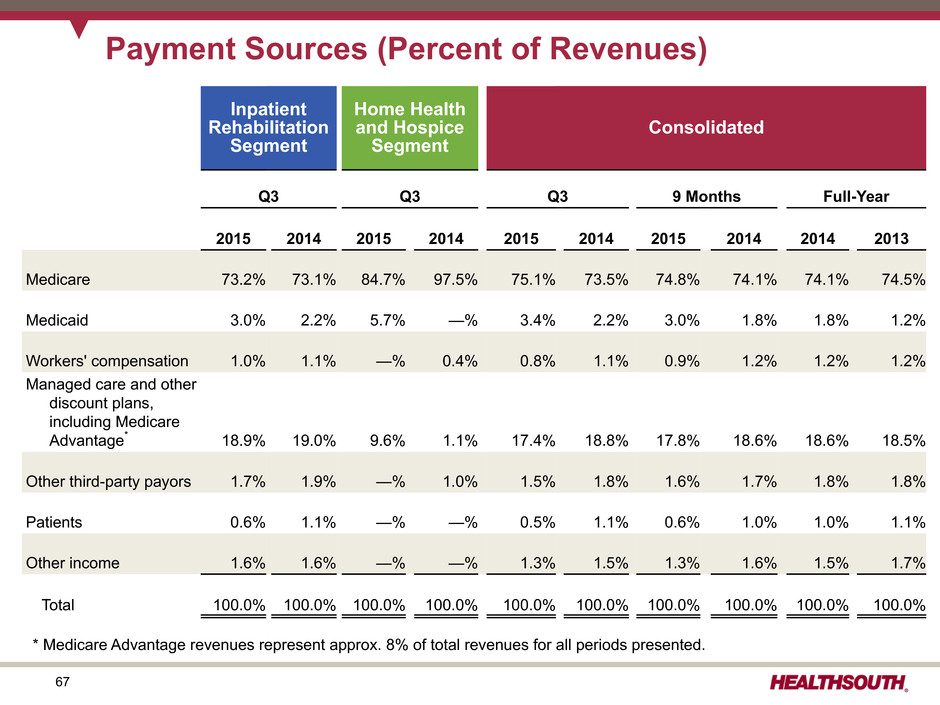
67 Payment Sources (Percent of Revenues) * Medicare Advantage revenues represent approx. 8% of total revenues for all periods presented. Inpatient Rehabilitation Segment Home Health and Hospice Segment Consolidated Q3 Q3 Q3 9 Months Full-Year 2015 2014 2015 2014 2015 2014 2015 2014 2014 2013 Medicare 73.2% 73.1% 84.7% 97.5% 75.1% 73.5% 74.8% 74.1% 74.1% 74.5% Medicaid 3.0% 2.2% 5.7% —% 3.4% 2.2% 3.0% 1.8% 1.8% 1.2% Workers' compensation 1.0% 1.1% —% 0.4% 0.8% 1.1% 0.9% 1.2% 1.2% 1.2% Managed care and other discount plans, including Medicare Advantage* 18.9% 19.0% 9.6% 1.1% 17.4% 18.8% 17.8% 18.6% 18.6% 18.5% Other third-party payors 1.7% 1.9% —% 1.0% 1.5% 1.8% 1.6% 1.7% 1.8% 1.8% Patients 0.6% 1.1% —% —% 0.5% 1.1% 0.6% 1.0% 1.0% 1.1% Other income 1.6% 1.6% —% —% 1.3% 1.5% 1.3% 1.6% 1.5% 1.7% Total 100.0% 100.0% 100.0% 100.0% 100.0% 100.0% 100.0% 100.0% 100.0% 100.0%
68 History Recast by Segment
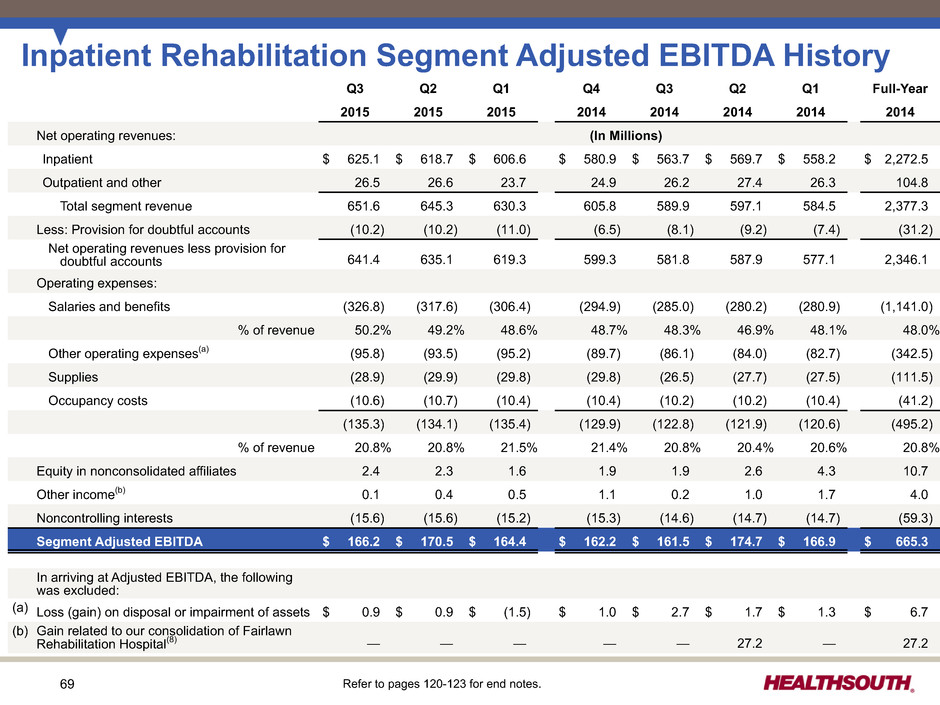
69 Inpatient Rehabilitation Segment Adjusted EBITDA History Q3 Q2 Q1 Q4 Q3 Q2 Q1 Full-Year 2015 2015 2015 2014 2014 2014 2014 2014 Net operating revenues: (In Millions) Inpatient $ 625.1 $ 618.7 $ 606.6 $ 580.9 $ 563.7 $ 569.7 $ 558.2 $ 2,272.5 Outpatient and other 26.5 26.6 23.7 24.9 26.2 27.4 26.3 104.8 Total segment revenue 651.6 645.3 630.3 605.8 589.9 597.1 584.5 2,377.3 Less: Provision for doubtful accounts (10.2) (10.2) (11.0) (6.5) (8.1) (9.2) (7.4) (31.2) Net operating revenues less provision for doubtful accounts 641.4 635.1 619.3 599.3 581.8 587.9 577.1 2,346.1 Operating expenses: Salaries and benefits (326.8) (317.6) (306.4) (294.9) (285.0) (280.2) (280.9) (1,141.0) % of revenue 50.2% 49.2% 48.6% 48.7% 48.3% 46.9% 48.1% 48.0% Other operating expenses(a) (95.8) (93.5) (95.2) (89.7) (86.1) (84.0) (82.7) (342.5) Supplies (28.9) (29.9) (29.8) (29.8) (26.5) (27.7) (27.5) (111.5) Occupancy costs (10.6) (10.7) (10.4) (10.4) (10.2) (10.2) (10.4) (41.2) (135.3) (134.1) (135.4) (129.9) (122.8) (121.9) (120.6) (495.2) % of revenue 20.8% 20.8% 21.5% 21.4% 20.8% 20.4% 20.6% 20.8% Equity in nonconsolidated affiliates 2.4 2.3 1.6 1.9 1.9 2.6 4.3 10.7 Other income(b) 0.1 0.4 0.5 1.1 0.2 1.0 1.7 4.0 Noncontrolling interests (15.6) (15.6) (15.2) (15.3) (14.6) (14.7) (14.7) (59.3) Segment Adjusted EBITDA $ 166.2 $ 170.5 $ 164.4 $ 162.2 $ 161.5 $ 174.7 $ 166.9 $ 665.3 In arriving at Adjusted EBITDA, the following was excluded: (a) Loss (gain) on disposal or impairment of assets $ 0.9 $ 0.9 $ (1.5) $ 1.0 $ 2.7 $ 1.7 $ 1.3 $ 6.7 (b) Gain related to our consolidation of Fairlawn Rehabilitation Hospital(8) — — — — — 27.2 — 27.2 Refer to pages 120-123 for end notes.
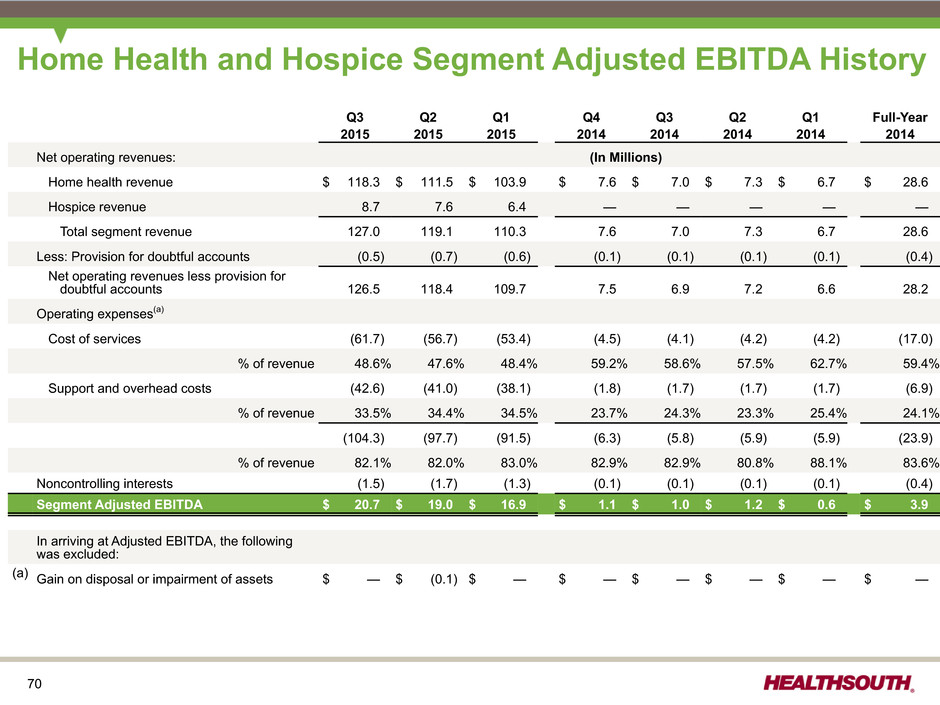
70 Home Health and Hospice Segment Adjusted EBITDA History Q3 Q2 Q1 Q4 Q3 Q2 Q1 Full-Year 2015 2015 2015 2014 2014 2014 2014 2014 Net operating revenues: (In Millions) Home health revenue $ 118.3 $ 111.5 $ 103.9 $ 7.6 $ 7.0 $ 7.3 $ 6.7 $ 28.6 Hospice revenue 8.7 7.6 6.4 — — — — — Total segment revenue 127.0 119.1 110.3 7.6 7.0 7.3 6.7 28.6 Less: Provision for doubtful accounts (0.5) (0.7) (0.6) (0.1) (0.1) (0.1) (0.1) (0.4) Net operating revenues less provision for doubtful accounts 126.5 118.4 109.7 7.5 6.9 7.2 6.6 28.2 Operating expenses(a) Cost of services (61.7) (56.7) (53.4) (4.5) (4.1) (4.2) (4.2) (17.0) % of revenue 48.6% 47.6% 48.4% 59.2% 58.6% 57.5% 62.7% 59.4% Support and overhead costs (42.6) (41.0) (38.1) (1.8) (1.7) (1.7) (1.7) (6.9) % of revenue 33.5% 34.4% 34.5% 23.7% 24.3% 23.3% 25.4% 24.1% (104.3) (97.7) (91.5) (6.3) (5.8) (5.9) (5.9) (23.9) % of revenue 82.1% 82.0% 83.0% 82.9% 82.9% 80.8% 88.1% 83.6% Noncontrolling interests (1.5) (1.7) (1.3) (0.1) (0.1) (0.1) (0.1) (0.4) Segment Adjusted EBITDA $ 20.7 $ 19.0 $ 16.9 $ 1.1 $ 1.0 $ 1.2 $ 0.6 $ 3.9 In arriving at Adjusted EBITDA, the following was excluded: (a) Gain on disposal or impairment of assets $ — $ (0.1) $ — $ — $ — $ — $ — $ —
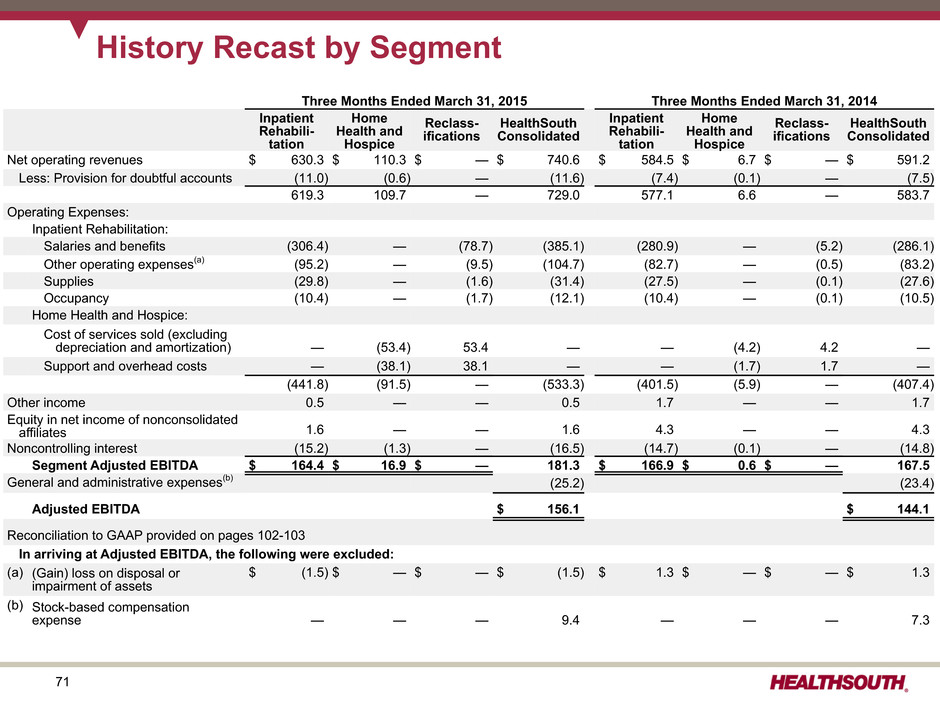
71 History Recast by Segment (9.4) Three Months Ended March 31, 2015 Three Months Ended March 31, 2014 Inpatient Rehabili- tation Home Health and Hospice Reclass- ifications HealthSouth Consolidated Inpatient Rehabili- tation Home Health and Hospice Reclass- ifications HealthSouth Consolidated Net operating revenues $ 630.3 $ 110.3 $ — $ 740.6 $ 584.5 $ 6.7 $ — $ 591.2 Less: Provision for doubtful accounts (11.0) (0.6) — (11.6) (7.4) (0.1) — (7.5) 619.3 109.7 — 729.0 577.1 6.6 — 583.7 Operating Expenses: Inpatient Rehabilitation: Salaries and benefits (306.4) — (78.7) (385.1) (280.9) — (5.2) (286.1) Other operating expenses(a) (95.2) — (9.5) (104.7) (82.7) — (0.5) (83.2) Supplies (29.8) — (1.6) (31.4) (27.5) — (0.1) (27.6) Occupancy (10.4) — (1.7) (12.1) (10.4) — (0.1) (10.5) Home Health and Hospice: Cost of services sold (excluding depreciation and amortization) — (53.4) 53.4 — — (4.2) 4.2 — Support and overhead costs — (38.1) 38.1 — — (1.7) 1.7 — (441.8) (91.5) — (533.3) (401.5) (5.9) — (407.4) Other income 0.5 — — 0.5 1.7 — — 1.7 Equity in net income of nonconsolidated affiliates 1.6 — — 1.6 4.3 — — 4.3 Noncontrolling interest (15.2) (1.3) — (16.5) (14.7) (0.1) — (14.8) Segment Adjusted EBITDA $ 164.4 $ 16.9 $ — 181.3 $ 166.9 $ 0.6 $ — 167.5 General and administrative expenses(b) (25.2) (23.4) Adjusted EBITDA $ 156.1 $ 144.1 Reconciliation to GAAP provided on pages 102-103 In arriving at Adjusted EBITDA, the following were excluded: (a) (Gain) loss on disposal or impairment of assets $ (1.5) $ — $ — $ (1.5) $ 1.3 $ — $ — $ 1.3 (b) Stock-based compensation expense — — — 9.4 — — — 7.3
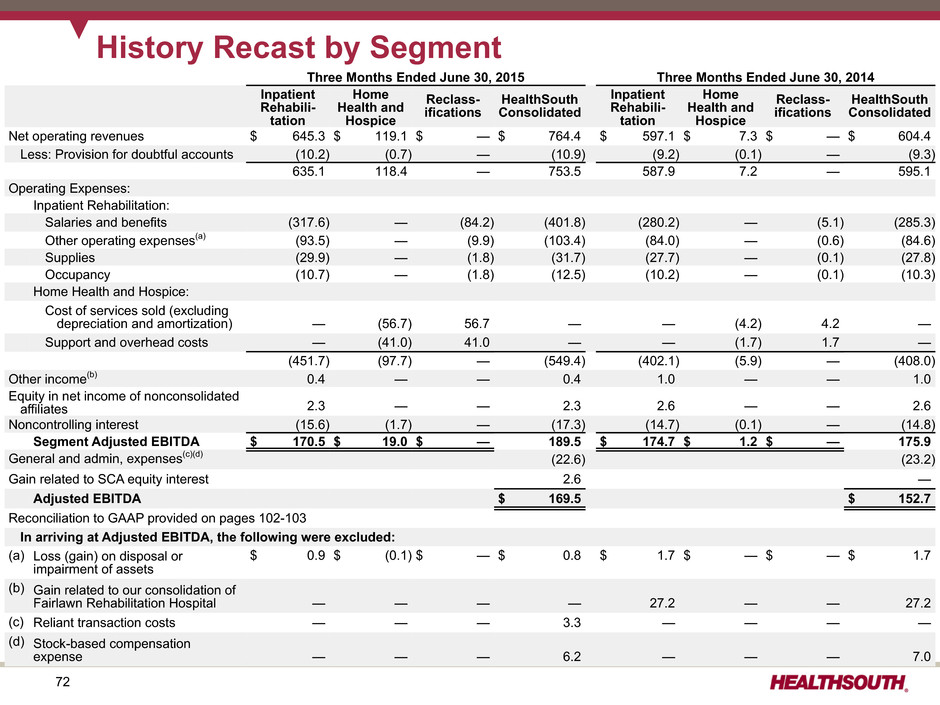
72 History Recast by Segment (9.4) Three Months Ended June 30, 2015 Three Months Ended June 30, 2014 Inpatient Rehabili- tation Home Health and Hospice Reclass- ifications HealthSouth Consolidated Inpatient Rehabili- tation Home Health and Hospice Reclass- ifications HealthSouth Consolidated Net operating revenues $ 645.3 $ 119.1 $ — $ 764.4 $ 597.1 $ 7.3 $ — $ 604.4 Less: Provision for doubtful accounts (10.2) (0.7) — (10.9) (9.2) (0.1) — (9.3) 635.1 118.4 — 753.5 587.9 7.2 — 595.1 Operating Expenses: Inpatient Rehabilitation: Salaries and benefits (317.6) — (84.2) (401.8) (280.2) — (5.1) (285.3) Other operating expenses(a) (93.5) — (9.9) (103.4) (84.0) — (0.6) (84.6) Supplies (29.9) — (1.8) (31.7) (27.7) — (0.1) (27.8) Occupancy (10.7) — (1.8) (12.5) (10.2) — (0.1) (10.3) Home Health and Hospice: Cost of services sold (excluding depreciation and amortization) — (56.7) 56.7 — — (4.2) 4.2 — Support and overhead costs — (41.0) 41.0 — — (1.7) 1.7 — (451.7) (97.7) — (549.4) (402.1) (5.9) — (408.0) Other income(b) 0.4 — — 0.4 1.0 — — 1.0 Equity in net income of nonconsolidated affiliates 2.3 — — 2.3 2.6 — — 2.6 Noncontrolling interest (15.6) (1.7) — (17.3) (14.7) (0.1) — (14.8) Segment Adjusted EBITDA $ 170.5 $ 19.0 $ — 189.5 $ 174.7 $ 1.2 $ — 175.9 General and admin, expenses(c)(d) (22.6) (23.2) Gain related to SCA equity interest 2.6 — Adjusted EBITDA $ 169.5 $ 152.7 Reconciliation to GAAP provided on pages 102-103 In arriving at Adjusted EBITDA, the following were excluded: (a) Loss (gain) on disposal or impairment of assets $ 0.9 $ (0.1) $ — $ 0.8 $ 1.7 $ — $ — $ 1.7 (b) Gain related to our consolidation of Fairlawn Rehabilitation Hospital — — — — 27.2 — — 27.2 (c) Reliant transaction costs — — — 3.3 — — — — (d) Stock-based compensation expense — — — 6.2 — — — 7.0
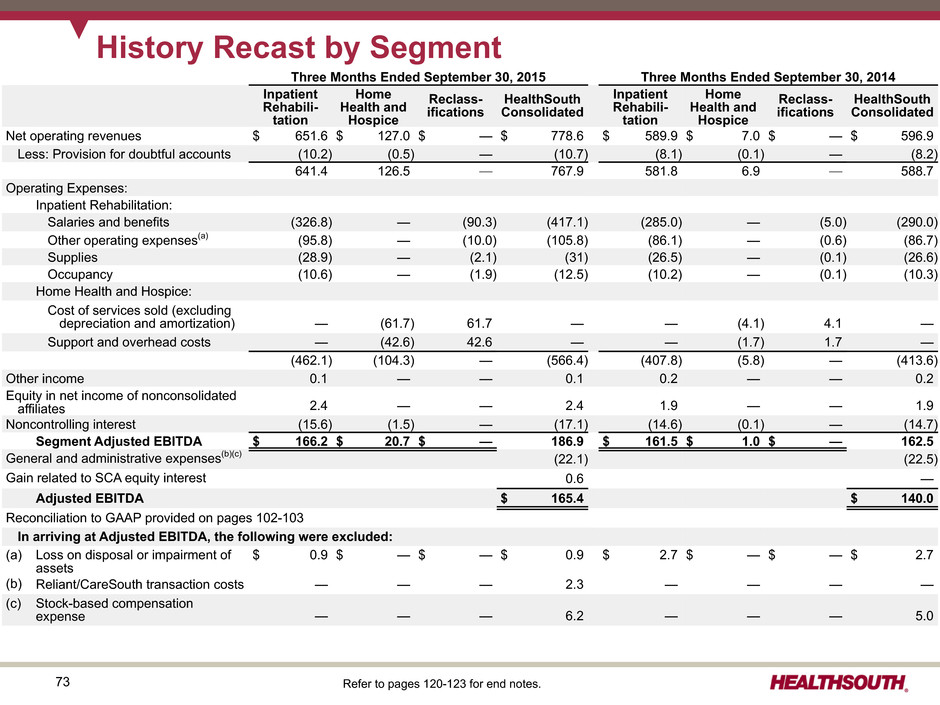
73 History Recast by Segment Three Months Ended September 30, 2015 Three Months Ended September 30, 2014 Inpatient Rehabili- tation Home Health and Hospice Reclass- ifications HealthSouth Consolidated Inpatient Rehabili- tation Home Health and Hospice Reclass- ifications HealthSouth Consolidated Net operating revenues $ 651.6 $ 127.0 $ — $ 778.6 $ 589.9 $ 7.0 $ — $ 596.9 Less: Provision for doubtful accounts (10.2) (0.5) — (10.7) (8.1) (0.1) — (8.2) 641.4 126.5 — 767.9 581.8 6.9 — 588.7 Operating Expenses: Inpatient Rehabilitation: Salaries and benefits (326.8) — (90.3) (417.1) (285.0) — (5.0) (290.0) Other operating expenses(a) (95.8) — (10.0) (105.8) (86.1) — (0.6) (86.7) Supplies (28.9) — (2.1) (31) (26.5) — (0.1) (26.6) Occupancy (10.6) — (1.9) (12.5) (10.2) — (0.1) (10.3) Home Health and Hospice: Cost of services sold (excluding depreciation and amortization) — (61.7) 61.7 — — (4.1) 4.1 — Support and overhead costs — (42.6) 42.6 — — (1.7) 1.7 — (462.1) (104.3) — (566.4) (407.8) (5.8) — (413.6) Other income 0.1 — — 0.1 0.2 — — 0.2 Equity in net income of nonconsolidated affiliates 2.4 — — 2.4 1.9 — — 1.9 Noncontrolling interest (15.6) (1.5) — (17.1) (14.6) (0.1) — (14.7) Segment Adjusted EBITDA $ 166.2 $ 20.7 $ — 186.9 $ 161.5 $ 1.0 $ — 162.5 General and administrative expenses(b)(c) (22.1) (22.5) Gain related to SCA equity interest 0.6 — Adjusted EBITDA $ 165.4 $ 140.0 Reconciliation to GAAP provided on pages 102-103 In arriving at Adjusted EBITDA, the following were excluded: (a) Loss on disposal or impairment of assets $ 0.9 $ — $ — $ 0.9 $ 2.7 $ — $ — $ 2.7 (b) Reliant/CareSouth transaction costs — — — 2.3 — — — — (c) Stock-based compensation expense — — — 6.2 — — — 5.0 Refer to pages 120-123 for end notes.
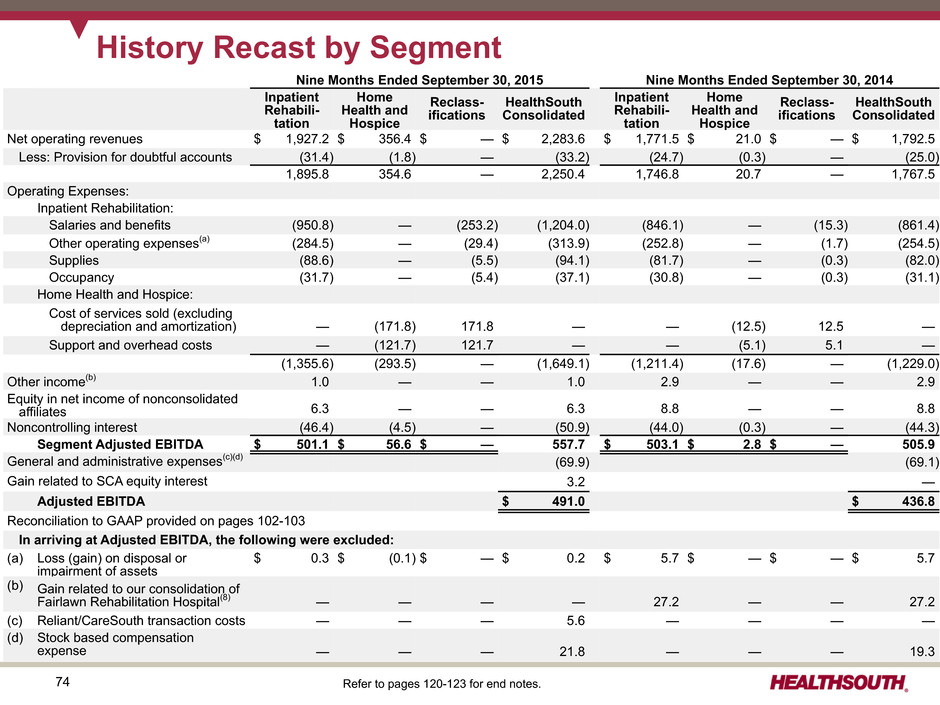
74 History Recast by Segment Nine Months Ended September 30, 2015 Nine Months Ended September 30, 2014 Inpatient Rehabili- tation Home Health and Hospice Reclass- ifications HealthSouth Consolidated Inpatient Rehabili- tation Home Health and Hospice Reclass- ifications HealthSouth Consolidated Net operating revenues $ 1,927.2 $ 356.4 $ — $ 2,283.6 $ 1,771.5 $ 21.0 $ — $ 1,792.5 Less: Provision for doubtful accounts (31.4) (1.8) — (33.2) (24.7) (0.3) — (25.0) 1,895.8 354.6 — 2,250.4 1,746.8 20.7 — 1,767.5 Operating Expenses: Inpatient Rehabilitation: Salaries and benefits (950.8) — (253.2) (1,204.0) (846.1) — (15.3) (861.4) Other operating expenses(a) (284.5) — (29.4) (313.9) (252.8) — (1.7) (254.5) Supplies (88.6) — (5.5) (94.1) (81.7) — (0.3) (82.0) Occupancy (31.7) — (5.4) (37.1) (30.8) — (0.3) (31.1) Home Health and Hospice: Cost of services sold (excluding depreciation and amortization) — (171.8) 171.8 — — (12.5) 12.5 — Support and overhead costs — (121.7) 121.7 — — (5.1) 5.1 — (1,355.6) (293.5) — (1,649.1) (1,211.4) (17.6) — (1,229.0) Other income(b) 1.0 — — 1.0 2.9 — — 2.9 Equity in net income of nonconsolidated affiliates 6.3 — — 6.3 8.8 — — 8.8 Noncontrolling interest (46.4) (4.5) — (50.9) (44.0) (0.3) — (44.3) Segment Adjusted EBITDA $ 501.1 $ 56.6 $ — 557.7 $ 503.1 $ 2.8 $ — 505.9 General and administrative expenses(c)(d) (69.9) (69.1) Gain related to SCA equity interest 3.2 — Adjusted EBITDA $ 491.0 $ 436.8 Reconciliation to GAAP provided on pages 102-103 In arriving at Adjusted EBITDA, the following were excluded: (a) Loss (gain) on disposal or impairment of assets $ 0.3 $ (0.1) $ — $ 0.2 $ 5.7 $ — $ — $ 5.7 (b) Gain related to our consolidation of Fairlawn Rehabilitation Hospital(8) — — — — 27.2 — — 27.2 (c) Reliant/CareSouth transaction costs — — — 5.6 — — — — (d) Stock based compensation expense — — — 21.8 — — — 19.3 Refer to pages 120-123 for end notes.
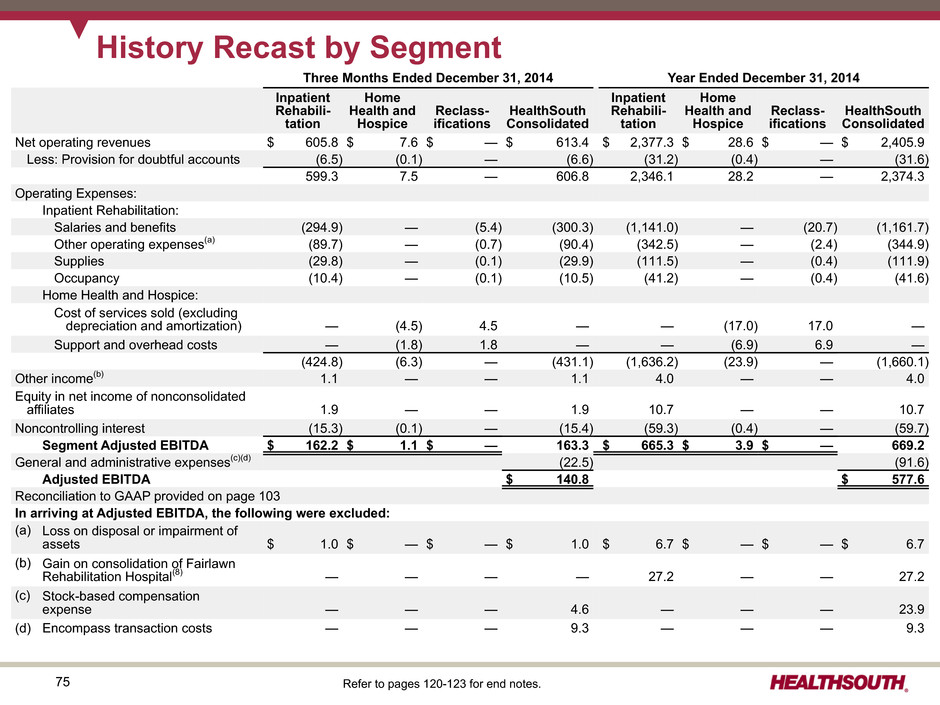
75 Three Months Ended December 31, 2014 Year Ended December 31, 2014 Inpatient Rehabili- tation Home Health and Hospice Reclass- ifications HealthSouth Consolidated Inpatient Rehabili- tation Home Health and Hospice Reclass- ifications HealthSouth Consolidated Net operating revenues $ 605.8 $ 7.6 $ — $ 613.4 $ 2,377.3 $ 28.6 $ — $ 2,405.9 Less: Provision for doubtful accounts (6.5) (0.1) — (6.6) (31.2) (0.4) — (31.6) 599.3 7.5 — 606.8 2,346.1 28.2 — 2,374.3 Operating Expenses: Inpatient Rehabilitation: Salaries and benefits (294.9) — (5.4) (300.3) (1,141.0) — (20.7) (1,161.7) Other operating expenses(a) (89.7) — (0.7) (90.4) (342.5) — (2.4) (344.9) Supplies (29.8) — (0.1) (29.9) (111.5) — (0.4) (111.9) Occupancy (10.4) — (0.1) (10.5) (41.2) — (0.4) (41.6) Home Health and Hospice: Cost of services sold (excluding depreciation and amortization) — (4.5) 4.5 — — (17.0) 17.0 — Support and overhead costs — (1.8) 1.8 — — (6.9) 6.9 — (424.8) (6.3) — (431.1) (1,636.2) (23.9) — (1,660.1) Other income(b) 1.1 — — 1.1 4.0 — — 4.0 Equity in net income of nonconsolidated affiliates 1.9 — — 1.9 10.7 — — 10.7 Noncontrolling interest (15.3) (0.1) — (15.4) (59.3) (0.4) — (59.7) Segment Adjusted EBITDA $ 162.2 $ 1.1 $ — 163.3 $ 665.3 $ 3.9 $ — 669.2 General and administrative expenses(c)(d) (22.5) (91.6) Adjusted EBITDA $ 140.8 $ 577.6 Reconciliation to GAAP provided on page 103 In arriving at Adjusted EBITDA, the following were excluded: (a) Loss on disposal or impairment of assets $ 1.0 $ — $ — $ 1.0 $ 6.7 $ — $ — $ 6.7 (b) Gain on consolidation of Fairlawn Rehabilitation Hospital(8) — — — — 27.2 — — 27.2 (c) Stock-based compensation expense — — — 4.6 — — — 23.9 (d) Encompass transaction costs — — — 9.3 — — — 9.3 History Recast by Segment Refer to pages 120-123 for end notes.
76 Alternative Payment Models
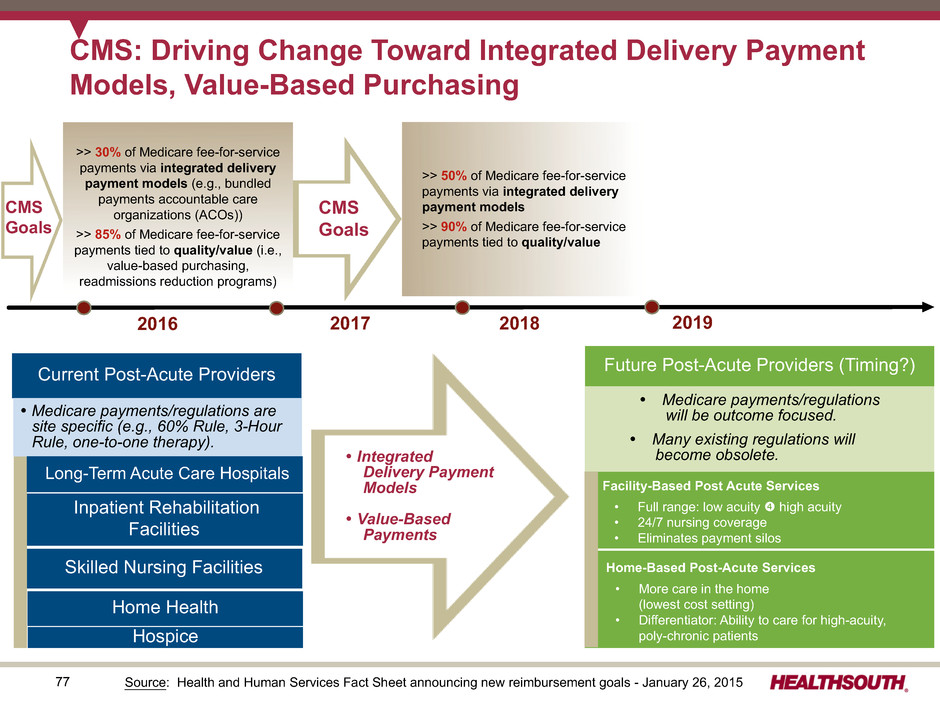
77 CMS: Driving Change Toward Integrated Delivery Payment Models, Value-Based Purchasing Future Post-Acute Providers (Timing?) Inpatient Rehabilitation Facilities Home Health Skilled Nursing Facilities Hospice • Full range: low acuity high acuity • 24/7 nursing coverage • Eliminates payment silos Home-Based Post-Acute Services • More care in the home (lowest cost setting) • Differentiator: Ability to care for high-acuity, poly-chronic patients >> 50% of Medicare fee-for-service payments via integrated delivery payment models >> 90% of Medicare fee-for-service payments tied to quality/value Ÿ Integrated Delivery Payment Models Ÿ Value-Based Payments Current Post-Acute Providers Ÿ Medicare payments/regulations are site specific (e.g., 60% Rule, 3-Hour Rule, one-to-one therapy). Ÿ Medicare payments/regulations will be outcome focused. Ÿ Many existing regulations will become obsolete. Facility-Based Post Acute Services >> 30% of Medicare fee-for-service payments via integrated delivery payment models (e.g., bundled payments accountable care organizations (ACOs)) >> 85% of Medicare fee-for-service payments tied to quality/value (i.e., value-based purchasing, readmissions reduction programs) 2017 Long-Term Acute Care Hospitals 2016 Source: Health and Human Services Fact Sheet announcing new reimbursement goals - January 26, 2015 CMS Goals 2018 2019 CMS Goals
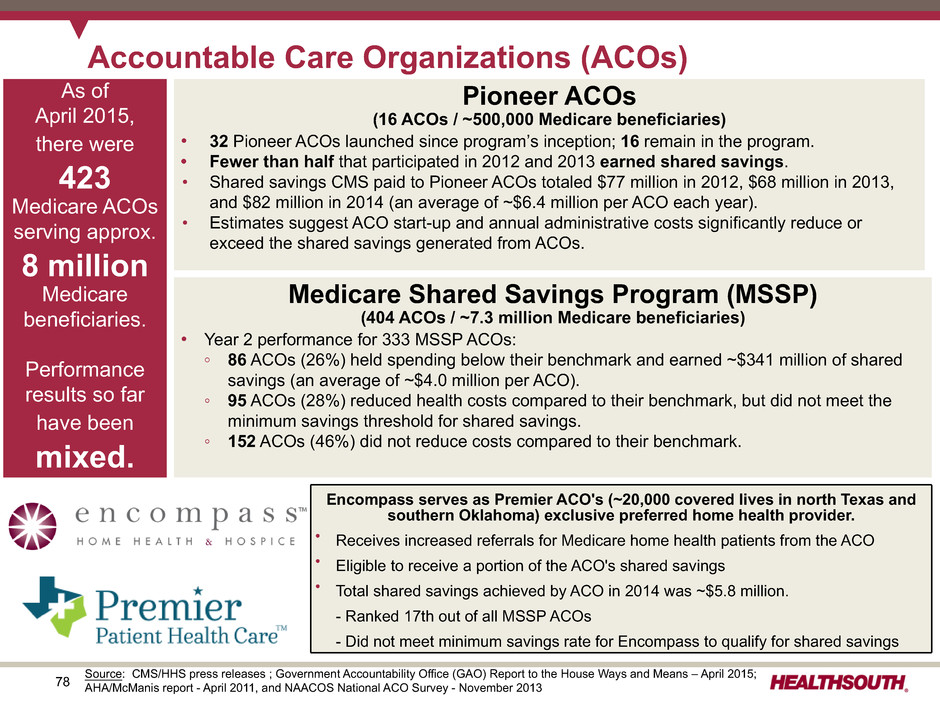
78 Accountable Care Organizations (ACOs) As of April 2015, there were 423 Medicare ACOs serving approx. 8 million Medicare beneficiaries. Performance results so far have been mixed. Pioneer ACOs (16 ACOs / ~500,000 Medicare beneficiaries) • 32 Pioneer ACOs launched since program’s inception; 16 remain in the program. • Fewer than half that participated in 2012 and 2013 earned shared savings. • Shared savings CMS paid to Pioneer ACOs totaled $77 million in 2012, $68 million in 2013, and $82 million in 2014 (an average of ~$6.4 million per ACO each year). • Estimates suggest ACO start-up and annual administrative costs significantly reduce or exceed the shared savings generated from ACOs. Medicare Shared Savings Program (MSSP) (404 ACOs / ~7.3 million Medicare beneficiaries) • Year 2 performance for 333 MSSP ACOs: ◦ 86 ACOs (26%) held spending below their benchmark and earned ~$341 million of shared savings (an average of ~$4.0 million per ACO). ◦ 95 ACOs (28%) reduced health costs compared to their benchmark, but did not meet the minimum savings threshold for shared savings. ◦ 152 ACOs (46%) did not reduce costs compared to their benchmark. Source: CMS/HHS press releases ; Government Accountability Office (GAO) Report to the House Ways and Means – April 2015; AHA/McManis report - April 2011, and NAACOS National ACO Survey - November 2013 Encompass serves as Premier ACO's (~20,000 covered lives in north Texas and southern Oklahoma) exclusive preferred home health provider. Ÿ Receives increased referrals for Medicare home health patients from the ACO Ÿ Eligible to receive a portion of the ACO's shared savings Ÿ Total shared savings achieved by ACO in 2014 was ~$5.8 million. - Ranked 17th out of all MSSP ACOs - Did not meet minimum savings rate for Encompass to qualify for shared savings
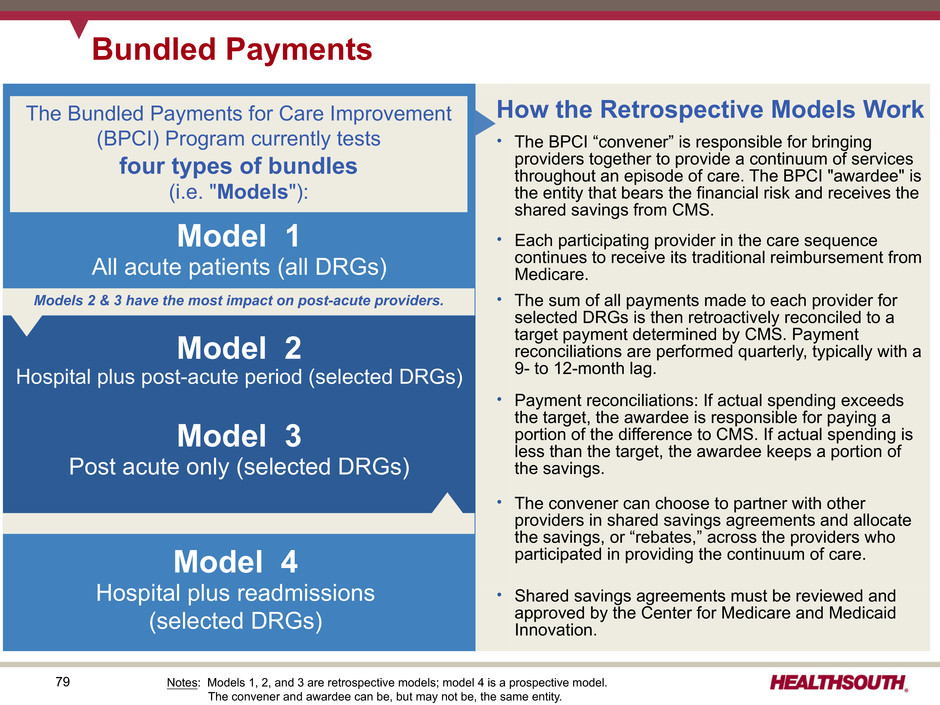
79 Bundled Payments How the Retrospective Models Work Ÿ The BPCI “convener” is responsible for bringing providers together to provide a continuum of services throughout an episode of care. The BPCI "awardee" is the entity that bears the financial risk and receives the shared savings from CMS. Ÿ Each participating provider in the care sequence continues to receive its traditional reimbursement from Medicare. Ÿ The sum of all payments made to each provider for selected DRGs is then retroactively reconciled to a target payment determined by CMS. Payment reconciliations are performed quarterly, typically with a 9- to 12-month lag. Ÿ Payment reconciliations: If actual spending exceeds the target, the awardee is responsible for paying a portion of the difference to CMS. If actual spending is less than the target, the awardee keeps a portion of the savings. Ÿ The convener can choose to partner with other providers in shared savings agreements and allocate the savings, or “rebates,” across the providers who participated in providing the continuum of care. Ÿ Shared savings agreements must be reviewed and approved by the Center for Medicare and Medicaid Innovation. Model 1 All acute patients (all DRGs) The Bundled Payments for Care Improvement (BPCI) Program currently tests four types of bundles (i.e. "Models"): Models 2 & 3 have the most impact on post-acute providers. Model 2 Hospital plus post-acute period (selected DRGs) Model 3 Post acute only (selected DRGs) Model 4 Hospital plus readmissions (selected DRGs) Notes: Models 1, 2, and 3 are retrospective models; model 4 is a prospective model. The convener and awardee can be, but may not be, the same entity.
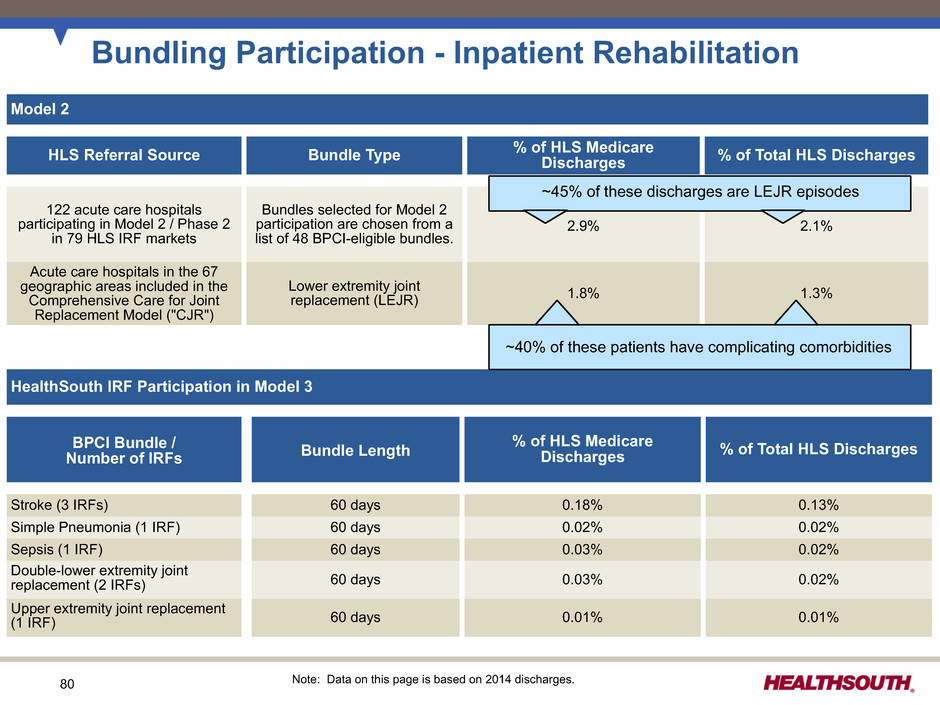
80 Bundling Participation - Inpatient Rehabilitation Model 2 HLS Referral Source Bundle Type % of HLS MedicareDischarges % of Total HLS Discharges 122 acute care hospitals participating in Model 2 / Phase 2 in 79 HLS IRF markets Bundles selected for Model 2 participation are chosen from a list of 48 BPCI-eligible bundles. 2.9% 2.1% Acute care hospitals in the 67 geographic areas included in the Comprehensive Care for Joint Replacement Model ("CJR") Lower extremity joint replacement (LEJR) 1.8% 1.3% HealthSouth IRF Participation in Model 3 BPCI Bundle / Number of IRFs Bundle Length % of HLS Medicare Discharges % of Total HLS Discharges Stroke (3 IRFs) 60 days 0.18% 0.13% Simple Pneumonia (1 IRF) 60 days 0.02% 0.02% Sepsis (1 IRF) 60 days 0.03% 0.02% Double-lower extremity joint replacement (2 IRFs) 60 days 0.03% 0.02% Upper extremity joint replacement (1 IRF) 60 days 0.01% 0.01% Note: Data on this page is based on 2014 discharges. ~40% of these patients have complicating comorbidities ~45% of these discharges are LEJR episodes
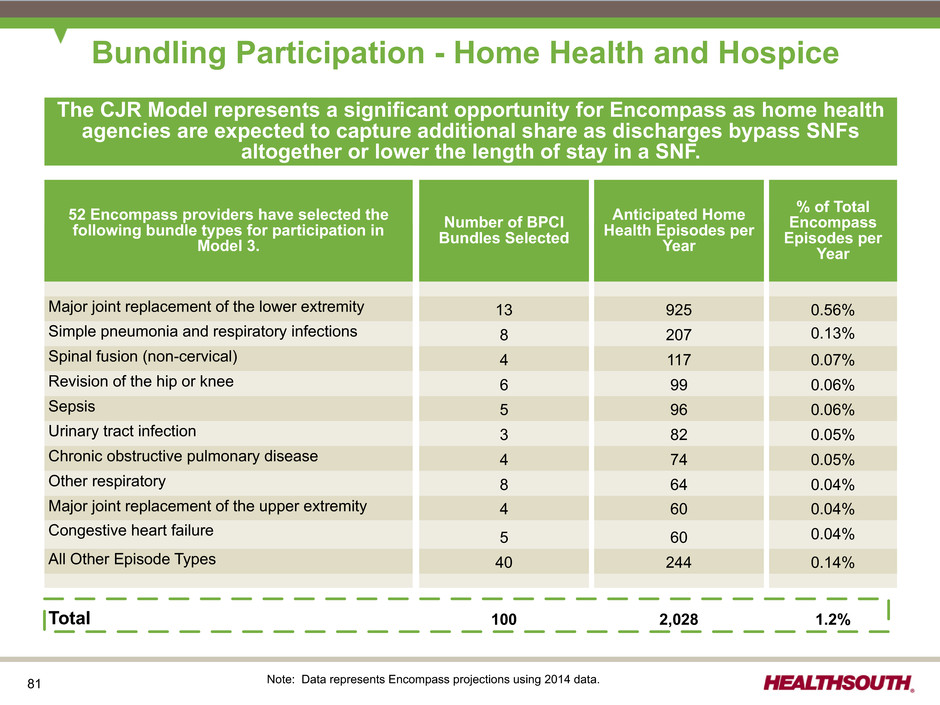
81 Bundling Participation - Home Health and Hospice The CJR Model represents a significant opportunity for Encompass as home health agencies are expected to capture additional share as discharges bypass SNFs altogether or lower the length of stay in a SNF. 52 Encompass providers have selected the following bundle types for participation in Model 3. Number of BPCI Bundles Selected Anticipated Home Health Episodes per Year % of Total Encompass Episodes per Year Major joint replacement of the lower extremity 13 925 0.56% Simple pneumonia and respiratory infections 8 207 0.13% Spinal fusion (non-cervical) 4 117 0.07% Revision of the hip or knee 6 99 0.06% Sepsis 5 96 0.06% Urinary tract infection 3 82 0.05% Chronic obstructive pulmonary disease 4 74 0.05% Other respiratory 8 64 0.04% Major joint replacement of the upper extremity 4 60 0.04% Congestive heart failure 5 60 0.04% All Other Episode Types 40 244 0.14% Total 100 2,028 1.2% Note: Data represents Encompass projections using 2014 data.
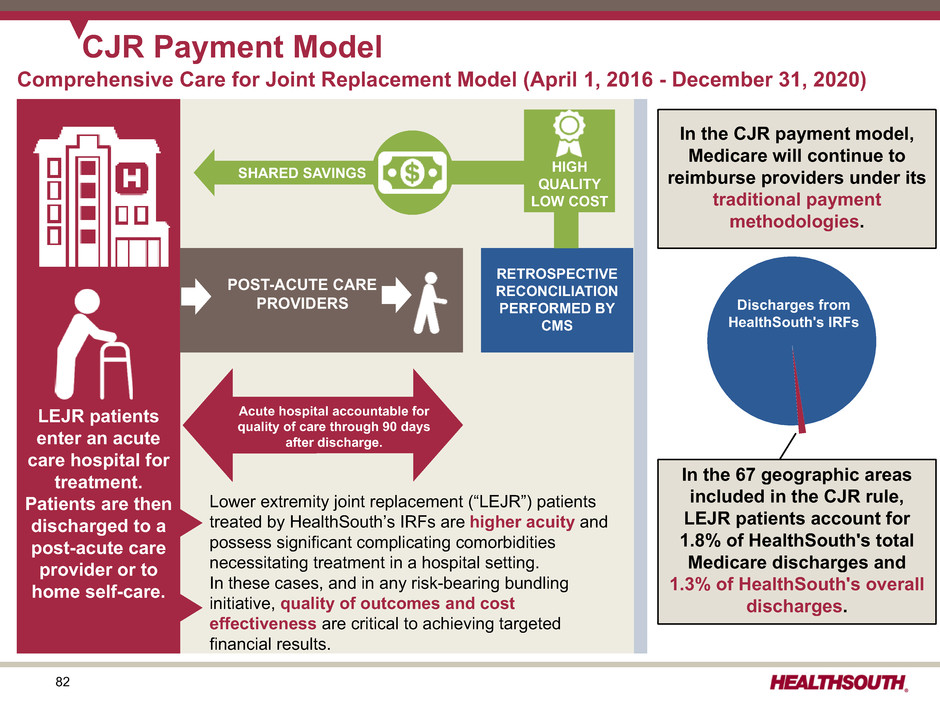
82 CJR Payment Model In the 67 geographic areas included in the CJR rule, LEJR patients account for 1.8% of HealthSouth's total Medicare discharges and 1.3% of HealthSouth's overall discharges. Discharges from HealthSouth's IRFs In the CJR payment model, Medicare will continue to reimburse providers under its traditional payment methodologies. Comprehensive Care for Joint Replacement Model (April 1, 2016 - December 31, 2020) LEJR patients enter an acute care hospital for treatment. Patients are then discharged to a post-acute care provider or to home self-care. RETROSPECTIVE RECONCILIATION PERFORMED BY CMS HIGH QUALITY LOW COST POST-ACUTE CARE PROVIDERS SHARED SAVINGS Lower extremity joint replacement (“LEJR”) patients treated by HealthSouth’s IRFs are higher acuity and possess significant complicating comorbidities necessitating treatment in a hospital setting. In these cases, and in any risk-bearing bundling initiative, quality of outcomes and cost effectiveness are critical to achieving targeted financial results. Acute hospital accountable for quality of care through 90 days after discharge.
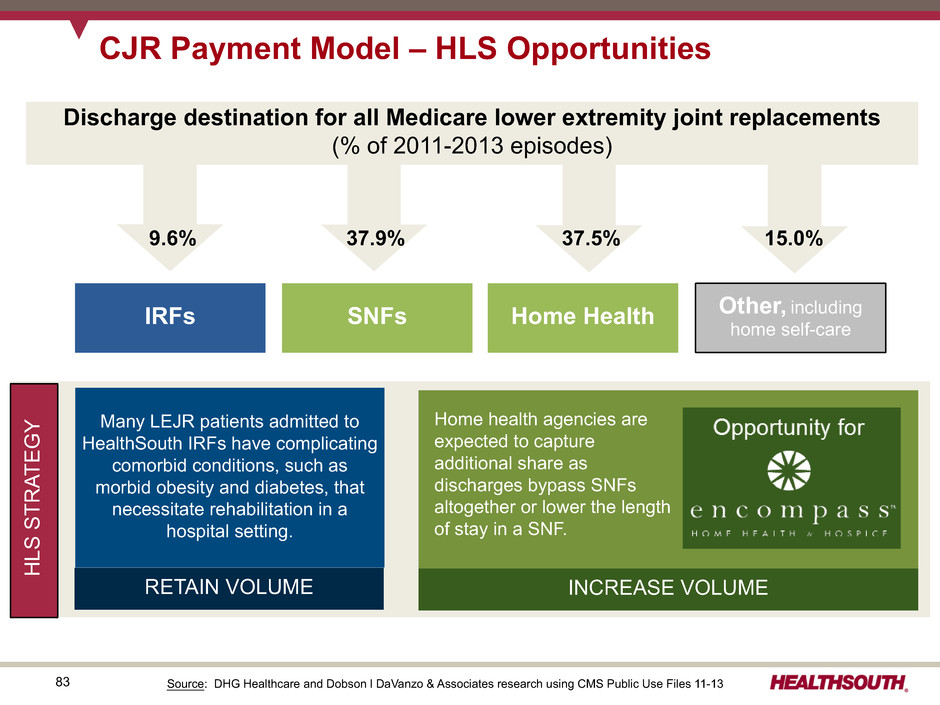
83 CJR Payment Model – HLS Opportunities Source: DHG Healthcare and Dobson l DaVanzo & Associates research using CMS Public Use Files 11-13 Discharge destination for all Medicare lower extremity joint replacements (% of 2011-2013 episodes) IRFs SNFs Home Health Other, includinghome self-care 9.6% 37.9% 15.0%37.5% HLS STR ATEG Y Many LEJR patients admitted to HealthSouth IRFs have complicating comorbid conditions, such as morbid obesity and diabetes, that necessitate rehabilitation in a hospital setting. RETAIN VOLUME INCREASE VOLUME Home health agencies are expected to capture additional share as discharges bypass SNFs altogether or lower the length of stay in a SNF.
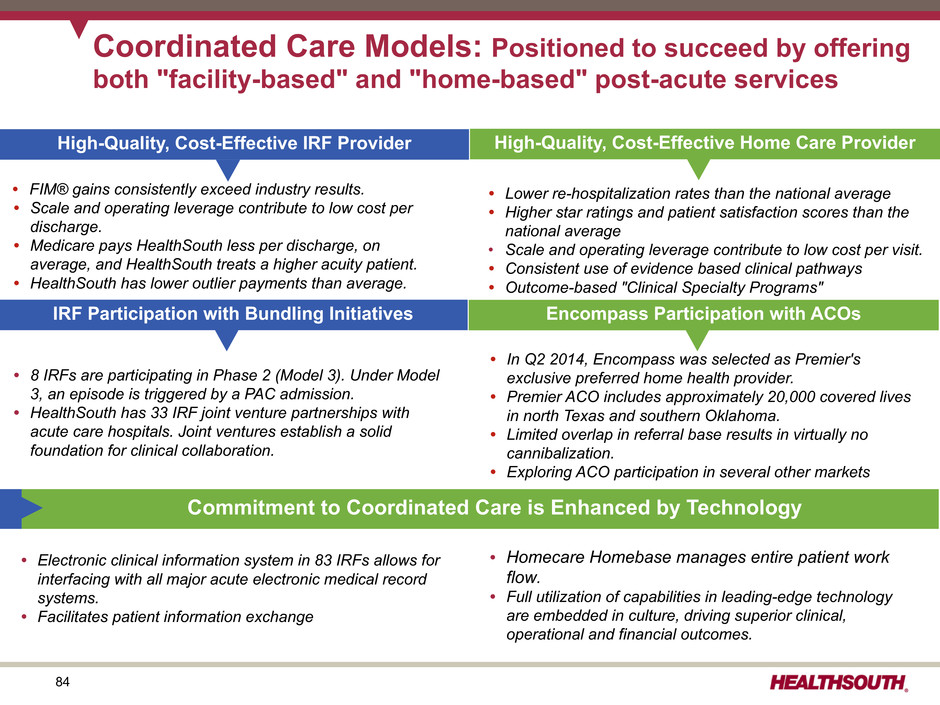
84 • Homecare Homebase manages entire patient work flow. • Full utilization of capabilities in leading-edge technology are embedded in culture, driving superior clinical, operational and financial outcomes. • Electronic clinical information system in 83 IRFs allows for interfacing with all major acute electronic medical record systems. • Facilitates patient information exchange Coordinated Care Models: Positioned to succeed by offering both "facility-based" and "home-based" post-acute services • Lower re-hospitalization rates than the national average • Higher star ratings and patient satisfaction scores than the national average • Scale and operating leverage contribute to low cost per visit. • Consistent use of evidence based clinical pathways • Outcome-based "Clinical Specialty Programs" • FIM® gains consistently exceed industry results. • Scale and operating leverage contribute to low cost per discharge. • Medicare pays HealthSouth less per discharge, on average, and HealthSouth treats a higher acuity patient. • HealthSouth has lower outlier payments than average. • 8 IRFs are participating in Phase 2 (Model 3). Under Model 3, an episode is triggered by a PAC admission. • HealthSouth has 33 IRF joint venture partnerships with acute care hospitals. Joint ventures establish a solid foundation for clinical collaboration. • In Q2 2014, Encompass was selected as Premier's exclusive preferred home health provider. • Premier ACO includes approximately 20,000 covered lives in north Texas and southern Oklahoma. • Limited overlap in referral base results in virtually no cannibalization. • Exploring ACO participation in several other markets Commitment to Coordinated Care is Enhanced by Technology High-Quality, Cost-Effective IRF Provider High-Quality, Cost-Effective Home Care Provider IRF Participation with Bundling Initiatives Encompass Participation with ACOs
85 Industry Structure
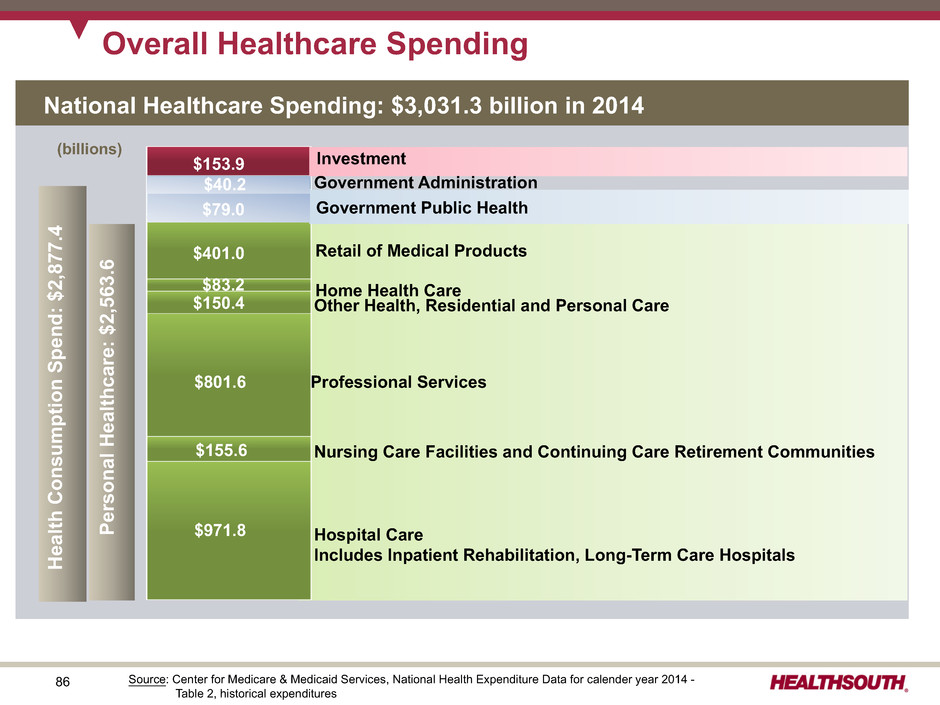
86 Overall Healthcare Spending Hospital Care Includes Inpatient Rehabilitation, Long-Term Care Hospitals $801.6 $150.4 $83.2 $401.0 Nursing Care Facilities and Continuing Care Retirement Communities Professional Services Other Health, Residential and Personal Care Home Health Care Retail of Medical Products $153.9 (billions) Health Consumption Spend: $2,877.4 Personal Healthcare: $2,563. 6 Investment Net Cost of Health InsuranceGovernment Public Health Government Administration $971.8 $155.6 Source: Center for Medicare & Medicaid Services, National Health Expenditure Data for calender year 2014 - Table 2, historical expenditures National Healthcare Spending: $3,031.3 billion in 2014 $40.2 $79.0
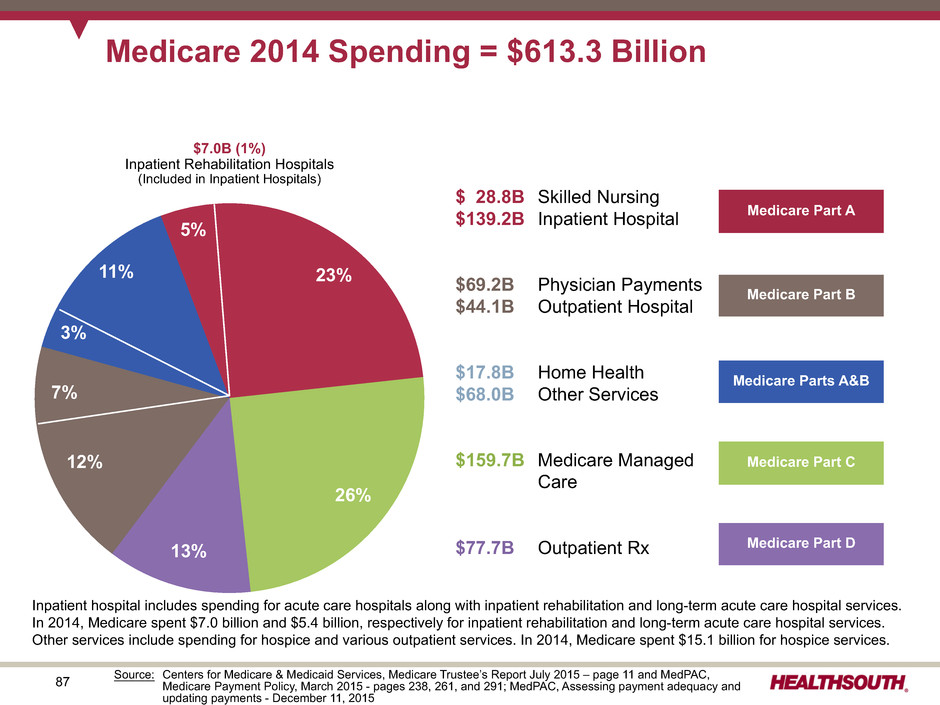
87 Medicare 2014 Spending = $613.3 Billion $ 28.8B Skilled Nursing $139.2B Inpatient Hospital $69.2B Physician Payments $44.1B Outpatient Hospital $17.8B Home Health $68.0B Other Services $159.7B Medicare Managed Care $77.7B Outpatient Rx $7.0B (1%) Inpatient Rehabilitation Hospitals (Included in Inpatient Hospitals) 13% 3% 7% 11% 12% 26% 23% Medicare Part A Medicare Part B Medicare Parts A&B Medicare Part C Medicare Part D 5% Source: Centers for Medicare & Medicaid Services, Medicare Trustee’s Report July 2015 – page 11 and MedPAC, Medicare Payment Policy, March 2015 - pages 238, 261, and 291; MedPAC, Assessing payment adequacy and updating payments - December 11, 2015 Inpatient hospital includes spending for acute care hospitals along with inpatient rehabilitation and long-term acute care hospital services. In 2014, Medicare spent $7.0 billion and $5.4 billion, respectively for inpatient rehabilitation and long-term acute care hospital services. Other services include spending for hospice and various outpatient services. In 2014, Medicare spent $15.1 billion for hospice services.
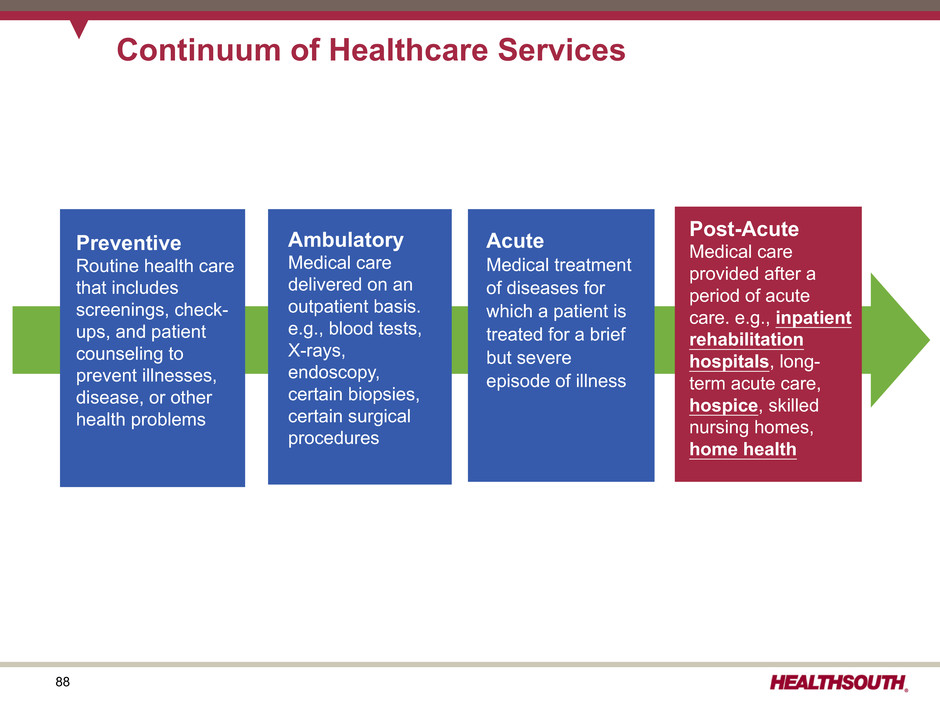
88 Continuum of Healthcare Services Preventive Routine health care that includes screenings, check- ups, and patient counseling to prevent illnesses, disease, or other health problems Acute Medical treatment of diseases for which a patient is treated for a brief but severe episode of illness Ambulatory Medical care delivered on an outpatient basis. e.g., blood tests, X-rays, endoscopy, certain biopsies, certain surgical procedures Post-Acute Medical care provided after a period of acute care. e.g., inpatient rehabilitation hospitals, long- term acute care, hospice, skilled nursing homes, home health
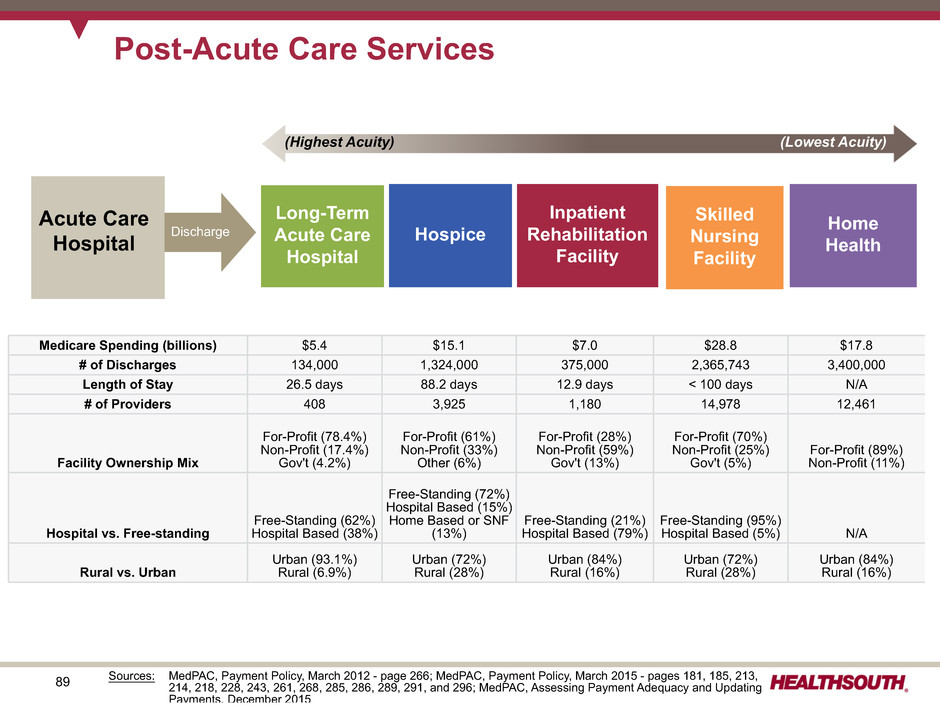
89 Post-Acute Care Services Acute Care Hospital Home HealthHospice Long-Term Acute Care Hospital Inpatient Rehabilitation Facility Skilled Nursing Facility Discharge Medicare Spending (billions) $5.4 $15.1 $7.0 $28.8 $17.8 # of Discharges 134,000 1,324,000 375,000 2,365,743 3,400,000 Length of Stay 26.5 days 88.2 days 12.9 days < 100 days N/A # of Providers 408 3,925 1,180 14,978 12,461 Facility Ownership Mix For-Profit (78.4%) Non-Profit (17.4%) Gov't (4.2%) For-Profit (61%) Non-Profit (33%) Other (6%) For-Profit (28%) Non-Profit (59%) Gov't (13%) For-Profit (70%) Non-Profit (25%) Gov't (5%) For-Profit (89%) Non-Profit (11%) Hospital vs. Free-standing Free-Standing (62%) Hospital Based (38%) Free-Standing (72%) Hospital Based (15%) Home Based or SNF (13%) Free-Standing (21%) Hospital Based (79%) Free-Standing (95%) Hospital Based (5%) N/A Rural vs. Urban Urban (93.1%) Rural (6.9%) Urban (72%) Rural (28%) Urban (84%) Rural (16%) Urban (72%) Rural (28%) Urban (84%) Rural (16%) (Lowest Acuity)(Highest Acuity) Sources: MedPAC, Payment Policy, March 2012 - page 266; MedPAC, Payment Policy, March 2015 - pages 181, 185, 213, 214, 218, 228, 243, 261, 268, 285, 286, 289, 291, and 296; MedPAC, Assessing Payment Adequacy and Updating Payments, December 2015
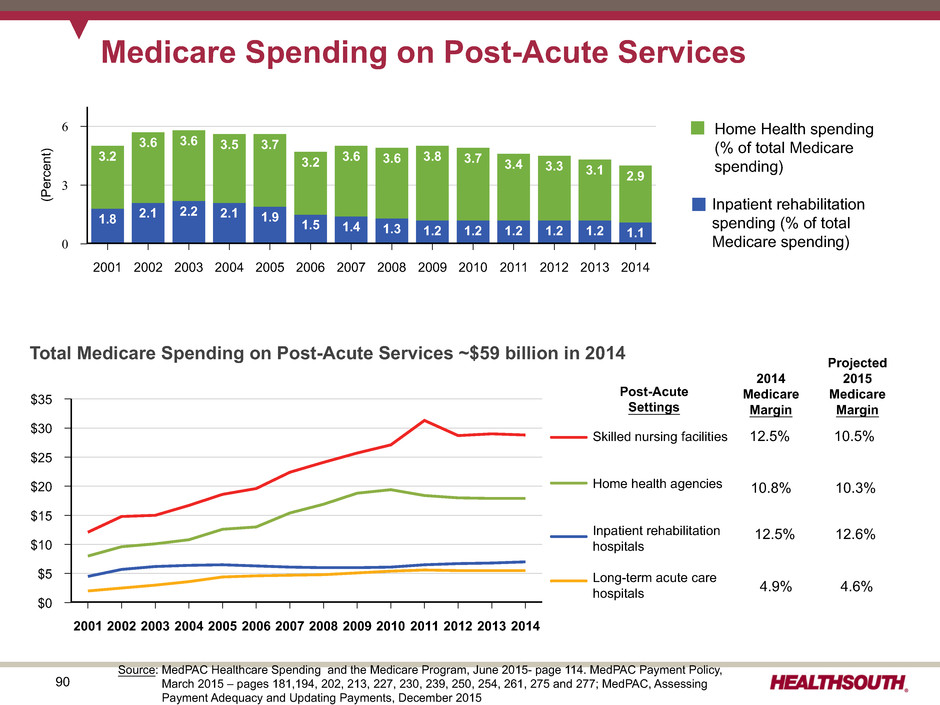
90 $35 $30 $25 $20 $15 $10 $5 $0 2001 2002 2003 2004 2005 2006 2007 2008 2009 2010 2011 2012 2013 2014 Medicare Spending on Post-Acute Services Post-Acute Settings 2014 Medicare Margin Projected 2015 Medicare Margin Sources: (1) 12.5% 10.5% 10.8% 10.3% 12.5% 12.6% 4.9% 4.6% Skilled nursing facilities Home health agencies Inpatient rehabilitation hospitals Long-term acute care hospitals Inpatient rehabilitation spending (% of total Medicare spending) Source: MedPAC Healthcare Spending and the Medicare Program, June 2015- page 114. MedPAC Payment Policy, March 2015 – pages 181,194, 202, 213, 227, 230, 239, 250, 254, 261, 275 and 277; MedPAC, Assessing Payment Adequacy and Updating Payments, December 2015 6 3 0 (P er ce nt ) 2001 2002 2003 2004 2005 2006 2007 2008 2009 2010 2011 2012 2013 2014 1.8 2.1 2.2 2.1 1.9 1.5 1.4 1.3 1.2 1.2 1.2 1.2 1.2 1.1 3.2 3.6 3.6 3.5 3.7 3.2 3.6 3.6 3.8 3.7 3.4 3.3 3.1 2.9 Home Health spending (% of total Medicare spending) Total Medicare Spending on Post-Acute Services ~$59 billion in 2014
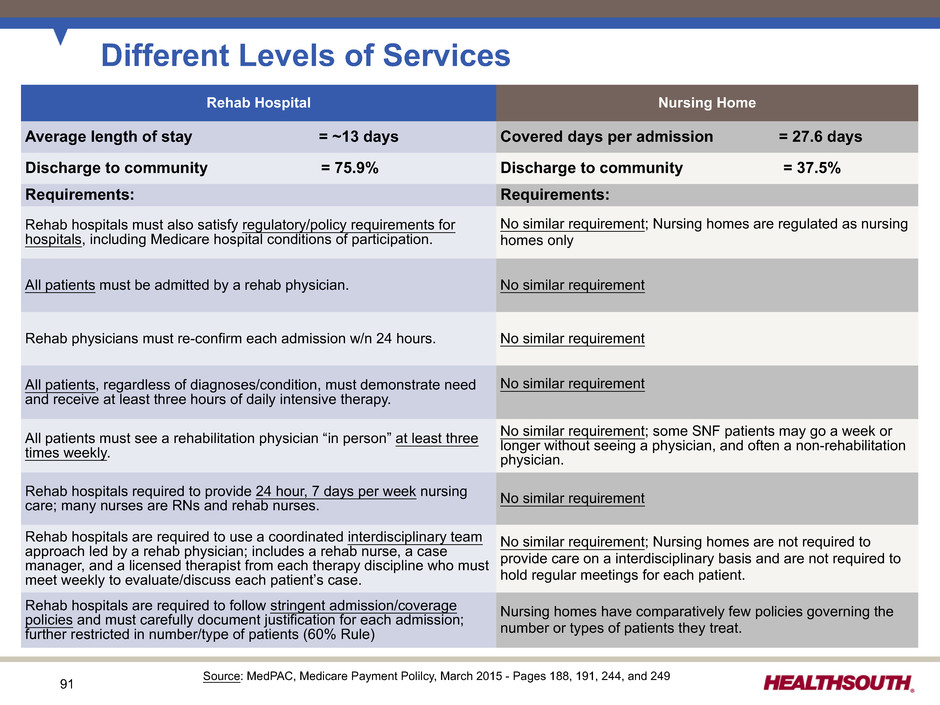
91 Different Levels of Services Rehab Hospital Nursing Home Average length of stay = ~13 days Covered days per admission = 27.6 days Discharge to community = 75.9% Discharge to community = 37.5% Requirements: Requirements: Rehab hospitals must also satisfy regulatory/policy requirements for hospitals, including Medicare hospital conditions of participation. No similar requirement; Nursing homes are regulated as nursing homes only All patients must be admitted by a rehab physician. No similar requirement Rehab physicians must re-confirm each admission w/n 24 hours. No similar requirement All patients, regardless of diagnoses/condition, must demonstrate need and receive at least three hours of daily intensive therapy. No similar requirement All patients must see a rehabilitation physician “in person” at least three times weekly. No similar requirement; some SNF patients may go a week or longer without seeing a physician, and often a non-rehabilitation physician. Rehab hospitals required to provide 24 hour, 7 days per week nursing care; many nurses are RNs and rehab nurses. No similar requirement Rehab hospitals are required to use a coordinated interdisciplinary team approach led by a rehab physician; includes a rehab nurse, a case manager, and a licensed therapist from each therapy discipline who must meet weekly to evaluate/discuss each patient’s case. No similar requirement; Nursing homes are not required to provide care on a interdisciplinary basis and are not required to hold regular meetings for each patient. Rehab hospitals are required to follow stringent admission/coverage policies and must carefully document justification for each admission; further restricted in number/type of patients (60% Rule) Nursing homes have comparatively few policies governing the number or types of patients they treat. Source: MedPAC, Medicare Payment Polilcy, March 2015 - Pages 188, 191, 244, and 249
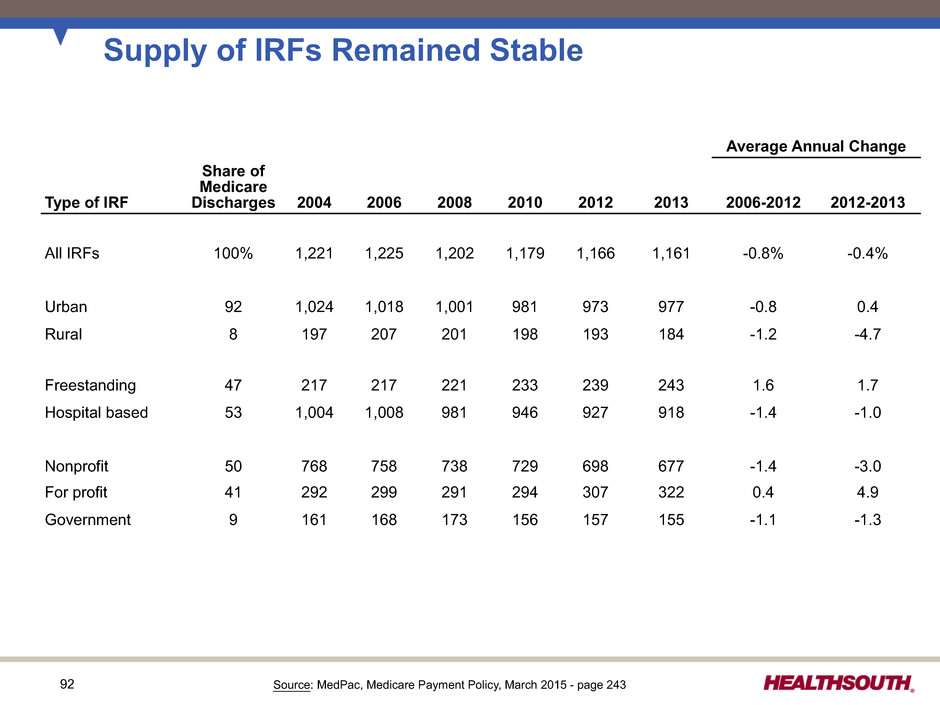
92 Supply of IRFs Remained Stable Average Annual Change Share of Medicare DischargesType of IRF 2004 2006 2008 2010 2012 2013 2006-2012 2012-2013 All IRFs 100% 1,221 1,225 1,202 1,179 1,166 1,161 -0.8% -0.4% Urban 92 1,024 1,018 1,001 981 973 977 -0.8 0.4 Rural 8 197 207 201 198 193 184 -1.2 -4.7 Freestanding 47 217 217 221 233 239 243 1.6 1.7 Hospital based 53 1,004 1,008 981 946 927 918 -1.4 -1.0 Nonprofit 50 768 758 738 729 698 677 -1.4 -3.0 For profit 41 292 299 291 294 307 322 0.4 4.9 Government 9 161 168 173 156 157 155 -1.1 -1.3 Source: MedPac, Medicare Payment Policy, March 2015 - page 243
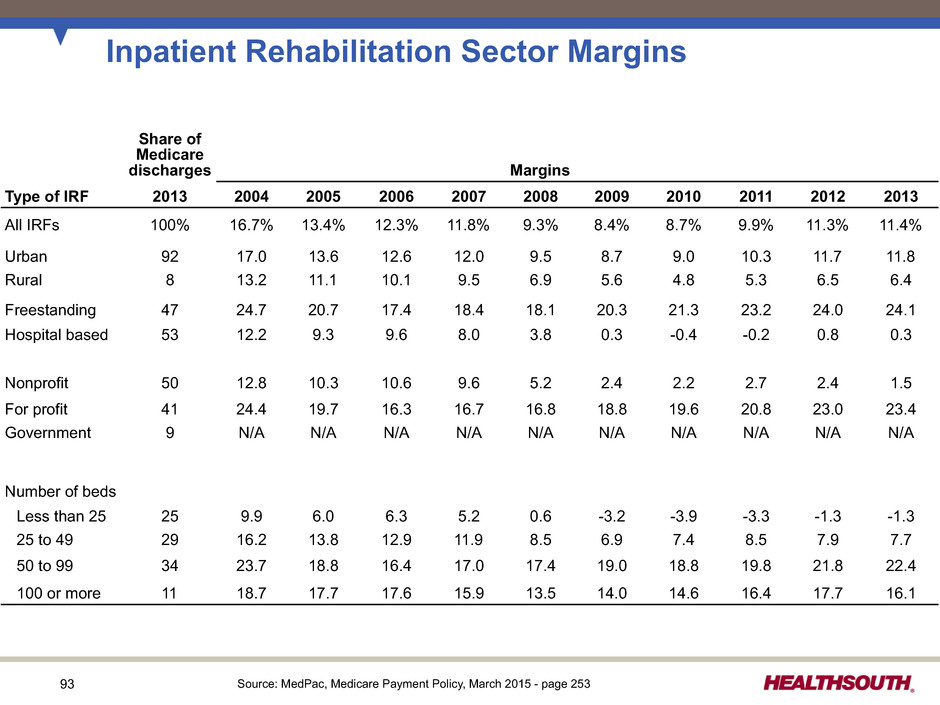
93 Inpatient Rehabilitation Sector Margins Share of Medicare discharges Margins Type of IRF 2013 2004 2005 2006 2007 2008 2009 2010 2011 2012 2013 All IRFs 100% 16.7% 13.4% 12.3% 11.8% 9.3% 8.4% 8.7% 9.9% 11.3% 11.4% Urban 92 17.0 13.6 12.6 12.0 9.5 8.7 9.0 10.3 11.7 11.8 Rural 8 13.2 11.1 10.1 9.5 6.9 5.6 4.8 5.3 6.5 6.4 Freestanding 47 24.7 20.7 17.4 18.4 18.1 20.3 21.3 23.2 24.0 24.1 Hospital based 53 12.2 9.3 9.6 8.0 3.8 0.3 -0.4 -0.2 0.8 0.3 Nonprofit 50 12.8 10.3 10.6 9.6 5.2 2.4 2.2 2.7 2.4 1.5 For profit 41 24.4 19.7 16.3 16.7 16.8 18.8 19.6 20.8 23.0 23.4 Government 9 N/A N/A N/A N/A N/A N/A N/A N/A N/A N/A Number of beds Less than 25 25 9.9 6.0 6.3 5.2 0.6 -3.2 -3.9 -3.3 -1.3 -1.3 25 to 49 29 16.2 13.8 12.9 11.9 8.5 6.9 7.4 8.5 7.9 7.7 50 to 99 34 23.7 18.8 16.4 17.0 17.4 19.0 18.8 19.8 21.8 22.4 100 or more 11 18.7 17.7 17.6 15.9 13.5 14.0 14.6 16.4 17.7 16.1 Source: MedPac, Medicare Payment Policy, March 2015 - page 253
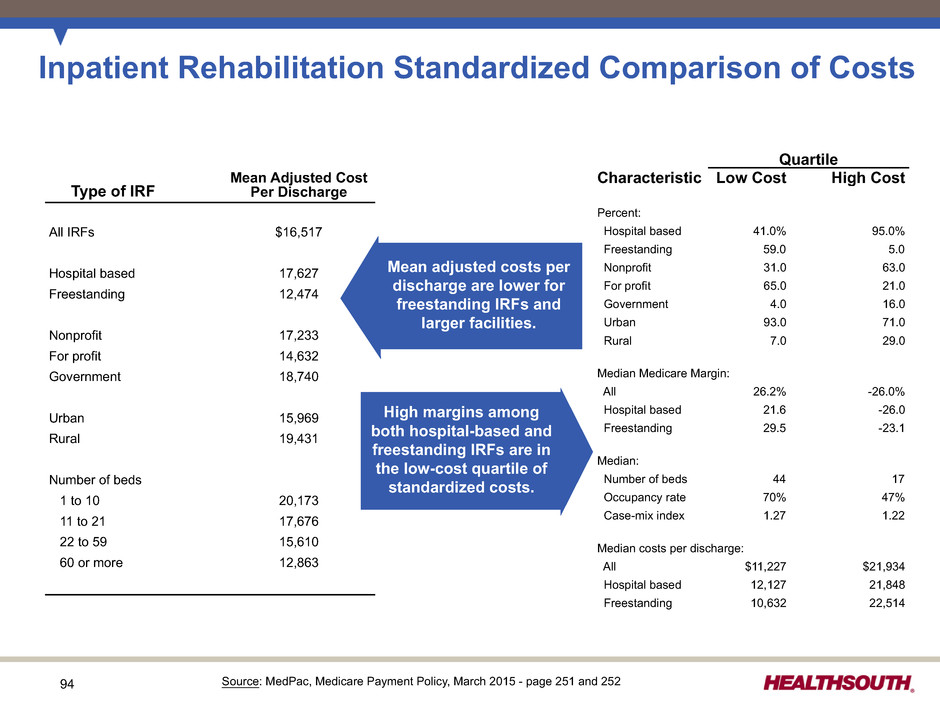
94 Inpatient Rehabilitation Standardized Comparison of Costs Type of IRF Mean Adjusted Cost Per Discharge All IRFs $16,517 Hospital based 17,627 Freestanding 12,474 Nonprofit 17,233 For profit 14,632 Government 18,740 Urban 15,969 Rural 19,431 Number of beds 1 to 10 20,173 11 to 21 17,676 22 to 59 15,610 60 or more 12,863 Quartile Characteristic Low Cost High Cost Percent: Hospital based 41.0% 95.0% Freestanding 59.0 5.0 Nonprofit 31.0 63.0 For profit 65.0 21.0 Government 4.0 16.0 Urban 93.0 71.0 Rural 7.0 29.0 Median Medicare Margin: All 26.2% -26.0% Hospital based 21.6 -26.0 Freestanding 29.5 -23.1 Median: Number of beds 44 17 Occupancy rate 70% 47% Case-mix index 1.27 1.22 Median costs per discharge: All $11,227 $21,934 Hospital based 12,127 21,848 Freestanding 10,632 22,514 Mean adjusted costs per discharge are lower for freestanding IRFs and larger facilities. High margins among both hospital-based and freestanding IRFs are in the low-cost quartile of standardized costs. Source: MedPac, Medicare Payment Policy, March 2015 - page 251 and 252
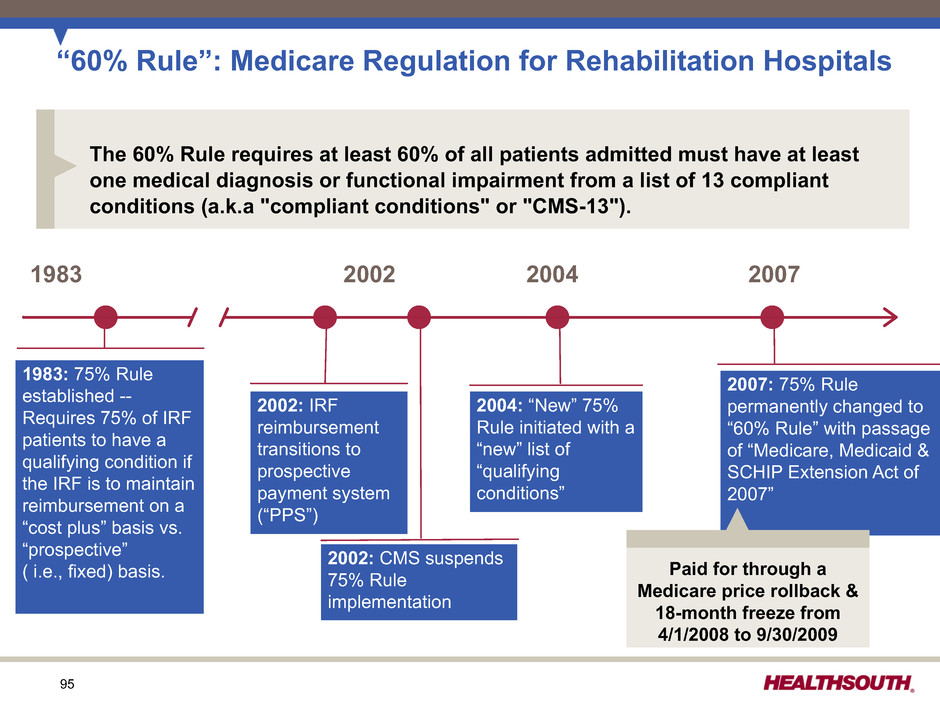
95 “60% Rule”: Medicare Regulation for Rehabilitation Hospitals 1983 1983: 75% Rule established -- Requires 75% of IRF patients to have a qualifying condition if the IRF is to maintain reimbursement on a “cost plus” basis vs. “prospective” ( i.e., fixed) basis. 2002 2004 2007 2002: IRF reimbursement transitions to prospective payment system (“PPS”) 2002: CMS suspends 75% Rule implementation 2004: “New” 75% Rule initiated with a “new” list of “qualifying conditions” 2007: 75% Rule permanently changed to “60% Rule” with passage of “Medicare, Medicaid & SCHIP Extension Act of 2007” Paid for through a Medicare price rollback & 18-month freeze from 4/1/2008 to 9/30/2009 The 60% Rule requires at least 60% of all patients admitted must have at least one medical diagnosis or functional impairment from a list of 13 compliant conditions (a.k.a "compliant conditions" or "CMS-13").
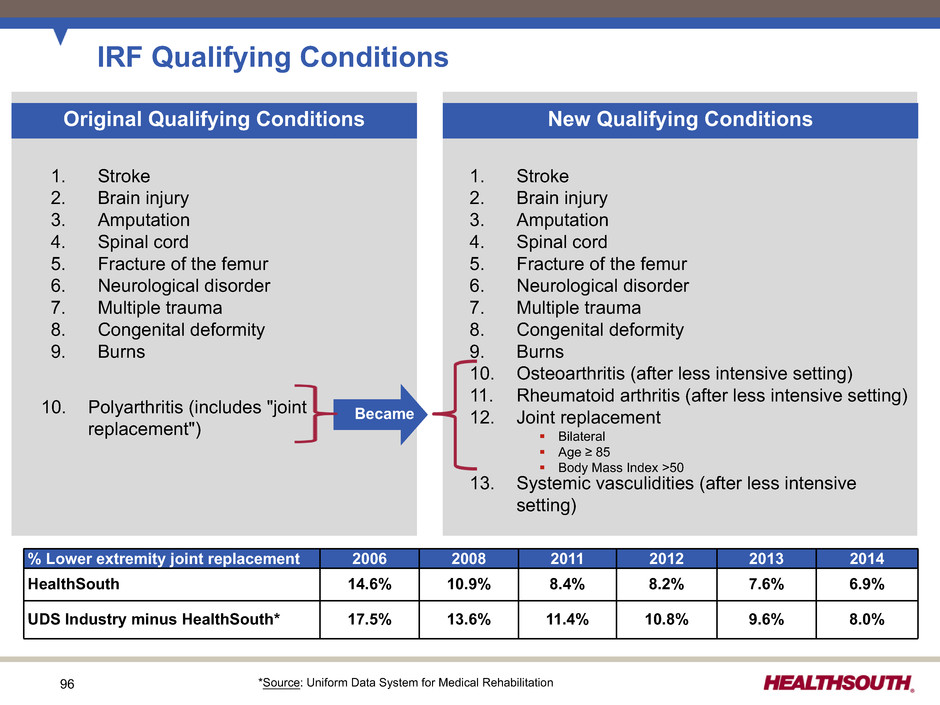
96 IRF Qualifying Conditions 1. Stroke 2. Brain injury 3. Amputation 4. Spinal cord 5. Fracture of the femur 6. Neurological disorder 7. Multiple trauma 8. Congenital deformity 9. Burns 10. Osteoarthritis (after less intensive setting) 11. Rheumatoid arthritis (after less intensive setting) 12. Joint replacement 13. Systemic vasculidities (after less intensive setting) % Lower extremity joint replacement 2006 2008 2011 2012 2013 2014 HealthSouth 14.6% 10.9% 8.4% 8.2% 7.6% 6.9% UDS Industry minus HealthSouth* 17.5% 13.6% 11.4% 10.8% 9.6% 8.0% Became 1. Stroke 2. Brain injury 3. Amputation 4. Spinal cord 5. Fracture of the femur 6. Neurological disorder 7. Multiple trauma 8. Congenital deformity 9. Burns Original Qualifying Conditions New Qualifying Conditions § Bilateral § Age ≥ 85 § Body Mass Index >50 10. Polyarthritis (includes "joint replacement") Became *Source: Uniform Data System for Medical Rehabilitation
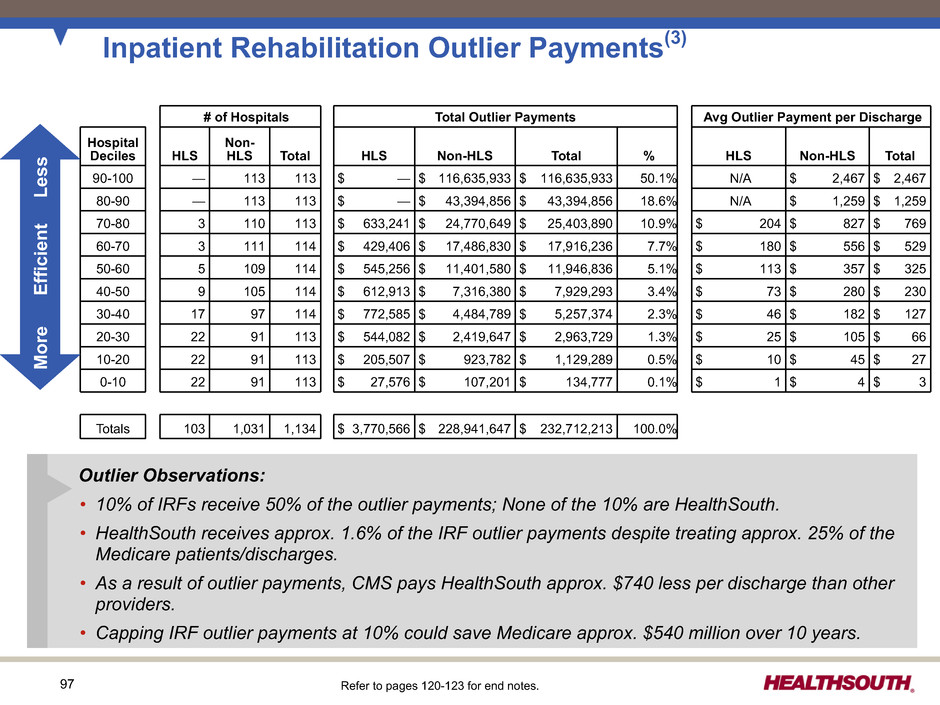
97 Inpatient Rehabilitation Outlier Payments(3) # of Hospitals Total Outlier Payments Avg Outlier Payment per Discharge Hospital Deciles HLS Non- HLS Total HLS Non-HLS Total % HLS Non-HLS Total 90-100 — 113 113 $ — $ 116,635,933 $ 116,635,933 50.1% N/A $ 2,467 $ 2,467 80-90 — 113 113 $ — $ 43,394,856 $ 43,394,856 18.6% N/A $ 1,259 $ 1,259 70-80 3 110 113 $ 633,241 $ 24,770,649 $ 25,403,890 10.9% $ 204 $ 827 $ 769 60-70 3 111 114 $ 429,406 $ 17,486,830 $ 17,916,236 7.7% $ 180 $ 556 $ 529 50-60 5 109 114 $ 545,256 $ 11,401,580 $ 11,946,836 5.1% $ 113 $ 357 $ 325 40-50 9 105 114 $ 612,913 $ 7,316,380 $ 7,929,293 3.4% $ 73 $ 280 $ 230 30-40 17 97 114 $ 772,585 $ 4,484,789 $ 5,257,374 2.3% $ 46 $ 182 $ 127 20-30 22 91 113 $ 544,082 $ 2,419,647 $ 2,963,729 1.3% $ 25 $ 105 $ 66 10-20 22 91 113 $ 205,507 $ 923,782 $ 1,129,289 0.5% $ 10 $ 45 $ 27 0-10 22 91 113 $ 27,576 $ 107,201 $ 134,777 0.1% $ 1 $ 4 $ 3 Totals 103 1,031 1,134 $ 3,770,566 $ 228,941,647 $ 232,712,213 100.0% Refer to pages 120-123 for end notes. More Efficient Less Outlier Observations: • 10% of IRFs receive 50% of the outlier payments; None of the 10% are HealthSouth. • HealthSouth receives approx. 1.6% of the IRF outlier payments despite treating approx. 25% of the Medicare patients/discharges. • As a result of outlier payments, CMS pays HealthSouth approx. $740 less per discharge than other providers. • Capping IRF outlier payments at 10% could save Medicare approx. $540 million over 10 years.
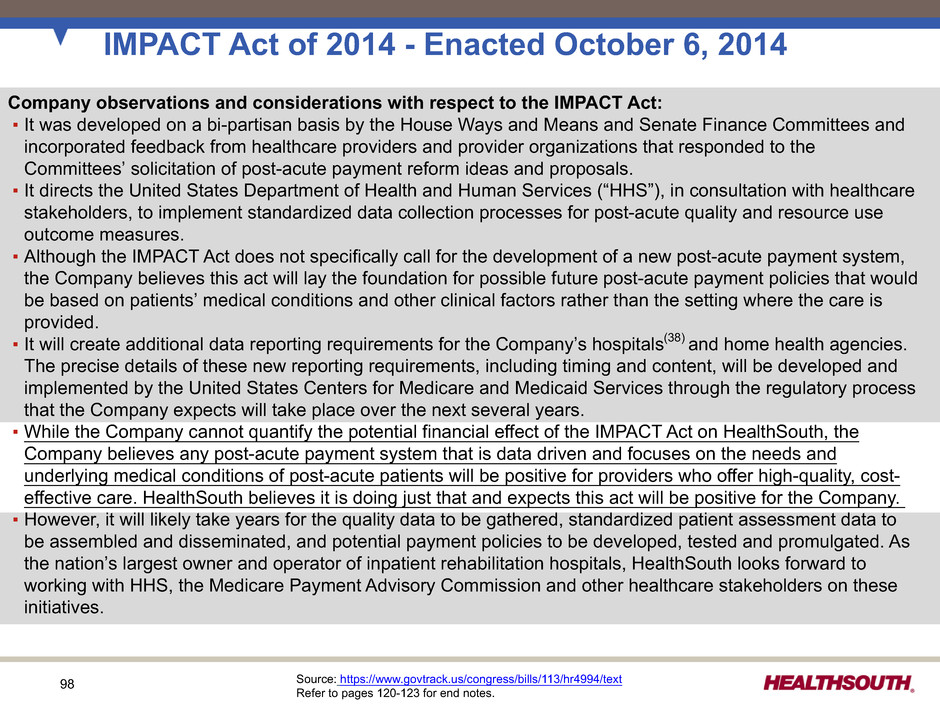
98 IMPACT Act of 2014 - Enacted October 6, 2014 Company observations and considerations with respect to the IMPACT Act: ▪ It was developed on a bi-partisan basis by the House Ways and Means and Senate Finance Committees and incorporated feedback from healthcare providers and provider organizations that responded to the Committees’ solicitation of post-acute payment reform ideas and proposals. ▪ It directs the United States Department of Health and Human Services (“HHS”), in consultation with healthcare stakeholders, to implement standardized data collection processes for post-acute quality and resource use outcome measures. ▪ Although the IMPACT Act does not specifically call for the development of a new post-acute payment system, the Company believes this act will lay the foundation for possible future post-acute payment policies that would be based on patients’ medical conditions and other clinical factors rather than the setting where the care is provided. ▪ It will create additional data reporting requirements for the Company’s hospitals(38) and home health agencies. The precise details of these new reporting requirements, including timing and content, will be developed and implemented by the United States Centers for Medicare and Medicaid Services through the regulatory process that the Company expects will take place over the next several years. ▪ While the Company cannot quantify the potential financial effect of the IMPACT Act on HealthSouth, the Company believes any post-acute payment system that is data driven and focuses on the needs and underlying medical conditions of post-acute patients will be positive for providers who offer high-quality, cost- effective care. HealthSouth believes it is doing just that and expects this act will be positive for the Company. ▪ However, it will likely take years for the quality data to be gathered, standardized patient assessment data to be assembled and disseminated, and potential payment policies to be developed, tested and promulgated. As the nation’s largest owner and operator of inpatient rehabilitation hospitals, HealthSouth looks forward to working with HHS, the Medicare Payment Advisory Commission and other healthcare stakeholders on these initiatives. Source: https://www.govtrack.us/congress/bills/113/hr4994/text Refer to pages 120-123 for end notes.
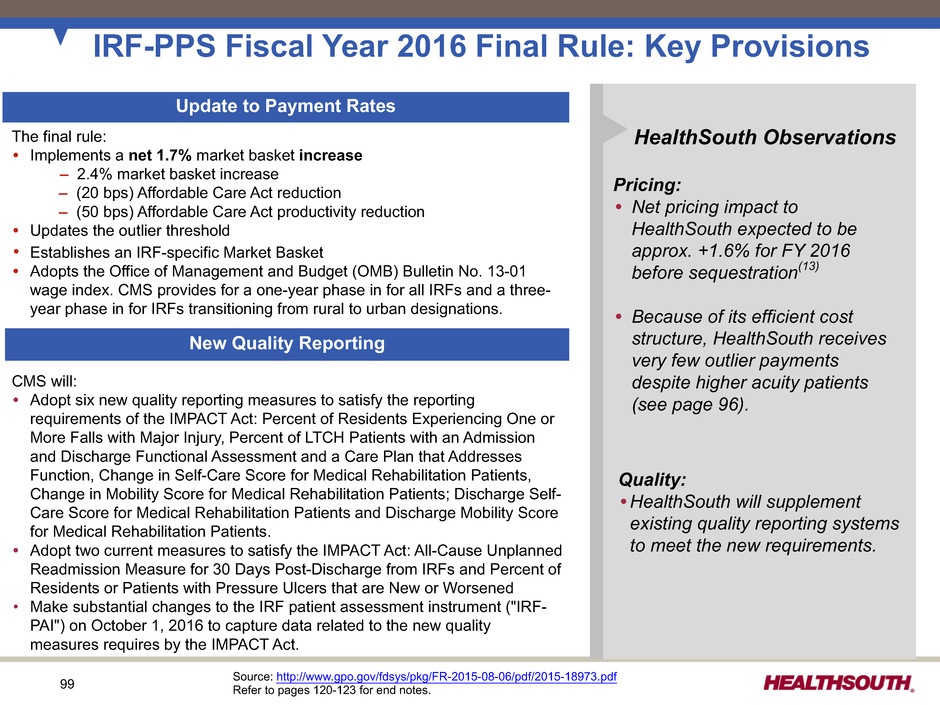
99 IRF-PPS Fiscal Year 2016 Final Rule: Key Provisions Source: http://www.gpo.gov/fdsys/pkg/FR-2015-08-06/pdf/2015-18973.pdf Refer to pages 120-123 for end notes. New Quality Reporting Update to Payment Rates HealthSouth Observations Pricing: • Net pricing impact to HealthSouth expected to be approx. +1.6% for FY 2016 before sequestration(13) • Because of its efficient cost structure, HealthSouth receives very few outlier payments despite higher acuity patients (see page 96). Quality: • HealthSouth will supplement existing quality reporting systems to meet the new requirements. The final rule: • Implements a net 1.7% market basket increase – 2.4% market basket increase – (20 bps) Affordable Care Act reduction – (50 bps) Affordable Care Act productivity reduction • Updates the outlier threshold • Establishes an IRF-specific Market Basket • Adopts the Office of Management and Budget (OMB) Bulletin No. 13-01 wage index. CMS provides for a one-year phase in for all IRFs and a three- year phase in for IRFs transitioning from rural to urban designations. CMS will: • Adopt six new quality reporting measures to satisfy the reporting requirements of the IMPACT Act: Percent of Residents Experiencing One or More Falls with Major Injury, Percent of LTCH Patients with an Admission and Discharge Functional Assessment and a Care Plan that Addresses Function, Change in Self-Care Score for Medical Rehabilitation Patients, Change in Mobility Score for Medical Rehabilitation Patients; Discharge Self- Care Score for Medical Rehabilitation Patients and Discharge Mobility Score for Medical Rehabilitation Patients. • Adopt two current measures to satisfy the IMPACT Act: All-Cause Unplanned Readmission Measure for 30 Days Post-Discharge from IRFs and Percent of Residents or Patients with Pressure Ulcers that are New or Worsened • Make substantial changes to the IRF patient assessment instrument ("IRF- PAI") on October 1, 2016 to capture data related to the new quality measures requires by the IMPACT Act.
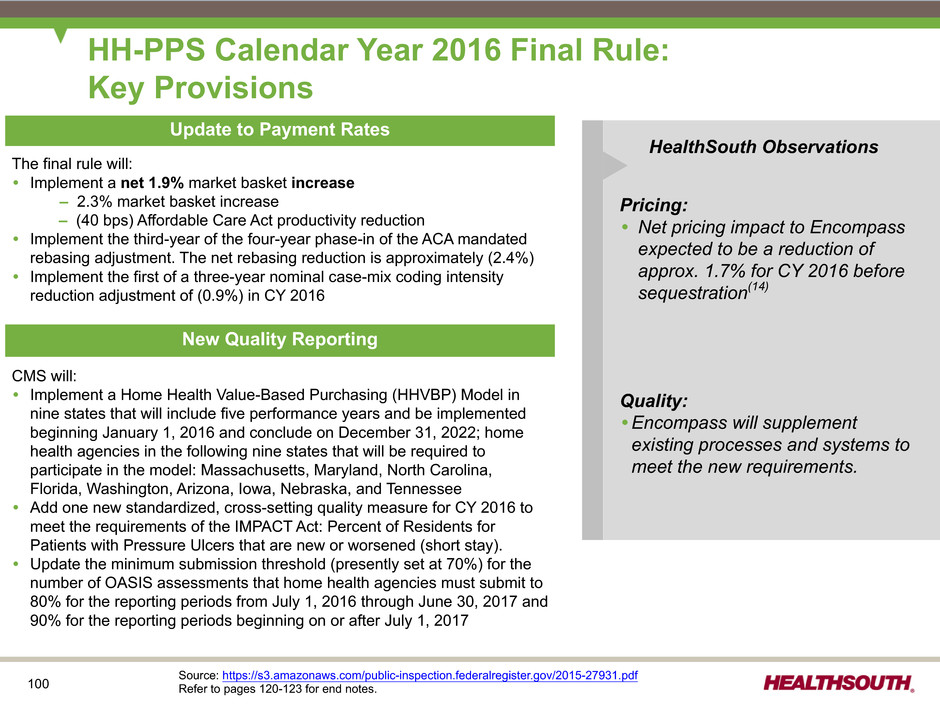
100 HH-PPS Calendar Year 2016 Final Rule: Key Provisions Source: https://s3.amazonaws.com/public-inspection.federalregister.gov/2015-27931.pdf Refer to pages 120-123 for end notes. New Quality Reporting Update to Payment Rates HealthSouth Observations Pricing: • Net pricing impact to Encompass expected to be a reduction of approx. 1.7% for CY 2016 before sequestration(14) Quality: • Encompass will supplement existing processes and systems to meet the new requirements. The final rule will: • Implement a net 1.9% market basket increase – 2.3% market basket increase – (40 bps) Affordable Care Act productivity reduction • Implement the third-year of the four-year phase-in of the ACA mandated rebasing adjustment. The net rebasing reduction is approximately (2.4%) • Implement the first of a three-year nominal case-mix coding intensity reduction adjustment of (0.9%) in CY 2016 CMS will: • Implement a Home Health Value-Based Purchasing (HHVBP) Model in nine states that will include five performance years and be implemented beginning January 1, 2016 and conclude on December 31, 2022; home health agencies in the following nine states that will be required to participate in the model: Massachusetts, Maryland, North Carolina, Florida, Washington, Arizona, Iowa, Nebraska, and Tennessee • Add one new standardized, cross-setting quality measure for CY 2016 to meet the requirements of the IMPACT Act: Percent of Residents for Patients with Pressure Ulcers that are new or worsened (short stay). • Update the minimum submission threshold (presently set at 70%) for the number of OASIS assessments that home health agencies must submit to 80% for the reporting periods from July 1, 2016 through June 30, 2017 and 90% for the reporting periods beginning on or after July 1, 2017
101 Reconciliations to GAAP
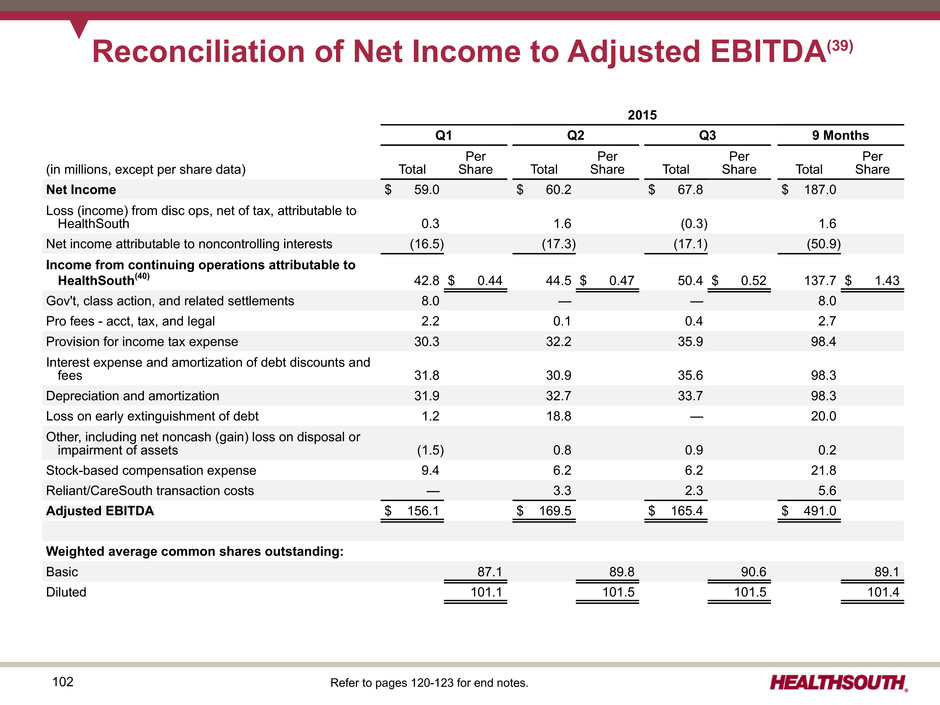
102 Reconciliation of Net Income to Adjusted EBITDA(39) Refer to pages 120-123 for end notes. 2015 Q1 Q2 Q3 9 Months (in millions, except per share data) Total Per Share Total Per Share Total Per Share Total Per Share Net Income $ 59.0 $ 60.2 $ 67.8 $ 187.0 Loss (income) from disc ops, net of tax, attributable to HealthSouth 0.3 1.6 (0.3) 1.6 Net income attributable to noncontrolling interests (16.5) (17.3) (17.1) (50.9) Income from continuing operations attributable to HealthSouth(40) 42.8 $ 0.44 44.5 $ 0.47 50.4 $ 0.52 137.7 $ 1.43 Gov't, class action, and related settlements 8.0 — — 8.0 Pro fees - acct, tax, and legal 2.2 0.1 0.4 2.7 Provision for income tax expense 30.3 32.2 35.9 98.4 Interest expense and amortization of debt discounts and fees 31.8 30.9 35.6 98.3 Depreciation and amortization 31.9 32.7 33.7 98.3 Loss on early extinguishment of debt 1.2 18.8 — 20.0 Other, including net noncash (gain) loss on disposal or impairment of assets (1.5) 0.8 0.9 0.2 Stock-based compensation expense 9.4 6.2 6.2 21.8 Reliant/CareSouth transaction costs — 3.3 2.3 5.6 Adjusted EBITDA $ 156.1 $ 169.5 $ 165.4 $ 491.0 Weighted average common shares outstanding: Basic 87.1 89.8 90.6 89.1 Diluted 101.1 101.5 101.5 101.4
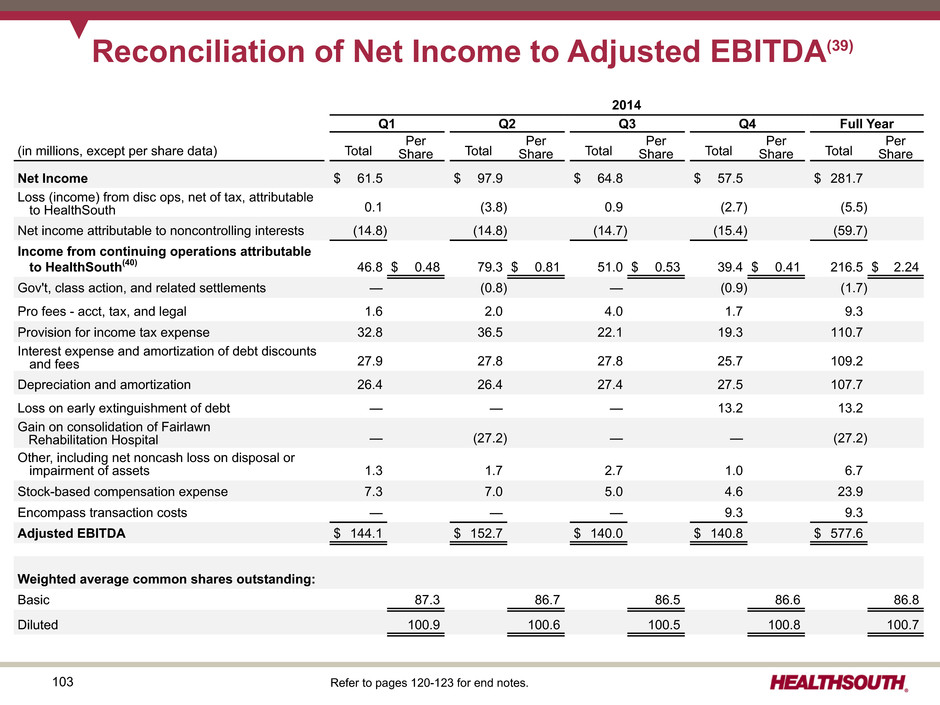
103 Reconciliation of Net Income to Adjusted EBITDA(39) 2014 Q1 Q2 Q3 Q4 Full Year (in millions, except per share data) Total Per Share Total Per Share Total Per Share Total Per Share Total Per Share Net Income $ 61.5 $ 97.9 $ 64.8 $ 57.5 $ 281.7 Loss (income) from disc ops, net of tax, attributable to HealthSouth 0.1 (3.8) 0.9 (2.7) (5.5) Net income attributable to noncontrolling interests (14.8) (14.8) (14.7) (15.4) (59.7) Income from continuing operations attributable to HealthSouth(40) 46.8 $ 0.48 79.3 $ 0.81 51.0 $ 0.53 39.4 $ 0.41 216.5 $ 2.24 Gov't, class action, and related settlements — (0.8) — (0.9) (1.7) Pro fees - acct, tax, and legal 1.6 2.0 4.0 1.7 9.3 Provision for income tax expense 32.8 36.5 22.1 19.3 110.7 Interest expense and amortization of debt discounts and fees 27.9 27.8 27.8 25.7 109.2 Depreciation and amortization 26.4 26.4 27.4 27.5 107.7 Loss on early extinguishment of debt — — — 13.2 13.2 Gain on consolidation of Fairlawn Rehabilitation Hospital — (27.2) — — (27.2) Other, including net noncash loss on disposal or impairment of assets 1.3 1.7 2.7 1.0 6.7 Stock-based compensation expense 7.3 7.0 5.0 4.6 23.9 Encompass transaction costs — — — 9.3 9.3 Adjusted EBITDA $ 144.1 $ 152.7 $ 140.0 $ 140.8 $ 577.6 Weighted average common shares outstanding: Basic 87.3 86.7 86.5 86.6 86.8 Diluted 100.9 100.6 100.5 100.8 100.7 Refer to pages 120-123 for end notes.
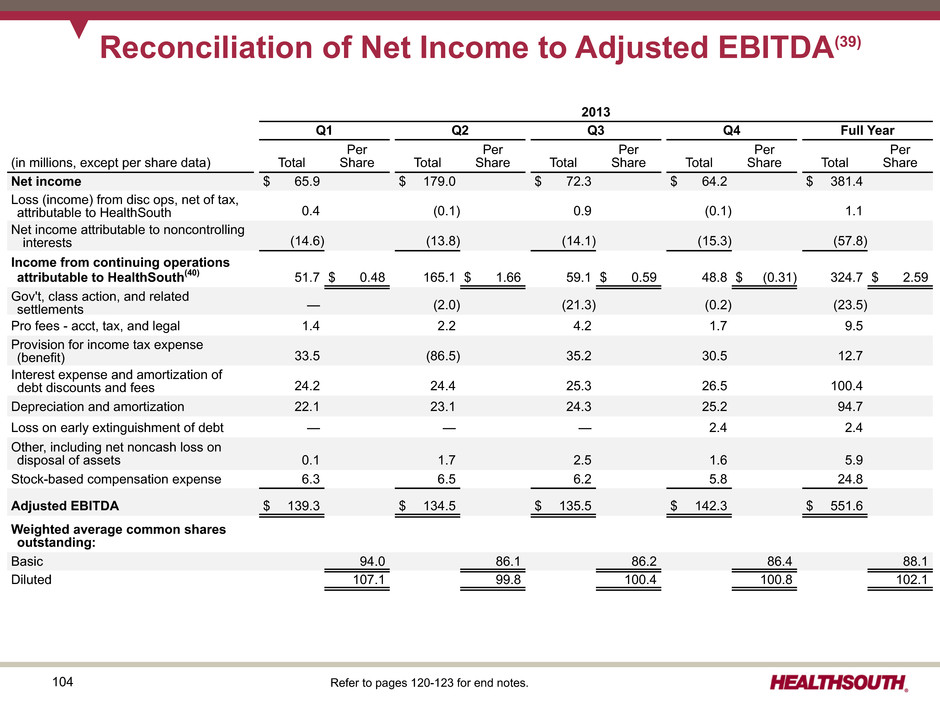
104 Reconciliation of Net Income to Adjusted EBITDA(39) 2013 Q1 Q2 Q3 Q4 Full Year (in millions, except per share data) Total Per Share Total Per Share Total Per Share Total Per Share Total Per Share Net income $ 65.9 $ 179.0 $ 72.3 $ 64.2 $ 381.4 Loss (income) from disc ops, net of tax, attributable to HealthSouth 0.4 (0.1) 0.9 (0.1) 1.1 Net income attributable to noncontrolling interests (14.6) (13.8) (14.1) (15.3) (57.8) Income from continuing operations attributable to HealthSouth(40) 51.7 $ 0.48 165.1 $ 1.66 59.1 $ 0.59 48.8 $ (0.31) 324.7 $ 2.59 Gov't, class action, and related settlements — (2.0) (21.3) (0.2) (23.5) Pro fees - acct, tax, and legal 1.4 2.2 4.2 1.7 9.5 Provision for income tax expense (benefit) 33.5 (86.5) 35.2 30.5 12.7 Interest expense and amortization of debt discounts and fees 24.2 24.4 25.3 26.5 100.4 Depreciation and amortization 22.1 23.1 24.3 25.2 94.7 Loss on early extinguishment of debt — — — 2.4 2.4 Other, including net noncash loss on disposal of assets 0.1 1.7 2.5 1.6 5.9 Stock-based compensation expense 6.3 6.5 6.2 5.8 24.8 Adjusted EBITDA $ 139.3 $ 134.5 $ 135.5 $ 142.3 $ 551.6 Weighted average common shares outstanding: Basic 94.0 86.1 86.2 86.4 88.1 Diluted 107.1 99.8 100.4 100.8 102.1 Refer to pages 120-123 for end notes.
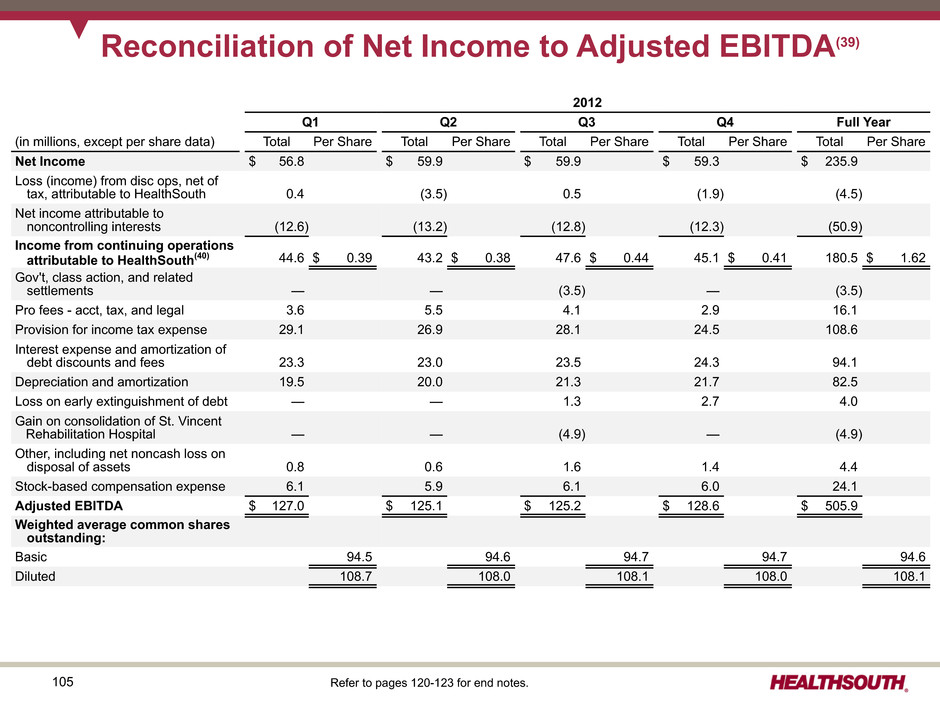
105 Reconciliation of Net Income to Adjusted EBITDA(39) 2012 Q1 Q2 Q3 Q4 Full Year (in millions, except per share data) Total Per Share Total Per Share Total Per Share Total Per Share Total Per Share Net Income $ 56.8 $ 59.9 $ 59.9 $ 59.3 $ 235.9 Loss (income) from disc ops, net of tax, attributable to HealthSouth 0.4 (3.5) 0.5 (1.9) (4.5) Net income attributable to noncontrolling interests (12.6) (13.2) (12.8) (12.3) (50.9) Income from continuing operations attributable to HealthSouth(40) 44.6 $ 0.39 43.2 $ 0.38 47.6 $ 0.44 45.1 $ 0.41 180.5 $ 1.62 Gov't, class action, and related settlements — — (3.5) — (3.5) Pro fees - acct, tax, and legal 3.6 5.5 4.1 2.9 16.1 Provision for income tax expense 29.1 26.9 28.1 24.5 108.6 Interest expense and amortization of debt discounts and fees 23.3 23.0 23.5 24.3 94.1 Depreciation and amortization 19.5 20.0 21.3 21.7 82.5 Loss on early extinguishment of debt — — 1.3 2.7 4.0 Gain on consolidation of St. Vincent Rehabilitation Hospital — — (4.9) — (4.9) Other, including net noncash loss on disposal of assets 0.8 0.6 1.6 1.4 4.4 Stock-based compensation expense 6.1 5.9 6.1 6.0 24.1 Adjusted EBITDA $ 127.0 $ 125.1 $ 125.2 $ 128.6 $ 505.9 Weighted average common shares outstanding: Basic 94.5 94.6 94.7 94.7 94.6 Diluted 108.7 108.0 108.1 108.0 108.1 Refer to pages 120-123 for end notes.
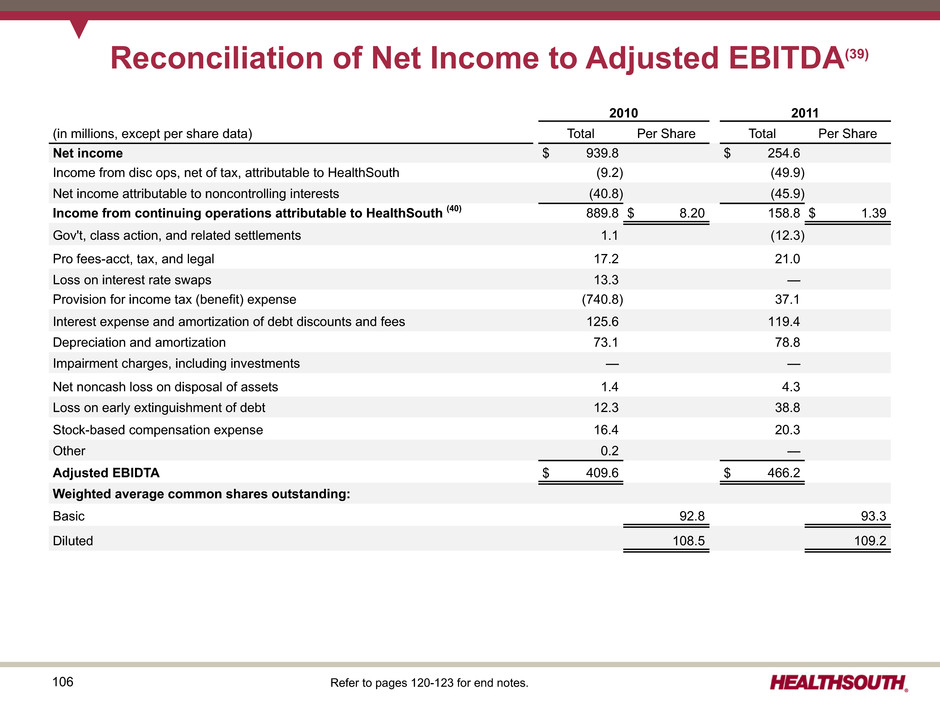
106 Reconciliation of Net Income to Adjusted EBITDA(39) 2010 2011 (in millions, except per share data) Total Per Share Total Per Share Net income $ 939.8 $ 254.6 Income from disc ops, net of tax, attributable to HealthSouth (9.2) (49.9) Net income attributable to noncontrolling interests (40.8) (45.9) Income from continuing operations attributable to HealthSouth (40) 889.8 $ 8.20 158.8 $ 1.39 Gov't, class action, and related settlements 1.1 (12.3) Pro fees-acct, tax, and legal 17.2 21.0 Loss on interest rate swaps 13.3 — Provision for income tax (benefit) expense (740.8) 37.1 Interest expense and amortization of debt discounts and fees 125.6 119.4 Depreciation and amortization 73.1 78.8 Impairment charges, including investments — — Net noncash loss on disposal of assets 1.4 4.3 Loss on early extinguishment of debt 12.3 38.8 Stock-based compensation expense 16.4 20.3 Other 0.2 — Adjusted EBIDTA $ 409.6 $ 466.2 Weighted average common shares outstanding: Basic 92.8 93.3 Diluted 108.5 109.2 Refer to pages 120-123 for end notes.
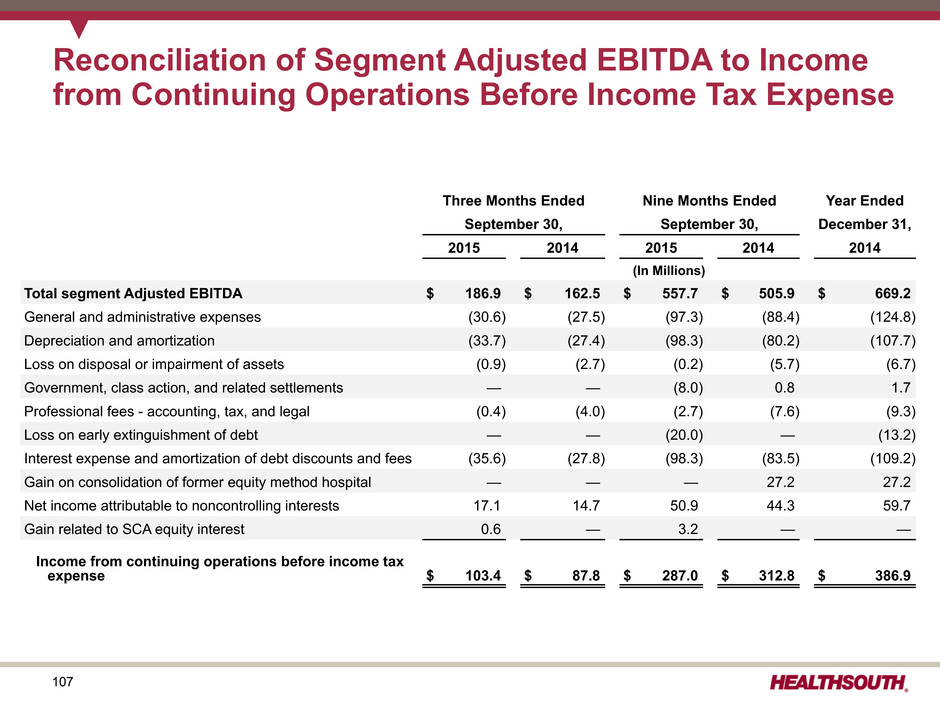
107 Three Months Ended Nine Months Ended Year Ended September 30, September 30, December 31, 2015 2014 2015 2014 2014 (In Millions) Total segment Adjusted EBITDA $ 186.9 $ 162.5 $ 557.7 $ 505.9 $ 669.2 General and administrative expenses (30.6) (27.5) (97.3) (88.4) (124.8) Depreciation and amortization (33.7) (27.4) (98.3) (80.2) (107.7) Loss on disposal or impairment of assets (0.9) (2.7) (0.2) (5.7) (6.7) Government, class action, and related settlements — — (8.0) 0.8 1.7 Professional fees - accounting, tax, and legal (0.4) (4.0) (2.7) (7.6) (9.3) Loss on early extinguishment of debt — — (20.0) — (13.2) Interest expense and amortization of debt discounts and fees (35.6) (27.8) (98.3) (83.5) (109.2) Gain on consolidation of former equity method hospital — — — 27.2 27.2 Net income attributable to noncontrolling interests 17.1 14.7 50.9 44.3 59.7 Gain related to SCA equity interest 0.6 — 3.2 — — Income from continuing operations before income tax expense $ 103.4 $ 87.8 $ 287.0 $ 312.8 $ 386.9 Reconciliation of Segment Adjusted EBITDA to Income from Continuing Operations Before Income Tax Expense
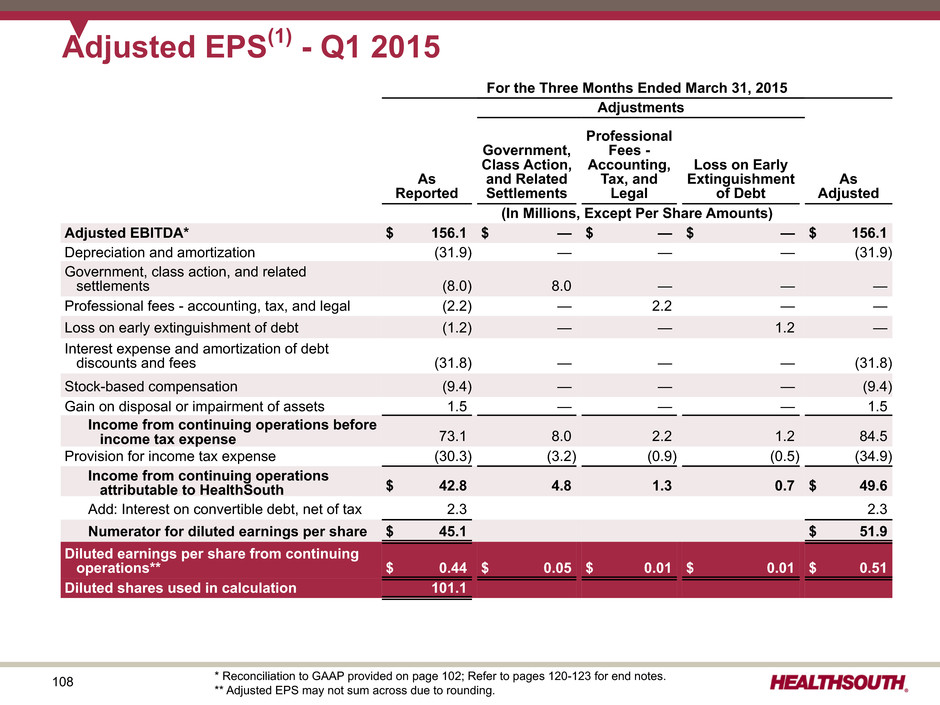
108 For the Three Months Ended March 31, 2015 Adjustments As Reported Government, Class Action, and Related Settlements Professional Fees - Accounting, Tax, and Legal Loss on Early Extinguishment of Debt As Adjusted (In Millions, Except Per Share Amounts) Adjusted EBITDA* $ 156.1 $ — $ — $ — $ 156.1 Depreciation and amortization (31.9) — — — (31.9) Government, class action, and related settlements (8.0) 8.0 — — — Professional fees - accounting, tax, and legal (2.2) — 2.2 — — Loss on early extinguishment of debt (1.2) — — 1.2 — Interest expense and amortization of debt discounts and fees (31.8) — — — (31.8) Stock-based compensation (9.4) — — — (9.4) Gain on disposal or impairment of assets 1.5 — — — 1.5 Income from continuing operations before income tax expense 73.1 8.0 2.2 1.2 84.5 Provision for income tax expense (30.3) (3.2) (0.9) (0.5) (34.9) Income from continuing operations attributable to HealthSouth $ 42.8 4.8 1.3 0.7 $ 49.6 Add: Interest on convertible debt, net of tax 2.3 2.3 Numerator for diluted earnings per share $ 45.1 $ 51.9 Diluted earnings per share from continuing operations** $ 0.44 $ 0.05 $ 0.01 $ 0.01 $ 0.51 Diluted shares used in calculation 101.1 Adjusted EPS(1) - Q1 2015 * Reconciliation to GAAP provided on page 102; Refer to pages 120-123 for end notes. ** Adjusted EPS may not sum across due to rounding.
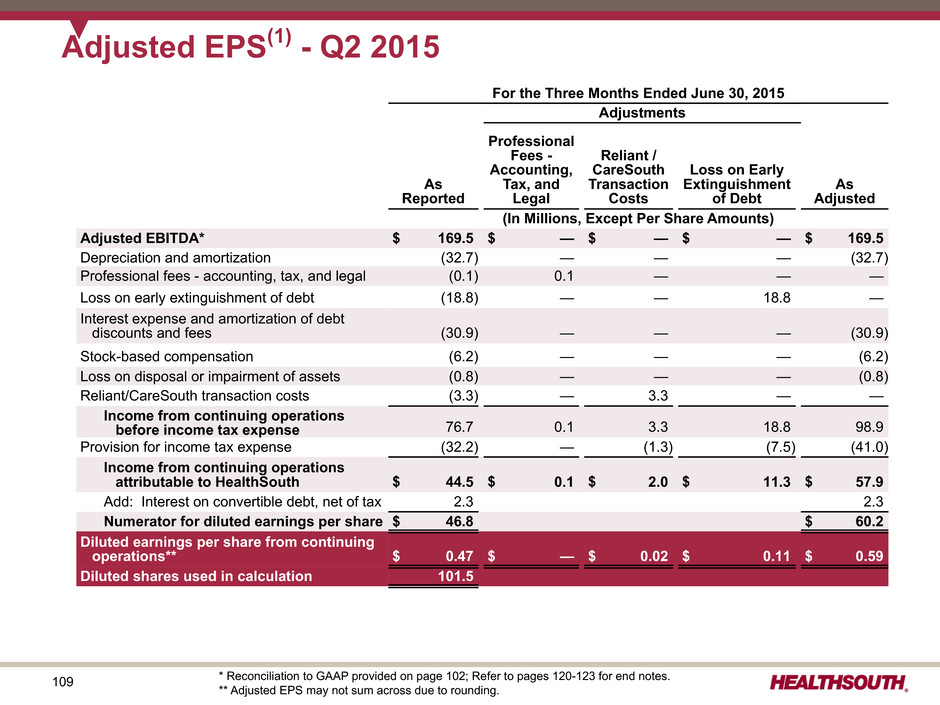
109 For the Three Months Ended June 30, 2015 Adjustments As Reported Professional Fees - Accounting, Tax, and Legal Reliant / CareSouth Transaction Costs Loss on Early Extinguishment of Debt As Adjusted (In Millions, Except Per Share Amounts) Adjusted EBITDA* $ 169.5 $ — $ — $ — $ 169.5 Depreciation and amortization (32.7) — — — (32.7) Professional fees - accounting, tax, and legal (0.1) 0.1 — — — Loss on early extinguishment of debt (18.8) — — 18.8 — Interest expense and amortization of debt discounts and fees (30.9) — — — (30.9) Stock-based compensation (6.2) — — — (6.2) Loss on disposal or impairment of assets (0.8) — — — (0.8) Reliant/CareSouth transaction costs (3.3) — 3.3 — — Income from continuing operations before income tax expense 76.7 0.1 3.3 18.8 98.9 Provision for income tax expense (32.2) — (1.3) (7.5) (41.0) Income from continuing operations attributable to HealthSouth $ 44.5 $ 0.1 $ 2.0 $ 11.3 $ 57.9 Add: Interest on convertible debt, net of tax 2.3 2.3 Numerator for diluted earnings per share $ 46.8 $ 60.2 Diluted earnings per share from continuing operations** $ 0.47 $ — $ 0.02 $ 0.11 $ 0.59 Diluted shares used in calculation 101.5 Adjusted EPS(1) - Q2 2015 * Reconciliation to GAAP provided on page 102; Refer to pages 120-123 for end notes. ** Adjusted EPS may not sum across due to rounding.
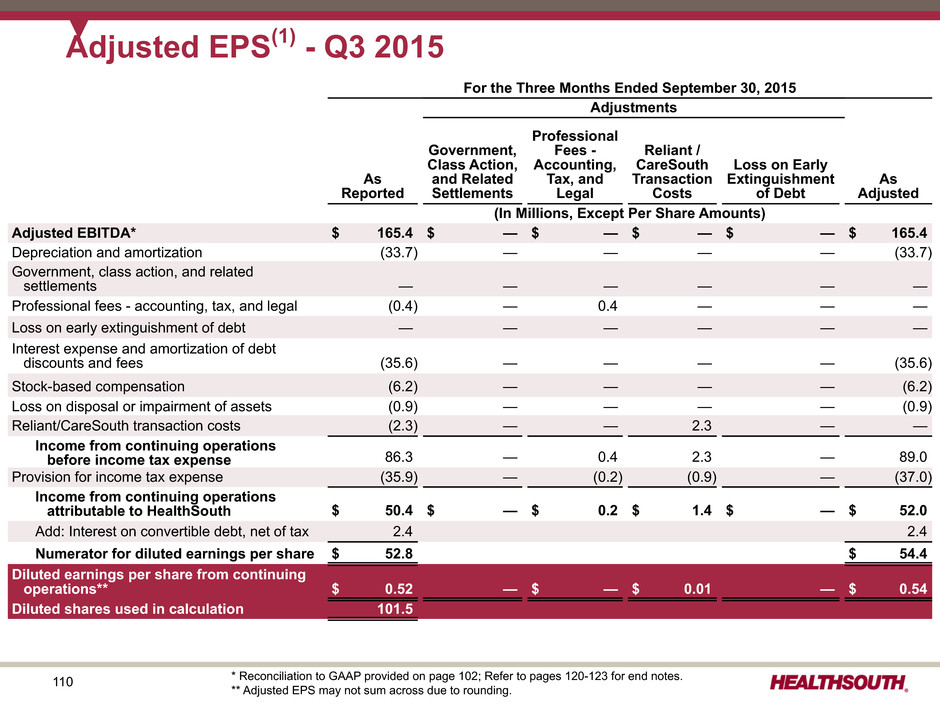
110 For the Three Months Ended September 30, 2015 Adjustments As Reported Government, Class Action, and Related Settlements Professional Fees - Accounting, Tax, and Legal Reliant / CareSouth Transaction Costs Loss on Early Extinguishment of Debt As Adjusted (In Millions, Except Per Share Amounts) Adjusted EBITDA* $ 165.4 $ — $ — $ — $ — $ 165.4 Depreciation and amortization (33.7) — — — — (33.7) Government, class action, and related settlements — — — — — — Professional fees - accounting, tax, and legal (0.4) — 0.4 — — — Loss on early extinguishment of debt — — — — — — Interest expense and amortization of debt discounts and fees (35.6) — — — — (35.6) Stock-based compensation (6.2) — — — — (6.2) Loss on disposal or impairment of assets (0.9) — — — — (0.9) Reliant/CareSouth transaction costs (2.3) — — 2.3 — — Income from continuing operations before income tax expense 86.3 — 0.4 2.3 — 89.0 Provision for income tax expense (35.9) — (0.2) (0.9) — (37.0) Income from continuing operations attributable to HealthSouth $ 50.4 $ — $ 0.2 $ 1.4 $ — $ 52.0 Add: Interest on convertible debt, net of tax 2.4 2.4 Numerator for diluted earnings per share $ 52.8 $ 54.4 Diluted earnings per share from continuing operations** $ 0.52 — $ — $ 0.01 — $ 0.54 Diluted shares used in calculation 101.5 Adjusted EPS(1) - Q3 2015 * Reconciliation to GAAP provided on page 102; Refer to pages 120-123 for end notes. ** Adjusted EPS may not sum across due to rounding.
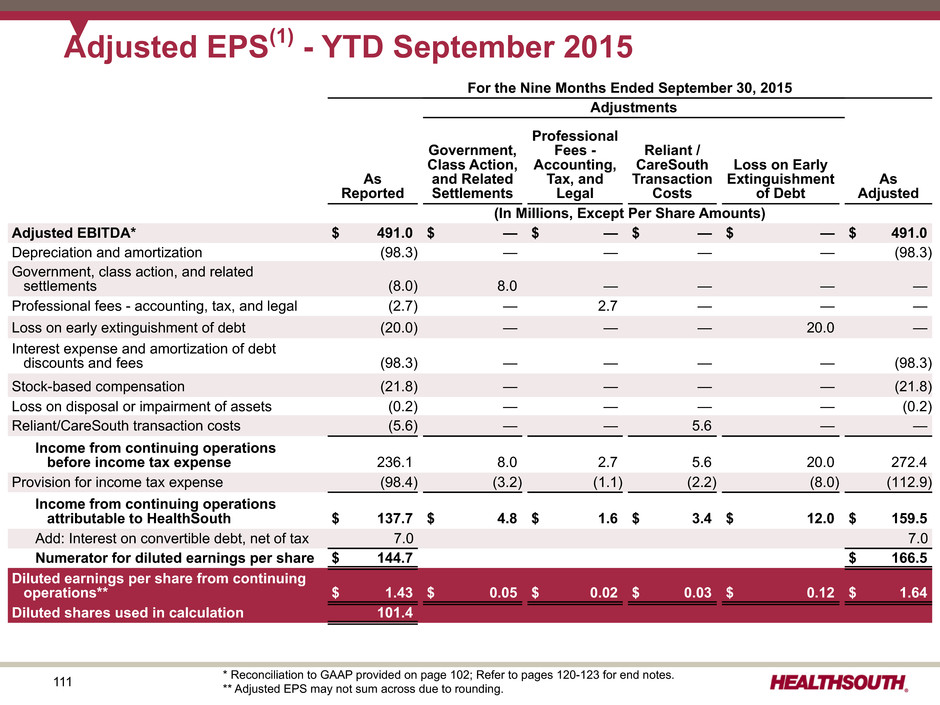
111 For the Nine Months Ended September 30, 2015 Adjustments As Reported Government, Class Action, and Related Settlements Professional Fees - Accounting, Tax, and Legal Reliant / CareSouth Transaction Costs Loss on Early Extinguishment of Debt As Adjusted (In Millions, Except Per Share Amounts) Adjusted EBITDA* $ 491.0 $ — $ — $ — $ — $ 491.0 Depreciation and amortization (98.3) — — — — (98.3) Government, class action, and related settlements (8.0) 8.0 — — — — Professional fees - accounting, tax, and legal (2.7) — 2.7 — — — Loss on early extinguishment of debt (20.0) — — — 20.0 — Interest expense and amortization of debt discounts and fees (98.3) — — — — (98.3) Stock-based compensation (21.8) — — — — (21.8) Loss on disposal or impairment of assets (0.2) — — — — (0.2) Reliant/CareSouth transaction costs (5.6) — — 5.6 — — Income from continuing operations before income tax expense 236.1 8.0 2.7 5.6 20.0 272.4 Provision for income tax expense (98.4) (3.2) (1.1) (2.2) (8.0) (112.9) Income from continuing operations attributable to HealthSouth $ 137.7 $ 4.8 $ 1.6 $ 3.4 $ 12.0 $ 159.5 Add: Interest on convertible debt, net of tax 7.0 7.0 Numerator for diluted earnings per share $ 144.7 $ 166.5 Diluted earnings per share from continuing operations** $ 1.43 $ 0.05 $ 0.02 $ 0.03 $ 0.12 $ 1.64 Diluted shares used in calculation 101.4 Adjusted EPS(1) - YTD September 2015 * Reconciliation to GAAP provided on page 102; Refer to pages 120-123 for end notes. ** Adjusted EPS may not sum across due to rounding.
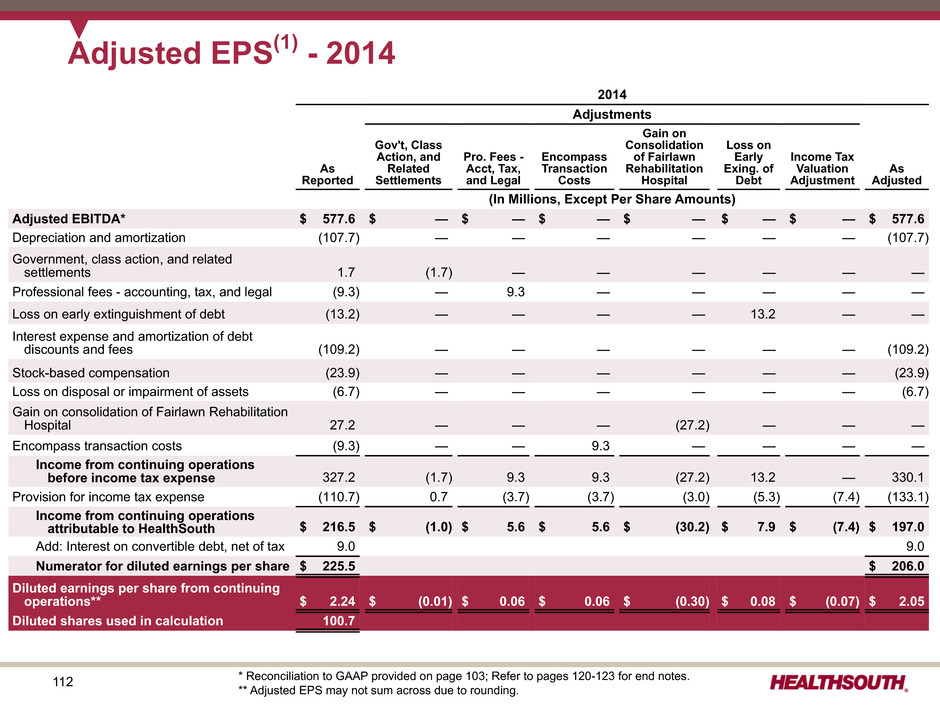
112 2014 Adjustments As Reported Gov't, Class Action, and Related Settlements Pro. Fees - Acct, Tax, and Legal Encompass Transaction Costs Gain on Consolidation of Fairlawn Rehabilitation Hospital Loss on Early Exing. of Debt Income Tax Valuation Adjustment As Adjusted (In Millions, Except Per Share Amounts) Adjusted EBITDA* $ 577.6 $ — $ — $ — $ — $ — $ — $ 577.6 Depreciation and amortization (107.7) — — — — — — (107.7) Government, class action, and related settlements 1.7 (1.7) — — — — — — Professional fees - accounting, tax, and legal (9.3) — 9.3 — — — — — Loss on early extinguishment of debt (13.2) — — — — 13.2 — — Interest expense and amortization of debt discounts and fees (109.2) — — — — — — (109.2) Stock-based compensation (23.9) — — — — — — (23.9) Loss on disposal or impairment of assets (6.7) — — — — — — (6.7) Gain on consolidation of Fairlawn Rehabilitation Hospital 27.2 — — — (27.2) — — — Encompass transaction costs (9.3) — — 9.3 — — — — Income from continuing operations before income tax expense 327.2 (1.7) 9.3 9.3 (27.2) 13.2 — 330.1 Provision for income tax expense (110.7) 0.7 (3.7) (3.7) (3.0) (5.3) (7.4) (133.1) Income from continuing operations attributable to HealthSouth $ 216.5 $ (1.0) $ 5.6 $ 5.6 $ (30.2) $ 7.9 $ (7.4) $ 197.0 Add: Interest on convertible debt, net of tax 9.0 9.0 Numerator for diluted earnings per share $ 225.5 $ 206.0 Diluted earnings per share from continuing operations** $ 2.24 $ (0.01) $ 0.06 $ 0.06 $ (0.30) $ 0.08 $ (0.07) $ 2.05 Diluted shares used in calculation 100.7 Adjusted EPS(1) - 2014 * Reconciliation to GAAP provided on page 103; Refer to pages 120-123 for end notes. ** Adjusted EPS may not sum across due to rounding.
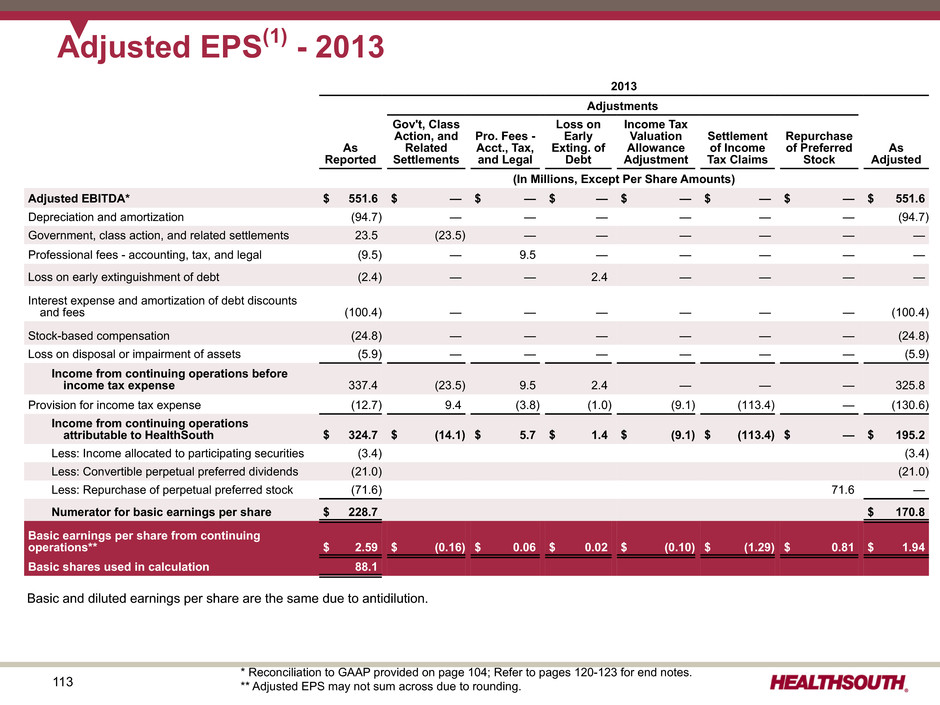
113 2013 Adjustments As Reported Gov't, Class Action, and Related Settlements Pro. Fees - Acct., Tax, and Legal Loss on Early Exting. of Debt Income Tax Valuation Allowance Adjustment Settlement of Income Tax Claims Repurchase of Preferred Stock As Adjusted (In Millions, Except Per Share Amounts) Adjusted EBITDA* $ 551.6 $ — $ — $ — $ — $ — $ — $ 551.6 Depreciation and amortization (94.7) — — — — — — (94.7) Government, class action, and related settlements 23.5 (23.5) — — — — — — Professional fees - accounting, tax, and legal (9.5) — 9.5 — — — — — Loss on early extinguishment of debt (2.4) — — 2.4 — — — — Interest expense and amortization of debt discounts and fees (100.4) — — — — — — (100.4) Stock-based compensation (24.8) — — — — — — (24.8) Loss on disposal or impairment of assets (5.9) — — — — — — (5.9) Income from continuing operations before income tax expense 337.4 (23.5) 9.5 2.4 — — — 325.8 Provision for income tax expense (12.7) 9.4 (3.8) (1.0) (9.1) (113.4) — (130.6) Income from continuing operations attributable to HealthSouth $ 324.7 $ (14.1) $ 5.7 $ 1.4 $ (9.1) $ (113.4) $ — $ 195.2 Less: Income allocated to participating securities (3.4) (3.4) Less: Convertible perpetual preferred dividends (21.0) (21.0) Less: Repurchase of perpetual preferred stock (71.6) 71.6 — Numerator for basic earnings per share $ 228.7 $ 170.8 Basic earnings per share from continuing operations** $ 2.59 $ (0.16) $ 0.06 $ 0.02 $ (0.10) $ (1.29) $ 0.81 $ 1.94 Basic shares used in calculation 88.1 Adjusted EPS(1) - 2013 Basic and diluted earnings per share are the same due to antidilution. * Reconciliation to GAAP provided on page 104; Refer to pages 120-123 for end notes. ** Adjusted EPS may not sum across due to rounding.
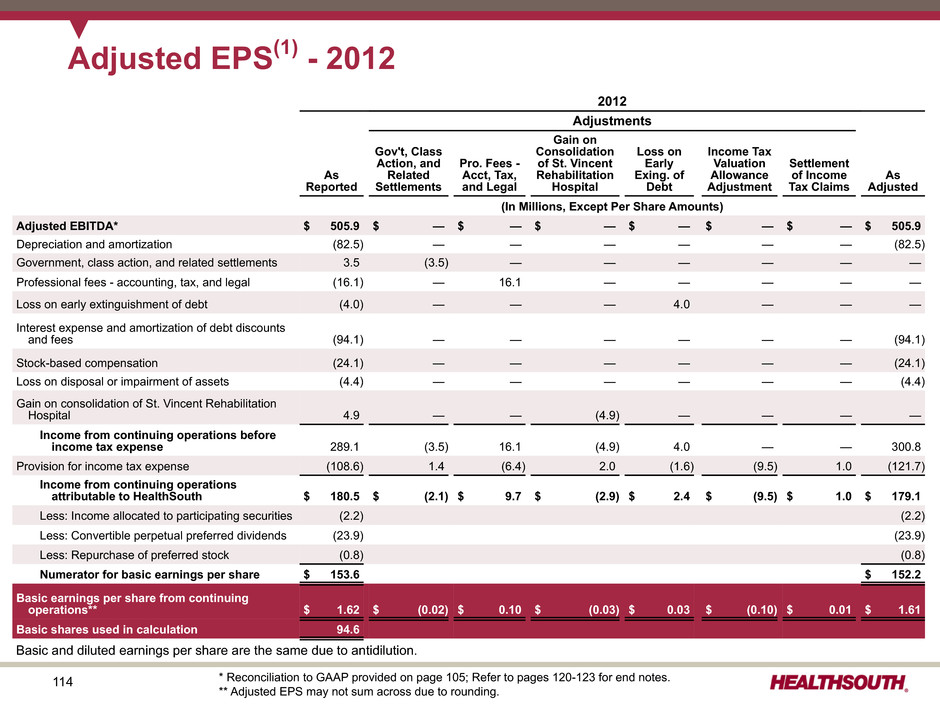
114 2012 Adjustments As Reported Gov't, Class Action, and Related Settlements Pro. Fees - Acct, Tax, and Legal Gain on Consolidation of St. Vincent Rehabilitation Hospital Loss on Early Exing. of Debt Income Tax Valuation Allowance Adjustment Settlement of Income Tax Claims As Adjusted (In Millions, Except Per Share Amounts) Adjusted EBITDA* $ 505.9 $ — $ — $ — $ — $ — $ — $ 505.9 Depreciation and amortization (82.5) — — — — — — (82.5) Government, class action, and related settlements 3.5 (3.5) — — — — — — Professional fees - accounting, tax, and legal (16.1) — 16.1 — — — — — Loss on early extinguishment of debt (4.0) — — — 4.0 — — — Interest expense and amortization of debt discounts and fees (94.1) — — — — — — (94.1) Stock-based compensation (24.1) — — — — — — (24.1) Loss on disposal or impairment of assets (4.4) — — — — — — (4.4) Gain on consolidation of St. Vincent Rehabilitation Hospital 4.9 — — (4.9) — — — — Income from continuing operations before income tax expense 289.1 (3.5) 16.1 (4.9) 4.0 — — 300.8 Provision for income tax expense (108.6) 1.4 (6.4) 2.0 (1.6) (9.5) 1.0 (121.7) Income from continuing operations attributable to HealthSouth $ 180.5 $ (2.1) $ 9.7 $ (2.9) $ 2.4 $ (9.5) $ 1.0 $ 179.1 Less: Income allocated to participating securities (2.2) (2.2) Less: Convertible perpetual preferred dividends (23.9) (23.9) Less: Repurchase of preferred stock (0.8) (0.8) Numerator for basic earnings per share $ 153.6 $ 152.2 Basic earnings per share from continuing operations** $ 1.62 $ (0.02) $ 0.10 $ (0.03) $ 0.03 $ (0.10) $ 0.01 $ 1.61 Basic shares used in calculation 94.6 Adjusted EPS(1) - 2012 Basic and diluted earnings per share are the same due to antidilution. * Reconciliation to GAAP provided on page 105; Refer to pages 120-123 for end notes. ** Adjusted EPS may not sum across due to rounding.
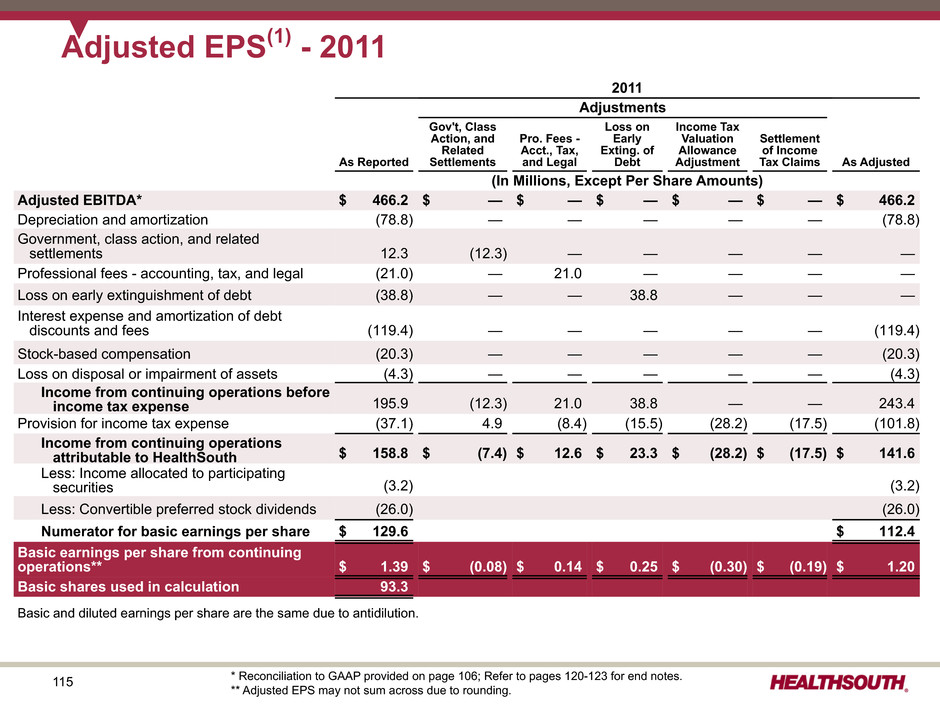
115 2011 Adjustments As Reported Gov't, Class Action, and Related Settlements Pro. Fees - Acct., Tax, and Legal Loss on Early Exting. of Debt Income Tax Valuation Allowance Adjustment Settlement of Income Tax Claims As Adjusted (In Millions, Except Per Share Amounts) Adjusted EBITDA* $ 466.2 $ — $ — $ — $ — $ — $ 466.2 Depreciation and amortization (78.8) — — — — — (78.8) Government, class action, and related settlements 12.3 (12.3) — — — — — Professional fees - accounting, tax, and legal (21.0) — 21.0 — — — — Loss on early extinguishment of debt (38.8) — — 38.8 — — — Interest expense and amortization of debt discounts and fees (119.4) — — — — — (119.4) Stock-based compensation (20.3) — — — — — (20.3) Loss on disposal or impairment of assets (4.3) — — — — — (4.3) Income from continuing operations before income tax expense 195.9 (12.3) 21.0 38.8 — — 243.4 Provision for income tax expense (37.1) 4.9 (8.4) (15.5) (28.2) (17.5) (101.8) Income from continuing operations attributable to HealthSouth $ 158.8 $ (7.4) $ 12.6 $ 23.3 $ (28.2) $ (17.5) $ 141.6 Less: Income allocated to participating securities (3.2) (3.2) Less: Convertible preferred stock dividends (26.0) (26.0) Numerator for basic earnings per share $ 129.6 $ 112.4 Basic earnings per share from continuing operations** $ 1.39 $ (0.08) $ 0.14 $ 0.25 $ (0.30) $ (0.19) $ 1.20 Basic shares used in calculation 93.3 Adjusted EPS(1) - 2011 Basic and diluted earnings per share are the same due to antidilution. * Reconciliation to GAAP provided on page 106; Refer to pages 120-123 for end notes. ** Adjusted EPS may not sum across due to rounding.
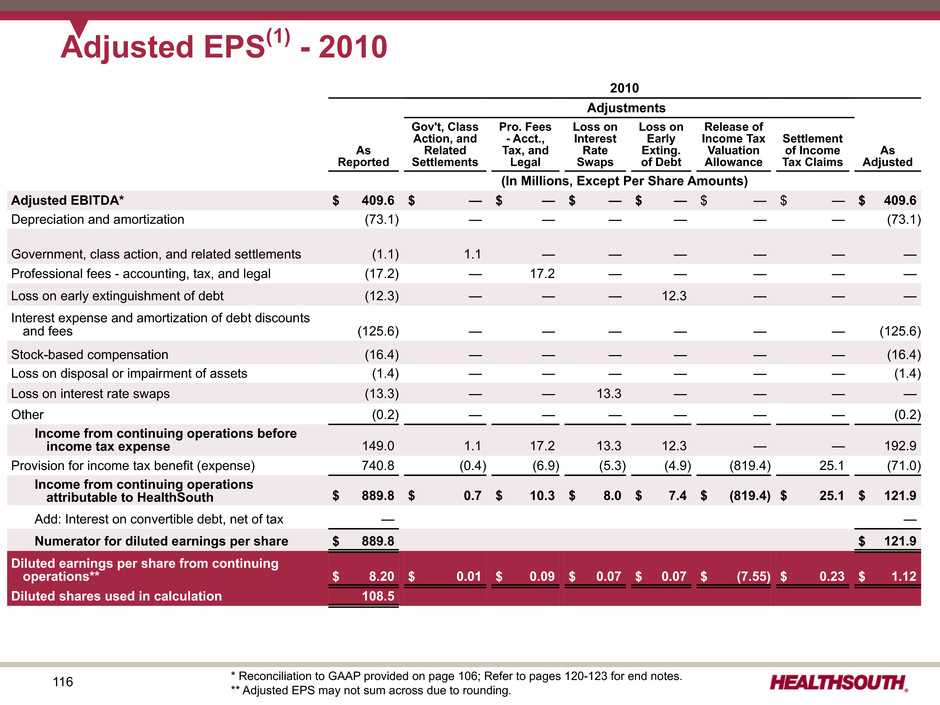
116 2010 Adjustments As Reported Gov't, Class Action, and Related Settlements Pro. Fees - Acct., Tax, and Legal Loss on Interest Rate Swaps Loss on Early Exting. of Debt Release of Income Tax Valuation Allowance Settlement of Income Tax Claims As Adjusted (In Millions, Except Per Share Amounts) Adjusted EBITDA* $ 409.6 $ — $ — $ — $ — $ — $ — $ 409.6 Depreciation and amortization (73.1) — — — — — — (73.1) Government, class action, and related settlements (1.1) 1.1 — — — — — — Professional fees - accounting, tax, and legal (17.2) — 17.2 — — — — — Loss on early extinguishment of debt (12.3) — — — 12.3 — — — Interest expense and amortization of debt discounts and fees (125.6) — — — — — — (125.6) Stock-based compensation (16.4) — — — — — — (16.4) Loss on disposal or impairment of assets (1.4) — — — — — — (1.4) Loss on interest rate swaps (13.3) — — 13.3 — — — — Other (0.2) — — — — — — (0.2) Income from continuing operations before income tax expense 149.0 1.1 17.2 13.3 12.3 — — 192.9 Provision for income tax benefit (expense) 740.8 (0.4) (6.9) (5.3) (4.9) (819.4) 25.1 (71.0) Income from continuing operations attributable to HealthSouth $ 889.8 $ 0.7 $ 10.3 $ 8.0 $ 7.4 $ (819.4) $ 25.1 $ 121.9 Add: Interest on convertible debt, net of tax — — Numerator for diluted earnings per share $ 889.8 $ 121.9 Diluted earnings per share from continuing operations** $ 8.20 $ 0.01 $ 0.09 $ 0.07 $ 0.07 $ (7.55) $ 0.23 $ 1.12 Diluted shares used in calculation 108.5 Adjusted EPS(1) - 2010 * Reconciliation to GAAP provided on page 106; Refer to pages 120-123 for end notes. ** Adjusted EPS may not sum across due to rounding.
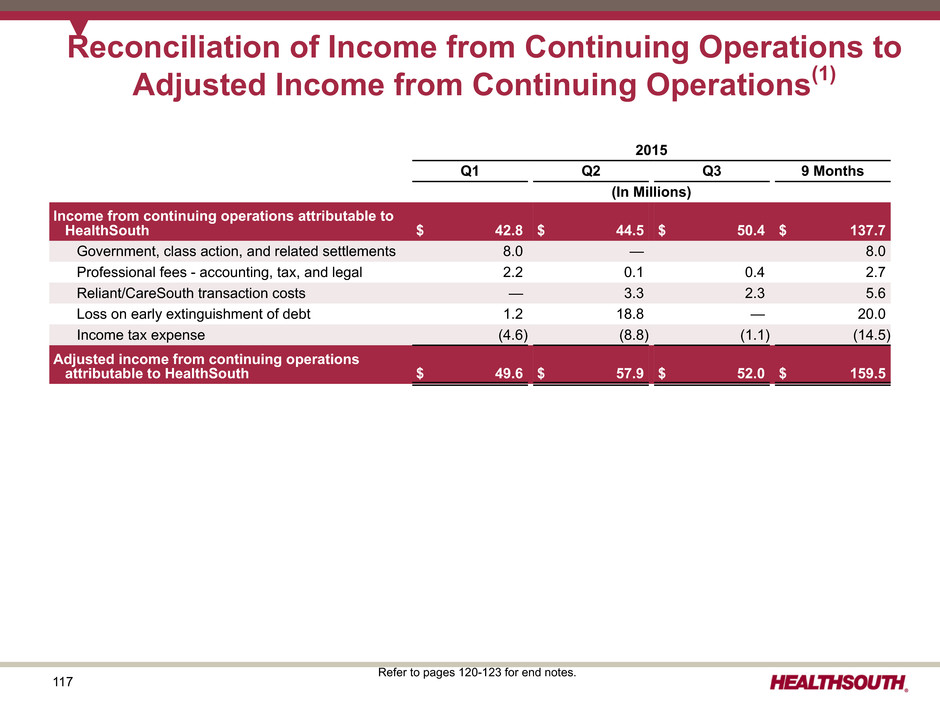
117 2015 Q1 Q2 Q3 9 Months (In Millions) Income from continuing operations attributable to HealthSouth $ 42.8 $ 44.5 $ 50.4 $ 137.7 Government, class action, and related settlements 8.0 — 8.0 Professional fees - accounting, tax, and legal 2.2 0.1 0.4 2.7 Reliant/CareSouth transaction costs — 3.3 2.3 5.6 Loss on early extinguishment of debt 1.2 18.8 — 20.0 Income tax expense (4.6) (8.8) (1.1) (14.5) Adjusted income from continuing operations attributable to HealthSouth $ 49.6 $ 57.9 $ 52.0 $ 159.5 Reconciliation of Income from Continuing Operations to Adjusted Income from Continuing Operations(1) Refer to pages 120-123 for end notes.
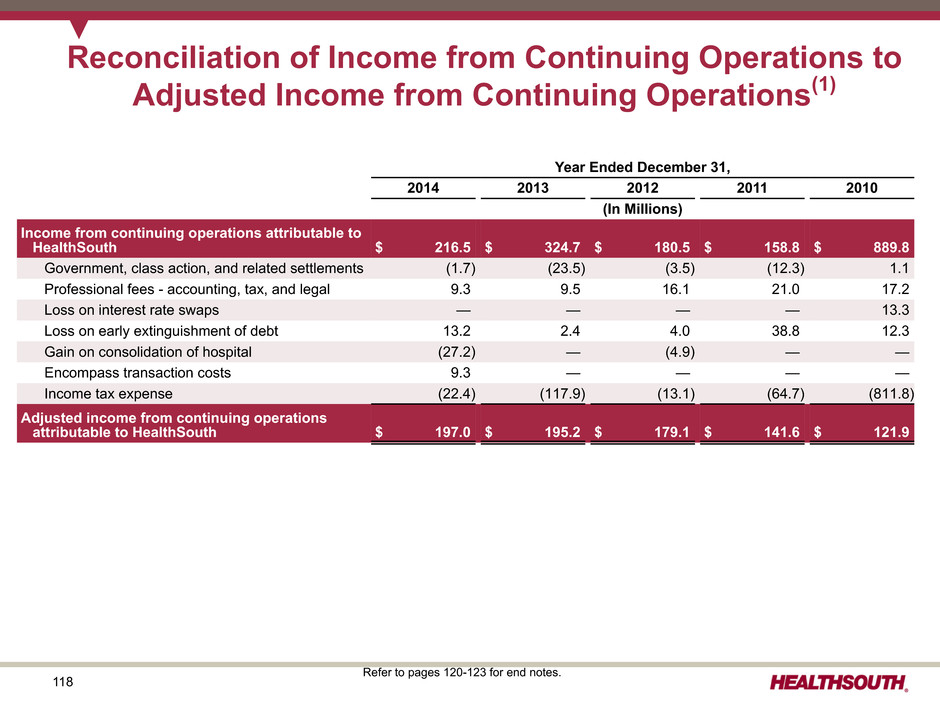
118 Year Ended December 31, 2014 2013 2012 2011 2010 (In Millions) Income from continuing operations attributable to HealthSouth $ 216.5 $ 324.7 $ 180.5 $ 158.8 $ 889.8 Government, class action, and related settlements (1.7) (23.5) (3.5) (12.3) 1.1 Professional fees - accounting, tax, and legal 9.3 9.5 16.1 21.0 17.2 Loss on interest rate swaps — — — — 13.3 Loss on early extinguishment of debt 13.2 2.4 4.0 38.8 12.3 Gain on consolidation of hospital (27.2) — (4.9) — — Encompass transaction costs 9.3 — — — — Income tax expense (22.4) (117.9) (13.1) (64.7) (811.8) Adjusted income from continuing operations attributable to HealthSouth $ 197.0 $ 195.2 $ 179.1 $ 141.6 $ 121.9 Reconciliation of Income from Continuing Operations to Adjusted Income from Continuing Operations(1) Refer to pages 120-123 for end notes.
119 End Notes
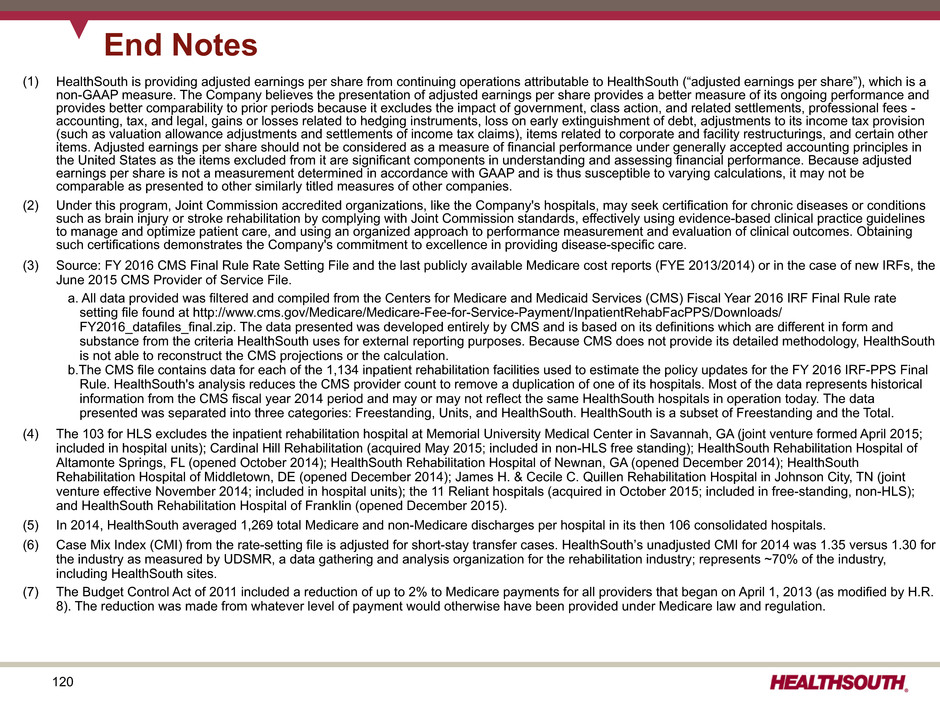
120 End Notes (1) HealthSouth is providing adjusted earnings per share from continuing operations attributable to HealthSouth (“adjusted earnings per share”), which is a non-GAAP measure. The Company believes the presentation of adjusted earnings per share provides a better measure of its ongoing performance and provides better comparability to prior periods because it excludes the impact of government, class action, and related settlements, professional fees - accounting, tax, and legal, gains or losses related to hedging instruments, loss on early extinguishment of debt, adjustments to its income tax provision (such as valuation allowance adjustments and settlements of income tax claims), items related to corporate and facility restructurings, and certain other items. Adjusted earnings per share should not be considered as a measure of financial performance under generally accepted accounting principles in the United States as the items excluded from it are significant components in understanding and assessing financial performance. Because adjusted earnings per share is not a measurement determined in accordance with GAAP and is thus susceptible to varying calculations, it may not be comparable as presented to other similarly titled measures of other companies. (2) Under this program, Joint Commission accredited organizations, like the Company's hospitals, may seek certification for chronic diseases or conditions such as brain injury or stroke rehabilitation by complying with Joint Commission standards, effectively using evidence-based clinical practice guidelines to manage and optimize patient care, and using an organized approach to performance measurement and evaluation of clinical outcomes. Obtaining such certifications demonstrates the Company's commitment to excellence in providing disease-specific care. (3) Source: FY 2016 CMS Final Rule Rate Setting File and the last publicly available Medicare cost reports (FYE 2013/2014) or in the case of new IRFs, the June 2015 CMS Provider of Service File. a. All data provided was filtered and compiled from the Centers for Medicare and Medicaid Services (CMS) Fiscal Year 2016 IRF Final Rule rate setting file found at http://www.cms.gov/Medicare/Medicare-Fee-for-Service-Payment/InpatientRehabFacPPS/Downloads/ FY2016_datafiles_final.zip. The data presented was developed entirely by CMS and is based on its definitions which are different in form and substance from the criteria HealthSouth uses for external reporting purposes. Because CMS does not provide its detailed methodology, HealthSouth is not able to reconstruct the CMS projections or the calculation. b.The CMS file contains data for each of the 1,134 inpatient rehabilitation facilities used to estimate the policy updates for the FY 2016 IRF-PPS Final Rule. HealthSouth's analysis reduces the CMS provider count to remove a duplication of one of its hospitals. Most of the data represents historical information from the CMS fiscal year 2014 period and may or may not reflect the same HealthSouth hospitals in operation today. The data presented was separated into three categories: Freestanding, Units, and HealthSouth. HealthSouth is a subset of Freestanding and the Total. (4) The 103 for HLS excludes the inpatient rehabilitation hospital at Memorial University Medical Center in Savannah, GA (joint venture formed April 2015; included in hospital units); Cardinal Hill Rehabilitation (acquired May 2015; included in non-HLS free standing); HealthSouth Rehabilitation Hospital of Altamonte Springs, FL (opened October 2014); HealthSouth Rehabilitation Hospital of Newnan, GA (opened December 2014); HealthSouth Rehabilitation Hospital of Middletown, DE (opened December 2014); James H. & Cecile C. Quillen Rehabilitation Hospital in Johnson City, TN (joint venture effective November 2014; included in hospital units); the 11 Reliant hospitals (acquired in October 2015; included in free-standing, non-HLS); and HealthSouth Rehabilitation Hospital of Franklin (opened December 2015). (5) In 2014, HealthSouth averaged 1,269 total Medicare and non-Medicare discharges per hospital in its then 106 consolidated hospitals. (6) Case Mix Index (CMI) from the rate-setting file is adjusted for short-stay transfer cases. HealthSouth’s unadjusted CMI for 2014 was 1.35 versus 1.30 for the industry as measured by UDSMR, a data gathering and analysis organization for the rehabilitation industry; represents ~70% of the industry, including HealthSouth sites. (7) The Budget Control Act of 2011 included a reduction of up to 2% to Medicare payments for all providers that began on April 1, 2013 (as modified by H.R. 8). The reduction was made from whatever level of payment would otherwise have been provided under Medicare law and regulation.
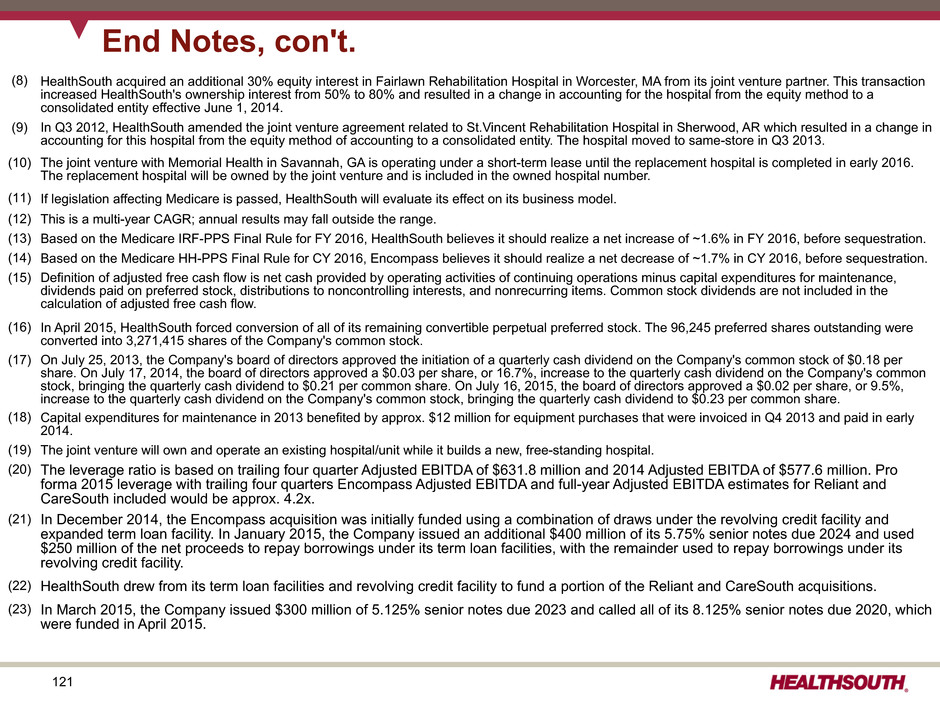
121 End Notes, con't. (8) HealthSouth acquired an additional 30% equity interest in Fairlawn Rehabilitation Hospital in Worcester, MA from its joint venture partner. This transaction increased HealthSouth's ownership interest from 50% to 80% and resulted in a change in accounting for the hospital from the equity method to a consolidated entity effective June 1, 2014. (9) In Q3 2012, HealthSouth amended the joint venture agreement related to St.Vincent Rehabilitation Hospital in Sherwood, AR which resulted in a change in accounting for this hospital from the equity method of accounting to a consolidated entity. The hospital moved to same-store in Q3 2013. (10) The joint venture with Memorial Health in Savannah, GA is operating under a short-term lease until the replacement hospital is completed in early 2016. The replacement hospital will be owned by the joint venture and is included in the owned hospital number. (11) If legislation affecting Medicare is passed, HealthSouth will evaluate its effect on its business model. (12) This is a multi-year CAGR; annual results may fall outside the range. (13) Based on the Medicare IRF-PPS Final Rule for FY 2016, HealthSouth believes it should realize a net increase of ~1.6% in FY 2016, before sequestration. (14) Based on the Medicare HH-PPS Final Rule for CY 2016, Encompass believes it should realize a net decrease of ~1.7% in CY 2016, before sequestration. (15) Definition of adjusted free cash flow is net cash provided by operating activities of continuing operations minus capital expenditures for maintenance, dividends paid on preferred stock, distributions to noncontrolling interests, and nonrecurring items. Common stock dividends are not included in the calculation of adjusted free cash flow. (16) In April 2015, HealthSouth forced conversion of all of its remaining convertible perpetual preferred stock. The 96,245 preferred shares outstanding were converted into 3,271,415 shares of the Company's common stock. (17) On July 25, 2013, the Company's board of directors approved the initiation of a quarterly cash dividend on the Company's common stock of $0.18 per share. On July 17, 2014, the board of directors approved a $0.03 per share, or 16.7%, increase to the quarterly cash dividend on the Company's common stock, bringing the quarterly cash dividend to $0.21 per common share. On July 16, 2015, the board of directors approved a $0.02 per share, or 9.5%, increase to the quarterly cash dividend on the Company's common stock, bringing the quarterly cash dividend to $0.23 per common share. (18) Capital expenditures for maintenance in 2013 benefited by approx. $12 million for equipment purchases that were invoiced in Q4 2013 and paid in early 2014. (19) The joint venture will own and operate an existing hospital/unit while it builds a new, free-standing hospital. (20) The leverage ratio is based on trailing four quarter Adjusted EBITDA of $631.8 million and 2014 Adjusted EBITDA of $577.6 million. Pro forma 2015 leverage with trailing four quarters Encompass Adjusted EBITDA and full-year Adjusted EBITDA estimates for Reliant and CareSouth included would be approx. 4.2x. (21) In December 2014, the Encompass acquisition was initially funded using a combination of draws under the revolving credit facility and expanded term loan facility. In January 2015, the Company issued an additional $400 million of its 5.75% senior notes due 2024 and used $250 million of the net proceeds to repay borrowings under its term loan facilities, with the remainder used to repay borrowings under its revolving credit facility. (22) HealthSouth drew from its term loan facilities and revolving credit facility to fund a portion of the Reliant and CareSouth acquisitions. (23) In March 2015, the Company issued $300 million of 5.125% senior notes due 2023 and called all of its 8.125% senior notes due 2020, which were funded in April 2015.
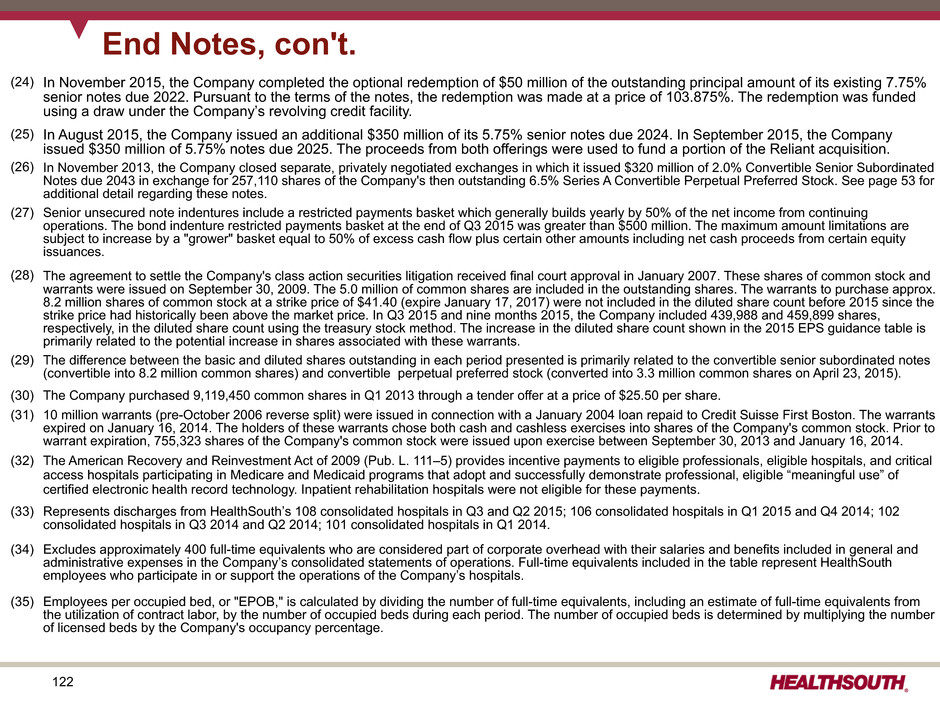
122 End Notes, con't. (24) In November 2015, the Company completed the optional redemption of $50 million of the outstanding principal amount of its existing 7.75% senior notes due 2022. Pursuant to the terms of the notes, the redemption was made at a price of 103.875%. The redemption was funded using a draw under the Company’s revolving credit facility. (25) In August 2015, the Company issued an additional $350 million of its 5.75% senior notes due 2024. In September 2015, the Company issued $350 million of 5.75% notes due 2025. The proceeds from both offerings were used to fund a portion of the Reliant acquisition. (26) In November 2013, the Company closed separate, privately negotiated exchanges in which it issued $320 million of 2.0% Convertible Senior Subordinated Notes due 2043 in exchange for 257,110 shares of the Company's then outstanding 6.5% Series A Convertible Perpetual Preferred Stock. See page 53 for additional detail regarding these notes. (27) Senior unsecured note indentures include a restricted payments basket which generally builds yearly by 50% of the net income from continuing operations. The bond indenture restricted payments basket at the end of Q3 2015 was greater than $500 million. The maximum amount limitations are subject to increase by a "grower" basket equal to 50% of excess cash flow plus certain other amounts including net cash proceeds from certain equity issuances. (28) The agreement to settle the Company's class action securities litigation received final court approval in January 2007. These shares of common stock and warrants were issued on September 30, 2009. The 5.0 million of common shares are included in the outstanding shares. The warrants to purchase approx. 8.2 million shares of common stock at a strike price of $41.40 (expire January 17, 2017) were not included in the diluted share count before 2015 since the strike price had historically been above the market price. In Q3 2015 and nine months 2015, the Company included 439,988 and 459,899 shares, respectively, in the diluted share count using the treasury stock method. The increase in the diluted share count shown in the 2015 EPS guidance table is primarily related to the potential increase in shares associated with these warrants. (29) The difference between the basic and diluted shares outstanding in each period presented is primarily related to the convertible senior subordinated notes (convertible into 8.2 million common shares) and convertible perpetual preferred stock (converted into 3.3 million common shares on April 23, 2015). (30) The Company purchased 9,119,450 common shares in Q1 2013 through a tender offer at a price of $25.50 per share. (31) 10 million warrants (pre-October 2006 reverse split) were issued in connection with a January 2004 loan repaid to Credit Suisse First Boston. The warrants expired on January 16, 2014. The holders of these warrants chose both cash and cashless exercises into shares of the Company's common stock. Prior to warrant expiration, 755,323 shares of the Company's common stock were issued upon exercise between September 30, 2013 and January 16, 2014. (32) The American Recovery and Reinvestment Act of 2009 (Pub. L. 111–5) provides incentive payments to eligible professionals, eligible hospitals, and critical access hospitals participating in Medicare and Medicaid programs that adopt and successfully demonstrate professional, eligible “meaningful use” of certified electronic health record technology. Inpatient rehabilitation hospitals were not eligible for these payments. (33) Represents discharges from HealthSouth’s 108 consolidated hospitals in Q3 and Q2 2015; 106 consolidated hospitals in Q1 2015 and Q4 2014; 102 consolidated hospitals in Q3 2014 and Q2 2014; 101 consolidated hospitals in Q1 2014. (34) Excludes approximately 400 full-time equivalents who are considered part of corporate overhead with their salaries and benefits included in general and administrative expenses in the Company’s consolidated statements of operations. Full-time equivalents included in the table represent HealthSouth employees who participate in or support the operations of the Company’s hospitals. (35) Employees per occupied bed, or "EPOB," is calculated by dividing the number of full-time equivalents, including an estimate of full-time equivalents from the utilization of contract labor, by the number of occupied beds during each period. The number of occupied beds is determined by multiplying the number of licensed beds by the Company's occupancy percentage.
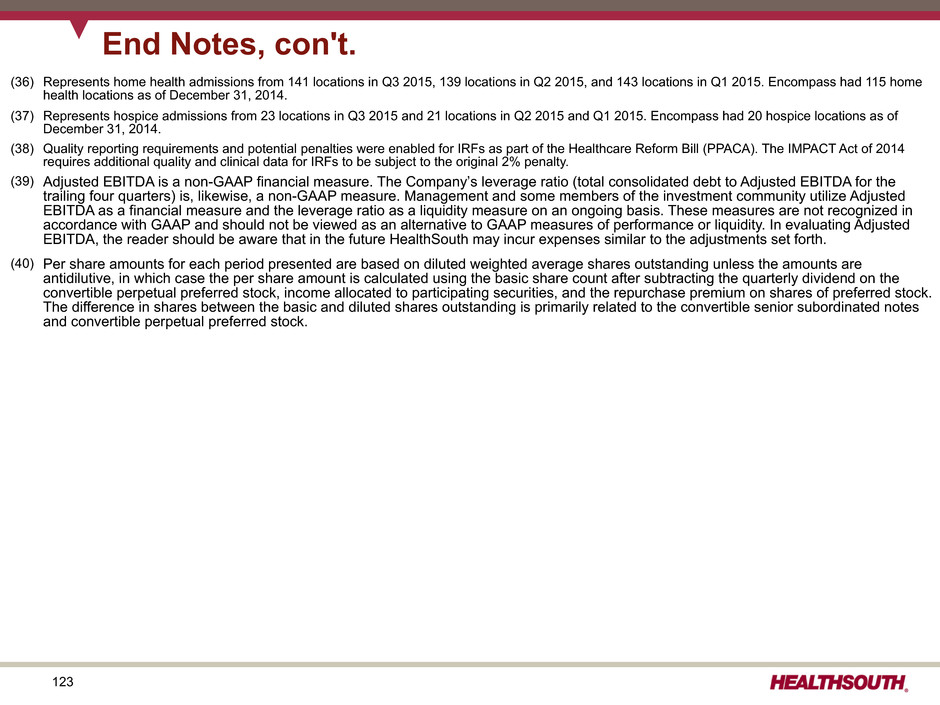
123 End Notes, con't. (36) Represents home health admissions from 141 locations in Q3 2015, 139 locations in Q2 2015, and 143 locations in Q1 2015. Encompass had 115 home health locations as of December 31, 2014. (37) Represents hospice admissions from 23 locations in Q3 2015 and 21 locations in Q2 2015 and Q1 2015. Encompass had 20 hospice locations as of December 31, 2014. (38) Quality reporting requirements and potential penalties were enabled for IRFs as part of the Healthcare Reform Bill (PPACA). The IMPACT Act of 2014 requires additional quality and clinical data for IRFs to be subject to the original 2% penalty. (39) Adjusted EBITDA is a non-GAAP financial measure. The Company’s leverage ratio (total consolidated debt to Adjusted EBITDA for the trailing four quarters) is, likewise, a non-GAAP measure. Management and some members of the investment community utilize Adjusted EBITDA as a financial measure and the leverage ratio as a liquidity measure on an ongoing basis. These measures are not recognized in accordance with GAAP and should not be viewed as an alternative to GAAP measures of performance or liquidity. In evaluating Adjusted EBITDA, the reader should be aware that in the future HealthSouth may incur expenses similar to the adjustments set forth. (40) Per share amounts for each period presented are based on diluted weighted average shares outstanding unless the amounts are antidilutive, in which case the per share amount is calculated using the basic share count after subtracting the quarterly dividend on the convertible perpetual preferred stock, income allocated to participating securities, and the repurchase premium on shares of preferred stock. The difference in shares between the basic and diluted shares outstanding is primarily related to the convertible senior subordinated notes and convertible perpetual preferred stock.
Serious News for Serious Traders! Try StreetInsider.com Premium Free!
You May Also Be Interested In
- EPIC Framework Guides Florida Corporate, Gala & Luxury Events
- Pardu Productions Publishes Exclusive Feature on Marc Mysterio's Proposed “Name vs. Name” Match
- [Crypto Market News] Apeing Announces Stage 3 Presale at $0.0004 as More Than 400 Million $APEING Tokens Are Sold
Create E-mail Alert Related Categories
SEC FilingsSign up for StreetInsider Free!
Receive full access to all new and archived articles, unlimited portfolio tracking, e-mail alerts, custom newswires and RSS feeds - and more!
